UNITED STATES
SECURITIES AND EXCHANGE COMMISSION
Washington, D.C. 20549
FORM N-CSR
CERTIFIED SHAREHOLDER REPORT OF REGISTERED MANAGEMENT INVESTMENT
COMPANIES
Investment Company Act file number 811-08361
Goldman Sachs Variable Insurance Trust
(Exact name of registrant as specified in charter)
71 South Wacker Drive, Chicago, Illinois 60606-6303
(Address of principal executive offices) (Zip code)
| Peter V. Bonanno, Esq. | Copies to: | |
| Goldman, Sachs & Co. | Geoffrey R. T. Kenyon, Esq. | |
| 200 West Street | Dechert LLP | |
| New York, New York 10282 | 200 Clarendon Street | |
| 27th Floor Boston, MA 02116-5021 | ||
| (Name and address of agents for service) | ||
Registrant’s telephone number, including area code: (312) 655-4400
Date of fiscal year end: December 31
Date of reporting period: June 30, 2011
| ITEM 1. | REPORTS TO STOCKHOLDERS. | |
| The Semi-Annual Reports to Stockholders are filed herewith. |
Goldman
Sachs Variable Insurance Trust
Goldman Sachs Equity Index Fund
Goldman Sachs Government Income Fund
Goldman Sachs Growth Opportunities Fund
Semi-Annual Report
June 30, 2011
 |
GOLDMAN SACHS VARIABLE INSURANCE TRUST FUNDS
Principal Investment Strategies and Risks
Shares of the Goldman Sachs Variable Insurance Trust Funds are offered to separate accounts of participating life insurance companies for the purpose of funding variable annuity contracts and variable life insurance policies. Shares of the Funds are not offered directly to the general public. The variable annuity contracts and variable life insurance policies are described in the separate prospectuses issued by participating insurance companies. You should refer to those prospectuses for information about surrender charges, mortality and expense risk fees and other charges that may be assessed by participating insurance companies under the variable annuity contracts or variable life insurance policies. Such fees or charges, if any, may affect the return you realize with respect to your investments. Ask your representative for more complete information. Please consider a Fund’s objective, risks and charges and expenses, and read the Prospectus carefully before investing. The Prospectus contains this and other information about a Fund.
GOLDMAN SACHS VARIABLE INSURANCE TRUST FUNDS
securities and other derivative investments. Derivative instruments may involve a high degree of financial risk. These risks include the risk that a small movement in the price of the underlying security or benchmark may result in a disproportionately large movement, unfavorable or favorable, in the price of the derivative instrument; risks of default by a counterparty; and the risks that transactions may not be liquid.
MARKET REVIEW
Goldman Sachs Variable Insurance Trust Funds
Market Review
Despite significant volatility, the U.S. financial markets recorded gains during the six months ended June 30, 2011 (the “Reporting Period”).
Equity Markets
U.S. equities continued their positive momentum from 2010 during the Reporting Period. Most of the gains, however, were generated during the first quarter of 2011, as improving trends in labor, housing, manufacturing and consumer confidence pointed to a continuation in the economic recovery. A positive trajectory in corporate earnings and cash flows and strong merger and acquisition activity further supported U.S. equity market performance. Indeed, despite great exogenous shocks as a result of Middle East and North African turmoil, a series of disasters in Japan, political debate over collective bargaining rights in Wisconsin and the possible repeal of health care reform in Washington D.C., the U.S. equity markets rewarded investors with solid returns during the first quarter of 2011.
The broad U.S. equity markets experienced a much more volatile second quarter, rising to a three-year high in April before losing most of their early 2011 gains by mid-June and then recovering somewhat during the very last week of the Reporting Period. In early April, commodity prices declined and expectations ran high for strong corporate profit growth. However, while home construction rose modestly in May, housing and employment remained key weak spots in the U.S. economy. In addition, concerns about Greece’s debt crisis re-surfaced, the U.S. Congress wrangled over the U.S. debt ceiling, the Federal Reserve Board’s (the Fed’s) quantitative easing program was scheduled to expire on June 30, 2011, the impact of Japan’s natural and nuclear disasters worked its way through the global supply chain and deadly storms cut a wide swath of destruction across the midwestern and southern United States. In turn, the U.S. stock market lost ground. Toward the end of June, U.S. equities recovered from their May to mid-June decline on the heels of better than expected U.S. manufacturing activity, improved automobile sales and a short-term resolution of the sovereign debt crisis in Greece.
Despite this volatility, all sectors in the Standard &Poor’s® 500 Index (“S&P 500 Index”) posted gains during the Reporting Period, with the exception of financials, which posted a negative return. Health care and energy led the way. Energy was, not surprisingly, impacted by the price of Brent crude oil, which peaked at more than $126 per barrel in April on supply disruption fears in North Africa and the Middle East before falling in June on weaker U.S. economic data and concerns about the pace of growth in China’s economy. Still, Brent crude oil prices ended the Reporting Period at more than $112 per barrel.
While all capitalization segments of the U.S. equity market advanced during the Reporting Period, mid-cap stocks, as measured by the Russell Midcap® Index, performed best, followed by large-cap and then small-cap stocks, as measured by the Russell 1000® Index and the Russell 2000® Index, respectively, which performed nearly in line with each other. Large-cap stocks were least successful relative to small-cap stocks in the information technology sector. Growth-oriented stocks outpaced value-oriented stocks across the capitalization spectrum.
Fixed Income Markets
The U.S. fixed income market, as represented by the Barclays Capital U.S. Aggregate Bond Index (“Barclays Capital Index”), returned 2.72% during the Reporting Period.
MARKET REVIEW
For the second consecutive year, U.S. economic growth hit a soft patch after starting strongly. In turn, U.S. government yields increased early in the Reporting Period, but reversed direction on doubts about the economic outlook and on a flight to quality in response to global events. By the end of the Reporting Period, many of these economic and systemic concerns began to ease, and U.S. government yields seemed poised to resume a rising trend.
During the first quarter of 2011, U.S. economic data, with the exception of the housing and labor markets, remained relatively strong. However, risks to the global economy proliferated. Political unrest emerged in Tunisia, followed by Egypt and the broader Middle East and North African region. Oil prices peaked around $126 per barrel on concerns about potential supply disruptions. In March, Japan was struck by the Tohoku earthquake and tsunami, leading to a nuclear emergency at the Fukushima Daiichi plant. In Europe, as policymakers struggled to avert restructures, Ireland and Portugal joined Greece as recipients of European Union bailouts. In April, the European Central Bank delivered its first interest-rate hike since the financial crisis in response to escalating inflation pressures.
These factors combined to halt the rising trend, which had persisted since late 2010, in the government bond yields of major developed nations. In mid-February 2011, the yield on the 10-year U.S. Treasury note peaked at 3.75% and then started to decline as risks to economic growth increased. Japan’s disasters added to the downward pressure on yields, and together with Europe’s escalating sovereign debt crisis, drove a steady flight to quality from April through June. U.S. Treasury security yields declined, and investors sold riskier assets, including high-grade corporate debt.
Investors generally remained defensive during the second quarter, but the economic data had begun to shift. Oil prices started to moderate in April, helped in June by the International Energy Agency’s (“IEA”) agreement to release global strategic reserves. Japanese industrial output improved substantially toward the end of the Reporting Period, and the subsequent boost in U.S. manufacturing figures suggested that Japan’s recovery, even at these early stages, was repairing significant gaps in the global supply chain. These positive signals caused 10-year U.S. Treasury yields to rise near the end of June, closing the Reporting Period at 3.16% — still below 3.29% where they stood at the beginning of 2011. Risk premiums subsided on U.S. corporate bond indexes, in line with a fledgling rally in U.S. equities.
Alongside these modest improvements, there remained widespread risks to market confidence at the end of the Reporting Period. U.S. labor markets had yet to show any consistent strength, and Eurozone policymakers were still working toward a detailed resolution to the peripheral European nations’ severe debt and fiscal problems. Moreover, fiscal pressures were mounting in the U.S., where lawmakers continued to disagree on terms for raising the country’s debt ceiling ahead of an August 2, 2011 payment deadline.
Looking Ahead
Equity Markets
During the remainder of 2011, we believe the most significant factor for the U.S. equity markets will be fallout from the completion of the Fed’s second round of quantitative easing, referred to as QE2. We believe the program has created a fertile environment for forward-looking stock pickers as the momentum rally ends and companies begin to trade more in line with underlying fundamentals. In our view, the Fed’s actions have led to rising commodity costs, and we believe certain companies will be challenged to maintain cost structure without
MARKET REVIEW
sacrificing revenue growth. We believe companies with strong brands and pricing power will be able to pass along inflationary pressures and maintain margins throughout the recovery. Specifically, we believe our portfolios are well positioned due to our focus on identifying the companies that can provide a differentiated product or service and those that benefit from secular tailwinds, which we believe will enable these types of companies to sustain growth without sacrificing price.
Fixed Income Markets
In our opinion, economic growth is likely to rebound later in 2011 as economic headwinds reverse. Oil prices have moderated, and global manufacturing seems poised to rebound as Japan’s suppliers come back on line. However, we think the policy outlook in the U.S. has changed significantly compared to 2010. Deflation no longer appears to be the risk it was, making it difficult for policymakers to justify additional monetary stimulus. Additional fiscal stimulus also seems unlikely considering the deterioration in the U.S. government’s balance sheet and the growing emphasis on spending cuts in budget debates. While the Fed has the flexibility to maintain its accommodative monetary policy and indeed we do not expect it to raise rates until well into 2012, we believe fiscal policy is likely to start tightening during the second half of 2011.
Overall, we believe that resilient underlying economic growth will favor riskier fixed income assets over U.S. government bonds as 2011 progresses. However, the uncertain economic environment has prompted us to trim our 2011 U.S. Gross Domestic Product (“GDP”) forecast to 3.0%, which is still above consensus. Our 2012 GDP forecast remains at 3.0%. We have substantially increased our forecasts for U.S. headline inflation (which includes volatile food and energy cost), given stronger price pressures and the relatively consistent rise in the core inflation rate (which excludes volatile food and energy costs) since late 2010. We now expect headline inflation to accelerate to 3.0% in 2011 and then subside to 2.2% in 2012, which is roughly in line with the consensus.
GOLDMAN SACHS VARIABLE INSURANCE TRUST CORE FIXED INCOME FUND
INVESTMENT OBJECTIVE
The Fund seeks a total return consisting of capital appreciation and income that exceeds the total return of the Barclays Capital U.S. Aggregate Bond Index.
Portfolio Management Discussion and Analysis
Below, the Goldman Sachs Fixed Income Investment Management Team discusses the performance of the Goldman Sachs Variable Insurance Trust — Goldman Sachs Core Fixed Income Fund (the “Fund”) and positioning for the six-month period ended June 30, 2011 (the “Reporting Period”).
How did the Fund perform during the Reporting Period?
During the Reporting Period, the Fund’s Service Shares generated a cumulative total return of 2.65%. This return compares to the 2.72% cumulative total return of the Fund’s benchmark, the Barclays Capital U.S. Aggregate Bond Index* (the “Barclays Capital Index”), during the same time period.
What key factors were responsible for the Fund’s performance during the Reporting Period?
The Fund’s duration and U.S. yield curve positioning relative to the Barclays Capital Index detracted from relative performance. Duration is a measure of the Fund’s sensitivity to changes in interest rates. Yield curve indicates a spectrum of maturities.
Both our top-down and bottom-up strategies contributed positively to the Fund’s relative results during the Reporting Period. Within our top-down strategies, our cross-sector strategy enhanced performance. Our cross-sector strategy is one in which we invest Fund assets across a variety of fixed income sectors, including some that may not be included in the Barclays Capital Index. Bottom-up individual issue selection among investment grade corporate bonds and collateralized securities also contributed positively to the Fund’s relative returns during the Reporting Period.
Which fixed income market sectors most significantly affected Fund performance?
The Fund’s overweighted exposure to corporate bonds compared to the Barclays Capital Index added to relative returns, as credit fundamentals within the sector remained strong and continued to improve during the Reporting Period. Also contributing to results was individual issue selection within the corporate bond sector, especially the Fund’s bias toward lower quality investment grade credits. In addition, issue selection within the collateralized sector, particularly among agency mortgage-backed securities (“MBS”), non-agency adjustable-rate mortgages (“ARMs”) and commercial mortgage-backed securities (“CMBS”), contributed to relative performance.
The Fund’s allocation to non-agency residential mortgage-backed securities (“RMBS”) detracted from relative results. These issues declined in sympathy with a broad risk reduction in the global financial markets as well as seasonal weakness in U.S. housing fundamentals.
Did the Fund’s duration and yield curve positioning strategy help or hurt its results during the Reporting Period?
Tactical management of the Fund’s duration and yield curve positioning detracted from relative returns for the Reporting Period as a whole. In January and early February, the Fund had a shorter duration position than that of the Barclays Capital Index, which contributed positively to performance. By the end of February, we had shifted the Fund to a longer duration position in the two-, seven- and 30-year portions of the U.S. yield curve. The Fund maintained a short duration position in the 10-year part of the yield curve. In March, we tactically shifted the Fund to a neutral duration position relative to the Barclays Capital Index, before moving back to a long duration position in April in response to concerns about inflation. As worries of inflation appeared to subside, we reinstated the Fund’s short duration position compared to the Barclays Capital Index at the end of April, as we believed the Fed was not planning to raise interest rates near term. We maintained the Fund’s duration shorter than the Barclays Capital Index through June. However, the Fund’s duration and yield curve positioning hurt performance during the second quarter as yields fell in response to global economic growth worries, rising oil prices resulting from the political upheaval across the Middle East and North Africa and concerns that Japan’s devastating earthquake and tsunami would disrupt the global supply chain. The yield on the 10-year U.S. Treasury note ended the Reporting Period at 3.16%, down from 3.29% at the beginning of 2011.
| * | The Barclays Capital U.S. Aggregate Bond Index (formerly known as the Lehman Brothers Aggregate Bond Index) represents an unmanaged diversified portfolio of fixed income securities, including U.S. Treasuries, investment-grade corporate bonds, and mortgage-backed and asset-backed securities. The Index figures do not reflect any deduction for fees, expenses or taxes. It is not possible to invest directly in an unmanaged index. |
GOLDMAN SACHS VARIABLE INSURANCE TRUST CORE FIXED INCOME FUND
How did the Fund use derivatives and similar instruments during the Reporting Period?
As market conditions warranted during the Reporting Period, the Fund engaged in forward foreign currency exchange contracts to hedge currency exposure; Treasury futures to hedge interest rate exposure and facilitate specific duration and yield curve strategies; and Eurodollar futures to express the Team’s views on the direction of interest rates and facilitate specific duration and yield curve strategies. Eurodollar futures are contracts whose underlying assets are linked to time deposits denominated in U.S. dollars at banks outside the United States.
Were there any notable changes in the Fund’s weightings during the Reporting Period?
As mentioned earlier, based on our view of interest rates, we tactically shifted the Fund’s duration position as market conditions changed during the Reporting Period. In addition, we increased the Fund’s position in RMBS, favoring Alt-A mortgages, which are mortgages that fall between prime and subprime in terms of the credit quality of the underlying borrowers, and option ARMs, which give borrowers payment options. We added to the Fund’s overweight to covered bonds (i.e., debt securities backed by cash flows from mortgages and public sector loans) and AAA and AA rated collateralized loan obligations. Toward the end of the Reporting Period, we increased the Fund’s underweighted position in government securities. We shifted the Fund to an underweighted allocation to investment grade corporate debt but maintained its bias toward lower quality investment grade credits.
How was the Fund positioned relative to the Barclays Capital Index at the end of the Reporting Period?
At the end of the Reporting Period, the Fund held a shorter duration position than the Barclays Capital Index. The Fund was underweight government securities and investment grade corporate bonds compared to the Barclays Capital Index. It was overweight taxable municipal securities issued through the Build America Bonds (“BAB”) program. The BAB program provided federal subsidies for taxable bonds issued by state and local governments. Relative to the Barclays Capital Index, the Fund was also overweight at the end of Reporting Period in asset-backed securities, particularly FFELP (“Federal Family Education Loan Program”) student loans, non-agency MBS and covered bonds. The Fund also had exposure to high yield corporate bonds and emerging markets debt, both of which are not represented in the Barclays Capital Index, at the end of the Reporting Period.
FUND BASICS
Core Fixed Income Fund
as of June 30, 2011
| STANDARDIZED AVERAGE ANNUAL TOTAL RETURNS1 |
| For the period ended 6/30/2011 | One Year | Five Year | Since Inception | Inception Date | ||||||||||||
| Service | 4.24 | % | 5.30 | % | 4.64 | % | 1/09/06 | |||||||||
| 1 | The Standardized Average Annual Total Returns are average annual total returns as of the most recent calendar quarter-end. They assume reinvestment of all distributions at net asset value (“NAV”). | |
| Total return figures in the above chart represent past performance and do not indicate future results, which will vary. The investment return and principal value of an investment will fluctuate and, therefore, an investor’s shares, when redeemed, may be worth more or less than their original cost. Current performance may be lower or higher than the total return figures in the above chart. Please visit www.goldmansachsfunds.com/vit to obtain the most recent month-end returns. Performance reflects expense limitations in effect. In their absence, performance would be reduced. |
| EXPENSE RATIOS2 |
| Net Expense Ratio (Current) | Gross Expense Ratio (Before Waivers) | |||||||||
| Service | 0.69 | % | 0.83 | % | ||||||
| 2 | The expense ratios of the Fund, both current (net of any fee waivers or expense limitations) and before waivers (gross of any fee waivers or expense limitations) are as set forth above. The Fund’s waivers and/or expense limitations will remain in place through at least April 29, 2012, and prior to such date the investment adviser may not terminate the arrangements without the approval of the Fund’s Board of Trustees. The expense ratios set forth above may differ from the expense ratios disclosed in the Financial Highlights in this report. |
FUND BASICS
| FUND COMPOSITION3 |
| 3 | The percentage shown for each investment category reflects the value of investments in that category as a percentage of net assets. Short-term investments represent investments in investment companies other than those that are exchange traded. Figures in the above graph may not sum to 100% due to the exclusion of other assets and liabilities. The above graph depicts the Fund’s investments but may not represent the Fund’s market exposure due to the exclusion of derivatives, if any, as listed in the Additional Investment Information section of the Schedule of Investments. | |
| 4 | “Federal Agencies” are mortgage-backed securities guaranteed by the Government National Mortgage Association (“GNMA”), Federal National Mortgage Association (“FNMA”) and Federal Home Loan Mortgage Corp. (“FHLMC”). GNMA instruments are backed by the full faith and credit of the United States Government. | |
| 5 | “Government Guarantee Obligations” are guaranteed under the Federal Deposit Insurance Corporation’s (“FDIC”) Temporary Liquidity Guarantee Program or a foreign government guarantee program and are backed by the full faith and credit of the United States or the government of a foreign country. The expiration date of the FDIC’s guarantee is the earlier of the maturity date of the debt or June 30, 2012 and the expiration date of a foreign country guarantee is the maturity date of the debt. | |
| 6 | “Agency Debentures” include agency securities offered by companies such as FNMA and FHLMC, which operate under a government charter. While they are required to report to a government regulator, their assets are not explicitly guaranteed by the government and they otherwise operate like any other publicly traded company. |
GOLDMAN SACHS VARIABLE INSURANCE TRUST EQUITY INDEX FUND
INVESTMENT OBJECTIVE
The Fund seeks to achieve investment results that correspond to the aggregate price and yield performance of a benchmark index that measures the investment returns of large capitalization stocks.
Portfolio Management Discussion and Analysis
Below, SSgA Funds Management, Inc. (“SSgA”), the Fund’s Subadvisor, discusses the performance of the Goldman Sachs Variable Insurance Trust — Goldman Sachs Equity Index Fund (the “Fund”) and positioning for the six-month period ended June 30, 2011 (the “Reporting Period”).
How did the Fund perform during the Reporting Period?
During the Reporting Period, the Fund’s Service Shares generated a cumulative total return of 5.92%. This return compares to the 6.02% cumulative total return of the Fund’s benchmark, the Standard & Poor’s® 500 Index* (with dividends reinvested) (the “S&P 500 Index”), during the same time period.
During the Reporting Period, which sectors and which industries in the S&P 500 Index were the strongest contributors to the Fund’s performance?
Nine of the ten sectors in the S&P 500 Index advanced during the Reporting Period. On the basis of impact (which takes both total returns and weightings into account), the sectors that made the strongest positive contributions to the S&P 500 Index — and to the Fund — were health care, energy and industrials. The industries with the strongest performance on the basis of impact were oil, gas and consumable fuels; pharmaceuticals; media; information technology services; and health care providers and services.
Which sectors and industries in the S&P 500 Index were the weakest contributors to the Fund’s performance?
During the Reporting Period, financials was the only sector to post a negative total return in the S&P 500 Index. The financials sector was also the weakest performer in the S&P Index on the basis of impact, followed by materials and telecommunications services. The industries with the weakest performance on the basis of impact were diversified financial services, capital markets, internet software and services, commercial banks and communications equipment.
Which individual stocks were the top performers, and which were the greatest detractors?
The largest sector by weighting in the S&P 500 Index at the end of the Reporting Period was information technology at a weighting of 17.79%, and it provided one of the Reporting Period’s top performers and two of its top detractors. The stocks that made the strongest positive contribution on the basis of impact were Exxon Mobil, IBM, Pfizer, Chevron and United Health Group. The weakest performers were Cisco Systems, Bank of America, Google, Goldman Sachs Group and Citigroup.
How did the Fund use derivatives and similar instruments during the Reporting Period?
During the Reporting Period, we did not use derivatives as part of an active management strategy to add value to the Fund’s results. However, we used equity index futures, on an opportunistic basis, to equitize the Fund’s cash holdings. In other words, we put the Fund’s cash holdings to work by using them as collateral for the purchase of equity index futures.
What changes were made to the makeup of the S&P 500 Index during the Reporting Period?
Fourteen stocks were removed from the S&P 500 Index during the Reporting Period. They were RadioShack, Prologis, Massey Energy, Novell, Genzyme, Qwest Communications International, Campbell Soup, NYSE Euronext, Regions Financial, Sara Lee, McAfee, Allegheny Energy, QLogic and Meredith.
There were also fourteen additions to the S&P 500 Index during the Reporting Period. They were Marathon Petroleum, AMB Property, Alpha Natural Resources, Chipotle Mexican Grill, BlackRock, Edwards Lifesciences, Apache, Emerson Electric, Union Pacific, Visa, Covidien, Joy Global, Noble and Motorola Mobility Holdings.
| * | The S&P 500 Index is the Standard & Poor’s 500 Composite Index of 500 stocks, an unmanaged index of common stock prices. The Index figures do not reflect any deduction for fees, expenses or taxes. It is not possible to invest directly in an unmanaged index. |
FUND BASICS
Equity Index Fund
as of June 30, 2011
| STANDARDIZED AVERAGE ANNUAL TOTAL RETURNS1 |
| For the period ended 6/30/11 | One Year | Five Year | Since Inception | Inception Date | ||||||||||||
| Service | 30.30 | % | 2.74 | % | 2.41 | % | 1/09/06 | |||||||||
| 1 | The Standardized Average Annual Total Returns are average annual total returns as of the most recent calendar quarter-end. They assume reinvestment of all distributions at net asset value (“NAV”). | |
| Total return figures in the above chart represent past performance and do not indicate future results, which will vary. The investment return and principal value of an investment will fluctuate and, therefore, an investor’s shares, when redeemed, may be worth more or less than their original cost. Current performance may be lower or higher than the total return figures in the above chart. Please visit www.goldmansachsfunds.com/vit to obtain the most recent month-end returns. Performance reflects fee waivers and/or expense limitations in effect. In their absence, performance would be reduced. |
| EXPENSE RATIOS2 |
| Net Expense Ratio (Current) | Gross Expense Ratio (Before Waivers) | |||||||||
| Service | 0.48 | % | 0.71 | % | ||||||
| 2 | The expense ratios of the Fund, both current (net of any fee waivers or expense limitations) and before waivers (gross of any fee waivers or expense limitations) are as set forth above. The Fund’s waivers and/or expense limitations will remain in place through at least April 29, 2012, and prior to such date the investment adviser may not terminate the arrangements without the approval of the Fund’s Board of Trustees. The expense ratios set forth above may differ from the expense ratios disclosed in the Financial Highlights in this report. |
| TOP 10 HOLDINGS AS OF 6/30/113 |
| Holding | % of Net Assets | Line of Business | ||||||
| Exxon Mobil Corp. | 3.3 | % | Energy | |||||
| Apple, Inc. | 2.6 | Technology Hardware & Equipment | ||||||
| International Business Machines Corp. | 1.7 | Software & Services | ||||||
| Chevron Corp. | 1.7 | Energy | ||||||
| General Electric Co. | 1.7 | Capital Goods | ||||||
| Microsoft Corp. | 1.6 | Software & Services | ||||||
| AT&T, Inc. | 1.5 | Telecommunication Services | ||||||
| Johnson & Johnson | 1.5 | Pharmaceuticals, Biotechnology & Life Sciences | ||||||
| The Procter & Gamble Co. | 1.5 | Household & Personal Products | ||||||
| Pfizer, Inc. | 1.4 | Pharmaceuticals, Biotechnology & Life Sciences | ||||||
| 3 | The top 10 holdings may not be representative of the Fund’s future investments. |
FUND BASICS
| FUND VS. BENCHMARK SECTOR ALLOCATIONS4 |
As of June 30, 2011
| 4 | The Fund’s composition may differ over time. The above graph categorizes investments using Global Industry Classification Standard (“GICS”), however, the sector classifications used by the portfolio management team may differ from GICS. Consequently, the Fund’s overall industry sector allocations may differ from percentages contained in the graph above. The percentage shown for each investment category reflects the value of investments in that category as a percentage of market value. Short-term investments represent investments in investment companies other than those that are exchange traded. The above graph depicts the Fund’s investments but may not represent the Fund’s market exposure due to the exclusion of derivatives, if any, as listed in the Additional Investment Information section of the Schedule of Investments. |
GOLDMAN SACHS VARIABLE INSURANCE TRUST GOVERNMENT INCOME FUND
INVESTMENT OBJECTIVE
The Fund seeks a high level of current income, consistent with safety of principal.
Portfolio Management Discussion and Analysis
Below, the Goldman Sachs Fixed Income Investment Management Team discusses the performance of the Goldman Sachs Variable Insurance Trust — Goldman Sachs Government Income Fund (the “Fund”) and positioning for the six-month period ended June 30, 2011 (the “Reporting Period”).
How did the Fund perform during the Reporting Period?
During the Reporting Period, the Fund’s Service Shares generated a cumulative total return of 1.82%. This return compares to the 2.47% cumulative total return of the Fund’s benchmark, the Barclays Capital Government/Mortgage Index* (the “Barclays Capital Index”) during the same time period.
What key factors were responsible for the Fund’s performance during the Reporting Period?
The Fund’s duration and yield curve positioning detracted from relative performance during the Reporting Period. Duration is a measure of the Fund’s sensitivity to changes in interest rates. Yield curve indicates a spectrum of maturities.
Our top-down and bottom-up strategies enhanced relative performance. Within our top-down strategies, our cross-sector strategy contributed positively. Our cross-sector strategy is one in which we invest Fund assets across a variety of fixed income sectors, including some that may not be included in the Barclays Capital Index. Bottom-up individual issue selection among government and agency securities also added to the Fund’s results during the Reporting Period.
Which fixed income market sectors contributed the most to Fund performance?
The Fund’s exposure to agency mortgage-backed securities (“MBS”) added to relative returns, especially in March, as demand for high-quality spread product increased. (Spread product refers to securities that typically carry interest rates higher than Treasuries because of their greater inherent risk.) Also contributing to the Fund’s performance was its exposure to asset-backed securities (“ABS”) and commercial mortgage-backed securities (“CMBS”). In addition, issue selection among government and agency securities, specifically Treasury Inflation-Protected Securities (“TIPS”), enhanced the Fund’s results versus the Barclays Capital Index.
What sectors detracted from the Fund’s performance?
The Fund’s allocation to non-agency MBS, which are not represented in the Barclays Capital Index, detracted from relative performance. These issues declined amid broad risk reduction in the global financial markets and in response to seasonal weakness in U.S. housing fundamentals.
Did the Fund’s duration and yield curve positioning strategy help or hurt its results during the Reporting Period?
Tactical management of the Fund’s duration and yield curve positioning detracted from relative returns for the Reporting Period as a whole. In January and early February, the Fund had a shorter duration position than that of the Barclays Capital Index, which contributed positively to performance. By the end of February, we had shifted the Fund to a longer duration position in the two-, seven- and 30-year portions of the U.S. yield curve. The Fund maintained a short-duration position in the 10-year part of the yield curve. In March, we tactically shifted the Fund to a neutral duration position relative to the Barclays Capital Index, before moving back to a long duration position in April in response to concerns about inflation. As worries of inflation appeared to subside, we reinstated the Fund’s short duration position compared to the Barclays Capital Index at the end of April, as we believed the Fed was not planning to raise interest rates near term. We maintained the Fund’s duration shorter than the Barclays Capital Index through June. However, the Fund’s duration and yield curve positioning hurt performance during the second quarter as yields fell in response to global economic growth worries, rising oil prices resulting from the political upheaval across the Middle East and North Africa and concerns that Japan’s devastating earthquake and tsunami would disrupt the global supply chain. The yield on the 10-year U.S. Treasury note ended the Reporting Period at 3.16%, down from 3.29% at the beginning of 2011.
| * | The Barclays Capital Government/Mortgage Index (formerly the Lehman Brothers Government/Mortgage Index), an unmanaged index, does not reflect any deduction for fees, expenses or taxes. It is not possible to invest directly in an unmanaged index. |
GOLDMAN SACHS VARIABLE INSURANCE TRUST GOVERNMENT INCOME FUND
How did the Fund use derivatives and similar instruments during the Reporting Period?
As market conditions warranted during the Reporting Period, the Fund engaged in Treasury futures to hedge interest rate exposure and facilitate specific duration and yield curve strategies.
Were there any notable changes in the Fund’s weightings during the Reporting Period?
As mentioned earlier, based on our view of interest rates, we tactically shifted the Fund’s duration position as market conditions changed during the Reporting Period. In addition, we reduced the Fund’s underweight in government securities and increased its overweight in quasi-government securities. We reduced the Fund’s exposure to residential mortgage-backed securities (“RMBS”), moving to a more neutral stance relative to the Barclays Capital Index. Over the course of the Reporting Period, we shifted the Fund from an overweight to an underweight in premium mortgage pass-throughs. In our opinion, their high prices did not reflect the impact of market technicals resulting from the Treasury selloff or the prepayment risks that could arise from potential mortgage servicing reforms or other housing initiatives. Pass-through mortgages consist of a pool of residential mortgage loans, where homeowners’ monthly payments of principal, interest and prepayments pass from the original bank through a government agency or investment bank to investors.
How was the Fund positioned relative to the Barclays Capital Index at the end of the Reporting Period?
The Fund held a shorter duration position than the Barclays Capital Index at the end of the Reporting Period. Relative to the Barclays Capital Index, the Fund was underweight government securities and mortgage pass-throughs. It was overweight quasi-government securities and agency adjustable-rate mortgages (“ARMs”). We continued to find value in agency multi-family securities, which offer high credit quality, stable cash flows, prepayment protections and some yield premium over single family fixed-rate MBS. At the end of the Reporting Period, the Fund had modest exposure to ABS and non-agency mortgages, both of which are not represented in the Barclays Capital Index. We maintained the Fund’s position in non-agency mortgages because of the New York Federal Reserve’s pause in the liquidation of its Maiden Lane II portfolio, established to facilitate transactions related to its takeover of select assets of American International Group (AIG). We believe the pause could ease the supply burden on the market. We also view the settlement reached between Bank of America and a group of large investors as a positive step for the residential mortgage sector. In our opinion, loss-adjusted yields across the non-agency sector compared favorably with other high-volatility asset classes. Moreover, recent S&P/Case-Shiller Home Price Index data supported our view at the end of the Reporting Period that home prices could rise during the summer of 2011.
FUND BASICS
Government Income Fund
as of June 30, 2011
| STANDARDIZED AVERAGE ANNUAL TOTAL RETURNS1 |
| For the period ended 6/30/11 | One Year | Five Year | Since Inception | Inception Date | ||||||||||||
| Service | 2.24 | % | 5.67 | % | 5.07 | % | 1/09/06 | |||||||||
| 1 | The Standardized Average Annual Total Returns are average annual total returns as of the most recent calendar quarter-end. They assume reinvestment of all distributions at net asset value (“NAV”). | |
| Total return figures in the above chart represent past performance and do not indicate future results, which will vary. The investment return and principal value of an investment will fluctuate and, therefore, an investor’s shares, when redeemed, may be worth more or less than their original cost. Current performance may be lower or higher than the total return figures in the above chart. Please visit www.goldmansachsfunds.com/vit to obtain the most recent month-end returns. Performance reflects expense limitations in effect. In their absence, performance would be reduced. |
| EXPENSE RATIOS2 |
| Net Expense Ratio (Current) | Gross Expense Ratio (Before Waivers) | |||||||||
| Service | 0.85 | % | 1.12 | % | ||||||
| 2 | The expense ratios of the Fund, both current (net of any fee waivers or expense limitations) and before waivers (gross of any fee waivers or expense limitations) are as set forth above. The Fund’s waivers and/or expense limitations will remain in place through at least April 29, 2012, and prior such date the investment adviser may not terminate the arrangements without the approval of the Fund’s Board of Trustees. The expense ratios set forth above may differ from the expense ratios disclosed in the Financial Highlights in this report. |
FUND BASICS
| FUND COMPOSITION3 |
| 3 | The percentage shown for each investment category reflects the value of investments in that category as a percentage of net assets. Short-term investments represent investments in investment companies other than those that are exchange traded. Figures in the above graph may not sum to 100% due to the exclusion of other assets and liabilities. The above graph depicts the Fund’s investments but may not represent the Fund’s market exposure due to the exclusion of derivatives, if any, as listed in the Additional Investment Information section of the Schedule of Investments. | |
| 4 | “Federal Agencies” are mortgage-backed securities guaranteed by the Government National Mortgage Association (“GNMA”), Federal National Mortgage Association (“FNMA”) and Federal Home Loan Mortgage Corp. (“FHLMC”). GNMA instruments are backed by the full faith and credit of the United States Government. | |
| 5 | “Government Guarantee Obligations” are guaranteed under the Federal Deposit Insurance Corporation’s (“FDIC”) Temporary Liquidity Guarantee Program and are backed by the full faith and credit of the United States. The expiration date of the FDIC’s guarantee is the earlier of the maturity date of the debt or June 30, 2012. | |
| 6 | “Agency Debentures” include agency securities offered by companies such as FNMA and FHLMC, which operate under a government charter. While they are required to report to a government regulator, their assets are not explicitly guaranteed by the government and they otherwise operate like any other publicly traded company. |
GOLDMAN SACHS VARIABLE INSURANCE TRUST GROWTH OPPORTUNITIES FUND
INVESTMENT OBJECTIVE
The Fund seeks long-term growth of capital.
Portfolio Management Discussion and Analysis
Below, the Goldman Sachs Growth Equity Management Team discusses the performance of the Goldman Sachs Variable Insurance Trust — Goldman Sachs Growth Opportunities Fund (the “Fund”) and positioning for the six-month period ended June 30, 2011 (the “Reporting Period”).
How did the Fund perform during the Reporting Period?
During the Reporting Period, the Fund’s Service Shares generated a cumulative total return of 4.17%. This return compares to the 9.59% cumulative total return of the Fund’s benchmark, the Russell Midcap® Growth Index* (with dividends reinvested) (the “Russell Index”), during the same time period.
What key factors were responsible for the Fund’s performance during the Reporting Period?
The Fund’s underperformance relative to the Russell Index was largely the result of security selection.
Which equity market sectors most significantly affected Fund performance?
Our bottom-up approach focuses on security selection, and as a result, we do not make active sector-level investment decisions. That said, on a sector level, security selection in the consumer discretionary, consumer staples and financials sectors hampered Fund performance. Also detracting was an overweighted position in the information technology sector, which lagged the Russell Index. An underweighted position in the utilities sector, which outperformed in the Russell Index, further dampened results.
Stock picks in the industrials and information technology sectors added to the Fund’s relative results. An underweighted position in the industrials sector, which underperformed the Russell Index, was also advantageous.
Which individual stocks detracted significantly from the Fund’s performance during the Reporting Period?
Office supply retailer Staples, which posted a second straight quarter of disappointing results, detracted from the Fund’s relative performance during the Reporting Period. The company reported earnings below consensus estimates and lowered guidance for 2011. According to Staples’ management, the company has been experiencing pressure on its profit margins, an issue that we consider transitory. Because Staples is aggressively cutting prices for some of its products in the U.S., we believe the company may be able to gain market share. In our opinion, management’s recent actions may pressure competitors to lower prices, which is likely to have a negative impact on companies with limited margin flexibility. We believe Staples may be in a position to gain additional market share if competitors are weakened and the industry becomes more consolidated. Although Staples’ share price was under pressure during the Reporting Period, we believe the company is dealing with macroeconomic headwinds that are cyclical in nature and not evidence of structural issues associated with the company’s business model. In addition to Staples’ retail locations, the company has a significant online business and is one of the largest online retailers in North America.
Another top detractor during the Reporting Period was Lamar, an outdoor advertising company. Lamar’s shares declined after it reported disappointing revenue growth for its fiscal first quarter. In our view, outdoor advertising is a growing segment of the media industry. We expect Lamar to benefit from this trend as the company converts its billboards from static to digital formats to generate more revenue from its existing locations and to attract more advertisers to the medium.
A position in Northern Trust hampered the Fund’s relative returns during the Reporting Period. Its share price fell after the company reported disappointing fiscal fourth quarter earnings, pressured by persistently low interest rates. The company’s private wealth and institutional custody businesses, however, helped offset weakness in the parts of its business that have been negatively affected by macro-economic factors. Northern Trust remains focused on expanding in its core markets, and given the company’s solid balance sheet and cash holdings, we believe management is likely to begin redeploying capital through stock buybacks and dividend increases.
| * | The Russell Midcap Growth Index is an unmanaged index that measures the performance of those Russell Midcap companies with higher price-to-book ratios and higher forecasted growth values. The Index figures do not reflect any deduction for fees, expenses or taxes. It is not possible to invest directly in an unmanaged index. |
What were some of the Fund’s best-performing individual stocks?
Iron Mountain, a leader in records management, data storage and online backup, contributed to the Fund’s relative performance during the Reporting Period. Its shares appreciated after management announced a strategic plan for enhancing shareholder value. While we continue to believe that Iron Mountain holds dominant market share position and advantages of scale, we think the gap between the stock price and the economic value of Iron Mountain’s business has closed. We took advantage of the increase in its share price during the Reporting Period to exit the Fund’s position.
Xilinx, a semiconductor chip company that is a leader in programmable logic devices (“PLDs”), was another top contributor during the Reporting Period. Its shares were up after the company reported strong revenue growth and management issued a positive outlook. The PLD industry is a duopoly structure — that is, it is generally dominated by two companies — with high barriers to entry. In our opinion, Xilinx is likely to benefit as PLDs take market share from application-specific integrated circuits (“ASICs”), an alternative semiconductor chip. We believe the market for PLDs will continue to expand because they offer significant benefits over ASICs, including lower development costs, shorter development time and upgradability.
Sallie Mae, a student loan originator and servicer, enhanced the Fund’s relative performance during the Reporting Period. The company reported strong quarterly earnings driven by higher interest and fee income as well as a lower loan loss provision. In addition, the company improved its profit margins amid positive credit trends. During the Reporting Period, Sallie Mae also completed an unsecured debt deal, which we expect to improve its liquidity position. In our opinion, Sallie Mae has strong businesses that are underappreciated by the equity market. We think the company has the potential to grow earnings significantly as the credit market continues to normalize.
Did the Fund make any significant purchases or sales during the Reporting Period?
During the Reporting Period, we added Pioneer National Resources to the Fund. In our view, this independent oil and gas exploration and production company has attractive assets in the Permian and Eagleford Basins. Although the Permian Basin is older than other North American oil fields, it has had limited exposure to newer, unconventional drilling technologies, which we believe can unlock value in this geography.
The Fund also purchased Urban Outfitters during the Reporting Period. The specialty retailer operates numerous successful brands including Urban Outfitters, Anthropologie, Free People and Terrain. It has been rapidly expanding its retail store base and has been successful at introducing brands to the global marketplace. In our opinion, its management has a history of strong execution, demonstrating disciplined capital allocation and producing consistent sales growth over a multi-year period.
The Fund eliminated its position in Iron Mountain during the Reporting Period. As mentioned above, we continue to believe the company holds dominant market share position and advantages of scale. However, we think the gap between the stock price and the economic value of Iron Mountain’s business has closed. We took advantage of the increase in its share price during the Reporting Period to exit the Fund’s position.
The Fund also eliminated its position in People’s United Financial. Our original investment thesis was that People’s United Financial, a well-capitalized bank, would have the opportunity to purchase other banks at depressed prices. Although it made several small acquisitions, we believe the window of greatest opportunity has closed. Therefore, we decided to sell the position.
Were there any notable changes in the Fund’s weightings during the Reporting Period?
There were no notable changes in the Fund’s weightings during the Reporting Period.
How did the Fund use derivatives and similar instruments during the Reporting Period?
The Fund does not use derivatives within its investment process.
How was the Fund positioned relative to the Russell Index at the end of the Reporting Period?
As mentioned, the Fund’s sector positioning relative to the Russell Index is the result of our stock selection, as we take a pure bottom-up, research-intensive approach to investing. From that perspective, then, at the end of the Reporting Period, the Fund’s portfolio was broadly diversified with overweighted positions compared to the Russell Index in the information technology, financials, telecommunication services, energy and consumer discretionary sectors. The Fund had smaller weightings relative to the Russell Index in the materials, health care, industrials, consumer staples and utilities sectors at the end of the Reporting Period.
FUND BASICS
Growth Opportunities Fund
as of June 30, 2011
| STANDARDIZED AVERAGE ANNUAL TOTAL RETURNS1 |
| For the period ended 6/30/11 | One Year | Five Year | Since Inception | Inception Date | ||||||||||||
| Service | 30.84 | % | 8.38% | 6.71 | % | 1/09/06 | ||||||||||
| 1 | The Standardized Average Annual Total Returns are average annual total returns as of the most recent calendar quarter-end. They assume reinvestment of all distributions at net asset value (“NAV”). | |
| Total return figures in the above chart represent past performance and do not indicate future results, which will vary. The investment return and principal value of an investment will fluctuate and, therefore, an investor’s shares, when redeemed, may be worth more or less than their original cost. Current performance may be lower or higher than the total return figures in the above chart. Please visit www.goldmansachsfunds.com/vit to obtain the most recent month-end returns. Performance reflects fee waivers and/or expense limitations in effect. In their absence, performance would be reduced. |
| EXPENSE RATIOS2 |
| Net Expense Ratio (Current) | Gross Expense Ratio (Before Waivers) | |||||||||
| Service | 1.15 | % | 1.43 | % | ||||||
| 2 | The expense ratios of the Fund, both current (net of any fee waivers or expense limitations) and before waivers (gross of any fee waivers or expense limitations) are as set forth above. The Fund’s waivers and/or expense limitations will remain in place through at least April 29, 2012, and prior to such date the investment adviser may not terminate the arrangements without the approval of the Fund’s Board of Trustees. The expense ratios set forth above may differ from the expense ratios disclosed in the Financial Highlights in this report. |
| TOP 10 HOLDINGS AS OF 6/30/113 |
| Holding | % of Net Assets | Line of Business | ||||||
| Global Payments, Inc. | 2.6 | % | Software & Services | |||||
| Xilinx, Inc. | 2.5 | Semiconductors & Semiconductor Equipment | ||||||
| Cameron International Corp. | 2.3 | Energy | ||||||
| Kennametal, Inc. | 2.2 | Capital Goods | ||||||
| SBA Communications Corp. Class A | 2.2 | Telecommunication Services | ||||||
| PetSmart, Inc. | 2.2 | Retailing | ||||||
| Phillips-Van Heusen Corp. | 2.2 | Consumer Durables & Apparel | ||||||
| Bed Bath & Beyond, Inc. | 2.1 | Retailing | ||||||
| IntercontinentalExchange, Inc. | 2.1 | Diversified Financials | ||||||
| Coinstar, Inc. | 2.0 | Consumer Services | ||||||
| 3 | The top 10 holdings may not be representative of the Fund’s future investments. |
FUND BASICS
| FUND vs. BENCHMARK SECTOR ALLOCATIONS4 |
As of June 30, 2011
| 4 | The Fund is actively managed and, as such, its composition may differ over time. The above graph categorizes investments using Global Industry Classification Standard (“GICS”), however, the sector classifications used by the portfolio management team may differ from GICS. Consequently, the Fund’s overall industry sector allocations may differ from percentages contained in the graph above. The percentage shown for each investment category reflects the value of investments in that category as a percentage of market value. Short-term investments represent investments in investment companies other than those that are exchange traded. The above graph depicts the Fund’s investments but may not represent the Fund’s market exposure due to the exclusion of derivatives, if any, as listed in the Additional Investment Information section of the Schedule of Investments. |
GOLDMAN SACHS VARIABLE INSURANCE TRUST CORE FIXED INCOME FUND
Schedule of Investments
June 30, 2011 (Unaudited)
| Principal | Interest | Maturity | ||||||||||||
| Amount | Rate | Date | Value | |||||||||||
Corporate Obligations – 22.0% | ||||||||||||||
Banks – 6.4% | ||||||||||||||
| Abbey National Treasury Services PLC | ||||||||||||||
| $ | 175,000 | 2.875 | % | 04/25/14 | $ | 175,154 | ||||||||
| 100,000 | 4.000 | 04/27/16 | 98,887 | |||||||||||
| Bank of America Corp. | ||||||||||||||
| 425,000 | 3.625 | 03/17/16 | 425,317 | |||||||||||
| 200,000 | 5.750 | 12/01/17 | 212,569 | |||||||||||
| 375,000 | 5.625 | 07/01/20 | 384,766 | |||||||||||
BBVA Bancomer SA(a) | ||||||||||||||
| 425,000 | 7.250 | 04/22/20 | 446,371 | |||||||||||
| Capital One Bank NA | ||||||||||||||
| 300,000 | 8.800 | 07/15/19 | 368,482 | |||||||||||
CBA Capital Trust II(a)(b)(c) | ||||||||||||||
| 325,000 | 6.024 | 03/29/49 | 320,255 | |||||||||||
Citigroup Capital XXI(b)(c) | ||||||||||||||
| 383,000 | 8.300 | 12/21/57 | 390,660 | |||||||||||
| Citigroup, Inc. | ||||||||||||||
| 225,000 | 6.375 | 08/12/14 | 249,589 | |||||||||||
| 600,000 | 5.000 | 09/15/14 | 629,610 | |||||||||||
| 155,000 | 6.125 | 11/21/17 | 171,042 | |||||||||||
| 165,000 | 5.375 | 08/09/20 | 172,691 | |||||||||||
| Fifth Third Bancorp | ||||||||||||||
| 150,000 | 3.625 | 01/25/16 | 151,371 | |||||||||||
| HSBC Bank NA | ||||||||||||||
| 275,000 | 4.875 | 08/24/20 | 272,323 | |||||||||||
ING Bank NV(a) | ||||||||||||||
| 325,000 | 2.375 | 06/09/14 | 323,494 | |||||||||||
| JPMorgan Chase Capital XXV Series Y | ||||||||||||||
| 275,000 | 6.800 | 10/01/37 | 274,026 | |||||||||||
| Merrill Lynch & Co., Inc. | ||||||||||||||
| 325,000 | 6.400 | 08/28/17 | 357,771 | |||||||||||
| Morgan Stanley & Co. | ||||||||||||||
| 275,000 | 5.750 | 08/31/12 | 289,471 | |||||||||||
| 400,000 | 5.950 | 12/28/17 | 424,099 | |||||||||||
| 300,000 | 6.625 | 04/01/18 | 329,263 | |||||||||||
| PNC Bank NA | ||||||||||||||
| 225,000 | 6.875 | 04/01/18 | 259,923 | |||||||||||
| Regions Financial Corp. | ||||||||||||||
| 325,000 | 5.750 | 06/15/15 | 319,313 | |||||||||||
Resona Bank Ltd.(a)(b)(c) | ||||||||||||||
| 650,000 | 5.850 | 09/29/49 | 648,676 | |||||||||||
| Santander Holdings USA, Inc. | ||||||||||||||
| 165,000 | 4.625 | 04/19/16 | 165,118 | |||||||||||
SunTrust Banks, Inc.(b) | ||||||||||||||
| 225,000 | 3.600 | 04/15/16 | 227,888 | |||||||||||
| The Bear Stearns Companies, LLC | ||||||||||||||
| 500,000 | 7.250 | 02/01/18 | 592,959 | |||||||||||
The Royal Bank of Scotland Group PLC(a) | ||||||||||||||
| 425,000 | 4.875 | 08/25/14 | 442,325 | |||||||||||
| U.S. Bancorp | ||||||||||||||
| 375,000 | 3.442 | 02/01/16 | 379,525 | |||||||||||
| Union Bank NA | ||||||||||||||
| 400,000 | 3.000 | 06/06/16 | 396,251 | |||||||||||
| Wachovia Bank NA | ||||||||||||||
| 300,000 | 6.600 | 01/15/38 | 331,511 | |||||||||||
| 10,230,700 | ||||||||||||||
Captive Auto – 0.2% | ||||||||||||||
FUEL Trust(a) | ||||||||||||||
| 325,000 | 3.984 | 06/15/16 | 320,936 | |||||||||||
Chemicals – 0.4% | ||||||||||||||
| The Dow Chemical Co. | ||||||||||||||
| 500,000 | 7.600 | 05/15/14 | 579,168 | |||||||||||
Diversified Manufacturing – 0.2% | ||||||||||||||
| Valmont Industries, Inc. | ||||||||||||||
| 250,000 | 6.625 | 04/20/20 | 273,411 | |||||||||||
Electric – 0.9% | ||||||||||||||
| Arizona Public Service Co. | ||||||||||||||
| 250,000 | 6.375 | 10/15/11 | 254,121 | |||||||||||
Ipalco Enterprises, Inc.(a) | ||||||||||||||
| 400,000 | 5.000 | 05/01/18 | 396,000 | |||||||||||
PPL WEM Holdings PLC(a)(b) | ||||||||||||||
| 350,000 | 5.375 | 05/01/21 | 360,944 | |||||||||||
| Progress Energy, Inc. | ||||||||||||||
| 350,000 | 7.000 | 10/30/31 | 405,810 | |||||||||||
| 1,416,875 | ||||||||||||||
Energy – 2.8% | ||||||||||||||
| Anadarko Petroleum Corp. | ||||||||||||||
| 375,000 | 6.375 | 09/15/17 | 429,438 | |||||||||||
| BP Capital Markets PLC | ||||||||||||||
| 225,000 | 3.200 | 03/11/16 | 228,662 | |||||||||||
| 500,000 | 4.500 | 10/01/20 | 510,290 | |||||||||||
Dolphin Energy Ltd.(a) | ||||||||||||||
| 212,064 | 5.888 | 06/15/19 | 228,561 | |||||||||||
| Gazprom OAO Via Gaz Capital SA | ||||||||||||||
| 350,000 | 9.250 | 04/23/19 | 435,313 | |||||||||||
| Nexen, Inc. | ||||||||||||||
| 120,000 | 6.400 | 05/15/37 | 119,243 | |||||||||||
| 200,000 | 7.500 | 07/30/39 | 223,973 | |||||||||||
| Noble Energy, Inc. | ||||||||||||||
| 250,000 | 6.000 | 03/01/41 | 256,364 | |||||||||||
| Pemex Project Funding Master Trust | ||||||||||||||
| 330,000 | 6.625 | 06/15/35 | 345,675 | |||||||||||
| Petrobras International Finance Co. | ||||||||||||||
| 170,000 | 5.375 | 01/27/21 | 174,461 | |||||||||||
PTTEP Canada International Finance Ltd.(a) | ||||||||||||||
| 240,000 | 5.692 | 04/05/21 | 239,208 | |||||||||||
Ras Laffan Liquefied Natural Gas Co. Ltd. III(a) | ||||||||||||||
| 250,000 | 5.500 | 09/30/14 | 270,774 | |||||||||||
TNK-BP Finance SA | ||||||||||||||
| 140,000 | 7.875 | 03/13/18 | 160,479 | |||||||||||
| Transocean, Inc. | ||||||||||||||
| 100,000 | 4.950 | 11/15/15 | 107,056 | |||||||||||
| 325,000 | 6.000 | 03/15/18 | 357,698 | |||||||||||
| 100,000 | 6.500 | 11/15/20 | 111,838 | |||||||||||
| Weatherford International Ltd. | ||||||||||||||
| 225,000 | 9.625 | 03/01/19 | 290,436 | |||||||||||
| 4,489,469 | ||||||||||||||
Food & Beverage – 0.7% | ||||||||||||||
Cargill, Inc.(a) | ||||||||||||||
| 425,000 | 4.307 | 05/14/21 | 428,313 | |||||||||||
GOLDMAN SACHS VARIABLE INSURANCE TRUST CORE FIXED INCOME FUND
Schedule of Investments (continued)
June 30, 2011 (Unaudited)
| Principal | Interest | Maturity | ||||||||||||
| Amount | Rate | Date | Value | |||||||||||
Corporate Obligations – (continued) | ||||||||||||||
Food & Beverage – (continued) | ||||||||||||||
| Kraft Foods, Inc. | ||||||||||||||
| $ | 275,000 | 6.125 | % | 08/23/18 | $ | 314,260 | ||||||||
| 225,000 | 6.500 | 02/09/40 | 247,529 | |||||||||||
| 990,102 | ||||||||||||||
Food & Drug Retail(b)(c) – 0.3% | ||||||||||||||
| CVS Caremark Corp. | ||||||||||||||
| 500,000 | 6.302 | 06/01/37 | 484,997 | |||||||||||
Healthcare – 0.4% | ||||||||||||||
| Boston Scientific Corp. | ||||||||||||||
| 525,000 | 4.500 | 01/15/15 | 553,012 | |||||||||||
| Life Technologies Corp. | ||||||||||||||
| 150,000 | 6.000 | 03/01/20 | 162,539 | |||||||||||
| 715,551 | ||||||||||||||
Life Insurance – 1.1% | ||||||||||||||
| Lincoln National Corp. | ||||||||||||||
| 300,000 | 4.850 | 06/24/21 | 299,337 | |||||||||||
MetLife Capital Trust X(a)(b)(c) | ||||||||||||||
| 300,000 | 9.250 | 04/08/38 | 366,000 | |||||||||||
| Prudential Financial, Inc. | ||||||||||||||
| 575,000 | 3.875 | 01/14/15 | 599,478 | |||||||||||
The Northwestern Mutual Life Insurance Co.(a) | ||||||||||||||
| 425,000 | 6.063 | 03/30/40 | 447,943 | |||||||||||
| 1,712,758 | ||||||||||||||
Media Cable – 0.3% | ||||||||||||||
| DIRECTV Holdings LLC/DIRECTV Financing Co., Inc. | ||||||||||||||
| 425,000 | 3.500 | 03/01/16 | 436,856 | |||||||||||
Media Non Cable(a) – 0.5% | ||||||||||||||
| NBCUniversal Media LLC | ||||||||||||||
| 175,000 | 2.875 | 04/01/16 | 175,137 | |||||||||||
| 400,000 | 4.375 | 04/01/21 | 395,813 | |||||||||||
| News America, Inc. | ||||||||||||||
| 375,000 | 6.150 | 02/15/41 | 377,112 | |||||||||||
| 948,062 | ||||||||||||||
Metals and Mining(b) – 0.5% | ||||||||||||||
| Freeport-McMoRan Copper & Gold, Inc. | ||||||||||||||
| 418,000 | 8.375 | 04/01/17 | 456,142 | |||||||||||
| Teck Resources Ltd. | ||||||||||||||
| 300,000 | 10.750 | 05/15/19 | 379,125 | |||||||||||
| 835,267 | ||||||||||||||
Noncaptive-Financial – 1.6% | ||||||||||||||
| Capital One Capital III | ||||||||||||||
| 125,000 | 7.686 | 08/15/36 | 127,500 | |||||||||||
Capital One Capital IV(b)(c) | ||||||||||||||
| 350,000 | 6.745 | 02/17/37 | 353,500 | |||||||||||
| Discover Bank | ||||||||||||||
| 250,000 | 8.700 | 11/18/19 | 301,031 | |||||||||||
| General Electric Capital Corp. | ||||||||||||||
| 825,000 | 5.625 | 05/01/18 | 898,854 | |||||||||||
| International Lease Finance Corp. | ||||||||||||||
| 375,000 | 5.750 | 05/15/16 | 369,375 | |||||||||||
| SLM Corp. | ||||||||||||||
| AUD | 150,000 | 6.000 | 05/10/12 | 158,909 | ||||||||||
| $ | 325,000 | 6.250 | 01/25/16 | 339,707 | ||||||||||
| 2,548,876 | ||||||||||||||
Pipelines – 1.4% | ||||||||||||||
| Boardwalk Pipelines LP | ||||||||||||||
| 550,000 | 5.875 | 11/15/16 | 613,103 | |||||||||||
| El Paso Pipeline Partners Operating Co. LLC | ||||||||||||||
| 150,000 | 6.500 | 04/01/20 | 168,000 | |||||||||||
| Energy Transfer Partners LP | ||||||||||||||
| 450,000 | 5.950 | 02/01/15 | 498,361 | |||||||||||
| Enterprise Products Operating LLC | ||||||||||||||
| 175,000 | 5.000 | 03/01/15 | 190,390 | |||||||||||
| Tennessee Gas Pipeline Co. | ||||||||||||||
| 150,000 | 8.000 | 02/01/16 | 180,897 | |||||||||||
| 200,000 | 8.375 | 06/15/32 | 252,838 | |||||||||||
TransCanada Pipelines Ltd.(b)(c) | ||||||||||||||
| 325,000 | 6.350 | 05/15/67 | 325,000 | |||||||||||
| 2,228,589 | ||||||||||||||
Property/Casualty Insurance – 0.9% | ||||||||||||||
QBE Capital Funding III Ltd.(a)(b)(c) | ||||||||||||||
| 250,000 | 7.250 | 05/24/41 | 250,843 | |||||||||||
QBE Insurance Group Ltd.(a) | ||||||||||||||
| 225,000 | 9.750 | 03/14/14 | 261,775 | |||||||||||
| Transatlantic Holdings, Inc. | ||||||||||||||
| 225,000 | 8.000 | 11/30/39 | 244,657 | |||||||||||
ZFS Finance USA Trust IV(a)(b)(c) | ||||||||||||||
| 675,000 | 5.875 | 05/09/32 | 681,386 | |||||||||||
| 1,438,661 | ||||||||||||||
Real Estate Investment Trusts – 2.1% | ||||||||||||||
Brandywine Operating Partnership LP(b) | ||||||||||||||
| 325,000 | 4.950 | 04/15/18 | 329,486 | |||||||||||
| Developers Diversified Realty Corp. | ||||||||||||||
| 375,000 | 7.500 | 04/01/17 | 424,688 | |||||||||||
| Duke Realty LP | ||||||||||||||
| 350,000 | 5.950 | 02/15/17 | 382,899 | |||||||||||
| HCP, Inc. | ||||||||||||||
| 275,000 | 6.000 | 01/30/17 | 302,158 | |||||||||||
| 250,000 | 5.375 | (b) | 02/01/21 | 256,711 | ||||||||||
| Healthcare Realty Trust, Inc. | ||||||||||||||
| 350,000 | 5.750 | 01/15/21 | 357,502 | |||||||||||
| Kilroy Realty LP | ||||||||||||||
| 275,000 | 5.000 | 11/03/15 | 287,290 | |||||||||||
| ProLogis LP | ||||||||||||||
| 100,000 | 2.250 | 04/01/37 | 99,625 | |||||||||||
| 175,000 | 1.875 | (b) | 11/15/37 | 172,375 | ||||||||||
| Simon Property Group LP | ||||||||||||||
| 350,000 | 10.350 | 04/01/19 | 482,448 | |||||||||||
WEA Finance LLC(a) | ||||||||||||||
| 125,000 | 7.500 | 06/02/14 | 144,079 | |||||||||||
| 3,239,261 | ||||||||||||||
GOLDMAN SACHS VARIABLE INSURANCE TRUST CORE FIXED INCOME FUND
| Principal | Interest | Maturity | ||||||||||||
| Amount | Rate | Date | Value | |||||||||||
Corporate Obligations – (continued) | ||||||||||||||
Retailers – 0.2% | ||||||||||||||
| Macy’s Retail Holdings, Inc. | ||||||||||||||
| $ | 250,000 | 7.450 | % | 07/15/17 | $ | 297,500 | ||||||||
Tobacco – 0.1% | ||||||||||||||
| Altria Group, Inc. | ||||||||||||||
| 175,000 | 9.700 | 11/10/18 | 230,059 | |||||||||||
Transportation – 0.3% | ||||||||||||||
Transnet Ltd.(a) | ||||||||||||||
| 400,000 | 4.500 | 02/10/16 | 412,835 | |||||||||||
Wirelines Telecommunications – 0.7% | ||||||||||||||
| AT&T, Inc. | ||||||||||||||
| 625,000 | 2.950 | 05/15/16 | 632,449 | |||||||||||
Qwest Communications International, Inc.(b) | ||||||||||||||
| 325,000 | 8.000 | 10/01/15 | 352,300 | |||||||||||
| Qwest Corp. | ||||||||||||||
| 150,000 | 8.375 | 05/01/16 | 176,219 | |||||||||||
| 1,160,968 | ||||||||||||||
TOTAL CORPORATE OBLIGATIONS | ||||||||||||||
(Cost $33,591,229) | $ | 34,990,901 | ||||||||||||
Mortgage-Backed Obligations – 58.3% | ||||||||||||||
Adjustable Rate Non-Agency(c) – 2.9% | ||||||||||||||
Bear Stearns Adjustable Rate Mortgage Trust Series 2004-1, Class 21A1 | ||||||||||||||
| $ | 27,716 | 2.475 | % | 04/25/34 | $ | 24,346 | ||||||||
Countrywide Alternative Loan Trust Series 2005-38, Class A1 | ||||||||||||||
| 270,220 | 1.778 | 09/25/35 | 170,292 | |||||||||||
Countrywide Home Loan Mortgage Pass-Through Trust Series 2003-52, Class A1 | ||||||||||||||
| 104,902 | 2.831 | 02/19/34 | 93,677 | |||||||||||
Countrywide Home Loan Mortgage Pass-Through Trust Series 2004-HYB6, Class A2 | ||||||||||||||
| 20,515 | 3.067 | 11/20/34 | 17,163 | |||||||||||
Indymac Index Mortgage Loan Trust Series 2005-AR15, Class A1 | ||||||||||||||
| 484,042 | 4.970 | 09/25/35 | 408,254 | |||||||||||
Indymac Index Mortgage Loan Trust Series 2006-AR4, Class A1A | ||||||||||||||
| 999,856 | 0.396 | 05/25/46 | 594,186 | |||||||||||
J.P. Morgan Mortgage Trust Series 2007-A1, Class 2A2 | ||||||||||||||
| 356,201 | 3.078 | 07/25/35 | 314,944 | |||||||||||
Lehman XS Trust Series 2005-7N, Class 1A1A | ||||||||||||||
| 396,211 | 0.456 | 12/25/35 | 262,585 | |||||||||||
Master Adjustable Rate Mortgages Trust Series 2006-OA2, Class 4A1A | ||||||||||||||
| 661,448 | 1.128 | 12/25/46 | 233,299 | |||||||||||
Structured Adjustable Rate Mortgage Loan Trust Series 2004-12, Class 3A2 | ||||||||||||||
| 23,091 | 2.561 | 09/25/34 | 19,890 | |||||||||||
Structured Adjustable Rate Mortgage Loan Trust Series 2004-5, Class 3A1 | ||||||||||||||
| 50,158 | 2.542 | 05/25/34 | 44,412 | |||||||||||
Thornburg Mortgage Securities Trust Series 2006-4, Class A2B | ||||||||||||||
| 1,335,079 | 0.314 | 07/25/36 | 1,332,748 | |||||||||||
Washington Mutual Mortgage Pass-Through Certificates Series 2004-AR3, Class A2 | ||||||||||||||
| 28,750 | 2.577 | 06/25/34 | 27,142 | |||||||||||
Washington Mutual Mortgage Pass-Through Certificates Series 2007-OA2, Class 1A | ||||||||||||||
| 618,842 | 0.978 | 03/25/47 | 392,135 | |||||||||||
Wells Fargo Mortgage Backed Securities Trust Series 2006-AR10, Class 5A3 | ||||||||||||||
| 812,249 | 3.149 | 07/25/36 | 640,281 | |||||||||||
| 4,575,354 | ||||||||||||||
Collateralized Mortgage Obligations – 15.0% | ||||||||||||||
Agency Multi-Family – 2.8% | ||||||||||||||
| FNMA | ||||||||||||||
| 398,126 | 2.800 | 03/01/18 | 392,604 | |||||||||||
| 1,098,899 | 3.740 | 05/01/18 | 1,139,120 | |||||||||||
| 320,000 | 3.840 | 05/01/18 | 330,294 | |||||||||||
| 800,000 | 4.506 | 06/01/19 | 845,718 | |||||||||||
| 199,267 | 3.416 | 10/01/20 | 195,531 | |||||||||||
| 298,869 | 3.375 | 11/01/20 | 292,209 | |||||||||||
| 199,290 | 3.632 | 12/01/20 | 197,970 | |||||||||||
| 994,949 | 3.763 | 12/01/20 | 998,258 | |||||||||||
| GNMA | ||||||||||||||
| 193,941 | 3.950 | 07/15/25 | 200,263 | |||||||||||
| 4,591,967 | ||||||||||||||
Covered Bonds(a) – 8.0% | ||||||||||||||
| Bank of Scotland PLC | ||||||||||||||
| 300,000 | 5.250 | 02/21/17 | 320,781 | |||||||||||
| Companhia de Financement Foncier | ||||||||||||||
| 1,900,000 | 2.125 | 04/22/13 | 1,928,337 | |||||||||||
| DnB NOR Boligkreditt | ||||||||||||||
| 1,300,000 | 2.100 | 10/14/15 | 1,284,781 | |||||||||||
| 1,100,000 | 2.900 | 03/29/16 | 1,119,642 | |||||||||||
| ING Bank NV | ||||||||||||||
| 800,000 | 2.500 | 01/14/16 | 785,959 | |||||||||||
| Nordea Eiendomskreditt AS | ||||||||||||||
| 800,000 | 1.875 | 04/07/14 | 808,105 | |||||||||||
| Sparebank 1 Boligkreditt AS | ||||||||||||||
| 1,400,000 | 1.250 | 10/25/13 | 1,398,568 | |||||||||||
| 1,200,000 | 2.625 | 05/27/16 | 1,201,519 | |||||||||||
| Stadshypotek AB | ||||||||||||||
| 450,000 | 1.450 | 09/30/13 | 452,934 | |||||||||||
Swedbank Hypotek AB(c) | ||||||||||||||
| 300,000 | 0.696 | 03/28/14 | 301,654 | |||||||||||
| The Bank of Nova Scotia | ||||||||||||||
| 2,000,000 | 1.450 | 07/26/13 | 2,022,960 | |||||||||||
| The Canadian Imperial Bank of Commerce | ||||||||||||||
| 500,000 | 2.000 | 02/04/13 | 509,386 | |||||||||||
| 400,000 | 2.750 | 01/27/16 | 409,260 | |||||||||||
| 12,543,886 | ||||||||||||||
Interest Only(c)(d)(e) – 0.0% | ||||||||||||||
FNMA REMIC Series 2004-71, Class DI | ||||||||||||||
| 301,246 | 0.000 | 04/25/34 | 3,756 | |||||||||||
GOLDMAN SACHS VARIABLE INSURANCE TRUST CORE FIXED INCOME FUND
Schedule of Investments (continued)
June 30, 2011 (Unaudited)
| Principal | Interest | Maturity | ||||||||||||
| Amount | Rate | Date | Value | |||||||||||
Mortgage-Backed Obligations – (continued) | ||||||||||||||
Planned Amortization Class – 1.0% | ||||||||||||||
FNMA REMIC Series 2003-92, Class PD | ||||||||||||||
| $ | 1,590,707 | 4.500 | % | 03/25/17 | $ | 1,626,873 | ||||||||
Regular Floater(c) – 2.9% | ||||||||||||||
Arkle Master Issuer PLC Series 2010-2A, Class 1A1(a) | ||||||||||||||
| 800,000 | 1.661 | 05/17/60 | 800,517 | |||||||||||
Arran Residential Mortgages Funding PLC Series 2011-1A, Class A1B(a) | ||||||||||||||
| 400,000 | 2.624 | 11/19/47 | 579,819 | |||||||||||
FHLMC REMIC Series 2005-3038, Class XA(d) | ||||||||||||||
| 7,787 | 0.000 | 09/15/35 | 7,730 | |||||||||||
Fosse Master Issuer PLC Series 2011-1A, Class A2(a) | ||||||||||||||
| 750,000 | 1.619 | 10/18/54 | 748,975 | |||||||||||
Holmes Master Issuer PLC Series 2010-1A, Class A2(a) | ||||||||||||||
| 300,000 | 1.678 | 10/15/54 | 300,515 | |||||||||||
Permanent Master Issuer PLC Series 2011-1A, Class 1A3(a) | ||||||||||||||
| 900,000 | 2.617 | 07/15/42 | 1,303,843 | |||||||||||
Silverstone Master Issuer PLC Series 2010-1A, Class A1(a) | ||||||||||||||
| 800,000 | 1.674 | 01/21/55 | 799,998 | |||||||||||
| 4,541,397 | ||||||||||||||
Sequential Fixed Rate – 0.3% | ||||||||||||||
| National Credit Union Administration Guaranteed Notes | ||||||||||||||
| 500,000 | 3.000 | 06/12/19 | 494,250 | |||||||||||
TOTAL COLLATERALIZED MORTGAGE OBLIGATIONS | 23,802,129 | |||||||||||||
Commercial Mortgage-Backed Securities – 5.6% | ||||||||||||||
Adjustable Rate Non-Agency(c) – 0.8% | ||||||||||||||
Wachovia Bank Commercial Mortgage Trust Series 2006-C25, Class A5 | ||||||||||||||
| $ | 1,200,000 | 5.860 | % | 05/15/43 | $ | 1,316,851 | ||||||||
Sequential Fixed Rate – 4.3% | ||||||||||||||
CWCapital Cobalt Ltd. Series 2006-C1, Class A4 | ||||||||||||||
| 1,052,000 | 5.223 | 08/15/48 | 1,121,866 | |||||||||||
GE Capital Commercial Mortgage Corp. Series 2002-1A, Class A3 | ||||||||||||||
| 2,385,371 | 6.269 | 12/10/35 | 2,435,575 | |||||||||||
LB-UBS Commercial Mortgage Trust Series 2007-C1, Class A4 | ||||||||||||||
| 400,000 | 5.424 | 02/15/40 | 430,749 | |||||||||||
Morgan Stanley Dean Witter Capital I Series 2003-TOP9, Class A2 | ||||||||||||||
| 2,681,024 | 4.740 | 11/13/36 | 2,772,320 | |||||||||||
| 6,760,510 | ||||||||||||||
Sequential Floating Rate(c) – 0.5% | ||||||||||||||
LB-UBS Commercial Mortgage Trust Series 2007-C7, Class A3 | ||||||||||||||
| 800,000 | 5.866 | 09/15/45 | 869,998 | |||||||||||
TOTAL COMMERCIAL MORTGAGE-BACKED SECURITIES | 8,947,359 | |||||||||||||
Federal Agencies – 34.8% | ||||||||||||||
Adjustable Rate FHLMC(c) – 1.7% | ||||||||||||||
| $ | 1,686,681 | 2.591 | % | 09/01/35 | $ | 1,775,115 | ||||||||
| 778,217 | 4.775 | 10/01/35 | 829,774 | |||||||||||
| 2,604,889 | ||||||||||||||
Adjustable Rate FNMA(c) – 1.6% | ||||||||||||||
| 590,073 | 2.077 | 05/01/33 | 614,351 | |||||||||||
| 848,364 | 2.457 | 05/01/35 | 888,626 | |||||||||||
| 1,002,245 | 2.786 | 09/01/35 | 1,058,982 | |||||||||||
| 2,561,959 | ||||||||||||||
FHLMC – 2.9% | ||||||||||||||
| 1,736 | 7.000 | 11/01/11 | 1,761 | |||||||||||
| 996 | 7.000 | 12/01/11 | 1,010 | |||||||||||
| 28,621 | 7.500 | 06/01/15 | 31,355 | |||||||||||
| 56,267 | 7.000 | 07/01/16 | 60,334 | |||||||||||
| 551,809 | 5.500 | 02/01/18 | 598,756 | |||||||||||
| 43,051 | 5.500 | 04/01/18 | 46,714 | |||||||||||
| 16,103 | 4.500 | 09/01/18 | 17,176 | |||||||||||
| 78,230 | 5.500 | 09/01/18 | 84,885 | |||||||||||
| 8,723 | 9.500 | 08/01/19 | 9,766 | |||||||||||
| 663 | 9.500 | 08/01/20 | 744 | |||||||||||
| 142,032 | 6.500 | 10/01/20 | 160,157 | |||||||||||
| 31,738 | 4.500 | 07/01/24 | 33,912 | |||||||||||
| 180,833 | 4.500 | 11/01/24 | 193,336 | |||||||||||
| 41,428 | 4.500 | 12/01/24 | 44,293 | |||||||||||
| 59,942 | 6.000 | 03/01/29 | 66,605 | |||||||||||
| 680 | 6.000 | 04/01/29 | 756 | |||||||||||
| 38,125 | 7.500 | 12/01/29 | 42,978 | |||||||||||
| 354,451 | 7.000 | 05/01/32 | 400,091 | |||||||||||
| 1,126 | 6.000 | 08/01/32 | 1,247 | |||||||||||
| 194,945 | 7.000 | 12/01/32 | 220,046 | |||||||||||
| 36,498 | 5.000 | 12/01/35 | 38,893 | |||||||||||
| 40,677 | 6.000 | 09/01/37 | 45,117 | |||||||||||
| 66,568 | 6.000 | 02/01/38 | 73,844 | |||||||||||
| 162,792 | 6.000 | 07/01/38 | 180,785 | |||||||||||
| 47,728 | 6.000 | 10/01/38 | 53,041 | |||||||||||
| 877,482 | 4.500 | 09/01/39 | 914,398 | |||||||||||
| 89,223 | 4.500 | 10/01/39 | 92,976 | |||||||||||
| 790,456 | 5.500 | 01/01/40 | 854,078 | |||||||||||
| 297,046 | 4.000 | 12/01/40 | 297,267 | |||||||||||
| 4,566,321 | ||||||||||||||
FNMA – 23.0% | ||||||||||||||
| 7,533 | 6.000 | 08/01/13 | 8,198 | |||||||||||
| 77,839 | 7.500 | 08/01/15 | 85,025 | |||||||||||
| 35,936 | 6.000 | 04/01/16 | 39,202 | |||||||||||
| 67,377 | 6.500 | 05/01/16 | 73,474 | |||||||||||
| 99,686 | 6.500 | 09/01/16 | 108,706 | |||||||||||
| 126,841 | 6.500 | 11/01/16 | 138,318 | |||||||||||
| 33,527 | 7.500 | 04/01/17 | 35,857 | |||||||||||
| 480,380 | 5.500 | 02/01/18 | 520,574 | |||||||||||
| 471,895 | 5.000 | 05/01/18 | 506,310 | |||||||||||
| 41,868 | 6.500 | 08/01/18 | 47,438 | |||||||||||
| 200,383 | 7.000 | 08/01/18 | 228,750 | |||||||||||
| 7,745 | 5.000 | 06/01/23 | 8,310 | |||||||||||
| 573,604 | 5.500 | 09/01/23 | 622,475 | |||||||||||
| 116,666 | 5.500 | 10/01/23 | 126,993 | |||||||||||
| 25,083 | 4.500 | 07/01/24 | 26,867 | |||||||||||
| 404,216 | 4.500 | 11/01/24 | 432,954 | |||||||||||
| 144,125 | 4.500 | 12/01/24 | 154,372 | |||||||||||
| 287 | 7.000 | 07/01/25 | 328 | |||||||||||
| 6,358 | 7.000 | 11/01/25 | 7,256 | |||||||||||
GOLDMAN SACHS VARIABLE INSURANCE TRUST CORE FIXED INCOME FUND
| Principal | Interest | Maturity | ||||||||||||
| Amount | Rate | Date | Value | |||||||||||
Mortgage-Backed Obligations – (continued) | ||||||||||||||
FNMA – (continued) | ||||||||||||||
| $ | 40,505 | 9.000 | % | 11/01/25 | $ | 47,873 | ||||||||
| 182,952 | 7.000 | 08/01/26 | 211,006 | |||||||||||
| 1,807 | 7.000 | 08/01/27 | 2,062 | |||||||||||
| 11,268 | 7.000 | 09/01/27 | 12,862 | |||||||||||
| 56,086 | 6.000 | 12/01/27 | 61,666 | |||||||||||
| 455 | 7.000 | 01/01/28 | 520 | |||||||||||
| 331,592 | 6.000 | 02/01/29 | 367,135 | |||||||||||
| 304,362 | 6.000 | 06/01/29 | 336,964 | |||||||||||
| 60,502 | 8.000 | 10/01/29 | 71,086 | |||||||||||
| 21,349 | 7.000 | 12/01/29 | 24,361 | |||||||||||
| 1,535 | 8.500 | 04/01/30 | 1,814 | |||||||||||
| 7,626 | 8.000 | 05/01/30 | 8,689 | |||||||||||
| 419 | 8.500 | 06/01/30 | 496 | |||||||||||
| 23,870 | 7.000 | 05/01/32 | 27,190 | |||||||||||
| 182,861 | 7.000 | 06/01/32 | 207,952 | |||||||||||
| 241,035 | 7.000 | 08/01/32 | 274,109 | |||||||||||
| 48,769 | 8.000 | 08/01/32 | 57,498 | |||||||||||
| 21,667 | 5.000 | 08/01/33 | 23,134 | |||||||||||
| 3,075 | 5.500 | 09/01/33 | 3,344 | |||||||||||
| 4,180 | 5.500 | 02/01/34 | 4,546 | |||||||||||
| 664 | 5.500 | 04/01/34 | 722 | |||||||||||
| 39,718 | 5.500 | 12/01/34 | 43,178 | |||||||||||
| 85,137 | 5.000 | 04/01/35 | 90,811 | |||||||||||
| 250,076 | 6.000 | 04/01/35 | 276,464 | |||||||||||
| 12,340 | 5.000 | 09/01/35 | 13,169 | |||||||||||
| 5,316 | 5.500 | 09/01/35 | 5,775 | |||||||||||
| 578 | 5.500 | 02/01/37 | 628 | |||||||||||
| 943 | 5.500 | 04/01/37 | 1,025 | |||||||||||
| 969 | 5.500 | 05/01/37 | 1,053 | |||||||||||
| 88,364 | 6.000 | 12/01/37 | 98,084 | |||||||||||
| 1,420 | 5.500 | 03/01/38 | 1,544 | |||||||||||
| 41,793 | 6.000 | 05/01/38 | 46,463 | |||||||||||
| 993 | 5.500 | 06/01/38 | 1,079 | |||||||||||
| 37,604 | 6.000 | 06/01/38 | 41,806 | |||||||||||
| 1,406 | 5.500 | 07/01/38 | 1,528 | |||||||||||
| 92,213 | 6.000 | 07/01/38 | 102,529 | |||||||||||
| 1,582 | 5.500 | 08/01/38 | 1,719 | |||||||||||
| 36,825 | 6.000 | 08/01/38 | 40,944 | |||||||||||
| 904 | 5.500 | 09/01/38 | 983 | |||||||||||
| 19,910 | 5.500 | 10/01/38 | 21,639 | |||||||||||
| 47,011 | 6.000 | 10/01/38 | 52,270 | |||||||||||
| 50,883 | 6.000 | 11/01/38 | 56,575 | |||||||||||
| 553 | 5.500 | 12/01/38 | 601 | |||||||||||
| 378,300 | 5.000 | 01/01/39 | 403,746 | |||||||||||
| 67,503 | 4.500 | 08/01/39 | 70,282 | |||||||||||
| 199,414 | 4.500 | 12/01/39 | 207,960 | |||||||||||
| 49,746 | 4.500 | 01/01/40 | 51,864 | |||||||||||
| 93,526 | 3.500 | 12/01/40 | 89,617 | |||||||||||
| 7,886,727 | 3.500 | 02/01/41 | 7,556,942 | |||||||||||
| 996,747 | 3.500 | 03/01/41 | 955,084 | |||||||||||
| 6,000,000 | 3.500 | TBA-15yr | (f) | 6,108,750 | ||||||||||
| 9,000,000 | 4.000 | TBA-30yr | (f) | 9,000,000 | ||||||||||
| 3,000,000 | 4.500 | TBA-30yr | (f) | 3,103,828 | ||||||||||
| 2,000,000 | 5.000 | TBA-30yr | (f) | 2,124,688 | ||||||||||
| 1,000,000 | 6.000 | TBA-30yr | (f) | 1,098,906 | ||||||||||
| 36,587,970 | ||||||||||||||
GNMA – 5.6% | ||||||||||||||
| 1,521 | 7.000 | 03/15/12 | 1,527 | |||||||||||
| 11,405 | 7.000 | 10/15/25 | 13,231 | |||||||||||
| 15,772 | 7.000 | 11/15/25 | 18,296 | |||||||||||
| 2,895 | 7.000 | 02/15/26 | 3,365 | |||||||||||
| 11,418 | 7.000 | 04/15/26 | 13,268 | |||||||||||
| 6,658 | 7.000 | 03/15/27 | 7,604 | |||||||||||
| 107,320 | 7.000 | 11/15/27 | 122,570 | |||||||||||
| 5,239 | 7.000 | 01/15/28 | 5,986 | |||||||||||
| 40,417 | 7.000 | 02/15/28 | 46,183 | |||||||||||
| 15,444 | 7.000 | 03/15/28 | 17,647 | |||||||||||
| 4,091 | 7.000 | 04/15/28 | 4,675 | |||||||||||
| 644 | 7.000 | 05/15/28 | 736 | |||||||||||
| 10,637 | 7.000 | 06/15/28 | 12,154 | |||||||||||
| 22,878 | 7.000 | 07/15/28 | 26,141 | |||||||||||
| 15,154 | 7.000 | 08/15/28 | 17,315 | |||||||||||
| 38,097 | 7.000 | 09/15/28 | 43,531 | |||||||||||
| 4,356 | 7.000 | 11/15/28 | 4,978 | |||||||||||
| 5,135 | 7.500 | 11/15/30 | 5,972 | |||||||||||
| 627 | 7.000 | 12/15/31 | 716 | |||||||||||
| 25,869 | 7.500 | 10/15/32 | 30,587 | |||||||||||
| 665,412 | 6.000 | 08/20/34 | 740,301 | |||||||||||
| 332,386 | 3.500 | 11/15/40 | 323,331 | |||||||||||
| 2,000,000 | 4.500 | TBA-30yr | (f) | 2,110,781 | ||||||||||
| 3,000,000 | 5.000 | TBA-30yr | (f) | 3,249,375 | ||||||||||
| 2,000,000 | 4.500 | TBA-30yr | (f) | 2,104,219 | ||||||||||
| 8,924,489 | ||||||||||||||
TOTAL FEDERAL AGENCIES | $ | 55,245,628 | ||||||||||||
TOTAL MORTGAGE-BACKED OBLIGATIONS | ||||||||||||||
(Cost $92,803,684) | $ | 92,570,470 | ||||||||||||
Agency Debenture – 0.6% | ||||||||||||||
Tennessee Valley Authority(g) | ||||||||||||||
| $ | 900,000 | 5.375 | % | 04/01/56 | $ | 966,449 | ||||||||
(Cost $895,011) | ||||||||||||||
Asset-Backed Securities – 2.5% | ||||||||||||||
Home Equity – 0.2% | ||||||||||||||
GMAC Mortgage Corp. Loan Trust Series 2007-HE3, Class 1A1 | ||||||||||||||
| $ | 152,202 | 7.000 | % | 09/25/37 | $ | 110,346 | ||||||||
GMAC Mortgage Corp. Loan Trust Series 2007-HE3, Class 2A1 | ||||||||||||||
| 195,541 | 7.000 | (b) | 09/25/37 | 136,683 | ||||||||||
| 247,029 | ||||||||||||||
Student Loans(c) – 2.3% | ||||||||||||||
Brazos Higher Education Authority Series 2011-1, Class A2 | ||||||||||||||
| 1,000,000 | 1.057 | 02/25/30 | 987,043 | |||||||||||
Brazos Higher Education Authority Series 2011-2, Class A2 | ||||||||||||||
| 800,000 | 1.097 | 07/25/29 | 791,995 | |||||||||||
College Loan Corp. Trust Series 2006-1, Class A3 | ||||||||||||||
| 1,000,000 | 0.364 | 10/25/25 | 991,061 | |||||||||||
Goal Capital Funding Trust Series 2010-1, Class A(a) | ||||||||||||||
| 276,142 | 0.957 | 08/25/48 | 273,014 | |||||||||||
GOLDMAN SACHS VARIABLE INSURANCE TRUST CORE FIXED INCOME FUND
Schedule of Investments (continued)
June 30, 2011 (Unaudited)
| Principal | Interest | Maturity | ||||||||||||
| Amount | Rate | Date | Value | |||||||||||
Asset-Backed Securities – (continued) | ||||||||||||||
Student Loans(c) – (continued) | ||||||||||||||
Knowledgeworks Foundation Series 2010-1, Class A | ||||||||||||||
| $ | 282,535 | 1.207 | % | 02/25/42 | $ | 278,682 | ||||||||
Nelnet Student Loan Trust Series 2010-3A, Class A(a) | ||||||||||||||
| 364,218 | 1.054 | 07/27/48 | 364,564 | |||||||||||
| 3,686,359 | ||||||||||||||
TOTAL ASSET-BACKED SECURITIES | ||||||||||||||
(Cost $4,029,099) | $ | 3,933,388 | ||||||||||||
Foreign Debt Obligations – 8.0% | ||||||||||||||
Sovereign – 7.6% | ||||||||||||||
Bank Negara Malaysia Monetary Notes(h) | ||||||||||||||
| MYR | 2,450,000 | 0.000 | % | �� | 09/22/11 | $ | 805,673 | |||||||
| 2,450,000 | 0.000 | 09/27/11 | 805,307 | |||||||||||
| Federal Republic of Brazil | ||||||||||||||
| $ | 220,000 | 8.250 | 01/20/34 | 302,500 | ||||||||||
| 200,000 | 7.125 | 01/20/37 | 247,000 | |||||||||||
| Malaysia Government Bond | ||||||||||||||
| MYR | 1,220,000 | 3.434 | 08/15/14 | 406,303 | ||||||||||
| State of Qatar | ||||||||||||||
| $ | 260,000 | 5.150 | 04/09/14 | 282,360 | ||||||||||
| 330,000 | 5.250 | (a) | 01/20/20 | 352,110 | ||||||||||
| United Kingdom Gilt | ||||||||||||||
| GBP | 4,200,000 | 4.500 | 03/07/13 | 7,155,079 | ||||||||||
| 1,000,000 | 2.750 | 01/22/15 | 1,665,216 | |||||||||||
| 12,021,548 | ||||||||||||||
Supranational – 0.4% | ||||||||||||||
| North American Development Bank | ||||||||||||||
| $ | 600,000 | 4.375 | 02/11/20 | 620,296 | ||||||||||
TOTAL FOREIGN DEBT OBLIGATIONS | ||||||||||||||
(Cost $12,361,222) | $ | 12,641,844 | ||||||||||||
Municipal Debt Obligations – 2.3% | ||||||||||||||
California – 1.1% | ||||||||||||||
| California State Various Purpose GO Bonds Series 2009 | ||||||||||||||
| $ | 325,000 | 7.500 | % | 04/01/34 | $ | 367,575 | ||||||||
| 450,000 | 7.550 | 04/01/39 | 514,962 | |||||||||||
| California State Various Purpose GO Bonds Series 2010 | ||||||||||||||
| 140,000 | 7.950 | 03/01/36 | 152,535 | |||||||||||
| 575,000 | 7.625 | 03/01/40 | 661,946 | |||||||||||
| 1,697,018 | ||||||||||||||
Illinois – 0.2% | ||||||||||||||
Illinois State GO Bonds for Build American Bonds Series 2010-5 | ||||||||||||||
| 275,000 | 7.350 | 07/01/35 | 292,386 | |||||||||||
Missouri – 0.5% | ||||||||||||||
Missouri Higher Education Loan Authority RB Asset-Backed Notes Series 2010 A-1(c)(i) | ||||||||||||||
| 847,031 | 1.207 | 08/25/11 | 849,043 | |||||||||||
New York – 0.3% | ||||||||||||||
| Rensselaer Polytechnic Institute Taxable Bonds Series 2010 | ||||||||||||||
| 475,000 | 5.600 | 09/01/20 | 506,844 | |||||||||||
Ohio – 0.1% | ||||||||||||||
| American Municipal Power, Inc. RB Build America Bond Series 2010 E RMKT | ||||||||||||||
| 250,000 | 6.270 | 02/15/50 | 250,398 | |||||||||||
Texas – 0.1% | ||||||||||||||
| Dallas Area Rapid Transit Sales Tax RB Senior Lien Series 2008 B2 | ||||||||||||||
| 100,000 | 5.250 | 12/01/48 | 102,708 | |||||||||||
TOTAL MUNICIPAL DEBT OBLIGATIONS | ||||||||||||||
(Cost $3,478,234) | $ | 3,698,397 | ||||||||||||
Government Guarantee Obligations(j) – 4.8% | ||||||||||||||
Achmea Hypotheekbank NV(a) | ||||||||||||||
| $ | 1,300,000 | 3.200 | % | 11/03/14 | $ | 1,364,483 | ||||||||
BRFkredit AS(a) | ||||||||||||||
| 1,700,000 | 2.050 | 04/15/13 | 1,736,004 | |||||||||||
Commonwealth Bank of Australia(a) | ||||||||||||||
| 700,000 | 2.500 | 12/10/12 | 717,823 | |||||||||||
FIH Erhvervsbank A/S(a) | ||||||||||||||
| 1,400,000 | 1.750 | 12/06/12 | 1,422,974 | |||||||||||
| Landwirtschaftliche Rentenbank | ||||||||||||||
| 1,400,000 | 4.125 | 07/15/13 | 1,495,061 | |||||||||||
| 400,000 | 2.125 | 07/15/16 | 400,091 | |||||||||||
Swedbank AB(a) | ||||||||||||||
| 200,000 | 2.900 | 01/14/13 | 206,944 | |||||||||||
Westpac Securities NZ Ltd.(a) | ||||||||||||||
| 200,000 | 2.500 | 05/25/12 | 203,231 | |||||||||||
TOTAL GOVERNMENT GUARANTEE OBLIGATIONS | ||||||||||||||
(Cost $7,346,321) | $ | 7,546,611 | ||||||||||||
U.S. Treasury Obligations – 4.0% | ||||||||||||||
| United States Treasury Bonds | ||||||||||||||
| $ | 1,200,000 | 4.250 | % | 11/15/40 | $ | 1,173,132 | ||||||||
| United States Treasury Inflation-Protected Securities | ||||||||||||||
| 669,150 | 2.375 | 01/15/27 | 763,039 | |||||||||||
| United States Treasury Notes | ||||||||||||||
| 2,300,000 | 1.500 | 06/30/16 | 2,271,871 | |||||||||||
| 2,200,000 | 3.125 | 05/15/21 | 2,193,818 | |||||||||||
TOTAL U.S. TREASURY OBLIGATIONS | ||||||||||||||
(Cost $6,356,177) | $ | 6,401,860 | ||||||||||||
GOLDMAN SACHS VARIABLE INSURANCE TRUST CORE FIXED INCOME FUND
| Shares | Rate | Value | ||||||||
Short-term Investment(c) – 15.2% | ||||||||||
| JPMorgan U.S. Government Money Market Fund – Capital Shares | ||||||||||
| 24,126,683 | 0.010 | % | $ | 24,126,683 | ||||||
(Cost $24,126,683) | ||||||||||
TOTAL INVESTMENTS – 117.7% | ||||||||||
(Cost $184,987,660) | $ | 186,876,603 | ||||||||
LIABILITIES IN EXCESS OF OTHER ASSETS – (17.7)% | (28,061,818 | ) | ||||||||
NET ASSETS – 100.0% | $ | 158,814,785 | ||||||||
The percentage shown for each investment category reflects the value of investments in that category as a percentage of net assets.
| (a) | Exempt from registration under Rule 144A of the Securities Act of 1933. Under procedures approved by the Board of Trustees, such securities have been determined to be liquid by the Investment Adviser and may be resold, normally to qualified institutional buyers in transactions exempt from registration. Total market value of Rule 144A securities amounts to 31,657,480, which represents approximately 19.9% of net assets as of June 30, 2011. | |
| (b) | Securities with “Call” features with resetting interest rates. Maturity dates disclosed are the final maturity dates. | |
| (c) | Variable rate security. Interest rate disclosed is that which is in effect at June 30, 2011. | |
| (d) | Issued with a zero coupon. Interest rate is contingent upon LIBOR reaching a predetermined level. | |
| (e) | Security with notional or nominal principal amount. The actual effective yield of this security is different than the stated interest rate. | |
| (f) | TBA (To Be Announced) Securities are purchased/sold on a forward commitment basis with an approximate principal amount and no defined maturity date. The actual principal and maturity date will be determined upon settlement when the specific mortgage pools are assigned. Total market value of TBA securities (excluding forward sales contracts, if any) amounts to $28,900,547 which represents approximately 18.2% of net assets as of June 30, 2011. | |
| (g) | All or a portion of this security is segregated as collateral for initial margin requirements or futures transactions. | |
| (h) | Issued with zero coupon. Income is recognized through the accretion of discount. | |
| (i) | Maturity date disclosed is the next interest reset date. | |
| (j) | Guaranteed by a foreign government under maturity. |
Investment Abbreviations: | ||||
| FHLMC | — | Federal Home Loan Mortgage Corp. | ||
| FNMA | — | Federal National Mortgage Association | ||
| GNMA | — | Government National Mortgage Association | ||
| GO | — | General Obligation | ||
| LIBOR | — | London Interbank Offered Rate | ||
| RB | — | Revenue Bond | ||
| REMIC | — | Real Estate Mortgage Investment Conduit | ||
| RMKT | — | Remarketed | ||
Currency Abbreviations: | ||||
| AUD | — | Australian Dollar | ||
| CAD | — | Canadian Dollar | ||
| CHF | — | Swiss Franc | ||
| EUR | — | Euro Dollar | ||
| GBP | — | British Pound | ||
| JPY | — | Japanese Yen | ||
| MYR | — | Malaysian Ringgit | ||
| NOK | — | Norwegian Krone | ||
| NZD | — | New Zealand Dollar | ||
| SEK | — | Swedish Krona | ||
| USD | — | United States Dollar | ||
GOLDMAN SACHS VARIABLE INSURANCE TRUST CORE FIXED INCOME FUND
Schedule of Investments (continued)
June 30, 2011 (Unaudited)
| ADDITIONAL INVESTMENT INFORMATION |
FORWARD FOREIGN CURRENCY EXCHANGE CONTRACTS — At June 30, 2011, the Fund had outstanding forward foreign currency exchange contracts, both to purchase and sell foreign currencies:
FORWARD FOREIGN CURRENCY EXCHANGE CONTRACTS WITH UNREALIZED GAIN
| Contracts to | Expiration | Current | Unrealized | |||||||||||
| Counterparty | Buy/Sell | Date | Value | Gain | ||||||||||
| Barclays Bank PLC | USD/JPY | 9/21/11 | $ | 443,252 | $ | 1,872 | ||||||||
| Citibank NA | AUD/USD | 9/21/11 | 415,068 | 2,799 | ||||||||||
| NZD/EUR | 9/21/11 | 216,533 | 2,388 | |||||||||||
| NZD/USD | 9/21/11 | 215,085 | 2,985 | |||||||||||
| HSBC Bank PLC | NOK/USD | 9/21/11 | 366,456 | 3,456 | ||||||||||
| Royal Bank of Canada | CAD/JPY | 9/21/11 | 109,689 | 1,847 | ||||||||||
| CAD/USD | 9/21/11 | 531,457 | 7,530 | |||||||||||
| Royal Bank of Scotland | EUR/CHF | 9/21/11 | 180,866 | 3,462 | ||||||||||
| JPY/GBP | 9/21/11 | 319,576 | 489 | |||||||||||
| SEK/EUR | 9/21/11 | 216,983 | 1,390 | |||||||||||
| USD/CHF | 9/21/11 | 155,341 | 659 | |||||||||||
| UBS AG | CHF/EUR | 9/21/11 | 215,312 | 1,166 | ||||||||||
| EUR/CHF | 9/21/11 | 218,486 | 3,013 | |||||||||||
| Westpac Banking Corp. | AUD/USD | 9/21/11 | 107,243 | 707 | ||||||||||
| NZD/USD | 9/21/11 | 363,297 | 2,812 | |||||||||||
TOTAL | $ | 36,575 | ||||||||||||
FORWARD FOREIGN CURRENCY EXCHANGE CONTRACTS WITH UNREALIZED LOSS
| Contracts to | Expiration | Current | Unrealized | |||||||||||
| Counterparty | Buy/Sell | Date | Value | Loss | ||||||||||
| Citibank NA | EUR/USD | 9/21/11 | $ | 214,146 | $ | (1,309 | ) | |||||||
| USD/AUD | 9/21/11 | 108,305 | (2,062 | ) | ||||||||||
| USD/EUR | 9/21/11 | 609,157 | (2,158 | ) | ||||||||||
| USD/NZD | 9/21/11 | 220,029 | (5,719 | ) | ||||||||||
| Deutsche Bank Securities, Inc. | USD/EUR | 7/27/11 | 1,976,328 | (28,810 | ) | |||||||||
| USD/GBP | 8/05/11 | 8,862,952 | (33,500 | ) | ||||||||||
| HSBC Bank PLC | USD/SEK | 9/21/11 | 599,237 | (11,507 | ) | |||||||||
| JPMorgan Chase Bank NA | NOK/USD | 9/21/11 | 466,114 | (3,787 | ) | |||||||||
| Royal Bank of Canada | JPY/CAD | 9/21/11 | 106,884 | (1,770 | ) | |||||||||
| USD/CAD | 9/21/11 | 272,380 | (4,380 | ) | ||||||||||
| USD/SEK | 9/21/11 | 109,002 | (2,003 | ) | ||||||||||
| Royal Bank of Scotland | GBP/USD | 9/21/11 | 112,794 | (2,614 | ) | |||||||||
| SEK/USD | 9/21/11 | 376,518 | (10,435 | ) | ||||||||||
| USD/EUR | 9/21/11 | 217,040 | (2,109 | ) | ||||||||||
| State Street Bank and Trust Co. | EUR/CHF | 9/21/11 | 326,844 | (834 | ) | |||||||||
| UBS AG | EUR/USD | 9/21/11 | 245,828 | (2,492 | ) | |||||||||
| USD/AUD | 9/21/11 | 430,033 | (7,327 | ) | ||||||||||
| USD/NOK | 9/21/11 | 354,967 | (10,967 | ) | ||||||||||
| Westpac Banking Corp. | USD/AUD | 9/21/11 | 87,068 | (2,376 | ) | |||||||||
| USD/NZD | 9/21/11 | 498,165 | (6,402 | ) | ||||||||||
TOTAL | $ | (142,561 | ) | |||||||||||
GOLDMAN SACHS VARIABLE INSURANCE TRUST CORE FIXED INCOME FUND
| ADDITIONAL INVESTMENT INFORMATION (continued) |
FORWARD SALES CONTRACTS — At June 30, 2011, the Fund had the following forward sales contracts:
| Interest | Maturity | Settlement | Principal | |||||||||||||||
| Description | Rate | Date(f) | Date | Amount | Value | |||||||||||||
| FNMA | 3.500 | % | TBA-30yr | 07/14/11 | $ | (6,000,000 | ) | $ | (5,738,907 | ) | ||||||||
| FNMA | 3.500 | TBA-30yr | 08/11/11 | (2,000,000 | ) | (1,907,656 | ) | |||||||||||
TOTAL (Proceeds Receivable: $7,723,516) | $ | (7,646,563 | ) | |||||||||||||||
FUTURES CONTRACTS — At June 30, 2011, the following futures contracts were open:
| Number of | ||||||||||||||
| Contracts | Expiration | Current | Unrealized | |||||||||||
| Type | Long (Short) | Date | Value | Gain (Loss) | ||||||||||
| Eurodollars | (7 | ) | March 2012 | $ | (1,741,513 | ) | $ | (12,207 | ) | |||||
| U.S. Treasury Bonds | 7 | September 2011 | 861,219 | (637 | ) | |||||||||
| U.S. Ultra Long Treasury Bonds | 27 | September 2011 | 3,408,750 | (57,576 | ) | |||||||||
| 2 Year U.S. Treasury Notes | 54 | September 2011 | 11,844,562 | 21,124 | ||||||||||
| 5 Year U.S. Treasury Notes | 25 | September 2011 | 2,979,883 | (23,690 | ) | |||||||||
| 10 Year U.S. Treasury Notes | 62 | September 2011 | 7,584,344 | (44,798 | ) | |||||||||
TOTAL | $ | (117,784 | ) | |||||||||||
GOLDMAN SACHS VARIABLE INSURANCE TRUST EQUITY INDEX FUND
Schedule of Investments
June 30, 2011 (Unaudited)
| Shares | Description | Value | ||||||
Common Stocks – 99.4% | ||||||||
Automobiles & Components – 0.8% | ||||||||
| 59,913 | Ford Motor Co.* | $ | 826,200 | |||||
| 3,800 | Harley-Davidson, Inc. | 155,686 | ||||||
| 10,835 | Johnson Controls, Inc. | 451,386 | ||||||
| 3,800 | The Goodyear Tire & Rubber Co.* | 63,726 | ||||||
| 1,496,998 | ||||||||
Banks – 2.7% | ||||||||
| 10,900 | BB&T Corp. | 292,556 | ||||||
| 2,850 | Comerica, Inc. | 98,525 | ||||||
| 14,305 | Fifth Third Bancorp | 182,389 | ||||||
| 4,486 | First Horizon National Corp. | 42,796 | ||||||
| 8,700 | Hudson City Bancorp, Inc. | 71,253 | ||||||
| 12,749 | Huntington Bancshares, Inc. | 83,633 | ||||||
| 14,300 | KeyCorp | 119,119 | ||||||
| 1,916 | M&T Bank Corp. | 168,512 | ||||||
| 8,000 | Marshall & Ilsley Corp. | 63,760 | ||||||
| 6,100 | People’s United Financial, Inc. | 81,984 | ||||||
| 8,257 | PNC Financial Services Group, Inc. | 492,200 | ||||||
| 19,425 | Regions Financial Corp. | 120,435 | ||||||
| 7,900 | SunTrust Banks, Inc. | 203,820 | ||||||
| 30,551 | U.S. Bancorp | 779,356 | ||||||
| 83,967 | Wells Fargo & Co. | 2,356,114 | ||||||
| 2,800 | Zions Bancorporation | 67,228 | ||||||
| 5,223,680 | ||||||||
Capital Goods – 8.6% | ||||||||
| 11,339 | 3M Co. | 1,075,504 | ||||||
| 10,171 | Caterpillar, Inc. | 1,082,805 | ||||||
| 3,100 | Cummins, Inc. | 320,819 | ||||||
| 8,600 | Danaher Corp. | 455,714 | ||||||
| 6,679 | Deere & Co. | 550,684 | ||||||
| 2,901 | Dover Corp. | 196,688 | ||||||
| 5,400 | Eaton Corp. | 277,830 | ||||||
| 11,996 | Emerson Electric Co. | 674,775 | ||||||
| 4,800 | Fastenal Co. | 172,752 | ||||||
| 900 | Flowserve Corp. | 98,901 | ||||||
| 2,782 | Fluor Corp. | 179,884 | ||||||
| 5,906 | General Dynamics Corp. | 440,115 | ||||||
| 167,747 | General Electric Co. | 3,163,708 | ||||||
| 2,037 | Goodrich Corp. | 194,534 | ||||||
| 12,408 | Honeywell International, Inc. | 739,393 | ||||||
| 7,900 | Illinois Tool Works, Inc. | 446,271 | ||||||
| 5,200 | Ingersoll-Rand PLC | 236,132 | ||||||
| 3,000 | ITT Corp. | 176,790 | ||||||
| 2,100 | Jacobs Engineering Group, Inc.* | 90,825 | ||||||
| 1,700 | Joy Global, Inc. | 161,908 | ||||||
| 1,600 | L-3 Communications Holdings, Inc. | 139,920 | ||||||
| 4,551 | Lockheed Martin Corp. | 368,495 | ||||||
| 5,400 | Masco Corp. | 64,962 | ||||||
| 4,692 | Northrop Grumman Corp. | 325,390 | ||||||
| 5,793 | PACCAR, Inc. | 295,964 | ||||||
| 1,900 | Pall Corp. | 106,837 | ||||||
| 2,548 | Parker Hannifin Corp. | 228,658 | ||||||
| 2,300 | Precision Castparts Corp. | 378,695 | ||||||
| 3,500 | Quanta Services, Inc.* | 70,700 | ||||||
| 5,676 | Raytheon Co. | 282,949 | ||||||
| 2,200 | Rockwell Automation, Inc. | 190,872 | ||||||
| 2,460 | Rockwell Collins, Inc. | 151,757 | ||||||
| 1,500 | Roper Industries, Inc. | 124,950 | ||||||
| 1,003 | Snap-On, Inc. | 62,667 | ||||||
| 2,652 | Stanley Black & Decker, Inc. | 191,077 | ||||||
| 4,500 | Textron, Inc. | 106,245 | ||||||
| 11,667 | The Boeing Co. | 862,541 | ||||||
| 7,500 | Tyco International Ltd. | 370,725 | ||||||
| 14,414 | United Technologies Corp. | 1,275,783 | ||||||
| 933 | W.W. Grainger, Inc. | 143,355 | ||||||
| 16,478,574 | ||||||||
Commercial & Professional Services – 0.6% | ||||||||
| 1,800 | Avery Dennison Corp. | 69,534 | ||||||
| 2,000 | Cintas Corp. | 66,060 | ||||||
| 800 | Dun & Bradstreet Corp. | 60,432 | ||||||
| 2,050 | Equifax, Inc. | 71,176 | ||||||
| 3,100 | Iron Mountain, Inc. | 105,679 | ||||||
| 3,100 | Pitney Bowes, Inc. | 71,269 | ||||||
| 2,800 | R.R. Donnelley & Sons Co. | 54,908 | ||||||
| 5,010 | Republic Services, Inc. | 154,559 | ||||||
| 2,200 | Robert Half International, Inc. | 59,466 | ||||||
| 1,400 | Stericycle, Inc.* | 124,768 | ||||||
| 7,549 | Waste Management, Inc. | 281,351 | ||||||
| 1,119,202 | ||||||||
Consumer Durables & Apparel – 1.0% | ||||||||
| 4,600 | Coach, Inc. | 294,078 | ||||||
| 4,700 | D.R. Horton, Inc. | 54,144 | ||||||
| 2,500 | Fortune Brands, Inc. | 159,425 | ||||||
| 1,100 | Harman International Industries, Inc. | 50,127 | ||||||
| 2,221 | Hasbro, Inc. | 97,568 | ||||||
| 2,500 | Leggett & Platt, Inc. | 60,950 | ||||||
| 2,500 | Lennar Corp. Class A | 45,375 | ||||||
| 5,651 | Mattel, Inc. | 155,346 | ||||||
| 4,733 | Newell Rubbermaid, Inc. | 74,687 | ||||||
| 6,059 | NIKE, Inc. Class B | 545,189 | ||||||
| 1,000 | Polo Ralph Lauren Corp. | 132,610 | ||||||
| 5,413 | Pulte Group, Inc.* | 41,464 | ||||||
| 1,400 | VF Corp. | 151,984 | ||||||
| 1,259 | Whirlpool Corp. | 102,382 | ||||||
| 1,965,329 | ||||||||
Consumer Services – 1.9% | ||||||||
| 1,900 | Apollo Group, Inc. Class A* | 82,992 | ||||||
| 6,900 | Carnival Corp. | 259,647 | ||||||
| 500 | Chipotle Mexican Grill, Inc.* | 154,095 | ||||||
| 2,220 | Darden Restaurants, Inc. | 110,467 | ||||||
| 900 | DeVry, Inc. | 53,217 | ||||||
| 5,100 | H&R Block, Inc. | 81,804 | ||||||
| 4,900 | International Game Technology | 86,142 | ||||||
| 4,563 | Marriott International, Inc. Class A | 161,941 | ||||||
| 16,397 | McDonald’s Corp. | 1,382,595 | ||||||
| 11,856 | Starbucks Corp. | 468,194 | ||||||
| 3,100 | Starwood Hotels & Resorts Worldwide, Inc. | 173,724 | ||||||
| 2,626 | Wyndham Worldwide Corp. | 88,365 | ||||||
GOLDMAN SACHS VARIABLE INSURANCE TRUST EQUITY INDEX FUND
| Shares | Description | Value | ||||||
Common Stocks – (continued) | ||||||||
Consumer Services – (continued) | ||||||||
| 1,200 | Wynn Resorts Ltd. | $ | 172,248 | |||||
| 7,497 | Yum! Brands, Inc. | 414,134 | ||||||
| 3,689,565 | ||||||||
Diversified Financials – 6.9% | ||||||||
| 16,631 | American Express Co. | 859,823 | ||||||
| 3,880 | Ameriprise Financial, Inc. | 223,798 | ||||||
| 161,192 | Bank of America Corp. | 1,766,664 | ||||||
| 1,500 | BlackRock, Inc. | 287,715 | ||||||
| 7,333 | Capital One Financial Corp. | 378,896 | ||||||
| 46,251 | Citigroup, Inc. | 1,925,892 | ||||||
| 1,039 | CME Group, Inc. | 302,962 | ||||||
| 8,617 | Discover Financial Services | 230,505 | ||||||
| 3,050 | E*Trade Financial Corp.* | 42,090 | ||||||
| 1,656 | Federated Investors, Inc. Class B | 39,479 | ||||||
| 2,330 | Franklin Resources, Inc. | 305,906 | ||||||
| 1,200 | IntercontinentalExchange, Inc.* | 149,652 | ||||||
| 7,300 | Invesco Ltd. | 170,820 | ||||||
| 2,800 | Janus Capital Group, Inc. | 26,432 | ||||||
| 62,867 | JPMorgan Chase & Co. | 2,573,775 | ||||||
| 2,500 | Legg Mason, Inc. | 81,900 | ||||||
| 3,200 | Leucadia National Corp. | 109,120 | ||||||
| 3,100 | Moody’s Corp. | 118,885 | ||||||
| 24,747 | Morgan Stanley | 569,428 | ||||||
| 3,800 | Northern Trust Corp. | 174,648 | ||||||
| 4,100 | NYSE Euronext | 140,507 | ||||||
| 7,871 | SLM Corp. | 132,312 | ||||||
| 8,067 | State Street Corp. | 363,741 | ||||||
| 4,100 | T. Rowe Price Group, Inc. | 247,394 | ||||||
| 19,715 | The Bank of New York Mellon Corp. | 505,098 | ||||||
| 15,742 | The Charles Schwab Corp. | 258,956 | ||||||
| 8,182 | The Goldman Sachs Group, Inc.(a) | 1,088,942 | ||||||
| 2,500 | The NASDAQ OMX Group, Inc.* | 63,250 | ||||||
| 13,138,590 | ||||||||
Energy – 12.6% | ||||||||
| 3,600 | Alpha Natural Resources, Inc.* | 163,584 | ||||||
| 7,865 | Anadarko Petroleum Corp. | 603,717 | ||||||
| 6,116 | Apache Corp. | 754,653 | ||||||
| 6,960 | Baker Hughes, Inc. | 505,018 | ||||||
| 1,700 | Cabot Oil & Gas Corp. | 112,727 | ||||||
| 3,900 | Cameron International Corp.* | 196,131 | ||||||
| 10,517 | Chesapeake Energy Corp. | 312,250 | ||||||
| 31,893 | Chevron Corp. | 3,279,876 | ||||||
| 22,452 | ConocoPhillips | 1,688,166 | ||||||
| 3,500 | Consol Energy, Inc. | 169,680 | ||||||
| 6,200 | Denbury Resources, Inc.* | 124,000 | ||||||
| 6,772 | Devon Energy Corp. | 533,701 | ||||||
| 1,100 | Diamond Offshore Drilling, Inc. | 77,451 | ||||||
| 11,630 | El Paso Corp. | 234,926 | ||||||
| 4,181 | EOG Resources, Inc. | 437,124 | ||||||
| 2,400 | EQT Corp. | 126,048 | ||||||
| 77,960 | Exxon Mobil Corp. | 6,344,385 | ||||||
| 3,746 | FMC Technologies, Inc.* | 167,783 | ||||||
| 14,517 | Halliburton Co. | 740,367 | ||||||
| 1,700 | Helmerich & Payne, Inc. | 112,404 | ||||||
| 4,800 | Hess Corp. | 358,848 | ||||||
| 11,199 | Marathon Oil Corp. | 589,963 | ||||||
| 3,000 | Murphy Oil Corp. | 196,980 | ||||||
| 4,700 | Nabors Industries Ltd.* | 115,808 | ||||||
| 6,618 | National Oilwell Varco, Inc. | 517,594 | ||||||
| 2,100 | Newfield Exploration Co.* | 142,842 | ||||||
| 3,900 | Noble Corp. | 153,699 | ||||||
| 2,800 | Noble Energy, Inc. | 250,964 | ||||||
| 12,895 | Occidental Petroleum Corp. | 1,341,596 | ||||||
| 4,306 | Peabody Energy Corp. | 253,667 | ||||||
| 1,900 | Pioneer Natural Resources Co. | 170,183 | ||||||
| 2,750 | QEP Resources, Inc. | 115,033 | ||||||
| 2,600 | Range Resources Corp. | 144,300 | ||||||
| 1,800 | Rowan Companies, Inc.* | 69,858 | ||||||
| 21,440 | Schlumberger Ltd. | 1,852,416 | ||||||
| 5,500 | Southwestern Energy Co.* | 235,840 | ||||||
| 10,142 | Spectra Energy Corp. | 277,992 | ||||||
| 1,900 | Sunoco, Inc. | 79,249 | ||||||
| 2,200 | Tesoro Corp.* | 50,402 | ||||||
| 9,345 | The Williams Companies, Inc. | 282,686 | ||||||
| 9,013 | Valero Energy Corp. | 230,462 | ||||||
| 24,114,373 | ||||||||
Food & Staples Retailing – 2.3% | ||||||||
| 6,987 | Costco Wholesale Corp. | 567,624 | ||||||
| 21,664 | CVS Caremark Corp. | 814,133 | ||||||
| 5,800 | Safeway, Inc. | 135,546 | ||||||
| 3,373 | SUPERVALU, Inc. | 31,740 | ||||||
| 9,200 | Sysco Corp. | 286,856 | ||||||
| 9,432 | The Kroger Co. | 233,914 | ||||||
| 14,610 | Walgreen Co. | 620,341 | ||||||
| 30,260 | Wal-Mart Stores, Inc. | 1,608,016 | ||||||
| 2,400 | Whole Foods Market, Inc. | 152,280 | ||||||
| 4,450,450 | ||||||||
Food, Beverage & Tobacco – 6.0% | ||||||||
| 33,226 | Altria Group, Inc. | 877,499 | ||||||
| 10,233 | Archer-Daniels-Midland Co. | 308,525 | ||||||
| 1,650 | Brown-Forman Corp. Class B | 123,238 | ||||||
| 2,800 | Campbell Soup Co. | 96,740 | ||||||
| 5,150 | Coca-Cola Enterprises, Inc. | 150,277 | ||||||
| 6,600 | ConAgra Foods, Inc. | 170,346 | ||||||
| 2,900 | Constellation Brands, Inc. Class A* | 60,378 | ||||||
| 2,600 | Dean Foods Co.* | 31,902 | ||||||
| 3,600 | Dr. Pepper Snapple Group, Inc. | 150,948 | ||||||
| 10,224 | General Mills, Inc. | 380,537 | ||||||
| 5,068 | H.J. Heinz Co. | 270,023 | ||||||
| 2,100 | Hormel Foods Corp. | 62,601 | ||||||
| 4,000 | Kellogg Co. | 221,280 | ||||||
| 27,757 | Kraft Foods, Inc. Class A | 977,879 | ||||||
| 2,316 | Lorillard, Inc. | 252,143 | ||||||
| 2,200 | McCormick & Co., Inc. | 109,054 | ||||||
| 3,202 | Mead Johnson Nutrition Co. Class A | 216,295 | ||||||
| 2,600 | Molson Coors Brewing Co. Class B | 116,324 | ||||||
| 24,962 | PepsiCo, Inc. | 1,758,074 | ||||||
| 28,175 | Philip Morris International, Inc. | 1,881,245 | ||||||
| 5,490 | Reynolds American, Inc. | 203,404 | ||||||
| 9,100 | Sara Lee Corp. | 172,809 | ||||||
GOLDMAN SACHS VARIABLE INSURANCE TRUST EQUITY INDEX FUND
Schedule of Investments (continued)
June 30, 2011 (Unaudited)
| Shares | Description | Value | ||||||
Common Stocks – (continued) | ||||||||
Food, Beverage & Tobacco – (continued) | ||||||||
| 36,206 | The Coca-Cola Co. | $ | 2,436,302 | |||||
| 2,400 | The Hershey Co. | 136,440 | ||||||
| 1,934 | The J.M. Smucker Co. | 147,835 | ||||||
| 4,500 | Tyson Foods, Inc. Class A | 87,390 | ||||||
| 11,399,488 | ||||||||
Health Care Equipment & Services – 4.2% | ||||||||
| 6,089 | Aetna, Inc. | 268,464 | ||||||
| 4,360 | AmerisourceBergen Corp. | 180,504 | ||||||
| 9,110 | Baxter International, Inc. | 543,776 | ||||||
| 3,523 | Becton, Dickinson and Co. | 303,577 | ||||||
| 23,706 | Boston Scientific Corp.* | 163,808 | ||||||
| 1,367 | C. R. Bard, Inc. | 150,179 | ||||||
| 5,532 | Cardinal Health, Inc. | 251,263 | ||||||
| 3,416 | CareFusion Corp.* | 92,813 | ||||||
| 2,200 | Cerner Corp.* | 134,442 | ||||||
| 4,219 | CIGNA Corp. | 216,983 | ||||||
| 2,300 | Coventry Health Care, Inc.* | 83,881 | ||||||
| 7,800 | Covidien PLC | 415,194 | ||||||
| 1,500 | DaVita, Inc.* | 129,915 | ||||||
| 2,200 | DENTSPLY International, Inc. | 83,776 | ||||||
| 1,800 | Edwards Lifesciences Corp.* | 156,924 | ||||||
| 8,474 | Express Scripts, Inc.* | 457,427 | ||||||
| 2,700 | Humana, Inc. | 217,458 | ||||||
| 617 | Intuitive Surgical, Inc.* | 229,592 | ||||||
| 1,600 | Laboratory Corp. of America Holdings* | 154,864 | ||||||
| 3,964 | McKesson Corp. | 331,589 | ||||||
| 6,437 | Medco Health Solutions, Inc.* | 363,819 | ||||||
| 16,882 | Medtronic, Inc. | 650,463 | ||||||
| 1,381 | Patterson Companies, Inc. | 45,421 | ||||||
| 2,400 | Quest Diagnostics, Inc. | 141,840 | ||||||
| 5,080 | St. Jude Medical, Inc. | 242,214 | ||||||
| 5,400 | Stryker Corp. | 316,926 | ||||||
| 8,150 | Tenet Healthcare Corp.* | 50,856 | ||||||
| 17,070 | UnitedHealth Group, Inc. | 880,471 | ||||||
| 1,900 | Varian Medical Systems, Inc.* | 133,038 | ||||||
| 5,817 | WellPoint, Inc. | 458,205 | ||||||
| 3,017 | Zimmer Holdings, Inc.* | 190,674 | ||||||
| 8,040,356 | ||||||||
Household & Personal Products – 2.3% | ||||||||
| 6,700 | Avon Products, Inc. | 187,600 | ||||||
| 7,748 | Colgate-Palmolive Co. | 677,253 | ||||||
| 6,340 | Kimberly-Clark Corp. | 421,990 | ||||||
| 2,100 | The Clorox Co. | 141,624 | ||||||
| 1,800 | The Estee Lauder Companies, Inc. Class A | 189,342 | ||||||
| 44,187 | The Procter & Gamble Co. | 2,808,968 | ||||||
| 4,426,777 | ||||||||
Insurance – 3.8% | ||||||||
| 5,400 | ACE Ltd. | 355,428 | ||||||
| 7,392 | Aflac, Inc. | 345,059 | ||||||
| 7,041 | American International Group, Inc.* | 206,442 | ||||||
| 5,250 | Aon Corp. | 269,325 | ||||||
| 1,700 | Assurant, Inc. | 61,659 | ||||||
| 27,515 | Berkshire Hathaway, Inc. Class B* | 2,129,386 | ||||||
| 2,668 | Cincinnati Financial Corp. | 77,852 | ||||||
| 7,900 | Genworth Financial, Inc. Class A* | 81,212 | ||||||
| 7,173 | Hartford Financial Services Group, Inc. | 189,152 | ||||||
| 5,158 | Lincoln National Corp. | 146,951 | ||||||
| 5,047 | Loews Corp. | 212,428 | ||||||
| 8,688 | Marsh & McLennan Companies, Inc. | 270,979 | ||||||
| 16,781 | MetLife, Inc. | 736,183 | ||||||
| 5,232 | Principal Financial Group, Inc. | 159,157 | ||||||
| 7,633 | Prudential Financial, Inc. | 485,382 | ||||||
| 8,438 | The Allstate Corp. | 257,612 | ||||||
| 4,749 | The Chubb Corp. | 297,335 | ||||||
| 10,682 | The Progressive Corp. | 228,381 | ||||||
| 6,584 | The Travelers Companies, Inc. | 384,374 | ||||||
| 1,141 | Torchmark Corp. | 73,184 | ||||||
| 4,918 | Unum Group | 125,311 | ||||||
| 4,900 | XL Group PLC | 107,702 | ||||||
| 7,200,494 | ||||||||
Materials – 3.6% | ||||||||
| 3,400 | Air Products & Chemicals, Inc. | 324,972 | ||||||
| 1,100 | Airgas, Inc. | 77,044 | ||||||
| 1,900 | AK Steel Holding Corp. | 29,944 | ||||||
| 16,868 | Alcoa, Inc. | 267,527 | ||||||
| 1,651 | Allegheny Technologies, Inc. | 104,789 | ||||||
| 2,600 | Ball Corp. | 99,996 | ||||||
| 1,600 | Bemis Co., Inc. | 54,048 | ||||||
| 1,090 | CF Industries Holdings, Inc. | 154,420 | ||||||
| 2,094 | Cliffs Natural Resources, Inc. | 193,590 | ||||||
| 14,738 | E.I. du Pont de Nemours & Co. | 796,589 | ||||||
| 1,100 | Eastman Chemical Co. | 112,277 | ||||||
| 3,612 | Ecolab, Inc. | 203,645 | ||||||
| 1,100 | FMC Corp. | 94,622 | ||||||
| 15,036 | Freeport-McMoRan Copper & Gold, Inc. | 795,405 | ||||||
| 1,300 | International Flavors & Fragrances, Inc. | 83,512 | ||||||
| 6,859 | International Paper Co. | 204,535 | ||||||
| 2,798 | MeadWestvaco Corp. | 93,201 | ||||||
| 8,554 | Monsanto Co. | 620,507 | ||||||
| 7,887 | Newmont Mining Corp. | 425,661 | ||||||
| 5,000 | Nucor Corp. | 206,100 | ||||||
| 2,500 | Owens-Illinois, Inc.* | 64,525 | ||||||
| 2,600 | PPG Industries, Inc. | 236,054 | ||||||
| 4,800 | Praxair, Inc. | 520,272 | ||||||
| 2,616 | Sealed Air Corp. | 62,235 | ||||||
| 2,000 | Sigma-Aldrich Corp. | 146,760 | ||||||
| 18,513 | The Dow Chemical Co. | 666,468 | ||||||
| 1,400 | The Sherwin-Williams Co. | 117,418 | ||||||
| 1,500 | Titanium Metals Corp. | 27,480 | ||||||
| 2,220 | United States Steel Corp. | 102,209 | ||||||
| 2,100 | Vulcan Materials Co. | 80,913 | ||||||
| 6,966,718 | ||||||||
Media – 3.3% | ||||||||
| 3,700 | Cablevision Systems Corp. Class A | 133,977 | ||||||
| 10,764 | CBS Corp. Class B | 306,666 | ||||||
| 43,698 | Comcast Corp. Class A | 1,107,307 | ||||||
| 12,139 | DIRECTV Class A* | 616,904 | ||||||
GOLDMAN SACHS VARIABLE INSURANCE TRUST EQUITY INDEX FUND
| Shares | Description | Value | ||||||
Common Stocks – (continued) | ||||||||
Media – (continued) | ||||||||
| 4,500 | Discovery Communications, Inc. Class A* | $ | 184,320 | |||||
| 3,871 | Gannett Co., Inc. | 55,433 | ||||||
| 36,086 | News Corp. Class A | 638,722 | ||||||
| 4,448 | Omnicom Group, Inc. | 214,216 | ||||||
| 1,500 | Scripps Networks Interactive, Inc. Class A | 73,320 | ||||||
| 8,071 | The Interpublic Group of Companies, Inc. | 100,888 | ||||||
| 4,808 | The McGraw-Hill Companies, Inc. | 201,503 | ||||||
| 29,829 | The Walt Disney Co. | 1,164,524 | ||||||
| 83 | The Washington Post Co. Class B | 34,773 | ||||||
| 5,396 | Time Warner Cable, Inc. | 421,104 | ||||||
| 16,871 | Time Warner, Inc. | 613,598 | ||||||
| 9,144 | Viacom, Inc. Class B | 466,344 | ||||||
| 6,333,599 | ||||||||
Pharmaceuticals, Biotechnology & Life Sciences – 7.4% | ||||||||
| 24,598 | Abbott Laboratories | 1,294,347 | ||||||
| 5,496 | Agilent Technologies, Inc.* | 280,900 | ||||||
| 4,900 | Allergan, Inc. | 407,925 | ||||||
| 14,768 | Amgen, Inc.* | 861,713 | ||||||
| 3,815 | Biogen Idec, Inc.* | 407,900 | ||||||
| 27,026 | Bristol-Myers Squibb Co. | 782,673 | ||||||
| 7,300 | Celgene Corp.* | 440,336 | ||||||
| 1,200 | Cephalon, Inc.* | 95,880 | ||||||
| 16,142 | Eli Lilly & Co. | 605,809 | ||||||
| 4,500 | Forest Laboratories, Inc.* | 177,030 | ||||||
| 12,600 | Gilead Sciences, Inc.* | 521,766 | ||||||
| 2,590 | Hospira, Inc.* | 146,749 | ||||||
| 43,428 | Johnson & Johnson | 2,888,831 | ||||||
| 2,870 | Life Technologies Corp.* | 149,441 | ||||||
| 49,069 | Merck & Co., Inc. | 1,731,645 | ||||||
| 6,900 | Mylan, Inc.* | 170,223 | ||||||
| 1,900 | PerkinElmer, Inc. | 51,129 | ||||||
| 125,473 | Pfizer, Inc. | 2,584,744 | ||||||
| 5,968 | Thermo Fisher Scientific, Inc.* | 384,279 | ||||||
| 1,500 | Waters Corp.* | 143,610 | ||||||
| 1,800 | Watson Pharmaceuticals, Inc.* | 123,714 | ||||||
| 14,250,644 | ||||||||
Real Estate – 1.7% | ||||||||
| 1,780 | Apartment Investment & Management Co. Class A (REIT) | 45,443 | ||||||
| 1,391 | AvalonBay Communities, Inc. (REIT) | 178,604 | ||||||
| 2,227 | Boston Properties, Inc. (REIT) | 236,418 | ||||||
| 4,500 | CB Richard Ellis Group, Inc. Class A* | 112,995 | ||||||
| 4,500 | Equity Residential (REIT) | 270,000 | ||||||
| 6,100 | HCP, Inc. (REIT) | 223,809 | ||||||
| 2,700 | Health Care REIT, Inc. (REIT) | 141,561 | ||||||
| 11,052 | Host Hotels & Resorts, Inc. (REIT) | 187,331 | ||||||
| 6,300 | Kimco Realty Corp. (REIT) | 117,432 | ||||||
| 2,500 | Plum Creek Timber Co., Inc. (REIT) | 101,350 | ||||||
| 6,799 | ProLogis, Inc. (REIT) | 243,676 | ||||||
| 2,251 | Public Storage (REIT) | 256,637 | ||||||
| 4,707 | Simon Property Group, Inc. (REIT) | 547,095 | ||||||
| 2,600 | Ventas, Inc. (REIT) | 137,046 | ||||||
| 2,622 | Vornado Realty Trust (REIT) | 244,318 | ||||||
| 8,409 | Weyerhaeuser Co. (REIT) | 183,821 | ||||||
| 3,227,536 | ||||||||
Retailing – 3.6% | ||||||||
| 1,377 | Abercrombie & Fitch Co. Class A | 92,149 | ||||||
| 5,638 | Amazon.com, Inc.* | 1,152,915 | ||||||
| 1,072 | AutoNation, Inc.* | 39,246 | ||||||
| 379 | AutoZone, Inc.* | 111,748 | ||||||
| 3,924 | Bed Bath & Beyond, Inc.* | 229,044 | ||||||
| 5,150 | Best Buy Co., Inc. | 161,762 | ||||||
| 1,300 | Big Lots, Inc.* | 43,095 | ||||||
| 3,500 | CarMax, Inc.* | 115,745 | ||||||
| 3,000 | Expedia, Inc. | 86,970 | ||||||
| 1,900 | Family Dollar Stores, Inc. | 99,864 | ||||||
| 2,300 | GameStop Corp. Class A* | 61,341 | ||||||
| 2,540 | Genuine Parts Co. | 138,176 | ||||||
| 25,164 | Home Depot, Inc. | 911,440 | ||||||
| 3,300 | J.C. Penney Co., Inc. | 113,982 | ||||||
| 4,619 | Kohl’s Corp. | 230,996 | ||||||
| 3,900 | Limited Brands, Inc. | 149,955 | ||||||
| 20,536 | Lowe’s Companies, Inc. | 478,694 | ||||||
| 6,734 | Macy’s, Inc. | 196,902 | ||||||
| 700 | Netflix, Inc.* | 183,883 | ||||||
| 2,724 | Nordstrom, Inc. | 127,865 | ||||||
| 2,300 | O’Reilly Automotive, Inc.* | 150,673 | ||||||
| 787 | Priceline.com, Inc.* | 402,889 | ||||||
| 1,878 | Ross Stores, Inc. | 150,465 | ||||||
| 700 | Sears Holdings Corp.* | 50,008 | ||||||
| 11,497 | Staples, Inc. | 181,653 | ||||||
| 10,839 | Target Corp. | 508,457 | ||||||
| 5,950 | The Gap, Inc. | 107,695 | ||||||
| 2,000 | Tiffany & Co. | 157,040 | ||||||
| 6,193 | TJX Companies, Inc. | 325,318 | ||||||
| 2,100 | Urban Outfitters, Inc.* | 59,115 | ||||||
| 6,819,085 | ||||||||
Semiconductors & Semiconductor Equipment – 2.4% | ||||||||
| 9,100 | Advanced Micro Devices, Inc.* | 63,609 | ||||||
| 4,974 | Altera Corp. | 230,545 | ||||||
| 4,700 | Analog Devices, Inc. | 183,958 | ||||||
| 21,122 | Applied Materials, Inc. | 274,797 | ||||||
| 7,450 | Broadcom Corp. Class A* | 250,618 | ||||||
| 880 | First Solar, Inc.* | 116,397 | ||||||
| 84,080 | Intel Corp. | 1,863,213 | ||||||
| 2,525 | KLA-Tencor Corp. | 102,212 | ||||||
| 3,500 | Linear Technology Corp. | 115,570 | ||||||
| 10,200 | LSI Corp.* | 72,624 | ||||||
| 3,700 | MEMC Electronic Materials, Inc.* | 31,561 | ||||||
| 3,100 | Microchip Technology, Inc. | 117,521 | ||||||
| 13,543 | Micron Technology, Inc.* | 101,302 | ||||||
| 3,800 | National Semiconductor Corp. | 93,518 | ||||||
| 1,465 | Novellus Systems, Inc.* | 52,945 | ||||||
| 9,050 | NVIDIA Corp.* | 144,212 | ||||||
| 2,800 | Teradyne, Inc.* | 41,440 | ||||||
GOLDMAN SACHS VARIABLE INSURANCE TRUST EQUITY INDEX FUND
Schedule of Investments (continued)
June 30, 2011 (Unaudited)
| Shares | Description | Value | ||||||
Common Stocks – (continued) | ||||||||
Semiconductors & Semiconductor Equipment – (continued) | ||||||||
| 18,628 | Texas Instruments, Inc. | $ | 611,557 | |||||
| 4,100 | Xilinx, Inc. | 149,527 | ||||||
| 4,617,126 | ||||||||
Software & Services – 8.5% | ||||||||
| 8,115 | Adobe Systems, Inc.* | 255,217 | ||||||
| 3,000 | Akamai Technologies, Inc.* | 94,410 | ||||||
| 3,600 | Autodesk, Inc.* | 138,960 | ||||||
| 7,900 | Automatic Data Processing, Inc. | 416,172 | ||||||
| 2,900 | BMC Software, Inc.* | 158,630 | ||||||
| 6,204 | CA, Inc. | 141,699 | ||||||
| 3,000 | Citrix Systems, Inc.* | 240,000 | ||||||
| 4,835 | Cognizant Technology Solutions Corp. Class A* | 354,599 | ||||||
| 2,500 | Computer Sciences Corp. | 94,900 | ||||||
| 3,500 | Compuware Corp.* | 34,160 | ||||||
| 18,144 | eBay, Inc.* | 585,507 | ||||||
| 5,200 | Electronic Arts, Inc.* | 122,720 | ||||||
| 4,300 | Fidelity National Information Services, Inc. | 132,397 | ||||||
| 2,250 | Fiserv, Inc.* | 140,917 | ||||||
| 3,944 | Google, Inc. Class A* | 1,997,163 | ||||||
| 19,179 | International Business Machines Corp. | 3,290,157 | ||||||
| 4,400 | Intuit, Inc.* | 228,184 | ||||||
| 1,447 | Mastercard, Inc. Class A | 436,039 | ||||||
| 117,500 | Microsoft Corp. | 3,055,000 | ||||||
| 2,100 | Monster Worldwide, Inc.* | 30,786 | ||||||
| 61,937 | Oracle Corp. | 2,038,347 | ||||||
| 5,009 | Paychex, Inc. | 153,876 | ||||||
| 3,155 | Red Hat, Inc.* | 144,814 | ||||||
| 4,933 | SAIC, Inc.* | 82,973 | ||||||
| 1,900 | Salesforce.com, Inc.* | 283,062 | ||||||
| 12,312 | Symantec Corp.* | 242,793 | ||||||
| 2,600 | Teradata Corp.* | 156,520 | ||||||
| 10,219 | The Western Union Co. | 204,687 | ||||||
| 2,800 | Total System Services, Inc. | 52,024 | ||||||
| 2,602 | VeriSign, Inc. | 87,063 | ||||||
| 7,680 | Visa, Inc. Class A | 647,117 | ||||||
| 20,900 | Yahoo!, Inc.* | 314,336 | ||||||
| 16,355,229 | ||||||||
Technology Hardware & Equipment – 6.7% | ||||||||
| 2,700 | Amphenol Corp. Class A | 145,773 | ||||||
| 14,672 | Apple, Inc.* | 4,924,950 | ||||||
| 86,881 | Cisco Systems, Inc. | 1,356,212 | ||||||
| 25,125 | Corning, Inc. | 456,019 | ||||||
| 25,800 | Dell, Inc.* | 430,086 | ||||||
| 32,872 | EMC Corp.* | 905,624 | ||||||
| 1,300 | F5 Networks, Inc.* | 143,325 | ||||||
| 2,400 | FLIR Systems, Inc. | 80,904 | ||||||
| 2,100 | Harris Corp. | 94,626 | ||||||
| 32,833 | Hewlett-Packard Co. | 1,195,121 | ||||||
| 3,083 | Jabil Circuit, Inc. | 62,277 | ||||||
| 3,425 | JDS Uniphase Corp.* | 57,061 | ||||||
| 8,400 | Juniper Networks, Inc.* | 264,600 | ||||||
| 1,200 | Lexmark International, Inc. Class A* | 35,112 | ||||||
| 2,025 | Molex, Inc. | 52,184 | ||||||
| 4,860 | Motorola Mobility Holdings, Inc.* | 107,114 | ||||||
| 5,354 | Motorola Solutions, Inc.* | 246,498 | ||||||
| 5,811 | NetApp, Inc.* | 306,705 | ||||||
| 26,185 | QUALCOMM, Inc. | 1,487,046 | ||||||
| 3,700 | SanDisk Corp.* | 153,550 | ||||||
| 6,600 | Tellabs, Inc. | 30,426 | ||||||
| 3,800 | Western Digital Corp.* | 138,244 | ||||||
| 21,976 | Xerox Corp. | 228,770 | ||||||
| 12,902,227 | ||||||||
Telecommunication Services – 3.1% | ||||||||
| 6,240 | American Tower Corp. Class A* | 326,539 | ||||||
| 93,674 | AT&T, Inc. | 2,942,300 | ||||||
| 9,529 | CenturyLink, Inc. | 385,257 | ||||||
| 16,108 | Frontier Communications Corp. | 129,992 | ||||||
| 4,000 | MetroPCS Communications, Inc.* | 68,840 | ||||||
| 47,110 | Sprint Nextel Corp.* | 253,923 | ||||||
| 45,043 | Verizon Communications, Inc. | 1,676,951 | ||||||
| 7,681 | Windstream Corp. | 99,546 | ||||||
| 5,883,348 | ||||||||
Transportation – 2.0% | ||||||||
| 2,630 | C.H. Robinson Worldwide, Inc. | 207,349 | ||||||
| 17,586 | CSX Corp. | 461,105 | ||||||
| 3,400 | Expeditors International of Washington, Inc. | 174,046 | ||||||
| 5,000 | FedEx Corp. | 474,250 | ||||||
| 5,635 | Norfolk Southern Corp. | 422,230 | ||||||
| 800 | Ryder System, Inc. | 45,480 | ||||||
| 12,118 | Southwest Airlines Co. | 138,388 | ||||||
| 7,820 | Union Pacific Corp. | 816,408 | ||||||
| 15,692 | United Parcel Service, Inc. Class B | 1,144,418 | ||||||
| 3,883,674 | ||||||||
Utilities – 3.4% | ||||||||
| 3,977 | Ameren Corp. | 114,697 | ||||||
| 7,691 | American Electric Power Co., Inc. | 289,797 | ||||||
| 6,598 | CenterPoint Energy, Inc. | 127,671 | ||||||
| 4,200 | CMS Energy Corp. | 82,698 | ||||||
| 4,600 | Consolidated Edison, Inc. | 244,904 | ||||||
| 3,277 | Constellation Energy Group, Inc. | 124,395 | ||||||
| 9,147 | Dominion Resources, Inc. | 441,526 | ||||||
| 2,600 | DTE Energy Co. | 130,052 | ||||||
| 21,293 | Duke Energy Corp. | 400,947 | ||||||
| 5,269 | Edison International | 204,174 | ||||||
| 2,875 | Entergy Corp. | 196,305 | ||||||
| 10,481 | Exelon Corp. | 449,006 | ||||||
| 6,578 | FirstEnergy Corp. | 290,419 | ||||||
| 1,131 | Integrys Energy Group, Inc. | 58,631 | ||||||
| 6,646 | NextEra Energy, Inc. | 381,879 | ||||||
| 700 | Nicor, Inc. | 38,318 | ||||||
| 4,500 | NiSource, Inc. | 91,125 | ||||||
| 2,790 | Northeast Utilities | 98,124 | ||||||
| 4,000 | NRG Energy, Inc.* | 98,320 | ||||||
| 1,700 | Oneok, Inc. | 125,817 | ||||||
| 3,600 | Pepco Holdings, Inc. | 70,668 | ||||||
| 6,331 | PG&E Corp. | 266,092 | ||||||
GOLDMAN SACHS VARIABLE INSURANCE TRUST EQUITY INDEX FUND
| Shares | Description | Value | ||||||
Common Stocks – (continued) | ||||||||
Utilities – (continued) | ||||||||
| 1,800 | Pinnacle West Capital Corp. | $ | 80,244 | |||||
| 9,051 | PPL Corp. | 251,889 | ||||||
| 4,677 | Progress Energy, Inc. | 224,543 | ||||||
| 7,942 | Public Service Enterprise Group, Inc. | 259,227 | ||||||
| 1,831 | SCANA Corp. | 72,086 | ||||||
| 3,713 | Sempra Energy | 196,343 | ||||||
| 13,541 | Southern Co. | 546,786 | ||||||
| 3,600 | TECO Energy, Inc. | 68,004 | ||||||
| 10,764 | The AES Corp.* | 137,133 | ||||||
| 3,800 | Wisconsin Energy Corp. | 119,130 | ||||||
| 7,210 | Xcel Energy, Inc. | 175,203 | ||||||
| 6,456,153 | ||||||||
TOTAL COMMON STOCKS | ||||||||
(Cost $155,428,634) | $ | 190,439,215 | ||||||
| Principal | Interest | Maturity | ||||||||||||
| Amount | Rate | Date | Value | |||||||||||
U.S. Treasury Obligation(b)(c) – 0.1% | ||||||||||||||
| United States Treasury Bills | ||||||||||||||
| $ | 45,000 | 0.000 | % | 07/07/11 | $ | 45,000 | ||||||||
| 95,000 | 0.000 | 08/25/11 | 94,997 | |||||||||||
TOTAL U.S. TREASURY OBLIGATIONS | ||||||||||||||
(Cost $139,996) | $ | 139,997 | ||||||||||||
| Shares | Rate | Value | ||||||||
Short-term Investment(d) – 0.1% | ||||||||||
| JPMorgan U.S. Government Money Market Fund — Capital Shares | ||||||||||
| 249,711 | 0.010 | % | $ | 249,711 | ||||||
(Cost $249,711) | ||||||||||
TOTAL INVESTMENTS – 99.6% | ||||||||||
(Cost $155,818,341) | $ | 190,828,923 | ||||||||
OTHER ASSETS IN EXCESS OF LIABILITIES – 0.4% | 726,283 | |||||||||
NET ASSETS – 100.0% | $ | 191,555,206 | ||||||||
The percentage shown for each investment category reflects the value of investments in that category as a percentage of net assets.
| * | Non-income producing security. | |
| (a) | Represents an affiliated issuer. | |
| (b) | Issued with zero coupon. Income is recognized through the accretion of discount. | |
| (c) | All or a portion of security is segregated as collateral for initial margin requirements on futures transactions. | |
| (d) | Variable rate security. Interest rate disclosed is that which is in effect at June 30, 2011. |
Investment Abbreviation: | ||||
| REIT | — | Real Estate Investment Trust | ||
| ADDITIONAL INVESTMENT INFORMATION |
FUTURES CONTRACTS — At June 30, 2011, the following futures contracts were open:
| Number of | ||||||||||||||
| Contracts | Expiration | Current | Unrealized | |||||||||||
| Type | Long (Short) | Date | Value | Gain (Loss) | ||||||||||
S&P 500 E-mini Index | 20 | September 2011 | $ | 1,315,500 | $ | 48,015 | ||||||||
GOLDMAN SACHS VARIABLE INSURANCE TRUST GOVERNMENT INCOME FUND
Schedule of Investments
June 30, 2011 (Unaudited)
| Principal | Interest | Maturity | ||||||||||||
| Amount | Rate | Date | Value | |||||||||||
Mortgage-Backed Obligations – 55.0% | ||||||||||||||
Adjustable Rate Non-Agency(a) – 1.2% | ||||||||||||||
First Horizon Alternative Mortgage Securities Series 2005-AA7, Class 2A1 | ||||||||||||||
| $ | 426,294 | 2.367 | % | 09/25/35 | $ | 265,067 | ||||||||
Harborview Mortgage Loan Trust Series 2006-6, Class 3A1A | ||||||||||||||
| 384,524 | 2.822 | 08/19/36 | 240,172 | |||||||||||
J.P. Morgan Mortgage Trust Series 2007-A1, Class 2A2 | ||||||||||||||
| 356,201 | 3.078 | 07/25/35 | 314,945 | |||||||||||
| 820,184 | ||||||||||||||
Collateralized Mortgage Obligations – 7.4% | ||||||||||||||
Agency Multi-Family – 3.1% | ||||||||||||||
| FNMA | ||||||||||||||
| $ | 199,063 | 2.800 | % | 03/01/18 | $ | 196,302 | ||||||||
| 499,499 | 3.740 | 05/01/18 | 517,782 | |||||||||||
| 110,000 | 3.840 | 05/01/18 | 113,539 | |||||||||||
| 400,000 | 4.506 | 06/01/19 | 422,859 | |||||||||||
| 99,633 | 3.416 | 10/01/20 | 97,766 | |||||||||||
| 199,246 | 3.375 | 11/01/20 | 194,806 | |||||||||||
| 99,645 | 3.632 | 12/01/20 | 98,985 | |||||||||||
| 397,980 | 3.763 | 12/01/20 | 399,303 | |||||||||||
| GNMA | ||||||||||||||
| 96,970 | 3.950 | 07/15/25 | 100,131 | |||||||||||
| 2,141,473 | ||||||||||||||
Interest Only(a)(b)(c) – 0.0% | ||||||||||||||
FNMA REMIC Series 2004-47, Class EI | ||||||||||||||
| 203,460 | 0.000 | 06/25/34 | 3,322 | |||||||||||
FNMA REMIC Series 2004-62, Class DI | ||||||||||||||
| 85,674 | 0.000 | 07/25/33 | 1,021 | |||||||||||
| 4,343 | ||||||||||||||
Regular Floater(a) – 2.7% | ||||||||||||||
National Credit Union Administration Guaranteed Notes Series 2011-R3, Class 1A | ||||||||||||||
| 283,236 | 0.590 | 03/11/20 | 283,701 | |||||||||||
National Credit Union Administration Guaranteed Notes Series 2011-R4, Class 1A | ||||||||||||||
| 373,118 | 0.570 | 03/06/20 | 373,380 | |||||||||||
National Credit Union Administration Guaranteed Notes Series 2011-R5, Class 1A | ||||||||||||||
| 381,216 | 0.570 | 04/06/20 | 381,499 | |||||||||||
National Credit Union Administration Guaranteed Notes Series 2011-R6, Class 1A | ||||||||||||||
| 378,440 | 0.570 | 05/07/20 | 378,735 | |||||||||||
| National Credit Union Administration Guaranteed Notes Series A1 | ||||||||||||||
| 400,000 | 0.206 | 06/12/13 | 400,000 | |||||||||||
| 1,817,315 | ||||||||||||||
Sequential Fixed Rate – 1.6% | ||||||||||||||
Banc of America Funding Corp. Series 2007-8, Class 2A1 | ||||||||||||||
| 550,538 | 7.000 | 10/25/37 | 395,752 | |||||||||||
| National Credit Union Administration Guaranteed Notes | ||||||||||||||
| 400,000 | 3.000 | 06/12/19 | 395,400 | |||||||||||
National Credit Union Administration Guaranteed Notes Series 2010-C1, Class APT | ||||||||||||||
| 294,706 | 2.650 | 10/29/20 | 293,453 | |||||||||||
| 1,084,605 | ||||||||||||||
TOTAL COLLATERALIZED MORTGAGE OBLIGATIONS | $ | 5,047,736 | ||||||||||||
Federal Agencies – 46.4% | ||||||||||||||
Adjustable Rate FHLMC(a) – 0.9% | ||||||||||||||
| $ | 421,670 | 2.591 | % | 09/01/35 | $ | 443,779 | ||||||||
| 194,554 | 4.775 | 10/01/35 | 207,443 | |||||||||||
| 651,222 | ||||||||||||||
Adjustable Rate FNMA(a) – 1.4% | ||||||||||||||
| 196,691 | 2.077 | 05/01/33 | 204,784 | |||||||||||
| 424,182 | 2.457 | 05/01/35 | 444,312 | |||||||||||
| 281,060 | 2.555 | 12/01/35 | 293,902 | |||||||||||
| 942,998 | ||||||||||||||
FHLMC – 1.7% | ||||||||||||||
| 3,013 | 10.000 | 03/01/21 | 3,355 | |||||||||||
| 4,568 | 6.500 | 06/01/23 | 5,136 | |||||||||||
| 790,456 | 5.500 | 01/01/40 | 854,078 | |||||||||||
| 297,046 | 4.000 | 12/01/40 | 297,268 | |||||||||||
| 1,159,837 | ||||||||||||||
FNMA – 34.5% | ||||||||||||||
| 1,150 | 5.000 | 02/01/14 | 1,204 | |||||||||||
| 62,506 | 5.000 | 03/01/18 | 67,064 | |||||||||||
| 27,488 | 5.000 | 06/01/18 | 29,493 | |||||||||||
| 589,913 | 5.500 | 03/01/19 | 639,722 | |||||||||||
| 10,971 | 8.000 | 09/01/21 | 12,816 | |||||||||||
| 13,058 | 5.000 | 04/01/23 | 14,011 | |||||||||||
| 49,544 | 5.000 | 06/01/23 | 53,160 | |||||||||||
| 701,670 | 5.500 | 05/01/25 | 762,892 | |||||||||||
| 74 | 6.000 | 03/01/32 | 82 | |||||||||||
| 2,622 | 6.000 | 05/01/33 | 2,898 | |||||||||||
| 21,667 | 5.000 | 08/01/33 | 23,134 | |||||||||||
| 1,504 | 6.000 | 12/01/33 | 1,670 | |||||||||||
| 1,071 | 6.000 | 12/01/34 | 1,185 | |||||||||||
| 37,106 | 5.000 | 04/01/35 | 39,579 | |||||||||||
| 2,208 | 6.000 | 04/01/35 | 2,432 | |||||||||||
| 4,600 | 6.000 | 02/01/36 | 5,073 | |||||||||||
| 16,473 | 6.500 | 03/01/36 | 18,653 | |||||||||||
| 90,541 | 4.500 | 09/01/39 | 94,424 | |||||||||||
| 89,007 | 4.500 | 10/01/39 | 92,824 | |||||||||||
| 264,847 | 4.500 | 12/01/39 | 276,207 | |||||||||||
| 996,115 | 3.500 | 01/01/41 | 954,478 | |||||||||||
| 3,988,020 | 3.500 | 02/01/41 | 3,821,291 | |||||||||||
| 1,000,000 | 3.500 | 03/01/41 | 958,168 | |||||||||||
| 2,000,000 | 3.500 | TBA-15yr | (d) | 2,036,250 | ||||||||||
| 5,000,000 | 4.000 | TBA-30yr | (d) | 5,000,000 | ||||||||||
| 3,000,000 | 5.000 | TBA-30yr | (d) | 3,187,031 | �� | |||||||||
| 5,000,000 | 6.000 | TBA-30yr | (d) | 5,494,531 | ||||||||||
| 23,590,272 | ||||||||||||||
GOLDMAN SACHS VARIABLE INSURANCE TRUST GOVERNMENT INCOME FUND
| Principal | Interest | Maturity | ||||||||||||
| Amount | Rate | Date | Value | |||||||||||
Mortgage-Backed Obligations – (continued) | ||||||||||||||
GNMA – 7.9% | ||||||||||||||
| $ | 52,297 | 3.500 | % | 12/15/40 | $ | 50,872 | ||||||||
| 3,000,000 | 4.500 | TBA-30yr | (d) | 3,159,610 | ||||||||||
| 2,000,000 | 5.000 | TBA-30yr | (d) | 2,166,250 | ||||||||||
| 5,376,732 | ||||||||||||||
TOTAL FEDERAL AGENCIES | $ | 31,721,061 | ||||||||||||
TOTAL MORTGAGE-BACKED OBLIGATIONS | ||||||||||||||
(Cost $37,882,592) | $ | 37,588,981 | ||||||||||||
Agency Debentures – 7.3% | ||||||||||||||
| FFCB | ||||||||||||||
| $ | 500,000 | 5.400 | % | 06/08/17 | $ | 579,716 | ||||||||
| FHLB | ||||||||||||||
| 800,000 | 1.750 | 12/14/12 | 814,739 | |||||||||||
| 300,000 | 5.375 | 05/15/19 | 346,709 | |||||||||||
| 200,000 | 5.625 | 06/11/21 | 233,883 | |||||||||||
| FHLMC | ||||||||||||||
| 1,000,000 | 1.375 | 02/25/14 | 1,013,222 | |||||||||||
| 1,500,000 | 4.500 | 04/02/14 | 1,644,574 | |||||||||||
Tennessee Valley Authority(e) | ||||||||||||||
| 300,000 | 5.375 | 04/01/56 | 322,150 | |||||||||||
TOTAL AGENCY DEBENTURES | ||||||||||||||
(Cost $4,739,400) | $ | 4,954,993 | ||||||||||||
Asset-Backed Securities – 3.2% | ||||||||||||||
Credit Card(a) – 0.7% | ||||||||||||||
Chase Issuance Trust Series 2005-A11, Class A | ||||||||||||||
| $ | 500,000 | 0.257 | % | 12/15/14 | $ | 499,812 | ||||||||
Home Equity – 0.1% | ||||||||||||||
GMAC Mortgage Corp. Loan Trust Series 2007-HE3, Class 1A1 | ||||||||||||||
| 43,486 | 7.000 | 09/25/37 | 31,528 | |||||||||||
GMAC Mortgage Corp. Loan Trust Series 2007-HE3, Class 2A1 | ||||||||||||||
| 55,869 | 7.000 | 09/25/37 | 39,052 | |||||||||||
| 70,580 | ||||||||||||||
Student Loans(a) – 2.4% | ||||||||||||||
Brazos Higher Education Authority Series 2005-3, Class A14 | ||||||||||||||
| 174,053 | 0.357 | 09/25/23 | 172,884 | |||||||||||
Brazos Higher Education Authority Series 2011-1, Class A2 | ||||||||||||||
| 400,000 | 1.057 | 02/25/30 | 394,817 | |||||||||||
Brazos Higher Education Authority Series 2011-2, Class A2 | ||||||||||||||
| 400,000 | 1.097 | 07/25/29 | 395,998 | |||||||||||
Knowledgeworks Foundation Series 2010-1, Class A | ||||||||||||||
| 282,535 | 1.207 | 02/25/42 | 278,682 | |||||||||||
Nelnet Student Loan Trust Series 2010-3A, Class A(f) | ||||||||||||||
| 364,218 | 1.054 | 07/27/48 | 364,564 | |||||||||||
| 1,606,945 | ||||||||||||||
TOTAL ASSET-BACKED SECURITIES | ||||||||||||||
(Cost $2,117,709) | $ | 2,177,337 | ||||||||||||
Government Guarantee Obligations(g) – 9.2% | ||||||||||||||
| Ally Financial, Inc. | ||||||||||||||
| $ | 1,100,000 | 1.750 | % | 10/30/12 | $ | 1,119,596 | ||||||||
| Citigroup Funding, Inc. | ||||||||||||||
| 1,300,000 | 1.875 | 10/22/12 | 1,325,392 | |||||||||||
| 600,000 | 1.875 | 11/15/12 | 612,063 | |||||||||||
| General Electric Capital Corp. | ||||||||||||||
| 700,000 | 2.125 | 12/21/12 | 717,297 | |||||||||||
| Private Export Funding Corp. | ||||||||||||||
| 2,000,000 | 3.550 | 04/15/13 | 2,103,862 | |||||||||||
| U.S. Central Federal Credit Union | ||||||||||||||
| 400,000 | 1.900 | 10/19/12 | 407,799 | |||||||||||
TOTAL GOVERNMENT GUARANTEE OBLIGATIONS | ||||||||||||||
(Cost $6,179,287) | $ | 6,286,009 | ||||||||||||
U.S. Treasury Obligations – 20.0% | ||||||||||||||
United States Treasury Bill(h) | ||||||||||||||
| $ | 5,200,000 | 0.000 | % | 09/29/11 | $ | 5,199,675 | ||||||||
| United States Treasury Bonds | ||||||||||||||
| 200,000 | 5.000 | 05/15/37 | 222,190 | |||||||||||
| 100,000 | 4.250 | 05/15/39 | 98,134 | |||||||||||
| 100,000 | 4.375 | 11/15/39 | 100,075 | |||||||||||
| 100,000 | 4.375 | 05/15/40 | 99,970 | |||||||||||
| 400,000 | 4.250 | 11/15/40 | 391,044 | |||||||||||
| 500,000 | 4.375 | 05/15/41 | 499,295 | |||||||||||
| United States Treasury Inflation-Protected Securities | ||||||||||||||
| 250,174 | 3.000 | 07/15/12 | 261,237 | |||||||||||
| 223,050 | 2.375 | 01/15/27 | 254,346 | |||||||||||
| United States Treasury Notes | ||||||||||||||
| 1,800,000 | 1.000 | 04/30/12 | 1,811,898 | |||||||||||
| 1,900,000 | 0.750 | 06/15/14 | 1,897,701 | |||||||||||
| 400,000 | 2.875 | 03/31/18 | 412,064 | |||||||||||
| 1,800,000 | 3.625 | 02/15/21 | 1,876,878 | |||||||||||
| 500,000 | 3.125 | 05/15/21 | 498,595 | |||||||||||
TOTAL U.S. TREASURY OBLIGATIONS | ||||||||||||||
(Cost $13,630,349) | $ | 13,623,102 | ||||||||||||
| Shares | Rate | Value | ||||||||
Short-term Investment(a) – 35.9 | ||||||||||
| JPMorgan U.S. Government Money Market Fund — Capital Shares | ||||||||||
| 24,532,792 | 0.010 | % | $ | 24,532,792 | ||||||
(Cost $24,532,792) | ||||||||||
TOTAL INVESTMENTS – 130.6% | ||||||||||
(Cost $89,082,129) | $ | 89,163,214 | ||||||||
LIABILITIES IN EXCESS OF OTHER ASSETS – (30.6)% | (20,869,654 | ) | ||||||||
NET ASSETS – 100.0% | $ | 68,293,560 | ||||||||
GOLDMAN SACHS VARIABLE INSURANCE TRUST GOVERNMENT INCOME FUND
Schedule of Investments (continued)
June 30, 2011 (Unaudited)
The percentage shown for each investment category reflects the value of investments in that category as a percentage of net assets.
| (a) | Variable rate security. Interest rate disclosed is that which is in effect at June 30, 2011. | |
| (b) | Issued with a zero coupon. Interest rate is contingent upon LIBOR reaching a predetermined level. | |
| (c) | Security with notional or nominal principal amount. The actual effective yield of this security is different than the stated interest rate. | |
| (d) | TBA (To Be Announced) Securities are purchased/sold on a forward commitment basis with an approximate principal amount and no defined maturity date. The actual principal and maturity date will be determined upon settlement when the specific mortgage pools are assigned. Total market value of TBA securities (excluding forward sales contracts, if any) amounts to $21,043,672 which represents approximately 30.8% of net assets as of June 30, 2011. | |
| (e) | All or a portion of security is segregated as collateral for initial margin requirements on futures transactions. | |
| (f) | Exempt from registration under Rule 144A of the Securities Act of 1933. Under procedures approved by the Board of Trustees, such securities have been determined to be liquid by the investment adviser and may be resold, normally to qualified institutional buyers in transactions exempt from registration. Total market value of Rule 144A securities amounts to $364,564, which represents approximately 0.5% of net assets as of June 30, 2011. | |
| (g) | Guaranteed under the Federal Deposit Insurance Corporation’s (“FDIC”) Temporary Liquidity Guarantee Program and backed by the full faith and credit of the United States. The expiration date of the FDIC’s guarantee is the earlier of the maturity date of the debt or June 30, 2012. | |
| (h) | Issued with zero coupon. Income is recognized through the accretion of discount. |
Investment Abbreviations: | ||||
| FFCB | — | Federal Farm Credit Bank | ||
| FHLB | — | Federal Home Loan Bank | ||
| FHLMC | — | Federal Home Loan Mortgage Corp. | ||
| FNMA | — | Federal National Mortgage Association | ||
| GNMA | — | Government National Mortgage Association | ||
| LIBOR | — | London Interbank Offered Rate | ||
| REMIC | — | Real Estate Mortgage Investment Conduit | ||
GOLDMAN SACHS VARIABLE INSURANCE TRUST GOVERNMENT INCOME FUND
| ADDITIONAL INVESTMENT INFORMATION |
FORWARD SALES CONTRACTS — At June 30, 2011, the Fund had the following forward sales contracts:
| Interest | Maturity | Settlement | Principal | |||||||||||||||
| Description | Rate | Date(d) | Date | Amount | Value | |||||||||||||
| FNMA | 3.500 | % | TBA-30yr | 07/14/11 | $ | (3,000,000 | ) | $ | (2,869,453 | ) | ||||||||
| FNMA | 3.500 | TBA-30yr | 08/11/11 | (2,000,000 | ) | (1,907,656 | ) | |||||||||||
TOTAL (Proceeds Receivable: $4,827,031) | $ | (4,777,109 | ) | |||||||||||||||
FUTURES CONTRACTS — At June 30, 2011, the following futures contracts were open:
| Number of | ||||||||||||||
| Contracts | Expiration | Current | Unrealized | |||||||||||
| Type | Long (Short) | Date | Value | Gain (Loss) | ||||||||||
| U.S. Treasury Bonds | 3 | September 2011 | $ | 369,094 | $ | (255 | ) | |||||||
| U.S. Ultra Long Treasury Bonds | 12 | September 2011 | 1,515,000 | (19,610 | ) | |||||||||
| 2 Year U.S. Treasury Notes | 19 | September 2011 | 4,167,531 | 7,580 | ||||||||||
| 5 Year U.S. Treasury Notes | 27 | September 2011 | 3,218,274 | (24,854 | ) | |||||||||
| 10 Year U.S. Treasury Notes | 27 | September 2011 | 3,302,859 | (30,568 | ) | |||||||||
TOTAL | $ | (67,707 | ) | |||||||||||
GOLDMAN SACHS VARIABLE INSURANCE TRUST GROWTH OPPORTUNITIES FUND
Schedule of Investments
June 30, 2011 (Unaudited)
| Shares | Description | Value | ||||||
Common Stocks – 97.7% | ||||||||
Banks – 1.0% | ||||||||
| 51,921 | First Republic Bank* | $ | 1,676,010 | |||||
Capital Goods – 8.0% | ||||||||
| 50,615 | DigitalGlobe, Inc.* | 1,286,127 | ||||||
| 85,517 | Kennametal, Inc. | 3,609,673 | ||||||
| 107,682 | Quanta Services, Inc.* | 2,175,176 | ||||||
| 37,383 | Raytheon Co. | 1,863,542 | ||||||
| 13,630 | Rockwell Automation, Inc. | 1,182,539 | ||||||
| 34,039 | Roper Industries, Inc. | 2,835,449 | ||||||
| 12,952,506 | ||||||||
Commercial & Professional Services – 2.2% | ||||||||
| 43,411 | Ritchie Bros Auctioneers, Inc. | 1,193,369 | ||||||
| 68,765 | Verisk Analytics, Inc. Class A* | 2,380,644 | ||||||
| 3,574,013 | ||||||||
Consumer Durables & Apparel – 4.2% | ||||||||
| 156,861 | Newell Rubbermaid, Inc. | 2,475,267 | ||||||
| 53,454 | Phillips-Van Heusen Corp. | 3,499,633 | ||||||
| 6,398 | Polo Ralph Lauren Corp. | 848,439 | ||||||
| 6,823,339 | ||||||||
Consumer Services – 3.8% | ||||||||
| 60,157 | Coinstar, Inc.* | 3,280,963 | ||||||
| 32,560 | Darden Restaurants, Inc. | 1,620,185 | ||||||
| 34,729 | Marriott International, Inc. Class A | 1,232,532 | ||||||
| 6,133,680 | ||||||||
Diversified Financials – 9.6% | ||||||||
| 8,859 | Affiliated Managers Group, Inc.* | 898,746 | ||||||
| 27,177 | IntercontinentalExchange, Inc.* | 3,389,244 | ||||||
| 36,854 | Invesco Ltd. | 862,384 | ||||||
| 60,970 | Lazard Ltd. Class A | 2,261,987 | ||||||
| 59,555 | MSCI, Inc. Class A* | 2,244,032 | ||||||
| 58,539 | Northern Trust Corp. | 2,690,452 | ||||||
| 97,869 | SLM Corp. | 1,645,178 | ||||||
| 82,405 | TD Ameritrade Holding Corp. | 1,607,721 | ||||||
| 15,599,744 | ||||||||
Energy – 11.0% | ||||||||
| 74,937 | Cameron International Corp.* | 3,768,582 | ||||||
| 17,852 | Core Laboratories NV | 1,991,212 | ||||||
| 39,798 | Dril-Quip, Inc.* | 2,699,498 | ||||||
| 65,066 | Petrohawk Energy Corp.* | 1,605,178 | ||||||
| 32,329 | Pioneer Natural Resources Co. | 2,895,709 | ||||||
| 47,842 | Southwestern Energy Co.* | 2,051,465 | ||||||
| 50,031 | Whiting Petroleum Corp.* | 2,847,264 | ||||||
| 17,858,908 | ||||||||
Health Care Equipment & Services – 7.8% | ||||||||
| 20,448 | C. R. Bard, Inc. | 2,246,417 | ||||||
| 90,632 | CareFusion Corp.* | 2,462,472 | ||||||
| 82,510 | Emdeon, Inc. Class A* | 1,082,531 | ||||||
| 36,047 | Henry Schein, Inc.* | 2,580,605 | ||||||
| 4,149 | Intuitive Surgical, Inc.* | 1,543,884 | ||||||
| 58,226 | St. Jude Medical, Inc. | 2,776,216 | ||||||
| 12,692,125 | ||||||||
Household & Personal Products – 1.9% | ||||||||
| 109,234 | Avon Products, Inc. | 3,058,552 | ||||||
Insurance – 1.4% | ||||||||
| 74,578 | Principal Financial Group, Inc. | 2,268,663 | ||||||
Materials – 2.0% | ||||||||
| 28,698 | Ecolab, Inc. | 1,617,993 | ||||||
| 58,420 | Nalco Holding Co. | 1,624,660 | ||||||
| 3,242,653 | ||||||||
Media – 2.0% | ||||||||
| 61,511 | Lamar Advertising Co. Class A* | 1,683,556 | ||||||
| 32,332 | Scripps Networks Interactive, Inc. Class A | 1,580,388 | ||||||
| 3,263,944 | ||||||||
Real Estate – 1.6% | ||||||||
| 102,066 | CB Richard Ellis Group, Inc. Class A* | 2,562,877 | ||||||
Retailing – 9.4% | ||||||||
| 58,977 | Bed Bath & Beyond, Inc.* | 3,442,487 | ||||||
| 46,810 | Dick’s Sporting Goods, Inc.* | 1,799,845 | ||||||
| 57,420 | GameStop Corp. Class A* | 1,531,391 | ||||||
| 79,026 | PetSmart, Inc. | 3,585,410 | ||||||
| 165,482 | Staples, Inc. | 2,614,616 | ||||||
| 79,780 | Urban Outfitters, Inc.* | 2,245,807 | ||||||
| 15,219,556 | ||||||||
Semiconductors & Semiconductor Equipment – 5.6% | ||||||||
| 42,376 | Altera Corp. | 1,964,128 | ||||||
| 43,782 | Linear Technology Corp. | 1,445,682 | ||||||
| 104,857 | NVIDIA Corp.* | 1,670,896 | ||||||
| 110,148 | Xilinx, Inc. | 4,017,097 | ||||||
| 9,097,803 | ||||||||
Software & Services – 15.0% | ||||||||
| 30,240 | Citrix Systems, Inc.* | 2,419,200 | ||||||
| 23,482 | Equinix, Inc.* | 2,372,152 | ||||||
| 22,175 | FleetCor Technologies, Inc.* | 657,267 | ||||||
| 103,847 | Genpact Ltd.* | 1,790,322 | ||||||
| 82,701 | Global Payments, Inc. | 4,217,751 | ||||||
| 20,281 | Rackspace Hosting, Inc.* | 866,810 | ||||||
| 104,678 | RealD, Inc.* | 2,448,419 | ||||||
| 101,053 | Renren, Inc. ADR* | 894,319 | ||||||
| 16,192 | Salesforce.com, Inc.* | 2,412,284 | ||||||
| 71,513 | SuccessFactors, Inc.* | 2,102,482 | ||||||
| 103,565 | The Western Union Co. | 2,074,407 | ||||||
| 45,883 | VeriFone Systems, Inc.* | 2,034,911 | ||||||
| 24,290,324 | ||||||||
Technology Hardware & Equipment – 5.8% | ||||||||
| 58,939 | Amphenol Corp. Class A | 3,182,117 | ||||||
| 35,091 | Dolby Laboratories, Inc. Class A* | 1,489,964 | ||||||
| 65,768 | FLIR Systems, Inc. | 2,217,039 | ||||||
| 47,021 | NetApp, Inc.* | 2,481,768 | ||||||
| 9,370,888 | ||||||||
GOLDMAN SACHS VARIABLE INSURANCE TRUST GROWTH OPPORTUNITIES FUND
| Shares | Description | Value | ||||||
Common Stocks – (continued) | ||||||||
Telecommunication Services – 4.8% | ||||||||
| 45,295 | Crown Castle International Corp.* | $ | 1,847,583 | |||||
| 94,253 | SBA Communications Corp. Class A* | 3,599,522 | ||||||
| 113,947 | tw telecom, inc.* | 2,339,332 | ||||||
| 7,786,437 | ||||||||
Transportation – 0.6% | ||||||||
| 13,297 | C.H. Robinson Worldwide, Inc. | 1,048,335 | ||||||
TOTAL COMMON STOCKS | ||||||||
(Cost $133,499,865) | $ | 158,520,357 | ||||||
| Shares | Rate | Value | ||||||||
Short-term Investment(a) – 2.3% | ||||||||||
| JPMorgan U.S. Government Money Market Fund — Capital Shares | ||||||||||
| 3,790,358 | 0.010 | % | $ | 3,790,358 | ||||||
(Cost $3,790,358) | ||||||||||
TOTAL INVESTMENTS – 100.0% | ||||||||||
(Cost $137,290,223) | $ | 162,310,715 | ||||||||
LIABILITIES IN EXCESS OF OTHER ASSETS – 0.0% | (28,554 | ) | ||||||||
NET ASSETS – 100.0% | $ | 162,282,161 | ||||||||
The percentage shown for each investment category reflects the value of investments in that category as a percentage of net assets.
| * | Non-income producing security. | |
| (a) | Variable rate security. Interest rate disclosed is that which is in effect at June 30, 2011. |
Investment Abbreviation: | ||||
| ADR | — | American Depositary Receipt | ||
GOLDMAN SACHS VARIABLE INSURANCE TRUST FUNDS
Statements of Assets and Liabilities
June 30, 2011 (Unaudited)
| Growth | ||||||||||||||||
| Core Fixed | Equity Index | Government | Opportunities | |||||||||||||
| Income Fund | Fund | Income Fund | Fund | |||||||||||||
Assets: | ||||||||||||||||
| Investments in securities, at value (identified cost $184,987,660, $155,818,341, $89,082,129 and $137,290,223, respectively) | $ | 186,876,603 | $ | 190,828,923 | $ | 89,163,214 | $ | 162,310,715 | ||||||||
| Cash | 1,510 | — | — | — | ||||||||||||
| Foreign currencies, at value (identified cost $5,652 for the Core Fixed Income Fund) | 5,756 | — | — | — | ||||||||||||
| Receivables: | ||||||||||||||||
| Investment securities sold on an extended-delivery basis | 25,608,985 | — | 14,169,687 | — | ||||||||||||
| Investment securities sold | 1,678,531 | 550,299 | 414 | 260,031 | ||||||||||||
| Interest and dividends, at value | 1,032,782 | 242,619 | 157,774 | 61,100 | ||||||||||||
| Fund shares sold | 92,122 | 84,189 | 138,004 | 65,132 | ||||||||||||
| Reimbursement from investment adviser | 41,420 | 26,318 | 35,288 | 32,378 | ||||||||||||
| Forward foreign currency exchange contracts, at value | 36,575 | — | — | — | ||||||||||||
| Due from broker — variation margin, at value | — | 11,200 | — | — | ||||||||||||
| Other assets | 1,369 | 1,263 | 622 | 1,017 | ||||||||||||
Total assets | 215,375,653 | 191,744,811 | 103,665,003 | 162,730,373 | ||||||||||||
Liabilities: | ||||||||||||||||
| Payables: | ||||||||||||||||
| Investment securities purchased on an extended-delivery basis | 46,841,328 | — | 30,426,875 | — | ||||||||||||
| Forward Sale Contracts, at value (proceeds receivable $7,723,516, $0, $4,827,031 and $0, respectively) | 7,646,563 | — | 4,777,109 | — | ||||||||||||
| Investment securities purchased | 1,612,509 | — | — | 112,662 | ||||||||||||
| Forward foreign currency exchange contracts, at value | 142,561 | — | — | — | ||||||||||||
| Fund shares redeemed | 94,733 | 23,559 | 20,206 | 109,688 | ||||||||||||
| Amounts owed to affiliates | 88,787 | 87,901 | 46,854 | 152,293 | ||||||||||||
| Due to broker — variation margin, at value | 51,248 | — | 30,320 | — | ||||||||||||
| Accrued expenses | 83,139 | 78,145 | 70,079 | 73,569 | ||||||||||||
Total liabilities | 56,560,868 | 189,605 | 35,371,443 | 448,212 | ||||||||||||
Net Assets: | ||||||||||||||||
| Paid-in capital | 170,623,940 | 183,686,964 | 67,370,254 | 137,232,495 | ||||||||||||
| Accumulated undistributed (distributions in excess of) net investment income (loss) | (59,420 | ) | 1,723,441 | (3,201 | ) | (374,472 | ) | |||||||||
| Accumulated net realized gain (loss) from investment, futures and foreign currency related transactions | (13,489,192 | ) | (28,913,796 | ) | 863,207 | 403,646 | ||||||||||
| Net unrealized gain on investments, futures and translation of assets and liabilities denominated in foreign currencies | 1,739,457 | 35,058,597 | 63,300 | 25,020,492 | ||||||||||||
NET ASSETS | $ | 158,814,785 | $ | 191,555,206 | $ | 68,293,560 | $ | 162,282,161 | ||||||||
| Total Service Shares of beneficial interest outstanding $0.001 par value (unlimited shares authorized): | 15,704,512 | 19,475,827 | 6,396,484 | 23,175,720 | ||||||||||||
| Net asset value, offering and redemption price per share | $10.11 | $9.84 | $10.68 | $7.00 | ||||||||||||
GOLDMAN SACHS VARIABLE INSURANCE TRUST FUNDS
Statements of Operations
For the Six Months Ended June 30, 2011 (Unaudited)
| Growth | ||||||||||||||||
| Core Fixed | Equity Index | Government | Opportunities | |||||||||||||
| Income Fund | Fund | Income Fund | Fund | |||||||||||||
Investment income: | ||||||||||||||||
| Interest | $ | 2,519,250 | $ | — | $ | 658,179 | $ | — | ||||||||
| Dividends (net of foreign taxes withheld of $2,303 for the Growth Opportunities Fund) | 3,029 | 1,929,175 | 2,621 | 530,159 | ||||||||||||
Total investment income | 2,522,279 | 1,929,175 | 660,800 | 530,159 | ||||||||||||
Expenses: | ||||||||||||||||
| Management fees | 325,394 | 292,314 | 188,395 | 777,850 | ||||||||||||
| Distribution and Service fees | 203,371 | 243,593 | 87,220 | 194,462 | ||||||||||||
| Professional fees | 49,295 | 40,806 | 46,252 | 38,483 | ||||||||||||
| Custody and accounting fees | 37,760 | 25,027 | 29,611 | 26,506 | ||||||||||||
| Printing and mailing costs | 30,845 | 32,245 | 25,358 | 31,060 | ||||||||||||
| Transfer Agent fees | 16,268 | 19,486 | 6,977 | 15,556 | ||||||||||||
| Trustee fees | 8,307 | 8,365 | 8,241 | 8,316 | ||||||||||||
| Other | 4,955 | 3,868 | 3,527 | 4,715 | ||||||||||||
Total expenses | 676,195 | 665,704 | 395,581 | 1,096,948 | ||||||||||||
| Less — expense reductions | (127,910 | ) | (194,110 | ) | (111,594 | ) | (176,104 | ) | ||||||||
Net expenses | 548,285 | 471,594 | 283,987 | 920,844 | ||||||||||||
NET INVESTMENT INCOME (LOSS) | 1,973,994 | 1,457,581 | 376,813 | (390,685 | ) | |||||||||||
Realized and unrealized gain (loss) from investment, futures and foreign currency related transactions: | ||||||||||||||||
| Net realized gain (loss) from: | ||||||||||||||||
| Investment transactions (including commissions recaptured of $33,261 for the Growth Opportunities Fund) | 2,523,063 | 3,005,121 | 1,717,387 | 7,481,042 | ||||||||||||
| Futures transactions | (111,782 | ) | 115,198 | (362,654 | ) | — | ||||||||||
| Forward foreign currency exchange contracts (includes $23,158 of losses on foreign currency related transactions) | (265,349 | ) | — | — | — | |||||||||||
| Net change in unrealized gain (loss) on: | ||||||||||||||||
| Investments | (28,787 | ) | 6,599,144 | (632,411 | ) | (856,542 | ) | |||||||||
| Futures | 232,900 | 35,156 | 161,242 | — | ||||||||||||
| Forward foreign currency exchange contracts (includes $274 of losses on translation of assets and liabilities denominated in foreign currencies) | (75,001 | ) | — | — | — | |||||||||||
Net realized and unrealized gain from investment, futures and foreign currency related transactions | 2,275,044 | 9,754,619 | 883,564 | 6,624,500 | ||||||||||||
NET INCREASE IN NET ASSETS RESULTING FROM OPERATIONS | $ | 4,249,038 | $ | 11,212,200 | $ | 1,260,377 | $ | 6,233,815 | ||||||||
GOLDMAN SACHS VARIABLE INSURANCE TRUST FUNDS
Statements of Changes in Net Assets
| Core Fixed Income Fund | ||||||||
| For the | ||||||||
| Six Months Ended | For the | |||||||
| June 30, 2011 | Fiscal Year Ended | |||||||
| (Unaudited) | December 31, 2010 | |||||||
From operations: | ||||||||
| Net investment income (loss) | $ | 1,973,994 | $ | 5,067,283 | ||||
| Net realized gain from investment, futures and foreign currency related transactions | 2,145,932 | 5,695,098 | ||||||
| Net change in unrealized gain (loss) on investments, futures and translation of assets and liabilities denominated in foreign currencies | 129,112 | 2,132,947 | ||||||
Net increase in net assets resulting from operations | 4,249,038 | 12,895,328 | ||||||
Distributions to shareholders: | ||||||||
| From net investment income | (2,442,779 | ) | (5,464,354 | ) | ||||
| From net realized gains | — | — | ||||||
Total distributions to shareholders | (2,442,779 | ) | (5,464,354 | ) | ||||
From share transactions: | ||||||||
| Proceeds from sales of shares | 4,470,079 | 14,587,352 | ||||||
| Reinvestment of distributions | 2,442,779 | 5,464,354 | ||||||
| Cost of shares redeemed | (20,624,683 | ) | (39,940,402 | ) | ||||
Net decrease in net assets resulting from share transactions | (13,711,825 | ) | (19,888,696 | ) | ||||
TOTAL INCREASE (DECREASE) | (11,905,566 | ) | (12,457,722 | ) | ||||
Net assets: | ||||||||
| Beginning of period | 170,720,351 | 183,178,073 | ||||||
| End of period | $ | 158,814,785 | $ | 170,720,351 | ||||
Accumulated undistributed (distributions in excess of) net investment income (loss) | $ | (59,420 | ) | $ | 409,365 | |||
Summary of share transactions: | ||||||||
| Shares sold | 441,889 | 1,456,328 | ||||||
| Shares issued on reinvestment of distributions | 243,656 | 549,659 | ||||||
| Shares redeemed | (2,045,368 | ) | (3,991,289 | ) | ||||
NET INCREASE (DECREASE) | (1,359,823 | ) | (1,985,302 | ) | ||||
GOLDMAN SACHS VARIABLE INSURANCE TRUST FUNDS
| Equity Index Fund | Government Income Fund | Growth Opportunities Fund | ||||||||||||||||||||
| For the | For the | For the | ||||||||||||||||||||
| Six Months Ended | For the | Six Months Ended | For the | Six Months Ended | For the | |||||||||||||||||
| June 30, 2011 | Fiscal Year Ended | June 30, 2011 | Fiscal Year Ended | June 30, 2011 | Fiscal Year Ended | |||||||||||||||||
| (Unaudited) | December 31, 2010 | (Unaudited) | December 31, 2010 | (Unaudited) | December 31, 2010 | |||||||||||||||||
| $ | 1,457,581 | $ | 2,867,686 | $ | 376,813 | $ | 1,174,322 | $ | (390,685 | ) | $ | (712,464 | ) | |||||||||
| 3,120,319 | 3,039,130 | 1,354,733 | 2,243,162 | 7,481,042 | 16,003,733 | |||||||||||||||||
6,634,300 | 19,814,112 | (471,169 | ) | 337,789 | (856,542 | ) | 8,130,062 | |||||||||||||||
| 11,212,200 | 25,720,928 | 1,260,377 | 3,755,273 | 6,233,815 | 23,421,331 | |||||||||||||||||
| — | (2,986,451 | ) | (468,085 | ) | (1,312,896 | ) | — | — | ||||||||||||||
| — | — | — | (523,731 | ) | — | — | ||||||||||||||||
| — | (2,986,451 | ) | (468,085 | ) | (1,836,627 | ) | — | — | ||||||||||||||
| 13,100,098 | 4,058,717 | 7,272,370 | 16,983,366 | 22,301,861 | 19,089,330 | |||||||||||||||||
| — | 2,986,451 | 468,085 | 1,836,627 | — | — | |||||||||||||||||
| (26,631,092 | ) | (34,493,149 | ) | (12,550,424 | ) | (23,187,620 | ) | (12,157,180 | ) | (24,317,063 | ) | |||||||||||
| (13,530,994 | ) | (27,447,981 | ) | (4,809,969 | ) | (4,367,627 | ) | 10,144,681 | (5,227,733 | ) | ||||||||||||
| (2,318,794 | ) | (4,713,504 | ) | (4,017,677 | ) | (2,448,981 | ) | 16,378,496 | 18,193,598 | |||||||||||||
| 193,874,000 | 198,587,504 | 72,311,237 | 74,760,218 | 145,903,665 | 127,710,067 | |||||||||||||||||
| $ | 191,555,206 | $ | 193,874,000 | $ | 68,293,560 | $ | 72,311,237 | $ | 162,282,161 | $ | 145,903,665 | |||||||||||
| $ | 1,723,441 | $ | 265,860 | $ | (3,201 | ) | $ | 88,071 | $ | (374,472 | ) | $ | 16,213 | |||||||||
| 238,533 | 481,675 | 685,472 | 1,598,199 | 3,195,217 | 3,177,035 | |||||||||||||||||
| — | 322,163 | 44,245 | 174,144 | — | — | |||||||||||||||||
| (1,628,690 | ) | (4,084,097 | ) | (1,183,519 | ) | (2,183,890 | ) | (1,733,520 | ) | (4,134,939 | ) | |||||||||||
| (1,390,157 | ) | (3,280,259 | ) | (453,802 | ) | (411,547 | ) | 1,461,697 | (957,904 | ) | ||||||||||||
GOLDMAN SACHS VARIABLE INSURANCE TRUST CORE FIXED INCOME FUND
Financial Highlights
Selected Data for a Share Outstanding Throughout Each Period
| Income (loss) from | ||||||||||||||||||||||||||||||||||||||||||||||||||||||
| investment operations | ||||||||||||||||||||||||||||||||||||||||||||||||||||||
| Net | Distributions | Ratio of | Ratio of | Portfolio | Portfolio | |||||||||||||||||||||||||||||||||||||||||||||||||
| Net asset | realized | to shareholders | Net asset | Net assets, | Ratio of | total | net investment | turnover rate | turnover rate | |||||||||||||||||||||||||||||||||||||||||||||
| value, | Net | and | Total from | from net | value, | end of | net expenses | expenses | income | (including the | (excluding the | |||||||||||||||||||||||||||||||||||||||||||
| beginning | investment | unrealized | investment | investment | end of | Total | period | to average | to average | to average | effect of mortgage | effect of mortgage | ||||||||||||||||||||||||||||||||||||||||||
| Year | of period | income(a) | gain (loss) | operations | income | period | return(b) | (in 000s) | net assets | net assets | net assets | dollar rolls) | dollar rolls) | |||||||||||||||||||||||||||||||||||||||||
FOR THE SIX MONTHS ENDED JUNE 30, (UNAUDITED) | ||||||||||||||||||||||||||||||||||||||||||||||||||||||
| 2011 | $ | 10.00 | $ | 0.12 | $ | 0.14 | $ | 0.26 | $ | (0.15 | ) | $ | 10.11 | 2.65 | % | $ | 158,815 | 0.67 | %(c) | 0.83 | %(c) | 2.43 | %(c) | 301 | % | 216 | % | |||||||||||||||||||||||||||
FOR THE FISCAL YEARS ENDED DECEMBER 31, | ||||||||||||||||||||||||||||||||||||||||||||||||||||||
| 2010 | 9.62 | 0.28 | 0.41 | 0.69 | (0.31 | ) | 10.00 | 7.18 | 170,720 | 0.67 | 0.81 | 2.80 | 399 | 307 | ||||||||||||||||||||||||||||||||||||||||
| 2009 | 8.81 | 0.39 | 0.87 | 1.26 | (0.45 | ) | 9.62 | 14.68 | 183,178 | 0.67 | 0.79 | 4.29 | 187 | 159 | ||||||||||||||||||||||||||||||||||||||||
| 2008 | 10.13 | 0.47 | (1.31 | ) | (0.84 | ) | (0.48 | ) | 8.81 | (8.56 | ) | 182,978 | 0.67 | 0.77 | 4.92 | 140 | 105 | |||||||||||||||||||||||||||||||||||||
| 2007 | 9.94 | 0.48 | 0.17 | 0.65 | (0.46 | ) | 10.13 | 6.81 | 264,389 | 0.54 | (d) | 0.76 | (d) | 4.82 | (d) | 123 | 92 | |||||||||||||||||||||||||||||||||||||
2006(e) | 9.98 | 0.44 | (0.03 | )(f) | 0.41 | (0.45 | ) | 9.94 | 4.23 | (g) | 285,768 | 0.54 | 0.78 | 4.49 | 265 | 259 | ||||||||||||||||||||||||||||||||||||||
| (a) | Calculated based on the average shares outstanding methodology. | |
| (b) | Assumes investment at the net asset value at the beginning of the period, reinvestment of all distributions and a complete redemption of the investment at the net asset value at the end of the period. The Goldman Sachs Core Fixed Income Fund first began operations as the Allmerica Select Investment Grade Fund (the “Predecessor AIT Fund”) of the Allmerica Investment Trust. On January 9, 2006, the Predecessor AIT Fund was reorganized as a new portfolio of the Goldman Sachs Variable Insurance Trust. Performance prior to January 9, 2006 is that of the Predecessor AIT Fund. The Predecessor AIT Fund was considered the accounting survivor of the reorganization and as such, the historical total return information of the Predecessor AIT Fund is provided. | |
| (c) | Annualized. | |
| (d) | Includes non-recurring expense for a special shareholder meeting which amounted to approximately 0.02% of average net assets. | |
| (e) | The Predecessor AIT Fund was the accounting survivor of the reorganization and as such, the financial highlights reflect the financial information of the Predecessor AIT Fund through January 8, 2006. In connection with such reorganization, the Goldman Sachs Core Fixed Income Fund issued Service Shares to the former shareholders of the Predecessor AIT Fund at $10.00 per share. Historical per-share amounts prior to the Fund reorganization have been adjusted to reflect the conversion ratio utilized for the reorganization. | |
| (f) | Reflects an increase of $0.04 due to payments received for class action settlements received this year. | |
| (g) | Total return reflects the impact of payments received for class action settlements received this year. Excluding such payment, the total return would have been 3.81%. |
46
GOLDMAN SACHS VARIABLE INSURANCE TRUST EQUITY INDEX FUND
Financial Highlights
Selected Data for a Share Outstanding Throughout Each Period
| Income (loss) from | ||||||||||||||||||||||||||||||||||||||||||||||||||||||||||
| investment operations | ||||||||||||||||||||||||||||||||||||||||||||||||||||||||||
| Net | Distributions to shareholders | Ratio of | Ratio of | |||||||||||||||||||||||||||||||||||||||||||||||||||||||
| Net asset | realized | From | Net asset | Net assets, | Ratio of | total | net investment | |||||||||||||||||||||||||||||||||||||||||||||||||||
| value, | Net | and | Total from | From net | net | value, | end of | net expenses | expenses | income | Portfolio | |||||||||||||||||||||||||||||||||||||||||||||||
| beginning | investment | unrealized | investment | investment | realized | Total | end of | Total | period | to average | to average | to average | turnover | |||||||||||||||||||||||||||||||||||||||||||||
| Year | of period | income(a) | gain (loss) | operations | income | gains | distributions | period | return(b) | (in 000s) | net assets | net assets | net assets | rate | ||||||||||||||||||||||||||||||||||||||||||||
FOR THE SIX MONTHS ENDED JUNE 30, (UNAUDITED) | ||||||||||||||||||||||||||||||||||||||||||||||||||||||||||
| 2011 | $ | 9.29 | $ | 0.07 | $ | 0.48 | $ | 0.55 | $ | — | $ | — | $ | — | $ | 9.84 | 5.92 | % | $ | 191,555 | 0.48 | %(c) | 0.68 | %(c) | 1.50 | %(c) | 1 | % | ||||||||||||||||||||||||||||||
FOR THE FISCAL YEARS ENDED DECEMBER 31, | ||||||||||||||||||||||||||||||||||||||||||||||||||||||||||
| 2010 | 8.22 | 0.13 | 1.08 | 1.21 | (0.14 | ) | — | (0.14 | ) | 9.29 | 14.92 | 193,874 | 0.51 | 0.71 | 1.52 | 4 | ||||||||||||||||||||||||||||||||||||||||||
| 2009 | 6.61 | 0.14 | 1.62 | 1.76 | (0.15 | ) | — | (0.15 | ) | 8.22 | 26.28 | 198,588 | 0.59 | 0.68 | 1.97 | 5 | ||||||||||||||||||||||||||||||||||||||||||
| 2008 | 11.42 | 0.17 | (4.46 | ) | (4.29 | ) | (0.18 | ) | (0.34 | ) | (0.52 | ) | 6.61 | (37.18 | ) | 187,383 | 0.60 | 0.69 | 1.81 | 4 | ||||||||||||||||||||||||||||||||||||||
| 2007 | 11.04 | 0.18 | 0.41 | 0.59 | (0.21 | ) | — | (0.21 | ) | 11.42 | 5.32 | 364,288 | 0.41 | (d) | 0.68 | (d) | 1.57 | (d) | 8 | |||||||||||||||||||||||||||||||||||||||
2006(e) | 9.71 | 0.16 | 1.34 | 1.50 | (0.17 | ) | — | (0.17 | ) | 11.04 | 15.49 | (f) | 438,471 | 0.41 | 0.67 | 1.53 | 4 | |||||||||||||||||||||||||||||||||||||||||
| (a) | Calculated based on the average shares outstanding methodology. | |
| (b) | Assumes investment at the net asset value at the beginning of the period, reinvestment of all distributions and a complete redemption of the investment at the net asset value at the end of the period. The Goldman Sachs Equity Index Fund first began operations as the Allmerica Equity Index Fund (the “Predecessor AIT Fund”) of the Allmerica Investment Trust. On January 9, 2006, the Predecessor AIT Fund was reorganized as a new portfolio of the Goldman Sachs Variable Insurance Trust. Performance prior to January 9, 2006 is that of the Predecessor AIT Fund. The Predecessor AIT Fund was considered the accounting survivor of the reorganization and as such, the historical total return information of the Predecessor AIT Fund is provided. | |
| (c) | Annualized. | |
| (d) | Includes non-recurring expense for a special shareholder meeting which amounted to approximately 0.02% of average net assets. | |
| (e) | The Predecessor AIT Fund was the accounting survivor of the reorganization and as such, the financial highlights reflect the financial information of the Predecessor AIT Fund through January 8, 2006. In connection with such reorganization, the Goldman Sachs Equity Index Fund issued Service Shares to the former shareholders of the Predecessor AIT Fund at $10.00 per share. Historical per-share amounts prior to the Fund reorganization have been adjusted to reflect the conversion ratio utilized for the reorganization. | |
| (f) | Total return reflects the impact of a payment from previous investment manager of a merged fund to compensate for possible adverse effects of trading activity of certain contract holders of the merged fund prior to January 9, 2006 received this year. Excluding such payments, the total return would have been 15.39%. |
47
GOLDMAN SACHS VARIABLE INSURANCE TRUST GOVERNMENT INCOME FUND
Financial Highlights
Selected Data for a Share Outstanding Throughout Each Period
| Income (loss) from | ||||||||||||||||||||||||||||||||||||||||||||||||||||||||||||||
| investment operations | ||||||||||||||||||||||||||||||||||||||||||||||||||||||||||||||
| Net | Distributions to shareholders | Ratio of | Ratio of | Portfolio | Portfolio | |||||||||||||||||||||||||||||||||||||||||||||||||||||||||
| Net asset | realized | From | Net asset | Net assets, | Ratio of | total | net investment | turnover rate | turnover rate | |||||||||||||||||||||||||||||||||||||||||||||||||||||
| value, | Net | and | Total from | From net | net | value, | end of | net expenses | expenses | income | (including the | (excluding the | ||||||||||||||||||||||||||||||||||||||||||||||||||
| beginning | investment | unrealized | investment | investment | realized | Total | end of | Total | period | to average | to average | to average | effect of mortgage | effect of mortgage | ||||||||||||||||||||||||||||||||||||||||||||||||
| Year | of period | income(a) | gain (loss) | operations | income | gains | distributions | period | return(b) | (in 000s) | net assets | net assets | net assets | dollar rolls) | dollar rolls) | |||||||||||||||||||||||||||||||||||||||||||||||
FOR THE SIX MONTHS ENDED JUNE 30, (UNAUDITED) | ||||||||||||||||||||||||||||||||||||||||||||||||||||||||||||||
| 2011 | $ | 10.56 | $ | 0.06 | $ | 0.13 | $ | 0.19 | $ | (0.07 | ) | $ | — | $ | (0.07 | ) | $ | 10.68 | 1.82 | % | $ | 68,294 | 0.81 | %(c) | 1.13 | %(c) | 1.08 | %(c) | 482 | % | 312 | % | ||||||||||||||||||||||||||||||
FOR THE FISCAL YEARS ENDED DECEMBER 31, | ||||||||||||||||||||||||||||||||||||||||||||||||||||||||||||||
| 2010 | 10.29 | 0.17 | 0.37 | 0.54 | (0.19 | ) | (0.08 | ) | (0.27 | ) | 10.56 | 5.19 | 72,311 | 0.81 | 1.08 | 1.56 | 614 | 416 | ||||||||||||||||||||||||||||||||||||||||||||
| 2009 | 10.14 | 0.31 | 0.33 | 0.64 | (0.36 | ) | (0.13 | ) | (0.49 | ) | 10.29 | 6.44 | 74,760 | 0.81 | 1.05 | 3.01 | 287 | 231 | ||||||||||||||||||||||||||||||||||||||||||||
| 2008 | 10.27 | 0.42 | (0.11 | ) | 0.31 | (0.44 | ) | — | (0.44 | ) | 10.14 | 3.14 | 87,050 | 0.81 | 1.04 | 4.12 | 244 | 184 | ||||||||||||||||||||||||||||||||||||||||||||
| 2007 | 9.96 | 0.42 | 0.29 | 0.71 | (0.40 | ) | — | (0.40 | ) | 10.27 | 7.34 | 85,978 | 0.67 | (d) | 1.03 | (d) | 4.19 | (d) | 217 | 146 | ||||||||||||||||||||||||||||||||||||||||||
2006(e) | 9.98 | 0.39 | 0.01 | 0.40 | (0.42 | ) | — | (0.42 | ) | 9.96 | 4.05 | 87,063 | 0.68 | 1.02 | 3.96 | 523 | 447 | |||||||||||||||||||||||||||||||||||||||||||||
| (a) | Calculated based on the average shares outstanding methodology. | |
| (b) | Assumes investment at the net asset value at the beginning of the period, reinvestment of all distributions and a complete redemption of the investment at the net asset value at the end of the period. The Goldman Sachs Government Income Fund first began operations as the Allmerica Government Bond Fund (the “Predecessor AIT Fund”) of the Allmerica Investment Trust. On January 9, 2006, the Predecessor AIT Fund was reorganized as a new portfolio of the Goldman Sachs Variable Insurance Trust. Performance prior to January 9, 2006 is that of the Predecessor AIT Fund. The Predecessor AIT Fund was considered the accounting survivor of the reorganization and as such, the historical total return information of the Predecessor AIT Fund is provided. | |
| (c) | Annualized. | |
| (d) | Includes non-recurring expense for a special shareholder meeting which amounted to approximately 0.03% of average net assets. | |
| (e) | The Predecessor AIT Fund was the accounting survivor of the reorganization and as such, the financial highlights reflect the financial information of the Predecessor AIT Fund through January 8, 2006. In connection with such reorganization, the Goldman Sachs Government Income Fund issued Service Shares to the former shareholders of the Predecessor AIT Fund at $10.00 per share. Historical per-share amounts prior to the Fund reorganization have been adjusted to reflect the conversion ratio utilized for the reorganization. |
48
GOLDMAN SACHS VARIABLE INSURANCE TRUST GROWTH OPPORTUNITIES FUND
Financial Highlights
Selected Data for a Share Outstanding Throughout Each Period
| Income (loss) from | ||||||||||||||||||||||||||||||||||||||||||||||||||
| investment operations | ||||||||||||||||||||||||||||||||||||||||||||||||||
| Net | Distributions | Ratio of | Ratio of | |||||||||||||||||||||||||||||||||||||||||||||||
| Net asset | realized | to shareholders | Net asset | Net assets, | Ratio of | total | net investment | |||||||||||||||||||||||||||||||||||||||||||
| value, | Net | and | Total from | from net | value, | end of | net expenses | expenses | loss | Portfolio | ||||||||||||||||||||||||||||||||||||||||
| beginning | investment | unrealized | investment | realized | end of | Total | period | to average | to average | to average | turnover | |||||||||||||||||||||||||||||||||||||||
| Year | of period | loss(a) | gain (loss) | operations | gains | period | return(b) | (in 000s) | net assets | net assets | net assets | rate | ||||||||||||||||||||||||||||||||||||||
FOR THE SIX MONTHS ENDED JUNE 30, (UNAUDITED) | ||||||||||||||||||||||||||||||||||||||||||||||||||
| 2011 | $ | 6.72 | $ | (0.02 | ) | $ | 0.30 | $ | 0.28 | $ | — | $ | 7.00 | 4.17 | % | $ | 162,282 | 1.18 | %(c) | 1.41 | %(c) | (0.50 | )%(c) | 23 | % | |||||||||||||||||||||||||
FOR THE FISCAL YEARS ENDED DECEMBER 31, | ||||||||||||||||||||||||||||||||||||||||||||||||||
| 2010 | 5.63 | (0.03 | ) | 1.12 | 1.09 | — | 6.72 | 19.36 | 145,904 | 1.18 | 1.43 | (0.56 | ) | 57 | ||||||||||||||||||||||||||||||||||||
| 2009 | 3.55 | (0.02 | ) | 2.10 | 2.08 | — | 5.63 | 58.59 | 127,710 | 1.18 | 1.43 | (0.50 | ) | 71 | ||||||||||||||||||||||||||||||||||||
| 2008 | 6.20 | (0.02 | ) | (2.52 | ) | (2.54 | ) | (0.11 | ) | 3.55 | (40.72 | ) | 95,237 | 1.18 | 1.37 | (0.32 | ) | 78 | ||||||||||||||||||||||||||||||||
| 2007 | 6.07 | (0.03 | ) | 1.22 | 1.19 | (1.06 | ) | 6.20 | 19.37 | 200,146 | 1.14 | (d) | 1.38 | (d) | (0.48 | )(d) | 73 | |||||||||||||||||||||||||||||||||
2006(e) | 9.69 | (0.06 | ) | 0.68 | 0.62 | (4.24 | ) | 6.07 | 5.74 | 215,251 | 1.15 | 1.37 | (0.60 | ) | 82 | |||||||||||||||||||||||||||||||||||
| (a) | Calculated based on the average shares outstanding methodology. | |
| (b) | Assumes investment at the net asset value at the beginning of the year, reinvestment of all distributions, and a complete redemption of the investment at the net asset value at the end of the period. The Goldman Sachs Growth Opportunities Fund first began operations as the Allmerica Select Capital Appreciation Fund (the “Predecessor AIT Fund”) of the Allmerica Investment Trust. On January 9, 2006, the Predecessor AIT Fund was reorganized as a new portfolio of the Goldman Sachs Variable Insurance Trust. Performance prior to January 9, 2006 is that of the Predecessor AIT Fund. The Predecessor AIT Fund was considered the accounting survivor of the reorganization and as such, the historical total return information of the Predecessor AIT Fund is provided. | |
| (c) | Annualized. | |
| (d) | Includes non-recurring expense for a special shareholder meeting which amounted to approximately 0.02% of average net assets. | |
| (e) | The Predecessor AIT Fund was the accounting survivor of the reorganization and as such, the financial highlights reflect the financial information of the Predecessor AIT Fund through January 8, 2006. In connection with such reorganization, the Goldman Sachs Growth Opportunities Fund issued Service Shares to the former shareholders of the Predecessor AIT Fund at $10.00 per share. Historical per-share amounts prior to the Fund reorganization have been adjusted to reflect the conversion ratio utilized for the reorganization. |
49
GOLDMAN SACHS VARIABLE INSURANCE TRUST FUNDS
Notes to Financial Statements
June 30, 2011 (Unaudited)
| 1. ORGANIZATION |
Goldman Sachs Variable Insurance Trust (the “Trust” or “VIT”) is a Delaware statutory trust registered under the Investment Company Act of 1940, as amended (the “Act”), as an open-end management investment company. The Trust includes the Goldman Sachs Core Fixed Income Fund, Goldman Sachs Equity Index Fund, Goldman Sachs Government Income Fund and Goldman Sachs Growth Opportunities Fund (collectively, the “Funds” or individually a “Fund”). The Funds are diversified portfolios under the Act offering one class of shares — Service Shares.
Goldman Sachs Asset Management, L.P. (“GSAM”), an affiliate of Goldman, Sachs & Co. (“Goldman Sachs”), serves as investment adviser to each Fund pursuant to management agreements (the “Agreements”) with the Trust.
| 2. SIGNIFICANT ACCOUNTING POLICIES |
The following is a summary of the significant accounting policies consistently followed by the Funds. The preparation of financial statements in conformity with accounting principles generally accepted in the United States of America (“GAAP”) requires management to make estimates and assumptions that may affect the amounts and disclosures in the financial statements. Actual results could differ from those estimates and assumptions.
A. Investment Valuation — The investment valuation policy of the Funds is to value investments at market value. Investments in equity securities and investment companies traded on a United States (“U.S.”) securities exchange or the NASDAQ system are valued daily at their last sale price or official closing price on the principal exchange or system on which they are traded. If no sale occurs, such securities and investment companies are valued at the last bid price for long positions and at the last ask price for short positions. Debt securities for which market quotations are readily available are valued on the basis of quotations furnished by an independent pricing service approved by the trustees or provided by securities dealers. The pricing services may use valuation models or matrix pricing, which consider: (i) yield or price with respect to bonds that are considered comparable in characteristics such as rating, interest rate and maturity date or (ii) quotations from securities dealers to determine current value. If accurate quotations are not readily available, or if GSAM believes that such quotations do not accurately reflect fair value, the fair value of the Funds’ investments may be determined based on yield equivalents, a pricing matrix or other sources, under valuation procedures established by the trustees. Unlisted equity securities for which market quotations are available are valued at the last sale price on the valuation date, or if no sale occurs, at the last bid price. In the absence of market quotations, broker quotes will be utilized or the security will be fair valued. Investments in investment companies (other than those that are exchange traded) are valued at the net asset value per share (“NAV”) of the investment company on the valuation date. Short-term debt obligations that mature in sixty days or less and that do not exhibit signs of credit deterioration are valued at amortized cost, which approximates market value.
GSAM, consistent with its procedures and applicable regulatory guidance, may make an adjustment to the previous closing prices of either domestic or foreign securities in light of significant events to reflect what it believes to be the fair value of the securities at the time of determining the Funds’ NAV. Significant events that could affect a large number of securities in a particular market may include, but are not limited to: situations relating to one or more single issuers in a market sector; significant fluctuations in U.S. or foreign markets; market dislocations; market disruptions or market closings; equipment failures; natural or man-made disasters or acts of God; armed conflicts; government actions or other developments; as well as the same or similar events which may affect specific issuers or the securities markets even though not tied directly to the securities markets. Other significant events that could relate to a single issuer may include, but are not limited to: corporate actions such as reorganizations, mergers and buy-outs; corporate announcements, including those relating to earnings, products and regulatory news; significant litigation; low trading volume; and trading limits or suspensions.
B. Security and Fund Share Transactions, and Investment Income — Security and Fund share transactions are reflected for financial reporting purposes as of the trade date, which may cause the NAV as stated in the accompanying financial statements to be different than the NAV applied to Fund share transactions. Realized gains and losses on sales of portfolio securities are calculated using the identified cost basis. Dividend income is recognized on the ex-dividend date, net of foreign withholding taxes, if any, which are reduced by any amounts reclaimable by the Funds, where applicable. Certain dividends from foreign securities
GOLDMAN SACHS VARIABLE INSURANCE TRUST FUNDS
| 2. SIGNIFICANT ACCOUNTING POLICIES (continued) |
will be recorded when the Fund is informed of the dividend, if such information is obtained subsequent to the ex-dividend date. Interest income is recorded on the basis of interest accrued, premium amortized and discount accreted. In addition, it is the Funds’ policy to accrue for foreign capital gains taxes, if applicable, on certain foreign securities held by the Funds. An estimated foreign capital gains tax is recorded daily on net unrealized gains on these securities and is payable upon the sale of such securities when a gain is realized.
Investment income and unrealized and realized gains or losses are allocated daily to each class of shares of the respective Fund based upon the relative proportion of net assets of each class.
In addition, distributions received from the Funds’ investments in U.S. real estate investment trusts (“REITs”) often include a “return of capital”, which is recorded by the Funds as a reduction of the cost basis of the securities held. The Internal Revenue Code of 1986, as amended (the “Code”) requires a REIT to distribute at least 95% of its taxable income to investors. In many cases, however, because of “non-cash” expenses such as property depreciation, a REIT’s cash flow will exceed its taxable income. The REIT may distribute this excess cash to offer a more competitive yield. This portion of the Funds’ distributions is deemed a return of capital and is generally not taxable to shareholders.
C. Commission Recapture — The Growth Opportunities Fund may direct portfolio trades, subject to obtaining best execution, to various brokers who have agreed to rebate a portion of the commissions generated. Such rebates are made directly to the Fund as cash payments and are included in net realized gain (loss) from investments on the Statements of Operations.
D. Expenses — Expenses incurred by the Funds, which may not specifically relate to the Funds, may be shared with other registered investment companies having management agreements with GSAM or its affiliates, as appropriate. These expenses are allocated to the Funds on a straight-line and/or pro-rata basis depending upon the nature of the expenses and are accrued daily. Non-class specific expenses are allocated daily to each share class of the respective Fund based upon the relative proportion of net assets of each class. Class specific expenses, where applicable, are borne by the respective share classes and include Distribution and Service and Transfer Agent.
E. Federal Taxes and Distributions to Shareholders — It is each Fund’s policy to comply with the requirements of the Code, applicable to regulated investment companies (mutual funds) and to distribute each year substantially all of its investment company taxable income and capital gains to its shareholders. Accordingly, the Funds are not required to make any provisions for the payment of federal income tax. Distributions to shareholders are recorded on the ex-dividend date. Income and capital gains distributions, if any, are declared and paid according to the following schedule:
| Income Distributions | Capital Gains Distributions | |||||||
| Fund | Declared/Paid | Declared/Paid | ||||||
| Core Fixed Income and Government Income | Quarterly | Annually | ||||||
| Equity Index and Growth Opportunities | Annually | Annually | ||||||
Net capital losses are carried forward to future fiscal years and may be used to the extent allowed by the Code to offset any future capital gains. Utilization of capital loss carryforwards will reduce the requirement of future capital gains distributions.
The characterization of distributions to shareholders for financial reporting purposes is determined in accordance with federal income tax rules, which may differ from GAAP. The source of each Fund’s distributions may be shown in the accompanying financial statements as either from net investment income, net realized gain or capital. Certain components of the Funds’ net assets on the Statements of Assets and Liabilities reflect permanent GAAP/tax differences based on the appropriate tax character.
F. Foreign Currency Translations — The books and records of the Funds are maintained in U.S. dollars. Amounts denominated in foreign currencies are translated into U.S. dollars on the following basis: (i) investment valuations, foreign currency and other assets and liabilities initially expressed in foreign currencies are converted into U.S. dollars based upon 4:00 p.m. Eastern Time exchange rates; and (ii) purchases and sales of foreign investments, income and expenses are converted into U.S. dollars based upon currency exchange rates prevailing on the respective dates of such transactions as of 4:00 p.m. Eastern Time.
GOLDMAN SACHS VARIABLE INSURANCE TRUST FUNDS
Notes to Financial Statements (continued)
June 30, 2011 (Unaudited)
| 2. SIGNIFICANT ACCOUNTING POLICIES (continued) |
Net realized and unrealized gain (loss) on foreign currency transactions represents: (i) foreign exchange gains and losses from the sale and holdings of foreign currencies; (ii) currency gains and losses between trade date and settlement date on investment security transactions and forward foreign currency exchange contracts; and (iii) gains and losses from the difference between amounts of dividends, interest and foreign withholding taxes recorded and the amounts actually received. The effect of changes in foreign currency exchange rates on securities and derivative instruments is included with the net realized and change in unrealized gain (loss) on investments on the Statements of Operations, however, the effect of changes in foreign currency exchange rates on fixed income securities sold during the period is included with the net realized gain (loss) on foreign currency related transactions. Changes in the value of other assets and liabilities as a result of fluctuations in foreign exchange rates are included as an increase or decrease to net change in unrealized gain (loss) on translation of assets and liabilities denominated in foreign currencies.
G. Forward Foreign Currency Exchange Contracts — All forward foreign currency exchange contracts are marked to market daily at the applicable forward rate. Unrealized gains or losses on forward foreign currency exchange contracts are recorded by the Funds on a daily basis and realized gains or losses are recorded on the settlement date of a contract.
Risks may arise upon entering into these contracts from the potential inability of counterparties to meet the terms of their contracts and from unanticipated movements in the value of a foreign currency relative to the U.S. dollar.
The contractual amounts of forward foreign currency exchange contracts do not necessarily represent the amounts potentially subject to risk. The measurement of the risks associated with these instruments is meaningful only when all related and offsetting transactions are considered. The Funds must set aside liquid assets, or engage in other appropriate measures to cover their obligations under these contracts.
H. Futures Contracts — Futures contracts are valued at the last settlement price, or in the absence of a sale, the last bid price, at the end of each day on the board of trade or exchange upon which they are traded. Upon entering into a futures contract, the Funds deposit cash or securities in an account on behalf of the broker in an amount sufficient to meet the initial margin requirement. Subsequent payments are made or received by the Funds equal to the daily change in the contract value and are recorded as variation margin receivable or payable with a corresponding offset in unrealized gains or losses. The Funds recognize a realized gain or loss when a contract is closed or expires.
The use of futures contracts involves, to varying degrees, elements of market and counterparty risk which may exceed the amounts recognized in the Statements of Assets and Liabilities. Futures contracts may be illiquid, and exchanges may limit fluctuations in futures contract prices during a single day. Changes in the value of a futures contract may not directly correlate with changes in the value of the underlying securities. These risks may decrease the effectiveness of the Funds’ strategies and potentially result in a loss. The Funds must set aside liquid assets, or engage in other appropriate measures, to cover their obligations under these contracts.
I. Mortgage-Backed and Asset-Backed Securities — The Core Fixed Income, Government Income and Growth Opportunities Funds may invest in mortgage-backed and/or asset-backed securities. Mortgage-backed securities represent direct or indirect participations in, or are collateralized by and payable from, mortgage loans secured by residential and/or commercial real property. These securities may include mortgage pass-through securities, collateralized mortgage obligations, real estate mortgage investment conduit pass-through or participation certificates and stripped mortgage-backed securities. Asset-backed securities include securities whose principal and interest payments are collateralized by pools of assets such as auto loans, credit card receivables, leases, installment contracts and personal property.
Asset-backed securities also include home equity line of credit loans and other second-lien mortgages.
The value of certain mortgage-backed and asset-backed securities (including adjustable rate mortgage loans) may be particularly sensitive to changes in prevailing interest rates. The value of these securities may also fluctuate in response to the market’s perception of the creditworthiness of the issuers. Early repayment of principal on mortgage-backed or asset-backed securities may expose a Fund to the risk of earning a lower rate of return upon reinvestment of principal. Asset-backed securities may present credit risks that are not presented by mortgage-backed securities because they generally do not have the benefit of a security interest in collateral that is comparable to mortgage assets. Some asset-backed securities may only have a subordinated
GOLDMAN SACHS VARIABLE INSURANCE TRUST FUNDS
| 2. SIGNIFICANT ACCOUNTING POLICIES (continued) |
claim on collateral. In addition, while mortgage-backed and asset-backed securities may be supported by some form of government or private guarantee and/or insurance, there is no assurance that private guarantors or insurers, if any, will meet their obligations.
Stripped mortgage-backed securities are usually structured with two different classes: one that receives substantially all of the interest payments (the interest-only, or “IO” and/or the high coupon rate with relatively low principal amount, or “IOette”), and the other that receives substantially all of the principal payments (the principal-only, or “PO”) from a pool of mortgage loans. Little to no principal will be received at the maturity of an IO; as a result, periodic adjustments are recorded to reduce the cost of the security through maturity. These adjustments are included in interest income. Payments received for PO’s are treated as a proportionate reduction to the cost basis of the securities and excess amounts are recorded as gains.
J. Mortgage Dollar Rolls — The Core Fixed Income and Government Income Funds may enter into mortgage dollar rolls (“dollar rolls”) in which the Funds sell securities in the current month for delivery and simultaneously contracts with the same counterparty to repurchase similar (same type, coupon and maturity) but not identical securities on a specified future date. The Funds treat dollar rolls as two separate transactions: one involving the purchase of a security and a separate transaction involving a sale.
During the settlement period between sale and repurchase, the Funds will not be entitled to accrue interest and principal payments on the securities sold. Dollar roll transactions involve the risk that the market value of the securities sold by the Funds may decline below the repurchase price of those securities. In the event the buyer of the securities in a dollar roll transaction files for bankruptcy or becomes insolvent, the Funds’ use of proceeds from the transaction may be restricted pending a determination by, or with respect to, the other counterparty.
K. Treasury Inflation-Protected Securities — The Funds may invest in treasury inflation protected securities (“TIPS”), including structured bonds in which the principal amount is adjusted daily to keep pace with inflation, as measured by the U.S. Consumer Pricing Index for Urban Consumers. The adjustments to principal due to inflation/deflation are reflected as increases/decreases to interest income with a corresponding adjustment to cost. Such adjustments may have a significant impact on the Funds’ distributions and may result in a return of capital to shareholders. The repayment of the original bond principal upon maturity is guaranteed by the full faith and credit of the U.S. Government.
L. When-Issued Securities and Forward Commitments — The Funds may purchase when-issued securities, including TBA (“To Be Announced”) securities that have been authorized, but not yet issued in the market. When issued securities are purchased in order to secure what is considered to be an advantageous price or yield to the Fund at the time of entering into the transaction. A forward commitment involves entering into a contract to purchase or sell securities, typically on an extended delivery basis, for a fixed price at a future date. The purchase of securities on a when-issued or forward commitment basis involves a risk of loss if the value of the security to be purchased declines before the settlement date. Conversely, the sale of securities on a forward commitment basis involves the risk that the value of the securities sold may increase before the settlement date. Although the Funds will generally purchase securities on a when-issued or forward commitment basis with the intention of acquiring the securities for their portfolios, the Funds may dispose of when-issued securities or forward commitments prior to settlement which may result in a realized gain or loss. When purchasing a security on a when-issued basis or entering into a forward commitment, the Funds must “set aside” liquid assets, or engage in other appropriate measures to “cover” their obligations under these contracts.
| 3. FAIR VALUE OF INVESTMENTS |
The fair value of a financial instrument is the amount that would be received to sell an asset or paid to transfer a liability in an orderly transaction between market participants at the measurement date (i.e., the exit price). GAAP establishes a fair value hierarchy that prioritizes the inputs to valuation techniques used to measure fair value. The hierarchy gives the highest priority to
GOLDMAN SACHS VARIABLE INSURANCE TRUST FUNDS
Notes to Financial Statements (continued)
June 30, 2011 (Unaudited)
| 3. FAIR VALUE OF INVESTMENTS (continued) |
unadjusted quoted prices in active markets for identical assets or liabilities (Level 1 measurements) and the lowest priority to unobservable inputs (Level 3 measurements). The three levels of the fair value hierarchy are described below:
Level 1 — Unadjusted quoted prices in active markets that are accessible at the measurement date for identical, unrestricted assets or liabilities;
Level 2 — Quoted prices in markets that are not active or financial instruments for which significant inputs are observable (including, but not limited to, quoted prices for similar securities, interest rates, foreign exchange rates, volatility and credit spreads), either directly or indirectly;
Level 3 — Prices or valuations that require significant unobservable inputs (including GSAM’s assumptions in determining fair value measurement).
The following is a summary of the Funds’ investments and derivatives categorized in the fair value hierarchy as of June 30, 2011:
| CORE FIXED INCOME | ||||||||||||
| Investment Type | Level 1 | Level 2 | Level 3 | |||||||||
Assets | ||||||||||||
| Fixed Income | ||||||||||||
| Corporate Obligations | $ | — | $ | 34,990,901 | $ | — | ||||||
| Mortgage-Backed Obligations | — | 92,570,470 | — | |||||||||
U.S. Treasury Obligations and/or Other U.S. Government Agencies | 7,368,309 | — | — | |||||||||
| Asset-Backed Securities | — | 3,933,388 | — | |||||||||
| Foreign Debt Obligations | — | 12,641,844 | — | |||||||||
| Municipal Debt Obligations | — | 3,698,397 | — | |||||||||
| Government Guarantee Obligations | — | 7,546,611 | — | |||||||||
| Short-term Investment | 24,126,683 | — | — | |||||||||
Total | $ | 31,494,992 | $ | 155,381,611 | $ | — | ||||||
Liabilities | ||||||||||||
| Fixed Income | ||||||||||||
| Mortgage-Backed Obligations — Forward Sales Contracts | $ | — | $ | (7,646,563 | ) | $ | — | |||||
| Derivative Type | ||||||||||||
Assets(a) | ||||||||||||
| Futures Contracts | $ | 21,124 | $ | — | $ | — | ||||||
| Forward Foreign Currency Exchange Contracts | — | 36,575 | — | |||||||||
Liabilities(a) | ||||||||||||
| Futures Contracts | $ | (138,908 | ) | $ | — | $ | — | |||||
| Forward Foreign Currency Exchange Contracts | — | (142,561 | ) | $ | — | |||||||
GOLDMAN SACHS VARIABLE INSURANCE TRUST FUNDS
| 3. FAIR VALUE OF INVESTMENTS (continued) |
| EQUITY INDEX | ||||||||||||
| Investment Type | Level 1 | Level 2 | Level 3 | |||||||||
Assets | ||||||||||||
Common Stock and/or Other Equity Investments | $ | 190,439,215 | $ | — | $ | — | ||||||
U.S. Treasury Obligations and/or Other U.S. Government Agencies | 139,997 | — | — | |||||||||
| Short-term Investment | 249,711 | — | — | |||||||||
Total | $ | 190,828,923 | $ | — | $ | — | ||||||
| Derivative Type | ||||||||||||
Assets(a) | ||||||||||||
| Futures Contracts | $ | 48,015 | $ | — | $ | — | ||||||
| GOVERNMENT INCOME | ||||||||||||
| Investment Type | Level 1 | Level 2 | Level 3 | |||||||||
Assets | ||||||||||||
| Fixed Income | ||||||||||||
| Mortgage-Backed Obligations | $ | — | $ | 37,588,981 | $ | — | ||||||
U.S. Treasury Obligations and/or Other U.S. Government Agencies | 13,945,252 | 4,632,843 | — | |||||||||
| Asset-Backed Securities | — | 2,177,337 | — | |||||||||
| Government Guarantee Obligations | — | 6,286,009 | — | |||||||||
| Short-term Investment | 24,532,792 | — | — | |||||||||
Total | $ | 38,478,044 | $ | 50,685,170 | $ | — | ||||||
Liabilities | ||||||||||||
| Fixed Income | ||||||||||||
| Mortgage-Backed Obligations — Forward Sales Contracts | $ | — | $ | (4,777,109 | ) | $ | — | |||||
| Derivative Type | ||||||||||||
Assets(a) | ||||||||||||
| Futures Contracts | $ | 7,580 | $ | — | $ | — | ||||||
Liabilities(a) | ||||||||||||
| Futures Contracts | $ | (75,287 | ) | $ | — | $ | — | |||||
| GROWTH OPPORTUNITIES | ||||||||||||
| Investment Type | Level 1 | Level 2 | Level 3 | |||||||||
Assets | ||||||||||||
Common Stock and/or Other Equity Investments | $ | 158,520,357 | $ | — | $ | — | ||||||
| Short-term Investment | 3,790,358 | — | — | |||||||||
Total | $ | 162,310,715 | $ | — | $ | — | ||||||
| (a) | Amount shown represents unrealized gain (loss) at period end. |
GOLDMAN SACHS VARIABLE INSURANCE TRUST FUNDS
Notes to Financial Statements (continued)
June 30, 2011 (Unaudited)
| 4. INVESTMENTS IN DERIVATIVES |
The Funds may make investments in derivative instruments, including, but not limited to options, futures, swaps, swaptions and other derivatives relating to foreign currency transactions. A derivative is an instrument whose value is derived from underlying assets, indices, reference rates or a combination of these factors. Derivative instruments may be privately negotiated contracts (often referred to as over the counter (“OTC”) derivatives) or they may be listed and traded on an exchange. Derivative contracts may involve future commitments to purchase or sell financial instruments or commodities at specified terms on a specified date, or to exchange interest payment streams or currencies based on a notional or contractual amount. Derivative instruments may involve a high degree of financial risk. The use of derivatives also involves the risk of loss if the investment adviser is incorrect in its expectation of the timing or level of fluctuations in securities prices, interest rates or currency prices. Investments in derivative instruments also include the risk of default by the counterparty, the risk that the investment may not be liquid and the risk that a small movement in the price of the underlying security or benchmark may result in a disproportionately large movement, unfavorable or favorable, in the price of the derivative instrument.
During the six months ended June 30, 2011, the Core Fixed Income, Government Income and Equity Index Funds entered into certain derivative contract types. These instruments were used to meet the Funds’ investment objectives and to obtain and/or manage exposure related to the risks below. The following tables set forth, by certain risk types, the gross value of these derivative contracts for trading activities as of June 30, 2011. The values in the tables below exclude the effects of cash collateral received or posted pursuant to these derivative contracts, and therefore are not representative of the Funds’ net exposure.
| Core Fixed Income | |||||||||||||||
| Statements of Assets | Statements of Assets | ||||||||||||||
| and Liabilities | and Liabilities | ||||||||||||||
| Risk | Location | Assets | Location | Liabilities | |||||||||||
| Interest rate | Due from broker — variation margin, at value | $ | 21,124 | (a) | Due to broker — variation margin, at value | $ | (138,908 | )(a) | |||||||
| Currency | Receivables for forward foreign currency exchange contracts, at value | 36,575 | Payables for forward foreign currency exchange contracts, at value | (142,561 | ) | ||||||||||
Total | $ | 57,699 | $ | (281,469 | ) | ||||||||||
| Statements of Assets | Statements of Assets | ||||||||||||||||
| Fund | Risk | and Liabilities Location | Assets(a) | and Liabilities Location | Liabilities(a) | ||||||||||||
| Equity Index | Equity | Due from broker — variation margin, at value | $ | 48,015 | — | $ | — | ||||||||||
| Government Income | Interest Rate | Due from broker — variation margin, at value | 7,580 | Due to broker — variation margin, at value | (75,287 | ) | |||||||||||
| (a) | Includes unrealized gain (loss) on futures contracts described in the Additional Investment Information sections of the Schedules of Investments. Only current day’s variation margin is reported within the Statements of Assets and Liabilities. |
The following tables set forth, by certain risk types, the Funds’ gains (losses) related to these derivatives and their indicative volumes for the six months ended June 30, 2011. These gains (losses) should be considered in the context that these derivative contracts may have been executed to economically hedge certain securities, and accordingly, certain gains (losses) on such
GOLDMAN SACHS VARIABLE INSURANCE TRUST FUNDS
| 4. INVESTMENTS IN DERIVATIVES (continued) |
derivative contracts may offset certain (losses) gains attributable to securities. These gains (losses) are included in “Net realized gain (loss)” or “Net change in unrealized gain (loss)” on the Statements of Operations:
| Core Fixed Income | |||||||||||||||
| Net Change in | Average | ||||||||||||||
| Net Realized | Unrealized | Number of | |||||||||||||
| Risk | Statements of Operations Location | Gain (Loss) | Gain (Loss) | Contracts(a) | |||||||||||
| Interest rate | Net realized gain (loss) from futures transactions/Net change in unrealized gain (loss) on futures | $ | (111,782 | ) | $ | 232,900 | 213 | ||||||||
| Currency | Net realized gain (loss) from foreign currency related transactions/Net change in unrealized gain (loss) on translation of assets and liabilities denominated in foreign currencies | (242,191 | ) | (75,275 | ) | 150 | |||||||||
Total | $ | (353,973 | ) | $ | 157,625 | 363 | |||||||||
The following table represents gains (losses) which are included in “Net realized gain (loss) from future transactions” and “Net change in unrealized gain (loss) on futures” in the Statements of Operations.
| Net | Net Change in | Average | |||||||||||||
| Realized | Unrealized | Number of | |||||||||||||
| Risk | Fund | Gain (Loss) | Gain (Loss) | Contracts(a) | |||||||||||
| Equity | Equity Index | $ | 115,198 | $ | 35,156 | 22 | |||||||||
| Interest rate | Government Income | (362,654 | ) | 161,242 | 104 | ||||||||||
| (a) | Average number of contracts is based on the average of month end balances for the six months ended June 30, 2011. |
| 5. AGREEMENTS AND AFFILIATED TRANSACTIONS |
A. Management Agreements — Under the Agreements, GSAM manages the Funds, subject to the general supervision of the trustees.
As compensation for the services rendered pursuant to the Agreements, the assumption of the expenses related thereto and administration of the Funds’ business affairs, including providing facilities, GSAM is entitled to a management fee, accrued daily and paid monthly, equal to an annual percentage rate of each Fund’s average daily net assets.
For the six months ended June 30, 2011, contractual and effective net management fees with GSAM were at the following rates:
| Contractual Management Rate | Effective Net | |||||||||||||||||||||||||||
| First | Next | Next | Next | Over | Effective | Management | ||||||||||||||||||||||
| Fund | $1 billion | $1 billion | $3 billion | $3 billion | $8 billion | Rate | Rate | |||||||||||||||||||||
| Core Fixed Income | 0.40 | % | 0.36 | % | 0.34 | % | 0.33 | % | 0.32 | % | 0.40 | % | 0.40 | % | ||||||||||||||
| Government Income | 0.54 | 0.49 | 0.47 | 0.46 | 0.45 | 0.54 | 0.54 | |||||||||||||||||||||
| Growth Opportunities | 1.00 | 1.00 | 0.90 | 0.86 | 0.84 | 1.00 | 1.00 | * | ||||||||||||||||||||
| * | Effective June 30, 2011, GSAM agreed to waive a portion of its management fee in order to achieve an effective net management rate of 0.97% through at least April 29, 2012. Prior to such date GSAM may not terminate the arrangement without the approval of the trustees. |
GOLDMAN SACHS VARIABLE INSURANCE TRUST FUNDS
Notes to Financial Statements (continued)
June 30, 2011 (Unaudited)
| 5. AGREEMENTS AND AFFILIATED TRANSACTIONS (continued) |
The Agreement for the Equity Index Fund provides for a contractual management fee at an annual rate equal to 0.30% of the Fund’s average daily net assets. For the six months ended June 30, 2011, GSAM has agreed to waive a portion of its management fee in order to achieve the following effective annual rates which will remain in effect through at least April 29, 2012 and prior to such date GSAM may not terminate the arrangement without the approval of the trustees:
| Management Rate | ||||||||||
| $0 – $400 million | Over $400 million | Effective Rate | ||||||||
| 0.21 | % | 0.20 | % | 0.21 | % | |||||
As authorized by the Agreement, GSAM has entered into a Sub-advisory Agreement with SSgA which serves as the sub-adviser to the Equity Index Fund and provides the day-to-day advice regarding the Fund’s portfolio transactions. As compensation for its services, SSgA is entitled to a fee, accrued daily and paid monthly by GSAM, at the following annual rates of the Fund’s average daily net assets: 0.03% on the first $50 million, 0.02% on the next $200 million, 0.01% on the next $750 million and 0.008% over $1 billion. The effective Sub-advisory fee was 0.02% for the six months ended June 30, 2011.
B. Distribution and Service Plan — The Trust, on behalf of the Service Shares of the Funds, has adopted a Distribution and Service Plan (the “Plan”). Under the Plan, Goldman Sachs, which serves as distributor, is entitled to a fee accrued daily and paid monthly for distribution services, which may then be paid by Goldman Sachs to authorized dealers, equal to, on an annual basis, 0.25% of the Fund’s average daily net assets attributable to Service Shares. For the Growth Opportunities Fund, Goldman Sachs has agreed to waive distribution and services fees so as not to exceed an annual rate of 0.16% of average daily net assets of the Fund. This distribution and service fee waiver will remain in place through at least April 29, 2012, and prior to such date Goldman Sachs may not terminate the arrangement without the approval of the trustees.
C. Transfer Agency Agreement — Goldman Sachs also serves as the transfer agent of the Funds for a fee pursuant to a Transfer Agency Agreement. The fees charged for such transfer agency services are accrued daily and paid monthly at an annual rate of 0.02% of the average daily net assets of the Funds.
D. Other Expense Agreements and Affiliated Transactions — GSAM has agreed to limit certain “Other Expense” of the Funds (excluding management fees, distribution and service fees, transfer agent fees and expenses, taxes, interest, brokerage fees and litigation, indemnification, shareholder meetings and other extraordinary expenses, exclusive of any custody and transfer agent fee credit reductions) to the extent such expenses exceed, on an annual basis, 0.004% of the average daily net assets of each Fund. Such Other Expense reimbursements, if any, are accrued daily and paid monthly. In addition, the Funds are not obligated to reimburse GSAM for prior fiscal year expense reimbursements, if any. These Other Expense reimbursements will remain in place through at least April 29, 2012, and prior to such date GSAM may not terminate the arrangements without the approval of the trustees.
For the six months ended June 30, 2011, these expense reductions, including any fee waivers and Other Expense reimbursements, were as follows (in thousands):
| Management | Distribution and | Other | Total | |||||||||||||
| Fee | Service Fee | Expense | Expense | |||||||||||||
| Fund | Waiver | Waiver | Reimbursement | Reductions | ||||||||||||
| Core Fixed Income | $ | — | $ | — | $ | 128 | $ | 128 | ||||||||
| Equity Index | 88 | — | 106 | 194 | ||||||||||||
| Government Income | — | — | 112 | 112 | ||||||||||||
| Growth Opportunities | — | * | 70 | 106 | 176 | |||||||||||
| * | Amount is less than $500. |
GOLDMAN SACHS VARIABLE INSURANCE TRUST FUNDS
| 5. AGREEMENTS AND AFFILIATED TRANSACTIONS (continued) |
As of June 30, 2011, the amounts owed to affiliates of the Funds were as follows (in thousands):
| Distribution | Transfer | |||||||||||||||
| Management | and Service | Agent | ||||||||||||||
| Fund | Fees | Fees | Fees | Total | ||||||||||||
| Core Fixed Income | $ | 53 | $ | 33 | $ | 3 | $ | 89 | ||||||||
| Equity Index | 46 | 39 | 3 | 88 | ||||||||||||
| Government Income | 31 | 15 | 1 | 47 | ||||||||||||
| Growth Opportunities | 129 | 21 | 2 | 152 | ||||||||||||
E. Line of Credit Facility — As of June 30, 2011, the Funds participated in a $580,000,000 committed, unsecured revolving line of credit facility (the “facility”) together with other funds of the Trust and registered investment companies having management agreements with GSAM or its affiliates. Pursuant to the terms of the facility, the Funds and other borrowers could increase the credit amount by an additional $340,000,000, for a total of up to $920,000,000. This facility is to be used solely for temporary or emergency purposes. The interest rate on borrowings is based on the federal funds rate. The facility also requires a fee to be paid by the Funds based on the amount of the commitment that has not been utilized. For the six months ended June 30, 2011, the Funds did not have any borrowings under the facility.
| 6. PORTFOLIO SECURITIES TRANSACTIONS |
The cost of purchases and proceeds from sales and maturities of long-term securities for the six months ended June 30, 2011, were as follows:
| Sales and | ||||||||||||||||
| Purchases | Sales and | Maturities | ||||||||||||||
| Purchases of U.S. | (Excluding U.S. | Maturities of U.S. | (Excluding U.S. | |||||||||||||
| Government and | Government and | Government and | Government and | |||||||||||||
| Fund | Agency Obligations | Agency Obligations) | Agency Obligations | Agency Obligations) | ||||||||||||
| Core Fixed Income | $ | 458,663,319 | $ | 33,426,012 | $ | 473,374,407 | $ | 34,571,650 | ||||||||
| Equity Index | — | 2,180,877 | — | 14,441,786 | ||||||||||||
| Government Income | 308,809,062 | 3,593,930 | 320,343,811 | 272,458 | ||||||||||||
| Growth Opportunities | — | 46,558,515 | — | 34,897,793 | ||||||||||||
GOLDMAN SACHS VARIABLE INSURANCE TRUST FUNDS
Notes to Financial Statements (continued)
June 30, 2011 (Unaudited)
| 7. TAX INFORMATION |
As of the Funds’ most recent fiscal year end, December 31, 2010, the Funds’ capital loss carryforwards on a tax-basis were as follows:
| Core Fixed | Equity | Government | Growth | |||||||||||||
| Income | Index | Income | Opportunities | |||||||||||||
Capital loss carryforward: (1) | ||||||||||||||||
| Expiring 2011 | — | (8,097,717 | ) | — | — | |||||||||||
| Expiring 2012 | — | (2,961,297 | ) | — | — | |||||||||||
| Expiring 2014 | (4,813,823 | ) | — | — | — | |||||||||||
| Expiring 2017 | (5,634,986 | ) | (4,133,732 | ) | — | (5,903,029 | ) | |||||||||
| Expiring 2018 | (4,488,774 | ) | — | — | — | |||||||||||
| Total capital loss carryforward | $ | (14,937,583 | ) | $ | (15,192,746 | ) | $ | — | $ | (5,903,029 | ) | |||||
| (1) | Expiration occurs on December 31 of the year indicated. |
As of June 30, 2011, the Funds’ aggregate security unrealized gains and losses based on cost for U.S. federal income tax purposes were as follows:
| Core Fixed | Equity | Government | Growth | |||||||||||||
| Income | Index | Income | Opportunities | |||||||||||||
| Tax cost | $ | 184,987,660 | $ | 172,607,606 | $ | 89,100,626 | $ | 138,448,377 | ||||||||
| Gross unrealized gain | 4,182,364 | 57,367,307 | 733,566 | 29,912,700 | ||||||||||||
| Gross unrealized loss | (2,293,421 | ) | (39,145,990 | ) | (670,978 | ) | (6,050,362 | ) | ||||||||
| Net unrealized security gain | $ | 1,888,943 | $ | 18,221,317 | 62,588 | 23,862,338 | ||||||||||
The difference between GAAP-basis and tax-basis unrealized gains (losses), as of the most recent fiscal year end, is attributable primarily to wash sales, net mark to market gains (losses) on regulated futures and forward foreign currency exchange contracts and differences related to the tax treatment of underlying fun investments.
GSAM has reviewed the Funds’ tax positions for all open tax years (the current and prior three years, as applicable) and has concluded that no provision for income tax is required in the Funds’ financial statements. Such open tax years remain subject to examination and adjustment by tax authorities.
Under the recently enacted Regulated Investment Company Modernization Act of 2010, the Funds will be permitted to carry forward capital losses incurred in taxable years beginning after December 22, 2010 for an unlimited period. However, any losses incurred during those future taxable years will be required to be utilized prior to the losses incurred in pre-enactment taxable years. As a result of this ordering rule, pre-enactment capital loss carryforwards may be more likely to expire unused. Additionally, post-enactment capital losses that are carried forward will retain their character as either short-term or long-term capital losses rather than being considered all short-term as under previous law.
| 8. OTHER RISKS |
Funds’ Shareholder Concentration Risk — Certain participating insurance companies, accounts, or Goldman Sachs affiliates may from time to time own (beneficially or of record) or control a significant percentage of the Funds’ shares. Redemptions by these entities of their holdings in the Funds may impact the Funds’ liquidity and NAV. These redemptions may also force the Funds to sell securities.
Liquidity Risk — The Funds may make investments that may be illiquid or that may become less liquid in response to market developments or adverse investor perceptions. Liquidity risk may also refer to the risk that a Fund will not be able to pay
GOLDMAN SACHS VARIABLE INSURANCE TRUST FUNDS
| 8. OTHER RISKS (continued) |
redemption proceeds within the allowable time period because of unusual market conditions, an unusually high volume of redemption requests, or other reasons. To meet redemption requests, a Fund may be forced to sell investments at an unfavorable time and/or under unfavorable conditions.
Market and Credit Risks — In the normal course of business, the Funds trade financial instruments and enter into financial transactions where risk of potential loss exists due to changes in the market (market risk). Additionally, the Funds may also be exposed to credit risk in the event that an issuer fails to perform or that an institution or entity with which the Funds have unsettled or open transaction defaults.
| 9. INDEMNIFICATIONS |
Under the Trust’s organizational documents, its trustees, officers, employees and agents are indemnified, to the extent permitted by the Act, against certain liabilities that may arise out of performance of their duties to the Funds. Additionally, in the course of business, the Funds enter into contracts that contain a variety of indemnification clauses. The Funds’ maximum exposure under these arrangements is unknown, as this would involve future claims that may be made against the Funds that have not yet occurred. However, GSAM believes the risk of loss under these arrangements to be remote.
| 10. SUBSEQUENT EVENTS |
Subsequent events after the balance sheet date have been evaluated through the date the financial statements were issued. GSAM has concluded that there is no impact requiring adjustment or disclosure in the financial statements.
GOLDMAN SACHS VARIABLE INSURANCE TRUST FUND
Statement Regarding Basis for Approval of Management Agreements (Unaudited)
Background
The Goldman Sachs Core Fixed Income, Goldman Sachs Government Income, Goldman Sachs Growth Opportunities and Goldman Sachs Equity Index Funds (the “Funds”) are investment portfolios of Goldman Sachs Variable Insurance Trust (the “Trust”). The Board of Trustees oversees the management of the Trust and reviews the investment performance and expenses of the Funds at regularly scheduled meetings held during the year. In addition, the Board of Trustees determines annually whether to approve the continuance of the Trust’s investment management agreements (the “Management Agreements”) with Goldman Sachs Asset Management, L.P. (the “Investment Adviser”) on behalf of the Funds and the sub-advisory agreement (the “Sub-Advisory Agreement”, and together with the Management Agreements, the “Agreements”) between the Investment Adviser and SSgA Funds Management, Inc. (the “Sub-Adviser”) on behalf of the Equity Index Fund.
The Agreements were most recently approved for continuation until June 30, 2012 by the Board of Trustees, including those Trustees who are not parties to the Agreements or “interested persons” (as defined in the Investment Company Act of 1940, as amended) of any party thereto (the “Independent Trustees”), at a meeting held on June 15-16, 2011 (the “Annual Meeting”).
The review process undertaken by the Trustees spans the course of the year and culminates with the Annual Meeting. To assist the Trustees in their deliberations, the Trustees have established a Contract Review Committee (the “Committee”), comprised of the Independent Trustees. The Committee held three meetings over the course of the year since the Agreements were last approved. At those Committee meetings, regularly scheduled Board meetings and/or the Annual Meeting, the Board, or the Independent Trustees, as applicable, considered matters relating to the Management Agreements, including:
| (a) | the nature and quality of the advisory, administrative and other services provided to the Funds by the Investment Adviser and its affiliates, including information about: |
| (i) | the structure, staff and capabilities of the Investment Adviser and its portfolio management teams; | |
| (ii) | the groups within the Investment Adviser and its affiliates that support the portfolio management teams or provide other types of necessary services, including fund services groups (e.g., accounting and financial reporting, tax, shareholder services and operations), controls and risk management groups (e.g., legal, compliance, valuation oversight, credit risk management, internal audit, market risk analysis, finance and strategy and central funding), sales and distribution support groups and others (e.g., information technology and training); | |
| (iii) | trends in headcount; | |
| (iv) | the Investment Adviser’s financial resources and ability to hire and retain talented personnel and strengthen its operations; and | |
| (v) | the parent company’s support of the Investment Adviser and its mutual fund business, as expressed by the firm’s senior management; |
| (b) | information on the investment performance of the Funds, including comparisons to the performance of similar mutual funds, as provided by a third party mutual fund data provider engaged as part of the contract review process (the “Outside Data Provider”), benchmark performance indices, (for Growth Opportunities and Core Fixed Income Funds) comparable institutional composites managed by the Investment Adviser, and general investment outlooks in the markets in which the Funds invest; | |
| (c) | the terms of the Management Agreements and agreements with affiliated service providers entered into by the Trust on behalf of the Funds; | |
| (d) | expense information for the Funds, including: |
| (i) | the relative management fee and expense levels of the Funds as compared to those of comparable funds managed by other advisers, as provided by the Outside Data Provider; | |
| (ii) | each Fund’s expense trends over time; and | |
| (iii) | to the extent the Investment Adviser manages institutional accounts or collective investment vehicles having investment objectives and policies similar to those of the Funds, comparative information on the advisory fees charged and services provided to those accounts by the Investment Adviser; |
| (e) | with respect to the extensive investment performance and expense comparison data provided by the Outside Data Provider, its processes in producing that data for the Funds; |
GOLDMAN SACHS VARIABLE INSURANCE TRUST FUND
Statement Regarding Basis for Approval of Management Agreements (Unaudited) (continued)
| (f) | the undertakings of the Investment Adviser to waive certain fees (with respect to the Equity Index Fund and Growth Opportunities Fund) and reimburse certain expenses of each of the Funds that exceed specified levels; the undertaking of Goldman, Sachs & Co. (“Goldman Sachs”), the Funds’ distributor, to waive a portion of the distribution and service fees paid by the Growth Opportunities Fund; and a summary of contractual fee reductions made by the Investment Adviser and its affiliates over the past several years with respect to the Funds; | |
| (g) | information relating to the profitability of the Management Agreements and the transfer agency and distribution and service arrangements of each of the Funds and the Trust as a whole to the Investment Adviser and its affiliates; | |
| (h) | whether each Fund’s existing management fee schedule adequately addressed any economies of scale; | |
| (i) | a summary of the “fall-out” benefits derived by the Investment Adviser and its affiliates from their relationships with the Funds, including the fees received by the Investment Adviser’s affiliates from the Funds for transfer agency, portfolio brokerage (in the case of the Growth Opportunities and Equity Index Funds (the “Equity Funds”)), distribution and other services; | |
| (j) | a summary of potential benefits derived by the Funds as a result of their relationship with the Investment Adviser; | |
| (k) | information regarding commissions paid by the Equity Funds, an update on the Investment Adviser’s soft dollars practices (in the case of the Growth Opportunities Fund) and other information regarding portfolio trading and how the Investment Adviser carries out its duty to seek best execution; | |
| (l) | the manner in which portfolio manager compensation is determined, and the number and types of accounts managed by the portfolio managers; | |
| (m) | the nature and quality of the services provided to the Funds by their unaffiliated service providers (including the Equity Index Fund’s Sub-Adviser), and the Investment Adviser’s general oversight and evaluation (including reports on due diligence) of those service providers as part of the administration services provided under the Management Agreements; and | |
| (n) | the Investment Adviser’s processes and policies addressing various types of potential conflicts of interest; its approach to risk management; the annual review of the effectiveness of the Funds’ compliance program; and compliance reports. |
The Trustees also received an overview of the Funds’ distribution arrangements. They received information regarding the Funds’ assets, share purchase and redemption activity and the payment of Rule 12b-1 distribution and service fees by the Funds. Information was also provided to the Trustees relating to revenue sharing payments made by and services provided by the Investment Adviser and its affiliates to intermediaries that promote the sale, distribution and/or servicing of Fund shares.
The presentations made at the Board and Committee meetings and at the Annual Meeting encompassed the Funds and other mutual fund portfolios for which the Board of Trustees has responsibility. In evaluating the Management Agreements at the Annual Meeting, the Trustees relied upon their knowledge, resulting from their meetings and other interactions throughout the year, of the Investment Adviser, its affiliates, their services and the Funds. In conjunction with these meetings, the Trustees received written materials and oral presentations on the topics covered, and were advised by their independent legal counsel regarding their responsibilities and other regulatory requirements related to the approval and continuation of mutual fund investment management agreements under applicable law. In addition, the Investment Adviser and its affiliates provided the Independent Trustees with a written response to a formal request for information sent on behalf of the Independent Trustees by their independent legal counsel. During the course of their deliberations, the Independent Trustees met in executive sessions with their independent legal counsel, without representatives of the Investment Adviser or its affiliates present. The Independent Trustees also discussed the broad range of other investment choices that are available to Fund investors, including the availability of comparable funds managed by other advisers.
Nature, Extent and Quality of the Services Provided Under the Management Agreements
As part of their review, the Trustees considered the nature, extent and quality of the services provided by the Investment Adviser. In this regard, the Trustees considered both the investment advisory services, and the other, non-advisory services (including, with respect to the Equity Index Fund, the Investment Adviser’s oversight of the Sub-Adviser), that are provided to the Funds by the Investment Adviser and its affiliates. The Trustees noted the transition in the leadership and changes in personnel of various portfolio management teams, including the portfolio management team managing the Core Fixed Income and Government Income Funds (the “Fixed Income Funds”), that had occurred in recent periods, the potential benefit to the Funds of recent increases in headcount at the Investment Adviser and the ongoing recruitment efforts aimed at bringing high quality investment talent to the Investment Adviser. The Independent Trustees concluded that the Investment Adviser had committed substantial financial and operational resources to the Funds and expressed confidence that the Investment Adviser would continue to do so in the future. The Trustees also observed that the Investment Adviser had made significant commitments to address regulatory compliance requirements applicable to the Funds and the Investment Adviser.
GOLDMAN SACHS VARIABLE INSURANCE TRUST FUND
Statement Regarding Basis for Approval of Management Agreements (Unaudited) (continued)
Investment Performance
The Trustees also considered the investment performance of the Funds and the Investment Adviser. In this regard, they compared the Funds to their peers using rankings and ratings compiled by the Outside Data Provider as of December 31, 2010, and updated performance information prepared by the Investment Adviser using the peer groups identified by the Outside Data provider. The information on each Fund’s investment performance was provided for the one-, three- and five-year periods ending on the applicable dates. The Trustees also reviewed each Fund’s investment performance over time on a year-by-year basis relative to its performance benchmark. In addition, they considered the investment performance trends of the Funds over time, and reviewed the investment performance of each Fund in light of its investment objective and policies and market conditions (and credit and duration parameters in the case of the Fixed Income Funds). The Trustees also received information comparing the Growth Opportunities and Core Fixed Income Funds’ performance to that of a comparable institutional composite managed by the Investment Adviser. The Trustees considered whether each Fund had operated within its investment policies and had complied with its investment limitations.
In addition, the Trustees considered materials prepared and presentations made by the Investment Adviser’s senior management and portfolio management personnel, in which Fund performance was assessed. The Trustees also considered the Investment Adviser’s periodic reports with respect to the Funds’ risk profiles, and how the Investment Adviser’s approach to risk monitoring and management influences portfolio management.
The Independent Trustees noted that for the one-year period ended May 31, 2011, the Core Fixed Income Fund had outperformed its benchmark index, but had ranked in the bottom half of its peer group. They also noted that the Government Income Fund ranked in the bottom half of its peer group and had underperformed its benchmark index for the one-year period ended May 31, 2011. The Independent Trustees observed that both of the Fixed Income Funds had performance for multiple time periods that was in the bottom half of their respective peer groups, and that they had communicated their concerns to the Investment Adviser’s senior management. The Independent Trustees also noted that they had received assurances from the Investment Adviser’s senior management that measures would continue to be taken to address the Fixed Income Funds’ performance.
The Independent Trustees noted that for the one-year period ended May 31, 2011, the Growth Opportunities Fund ranked in the bottom half of its peer group, and had underperformed its benchmark index during that period. The Independent Trustees also noted that the Growth Opportunities Fund had ranked in the top half of its peer group for the three- and five-year periods ended May 31, 2011. The Independent Trustees observed that they had communicated their concerns regarding the recent performance of the Growth Opportunities Fund to the Investment Adviser’s senior management and had received assurances that measures would be taken to address the Fund’s performance.
The Independent Trustees noted that for the one-, three- and five-year periods ended May 31, 2011, the Equity Index Fund ranked in the top half of its peer group. They also noted that the Equity Index Fund had underperformed its benchmark index for the one-year period ended May 31, 2011 by an amount less than Fund expenses.
Costs of Services Provided and Competitive Information
The Trustees considered the contractual fee rates payable by each Fund under its respective Management Agreement and payable by the Investment Adviser under the Sub-Advisory Agreement. In this regard, the Trustees considered information on the services rendered by the Investment Adviser to the Funds, which included both advisory and administrative services that were directed to the needs and operations of the Funds as registered mutual funds.
In particular, the Trustees reviewed analyses prepared by the Outside Data Provider regarding the expense rankings of the Funds. The analyses provided a comparison of the Funds’ management fees and breakpoints (as applicable) to those of relevant peer groups and category universes; an expense analysis which compared each Fund’s expenses to a peer group and a category universe; and a five-year history comparing each Fund’s expenses to the peer and category medians. The analyses also compared each Fund’s transfer agency fees, custody and accounting fees, distribution fees, other expenses and fee waivers/reimbursements to those of other funds in the peer group and the peer group median. The Trustees concluded that the comparisons provided by the Outside Data Provider were useful in evaluating the reasonableness of the management fees and total expenses paid by the Funds.
In addition, the Trustees considered the Investment Adviser’s undertakings to limit the Funds’ “other expenses” ratios (excluding certain expenses) to certain specified levels and to waive a portion of the contractual management fees paid by the Equity Index Fund and Growth Opportunities Fund, as well as Goldman Sachs’ undertaking to waive a portion of the distribution and service fees paid by the Growth Opportunities Fund’s Service Shares. They also considered, to the extent that the Investment Adviser manages institutional accounts or collective investment vehicles having investment objectives and policies similar to those of the Funds, comparative fee information for services provided by the Investment Adviser to those accounts, and information that indicated that services provided to the Funds differed in various significant respects from the services provided to institutional accounts, which generally operated under less stringent legal and regulatory structures, required fewer services from the
GOLDMAN SACHS VARIABLE INSURANCE TRUST FUND
Statement Regarding Basis for Approval of Management Agreements (Unaudited) (continued)
Investment Adviser to a smaller number of client contact points, were less time-intensive and paid lower fees. By contrast, the Trustees noted that the Investment Adviser provides substantial administrative services to the Funds under the terms of the Management Agreements.
In addition, the Trustees noted that shareholders are able to redeem their Fund shares at any time if they believe that the Fund fees and expenses are too high or if they are dissatisfied with the performance of the Fund.
Profitability
The Trustees reviewed the Investment Adviser’s revenues and pre-tax profit margins with respect to the Trust and each of the Funds. In this regard the Trustees noted that they had received, among other things, profitability analyses and summaries, revenue and expense schedules by Fund and by function (i.e., investment management, transfer agency and distribution and service) and the Investment Adviser’s expense allocation methodology. They observed that the profitability and expense figures are substantially similar to those used by the Investment Adviser for many internal purposes, including compensation decisions among various business groups, and are thus subject to a vigorous internal debate about how certain revenue and expenses should be allocated. The Trustees also reviewed the report of the internal audit group within the Goldman Sachs organization, which included an assessment of the reasonableness and consistency of the Investment Adviser’s expense allocation methodology and an evaluation of the accuracy of the Investment Adviser’s profitability analysis calculations. Profitability data for the Trust and each Fund were provided for 2010 and 2009, and the Trustees considered this information in relation to the Investment Adviser’s overall profitability. The Trustees considered the Investment Adviser’s revenues and pre-tax profit margins both in absolute terms and in comparison to information on the reported pre-tax profit margins earned by certain other asset management firms.
Economies of Scale
The Trustees considered the information that had been provided regarding the Investment Adviser’s profitability and (as applicable) the rationale for the Funds’ breakpoint structure. The Trustees also considered the breakpoints in the fee rate payable under the Management Agreement for the Core Fixed Income, Government Income and Growth Opportunities Funds at the following annual percentage rates of the average daily net assets of the Funds:
| Core Fixed | Government | Growth | ||||||||||
| Income | Income | Opportunities | ||||||||||
| Fund | Fund | Fund | ||||||||||
| First $1 billion | 0.40 | % | 0.54 | % | 1.00 | % | ||||||
| Next $1 billion | 0.36 | 0.49 | 1.00 | |||||||||
| Next $3 billion | 0.34 | 0.47 | 0.90 | |||||||||
| Next $3 billion | 0.33 | 0.46 | 0.86 | |||||||||
| Over $8 billion | 0.32 | 0.45 | 0.84 | |||||||||
The Trustees noted that the breakpoints at the $5 and $8 billion asset levels had been proposed by the Investment Adviser and approved by the Trustees in 2008 to further share potential economies of scale, if any, with the Funds and their shareholders as assets under management reach those asset levels. The Trustees considered the amounts of assets in the Funds; the Funds’ recent share purchase and redemption activity; the information provided by the Investment Adviser relating to the costs of the services provided by the Investment Adviser and its affiliates and their realized profits; information comparing fee rates charged by the Investment Adviser with fee rates charged to other funds in the peer group; and the Investment Adviser’s undertakings to limit fees (with respect to the Growth Opportunities Fund) and “other expenses” ratios (excluding certain expenses) (with respect to all of the Funds) to certain amounts. Upon reviewing these matters at the Annual Meeting, the Trustees concluded that the fee breakpoints represented a means of assuring that benefits of scalability would be passed along to shareholders at the specified asset levels.
With respect to the Equity Index Fund, the Trustees noted that while its Management Agreement did not have breakpoints, the Investment Adviser had agreed to waive fees in order to achieve the following effective annual rates: 0.21% on the first $400 million of average daily net assets and 0.20% of average daily net assets in excess of $400 million. The Trustees considered the amounts of assets in the Fund; the Fund’s recent share purchase and redemption activity; the information provided by the Investment Adviser relating to the costs of the services provided by the Investment Adviser and its affiliates and their realized profits; and information comparing the contractual fee rate charged by the Investment Adviser with fee rates charged by other, unaffiliated investment managers to other variable annuity equity index funds. The Trustees noted that, in relation to the Investment Adviser’s management fee waiver mentioned above, the fees actually paid by the Fund were reduced by the Investment Adviser’s undertaking to limit the “other expenses” ratio (excluding certain expenses) to a certain amount.
GOLDMAN SACHS VARIABLE INSURANCE TRUST FUND
Statement Regarding Basis for Approval of Management Agreements (Unaudited) (continued)
The Trustees also considered and approved the following breakpoints in the contractual fee rate (paid by the Investment Adviser) in the Sub-Advisory Agreement:
| Equity Index Fund | ||||
| (Sub-Advisory Fee) | ||||
| First $50 million | 0.03 | % | ||
| Next $200 million | 0.02 | |||
| Next $750 million | 0.01 | |||
| Over $1 billion | 0.008 | |||
Other Benefits to the Investment Adviser and Its Affiliates
The Trustees also considered the other benefits derived by the Investment Adviser and its affiliates from their relationship with the Funds as stated above, including: (a) transfer agency fees received by Goldman Sachs; (b) brokerage and futures commissions earned by Goldman Sachs for executing securities transactions (on behalf of the Equity Funds) and futures transactions (on behalf of all of the Funds); (c) research received by the Investment Adviser from broker-dealers in exchange for executing certain transactions (on behalf of the Growth Opportunities Fund); (d) trading efficiencies resulting from aggregation of orders of the Funds with those for other funds or accounts managed by the Investment Adviser; (e) the Investment Adviser’s ability to leverage the infrastructure designed to service the Funds on behalf of its other clients; (f) the Investment Adviser’s ability to cross-market other products and services to Fund shareholders; (g) Goldman Sachs’ retention of certain fees as Fund Distributor; (h) the Investment Adviser’s ability to negotiate better pricing with custodians on behalf of its other clients, as a result of the relationship with the Funds; and (i) the possibility that the working relationship between the Investment Adviser and the Funds’ third party service providers may cause those service providers to be open to doing business with other areas of Goldman Sachs. In the course of considering the foregoing, the Independent Trustees requested and received further information quantifying certain of the fall-out benefits.
Other Benefits to the Funds and Their Shareholders
The Trustees also noted that the Funds receive certain potential benefits as a result of their relationship with the Investment Adviser, including: (a) trading efficiencies resulting from aggregation of orders of the Funds with those of other funds or accounts managed by the Investment Adviser; (b) improved servicing and pricing from vendors because of the volume of business generated by the Investment Adviser and its affiliates; (c) improved servicing from broker-dealers because of the volume of business generated by the Investment Adviser and its affiliates; (d) the Investment Adviser’s ability to negotiate favorable terms with derivatives counterparties as a result of the size and reputation of the Goldman Sachs organization; (e) the advantages gained from the Investment Adviser’s knowledge and experience gained from managing other accounts and products; (f) the Investment Adviser’s ability to hire and retain qualified personnel to provide services to the Funds because of the reputation of the Goldman Sachs organization; (g) the Funds’ access, through the Investment Adviser, to certain firmwide resources (e.g., proprietary databases); and (h) the Funds’ access to certain affiliated distribution channels. The Trustees noted the competitive nature of the mutual fund marketplace, and noted further that many of the Funds’ shareholders invested in the Funds in part because of the Funds’ relationship with the Investment Adviser and that those shareholders have a general expectation that the relationship will continue.
Approval of Sub-Advisory Agreement
The Trustees concluded that the Sub-Advisory Agreement with respect to the Equity Index Fund should be continued and approved. In reaching this determination, they relied on the information provided by the Investment Adviser and the Sub-Adviser. The Trustees noted that the Fund commenced operations in January 2006, and reviewed the Fund’s operations and investment performance since then. The Trustees reviewed the respective services provided to the Fund by the Investment Adviser under its Management Agreement and by the Sub-Adviser under its Sub-Advisory Agreement. They considered the Sub-Adviser’s strong record in tracking the performance of the Fund’s benchmark, in accordance with the investment objective of the Fund. They also considered the Sub-Adviser’s experience in index investing and its compliance policies and procedures and code of ethics. They considered the contractual management fee rate received by the Sub-Adviser (along with the breakpoints in the fee schedule) and noted that the compensation paid to the Sub-Adviser was paid by the Investment Adviser, not by the Fund, and that the retention of the Sub-Adviser does not increase the fees incurred by the Fund for advisory services. After deliberation and consideration of the information provided, the Trustees unanimously concluded that the sub-advisory fee to be paid by the Investment Adviser to the Sub-Adviser with respect to the Equity Index Fund was reasonable in light of the services provided by the Sub-Adviser and the Fund’s current and reasonably foreseeable asset levels; that the Sub-Adviser’s continued management would likely benefit the Equity Index Fund and its shareholders; and that the Sub-Advisory Agreement should be approved and continued until June 30, 2012.
GOLDMAN SACHS VARIABLE INSURANCE TRUST FUND
Statement Regarding Basis for Approval of Management Agreements (Unaudited) (continued)
Conclusion
In connection with their consideration of the Management Agreements, the Trustees gave weight to each of the factors described above, but did not identify any particular factor as controlling their decision. After deliberation and consideration of all of the information provided, including the factors described above, the Trustees concluded, in the exercise of their business judgment, that the management fees paid by each of the Funds were reasonable in light of the services provided to it by the Investment Adviser, the Investment Adviser’s costs and each Fund’s current and reasonably foreseeable asset levels. The Trustees unanimously concluded that the Investment Adviser’s continued management likely would benefit each Fund and its shareholders and that the Management Agreements should be approved and continued with respect to each applicable Fund until June 30, 2012.
GOLDMAN SACHS VARIABLE INSURANCE TRUST FUNDS
Fund Expenses — Six Month Period Ended June 30, 2011 (Unaudited)
As a shareholder of the Service Shares of the Funds, you incur ongoing costs, including management fees; distribution and service (12b-1) fees; and other Fund expenses. This example is intended to help you understand your ongoing costs (in dollars) of investing in the Funds and to compare these costs with the ongoing costs of investing in other mutual funds.
The example is based on an investment of $1,000 invested at the beginning of the period and held for the entire period from January 1, 2011 through June 30, 2011.
Actual Expenses — The first line under each share class in the table below provides information about actual account values and actual expenses. You may use the information in this line, together with the amount you invested, to estimate the expenses that you paid over the period. Simply divide your account value by $1,000 (for example, an $8,600 account value divided by $1,000 = 8.6), then multiply the result by the number in the first line under the heading “Expenses Paid” to estimate the expenses you paid on your account during this period.
Hypothetical Example for Comparison Purposes — The second line under each share class in the table below provides information about hypothetical account values and hypothetical expenses based on the Funds’ actual net expense ratio and an assumed rate of return of 5% per year before expenses, which is not the Funds’ actual return. The hypothetical account values and expenses may not be used to estimate the actual ending account balance or expenses you paid for the period. You may use this information to compare the ongoing costs of investing in the Funds and other funds. To do so, compare this 5% hypothetical example with the 5% hypothetical examples that appear in the shareholder reports of the other funds.
Please note that the expenses shown in the table are meant to highlight your ongoing costs only. As a shareholder of the Funds, you do not incur any transaction costs, such as sales charges (loads), redemption fees, or exchange fees, but shareholders of other funds may incur such costs. The second line of the table is useful in comparing ongoing costs only, and will not help you determine the relative total costs of owning different funds whose shareholders may incur transaction costs.
| Core Fixed Income Fund | Equity Index Fund | Government Income Fund | Growth Opportunities Fund | |||||||||||||||||||||||||||||||||||||||||||||||||||||||||
| Beginning | Ending | Expenses | Beginning | Ending | Expenses | Beginning | Ending | Expenses | Beginning | Ending | Expenses | |||||||||||||||||||||||||||||||||||||||||||||||||
| Account | Account | Paid for the | Account | Account | Paid for the | Account | Account | Paid for the | Account | Account | Paid for the | |||||||||||||||||||||||||||||||||||||||||||||||||
| Value | Value | 6 Months Ended | Value | Value | 6 Months Ended | Value | Value | 6 Months Ended | Value | Value | 6 Months Ended | |||||||||||||||||||||||||||||||||||||||||||||||||
| 1/01/11 | 6/30/11 | 6/30/11* | 1/01/11 | 6/30/11 | 6/30/11* | 1/01/11 | 6/30/11 | 6/30/11* | 1/01/11 | 6/30/11 | 6/30/11* | |||||||||||||||||||||||||||||||||||||||||||||||||
| Actual | $ | 1,000 | $ | 1,026.50 | $ | 3.37 | $ | 1,000 | $ | 1,059.20 | $ | 2.45 | $ | 1,000 | $ | 1,018.20 | $ | 4.05 | $ | 1,000 | $ | 1,041.70 | $ | 5.97 | ||||||||||||||||||||||||||||||||||||
| Hypothetical 5% return | 1,000 | 1,021.47 | + | 3.36 | 1,000 | 1,022.41 | + | 2.41 | 1,000 | 1,020.78 | + | 4.06 | 1,000 | 1,018.94 | + | 5.91 | ||||||||||||||||||||||||||||||||||||||||||||
| * | Expenses are calculated using each Fund’s annualized net expense ratio for each class, which represents the ongoing expenses as a percentage of net assets for the six months ended June 30, 2011. Expenses are calculated by multiplying the annualized net expense ratio by the average account value for the period; then multiplying the result by the number of days in the most recent fiscal half year; and then dividing that result by the number of days in the fiscal year. The annualized net expense ratios for the period were as follows: |
| Fund | Service | |||
| Core Fixed Income | 0.67 | % | ||
| Equity Index | 0.48 | |||
| Government Income | 0.81 | |||
| Growth Opportunities | 1.18 | |||
| + | Hypothetical expenses are based on each Fund’s actual annualized net expense ratios and an assumed rate of return of 5% per year before expenses. |
68
| TRUSTEES | OFFICERS | |
Ashok N. Bakhru, Chairman | James A. McNamara, President | |
| Donald C. Burke | George F. Travers, Principal Financial Officer | |
| John P. Coblentz, Jr. | Peter V. Bonanno, Secretary | |
| Diana M. Daniels | Scott M. McHugh, Treasurer | |
| Joseph P. LaRusso | ||
| James A. McNamara | ||
| Jessica Palmer | ||
| Alan A. Shuch | ||
| Richard P. Strubel |
| GOLDMAN, SACHS & CO. Distributor and Transfer Agent | ||
| GOLDMAN SACHS ASSET MANAGEMENT, L.P. Investment Adviser | ||
| 200 West Street, New York, New York 10282 | ||
| Visit our website at www.goldmansachsfunds.com/vit to obtain the most recent month-end returns. | ||
| The reports concerning the Funds included in this shareholder report may contain certain forward-looking statements about the factors that may affect the performance of the Funds in the future. These statements are based on Fund management’s predictions and expectations concerning certain future events and their expected impact on the Funds, such as performance of the economy as a whole and of specific industry sectors, changes in the levels of interest rates, the impact of developing world events, and other factors that may influence the future performance of the Funds. Management believes these forward-looking statements to be reasonable, although they are inherently uncertain and difficult to predict. Actual events may cause adjustments in portfolio management strategies from those currently expected to be employed. | ||
| A description of the policies and procedures that the Funds use to determine how to vote proxies relating to portfolio securities and information regarding how the Funds voted proxies relating to portfolio securities during the most recent 12-month period ended June 30 is available (i) without charge, upon request by calling 1-800-621-2550; and (ii) on the Securities and Exchange Commission (“SEC”) website at http://www.sec.gov. | ||
| The Funds file their complete schedule of portfolio holdings with the SEC for the first and third quarters of each fiscal year on Form N-Q. The Funds’ Forms N-Q are available on the SEC’s website at http://www.sec.gov within 60 days after the Funds’ first and third fiscal quarters. When available, the Funds’ Forms N-Q may be reviewed and copied at the SEC’s Public Reference Room in Washington, D.C. and information on the operation of the Public Reference Room may also be obtained by calling 1-800-SEC-0330. Forms N-Q may be obtained upon request and without charge by calling 1-800-621-2550. | ||
| Holdings and allocations shown may not be representative of current or future investments. Holdings and allocations may not include the Funds’ entire investment portfolio, which may change at any time. Fund holdings should not be relied on in making investment decisions and should not be construed as research or investment advice regarding particular securities. | ||
| Economic and market forecasts presented herein reflect our judgment as of the date of this presentation and are subject to change without notice. These forecasts do not take into account the specific investment objectives, restrictions, tax and financial situation or other needs of any specific client. Actual data will vary and may not be reflected here. These forecasts are subject to high levels of uncertainty that may affect actual performance. Accordingly, these forecasts should be viewed as merely representative of a broad range of possible outcomes. These forecasts are estimated, based on assumptions, and are subject to significant revision and may change materially as economic and market conditions change. Goldman Sachs has no obligation to provide updates or changes to these forecasts. Case studies and examples are for illustrative purposes only. | ||
| The Global Industry Classification Standard (“GICS”) was developed by and is the exclusive property and a service mark of Morgan Stanley Capital International Inc. (“MSCI”) and Standard & Poor’s, a division of The McGraw-Hill Companies, Inc. (“S&P”) and is licensed for use by Goldman Sachs. Neither MSCI, S&P nor any other party involved in making or compiling the GICS or any GICS classifications makes any express or implied warranties or representations with respect to such standard or classification (or the results to be obtained by the use thereof), and all such parties hereby expressly disclaim all warranties of originality, accuracy, completeness, merchantability or fitness for a particular purpose with respect to any of such standard or classification. Without limiting any of the foregoing, in no event shall MSCI, S&P, any of their affiliates or any third party involved in making or compiling the GICS or any GICS classifications have any liability for any direct, indirect, special, punitive, consequential or any other damages (including lost profits) even if notified of the possibility of such damages. | ||
| The portfolio risk management process includes an effort to monitor and manage risk, but does not imply low risk. | ||
| Shares of the Goldman Sachs VIT Funds are offered to separate accounts of participating life insurance companies for the purpose of funding variable annuity contracts and variable life insurance policies. Shares of the Fund are not offered directly to the general public. The variable annuity contracts and variable life insurance policies are described in the separate prospectuses issued by participating insurance companies. You should refer to those prospectuses for information about surrender charges, mortality and expense risk fees and other charges that may be assessed by participating insurance companies under the variable annuity contracts or variable life insurance policies. Such fees or charges, if any, may affect the return you may realize with respect to your investments. Ask your representative for more complete information. Please consider a fund’s objectives, risks and charges and expenses, and read the prospectus carefully before investing. The prospectus contains this and other information about the Fund. | ||
| This material is not authorized for distribution to prospective investors unless preceded or accompanied by a current Prospectus or summary prospectus, if applicable. Investors should consider a Fund’s objective, risks, and charges and expenses, and read the summary prospectus, if available, and/or the Prospectus carefully before investing or sending money. The summary prospectus, if available, and the Prospectus contain this and other information about a Fund and may be obtained from your authorized dealer or from Goldman, Sachs & Co. by calling 1-800-621-2550. | ||
| Toll Free (in U.S.): 800-292-4726 | ||
| This report is prepared for the general information of contract owners and is not an offer of shares of the Goldman Sachs Variable Insurance Trust Funds. | ||
| © 2011 Goldman Sachs. All rights reserved. | ||
| VITSVCSAR11/57755.MF.MED.TMPL/8/2011 | ||
Goldman
Sachs Variable Insurance Trust
Goldman Sachs
Large Cap Value Fund
Semi-Annual Report
June 30, 2011
|
GOLDMAN SACHS VARIABLE INSURANCE TRUST LARGE CAP VALUE FUND
Principal Investment Strategies and Risks
Shares of the Goldman Sachs Variable Insurance Trust — Goldman Sachs Large Cap Value Fund are offered to separate accounts of participating life insurance companies for the purpose of funding variable annuity contracts and variable life insurance policies. Shares of the Fund are not offered directly to the general public. The variable annuity contracts and variable life insurance policies are described in the separate prospectuses issued by participating insurance companies. You should refer to those prospectuses for information about surrender charges, mortality and expense risk fees and other charges that may be assessed by participating insurance companies under the variable annuity contracts or variable life insurance policies. Such fees or charges, if any, may affect the return you realize with respect to your investments. Ask your representative for more complete information. Please consider the Fund’s objective, risks and charges and expenses, and read the Prospectus carefully before investing. The Prospectus contains this and other information about the Fund.
The Goldman Sachs Large Cap Value Fund invests primarily in large-capitalization U.S. equity investments. The Fund’s equity investments will be subject to market risk, which means that the value of the securities in which it invests may go up or down in response to the prospects of individual companies, particular industry sectors and/or general economic conditions. The Fund may also invest in fixed income securities, which are subject to the risks associated with debt securities, including credit, liquidity and interest rate risk. The Fund may invest in foreign securities, including emerging country securities, which may be more volatile and less liquid than investments in U.S. securities and will be subject to the risks of currency fluctuations and sudden economic or political developments.
GOLDMAN SACHS VARIABLE INSURANCE TRUST LARGE CAP VALUE FUND
INVESTMENT OBJECTIVE
The Fund seeks long-term capital appreciation.
Portfolio Management Discussion and Analysis
Below, the Goldman Sachs Value Portfolio Management Team discusses the performance of the Goldman Sachs Variable Insurance Trust — Goldman Sachs Large Cap Value Fund (the “Fund”) and positioning for the six-month period ended June 30, 2011 (the “Reporting Period”).
How did the Fund perform during the Reporting Period?
During the Reporting Period, the Fund’s Institutional and Service Shares generated cumulative total returns of 3.42% and 3.23%, respectively. These returns compare to the 5.92% cumulative total return of the Fund’s benchmark, the Russell 1000® Value Index* (with dividends reinvested) (the “Russell Index”) during the same time period.
What economic and market factors most influenced the equity markets as a whole during the Reporting Period?
U.S. equities continued their positive momentum from 2010 during the Reporting Period. However, most of the gains were generated during the first quarter of 2011, as improving trends in labor, housing, manufacturing and consumer confidence pointed to a continuation in the economic recovery. A positive trajectory in corporate earnings and cash flows and strong merger and acquisition activity further supported U.S. equity market performance. Indeed, despite great exogenous shocks in the Middle East and North African turmoil, a series of disasters in Japan, political debate over collective bargaining rights in Wisconsin and the possible repeal of health care reform in Washington D.C., the U.S. equity markets rewarded investors with solid returns during the first quarter of 2011.
The broad U.S. equity markets experienced a much more volatile second quarter, rising to a three-year high in April before losing most of its early 2011 gains by mid-June and then recovering somewhat in the very last week of the Reporting Period. In early April, commodity prices declined and expectations ran high for strong corporate profit growth. However, while home construction rose modestly in May, housing and employment remained key weak spots in the U.S. economy. Concerns about Greece’s debt crisis also re-surfaced, the U.S. Congress wrangled over the U.S. debt ceiling, the Federal Reserve Board’s quantitative easing program was scheduled to expire on June 30, 2011, the impact of Japan’s natural and nuclear disasters worked its way through the global supply chain and deadly storms cut a wide swath of destruction across the midwestern and southern United States. In turn, the U.S. stock market felt pressured and lost ground. Toward the end of June, U.S. equity markets recovered from their May to mid-June decline on the heels of better than expected U.S. manufacturing activity, improved automobile sales and a short-term resolution of the sovereign debt crisis in Greece.
Despite this volatility, all sectors posted gains during the Reporting Period, with the exception of financials, which posted a negative return. Health care and energy led the way. Energy was, not surprisingly, impacted by the price of Brent crude oil, which peaked at more than $126 per barrel in April on supply disruption fears in North Africa and the Middle East before falling in June on weaker U.S. economic data and concerns about the pace of growth in China’s economy. Still, Brent crude oil prices ended the Reporting Period at more than $112 per barrel.
While all capitalization segments of the U.S. equity market advanced during the Reporting Period, mid-cap stocks, as measured by the Russell Midcap® Index, performed best, followed by large-cap and then small-cap stocks, as measured by the Russell 1000® Index and the Russell 2000® Index, respectively, which performed nearly in line with each other. Large-cap stocks were least successful relative to small-cap stocks in the information technology sector. Growth-oriented stocks outpaced value-oriented stocks across the capitalization spectrum.
What key factors were responsible for the Fund’s performance during the Reporting Period?
Stock selection overall detracted most from the Fund’s performance relative to the Russell Index during the Reporting Period.
| * | The Russell 1000 Value Index is an unmanaged market capitalization weighted index of the 1000 largest U.S. companies with lower-price-to-book ratios and lower forecasted growth values. The Index figures do not include any deduction for fees, expenses or taxes. It is not possible to invest directly in an unmanaged index. |
GOLDMAN SACHS VARIABLE INSURANCE TRUST LARGE CAP VALUE FUND
Which equity market sectors most significantly affected Fund performance?
Effective stock selection in the consumer discretionary, financials and telecommunication services sectors helped the Fund’s performance most relative to the Russell Index. Detracting from the Fund’s relative results most was stock selection within, and having underweighted positions in the strongly-performing energy, health care and utilities sectors.
What were some of the Fund’s best-performing individual stocks?
The Fund benefited most relative to the Russell Index from positions in two media companies within the consumer discretionary sector — DISH Network and CBS — as well as from a position in the health care sector — WellPoint.
DISH Network is a broadcast satellite subscription television service provider. The company’s churn — or the number of customers who switch to a competitor — materially dropped following reports of its quarterly results, which surprised the market to the upside. DISH Network also benefited from a court ruling favoring the company when it served as a defendant in TIVO’s patent infringement case. These factors, combined with an attractive valuation, drove DISH Network’s shares higher during the Reporting Period.
Multimedia giant CBS was also a top contributor to the Fund’s results during the Reporting Period. CBS saw its shares advance when the company demonstrated new avenues for profitable growth and reported a significant increase in advertisement pricing.
WellPoint, a health benefits company, was a strong performer during the Reporting Period for a few reasons. First, WellPoint’s margins grew, benefiting from lower health care utilization compared to the rest of the industry. This, combined with strong, accretive share repurchases and previously depressed valuations, pushed its share price higher. Additionally, investors appeared to become increasingly comfortable with the PPACA (Patient Protection and Affordable Care Act, aka heath care reform). Finally, during the Reporting Period, WellPoint instituted its first dividend.
Which stocks detracted significantly from the Fund’s performance during the Reporting Period?
Detracting most from the Fund’s results relative to its benchmark index were positions in leading web-based search engine Google of the information technology sector, diversified banking institution Bank of America of the financials sector and independent oil and gas exploration and production company Devon Energy of the energy sector.
Shares of Google declined during the Reporting Period due primarily to near-term fears over margin pressures from accelerated spending, decelerating search volume growth and potentially increased competition from social media. However, we maintained the Fund’s position in Google, as we believe the company will continue to dominate its industry. We also believe that Google has the additional catalyst of its mobile/Android operating system, which has gained share on smartphones and provided new opportunities for revenues.
Bank of America saw its shares decline during the Reporting Period, as the institution was negatively impacted by uncertainty surrounding mortgage litigation, capital level requirements and debit interchange fees. Still, with its U.S. footprint of nearly 6,000 branches, we continued to believe that Bank of America is on a path to recovery as the economy stabilizes and as the consumer bounces back. We also held the position because we believe that the company’s earnings should accelerate over the next couple of years through the myriad cross-selling opportunities and synergies it has resulting from its acquisitions of Countrywide, a top mortgage company, and Merrill Lynch, a leading broker.
Devon Energy, a new position for the Fund, was a top detractor during the Reporting Period, as it was affected by a combination of weaker oil prices and weather-related events that together caused concerns regarding the company’s near-term production levels. More specifically, shares of Devon Energy were hurt by the news that one of its processing plants that had been hit by a tornado would be out of commission longer than anticipated. However, we maintained our long-term favorable view of the company, which we believe has a strong asset base that should provide solid organic production growth over the next few years.
How did the Fund use derivatives and similar instruments during the Reporting Period?
During the Reporting Period, we did not use derivatives as part of an active management strategy.
Did the Fund make any significant purchases or sales during the Reporting Period?
As already indicated, we initiated a Fund position in Devon Energy, one of the largest independent oil and gas exploration and production companies in the world, during the Reporting Period. In our view, Devon Energy’s asset base, which is principally located in North America, should provide solid organic production growth over the next several years. We further believe that geopolitical uncertainty abroad could increase the value of North American assets generally. Devon Energy’s investment grade balance sheet, strong cash flow generation and asset sales are, in our view, supporting a major share buyback.
GOLDMAN SACHS VARIABLE INSURANCE TRUST LARGE CAP VALUE FUND
We established a Fund position in energy utility company PPL during the Reporting Period. In our view, PPL’s shift into more regulated businesses should allow the company to generate a more predictable earnings stream and to mitigate the impact of secularly low power prices. In addition, we believe that PPL should benefit from reduced supply in power markets, as old plants close and environmental regulations become stricter.
True to our sell discipline, we sold out of certain stocks that approached their price targets as they appreciated during the Reporting Period. For example, we sold the Fund’s positions in mining company Freeport-McMoRan Copper & Gold and agricultural company Archer Daniels Midland, taking profits in each. Freeport-McMoRan Copper & Gold is highly levered to copper prices, and as a result, its shares rose on strength of the underlying commodity during the Reporting Period. We exited the Fund’s position in Archer Daniels Midland as the company executed on its strategy, posted solid earnings and consequently saw its share price rise.
We also eliminated the Fund’s position in diversified consumer products company Newell Rubbermaid during the Reporting Period and redeployed the proceeds into another stock within the consumer discretionary sector that we believed had higher potential upside.
Were there any notable changes in the Fund’s weightings during the Reporting Period?
In constructing the Fund’s portfolio, we focus on picking stocks rather than on making industry or sector bets. We seek to outpace the benchmark index by overweighting stocks that we expect to outperform and underweighting those that we think may lag. Consequently, changes in the Fund’s sector weights are generally the direct result of individual stock selection or of stock appreciation or depreciation. That said, during the Reporting Period, the Fund’s exposure to consumer staples, energy and telecommunication services increased compared to the Russell Index. The Fund’s allocations compared to the benchmark index in consumer discretionary, information technology and materials decreased.
How was the Fund positioned relative to its benchmark index at the end of the Reporting Period?
As of June 30, 2011, the Fund had modestly overweighted positions relative to the Russell Index in the consumer staples, consumer discretionary, financials and industrials sectors. On the same date, the Fund had modestly underweighted positions compared to the Russell Index in energy, health care, information technology, telecommunication services and utilities and was rather neutrally weighted to the Russell Index in materials.
What is the Fund’s tactical view and strategy for the months ahead?
At the end of the Reporting Period, we remained cautiously optimistic on the U.S. equity market, despite macroeconomic, geopolitical and regulatory uncertainty persisting. In our view, valuations remained compelling, especially after the pullback during the second quarter of 2011, as many companies were trading at depressed levels. Companies generally continued to exhibit strong fundamentals, with cash rich balance sheets. We also continued to expect that management teams will be focused in the months ahead on returning value to shareholders through mergers and acquisitions, share buybacks, new or increased dividends and deleveraging of balance sheets, providing further catalyst for growth.
Given this backdrop, we believe the coming months should be fertile ground for forward-looking stock pickers. We anticipate that stock correlations may well decline and that companies will likely begin to trade more in line with underlying fundamentals. We maintain our discipline as we seek companies with strong or improving fundamentals, led by quality management teams that are smart allocators of capital and remain focused on creating shareholder value. As always, deep research resources, a forward-looking investment process and truly actively managed portfolios are keys, in our view, to both preserving capital and outperforming the market over the long term.
FUND BASICS
Large Cap Value Fund
as of June 30, 2011
| STANDARDIZED AVERAGE ANNUAL TOTAL RETURNS1 |
| For the period ended 6/30/11 | One Year | Five Years | Ten Years | Since Inception | Inception Date | |||||||||||||||
| Institutional | 25.40 | % | 0.90 | % | 3.81 | % | 2.80 | % | 1/12/98 | |||||||||||
| Service | 24.97 | N/A | N/A | −4.06 | 7/24/07 | |||||||||||||||
| 1 | The Standardized Average Annual Total Returns are average annual total returns as of the most recent calendar quarter-end. They assume reinvestment of all distributions at net asset value (“NAV”). | |
| Total return figures in the above chart represent past performance and do not indicate future results, which will vary. The investment return and principal value of an investment will fluctuate and, therefore, an investor’s shares, when redeemed, may be worth more or less than their original cost. Current performance may be lower or higher than the total return figures in the above chart. Please visit www.goldmansachsfunds.com/vit to obtain the most recent month-end returns. Performance reflects expense limitations in effect. In their absence, performance would be reduced. |
| EXPENSE RATIOS2 |
| Net Expense Ratio (Current) | Gross Expense Ratio (Before Waivers) | |||||||||
| Institutional | 0.78 | % | 0.80 | % | ||||||
| Service | 1.03 | 1.05 | ||||||||
| 2 | The expense ratios of the Fund, both current (net of any fee waivers or expense limitations) and before waivers (gross of any fee waivers or expense limitations) are as set forth above. The Fund’s waivers and/or expense limitations will remain in place through at least April 29, 2012, and prior to such date the investment adviser may not terminate the arrangements without the approval of the Fund’s Board of Trustees. The expense ratios set forth above may differ from the expense ratios disclosed in the Financial Highlights in this report. |
| TOP TEN HOLDINGS AS OF 6/30/113 |
| Holding | % of Net Assets | Line of Business | ||||||
| JPMorgan Chase & Co. | 4.7 | % | Diversified Financials | |||||
| General Electric Co. | 4.0 | Capital Goods | ||||||
| Merck & Co., Inc. | 3.4 | Pharmaceuticals, Biotechnology & Life Sciences | ||||||
| Bank of America Corp. | 3.1 | Diversified Financials | ||||||
| U.S. Bancorp | 2.8 | Banks | ||||||
| Devon Energy Corp. | 2.8 | Energy | ||||||
| Sprint Nextel Corp. | 2.8 | Telecommunication Services | ||||||
| Comcast Corp. Class A | 2.7 | Media | ||||||
| WellPoint, Inc. | 2.6 | Health Care Equipment & Services | ||||||
| Prudential Financial, Inc. | 2.6 | Insurance | ||||||
| 3 | The top 10 holdings may not be representative of the Fund’s future investments. |
FUND BASICS
| FUND vs. BENCHMARK SECTOR ALLOCATIONS4 |
As of June 30, 2011
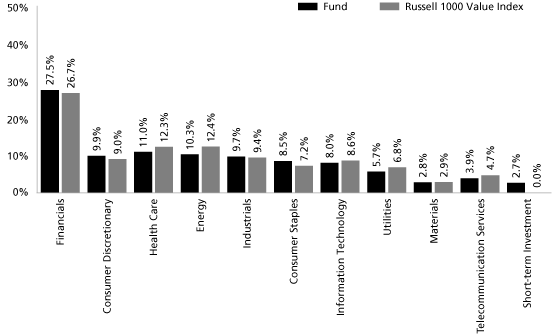
| 4 | The Fund is actively managed and, as such, its composition may differ over time. The above graph categorizes investments using Global Industry Classification Standard (“GICS”), however, the sector classifications used by the portfolio management team may differ from GICS. Consequently, the Fund’s overall industry sector allocations may differ from percentages contained in the graph above. The percentage shown for each investment category reflects the value of investments in that category as a percentage of market value. Short-term investments represent investments in investment companies other than those that are exchange traded. The above graph depicts the Fund’s investments but may not represent the Fund’s market exposure due to the exclusion of derivatives, if any, as listed in the Additional Investment Information section of the Schedule of Investments. |
GOLDMAN SACHS VARIABLE INSURANCE TRUST LARGE CAP VALUE FUND
Schedule of Investments
June 30, 2011 (Unaudited)
| Shares | Description | Value | ||||||
Common Stocks – 100.5% | ||||||||
Automobiles & Components – 3.4% | ||||||||
| 937,834 | Ford Motor Co.* | $ | 12,932,731 | |||||
| 355,055 | General Motors Co.* | 10,779,469 | ||||||
| 482,877 | Johnson Controls, Inc. | 20,116,656 | ||||||
| 43,828,856 | ||||||||
Banks – 6.4% | ||||||||
| 364,174 | PNC Financial Services Group, Inc. | 21,708,412 | ||||||
| 913,347 | SunTrust Banks, Inc. | 23,564,353 | ||||||
| 1,424,902 | U.S. Bancorp | 36,349,250 | ||||||
| 81,622,015 | ||||||||
Capital Goods – 10.0% | ||||||||
| 112,638 | Emerson Electric Co. | 6,335,888 | ||||||
| 2,718,494 | General Electric Co. | 51,270,797 | ||||||
| 461,433 | Honeywell International, Inc. | 27,496,792 | ||||||
| 216,828 | Illinois Tool Works, Inc. | 12,248,614 | ||||||
| 418,669 | The Boeing Co. | 30,952,199 | ||||||
| 128,304,290 | ||||||||
Diversified Financials – 13.1% | ||||||||
| 167,733 | Ameriprise Financial, Inc. | 9,674,839 | ||||||
| 3,623,638 | Bank of America Corp. | 39,715,072 | ||||||
| 120,596 | Franklin Resources, Inc. | 15,833,049 | ||||||
| 527,807 | Invesco Ltd. | 12,350,684 | ||||||
| 1,457,438 | JPMorgan Chase & Co. | 59,667,512 | ||||||
| 1,083,774 | SLM Corp. | 18,218,241 | ||||||
| 279,146 | State Street Corp. | 12,586,693 | ||||||
| 168,046,090 | ||||||||
Energy – 10.7% | ||||||||
| 140,017 | Baker Hughes, Inc. | 10,159,634 | ||||||
| 161,733 | Cameron International Corp.* | 8,133,553 | ||||||
| 404,422 | ConocoPhillips | 30,408,490 | ||||||
| 455,901 | Devon Energy Corp. | 35,929,558 | ||||||
| 177,523 | Newfield Exploration Co.* | 12,075,114 | ||||||
| 284,411 | Occidental Petroleum Corp. | 29,590,120 | ||||||
| 122,433 | Schlumberger Ltd. | 10,578,211 | ||||||
| 136,874,680 | ||||||||
Food & Staples Retailing – 1.8% | ||||||||
| 626,015 | CVS Caremark Corp. | 23,525,644 | ||||||
Food, Beverage & Tobacco – 7.0% | ||||||||
| 227,922 | Coca-Cola Enterprises, Inc. | 6,650,764 | ||||||
| 171,275 | ConAgra Foods, Inc. | 4,420,608 | ||||||
| 725,678 | General Mills, Inc. | 27,009,735 | ||||||
| 352,238 | PepsiCo, Inc. | 24,808,122 | ||||||
| 794,490 | Unilever NV | 26,098,997 | ||||||
| 88,988,226 | ||||||||
Health Care Equipment & Services – 3.9% | ||||||||
| 2,398,261 | Boston Scientific Corp.* | 16,571,984 | ||||||
| 418,968 | WellPoint, Inc. | 33,002,109 | ||||||
| 49,574,093 | ||||||||
Insurance – 8.9% | ||||||||
| 187,199 | Aflac, Inc. | 8,738,449 | ||||||
| 165,896 | Everest Re Group Ltd. | 13,561,998 | ||||||
| 607,744 | Hartford Financial Services Group, Inc. | 16,026,209 | ||||||
| 353,830 | Marsh & McLennan Companies, Inc. | 11,035,958 | ||||||
| 518,135 | Prudential Financial, Inc. | 32,948,205 | ||||||
| 511,401 | The Allstate Corp. | 15,613,073 | ||||||
| 282,330 | The Travelers Companies, Inc. | 16,482,425 | ||||||
| 114,406,317 | ||||||||
Materials – 2.9% | ||||||||
| 93,049 | Cliffs Natural Resources, Inc. | 8,602,380 | ||||||
| 334,853 | Huntsman Corp. | 6,311,979 | ||||||
| 408,068 | LyondellBasell Industries NV Class A | 15,718,779 | ||||||
| 179,754 | The Dow Chemical Co. | 6,471,144 | ||||||
| 37,104,282 | ||||||||
Media – 6.0% | ||||||||
| 605,669 | CBS Corp. Class B | 17,255,510 | ||||||
| 1,343,073 | Comcast Corp. Class A | 34,033,470 | ||||||
| 827,708 | DISH Network Corp. Class A* | 25,385,804 | ||||||
| 76,674,784 | ||||||||
Pharmaceuticals, Biotechnology & Life Sciences – 7.5% | ||||||||
| 344,403 | Celgene Corp.* | 20,774,389 | ||||||
| 1,234,855 | Merck & Co., Inc. | 43,578,033 | ||||||
| 652,181 | Teva Pharmaceutical Industries Ltd. ADR | 31,448,168 | ||||||
| 95,800,590 | ||||||||
Retailing – 0.8% | ||||||||
| 616,955 | Liberty Media Corp. — Interactive Class A* | 10,346,335 | ||||||
Semiconductors & Semiconductor Equipment – 1.6% | ||||||||
| 160,918 | Maxim Integrated Products, Inc. | 4,113,064 | ||||||
| 378,515 | NVIDIA Corp.* | 6,031,636 | ||||||
| 320,161 | Texas Instruments, Inc. | 10,510,886 | ||||||
| 20,655,586 | ||||||||
Software & Services – 4.9% | ||||||||
| 611,435 | Adobe Systems, Inc.* | 19,229,630 | ||||||
| 44,810 | Google, Inc. Class A* | 22,690,888 | ||||||
| 821,400 | Microsoft Corp. | 21,356,400 | ||||||
| 63,276,918 | ||||||||
Technology Hardware & Equipment – 1.8% | ||||||||
| 817,092 | EMC Corp.* | 22,510,885 | ||||||
Telecommunication Services – 4.0% | ||||||||
| 397,171 | CenturyLink, Inc. | 16,057,623 | ||||||
| 6,588,222 | Sprint Nextel Corp.* | 35,510,517 | ||||||
| 51,568,140 | ||||||||
Utilities – 5.8% | ||||||||
| 554,297 | American Electric Power Co., Inc. | 20,885,911 | ||||||
| 199,436 | Entergy Corp. | 13,617,490 | ||||||
GOLDMAN SACHS VARIABLE INSURANCE TRUST LARGE CAP VALUE FUND
Schedule of Investments (continued)
June 30, 2011 (Unaudited)
| Shares | Description | Value | ||||||
Common Stocks – (continued) | ||||||||
Utilities – (continued) | ||||||||
| 473,069 | PG&E Corp. | $ | 19,883,090 | |||||
| 735,785 | PPL Corp. | 20,476,897 | ||||||
| 74,863,388 | ||||||||
TOTAL COMMON STOCKS | ||||||||
(Cost $1,180,761,483) | $ | 1,287,971,119 | ||||||
| Shares | Rate | Value | ||||||||
Short-term Investment(a) – 2.7% | ||||||||||
| JPMorgan U.S. Government Money Market Fund — Capital Shares | ||||||||||
| 34,943,449 | 0.010 | % | $ | 34,943,449 | ||||||
(Cost $34,943,449) | ||||||||||
TOTAL INVESTMENTS – 103.2% | ||||||||||
(Cost $1,215,704,932) | $ | 1,322,914,568 | ||||||||
LIABILITIES IN EXCESS OF OTHER ASSETS – (3.2)% | (41,326,899 | ) | ||||||||
NET ASSETS – 100.0% | $ | 1,281,587,669 | ||||||||
The percentage shown for each investment category reflects the value of investments in that category as a percentage of net assets.
| * | Non-income producing security. | |
| (a) | Variable rate security. Interest rate disclosed is that which is in effect at June 30, 2011. |
Investment Abbreviation: | ||||
| ADR | — | American Depositary Receipt | ||
GOLDMAN SACHS VARIABLE INSURANCE TRUST LARGE CAP VALUE FUND
Statement of Assets and Liabilities
June 30, 2011 (Unaudited)
Assets: | ||||
| Investments in securities, at value (identified cost $1,215,704,932) | $ | 1,322,914,568 | ||
| Receivables: | ||||
| Fund shares sold | 7,178,137 | |||
| Investment securities sold | 2,890,216 | |||
| Dividends | 2,214,098 | |||
| Other assets | 6,732 | |||
Total assets | 1,335,203,751 | |||
Liabilities: | ||||
| Payables: | ||||
| Fund shares redeemed | 49,365,657 | |||
| Investment securities purchased | 3,160,330 | |||
| Amounts owed to affiliates | 959,744 | |||
| Accrued expenses | 130,351 | |||
Total liabilities | 53,616,082 | |||
Net Assets: | ||||
| Paid-in capital | 1,220,485,017 | |||
| Accumulated undistributed net investment income | 6,986,346 | |||
| Accumulated net realized loss from investment transactions | (53,093,330 | ) | ||
| Net unrealized gain on investments | 107,209,636 | |||
NET ASSETS | $ | 1,281,587,669 | ||
| Net Assets: | ||||
| Institutional | $ | 480,749,158 | ||
| Service | 800,838,511 | |||
| Total Net Assets | $ | 1,281,587,669 | ||
| Shares of beneficial interest outstanding $0.001 par value (unlimited shares authorized): | ||||
| Institutional | 45,414,031 | |||
| Service | 75,813,101 | |||
| Net asset value, offering and redemption price per share: | ||||
| Institutional | $10.59 | |||
| Service | 10.56 | |||
GOLDMAN SACHS VARIABLE INSURANCE TRUST LARGE CAP VALUE FUND
Statement of Operations
For the Six Months Ended June 30, 2011 (Unaudited)
Investment income: | ||||
| Dividends | $ | 11,104,921 | ||
Expenses: | ||||
| Management fees | 4,646,023 | |||
| Distribution and Service fees — Service Class | 944,320 | |||
Transfer Agent fees(a) | 126,428 | |||
| Printing and mailing costs | 75,585 | |||
| Custody and accounting fees | 46,363 | |||
| Professional fees | 44,866 | |||
| Trustee fees | 9,688 | |||
| Registration fees | 609 | |||
| Other | 21,221 | |||
Total expenses | 5,915,103 | |||
| Less — expense reductions | (558 | ) | ||
Net expenses | 5,914,545 | |||
NET INVESTMENT INCOME | 5,190,376 | |||
Realized and unrealized gain (loss) from investment transactions: | ||||
| Net realized gain from investment transactions (including commissions recaptured of $111,271) | 57,726,448 | |||
| Net change in unrealized loss on investments | (23,978,528 | ) | ||
Net realized and unrealized gain from investment transactions | 33,747,920 | |||
NET INCREASE IN NET ASSETS RESULTING FROM OPERATIONS | $ | 38,938,296 | ||
| (a) | Institutional and Service Shares had Transfer Agent fees of $50,888 and $75,540, respectively. |
GOLDMAN SACHS VARIABLE INSURANCE TRUST LARGE CAP VALUE FUND
Statements of Changes in Net Assets
| For the | For the | |||||||
| Six Months Ended | Fiscal Year Ended | |||||||
| June 30, 2011 (Unaudited) | December 31, 2010 | |||||||
From operations: | ||||||||
| Net investment income | $ | 5,190,376 | $ | 8,805,701 | ||||
| Net realized gain from investment transactions | 57,726,448 | 61,357,865 | ||||||
| Net change in unrealized gain (loss) on investments | (23,978,528 | ) | 51,676,161 | |||||
Net increase in net assets resulting from operations | 38,938,296 | 121,839,727 | ||||||
Distributions to shareholders: | ||||||||
| From net investment income | ||||||||
| Institutional Shares | — | (3,935,813 | ) | |||||
| Service Shares | — | (3,969,754 | ) | |||||
Total distributions to shareholders | — | (7,905,567 | ) | |||||
From share transactions: | ||||||||
| Proceeds from sales of shares | 204,771,705 | 355,441,232 | ||||||
| Reinvestment of distributions | — | 7,905,567 | ||||||
| Cost of shares redeemed | (141,507,996 | ) | (176,911,161 | ) | ||||
Net increase in net assets resulting from share transactions | 63,263,709 | 186,435,638 | ||||||
TOTAL INCREASE | 102,202,005 | 300,369,798 | ||||||
Net assets: | ||||||||
| Beginning of period | 1,179,385,664 | 879,015,866 | ||||||
| End of period | $ | 1,281,587,669 | $ | 1,179,385,664 | ||||
Accumulated undistributed net investment income | $ | 6,986,346 | $ | 1,795,970 | ||||
GOLDMAN SACHS VARIABLE INSURANCE TRUST LARGE CAP VALUE FUND
Financial Highlights
Selected Data for a Share Outstanding Throughout Each Period
| Income (loss) from | ||||||||||||||||||||||||||||||||||||||||||||||||||||||||||
| investment operations | Distributions to shareholders | |||||||||||||||||||||||||||||||||||||||||||||||||||||||||
| Net | Ratio of | Ratio of | ||||||||||||||||||||||||||||||||||||||||||||||||||||||||
| Net asset | realized | From | Net asset | Net assets, | Ratio of | total | net investment | |||||||||||||||||||||||||||||||||||||||||||||||||||
| value, | Net | and | Total from | From net | net | value, | end of | net expenses | expenses | income | Portfolio | |||||||||||||||||||||||||||||||||||||||||||||||
| beginning | investment | unrealized | investment | investment | realized | Total | end of | Total | period | to average | to average | to average | turnover | |||||||||||||||||||||||||||||||||||||||||||||
| Year - Share Class | of period | income(a) | gain (loss) | operations | income | gains | distributions | period | return(b) | (in 000s) | net assets | net assets | net assets | rate | ||||||||||||||||||||||||||||||||||||||||||||
FOR THE SIX MONTHS ENDED JUNE 30, (UNAUDITED) | ||||||||||||||||||||||||||||||||||||||||||||||||||||||||||
| 2011 - Institutional | $ | 10.24 | $ | 0.05 | $ | 0.30 | $ | 0.35 | $ | — | $ | — | $ | — | $ | 10.59 | 3.42 | % | $ | 480,749 | 0.79 | %(c) | 0.79 | %(c) | 0.96 | %(c) | 32 | % | ||||||||||||||||||||||||||||||
| 2011 - Service | 10.23 | 0.04 | 0.29 | 0.33 | — | — | — | 10.56 | 3.23 | 800,839 | 1.04 | (c) | 1.04 | (c) | 0.73 | (c) | 32 | |||||||||||||||||||||||||||||||||||||||||
FOR THE FISCAL YEARS ENDED DECEMBER 31, | ||||||||||||||||||||||||||||||||||||||||||||||||||||||||||
| 2010 - Institutional | 9.28 | 0.10 | 0.94 | 1.04 | (0.08 | ) | — | (0.08 | ) | 10.24 | 11.20 | 507,146 | 0.80 | 0.80 | 1.02 | 95 | ||||||||||||||||||||||||||||||||||||||||||
| 2010 - Service | 9.28 | 0.07 | 0.94 | 1.01 | (0.06 | ) | — | (0.06 | ) | 10.23 | 10.89 | 672,239 | 1.05 | 1.05 | 0.78 | 95 | ||||||||||||||||||||||||||||||||||||||||||
| 2009 - Institutional | 7.97 | 0.18 | (d) | 1.28 | 1.46 | (0.15 | ) | — | (0.15 | ) | 9.28 | 18.32 | 487,962 | 0.81 | 0.81 | 2.18 | (d) | 84 | ||||||||||||||||||||||||||||||||||||||||
| 2009 - Service | 7.98 | 0.16 | (d) | 1.28 | 1.44 | (0.14 | ) | — | (0.14 | ) | 9.28 | 17.87 | 391,053 | 1.06 | 1.06 | 1.92 | (d) | 84 | ||||||||||||||||||||||||||||||||||||||||
| 2008 - Institutional | 12.53 | 0.25 | (4.59 | ) | (4.34 | ) | (0.22 | ) | — | (e) | (0.22 | ) | 7.97 | (34.45 | ) | 389,838 | 0.81 | 0.81 | 2.36 | 69 | ||||||||||||||||||||||||||||||||||||||
| 2008 - Service | 12.52 | 0.19 | (4.51 | ) | (4.32 | ) | (0.22 | ) | — | (e) | (0.22 | ) | 7.98 | (34.32 | ) | 67,200 | 1.06 | 1.06 | 2.15 | 69 | ||||||||||||||||||||||||||||||||||||||
| 2007 - Institutional | 13.91 | 0.25 | (0.03 | ) | 0.22 | (0.26 | ) | (1.34 | ) | (1.60 | ) | 12.53 | 1.49 | 571,883 | 0.85 | 0.85 | 1.75 | 79 | ||||||||||||||||||||||||||||||||||||||||
| 2007 - Service (Commenced July 24, 2007) | 14.71 | 0.15 | (0.74 | ) | (0.59 | ) | (0.26 | ) | (1.34 | ) | (1.60 | ) | 12.52 | (4.02 | ) | 90 | 0.94 | (c) | 1.09 | (c) | 3.11 | (c) | 79 | |||||||||||||||||||||||||||||||||||
| 2006 - Institutional | 11.97 | 0.28 | 2.43 | 2.71 | (0.23 | ) | (0.54 | ) | (0.77 | ) | 13.91 | 22.63 | 432,016 | 0.86 | 0.87 | 2.15 | 52 | |||||||||||||||||||||||||||||||||||||||||
| (a) | Calculated based on the average shares outstanding methodology. | |
| (b) | Assumes investment at the net asset value at the beginning of the period, reinvestment of all distributions, and a complete redemption of the investment at the net asset value at the end of the period. Total returns for periods less than one full year are not annualized. | |
| (c) | Annualized. | |
| (d) | Reflects income recognized from non-recurring special dividends which amounted to $0.02 per share and 0.24% of average net assets. | |
| (e) | Amount is less than $0.005 per share. |
12
GOLDMAN SACHS VARIABLE INSURANCE TRUST LARGE CAP VALUE FUND
Notes to Financial Statements
June 30, 2011 (Unaudited)
| 1. ORGANIZATION |
Goldman Sachs Variable Insurance Trust (the “Trust” or “VIT”) is a Delaware statutory trust registered under the Investment Company Act of 1940, as amended (the “Act”), as an open-end management investment company. The Trust includes the Goldman Sachs Large Cap Value Fund (the “Fund”). The Fund is a diversified portfolio under the Act offering two classes of shares — Institutional and Service.
Goldman Sachs Asset Management, L.P. (“GSAM”), an affiliate of Goldman, Sachs & Co. (“Goldman Sachs”), serves as investment adviser to the Fund pursuant to a management agreement (the “Agreement”) with the Trust.
| 2. SIGNIFICANT ACCOUNTING POLICIES |
The following is a summary of the significant accounting policies consistently followed by the Fund. The preparation of financial statements in conformity with accounting principles generally accepted in the United States of America (“GAAP”) requires management to make estimates and assumptions that may affect the amounts and disclosures in the financial statements. Actual results could differ from those estimates and assumptions.
A. Investment Valuation — The investment valuation policy of the Fund is to value investments at market value. Investments in equity securities and investment companies traded on a United States (“U.S.”) securities exchange or the NASDAQ system are valued daily at their last sale price or official closing price on the principal exchange or system on which they are traded. If no sale occurs, such securities and investment companies are valued at the last bid price for long positions and at the last ask price for short positions. Debt securities for which market quotations are readily available are valued on the basis of quotations furnished by an independent pricing service approved by the trustees or provided by securities dealers. The pricing services may use valuation models or matrix pricing, which consider: (i) yield or price with respect to bonds that are considered comparable in characteristics such as rating, interest rate and maturity date or (ii) quotations from securities dealers to determine current value. If accurate quotations are not readily available, or if GSAM believes that such quotations do not accurately reflect fair value, the fair value of the Fund’s investments may be determined based on yield equivalents, a pricing matrix or other sources, under valuation procedures established by the trustees. Unlisted equity securities for which market quotations are available are valued at the last sale price on the valuation date, or if no sale occurs, at the last bid price. In the absence of market quotations, broker quotes will be utilized or the security will be fair valued. Investments in investment companies (other than those that are exchange traded) are valued at the net asset value per share (“NAV”) of the investment company on the valuation date. Short-term debt obligations that mature in sixty days or less and that do not exhibit signs of credit deterioration are valued at amortized cost, which approximates market value.
GSAM, consistent with its procedures and applicable regulatory guidance, may make an adjustment to the previous closing prices of either domestic or foreign securities in light of significant events to reflect what it believes to be the fair value of the securities at the time of determining the Fund’s NAV. Significant events that could affect a large number of securities in a particular market may include, but are not limited to: situations relating to one or more single issuers in a market sector; significant fluctuations in U.S. or foreign markets; market dislocations; market disruptions or market closings; equipment failures; natural or man-made disasters or acts of God; armed conflicts; government actions or other developments; as well as the same or similar events which may affect specific issuers or the securities markets even though not tied directly to the securities markets. Other significant events that could relate to a single issuer may include, but are not limited to: corporate actions such as reorganizations, mergers and buy-outs; corporate announcements, including those relating to earnings, products and regulatory news; significant litigation; low trading volume; and trading limits or suspensions.
B. Security and Fund Share Transactions, and Investment Income — Security and Fund share transactions are reflected for financial reporting purposes as of the trade date, which may cause the NAV as stated in the accompanying financial statements to be different than the NAV applied to Fund share transactions. Realized gains and losses on sales of portfolio securities are calculated using the identified cost basis. Dividend income is recognized on the ex-dividend date, net of foreign withholding taxes, if any, which are reduced by any amounts reclaimable by the Fund, where applicable. Certain dividends from foreign securities will be recorded when the Fund is informed of the dividend, if such information is obtained subsequent to the ex-dividend date.
GOLDMAN SACHS VARIABLE INSURANCE TRUST LARGE CAP VALUE FUND
Notes to Financial Statements (continued)
June 30, 2011 (Unaudited)
| 2. SIGNIFICANT ACCOUNTING POLICIES (continued) |
Interest income is recorded on the basis of interest accrued, premium amortized and discount accreted. In addition, it is the Fund’s policy to accrue for foreign capital gains taxes, if applicable, on certain foreign securities held by the Fund. An estimated foreign capital gains tax is recorded daily on net unrealized gains on these securities and is payable upon the sale of such securities when a gain is realized.
Investment income and unrealized and realized gains or losses are allocated daily to each class of shares of the Fund based upon the relative proportion of net assets of each class.
In addition, distributions received from the Fund’s investments in the U.S. real estate investment trusts (“REITs”) often include a “return of capital”, which is recorded by the Fund as a reduction of the cost basis of the securities held. The Internal Revenue Code of 1986, as amended (the “Code”) requires a REIT to distribute at least 95% of its taxable income to investors. In many cases, however, because of “non-cash” expenses such as property depreciation, a REIT’s cash flow will exceed its taxable income. The REIT may distribute this excess cash to offer a more competitive yield. This portion of the Fund’s distributions is deemed a return of capital and is generally not taxable to shareholders.
C. Expenses — Expenses incurred by the Fund, which may not specifically relate to the Fund, may be shared with other registered investment companies having management agreements with GSAM or its affiliates, as appropriate. These expenses are allocated to the Fund on a straight-line and/or pro-rata basis depending upon the nature of the expenses and are accrued daily. Non-class specific expenses are allocated daily to each share class of the respective Fund based upon the relative proportion of net assets of each class. Class specific expenses, where applicable, are borne by the respective share classes and include Distribution and Service and Transfer Agent fees.
D. Federal Taxes and Distributions to Shareholders — It is the Fund’s policy to comply with the requirements of the Code, applicable to regulated investment companies (mutual funds) and to distribute each year substantially all of its investment company taxable income and capital gains to its shareholders. Accordingly, the Fund is not required to make any provisions for the payment of federal income tax. Distributions to shareholders are recorded on the ex-dividend date. Income and capital gains distributions, if any, are declared and paid annually.
Net capital losses are carried forward to future fiscal years and may be used to the extent allowed by the Code to offset any future capital gains. Utilization of capital loss carryforwards will reduce the requirement of future capital gains distributions.
The characterization of distributions to shareholders for financial reporting purposes is determined in accordance with federal income tax rules, which may differ from GAAP. The source of the Fund’s distributions may be shown in the accompanying financial statements as either from net investment income, net realized gain or capital. Certain components of the Fund’s net assets on the Statement of Assets and Liabilities reflect permanent GAAP/tax differences based on the appropriate tax character.
E. Commission Recapture — The Fund may direct portfolio trades, subject to obtaining best execution, to various brokers who have agreed to rebate a portion of the commissions generated. Such rebates are made directly to the Fund as cash payments and are included in net realized gain (loss) from investments on the Statement of Operations.
| 3. FAIR VALUE OF INVESTMENTS |
The fair value of a financial instrument is the amount that would be received to sell an asset or paid to transfer a liability in an orderly transaction between market participants at the measurement date (i.e., the exit price). GAAP establishes a fair value hierarchy that prioritizes the inputs to valuation techniques used to measure fair value. The hierarchy gives the highest priority to unadjusted quoted prices in active markets for identical assets or liabilities (Level 1 measurements) and the lowest priority to unobservable inputs (Level 3 measurements). The three levels of the fair value hierarchy are described below:
Level 1 — Unadjusted quoted prices in active markets that are accessible at the measurement date for identical, unrestricted assets or liabilities;
GOLDMAN SACHS VARIABLE INSURANCE TRUST LARGE CAP VALUE FUND
| 3. FAIR VALUE OF INVESTMENTS (continued) |
Level 2 — Quoted prices in markets that are not active or financial instruments for which significant inputs are observable (including, but not limited to, quoted prices for similar securities, interest rates, foreign exchange rates, volatility and credit spreads), either directly or indirectly;
Level 3 — Prices or valuations that require significant unobservable inputs (including GSAM’s assumptions in determining fair value measurement).
The following is a summary of the Fund’s investments categorized in the fair value hierarchy as of June 30, 2011:
| Investment Type | Level 1 | Level 2 | Level 3 | |||||||||
Assets | ||||||||||||
Common Stock and/or Other Equity Investments | $ | 1,287,971,119 | $ | — | $ | — | ||||||
| Short-term Investment | 34,943,449 | — | — | |||||||||
Total | $ | 1,322,914,568 | $ | — | $ | — | ||||||
| 4. AGREEMENTS AND AFFILIATED TRANSACTIONS |
A. Management Agreement — Under the Agreement, GSAM manages the Fund, subject to the general supervision of the trustees.
As compensation for the services rendered pursuant to the Agreement, the assumption of the expenses related thereto and administration of the Fund’s business affairs, including providing facilities, GSAM is entitled to a management fee, accrued daily and paid monthly, equal to an annual percentage rate of the Fund’s average daily net assets.
For the six months ended June 30, 2011, contractual and effective net management fees with GSAM were at the following rates:
| Contractual Management Rate | Effective Net | |||||||||||||||||||||||
| First | Next | Next | Next | Over | Effective | Management | ||||||||||||||||||
| $1 billion | $1 billion | $3 billion | $3 billion | $8 billion | Rate | Rate | ||||||||||||||||||
| 0.75% | 0.68 | % | 0.65 | % | 0.64 | % | 0.63 | % | 0.73 | % | 0.73 | %* | ||||||||||||
| * | Effective June 30, 2011, GSAM agreed to waive a portion of its management fee in order to achieve an effective net management rate of 0.73% through at least April 29, 2012. Prior to such date GSAM may not terminate the arrangement without the approval of the trustees. For the six months ended June 30, 2011, GSAM waived approximately $600 of the Fund’s management fee. |
B. Distribution and Service Plan — The Trust, on behalf of the Service Shares of the Fund, has adopted a Distribution and Service Plan (the “Plan”). Under the Plan, Goldman Sachs, which serves as distributor, is entitled to a fee accrued daily and paid monthly for distribution services, which may then be paid by Goldman Sachs to authorized dealers, equal to, on an annual basis, 0.25% of the Fund’s average daily net assets attributable to Service Shares.
C. Transfer Agency Agreement — Goldman Sachs also serves as the transfer agent of the Fund for a fee pursuant to a Transfer Agency Agreement. The fees charged for such transfer agency services are accrued daily and paid monthly at an annual rate of 0.02% of the average daily net assets for Institutional and Service Shares.
D. Other Expense Agreements and Affiliated Transactions — GSAM has agreed to limit certain “Other Expense” of the Fund (excluding management fees, distribution and service fees, transfer agent fees and expenses, taxes, interest, brokerage fees and litigation, indemnification, shareholder meetings and other extraordinary expenses, exclusive of any custody and transfer agent fee credit reductions) to the extent such expenses exceed, on an annual basis, 0.114% of the average daily net assets of the Fund. Such Other Expense reimbursements, if any, are accrued daily and paid monthly. In addition, the Fund is not obligated to reimburse GSAM for prior fiscal year expense reimbursements, if any. These Other Expense reimbursements will remain in place
GOLDMAN SACHS VARIABLE INSURANCE TRUST LARGE CAP VALUE FUND
Notes to Financial Statements (continued)
June 30, 2011 (Unaudited)
| 4. AGREEMENTS AND AFFILIATED TRANSACTIONS (continued) |
through at least April 29, 2012, and prior to such date GSAM may not terminate the arrangements without the approval of the trustees. For the six months ended June 30, 2011, GSAM did not make any reimbursements to the Fund.
As of June 30, 2011, the amounts owed to affiliates were approximately $774,600, $164,000 and $21,100 for management, distribution and service, and transfer agent fees, respectively.
E. Line of Credit Facility — As of June 30, 2011, the Fund participated in a $580,000,000 committed, unsecured revolving line of credit facility (the “facility”) together with other funds of the Trust and registered investment companies having management agreements with GSAM or its affiliates. Pursuant to the terms of the facility, the Fund and other borrowers could increase the credit amount by an additional $340,000,000, for a total of up to $920,000,000. This facility is to be used solely for temporary or emergency purposes. The interest rate on borrowings is based on the federal funds rate. The facility also requires a fee to be paid by the Fund based on the amount of the commitment that has not been utilized. For the six months ended June 30, 2011, the Fund did not have any borrowings under the facility.
F. Other Transactions with Affiliates — For the six months ended June 30, 2011, Goldman Sachs earned approximately $14,500 in brokerage commissions from portfolio transactions on behalf of the Fund.
| 5. PORTFOLIO SECURITIES TRANSACTIONS |
The cost of purchases and proceeds from sales and maturities of long-term securities for the six months ended June 30, 2011, were $493,693,691 and $400,988,669, respectively.
| 6. TAX INFORMATION |
As of the Fund’s most recent fiscal year end, December 31, 2010, the Fund’s capital loss carryforwards on a tax-basis were as follows:
Capital loss carryforward:(1) | ||||
| Expiring 2016 | $ | (1,262,514 | ) | |
| Expiring 2017 | (99,804,144 | ) | ||
| Total capital loss carryforward | $ | (101,066,658 | ) | |
| (1) | Expiration occurs on December 31 of the year indicated. |
As of June 30, 2011, the Fund’s aggregate security unrealized gains and losses based on cost for U.S. federal income tax purposes were as follows:
| Tax cost | $ | 1,225,458,052 | ||
| Gross unrealized gain | 137,259,315 | |||
| Gross unrealized loss | (39,802,799 | ) | ||
| Net unrealized security gain | $ | 97,456,516 | ||
The difference between GAAP-basis and tax-basis unrealized gains (losses), as of the most recent fiscal year end, is attributable primarily to wash sales.
GSAM has reviewed the Fund’s tax positions for all open tax years (the current and prior three years, as applicable) and has concluded that no provision for income tax is required in the Fund’s financial statements. Such open tax years remain subject to examination and adjustment by tax authorities.
GOLDMAN SACHS VARIABLE INSURANCE TRUST LARGE CAP VALUE FUND
| 6. TAX INFORMATION (continued) |
Under the recently enacted Regulated Investment Company Modernization Act of 2010, the Fund will be permitted to carry forward capital losses incurred in taxable years beginning after December 22, 2010 for an unlimited period. However, any losses incurred during those future taxable years will be required to be utilized prior to the losses incurred in pre-enactment taxable years. As a result of this ordering rule, pre-enactment capital loss carryforwards may be more likely to expire unused. Additionally, post-enactment capital losses that are carried forward will retain their character as either short-term or long-term capital losses rather than being considered all short-term as under previous law.
| 7. OTHER RISKS |
Fund’s Shareholder Concentration Risk — Certain participating insurance companies, accounts, or Goldman Sachs affiliates may from time to time own (beneficially or of record) or control a significant percentage of the Fund’s shares. Redemptions by these entities of their holdings in the Fund may impact the Fund’s liquidity and NAV. These redemptions may also force the Fund to sell securities.
Liquidity Risk — The Fund may make investments that may be illiquid or that may become less liquid in response to market developments or adverse investor perceptions. Liquidity risk may also refer to the risk that a Fund will not be able to pay redemption proceeds within the allowable time period because of unusual market conditions, an unusually high volume of redemption requests, or other reasons. To meet redemption requests, a Fund may be forced to sell investments at an unfavorable time and/or under unfavorable conditions.
Market and Credit Risks — In the normal course of business, the Fund trades financial instruments and enters into financial transactions where risk of potential loss exists due to changes in the market (market risk). Additionally, the Fund may also be exposed to credit risk in the event that an issuer fails to perform or that an institution or entity with which the Fund has unsettled or open transaction defaults.
| 8. INDEMNIFICATIONS |
Under the Trust’s organizational documents, its trustees, officers, employees and agents are indemnified, to the extent permitted by the Act, against certain liabilities that may arise out of performance of their duties to the Fund. Additionally, in the course of business, the Fund enters into contracts that contain a variety of indemnification clauses. The Fund’s maximum exposure under these arrangements is unknown, as this would involve future claims that may be made against the Fund that have not yet occurred. However, GSAM believes the risk of loss under these arrangements to be remote.
| 9. SUBSEQUENT EVENTS |
Subsequent events after the balance sheet date have been evaluated through the date the financial statements were issued. GSAM has concluded that there is no impact requiring adjustment or disclosure in the financial statements.
GOLDMAN SACHS VARIABLE INSURANCE TRUST LARGE CAP VALUE FUND
Notes to Financial Statements (continued)
June 30, 2011 (Unaudited)
| 10. SUMMARY OF SHARE TRANSACTIONS |
Share activity is as follows:
| For the Six Months Ended | ||||||||||||||||
| June 30, 2011 | For the Fiscal Year Ended | |||||||||||||||
| (Unaudited) | December 31, 2010 | |||||||||||||||
| Shares | Dollars | Shares | Dollars | |||||||||||||
Institutional Shares | ||||||||||||||||
| Shares sold | 2,340,368 | $ | 24,834,651 | 7,156,994 | $ | 65,134,638 | ||||||||||
| Reinvestment of distributions | — | — | 386,622 | 3,935,813 | ||||||||||||
| Shares redeemed | (6,461,000 | ) | (68,717,099 | ) | (10,612,256 | ) | (100,508,688 | ) | ||||||||
| (4,120,632 | ) | (43,882,448 | ) | (3,068,640 | ) | (31,438,237 | ) | |||||||||
Service Shares | ||||||||||||||||
| Shares sold | 16,966,248 | 179,937,054 | 31,182,290 | 290,306,594 | ||||||||||||
| Reinvestment of distributions | — | — | 390,340 | 3,969,754 | ||||||||||||
| Shares redeemed | (6,867,628 | ) | (72,790,897 | ) | (8,012,106 | ) | (76,402,473 | ) | ||||||||
| 10,098,620 | 107,146,157 | 23,560,524 | 217,873,875 | |||||||||||||
NET INCREASE | 5,977,988 | $ | 63,263,709 | 20,491,884 | $ | 186,435,638 | ||||||||||
GOLDMAN SACHS VARIABLE INSURANCE TRUST LARGE CAP VALUE FUND
Statement Regarding Basis for Approval of Management Agreement (Unaudited)
Background
The Goldman Sachs Large Cap Value Fund (the “Fund”) is an investment portfolio of Goldman Sachs Variable Insurance Trust (the “Trust”). The Board of Trustees oversees the management of the Trust and reviews the investment performance and expenses of the Fund at regularly scheduled meetings held during the year. In addition, the Board of Trustees determines annually whether to approve the continuance of the Trust’s investment management agreement (the “Management Agreement”) with Goldman Sachs Asset Management, L.P. (the “Investment Adviser”) on behalf of the Fund.
The Management Agreement was most recently approved for continuation until June 30, 2012 by the Board of Trustees, including those Trustees who are not parties to the Management Agreement or “interested persons” (as defined in the Investment Company Act of 1940, as amended) of any party thereto (the “Independent Trustees”), at a meeting held on June 15-16, 2011 (the “Annual Meeting”).
The review process undertaken by the Trustees spans the course of the year and culminates with the Annual Meeting. To assist the Trustees in their deliberations, the Trustees have established a Contract Review Committee (the “Committee”), comprised of the Independent Trustees. The Committee held three meetings over the course of the year since the Management Agreement was last approved. At those Committee meetings, regularly scheduled Board meetings and/or the Annual Meeting, the Board, or the Independent Trustees, as applicable, considered matters relating to the Management Agreement, including:
| (a) | the nature and quality of the advisory, administrative and other services provided to the Fund by the Investment Adviser and its affiliates, including information about: |
| (i) | the structure, staff and capabilities of the Investment Adviser and its portfolio management teams; | |
| (ii) | the groups within the Investment Adviser and its affiliates that support the portfolio management teams or provide other types of necessary services, including fund services groups (e.g., accounting and financial reporting, tax, shareholder services and operations), controls and risk management groups (e.g., legal, compliance, valuation oversight, credit risk management, internal audit, market risk analysis, finance and strategy and central funding), sales and distribution support groups and others (e.g., information technology and training); | |
| (iii) | trends in headcount; | |
| (iv) | the Investment Adviser’s financial resources and ability to hire and retain talented personnel and strengthen its operations; and | |
| (v) | the parent company’s support of the Investment Adviser and its mutual fund business, as expressed by the firm’s senior management; |
| (b) | information on the investment performance of the Fund, including comparisons to the performance of similar mutual funds, as provided by a third party mutual fund data provider engaged as part of the contract review process (the “Outside Data Provider”), its benchmark performance index, a comparable institutional composite managed by the Investment Adviser, and general investment outlooks in the markets in which the Fund invests; | |
| (c) | the terms of the Management Agreement and agreements with affiliated service providers entered into by the Trust on behalf of the Fund; | |
| (d) | expense information for the Fund, including: |
| (i) | the relative management fee and expense level of the Fund as compared to those of comparable funds managed by other advisers, as provided by the Outside Data Provider; | |
| (ii) | the Fund’s expense trends over time; and | |
| (iii) | to the extent the Investment Adviser manages institutional accounts or collective investment vehicles having investment objectives and policies similar to those of the Fund, comparative information on the advisory fees charged and services provided to those accounts by the Investment Adviser; |
| (e) | with respect to the extensive investment performance and expense comparison data provided by the Outside Data Provider, its processes in producing that data for the Fund; | |
| (f) | the undertakings of the Investment Adviser to waive certain fees and reimburse certain expenses of the Fund that exceed a specified level, and a summary of contractual fee reductions made by the Investment Adviser and its affiliates over the past several years with respect to the Fund; |
GOLDMAN SACHS VARIABLE INSURANCE TRUST LARGE CAP VALUE FUND
Statement Regarding Basis for Approval of Management Agreement (Unaudited) (continued)
| (g) | information relating to the profitability of the Management Agreement and the transfer agency and distribution and service arrangements of the Fund and the Trust as a whole to the Investment Adviser and its affiliates; | |
| (h) | whether the Fund’s existing management fee schedule adequately addressed any economies of scale; | |
| (i) | a summary of the “fall-out” benefits derived by the Investment Adviser and its affiliates from their relationships with the Fund, including the fees received by the Investment Adviser’s affiliates from the Fund for transfer agency, portfolio brokerage, distribution and other services; | |
| (j) | a summary of potential benefits derived by the Fund as a result of its relationship with the Investment Adviser; | |
| (k) | information regarding commissions paid by the Fund, an update on the Investment Adviser’s soft dollars practices, other information regarding portfolio trading and how the Investment Adviser carries out its duty to seek best execution; | |
| (l) | the manner in which portfolio manager compensation is determined, and the number and types of accounts managed by the portfolio managers; | |
| (m) | the nature and quality of the services provided to the Fund by its unaffiliated service providers, and the Investment Adviser’s general oversight and evaluation (including reports on due diligence) of those service providers as part of the administration services provided under the Management Agreement; and | |
| (n) | the Investment Adviser’s processes and policies addressing various types of potential conflicts of interest; its approach to risk management; the annual review of the effectiveness of the Fund’s compliance program; and compliance reports. |
The Trustees also received an overview of the Fund’s distribution arrangements. They received information regarding the Fund’s assets, share purchase and redemption activity and the payment of Rule 12b-1 distribution and service fees by the Fund’s Service Shares. Information was also provided to the Trustees relating to revenue sharing payments made by and services provided by the Investment Adviser and its affiliates to intermediaries that promote the sale, distribution and/or servicing of Fund shares.
The presentations made at the Board and Committee meetings and at the Annual Meeting encompassed the Fund and other mutual fund portfolios for which the Board of Trustees has responsibility. In evaluating the Management Agreement at the Annual Meeting, the Trustees relied upon their knowledge, resulting from their meetings and other interactions throughout the year, of the Investment Adviser, its affiliates, their services and the Fund. In conjunction with these meetings, the Trustees received written materials and oral presentations on the topics covered, and were advised by their independent legal counsel regarding their responsibilities and other regulatory requirements related to the approval and continuation of mutual fund investment management agreements under applicable law. In addition, the Investment Adviser and its affiliates provided the Independent Trustees with a written response to a formal request for information sent on behalf of the Independent Trustees by their independent legal counsel. During the course of their deliberations, the Independent Trustees met in executive sessions with their independent legal counsel, without representatives of the Investment Adviser or its affiliates present. The Independent Trustees also discussed the broad range of other investment choices that are available to Fund investors, including the availability of comparable funds managed by other advisers.
Nature, Extent and Quality of the Services Provided Under the Management Agreement
As part of their review, the Trustees considered the nature, extent and quality of the services provided by the Investment Adviser. In this regard, the Trustees considered both the investment advisory services, and the other, non-advisory services, that are provided to the Fund by the Investment Adviser and its affiliates. The Trustees noted the transition in the leadership and changes in personnel of various portfolio management teams that had occurred in recent periods, the potential benefit to the Fund of recent increases in headcount at the Investment Adviser and the ongoing recruitment efforts aimed at bringing high quality investment talent to the Investment Adviser. The Independent Trustees concluded that the Investment Adviser had committed substantial financial and operational resources to the Fund and expressed confidence that the Investment Adviser would continue to do so in the future. The Trustees also observed that the Investment Adviser had made significant commitments to address regulatory compliance requirements applicable to the Fund and the Investment Adviser.
GOLDMAN SACHS VARIABLE INSURANCE TRUST LARGE CAP VALUE FUND
Statement Regarding Basis for Approval of Management Agreement (Unaudited) (continued)
Investment Performance
The Trustees also considered the investment performance of the Fund and the Investment Adviser. In this regard, they compared the Fund to its peers using the performance rankings and ratings compiled by the Outside Data Provider as of December 31, 2010, and updated performance information prepared by the Investment Adviser using the peer group identified by the Outside Data provider. The information on the Fund’s investment performance was provided for the one-, three-, five- and ten-year periods ending on the applicable dates. The Trustees also reviewed the Fund’s investment performance over time on a year-by-year basis relative to its performance benchmark. In addition, they considered the investment performance trends of the Fund over time, and reviewed the investment performance of the Fund in light of its investment objective and policies, and market conditions. The Trustees also received information comparing the Fund’s performance to that of a comparable institutional composite managed by the Investment Adviser. The Trustees considered whether the Fund had operated within its investment policies and had complied with its investment limitations.
In addition, the Trustees considered materials prepared and presentations made by the Investment Adviser’s senior management and portfolio management personnel, in which Fund performance was assessed. The Trustees also considered the Investment Adviser’s periodic reports with respect to the Fund’s risk profile, and how the Investment Adviser’s approach to risk monitoring and management influences portfolio management.
The Independent Trustees observed that the Fund had underperformed its benchmark index and had placed in the fourth quartile of its peer group for the one-year period ended May 31, 2011. The Independent Trustees also noted that the Fund had ranked in the top half of its peer group for the ten-year period ended May 31, 2011. The Independent Trustees noted that they had communicated concerns regarding the performance of the Fund to GSAM senior management and had received assurances that measures would continue to be taken to address the Fund’s performance.
Costs of Services Provided and Competitive Information
The Trustees considered the contractual fee rates payable by the Fund under the Management Agreement. In this regard, the Trustees considered information on the services rendered by the Investment Adviser to the Fund, which included both advisory and administrative services that were directed to the needs and operations of the Fund as a registered mutual fund.
In particular, the Trustees reviewed analyses prepared by the Outside Data Provider regarding the expense rankings of the Fund. The analyses provided a comparison of the Fund’s management fees and breakpoints to those of a relevant peer group and category universe; an expense analysis which compared the Fund’s expenses to a peer group and a category universe; and a four-year history comparing the Fund’s expenses to the peer and category medians. The analyses also compared the Fund’s transfer agency fees, custody and accounting fees, distribution fees, other expenses and fee waivers/reimbursements to those of other funds in the peer group and the peer group median. The Trustees concluded that the comparisons provided by the Outside Data Provider were useful in evaluating the reasonableness of the management fees and total expenses paid by the Fund.
In addition, the Trustees considered the Investment Adviser’s undertakings to waive a portion of its management fee and limit the Fund’s “other expenses” ratio (excluding certain expenses) to a certain specified level. They also considered, to the extent that the Investment Adviser manages institutional accounts or collective investment vehicles having investment objectives and policies similar to those of the Fund, comparative fee information for services provided by the Investment Adviser to those accounts, and information that indicated that services provided to the Fund differed in various significant respects from the services provided to institutional accounts, which generally operated under less stringent legal and regulatory structures, required fewer services from the Investment Adviser to a smaller number of client contact points, were less time-intensive and paid lower fees. By contrast, the Trustees noted that the Investment Adviser provides substantial administrative services to the Fund under the terms of the Management Agreement.
In addition, the Trustees noted that shareholders are able to redeem their Fund shares at any time if they believe that the Fund fees and expenses are too high or if they are dissatisfied with the performance of the Fund.
GOLDMAN SACHS VARIABLE INSURANCE TRUST LARGE CAP VALUE FUND
Statement Regarding Basis for Approval of Management Agreement (Unaudited) (continued)
Profitability
The Trustees reviewed the Investment Adviser’s revenues and pre-tax profit margins with respect to the Trust and the Fund. In this regard the Trustees noted that they had received, among other things, profitability analyses and summaries, revenue and expense schedules by Fund and by function (i.e., investment management, transfer agency and distribution and service) and the Investment Adviser’s expense allocation methodology. They observed that the profitability and expense figures are substantially similar to those used by the Investment Adviser for many internal purposes, including compensation decisions among various business groups, and are thus subject to a vigorous internal debate about how certain revenue and expenses should be allocated. The Trustees also reviewed the report of the internal audit group within the Goldman Sachs organization, which included an assessment of the reasonableness and consistency of the Investment Adviser’s expense allocation methodology and an evaluation of the accuracy of the Investment Adviser’s profitability analysis calculations. Profitability data for the Trust and the Fund were provided for 2010 and 2009, and the Trustees considered this information in relation to the Investment Adviser’s overall profitability. The Trustees considered the Investment Adviser’s revenues and pre-tax profit margins both in absolute terms and in comparison to information on the reported pre-tax profit margins earned by certain other asset management firms.
Economies of Scale
The Trustees considered the information that had been provided regarding the Investment Adviser’s profitability and the rationale for the Fund’s breakpoint structure. The Trustees also considered the breakpoints in the fee rate payable under the Management Agreement for the Fund at the following annual percentage rates of the average daily net assets of the Fund:
| First $1 billion | 0.75 | % | ||
| Next $1 billion | 0.68 | |||
| Next $3 billion | 0.65 | |||
| Next $3 billion | 0.64 | |||
| Over $8 billion | 0.63 |
The Trustees noted that the breakpoints at the $5 and $8 billion asset levels had been proposed by the Investment Adviser and approved by the Trustees in 2008 to further share potential economies of scale, if any, with the Fund and its shareholders as assets under management reach those asset levels. The Trustees considered the amounts of assets in the Fund; the Fund’s recent share purchase and redemption activity; the information provided by the Investment Adviser relating to the costs of the services provided by the Investment Adviser and its affiliates and their realized profits; information comparing fee rates charged by the Investment Adviser with fee rates charged to other funds in the peer group; and the Investment Adviser’s undertakings to limit the Fund’s fees and “other expenses” ratio (excluding certain expenses) to certain amounts. Upon reviewing these matters at the Annual Meeting, the Trustees concluded that the fee breakpoints represented a means of assuring that benefits of scalability would be passed along to shareholders at the specified asset levels.
Other Benefits to the Investment Adviser and Its Affiliates
The Trustees also considered the other benefits derived by the Investment Adviser and its affiliates from their relationship with the Fund as stated above, including: (a) transfer agency fees received by Goldman, Sachs & Co. (“Goldman Sachs”); (b) brokerage and futures commissions earned by Goldman Sachs for executing securities and futures transactions on behalf of the Fund; (c) research received by the Investment Adviser from broker-dealers in exchange for executing certain transactions on behalf of the Fund; (d) trading efficiencies resulting from aggregation of orders of the Fund with those for other funds or accounts managed by the Investment Adviser; (e) the Investment Adviser’s ability to leverage the infrastructure designed to service the Fund on behalf of its other clients; (f) the Investment Adviser’s ability to cross-market other products and services to Fund shareholders; (g) Goldman Sachs’ retention of certain fees as Fund Distributor; (h) the Investment Adviser’s ability to negotiate better pricing with custodians on behalf of its other clients, as a result of the relationship with the Fund; and (i) the possibility that the working relationship between the Investment Adviser and the Fund’s third party service providers may cause those service providers to be open to doing business with other areas of Goldman Sachs. In the course of considering the foregoing, the Independent Trustees requested and received further information quantifying certain of the fall-out benefits.
GOLDMAN SACHS VARIABLE INSURANCE TRUST LARGE CAP VALUE FUND
Statement Regarding Basis for Approval of Management Agreement (Unaudited) (continued)
Other Benefits to the Fund and Its Shareholders
The Trustees also noted that the Fund receives certain potential benefits as a result of its relationship with the Investment Adviser, including: (a) trading efficiencies resulting from aggregation of orders of the Fund with those of other funds or accounts managed by the Investment Adviser; (b) improved servicing and pricing from vendors because of the volume of business generated by the Investment Adviser and its affiliates; (c) improved servicing from broker-dealers because of the volume of business generated by the Investment Adviser and its affiliates; (d) the Investment Adviser’s ability to negotiate favorable terms with derivatives counterparties as a result of the size and reputation of the Goldman Sachs organization; (e) the advantages gained from the Investment Adviser’s knowledge and experience gained from managing other accounts and products; (f) the Investment Adviser’s ability to hire and retain qualified personnel to provide services to the Fund because of the reputation of the Goldman Sachs organization; (g) the Fund’s access, through the Investment Adviser, to certain firmwide resources (e.g., proprietary databases); and (h) the Fund’s access to certain affiliated distribution channels. The Trustees noted the competitive nature of the mutual fund marketplace, and noted further that many of the Fund’s shareholders invested in the Fund in part because of the Fund’s relationship with the Investment Adviser and that those shareholders have a general expectation that the relationship will continue.
Conclusion
In connection with their consideration of the Management Agreement, the Trustees gave weight to each of the factors described above, but did not identify any particular factor as controlling their decision. After deliberation and consideration of all of the information provided, including the factors described above, the Trustees concluded, in the exercise of their business judgment, that the management fees paid by the Fund were reasonable in light of the services provided to it by the Investment Adviser, the Investment Adviser’s costs and the Fund’s current and reasonably foreseeable asset levels. The Trustees unanimously concluded that the Investment Adviser’s continued management likely would benefit the Fund and its shareholders and that the Management Agreement should be approved and continued with respect to the Fund until June 30, 2012.
GOLDMAN SACHS VARIABLE INSURANCE TRUST LARGE CAP VALUE FUND
Fund Expenses — Six Month Period Ended June 30, 2011 (Unaudited)
As a shareholder of Institutional or Service Shares of the Fund, you incur ongoing costs, including management fees; distribution and service (12b-1) fees (with respect to Service Shares); and other Fund expenses. This example is intended to help you understand your ongoing costs (in dollars) of investing in the Institutional Shares and Service Shares of the Fund and to compare these costs with the ongoing costs of investing in other mutual funds.
The example is based on an investment of $1,000 invested at the beginning of the period and held for the entire period from January 1, 2011 through June 30, 2011.
Actual Expenses — The first line under each share class in the table below provides information about actual account values and actual expenses. You may use the information in this line, together with the amount you invested, to estimate the expenses that you paid over the period. Simply divide your account value by $1,000 (for example, an $8,600 account value divided by $1,000=8.6), then multiply the result by the number in the first line under the heading entitled “Expenses Paid” to estimate the expenses you paid on your account during this period.
Hypothetical Example for Comparison Purposes — The second line under each share class in the table below provides information about hypothetical account values and hypothetical expenses based on the Fund’s actual net expense ratio and an assumed rate of return of 5% per year before expenses, which is not the Fund’s actual return. The hypothetical account values and expenses may not be used to estimate the actual ending account balance or expenses you paid for the period. You may use this information to compare the ongoing costs of investing in the Fund and other funds. To do so, compare this 5% hypothetical example with the 5% hypothetical examples that appear in the shareholder reports of the other funds.
Please note that the expenses shown in the table are meant to highlight your ongoing costs only. As a shareholder of the Fund, you do not incur any transaction costs, such as sales charges (loads), redemption fees, or exchange fees, but shareholders of other funds may incur such costs. The second line of the table is useful in comparing ongoing costs only, and will not help you determine the relative total costs of owning different funds whose shareholders may incur transaction costs.
| Expenses Paid | |||||||||||||||
| for the | |||||||||||||||
| Beginning | Ending | 6 Months | |||||||||||||
| Account Value | Account Value | Ended | |||||||||||||
| Share Class | 1/01/11 | 6/30/11 | 6/30/11* | ||||||||||||
Institutional | |||||||||||||||
| Actual | $ | 1,000 | $ | 1,034.20 | $ | 3.98 | |||||||||
| Hypothetical 5% return | 1,000 | 1,020.88 | + | 3.96 | |||||||||||
Service | |||||||||||||||
| Actual | 1,000 | 1,032.30 | 5.24 | ||||||||||||
| Hypothetical 5% return | 1,000 | 1,019.64 | + | 5.21 | |||||||||||
| * | Expenses for each share class are calculated using the Fund’s annualized net expense ratio for each class, which represents the ongoing expenses as a percentage of net assets for the six months ended June 30, 2011. Expenses are calculated by multiplying the annualized net expense ratio by the average account value for the period; then multiplying the result by the number of days in the most recent fiscal half year; and then dividing that result by the number of days in the fiscal year. The annualized net expense ratios for the period were 0.79% and 1.04% for Institutional and Service Shares, respectively. | |
| + | Hypothetical expenses are based on each Fund’s actual annualized net expense ratios and an assumed rate of return of 5% per year before expenses. |
| TRUSTEES | OFFICERS | |
| Ashok N. Bakhru, Chairman Donald C. Burke John P. Coblentz, Jr. Diana M. Daniels Joseph P. LoRusso James A. McNamara Jessica Palmer Alan A. Shuch Richard P. Strubel | James A. McNamara, President George F. Travers, Principal Financial Officer Peter V. Bonanno, Secretary Scott M. McHugh, Treasurer | |
| GOLDMAN, SACHS & CO. Distributor and Transfer Agent | ||
| GOLDMAN SACHS ASSET MANAGEMENT, L.P. Investment Adviser 200 West Street, New York New York 10282 | ||
| Visit our website at www.goldmansachsfunds.com/vit to obtain the most recent month-end returns. | ||
| The reports concerning the Fund included in this shareholder report may contain certain forward-looking statements about the factors that may affect the performance of the Fund in the future. These statements are based on Fund management’s predictions and expectations concerning certain future events and their expected impact on the Fund, such as performance of the economy as a whole and of specific industry sectors, changes in the levels of interest rates, the impact of developing world events, and other factors that may influence the future performance of the Fund. Management believes these forward-looking statements to be reasonable, although they are inherently uncertain and difficult to predict. Actual events may cause adjustments in portfolio management strategies from those currently expected to be employed. | ||
| A description of the policies and procedures that the Fund uses to determine how to vote proxies relating to portfolio securities and information regarding how the Fund voted proxies relating to portfolio securities during the most recent 12-month period ended June 30 is available (i) without charge, upon request by calling 1-800-621-2550; and (ii) on the Securities and Exchange Commission (“SEC”) website at http://www.sec.gov. | ||
| The Fund files its complete schedule of portfolio holdings with the SEC for the first and third quarters of each fiscal year on Form N-Q. The Fund’s Form N-Q is available on the SEC’s website at http://www.sec.gov within 60 days after the Fund’s first and third fiscal quarters. When available, the Fund’s Forms N-Q may be reviewed and copied at the SEC’s Public Reference Room in Washington, D.C. and information on the operation of the Public Reference Room may also be obtained by calling 1-800-SEC-0330. Forms N-Q may be obtained upon request and without charge by calling 1-800-621-2550. | ||
| Holdings and allocations shown may not be representative of current or future investments. Holdings and allocations may not include the Fund’s entire investment portfolio, which may change at any time. Fund holdings should not be relied on in making investment decisions and should not be construed as research or investment advice regarding particular securities. | ||
| Economic and market forecasts presented herein reflect our judgment as of the date of this presentation and are subject to change without notice. These forecasts do not take into account the specific investment objectives, restrictions, tax and financial situation or other needs of any specific client. Actual data will vary and may not be reflected here. These forecasts are subject to high levels of uncertainty that may affect actual performance. Accordingly, these forecasts should be viewed as merely representative of a broad range of possible outcomes. These forecasts are estimated, based on assumptions, and are subject to significant revision and may change materially as economic and market conditions change. Goldman Sachs has no obligation to provide updates or changes to these forecasts. Case studies and examples are for illustrative purposes only. | ||
| The Global Industry Classification Standard (“GICS”) was developed by and is the exclusive property and a service mark of Morgan Stanley Capital International Inc. (“MSCI”) and Standard & Poor’s, a division of The McGraw-Hill Companies, Inc. (“S&P”) and is licensed for use by Goldman Sachs. Neither MSCI, S&P nor any other party involved in making or compiling the GICS or any GICS classifications makes any express or implied warranties or representations with respect to such standard or classification (or the results to be obtained by the use thereof), and all such parties hereby expressly disclaim all warranties of originality, accuracy, completeness, merchantability or fitness for a particular purpose with respect to any of such standard or classification. Without limiting any of the foregoing, in no event shall MSCI, S&P, any of their affiliates or any third party involved in making or compiling the GICS or any GICS classifications have any liability for any direct, indirect, special, punitive, consequential or any other damages (including lost profits) even if notified of the possibility of such damages. | ||
| The portfolio risk management process includes an effort to monitor and manage risk, but does not imply low risk. | ||
| Shares of the Goldman Sachs VIT Funds are offered to separate accounts of participating life insurance companies for the purpose of funding variable annuity contracts and variable life insurance policies. Shares of the Fund are not offered directly to the general public. The variable annuity contracts and variable life insurance policies are described in the separate prospectuses issued by participating insurance companies. You should refer to those prospectuses for information about surrender charges, mortality and expense risk fees and other charges that may be assessed by participating insurance companies under the variable annuity contracts or variable life insurance policies. Such fees or charges, if any, may affect the return you may realize with respect to your investments. Ask your representative for more complete information. Please consider a fund’s objectives, risks and charges and expenses, and read the prospectus carefully before investing. The prospectus contains this and other information about the Fund. | ||
| This material is not authorized for distribution to prospective investors unless preceded or accompanied by a current Prospectus or summary prospectus, if applicable. Investors should consider a Fund’s objective, risks, and charges and expenses, and read the summary prospectus, if available, and/or the Prospectus carefully before investing or sending money. The summary prospectus, if available, and the Prospectus contain this and other information about a Fund and may be obtained from your authorized dealer or from Goldman, Sachs & Co. by calling 1-800-621-2550. | ||
| Toll Free (in U.S.): 800-292-4726 | ||
| This report is prepared for the general information of contract owners and is not an offer of shares of the Goldman Sachs Variable Insurance Trust: Goldman Sachs Large Cap Value Fund. | ||
| © 2011 Goldman Sachs. All rights reserved. | ||
| VITLCVSAR11/57740.MF.MED.TMPL/8/2011 | ||
Goldman
Sachs Variable Insurance Trust
Strategic Growth Fund
Semi-Annual Report
June 30, 2011
|
GOLDMAN SACHS VARIABLE INSURANCE TRUST STRATEGIC GROWTH FUND
Principal Investment Strategies and Risks
Shares of the Goldman Sachs Variable Insurance Trust — Goldman Sachs Strategic Growth Fund are offered to separate accounts of participating life insurance companies for the purpose of funding variable annuity contracts and variable life insurance policies. Shares of the Fund are not offered directly to the general public. The variable annuity contracts and variable life insurance policies are described in the separate prospectuses issued by participating insurance companies. You should refer to those prospectuses for information about surrender charges, mortality and expense risk fees and other charges that may be assessed by participating insurance companies under the variable annuity contracts or variable life insurance policies. Such fees or charges, if any, may affect the return you realize with respect to your investments. Ask your representative for more complete information. Please consider the Fund’s objective, risks and charges and expenses, and read the Prospectus carefully before investing. The Prospectus contains this and other information about the Fund.
GOLDMAN SACHS VARIABLE INSURANCE TRUST STRATEGIC GROWTH FUND
INVESTMENT OBJECTIVE
The Fund seeks long-term growth of capital.
Portfolio Management Discussion and Analysis
Below, the Goldman Sachs Growth Portfolio Management Team discusses the performance of the Goldman Sachs Variable Insurance Trust — Goldman Sachs Strategic Growth Fund (the “Fund”) and positioning for the six-month period ended June 30, 2011 (the “Reporting Period”).
How did the Fund perform during the Reporting Period?
During the Reporting Period, the Fund’s Institutional and Service Shares generated cumulative total returns of 3.58% and 3.42%, respectively. These returns compare to the 6.83% cumulative total return of the Fund’s benchmark, the Russell 1000® Growth Index* (with dividends reinvested) (the “Russell Index”), during the same time period.
What economic and market factors most influenced the equity markets as a whole during the Reporting Period?
U.S. equities continued their positive momentum from 2010 during the Reporting Period. However, most of the gains were generated during the first quarter of 2011, as improving trends in labor, housing, manufacturing and consumer confidence pointed to a continuation in the economic recovery. A positive trajectory in corporate earnings and cash flows and strong merger and acquisition activity further supported U.S. equity market performance. Indeed, despite great exogenous shocks in Middle East and North African turmoil, a series of disasters in Japan, political debate over collective bargaining rights in Wisconsin and the possible repeal of health care reform in Washington D.C., the U.S. equity markets rewarded investors with solid returns during the first quarter of 2011.
The broad U.S. equity markets experienced a much more volatile second quarter, rising to a three-year high in April before losing most of its early 2011 gains by mid-June and then recovering somewhat in the very last week of the Reporting Period. In early April, commodity prices declined and expectations ran high for strong corporate profit growth. However, while home construction rose modestly in May, housing and employment remained key weak spots in the U.S. economy. Concerns about Greece’s debt crisis also re-surfaced, the U.S. Congress wrangled over the U.S. debt ceiling, the Federal Reserve Board’s quantitative easing program was scheduled to expire on June 30, 2011, the impact of Japan’s natural and nuclear disasters worked its way through the global supply chain and deadly storms cut a wide swath of destruction across the midwestern and southern United States. In turn, the U.S. stock market felt pressured and lost ground. Toward the end of June, U.S. equity markets recovered from their May to mid-June decline on the heels of better than expected U.S. manufacturing activity, improved automobile sales and a short-term resolution of the sovereign debt crisis in Greece.
Despite this volatility, all sectors posted gains during the Reporting Period, with the exception of financials, which posted a negative return. Health care and energy led the way. Energy was, not surprisingly, impacted by the price of Brent crude oil, which peaked at more than $126 per barrel in April on supply disruption fears in North Africa and the Middle East before falling in June on weaker U.S. economic data and concerns about the pace of growth in China’s economy. Still, Brent crude oil prices ended the Reporting Period at more than $112 per barrel.
While all capitalization segments of the U.S. equity market advanced during the Reporting Period, mid-cap stocks, as measured by the Russell Midcap® Index, performed best, followed by large-cap and then small-cap stocks, as measured by the Russell 1000® Index and the Russell 2000® Index, respectively, which performed nearly in line with each other. Large-cap stocks were least successful relative to small-cap stocks in the information technology sector. Growth-oriented stocks outpaced value-oriented stocks across the capitalization spectrum.
What key factors were responsible for the Fund’s performance during the Reporting Period?
Stock selection overall detracted most from the Fund’s performance relative to the Russell Index during the Reporting Period.
| * | The Russell 1000 Growth Index is an unmanaged market capitalization weighted index of the 1000 largest U.S. companies with higher price-to-book ratios and higher forecasted growth values. The Index figures do not include any deduction for fees, expenses or taxes. It is not possible to invest directly in an unmanaged index. |
GOLDMAN SACHS VARIABLE INSURANCE TRUST STRATEGIC GROWTH FUND
Which equity market sectors most significantly affected Fund performance?
Effective stock selection in the information technology sector, an underweighted position in the lagging materials sector and an overweighted exposure to the strongly performing health care sector helped the Fund’s performance most relative to the Russell Index during the Reporting Period. Detracting from the Fund’s relative results most during the Reporting Period was stock selection in the consumer discretionary, financials and telecommunication services sectors, where company-specific issues weighed on certain holdings.
What were some of the Fund’s best-performing individual stocks?
The Fund benefited relative to the Russell Index from positions in MasterCard, a global payment services company; Xilinx, a semiconductor chip company; and Biogen Idec, a biomedical company.
MasterCard’s shares rose after the Federal Reserve Board (the “Fed”) announced its final decision on debit interchange rates (i.e. charges on debit card transactions) as part of the Durbin amendment, which was more favorable for the company than the market had anticipated. At the end of the Reporting Period, we believed that the company’s large payment network and robust global footprint would allow it to benefit from the secular growth in cashless payments over the long term.
A position in Xilinx, a leader in programmable logic devices (PLDs), also contributed to the Fund’s relative performance. Shares of Xilinx rose after the company reported solid earnings growth and raised guidance for the next quarter. The PLD industry is a duopoly structure with high barriers to entry. As such, in our view, Xilinx should benefit from the long-term secular trends of PLDs taking share from application-specific integrated circuits (ASICs), an alternative semiconductor chip. We believe the addressable market for PLDs will likely continue to expand as they offer significant benefits over ASICs, such as lower development costs, shorter development time and upgradability.
Shares of Biogen Idec rose during the Reporting Period after the company reported strong earnings as well as positive results from a late-stage clinical trial of its experimental multiple sclerosis drug. We decided to exit the Fund’s position in the company, as we believed our long-term thesis had played out, and, in our view, the stock price reflected the value of the company’s drug pipeline at the time of sale.
Which stocks detracted significantly from the Fund’s performance during the Reporting Period?
Detracting most from the Fund’s results relative to its benchmark index were positions in office supply retailer Staples, derivatives exchange operator CME Group and fiduciary bank Northern Trust.
Shares of Staples declined during the Reporting Period after the company reported its second consecutive quarter of disappointing results. The company reported earnings that were below consensus estimates and lowered guidance for 2011. Staples’ management indicated that the company has been facing margin pressure, an issue that we view as transitory. Indeed, at the end of the Reporting Period, we maintained the Fund’s position in Staples because we believe the company is aggressively pricing some of its products in the U.S., which may enable it to gain market share. It is also our belief that recent actions taken by Staples’ management may pressure competitors to lower their prices, which should, in our view, have the greatest impact on companies that have limited margin flexibility. In short, we believe Staples may be in a position to gain market share going forward if competitors are weakened and the industry becomes more consolidated.
CME Group, the world’s largest futures and options exchange, detracted from the Fund’s relative performance during the Reporting Period due to uncertainty over volumes following the end of QE2, the Fed’s asset purchasing initiative referred to as quantitative easing. Despite these near-term headwinds, we believed at the end of the Reporting Period that CME Group will likely benefit from the migration of over-the-counter (OTC) derivatives markets to exchanges. Furthermore, we believe CME Group’s interest rate OTC clearing platform may well be a long-term growth driver for the company as it meets its customers’ demand for more transparency and less counterparty risk.
During the Reporting Period, shares of Northern Trust declined, as the company continued to be pressured by persistently low interest rates. Still, we maintained the Fund’s position in the fiduciary bank at the end of the Reporting Period, as Northern Trust, in our view, remains focused on expanding its business in core markets. Also, given the company’s solid balance sheet and cash position, we believe that Northern Trust’s management should begin to redeploy capital through stock buybacks and dividend increases.
How did the Fund use derivatives and similar investments during the Reporting Period?
During the Reporting Period, we did not use derivatives as part of an active management strategy. However, we used futures contracts, on an opportunistic basis, to ensure the portfolio remained almost fully exposed to equities following cash inflows or stock sales.
GOLDMAN SACHS VARIABLE INSURANCE TRUST STRATEGIC GROWTH FUND
Did the Fund make any significant purchases or sales during the Reporting Period?
We initiated a Fund position in American Express, a high quality global franchise with a strong brand name synonymous with credit cards and travel-related services. In our view, the stock was attractively valued at the time of purchase, as it was trading at a discount to its longer-term average multiple. Despite solid operating results, the stock had been pressured by uncertainty around the impact of financial regulation. We believed these conditions created an attractive entry point, as, in our view, American Express’ business prospects are still quite strong with high leverage to a turnaround in corporate hiring.
We established a Fund position in Emerson Electric, a leading diversified global manufacturing and technology company that designs and supplies products and services to industrial, commercial and consumer markets. The company holds dominant market share in many of its business areas and has exposure to growth opportunities within its automation and energy segments and emerging markets. In our view, the company’s position as a market leader is further enhanced by innovative research and development programs and its global low-cost footprint. Finally, in our view, Emerson Electric has an excellent management team with a history of strong execution, which may provide opportunities for expanding margins and potentially returning capital to shareholders.
We exited the Fund’s position in semiconductor company Broadcom, as we had become concerned that it was falling behind competitors in key technology areas that would affect its placement in upcoming product launches. While we maintained our belief that Broadcom has a strong management team and the resources required to regain its competitive position, our concerns led us to sell out of the Fund’s position.
We also eliminated the Fund’s position in Internet data networking products supplier Cisco Systems during the Reporting Period. The company continued to face competitive pressures in its switching business and, as a result, experienced a decline in margins. While we expect Cisco Systems to continue to be a leader in its markets over the long term, we believed there were other opportunities for investment with more attractive risk/return profiles.
Were there any notable changes in the Fund’s weightings during the Reporting Period?
In constructing the Fund’s portfolio, we focus on picking stocks rather than on making industry or sector bets. We seek to outpace the benchmark index by overweighting stocks that we expect to outperform and underweighting those that we think may lag. Consequently, changes in the Fund’s sector weights are generally the direct result of individual stock selection or of stock appreciation or depreciation. That said, during the Reporting Period, the Fund’s exposure to financials, industrials and information technology increased compared to the Russell Index. The Fund’s exposure compared to the benchmark index in consumer staples and health care decreased.
How was the Fund positioned relative to its benchmark index at the end of the Reporting Period?
As of June, 30 2011, the Fund had overweighted positions relative to the Russell Index in the financials, information technology and telecommunication services sectors. On the same date, the Fund had underweighted positions compared to the Russell Index in consumer staples, energy, industrials and materials and was rather neutrally weighted to the Russell Index in consumer discretionary, health care and utilities.
What is the Fund’s tactical view and strategy for the months ahead?
At the end of the Reporting Period, we believe the most significant factor for the U.S. equity markets during the remainder of the year should likely be the fallout from the scheduled completion of the Fed’s second round of quantitative easing at the end of June 2011. We believe the program has created a fertile environment for forward-looking stock pickers, as the momentum rally appears to have ended and we expect companies to begin to trade more in line with underlying fundamentals. In our view, the Fed’s actions have led to rising commodity costs and, in turn, we believe certain companies will be challenged to maintain cost structure without sacrificing revenue growth. We believe companies with strong brands and pricing power should best be able to pass along inflationary pressures and maintain margins throughout the economic recovery.
Given this view, we believe the Fund was well positioned at the end of the Reporting Period. We intend going forward to maintain our focus on seeking to identify those companies that can provide a differentiated product or service and those that may benefit from secular tailwinds. Such factors, we believe, should enable these companies to sustain growth without sacrificing price. As always, deep research resources, a forward-looking investment process and truly actively managed portfolios are keys, in our view, to both preserving capital and outperforming the market over the long term.
FUND BASICS
Strategic Growth Fund
as of June 30, 2011
| STANDARDIZED AVERAGE ANNUAL TOTAL RETURNS1 |
| For the period ended 6/30/11 | One Year | Five Years | Ten Years | Since Inception | Inception Date | |||||||||||||||
| Institutional | 25.54 | % | 3.48 | % | 1.34 | % | 2.63 | % | 4/30/98 | |||||||||||
| Service | 25.20 | 3.28 | N/A | 2.26 | 1/09/06 | |||||||||||||||
| 1 | The Standardized Average Annual Total Returns are average annual total returns as of the most recent calendar quarter-end. They assume reinvestment of all distributions at net asset value (“NAV”). | |
| Total return figures in the above chart represent past performance and do not indicate future results, which will vary. The investment return and principal value of an investment will fluctuate and, therefore, an investor’s shares, when redeemed, may be worth more or less than their original cost. Current performance may be lower or higher than the total return figures in the above chart. Please visit www.goldmansachsfunds.com/vit to obtain the most recent month-end returns. Performance reflects expense limitations in effect. In their absence, performance would be reduced. |
| EXPENSE RATIOS2 |
| Net Expense Ratio (Current) | Gross Expense Ratio (Before Waivers) | |||||||||
| Institutional | 0.82 | % | 0.86 | % | ||||||
| Service | 1.07 | % | 1.11 | |||||||
| 2 | The expense ratios of the Fund, both current (net of any fee waivers or expense limitations) and before waivers (gross of any fee waivers or expense limitations) are as set forth above. The Fund’s waivers and/or expense limitations will remain in place through at least April 29, 2012, and prior to such date the investment adviser may not terminate the arrangements without the approval of the Fund’s Board of Trustees. The expense ratios set forth above may differ from the expense ratios disclosed in the Financial Highlights in this report. |
| TOP TEN HOLDINGS AS OF 6/30/113 |
| Holding | % of Net Assets | Line of Business | ||||||
| Apple, Inc. | 5.1 | % | Technology Hardware & Equipment | |||||
| QUALCOMM, Inc. | 4.6 | Technology Hardware & Equipment | ||||||
| Schlumberger Ltd. | 4.5 | Energy | ||||||
| PepsiCo, Inc. | 3.6 | Food, Beverage & Tobacco | ||||||
| Oracle Corp. | 3.0 | Software & Services | ||||||
| Google, Inc. Class A | 3.0 | Software & Services | ||||||
| Xilinx, Inc. | 3.0 | Semiconductors & Semiconductor Equipment | ||||||
| American Tower Corp. Class A | 2.9 | Telecommunication Services | ||||||
| Lowe’s Companies, Inc. | 2.6 | Retailing | ||||||
| Costco Wholesale Corp. | 2.6 | Food & Staples Retailing | ||||||
| 3 | The top 10 holdings may not be representative of the Fund’s future investments. |
FUND BASICS
| FUND vs. BENCHMARK SECTOR ALLOCATIONS4 |
As of June 30, 2011
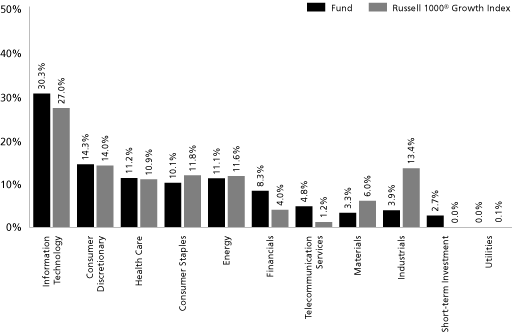
| 4 | The Fund is actively managed and, as such, its composition may differ over time. The above graph categorizes investments using Global Industry Classification Standard (“GICS”), however, the sector classifications used by the portfolio management team may differ from GICS. Consequently, the Fund’s overall industry sector allocations may differ from percentages contained in the graph above. The percentage shown for each investment category reflects the value of investments in that category as a percentage of market value. Short-term investments represent investments in investment companies other than those that are exchange traded. The above graph depicts the Fund’s investments but may not represent the Fund’s market exposure due to the exclusion of derivatives, if any, as listed in the Additional Investment Information section of the Schedule of Investments. |
GOLDMAN SACHS VARIABLE INSURANCE TRUST STRATEGIC GROWTH FUND
Schedule of Investments
June 30, 2011 (Unaudited)
| Shares | Description | Value | ||||||
Common Stocks – 97.1% | ||||||||
Capital Goods – 3.9% | ||||||||
| 92,500 | Danaher Corp. | $ | 4,901,575 | |||||
| 90,166 | Emerson Electric Co. | 5,071,838 | ||||||
| 91,337 | Raytheon Co. | 4,553,149 | ||||||
| 14,526,562 | ||||||||
Consumer Durables & Apparel – 2.2% | ||||||||
| 93,207 | NIKE, Inc. Class B | 8,386,766 | ||||||
Consumer Services – 2.3% | ||||||||
| 52,952 | Marriott International, Inc. Class A | 1,879,267 | ||||||
| 58,279 | McDonald’s Corp. | 4,914,085 | ||||||
| 36,300 | Yum! Brands, Inc. | 2,005,212 | ||||||
| 8,798,564 | ||||||||
Diversified Financials – 7.8% | ||||||||
| 138,458 | American Express Co. | 7,158,279 | ||||||
| 24,708 | CME Group, Inc. | 7,204,606 | ||||||
| 14,396 | IntercontinentalExchange, Inc.* | 1,795,325 | ||||||
| 163,506 | Morgan Stanley | 3,762,273 | ||||||
| 112,800 | Northern Trust Corp. | 5,184,288 | ||||||
| 260,430 | The Charles Schwab Corp. | 4,284,073 | ||||||
| 29,388,844 | ||||||||
Energy – 11.1% | ||||||||
| 59,061 | Cameron International Corp.* | 2,970,177 | ||||||
| 49,443 | Devon Energy Corp. | 3,896,603 | ||||||
| 138,155 | Halliburton Co. | 7,045,905 | ||||||
| 27,937 | National Oilwell Varco, Inc. | 2,184,953 | ||||||
| 40,146 | Occidental Petroleum Corp. | 4,176,790 | ||||||
| 194,622 | Schlumberger Ltd. | 16,815,341 | ||||||
| 108,134 | Southwestern Energy Co.* | 4,636,786 | ||||||
| 41,726,555 | ||||||||
Food & Staples Retailing – 2.6% | ||||||||
| 120,346 | Costco Wholesale Corp. | 9,776,909 | ||||||
Food, Beverage & Tobacco – 4.7% | ||||||||
| 190,500 | PepsiCo, Inc. | 13,416,915 | ||||||
| 60,700 | The Coca-Cola Co. | 4,084,503 | ||||||
| 17,501,418 | ||||||||
Health Care Equipment & Services – 3.1% | ||||||||
| 68,583 | Baxter International, Inc. | 4,093,719 | ||||||
| 157,534 | St. Jude Medical, Inc. | 7,511,221 | ||||||
| 11,604,940 | ||||||||
Household & Personal Products – 2.8% | ||||||||
| 244,458 | Avon Products, Inc. | 6,844,824 | ||||||
| 58,380 | The Procter & Gamble Co. | 3,711,217 | ||||||
| 10,556,041 | ||||||||
Materials – 3.3% | ||||||||
| 53,493 | Ecolab, Inc. | 3,015,935 | ||||||
| 85,269 | Praxair, Inc. | 9,242,307 | ||||||
| 12,258,242 | ||||||||
Media – 1.6% | ||||||||
| 121,574 | Viacom, Inc. Class B | 6,200,274 | ||||||
Pharmaceuticals, Biotechnology & Life Sciences – 8.1% | ||||||||
| 63,019 | Amgen, Inc.* | 3,677,159 | ||||||
| 105,753 | Gilead Sciences, Inc.* | 4,379,232 | ||||||
| 109,404 | Johnson & Johnson | 7,277,554 | ||||||
| 54,212 | Merck & Co., Inc. | 1,913,141 | ||||||
| 85,991 | Teva Pharmaceutical Industries Ltd. ADR | 4,146,486 | ||||||
| 141,080 | Thermo Fisher Scientific, Inc.* | 9,084,141 | ||||||
| 30,477,713 | ||||||||
Real Estate* – 0.5% | ||||||||
| 75,218 | CB Richard Ellis Group, Inc. Class A | 1,888,724 | ||||||
Retailing – 8.1% | ||||||||
| 105,200 | Bed Bath & Beyond, Inc.* | 6,140,524 | ||||||
| 422,774 | Lowe’s Companies, Inc. | 9,854,862 | ||||||
| 476,032 | Staples, Inc. | 7,521,306 | ||||||
| 91,297 | Target Corp. | 4,282,742 | ||||||
| 93,943 | Urban Outfitters, Inc.* | 2,644,495 | ||||||
| 30,443,929 | ||||||||
Semiconductors & Semiconductor Equipment – 3.5% | ||||||||
| 118,760 | NVIDIA Corp.* | 1,892,441 | ||||||
| 309,760 | Xilinx, Inc. | 11,296,947 | ||||||
| 13,189,388 | ||||||||
Software & Services – 13.8% | ||||||||
| 34,468 | Equinix, Inc.* | 3,481,957 | ||||||
| 22,487 | Google, Inc. Class A* | 11,386,967 | ||||||
| 31,965 | Mastercard, Inc. Class A | 9,632,333 | ||||||
| 332,847 | Microsoft Corp. | 8,654,022 | ||||||
| 346,400 | Oracle Corp. | 11,400,024 | ||||||
| 20,903 | Salesforce.com, Inc.* | 3,114,129 | ||||||
| 218,791 | The Western Union Co. | 4,382,384 | ||||||
| 52,051,816 | ||||||||
Technology Hardware & Equipment – 12.9% | ||||||||
| 86,871 | Amphenol Corp. Class A | 4,690,165 | ||||||
| 56,600 | Apple, Inc.* | 18,998,922 | ||||||
| 136,981 | NetApp, Inc.* | 7,229,857 | ||||||
| 306,868 | QUALCOMM, Inc. | 17,427,034 | ||||||
| 48,345,978 | ||||||||
Telecommunication Services* – 4.8% | ||||||||
| 210,121 | American Tower Corp. Class A | 10,995,632 | ||||||
| 173,668 | Crown Castle International Corp. | 7,083,918 | ||||||
| 18,079,550 | ||||||||
TOTAL COMMON STOCKS | ||||||||
(Cost $302,735,017) | $ | 365,202,213 | ||||||
GOLDMAN SACHS VARIABLE INSURANCE TRUST STRATEGIC GROWTH FUND
Schedule of Investments (continued)
June 30, 2011 (Unaudited)
| Shares | Rate | Value | ||||||||
Short-term Investment(a) – 2.7% | ||||||||||
| JPMorgan U.S. Government Money Market Fund — Capital Shares | ||||||||||
| 10,055,413 | 0.010 | % | $ | 10,055,413 | ||||||
(Cost $10,055,413) | ||||||||||
TOTAL INVESTMENTS – 99.8% | ||||||||||
(Cost $312,790,430) | $ | 375,257,626 | ||||||||
OTHER ASSETS IN EXCESS OF LIABILITIES – 0.2% | 749,464 | |||||||||
NET ASSETS – 100.0% | $ | 376,007,090 | ||||||||
The percentage shown for each investment category reflects the value of investments in that category as a percentage of net assets.
| * | Non-income producing security. | |
| (a) | Variable rate security. Interest rate disclosed is that which is in effect at June 30, 2011. |
Investment Abbreviation: | ||||
| ADR | — | American Depositary Receipt | ||
GOLDMAN SACHS VARIABLE INSURANCE TRUST STRATEGIC GROWTH FUND
Statement of Assets and Liabilities
June 30, 2011 (Unaudited)
Assets: | ||||
| Investments in securities, at value (identified cost $312,790,430) | $ | 375,257,626 | ||
| Receivables: | ||||
| Investment securities sold | 990,441 | |||
| Dividends | 350,047 | |||
| Fund shares sold | 89,234 | |||
| Other assets | 2,156 | |||
Total assets | 376,689,504 | |||
Liabilities: | ||||
| Payables: | ||||
| Amounts owed to affiliates | 282,430 | |||
| Fund shares redeemed | 276,538 | |||
| Accrued expenses | 123,446 | |||
Total liabilities | 682,414 | |||
Net Assets: | ||||
| Paid-in capital | 381,583,759 | |||
| Accumulated undistributed net investment income | 692,023 | |||
| Accumulated net realized loss from investment transactions | (68,735,888 | ) | ||
| Net unrealized gain on investments | 62,467,196 | |||
NET ASSETS | $ | 376,007,090 | ||
| Net Assets: | ||||
| Institutional | $ | 117,749,345 | ||
| Service | 258,257,745 | |||
| Total Net Assets | $ | 376,007,090 | ||
| Shares of beneficial interest outstanding $0.001 par value (unlimited shares authorized): | ||||
| Institutional | 9,465,552 | |||
| Service | 20,810,816 | |||
| Net asset value, offering and redemption price per share: | ||||
| Institutional | $12.44 | |||
| Service | 12.41 | |||
GOLDMAN SACHS VARIABLE INSURANCE TRUST STRATEGIC GROWTH FUND
Statement of Operations
For the Six Months Ended June 30, 2011 (Unaudited)
Investment income: | ||||
| Dividends | $ | 2,375,110 | ||
Expenses: | ||||
| Management fees | 1,368,630 | |||
| Distribution and Service fees — Service Class | 308,463 | |||
| Printing and mailing costs | 55,008 | |||
| Professional fees | 39,729 | |||
Transfer Agent fees(a) | 36,494 | |||
| Custody and accounting fees | 22,043 | |||
| Trustee fees | 7,886 | |||
| Registration fees | 615 | |||
| Other | 9,439 | |||
Total expenses | 1,848,307 | |||
| Less — expense reductions | (411 | ) | ||
Net expenses | 1,847,896 | |||
NET INVESTMENT INCOME | 527,214 | |||
Realized and unrealized gain from investment transactions: | ||||
| Net realized gain from: | ||||
| Investment transactions (including commissions recaptured of $10,105) | 3,820,648 | |||
| Net change in unrealized gain on: | ||||
| Investments | 8,140,124 | |||
Net realized and unrealized gain from investment transactions | 11,960,772 | |||
NET INCREASE IN NET ASSETS RESULTING FROM OPERATIONS | $ | 12,487,986 | ||
| (a) | Institutional and Service Shares had Transfer Agent fees of $11,819 and $24,675, respectively. |
GOLDMAN SACHS VARIABLE INSURANCE TRUST STRATEGIC GROWTH FUND
Statements of Changes in Net Assets
| For the | ||||||||
| Six Months Ended | For the | |||||||
| June 30, 2011 | Fiscal Year Ended | |||||||
| (Unaudited) | December 31, 2010 | |||||||
From operations: | ||||||||
| Net investment income | $ | 527,214 | $ | 1,088,321 | ||||
| Net realized gain from investment transactions | 3,820,648 | 21,832,558 | ||||||
| Net change in unrealized gain on investments | 8,140,124 | 11,387,154 | ||||||
Net increase in net assets resulting from operations | 12,487,986 | 34,308,033 | ||||||
Distributions to shareholders: | ||||||||
| From net investment income | ||||||||
| Institutional Shares | — | (490,173 | ) | |||||
| Service Shares | — | (435,824 | ) | |||||
Total distributions to shareholders | — | (925,997 | ) | |||||
From share transactions: | ||||||||
| Proceeds from sales of shares | 30,450,840 | 37,422,641 | ||||||
| Reinvestment of distributions | — | 925,997 | ||||||
| Cost of shares redeemed | (25,311,949 | ) | (58,517,681 | ) | ||||
Net increase (decrease) in net assets resulting from share transactions | 5,138,891 | (20,169,043 | ) | |||||
TOTAL INCREASE | 17,626,877 | 13,212,993 | ||||||
Net assets: | ||||||||
| Beginning of period | 358,380,213 | 345,167,220 | ||||||
| End of period | $ | 376,007,090 | $ | 358,380,213 | ||||
Accumulated undistributed net investment income | $ | 692,023 | $ | 164,809 | ||||
GOLDMAN SACHS VARIABLE INSURANCE TRUST STRATEGIC GROWTH FUND
Financial Highlights
Selected Data for a Share Outstanding Throughout Each Period
| Income (loss) from | ||||||||||||||||||||||||||||||||||||||||||||||||||
| investment operations | ||||||||||||||||||||||||||||||||||||||||||||||||||
| Net | Distributions | Ratio of | Ratio of | |||||||||||||||||||||||||||||||||||||||||||||||
| Net asset | realized | to shareholders | Net asset | Net assets, | Ratio of | total | net investment | |||||||||||||||||||||||||||||||||||||||||||
| value, | Net | and | Total from | from net | value, | end of | net expenses | expenses | income (loss) | Portfolio | ||||||||||||||||||||||||||||||||||||||||
| beginning | investment | unrealized | investment | investment | end of | Total | period | to average | to average | to average | turnover | |||||||||||||||||||||||||||||||||||||||
| Year - Share Class | of period | income (loss)(a) | gain (loss) | operations | income | period | return(b) | (in 000s) | net assets | net assets | net assets | rate | ||||||||||||||||||||||||||||||||||||||
FOR THE SIX MONTHS ENDED JUNE 30, (UNAUDITED) | ||||||||||||||||||||||||||||||||||||||||||||||||||
| 2011 - Institutional | $ | 12.01 | $ | 0.03 | $ | 0.40 | $ | 0.43 | $ | — | $ | 12.44 | 3.58 | % | $ | 117,749 | 0.84 | %(c) | 0.84 | %(c) | 0.45 | %(c) | 15 | % | ||||||||||||||||||||||||||
| 2011 - Service | 12.00 | 0.01 | 0.40 | 0.41 | — | 12.41 | 3.42 | 258,258 | 1.09 | (c) | 1.09 | (c) | 0.21 | (c) | 15 | |||||||||||||||||||||||||||||||||||
FOR THE FISCAL YEARS ENDED DECEMBER 31, | ||||||||||||||||||||||||||||||||||||||||||||||||||
| 2010 - Institutional | 10.89 | 0.05 | 1.12 | 1.17 | (0.05 | ) | 12.01 | 10.74 | 120,027 | 0.86 | 0.86 | 0.49 | 38 | |||||||||||||||||||||||||||||||||||||
| 2010 - Service | 10.88 | 0.03 | 1.11 | 1.14 | (0.02 | ) | 12.00 | 10.50 | 238,353 | 1.11 | 1.11 | 0.24 | 38 | |||||||||||||||||||||||||||||||||||||
| 2009 - Institutional | 7.40 | 0.03 | 3.50 | 3.53 | (0.04 | )(d) | 10.89 | 47.75 | 125,258 | 0.85 | 0.85 | 0.35 | 64 | |||||||||||||||||||||||||||||||||||||
| 2009 - Service | 7.39 | 0.01 | 3.50 | 3.51 | (0.02 | )(d) | 10.88 | 47.50 | 219,909 | 1.10 | 1.10 | 0.10 | 64 | |||||||||||||||||||||||||||||||||||||
| 2008 - Institutional | 12.73 | 0.02 | (5.34 | ) | (5.32 | ) | (0.01 | ) | 7.40 | (41.67 | ) | 95,218 | 0.81 | 0.81 | 0.20 | 44 | ||||||||||||||||||||||||||||||||||
| 2008 - Service | 12.73 | (0.01 | ) | (5.33 | ) | (5.34 | ) | — | 7.39 | (41.86 | ) | 167,930 | 1.06 | 1.06 | (0.05 | ) | 44 | |||||||||||||||||||||||||||||||||
| 2007 - Institutional | 11.58 | 0.02 | (e) | 1.15 | 1.17 | (0.02 | ) | 12.73 | 10.13 | 172,418 | 0.86 | (f) | 0.86 | (f) | 0.18 | (e)(f) | 53 | |||||||||||||||||||||||||||||||||
| 2007 - Service | 11.58 | 0.01 | (e) | 1.15 | 1.16 | (0.01 | ) | 12.73 | 10.01 | 343,100 | 0.96 | (f) | 1.11 | (f) | 0.08 | (e)(f) | 53 | |||||||||||||||||||||||||||||||||
| 2006 - Institutional | 10.68 | 0.01 | 0.90 | 0.91 | (0.01 | ) | 11.58 | 8.56 | 165,877 | 0.84 | 0.85 | 0.12 | 70 | |||||||||||||||||||||||||||||||||||||
| 2006 - Service (Commenced January 9, 2006) | 11.03 | — | (g) | 0.55 | 0.55 | — | (g) | 11.58 | 5.01 | 386,526 | 0.94 | (c) | 1.10 | (c) | 0.03 | (c) | 70 | |||||||||||||||||||||||||||||||||
| (a) | Calculated based on the average shares outstanding methodology. | |
| (b) | Assumes investment at the net asset value at the beginning of the period, reinvestment of all distributions and a complete redemption of the investment at the net asset value at the end of the period. Total returns for periods less than one full year are not annualized. | |
| (c) | Annualized. | |
| (d) | Includes a return of capital amounting to less than $0.005 per share. | |
| (e) | Reflects income recognized from non-recurring special dividends which amounted to $0.01 per share and 0.09% of average net assets. | |
| (f) | Includes non-recurring expense for a special shareholder proxy meeting which amounted to approximately 0.02% of average net assets. | |
| (g) | Amount is less than $0.005 per share. |
12
GOLDMAN SACHS VARIABLE INSURANCE TRUST STRATEGIC GROWTH FUND
Notes to Financial Statements
June 30, 2011 (Unaudited)
| 1. ORGANIZATION |
Goldman Sachs Variable Insurance Trust (the “Trust” or “VIT”) is a Delaware statutory trust registered under the Investment Company Act of 1940, as amended (the “Act”), as an open-end management investment company. The Trust includes the Goldman Sachs Strategic Growth Fund (the “Fund”). The Fund is a diversified portfolio under the Act offering two classes of shares — Institutional and Service.
Goldman Sachs Asset Management, L.P. (“GSAM”), an affiliate of Goldman, Sachs & Co. (“Goldman Sachs”), serves as investment adviser to the Fund pursuant to a management agreement (the “Agreement”) with the Trust.
| 2. SIGNIFICANT ACCOUNTING POLICIES |
The following is a summary of the significant accounting policies consistently followed by the Fund. The preparation of financial statements in conformity with accounting principles generally accepted in the United States of America (“GAAP”) requires management to make estimates and assumptions that may affect the amounts and disclosures in the financial statements. Actual results could differ from those estimates and assumptions.
A. Investment Valuation — The investment valuation policy of the Fund is to value investments at market value. Investments in equity securities and investment companies traded on a United States (“U.S.”) securities exchange or the NASDAQ system are valued daily at their last sale price or official closing price on the principal exchange or system on which they are traded. If no sale occurs, such securities and investment companies are valued at the last bid price for long positions and at the last ask price for short positions. Debt securities for which market quotations are readily available are valued on the basis of quotations furnished by an independent pricing service approved by the trustees or provided by securities dealers. The pricing services may use valuation models or matrix pricing, which consider: (i) yield or price with respect to bonds that are considered comparable in characteristics such as rating, interest rate and maturity date or (ii) quotations from securities dealers to determine current value. If accurate quotations are not readily available, or if GSAM believes that such quotations do not accurately reflect fair value, the fair value of the Fund’s investments may be determined based on yield equivalents, a pricing matrix or other sources, under valuation procedures established by the trustees. Unlisted equity securities for which market quotations are available are valued at the last sale price on the valuation date, or if no sale occurs, at the last bid price. In the absence of market quotations, broker quotes will be utilized or the security will be fair valued. Investments in investment companies (other than those that are exchange traded) are valued at the net asset value per share (“NAV”) of the investment company on the valuation date. Short-term debt obligations that mature in sixty days or less and that do not exhibit signs of credit deterioration are valued at amortized cost, which approximates market value.
GSAM, consistent with its procedures and applicable regulatory guidance, may make an adjustment to the previous closing prices of either domestic or foreign securities in light of significant events to reflect what it believes to be the fair value of the securities at the time of determining the Fund’s NAV. Significant events that could affect a large number of securities in a particular market may include, but are not limited to: situations relating to one or more single issuers in a market sector; significant fluctuations in U.S. or foreign markets; market dislocations; market disruptions or market closings; equipment failures; natural or man-made disasters or acts of God; armed conflicts; government actions or other developments; as well as the same or similar events which may affect specific issuers or the securities markets even though not tied directly to the securities markets. Other significant events that could relate to a single issuer may include, but are not limited to: corporate actions such as reorganizations, mergers and buy-outs; corporate announcements, including those relating to earnings, products and regulatory news; significant litigation; low trading volume; and trading limits or suspensions.
B. Security and Fund Share Transactions, and Investment Income — Security and Fund share transactions are reflected for financial reporting purposes as of the trade date, which may cause the NAV as stated in the accompanying financial statements to be different than the NAV applied to Fund share transactions. Realized gains and losses on sales of portfolio securities are calculated using the identified cost basis. Dividend income is recognized on the ex-dividend date, net of foreign withholding taxes, if any, which are reduced by any amounts reclaimable by the Fund, where applicable. Certain dividends from foreign securities will be recorded when the Fund is informed of the dividend, if such information is obtained subsequent to the ex-dividend date.
GOLDMAN SACHS VARIABLE INSURANCE TRUST STRATEGIC GROWTH FUND
Notes to Financial Statements (continued)
June 30, 2011 (Unaudited)
| 2. SIGNIFICANT ACCOUNTING POLICIES (continued) |
Interest income is recorded on the basis of interest accrued, premium amortized and discount accreted. In addition, it is the Fund’s policy to accrue for foreign capital gains taxes, if applicable, on certain foreign securities held by the Fund. An estimated foreign capital gains tax is recorded daily on net unrealized gains on these securities and is payable upon the sale of such securities when a gain is realized.
Investment income and unrealized and realized gains or losses are allocated daily to each class of shares of the Fund based upon the relative proportion of net assets of each class.
C. Expenses — Expenses incurred by the Fund, which may not specifically relate to the Fund, may be shared with other registered investment companies having management agreements with GSAM or its affiliates, as appropriate. These expenses are allocated to the Fund on a straight-line and/or pro-rata basis depending upon the nature of the expenses and are accrued daily. Non-class specific expenses are allocated daily to each share class of the respective Fund based upon the relative proportion of net assets of each class. Class specific expenses, where applicable, are borne by the respective share classes and include Distribution and Service, and Transfer Agent fees.
D. Federal Taxes and Distributions to Shareholders — It is the Fund’s policy to comply with the requirements of the Internal Revenue Code of 1986, as amended (the “Code”), applicable to regulated investment companies (mutual funds) and to distribute each year substantially all of its investment company taxable income and capital gains to its shareholders. Accordingly, the Fund is not required to make any provisions for the payment of federal income tax. Distributions to shareholders are recorded on the ex-dividend date. Income and capital gains distributions, if any, are declared and paid annually.
Net capital losses are carried forward to future fiscal years and may be used to the extent allowed by the Code to offset any future capital gains. Utilization of capital loss carryforwards will reduce the requirement of future capital gains distributions.
The characterization of distributions to shareholders for financial reporting purposes is determined in accordance with federal income tax rules, which may differ from GAAP. The source of the Fund’s distributions may be shown in the accompanying financial statements as either from net investment income, net realized gain or capital. Certain components of the Fund’s net assets on the Statement of Assets and Liabilities reflect permanent GAAP/tax differences based on the appropriate tax character.
E. Commission Recapture — The Fund may direct portfolio trades, subject to obtaining best execution, to various brokers who have agreed to rebate a portion of the commissions generated. Such rebates are made directly to the Fund as cash payments and are included in net realized gain (loss) from investments on the Statement of Operations.
| 3. FAIR VALUE OF INVESTMENTS |
The fair value of a financial instrument is the amount that would be received to sell an asset or paid to transfer a liability in an orderly transaction between market participants at the measurement date (i.e., the exit price). GAAP establishes a fair value hierarchy that prioritizes the inputs to valuation techniques used to measure fair value. The hierarchy gives the highest priority to unadjusted quoted prices in active markets for identical assets or liabilities (Level 1 measurements) and the lowest priority to unobservable inputs (Level 3 measurements). The three levels of the fair value hierarchy are described below:
Level 1 — Unadjusted quoted prices in active markets that are accessible at the measurement date for identical, unrestricted assets or liabilities;
Level 2 — Quoted prices in markets that are not active or financial instruments for which significant inputs are observable (including, but not limited to, quoted prices for similar securities, interest rates, foreign exchange rates, volatility and credit spreads), either directly or indirectly;
Level 3 — Prices or valuations that require significant unobservable inputs (including GSAM’s assumptions in determining fair value measurement).
GOLDMAN SACHS VARIABLE INSURANCE TRUST STRATEGIC GROWTH FUND
| 3. FAIR VALUE OF INVESTMENTS (continued) |
The following is a summary of the Fund’s investments categorized in the fair value hierarchy as of June 30, 2011:
| Investment Type | Level 1 | Level 2 | Level 3 | |||||||||
Assets | ||||||||||||
Common Stock and/or Other Equity Investments | $ | 365,202,213 | $ | — | $ | — | ||||||
| Short-term Investment | 10,055,413 | — | — | |||||||||
Total | $ | 375,257,626 | $ | — | $ | — | ||||||
| 4. AGREEMENTS AND AFFILIATED TRANSACTIONS |
A. Management Agreement — Under the Agreement, GSAM manages the Fund, subject to the general supervision of the trustees.
As compensation for the services rendered pursuant to the Agreement, the assumption of the expenses related thereto and administration of the Fund’s business affairs, including providing facilities, GSAM is entitled to a management fee, accrued daily and paid monthly, equal to an annual percentage rate of the Fund’s average daily net assets.
For the six months ended June 30, 2011, contractual and effective net management fees with GSAM were at the following rates:
| Contractual Management Rate | ||||||||||||||||||||||||
| First | Next | Next | Next | Over | Effective | Effective Net | ||||||||||||||||||
| $1 billion | $1 billion | $3 billion | $3 billion | $8 billion | Rate | Management Rate | ||||||||||||||||||
| 0.75% | 0.68 | % | 0.65 | % | 0.64 | % | 0.63 | % | 0.75 | % | 0.75 | %* | ||||||||||||
| * | Effective June 30, 2011, GSAM agreed to waive a portion of its management fee in order to achieve an effective net management rate of 0.71% through at least April 29, 2012. Prior to such date GSAM may not terminate the arrangement without the approval of the trustees. For the six months ended June 30, 2011, GSAM waived approximately $400 of the Fund’s management fee. |
B. Distribution and Service Plan — The Trust, on behalf of the Service Shares of the Fund, has adopted a Distribution and Service Plan (the “Plan”). Under the Plan, Goldman Sachs, which serves as distributor, is entitled to a fee accrued daily and paid monthly for distribution services, which may then be paid by Goldman Sachs to authorized dealers, equal to, on an annual basis, 0.25% of the Fund’s average daily net assets attributable to Service Shares.
C. Transfer Agency Agreement — Goldman Sachs also serves as the transfer agent of the Fund for a fee pursuant to a Transfer Agency Agreement. The fees charged for such transfer agency services are accrued daily and paid monthly at an annual rate of 0.02% of the average daily net assets for Institutional and Service Shares.
D. Other Expense Agreements and Affiliated Transactions — GSAM has agreed to limit certain “Other Expense” of the Fund (excluding management fees, distribution and service fees, transfer agent fees and expenses, taxes, interest, brokerage fees and litigation, indemnification, shareholder meetings and other extraordinary expenses, exclusive of any custody and transfer agent fee credit reductions) to the extent such expenses exceed, on an annual basis, 0.114% of the average daily net assets of the Fund. Such Other Expense reimbursements, if any, are accrued daily and paid monthly. In addition, the Fund is not obligated to reimburse GSAM for prior fiscal year expense reimbursements, if any. These Other Expense reimbursements will remain in place through at least April 29, 2012, and prior to such date GSAM may not terminate the arrangements without the approval of the trustees. For the six months ended June 30, 2011, GSAM did not make any reimbursements to the Fund.
As of June 30, 2011, the amounts owed to affiliates were approximately $225,000, $51,400 and $6,000 for management, distribution and service, and transfer agent fees, respectively.
E. Line of Credit Facility — As of June 30, 2011, the Fund participated in a $580,000,000 committed, unsecured revolving line of credit facility (the “facility”) together with other funds of the Trust and registered investment companies having management
GOLDMAN SACHS VARIABLE INSURANCE TRUST STRATEGIC GROWTH FUND
Notes to Financial Statements (continued)
June 30, 2011 (Unaudited)
| 4. AGREEMENTS AND AFFILIATED TRANSACTIONS (continued) |
agreements with GSAM or its affiliates. Pursuant to the terms of the facility, the Fund and other borrowers could increase the credit amount by an additional $340,000,000, for a total of up to $920,000,000. This facility is to be used solely for temporary or emergency purposes. The interest rate on borrowings is based on the federal funds rate. The facility also requires a fee to be paid by the Fund based on the amount of the commitment that has not been utilized. For the six months ended June 30, 2011, the Fund did not have any borrowings under the facility.
| 5. PORTFOLIO SECURITIES TRANSACTIONS |
The cost of purchases and proceeds from sales and maturities of long-term securities for the six months ended June 30, 2011, were $57,691,573 and $53,832,577, respectively.
| 6. TAX INFORMATION |
As of the Fund’s most recent fiscal year end, December 31, 2010, the Fund’s capital loss carryforwards on a tax-basis were as follows:
Capital loss carryforward:(1) | ||||
| Expiring 2011 | $ | (1,064,803 | ) | |
| Expiring 2016 | (23,475,963 | ) | ||
| Expiring 2017 | (43,614,413 | ) | ||
| Total capital loss carryforward | $ | (68,155,179 | ) | |
| (1) | Expiration occurs on December 31 of the year indicated. |
As of June 30, 2011, the Fund’s aggregate security unrealized gains and losses based on cost for U.S. federal income tax purposes were as follows:
| Tax cost | $ | 317,191,787 | ||
| Gross unrealized gain | 70,360,526 | |||
| Gross unrealized loss | (12,294,687 | ) | ||
| Net unrealized security gain | $ | 58,065,839 | ||
The difference between GAAP-basis and tax-basis unrealized gains (losses), as of the most recent fiscal year end, is attributable primarily to wash sales.
GSAM has reviewed the Fund’s tax positions for all open tax years (the current and prior three years, as applicable) and has concluded that no provision for income tax is required in the Fund’s financial statements. Such open tax years remain subject to examination and adjustment by tax authorities.
Under the recently enacted Regulated Investment Company Modernization Act of 2010, the Fund will be permitted to carry forward capital losses incurred in taxable years beginning after December 22, 2010 for an unlimited period. However, any losses incurred during those future taxable years will be required to be utilized prior to the losses incurred in pre-enactment taxable years. As a result of this ordering rule, pre-enactment capital loss carryforwards may be more likely to expire unused. Additionally, post-enactment capital losses that are carried forward will retain their character as either short-term or long-term capital losses rather than being considered all short-term as under previous law.
GOLDMAN SACHS VARIABLE INSURANCE TRUST STRATEGIC GROWTH FUND
| 7. OTHER RISKS |
Fund’s Shareholder Concentration Risk — Certain participating insurance companies, accounts, or Goldman Sachs affiliates may from time to time own (beneficially or of record) or control a significant percentage of the Fund’s shares. Redemptions by these entities of their holdings in the Fund may impact the Fund’s liquidity and NAV. These redemptions may also force the Fund to sell securities.
Liquidity Risk — The Fund may make investments that may be illiquid or that may become less liquid in response to market developments or adverse investor perceptions. Liquidity risk may also refer to the risk that a Fund will not be able to pay redemption proceeds within the allowable time period because of unusual market conditions, an unusually high volume of redemption requests, or other reasons. To meet redemption requests, a Fund may be forced to sell investments at an unfavorable time and/or under unfavorable conditions.
Market and Credit Risks — In the normal course of business, the Fund trades financial instruments and enters into financial transactions where risk of potential loss exists due to changes in the market (market risk). Additionally, the Fund may also be exposed to credit risk in the event that an issuer fails to perform or that an institution or entity with which the Fund has unsettled or open transaction defaults.
| 8. INDEMNIFICATIONS |
Under the Trust’s organizational documents, its trustees, officers, employees and agents are indemnified, to the extent permitted by the Act, against certain liabilities that may arise out of performance of their duties to the Fund. Additionally, in the course of business, the Fund enters into contracts that contain a variety of indemnification clauses. The Fund’s maximum exposure under these arrangements is unknown, as this would involve future claims that may be made against the Fund that have not yet occurred. However, GSAM believes the risk of loss under these arrangements to be remote.
| 9. SUBSEQUENT EVENTS |
Subsequent events after the balance sheet date have been evaluated through the date the financial statements were issued. GSAM has concluded that there is no impact requiring adjustment or disclosure in the financial statements.
GOLDMAN SACHS VARIABLE INSURANCE TRUST STRATEGIC GROWTH FUND
Notes to Financial Statements (continued)
June 30, 2011 (Unaudited)
| 10. SUMMARY OF SHARE TRANSACTIONS |
Share activity is as follows:
| For the Six Months Ended | ||||||||||||||||
| June 30, 2011 | For the Fiscal Year Ended | |||||||||||||||
| (Unaudited) | December 31, 2010 | |||||||||||||||
| Shares | Dollars | Shares | Dollars | |||||||||||||
Institutional Shares | ||||||||||||||||
| Shares sold | 307,680 | $ | 3,785,477 | 589,735 | $ | 6,437,104 | ||||||||||
| Reinvestment of distributions | — | — | 40,882 | 490,173 | ||||||||||||
| Shares redeemed | (833,910 | ) | (10,226,388 | ) | (2,141,448 | ) | (23,457,107 | ) | ||||||||
| (526,230 | ) | (6,440,911 | ) | (1,510,831 | ) | (16,529,830 | ) | |||||||||
Service Shares | ||||||||||||||||
| Shares sold | 2,179,173 | 26,665,363 | 2,823,030 | 30,985,537 | ||||||||||||
| Reinvestment of distributions | — | — | 36,379 | 435,824 | ||||||||||||
| Shares redeemed | (1,233,931 | ) | (15,085,561 | ) | (3,207,332 | ) | (35,060,574 | ) | ||||||||
| 945,242 | 11,579,802 | (347,923 | ) | (3,639,213 | ) | |||||||||||
NET INCREASE (DECREASE) | 419,012 | $ | 5,138,891 | (1,858,754 | ) | $ | (20,169,043 | ) | ||||||||
GOLDMAN SACHS VARIABLE INSURANCE TRUST STRATEGIC GROWTH FUND
Statement Regarding Basis for Approval of Management Agreement (Unaudited)
Background
The Goldman Sachs Strategic Growth Fund (the “Fund”) is an investment portfolio of Goldman Sachs Variable Insurance Trust (the “Trust”). The Board of Trustees oversees the management of the Trust and reviews the investment performance and expenses of the Fund at regularly scheduled meetings held during the year. In addition, the Board of Trustees determines annually whether to approve the continuance of the Trust’s investment management agreement (the “Management Agreement”) with Goldman Sachs Asset Management, L.P. (the “Investment Adviser”) on behalf of the Fund.
The Management Agreement was most recently approved for continuation until June 30, 2012 by the Board of Trustees, including those Trustees who are not parties to the Management Agreement or “interested persons” (as defined in the Investment Company Act of 1940, as amended) of any party thereto (the “Independent Trustees”), at a meeting held on June 15-16, 2011 (the “Annual Meeting”).
The review process undertaken by the Trustees spans the course of the year and culminates with the Annual Meeting. To assist the Trustees in their deliberations, the Trustees have established a Contract Review Committee (the “Committee”), comprised of the Independent Trustees. The Committee held three meetings over the course of the year since the Management Agreement was last approved. At those Committee meetings, regularly scheduled Board meetings and/or the Annual Meeting, the Board, or the Independent Trustees, as applicable, considered matters relating to the Management Agreement, including:
| (a) | the nature and quality of the advisory, administrative and other services provided to the Fund by the Investment Adviser and its affiliates, including information about: |
| (i) | the structure, staff and capabilities of the Investment Adviser and its portfolio management teams; | |
| (ii) | the groups within the Investment Adviser and its affiliates that support the portfolio management teams or provide other types of necessary services, including fund services groups (e.g., accounting and financial reporting, tax, shareholder services and operations), controls and risk management groups (e.g., legal, compliance, valuation oversight, credit risk management, internal audit, market risk analysis, finance and strategy and central funding), sales and distribution support groups and others (e.g., information technology and training); | |
| (iii) | trends in headcount; | |
| (iv) | the Investment Adviser’s financial resources and ability to hire and retain talented personnel and strengthen its operations; and |
| (v) | the parent company’s support of the Investment Adviser and its mutual fund business, as expressed by the firm’s senior management; |
| (b) | information on the investment performance of the Fund, including comparisons to the performance of similar mutual funds, as provided by a third party mutual fund data provider engaged as part of the contract review process (the “Outside Data Provider”), its benchmark performance index, a comparable institutional composite managed by the Investment Adviser, and general investment outlooks in the markets in which the Fund invests; | |
| (c) | the terms of the Management Agreement and agreements with affiliated service providers entered into by the Trust on behalf of the Fund; | |
| (d) | expense information for the Fund, including: |
| (i) | the relative management fee and expense level of the Fund as compared to those of comparable funds managed by other advisers, as provided by the Outside Data Provider; | |
| (ii) | the Fund’s expense trends over time; and | |
| (iii) | to the extent the Investment Adviser manages institutional accounts or collective investment vehicles having investment objectives and policies similar to those of the Fund, comparative information on the advisory fees charged and services provided to those accounts by the Investment Adviser; |
| (e) | with respect to the extensive investment performance and expense comparison data provided by the Outside Data Provider, its processes in producing that data for the Fund; | |
| (f) | the undertakings of the Investment Adviser to waive certain fees and reimburse certain expenses of the Fund that exceed a specified level, and a summary of contractual fee reductions made by the Investment Adviser and its affiliates over the past several years with respect to the Fund; | |
| (g) | information relating to the profitability of the Management Agreement and the transfer agency and distribution and service arrangements of the Fund and the Trust as a whole to the Investment Adviser and its affiliates; | |
| (h) | whether the Fund’s existing management fee schedule adequately addressed any economies of scale; | |
| (i) | a summary of the “fall-out” benefits derived by the Investment Adviser and its affiliates from their relationships with the Fund, including the fees received by the Investment Adviser’s affiliates from the Fund for transfer agency, portfolio brokerage, distribution and other services; | |
| (j) | a summary of potential benefits derived by the Fund as a result of its relationship with the Investment Adviser; |
GOLDMAN SACHS VARIABLE INSURANCE TRUST STRATEGIC GROWTH FUND
Statement Regarding Basis for Approval of Management Agreement (Unaudited) (continued)
| (k) | information regarding commissions paid by the Fund, an update on the Investment Adviser’s soft dollars practices, other information regarding portfolio trading and how the Investment Adviser carries out its duty to seek best execution; | |
| (l) | the manner in which portfolio manager compensation is determined, and the number and types of accounts managed by the portfolio managers; | |
| (m) | the nature and quality of the services provided to the Fund by its unaffiliated service providers, and the Investment Adviser’s general oversight and evaluation (including reports on due diligence) of those service providers as part of the administration services provided under the Management Agreement; and | |
| (n) | the Investment Adviser’s processes and policies addressing various types of potential conflicts of interest; its approach to risk management; the annual review of the effectiveness of the Fund’s compliance program; and compliance reports. |
The Trustees also received an overview of the Fund’s distribution arrangements. They received information regarding the Fund’s assets, share purchase and redemption activity and the payment of Rule 12b-1 distribution and service fees by the Fund’s Service Shares. Information was also provided to the Trustees relating to revenue sharing payments made by and services provided by the Investment Adviser and its affiliates to intermediaries that promote the sale, distribution and/or servicing of Fund shares.
The presentations made at the Board and Committee meetings and at the Annual Meeting encompassed the Fund and other mutual fund portfolios for which the Board of Trustees has responsibility. In evaluating the Management Agreement at the Annual Meeting, the Trustees relied upon their knowledge, resulting from their meetings and other interactions throughout the year, of the Investment Adviser, its affiliates, their services and the Fund. In conjunction with these meetings, the Trustees received written materials and oral presentations on the topics covered, and were advised by their independent legal counsel regarding their responsibilities and other regulatory requirements related to the approval and continuation of mutual fund investment management agreements under applicable law. In addition, the Investment Adviser and its affiliates provided the Independent Trustees with a written response to a formal request for information sent on behalf of the Independent Trustees by their independent legal counsel. During the course of their deliberations, the Independent Trustees met in executive sessions with their independent legal counsel, without representatives of the Investment Adviser or its affiliates present. The Independent Trustees also discussed the broad range of other investment choices that are available to Fund investors, including the availability of comparable funds managed by other advisers.
Nature, Extent and Quality of the Services Provided Under the Management Agreement
As part of their review, the Trustees considered the nature, extent and quality of the services provided by the Investment Adviser. In this regard, the Trustees considered both the investment advisory services, and the other, non-advisory services, that are provided to the Fund by the Investment Adviser and its affiliates. The Trustees noted the transition in the leadership and changes in personnel of various portfolio management teams that had occurred in recent periods, the potential benefit to the Fund of recent increases in headcount at the Investment Adviser and the ongoing recruitment efforts aimed at bringing high quality investment talent to the Investment Adviser. The Independent Trustees concluded that the Investment Adviser had committed substantial financial and operational resources to the Fund and expressed confidence that the Investment Adviser would continue to do so in the future. The Trustees also observed that the Investment Adviser had made significant commitments to address regulatory compliance requirements applicable to the Fund and the Investment Adviser.
Investment Performance
The Trustees also considered the investment performance of the Fund and the Investment Adviser. In this regard, they compared the Fund to its peers using performance rankings and ratings compiled by the Outside Data Provider as of December 31, 2010, and updated performance information prepared by the Investment Adviser using the peer groups identified by the Outside Data provider. The information on each Fund’s investment performance was provided for the one-, three-, five- and ten-year periods ending on the applicable dates. The Trustees also reviewed the Fund’s investment performance over time on a year-by-year basis relative to its performance benchmark. In addition, they considered the investment performance trends of the Fund over time, and reviewed the investment performance of the Fund in light of its investment objective and policies, and market conditions. The Trustees also received information comparing the Fund’s performance to that of a comparable institutional composite managed by the Investment Adviser. The Trustees considered whether the Fund had operated within its investment policies and had complied with its investment limitations.
In addition, the Trustees considered materials prepared and presentations made by the Investment Adviser’s senior management and portfolio management personnel, in which Fund performance was assessed. The Trustees also considered the Investment Adviser’s periodic reports with respect to the Fund’s risk profile, and how the Investment Adviser’s approach to risk monitoring and management influences portfolio management.
GOLDMAN SACHS VARIABLE INSURANCE TRUST STRATEGIC GROWTH FUND
Statement Regarding Basis for Approval of Management Agreement (Unaudited) (continued)
The Independent Trustees noted that for the one-year period ended May 31, 2011, the Fund ranked in the bottom half of its peer group. They also noted that the Fund had underperformed its benchmark index during that period. The Independent Trustees observed that they had communicated their concerns regarding the performance of the Fund to GSAM senior management and had received assurances that measures would continue to be taken to address the Fund’s performance.
Costs of Services Provided and Competitive Information
The Trustees considered the contractual fee rates payable by the Fund under the Management Agreement. In this regard, the Trustees considered information on the services rendered by the Investment Adviser to the Fund, which included both advisory and administrative services that were directed to the needs and operations of the Fund as a registered mutual fund.
In particular, the Trustees reviewed analyses prepared by the Outside Data Provider regarding the expense rankings of the Fund. The analyses provided a comparison of the Fund’s management fees and breakpoints to those of a relevant peer group and category universe; an expense analysis which compared the Fund’s expenses to a peer group and a category universe; and a five-year history comparing the Fund’s expenses to the peer and category medians. The analyses also compared the Fund’s transfer agency fees, custody and accounting fees, distribution fees, other expenses and fee waivers/reimbursements to those of other funds in the peer group and the peer group median. The Trustees concluded that the comparisons provided by the Outside Data Provider were useful in evaluating the reasonableness of the management fees and total expenses paid by the Fund.
In addition, the Trustees considered the Investment Adviser’s undertakings to waive a portion of its management fee and limit the Fund’s “other expenses” ratio (excluding certain expenses) to a certain specified level. They also considered, to the extent that the Investment Adviser manages institutional accounts or collective investment vehicles having investment objectives and policies similar to those of the Fund, comparative fee information for services provided by the Investment Adviser to those accounts, and information that indicated that services provided to the Fund differed in various significant respects from the services provided to institutional accounts, which generally operated under less stringent legal and regulatory structures, required fewer services from the Investment Adviser to a smaller number of client contact points, were less time-intensive and paid lower fees. By contrast, the Trustees noted that the Investment Adviser provides substantial administrative services to the Fund under the terms of the Management Agreement.
In addition, the Trustees noted that shareholders are able to redeem their Fund shares at any time if they believe that the Fund fees and expenses are too high or if they are dissatisfied with the performance of the Fund.
Profitability
The Trustees reviewed the Investment Adviser’s revenues and pre-tax profit margins with respect to the Trust and the Fund. In this regard the Trustees noted that they had received, among other things, profitability analyses and summaries, revenue and expense schedules by Fund and by function (i.e., investment management, transfer agency and distribution and service) and the Investment Adviser’s expense allocation methodology. They observed that the profitability and expense figures are substantially similar to those used by the Investment Adviser for many internal purposes, including compensation decisions among various business groups, and are thus subject to a vigorous internal debate about how certain revenue and expenses should be allocated. The Trustees also reviewed the report of the internal audit group within the Goldman Sachs organization, which included an assessment of the reasonableness and consistency of the Investment Adviser’s expense allocation methodology and an evaluation of the accuracy of the Investment Adviser’s profitability analysis calculations. Profitability data for the Trust and the Fund were provided for 2010 and 2009, and the Trustees considered this information in relation to the Investment Adviser’s overall profitability. The Trustees considered the Investment Adviser’s revenues and pre-tax profit margins both in absolute terms and in comparison to information on the reported pre-tax profit margins earned by certain other asset management firms.
Economies of Scale
The Trustees considered the information that had been provided regarding the Investment Adviser’s profitability and the rationale for the Fund’s breakpoint structure. The Trustees also considered the breakpoints in the fee rate payable under the Management Agreement for the Fund at the following annual percentage rates of the average daily net assets of the Fund:
| First $1 billion | 0.75 | % | ||
| Next $1 billion | 0.68 | |||
| Next $3 billion | 0.65 | |||
| Next $3 billion | 0.64 | |||
| Over $8 billion | 0.63 |
GOLDMAN SACHS VARIABLE INSURANCE TRUST STRATEGIC GROWTH FUND
Statement Regarding Basis for Approval of Management Agreement (Unaudited) (continued)
The Trustees noted that the breakpoints at the $5 and $8 billion asset levels had been proposed by the Investment Adviser and approved by the Trustees in 2008 to further share potential economies of scale, if any, with the Fund and its shareholders as assets under management reach those asset levels. The Trustees considered the amounts of assets in the Fund; the Fund’s recent share purchase and redemption activity; the information provided by the Investment Adviser relating to the costs of the services provided by the Investment Adviser and its affiliates and their realized profits; information comparing fee rates charged by the Investment Adviser with fee rates charged to other funds in the peer group; and the Investment Adviser’s undertakings to limit the Fund’s fees and “other expenses” ratio (excluding certain expenses) to certain amounts. Upon reviewing these matters at the Annual Meeting, the Trustees concluded that the fee breakpoints represented a means of assuring that benefits of scalability would be passed along to shareholders at the specified asset levels.
Other Benefits to the Investment Adviser and Its Affiliates
The Trustees also considered the other benefits derived by the Investment Adviser and its affiliates from their relationship with the Fund as stated above, including: (a) transfer agency fees received by Goldman, Sachs & Co. (“Goldman Sachs”); (b) brokerage and futures commissions earned by Goldman Sachs for executing securities and futures transactions on behalf of the Fund; (c) research received by the Investment Adviser from broker-dealers in exchange for executing certain transactions on behalf of the Fund; (d) trading efficiencies resulting from aggregation of orders of the Fund with those for other funds or accounts managed by the Investment Adviser; (e) the Investment Adviser’s ability to leverage the infrastructure designed to service the Fund on behalf of its other clients; (f) the Investment Adviser’s ability to cross-market other products and services to Fund shareholders; (g) Goldman Sachs’ retention of certain fees as Fund Distributor; (h) the Investment Adviser’s ability to negotiate better pricing with custodians on behalf of its other clients, as a result of the relationship with the Fund; and (i) the possibility that the working relationship between the Investment Adviser and the Fund’s third party service providers may cause those service providers to be open to doing business with other areas of Goldman Sachs. In the course of considering the foregoing, the Independent Trustees requested and received further information quantifying certain of the fall-out benefits.
Other Benefits to the Fund and Its Shareholders
The Trustees also noted that the Fund receives certain potential benefits as a result of its relationship with the Investment Adviser, including: (a) trading efficiencies resulting from aggregation of orders of the Fund with those of other funds or accounts managed by the Investment Adviser; (b) improved servicing and pricing from vendors because of the volume of business generated by the Investment Adviser and its affiliates; (c) improved servicing from broker-dealers because of the volume of business generated by the Investment Adviser and its affiliates; (d) the Investment Adviser’s ability to negotiate favorable terms with derivatives counterparties as a result of the size and reputation of the Goldman Sachs organization; (e) the advantages gained from the Investment Adviser’s knowledge and experience gained from managing other accounts and products; (f) the Investment Adviser’s ability to hire and retain qualified personnel to provide services to the Fund because of the reputation of the Goldman Sachs organization; (g) the Fund’s access, through the Investment Adviser, to certain firmwide resources (e.g., proprietary databases); and (h) the Fund’s access to certain affiliated distribution channels. The Trustees noted the competitive nature of the mutual fund marketplace, and noted further that many of the Fund’s shareholders invested in the Fund in part because of the Fund’s relationship with the Investment Adviser and that those shareholders have a general expectation that the relationship will continue.
GOLDMAN SACHS VARIABLE INSURANCE TRUST STRATEGIC GROWTH FUND
Statement Regarding Basis for Approval of Management Agreement (Unaudited) (continued)
Conclusion
In connection with their consideration of the Management Agreement, the Trustees gave weight to each of the factors described above, but did not identify any particular factor as controlling their decision. After deliberation and consideration of all of the information provided, including the factors described above, the Trustees concluded, in the exercise of their business judgment, that the management fees paid by the Fund were reasonable in light of the services provided to it by the Investment Adviser, the Investment Adviser’s costs and the Fund’s current and reasonably foreseeable asset levels. The Trustees unanimously concluded that the Investment Adviser’s continued management likely would benefit the Fund and its shareholders and that the Management Agreement should be approved and continued with respect to the Fund until June 30, 2012.
GOLDMAN SACHS VARIABLE INSURANCE TRUST STRATEGIC GROWTH FUND
Fund Expenses — Six Month Period Ended June 30, 2011 (Unaudited)
As a shareholder of Institutional or Service Shares of the Fund, you incur ongoing costs, including management fees, distribution and service (12b-1) fees (with respect to Service Shares) and other Fund expenses. This example is intended to help you understand your ongoing costs (in dollars) of investing in the Institutional Shares and Service Shares of the Fund and to compare these costs with the ongoing costs of investing in other mutual funds.
The example is based on an investment of $1,000 invested at the beginning of the period and held for the entire period from January 1, 2011 through June 30, 2011.
Actual Expenses — The first line under each share class in the table below provides information about actual account values and actual expenses. You may use the information in this line, together with the amount you invested, to estimate the expenses that you paid over the period. Simply divide your account value by $1,000 (for example, an $8,600 account value divided by $1,000=8.6), then multiply the result by the number in the first line under the heading entitled “Expenses Paid” to estimate the expenses you paid on your account during this period.
Hypothetical Example for Comparison Purposes — The second line under each share class in the table below provides information about hypothetical account values and hypothetical expenses based on the Fund’s actual net expense ratio and an assumed rate of return of 5% per year before expenses, which is not the Fund’s actual return. The hypothetical account values and expenses may not be used to estimate the actual ending account balance or expenses you paid for the period. You may use this information to compare the ongoing costs of investing in the Fund and other funds. To do so, compare this 5% hypothetical example with the 5% hypothetical examples that appear in the shareholder reports of the other funds.
Please note that the expenses shown in the table are meant to highlight your ongoing costs only. As a shareholder of the Fund, you do not incur any transaction costs, such as sales charges (loads), redemption fees, or exchange fees, but shareholders of other funds may incur such costs. The second line of the table is useful in comparing ongoing costs only, and will not help you determine the relative total costs of owning different funds whose shareholders may incur transaction costs.
| Expenses Paid | |||||||||||||||
| for the | |||||||||||||||
| Beginning | Ending | 6 Months | |||||||||||||
| Account Value | Account Value | Ended | |||||||||||||
| Share Class | 1/01/11 | 6/30/11 | 6/30/11* | ||||||||||||
Institutional | |||||||||||||||
| Actual | $ | 1,000 | $ | 1,035.80 | $ | 4.24 | |||||||||
| Hypothetical 5% return | 1,000 | 1,020.63 | + | 4.21 | |||||||||||
Service | |||||||||||||||
| Actual | 1,000 | 1,034.20 | 5.50 | ||||||||||||
| Hypothetical 5% return | 1,000 | 1,019.39 | + | 5.46 | |||||||||||
| * | Expenses for each share class are calculated using the Fund’s annualized net expense ratio for each class, which represents the ongoing expenses as a percentage of net assets for the six months ended June 30, 2011. Expenses are calculated by multiplying the annualized net expense ratio by the average account value for the period; then multiplying the result by the number of days in the most recent fiscal half year; and then dividing that result by the number of days in the fiscal year. The annualized net expense ratios for the period were 0.84% and 1.09% for Institutional and Service Shares, respectively. | |
| + | Hypothetical expenses are based on the Fund’s actual annualized net expense ratios and an assumed rate of return of 5% per year before expenses. |
| TRUSTEES | OFFICERS | |
| Ashok N. Bakhru, Chairman Donald C. Burke John P. Coblentz, Jr. Diana M. Daniels Joseph P. LoRusso James A. McNamara Jessica Palmer Alan A. Shuch Richard P. Strubel | James A. McNamara, President George F. Travers, Principal Financial Officer Peter V. Bonanno, Secretary Scott M. McHugh, Treasurer | |
| GOLDMAN, SACHS & CO. Distributor and Transfer Agent | ||
| GOLDMAN SACHS ASSET MANAGEMENT, L.P. Investment Adviser 200 West Street, New York New York 10282 | ||
| Visit our website at www.goldmansachsfunds.com/vit to obtain the most recent month-end returns. | ||
| The reports concerning the Fund included in this shareholder report may contain certain forward-looking statements about the factors that may affect the performance of the Fund in the future. These statements are based on Fund management’s predictions and expectations concerning certain future events and their expected impact on the Fund, such as performance of the economy as a whole and of specific industry sectors, changes in the levels of interest rates, the impact of developing world events, and other factors that may influence the future performance of the Fund. Management believes these forward-looking statements to be reasonable, although they are inherently uncertain and difficult to predict. Actual events may cause adjustments in portfolio management strategies from those currently expected to be employed. | ||
| A description of the policies and procedures that the Fund uses to determine how to vote proxies relating to portfolio securities and information regarding how the Fund voted proxies relating to portfolio securities during the most recent 12-month period ended June 30 is available (i) without charge, upon request by calling 1-800-621-2550; and (ii) on the Securities and Exchange Commission (“SEC”) website at http://www.sec.gov. | ||
| The Fund files its complete schedule of portfolio holdings with the SEC for the first and third quarters of each fiscal year on Form N-Q. The Fund’s Form N-Q is available on the SEC’s website at http://www.sec.gov within 60 days after the Fund’s first and third fiscal quarters. When available, the Fund’s Forms N-Q may be reviewed and copied at the SEC’s Public Reference Room in Washington, D.C. and information on the operation of the Public Reference Room may also be obtained by calling 1-800-SEC-0330. Forms N-Q may be obtained upon request and without charge by calling 1-800-621-2550. | ||
| Holdings and allocations shown may not be representative of current or future investments. Holdings and allocations may not include the Fund’s entire investment portfolio, which may change at any time. Fund holdings should not be relied on in making investment decisions and should not be construed as research or investment advice regarding particular securities. | ||
| Economic and market forecasts presented herein reflect our judgment as of the date of this presentation and are subject to change without notice. These forecasts do not take into account the specific investment objectives, restrictions, tax and financial situation or other needs of any specific client. Actual data will vary and may not be reflected here. These forecasts are subject to high levels of uncertainty that may affect actual performance. Accordingly, these forecasts should be viewed as merely representative of a broad range of possible outcomes. These forecasts are estimated, based on assumptions, and are subject to significant revision and may change materially as economic and market conditions change. Goldman Sachs has no obligation to provide updates or changes to these forecasts. Case studies and examples are for illustrative purposes only. | ||
| The Global Industry Classification Standard (“GICS”) was developed by and is the exclusive property and a service mark of Morgan Stanley Capital International Inc. (“MSCI”) and Standard & Poor’s, a division of The McGraw-Hill Companies, Inc. (“S&P”) and is licensed for use by Goldman Sachs. Neither MSCI, S&P nor any other party involved in making or compiling the GICS or any GICS classifications makes any express or implied warranties or representations with respect to such standard or classification (or the results to be obtained by the use thereof), and all such parties hereby expressly disclaim all warranties of originality, accuracy, completeness, merchantability or fitness for a particular purpose with respect to any of such standard or classification. Without limiting any of the foregoing, in no event shall MSCI, S&P, any of their affiliates or any third party involved in making or compiling the GICS or any GICS classifications have any liability for any direct, indirect, special, punitive, consequential or any other damages (including lost profits) even if notified of the possibility of such damages. | ||
| The portfolio risk management process includes an effort to monitor and manage risk, but does not imply low risk. | ||
| Shares of the Goldman Sachs VIT Funds are offered to separate accounts of participating life insurance companies for the purpose of funding variable annuity contracts and variable life insurance policies. Shares of the Fund are not offered directly to the general public. The variable annuity contracts and variable life insurance policies are described in the separate prospectuses issued by participating insurance companies. You should refer to those prospectuses for information about surrender charges, mortality and expense risk fees and other charges that may be assessed by participating insurance companies under the variable annuity contracts or variable life insurance policies. Such fees or charges, if any, may affect the return you may realize with respect to your investments. Ask your representative for more complete information. Please consider a fund’s objectives, risks and charges and expenses, and read the prospectus carefully before investing. The prospectus contains this and other information about the Fund. | ||
| This material is not authorized for distribution to prospective investors unless preceded or accompanied by a current Prospectus or summary prospectus, if applicable. Investors should consider a Fund’s objective, risks, and charges and expenses, and read the summary prospectus, if available, and/or the Prospectus carefully before investing or sending money. The summary prospectus, if available, and the Prospectus contain this and other information about a Fund and may be obtained from your authorized dealer or from Goldman, Sachs & Co. by calling 1-800-621-2550. | ||
| Toll Free (in U.S.): 800-292-4726 | ||
| This report is prepared for the general information of contract owners and is not an offer of shares of the Goldman Sachs Variable Insurance Trust: Goldman Sachs Strategic Growth Fund. | ||
| © 2011 Goldman Sachs. All rights reserved. | ||
| VITSGRWSAR11/57663.MF.MED.TMPL/8/2011 | ||
Goldman
Sachs Variable Insurance Trust
Mid Cap Value Fund
Semi-Annual Report
June 30, 2011
|
GOLDMAN SACHS VARIABLE INSURANCE TRUST MID CAP VALUE FUND
Principal Investment Strategies and Risks
Shares of the Goldman Sachs Variable Insurance Trust — Goldman Sachs Mid Cap Value Fund are offered to separate accounts of participating life insurance companies for the purpose of funding variable annuity contracts and variable life insurance policies. Shares of the Fund are not offered directly to the general public. The variable annuity contracts and variable life insurance policies are described in the separate prospectuses issued by participating insurance companies. You should refer to those prospectuses for information about surrender charges, mortality and expense risk fees and other charges that may be assessed by participating insurance companies under the variable annuity contracts or variable life insurance policies. Such fees or charges, if any, may affect the return you realize with respect to your investments. Ask your representative for more complete information. Please consider the Fund’s objective, risks and charges and expenses, and read the Prospectus carefully before investing. The Prospectus contains this and other information about the Fund.
The Goldman Sachs Mid Cap Value Fund invests primarily in mid-capitalization U.S. equity investments. The Fund’s equity investments are subject to market risk, which means that the value of the securities in which it invests may go up or down in response to the prospects of individual companies, particular industry sectors and/or general economic conditions. The securities of mid-capitalization companies involve greater risks than those associated with larger, more established companies and may be subject to more abrupt or erratic price movements. The Fund may also invest in fixed income securities, which are subject to the risks associated with debt securities generally, including credit, liquidity and interest rate risk. The Fund may also invest in foreign securities, including emerging country securities, which may be more volatile and less liquid than investments in U.S. securities and are subject to the risks of currency fluctuations and sudden economic or political developments.
GOLDMAN SACHS VARIABLE INSURANCE TRUST MID CAP VALUE FUND
INVESTMENT OBJECTIVE
The Fund seeks long-term capital appreciation.
Portfolio Management Discussion and Analysis
Below, the Goldman Sachs Value Portfolio Management Team discusses the performance of the Goldman Sachs Variable Insurance Trust — Goldman Sachs Mid Cap Value Fund (the “Fund”) and positioning for the six-month period ended June 30, 2011 (the “Reporting Period”).
How did the Fund perform during the Reporting Period?
During the Reporting Period, the Fund’s Institutional and Service Shares generated cumulative total returns of 6.10% and 5.95%, respectively. These returns compare to the 6.69% cumulative total return of the Fund’s benchmark, the Russell Midcap® Value Index* (with dividends reinvested) (the “Russell Index”), during the same time period.
What economic and market factors most influenced the equity markets as a whole during the Reporting Period?
U.S. equities continued their positive momentum from 2010 during the Reporting Period. However, most of the gains were generated during the first quarter of 2011, as improving trends in labor, housing, manufacturing and consumer confidence pointed to a continuation in the economic recovery. A positive trajectory in corporate earnings and cash flows and strong merger and acquisition activity further supported U.S. equity market performance. Indeed, despite great exogenous shocks in the Middle East and turmoil in North African turmoil, a series of disasters in Japan, political debate over collective bargaining rights in Wisconsin and the possible repeal of health care reform in Washington D.C., the U.S. equity markets rewarded investors with solid returns during the first quarter of 2011.
The broad U.S. equity markets experienced a much more volatile second quarter, rising to a three-year high in April before losing most of its early 2011 gains by mid-June and then recovering somewhat in the very last week of the Reporting Period. In early April, commodity prices declined and expectations ran high for strong corporate profit growth. However, while home construction rose modestly in May, housing and employment remained key weak spots in the U.S. economy. Concerns about Greece’s debt crisis also re-surfaced, the U.S. Congress wrangled over the U.S. debt ceiling, the Federal Reserve Board’s quantitative easing program was scheduled to expire on June 30, 2011, the impact of Japan’s natural and nuclear disasters worked its way through the global supply chain and deadly storms cut a wide swath of destruction across the midwestern and southern United States. In turn, the U.S. stock market felt pressured and lost ground. Toward the end of June, U.S. equity markets recovered from their May to mid-June decline on the heels of better than expected U.S. manufacturing activity, improved automobile sales and a short-term resolution of the sovereign debt crisis in Greece.
Despite this volatility, all sectors posted gains during the Reporting Period, with the exception of financials, which posted a negative return. Health care and energy led the way. Energy was, not surprisingly, impacted by the price of Brent crude oil, which peaked at more than $126 per barrel in April on supply disruption fears in North Africa and the Middle East before falling in June on weaker U.S. economic data and concerns about the pace of growth in China’s economy. Still, Brent crude oil prices ended the Reporting Period at more than $112 per barrel.
While all capitalization segments of the U.S. equity market advanced during the Reporting Period, mid-cap stocks, as measured by the Russell Midcap® Index, performed best, followed by large-cap and then small-cap stocks, as measured by the Russell 1000® Index and the Russell 2000® Index, respectively, which performed nearly in line with each other. Large-cap stocks were least successful relative to small-cap stocks in the information technology sector. Growth-oriented stocks outpaced value-oriented stocks across the capitalization spectrum.
What key factors were responsible for the Fund’s performance during the Reporting Period?
Stock selection overall detracted most from the Fund’s performance relative to the Russell Index during the Reporting Period.
| * | The Russell Midcap Value Index is an unmanaged index of common stock prices that measures the performance of those Russell Midcap companies with lower price-to-book ratios and lower forecasted growth values. The Index figures do not include any deduction for fees, expenses or taxes. It is not possible to invest directly in an unmanaged index. |
GOLDMAN SACHS VARIABLE INSURANCE TRUST MID CAP VALUE FUND
Which equity market sectors most significantly affected Fund performance?
Effective stock selection in the information technology, consumer discretionary and materials sectors helped the Fund’s performance most relative to the Russell Index. Detracting from the Fund’s relative results most was stock selection in the energy, financials and utilities sectors, where company-specific issues weighed on certain holdings.
What were some of the Fund’s best-performing individual stocks?
The Fund benefited most relative to the Russell Index from positions in media company DISH Network within the consumer discretionary sector, health maintenance organization (HMO) Aetna within the health care sector and wireless and wireline communications services company Sprint Nextel within the telecommunication services sector.
DISH Network is a broadcast satellite subscription television service provider. The company’s churn — or the number of customers who switch to a competitor — materially dropped following reports of its quarterly results, which surprised the market to the upside. DISH Network also benefited from a court ruling favoring the company when it served as a defendant in TIVO’s patent infringement case. These factors, combined with an attractive valuation, drove DISH Network’s shares higher during the Reporting Period.
Like other HMOs, Aetna benefited during the Reporting Period both from a loosening of the restrictions placed on it by PPACA (Patient Protection and Affordable Care Act, aka heath care reform) and from strong fundamentals, due mostly to lower health care utilization during the tough economy.
Fundamentals in the core businesses of Sprint Nextel improved during the Reporting Period, despite increased competitive pressures, as its churn declined and its average revenue per unit increased. We believe these supportive trends gave investors confidence in the resiliency of Sprint Nextel and in the sustainability of its turnaround. Additionally, during the Reporting Period, Sprint Nextel signed a deal with LightSquared, a wholesale provider of 4G (fourth generation) capacity, to offer networking hosting services. This deal provides Sprint Nextel with a potential new revenue stream at high incremental margins. We continued, at the end of the Reporting Period, to believe there is potential for EBITDA (Earnings Before Interest, Taxes, Depreciation and Amortization) margin expansion over the next few years and remain positive on both near and longer-term prospects for Sprint Nextel.
Which stocks detracted significantly from the Fund’s performance during the Reporting Period?
Detracting from the Fund’s results relative to its benchmark index were positions in two oil and gas exploration and production companies — Forest Oil and Newfield Exploration — as well as in multi-line insurance company Genworth Financial.
Forest Oil was the biggest detractor from the Fund’s performance during the Reporting Period. Shares of Forest Oil fell after the company reported a fourth quarter 2010 earnings decline due to a drop in commodity prices and a disappointment in fourth quarter 2010 drilling results from its Granite Wash operations. We sold the Fund’s position in Forest Oil by the end of the Reporting Period.
Shares of Newfield Exploration were affected, particularly during the second quarter of 2011, by weaker oil prices and a weather-related event — specifically, flooding in the Williston Basin — that caused concerns about its potentially negative impact on the company’s near-term production. Despite these headwinds the company faced during the Reporting Period, Newfield Exploration’s stock remains a core long-term holding for the Fund, as we believe the company is well positioned to reduce its finding and development costs and to grow its reserve base with high returns on capital.
Genworth Financial saw its shares decline during the Reporting Period largely due to concerns over its significant exposure to consumer loans. However, we maintained the Fund’s holding in the company at the end of the Reporting Period, as we continued to have strong conviction in what we consider to be this attractively valued turnaround stock. Genworth Financial was still generating profitable earnings from non-mortgage fee-based businesses and international businesses. Also, we believe that mortgage losses will be earned out as the market stabilizes and that the company has the ability to earn high single-digit returns on equity, which warrants a higher valuation.
How did the Fund use derivatives and similar instruments during the Reporting Period?
The Fund did not use derivatives during the Reporting Period.
Did the Fund make any significant purchases or sales during the Reporting Period?
During the Reporting Period, we added to the Fund’s position in cable network company Scripps Networks Interactive, which operates six television channels focused on the home, food and travel/entertainment categories, including HGTV, the Food
GOLDMAN SACHS VARIABLE INSURANCE TRUST MID CAP VALUE FUND
Network and the Travel Channel. In our view, the company benefits from an undervalued runway of affiliate fee growth, which it receives for its networks, as well as from several underappreciated value-enhancing capital deployment opportunities due to its strong balance sheet. We also favor the stock because of its strong ties to a continued advertising recovery, as cable television has been taking an incremental share of advertising dollars from both broadcasters given shifts in viewership and from newsprint.
We looked during the Reporting Period to diversify the Fund’s mix of natural gas and oil companies and in that effort we initiated a Fund position in Cabot Oil & Gas. We liked this company because of its natural gas exposure, what we believe is a sustainable competitive advantage in the Marcellus shale and strong financial discipline.
Strict to our sell discipline, we eliminated stocks in which our investment thesis was challenged. For example, as already mentioned, we eliminated the Fund’s holding in Forest Oil during the Reporting Period, as the company had missed expectations for first quarter 2011 results. We had grown increasingly concerned about continued operational missteps in drilling.
We also sold out of certain stocks that approached their price targets as they appreciated during the Reporting Period. Shares of apartment REIT Equity Residential, for instance, benefited from the increasing trend in rental activity as home ownership rates declined. We exited the Fund’s position in its stock as it approached our price target and as its market cap was approaching the upper end of the Fund’s stated range.
Were there any notable changes in the Fund’s weightings during the Reporting Period?
In constructing the Fund’s portfolio, we focus on picking stocks rather than on making industry or sector bets. We seek to outpace the benchmark index by overweighting stocks that we expect to outperform and underweighting those that we think may lag. Consequently, changes in the Fund’s sector weights are generally the direct result of individual stock selection or of stock appreciation or depreciation. That said, during the Reporting Period, the Fund’s exposure to consumer discretionary, consumer staples and telecommunication services increased compared to the Russell Index. The Fund’s allocation compared to the benchmark index in financials, health care and materials decreased.
How was the Fund positioned relative to its benchmark index at the end of the Reporting Period?
As of June 30, 2011, the Fund had overweighted positions relative to the Russell Index in the consumer discretionary and telecommunication services sectors. On the same date, the Fund had modestly underweighted positions compared to the Russell Index in financials, consumer staples, health care, industrials, materials and utilities and was rather neutrally weighted to the Russell Index in energy and information technology.
What is the Fund’s tactical view and strategy for the months ahead?
At the end of the Reporting Period, we remained cautiously optimistic on the U.S. equity market, despite macroeconomic, geopolitical and regulatory uncertainty persisting. In our view, valuations remained compelling, especially after the pullback during the second quarter of 2011, as many companies were trading at depressed levels. Companies generally continued to exhibit strong fundamentals, with cash rich balance sheets. We also continued to expect that management teams will be focused in the months ahead on returning value to shareholders through mergers and acquisitions, share buybacks, new or increased dividends and deleveraging of balance sheets, providing further catalyst for growth.
Given this backdrop, we believe the coming months should be fertile ground for forward-looking stock pickers. We anticipate that stock correlations may well decline and that companies should likely begin to trade more in line with underlying fundamentals. We maintain our discipline as we seek companies with strong or improving fundamentals, led by quality management teams that are smart allocators of capital and remain focused on creating shareholder value. As always, deep research resources, a forward-looking investment process and truly actively managed portfolios are keys, in our view, to both preserving capital and outperforming the market over the long term.
FUND BASICS
Mid Cap Value Fund
as of June 30, 2011
| STANDARDIZED AVERAGE ANNUAL TOTAL RETURNS1 |
| For the period ended 6/30/11 | One Year | Five Years | Ten Years | Since Inception | Inception Date | |||||||||||||||
| Institutional | 36.97 | % | 4.94 | % | 9.19 | % | 8.45 | % | 5/01/98 | |||||||||||
| Service | 36.68 | 4.72 | N/A | 4.65 | 1/09/06 | |||||||||||||||
| 1 | The Standardized Average Annual Total Returns are average annual total returns as of the most recent calendar quarter-end. They assume reinvestment of all distributions at net asset value (“NAV”). | |
| Total return figures in the above chart represent past performance and do not indicate future results, which will vary. The investment return and principal value of an investment will fluctuate and, therefore, an investor’s shares, when redeemed, may be worth more or less than their original cost. Current performance may be lower or higher than the total return figures in the above chart. Please visit www.goldmansachsfunds.com/vit to obtain the most recent month-end returns. Performance reflects expense limitations in effect. In their absence, performance would be reduced. |
| EXPENSE RATIOS2 |
| Net Expense Ratio (Current) | Gross Expense Ratio (Before Waivers) | |||||||||
| Institutional | 0.84 | % | 0.87 | % | ||||||
| Service | 1.09 | 1.12 | ||||||||
| 2 | The expense ratios of the Fund, both current (net of any fee waivers or expense limitations) and before waivers (gross of any fee waivers or expense limitations) are as set forth above. The Fund’s waivers and/or expense limitations will remain in place through at least April 29, 2012, and prior to such date the investment adviser may not terminate the arrangements without the approval of the Fund’s Board of Trustees. The expense ratios set forth above may differ from the expense ratios disclosed in the Financial Highlights in this report. |
| TOP TEN HOLDINGS AS OF 6/30/113 |
| Holding | % of Net Assets | Line of Business | ||||||
| The J.M. Smucker Co. | 1.9 | % | Food, Beverage & Tobacco | |||||
| Principal Financial Group, Inc. | 1.9 | Insurance | ||||||
| PPL Corp. | 1.9 | Utilities | ||||||
| Lear Corp. | 1.8 | Automobiles & Components | ||||||
| Xcel Energy, Inc. | 1.8 | Utilities | ||||||
| Sprint Nextel Corp. | 1.7 | Telecommunication Services | ||||||
| Scripps Networks Interactive, Inc. Class A | 1.7 | Media | ||||||
| SLM Corp. | 1.6 | Diversified Financials | ||||||
| DISH Network Corp. Class A | 1.6 | Media | ||||||
| Liberty Media Corp. – Interactive Class A | 1.5 | Retailing | ||||||
| 3 | The top 10 holdings may not be representative of the Fund’s future investments. |
FUND BASICS
| FUND vs. BENCHMARK SECTOR ALLOCATIONS4 |
As of June 30, 2011
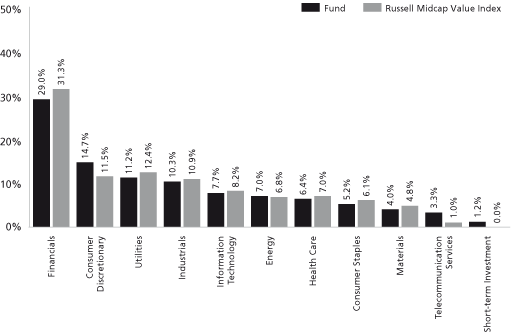
| 4 | The Fund is actively managed and, as such, its composition may differ over time. The above graph categorizes investments using Global Industry Classification Standard (“GICS”), however, the sector classifications used by the portfolio management team may differ from GICS. Consequently, the Fund’s overall industry sector allocations may differ from percentages contained in the graph above. The percentage shown for each investment category reflects the value of investments in that category as a percentage of market value. Short-term investment represent investments in investment companies other than those that are exchange traded. The above graph depicts the Fund’s investments but may not represent the Fund’s market exposure due to the exclusion of derivatives, if any, as listed in the Additional Investment Information section of the Schedule of Investments. |
GOLDMAN SACHS VARIABLE INSURANCE TRUST MID CAP VALUE FUND
Schedule of Investments
June 30, 2011 (Unaudited)
| Shares | Description | Value | ||||||
Common Stocks – 98.9% | ||||||||
Automobiles & Components – 3.0% | ||||||||
| 316,491 | Lear Corp. | $ | 16,925,939 | |||||
| 181,089 | TRW Automotive Holdings Corp.* | 10,689,683 | ||||||
| 27,615,622 | ||||||||
Banks – 5.8% | ||||||||
| 205,640 | CIT Group, Inc.* | 9,101,626 | ||||||
| 958,036 | Fifth Third Bancorp | 12,214,959 | ||||||
| 70,289 | First Republic Bank* | 2,268,929 | ||||||
| 86,886 | M&T Bank Corp. | 7,641,624 | ||||||
| 507,266 | SunTrust Banks, Inc. | 13,087,463 | ||||||
| 393,778 | Zions Bancorporation | 9,454,610 | ||||||
| 53,769,211 | ||||||||
Capital Goods – 7.6% | ||||||||
| 186,816 | BE Aerospace, Inc.* | 7,623,961 | ||||||
| 109,422 | Cooper Industries PLC | 6,529,211 | ||||||
| 86,769 | Eaton Corp. | 4,464,265 | ||||||
| 217,366 | GrafTech International Ltd.* | 4,406,009 | ||||||
| 769,591 | Masco Corp. | 9,258,179 | ||||||
| 105,812 | Parker Hannifin Corp. | 9,495,569 | ||||||
| 300,951 | Pentair, Inc. | 12,146,382 | ||||||
| 359,694 | Spirit Aerosystems Holdings, Inc. Class A* | 7,913,268 | ||||||
| 361,603 | Textron, Inc. | 8,537,447 | ||||||
| 70,374,291 | ||||||||
Commercial & Professional Services – 0.7% | ||||||||
| 219,488 | Republic Services, Inc. | 6,771,205 | ||||||
Consumer Durables & Apparel – 3.1% | ||||||||
| 206,732 | Hasbro, Inc. | 9,081,737 | ||||||
| 75,705 | Mohawk Industries, Inc.* | 4,541,543 | ||||||
| 564,702 | Newell Rubbermaid, Inc. | 8,910,997 | ||||||
| 8,793 | NVR, Inc.* | 6,379,146 | ||||||
| 28,913,423 | ||||||||
Consumer Services – 1.9% | ||||||||
| 249,137 | Royal Caribbean Cruises Ltd.* | 9,377,517 | ||||||
| 240,761 | Wyndham Worldwide Corp. | 8,101,607 | ||||||
| 17,479,124 | ||||||||
Diversified Financials – 5.5% | ||||||||
| 386,846 | Invesco Ltd. | 9,052,196 | ||||||
| 495,616 | Janus Capital Group, Inc. | 4,678,615 | ||||||
| 121,943 | Lazard Ltd. Class A | 4,524,085 | ||||||
| 314,814 | Legg Mason, Inc. | 10,313,307 | ||||||
| 896,499 | SLM Corp. | 15,070,148 | ||||||
| 297,486 | The NASDAQ OMX Group, Inc.* | 7,526,396 | ||||||
| 51,164,747 | ||||||||
Energy – 7.1% | ||||||||
| 164,834 | Cabot Oil & Gas Corp. | 10,930,143 | ||||||
| 137,666 | Cameron International Corp.* | 6,923,223 | ||||||
| 86,478 | Consol Energy, Inc. | 4,192,453 | ||||||
| 35,909 | Energen Corp. | 2,028,859 | ||||||
| 263,769 | Frontier Oil Corp. | 8,522,376 | ||||||
| 110,121 | Helmerich & Payne, Inc. | 7,281,201 | ||||||
| 196,161 | Newfield Exploration Co.* | 13,342,871 | ||||||
| 89,530 | Oil States International, Inc.* | 7,154,342 | ||||||
| 52,824 | Pioneer Natural Resources Co. | 4,731,446 | ||||||
| 65,106,914 | ||||||||
Food, Beverage & Tobacco – 4.2% | ||||||||
| 241,743 | Coca-Cola Enterprises, Inc. | 7,054,061 | ||||||
| 366,224 | ConAgra Foods, Inc. | 9,452,241 | ||||||
| 76,403 | H.J. Heinz Co. | 4,070,752 | ||||||
| 233,136 | The J.M. Smucker Co. | 17,820,916 | ||||||
| 38,397,970 | ||||||||
Health Care Equipment & Services – 5.2% | ||||||||
| 238,623 | Aetna, Inc. | 10,520,888 | ||||||
| 1,907,543 | Boston Scientific Corp.* | 13,181,122 | ||||||
| 383,564 | Hologic, Inc.* | 7,736,486 | ||||||
| 199,744 | Kinetic Concepts, Inc.* | 11,511,247 | ||||||
| 139,238 | Patterson Companies, Inc. | 4,579,538 | ||||||
| 47,529,281 | ||||||||
Household & Personal Products – 1.0% | ||||||||
| 133,066 | Energizer Holdings, Inc.* | 9,628,656 | ||||||
Insurance – 10.6% | ||||||||
| 168,530 | Everest Re Group Ltd. | 13,777,327 | ||||||
| 710,152 | Genworth Financial, Inc. Class A* | 7,300,363 | ||||||
| 374,553 | Hartford Financial Services Group, Inc. | 9,876,963 | ||||||
| 234,060 | Lincoln National Corp. | 6,668,369 | ||||||
| 186,641 | Marsh & McLennan Companies, Inc. | 5,821,333 | ||||||
| 87,706 | PartnerRe Ltd. | 6,038,558 | ||||||
| 574,175 | Principal Financial Group, Inc. | 17,466,403 | ||||||
| 350,224 | Unum Group | 8,923,707 | ||||||
| 361,545 | W.R. Berkley Corp. | 11,728,520 | ||||||
| 479,211 | XL Group PLC | 10,533,058 | ||||||
| 98,134,601 | ||||||||
Materials – 4.0% | ||||||||
| 47,418 | Albemarle Corp. | 3,281,326 | ||||||
| 479,388 | Chemtura Corp.* | 8,724,861 | ||||||
| 122,991 | Cytec Industries, Inc. | 7,033,855 | ||||||
| 432,129 | Huntsman Corp. | 8,145,632 | ||||||
| 316,663 | Stillwater Mining Co.* | 6,969,753 | ||||||
| 244,746 | Thompson Creek Metals Co., Inc.* | 2,442,565 | ||||||
| 36,597,992 | ||||||||
Media – 4.5% | ||||||||
| 484,930 | DISH Network Corp. Class A* | 14,872,803 | ||||||
| 255,895 | Liberty Global, Inc. Class A* | 11,525,511 | ||||||
| 317,243 | Scripps Networks Interactive, Inc. Class A | 15,506,838 | ||||||
| 41,905,152 | ||||||||
Pharmaceuticals, Biotechnology & Life Sciences – 1.3% | ||||||||
| 479,084 | Warner Chilcott PLC Class A | 11,560,297 | ||||||
Real Estate Investment Trust – 7.0% | ||||||||
| 59,341 | Alexandria Real Estate Equities, Inc. | 4,594,180 | ||||||
| 59,050 | AvalonBay Communities, Inc. | 7,582,020 | ||||||
| 96,028 | Camden Property Trust | 6,109,301 | ||||||
GOLDMAN SACHS VARIABLE INSURANCE TRUST MID CAP VALUE FUND
Schedule of Investments (continued)
June 30, 2011 (Unaudited)
| Shares | Description | Value | ||||||
Common Stocks – (continued) | ||||||||
Real Estate Investment Trust – (continued) | ||||||||
| 133,415 | Douglas Emmett, Inc. | $ | 2,653,624 | |||||
| 23,294 | Essex Property Trust, Inc. | 3,151,445 | ||||||
| 506,880 | Host Hotels & Resorts, Inc. | 8,591,616 | ||||||
| 481,695 | Kimco Realty Corp. | 8,978,795 | ||||||
| 961,194 | MFA Financial, Inc. | 7,728,000 | ||||||
| 247,230 | Tanger Factory Outlet Centers, Inc. | 6,618,347 | ||||||
| 161,833 | Ventas, Inc. | 8,530,218 | ||||||
| 64,537,546 | ||||||||
Retailing – 2.1% | ||||||||
| 124,283 | Guess?, Inc. | 5,227,343 | ||||||
| 844,684 | Liberty Media Corp. — Interactive Class A* | 14,165,351 | ||||||
| 19,392,694 | ||||||||
Semiconductors & Semiconductor Equipment – 2.3% | ||||||||
| 172,665 | Maxim Integrated Products, Inc. | 4,413,317 | ||||||
| 657,066 | ON Semiconductor Corp.* | 6,879,481 | ||||||
| 275,708 | Xilinx, Inc. | 10,055,071 | ||||||
| 21,347,869 | ||||||||
Software & Services – 3.4% | ||||||||
| 113,382 | BMC Software, Inc.* | 6,201,995 | ||||||
| 99,581 | Check Point Software Technologies Ltd.* | 5,661,180 | ||||||
| 227,359 | Electronic Arts, Inc.* | 5,365,672 | ||||||
| 350,103 | Parametric Technology Corp.* | 8,027,862 | ||||||
| 257,628 | Quest Software, Inc.* | 5,855,885 | ||||||
| 31,112,594 | ||||||||
Technology Hardware & Equipment – 2.0% | ||||||||
| 117,018 | Amphenol Corp. Class A | 6,317,802 | ||||||
| 1,003,736 | Brocade Communications Systems, Inc.* | 6,484,134 | ||||||
| 84,556 | Polycom, Inc.* | 5,436,951 | ||||||
| 18,238,887 | ||||||||
Telecommunication Services – 3.3% | ||||||||
| 286,568 | CenturyLink, Inc. | 11,585,944 | ||||||
| 695,191 | Clearwire Corp. Class A* | 2,627,822 | ||||||
| 2,943,485 | Sprint Nextel Corp.* | 15,865,384 | ||||||
| 30,079,150 | ||||||||
Transportation – 2.0% | ||||||||
| 1,055,639 | JetBlue Airways Corp.* | 6,439,398 | ||||||
| 116,410 | Kansas City Southern* | 6,906,605 | ||||||
| 84,766 | Ryder System, Inc. | 4,818,947 | ||||||
| 18,164,950 | ||||||||
Utilities – 11.3% | ||||||||
| 419,103 | CMS Energy Corp. | 8,252,138 | ||||||
| 155,085 | Edison International | 6,009,544 | ||||||
| 132,876 | Great Plains Energy, Inc. | 2,754,520 | ||||||
| 236,441 | Northeast Utilities | 8,315,630 | ||||||
| 476,380 | NV Energy, Inc. | 7,312,433 | ||||||
| 152,938 | Pinnacle West Capital Corp. | 6,817,976 | ||||||
| 615,222 | PPL Corp. | 17,121,628 | ||||||
| 144,656 | Questar Corp. | 2,561,858 | ||||||
| 247,801 | SCANA Corp. | 9,755,925 | ||||||
| 205,121 | Sempra Energy | 10,846,799 | ||||||
| 254,365 | The AES Corp.* | 3,240,610 | ||||||
| 167,074 | Westar Energy, Inc. | 4,495,961 | ||||||
| 673,844 | Xcel Energy, Inc. | 16,374,409 | ||||||
| 103,859,431 | ||||||||
TOTAL COMMON STOCKS | ||||||||
(Cost $787,044,266) | $ | 911,681,607 | ||||||
| Shares | Rate | Value | ||||||||
Short-term Investment(a) – 1.2% | ||||||||||
| JPMorgan U.S. Government Money Market Fund — Capital Shares | ||||||||||
| 11,384,811 | 0.010 | % | $ | 11,384,811 | ||||||
(Cost $11,384,811) | ||||||||||
TOTAL INVESTMENTS – 100.1% | ||||||||||
(Cost $798,429,077) | $ | 923,066,418 | ||||||||
LIABILITIES IN EXCESS OF OTHER ASSETS – (0.1)% | (993,003 | ) | ||||||||
NET ASSETS – 100.0% | $ | 922,073,415 | ||||||||
The percentage shown for each investment category reflects the value of investments in that category as a percentage of net assets.
| * | Non-income producing security. | |
| (a) | Variable rate security. Interest rate disclosed is that which is in effect at June 30, 2011. |
GOLDMAN SACHS VARIABLE INSURANCE TRUST MID CAP VALUE FUND
Statement of Assets and Liabilities
June 30, 2011 (Unaudited)
Assets: | ||||
| Investments in securities, at value (identified cost $798,429,077) | $ | 923,066,418 | ||
| Receivables: | ||||
| Investment securities sold | 1,708,219 | |||
| Fund shares sold | 1,506,827 | |||
| Dividends | 1,204,078 | |||
| Other assets | 5,014 | |||
Total assets | 927,490,556 | |||
Liabilities: | ||||
| Payables: | ||||
| Investment securities purchased | 3,771,474 | |||
| Fund shares redeemed | 863,498 | |||
| Amounts owed to affiliates | 639,725 | |||
| Accrued expenses | 142,444 | |||
Total liabilities | 5,417,141 | |||
Net Assets: | ||||
| Paid-in capital | 929,242,118 | |||
| Accumulated undistributed net investment income | 5,366,968 | |||
| Accumulated net realized loss from investment transactions | (137,173,012 | ) | ||
| Net unrealized gain on investments | 124,637,341 | |||
NET ASSETS | $ | 922,073,415 | ||
| Net Assets: | ||||
| Institutional | $ | 756,859,222 | ||
| Service | 165,214,193 | |||
| Total Net Assets | $ | 922,073,415 | ||
| Shares of beneficial interest outstanding $0.001 par value (unlimited shares authorized): | ||||
| Institutional | 50,587,835 | |||
| Service | 11,040,355 | |||
| Net asset value, offering and redemption price per share: | ||||
| Institutional | $14.96 | |||
| Service | 14.96 | |||
GOLDMAN SACHS VARIABLE INSURANCE TRUST MID CAP VALUE FUND
Statement of Operations
For the Six Months Ended June 30, 2011 (Unaudited)
Investment income: | ||||
| Dividends | $ | 6,802,281 | ||
Expenses: | ||||
| Management fees | 3,711,596 | |||
| Distribution and Service fees — Service Class | 195,458 | |||
Transfer Agent fees(a) | 92,782 | |||
| Printing and mailing costs | 54,120 | |||
| Professional fees | 45,522 | |||
| Custody and accounting fees | 39,748 | |||
| Trustee fees | 8,745 | |||
| Other | 17,250 | |||
Total expenses | 4,165,221 | |||
| Less — expense reductions | (754 | ) | ||
Net expenses | 4,164,467 | |||
NET INVESTMENT INCOME | 2,637,814 | |||
Realized and unrealized gain (loss) from investment transactions: | ||||
| Net realized gain from: | ||||
| Investment transactions (including commissions recaptured of $153,122) | 91,298,590 | |||
| Net change in unrealized loss on: | ||||
| Investments | (38,936,021 | ) | ||
Net realized and unrealized gain from investment transactions | 52,362,569 | |||
NET INCREASE IN NET ASSETS RESULTING FROM OPERATIONS | $ | 55,000,383 | ||
| (a) | Institutional and Service Shares had Transfer Agent fees of $77,147 and $15,635, respectively. |
GOLDMAN SACHS VARIABLE INSURANCE TRUST MID CAP VALUE FUND
Statements of Changes in Net Assets
| For the | For the | |||||||
| Six Months Ended | Fiscal Year Ended | |||||||
| June 30, 2011 (Unaudited) | December 31, 2010 | |||||||
From operations: | ||||||||
| Net investment income | $ | 2,637,814 | $ | 5,547,217 | ||||
| Net realized gain from investment transactions | 91,298,590 | 140,485,737 | ||||||
| Net change in unrealized gain (loss) on investments | (38,936,021 | ) | 51,064,556 | |||||
Net increase in net assets resulting from operations | 55,000,383 | 197,097,510 | ||||||
Distributions to shareholders: | ||||||||
| From net investment income | ||||||||
| Institutional Shares | — | (4,764,554 | ) | |||||
| Service Shares | — | (592,691 | ) | |||||
Total distributions to shareholders | — | (5,357,245 | ) | |||||
From share transactions: | ||||||||
| Proceeds from sales of shares | 47,156,873 | 52,232,265 | ||||||
| Reinvestment of distributions | — | 5,357,245 | ||||||
| Cost of shares redeemed | (96,268,019 | ) | (289,923,397 | ) | ||||
Net decrease in net assets resulting from share transactions | (49,111,146 | ) | (232,333,887 | ) | ||||
TOTAL INCREASE (DECREASE) | 5,889,237 | (40,593,622 | ) | |||||
Net assets: | ||||||||
| Beginning of period | 916,184,178 | 956,777,800 | ||||||
| End of period | $ | 922,073,415 | $ | 916,184,178 | ||||
Accumulated undistributed net investment income | $ | 5,366,968 | $ | 2,729,154 | ||||
GOLDMAN SACHS VARIABLE INSURANCE TRUST MID CAP VALUE FUND
Financial Highlights
Selected Data for a Share Outstanding Throughout Each Period
| Income (loss) from | ||||||||||||||||||||||||||||||||||||||||||||||||||||||||||
| investment operations | Distributions to shareholders | |||||||||||||||||||||||||||||||||||||||||||||||||||||||||
| Net | | Ratio of | Ratio of | |||||||||||||||||||||||||||||||||||||||||||||||||||||||
| Net asset | realized | From | Net asset | Net assets, | Ratio of | total | net investment | |||||||||||||||||||||||||||||||||||||||||||||||||||
| value, | Net | and | Total from | From net | net | value, | end of | net expenses | expenses | income | Portfolio | |||||||||||||||||||||||||||||||||||||||||||||||
| beginning | investment | unrealized | investment | investment | realized | Total | end of | Total | period | to average | to average | to average | turnover | |||||||||||||||||||||||||||||||||||||||||||||
| Year - Share Class | of period | income(a) | gain (loss) | operations | income | gains | distributions | period | return(b) | (in 000s) | net assets | net assets | net assets | rate | ||||||||||||||||||||||||||||||||||||||||||||
FOR THE SIX MONTHS ENDED JUNE 30, (UNAUDITED) | ||||||||||||||||||||||||||||||||||||||||||||||||||||||||||
| 2011 - Institutional | $ | 14.10 | $ | 0.04 | $ | 0.82 | $ | 0.86 | $ | — | $ | — | $ | — | $ | 14.96 | 6.10 | % | $ | 756,859 | 0.86 | %(c) | 0.86 | %(c) | 0.61 | %(c) | 38 | % | ||||||||||||||||||||||||||||||
| 2011 - Service | 14.12 | 0.03 | 0.81 | 0.84 | — | — | — | 14.96 | 5.95 | 165,214 | 1.11 | (c) | 1.11 | (c) | 0.37 | (c) | 38 | |||||||||||||||||||||||||||||||||||||||||
FOR THE FISCAL YEARS ENDED DECEMBER 31, | ||||||||||||||||||||||||||||||||||||||||||||||||||||||||||
| 2010 - Institutional | 11.35 | 0.08 | 2.76 | 2.84 | (0.09 | ) | — | (0.09 | ) | 14.10 | 25.00 | 769,552 | 0.87 | 0.87 | 0.65 | 88 | ||||||||||||||||||||||||||||||||||||||||||
| 2010 - Service | 11.37 | 0.05 | 2.76 | 2.81 | (0.06 | ) | — | (0.06 | ) | 14.12 | 24.69 | 146,632 | 1.12 | 1.12 | 0.44 | 88 | ||||||||||||||||||||||||||||||||||||||||||
| 2009 - Institutional | 8.66 | 0.14 | (d) | 2.73 | 2.87 | (0.18 | ) | — | (0.18 | ) | 11.35 | 33.15 | 834,376 | 0.86 | 0.86 | 1.46 | (d) | 111 | ||||||||||||||||||||||||||||||||||||||||
| 2009 - Service | 8.68 | 0.12 | (d) | 2.73 | 2.85 | (0.16 | ) | — | (0.16 | ) | 11.37 | 32.78 | 122,402 | 1.11 | 1.11 | 1.21 | (d) | 111 | ||||||||||||||||||||||||||||||||||||||||
| 2008 - Institutional | 14.02 | 0.14 | (e) | (5.34 | ) | (5.20 | ) | (0.14 | ) | (0.02 | ) | (0.16 | ) | 8.66 | (36.97 | ) | 748,682 | 0.84 | 0.84 | 1.16 | (e) | 93 | ||||||||||||||||||||||||||||||||||||
| 2008 - Service | 14.03 | 0.11 | (e) | (5.34 | ) | (5.23 | ) | (0.10 | ) | (0.02 | ) | (0.12 | ) | 8.68 | (37.13 | ) | 111,437 | 1.09 | 1.09 | 0.91 | (e) | 93 | ||||||||||||||||||||||||||||||||||||
| 2007 - Institutional | 16.09 | 0.14 | (f) | 0.39 | 0.53 | (0.13 | ) | (2.47 | ) | (2.60 | ) | 14.02 | 3.20 | 1,559,013 | 0.87 | (g) | 0.87 | (g) | 0.85 | (f)(g) | 84 | |||||||||||||||||||||||||||||||||||||
| 2007 - Service | 16.09 | 0.12 | (f) | 0.40 | 0.52 | (0.11 | ) | (2.47 | ) | (2.58 | ) | 14.03 | 3.16 | 225,190 | 0.97 | (g) | 1.12 | (g) | 0.75 | (f)(g) | 84 | |||||||||||||||||||||||||||||||||||||
| 2006 - Institutional | 15.53 | 0.13 | 2.39 | 2.52 | (0.16 | ) | (1.80 | ) | (1.96 | ) | 16.09 | 16.16 | 1,673,896 | 0.86 | 0.87 | 0.80 | 57 | |||||||||||||||||||||||||||||||||||||||||
| 2006 - Service (Commenced January 9, 2006) | 15.96 | 0.12 | 1.95 | 2.07 | (0.14 | ) | (1.80 | ) | (1.94 | ) | 16.09 | 12.91 | 273,903 | 0.96 | (c) | 1.12 | (c) | 0.72 | (c) | 57 | ||||||||||||||||||||||||||||||||||||||
| (a) | Calculated based on the average shares outstanding methodology. | |
| (b) | Assumes investment at the net asset value at the beginning of the period, reinvestment of all distributions, and a complete redemption of the investment at the net asset value at the end of the period. Total returns for periods less than one full year are not annualized. | |
| (c) | Annualized. | |
| (d) | Reflects income recognized from non-recurring special dividends which amounted to $0.03 per share and 0.37% of average net assets. | |
| (e) | Reflects income recognized from non-recurring special dividends which amounted to $0.01 per share and 0.11% of average net assets. | |
| (f) | Reflects income recognized from non-recurring special dividends which amounted to $0.01 per share and 0.06% of average net assets. | |
| (g) | Includes non-recurring expense for a special shareholder proxy meeting which amounted to approximately 0.02% of average net assets. |
12
GOLDMAN SACHS VARIABLE INSURANCE TRUST MID CAP VALUE FUND
Notes to Financial Statements
June 30, 2011 (Unaudited)
| 1. ORGANIZATION |
Goldman Sachs Variable Insurance Trust (the “Trust” or “VIT”) is a Delaware statutory trust registered under the Investment Company Act of 1940, as amended (the “Act”), as an open-end management investment company. The Trust includes the Goldman Sachs Mid Cap Value Fund (the “Fund”). The Fund is a diversified portfolio under the Act offering two classes of shares — Institutional and Service.
Goldman Sachs Asset Management, L.P. (“GSAM”), an affiliate of Goldman, Sachs & Co. (“Goldman Sachs”), serves as investment adviser to the Fund pursuant to a management agreement (the “Agreement”) with the Trust.
| 2. SIGNIFICANT ACCOUNTING POLICIES |
The following is a summary of the significant accounting policies consistently followed by the Fund. The preparation of financial statements in conformity with accounting principles generally accepted in the United States of America (“GAAP”) requires management to make estimates and assumptions that may affect the amounts and disclosures in the financial statements. Actual results could differ from those estimates and assumptions.
A. Investment Valuation — The investment valuation policy of the Fund is to value investments at market value. Investments in equity securities and investment companies traded on a United States (“U.S.”) securities exchange or the NASDAQ system are valued daily at their last sale price or official closing price on the principal exchange or system on which they are traded. If no sale occurs, such securities and investment companies are valued at the last bid price for long positions and at the last ask price for short positions. Debt securities for which market quotations are readily available are valued on the basis of quotations furnished by an independent pricing service approved by the trustees or provided by securities dealers. The pricing services may use valuation models or matrix pricing, which consider: (i) yield or price with respect to bonds that are considered comparable in characteristics such as rating, interest rate and maturity date or (ii) quotations from securities dealers to determine current value. If accurate quotations are not readily available, or if GSAM believes that such quotations do not accurately reflect fair value, the fair value of the Fund’s investments may be determined based on yield equivalents, a pricing matrix or other sources, under valuation procedures established by the trustees. Unlisted equity securities for which market quotations are available are valued at the last sale price on the valuation date, or if no sale occurs, at the last bid price. In the absence of market quotations, broker quotes will be utilized or the security will be fair valued. Investments in investment companies (other than those that are exchange traded) are valued at the net asset value per share (“NAV”) of the investment company on the valuation date. Short-term debt obligations that mature in sixty days or less and that do not exhibit signs of credit deterioration are valued at amortized cost, which approximates market value.
GSAM, consistent with its procedures and applicable regulatory guidance, may make an adjustment to the previous closing prices of either domestic or foreign securities in light of significant events to reflect what it believes to be the fair value of the securities at the time of determining the Fund’s NAV. Significant events that could affect a large number of securities in a particular market may include, but are not limited to: situations relating to one or more single issuers in a market sector; significant fluctuations in U.S. or foreign markets; market dislocations; market disruptions or market closings; equipment failures; natural or man-made disasters or acts of God; armed conflicts; government actions or other developments; as well as the same or similar events which may affect specific issuers or the securities markets even though not tied directly to the securities markets. Other significant events that could relate to a single issuer may include, but are not limited to: corporate actions such as reorganizations, mergers and buy-outs; corporate announcements, including those relating to earnings, products and regulatory news; significant litigation; low trading volume; and trading limits or suspensions.
B. Security and Fund Share Transactions, and Investment Income — Security and Fund share transactions are reflected for financial reporting purposes as of the trade date, which may cause the NAV as stated in the accompanying financial statements to be different than the NAV applied to Fund share transactions. Realized gains and losses on sales of portfolio securities are calculated using the identified cost basis. Dividend income is recognized on the ex-dividend date, net of foreign withholding taxes, if any, which are reduced by any amounts reclaimable by the Fund, where applicable. Certain dividends from foreign securities will be recorded when the Fund is informed of the dividend, if such information is obtained subsequent to the ex-dividend date.
GOLDMAN SACHS VARIABLE INSURANCE TRUST MID CAP VALUE FUND
Notes to Financial Statements (continued)
June 30, 2011 (Unaudited)
| 2. SIGNIFICANT ACCOUNTING POLICIES (continued) |
Interest income is recorded on the basis of interest accrued, premium amortized and discount accreted. In addition, it is the Fund’s policy to accrue for foreign capital gains taxes, if applicable, on certain foreign securities held by the Fund. An estimated foreign capital gains tax is recorded daily on net unrealized gains on these securities and is payable upon the sale of such securities when a gain is realized.
Investment income and unrealized and realized gains or losses are allocated daily to each class of shares of the Fund based upon the relative proportion of net assets of each class.
In addition, distributions received from the Fund’s investments in the U.S. real estate investment trusts (“REITs”) often include a “return of capital”, which is recorded by the Fund as a reduction of the cost basis of the securities held. The Internal Revenue Code of 1986, as amended (the “Code”) requires a REIT to distribute at least 95% of its taxable income to investors. In many cases, however, because of “non-cash” expenses such as property depreciation, a REIT’s cash flow will exceed its taxable income. The REIT may distribute this excess cash to offer a more competitive yield. This portion of the Fund’s distributions is deemed a return of capital and is generally not taxable to shareholders.
C. Expenses — Expenses incurred by the Fund, which may not specifically relate to the Fund, may be shared with other registered investment companies having management agreements with GSAM or its affiliates, as appropriate. These expenses are allocated to the Fund on a straight-line and/or pro-rata basis depending upon the nature of the expenses and are accrued daily. Non-class specific expenses are allocated daily to each share class of the respective Fund based upon the relative proportion of net assets of each class. Class specific expenses, where applicable, are borne by the respective share classes and include Distribution and Service and Transfer Agent fees.
D. Federal Taxes and Distributions to Shareholders — It is the Fund’s policy to comply with the requirements of the Code, applicable to regulated investment companies (mutual funds) and to distribute each year substantially all of its investment company taxable income and capital gains to its shareholders. Accordingly, the Fund is not required to make any provisions for the payment of federal income tax. Distributions to shareholders are recorded on the ex-dividend date. Income and capital gains distributions, if any, are declared and paid annually.
Net capital losses are carried forward to future fiscal years and may be used to the extent allowed by the Code to offset any future capital gains. Utilization of capital loss carryforwards will reduce the requirement of future capital gains distributions.
The characterization of distributions to shareholders for financial reporting purposes is determined in accordance with federal income tax rules, which may differ from GAAP. The source of the Fund’s distributions may be shown in the accompanying financial statements as either from net investment income, net realized gain or capital. Certain components of the Fund’s net assets on the Statement of Assets and Liabilities reflect permanent GAAP/tax differences based on the appropriate tax character.
E. Commission Recapture — The Fund may direct portfolio trades, subject to obtaining best execution, to various brokers who have agreed to rebate a portion of the commissions generated. Such rebates are made directly to the Fund as cash payments and are included in net realized gain (loss) from investments on the Statement of Operations.
| 3. FAIR VALUE OF INVESTMENTS |
The fair value of a financial instrument is the amount that would be received to sell an asset or paid to transfer a liability in an orderly transaction between market participants at the measurement date (i.e., the exit price). GAAP establishes a fair value hierarchy that prioritizes the inputs to valuation techniques used to measure fair value. The hierarchy gives the highest priority to unadjusted quoted prices in active markets for identical assets or liabilities (Level 1 measurements) and the lowest priority to unobservable inputs (Level 3 measurements). The three levels of the fair value hierarchy are described below:
Level 1 — Unadjusted quoted prices in active markets that are accessible at the measurement date for identical, unrestricted assets or liabilities;
GOLDMAN SACHS VARIABLE INSURANCE TRUST MID CAP VALUE FUND
| 3. FAIR VALUE OF INVESTMENTS (continued) |
Level 2 — Quoted prices in markets that are not active or financial instruments for which significant inputs are observable (including, but not limited to, quoted prices for similar securities, interest rates, foreign exchange rates, volatility and credit spreads), either directly or indirectly;
Level 3 — Prices or valuations that require significant unobservable inputs (including GSAM’s assumptions in determining fair value measurement).
The following is a summary of the Fund’s investments categorized in the fair value hierarchy as of June 30, 2011:
| Investment Type | Level 1 | Level 2 | Level 3 | |||||||||
Assets | ||||||||||||
Common Stock and/or Other Equity Investments | $ | 911,681,607 | $ | — | $ | — | ||||||
| Short-term Investment | 11,384,811 | — | — | |||||||||
Total | $ | 923,066,418 | $ | — | $ | — | ||||||
| 4. AGREEMENTS AND AFFILIATED TRANSACTIONS |
A. Management Agreement — Under the Agreement, GSAM manages the Fund, subject to the general supervision of the trustees.
As compensation for the services rendered pursuant to the Agreement, the assumption of the expenses related thereto and administration of the Fund’s business affairs, including providing facilities, GSAM is entitled to a management fee, accrued daily and paid monthly, equal to an annual percentage rate of the Fund’s average daily net assets.
For the six months ended June 30, 2011, contractual and effective net management fees with GSAM were at the following rates:
| Contractual Management Rate | ||||||||||||||||||||
| First | Next | Next | Over | Effective | Effective Net | |||||||||||||||
| $2 billion | $3 billion | $3 billion | $8 billion | Rate | Management Rate | |||||||||||||||
| 0.80% | 0.72 | % | 0.68 | % | 0.67 | % | 0.80 | % | 0.80 | %* | ||||||||||
| * | Effective June 30, 2011, GSAM agreed to waive a portion of its management fee in order to achieve an effective net management rate of 0.77% through at least April 29, 2012. Prior to such date GSAM may not terminate the arrangement without the approval of the trustees. For the six months ended June 30, 2011, GSAM waived approximately $800 of the Fund’s management fee. |
B. Distribution and Service Plan — The Trust, on behalf of the Service Shares of the Fund, has adopted a Distribution and Service Plan (the “Plan”). Under the Plan, Goldman Sachs, which serves as distributor, is entitled to a fee accrued daily and paid monthly for distribution services, which may then be paid by Goldman Sachs to authorized dealers, equal to, on an annual basis, 0.25% of the Fund’s average daily net assets attributable to Service Shares.
C. Transfer Agency Agreement — Goldman Sachs also serves as the transfer agent of the Fund for a fee pursuant to a Transfer Agency Agreement. The fees charged for such transfer agency services are accrued daily and paid monthly at an annual rate of 0.02% of the average daily net assets for Institutional and Service Shares.
D. Other Expense Agreements and Affiliated Transactions — GSAM has agreed to limit certain “Other Expense” of the Fund (excluding management fees, distribution and service fees, transfer agent fees and expenses, taxes, interest, brokerage fees and litigation, indemnification, shareholder meetings and other extraordinary expenses, exclusive of any custody and transfer agent fee credit reductions) to the extent such expenses exceed, on an annual basis, 0.054% of the average daily net assets of the Fund. Such Other Expense reimbursements, if any, are accrued daily and paid monthly. In addition, the Fund is not obligated to reimburse GSAM for prior fiscal year expense reimbursements, if any. These Other Expense reimbursements will remain in place
GOLDMAN SACHS VARIABLE INSURANCE TRUST MID CAP VALUE FUND
Notes to Financial Statements (continued)
June 30, 2011 (Unaudited)
| 4. AGREEMENTS AND AFFILIATED TRANSACTIONS (continued) |
through at least April 29, 2012, and prior to such date GSAM may not terminate the arrangements without the approval of the trustees. For the six months ended June 30, 2011, GSAM did not make any reimbursements to the Fund.
As of June 30, 2011, the amounts owed to affiliates were approximately $592,100, $32,800 and $14,800 for management, distribution and service, and transfer agent fees, respectively.
E. Line of Credit Facility — As of June 30, 2011, the Fund participated in a $580,000,000 committed, unsecured revolving line of credit facility (the “facility”) together with other funds of the Trust and registered investment companies having management agreements with GSAM or its affiliates. Pursuant to the terms of the facility, the Fund and other borrowers could increase the credit amount by an additional $340,000,000, for a total of up to $920,000,000. This facility is to be used solely for temporary or emergency purposes. The interest rate on borrowings is based on the federal funds rate. The facility also requires a fee to be paid by the Fund based on the amount of the commitment that has not been utilized. For the six months ended June 30, 2011, the Fund did not have any borrowings under the facility.
F. Other Transactions with Affiliates — For the six months ended June 30, 2011, Goldman Sachs earned approximately $40,300 in brokerage commissions from portfolio transactions on behalf of the Fund.
| 5. PORTFOLIO SECURITIES TRANSACTIONS |
The cost of purchases and proceeds from sales and maturities of long-term securities for the six months ended June 30, 2011, were $350,269,636 and $391,663,394, respectively.
| 6. TAX INFORMATION |
As of the Fund’s most recent fiscal year end, December 31, 2010, the Fund’s capital loss carryforwards on a tax-basis were as follows:
Capital loss carryforward:(1) | ||||
| Expiring 2016 | $ | (23,257,351 | ) | |
| Expiring 2017 | (198,932,335 | ) | ||
| Total capital loss carryforward | $ | (222,189,686 | ) | |
| (1) | Expiration occurs on December 31 of the year indicated. |
As of June 30, 2011, the Fund’s aggregate security unrealized gains and losses based on cost for U.S. federal income tax purposes were as follows:
| Tax cost | $ | 804,675,131 | ||
| Gross unrealized gain | 139,589,526 | |||
| Gross unrealized loss | (21,198,239 | ) | ||
| Net unrealized security gain | $ | 118,391,287 | ||
The difference between GAAP-basis and tax-basis unrealized gains (losses), as of the most recent fiscal year end, is attributable primarily to wash sales and differences related to the tax treatment of partnership and real estate investment trust investments.
GSAM has reviewed the Fund’s tax positions for all open tax years (the current and prior three years, as applicable) and has concluded that no provision for income tax is required in the Fund’s financial statements. Such open tax years remain subject to examination and adjustment by tax authorities.
GOLDMAN SACHS VARIABLE INSURANCE TRUST MID CAP VALUE FUND
| 6. TAX INFORMATION (continued) |
Under the recently enacted Regulated Investment Company Modernization Act of 2010, the Fund will be permitted to carry forward capital losses incurred in taxable years beginning after December 22, 2010 for an unlimited period. However, any losses incurred during those future taxable years will be required to be utilized prior to the losses incurred in pre-enactment taxable years. As a result of this ordering rule, pre-enactment capital loss carryforwards may be more likely to expire unused. Additionally, post-enactment capital losses that are carried forward will retain their character as either short-term or long-term capital losses rather than being considered all short-term as under previous law.
| 7. OTHER RISKS |
Fund’s Shareholder Concentration Risk — Certain participating insurance companies, accounts, or Goldman Sachs affiliates may from time to time own (beneficially or of record) or control a significant percentage of the Fund’s shares. Redemptions by these entities of their holdings in the Fund may impact the Fund’s liquidity and NAV. These redemptions may also force the Fund to sell securities.
Liquidity Risk — The Fund may make investments that may be illiquid or that may become less liquid in response to market developments or adverse investor perceptions. Liquidity risk may also refer to the risk that a Fund will not be able to pay redemption proceeds within the allowable time period because of unusual market conditions, an unusually high volume of redemption requests, or other reasons. To meet redemption requests, a Fund may be forced to sell investments at an unfavorable time and/or under unfavorable conditions.
Market and Credit Risks — In the normal course of business, the Fund trades financial instruments and enters into financial transactions where risk of potential loss exists due to changes in the market (market risk). Additionally, the Fund may also be exposed to credit risk in the event that an issuer fails to perform or that an institution or entity with which the Fund has unsettled or open transaction defaults.
| 8. INDEMNIFICATIONS |
Under the Trust’s organizational documents, its trustees, officers, employees and agents are indemnified, to the extent permitted by the Act, against certain liabilities that may arise out of performance of their duties to the Fund. Additionally, in the course of business, the Fund enters into contracts that contain a variety of indemnification clauses. The Fund’s maximum exposure under these arrangements is unknown, as this would involve future claims that may be made against the Fund that have not yet occurred. However, GSAM believes the risk of loss under these arrangements to be remote.
| 9. SUBSEQUENT EVENTS |
Subsequent events after the balance sheet date have been evaluated through the date the financial statements were issued. GSAM has concluded that there is no impact requiring adjustment or disclosure in the financial statements.
GOLDMAN SACHS VARIABLE INSURANCE TRUST MID CAP VALUE FUND
Notes to Financial Statements (continued)
June 30, 2011 (Unaudited)
| 10. SUMMARY OF SHARE TRANSACTIONS |
Share activity is as follows:
| For the Six Months Ended | ||||||||||||||||
| June 30, 2011 | For the Fiscal Year Ended | |||||||||||||||
| (Unaudited) | December 31, 2010 | |||||||||||||||
| Shares | Dollars | Shares | Dollars | |||||||||||||
Institutional Shares | ||||||||||||||||
| Shares sold | 1,620,923 | $ | 23,834,204 | 2,606,517 | $ | 31,970,939 | ||||||||||
| Reinvestment of distributions | — | — | 337,912 | 4,764,554 | ||||||||||||
| Shares redeemed | (5,611,184 | ) | (82,627,905 | ) | (21,886,065 | ) | (265,055,214 | ) | ||||||||
| (3,990,261 | ) | (58,793,701 | ) | (18,941,636 | ) | (228,319,721 | ) | |||||||||
Service Shares | ||||||||||||||||
| Shares sold | 1,580,451 | 23,322,669 | 1,609,166 | 20,261,326 | ||||||||||||
| Reinvestment of distributions | — | — | 41,975 | 592,691 | ||||||||||||
| Shares redeemed | (924,281 | ) | (13,640,114 | ) | (2,031,654 | ) | (24,868,183 | ) | ||||||||
| 656,170 | 9,682,555 | (380,513 | ) | (4,014,166 | ) | |||||||||||
NET DECREASE | (3,334,091 | ) | $ | (49,111,146 | ) | (19,322,149 | ) | $ | (232,333,887 | ) | ||||||
GOLDMAN SACHS VARIABLE INSURANCE TRUST MID CAP VALUE FUND
Statement Regarding Basis for Approval of Management Agreement (Unaudited)
Background
The Goldman Sachs Mid Cap Value Fund (the “Fund”) is an investment portfolio of Goldman Sachs Variable Insurance Trust (the “Trust”). The Board of Trustees oversees the management of the Trust and reviews the investment performance and expenses of the Fund at regularly scheduled meetings held during the year. In addition, the Board of Trustees determines annually whether to approve the continuance of the Trust’s investment management agreement (the “Management Agreement”) with Goldman Sachs Asset Management, L.P. (the “Investment Adviser”) on behalf of the Fund.
The Management Agreement was most recently approved for continuation until June 30, 2012 by the Board of Trustees, including those Trustees who are not parties to the Management Agreement or “interested persons” (as defined in the Investment Company Act of 1940, as amended) of any party thereto (the “Independent Trustees”), at a meeting held on June 15-16, 2011 (the “Annual Meeting”).
The review process undertaken by the Trustees spans the course of the year and culminates with the Annual Meeting. To assist the Trustees in their deliberations, the Trustees have established a Contract Review Committee (the “Committee”), comprised of the Independent Trustees. The Committee held three meetings over the course of the year since the Management Agreement was last approved. At those Committee meetings, regularly scheduled Board meetings and/or the Annual Meeting, the Board, or the Independent Trustees, as applicable, considered matters relating to the Management Agreement, including:
| (a) | the nature and quality of the advisory, administrative and other services provided to the Fund by the Investment Adviser and its affiliates, including information about: |
| (i) | the structure, staff and capabilities of the Investment Adviser and its portfolio management teams; | |
| (ii) | the groups within the Investment Adviser and its affiliates that support the portfolio management teams or provide other types of necessary services, including fund services groups (e.g., accounting and financial reporting, tax, shareholder services and operations), controls and risk management groups (e.g., legal, compliance, valuation oversight, credit risk management, internal audit, market risk analysis, finance and strategy and central funding), sales and distribution support groups and others (e.g., information technology and training); | |
| (iii) | trends in headcount; | |
| (iv) | the Investment Adviser’s financial resources and ability to hire and retain talented personnel and strengthen its operations; and | |
| (v) | the parent company’s support of the Investment Adviser and its mutual fund business, as expressed by the firm’s senior management; |
| (b) | information on the investment performance of the Fund, including comparisons to the performance of similar mutual funds, as provided by a third party mutual fund data provider engaged as part of the contract review process (the “Outside Data Provider”), its benchmark performance index, a comparable institutional composite managed by the Investment Adviser, and general investment outlooks in the markets in which the Fund invests; | |
| (c) | the terms of the Management Agreement and agreements with affiliated service providers entered into by the Trust on behalf of the Fund; | |
| (d) | expense information for the Fund, including: |
| (i) | the relative management fee and expense level of the Fund as compared to those of comparable funds managed by other advisers, as provided by the Outside Data Provider; | |
| (ii) | the Fund’s expense trends over time; and | |
| (iii) | to the extent the Investment Adviser manages institutional accounts or collective investment vehicles having investment objectives and policies similar to those of the Fund, comparative information on the advisory fees charged and services provided to those accounts by the Investment Adviser; |
| (e) | with respect to the extensive investment performance and expense comparison data provided by the Outside Data Provider, its processes in producing that data for the Fund; | |
| (f) | the undertakings of the Investment Adviser to waive certain fees and reimburse certain expenses of the Fund that exceed a specified level, and a summary of contractual fee reductions made by the Investment Adviser and its affiliates over the past several years with respect to the Fund; | |
| (g) | information relating to the profitability of the Management Agreement and the transfer agency and distribution and service arrangements of the Fund and the Trust as a whole to the Investment Adviser and its affiliates; | |
| (h) | whether the Fund’s existing management fee schedule adequately addressed any economies of scale; | |
| (i) | a summary of the “fall-out” benefits derived by the Investment Adviser and its affiliates from their relationships with the Fund, including the fees received by the Investment Adviser’s affiliates from the Fund for transfer agency, portfolio brokerage, distribution and other services; | |
| (j) | a summary of potential benefits derived by the Fund as a result of its relationship with the Investment Adviser; |
GOLDMAN SACHS VARIABLE INSURANCE TRUST MID CAP VALUE FUND
Statement Regarding Basis for Approval of Management Agreement (Unaudited) (continued)
| (k) | information regarding commissions paid by the Fund, an update on the Investment Adviser’s soft dollars practices, other information regarding portfolio trading and how the Investment Adviser carries out its duty to seek best execution; | |
| (l) | the manner in which portfolio manager compensation is determined, and the number and types of accounts managed by the portfolio managers; | |
| (m) | the nature and quality of the services provided to the Fund by its unaffiliated service providers, and the Investment Adviser’s general oversight and evaluation (including reports on due diligence) of those service providers as part of the administration services provided under the Management Agreement; and | |
| (n) | the Investment Adviser’s processes and policies addressing various types of potential conflicts of interest; its approach to risk management; the annual review of the effectiveness of the Fund’s compliance program; and compliance reports. |
The Trustees also received an overview of the Fund’s distribution arrangements. They received information regarding the Fund’s assets, share purchase and redemption activity and the payment of Rule 12b-1 distribution and service fees by the Fund’s Service Shares. Information was also provided to the Trustees relating to revenue sharing payments made by and services provided by the Investment Adviser and its affiliates to intermediaries that promote the sale, distribution and/or servicing of Fund shares.
The presentations made at the Board and Committee meetings and at the Annual Meeting encompassed the Fund and other mutual fund portfolios for which the Board of Trustees has responsibility. In evaluating the Management Agreement at the Annual Meeting, the Trustees relied upon their knowledge, resulting from their meetings and other interactions throughout the year, of the Investment Adviser, its affiliates, their services and the Fund. In conjunction with these meetings, the Trustees received written materials and oral presentations on the topics covered, and were advised by their independent legal counsel regarding their responsibilities and other regulatory requirements related to the approval and continuation of mutual fund investment management agreements under applicable law. In addition, the Investment Adviser and its affiliates provided the Independent Trustees with a written response to a formal request for information sent on behalf of the Independent Trustees by their independent legal counsel. During the course of their deliberations, the Independent Trustees met in executive sessions with their independent legal counsel, without representatives of the Investment Adviser or its affiliates present. The Independent Trustees also discussed the broad range of other investment choices that are available to Fund investors, including the availability of comparable funds managed by other advisers.
Nature, Extent and Quality of the Services Provided Under the Management Agreement
As part of their review, the Trustees considered the nature, extent and quality of the services provided by the Investment Adviser. In this regard, the Trustees considered both the investment advisory services, and the other, non-advisory services, that are provided to the Fund by the Investment Adviser and its affiliates. The Trustees noted the transition in the leadership and changes in personnel of various portfolio management teams that had occurred in recent periods, the potential benefit to the Fund of recent increases in headcount at the Investment Adviser and the ongoing recruitment efforts aimed at bringing high quality investment talent to the Investment Adviser. The Independent Trustees concluded that the Investment Adviser had committed substantial financial and operational resources to the Fund and expressed confidence that the Investment Adviser would continue to do so in the future. The Trustees also observed that the Investment Adviser had made significant commitments to address regulatory compliance requirements applicable to the Fund and the Investment Adviser.
Investment Performance
The Trustees also considered the investment performance of the Fund and the Investment Adviser. In this regard, they compared the Fund to its peers using the performance rankings and ratings compiled by the Outside Data Provider as of December 31, 2010, and updated performance information prepared by the Investment Adviser using the peer group identified by the Outside Data provider. The information on the Fund’s investment performance was provided for the one-, three-, five- and ten-year periods ending on the applicable dates. The Trustees also reviewed the Fund’s investment performance over time on a year-by-year basis relative to its performance benchmark. In addition, they considered the investment performance trends of the Fund over time, and reviewed the investment performance of the Fund in light of its investment objective and policies, and market conditions. The Trustees also received information comparing the Fund’s performance to that of a comparable institutional composite managed by the Investment Adviser. The Trustees considered whether the Fund had operated within its investment policies and had complied with its investment limitations.
In addition, the Trustees considered materials prepared and presentations made by the Investment Adviser’s senior management and portfolio management personnel, in which Fund performance was assessed. The Trustees also considered the Investment Adviser’s periodic reports with respect to the Fund’s risk profile, and how the Investment Adviser’s approach to risk monitoring and management influences portfolio management.
GOLDMAN SACHS VARIABLE INSURANCE TRUST MID CAP VALUE FUND
Statement Regarding Basis for Approval of Management Agreement (Unaudited) (continued)
The Independent Trustees noted that for the one-year period ended May 31, 2011, the Fund had outperformed its benchmark index and had placed in the top half of its peer group. The Independent Trustees also noted that the Fund had ranked in the top half of its peer group for the five- and ten-year periods ended May 31, 2011.
Costs of Services Provided and Competitive Information
The Trustees considered the contractual fee rates payable by the Fund under the Management Agreement. In this regard, the Trustees considered information on the services rendered by the Investment Adviser to the Fund, which included both advisory and administrative services that were directed to the needs and operations of the Fund as a registered mutual fund.
In particular, the Trustees reviewed analyses prepared by the Outside Data Provider regarding the expense rankings of the Fund. The analyses provided a comparison of the Fund’s management fees and breakpoints to those of a relevant peer group and category universe; an expense analysis which compared the Fund’s expenses to a peer group and a category universe; and a five-year history comparing the Fund’s expenses to the peer and category medians. The analyses also compared the Fund’s transfer agency fees, custody and accounting fees, distribution fees, other expenses and fee waivers/reimbursements to those of other funds in the peer group and the peer group median. The Trustees concluded that the comparisons provided by the Outside Data Provider were useful in evaluating the reasonableness of the management fees and total expenses paid by the Fund.
In addition, the Trustees considered the Investment Adviser’s undertakings to waive a portion of its management fee and limit the Fund’s “other expenses” ratio (excluding certain expenses) to a certain specified level. They also considered, to the extent that the Investment Adviser manages institutional accounts or collective investment vehicles having investment objectives and policies similar to those of the Fund, comparative fee information for services provided by the Investment Adviser to those accounts, and information that indicated that services provided to the Fund differed in various significant respects from the services provided to institutional accounts, which generally operated under less stringent legal and regulatory structures, required fewer services from the Investment Adviser to a smaller number of client contact points, were less time-intensive and paid lower fees. By contrast, the Trustees noted that the Investment Adviser provides substantial administrative services to the Fund under the terms of the Management Agreement.
In addition, the Trustees noted that shareholders are able to redeem their Fund shares at any time if they believe that the Fund fees and expenses are too high or if they are dissatisfied with the performance of the Fund.
Profitability
The Trustees reviewed the Investment Adviser’s revenues and pre-tax profit margins with respect to the Trust and the Fund. In this regard the Trustees noted that they had received, among other things, profitability analyses and summaries, revenue and expense schedules by Fund and by function (i.e., investment management, transfer agency and distribution and service) and the Investment Adviser’s expense allocation methodology. They observed that the profitability and expense figures are substantially similar to those used by the Investment Adviser for many internal purposes, including compensation decisions among various business groups, and are thus subject to a vigorous internal debate about how certain revenue and expenses should be allocated. The Trustees also reviewed the report of the internal audit group within the Goldman Sachs organization, which included an assessment of the reasonableness and consistency of the Investment Adviser’s expense allocation methodology and an evaluation of the accuracy of the Investment Adviser’s profitability analysis calculations. Profitability data for the Trust and the Fund were provided for 2010 and 2009, and the Trustees considered this information in relation to the Investment Adviser’s overall profitability. The Trustees considered the Investment Adviser’s revenues and pre-tax profit margins both in absolute terms and in comparison to information on the reported pre-tax profit margins earned by certain other asset management firms.
Economies of Scale
The Trustees considered the information that had been provided regarding the Investment Adviser’s profitability and the rationale for the Fund’s breakpoint structure. The Trustees also considered the breakpoints in the fee rate payable under the Management Agreement for the Fund at the following annual percentage rates of the average daily net assets of the Fund:
| First $2 billion | 0.80 | % | ||
| Next $3 billion | 0.72 | |||
| Next $3 billion | 0.68 | |||
| Over $8 billion | 0.67 |
The Trustees noted that the breakpoints at the $5 and $8 billion asset levels had been proposed by the Investment Adviser and approved by the Trustees in 2008 to further share potential economies of scale, if any, with the Fund and its shareholders as assets under management reach those asset levels. The Trustees considered the amounts of assets in the Fund; the Fund’s recent share
GOLDMAN SACHS VARIABLE INSURANCE TRUST MID CAP VALUE FUND
Statement Regarding Basis for Approval of Management Agreement (Unaudited) (continued)
purchase and redemption activity; the information provided by the Investment Adviser relating to the costs of the services provided by the Investment Adviser and its affiliates and their realized profits; information comparing fee rates charged by the Investment Adviser with fee rates charged to other funds in the peer group; and the Investment Adviser’s undertakings to limit the Fund’s fees and “other expenses” ratio (excluding certain expenses) to certain amounts. Upon reviewing these matters at the Annual Meeting, the Trustees concluded that the fee breakpoints represented a means of assuring that benefits of scalability would be passed along to shareholders at the specified asset levels.
Other Benefits to the Investment Adviser and Its Affiliates
The Trustees also considered the other benefits derived by the Investment Adviser and its affiliates from their relationship with the Fund as stated above, including: (a) transfer agency fees received by Goldman, Sachs & Co. (“Goldman Sachs”); (b) brokerage and futures commissions earned by Goldman Sachs for executing securities and futures transactions on behalf of the Fund; (c) research received by the Investment Adviser from broker-dealers in exchange for executing certain transactions on behalf of the Fund; (d) trading efficiencies resulting from aggregation of orders of the Fund with those for other funds or accounts managed by the Investment Adviser; (e) the Investment Adviser’s ability to leverage the infrastructure designed to service the Fund on behalf of its other clients; (f) the Investment Adviser’s ability to cross-market other products and services to Fund shareholders; (g) Goldman Sachs’ retention of certain fees as Fund Distributor; (h) the Investment Adviser’s ability to negotiate better pricing with custodians on behalf of its other clients, as a result of the relationship with the Fund; and (i) the possibility that the working relationship between the Investment Adviser and the Fund’s third party service providers may cause those service providers to be open to doing business with other areas of Goldman Sachs. In the course of considering the foregoing, the Independent Trustees requested and received further information quantifying certain of the fall-out benefits.
Other Benefits to the Fund and Its Shareholders
The Trustees also noted that the Fund receives certain potential benefits as a result of its relationship with the Investment Adviser, including: (a) trading efficiencies resulting from aggregation of orders of the Fund with those of other funds or accounts managed by the Investment Adviser; (b) improved servicing and pricing from vendors because of the volume of business generated by the Investment Adviser and its affiliates; (c) improved servicing from broker-dealers because of the volume of business generated by the Investment Adviser and its affiliates; (d) the Investment Adviser’s ability to negotiate favorable terms with derivatives counterparties as a result of the size and reputation of the Goldman Sachs organization; (e) the advantages gained from the Investment Adviser’s knowledge and experience gained from managing other accounts and products; (f) the Investment Adviser’s ability to hire and retain qualified personnel to provide services to the Fund because of the reputation of the Goldman Sachs organization; (g) the Fund’s access, through the Investment Adviser, to certain firmwide resources (e.g., proprietary databases); and (h) the Fund’s access to certain affiliated distribution channels. The Trustees noted the competitive nature of the mutual fund marketplace, and noted further that many of the Fund’s shareholders invested in the Fund in part because of the Fund’s relationship with the Investment Adviser and that those shareholders have a general expectation that the relationship will continue.
GOLDMAN SACHS VARIABLE INSURANCE TRUST MID CAP VALUE FUND
Statement Regarding Basis for Approval of Management Agreement (Unaudited) (continued)
Conclusion
In connection with their consideration of the Management Agreement, the Trustees gave weight to each of the factors described above, but did not identify any particular factor as controlling their decision. After deliberation and consideration of all of the information provided, including the factors described above, the Trustees concluded, in the exercise of their business judgment, that the management fees paid by the Fund were reasonable in light of the services provided to it by the Investment Adviser, the Investment Adviser’s costs and the Fund’s current and reasonably foreseeable asset levels. The Trustees unanimously concluded that the Investment Adviser’s continued management likely would benefit the Fund and its shareholders and that the Management Agreement should be approved and continued with respect to the Fund until June 30, 2012.
GOLDMAN SACHS VARIABLE INSURANCE TRUST MID CAP VALUE FUND
Fund Expenses — Six Month Period Ended June 30, 2011 (Unaudited)
As a shareholder of Institutional or Service Shares of the Fund, you incur ongoing costs, including management fees, distribution and service (12b-1) fees (with respect to Service Shares) and other Fund expenses. This example is intended to help you understand your ongoing costs (in dollars) of investing in the Institutional Shares and Service Shares of the Fund and to compare these costs with the ongoing costs of investing in other mutual funds.
The example is based on an investment of $1,000 invested at the beginning of the period and held for the entire period from January 1, 2011 through June 30, 2011.
Actual Expenses — The first line under each share class in the table below provides information about actual account values and actual expenses. You may use the information in this line, together with the amount you invested, to estimate the expenses that you paid over the period. Simply divide your account value by $1,000 (for example, an $8,600 account value divided by $1,000=8.6), then multiply the result by the number in the first line under the heading entitled “Expenses Paid” to estimate the expenses you paid on your account during this period.
Hypothetical Example for Comparison Purposes — The second line under each share class in the table below provides information about hypothetical account values and hypothetical expenses based on the Fund’s actual net expense ratio and an assumed rate of return of 5% per year before expenses, which is not the Fund’s actual return. The hypothetical account values and expenses may not be used to estimate the actual ending account balance or expenses you paid for the period. You may use this information to compare the ongoing costs of investing in the Fund and other funds. To do so, compare this 5% hypothetical example with the 5% hypothetical examples that appear in the shareholder reports of the other funds.
Please note that the expenses shown in the table are meant to highlight your ongoing costs only. As a shareholder of the Fund, you do not incur any transaction costs, such as sales charges (loads), redemption fees, or exchange fees, but shareholders of other funds may incur such costs. The second line of the table is useful in comparing ongoing costs only, and will not help you determine the relative total costs of owning different funds whose shareholders may incur transaction costs.
| Expenses Paid | |||||||||||||||
| for the | |||||||||||||||
| Beginning | Ending | 6 Months | |||||||||||||
| Account Value | Account Value | Ended | |||||||||||||
| Share Class | 1/01/11 | 6/30/11 | 6/30/11* | ||||||||||||
Institutional | |||||||||||||||
| Actual | $ | 1,000 | $ | 1,061.00 | $ | 4.39 | |||||||||
| Hypothetical 5% return | 1,000 | 1,020.53 | + | 4.31 | |||||||||||
Service | |||||||||||||||
| Actual | 1,000 | 1,059.50 | 5.67 | ||||||||||||
| Hypothetical 5% return | 1,000 | 1,019.29 | + | 5.56 | |||||||||||
| * | Expenses for each share class are calculated using the Fund’s annualized net expense ratio for each class, which represents the ongoing expenses as a percentage of net assets for the six months ended June 30, 2011. Expenses are calculated by multiplying the annualized net expense ratio by the average account value for the period; then multiplying the result by the number of days in the most recent fiscal half year; and then dividing that result by the number of days in the fiscal year. The annualized net expense ratios for the period were 0.86% and 1.11% for Institutional and Service Shares, respectively. | |
| + | Hypothetical expenses are based on the Fund’s actual annualized net expense ratios and an assumed rate of return of 5% per year before expenses. |
| TRUSTEES Ashok N. Bakhru, Chairman Donald C. Burke John P. Coblentz, Jr. Diana M. Daniels Joseph P. LoRusso James A. McNamara Jessica Palmer Alan A. Shuch Richard P. Strubel | OFFICERS James A. McNamara, President George F. Travers, Principal Financial Officer Peter V. Bonanno, Secretary Scott M. McHugh, Treasurer | |
| GOLDMAN, SACHS & CO. Distributor and Transfer Agent | ||
| GOLDMAN SACHS ASSET MANAGEMENT, L.P. Investment Adviser 200 West Street, New York New York 10282 | ||
| Visit our website at www.goldmansachsfunds.com/vit to obtain the most recent month-end returns. | ||
| The reports concerning the Fund included in this shareholder report may contain certain forward-looking statements about the factors that may affect the performance of the Fund in the future. These statements are based on Fund management’s predictions and expectations concerning certain future events and their expected impact on the Fund, such as performance of the economy as a whole and of specific industry sectors, changes in the levels of interest rates, the impact of developing world events, and other factors that may influence the future performance of the Fund. Management believes these forward-looking statements to be reasonable, although they are inherently uncertain and difficult to predict. Actual events may cause adjustments in portfolio management strategies from those currently expected to be employed. | ||
| A description of the policies and procedures that the Fund uses to determine how to vote proxies relating to portfolio securities and information regarding how the Fund voted proxies relating to portfolio securities during the most recent 12-month period ended June 30 is available (i) without charge, upon request by calling 1-800-621-2550; and (ii) on the Securities and Exchange Commission (“SEC”) website at http://www.sec.gov. | ||
| The Fund files its complete schedule of portfolio holdings with the SEC for the first and third quarters of each fiscal year on Form N-Q. The Fund’s Form N-Q is available on the SEC’s website at http://www.sec.gov within 60 days after the Fund’s first and third fiscal quarters. When available, the Fund’s Forms N-Q may be reviewed and copied at the SEC’s Public Reference Room in Washington, D.C. and information on the operation of the Public Reference Room may also be obtained by calling 1-800-SEC-0330. Forms N-Q may be obtained upon request and without charge by calling 1-800-621-2550. | ||
| Holdings and allocations shown may not be representative of current or future investments. Holdings and allocations may not include the Fund’s entire investment portfolio, which may change at any time. Fund holdings should not be relied on in making investment decisions and should not be construed as research or investment advice regarding particular securities. | ||
| Economic and market forecasts presented herein reflect our judgment as of the date of this presentation and are subject to change without notice. These forecasts do not take into account the specific investment objectives, restrictions, tax and financial situation or other needs of any specific client. Actual data will vary and may not be reflected here. These forecasts are subject to high levels of uncertainty that may affect actual performance. Accordingly, these forecasts should be viewed as merely representative of a broad range of possible outcomes. These forecasts are estimated, based on assumptions, and are subject to significant revision and may change materially as economic and market conditions change. Goldman Sachs has no obligation to provide updates or changes to these forecasts. Case studies and examples are for illustrative purposes only. | ||
| The Global Industry Classification Standard (“GICS”) was developed by and is the exclusive property and a service mark of Morgan Stanley Capital international Inc. (“MSCI”) and Standard & Poor’s, a division of The McGraw-Hill Companies, Inc. (“S&P”) and is licensed for use by Goldman Sachs. Neither MSCI, S&P nor any other party involved in making or compiling the GICS or any GICS classifications makes any express or implied warranties or representations with respect to such standard or classification (or the results to be obtained by the use thereof), and all such parties hereby expressly disclaim all warranties of originality, accuracy, completeness, merchantability or fitness for a particular purpose with respect to any of such standard or classification. Without limiting any of the foregoing, in no event shall MSCI, S&P, any of their affiliates or any third party involved in making or compiling the GICS or any GICS classifications have any liability for any direct, indirect, special, punitive, consequential or any other damages (including lost profits) even if notified of the possibility of such damages. | ||
| The portfolio risk management process includes an effort to monitor and manage risk, but does not imply low risk. | ||
| Shares of the Goldman Sachs VIT Funds are offered to separate accounts of participating life insurance companies for the purpose of funding variable annuity contracts and variable life insurance policies. Shares of the Fund are not offered directly to the general public. The variable annuity contracts and variable life insurance policies are described in the separate prospectuses issued by participating insurance companies. You should refer to those prospectuses for information about surrender charges, mortality and expense risk fees and other charges that may be assessed by participating insurance companies under the variable annuity contracts or variable life insurance policies. Such fees or charges, if any, may affect the return you may realize with respect to your investments. Ask your representative for more complete information. Please consider a fund’s objectives, risks and charges and expenses, and read the prospectus carefully before investing. The prospectus contains this and other information about the Fund. | ||
| This material is not authorized for distribution to prospective investors unless preceded or accompanied by a current Prospectus or summary prospectus, if applicable. Investors should consider a Fund’s objective, risks, and charges and expenses, and read the summary prospectus, if available, and/or the Prospectus carefully before investing or sending money. The summary prospectus, if available, and the Prospectus contain this and other information about a Fund and may be obtained from your authorized dealer or from Goldman, Sachs & Co. by calling 1-800-621-2550. | ||
| Toll Free (in U.S.): 800-292-4726 | ||
| This report is prepared for the general information of contract owners and is not an offer of shares of the Goldman Sachs Variable Insurance Trust: Goldman Sachs Mid Cap Value Fund. | ||
| © 2011 Goldman Sachs. All rights reserved. | ||
| VITMCVSAR11/57660.MF.MED.TMPL/8/2011 | ||
Goldman
Sachs Variable Insurance Trust
Goldman Sachs
Strategic International Equity Fund
Strategic International Equity Fund
Semi-Annual Report
June 30, 2011
GOLDMAN SACHS VARIABLE INSURANCE TRUST STRATEGIC INTERNATIONAL EQUITY FUND
Principal Investment Strategies and Risks
Shares of the Goldman Sachs Variable Insurance Trust — Goldman Sachs Strategic International Equity Fund are offered to separate accounts of participating life insurance companies for the purpose of funding variable annuity contracts and variable life insurance policies. Shares of the Fund are not offered directly to the general public. The variable annuity contracts and variable life insurance policies are described in the separate prospectuses issued by participating insurance companies. You should refer to those prospectuses for information about surrender charges, mortality and expense risk fees and other charges that may be assessed by participating insurance companies under the variable annuity contracts or variable life insurance policies. Such fees or charges, if any, may affect the return you realize with respect to your investments. Ask your representative for more complete information. Please consider the Fund’s objective, risks and charges and expenses, and read the Prospectus carefully before investing. The Prospectus contains this and other information about the Fund.
The Goldman Sachs Strategic International Equity Fund invests primarily in a diversified portfolio of equity investments in companies that are organized outside the United States or whose securities are principally traded outside the United States. The Fund’s equity investments are subject to market risk so that the value of the securities in which it invests may go up or down in response to the prospects of individual companies, particular industry sectors and/or general economic conditions. Foreign and emerging market securities may be more volatile and less liquid than investments in U.S. securities and will be subject to the risks of currency fluctuations and sudden economic or political developments. The Fund may also invest in fixed income securities, which are subject to the risks associated with debt securities generally including credit, liquidity and interest rate risk. Securities of issuers held by the Fund may lack sufficient market liquidity to enable the Fund to sell the securities at an advantageous time or without a substantial drop in price.
GOLDMAN SACHS VARIABLE INSURANCE TRUST STRATEGIC INTERNATIONAL EQUITY FUND
INVESTMENT OBJECTIVE
The Fund seeks long-term capital appreciation.
Portfolio Management Discussion and Analysis
Below, the Goldman Sachs International Equity Portfolio Management Team discusses the performance of the Goldman Sachs Variable Insurance Trust — Goldman Sachs Strategic International Equity Fund ( the “Fund”) and positioning for the six-month period ended June 30, 2011 (the “Reporting Period”).
How did the Fund perform during the Reporting Period?
During the Reporting Period, the Fund’s Institutional and Service Shares generated cumulative total returns of 4.65% and 4.53%, respectively. These returns compare to the 4.98% cumulative total return of the Fund’s benchmark, the Morgan Stanley Capital International (MSCI) Europe, Australasia, Far East (EAFE) Index* (net, unhedged) (the “MSCI EAFE Index”), during the same time period.
What economic and market factors most influenced the international equity markets as a whole during the Reporting Period?
During the Reporting Period, eight of the ten sectors in the MSCI EAFE Index contributed positively to performance, with the health care and consumer staples sectors leading returns. Within the health care sector, pharmaceutical companies were the primary contributors to performance. Evidence of many companies’ ability to pass through commodity price increases contributed to the strong performance of many food and beverage companies within the consumer staples sector. The information technology and utilities sectors, in contrast, experienced weakness during the Reporting Period, detracting from market returns.
Early in the Reporting Period, all ten sectors were generally strong, though energy stocks led the way as the benchmark Brent crude oil price reached almost $120 per barrel on supply disruption fears stemming from escalating unrest across North Africa and the Middle East. The international equity markets broadly remained resilient through most of April due to an earnings season that generally was perceived to exceed expectations. Strong merger and acquisition activity also supported market strength. However, in May and June, international equity market returns experienced weakness brought on by resurfacing concerns about the European sovereign debt crisis in Greece and other periphery economies and about continued supply chain disruptions in the aftermath of the earthquake and tsunami in Japan. After the Greek parliament approved austerity measures to avoid defaulting on its debt, the international equity markets rallied sharply in the last week of June.
What key factors were responsible for the Fund’s performance during the Reporting Period?
The Fund’s modest underperformance relative to the MSCI EAFE Index during the Reporting Period can be primarily attributed to individual stock selection.
What were some of the Fund’s best-performing individual stocks?
The greatest contributors to Fund performance relative to the MSCI EAFE Index during the Reporting Period were French aerospace and defense company Safran, German cable operator Kabel Deutschland and Indonesian cigarette manufacturer Gudang Garam.
Safran’s stock performed well on the back of a strengthening U.S. dollar in May and June, which more than offset the weaker U.S. dollar earlier in the Reporting Period. A strengthening dollar benefits Safran as the company’s revenue base is in U.S. dollars while its costs are reported in euros. Safran’s share price was further boosted by falling oil prices during the second quarter, which is anticipated to improve profitability for one of the company’s key customer bases, namely airlines.
Another strong contributor to the Fund’s performance during the Reporting Period was Kabel Deutschland, Germany’s largest cable operator. Its stock price increased on the back of strong results announced in February 2011, with revenue and earnings before interest, taxes, depreciation and amortization (EBITDA) ahead of consensus. We believe these results were driven by strong numbers of additional subscribers to its premium television services, which is consistent with our investment thesis and may be supportive of continued strong growth going forward.
| * | The unmanaged MSCI EAFE Index Net (unhedged) is a market capitalization weighted composite of securities in 22 developed markets as of May 30, 2010. The Index figures do not include any deduction for fees, expenses or taxes. It is not possible to invest directly in an unmanaged index. |
GOLDMAN SACHS VARIABLE INSURANCE TRUST STRATEGIC INTERNATIONAL EQUITY FUND
The performance of Gudang Garam, the leading cigarette manufacturer in Indonesia, was buoyed by its ability to raise prices in May, without hampering volumes, which continued to be strong. Given the company’s relatively attractive valuation, strong market position and brand and substantial pricing power, we remained bullish at the end of the Reporting Period on its ability to grow earnings for the foreseeable future.
Which stocks detracted significantly from the Fund’s performance during the Reporting Period?
The biggest detractors from Fund performance relative to the MSCI EAFE Index during the Reporting Period were Dutch mail delivery company PostNL, Japanese utilities company Tokyo Electric Power and Japanese electronics giant Sony.
In May, Dutch transportation company TNT N.V. was restructured into two companies — TNT Express, an international express and cargo delivery services company, and PostNL, which focuses on mail delivery. While we had expected the de-merger to be a positive catalyst for PostNL, the opposite proved to be the case. We, however, continued to hold a Fund position in PostNL, as we continued to believe at the end of the Reporting Period that there were a number of positive drivers in place. PostNL is a high dividend-paying stock. The company operates in a deregulated market. It continues to own a stake in TNT Express, and has, in our view, many areas of opportunities for earnings growth, including price increases, a healthier competitive landscape, parcels business expansion and the possibility of branching out to international markets.
Japan’s utilities sector overall detracted from the Fund’s results following the nation’s devastating earthquake and tsunami. Tokyo Electric Power is the operator of the nuclear power plant that was at the core of the nuclear crisis following the powerful natural disasters. Concerns about the magnitude of the nuclear crisis combined with poor perception of the company’s management of the crisis drove Tokyo Electric Power’s share price down sharply. We eliminated the Fund’s position in Tokyo Electric Power based on our outlook ahead for the company.
Sony’s share price fell during the Reporting Period due to generally weak global consumer electronic hardware sales as well as to damage from Japan’s earthquake to its device factories located in the Tohuku region of the nation. At the end of the Reporting Period, we believed the company still had an attractive valuation and was well positioned to maintain competitiveness in non-hardware segments. Thus, we held the Fund’s position in Sony.
Which equity market sectors most significantly affected Fund performance?
Effective security selection within the consumer staples, consumer discretionary and industrials sectors contributed most positively to the Fund’s performance relative to the MSCI EAFE Index during the Reporting Period.
The biggest detractors from the Fund’s relative results during the Reporting Period were financials, health care and utilities, where stock selection in each of these sectors weighed negatively on performance. The Fund’s underweighted allocation to utilities actually contributed to performance, but such positioning was more than offset by the detracting effect of holding poorly-performing Japanese electric utility company Tokyo Electric Power, discussed earlier.
Which countries or regions most affected the Fund’s performance during the Reporting Period?
Typically, the Fund’s individual stock holdings will significantly influence the Fund’s performance within a particular country or region relative to the MSCI EAFE Index. This effect may be even more pronounced in countries that represent only a modest proportion of the MSCI EAFE Index.
That said, based on effective individual stock selection, France, Indonesia and Denmark contributed most positively to the Fund’s returns relative to the MSCI EAFE Index. The countries that detracted most from the Fund’s performance during the Reporting Period were the Netherlands, Spain and Italy.
How did the Fund use derivatives during the Reporting Period?
During the Reporting Period, we did not use derivatives to hedge positions or as part of an active management strategy, but we used index futures, on an opportunistic basis, to ensure the portfolio remained almost fully exposed to equities following cash inflows or stock sales.
GOLDMAN SACHS VARIABLE INSURANCE TRUST STRATEGIC INTERNATIONAL EQUITY FUND
Did the Fund make any significant purchases or sales during the Reporting Period?
As part of the TNT N.V. restructuring referred to earlier, the Fund received shares of TNT Express, an affiliate of PostNL, during the Reporting Period. We held the position as we believe the company has a strong express parcel delivery business and is well positioned to benefit from the company’s move to seed growth in China earlier than competitors.
We initiated a Fund position in Nissan Motor, a Japanese company that manufactures and markets automobiles, light trucks and related parts. The company has overseas production bases in the U.S., the U.K. and Mexico. Nissan Motor also provides financing services and produces industrial motor vehicles, such as towing tractors and forklifts. At the time of purchase, we had conviction in the stock, as we believe the company is well positioned to benefit from global sales volume growth, what we consider to be a rational strategy implemented by strong management for mid-term growth and an attractive valuation.
We exited the Fund’s position in Dutch telecommunications company KPN due to news that impacted our original investment thesis on the company. More specifically, we sold the position in KPN based on announcements that the competitive landscape would be changing in the Dutch mobile phone market, a market in which KPN currently has a dominant market share. We were also concerned about pressures around KPN’s revenue as Dutch consumers seem to be moving away from “out of bundle” SMS (Short Message Service, i.e. the text communication service component of phone, web or mobile communication systems) and voice usage in favor of free smartphone applications, such as e-mail or instant messaging.
U.K. natural gas company BG Group had been a strong performer since we initiated the Fund position in September 2010. In order to capture profits following such strong performance and given our view that there was higher potential upside with other opportunities, we eliminated the Fund’s position in BG Group during the Reporting Period.
Were there any notable changes in the Fund’s weightings during the Reporting Period?
In constructing the Fund’s portfolio, we focus on picking stocks rather than on making regional, country, sector or industry bets. We seek to outpace the benchmark index by overweighting stocks that we expect to outperform and underweighting those that we think may lag. Consequently, changes in the Fund’s country or sector weights are generally the direct result of individual stock selection or of stock appreciation or depreciation. That said, during the Reporting Period, the Fund’s exposure to consumer staples, information technology and utilities increased and its exposure to energy, financials, health care and telecommunication services decreased, each as relative to the MSCI EAFE Index. There were no notable changes in the Fund’s country weightings.
How was the Fund positioned relative to its benchmark index at the end of the Reporting Period?
At the end of June 2011, the Fund had greater weightings than the MSCI EAFE Index in the consumer discretionary and information technology sectors. The Fund had underweighted allocations to the energy, financials, health care, industrials, materials and telecommunication services and was rather neutrally weighted to the MSCI EAFE Index in the utilities and consumer staples sectors at the end of the Reporting Period.
From a country perspective, the Fund had greater positions in Switzerland, Italy and Ireland relative to the MSCI EAFE Index at the end of June 2011. The Fund had less exposure to France, Sweden and Germany than the MSCI EAFE Index at the end of the Reporting Period. On the same date, the Fund had rather neutral exposures to Spain and Australia compared to the MSCI EAFE Index.
As always, we remained focused on individual stock selection, with sector and country positioning being a secondary, but closely monitored, effect.
What is the Fund’s tactical view and strategy for the months ahead?
In our view, multi-decade high corporate profits and cash levels for U.S. companies, dramatically improved European corporate balance sheets and strong global demand from the emerging markets — combined with low yields from cash and fixed income investments — bode well for supporting stock buybacks, higher dividends and greater merger and acquisition activity going forward. We were, at the end of the Reporting Period, particularly optimistic regarding corporate profits, which we believe will likely be predominantly driven by top-line growth rather than margin expansion.
GOLDMAN SACHS VARIABLE INSURANCE TRUST STRATEGIC INTERNATIONAL EQUITY FUND
Commodity prices, including those for oil, had generally weakened in the last months of the Reporting Period. Thus, we were concerned about oil as the demand from China is relatively softer for oil than for other commodities. We also feared that weakening economies in Europe and the U.S. could push oil prices down further in the short term. We further believed that a political desire for lower oil prices could exacerbate the economic slowdown. To date, we have seen the OECD (Organization for Economic Cooperation and Development) nations try to impact the oil price with the coordinated release of strategic petroleum reserves, and it appears that OPEC (Organization of Petroleum Exporting Countries) members with available spare capacity would prefer to see oil prices at a “healthier, more sustainable” sub-$100 per barrel level.
All that said, our team maintains a preference for companies with distinct competitive advantages, which often affords them the additional benefit of being able to pass through price increases to their customers. In addition, we consistently seek companies with strong balance sheets, as we believe these companies will be able to better absorb cost increases that cannot entirely be passed on to customers. With corporate profit margins at high levels at the end of the Reporting Period, we continue to be focused on which companies have the potential to sustain such margins. We are carefully watching current earnings results, company by company, for signs of rising commodity prices pushing up input costs faster than revenues being pulled up by strong global demand. In our view, fundamentally-driven analysis will be critical to determining which companies have the potential to perform well, even in a more challenging environment.
As always, we continue to focus on building the Fund’s quality portfolio through intense bottom-up research and believe such a disciplined strategy will help us position the Fund effectively in these still uncertain times.
FUND BASICS
Strategic International Equity Fund
as of June 30, 2011
| STANDARDIZED AVERAGE ANNUAL TOTAL RETURNS1 |
| For the period ended 6/30/11 | One Year | Five Years | Ten Years | Since Inception | Inception Date | |||||||||||||||
| Institutional | 32.86 | % | 0.05 | % | 3.28 | % | 3.62 | % | 1/12/98 | |||||||||||
| Service | 32.54 | -0.13 | N/A | -0.11 | 1/09/06 | |||||||||||||||
| 1 | The Standardized Average Annual Total Returns are average annual total returns as of the most recent calendar quarter-end. They assume reinvestment of all distributions at net asset value (“NAV”). | |
| Total return figures in the above chart represent past performance and do not indicate future results, which will vary. The investment return and principal value of an investment will fluctuate and, therefore, an investor’s shares, when redeemed, may be worth more or less than their original cost. Current performance may be lower or higher than the total return figures in the above chart. Please visit www.goldmansachsfunds.com/vit to obtain the most recent month-end returns. Performance reflects expense limitations in effect. In their absence, performance would be reduced. |
| EXPENSE RATIOS2 |
| Net Expense Ratio (Current) | Gross Expense Ratio (Before Waivers) | |||||||||
| Institutional | 0.97 | % | 1.09 | % | ||||||
| Service | 1.22 | 1.34 | ||||||||
| 2 | The expense ratios of the Fund, both current (net of any fee waivers or expense limitations) and before waivers (gross of any fee waivers or expense limitations) are as set forth above. The Fund’s waivers and/or expense limitations will remain in place through at least April 29, 2012, and prior to such date the investment adviser may not terminate the arrangements without the approval of the Fund’s Board of Trustees. The expense ratios set forth above may differ from the expense ratios disclosed in the Financial Highlights in this report. |
FUND BASICS
| TOP TEN HOLDINGS AS OF 6/30/113 |
| Holding | % of Net Assets | Line of Business | Country | |||||||
| HSBC Holdings PLC | 3.0 | % | Banks | United Kingdom | ||||||
| Eni SpA | 2.4 | Energy | Italy | |||||||
| Rio Tinto PLC | 2.1 | Materials | United Kingdom | |||||||
| Novartis AG (Registered) | 1.8 | Pharmaceuticals, Biotechnology & Life Sciences | Switzerland | |||||||
| Admiral Group PLC | 1.8 | Insurance | United Kingdom | |||||||
| Telefonaktiebolaget LM Ericsson Class B | 1.8 | Technology Hardware & Equipment | Sweden | |||||||
| Reckitt Benckiser Group PLC | 1.7 | Household & Personal Products | United Kingdom | |||||||
| BNP Paribas | 1.7 | Banks | France | |||||||
| Total SA | 1.7 | Energy | France | |||||||
| Carlsberg A/S Class B | 1.6 | Food, Beverage & Tobacco | Denmark | |||||||
| 3 | The top 10 holdings may not be representative of the Fund’s future investments. |
| FUND vs. BENCHMARK SECTOR ALLOCATIONS4 |
As of June 30, 2011
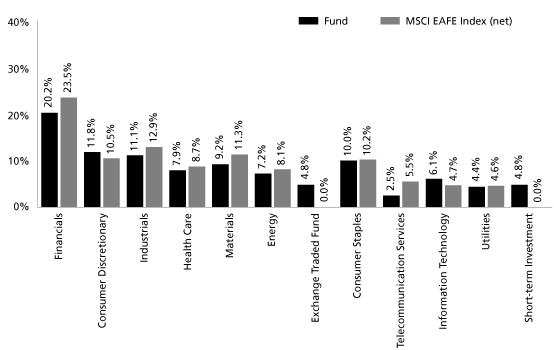
| 4 | The Fund is actively managed and, as such, its composition may differ over time. The above graph categorizes investments using Global Industry Classification Standard (“GICS”), however, the sector classifications used by the portfolio management team may differ from GICS. Underlying industry sector allocations of exchange traded funds (“ETFs”) held by the Fund are not reflected in the graph above. Consequently, the Fund’s overall industry sector allocations may differ from percentages contained in the graph above. The percentage shown for each investment category reflects the value of investments in that category as a percentage of market value. Short-term investments represent investments in investment companies other than those that are exchange traded. The above graph depicts the Fund’s investments but may not represent the Fund’s market exposure due to the exclusion of derivatives, if any, as listed in the Additional Investment Information section of the Schedule of Investments. |
GOLDMAN SACHS VARIABLE INSURANCE TRUST STRATEGIC INTERNATIONAL EQUITY FUND
Schedule of Investments
June 30, 2011 (Unaudited)
| Shares | Description | Value | ||||||
Common Stocks – 90.4% | ||||||||
Australia – 0.5% | ||||||||
| 660,520 | CFS Retail Property Trust (REIT) | $ | 1,287,552 | |||||
Belgium – 0.3% | ||||||||
| 18,261 | UCB SA (Pharmaceuticals, Biotechnology & Life Sciences) | 820,558 | ||||||
Czech Republic – 0.5% | ||||||||
| 20,704 | CEZ AS (Utilities) | 1,065,894 | ||||||
Denmark – 2.6% | ||||||||
| 33,884 | Carlsberg A/S Class B (Food, Beverage & Tobacco) | 3,689,388 | ||||||
| 69,324 | Christian Hansen Holding A/S (Materials) | 1,647,200 | ||||||
| 12,447 | Tryg A/S (Insurance) | 718,771 | ||||||
| 6,055,359 | ||||||||
Finland – 0.4% | ||||||||
| 14,962 | Outotec Oyj (Capital Goods) | 851,642 | ||||||
France – 11.7% | ||||||||
| 5,545 | Air Liquide SA (Materials) | 794,389 | ||||||
| 15,913 | Air Liquide SA-Prime De Fidelite (Materials)* | 2,279,732 | ||||||
| 51,290 | BNP Paribas (Banks) | 3,954,920 | ||||||
| 51,834 | EDF SA (Utilities) | 2,032,148 | ||||||
| 85,016 | GDF Suez (Utilities) | 3,107,132 | ||||||
| 8,297 | PPR (Retailing) | 1,477,739 | ||||||
| 30,808 | Remy Cointreau SA (Food, Beverage & Tobacco) | 2,591,245 | ||||||
| 82,676 | Safran SA (Capital Goods) | 3,527,851 | ||||||
| 57,936 | Societe Generale SA (Banks) | 3,431,321 | ||||||
| 67,378 | Total SA (Energy) | 3,895,357 | ||||||
| 27,091,834 | ||||||||
Germany – 5.9% | ||||||||
| 13,589 | Allianz SE (Registered) (Insurance) | 1,894,943 | ||||||
| 32,850 | Bayer AG (Registered) (Pharmaceuticals, Biotechnology & Life Sciences) | 2,638,400 | ||||||
| 26,100 | Daimler AG (Registered) (Automobiles & Components) | 1,968,241 | ||||||
| 19,118 | HeidelbergCement AG (Materials) | 1,222,707 | ||||||
| 39,125 | Henkel AG & Co. KGaA Preference Shares (Household & Personal Products) | 2,720,681 | ||||||
| 15,861 | Kabel Deutschland Holding AG (Media)* | 977,046 | ||||||
| 10,709 | Volkswagen AG Preference Shares (Automobiles & Components) | 2,214,576 | ||||||
| 13,636,594 | ||||||||
Hong Kong – 2.5% | ||||||||
| 339,000 | Hang Lung Properties Ltd. (Real Estate) | 1,393,848 | ||||||
| 494,000 | Lifestyle International Holdings Ltd. (Retailing) | 1,445,238 | ||||||
| 528,000 | Sands China Ltd. (Consumer Services)* | 1,431,170 | ||||||
| 106,443 | Sun Hung Kai Properties Ltd. (Real Estate) | 1,555,939 | ||||||
| 5,826,195 | ||||||||
Indonesia – 1.4% | ||||||||
| 304,000 | PT Gudang Garam Tbk (Food, Beverage & Tobacco) | 1,769,297 | ||||||
| 3,078,000 | PT Perusahaan Gas Negara (Utilities) | 1,447,684 | ||||||
| 3,216,981 | ||||||||
Ireland* – 0.2% | ||||||||
| 438,255 | Kenmare Resources PLC (Materials) | 414,641 | ||||||
Israel – 0.9% | ||||||||
| 42,583 | Teva Pharmaceutical Industries Ltd. ADR (Pharmaceuticals, Biotechnology & Life Sciences) | 2,053,352 | ||||||
Italy – 5.4% | ||||||||
| 137,736 | Azimut Holding SpA (Diversified Financials) | 1,285,900 | ||||||
| 235,807 | Eni SpA (Energy) | 5,588,382 | ||||||
| 1,043,082 | Telecom Italia SpA RSP (Telecommunication Services) | 1,213,499 | ||||||
| 1,663,294 | UniCredit SpA (Banks) | 3,520,723 | ||||||
| 165,421 | Unione di Banche Italiane ScpA (Banks) | 931,143 | ||||||
| 12,539,647 | ||||||||
Japan – 23.4% | ||||||||
| 62,400 | Advantest Corp. (Semiconductors & Semiconductor Equipment) | 1,148,748 | ||||||
| 260,000 | Calsonic Kansei Corp. (Automobiles & Components) | 1,567,004 | ||||||
| 530,000 | DIC Corp. (Materials) | 1,255,411 | ||||||
| 32,000 | East Japan Railway Co. (Transportation) | 1,832,666 | ||||||
| 11,100 | FANUC Corp. (Capital Goods) | 1,856,176 | ||||||
| 96,400 | FUJIFILM Holdings Corp. (Technology Hardware & Equipment) | 3,006,619 | ||||||
| 42,600 | Honda Motor Co. Ltd. (Automobiles & Components) | 1,641,247 | ||||||
| 191 | Inpex Corp. (Energy) | 1,412,098 | ||||||
| 85,500 | JSR Corp. (Materials) | 1,657,259 | ||||||
| 131,000 | Kirin Holdings Co. Ltd. (Food, Beverage & Tobacco) | 1,826,261 | ||||||
| 59,700 | Komatsu Ltd. (Capital Goods) | 1,864,022 | ||||||
| 10,400 | Kyocera Corp. (Technology Hardware & Equipment) | 1,058,907 | ||||||
| 135,000 | Mitsubishi Electric Corp. (Capital Goods) | 1,568,175 | ||||||
| 72,000 | Mitsubishi Estate Co. Ltd. (Real Estate) | 1,263,597 | ||||||
| 206,000 | Mitsubishi Gas Chemical Co., Inc. (Materials) | 1,509,268 | ||||||
| 611,400 | Mitsubishi UFJ Financial Group, Inc. (Banks) | 2,979,558 | ||||||
GOLDMAN SACHS VARIABLE INSURANCE TRUST STRATEGIC INTERNATIONAL EQUITY FUND
| Shares | Description | Value | ||||||
Common Stocks – (continued) | ||||||||
Japan – (continued) | ||||||||
| 190,000 | Mitsui & Co. Ltd. (Capital Goods) | $ | 3,285,124 | |||||
| 12,400 | Nidec Corp. (Capital Goods) | 1,157,668 | ||||||
| 4,900 | Nintendo Co. Ltd. (Software & Services) | 920,162 | ||||||
| 42,100 | Nippon Telegraph & Telephone Corp. (Telecommunication Services) | 2,030,560 | ||||||
| 283,500 | Nissan Motor Co. Ltd. (Automobiles & Components) | 2,979,362 | ||||||
| 14,740 | ORIX Corp. (Diversified Financials) | 1,433,787 | ||||||
| 64,300 | Otsuka Holdings Co. Ltd. (Pharmaceuticals, Biotechnology & Life Sciences) | 1,701,419 | ||||||
| 52,000 | Seiko Epson Corp. (Technology Hardware & Equipment) | 901,355 | ||||||
| 74,000 | Seven & I Holdings Co. Ltd. (Food & Staples Retailing) | 1,990,154 | ||||||
| 89,500 | Sony Corp. (Consumer Durables & Apparel) | 2,361,481 | ||||||
| 119,000 | Sumitomo Metal Mining Co. Ltd. (Materials) | 1,955,080 | ||||||
| 69,100 | Sumitomo Mitsui Financial Group, Inc. (Banks) | 2,130,677 | ||||||
| 57,900 | The Kansai Electric Power Co., Inc. (Utilities) | 1,153,003 | ||||||
| 171,000 | Yamaguchi Financial Group, Inc. (Banks) | 1,595,307 | ||||||
| 100,700 | Yamaha Corp. (Consumer Durables & Apparel) | 1,148,438 | ||||||
| 54,190,593 | ||||||||
Luxembourg – 0.5% | ||||||||
| 655,451 | Regus PLC (Commercial & Professional Services) | 1,163,748 | ||||||
Netherlands – 1.4% | ||||||||
| 123,727 | PostNL NV (Transportation) | 1,048,446 | ||||||
| 206,111 | TNT Express NV (Transportation)* | 2,137,674 | ||||||
| 3,186,120 | ||||||||
Spain – 0.6% | ||||||||
| 69,423 | Gas Natural SDG SA (Utilities) | 1,454,080 | ||||||
Sweden – 2.5% | ||||||||
| 441,802 | Swedish Orphan Biovitrum AB (Pharmaceuticals, Biotechnology & Life Sciences)* | 1,748,593 | ||||||
| 282,034 | Telefonaktiebolaget LM Ericsson Class B (Technology Hardware & Equipment) | 4,060,022 | ||||||
| 5,808,615 | ||||||||
Switzerland – 9.8% | ||||||||
| 49,344 | Aryzta AG (Food, Beverage & Tobacco) | 2,650,166 | ||||||
| 28,427 | Compagnie Financiere Richemont SA Class A (Consumer Durables & Apparel) | 1,862,908 | ||||||
| 29,802 | Julius Baer Group Ltd. (Diversified Financials)* | 1,231,062 | ||||||
| 645 | Lindt & Spruengli AG (Food, Beverage & Tobacco) | 2,013,609 | ||||||
| 67,794 | Novartis AG (Registered) (Pharmaceuticals, Biotechnology & Life Sciences) | 4,154,899 | ||||||
| 1,409 | Partners Group Holding AG (Diversified Financials) | 249,412 | ||||||
| 3,250 | Straumann Holding AG (Registered) (Health Care Equipment & Services) | 783,757 | ||||||
| 19,521 | Sulzer AG (Registered) (Capital Goods) | 3,182,898 | ||||||
| 72,210 | Temenos Group AG (Registered) (Software & Services)* | 2,227,133 | ||||||
| 181,487 | UBS AG (Registered) (Diversified Financials)* | 3,312,060 | ||||||
| 59,179 | Weatherford International Ltd. (Energy)* | 1,115,310 | ||||||
| 22,783,214 | ||||||||
United Kingdom – 19.9% | ||||||||
| 155,475 | Admiral Group PLC (Insurance) | 4,146,148 | ||||||
| 46,439 | Amlin PLC (Insurance) | 302,723 | ||||||
| 65,461 | Anglo American PLC (Materials) | 3,246,469 | ||||||
| 31,687 | Autonomy Corp. PLC (Software & Services)* | 867,971 | ||||||
| 108,505 | BG Group PLC (Energy) | 2,463,705 | ||||||
| 154,943 | GlaxoSmithKline PLC (Pharmaceuticals, Biotechnology & Life Sciences) | 3,321,087 | ||||||
| 318,308 | Halfords Group PLC (Retailing) | 1,897,600 | ||||||
| 709,091 | HSBC Holdings PLC (Banks) | 7,030,447 | ||||||
| 125,894 | Inmarsat PLC (Telecommunication Services) | 1,124,855 | ||||||
| 208,125 | Marks & Spencer Group PLC (Retailing) | 1,206,492 | ||||||
| 71,651 | Reckitt Benckiser Group PLC (Household & Personal Products) | 3,957,433 | ||||||
| 345,551 | Reed Elsevier PLC (Media) | 3,146,010 | ||||||
| 66,911 | Rio Tinto PLC (Materials)(a) | 4,831,358 | ||||||
| 1,831,719 | Royal Bank of Scotland Group PLC (Banks)* | 1,133,032 | ||||||
| 35,163 | Shire PLC (Pharmaceuticals, Biotechnology & Life Sciences) | 1,099,430 | ||||||
| 58,900 | Smiths Group PLC (Capital Goods) | 1,136,133 | ||||||
| 102,360 | The Capita Group PLC (Commercial & Professional Services) | 1,175,640 | ||||||
| 116,136 | Tullow Oil PLC (Energy) | 2,312,745 | ||||||
| 18,833 | Victrex PLC (Materials) | 453,752 | ||||||
| 529,020 | Vodafone Group PLC (Telecommunication Services) | 1,402,772 | ||||||
| 46,255,802 | ||||||||
TOTAL COMMON STOCKS | ||||||||
(Cost $194,362,089) | $ | 209,702,421 | ||||||
GOLDMAN SACHS VARIABLE INSURANCE TRUST STRATEGIC INTERNATIONAL EQUITY FUND
Schedule of Investments (continued)
June 30, 2011 (Unaudited)
| Shares | Description | Value | ||||||
Exchange Traded Fund – 4.8% | ||||||||
Australia – 4.8% | ||||||||
| 426,478 | iShares MSCI Australia Index Fund | $ | 11,109,752 | |||||
(Cost $5,038,108) | ||||||||
| Shares | Rate | Value | ||||||||
Short-term Investment(b) – 4.7% | ||||||||||
| JPMorgan U.S. Government Money Market Fund — Capital Shares | ||||||||||
| 11,015,186 | 0.010 | % | $ | 11,015,186 | ||||||
(Cost $11,015,186) | ||||||||||
TOTAL INVESTMENTS – 99.9% | ||||||||||
(Cost $210,415,383) | $ | 231,827,359 | ||||||||
OTHER ASSETS IN EXCESS OF LIABILITIES – 0.1% | 117,492 | |||||||||
NET ASSETS – 100.0% | $ | 231,944,851 | ||||||||
The percentage shown for each investment category reflects the value of investments in that category as a percentage of net assets.
| * | Non-income producing security. | |
| (a) | All or a portion of security is segregated as collateral for initial margin requirements on futures transactions. | |
| (b) | Variable rate security. Interest rate disclosed is that which is in effect at June 30, 2011. |
Investment Abbreviations: | ||||
| ADR | — | American Depositary Receipt | ||
| REIT | — | Real Estate Investment Trust | ||
| RSP | — | Risparmio Shares | ||
| ADDITIONAL INVESTMENT INFORMATION |
FUTURES CONTRACTS — At June 30, 2011, the following futures contracts were open:
| Number of | ||||||||||||||
| Contracts | Expiration | Current | Unrealized | |||||||||||
| Type | Long (Short) | Date | Value | Gain (Loss) | ||||||||||
| Hang Seng Index | 12 | July 2011 | $ | 1,729,288 | $ | 21,687 | ||||||||
| SPI 200 Index | 64 | September 2011 | 7,895,684 | 78,131 | ||||||||||
TOTAL | $ | 99,818 | ||||||||||||
GOLDMAN SACHS VARIABLE INSURANCE TRUST STRATEGIC INTERNATIONAL EQUITY FUND
Statement of Assets and Liabilities
June 30, 2011 (Unaudited)
Assets: | ||||
| Investments in securities, at value (identified cost $210,415,383) | $ | 231,827,359 | ||
| Foreign currencies, at value (identified cost $203,865) | 206,587 | |||
| Receivables: | ||||
| Investment securities sold, at value | 3,747,040 | |||
| Dividends, at value | 335,871 | |||
| Foreign tax reclaims, at value | 227,173 | |||
| Due from broker — variation margin, at value | 184,124 | |||
| Fund shares sold | 10,177 | |||
| Reimbursement from investment adviser | 3,870 | |||
| Other assets | 1,494 | |||
Total assets | 236,543,695 | |||
Liabilities: | ||||
| Payables: | ||||
| Investment securities purchased, at value | 4,165,990 | |||
| Amounts owed to affiliates | 195,394 | |||
| Fund shares redeemed | 86,390 | |||
| Accrued expenses | 151,070 | |||
Total liabilities | 4,598,844 | |||
Net Assets: | ||||
| Paid-in capital | 325,091,612 | |||
| Accumulated undistributed net investment income | 2,815,792 | |||
| Accumulated net realized loss from investment, futures and foreign currency related transactions | (117,529,287 | ) | ||
| Net unrealized gain on investments, futures and translation of assets and liabilities denominated in foreign currencies | 21,566,734 | |||
NET ASSETS | $ | 231,944,851 | ||
| Net Assets: | ||||
| Institutional | $ | 73,963,021 | ||
| Service | 157,981,830 | |||
| Total Net Assets | $ | 231,944,851 | ||
| Shares of beneficial interest outstanding $0.001 par value (unlimited shares authorized): | ||||
| Institutional | 8,010,948 | |||
| Service | 17,111,477 | |||
| Net asset value, offering and redemption price per share: | ||||
| Institutional | $9.23 | |||
| Service | 9.23 | |||
GOLDMAN SACHS VARIABLE INSURANCE TRUST STRATEGIC INTERNATIONAL EQUITY FUND
Statement of Operations
For the Six Months Ended June 30, 2011 (Unaudited)
Investment income: | ||||
| Dividends (net of foreign taxes withheld of $372,198) | $ | 3,663,745 | ||
| Interest | 17,460 | |||
Total investment income | 3,681,205 | |||
Expenses: | ||||
| Management fees | 1,002,030 | |||
| Distribution and Service fees — Service Class | 199,130 | |||
| Custody and accounting fees | 76,214 | |||
| Printing and mailing costs | 58,584 | |||
| Professional fees | 43,409 | |||
Transfer Agent fees(a) | 23,575 | |||
| Trustee fees | 8,412 | |||
| Other | 5,377 | |||
Total expenses | 1,416,731 | |||
| Less — expense reductions | (22,522 | ) | ||
Net expenses | 1,394,209 | |||
NET INVESTMENT INCOME | 2,286,996 | |||
Realized and unrealized gain (loss) from investment, futures and foreign currency related transactions: | ||||
| Net realized gain (loss) from: | ||||
| Investment transactions | 18,543,642 | |||
| Futures transactions | (264,608 | ) | ||
| Foreign currency related transactions | 160,331 | |||
| Net change in unrealized gain (loss) on: | ||||
| Investments | (10,188,270 | ) | ||
| Futures | 179,960 | |||
| Translation of asset and liabilities denominated in foreign currencies | 31,178 | |||
Net realized and unrealized gain from investment, futures and foreign currency related transactions | 8,462,233 | |||
NET INCREASE IN NET ASSETS RESULTING FROM OPERATIONS | $ | 10,749,229 | ||
| (a) | Institutional and Service Shares had Transfer Agent fees of $7,646 and $15,929, respectively. |
GOLDMAN SACHS VARIABLE INSURANCE TRUST STRATEGIC INTERNATIONAL EQUITY FUND
Statements of Changes in Net Assets
| For the | ||||||||
| Six Months Ended | For the | |||||||
| June 30, 2011 | Fiscal Year Ended | |||||||
| (Unaudited) | December 31, 2010 | |||||||
From operations: | ||||||||
| Net investment income | $ | 2,286,996 | $ | 2,768,882 | ||||
| Net realized gain from investment, futures and foreign currency related transactions | 18,439,365 | 20,455,703 | ||||||
| Net change in unrealized loss on investments, futures and translation of assets and liabilities denominated in foreign currencies | (9,977,132 | ) | (929,246 | ) | ||||
Net increase in net assets resulting from operations | 10,749,229 | 22,295,339 | ||||||
Distributions to shareholders: | ||||||||
| From net investment income | ||||||||
| Institutional Shares | — | (1,126,914 | ) | |||||
| Service Shares | — | (1,932,729 | ) | |||||
Total distributions to shareholders | — | (3,059,643 | ) | |||||
From share transactions: | ||||||||
| Proceeds from sales of shares | 2,228,124 | 8,858,275 | ||||||
| Reinvestment of distributions | — | 3,059,643 | ||||||
| Cost of shares redeemed | (17,804,651 | ) | (33,755,347 | ) | ||||
Net decrease in net assets resulting from share transactions | (15,576,527 | ) | (21,837,429 | ) | ||||
TOTAL DECREASE | (4,827,298 | ) | (2,601,733 | ) | ||||
Net assets: | ||||||||
| Beginning of period | 236,772,149 | 239,373,882 | ||||||
| End of period | $ | 231,944,851 | $ | 236,772,149 | ||||
Accumulated undistributed net investment income | $ | 2,815,792 | $ | 528,796 | ||||
GOLDMAN SACHS VARIABLE INSURANCE TRUST STRATEGIC INTERNATIONAL EQUITY FUND
Financial Highlights
Selected Data for a Share Outstanding Throughout Each Period
| Income (loss) from | ||||||||||||||||||||||||||||||||||||||||||||||||||||||||||
| investment operations | Distributions to shareholders | |||||||||||||||||||||||||||||||||||||||||||||||||||||||||
| Net | | Ratio of | Ratio of | |||||||||||||||||||||||||||||||||||||||||||||||||||||||
| Net asset | realized | From | Net asset | Net assets, | Ratio of | total | net investment | |||||||||||||||||||||||||||||||||||||||||||||||||||
| value, | Net | and | Total from | From net | net | value, | end of | net expenses | expenses | income | Portfolio | |||||||||||||||||||||||||||||||||||||||||||||||
| beginning | investment | unrealized | investment | investment | realized | Total | end of | Total | period | to average | to average | to average | turnover | |||||||||||||||||||||||||||||||||||||||||||||
| Year - Share Class | of period | income(a) | gain (loss) | operations | income | gains | distributions | period | return(b) | (in 000s) | net assets | net assets | net assets | rate | ||||||||||||||||||||||||||||||||||||||||||||
FOR THE SIX MONTHS ENDED JUNE 30, (UNAUDITED) | ||||||||||||||||||||||||||||||||||||||||||||||||||||||||||
| 2011 - Institutional | $ | 8.82 | $ | 0.10 | $ | 0.31 | $ | 0.41 | $ | — | $ | — | $ | — | $ | 9.23 | 4.65 | % | $ | 73,963 | 1.01 | %(c) | 1.03 | %(c) | 2.10 | %(c) | 60 | % | ||||||||||||||||||||||||||||||
| 2011 - Service | 8.83 | 0.08 | 0.32 | 0.40 | — | — | — | 9.23 | 4.53 | 157,982 | 1.26 | (c) | 1.28 | (c) | 1.86 | (c) | 60 | |||||||||||||||||||||||||||||||||||||||||
FOR THE FISCAL YEARS ENDED DECEMBER 31, | ||||||||||||||||||||||||||||||||||||||||||||||||||||||||||
| 2010 - Institutional | 8.11 | 0.11 | 0.73 | 0.84 | (0.13 | ) | — | (0.13 | ) | 8.82 | 10.36 | 77,558 | 1.02 | 1.05 | 1.38 | 112 | ||||||||||||||||||||||||||||||||||||||||||
| 2010 - Service | 8.12 | 0.09 | 0.73 | 0.82 | (0.11 | ) | — | (0.11 | ) | 8.83 | 10.09 | 159,214 | 1.27 | 1.30 | 1.13 | 112 | ||||||||||||||||||||||||||||||||||||||||||
| 2009 - Institutional | 6.41 | 0.13 | 1.71 | 1.84 | (0.14 | ) | — | (0.14 | ) | 8.11 | 28.69 | 82,015 | 1.07 | 1.07 | 1.80 | 118 | ||||||||||||||||||||||||||||||||||||||||||
| 2009 - Service | 6.42 | 0.11 | 1.71 | 1.82 | (0.12 | ) | — | (0.12 | ) | 8.12 | 28.37 | 157,359 | 1.32 | 1.32 | 1.51 | 118 | ||||||||||||||||||||||||||||||||||||||||||
| 2008 - Institutional | 13.76 | 0.32 | (d) | (6.69 | ) | (6.37 | ) | (0.33 | ) | (0.65 | ) | (0.98 | ) | 6.41 | (45.87 | ) | 74,149 | 1.12 | 1.12 | 2.95 | (d) | 165 | ||||||||||||||||||||||||||||||||||||
| 2008 - Service | 13.76 | 0.28 | (d) | (6.67 | ) | (6.39 | ) | (0.30 | ) | (0.65 | ) | (0.95 | ) | 6.42 | (46.00 | ) | 113,836 | 1.37 | 1.37 | 2.64 | (d) | 165 | ||||||||||||||||||||||||||||||||||||
| 2007 - Institutional | 14.49 | 0.20 | 0.92 | 1.12 | (0.21 | ) | (1.64 | ) | (1.85 | ) | 13.76 | 7.88 | 136,785 | 1.16 | (e) | 1.16 | (e) | 1.30 | (e) | 134 | ||||||||||||||||||||||||||||||||||||||
| 2007 - Service | 14.49 | 0.20 | 0.92 | 1.12 | (0.21 | ) | (1.64 | ) | (1.85 | ) | 13.76 | 7.86 | 225,901 | 1.18 | (e) | 1.41 | (e) | 1.30 | (e) | 134 | ||||||||||||||||||||||||||||||||||||||
| 2006 - Institutional | 12.05 | 0.22 | 2.44 | (f) | 2.66 | (0.22 | ) | — | (0.22 | ) | 14.49 | 22.10 | (g) | 127,795 | 1.15 | 1.16 | 1.64 | 76 | ||||||||||||||||||||||||||||||||||||||||
| 2006 - Service (Commenced January 9, 2006) | 12.71 | 0.22 | 1.78 | (f) | 2.00 | (0.22 | ) | — | (0.22 | ) | 14.49 | 15.74 | (g) | 260,251 | 1.17 | (c) | 1.41 | (c) | 1.68 | (c) | 76 | |||||||||||||||||||||||||||||||||||||
| (a) | Calculated based on the average shares outstanding methodology. | |
| (b) | Assumes investment at the net asset value at the beginning of the period, reinvestment of all distributions and a complete redemption of the investment at the net asset value at the end of the period. Total returns for periods less than one full year are not annualized. | |
| (c) | Annualized. | |
| (d) | Reflects income recognized from non-recurring special dividends which amounted to $0.12 per share and 1.12% of average net assets. | |
| (e) | Includes non-recurring expense for a special shareholder proxy meeting which amounted to approximately 0.02% of average net assets. | |
| (f) | Reflects an increase of $0.05 due to payments by previous investment manager of a merged fund to compensate for possible adverse affects of the trading activity by certain contract holders of the acquired fund prior to January 9, 2006. | |
| (g) | Performance has not been restated to reflect the impact of payments by previous investment manager of a merged fund recorded during the period related to (f) above. If restated, the performance would have been 21.69% and 15.26% for Institutional and Service Shares, respectively. |
14
GOLDMAN SACHS VARIABLE INSURANCE TRUST STRATEGIC INTERNATIONAL EQUITY FUND
Notes to Financial Statements
June 30, 2011 (Unaudited)
| 1. ORGANIZATION |
Goldman Sachs Variable Insurance Trust (the “Trust” or “VIT”) is a Delaware statutory trust registered under the Investment Company Act of 1940, as amended (the “Act”), as an open-end management investment company. The Trust includes the Goldman Sachs Strategic International Equity Fund (the “Fund”). The Fund is a diversified portfolio under the Act offering two classes of shares — Institutional and Service.
Goldman Sachs Asset Management International (“GSAMI”), an affiliate of Goldman, Sachs & Co. (“Goldman Sachs”), serves as investment adviser to the Fund pursuant to a management agreement (the “Agreement”) with the Trust.
| 2. SIGNIFICANT ACCOUNTING POLICIES |
The following is a summary of the significant accounting policies consistently followed by the Fund. The preparation of financial statements in conformity with accounting principles generally accepted in the United States of America (“GAAP”) requires management to make estimates and assumptions that may affect the amounts and disclosures in the financial statements. Actual results could differ from those estimates and assumptions.
A. Investment Valuation — The investment valuation policy of the Fund is to value investments at market value. Investments in equity securities and investment companies traded on a certain foreign securities exchange are valued daily at fair value determined by an independent fair value service (if available) under valuation procedures approved by the trustees consistent with applicable regulatory guidance. The independent fair value service takes into account multiple factors including, but not limited to, movements in the United States (“U.S.”) securities markets, certain depositary receipts, futures contracts and foreign currency exchange rates that have occurred subsequent to the close of the foreign securities exchanges. While the independent fair value service may not take into account market or security specific information, under the valuation procedures, these securities might also be fair valued by GSAMI by taking into consideration market or security specific information as discussed below.
Investments in equity securities and investment companies traded on a U.S. securities exchange, the NASDAQ system, or those located on certain foreign exchanges including, but not limited to the Americas, are valued daily at their last sale price or official closing price on the principal exchange or system on which they are traded. Investments in equity securities and investment companies traded on a foreign securities exchange for which an independent fair value service cannot provide a quote are valued daily at their last sale price or official closing price on the principal exchange on which they are traded. If no sale occurs, such securities and investment companies are valued at the last bid price for long positions and at the last ask price for short positions. Debt securities for which market quotations are readily available are valued on the basis of quotations furnished by an independent pricing service approved by the trustees or provided by securities dealers. The pricing services may use valuation models or matrix pricing, which consider: (i) yield or price with respect to bonds that are considered comparable in characteristics such as rating, interest rate and maturity date or (ii) quotations from securities dealers to determine current value. If accurate quotations are not readily available, or if GSAMI believes that such quotations do not accurately reflect fair value, the fair value of the Fund’s investments may be determined based on yield equivalents, a pricing matrix or other sources, under valuation procedures established by the trustees. Unlisted equity securities for which market quotations are available are valued at the last sale price on the valuation date, or if no sale occurs, at the last bid price. In the absence of market quotations, broker quotes will be utilized or the security will be fair valued. Investments in investment companies (other than those that are exchange traded) are valued at the net asset value per share (“NAV”) of the investment company on the valuation date. Short-term debt obligations that mature in sixty days or less and that do not exhibit signs of credit deterioration are valued at amortized cost, which approximates market value.
GSAMI, consistent with its procedures and applicable regulatory guidance, may make an adjustment to the previous closing prices of either domestic or foreign securities in light of significant events to reflect what it believes to be the fair value of the securities at the time of determining the Fund’s NAV. Significant events that could affect a large number of securities in a particular market may include, but are not limited to: situations relating to one or more single issuers in a market sector; significant fluctuations in U.S. or foreign markets; market dislocations; market disruptions or market closings; equipment failures; natural or man-made disasters or acts of God; armed conflicts; government actions or other developments; as well as the same or similar events which may affect specific issuers or the securities markets even though not tied directly to the securities markets.
GOLDMAN SACHS VARIABLE INSURANCE TRUST STRATEGIC INTERNATIONAL EQUITY FUND
Notes to Financial Statements (continued)
June 30, 2011 (Unaudited)
| 2. SIGNIFICANT ACCOUNTING POLICIES (continued) |
Other significant events that could relate to a single issuer may include, but are not limited to: corporate actions such as reorganizations, mergers and buy-outs; corporate announcements, including those relating to earnings, products and regulatory news; significant litigation; low trading volume; and trading limits or suspensions.
B. Security and Fund Share Transactions, and Investment Income — Security and Fund share transactions are reflected for financial reporting purposes as of the trade date, which may cause the NAV as stated in the accompanying financial statements to be different than the NAV applied to Fund share transactions. Realized gains and losses on sales of portfolio securities are calculated using the identified cost basis. Dividend income is recognized on the ex-dividend date, net of foreign withholding taxes, if any, which are reduced by any amounts reclaimable by the Fund, where applicable. Certain dividends from foreign securities will be recorded when the Fund is informed of the dividend, if such information is obtained subsequent to the ex-dividend date. Interest income is recorded on the basis of interest accrued, premium amortized and discount accreted. In addition, it is the Fund’s policy to accrue for foreign capital gains taxes, if applicable, on certain foreign securities held by the Fund. An estimated foreign capital gains tax is recorded daily on net unrealized gains on these securities and is payable upon the sale of such securities when a gain is realized.
Investment income and unrealized and realized gains or losses are allocated daily to each class of shares of the Fund based upon the relative proportion of net assets of each class.
C. Expenses — Expenses incurred by the Fund, which may not specifically relate to the Fund, may be shared with other registered investment companies having management agreements with GSAMI or its affiliates, as appropriate. These expenses are allocated to the Fund on a straight-line and/or pro-rata basis depending upon the nature of the expenses and are accrued daily. Non-class specific expenses are allocated daily to each share class of the respective Fund based upon the relative proportion of net assets of each class. Class specific expenses, where applicable, are borne by the respective share classes and include Distribution and Service and Transfer Agent fees.
D. Federal Taxes and Distributions to Shareholders — It is the Fund’s policy to comply with the requirements of the Internal Revenue Code of 1986, as amended (the “Code”), applicable to regulated investment companies (mutual funds) and to distribute each year substantially all of its investment company taxable income and capital gains to its shareholders. Accordingly, the Fund is not required to make any provisions for the payment of federal income tax. Distributions to shareholders are recorded on the ex-dividend date. Income and capital gains distributions, if any, are declared and paid annually.
Net capital losses are carried forward to future fiscal years and may be used to the extent allowed by the Code to offset any future capital gains. Utilization of capital loss carryforwards will reduce the requirement of future capital gains distributions.
The characterization of distributions to shareholders for financial reporting purposes is determined in accordance with federal income tax rules, which may differ from GAAP. The source of the Fund’s distributions may be shown in the accompanying financial statements as either from net investment income, net realized gain or capital. Certain components of the Fund’s net assets on the Statement of Assets and Liabilities reflect permanent GAAP/tax differences based on the appropriate tax character.
E. Foreign Currency Translations — The books and records of the Fund are maintained in U.S. dollars. Amounts denominated in foreign currencies are translated into U.S. dollars on the following basis: (i) investment valuations, foreign currency and other assets and liabilities initially expressed in foreign currencies are converted into U.S. dollars based upon 4:00 p.m. Eastern Time exchange rates; and (ii) purchases and sales of foreign investments, income and expenses are converted into U.S. dollars based upon currency exchange rates prevailing on the respective dates of such transactions as of 4:00 p.m. Eastern Time.
Net realized and unrealized gain (loss) on foreign currency transactions represents: (i) foreign exchange gains and losses from the sale and holdings of foreign currencies; (ii) currency gains and losses between trade date and settlement date on investment security transactions and forward foreign currency exchange contracts; and (iii) gains and losses from the difference between amounts of dividends, interest and foreign withholding taxes recorded and the amounts actually received. The effect of changes in foreign currency exchange rates on securities and derivative instruments is included with the net realized and change in unrealized gain (loss) on investments on the Statement of Operations, however, the effect of changes in foreign currency exchange rates on fixed income securities sold during the period is included with the net realized gain (loss) on foreign currency related transactions. Changes in the value of other assets and liabilities as a result of fluctuations in foreign exchange rates are included as
GOLDMAN SACHS VARIABLE INSURANCE TRUST STRATEGIC INTERNATIONAL EQUITY FUND
| 2. SIGNIFICANT ACCOUNTING POLICIES (continued) |
an increase or decrease to net change in unrealized gain (loss) on translation of assets and liabilities denominated in foreign currencies.
F. Futures Contracts — Futures contracts are valued at the last settlement price, or in the absence of a sale, the last bid price, at the end of each day on the board of trade or exchange upon which they are traded. Upon entering into a futures contract, the Fund deposits cash or securities in an account on behalf of the broker in an amount sufficient to meet the initial margin requirement. Subsequent payments are made or received by the Fund equal to the daily change in the contract value and are recorded as variation margin receivable or payable with a corresponding offset in unrealized gains or losses. The Fund recognizes a realized gain or loss when a contract is closed or expires.
The use of futures contracts involves, to varying degrees, elements of market and counterparty risk which may exceed the amounts recognized in the Statement of Assets and Liabilities. Futures contracts may be illiquid, and exchanges may limit fluctuations in futures contract prices during a single day. Changes in the value of a futures contract may not directly correlate with changes in the value of the underlying securities. These risks may decrease the effectiveness of the Fund’s strategies and potentially result in a loss. The Fund must set aside liquid assets, or engage in other appropriate measures, to cover its obligations under these contracts.
| 3. FAIR VALUE OF INVESTMENTS |
The fair value of a financial instrument is the amount that would be received to sell an asset or paid to transfer a liability in an orderly transaction between market participants at the measurement date (i.e., the exit price). GAAP establishes a fair value hierarchy that prioritizes the inputs to valuation techniques used to measure fair value. The hierarchy gives the highest priority to unadjusted quoted prices in active markets for identical assets or liabilities (Level 1 measurements) and the lowest priority to unobservable inputs (Level 3 measurements). The three levels of the fair value hierarchy are described below:
Level 1 — Unadjusted quoted prices in active markets that are accessible at the measurement date for identical, unrestricted assets or liabilities;
Level 2 — Quoted prices in markets that are not active or financial instruments for which significant inputs are observable (including, but not limited to, quoted prices for similar securities, interest rates, foreign exchange rates, volatility and credit spreads), either directly or indirectly;
Level 3 — Prices or valuations that require significant unobservable inputs (including GSAMI’s assumptions in determining fair value measurement).
The following is a summary of the Fund’s investments and derivatives categorized in the fair value hierarchy as of June 30, 2011:
| Investment Type | Level 1 | Level 2 | Level 3 | |||||||||
Assets | ||||||||||||
Common Stock and/or Other Equity Investments | $ | 23,954,570 | $ | 196,857,603 | (a) | $ | — | |||||
| Short-term Investment | 11,015,186 | — | — | |||||||||
Total | $ | 34,969,756 | $ | 196,857,603 | $ | — | ||||||
| Derivative Type | ||||||||||||
Assets | ||||||||||||
Futures Contracts(b) | $ | 99,818 | $ | — | $ | — | ||||||
| (a) | To adjust for the time difference between local market close and the calculation of net asset value, the Fund utilizes fair value model prices for international equities provided by an independent service resulting in a Level 2 classification. | |
| (b) | Amount shown represents unrealized gain (loss) at period end. |
GOLDMAN SACHS VARIABLE INSURANCE TRUST STRATEGIC INTERNATIONAL EQUITY FUND
Notes to Financial Statements (continued)
June 30, 2011 (Unaudited)
| 4. INVESTMENTS IN DERIVATIVES |
The Fund may make investments in derivative instruments, including, but not limited to options, futures, swaps, swaptions and other derivatives relating to foreign currency transactions. A derivative is an instrument whose value is derived from underlying assets, indices, reference rates or a combination of these factors. Derivative instruments may be privately negotiated contracts (often referred to as over the counter (“OTC”) derivatives) or they may be listed and traded on an exchange. Derivative contracts may involve future commitments to purchase or sell financial instruments or commodities at specified terms on a specified date, or to exchange interest payment streams or currencies based on a notional or contractual amount. Derivative instruments may involve a high degree of financial risk. The use of derivatives also involves the risk of loss if the investment adviser is incorrect in its expectation of the timing or level of fluctuations in securities prices, interest rates or currency prices. Investments in derivative instruments also include the risk of default by the counterparty, the risk that the investment may not be liquid and the risk that a small movement in the price of the underlying security or benchmark may result in a disproportionately large movement, unfavorable or favorable, in the price of the derivative instrument.
During the six months ended June 30, 2011, the Fund entered into futures contracts. These instruments were used to meet the Fund’s investment objectives and to obtain and/or manage exposure related to the risks below. The following table sets forth, by certain risk types, the gross value of these derivative contracts for trading activities as of June 30, 2011. The values in the table below exclude the effects of cash collateral received or posted pursuant to these derivative contracts, and therefore are not representative of the Fund’s net exposure.
| Statement of | ||||||||||
| Assets and Liabilities | ||||||||||
| Risk | Location | Assets(a) | ||||||||
| Equity | Due from broker — variation margin, at value | $ | 99,818 | |||||||
| (a) | Includes unrealized gain (loss) on futures contracts described in the Additional Investment Information section of the Schedule of Investments. Only current day’s variation margin is reported within the Statement of Assets and Liabilities. |
The following table sets forth, by certain risk types, the Fund’s gains (losses) related to these derivatives and their indicative volumes for the six months ended June 30, 2011. These gains (losses) should be considered in the context that these derivative contracts may have been executed to economically hedge certain securities and accordingly, certain gains (losses) on such derivative contracts may offset certain (losses) gains attributable to securities. These gains (losses) are included in “Net realized gain (loss)” or “Net change in unrealized gain (loss)” on the Statement of Operations:
| Net | |||||||||||||||
| Net | Change in | Average | |||||||||||||
| Realized | Unrealized | Number of | |||||||||||||
| Risk | Statement of Operations Location | Gain (Loss) | Gain (Loss) | Contracts(a) | |||||||||||
| Equity | Net realized gain (loss) from futures transactions/Net change in unrealized gain (loss) on futures | $ | (264,608 | ) | $ | 179,960 | 86 | ||||||||
| (a) | Average number of contracts is based on the average of month end balances for the six months ended June 30, 2011. |
| 5. AGREEMENTS AND AFFILIATED TRANSACTIONS |
A. Management Agreement — Under the Agreement, GSAMI manages the Fund, subject to the general supervision of the trustees.
As compensation for the services rendered pursuant to the Agreement, the assumption of the expenses related thereto and administration of the Fund’s business affairs, including providing facilities, GSAMI is entitled to a management fee, accrued daily and paid monthly, equal to an annual percentage rate of the Fund’s average daily net assets.
GOLDMAN SACHS VARIABLE INSURANCE TRUST STRATEGIC INTERNATIONAL EQUITY FUND
| 5. AGREEMENTS AND AFFILIATED TRANSACTIONS (continued) |
For the six months ended June 30, 2011, contractual and effective net management fees with GSAMI were at the following rates:
| Contractual Management Rate | ||||||||||||||||||||||||
| First | Next | Next | Next | Over | Effective | Effective Net | ||||||||||||||||||
| $1 billion | $1 billion | $3 billion | $3 billion | $8 billion | Rate | Management Rate | ||||||||||||||||||
| 0.85% | 0.77 | % | 0.73 | % | 0.72 | % | 0.71 | % | 0.85 | % | 0.85 | %* | ||||||||||||
| * | Effective June 30, 2011, GSAMI agreed to waive a portion of its management fee in order to achieve the effective net management rate of 0.81% through at least April 29, 2012. Prior to such date GSAMI may not terminate the arrangement without the approval of the trustees. For the six months ended June 30, 2011, GSAMI waived approximately $200 of the Fund’s management fee. |
B. Distribution and Service Plan — The Trust, on behalf of the Service Shares of the Fund, has adopted a Distribution and Service Plan (the “Plan”). Under the Plan, Goldman Sachs, which serves as distributor, is entitled to a fee accrued daily and paid monthly for distribution services, which may then be paid by Goldman Sachs to authorized dealers, equal to, on an annual basis, 0.25% of the Fund’s average daily net assets attributable to Service Shares.
C. Transfer Agency Agreement — Goldman Sachs also serves as the transfer agent of the Fund for a fee pursuant to a Transfer Agency Agreement. The fees charged for such transfer agency services are accrued daily and paid monthly at an annual rate of 0.02% of the average daily net assets for Institutional and Service Shares.
D. Other Expense Agreements and Affiliated Transactions — GSAMI has agreed to limit certain “Other Expense” of the Fund (excluding management fees, distribution and service fees, transfer agent fees and expenses, taxes, interest, brokerage fees and litigation, indemnification, shareholder meetings and other extraordinary expenses, exclusive of any custody and transfer agent fee credit reductions) to the extent such expenses exceed, on an annual basis, 0.144% of the average daily net assets of the Fund. Such Other Expense reimbursements, if any, are accrued daily and paid monthly. In addition, the Fund is not obligated to reimburse GSAMI for prior fiscal year expense reimbursements, if any. These Other Expense reimbursements will remain in place through at least April 29, 2012, and prior to such date GSAMI may not terminate the arrangements without the approval of the trustees. For the six months ended June 30, 2011, GSAMI reimbursed approximately $22,300 to the Fund.
As of June 30, 2011, the amounts owed to affiliates were approximately $159,600, $32,000 and $3,800 for management, distribution and service, and transfer agent fees, respectively.
E. Line of Credit Facility — As of June 30, 2011, the Fund participated in a $580,000,000 committed, unsecured revolving line of credit facility (the “facility”) together with other funds of the Trust and registered investment companies having management agreements with GSAMI or its affiliates. Pursuant to the terms of the facility, the Fund and other borrowers could increase the credit amount by an additional $340,000,000, for a total of up to $920,000,000. This facility is to be used solely for temporary or emergency purposes. The interest rate on borrowings is based on the federal funds rate. The facility also requires a fee to be paid by the Fund based on the amount of the commitment that has not been utilized. For the six months ended June 30, 2011, the Fund did not have any borrowings under the facility.
F. Other Transactions with Affiliates — For the six months ended June 30, 2011, Goldman Sachs earned approximately $2,000 in brokerage commissions from portfolio transactions, including futures transactions executed with Goldman Sachs as the Futures Commission Merchant, on behalf of the Fund.
| 6. PORTFOLIO SECURITIES TRANSACTIONS |
The cost of purchases and proceeds from sales and maturities of long-term securities for the six months ended June 30, 2011, were $138,178,149 and $154,034,394, respectively.
GOLDMAN SACHS VARIABLE INSURANCE TRUST STRATEGIC INTERNATIONAL EQUITY FUND
Notes to Financial Statements (continued)
June 30, 2011 (Unaudited)
| 7. TAX INFORMATION |
As of the Fund’s most recent fiscal year end, December 31, 2010, the Fund’s capital loss carryforwards on a tax-basis were as follows:
Capital loss carryforward:(1) | ||||
| Expiring 2016 | $ | (69,095,795 | ) | |
| Expiring 2017 | (63,558,058 | ) | ||
| Total capital loss carryforward | $ | (132,653,853 | ) | |
| (1) | Expiration occurs on December 31 of the year indicated. |
As of June 30, 2011, the Fund’s aggregate security unrealized gains and losses based on cost for U.S. federal income tax purposes were as follows:
| Tax cost | $ | 214,232,818 | ||
| Gross unrealized gain | 26,627,377 | |||
| Gross unrealized loss | (9,032,836 | ) | ||
| Net unrealized security gain | $ | 17,594,541 | ||
The difference between GAAP-basis and tax-basis unrealized gains (losses), as of the most recent fiscal year end, is attributable primarily to wash sales and differences related to the tax treatment of passive foreign investment company investments.
GSAMI has reviewed the Fund’s tax positions for all open tax years (the current and prior three years, as applicable) and has concluded that no provision for income tax is required in the Fund’s financial statements. Such open tax years remain subject to examination and adjustment by tax authorities.
Under the recently enacted Regulated Investment Company Modernization Act of 2010, the Fund will be permitted to carry forward capital losses incurred in taxable years beginning after December 22, 2010 for an unlimited period. However, any losses incurred during those future taxable years will be required to be utilized prior to the losses incurred in pre-enactment taxable years. As a result of this ordering rule, pre-enactment capital loss carryforwards may be more likely to expire unused. Additionally, post-enactment capital losses that are carried forward will retain their character as either short-term or long-term capital losses rather than being considered all short-term as under previous law.
| 8. OTHER RISKS |
Foreign Custody Risk — A Fund that invests in foreign securities may hold such securities and foreign currency with foreign banks, agents, and securities depositories appointed by the Fund’s custodian (each a “Foreign Custodian”). In some countries, Foreign Custodians may be subject to little or no regulatory oversight or independent evaluation of their operations. Further, the laws of certain countries may place limitations on a Fund’s ability to recover its assets if a Foreign Custodian enters into bankruptcy. Investments in emerging markets may be subject to greater custody risks than investments in more developed markets. Custody services in emerging market countries are often undeveloped and may be less regulated than in more developed countries, and thus may not afford the same level of investor protection as would apply in developed countries.
Fund’s Shareholder Concentration Risk — Certain participating insurance companies, accounts, or Goldman Sachs affiliates may from time to time own (beneficially or of record) or control a significant percentage of the Fund’s shares. Redemptions by these entities of their holdings in the Fund may impact the Fund’s liquidity and NAV. These redemptions may also force the Fund to sell securities.
Liquidity Risk — The Fund may make investments that may be illiquid or that may become less liquid in response to market developments or adverse investor perceptions. Liquidity risk may also refer to the risk that a Fund will not be able to pay
GOLDMAN SACHS VARIABLE INSURANCE TRUST STRATEGIC INTERNATIONAL EQUITY FUND
| 8. OTHER RISKS (continued) |
redemption proceeds within the allowable time period because of unusual market conditions, an unusually high volume of redemption requests, or other reasons. To meet redemption requests, a Fund may be forced to sell investments at an unfavorable time and/or under unfavorable conditions.
Market and Credit Risks — In the normal course of business, the Fund trades financial instruments and enters into financial transactions where risk of potential loss exists due to changes in the market (market risk). Additionally, the Fund may also be exposed to credit risk in the event that an issuer fails to perform or that an institution or entity with which the Fund has unsettled or open transaction defaults.
Investing in foreign markets may involve special risks and considerations not typically associated with investing in the U.S. These risks include revaluation of currencies, high rates of inflation, repatriation restrictions on income and capital, and adverse political and economic developments. Moreover, securities issued in these markets may be less liquid, be subject to government ownership controls, have delayed settlements and their prices may be more volatile than those of comparable securities in the U.S.
| 9. INDEMNIFICATIONS |
Under the Trust’s organizational documents, its trustees, officers, employees and agents are indemnified, to the extent permitted by the Act, against certain liabilities that may arise out of performance of their duties to the Fund. Additionally, in the course of business, the Fund enters into contracts that contain a variety of indemnification clauses. The Fund’s maximum exposure under these arrangements is unknown, as this would involve future claims that may be made against the Fund that have not yet occurred. However, GSAMI believes the risk of loss under these arrangements to be remote.
| 10. SUBSEQUENT EVENTS |
Subsequent events after the balance sheet date have been evaluated through the date the financial statements were issued. GSAMI has concluded that there is no impact requiring adjustment or disclosure in the financial statements.
GOLDMAN SACHS VARIABLE INSURANCE TRUST STRATEGIC INTERNATIONAL EQUITY FUND
Notes to Financial Statements (continued)
June 30, 2011 (Unaudited)
| 11. SUMMARY OF SHARE TRANSACTIONS |
Share activity is as follows:
| For the Six Months Ended | ||||||||||||||||
| June 30, 2011 | For the Fiscal Year Ended | |||||||||||||||
| (Unaudited) | December 31, 2010 | |||||||||||||||
| Shares | Dollars | Shares | Dollars | |||||||||||||
Institutional Shares | ||||||||||||||||
| Shares sold | 47,673 | $ | 430,103 | 177,071 | $ | 1,399,863 | ||||||||||
| Reinvestment of distributions | — | — | 128,790 | 1,126,914 | ||||||||||||
| Shares redeemed | (829,824 | ) | (7,596,386 | ) | (1,630,467 | ) | (13,247,331 | ) | ||||||||
| (782,151 | ) | (7,166,283 | ) | (1,324,606 | ) | (10,720,554 | ) | |||||||||
Service Shares | ||||||||||||||||
| Shares sold | 197,375 | 1,798,021 | 950,196 | 7,458,412 | ||||||||||||
| Reinvestment of distributions | — | — | 220,380 | 1,932,729 | ||||||||||||
| Shares redeemed | (1,114,960 | ) | (10,208,265 | ) | (2,528,885 | ) | (20,508,016 | ) | ||||||||
| (917,585 | ) | (8,410,244 | ) | (1,358,309 | ) | (11,116,875 | ) | |||||||||
NET DECREASE | (1,699,736 | ) | $ | (15,576,527 | ) | (2,682,915 | ) | $ | (21,837,429 | ) | ||||||
GOLDMAN SACHS VARIABLE INSURANCE TRUST STRATEGIC INTERNATIONAL EQUITY FUND
Statement Regarding Basis for Approval of Management Agreement (Unaudited)
Background
The Goldman Sachs Strategic International Equity Fund (the “Fund”) is an investment portfolio of Goldman Sachs Variable Insurance Trust (the “Trust”). The Board of Trustees oversees the management of the Trust and reviews the investment performance and expenses of the Fund at regularly scheduled meetings held during the year. In addition, the Board of Trustees determines annually whether to approve the continuance of the Trust’s investment management agreement (the “Management Agreement”) with Goldman Sachs Asset Management International (the “Investment Adviser”) on behalf of the Fund.
The Management Agreement was most recently approved for continuation until June 30, 2012 by the Board of Trustees, including those Trustees who are not parties to the Management Agreement or “interested persons” (as defined in the Investment Company Act of 1940, as amended) of any party thereto (the “Independent Trustees”), at a meeting held on June 15-16, 2011 (the “Annual Meeting”).
The review process undertaken by the Trustees spans the course of the year and culminates with the Annual Meeting. To assist the Trustees in their deliberations, the Trustees have established a Contract Review Committee (the “Committee”), comprised of the Independent Trustees. The Committee held three meetings over the course of the year since the Management Agreement was last approved. At those Committee meetings, regularly scheduled Board meetings and/or the Annual Meeting, the Board, or the Independent Trustees, as applicable, considered matters relating to the Management Agreement, including:
| (a) | the nature and quality of the advisory, administrative and other services provided to the Fund by the Investment Adviser and its affiliates, including information about: |
| (i) | the structure, staff and capabilities of the Investment Adviser and its portfolio management teams; | |
| (ii) | the groups within the Investment Adviser and its affiliates that support the portfolio management teams or provide other types of necessary services, including fund services groups (e.g., accounting and financial reporting, tax, shareholder services and operations), controls and risk management groups (e.g., legal, compliance, valuation oversight, credit risk management, internal audit, market risk analysis, finance and strategy and central funding), sales and distribution support groups and others (e.g., information technology and training); | |
| (iii) | trends in headcount; | |
| (iv) | the Investment Adviser’s financial resources and ability to hire and retain talented personnel and strengthen its operations; and | |
| (v) | the parent company’s support of the Investment Adviser and its mutual fund business, as expressed by the firm’s senior management; |
| (b) | information on the investment performance of the Fund, including comparisons to the performance of similar mutual funds, as provided by a third party mutual fund data provider engaged as part of the contract review process (the “Outside Data Provider”), and its benchmark performance index, and general investment outlooks in the markets in which the Fund invests; | |
| (c) | the terms of the Management Agreement and agreements with affiliated service providers entered into by the Trust on behalf of the Fund; | |
| (d) | expense information for the Fund, including: |
| (i) | the relative management fee and expense level of the Fund as compared to those of comparable funds managed by other advisers, as provided by the Outside Data Provider; | |
| (ii) | the Fund’s expense trends over time; and | |
| (iii) | to the extent the Investment Adviser manages institutional accounts or collective investment vehicles having investment objectives and policies similar to those of the Fund, comparative information on the advisory fees charged and services provided to those accounts by the Investment Adviser; |
| (e) | with respect to the extensive investment performance and expense comparison data provided by the Outside Data Provider, its processes in producing that data for the Fund; | |
| (f) | the undertakings of the Investment Adviser to waive certain fees and reimburse certain expenses of the Fund that exceed a specified level, and a summary of contractual fee reductions made by the Investment Adviser and its affiliates over the past several years with respect to the Fund; | |
| (g) | information relating to the profitability of the Management Agreement and the transfer agency and distribution and service arrangements of the Fund and the Trust as a whole to the Investment Adviser and its affiliates; | |
| (h) | whether the Fund’s existing management fee schedule adequately addressed any economies of scale; | |
| (i) | a summary of the “fall-out” benefits derived by the Investment Adviser and its affiliates from their relationships with the Fund, including the fees received by the Investment Adviser’s affiliates from the Fund for transfer agency, portfolio brokerage, distribution and other services; | |
| (j) | a summary of potential benefits derived by the Fund as a result of its relationship with the Investment Adviser; |
GOLDMAN SACHS VARIABLE INSURANCE TRUST STRATEGIC INTERNATIONAL EQUITY FUND
Statement Regarding Basis for Approval of Management Agreement (Unaudited) (continued)
| (k) | information regarding commissions paid by the Fund, an update on the Investment Adviser’s soft dollars practices, other information regarding portfolio trading and how the Investment Adviser carries out its duty to seek best execution; | |
| (l) | the manner in which portfolio manager compensation is determined, and the number and types of accounts managed by the portfolio managers; | |
| (m) | the nature and quality of the services provided to the Fund by its unaffiliated service providers, and the Investment Adviser’s general oversight and evaluation (including reports on due diligence) of those service providers as part of the administration services provided under the Management Agreement; and | |
| (n) | the Investment Adviser’s processes and policies addressing various types of potential conflicts of interest; its approach to risk management; the annual review of the effectiveness of the Fund’s compliance program; and compliance reports. |
The Trustees also received an overview of the Fund’s distribution arrangements. They received information regarding the Fund’s assets, share purchase and redemption activity and the payment of Rule 12b-1 distribution and service fees by the Fund’s Service Shares. Information was also provided to the Trustees relating to revenue sharing payments made by and services provided by the Investment Adviser and its affiliates to intermediaries that promote the sale, distribution and/or servicing of Fund shares.
The presentations made at the Board and Committee meetings and at the Annual Meeting encompassed the Fund and other mutual fund portfolios for which the Board of Trustees has responsibility. In evaluating the Management Agreement at the Annual Meeting, the Trustees relied upon their knowledge, resulting from their meetings and other interactions throughout the year, of the Investment Adviser, its affiliates, their services and the Fund. In conjunction with these meetings, the Trustees received written materials and oral presentations on the topics covered, and were advised by their independent legal counsel regarding their responsibilities and other regulatory requirements related to the approval and continuation of mutual fund investment management agreements under applicable law. In addition, the Investment Adviser and its affiliates provided the Independent Trustees with a written response to a formal request for information sent on behalf of the Independent Trustees by their independent legal counsel. During the course of their deliberations, the Independent Trustees met in executive sessions with their independent legal counsel, without representatives of the Investment Adviser or its affiliates present. The Independent Trustees also discussed the broad range of other investment choices that are available to Fund investors, including the availability of comparable funds managed by other advisers.
Nature, Extent and Quality of the Services Provided Under the Management Agreement
As part of their review, the Trustees considered the nature, extent and quality of the services provided by the Investment Adviser. In this regard, the Trustees considered both the investment advisory services, and the other, non-advisory services, that are provided to the Fund by the Investment Adviser and its affiliates. The Trustees noted the transition in the leadership and changes in personnel of various portfolio management teams, including the portfolio management team managing the Fund, that had occurred in recent periods, the potential benefit to the Fund of recent increases in headcount at the Investment Adviser and the ongoing recruitment efforts aimed at bringing high quality investment talent to the Investment Adviser. The Independent Trustees concluded that the Investment Adviser had committed substantial financial and operational resources to the Fund and expressed confidence that the Investment Adviser would continue to do so in the future. The Trustees also observed that the Investment Adviser had made significant commitments to address regulatory compliance requirements applicable to the Fund and the Investment Adviser.
Investment Performance
The Trustees also considered the investment performance of the Fund and the Investment Adviser. In this regard, they compared the Fund to its peers using performance rankings and ratings compiled by the Outside Data Provider as of December 31, 2010, and updated performance information prepared by the Investment Adviser using the peer groups identified by the Outside Data provider. The information on the Fund’s investment performance was provided for the one-, three-, five- and ten-year periods ending on the applicable dates. The Trustees also reviewed the Fund’s investment performance over time on a year-by-year basis relative to its performance benchmark. In addition, they considered the investment performance trends of the Fund over time, and reviewed the investment performance of the Fund in light of its investment objective and policies, and market conditions. The Trustees considered whether the Fund had operated within its investment policies and had complied with its investment limitations.
In addition, the Trustees considered materials prepared and presentations made by the Investment Adviser’s senior management and portfolio management personnel, in which Fund performance was assessed. The Trustees also considered the Investment Adviser’s periodic reports with respect to the Fund’s risk profile, and how the Investment Adviser’s approach to risk monitoring and management influences portfolio management.
GOLDMAN SACHS VARIABLE INSURANCE TRUST STRATEGIC INTERNATIONAL EQUITY FUND
Statement Regarding Basis for Approval of Management Agreement (Unaudited) (continued)
The Independent Trustees noted that during the one-year period ended May 31, 2011, the Fund had shown improving performance relative to its peer group and had placed in the top half of its peer group and outperformed its benchmark index. The Independent Trustees noted that the Investment Adviser had taken a number of steps in 2009 intended to improve the performance of the Fund, including making changes to the leadership and personnel on the portfolio management team and implementing enhancements to the investment process for the Fund (which among other things included refinement of how bottom-up stock selection is reflected across multi-regional portfolios), and that the changes seemed to have had a positive effect on performance. They also noted that they had received assurances from the Investment Adviser’s senior management that measures would continue to be taken to address the Fund’s performance.
Costs of Services Provided and Competitive Information
The Trustees considered the contractual fee rates payable by the Fund under the Management Agreement. In this regard, the Trustees considered information on the services rendered by the Investment Adviser to the Fund, which included both advisory and administrative services that were directed to the needs and operations of the Fund as a registered mutual fund.
In particular, the Trustees reviewed analyses prepared by the Outside Data Provider regarding the expense rankings of the Fund. The analyses provided a comparison of the Fund’s management fees and breakpoints to those of a relevant peer group and category universe; an expense analysis which compared the Fund’s expenses to a peer group and a category universe; and a five-year history comparing the Fund’s expenses to the peer and category medians. The analyses also compared the Fund’s transfer agency fees, custody and accounting fees, distribution fees, other expenses and fee waivers/reimbursements to those of other funds in the peer group and the peer group median. The Trustees concluded that the comparisons provided by the Outside Data Provider were useful in evaluating the reasonableness of the management fees and total expenses paid by the Fund.
In addition, the Trustees considered the Investment Adviser’s undertakings to waive a portion of its management fee and limit the Fund’s “other expenses” ratio (excluding certain expenses) to a certain specified level. They also considered, to the extent that the Investment Adviser manages institutional accounts or collective investment vehicles having investment objectives and policies similar to those of the Fund, comparative fee information for services provided by the Investment Adviser to those accounts, and information that indicated that services provided to the Fund differed in various significant respects from the services provided to institutional accounts, which generally operated under less stringent legal and regulatory structures, required fewer services from the Investment Adviser to a smaller number of client contact points, were less time-intensive and paid lower fees. By contrast, the Trustees noted that the Investment Adviser provides substantial administrative services to the Fund under the terms of the Management Agreement.
In addition, the Trustees noted that shareholders are able to redeem their Fund shares at any time if they believe that the Fund fees and expenses are too high or if they are dissatisfied with the performance of the Fund.
Profitability
The Trustees reviewed the Investment Adviser’s revenues and pre-tax profit margins with respect to the Trust and the Fund. In this regard the Trustees noted that they had received, among other things, profitability analyses and summaries, revenue and expense schedules by Fund and by function (i.e., investment management, transfer agency and distribution and service) and the Investment Adviser’s expense allocation methodology. They observed that the profitability and expense figures are substantially similar to those used by the Investment Adviser for many internal purposes, including compensation decisions among various business groups, and are thus subject to a vigorous internal debate about how certain revenue and expenses should be allocated. The Trustees also reviewed the report of the internal audit group within the Goldman Sachs organization, which included an assessment of the reasonableness and consistency of the Investment Adviser’s expense allocation methodology and an evaluation of the accuracy of the Investment Adviser’s profitability analysis calculations. Profitability data for the Trust and the Fund were provided for 2010 and 2009, and the Trustees considered this information in relation to the Investment Adviser’s overall profitability. The Trustees considered the Investment Adviser’s revenues and pre-tax profit margins both in absolute terms and in comparison to information on the reported pre-tax profit margins earned by certain other asset management firms.
GOLDMAN SACHS VARIABLE INSURANCE TRUST STRATEGIC INTERNATIONAL EQUITY FUND
Statement Regarding Basis for Approval of Management Agreement (Unaudited) (continued)
Economies of Scale
The Trustees considered the information that had been provided regarding the Investment Adviser’s profitability and the rationale for the Fund’s breakpoint structure. The Trustees also considered the breakpoints in the fee rate payable under the Management Agreement for the Fund at the following annual percentage rates of the average daily net assets of the Fund:
| First $1 billion | 0.85 | % | ||
| Next $1 billion | 0.77 | |||
| Next $3 billion | 0.73 | |||
| Next $3 billion | 0.72 | |||
| Over $8 billion | 0.71 |
The Trustees noted that the breakpoints at the $5 and $8 billion asset levels had been proposed by the Investment Adviser and approved by the Trustees in 2008 to further share potential economies of scale, if any, with the Fund and its shareholders as assets under management reach those asset levels. The Trustees considered the amounts of assets in the Fund; the Fund’s recent share purchase and redemption activity; the information provided by the Investment Adviser relating to the costs of the services provided by the Investment Adviser and its affiliates and their realized profits; information comparing fee rates charged by the Investment Adviser with fee rates charged to other funds in the peer group; and the Investment Adviser’s undertakings to limit the Fund’s fees and “other expenses” ratio (excluding certain expenses) to certain amounts. Upon reviewing these matters at the Annual Meeting, the Trustees concluded that the fee breakpoints represented a means of assuring that benefits of scalability would be passed along to shareholders at the specified asset levels.
Other Benefits to the Investment Adviser and Its Affiliates
The Trustees also considered the other benefits derived by the Investment Adviser and its affiliates from their relationship with the Fund as stated above, including: (a) transfer agency fees received by Goldman, Sachs & Co. (“Goldman Sachs”); (b) brokerage and futures commissions earned by Goldman Sachs for executing securities and futures transactions on behalf of the Fund; (c) research received by the Investment Adviser from broker-dealers in exchange for executing certain transactions on behalf of the Fund; (d) trading efficiencies resulting from aggregation of orders of the Fund with those for other funds or accounts managed by the Investment Adviser; (e) the Investment Adviser’s ability to leverage the infrastructure designed to service the Fund on behalf of its other clients; (f) the Investment Adviser’s ability to cross-market other products and services to Fund shareholders; (g) Goldman Sachs’ retention of certain fees as Fund Distributor; (h) the Investment Adviser’s ability to negotiate better pricing with custodians on behalf of its other clients, as a result of the relationship with the Fund; and (i) the possibility that the working relationship between the Investment Adviser and the Fund’s third party service providers may cause those service providers to be open to doing business with other areas of Goldman Sachs. In the course of considering the foregoing, the Independent Trustees requested and received further information quantifying certain of the fall-out benefits.
Other Benefits to the Fund and Its Shareholders
The Trustees also noted that the Fund receives certain potential benefits as a result of its relationship with the Investment Adviser, including: (a) trading efficiencies resulting from aggregation of orders of the Fund with those of other funds or accounts managed by the Investment Adviser; (b) improved servicing and pricing from vendors because of the volume of business generated by the Investment Adviser and its affiliates; (c) improved servicing from broker-dealers because of the volume of business generated by the Investment Adviser and its affiliates; (d) the Investment Adviser’s ability to negotiate favorable terms with derivatives counterparties as a result of the size and reputation of the Goldman Sachs organization; (e) the advantages gained from the Investment Adviser’s knowledge and experience gained from managing other accounts and products; (f) the Investment Adviser’s ability to hire and retain qualified personnel to provide services to the Fund because of the reputation of the Goldman Sachs organization; (g) the Fund’s access, through the Investment Adviser, to certain firmwide resources (e.g., proprietary databases); and (h) the Fund’s access to certain affiliated distribution channels. The Trustees noted the competitive nature of the mutual fund marketplace, and noted further that many of the Fund’s shareholders invested in the Fund in part because of the Fund’s relationship with the Investment Adviser and that those shareholders have a general expectation that the relationship will continue.
GOLDMAN SACHS VARIABLE INSURANCE TRUST STRATEGIC INTERNATIONAL EQUITY FUND
Statement Regarding Basis for Approval of Management Agreement (Unaudited) (continued)
Conclusion
In connection with their consideration of the Management Agreement, the Trustees gave weight to each of the factors described above, but did not identify any particular factor as controlling their decision. After deliberation and consideration of all of the information provided, including the factors described above, the Trustees concluded, in the exercise of their business judgment, that the management fees paid by the Fund were reasonable in light of the services provided to it by the Investment Adviser, the Investment Adviser’s costs and the Fund’s current and reasonably foreseeable asset levels. The Trustees unanimously concluded that the Investment Adviser’s continued management likely would benefit the Fund and its shareholders and that the Management Agreement should be approved and continued with respect to the Fund until June 30, 2012.
GOLDMAN SACHS VARIABLE INSURANCE TRUST STRATEGIC INTERNATIONAL EQUITY FUND
Fund Expenses — Six Month Period Ended June 30, 2011 (Unaudited)
As a shareholder of the Institutional or Service Shares of the Fund, you incur ongoing costs, including management fees, distribution and service (12b-1) fees (with respect to Service Shares) and other Fund expenses. This example is intended to help you understand your ongoing costs (in dollars) of investing in the Institutional Shares and Service Shares of the Fund and to compare these costs with the ongoing costs of investing in other mutual funds.
The example is based on an investment of $1,000 invested at the beginning of the period and held for the entire period from January 1, 2011 through June 30, 2011.
Actual Expenses — The first line under each share class in the table below provides information about actual account values and actual expenses. You may use the information in this line, together with the amount you invested, to estimate the expenses that you paid over the period. Simply divide your account value by $1,000 (for example, an $8,600 account value divided by $1,000=8.6), then multiply the result by the number in the first line under the heading entitled “Expenses Paid” to estimate the expenses you paid on your account during this period.
Hypothetical Example for Comparison Purposes — The second line under each share class in the table below provides information about hypothetical account values and hypothetical expenses based on the Fund’s actual net expense ratio and an assumed rate of return of 5% per year before expenses, which is not the Fund’s actual return. The hypothetical account values and expenses may not be used to estimate the actual ending account balance or expenses you paid for the period. You may use this information to compare the ongoing costs of investing in the Fund and other funds. To do so, compare this 5% hypothetical example with the 5% hypothetical examples that appear in the shareholder reports of the other funds.
Please note that the expenses shown in the table are meant to highlight your ongoing costs only. As a shareholder of the Fund, you do not incur any transaction costs, such as sales charges (loads), redemption fees, or exchange fees, but shareholders of other funds may incur such costs. The second line of the table is useful in comparing ongoing costs only, and will not help you determine the relative total costs of owning different funds whose shareholders may incur transaction costs.
| Expenses Paid | |||||||||||||||
| for the | |||||||||||||||
| Beginning | Ending | 6 Months | |||||||||||||
| Account Value | Account Value | Ended | |||||||||||||
| Share Class | 1/01/11 | 6/30/11 | 6/30/11* | ||||||||||||
Institutional | |||||||||||||||
| Actual | $ | 1,000 | $ | 1,046.50 | $ | 5.12 | |||||||||
| Hypothetical 5% return | 1,000 | 1,019.79 | + | 5.06 | |||||||||||
Service | |||||||||||||||
| Actual | 1,000 | 1,045.30 | 6.39 | ||||||||||||
| Hypothetical 5% return | 1,000 | 1,018.55 | + | 6.31 | |||||||||||
| * | Expenses for each share class are calculated using the Fund’s annualized net expense ratio for each class, which represents the ongoing expenses as a percentage of net assets for the six months ended June 30, 2011. Expenses are calculated by multiplying the annualized net expense ratio by the average account value for the period; then multiplying the result by the number of days in the most recent fiscal half year; and then dividing that result by the number of days in the fiscal year. The annualized net expense ratios for the period were 1.01% and 1.26% for Institutional and Service Shares, respectively. | |
| + | Hypothetical expenses are based on each Fund’s actual annualized net expense ratios and an assumed rate of return of 5% per year before expenses. |
| TRUSTEES | OFFICERS | |
| Ashok N. Bakhru, Chairman Donald C. Burke John P. Coblentz, Jr. Diana M. Daniels Joseph P. LoRusso James A. McNamara Jessica Palmer Alan A. Shuch Richard P. Strubel | James A. McNamara, President George F. Travers, Principal Financial Officer Peter V. Bonanno, Secretary Scott M. McHugh, Treasurer | |
| GOLDMAN, SACHS & CO. Distributor and Transfer Agent | ||
| GOLDMAN SACHS ASSET MANAGEMENT INTERNATIONAL Investment Adviser Christchurch Court, 10-15 Newgate Street London, EC1A 7HD, England, United Kingdom | ||
| Visit our website at www.goldmansachsfunds.com/vit to obtain the most recent month-end returns. | ||
| The reports concerning the Fund included in this shareholder report may contain certain forward-looking statements about the factors that may affect the performance of the Fund in the future. These statements are based on Fund management’s predictions and expectations concerning certain future events and their expected impact on the Fund, such as performance of the economy as a whole and of specific industry sectors, changes in the levels of interest rates, the impact of developing world events, and other factors that may influence the future performance of the Fund. Management believes these forward-looking statements to be reasonable, although they are inherently uncertain and difficult to predict. Actual events may cause adjustments in portfolio management strategies from those currently expected to be employed. | ||
| A description of the policies and procedures that the Fund uses to determine how to vote proxies relating to portfolio securities and information regarding how the Fund voted proxies relating to portfolio securities during the most recent 12-month period ended June 30 is available (i) without charge, upon request by calling 1-800-621-2550; and (ii) on the Securities and Exchange Commission (“SEC”) website at http://www.sec.gov. | ||
| The Fund files its complete schedule of portfolio holdings with the SEC for the first and third quarters of each fiscal year on Form N-Q. The Fund’s Form N-Q is available on the SEC’s website at http://www.sec.gov within 60 days after the Fund’s first and third fiscal quarters. When available, the Fund’s Forms N-Q may be reviewed and copied at the SEC’s Public Reference Room in Washington, D.C. and information on the operation of the Public Reference Room may also be obtained by calling 1-800-SEC-0330. Forms N-Q may be obtained upon request and without charge by calling 1-800-621-2550. | ||
| Holdings and allocations shown may not be representative of current or future investments. Holdings and allocations may not include the Fund’s entire investment portfolio, which may change at any time. Fund holdings should not be relied on in making investment decisions and should not be construed as research or investment advice regarding particular securities. | ||
| Economic and market forecasts presented herein reflect our judgment as of the date of this presentation and are subject to change without notice. These forecasts do not take into account the specific investment objectives, restrictions, tax and financial situation or other needs of any specific client. Actual data will vary and may not be reflected here. These forecasts are subject to high levels of uncertainty that may affect actual performance. Accordingly, these forecasts should be viewed as merely representative of a broad range of possible outcomes. These forecasts are estimated, based on assumptions, and are subject to significant revision and may change materially as economic and market conditions change. Goldman Sachs has no obligation to provide updates or changes to these forecasts. Case studies and examples are for illustrative purposes only. | ||
| The Global Industry Classification Standard (“GICS”) was developed by and is the exclusive property and a service mark of Morgan Stanley Capital International Inc. (“MSCI”) and Standard & Poor’s, a division of The McGraw-Hill Companies, Inc. (“S&P”) and is licensed for use by Goldman Sachs. Neither MSCI, S&P nor any other party involved in making or compiling the GICS or any GICS classifications makes any express or implied warranties or representations with respect to such standard or classification (or the results to be obtained by the use thereof), and all such parties hereby expressly disclaim all warranties of originality, accuracy, completeness, merchantability or fitness for a particular purpose with respect to any of such standard or classification. Without limiting any of the foregoing, in no event shall MSCI, S&P, any of their affiliates or any third party involved in making or compiling the GICS or any GICS classifications have any liability for any direct, indirect, special, punitive, consequential or any other damages (including lost profits) even if notified of the possibility of such damages. | ||
| The portfolio risk management process includes an effort to monitor and manage risk, but does not imply low risk. | ||
| Shares of the Goldman Sachs VIT Funds are offered to separate accounts of participating life insurance companies for the purpose of funding variable annuity contracts and variable life insurance policies. Shares of the Fund are not offered directly to the general public. The variable annuity contracts and variable life insurance policies are described in the separate prospectuses issued by participating insurance companies. You should refer to those prospectuses for information about surrender charges, mortality and expense risk fees and other charges that may be assessed by participating insurance companies under the variable annuity contracts or variable life insurance policies. Such fees or charges, if any, may affect the return you may realize with respect to your investments. Ask your representative for more complete information. Please consider a fund’s objectives, risks and charges and expenses, and read the prospectus carefully before investing. The prospectus contains this and other information about the Fund. | ||
| This material is not authorized for distribution to prospective investors unless preceded or accompanied by a current Prospectus or summary prospectus, if applicable. Investors should consider a Fund’s objective, risks, and charges and expenses, and read the summary prospectus, if available, and/or the Prospectus carefully before investing or sending money. The summary prospectus, if available, and the Prospectus contain this and other information about a Fund and may be obtained from your authorized dealer or from Goldman, Sachs & Co. by calling 1-800-621-2550. | ||
| Toll Free (in U.S.): 800-292-4726 | ||
| This report is prepared for the general information of contract owners and is not an offer of shares of the Goldman Sachs Variable Insurance Trust: Goldman Sachs Strategic International Equity Fund. | ||
| © 2011 Goldman Sachs. All rights reserved. | ||
| VITINTLSAR11/57688.MF.MED.TMPL/8/2011 | ||
Goldman
Sachs Variable Insurance Trust
Structured Small Cap Equity Fund
Semi-Annual Report
June 30, 2011
|
GOLDMAN SACHS VARIABLE INSURANCE TRUST STRUCTURED SMALL CAP EQUITY FUND
Principal Investment Strategies and Risks
Shares of the Goldman Sachs Variable Insurance Trust — Goldman Sachs Structured Small Cap Equity Fund are offered to separate accounts of participating life insurance companies for the purpose of funding variable annuity contracts and variable life insurance policies. Shares of the Fund are not offered directly to the general public. The variable annuity contracts and variable life insurance policies are described in the separate prospectuses issued by participating insurance companies. You should refer to those prospectuses for information about surrender charges, mortality and expense risk fees and other charges that may be assessed by participating insurance companies under the variable annuity contracts or variable life insurance policies. Such fees or charges, if any, may affect the return you realize with respect to your investments. Ask your representative for more complete information. Please consider the Fund’s objective, risks and charges and expenses, and read the Prospectus carefully before investing. The Prospectus contains this and other information about the Fund.
The Goldman Sachs Structured Small Cap Equity Fund invests primarily in a broadly diversified portfolio of small-capitalization U.S. issuers, including foreign issuers traded in the United States. The Fund’s equity investments will be subject to market risk, which means that the value of the securities in which it invests may go up or down in response to the prospects of individual companies, particular industry sectors and/or general economic conditions. Stocks of small companies are often more volatile and less liquid and present greater risks than stocks of larger companies. At times, the Fund may be unable to sell certain of its portfolio securities without a substantial drop in price, if at all. The Fund may also invest in fixed income securities, which are subject to the risks associated with debt securities generally, including credit, liquidity and interest rate risk.
GOLDMAN SACHS VARIABLE INSURANCE TRUST STRUCTURED SMALL CAP EQUITY FUND
INVESTMENT OBJECTIVE
The Fund seeks long-term growth of capital.
Portfolio Management Discussion and Analysis
Below, the Goldman Sachs Quantitative Investment Strategies Team discusses the performance of the Goldman Sachs Variable Insurance Trust — Goldman Sachs Structured Small Cap Equity Fund (the “Fund”) and positioning for the six-month period ended June 30, 2011 (the “Reporting Period”).
How did the Fund perform during the Reporting Period?
During the Reporting Period, the Fund’s Institutional and Service Shares generated cumulative total returns of 8.67% and 8.53%, respectively. These returns compare to the 6.21% cumulative total return of the Fund’s benchmark, the Russell 2000® Index* (with dividends reinvested) (the “Russell Index”) during the same time period.
What economic and market factors most influenced the equity markets as a whole during the annual period?
U.S. equities continued their positive momentum from 2010 during the Reporting Period. However, most of the gains were generated during the first quarter of 2011, as improving trends in labor, housing, manufacturing and consumer confidence pointed to a continuation in the economic recovery. A positive trajectory in corporate earnings and cash flows and strong merger and acquisition activity further supported U.S. equity market performance. Indeed, despite great exogenous shocks in Middle East and North African turmoil, a series of disasters in Japan, political debate over collective bargaining rights in Wisconsin and the possible repeal of health care reform in Washington D.C., the U.S. equity markets rewarded investors with solid returns during the first quarter of 2011.
The broad U.S. equity markets experienced a much more volatile second quarter, rising to a three-year high in April before losing most of its early 2011 gains by mid-June and then recovering somewhat in the very last week of the Reporting Period. In early April, commodity prices declined and expectations ran high for strong corporate profit growth. However, while home construction rose modestly in May, housing and employment remained key weak spots in the U.S. economy. Concerns about Greece’s debt crisis also re-surfaced, the U.S. Congress wrangled over the U.S. debt ceiling, the Federal Reserve Board’s quantitative easing program was scheduled to expire on June 30, 2011, the impact of Japan’s natural and nuclear disasters worked its way through the global supply chain and deadly storms cut a wide swath of destruction across the midwestern and southern United States. In turn, the U.S. stock market felt pressured and lost ground. Toward the end of June, U.S. equity markets recovered from their May to mid-June decline on the heels of better than expected U.S. manufacturing activity, improved automobile sales and a short-term resolution of the sovereign debt crisis in Greece.
Despite this volatility, all sectors posted gains during the Reporting Period, with the exception of financials, which posted a negative return. Health care and energy led the way.
Energy was, not surprisingly, impacted by the price of Brent crude oil, which peaked at more than $126 per barrel in April on supply disruption fears in North Africa and the Middle East before falling in June on weaker U.S. economic data and concerns about the pace of growth in China’s economy. Still, Brent crude oil prices ended the Reporting Period at more than $112 per barrel.
While all capitalization segments of the U.S. equity market advanced during the Reporting Period, mid-cap stocks, as measured by the Russell Midcap® Index, performed best, followed by large-cap and then small-cap stocks, as measured by the Russell 1000® Index and the Russell 2000® Index, respectively, which performed nearly in line with each other. Large-cap stocks were least successful relative to small-cap stocks in the information technology sector. Within the U.S. small-cap equity segment, growth-oriented stocks outperformed value-oriented stocks during the Reporting Period. The Russell 2000® Growth Index returned 8.59% compared to the 3.77% return of the Russell 2000® Value Index.
| * | The Russell 2000 Index is an unmanaged index of common stock prices that measures the performance of the 2000 smallest companies in the Russell 3000 Index. The Index figures do not reflect any deduction for fees, expenses or taxes. It is not possible to invest directly in an unmanaged index. |
GOLDMAN SACHS VARIABLE INSURANCE TRUST STRUCTURED SMALL CAP EQUITY FUND
What key factors were responsible for the Fund’s performance during the Reporting Period?
As expected, and in keeping with our investment approach, our quantitative model and its six investment themes — Valuation, Profitability, Quality, Management, Momentum and Sentiment — had the greatest impact on relative performance. We use these themes to take a long-term view of market patterns and look for inefficiencies, selecting stocks for the Fund and overweighting or underweighting the ones chosen by the model. Over time and by design, the performance of any one of the model’s investment themes tends to have a low correlation with the model’s other themes, demonstrating the diversification benefit of the Fund’s theme-driven quantitative model. The variance in performance supports our research indicating that the diversification provided by the Fund’s different investment themes is a significant investment advantage over the long term, even though the Fund may experience underperformance in the short term.
Overall, the Fund outperformed during the Reporting Period, with the Fund’s Profitability theme contributing the most positively to results. The Sentiment, Quality and Management themes also added value, albeit to a lesser extent. The Profitability theme assesses whether a company is earning more than its cost of capital. The Sentiment theme reflects selected investment views and decisions of individuals and financial intermediaries. Quality evaluates whether the company’s earnings are coming from more persistent, cash-based sources, as opposed to accruals. The Management theme assesses the characteristics, policies and strategic decisions of company management.
The Momentum theme detracted most from the Fund’s relative results during the Reporting Period, followed by Valuation. The Momentum theme seeks to predict drifts in stock prices caused by under-reaction to company-specific information. Valuation attempts to capture potential mispricings of securities, typically by comparing a measure of the company’s intrinsic value to its market value.
How did the Fund’s sector allocations affect relative performance?
In constructing the Fund’s portfolio, we focus on picking stocks rather than making industry or sector bets. Consequently, the Fund is similar to its benchmark, the Russell 2000® Index, in terms of its sector allocation and style. We manage the Fund’s industry and sector exposure by including industry factors in our risk model and by explicitly penalizing industry and sector deviations from the benchmark index in optimization. Sector weights or changes in weights generally do not have a meaningful impact on relative performance.
Did stock selection help or hurt Fund performance during the Reporting Period?
We seek to outpace the Russell 2000® Index by overweighting stocks that we expect to outperform and underweighting those that we think may lag. We also build positions based on our thematic views. For example, the Fund aims to hold a basket of stocks with more favorable Momentum characteristics than the benchmark index. During the Reporting Period, stock selection overall contributed positively to the Fund’s relative performance.
Stock selection in the consumer discretionary, energy and health care sectors made the biggest positive contribution to the Fund’s results relative to the Russell 2000® Index. Only partially offsetting these positives was stock selection in the industrials, materials and telecommunication services sectors, which detracted most from the Fund’s results relative to its benchmark index.
Which individual stock positions contributed the most to the Fund’s relative returns during the Reporting Period?
The Fund benefited most from overweight positions in enterprise software and services company MicroStrategy, oil refiner Western Refining and biomedical drug company Cubist Pharmaceuticals. We chose to overweight MicroStrategy because of our positive views on Management and Momentum. The Fund was overweight Western Refining and Cubist Pharmaceuticals due to our positive views on Momentum and Profitability.
Which individual positions detracted from the Fund’s results during the Reporting Period?
Detracting most from the Fund’s results relative to its benchmark index were overweight positions in passenger airline operator Allegiant Travel and commercial banks International Bancshares and Wilshire Bancorp. Our positive views on Management and Sentiment led us to overweight Allegiant Travel. The Fund had an overweighted position in International Bancshares because of our positive views on Profitability and Momentum. The Fund was overweight Wilshire Bancorp due to our positive views on Momentum and Valuation.
GOLDMAN SACHS VARIABLE INSURANCE TRUST STRUCTURED SMALL CAP EQUITY FUND
How did the Fund use derivatives during the Reporting Period?
During the Reporting Period, we did not use derivatives as part of an active management strategy to add value to the Fund’s results. However, we used equity index futures contracts, on an opportunistic basis, to equitize the Fund’s excess cash holdings. In other words, we put the Fund’s excess cash holdings to work by using them as collateral for the purchase of stock futures.
Did you make any enhancements to your quantitative models during the Reporting Period?
We continuously look for ways to improve our investment process. Accordingly, we continued our extensive ongoing research process but did not implement any significant model enhancements during the Reporting Period.
What was the Fund’s sector positioning relative to its benchmark index at the end of the Reporting Period?
As of June 30, 2011, the Fund was overweight the health care, consumer discretionary, materials, energy and consumer staples sectors relative to the Russell 2000® Index. The Fund was underweight industrials, financials, utilities and information technology and was rather neutrally weighted in telecommunication services compared to the benchmark index on the same date.
What is your strategy going forward for the Fund?
Looking ahead, we continue to believe that less expensive stocks should outpace more expensive stocks, and stocks with good momentum are likely to outperform those with poor momentum. We intend to maintain our focus on seeking companies with positive fundamentals, good profitability, sustainable earnings and a track record of using capital to enhance shareholder value. As such, we anticipate remaining fully invested with long-term performance likely to be the result of stock selection rather than sector or capitalization allocations.
We stand behind our investment philosophy that sound economic investment principles, coupled with a disciplined quantitative approach, can provide strong, uncorrelated returns over the long term. Our research agenda is robust, and we continue to enhance our existing models, add new proprietary forecasting signals, and improve our trading execution as we seek to provide the most value to our shareholders.
CHANGES MADE TO THE TEAM’S MANAGEMENT
During the first quarter of 2011, we announced that Richard Vanecek, Managing Director and co-head of Quantitative Investment Strategies (QIS) Trading would become the sole head of QIS Trading.
FUND BASICS
Structured Small Cap Equity Fund
as of June 30, 2011
| STANDARDIZED AVERAGE ANNUAL TOTAL RETURNS1 |
| For the period ended 6/30/11 | One Year | Five Years | Ten Years | Since Inception | Inception Date | |||||||||||||||
| Institutional | 41.72 | % | 1.19 | % | 5.46 | % | 5.07 | % | 2/13/98 | |||||||||||
| Service | 41.43 | N/A | N/A | 2.77 | 8/31/07 | |||||||||||||||
| 1 | The Standardized Average Annual Total Returns are average annual total returns as of the most recent calendar quarter-end. They assume reinvestments of all distributions at net assets value (“NAV”). | |
| Total return figures in the above chart represent past performance and do not indicate future results, which will vary. The investment return and principal value of an investment will fluctuate and, therefore, an investor’s shares, when redeemed, may be worth more or less than their original cost. Current performance may be lower or higher than the total return figures in the above chart. Please visit www.goldmansachsfunds.com/vit to obtain the most recent month-end returns. Performance reflects fee waivers and/or expense limitations in effect. In their absence, performance would be reduced. |
| EXPENSE RATIOS2 |
| Net Expense Ratio (Current) | Gross Expense Ratio (Before Waivers) | |||||||||
| Institutional | 0.81 | % | 0.97 | % | ||||||
| Service | 1.06 | 1.22 | ||||||||
| 2 | The expense ratios of the Fund, both current (net of any fee waivers or expense limitations) and before waivers (gross of any fee waivers or expense limitations) are as set forth above. The Fund’s waivers and/or expense limitations will remain in place through at least April 29, 2012, and prior to such date the investment adviser may not terminate the arrangements without the approval of the Fund’s Board of Trustees. The expense ratios set forth above may differ from the expense ratios disclosed in the Financial Highlights in this report. |
| TOP TEN HOLDINGS AS OF 6/30/113 |
| Holding | % of Net Assets | Line of Business | ||||||
| Tesoro Corp. | 2.0 | % | Energy | |||||
| Rayonier, Inc. (REIT) | 1.8 | Real Estate | ||||||
| W&T Offshore, Inc. | 1.5 | Energy | ||||||
| MicroStrategy, Inc. Class A | 1.3 | Software & Services | ||||||
| Western Refining, Inc. | 1.3 | Energy | ||||||
| Lattice Semiconductor Corp. | 1.3 | Semiconductors & Semiconductor Equipment | ||||||
| Nationwide Health Properties, Inc. (REIT) | 1.3 | Real Estate | ||||||
| Cubist Pharmaceuticals, Inc. | 1.2 | Pharmaceuticals, Biotechnology & Life Sciences | ||||||
| Polaris Industries, Inc. | 1.1 | Consumer Durables & Apparel | ||||||
| Molina Healthcare, Inc. | 1.1 | Health Care Equipment & Services | ||||||
| 3 | The top 10 holdings may not be representative of the Fund’s future investments. |
FUND BASICS
| FUND vs. BENCHMARK SECTOR ALLOCATIONS4 |
As of June 30, 2011
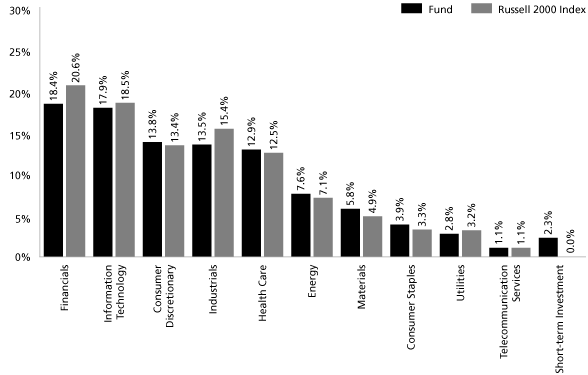
| 4 | The Fund is actively managed and, as such, its composition may differ over time. The above graph categorizes investments using Global Industry Classification Standard (“GICS”), however, the sector classifications used by the portfolio management team may differ from GICS. Consequently, the Fund’s overall industry sector allocations may differ from percentages contained in the graph above. The percentage shown for each investment category reflects the value of investments in that category as a percentage of market value (excluding investments in the securities lending reinvestment vehicle, if any). Investment in the securities lending reinvestment vehicle represented 2.2% of the Fund’s net assets at June 30, 2011. Short-term investments represent investments in investment companies other than those that are exchange traded. The above graph depicts the Fund’s investments but may not represent the Fund’s market exposure due to the exclusion of derivatives, if any, as listed in the Additional Investment Information section of the Schedule of Investments. |
GOLDMAN SACHS VARIABLE INSURANCE TRUST STRUCTURED SMALL CAP EQUITY FUND
Schedule of Investments
June 30, 2011 (Unaudited)
| Shares | Description | Value | ||||||
Common Stocks – 97.7% | ||||||||
Automobiles & Components – 0.9% | ||||||||
| 13,519 | Modine Manufacturing Co.* | $ | 207,787 | |||||
| 13,146 | Spartan Motors, Inc. | 70,988 | ||||||
| 13,479 | Standard Motor Products, Inc. | 205,285 | ||||||
| 22,346 | Stoneridge, Inc.* | 329,380 | ||||||
| 17,077 | Superior Industries International, Inc. | 377,573 | ||||||
| 1,191,013 | ||||||||
Banks – 4.3% | ||||||||
| 3,894 | 1st Source Corp. | 80,762 | ||||||
| 19,073 | Astoria Financial Corp. | 243,944 | ||||||
| 6,330 | Banco Latinoamericano de Comercio Exterior SA Class E | 109,636 | ||||||
| 4,778 | Commerce Bancshares, Inc. | 205,454 | ||||||
| 823 | Cullen/Frost Bankers, Inc. | 46,788 | ||||||
| 74,687 | CVB Financial Corp.(a) | 690,855 | ||||||
| 24,110 | First Bancorp | 246,886 | ||||||
| 6,132 | First Bancorp, Inc. | 91,122 | ||||||
| 11,406 | First Financial Bancorp | 190,366 | ||||||
| 12,553 | First Interstate Bancsystem, Inc. | 185,031 | ||||||
| 2,014 | First Republic Bank* | 65,012 | ||||||
| 4,567 | FirstMerit Corp. | 75,401 | ||||||
| 5,555 | FNB Corp. | 57,494 | ||||||
| 38,007 | Fulton Financial Corp. | 407,055 | ||||||
| 3,265 | Glacier Bancorp, Inc. | 44,012 | ||||||
| 14,075 | Great Southern Bancorp, Inc. | 266,721 | ||||||
| 64,629 | International Bancshares Corp. | 1,081,243 | ||||||
| 14,386 | Investors Bancorp, Inc.* | 204,281 | ||||||
| 3,893 | Northfield Bancorp, Inc. | 54,736 | ||||||
| 70,828 | Popular, Inc.* | 195,485 | ||||||
| 1,364 | Prosperity Bancshares, Inc. | 59,770 | ||||||
| 11,699 | Renasant Corp. | 169,518 | ||||||
| 2,231 | SVB Financial Group* | 133,213 | ||||||
| 2,979 | TCF Financial Corp. | 41,110 | ||||||
| 19,977 | Texas Capital Bancshares, Inc.* | 516,006 | ||||||
| 50,591 | Wilshire Bancorp, Inc.* | 148,738 | ||||||
| 5,610,639 | ||||||||
Capital Goods – 8.6% | ||||||||
| 1,857 | Alamo Group, Inc. | 44,011 | ||||||
| 11,114 | Albany International Corp. Class A | 293,298 | ||||||
| 751 | Alliant Techsystems, Inc. | 53,569 | ||||||
| 6,857 | American Woodmark Corp. | 118,763 | ||||||
| 5,369 | Applied Industrial Technologies, Inc. | 191,190 | ||||||
| 9,365 | Astec Industries, Inc.* | 346,318 | ||||||
| 2,507 | Astronics Corp.* | 77,216 | ||||||
| 2,325 | Belden, Inc. | 81,050 | ||||||
| 28,797 | Briggs & Stratton Corp. | 571,908 | ||||||
| 9,482 | Ceradyne, Inc.* | 369,703 | ||||||
| 4,177 | Cubic Corp. | 212,985 | ||||||
| 2,334 | Curtiss-Wright Corp. | 75,552 | ||||||
| 4,265 | DigitalGlobe, Inc.* | 108,374 | ||||||
| 4,623 | Ducommun, Inc. | 95,095 | ||||||
| 8,338 | Encore Wire Corp. | 201,946 | ||||||
| 5,173 | EnPro Industries, Inc.* | 248,666 | ||||||
| 2,829 | Franklin Electric Co., Inc. | 132,822 | ||||||
| 3,446 | Generac Holdings, Inc.* | 66,852 | ||||||
| 13,667 | General Cable Corp.* | 581,941 | ||||||
| 11,335 | Hexcel Corp.* | 248,123 | ||||||
| 977 | Hubbell, Inc. Class B | 63,456 | ||||||
| 4,414 | II-VI, Inc.* | 112,998 | ||||||
| 14,762 | Kadant, Inc.* | 465,151 | ||||||
| 3,622 | LMI Aerospace, Inc.* | 88,485 | ||||||
| 43,981 | LSI Industries, Inc. | 349,209 | ||||||
| 8,267 | Lydall, Inc.* | 98,873 | ||||||
| 17,917 | Miller Industries, Inc. | 334,869 | ||||||
| 25,011 | Mueller Industries, Inc. | 948,167 | ||||||
| 8,408 | NACCO Industries, Inc. Class A | 814,063 | ||||||
| 1,755 | Polypore International, Inc.* | 119,059 | ||||||
| 2,702 | Quanex Building Products Corp. | 44,286 | ||||||
| 7,062 | Sauer-Danfoss, Inc.* | 355,854 | ||||||
| 1,777 | Simpson Manufacturing Co., Inc. | 53,079 | ||||||
| 19,312 | Tecumseh Products Co. Class A* | 196,982 | ||||||
| 4,987 | Tennant Co. | 199,131 | ||||||
| 15,036 | Toro Co.(b) | 909,678 | ||||||
| 6,519 | Tredegar Corp. | 119,624 | ||||||
| 1,948 | United Rentals, Inc.* | 49,479 | ||||||
| 12,563 | Universal Forest Products, Inc. | 301,010 | ||||||
| 11,061 | Vicor Corp. | 178,856 | ||||||
| 15,038 | Watsco, Inc. | 1,022,434 | ||||||
| 5,741 | Woodward, Inc. | 200,131 | ||||||
| 11,144,256 | ||||||||
Commercial & Professional Services – 2.5% | ||||||||
| 17,398 | CDI Corp. | 231,219 | ||||||
| 577 | Clean Harbors, Inc.* | 59,575 | ||||||
| 1,500 | Copart, Inc.* | 69,900 | ||||||
| 23,393 | HNI Corp. | 587,632 | ||||||
| 6,580 | Insperity, Inc. | 194,834 | ||||||
| 48,423 | Kelly Services, Inc. Class A* | 798,980 | ||||||
| 30,916 | Kforce, Inc.* | 404,381 | ||||||
| 25,263 | Kimball International, Inc. Class B | 162,441 | ||||||
| 19,607 | SFN Group, Inc.* | 178,228 | ||||||
| 10,824 | Steelcase, Inc. Class A | 123,285 | ||||||
| 12,564 | United Stationers, Inc. | 445,143 | ||||||
| 3,255,618 | ||||||||
Consumer Durables & Apparel – 4.4% | ||||||||
| 9,389 | Blyth, Inc. | 472,736 | ||||||
| 7,091 | Columbia Sportswear Co. | 449,569 | ||||||
| 2,729 | CSS Industries, Inc. | 57,118 | ||||||
| 3,480 | Fossil, Inc.* | 409,666 | ||||||
| 8,198 | Harman International Industries, Inc. | 373,583 | ||||||
| 18,768 | iRobot Corp.* | 662,323 | ||||||
| 26,070 | Kenneth Cole Productions, Inc. Class A* | 325,614 | ||||||
| 5,880 | Mohawk Industries, Inc.* | 352,741 | ||||||
| 17,085 | Oxford Industries, Inc. | 576,790 | ||||||
| 19,424 | Perry Ellis International, Inc.* | 490,456 | ||||||
| 12,643 | Polaris Industries, Inc. | 1,405,522 | ||||||
| 867 | Under Armour, Inc. Class A* | 67,028 | ||||||
| 1,217 | Vera Bradley, Inc.* | 46,489 | ||||||
| 5,689,635 | ||||||||
GOLDMAN SACHS VARIABLE INSURANCE TRUST STRUCTURED SMALL CAP EQUITY FUND
Schedule of Investments (continued)
June 30, 2011 (Unaudited)
| Shares | Description | Value | ||||||
Common Stocks – (continued) | ||||||||
Consumer Services – 2.9% | ||||||||
| 9,497 | Ascent Media Corp. Class A* | $ | 503,056 | |||||
| 2,512 | Biglari Holdings, Inc.* | 982,318 | ||||||
| 12,948 | Domino’s Pizza, Inc.* | 326,807 | ||||||
| 48,755 | O’Charleys, Inc.* | 356,399 | ||||||
| 22,693 | Papa John’s International, Inc.* | 754,769 | ||||||
| 1,389 | Peet’s Coffee & Tea, Inc.* | 80,145 | ||||||
| 8,048 | Pre-Paid Legal Services, Inc.* | 535,112 | ||||||
| 9,981 | Texas Roadhouse, Inc. | 175,017 | ||||||
| 3,713,623 | ||||||||
Diversified Financials – 4.9% | ||||||||
| 92,314 | Advance America, Cash Advance Centers, Inc. | 636,044 | ||||||
| 27,432 | BlackRock Kelso Capital Corp. | 246,065 | ||||||
| 6,023 | Cash America International, Inc. | 348,551 | ||||||
| 43,359 | Compass Diversified Holdings | 714,990 | ||||||
| 677 | Diamond Hill Investment Group, Inc. | 55,033 | ||||||
| 13,822 | Federated Investors, Inc. Class B(a) | 329,517 | ||||||
| 2,826 | Financial Engines, Inc.* | 73,250 | ||||||
| 9,011 | First Cash Financial Services, Inc.* | 378,372 | ||||||
| 7,909 | GAMCO Investors, Inc. Class A | 366,108 | ||||||
| 17,521 | Gladstone Capital Corp. | 161,894 | ||||||
| 3,595 | Golub Capital BDC, Inc. | 53,673 | ||||||
| 29,610 | Hercules Technology Growth Capital, Inc. | 311,497 | ||||||
| 5,467 | Intl. FCStone, Inc.* | 132,356 | ||||||
| 37,002 | NGP Capital Resources Co. | 303,416 | ||||||
| 13,762 | PHH Corp.* | 282,396 | ||||||
| 60,795 | Primus Guaranty Ltd.* | 319,174 | ||||||
| 5,589 | Safeguard Scientifics, Inc.* | 105,520 | ||||||
| 4,200 | SEI Investments Co. | 94,542 | ||||||
| 4,373 | Solar Capital Ltd. | 107,969 | ||||||
| 38,290 | TICC Capital Corp. | 367,584 | ||||||
| 13,522 | World Acceptance Corp.* | 886,638 | ||||||
| 6,274,589 | ||||||||
Energy – 7.6% | ||||||||
| 15,430 | Alon USA Energy, Inc. | 173,896 | ||||||
| 36,677 | Complete Production Services, Inc.* | 1,223,545 | ||||||
| 7,284 | Dril-Quip, Inc.* | 494,074 | ||||||
| 6,901 | Energen Corp. | 389,907 | ||||||
| 4,285 | Exterran Holdings, Inc.* | 84,972 | ||||||
| 35,329 | Frontier Oil Corp. | 1,141,480 | ||||||
| 11,401 | Petroquest Energy, Inc.* | 80,035 | ||||||
| 113,742 | Tesoro Corp.* | 2,605,829 | ||||||
| 35,286 | USEC, Inc.* | 117,855 | ||||||
| 72,658 | W&T Offshore, Inc. | 1,897,827 | ||||||
| 93,306 | Western Refining, Inc.*(a) | 1,686,039 | ||||||
| 9,895,459 | ||||||||
Food & Staples Retailing – 0.4% | ||||||||
| 8,869 | PriceSmart, Inc. | 454,359 | ||||||
| 5,800 | Susser Holdings Corp.* | 91,176 | ||||||
| 545,535 | ||||||||
Food, Beverage & Tobacco – 2.6% | ||||||||
| 42,484 | Alliance One International, Inc.* | 137,223 | ||||||
| 6,291 | Boston Beer Co., Inc. Class A* | 563,674 | ||||||
| 35,928 | Dole Food Co., Inc.*(a) | 485,746 | ||||||
| 2,211 | Flowers Foods, Inc. | 48,730 | ||||||
| 5,928 | J&J Snack Foods Corp. | 295,511 | ||||||
| 21,912 | Lancaster Colony Corp. | 1,332,688 | ||||||
| 32,278 | National Beverage Corp. | 472,873 | ||||||
| 3,336,445 | ||||||||
Health Care Equipment & Services – 7.4% | ||||||||
| 27,652 | Align Technology, Inc.* | 630,466 | ||||||
| 3,494 | Amerigroup Corp.* | 246,222 | ||||||
| 10,455 | AMN Healthcare Services, Inc.* | 86,985 | ||||||
| 21,232 | Assisted Living Concepts, Inc. Class A | 356,273 | ||||||
| 1,791 | Centene Corp.* | 63,634 | ||||||
| 1,740 | Coventry Health Care, Inc.* | 63,458 | ||||||
| 24,807 | Health Net, Inc.* | 796,057 | ||||||
| 673 | HeartWare International, Inc.* | 49,856 | ||||||
| 18,235 | Hill-Rom Holdings, Inc. | 839,539 | ||||||
| 821 | IDEXX Laboratories, Inc.* | 63,677 | ||||||
| 18,579 | Invacare Corp. | 616,637 | ||||||
| 33,498 | Kindred Healthcare, Inc.* | 719,202 | ||||||
| 7,501 | Magellan Health Services, Inc.* | 410,605 | ||||||
| 16,186 | Masimo Corp. | 480,400 | ||||||
| 9,734 | Medcath Corp.* | 132,285 | ||||||
| 23,880 | Medical Action Industries, Inc.* | 194,622 | ||||||
| 50,847 | Molina Healthcare, Inc.* | 1,378,971 | ||||||
| 33,485 | PharMerica Corp.* | 427,269 | ||||||
| 5,065 | Sirona Dental Systems, Inc.* | 268,951 | ||||||
| 28,604 | Skilled Healthcare Group, Inc. Class A* | 270,594 | ||||||
| 4,370 | STERIS Corp. | 152,863 | ||||||
| 5,323 | SXC Health Solutions Corp.* | 313,631 | ||||||
| 1,424 | Teleflex, Inc. | 86,949 | ||||||
| 32,822 | Universal American Corp. | 359,401 | ||||||
| 12,622 | Vascular Solutions, Inc.* | 156,513 | ||||||
| 9,210 | WellCare Health Plans, Inc.* | 473,486 | ||||||
| 9,638,546 | ||||||||
Household & Personal Products* – 0.9% | ||||||||
| 58,085 | Central Garden and Pet Co. Class A | 589,563 | ||||||
| 34,661 | Prestige Brands Holdings, Inc. | 445,047 | ||||||
| 4,199 | USANA Health Sciences, Inc. | 131,345 | ||||||
| 1,165,955 | ||||||||
Insurance – 1.9% | ||||||||
| 4,022 | Allied World Assurance Co. Holdings Ltd. | 231,587 | ||||||
| 17,877 | American Equity Investment Life Holding Co. | 227,217 | ||||||
| 1,479 | American Financial Group, Inc. | 52,785 | ||||||
| 34,804 | Aspen Insurance Holdings Ltd. | 895,507 | ||||||
| 25,354 | Flagstone Reinsurance Holdings SA | 213,734 | ||||||
| 4,129 | Global Indemnity PLC* | 91,581 | ||||||
| 1,436 | Kansas City Life Insurance Co. | 44,731 | ||||||
| 33,139 | Maiden Holdings Ltd. | 301,565 | ||||||
| 4,705 | OneBeacon Insurance Group Ltd. Class A | 63,000 | ||||||
GOLDMAN SACHS VARIABLE INSURANCE TRUST STRUCTURED SMALL CAP EQUITY FUND
| Shares | Description | Value | ||||||
Common Stocks – (continued) | ||||||||
Insurance – (continued) | ||||||||
| 11,579 | Symetra Financial Corp. | $ | 155,506 | |||||
| 1,318 | W.R. Berkley Corp. | 42,756 | ||||||
| 468 | White Mountains Insurance Group Ltd. | 196,635 | ||||||
| 2,516,604 | ||||||||
Materials – 5.6% | ||||||||
| 15,836 | A. Schulman, Inc. | 398,909 | ||||||
| 739 | Airgas, Inc. | 51,759 | ||||||
| 11,376 | American Vanguard Corp. | 147,547 | ||||||
| 13,458 | Clearwater Paper Corp.* | 918,912 | ||||||
| 2,346 | Domtar Corp. | 222,213 | ||||||
| 2,130 | Georgia Gulf Corp.* | 51,418 | ||||||
| 34,028 | Golden Star Resources Ltd.* | 74,862 | ||||||
| 3,537 | Innophos Holdings, Inc. | 172,606 | ||||||
| 5,967 | Kaiser Aluminum Corp. | 325,917 | ||||||
| 29,287 | KapStone Paper and Packaging Corp.* | 485,286 | ||||||
| 1,526 | Koppers Holdings, Inc. | 57,881 | ||||||
| 29,299 | Kraton Performance Polymers, Inc.* | 1,147,642 | ||||||
| 15,635 | Materion Corp.* | 578,026 | ||||||
| 23,883 | Noranda Aluminum Holding Corp.* | 361,589 | ||||||
| 7,352 | OM Group, Inc.* | 298,785 | ||||||
| 25,434 | PolyOne Corp. | 393,464 | ||||||
| 48,974 | Senomyx, Inc.* | 251,726 | ||||||
| 20,667 | Spartech Corp.* | 125,862 | ||||||
| 7,970 | Stepan Co. | 565,073 | ||||||
| 15,105 | Titanium Metals Corp. | 276,724 | ||||||
| 8,373 | TPC Group, Inc.* | 328,389 | ||||||
| 7,234,590 | ||||||||
Media – 0.3% | ||||||||
| 7,679 | Harte-Hanks, Inc. | 62,354 | ||||||
| 59,889 | Journal Communications, Inc. Class A* | 309,626 | ||||||
| 371,980 | ||||||||
Pharmaceuticals, Biotechnology & Life Sciences – 5.9% | ||||||||
| 40,564 | Accelrys, Inc.* | 288,410 | ||||||
| 89,357 | Affymetrix, Inc.* | 708,601 | ||||||
| 8,305 | Akorn, Inc.* | 58,135 | ||||||
| 25,361 | Albany Molecular Research, Inc.* | 121,986 | ||||||
| 905 | Bio-Rad Laboratories, Inc. Class A* | 108,021 | ||||||
| 7,189 | Codexis, Inc.* | 69,230 | ||||||
| 43,652 | Cubist Pharmaceuticals, Inc.* | 1,571,035 | ||||||
| 24,696 | Emergent Biosolutions, Inc.* | 556,895 | ||||||
| 18,219 | eResearchTechnology, Inc.* | 116,055 | ||||||
| 10,774 | Genomic Health, Inc.* | 300,702 | ||||||
| 38,437 | Maxygen, Inc. | 210,250 | ||||||
| 92,957 | Nabi Biopharmaceuticals* | 500,109 | ||||||
| 1,595 | Par Pharmaceutical Cos, Inc.* | 52,603 | ||||||
| 117,180 | PDL BioPharma, Inc. | 687,847 | ||||||
| 55,984 | Progenics Pharmaceuticals, Inc.* | 401,965 | ||||||
| 13,019 | Questcor Pharmaceuticals, Inc.* | 313,758 | ||||||
| 48,417 | Sciclone Pharmaceuticals, Inc.* | 292,439 | ||||||
| 14,306 | Seattle Genetics, Inc.* | 293,559 | ||||||
| 9,376 | The Medicines Co.* | 154,798 | ||||||
| 47,344 | Viropharma, Inc.* | 875,864 | ||||||
| 7,682,262 | ||||||||
Real Estate – 7.4% | ||||||||
| 10,812 | Agree Realty Corp. (REIT) | 241,432 | ||||||
| 24,991 | American Campus Communities, Inc. (REIT) | 887,680 | ||||||
| 7,460 | Ashford Hospitality Trust, Inc. (REIT) | 92,877 | ||||||
| 4,716 | Capstead Mortgage Corp. (REIT) | 63,195 | ||||||
| 16,865 | Equity Lifestyle Properties, Inc. (REIT) | 1,053,051 | ||||||
| 12,279 | Extra Space Storage, Inc. (REIT) | 261,911 | ||||||
| 4,007 | Federal Realty Investment Trust (REIT) | 341,316 | ||||||
| 41,845 | Franklin Street Properties Corp. (REIT) | 540,219 | ||||||
| 2,718 | Hatteras Financial Corp. (REIT) | 76,729 | ||||||
| 3,011 | Jones Lang LaSalle, Inc. | 283,937 | ||||||
| 11,817 | LTC Properties, Inc. (REIT) | 328,749 | ||||||
| 8,659 | MFA Financial, Inc. (REIT) | 69,618 | ||||||
| 123,176 | MPG Office Trust, Inc. (REIT)* | 352,283 | ||||||
| 6,345 | National Health Investors, Inc. (REIT) | 281,908 | ||||||
| 1,981 | National Retail Properties, Inc. (REIT) | 48,554 | ||||||
| 39,103 | Nationwide Health Properties, Inc. (REIT) | 1,619,255 | ||||||
| 1,604 | Potlatch Corp. (REIT) | 56,573 | ||||||
| 35,636 | Rayonier, Inc. (REIT) | 2,328,813 | ||||||
| 13,105 | Realty Income Corp. (REIT) | 438,887 | ||||||
| 3,323 | Senior Housing Properties Trust (REIT) | 77,792 | ||||||
| 2,625 | Starwood Property Trust, Inc. (REIT) | 53,839 | ||||||
| 4,265 | Two Harbors Investment Corp. (REIT) | 45,849 | ||||||
| 3,365 | Urstadt Biddle Properties, Inc. Class A (REIT) | 60,940 | ||||||
| 9,605,407 | ||||||||
Retailing – 5.4% | ||||||||
| 30,832 | Asbury Automotive Group, Inc.* | 571,317 | ||||||
| 11,640 | Audiovox Corp. Class A* | 87,998 | ||||||
| 7,359 | Cabela’s, Inc.* | 199,797 | ||||||
| 7,988 | Core-Mark Holding Co., Inc.* | 285,172 | ||||||
| 14,869 | DSW, Inc. Class A* | 752,520 | ||||||
| 33,394 | Fred’s, Inc. Class A | 481,875 | ||||||
| 4,823 | Genesco, Inc.* | 251,278 | ||||||
| 25,042 | Group 1 Automotive, Inc. | 1,031,230 | ||||||
| 22,446 | Lithia Motors, Inc. Class A | 440,615 | ||||||
| 1,567 | Rue21, Inc.* | 50,928 | ||||||
| 12,242 | Shoe Carnival, Inc.* | 369,096 | ||||||
| 17,563 | Sonic Automotive, Inc. Class A | 257,298 | ||||||
| 62,365 | Stage Stores, Inc. | 1,047,732 | ||||||
| 10,862 | Ulta Salon Cosmetics & Fragrance, Inc.* | 701,468 | ||||||
| 15,818 | Zumiez, Inc.* | 394,975 | ||||||
| 6,923,299 | ||||||||
Semiconductors & Semiconductor Equipment – 3.3% | ||||||||
| 10,678 | Applied Micro Circuits Corp.* | 94,607 | ||||||
| 7,015 | DSP Group, Inc.* | 61,030 | ||||||
| 249,889 | Lattice Semiconductor Corp.* | 1,629,276 | ||||||
| 28,760 | LTX-Credence Corp.* | 257,114 | ||||||
| 28,994 | Micrel, Inc. | 306,757 | ||||||
| 1,740 | MKS Instruments, Inc. | 45,971 | ||||||
| 37,506 | Photronics, Inc.* | 317,676 | ||||||
| 53,382 | PLX Technology, Inc.* | 185,236 | ||||||
| 46,093 | RF Micro Devices, Inc.* | 282,089 | ||||||
| 108,448 | Silicon Image, Inc.* | 700,574 | ||||||
GOLDMAN SACHS VARIABLE INSURANCE TRUST STRUCTURED SMALL CAP EQUITY FUND
Schedule of Investments (continued)
June 30, 2011 (Unaudited)
| Shares | Description | Value | ||||||
Common Stocks – (continued) | ||||||||
Semiconductors & Semiconductor Equipment – (continued) | ||||||||
| 6,113 | Standard Microsystems Corp.* | $ | 164,990 | |||||
| 2,467 | Tessera Technologies, Inc.* | 42,284 | ||||||
| 21,640 | Zoran Corp.* | 181,776 | ||||||
| 4,269,380 | ||||||||
Software & Services – 9.0% | ||||||||
| 6,292 | Advent Software, Inc.*(b) | 177,246 | ||||||
| 8,978 | AOL, Inc.* | 178,303 | ||||||
| 23,168 | Blackbaud, Inc. | 642,217 | ||||||
| 17,947 | Bottomline Technologies, Inc.* | 443,470 | ||||||
| 86,289 | Ciber, Inc.* | 478,904 | ||||||
| 18,590 | CommVault Systems, Inc.* | 826,326 | ||||||
| 11,209 | CSG Systems International, Inc.* | 207,142 | ||||||
| 16,745 | Kenexa Corp.* | 401,545 | ||||||
| 121,557 | Lionbridge Technologies, Inc.* | 386,551 | ||||||
| 6,352 | LivePerson, Inc.* | 89,817 | ||||||
| 17,649 | LogMeIn, Inc.* | 680,722 | ||||||
| 79,406 | Magma Design Automation, Inc.* | 634,454 | ||||||
| 20,179 | Manhattan Associates, Inc.* | 694,965 | ||||||
| 55,638 | Marchex, Inc. Class B | 494,065 | ||||||
| 23,702 | Mentor Graphics Corp.* | 303,623 | ||||||
| 10,493 | MicroStrategy, Inc. Class A* | 1,707,001 | ||||||
| 2,341 | NeuStar, Inc. Class A* | 61,334 | ||||||
| 5,863 | Opnet Technologies, Inc. | 240,031 | ||||||
| 15,125 | PROS Holdings, Inc.* | 264,536 | ||||||
| 7,469 | QAD, Inc. Class A* | 76,333 | ||||||
| 13,245 | Quest Software, Inc.* | 301,059 | ||||||
| 99,910 | RealNetworks, Inc.* | 339,694 | ||||||
| 25,007 | Renaissance Learning, Inc. | 313,588 | ||||||
| 15,437 | Saba Software, Inc.* | 139,396 | ||||||
| 4,884 | SRA International, Inc. Class A* | 151,013 | ||||||
| 8,794 | TeleTech Holdings, Inc.* | 185,378 | ||||||
| 13,969 | Ultimate Software Group, Inc.* | 760,333 | ||||||
| 7,645 | VeriFone Systems, Inc.* | 339,056 | ||||||
| 1,205 | VistaPrint NV* | 57,659 | ||||||
| 2,117 | Websense, Inc.* | 54,979 | ||||||
| 11,630,740 | ||||||||
Technology Hardware & Equipment – 5.3% | ||||||||
| 16,911 | Agilysys, Inc.* | 141,038 | ||||||
| 3,300 | Aruba Networks, Inc.* | 97,515 | ||||||
| 41,074 | Brightpoint, Inc.* | 333,110 | ||||||
| 3,844 | DG FastChannel, Inc.* | 123,200 | ||||||
| 11,946 | EchoStar Corp. Class A* | 435,193 | ||||||
| 22,783 | Electronics for Imaging, Inc.* | 392,323 | ||||||
| 3,145 | EMS Technologies, Inc.* | 103,691 | ||||||
| 8,031 | Emulex Corp.* | 69,067 | ||||||
| 56,040 | Extreme Networks* | 181,570 | ||||||
| 20,500 | Gerber Scientific, Inc.* | 228,165 | ||||||
| 18,417 | Hypercom Corp.* | 181,039 | ||||||
| 38,302 | Imation Corp.* | 361,571 | ||||||
| 12,472 | Ingram Micro, Inc. Class A* | 226,242 | ||||||
| 19,606 | Insight Enterprises, Inc.* | 347,222 | ||||||
| 32,835 | Methode Electronics, Inc. | 381,214 | ||||||
| 4,602 | National Instruments Corp. | 136,633 | ||||||
| 14,692 | Plantronics, Inc. | 536,699 | ||||||
| 28,360 | Powerwave Technologies, Inc.* | 83,662 | ||||||
| 165,434 | Quantum Corp.* | 545,932 | ||||||
| 21,771 | Radisys Corp.* | 158,711 | ||||||
| 36,456 | ShoreTel, Inc.* | 371,851 | ||||||
| 9,391 | Super Micro Computer, Inc.* | 151,101 | ||||||
| 30,589 | Symmetricom, Inc.* | 178,334 | ||||||
| 2,200 | Synaptics, Inc.*(a) | 56,628 | ||||||
| 32,503 | Tellabs, Inc. | 149,839 | ||||||
| 54,500 | Vishay Intertechnology, Inc.* | 819,680 | ||||||
| 5,085 | Vishay Precision Group, Inc.* | 85,835 | ||||||
| 6,877,065 | ||||||||
Telecommunication Services – 1.1% | ||||||||
| 17,985 | Cbeyond, Inc.* | 237,942 | ||||||
| 15,884 | IDT Corp. Class B | 429,186 | ||||||
| 51,313 | USA Mobility, Inc. | 783,036 | ||||||
| 1,450,164 | ||||||||
Transportation – 2.3% | ||||||||
| 10,181 | Alaska Air Group, Inc.* | 696,991 | ||||||
| 4,228 | Allegiant Travel Co.* | 209,286 | ||||||
| 8,796 | Celadon Group, Inc.* | 122,792 | ||||||
| 756 | Copa Holdings SA Class A | 50,455 | ||||||
| 9,461 | Heartland Express, Inc. | 156,674 | ||||||
| 2,560 | Landstar System, Inc. | 118,989 | ||||||
| 83,110 | Pacer International, Inc.* | 392,279 | ||||||
| 7,676 | Saia, Inc.* | 130,108 | ||||||
| 22,962 | SkyWest, Inc. | 345,808 | ||||||
| 7,243 | Universal Truckload Services, Inc.* | 124,073 | ||||||
| 26,635 | Werner Enterprises, Inc. | 667,207 | ||||||
| 3,014,662 | ||||||||
Utilities – 2.8% | ||||||||
| 2,634 | Alliant Energy Corp. | 107,098 | ||||||
| 8,674 | Atmos Energy Corp. | 288,410 | ||||||
| 3,935 | DPL, Inc. | 118,680 | ||||||
| 11,507 | Dynegy, Inc.* | 71,228 | ||||||
| 2,920 | El Paso Electric Co. | 94,316 | ||||||
| 1,038 | IDACORP, Inc. | 41,001 | ||||||
| 8,815 | Integrys Energy Group, Inc. | 456,970 | ||||||
| 658 | ITC Holdings Corp. | 47,225 | ||||||
| 1,041 | Nicor, Inc. | 56,984 | ||||||
| 6,980 | Northeast Utilities | 245,487 | ||||||
| 1,074 | NSTAR | 49,383 | ||||||
| 3,209 | NV Energy, Inc. | 49,258 | ||||||
| 10,519 | Pepco Holdings, Inc. | 206,488 | ||||||
| 26,088 | PNM Resources, Inc. | 436,713 | ||||||
| 18,257 | Portland General Electric Co. | 461,537 | ||||||
| 1,508 | SCANA Corp. | 59,370 | ||||||
| 15,970 | Southwest Gas Corp. | 616,602 | ||||||
| 2,861 | TECO Energy, Inc. | 54,044 | ||||||
| 2,589 | Westar Energy, Inc. | 69,670 | ||||||
| 1,856 | WGL Holdings, Inc. | 71,437 | ||||||
| 3,601,901 | ||||||||
TOTAL COMMON STOCKS | ||||||||
(Cost $89,819,270) | $ | 126,639,367 | ||||||
GOLDMAN SACHS VARIABLE INSURANCE TRUST STRUCTURED SMALL CAP EQUITY FUND
| Shares | Rate | Value | ||||||||
Short-term Investment(c) – 2.3% | ||||||||||
| JPMorgan U.S. Government Money Market Fund — Capital Shares | ||||||||||
| 2,938,019 | 0.010 | % | $ | 2,938,019 | ||||||
(Cost $2,938,019) | ||||||||||
TOTAL INVESTMENTS BEFORE SECURITIES LENDING REINVESTMENT VEHICLE | ||||||||||
(Cost $92,757,289) | $ | 129,577,386 | ||||||||
Securities Lending Reinvestment Vehicle(c)(d) – 2.2% | ||||||||||
| Goldman Sachs Financial Square Money Market Fund — FST Shares | ||||||||||
| 2,887,450 | 0.099 | % | $ | 2,887,450 | ||||||
(Cost $2,887,450) | ||||||||||
TOTAL INVESTMENTS – 102.2% | ||||||||||
(Cost $95,644,739) | $ | 132,464,836 | ||||||||
LIABILITIES IN EXCESS OF OTHER ASSETS – (2.2)% | (2,896,137 | ) | ||||||||
NET ASSETS – 100.0% | $ | 129,568,699 | ||||||||
The percentage shown for each investment category reflects the value of investments in that category as a percentage of net assets.
| * | Non-income producing security. | |
| (a) | All or a portion of security is on loan. | |
| (b) | All or a portion of security is segregated as collateral for initial margin requirements on futures transactions. | |
| (c) | Variable rate security. Interest rate disclosed is that which is in effect at June 30, 2011. | |
| (d) | Represents an affiliated issuer. |
Investment Abbreviation: | ||||
| REIT | — | Real Estate Investment Trust | ||
| ADDITIONAL INVESTMENT INFORMATION |
FUTURES CONTRACTS — At June 30, 2011, the following futures contracts were open:
| Number of | ||||||||||||||
| Contracts | Expiration | Current | Unrealized | |||||||||||
| Type | Long (Short) | Date | Value | Gain (Loss) | ||||||||||
| Russell 2000 Mini Index | 32 | September 2011 | $ | 2,641,280 | $ | 164,270 | ||||||||
GOLDMAN SACHS VARIABLE INSURANCE TRUST STRUCTURED SMALL CAP EQUITY FUND
Statement of Assets and Liabilities
June 30, 2011 (Unaudited)
Assets: | ||||
Investments in securities of unaffiliated issuers, at value (identified cost $92,757,289)(a) | $ | 129,577,386 | ||
| Investments in affiliated securities lending reinvestment vehicle, at value (identified cost $2,887,450) | 2,887,450 | |||
| Receivables: | ||||
| Investment securities sold | 927,807 | |||
| Dividends | 92,314 | |||
| Due from custodian | 48,102 | |||
| Due from broker — variation margin | 20,800 | |||
| Fund shares sold | 16,769 | |||
| Reimbursement from investment adviser | 13,789 | |||
| Securities lending income | 1,492 | |||
| Other assets | 948 | |||
Total assets | 133,586,857 | |||
Liabilities: | ||||
| Payables: | ||||
| Payable upon return of securities loaned | 2,887,450 | |||
| Investment securities purchased | 802,211 | |||
| Fund shares redeemed | 161,054 | |||
| Amounts owed to affiliates | 82,777 | |||
| Accrued expenses | 84,666 | |||
Total liabilities | 4,018,158 | |||
Net Assets: | ||||
| Paid-in capital | 126,900,469 | |||
| Accumulated undistributed net investment income | 963,168 | |||
| Accumulated net realized loss from investment and futures transactions | (35,279,305 | ) | ||
| Net unrealized gain on investments and futures | 36,984,367 | |||
NET ASSETS | $ | 129,568,699 | ||
| Net Assets: | ||||
| Institutional | $ | 103,612,085 | ||
| Service | 25,956,614 | |||
| Total Net Assets | $ | 129,568,699 | ||
| Shares of beneficial interest outstanding $0.001 par value (unlimited shares authorized): | ||||
| Institutional | 8,349,506 | |||
| Service | 2,103,394 | |||
| Net asset value, offering and redemption price per share: | ||||
| Institutional | $12.41 | |||
| Service | 12.34 | |||
| (a) | Includes loaned securities having a market value of $2,850,253. |
GOLDMAN SACHS VARIABLE INSURANCE TRUST STRUCTURED SMALL CAP EQUITY FUND
Statement of Operations
For the Six Months Ended June 30, 2011 (Unaudited)
Investment income: | ||||
| Dividends | $ | 800,407 | ||
| Securities lending income — affiliated issuer | 14,917 | |||
Total investment income | 815,324 | |||
Expenses: | ||||
| Management fees | 493,991 | |||
| Printing and mailing costs | 39,852 | |||
| Professional fees | 39,245 | |||
| Distribution and Service fees — Service Class | 33,129 | |||
| Custody and accounting fees | 26,446 | |||
Transfer Agent fees(a) | 13,172 | |||
| Trustee fees | 8,255 | |||
| Registration fees | 667 | |||
| Other | 5,778 | |||
Total expenses | 660,535 | |||
| Less — expense reductions | (71,623 | ) | ||
Net expenses | 588,912 | |||
NET INVESTMENT INCOME | 226,412 | |||
Realized and unrealized gain from investment and futures transactions: | ||||
| Net realized gain from: | ||||
| Investment transactions | 6,598,090 | |||
| Futures transactions | 70,028 | |||
| Net change in unrealized gain on: | ||||
| Investments | 3,895,384 | |||
| Futures | 129,562 | |||
Net realized and unrealized gain from investment and futures transactions | 10,693,064 | |||
NET INCREASE IN NET ASSETS RESULTING FROM OPERATIONS | $ | 10,919,476 | ||
| (a) | Institutional and Service Shares had Transfer Agent fees of $10,522 and $2,650, respectively. |
GOLDMAN SACHS VARIABLE INSURANCE TRUST STRUCTURED SMALL CAP EQUITY FUND
Statements of Changes in Net Assets
| For the | For the | |||||||
| Six Months Ended | Fiscal Year Ended | |||||||
| June 30, 2011 (Unaudited) | December 31, 2010 | |||||||
From operations: | ||||||||
| Net investment income | $ | 226,412 | $ | 937,448 | ||||
| Net realized gain from investment and futures transactions | 6,668,118 | 11,300,293 | ||||||
| Net change in unrealized gain on investments and futures | 4,024,946 | 20,038,541 | ||||||
Net increase in net assets resulting from operations | 10,919,476 | 32,276,282 | ||||||
Distributions to shareholders: | ||||||||
| From net investment income | ||||||||
| Institutional Shares | — | (529,767 | ) | |||||
| Service Shares | — | (77,675 | ) | |||||
Total distributions to shareholders | — | (607,442 | ) | |||||
From share transactions: | ||||||||
| Proceeds from sales of shares | 5,532,558 | 16,035,389 | ||||||
| Reinvestment of distributions | — | 607,442 | ||||||
| Cost of shares redeemed | (20,957,610 | ) | (32,863,054 | ) | ||||
Net decrease in net assets resulting from share transactions | (15,425,052 | ) | (16,220,223 | ) | ||||
TOTAL INCREASE (DECREASE) | (4,505,576 | ) | 15,448,617 | |||||
Net assets: | ||||||||
| Beginning of period | 134,074,275 | 118,625,658 | ||||||
| End of period | $ | 129,568,699 | $ | 134,074,275 | ||||
Accumulated undistributed net investment income | $ | 963,168 | $ | 736,756 | ||||
GOLDMAN SACHS VARIABLE INSURANCE TRUST STRUCTURED SMALL CAP EQUITY FUND
Financial Highlights
Selected Data for a Share Outstanding Throughout Each Period
| Income (loss) from | ||||||||||||||||||||||||||||||||||||||||||||||||||||||||||
| investment operations | Distributions to shareholders | |||||||||||||||||||||||||||||||||||||||||||||||||||||||||
| Net | | Ratio of | Ratio of | |||||||||||||||||||||||||||||||||||||||||||||||||||||||
| Net asset | realized | From | Net asset | Net assets, | Ratio of | total | net investment | |||||||||||||||||||||||||||||||||||||||||||||||||||
| value, | Net | and | Total from | From net | net | value, | end of | net expenses | expenses | income | Portfolio | |||||||||||||||||||||||||||||||||||||||||||||||
| beginning | investment | unrealized | investment | investment | realized | Total | end of | Total | period | to average | to average | to average | turnover | |||||||||||||||||||||||||||||||||||||||||||||
| Year - Share Class | of period | income | gain (loss) | operations | income | gains | distributions | period | return(a) | (in 000s) | net assets | net assets | net assets | rate | ||||||||||||||||||||||||||||||||||||||||||||
FOR THE SIX MONTHS ENDED JUNE 30, (UNAUDITED) | ||||||||||||||||||||||||||||||||||||||||||||||||||||||||||
| 2011 - Institutional | $ | 11.42 | $ | 0.02 | (b) | $ | 0.97 | $ | 0.99 | $ | — | $ | — | $ | — | $ | 12.41 | 8.67 | % | $ | 103,612 | 0.84 | %(c) | 0.95 | %(c) | 0.39 | %(c) | 11 | % | |||||||||||||||||||||||||||||
| 2011 - Service | 11.37 | 0.01 | (b) | 0.96 | 0.97 | — | — | — | 12.34 | 8.53 | 25,957 | 1.09 | (c) | 1.20 | (c) | 0.14 | (c) | 11 | ||||||||||||||||||||||||||||||||||||||||
FOR THE FISCAL YEARS ENDED DECEMBER 31, | ||||||||||||||||||||||||||||||||||||||||||||||||||||||||||
| 2010 - Institutional | 8.82 | 0.08 | (b)(d) | 2.58 | 2.66 | (0.06 | ) | — | (0.06 | ) | 11.42 | 30.12 | 106,646 | 0.85 | 0.97 | 0.82 | (d) | 63 | ||||||||||||||||||||||||||||||||||||||||
| 2010 - Service | 8.78 | 0.06 | (b)(d) | 2.56 | 2.62 | (0.03 | ) | — | (0.03 | ) | 11.37 | 29.86 | 27,428 | 1.10 | 1.22 | 0.58 | (d) | 63 | ||||||||||||||||||||||||||||||||||||||||
| 2009 - Institutional | 6.98 | 0.08 | (b)(e) | 1.85 | 1.93 | (0.09 | ) | — | (0.09 | ) | 8.82 | 27.67 | 95,334 | 0.86 | 1.02 | 1.03 | (e) | 212 | ||||||||||||||||||||||||||||||||||||||||
| 2009 - Service | 6.96 | 0.07 | (b)(e) | 1.83 | 1.90 | (0.08 | ) | — | (0.08 | ) | 8.78 | 27.26 | 23,291 | 1.11 | 1.27 | 0.83 | (e) | 212 | ||||||||||||||||||||||||||||||||||||||||
| 2008 - Institutional | 10.71 | 0.09 | (f) | (3.74 | ) | (3.65 | ) | (0.06 | ) | (0.02 | ) | (0.08 | ) | 6.98 | (33.95 | ) | 86,253 | 0.86 | 1.06 | 0.85 | (f) | 189 | ||||||||||||||||||||||||||||||||||||
| 2008 - Service | 10.71 | 0.06 | (f) | (3.73 | ) | (3.67 | ) | (0.06 | ) | (0.02 | ) | (0.08 | ) | 6.96 | (34.16 | ) | 6,464 | 1.11 | 1.31 | 1.92 | (f) | 189 | ||||||||||||||||||||||||||||||||||||
| 2007 - Institutional | 14.44 | 0.07 | (b)(g) | (2.42 | ) | (2.35 | ) | (0.05 | ) | (1.33 | ) | (1.38 | ) | 10.71 | (16.48 | ) | 152,896 | 0.90 | (h) | 0.95 | (h) | 0.49 | (g)(h) | 163 | ||||||||||||||||||||||||||||||||||
| 2007 - Service (Commenced August 31, 2007) | 12.81 | 0.02 | (b) | (0.74 | ) | (0.72 | ) | (0.05 | ) | (1.33 | ) | (1.38 | ) | 10.71 | (5.86 | ) | 10 | 0.96 | (c) | 1.21 | (c) | 0.56 | (c) | 163 | ||||||||||||||||||||||||||||||||||
| 2006 - Institutional | 13.93 | 0.07 | (b) | 1.64 | 1.71 | (0.10 | ) | (1.10 | ) | (1.20 | ) | 14.44 | 12.27 | 202,929 | 0.87 | 0.99 | 0.49 | 133 | ||||||||||||||||||||||||||||||||||||||||
| (a) | Assumes investment at the net asset value at the beginning of the period, reinvestment of all distributions, and a complete redemption of the investment at the net asset value at the end of the period. Total returns for periods less than one full year are not annualized. | |
| (b) | Calculated based on the average shares outstanding methodology. | |
| (c) | Annualized. | |
| (d) | Reflects income recognized from non-recurring special dividends which amounted to $0.04 per share and 0.43% of average net assets. | |
| (e) | Reflects income recognized from non-recurring special dividends which amounted to $0.03 per share and 0.43% of average net assets. | |
| (f) | Reflects income recognized from non-recurring special dividends which amounted to $0.01 per share and 0.14% of average net assets. | |
| (g) | Reflects income recognized from non-recurring special dividends which amounted to $0.02 per share and 0.14% of average net assets. | |
| (h) | Includes non-recurring expense for a special shareholder meeting, which amounted to approximately 0.03% of average net assets. |
15
GOLDMAN SACHS VARIABLE INSURANCE TRUST STRUCTURED SMALL CAP EQUITY FUND
Notes to Financial Statements
June 30, 2011 (Unaudited)
| 1. ORGANIZATION |
Goldman Sachs Variable Insurance Trust (the “Trust” or “VIT”) is a Delaware statutory trust registered under the Investment Company Act of 1940, as amended (the “Act”), as an open-end management investment company. The Trust includes the Goldman Sachs Structured Small Cap Equity Fund (the “Fund”). The Fund is a diversified portfolio under the Act offering two classes of shares — Institutional and Service.
Goldman Sachs Asset Management, L.P. (“GSAM”), an affiliate of Goldman, Sachs & Co. (“Goldman Sachs”), serves as investment adviser to the Fund pursuant to a management agreement (the “Agreement”) with the Trust.
| 2. SIGNIFICANT ACCOUNTING POLICIES |
The following is a summary of the significant accounting policies consistently followed by the Fund. The preparation of financial statements in conformity with accounting principles generally accepted in the United States of America (“GAAP”) requires management to make estimates and assumptions that may affect the amounts and disclosures in the financial statements. Actual results could differ from those estimates and assumptions.
A. Investment Valuation — The investment valuation policy of the Fund is to value investments at market value. Investments in equity securities and investment companies traded on a United States (“U.S.”) securities exchange or the NASDAQ system are valued daily at their last sale price or official closing price on the principal exchange or system on which they are traded. If no sale occurs, such securities and investment companies are valued at the last bid price for long positions and at the last ask price for short positions. Debt securities for which market quotations are readily available are valued on the basis of quotations furnished by an independent pricing service approved by the trustees or provided by securities dealers. The pricing services may use valuation models or matrix pricing, which consider: (i) yield or price with respect to bonds that are considered comparable in characteristics such as rating, interest rate and maturity date or (ii) quotations from securities dealers to determine current value. If accurate quotations are not readily available, or if GSAM believes that such quotations do not accurately reflect fair value, the fair value of the Fund’s investments may be determined based on yield equivalents, a pricing matrix or other sources, under valuation procedures established by the trustees. Unlisted equity securities for which market quotations are available are valued at the last sale price on the valuation date, or if no sale occurs, at the last bid price. In the absence of market quotations, broker quotes will be utilized or the security will be fair valued. Investments in investment companies (other than those that are exchange traded) are valued at the net asset value per share (“NAV”) of the investment company on the valuation date. Short-term debt obligations that mature in sixty days or less and that do not exhibit signs of credit deterioration are valued at amortized cost, which approximates market value.
GSAM, consistent with its procedures and applicable regulatory guidance, may make an adjustment to the previous closing prices of either domestic or foreign securities in light of significant events to reflect what it believes to be the fair value of the securities at the time of determining the Fund’s NAV. Significant events that could affect a large number of securities in a particular market may include, but are not limited to: situations relating to one or more single issuers in a market sector; significant fluctuations in U.S. or foreign markets; market dislocations; market disruptions or market closings; equipment failures; natural or man-made disasters or acts of God; armed conflicts; government actions or other developments; as well as the same or similar events which may affect specific issuers or the securities markets even though not tied directly to the securities markets. Other significant events that could relate to a single issuer may include, but are not limited to: corporate actions such as reorganizations, mergers and buy-outs; corporate announcements, including those relating to earnings, products and regulatory news; significant litigation; low trading volume; and trading limits or suspensions.
B. Security and Fund Share Transactions, and Investment Income — Security and Fund share transactions are reflected for financial reporting purposes as of the trade date, which may cause the NAV as stated in the accompanying financial statements to be different than the NAV applied to Fund share transactions. Realized gains and losses on sales of portfolio securities are calculated using the identified cost basis. Dividend income is recognized on the ex-dividend date, net of foreign withholding taxes, if any, which are reduced by any amounts reclaimable by the Fund, where applicable. Certain dividends from foreign securities will be recorded when the Fund is informed of the dividend, if such information is obtained subsequent to the ex-dividend date.
GOLDMAN SACHS VARIABLE INSURANCE TRUST STRUCTURED SMALL CAP EQUITY FUND
| 2. SIGNIFICANT ACCOUNTING POLICIES (continued) |
Interest income is recorded on the basis of interest accrued, premium amortized and discount accreted. In addition, it is the Fund’s policy to accrue for foreign capital gains taxes, if applicable, on certain foreign securities held by the Fund. An estimated foreign capital gains tax is recorded daily on net unrealized gains on these securities and is payable upon the sale of such securities when a gain is realized.
Investment income and unrealized and realized gains or losses are allocated daily to each class of shares of the Fund based upon the relative proportion of net assets of each class.
In addition, distributions received from the Fund’s investments in U.S. real estate investment trusts (“REITs”) often include a “return of capital”, which is recorded by the Fund as a reduction of the cost basis of the securities held. The Internal Revenue Code of 1986, as amended (the “Code”) requires a REIT to distribute at least 95% of its taxable income to investors. In many cases, however, because of “non-cash” expenses such as property depreciation, a REIT’s cash flow will exceed its taxable income. The REIT may distribute this excess cash to offer a more competitive yield. This portion of the Fund’s distributions is deemed a return of capital and is generally not taxable to shareholders.
C. Expenses — Expenses incurred by the Fund, which may not specifically relate to the Fund, may be shared with other registered investment companies having management agreements with GSAM or its affiliates, as appropriate. These expenses are allocated to the Fund on a straight-line and/or pro-rata basis depending upon the nature of the expenses and are accrued daily. Non-class specific expenses are allocated daily to each share class of the respective Fund based upon the relative proportion of net assets of each class. Class specific expenses, where applicable, are borne by the respective share classes and include Distribution and Service, and Transfer Agent fees.
D. Federal Taxes and Distributions to Shareholders — It is the Fund’s policy to comply with the requirements of the Code, applicable to regulated investment companies (mutual funds) and to distribute each year substantially all of its investment company taxable income and capital gains to its shareholders. Accordingly, the Fund is not required to make any provisions for the payment of federal income tax. Distributions to shareholders are recorded on the ex-dividend date. Income and capital gains distributions, if any, are declared and paid annually.
Net capital losses are carried forward to future fiscal years and may be used to the extent allowed by the Code to offset any future capital gains. Utilization of capital loss carryforwards will reduce the requirement of future capital gains distributions.
The characterization of distributions to shareholders for financial reporting purposes is determined in accordance with federal income tax rules, which may differ from GAAP. The source of the Fund’s distributions may be shown in the accompanying financial statements as either from net investment income, net realized gain or capital. Certain components of the Fund’s net assets on the Statement of Assets and Liabilities reflect permanent GAAP/tax differences based on the appropriate tax character.
E. Futures Contracts — Futures contracts are valued at the last settlement price, or in the absence of a sale, the last bid price, at the end of each day on the board of trade or exchange upon which they are traded. Upon entering into a futures contract, the Fund deposits cash or securities in an account on behalf of the broker in an amount sufficient to meet the initial margin requirement. Subsequent payments are made or received by the Fund equal to the daily change in the contract value and are recorded as variation margin receivable or payable with a corresponding offset in unrealized gains or losses. The Fund recognizes a realized gain or loss when a contract is closed or expires.
The use of futures contracts involves, to varying degrees, elements of market and counterparty risk which may exceed the amounts recognized in the Statement of Assets and Liabilities. Futures contracts may be illiquid, and exchanges may limit fluctuations in futures contract prices during a single day. Changes in the value of a futures contract may not directly correlate with changes in the value of the underlying securities. These risks may decrease the effectiveness of the Fund’s strategies and potentially result in a loss. The Fund must set aside liquid assets, or engage in other appropriate measures, to cover its obligations under these contracts.
GOLDMAN SACHS VARIABLE INSURANCE TRUST STRUCTURED SMALL CAP EQUITY FUND
Notes to Financial Statements (continued)
June 30, 2011 (Unaudited)
| 3. FAIR VALUE OF INVESTMENTS |
The fair value of a financial instrument is the amount that would be received to sell an asset or paid to transfer a liability in an orderly transaction between market participants at the measurement date (i.e., the exit price). GAAP establishes a fair value hierarchy that prioritizes the inputs to valuation techniques used to measure fair value. The hierarchy gives the highest priority to unadjusted quoted prices in active markets for identical assets or liabilities (Level 1 measurements) and the lowest priority to unobservable inputs (Level 3 measurements). The three levels of the fair value hierarchy are described below:
Level 1 — Unadjusted quoted prices in active markets that are accessible at the measurement date for identical, unrestricted assets or liabilities;
Level 2 — Quoted prices in markets that are not active or financial instruments for which significant inputs are observable (including, but not limited to, quoted prices for similar securities, interest rates, foreign exchange rates, volatility and credit spreads), either directly or indirectly;
Level 3 — Prices or valuations that require significant unobservable inputs (including GSAM’s assumptions in determining fair value measurement).
The following is a summary of the Fund’s investments and derivatives categorized in the fair value hierarchy as of June 30, 2011:
| Investment Type | Level 1 | Level 2 | Level 3 | |||||||||
Assets | ||||||||||||
Common Stock and/or Other Equity Investments | $ | 126,639,367 | $ | — | $ | — | ||||||
| Short-term Investment | 2,938,019 | — | — | |||||||||
| Securities Lending Reinvestment Vehicle | 2,887,450 | — | — | |||||||||
Total | $ | 132,464,836 | $ | — | $ | — | ||||||
Derivatives Type | ||||||||||||
Assets | ||||||||||||
Futures Contracts(a) | $ | 164,270 | $ | — | $ | — | ||||||
| (a) | Amount shown represents unrealized gain (loss) at period end. |
| 4. INVESTMENTS IN DERIVATIVES |
The Fund may make investments in derivative instruments, including, but not limited to options, futures, swaps, swaptions and other derivatives relating to foreign currency transactions. A derivative is an instrument whose value is derived from underlying assets, indices, reference rates or a combination of these factors. Derivative instruments may be privately negotiated contracts (often referred to as over the counter (“OTC”) derivatives) or they may be listed and traded on an exchange. Derivative contracts may involve future commitments to purchase or sell financial instruments or commodities at specified terms on a specified date, or to exchange interest payment streams or currencies based on a notional or contractual amount. Derivative instruments may involve a high degree of financial risk. The use of derivatives also involves the risk of loss if the investment adviser is incorrect in its expectation of the timing or level of fluctuations in securities prices, interest rates or currency prices. Investments in derivative instruments also include the risk of default by the counterparty, the risk that the investment may not be liquid and the risk that a small movement in the price of the underlying security or benchmark may result in a disproportionately large movement, unfavorable or favorable, in the price of the derivative instrument.
During the six months ended June 30, 2011, the Fund entered into futures contracts. These instruments were used to meet the Fund’s investment objectives and to obtain and/or manage exposure related to the risks below. The following table sets forth, by certain risk types, the gross value of these derivative contracts for trading activities as of June 30, 2011. The values in the table below exclude the effects of cash collateral received or posted pursuant to these derivative contracts, and therefore are not representative of the Fund’s net exposure.
GOLDMAN SACHS VARIABLE INSURANCE TRUST STRUCTURED SMALL CAP EQUITY FUND
| 4. INVESTMENTS IN DERIVATIVES (continued) |
| Statement of | ||||||||
| Assets and Liabilities | ||||||||
| Risk | Location | Assets(a) | ||||||
| Equity | Due from broker — variation margin | $ | 164,270 | |||||
| (a) | Includes unrealized gain (loss) on futures contracts described in the Additional Investment Information section of the Schedule of Investments. Only current day’s variation margin is reported within the Statement of Assets and Liabilities. |
The following table sets forth, by certain risk types, the Fund’s gains (losses) related to these derivatives and their indicative volumes for the six months ended June 30, 2011. These gains (losses) should be considered in the context that these derivative contracts may have been executed to economically hedge certain securities, and accordingly, certain gains (losses) on such derivative contracts may offset certain (losses) gains attributable to securities. These gains (losses) are included in “Net realized gain (loss)” or “Net change in unrealized gain (loss)” on the Statement of Operations:
| Net | Net Change in | Average | |||||||||||||
| Realized | Unrealized | Number of | |||||||||||||
| Risk | Statement of Operations Location | Gain (Loss) | Gain (Loss) | Contracts(a) | |||||||||||
| Equity | Net realized gain (loss) from futures transactions/Net change in unrealized gain (loss) on futures | $ | 70,028 | $ | 129,562 | 31 | |||||||||
| (a) | Average number of contracts is based on the average of month end balances for the six months ended June 30, 2011. |
| 5. AGREEMENTS AND AFFILIATED TRANSACTIONS |
A. Management Agreement — Under the Agreement, GSAM manages the Fund, subject to the general supervision of the trustees.
As compensation for the services rendered pursuant to the Agreement, the assumption of the expenses related thereto and administration of the Fund’s business affairs, including providing facilities, GSAM is entitled to a management fee, accrued daily and paid monthly, equal to an annual percentage rate of the Fund’s average daily net assets.
For the six months ended June 30, 2011, contractual and effective net management fees with GSAM were at the following rates:
| Contractual Management Rate | ||||||||||||||||||||
| First | Next | Next | Over | Effective | Effective Net | |||||||||||||||
| $2 billion | $3 billion | $3 billion | $8 billion | Rate | Management Rate | |||||||||||||||
| 0.75% | 0.68 | % | 0.65 | % | 0.64 | % | 0.75 | % | 0.73 | %* | ||||||||||
| * | Effective June 30, 2011, GSAM agreed to waive a portion of its management fee in order to achieve an effective net management rate of 0.70% through at least April 29, 2012. Prior to such date GSAM may not terminate the arrangement without the approval of the trustees. Prior to June 30, 2011, GSAM had agreed to waive a portion of its management fee in order to achieve an effective net management rate of 0.73%. For the six months ended June 30, 2011, GSAM waived approximately $13,300 of the Fund’s management fee. |
B. Distribution and Service Plan — The Trust, on behalf of the Service Shares of the Fund, has adopted a Distribution and Service Plan (the “Plan”). Under the Plan, Goldman Sachs, which serves as distributor, is entitled to a fee accrued daily and paid monthly for distribution services, which may then be paid by Goldman Sachs to authorized dealers, equal to, on an annual basis, 0.25% of the Fund’s average daily net assets attributable to Service Shares.
C. Transfer Agency Agreement — Goldman Sachs also serves as the transfer agent of the Fund for a fee pursuant to a Transfer Agency Agreement. The fees charged for such transfer agency services are accrued daily and paid monthly at an annual rate of 0.02% of the average daily net assets for Institutional and Service Shares.
GOLDMAN SACHS VARIABLE INSURANCE TRUST STRUCTURED SMALL CAP EQUITY FUND
Notes to Financial Statements (continued)
June 30, 2011 (Unaudited)
| 5. AGREEMENTS AND AFFILIATED TRANSACTIONS (continued) |
D. Other Expense Agreements and Affiliated Transactions — GSAM has agreed to limit certain “Other Expense” of the Fund (excluding management fees, distribution and service fees, transfer agent fees and expenses, taxes, interest, brokerage fees and litigation, indemnification, shareholder meetings and other extraordinary expenses, exclusive of any custody and transfer agent fee credit reductions) to the extent such expenses exceed, on an annual basis, 0.094% of the average daily net assets of the Fund. Such Other Expense reimbursements, if any, are accrued daily and paid monthly. In addition, the Fund is not obligated to reimburse GSAM for prior fiscal year expense reimbursements, if any. These Other Expense reimbursements will remain in place through at least April 29, 2012, and prior to such date GSAM may not terminate the arrangements without the approval of the trustees. For the six months ended June 30, 2011, GSAM reimbursed approximately $58,300 to the Fund.
As of June 30, 2011, the amounts owed to affiliates were approximately $75,600, $5,100 and $2,100 for management, distribution and service, and transfer agent fees, respectively.
E. Line of Credit Facility — As of June 30, 2011, the Fund participated in a $580,000,000 committed, unsecured revolving line of credit facility (the “facility”) together with other funds of the Trust and registered investment companies having management agreements with GSAM or its affiliates. Pursuant to the terms of the facility, the Fund and other borrowers could increase the credit amount by an additional $340,000,000, for a total of up to $920,000,000. This facility is to be used solely for temporary or emergency purposes. The interest rate on borrowings is based on the federal funds rate. The facility also requires a fee to be paid by the Fund based on the amount of the commitment that has not been utilized. For the six months ended June 30, 2011, the Fund did not have any borrowings under the facility.
F. Other Transactions with Affiliates — For the six months ended June 30, 2011, Goldman Sachs earned approximately $300 in brokerage commissions from portfolio transactions, including futures transactions executed with Goldman Sachs as the Futures Commission Merchant, on behalf of the Fund.
| 6. PORTFOLIO SECURITIES TRANSACTIONS |
The cost of purchases and proceeds from sales and maturities of long-term securities for the six months ended June 30, 2011, were $13,879,763 and $27,824,303, respectively.
| 7. SECURITIES LENDING |
Pursuant to exemptive relief granted by the Securities and Exchange Commission (“SEC”) and the terms and conditions contained therein, the Fund may lend its securities through a securities lending agent, Goldman Sachs Agency Lending (“GSAL”), a wholly-owned subsidiary of Goldman Sachs, to certain qualified borrowers including Goldman Sachs and affiliates. In accordance with the Fund’s securities lending procedures, the Fund receives cash collateral at least equal to the market value of the securities on loan. The market value of the loaned securities is determined at the close of business of the Fund at their last sale price or official closing price on the principal exchange or system on which they are traded, and any additional required collateral is delivered to the Fund on the next business day. As with other extensions of credit, the Fund may experience a delay in the recovery of its securities or incur a loss should the borrower of the securities breach its agreement with the Fund or become insolvent at a time when the collateral is insufficient to cover the cost of repurchasing securities on loan.
The Fund invests the cash collateral received in connection with securities lending transactions in the Goldman Sachs Financial Square Money Market Fund (“Money Market Fund”), a series of Goldman Sachs Trust, a Delaware statutory trust. The Money Market Fund, deemed an affiliate of the Trust, is registered under the Act as an open end investment company, is subject to Rule 2a-7 under the Act, and is managed by GSAM, for which GSAM may receive an investment advisory fee of up to 0.205% on an annualized basis of the average daily net assets of the Money Market Fund.
Both the Fund and GSAL receive compensation relating to the lending of the Fund’s securities. The amount earned by the Fund for the six months ended June 30, 2011, is reported under Investment Income on the Statement of Operations. A portion of
GOLDMAN SACHS VARIABLE INSURANCE TRUST STRUCTURED SMALL CAP EQUITY FUND
| 7. SECURITIES LENDING (continued) |
this amount, $3,184, represents compensation earned by the Fund from lending its securities to Goldman Sachs. For the six months ended June 30, 2011, GSAL earned $1,645 in fees as securities lending agent.
The following table provides information about the Fund’s investment in the Money Market Fund for the six months ended June 30, 2011 (in thousands):
| Number of | Number of | |||||||||||||||
| Shares Held | Shares Held | Value at End | ||||||||||||||
| Beginning of Period | Shares Bought | Shares Sold | End of Period | of Period | ||||||||||||
| 3,893 | 16,362 | (17,368 | ) | 2,887 | $ | 2,887 | ||||||||||
| 8. TAX INFORMATION |
As of the Fund’s most recent fiscal year end, December 31, 2010, the Fund’s capital loss carryforwards on a tax-basis were as follows:
Capital loss carryforward:(1) | ||||
| Expiring 2016 | $ | (23,544,097 | ) | |
| Expiring 2017 | (17,973,195 | ) | ||
| Total capital loss carryforward | $ | (41,517,292 | ) | |
| (1) | Expiration occurs on December 31 of the year indicated. |
As of June 30, 2011, the Fund’s aggregate security unrealized gains and losses based on cost for U.S. federal income tax purposes were as follows:
| Tax cost | $ | 95,998,467 | ||
| Gross unrealized gain | 39,854,284 | |||
| Gross unrealized loss | (3,387,915 | ) | ||
| Net unrealized security gain | $ | 36,466,369 | ||
The difference between GAAP-basis and tax basis unrealized gains (losses), as of the most recent fiscal year end, is attributable primarily to wash sales, net mark to market gains (losses) on regulated futures contracts and differences related to the tax treatment of passive foreign investment companies, partnership investments and underlying fund investments.
GSAM has reviewed the Fund’s tax positions for all open tax years (the current and prior three years, as applicable) and has concluded that no provision for income tax is required in the Fund’s financial statements. Such open tax years remain subject to examination and adjustment by tax authorities.
Under the recently enacted Regulated Investment Company Modernization Act of 2010, the Fund will be permitted to carry forward capital losses incurred in taxable years beginning after December 22, 2010 for an unlimited period. However, any losses incurred during those future taxable years will be required to be utilized prior to the losses incurred in pre-enactment taxable years. As a result of this ordering rule, pre-enactment capital loss carryforwards may be more likely to expire unused. Additionally, post-enactment capital losses that are carried forward will retain their character as either short-term or long-term capital losses rather than being considered all short-term as under previous law.
GOLDMAN SACHS VARIABLE INSURANCE TRUST STRUCTURED SMALL CAP EQUITY FUND
Notes to Financial Statements (continued)
June 30, 2011 (Unaudited)
| 2. SIGNIFICANT ACCOUNTING POLICIES (continued) |
| 9. OTHER RISKS |
Fund’s Shareholder Concentration Risk — Certain participating insurance companies, accounts, or Goldman Sachs affiliates may from time to time own (beneficially or of record) or control a significant percentage of the Fund’s shares. Redemptions by these entities of their holdings in the Fund may impact the Fund’s liquidity and NAV. These redemptions may also force the Fund to sell securities.
Liquidity Risk — The Fund may make investments that may be illiquid or that may become less liquid in response to market developments or adverse investor perceptions. Liquidity risk may also refer to the risk that a Fund will not be able to pay redemption proceeds within the allowable time period because of unusual market conditions, an unusually high volume of redemption requests, or other reasons. To meet redemption requests, a Fund may be forced to sell investments at an unfavorable time and/or under unfavorable conditions.
Market and Credit Risks — In the normal course of business, the Fund trades financial instruments and enters into financial transactions where risk of potential loss exists due to changes in the market (market risk). Additionally, the Fund may also be exposed to credit risk in the event that an issuer fails to perform or that an institution or entity with which the Fund has unsettled or open transaction defaults.
| 10. INDEMNIFICATIONS |
Under the Trust’s organizational documents, its trustees, officers, employees and agents are indemnified, to the extent permitted by the Act, against certain liabilities that may arise out of performance of their duties to the Fund. Additionally, in the course of business, the Fund enters into contracts that contain a variety of indemnification clauses. The Fund’s maximum exposure under these arrangements is unknown, as this would involve future claims that may be made against the Fund that have not yet occurred. However, GSAM believes the risk of loss under these arrangements to be remote.
| 11. SUBSEQUENT EVENTS |
Subsequent events after the balance sheet date have been evaluated through the date the financial statements were issued. GSAM has concluded that there is no impact requiring adjustment or disclosure in the financial statements.
GOLDMAN SACHS VARIABLE INSURANCE TRUST STRUCTURED SMALL CAP EQUITY FUND
| 12. SUMMARY OF SHARE TRANSACTIONS |
Share activity is as follows:
| For the Six Months Ended | ||||||||||||||||
| June 30, 2011 | For the Fiscal Year Ended | |||||||||||||||
| (Unaudited) | December 31, 2010 | |||||||||||||||
| Shares | Dollars | Shares | Dollars | |||||||||||||
Institutional Shares | ||||||||||||||||
| Shares sold | 448,462 | $ | 5,432,402 | 1,530,530 | $ | 14,982,716 | ||||||||||
| Reinvestment of distributions | — | — | 46,067 | 529,767 | ||||||||||||
| Shares redeemed | (1,434,719 | ) | (17,174,503 | ) | (3,053,874 | ) | (29,401,499 | ) | ||||||||
| (986,257 | ) | (11,742,101 | ) | (1,477,277 | ) | (13,889,016 | ) | |||||||||
Service Shares | ||||||||||||||||
| Shares sold | 8,233 | 100,156 | 103,448 | 1,052,673 | ||||||||||||
| Reinvestment of distributions | — | — | 6,784 | 77,675 | ||||||||||||
| Shares redeemed | (316,342 | ) | (3,783,107 | ) | (350,880 | ) | (3,461,555 | ) | ||||||||
| (308,109 | ) | (3,682,951 | ) | (240,648 | ) | (2,331,207 | ) | |||||||||
NET DECREASE | (1,294,366 | ) | $ | (15,425,052 | ) | (1,717,925 | ) | $ | (16,220,223 | ) | ||||||
GOLDMAN SACHS VARIABLE INSURANCE TRUST STRUCTURED SMALL CAP EQUITY FUND
Statement Regarding Basis for Approval of Management Agreement (Unaudited)
Background
The Goldman Sachs Structured Small Cap Equity Fund (the “Fund”) is an investment portfolio of Goldman Sachs Variable Insurance Trust (the “Trust”). The Board of Trustees oversees the management of the Trust and reviews the investment performance and expenses of the Fund at regularly scheduled meetings held during the year. In addition, the Board of Trustees determines annually whether to approve the continuance of the Trust’s investment management agreement (the “Management Agreement”) with Goldman Sachs Asset Management, L.P. (the “Investment Adviser”) on behalf of the Fund.
The Management Agreement was most recently approved for continuation until June 30, 2012 by the Board of Trustees, including those Trustees who are not parties to the Management Agreement or “interested persons” (as defined in the Investment Company Act of 1940, as amended) of any party thereto (the “Independent Trustees”), at a meeting held on June 15-16, 2011 (the “Annual Meeting”).
The review process undertaken by the Trustees spans the course of the year and culminates with the Annual Meeting. To assist the Trustees in their deliberations, the Trustees have established a Contract Review Committee (the “Committee”), comprised of the Independent Trustees. The Committee held three meetings over the course of the year since the Management Agreement was last approved. At those Committee meetings, regularly scheduled Board meetings and/or the Annual Meeting, the Board, or the Independent Trustees, as applicable, considered matters relating to the Management Agreement, including:
| (a) | the nature and quality of the advisory, administrative and other services provided to the Fund by the Investment Adviser and its affiliates, including information about: |
| (i) | the structure, staff and capabilities of the Investment Adviser and its portfolio management teams; | |
| (ii) | the groups within the Investment Adviser and its affiliates that support the portfolio management teams or provide other types of necessary services, including fund services groups (e.g., accounting and financial reporting, tax, shareholder services and operations), controls and risk management groups (e.g., legal, compliance, valuation oversight, credit risk management, internal audit, market risk analysis, finance and strategy and central funding), sales and distribution support groups and others (e.g., information technology and training); | |
| (iii) | trends in headcount; | |
| (iv) | the Investment Adviser’s financial resources and ability to hire and retain talented personnel and strengthen its operations; and | |
| (v) | the parent company’s support of the Investment Adviser and its mutual fund business, as expressed by the firm’s senior management; |
| (b) | information on the investment performance of the Fund, including comparisons to the performance of similar mutual funds, as provided by a third party mutual fund data provider engaged as part of the contract review process (the “Outside Data Provider”), and its benchmark performance index, and general investment outlooks in the markets in which the Fund invests; | |
| (c) | the terms of the Management Agreement and agreements with affiliated service providers entered into by the Trust on behalf of the Fund; | |
| (d) | expense information for the Fund, including: |
| (i) | the relative management fee and expense level of the Fund as compared to those of comparable funds managed by other advisers, as provided by the Outside Data Provider; | |
| (ii) | the Fund’s expense trends over time; and | |
| (iii) | to the extent the Investment Adviser manages institutional accounts or collective investment vehicles having investment objectives and policies similar to those of the Fund, comparative information on the advisory fees charged and services provided to those accounts by the Investment Adviser; |
| (e) | with respect to the extensive investment performance and expense comparison data provided by the Outside Data Provider, its processes in producing that data for the Fund; | |
| (f) | the undertakings of the Investment Adviser to waive certain fees and reimburse certain expenses of the Fund that exceed specified levels, and a summary of contractual fee reductions made by the Investment Adviser and its affiliates over the past several years with respect to the Fund; | |
| (g) | information relating to the profitability of the Management Agreement and the transfer agency and distribution and service arrangements of the Fund and the Trust as a whole to the Investment Adviser and its affiliates; | |
| (h) | whether the Fund’s existing management fee schedule adequately addressed any economies of scale; | |
| (i) | a summary of the “fall-out” benefits derived by the Investment Adviser and its affiliates from their relationships with the Fund, including the fees received by the Investment Adviser’s affiliates from the Fund for transfer agency, securities lending, portfolio brokerage, distribution and other services; | |
| (j) | a summary of potential benefits derived by the Fund as a result of its relationship with the Investment Adviser; |
GOLDMAN SACHS VARIABLE INSURANCE TRUST STRUCTURED SMALL CAP EQUITY FUND
Statement Regarding Basis for Approval of Management Agreement (Unaudited) (continued)
| (k) | information regarding commissions paid by the Fund, portfolio trading and how the Investment Adviser carries out its duty to seek best execution; | |
| (l) | the manner in which portfolio manager compensation is determined, and the number and types of accounts managed by the portfolio managers; | |
| (m) | the nature and quality of the services provided to the Fund by its unaffiliated service providers, and the Investment Adviser’s general oversight and evaluation (including reports on due diligence) of those service providers as part of the administration services provided under the Management Agreement; and | |
| (n) | the Investment Adviser’s processes and policies addressing various types of potential conflicts of interest; its approach to risk management; the annual review of the effectiveness of the Fund’s compliance program; and compliance reports. |
The Trustees also received an overview of the Fund’s distribution arrangements. They received information regarding the Fund’s assets, share purchase and redemption activity and the payment of Rule 12b-1 distribution and service fees by the Fund’s Service Shares. Information was also provided to the Trustees relating to revenue sharing payments made by and services provided by the Investment Adviser and its affiliates to intermediaries that promote the sale, distribution and/or servicing of Fund shares.
The presentations made at the Board and Committee meetings and at the Annual Meeting encompassed the Fund and other mutual fund portfolios for which the Board of Trustees has responsibility. In evaluating the Management Agreement at the Annual Meeting, the Trustees relied upon their knowledge, resulting from their meetings and other interactions throughout the year, of the Investment Adviser, its affiliates, their services and the Fund. In conjunction with these meetings, the Trustees received written materials and oral presentations on the topics covered, and were advised by their independent legal counsel regarding their responsibilities and other regulatory requirements related to the approval and continuation of mutual fund investment management agreements under applicable law. In addition, the Investment Adviser and its affiliates provided the Independent Trustees with a written response to a formal request for information sent on behalf of the Independent Trustees by their independent legal counsel. During the course of their deliberations, the Independent Trustees met in executive sessions with their independent legal counsel, without representatives of the Investment Adviser or its affiliates present. The Independent Trustees also discussed the broad range of other investment choices that are available to Fund investors, including the availability of comparable funds managed by other advisers.
Nature, Extent and Quality of the Services Provided Under the Management Agreement
As part of their review, the Trustees considered the nature, extent and quality of the services provided by the Investment Adviser. In this regard, the Trustees considered both the investment advisory services, and the other, non-advisory services, that are provided to the Fund by the Investment Adviser and its affiliates. The Trustees noted the transition in the leadership and changes in personnel of various portfolio management teams, including the portfolio management team managing the Fund, that had occurred in recent periods, the potential benefit to the Fund of recent increases in headcount at the Investment Adviser and the ongoing recruitment efforts aimed at bringing high quality investment talent to the Investment Adviser. The Independent Trustees concluded that the Investment Adviser had committed substantial financial and operational resources to the Fund and expressed confidence that the Investment Adviser would continue to do so in the future. The Trustees also observed that the Investment Adviser had made significant commitments to address regulatory compliance requirements applicable to the Fund and the Investment Adviser.
Investment Performance
The Trustees also considered the investment performance of the Fund and the Investment Adviser. In this regard, they compared the Fund to its peers using the performance rankings and ratings compiled by the Outside Data Provider as of December 31, 2010, and updated performance information prepared by the Investment Adviser using the peer groups identified by the Outside Data provider. The information on the Fund’s investment performance was provided for the one-, three-, five- and ten-year periods ending on the applicable dates. The Trustees also reviewed the Fund’s investment performance over time on a year-by-year basis relative to its performance benchmark. In addition, they considered the investment performance trends of the Fund over time, and reviewed the investment performance of the Fund in light of its investment objective and policies, and market conditions. The Trustees considered whether the Fund had operated within its investment policies and had complied with its investment limitations.
In addition, the Trustees considered materials prepared and presentations made by the Investment Adviser’s senior management and portfolio management personnel, in which Fund performance was assessed. The Trustees also considered the Investment Adviser’s periodic reports with respect to the Fund’s risk profile, and how the Investment Adviser’s approach to risk monitoring and management influences portfolio management.
GOLDMAN SACHS VARIABLE INSURANCE TRUST STRUCTURED SMALL CAP EQUITY FUND
Statement Regarding Basis for Approval of Management Agreement (Unaudited) (continued)
The Independent Trustees noted that for the one-year period ended May 31, 2011, the Fund ranked in the top half of its peer group and had outperformed its benchmark index. The Independent Trustees observed that the Fund had performance that was in the bottom half of its peer group for multiple time periods of greater than one-year. The Independent Trustees also noted that in response to market turmoil in 2009, the Investment Adviser had implemented measures intended to improve Fund performance, including adjusting the Quantitative Investment Strategies (“QIS”) team’s investment process used to manage the Fund (which among other things included changes in trading strategies and enhancements to the models) and making certain changes to the QIS team’s personnel, and that the changes seemed to have had a positive effect on performance. They recognized that despite some recent turnover in senior personnel on the QIS team, the team was dedicated to both retaining talent and attracting high quality new talent. The Independent Trustees also noted that they had received assurances from the Investment Adviser’s senior management that measures would continue to be taken to address the Fund’s performance.
Costs of Services Provided and Competitive Information
The Trustees considered the contractual fee rates payable by the Fund under the Management Agreement. In this regard, the Trustees considered information on the services rendered by the Investment Adviser to the Fund, which included both advisory and administrative services that were directed to the needs and operations of the Fund as a registered mutual fund.
In particular, the Trustees reviewed analyses prepared by the Outside Data Provider regarding the expense rankings of the Fund. The analyses provided a comparison of the Fund’s management fees and breakpoints to those of a relevant peer group and category universe; an expense analysis which compared the Fund’s expenses to a peer group and a category universe; and a four-year history comparing the Fund’s expenses to the peer and category medians. The analyses also compared the Fund’s transfer agency fees, custody and accounting fees, distribution fees, other expenses and fee waivers/reimbursements to those of other funds in the peer group and the peer group median. The Trustees concluded that the comparisons provided by the Outside Data Provider were useful in evaluating the reasonableness of the management fees and total expenses paid by the Fund.
In addition, the Trustees considered the Investment Adviser’s undertakings to waive a portion of its management fee and limit the Fund’s “other expenses” ratio (excluding certain expenses) to a certain specified level. They also considered, to the extent that the Investment Adviser manages institutional accounts or collective investment vehicles having investment objectives and policies similar to those of the Fund, comparative fee information for services provided by the Investment Adviser to those accounts, and information that indicated that services provided to the Fund differed in various significant respects from the services provided to institutional accounts, which generally operated under less stringent legal and regulatory structures, required fewer services from the Investment Adviser to a smaller number of client contact points, were less time-intensive and paid lower fees. By contrast, the Trustees noted that the Investment Adviser provides substantial administrative services to the Fund under the terms of the Management Agreement.
In addition, the Trustees noted that shareholders are able to redeem their Fund shares at any time if they believe that the Fund fees and expenses are too high or if they are dissatisfied with the performance of the Fund.
Profitability
The Trustees reviewed the Investment Adviser’s revenues and pre-tax profit margins with respect to the Trust and the Fund. In this regard the Trustees noted that they had received, among other things, profitability analyses and summaries, revenue and expense schedules by Fund and by function (i.e., investment management, transfer agency and distribution and service) and the Investment Adviser’s expense allocation methodology. They observed that the profitability and expense figures are substantially similar to those used by the Investment Adviser for many internal purposes, including compensation decisions among various business groups, and are thus subject to a vigorous internal debate about how certain revenue and expenses should be allocated. The Trustees also reviewed the report of the internal audit group within the Goldman Sachs organization, which included an assessment of the reasonableness and consistency of the Investment Adviser’s expense allocation methodology and an evaluation of the accuracy of the Investment Adviser’s profitability analysis calculations. Profitability data for the Trust and the Fund were provided for 2010 and 2009, and the Trustees considered this information in relation to the Investment Adviser’s overall profitability. The Trustees considered the Investment Adviser’s revenues and pre-tax profit margins both in absolute terms and in comparison to information on the reported pre-tax profit margins earned by certain other asset management firms.
GOLDMAN SACHS VARIABLE INSURANCE TRUST STRUCTURED SMALL CAP EQUITY FUND
Statement Regarding Basis for Approval of Management Agreement (Unaudited) (continued)
Economies of Scale
The Trustees considered the information that had been provided regarding the Investment Adviser’s profitability and the rationale for the Fund’s breakpoint structure. The Trustees also considered the breakpoints in the fee rate payable under the Management Agreement for the Fund at the following annual percentage rates of the average daily net assets of the Fund:
| First $2 billion | 0.75 | % | ||
| Next $3 billion | 0.68 | |||
| Next $3 billion | 0.65 | |||
| Over $8 billion | 0.64 |
The Trustees noted that the breakpoints at the $5 and $8 billion asset levels had been proposed by the Investment Adviser and approved by the Trustees in 2008 to further share potential economies of scale, if any, with the Fund and its shareholders as assets under management reach those asset levels. The Trustees considered the amounts of assets in the Fund; the Fund’s recent share purchase and redemption activity; the information provided by the Investment Adviser relating to the costs of the services provided by the Investment Adviser and its affiliates and their realized profits; information comparing fee rates charged by the Investment Adviser with fee rates charged to other funds in the peer group; and the Investment Adviser’s undertakings to limit the Fund’s fees and “other expenses” ratio (excluding certain expenses) to certain amounts. Upon reviewing these matters at the Annual Meeting, the Trustees concluded that the fee breakpoints represented a means of assuring that benefits of scalability would be passed along to shareholders at the specified asset levels.
Other Benefits to the Investment Adviser and Its Affiliates
The Trustees also considered the other benefits derived by the Investment Adviser and its affiliates from their relationship with the Fund as stated above, including: (a) transfer agency fees received by Goldman, Sachs & Co. (“Goldman Sachs”); (b) brokerage and futures commissions earned by Goldman Sachs for executing securities and futures transactions on behalf of the Fund; (c) trading efficiencies resulting from aggregation of orders of the Fund with those for other funds or accounts managed by the Investment Adviser; (d) fees earned by Goldman Sachs Agency Lending, an affiliate of the Investment Adviser, as securities lending agent (and fees earned by the Investment Adviser for managing the portfolio in which the Fund’s cash collateral is invested); (e) the Investment Adviser’s ability to leverage the infrastructure designed to service the Fund on behalf of its other clients; (f) the Investment Adviser’s ability to cross-market other products and services to Fund shareholders; (g) Goldman Sachs’ retention of certain fees as Fund Distributor; (h) the Investment Adviser’s ability to negotiate better pricing with custodians on behalf of its other clients, as a result of the relationship with the Fund; and (i) the possibility that the working relationship between the Investment Adviser and the Fund’s third party service providers may cause those service providers to be open to doing business with other areas of Goldman Sachs. In the course of considering the foregoing, the Independent Trustees requested and received further information quantifying certain of the fall-out benefits. In looking at the benefits to Goldman Sachs Agency Lending and the Investment Adviser from the securities lending program, they noted that the Fund also benefited from its participation in the securities lending program.
Other Benefits to the Fund and Its Shareholders
The Trustees also noted that the Fund receives certain potential benefits as a result of its relationship with the Investment Adviser, including: (a) trading efficiencies resulting from aggregation of orders of the Fund with those of other funds or accounts managed by the Investment Adviser; (b) improved servicing and pricing from vendors because of the volume of business generated by the Investment Adviser and its affiliates; (c) improved servicing from broker-dealers because of the volume of business generated by the Investment Adviser and its affiliates; (d) the Investment Adviser’s ability to negotiate favorable terms with derivatives counterparties as a result of the size and reputation of the Goldman Sachs organization; (e) the advantages gained from the Investment Adviser’s knowledge and experience gained from managing other accounts and products; (f) the Investment Adviser’s ability to hire and retain qualified personnel to provide services to the Fund because of the reputation of the Goldman Sachs organization; (g) the Fund’s access, through the Investment Adviser, to certain firmwide resources (e.g., proprietary databases); and (h) the Fund’s access to certain affiliated distribution channels. The Trustees noted the competitive nature of the mutual fund marketplace, and noted further that many of the Fund’s shareholders invested in the Fund in part because of the Fund’s relationship with the Investment Adviser and that those shareholders have a general expectation that the relationship will continue.
GOLDMAN SACHS VARIABLE INSURANCE TRUST STRUCTURED SMALL CAP EQUITY FUND
Statement Regarding Basis for Approval of Management Agreement (Unaudited) (continued)
Conclusion
In connection with their consideration of the Management Agreement, the Trustees gave weight to each of the factors described above, but did not identify any particular factor as controlling their decision. After deliberation and consideration of all of the information provided, including the factors described above, the Trustees concluded, in the exercise of their business judgment, that the management fees paid by the Fund were reasonable in light of the services provided to it by the Investment Adviser, the Investment Adviser’s costs and the Fund’s current and reasonably foreseeable asset levels. The Trustees unanimously concluded that the Investment Adviser’s continued management likely would benefit the Fund and its shareholders and that the Management Agreement should be approved and continued with respect to the Fund until June 30, 2012.
GOLDMAN SACHS VARIABLE INSURANCE TRUST STRUCTURED SMALL CAP EQUITY FUND
Fund Expenses — Six Month Period Ended June 30, 2011 (Unaudited)
As a shareholder of Institutional or Service Shares of the Fund, you incur ongoing costs, including management fees, distribution and service (12b-1) fees (with respect to Service Shares) and other Fund expenses. This example is intended to help you understand your ongoing costs (in dollars) of investing in the Institutional Shares and Service Shares of the Fund and to compare these costs with the ongoing costs of investing in other mutual funds.
The example is based on an investment of $1,000 invested at the beginning of the period and held for the entire period from January 1, 2011 through June 30, 2011.
Actual Expenses — The first line under each share class in the table below provides information about actual account values and actual expenses. You may use the information in this line, together with the amount you invested, to estimate the expenses that you paid over the period. Simply divide your account value by $1,000 (for example, an $8,600 account value divided by $1,000=8.6), then multiply the result by the number in the first line under the heading entitled “Expenses Paid” to estimate the expenses you paid on your account during this period.
Hypothetical Example for Comparison Purposes — The second line under each share class in the table below provides information about hypothetical account values and hypothetical expenses based on the Fund’s actual net expense ratio and an assumed rate of return of 5% per year before expenses, which is not the Fund’s actual return. The hypothetical account values and expenses may not be used to estimate the actual ending account balance or expenses you paid for the period. You may use this information to compare the ongoing costs of investing in the Fund and other funds. To do so, compare this 5% hypothetical example with the 5% hypothetical examples that appear in the shareholder reports of the other funds.
Please note that the expenses shown in the table are meant to highlight your ongoing costs only. As a shareholder of the Fund, you do not incur any transaction costs, such as sales charges (loads), redemption fees, or exchange fees, but shareholders of other funds may incur such costs. The second line of the table is useful in comparing ongoing costs only, and will not help you determine the relative total costs of owning different funds whose shareholders may incur transaction costs.
| Expenses | |||||||||||||||
| Paid for the | |||||||||||||||
| Beginning | Ending | 6 Months | |||||||||||||
| Account Value | Account Value | Ended | |||||||||||||
| Share Class | 1/01/11 | 6/30/11 | 6/30/11* | ||||||||||||
Institutional | |||||||||||||||
| Actual | $ | 1,000 | $ | 1,086.70 | $ | 4.35 | |||||||||
| Hypothetical 5% return | 1,000 | 1,020.63 | + | 4.21 | |||||||||||
Service | |||||||||||||||
| Actual | 1,000 | 1,085.30 | 5.64 | ||||||||||||
| Hypothetical 5% return | 1,000 | 1,019.39 | + | 5.46 | |||||||||||
| * | Expenses for each share class are calculated using the Fund’s annualized net expense ratio for each class, which represents the ongoing expenses as a percentage of net assets for the six months ended June 30, 2011. Expenses are calculated by multiplying the annualized net expense ratio by the average account value for the period; then multiplying the result by the number of days in the most recent fiscal half year; and then dividing that result by the number of days in the fiscal year. The annualized net expense ratios for the period were 0.84% and 1.09% for Institutional and Service Shares, respectively. | |
| + | Hypothetical expenses are based on the Fund’s actual annualized net expense ratios and an assumed rate of return of 5% per year before expenses. |
| TRUSTEES | OFFICERS | |
| Ashok N. Bakhru, Chairman Donald C. Burke John P. Coblentz, Jr. Diana M. Daniels Joseph P. LoRusso James A. McNamara Jessica Palmer Alan A. Shuch Richard P. Strubel | James A. McNamara, President George F. Travers, Principal Financial Officer Peter V. Bonanno, Secretary Scott M. McHugh, Treasurer | |
| GOLDMAN, SACHS & CO. Distributor and Transfer Agent | ||
| GOLDMAN SACHS ASSET MANAGEMENT, L.P. Investment Adviser 200 West Street, New York New York 10282 | ||
| Visit our website at www.goldmansachsfunds.com/vit to obtain the most recent month-end returns. | ||
| The reports concerning the Fund included in this shareholder report may contain certain forward-looking statements about the factors that may affect the performance of the Fund in the future. These statements are based on Fund management’s predictions and expectations concerning certain future events and their expected impact on the Fund, such as performance of the economy as a whole and of specific industry sectors, changes in the levels of interest rates, the impact of developing world events, and other factors that may influence the future performance of the Fund. Management believes these forward-looking statements to be reasonable, although they are inherently uncertain and difficult to predict. Actual events may cause adjustments in portfolio management strategies from those currently expected to be employed. | ||
| A description of the policies and procedures that the Fund uses to determine how to vote proxies relating to portfolio securities and information regarding how the Fund voted proxies relating to portfolio securities during the most recent 12-month period ended June 30 is available (i) without charge, upon request by calling 1-800-621-2550; and (ii) on the Securities and Exchange Commission (“SEC”) website at http://www.sec.gov. | ||
| The Fund files its complete schedule of portfolio holdings with the SEC for the first and third quarters of each fiscal year on Form N-Q. The Fund’s Form N-Q is available on the SEC’s website at http://www.sec.gov within 60 days after the Fund’s first and third fiscal quarters. When available, the Fund’s Forms N-Q may be reviewed and copied at the SEC’s Public Reference Room in Washington, D.C. and information on the operation of the Public Reference Room may also be obtained by calling 1-800-SEC-0330. Forms N-Q may be obtained upon request and without charge by calling 1-800-621-2550. | ||
| Holdings and allocations shown may not be representative of current or future investments. Holdings and allocations may not include the Fund’s entire investment portfolio, which may change at any time. Fund holdings should not be relied on in making investment decisions and should not be construed as research or investment advice regarding particular securities. | ||
| Economic and market forecasts presented herein reflect our judgment as of the date of this presentation and are subject to change without notice. These forecasts do not take into account the specific investment objectives, restrictions, tax and financial situation or other needs of any specific client. Actual data will vary and may not be reflected here. These forecasts are subject to high levels of uncertainty that may affect actual performance. Accordingly, these forecasts should be viewed as merely representative of a broad range of possible outcomes. These forecasts are estimated, based on assumptions, and are subject to significant revision and may change materially as economic and market conditions change. Goldman Sachs has no obligation to provide updates or changes to these forecasts. Case studies and examples are for illustrative purposes only. | ||
| The Global Industry Classification Standard (“GICS”) was developed by and is the exclusive property and a service mark of Morgan Stanley Capital International Inc. (“MSCI”) and Standard & Poor’s, a division of The McGraw-Hill Companies, Inc. (“S&P”) and is licensed for use by Goldman Sachs. Neither MSCI, S&P nor any other party involved in making or compiling the GICS or any GICS classifications makes any express or implied warranties or representations with respect to such standard or classification (or the results to be obtained by the use thereof), and all such parties hereby expressly disclaim all warranties of originality, accuracy, completeness, merchantability or fitness for a particular purpose with respect to any of such standard or classification. Without limiting any of the foregoing, in no event shall MSCI, S&P, any of their affiliates or any third party involved in making or compiling the GICS or any GICS classifications have any liability for any direct, indirect, special, punitive, consequential or any other damages (including lost profits) even if notified of the possibility of such damages. | ||
| The portfolio risk management process includes an effort to monitor and manage risk, but does not imply low risk. | ||
| Shares of the Goldman Sachs VIT Funds are offered to separate accounts of participating life insurance companies for the purpose of funding variable annuity contracts and variable life insurance policies. Shares of the Fund are not offered directly to the general public. The variable annuity contracts and variable life insurance policies are described in the separate prospectuses issued by participating insurance companies. You should refer to those prospectuses for information about surrender charges, mortality and expense risk fees and other charges that may be assessed by participating insurance companies under the variable annuity contracts or variable life insurance policies. Such fees or charges, if any, may affect the return you may realize with respect to your investments. Ask your representative for more complete information. Please consider a fund’s objectives, risks and charges and expenses, and read the prospectus carefully before investing. The prospectus contains this and other information about the Fund. | ||
| This material is not authorized for distribution to prospective investors unless preceded or accompanied by a current Prospectus or summary prospectus, if applicable. Investors should consider a Fund’s objective, risks, and charges and expenses, and read the summary prospectus, if available, and/or the Prospectus carefully before investing or sending money. The summary prospectus, if available, and the Prospectus contain this and other information about a Fund and may be obtained from your authorized dealer or from Goldman, Sachs & Co. by calling 1-800-621-2550. | ||
| Toll Free (in U.S.): 800-292-4726 | ||
| This report is prepared for the general information of contract owners and is not an offer of shares of the Goldman Sachs Variable Insurance Trust: Goldman Sachs Structured Small Cap Equity Fund. | ||
| © 2011 Goldman Sachs. All rights reserved. | ||
| VITSCSAR11/57662.MF.MED.TMPL/8/2011 | ||
Goldman
Sachs Variable Insurance Trust
Goldman Sachs
Structured U.S. Equity Fund
Structured U.S. Equity Fund
Semi-Annual Report
June 30, 2011
June 30, 2011
GOLDMAN SACHS VARIABLE INSURANCE TRUST STRUCTURED U.S. EQUITY FUND
Principal Investment Strategies and Risks
Shares of the Goldman Sachs Variable Insurance Trust — Goldman Sachs Structured U.S. Equity Fund are offered to separate accounts of participating life insurance companies for the purpose of funding variable annuity contracts and variable life insurance policies. Shares of the Fund are not offered directly to the general public. The variable annuity contracts and variable life insurance policies are described in the separate prospectuses issued by participating insurance companies. You should refer to those prospectuses for information about surrender charges, mortality and expense risk fees and other charges that may be assessed by participating insurance companies under the variable annuity contracts or variable life insurance policies. Such fees or charges, if any, may affect the return you realize with respect to your investments. Ask your representative for more complete information. Please consider the Fund’s objective, risks and charges and expenses, and read the Prospectus carefully before investing. The Prospectus contains this and other information about the Fund.
The Goldman Sachs Structured U.S. Equity Fund invests in a broadly diversified portfolio of equity investments in U.S. issuers, including foreign issuers traded in the United States. The Fund’s equity investments will be subject to market risk, which means that the value of the securities in which it invests may go up or down in response to the prospects of individual companies, particular industry sectors and/or general economic conditions. The Fund may also invest in fixed income securities, which are subject to the risks associated with debt securities generally, including credit, liquidity and interest rate risk.
GOLDMAN SACHS VARIABLE INSURANCE TRUST STRUCTURED U.S. EQUITY FUND
INVESTMENT OBJECTIVE
The Fund seeks long-term growth of capital and dividend income.
Portfolio Management Discussion and Analysis
Below, the Goldman Sachs Quantitative Investment Strategies Team discusses the performance of the Goldman Sachs Variable Insurance Trust — Goldman Sachs Structured U.S. Equity Fund (the “Fund”) and positioning for the six-month period ended June 30, 2011 (the “Reporting Period”).
How did the Fund perform during the Reporting Period?
During the Reporting Period, the Fund’s Institutional and Service Shares generated cumulative total returns of 8.23% and 8.13%, respectively. These returns compare to the 6.02% cumulative total return of the Fund’s benchmark, the Standard & Poor’s® 500 Index* (with dividends reinvested) (the “S&P 500 Index”) during the same time period.
What economic and market factors most influenced the equity markets as a whole during the Reporting Period?
U.S. equities continued their positive momentum from 2010 during the Reporting Period. However, most of the gains were generated during the first quarter of 2011, as improving trends in labor, housing, manufacturing and consumer confidence pointed to a continuation in the economic recovery. A positive trajectory in corporate earnings and cash flows and strong merger and acquisition activity further supported U.S. equity market performance. Indeed, despite great exogenous shocks in the Middle East and North African turmoil, a series of disasters in Japan, political debate over collective bargaining rights in Wisconsin and the possible repeal of health care reform in Washington D.C., the U.S. equity markets rewarded investors with solid returns during the first quarter of 2011.
The broad U.S. equity markets experienced a much more volatile second quarter, rising to a three-year high in April before losing most of its early 2011 gains by mid-June and then recovering somewhat in the very last week of the Reporting Period. In early April, commodity prices declined and expectations ran high for strong corporate profit growth. However, while home construction rose modestly in May, housing and employment remained key weak spots in the U.S. economy. Concerns about Greece’s debt crisis also re-surfaced, the U.S. Congress wrangled over the U.S. debt ceiling, the Federal Reserve Board’s quantitative easing program was scheduled to expire on June 30, 2011, the impact of Japan’s natural and nuclear disasters worked its way through the global supply chain and deadly storms cut a wide swath of destruction across the midwestern and southern United States. In turn, the U.S. stock market felt pressured and lost ground. Toward the end of June, U.S. equity markets recovered from their May to mid-June decline on the heels of better than expected U.S. manufacturing activity, improved automobile sales and a short-term resolution of the sovereign debt crisis in Greece.
During the Reporting Period as a whole, the S&P 500 Index, representing the U.S. large-cap equity market, advanced 6.02%. Nine of the ten sectors in the S&P 500 Index were up, with the health care and energy sectors gaining the most. The health care sector was also the biggest positive contributor (weight times performance) to S&P 500 Index returns. Financials was the only sector in the S&P 500 Index to generate a negative return during the Reporting Period.
While all capitalization segments of the U.S. equity market advanced during the Reporting Period, mid-cap stocks, as measured by the Russell Midcap® Index, performed best, followed by large-cap and then small-cap stocks, as measured by the Russell 1000® Index and the Russell 2000® Index, respectively, which performed nearly in line with each other. Large-cap stocks were least successful relative to small-cap stocks in the information technology sector. Due primarily to the strong performance of growth-oriented financials stocks, growth-oriented stocks outpaced value-oriented stocks across the capitalization spectrum.
What key factors were responsible for the Fund’s performance during the Reporting Period?
As expected, and in keeping with our investment approach, our quantitative model and its six investment themes (Valuation, Profitability, Quality, Management, Momentum and Sentiment) had the greatest impact on relative performance. We use these themes to take a long-term view of market patterns and look for inefficiencies, selecting stocks for the Fund and overweighting or underweighting the ones chosen by the model. Over time and by design, the performance of any one of the model’s investment themes tends to have a low correlation with the model’s other themes, demonstrating the diversification benefit of the Fund’s theme-driven quantitative model. The variance in performance supports our research indicating that the diversification provided by the Fund’s different investment themes is a significant investment advantage over the long term, even though the Fund may experience underperformance in the short term.
| * | The S&P 500 Index is the Standard & Poor’s 500 Composite Index of 500 stocks, an unmanaged index of common stock prices. The Index figures do not reflect any deduction for fees, expenses or taxes. It is not possible to invest directly in an unmanaged index. |
GOLDMAN SACHS VARIABLE INSURANCE TRUST STRUCTURED U.S. EQUITY FUND
Overall, the Fund outperformed the S&P 500 Index during the Reporting Period, with the Fund’s Momentum theme contributing the most, followed by Sentiment, Profitability and Management, which also contributed positively to the Fund’s relative returns. The Momentum theme seeks to predict drifts in stock prices caused by under-reaction to company specific information. The Sentiment theme reflects selected investment views and decisions of individuals and financial intermediaries. The Profitability theme assesses whether a company is earning more than its cost of capital. The Management theme assesses the characteristics, policies and strategic decisions of company managements.
The Quality theme detracted most from the Fund’s relative performance during the Reporting Period, followed by Valuation. The Quality theme evaluates whether the company’s earnings are coming from more persistent, cash-based sources, as opposed to accruals. The Valuation theme attempts to capture potential mispricings of securities, typically by comparing a measure of the company’s intrinsic value to its market value.
How did the Fund’s sector allocations affect relative performance?
In constructing the Fund’s portfolio, we focus on picking stocks rather than making industry or sector bets. Consequently, the Fund is similar to its benchmark, the S&P 500 Index, in terms of its sector allocation and style. We manage the Fund’s industry and sector exposure by including industry factors in our risk model and by explicitly penalizing industry and sector deviations from the benchmark index in optimization. Sector weights or changes in sector weights generally do not have a meaningful impact on relative performance.
Did stock selection help or hurt Fund performance during the Reporting Period?
We seek to outpace the S&P 500 Index by overweighting stocks that we expect to outperform and underweighting those that we think may lag. We also build positions based on our thematic views. For example, the Fund aims to hold a basket of stocks with more favorable Momentum characteristics than the benchmark index. During the Reporting Period, stock selection overall contributed positively to the Fund’s relative performance.
While absolute returns from stock selection in each of the ten sectors of the S&P 500 were positive during the Reporting Period, stock selection in the consumer discretionary, financials and consumer staples sectors made the biggest positive contribution to the Fund’s results relative to the S&P 500 Index. Only partially offsetting these positives was stock selection in the industrials, materials and utilities sectors, which detracted most from the Fund’s results relative to its benchmark index.
Which individual stock positions contributed the most to the Fund’s relative returns during the Reporting Period?
The Fund benefited most from overweight positions in tobacco company Lorillard, broadcast satellite subscription television service provider DISH Network and computer services consulting company Accenture. We chose to overweight Lorillard and Accenture because of our positive view on Profitability. The overweight in DISH Network was the result of our positive view on Management.
Which individual positions detracted from the Fund’s results during the Reporting Period?
Detracting most from the Fund’s results relative to its benchmark index were overweight positions in software manufacturing behemoth Microsoft and gold miner Newmont Mining and an underweight position in diversified computer services giant International Business Machines (IBM). The Fund had overweighted positions in Microsoft and Newmont Mining because of our positive view on Momentum. Our negative view on Momentum led us to underweight IBM.
How did the Fund use derivatives and similar instruments during the Reporting Period?
During the Reporting Period, we did not use derivatives as part of an active management strategy to add value to the Fund’s results. However, we used equity index futures contracts, on an opportunistic basis, to equitize the Fund’s excess cash holdings. In other words, we put the Fund’s excess cash holdings to work by using them as collateral for the purchase of stock futures.
Did you make any enhancements to your quantitative models during the Reporting Period?
We continuously look for ways to improve our investment process. Accordingly, we continued our extensive ongoing research process but did not implement any significant model enhancements during the Reporting Period.
What was the Fund’s sector positioning relative to its benchmark index at the end of the Reporting Period?
As of June 30, 2011, the Fund was overweight the energy, health care, consumer discretionary, consumer staples, information technology and telecommunication services sectors relative to the S&P 500 Index. The Fund was underweight industrials, financials, materials and utilities compared to the benchmark index on the same date.
GOLDMAN SACHS VARIABLE INSURANCE TRUST STRUCTURED U.S. EQUITY FUND
What is your strategy going forward for the Fund?
Looking ahead, we continue to believe that less expensive stocks should outpace more expensive stocks, and stocks with good momentum are likely to outperform those with poor momentum. We intend to maintain our focus on seeking companies with positive fundamentals, good profitability, sustainable earnings and a track record of using capital to enhance shareholder value. As such, we anticipate remaining fully invested with long-term performance likely to be the result of stock selection rather than sector or capitalization allocations.
We stand behind our investment philosophy that sound economic investment principles, coupled with a disciplined quantitative approach, can provide strong, uncorrelated returns over the long term. Our research agenda is robust, and we continue to enhance our existing models, add new proprietary forecasting signals, and improve our trading execution as we seek to provide the most value to our shareholders.
CHANGES MADE TO THE TEAM’S MANAGEMENT
During the first quarter of 2011, we announced that Richard Vanecek, Managing Director and co-head of Quantitative Investment Strategies (QIS) Trading would become the sole head of QIS Trading.
FUND BASICS
Structured U.S. Equity Fund
as of June 30, 2011
| STANDARDIZED AVERAGE ANNUAL TOTAL RETURNS1 |
| For the period ended 6/30/11 | One Year | Five Years | Ten Years | Since Inception | Inception Date | |||||||||||||||
| Institutional | 32.14 | % | 0.28 | % | 1.86 | % | 2.84 | % | 02/13/98 | |||||||||||
| Service | 31.87 | 0.12 | N/A | -0.10 | 01/09/06 | |||||||||||||||
| 1 | The Standardized Average Annual Total Returns are average annual total returns as of the most recent calendar quarter-end. They assume reinvestment of all distributions at net asset value (“NAV”). | |
| Total return figures in the above chart represent past performance and do not indicate future results, which will vary. The investment return and principal value of an investment will fluctuate and, therefore, an investor’s shares, when redeemed, may be worth more or less than their original cost. Current performance may be lower or higher than the total return figures in the above chart. Please visit www.goldmansachsfunds.com/vit to obtain the most recent month-end returns. Performance reflects fee waivers and/or expense limitations in effect. In their absence, performance would be reduced. |
| EXPENSE RATIOS2 |
| Net Expense Ratio (Current) | Gross Expense Ratio (Before Waivers) | |||||||||
| Institutional | 0.64 | % | 0.70 | % | ||||||
| Service | 0.85 | 0.95 | ||||||||
| 2 | The expense ratios of the Fund, both current (net of any fee waivers or expense limitations) and before waivers (gross of any fee waivers or expense limitations) are as set forth above. The Fund’s waivers and/or expense limitations will remain in place through at least April 29, 2012, and prior to such date the investment adviser may not terminate the arrangements without the approval of the Fund’s Board of Trustees. The expense ratios set forth above may differ from the expense ratios disclosed in the Financial Highlights in this report. |
| TOP TEN HOLDINGS AS OF 6/30/113 |
| Holding | % of Net Assets | Line of Business | ||||||
| Microsoft Corp. | 4.0 | % | Software & Services | |||||
| Exxon Mobil Corp. | 3.9 | Energy | ||||||
| Lorillard, Inc. | 3.5 | Food, Beverage & Tobacco | ||||||
| Eli Lilly & Co. | 3.2 | Pharmaceuticals, Biotechnology & Life Sciences | ||||||
| ConocoPhillips | 2.7 | Energy | ||||||
| Chevron Corp. | 2.5 | Energy | ||||||
| Pfizer, Inc. | 2.5 | Pharmaceuticals, Biotechnology & Life Sciences | ||||||
| AT&T, Inc. | 2.4 | Telecommunication Services | ||||||
| Accenture PLC Class A | 2.1 | Software & Services | ||||||
| Simon Property Group, Inc. | 2.1 | Real Estate Investment Trust | ||||||
| 3 | The top 10 holdings may not be representative of the Fund’s future investments. |
FUND BASICS
| FUND vs. BENCHMARK SECTOR ALLOCATIONS4 |
As of June 30, 2011
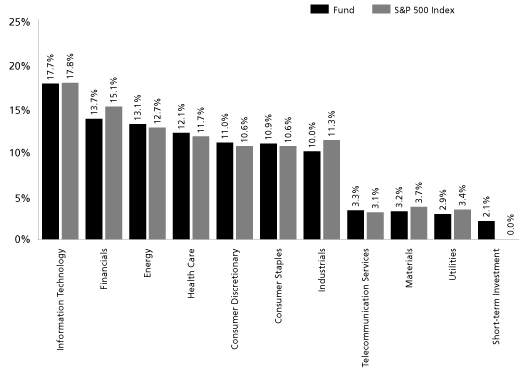
| 4 | The Fund is actively managed and, as such, its composition may differ over time. The above graph categorizes investments using Global Industry Classification Standard (“GICS”), however, the sector classifications used by the portfolio management team may differ from GICS. Consequently, the Fund’s overall industry sector allocations may differ from percentages contained in the graph above. The percentage shown for each investment category reflects the value of investments in that category as a percentage of market value (excluding investments in the securities lending reinvestment vehicle, if any). Investment in the securities lending reinvestment vehicle represented 0.2% of the Fund’s net assets at June 30, 2011. Short-term investments represent investments in investment companies other than those that are exchange traded. The above graph depicts the Fund’s investments but may not represent the Fund’s market exposure due to the exclusion of derivatives, if any, as listed in the Additional Investment Information section of the Schedule of Investments. |
GOLDMAN SACHS VARIABLE INSURANCE TRUST STRUCTURED U.S. EQUITY FUND
Schedule of Investments
June 30, 2011 (Unaudited)
| Shares | Description | Value | ||||||
Common Stocks – 98.1% | ||||||||
Automobiles & Components – 0.7% | ||||||||
| 12,207 | Autoliv, Inc. | $ | 957,639 | |||||
| 36,593 | TRW Automotive Holdings Corp.* | 2,160,085 | ||||||
| 3,117,724 | ||||||||
Banks – 2.0% | ||||||||
| 17,565 | Hudson City Bancorp, Inc. | 143,857 | ||||||
| 14,470 | PNC Financial Services Group, Inc. | 862,557 | ||||||
| 84,532 | U.S. Bancorp | 2,156,411 | ||||||
| 195,590 | Wells Fargo & Co. | 5,488,256 | ||||||
| 8,651,081 | ||||||||
Capital Goods – 7.4% | ||||||||
| 14,514 | Cummins, Inc. | 1,502,054 | ||||||
| 6,760 | Danaher Corp. | 358,212 | ||||||
| 45,288 | Eaton Corp. | 2,330,068 | ||||||
| 57,479 | Emerson Electric Co. | 3,233,194 | ||||||
| 2,702 | Fluor Corp. | 174,711 | ||||||
| 323,175 | General Electric Co. | 6,095,081 | ||||||
| 53,766 | Honeywell International, Inc. | 3,203,916 | ||||||
| 3,301 | Illinois Tool Works, Inc. | 186,473 | ||||||
| 3,044 | Ingersoll-Rand PLC | 138,228 | ||||||
| 3,205 | Lockheed Martin Corp. | 259,509 | ||||||
| 3,752 | MSC Industrial Direct Co. Class A | 248,795 | ||||||
| 64,083 | Northrop Grumman Corp. | 4,444,156 | ||||||
| 38,044 | Oshkosh Corp.* | 1,100,993 | ||||||
| 5,292 | Parker Hannifin Corp. | 474,904 | ||||||
| 10,930 | Rockwell Automation, Inc. | 948,287 | ||||||
| 2,999 | Rockwell Collins, Inc. | 185,008 | ||||||
| 18,852 | Timken Co. | 950,141 | ||||||
| 47,216 | Toro Co. | 2,856,568 | ||||||
| 16,757 | Tyco International Ltd. | 828,299 | ||||||
| 11,628 | United Technologies Corp. | 1,029,194 | ||||||
| 5,878 | W.W. Grainger, Inc. | 903,155 | ||||||
| 31,450,946 | ||||||||
Commercial & Professional Services – 0.3% | ||||||||
| 21,388 | Manpower, Inc. | 1,147,466 | ||||||
Consumer Durables & Apparel – 1.4% | ||||||||
| 16,191 | Fossil, Inc.* | 1,906,004 | ||||||
| 43,693 | Harman International Industries, Inc. | 1,991,090 | ||||||
| 3,471 | Lululemon Athletica, Inc.* | 388,127 | ||||||
| 25,444 | Mohawk Industries, Inc.* | 1,526,386 | ||||||
| 5,811,607 | ||||||||
Consumer Services – 1.7% | ||||||||
| 11,170 | Apollo Group, Inc. Class A* | 487,905 | ||||||
| 46,990 | Carnival Corp. | 1,768,234 | ||||||
| 2,294 | Chipotle Mexican Grill, Inc.* | 706,988 | ||||||
| 6,159 | McDonald’s Corp. | 519,327 | ||||||
| 85,321 | Starbucks Corp. | 3,369,326 | ||||||
| 6,242 | Yum! Brands, Inc. | 344,808 | ||||||
| 7,196,588 | ||||||||
Diversified Financials – 3.9% | ||||||||
| 205,394 | Bank of America Corp. | 2,251,118 | ||||||
| 72,983 | Capital One Financial Corp. | 3,771,032 | ||||||
| 34,758 | Citigroup, Inc. | 1,447,323 | ||||||
| 3,145 | CME Group, Inc. | 917,050 | ||||||
| 6,705 | Discover Financial Services | 179,359 | ||||||
| 1,164 | Franklin Resources, Inc. | 152,822 | ||||||
| 80,172 | JPMorgan Chase & Co. | 3,282,242 | ||||||
| 85,343 | SEI Investments Co. | 1,921,071 | ||||||
| 106,004 | The Bank of New York Mellon Corp. | 2,715,822 | ||||||
| 16,637,839 | ||||||||
Energy – 13.1% | ||||||||
| 104,310 | Chevron Corp. | 10,727,240 | ||||||
| 10,132 | Cimarex Energy Co. | 911,069 | ||||||
| 152,441 | ConocoPhillips | 11,462,039 | ||||||
| 6,096 | Core Laboratories NV | 679,948 | ||||||
| 25,949 | Devon Energy Corp. | 2,045,041 | ||||||
| 18,779 | Exterran Holdings, Inc.* | 372,388 | ||||||
| 203,277 | Exxon Mobil Corp. | 16,542,682 | ||||||
| 7,444 | Halliburton Co. | 379,644 | ||||||
| 13,746 | Hess Corp. | 1,027,651 | ||||||
| 7,132 | Marathon Oil Corp. | 375,714 | ||||||
| 9,181 | Murphy Oil Corp. | 602,824 | ||||||
| 1,999 | National Oilwell Varco, Inc. | 156,342 | ||||||
| 7,368 | Oil States International, Inc.* | 588,777 | ||||||
| 20,905 | Sunoco, Inc. | 871,948 | ||||||
| 79,352 | Tesoro Corp.* | 1,817,954 | ||||||
| 280,667 | Valero Energy Corp. | 7,176,655 | ||||||
| 55,737,916 | ||||||||
Food & Staples Retailing – 1.6% | ||||||||
| 15,256 | Costco Wholesale Corp. | 1,239,397 | ||||||
| 17,176 | CVS Caremark Corp. | 645,474 | ||||||
| 5,838 | Safeway, Inc. | 136,434 | ||||||
| 5,583 | The Kroger Co. | 138,458 | ||||||
| 87,036 | Walgreen Co. | 3,695,549 | ||||||
| 4,976 | Wal-Mart Stores, Inc. | 264,425 | ||||||
| 10,636 | Whole Foods Market, Inc. | 674,854 | ||||||
| 6,794,591 | ||||||||
Food, Beverage & Tobacco – 6.7% | ||||||||
| 125,471 | Archer-Daniels-Midland Co. | 3,782,951 | ||||||
| 18,775 | Dr. Pepper Snapple Group, Inc. | 787,236 | ||||||
| 7,113 | H.J. Heinz Co. | 378,980 | ||||||
| 18,515 | Hansen Natural Corp.* | 1,498,789 | ||||||
| 135,735 | Lorillard, Inc. | 14,777,469 | ||||||
| 5,737 | Molson Coors Brewing Co. Class B | 256,673 | ||||||
| 58,040 | Philip Morris International, Inc. | 3,875,331 | ||||||
| 4,555 | Reynolds American, Inc. | 168,763 | ||||||
| 155,542 | Tyson Foods, Inc. Class A | 3,020,626 | ||||||
| 28,546,818 | ||||||||
Health Care Equipment & Services – 3.3% | ||||||||
| 1,805 | Becton, Dickinson and Co. | 155,537 | ||||||
| 198,599 | Boston Scientific Corp.* | 1,372,319 | ||||||
| 62,591 | Cardinal Health, Inc. | 2,842,883 | ||||||
| 72,112 | CareFusion Corp.* | 1,959,283 | ||||||
| 6,100 | DENTSPLY International, Inc. | 232,288 | ||||||
| 25,846 | Humana, Inc. | 2,081,637 | ||||||
GOLDMAN SACHS VARIABLE INSURANCE TRUST STRUCTURED U.S. EQUITY FUND
Schedule of Investments (continued)
June 30, 2011 (Unaudited)
| Shares | Description | Value | ||||||
Common Stocks – (continued) | ||||||||
Health Care Equipment & Services – (continued) | ||||||||
| 41,207 | UnitedHealth Group, Inc. | $ | 2,125,457 | |||||
| 39,683 | WellPoint, Inc. | 3,125,830 | ||||||
| 13,895,234 | ||||||||
Household & Personal Products – 2.6% | ||||||||
| 16,755 | Colgate-Palmolive Co. | 1,464,555 | ||||||
| 16,590 | Herbalife Ltd. | 956,248 | ||||||
| 134,857 | The Procter & Gamble Co. | 8,572,859 | ||||||
| 10,993,662 | ||||||||
Insurance – 4.2% | ||||||||
| 7,928 | Aspen Insurance Holdings Ltd. | 203,987 | ||||||
| 88,192 | Berkshire Hathaway, Inc. Class B* | 6,825,179 | ||||||
| 10,333 | Everest Re Group Ltd. | 844,723 | ||||||
| 57,955 | Loews Corp. | 2,439,326 | ||||||
| 40,509 | MetLife, Inc. | 1,777,130 | ||||||
| 10,529 | The Travelers Companies, Inc. | 614,683 | ||||||
| 209,546 | Unum Group | 5,339,232 | ||||||
| 18,044,260 | ||||||||
Materials – 3.2% | ||||||||
| 14,227 | Ashland, Inc. | 919,349 | ||||||
| 4,645 | CF Industries Holdings, Inc. | 658,057 | ||||||
| 10,806 | Domtar Corp. | 1,023,544 | ||||||
| 17,993 | Eastman Chemical Co. | 1,836,546 | ||||||
| 29,850 | Freeport-McMoRan Copper & Gold, Inc. | 1,579,065 | ||||||
| 60,070 | Huntsman Corp. | 1,132,319 | ||||||
| 40,471 | Newmont Mining Corp. | 2,184,220 | ||||||
| 2,290 | PPG Industries, Inc. | 207,909 | ||||||
| 24,523 | Southern Copper Corp. | 806,071 | ||||||
| 13,894 | The Dow Chemical Co. | 500,184 | ||||||
| 6,565 | The Mosaic Co. | 444,647 | ||||||
| 13,067 | The Scotts Miracle-Gro Co. Class A | 670,468 | ||||||
| 18,073 | The Sherwin-Williams Co. | 1,515,783 | ||||||
| 15,969 | Titanium Metals Corp. | 292,552 | ||||||
| 13,770,714 | ||||||||
Media – 4.0% | ||||||||
| 9,487 | Cablevision Systems Corp. Class A | 343,524 | ||||||
| 22,024 | Comcast Corp. Class A | 558,088 | ||||||
| 118,177 | Comcast Corp. Special A Shares | 2,863,429 | ||||||
| 34,642 | DIRECTV Class A* | 1,760,506 | ||||||
| 180,828 | DISH Network Corp. Class A* | 5,545,995 | ||||||
| 72,395 | News Corp. Class A | 1,281,392 | ||||||
| 3,823 | The Walt Disney Co. | 149,250 | ||||||
| 119,873 | Time Warner, Inc. | 4,359,781 | ||||||
| 16,861,965 | ||||||||
Pharmaceuticals, Biotechnology & Life Sciences – 8.9% | ||||||||
| 2,984 | Alexion Pharmaceuticals, Inc.* | 140,338 | ||||||
| 83,212 | Amgen, Inc.* | 4,855,420 | ||||||
| 25,138 | Biogen Idec, Inc.* | 2,687,755 | ||||||
| 20,985 | Celgene Corp.* | 1,265,815 | ||||||
| 1,806 | Cephalon, Inc.* | 144,299 | ||||||
| 367,171 | Eli Lilly & Co. | 13,779,928 | ||||||
| 78,280 | Gilead Sciences, Inc.* | 3,241,575 | ||||||
| 9,149 | Johnson & Johnson | 608,592 | ||||||
| 18,246 | Merck & Co., Inc. | 643,901 | ||||||
| 507,160 | Pfizer, Inc. | 10,447,496 | ||||||
| 37,815,119 | ||||||||
Real Estate Investment Trust – 3.5% | ||||||||
| 8,152 | AvalonBay Communities, Inc. | 1,046,717 | ||||||
| 3,276 | Plum Creek Timber Co., Inc. | 132,809 | ||||||
| 5,751 | Public Storage | 655,672 | ||||||
| 65,818 | Rayonier, Inc. | 4,301,206 | ||||||
| 76,715 | Simon Property Group, Inc. | 8,916,584 | ||||||
| 15,052,988 | ||||||||
Retailing – 3.3% | ||||||||
| 3,658 | Advance Auto Parts, Inc. | 213,956 | ||||||
| 19,542 | Amazon.com, Inc.* | 3,996,144 | ||||||
| 23,414 | AutoNation, Inc.*(a) | 857,187 | ||||||
| 10,137 | Dick’s Sporting Goods, Inc.* | 389,768 | ||||||
| 3,850 | Dollar Tree, Inc.* | 256,487 | ||||||
| 132,190 | Limited Brands, Inc. | 5,082,705 | ||||||
| 675 | Netflix, Inc.* | 177,316 | ||||||
| 8,638 | PetSmart, Inc. | 391,906 | ||||||
| 23,411 | Ross Stores, Inc. | 1,875,689 | ||||||
| 15,704 | Target Corp. | 736,675 | ||||||
| 13,977,833 | ||||||||
Semiconductors & Semiconductor Equipment – 2.5% | ||||||||
| 361,278 | Intel Corp. | 8,005,921 | ||||||
| 50,781 | Marvell Technology Group Ltd.* | 749,781 | ||||||
| 53,596 | Texas Instruments, Inc. | 1,759,557 | ||||||
| 10,515,259 | ||||||||
Software & Services – 9.2% | ||||||||
| 150,495 | Accenture PLC Class A | 9,092,908 | ||||||
| 7,509 | Amdocs Ltd.* | 228,199 | ||||||
| 1,809 | Cognizant Technology Solutions Corp. Class A* | 132,672 | ||||||
| 12,086 | eBay, Inc.* | 390,015 | ||||||
| 10,275 | Google, Inc. Class A* | 5,203,054 | ||||||
| 647,183 | Microsoft Corp. | 16,826,758 | ||||||
| 163,110 | Oracle Corp. | 5,367,950 | ||||||
| 20,384 | Teradata Corp.* | 1,227,117 | ||||||
| 17,329 | VeriSign, Inc. | 579,828 | ||||||
| 39,048,501 | ||||||||
Technology Hardware & Equipment – 6.1% | ||||||||
| 261,280 | Cisco Systems, Inc. | 4,078,581 | ||||||
| 309,803 | Dell, Inc.* | 5,164,416 | ||||||
| 58,909 | EMC Corp.* | 1,622,943 | ||||||
| 90,817 | Flextronics International Ltd.* | 583,045 | ||||||
| 57,707 | Hewlett-Packard Co. | 2,100,535 | ||||||
| 135,734 | Ingram Micro, Inc. Class A* | 2,462,215 | ||||||
| 9,213 | Juniper Networks, Inc.* | 290,209 | ||||||
| 26,905 | Motorola Solutions, Inc.* | 1,238,706 | ||||||
| 90,952 | NetApp, Inc.* | 4,800,447 | ||||||
| 46,605 | QLogic Corp.* | 741,952 | ||||||
| 69,450 | Tellabs, Inc. | 320,164 | ||||||
GOLDMAN SACHS VARIABLE INSURANCE TRUST STRUCTURED U.S. EQUITY FUND
| Shares | Description | Value | ||||||
Common Stocks – (continued) | ||||||||
Technology Hardware & Equipment – (continued) | ||||||||
| 109,983 | Vishay Intertechnology, Inc.* | $ | 1,654,144 | |||||
| 25,257 | Western Digital Corp.* | 918,850 | ||||||
| 25,976,207 | ||||||||
Telecommunication Services – 3.3% | ||||||||
| 320,722 | AT&T, Inc.(b) | 10,073,878 | ||||||
| 412,684 | Sprint Nextel Corp.* | 2,224,367 | ||||||
| 42,263 | Verizon Communications, Inc. | 1,573,451 | ||||||
| 13,871,696 | ||||||||
Transportation – 2.3% | ||||||||
| 2,297 | Copa Holdings SA Class A | 153,302 | ||||||
| 2,908 | Expeditors International of Washington, Inc. | 148,860 | ||||||
| 16,134 | FedEx Corp. | 1,530,310 | ||||||
| 5,491 | Norfolk Southern Corp. | 411,441 | ||||||
| 1,388 | Union Pacific Corp. | 144,907 | ||||||
| 101,970 | United Parcel Service, Inc. Class B | 7,436,672 | ||||||
| 9,825,492 | ||||||||
Utilities – 2.9% | ||||||||
| 8,905 | Dominion Resources, Inc. | 429,844 | ||||||
| 264,508 | Duke Energy Corp. | 4,980,686 | ||||||
| 4,366 | Entergy Corp. | 298,110 | ||||||
| 35,903 | Exelon Corp. | 1,538,085 | ||||||
| 41,280 | Integrys Energy Group, Inc. | 2,139,955 | ||||||
| 18,810 | NiSource, Inc. | 380,903 | ||||||
| 46,793 | Sempra Energy | 2,474,414 | ||||||
| 12,241,997 | ||||||||
TOTAL COMMON STOCKS | ||||||||
(Cost $330,744,974) | $ | 416,983,503 | ||||||
| Shares | Rate | Value | ||||||||
Short-term Investment(c) – 2.1% | ||||||||||
| JPMorgan U.S. Government Money Market Fund — Capital Shares | ||||||||||
| 8,860,962 | 0.010 | % | $ | 8,860,962 | ||||||
(Cost $8,860,962) | ||||||||||
TOTAL INVESTMENTS BEFORE SECURITIES LENDING REINVESTMENT VEHICLE | ||||||||||
(Cost $339,605,936) | $ | 425,844,465 | ||||||||
Securities Lending Reinvestment Vehicle(c)(d) – 0.2% | ||||||||||
| Goldman Sachs Financial Square Money Market Fund — FST Shares | ||||||||||
| 819,500 | 0.099 | % | $ | 819,500 | ||||||
(Cost $819,500) | ||||||||||
TOTAL INVESTMENTS – 100.4% | ||||||||||
(Cost $340,425,436) | $ | 426,663,965 | ||||||||
LIABILITIES IN EXCESS OF OTHER ASSETS – (0.4)% | (1,891,449 | ) | ||||||||
NET ASSETS – 100.0% | $ | 424,772,516 | ||||||||
The percentage shown for each investment category reflects the value of investments in that category as a percentage of net assets.
| * | Non-income producing security. | |
| (a) | All or a portion of security is on loan. | |
| (b) | All or a portion of security is segregated as collateral for initial margin requirements on futures transactions. | |
| (c) | Variable rate security. Interest rate disclosed is that which is in effect at June 30, 2011. | |
| (d) | Represents an affiliated issuer. |
| ADDITIONAL INVESTMENT INFORMATION |
FUTURES CONTRACTS — At June 30, 2011, the following futures contracts were open:
| Number of | ||||||||||||||
| Contracts | Expiration | Current | Unrealized | |||||||||||
| Type | Long (Short) | Date | Value | Gain (Loss) | ||||||||||
S&P 500 E-mini Index | 99 | September 2011 | $ | 6,511,725 | $ | 243,862 | ||||||||
GOLDMAN SACHS VARIABLE INSURANCE TRUST STRUCTURED U.S. EQUITY FUND
Statement of Assets and Liabilities
June 30, 2011 (Unaudited)
Assets: | ||||
Investments in securities of unaffiliated issuers, at value (identified cost $339,605,936)(a) | $ | 425,844,465 | ||
| Investments in affiliated securities lending reinvestment vehicle, at value (identified cost $819,500) | 819,500 | |||
| Receivables: | ||||
| Dividends | 332,327 | |||
| Fund shares sold | 70,230 | |||
| Due from broker — variation margin | 67,571 | |||
| Reimbursement from investment adviser | 22,637 | |||
| Securities lending income | 1,161 | |||
| Other assets | 2,514 | |||
Total assets | 427,160,405 | |||
Liabilities: | ||||
| Payables: | ||||
| Payable upon return of securities loaned | 819,500 | |||
| Fund shares redeemed | 654,595 | |||
| Amounts owed to affiliates | 237,538 | |||
| Accrued expenses and other liabilities | 676,256 | |||
Total liabilities | 2,387,889 | |||
Net Assets: | ||||
| Paid-in capital | 561,959,352 | |||
| Accumulated undistributed net investment income | 3,592,573 | |||
| Accumulated net realized loss from investment and futures transactions | (227,261,800 | ) | ||
| Net unrealized gain on investments and futures | 86,482,391 | |||
NET ASSETS | $ | 424,772,516 | ||
| Net Assets: | ||||
| Institutional | $ | 313,074,677 | ||
| Service | 111,697,839 | |||
| Total Net Assets | $ | 424,772,516 | ||
| Shares of beneficial interest outstanding $0.001 par value (unlimited shares authorized): | ||||
| Institutional | 27,378,913 | |||
| Service | 9,766,512 | |||
| Net asset value, offering and redemption price per share: | ||||
| Institutional | $11.43 | |||
| Service | 11.44 | |||
| (a) | Includes loaned securities having a market value of $805,420. |
GOLDMAN SACHS VARIABLE INSURANCE TRUST STRUCTURED U.S. EQUITY FUND
Statement of Operations
For the Six Months Ended June 30, 2011 (Unaudited)
Investment income: | ||||
| Dividends (net of foreign taxes withheld of $173) | $ | 4,683,453 | ||
| Securities lending income — affiliated issuer | 5,946 | |||
Total investment income | 4,689,399 | |||
Expenses: | ||||
| Management fees | 1,336,788 | |||
| Distribution and Service fees — Service Class | 140,220 | |||
| Printing and mailing costs | 51,801 | |||
Transfer Agent fees(a) | 43,119 | |||
| Professional fees | 38,592 | |||
| Custody and accounting fees | 30,305 | |||
| Trustee fees | 8,644 | |||
| Other | 10,051 | |||
Total expenses | 1,659,520 | |||
| Less — expense reductions | (153,206 | ) | ||
Net expenses | 1,506,314 | |||
NET INVESTMENT INCOME | 3,183,085 | |||
Realized and unrealized gain from investment and futures transactions: | ||||
| Net realized gain from: | ||||
| Investment transactions | 16,065,978 | |||
| Futures transactions | 315,993 | |||
| Net change in unrealized gain on: | ||||
| Investments | 14,558,130 | |||
| Futures | 141,532 | |||
Net realized and unrealized gain from investment and futures transactions | 31,081,633 | |||
NET INCREASE IN NET ASSETS RESULTING FROM OPERATIONS | $ | 34,264,718 | ||
| (a) | Institutional and Service Shares had Transfer Agent fees of $31,902 and $11,217, respectively. |
GOLDMAN SACHS VARIABLE INSURANCE TRUST STRUCTURED U.S. EQUITY FUND
Statements of Changes in Net Assets
| For the | ||||||||
| Six Months Ended | For the | |||||||
| June 30, 2011 | Fiscal Year Ended | |||||||
| (Unaudited) | December 31, 2010 | |||||||
From operations: | ||||||||
| Net investment income | $ | 3,183,085 | $ | 5,975,139 | ||||
| Net realized gain from investment and futures transactions | 16,381,971 | 21,165,168 | ||||||
| Net change in unrealized gain on investments and futures | 14,699,662 | 23,637,904 | ||||||
Net increase in net assets resulting from operations | 34,264,718 | 50,778,211 | ||||||
Distributions to shareholders: | ||||||||
| From net investment income | ||||||||
| Institutional Shares | — | (4,505,171 | ) | |||||
| Service Shares | — | (1,334,105 | ) | |||||
Total distributions to shareholders | — | (5,839,276 | ) | |||||
From share transactions: | ||||||||
| Proceeds from sales of shares | 13,098,305 | 8,446,580 | ||||||
| Reinvestment of distributions | — | 5,839,276 | ||||||
| Cost of shares redeemed | (53,710,147 | ) | (81,171,074 | ) | ||||
Net decrease in net assets resulting from share transactions | (40,611,842 | ) | (66,885,218 | ) | ||||
TOTAL DECREASE | (6,347,124 | ) | (21,946,283 | ) | ||||
Net assets: | ||||||||
| Beginning of period | 431,119,640 | 453,065,923 | ||||||
| End of period | $ | 424,772,516 | $ | 431,119,640 | ||||
Accumulated undistributed net investment income | $ | 3,592,573 | $ | 409,488 | ||||
GOLDMAN SACHS VARIABLE INSURANCE TRUST STRUCTURED U.S. EQUITY FUND
Financial Highlights
Selected Data for a Share Outstanding Throughout Each Period
| Income (loss) from | ||||||||||||||||||||||||||||||||||||||||||||||||||||||||||
| investment operations | Distributions to shareholders | |||||||||||||||||||||||||||||||||||||||||||||||||||||||||
| Net | | Ratio of | Ratio of | |||||||||||||||||||||||||||||||||||||||||||||||||||||||
| Net asset | realized | From | Net asset | Net assets, | Ratio of | total | net investment | |||||||||||||||||||||||||||||||||||||||||||||||||||
| value, | Net | and | Total from | From net | net | value, | end of | net expenses | expenses | income | Portfolio | |||||||||||||||||||||||||||||||||||||||||||||||
| beginning | investment | unrealized | investment | investment | realized | Total | end of | Total | period | to average | to average | to average | turnover | |||||||||||||||||||||||||||||||||||||||||||||
| Year - Share Class | of period | income(a) | gain (loss) | operations | income | gains | distributions | period | return(b) | (in 000s) | net assets | net assets | net assets | rate | ||||||||||||||||||||||||||||||||||||||||||||
FOR THE SIX MONTHS ENDED JUNE 30, (UNAUDITED) | ||||||||||||||||||||||||||||||||||||||||||||||||||||||||||
| 2011 - Institutional | $ | 10.57 | $ | 0.08 | $ | 0.78 | $ | 0.86 | $ | — | $ | — | $ | — | $ | 11.43 | 8.23 | % | $ | 313,075 | 0.64 | %(c) | 0.70 | %(c) | 1.53 | %(c) | 16 | % | ||||||||||||||||||||||||||||||
| 2011 - Service | 10.58 | 0.07 | 0.79 | 0.86 | — | — | — | 11.44 | 8.13 | 111,698 | 0.85 | (c) | 0.95 | (c) | 1.32 | (c) | 16 | |||||||||||||||||||||||||||||||||||||||||
FOR THE FISCAL YEAR ENDED DECEMBER 31, | ||||||||||||||||||||||||||||||||||||||||||||||||||||||||||
| 2010 - Institutional | 9.50 | 0.14 | 1.08 | 1.22 | (0.15 | ) | — | (0.15 | ) | 10.57 | 12.84 | 319,948 | 0.64 | 0.70 | 1.45 | 38 | ||||||||||||||||||||||||||||||||||||||||||
| 2010 - Service | 9.51 | 0.12 | 1.08 | 1.20 | (0.13 | ) | — | (0.13 | ) | 10.58 | 12.60 | 111,171 | 0.85 | 0.95 | 1.25 | 38 | ||||||||||||||||||||||||||||||||||||||||||
| 2009 - Institutional | 7.99 | 0.15 | 1.54 | 1.69 | (0.18 | ) | — | (0.18 | ) | 9.50 | 21.15 | 340,536 | 0.68 | 0.72 | 1.75 | 136 | ||||||||||||||||||||||||||||||||||||||||||
| 2009 - Service | 8.00 | 0.13 | 1.54 | 1.67 | (0.16 | ) | — | (0.16 | ) | 9.51 | 20.89 | 112,530 | 0.89 | 0.97 | 1.53 | 136 | ||||||||||||||||||||||||||||||||||||||||||
| 2008 - Institutional | 13.16 | 0.17 | (5.06 | ) | (4.89 | ) | (0.18 | ) | (0.10 | ) | (0.28 | ) | 7.99 | (36.92 | ) | 344,144 | 0.71 | 0.72 | 1.53 | 110 | ||||||||||||||||||||||||||||||||||||||
| 2008 - Service | 13.16 | 0.14 | (5.04 | ) | (4.90 | ) | (0.16 | ) | (0.10 | ) | (0.26 | ) | 8.00 | (37.05 | ) | 106,586 | 0.92 | 0.97 | 1.34 | 110 | ||||||||||||||||||||||||||||||||||||||
| 2007 - Institutional | 14.67 | 0.15 | (0.37 | ) | (0.22 | ) | (0.16 | ) | (1.13 | ) | (1.29 | ) | 13.16 | (1.63 | ) | 752,148 | 0.71 | (d) | 0.72 | (d) | 1.02 | (d) | 125 | |||||||||||||||||||||||||||||||||||
| 2007 - Service | 14.67 | 0.14 | (0.37 | ) | (0.23 | ) | (0.15 | ) | (1.13 | ) | (1.28 | ) | 13.16 | (1.72 | ) | 205,997 | 0.79 | (d) | 0.97 | (d) | 0.94 | (d) | 125 | |||||||||||||||||||||||||||||||||||
| 2006 - Institutional | 13.13 | 0.14 | 1.55 | 1.69 | (0.15 | ) | — | (0.15 | ) | 14.67 | 12.89 | 910,345 | 0.72 | 0.72 | 1.01 | 99 | ||||||||||||||||||||||||||||||||||||||||||
| 2006 - Service (Commenced January 9, 2006) | 13.54 | 0.13 | 1.14 | 1.27 | (0.14 | ) | — | (0.14 | ) | 14.67 | 9.38 | 261,814 | 0.80 | (c) | 0.97 | (c) | 0.92 | (c) | 99 | |||||||||||||||||||||||||||||||||||||||
| (a) | Calculated based on the average shares outstanding methodology. | |
| (b) | Assumes investment at the net asset value at the beginning of the period, reinvestment of all distributions and a complete redemption of the investment at the net asset value at the end of the period. Total returns for periods less than one full year are not annualized. | |
| (c) | Annualized. | |
| (d) | Includes non-recurring expense for a special shareholder meeting which amounted to approximately 0.02% of average net assets. |
13
GOLDMAN SACHS VARIABLE INSURANCE TRUST STRUCTURED U.S. EQUITY FUND
Notes to Financial Statements
June 30, 2011 (Unaudited)
| 1. ORGANIZATION |
Goldman Sachs Variable Insurance Trust (the “Trust” or “VIT”) is a Delaware statutory trust registered under the Investment Company Act of 1940, as amended (the “Act”), as an open-end management investment company. The Trust includes the Goldman Sachs Structured U.S. Equity Fund (the “Fund”). The Fund is a diversified portfolio under the Act offering two classes of shares — Institutional and Service.
Goldman Sachs Asset Management, L.P. (“GSAM”), an affiliate of Goldman, Sachs & Co. (“Goldman Sachs”), serves as investment adviser to the Fund pursuant to a management agreement (the “Agreement”) with the Trust.
| 2. SIGNIFICANT ACCOUNTING POLICIES |
The following is a summary of the significant accounting policies consistently followed by the Fund. The preparation of financial statements in conformity with accounting principles generally accepted in the United States of America (“GAAP”) requires management to make estimates and assumptions that may affect the amounts and disclosures in the financial statements. Actual results could differ from those estimates and assumptions.
A. Investment Valuation — The investment valuation policy of the Fund is to value investments at market value. Investments in equity securities and investment companies traded on a United States (“U.S.”) securities exchange or the NASDAQ system are valued daily at their last sale price or official closing price on the principal exchange or system on which they are traded. If no sale occurs, such securities and investment companies are valued at the last bid price for long positions and at the last ask price for short positions. Debt securities for which market quotations are readily available are valued on the basis of quotations furnished by an independent pricing service approved by the trustees or provided by securities dealers. The pricing services may use valuation models or matrix pricing, which consider: (i) yield or price with respect to bonds that are considered comparable in characteristics such as rating, interest rate and maturity date or (ii) quotations from securities dealers to determine current value. If accurate quotations are not readily available, or if GSAM believes that such quotations do not accurately reflect fair value, the fair value of the Fund’s investments may be determined based on yield equivalents, a pricing matrix or other sources, under valuation procedures established by the trustees. Unlisted equity securities for which market quotations are available are valued at the last sale price on the valuation date, or if no sale occurs, at the last bid price. In the absence of market quotations, broker quotes will be utilized or the security will be fair valued. Investments in investment companies (other than those that are exchange traded) are valued at the net asset value per share (“NAV”) of the investment company on the valuation date. Short-term debt obligations that mature in sixty days or less and that do not exhibit signs of credit deterioration are valued at amortized cost, which approximates market value.
GSAM, consistent with its procedures and applicable regulatory guidance, may make an adjustment to the previous closing prices of either domestic or foreign securities in light of significant events to reflect what it believes to be the fair value of the securities at the time of determining the Fund’s NAV. Significant events that could affect a large number of securities in a particular market may include, but are not limited to: situations relating to one or more single issuers in a market sector; significant fluctuations in U.S. or foreign markets; market dislocations; market disruptions or market closings; equipment failures; natural or man-made disasters or acts of God; armed conflicts; government actions or other developments; as well as the same or similar events which may affect specific issuers or the securities markets even though not tied directly to the securities markets. Other significant events that could relate to a single issuer may include, but are not limited to: corporate actions such as reorganizations, mergers and buy-outs; corporate announcements, including those relating to earnings, products and regulatory news; significant litigation; low trading volume; and trading limits or suspensions.
B. Security and Fund Share Transactions, and Investment Income — Security and Fund share transactions are reflected for financial reporting purposes as of the trade date, which may cause the NAV as stated in the accompanying financial statements to be different than the NAV applied to Fund share transactions. Realized gains and losses on sales of portfolio securities are calculated using the identified cost basis. Dividend income is recognized on the ex-dividend date, net of foreign withholding taxes, if any, which are reduced by any amounts reclaimable by the Fund, where applicable. Certain dividends from foreign securities will be recorded when the Fund is informed of the dividend, if such information is obtained subsequent to the ex-dividend date.
GOLDMAN SACHS VARIABLE INSURANCE TRUST STRUCTURED U.S. EQUITY FUND
| 2. SIGNIFICANT ACCOUNTING POLICIES (continued) |
Interest income is recorded on the basis of interest accrued, premium amortized and discount accreted. In addition, it is the Fund’s policy to accrue for foreign capital gains taxes, if applicable, on certain foreign securities held by the Fund. An estimated foreign capital gains tax is recorded daily on net unrealized gains on these securities and is payable upon the sale of such securities when a gain is realized.
Investment income and unrealized and realized gains or losses are allocated daily to each class of shares of the Fund based upon the relative proportion of net assets of each class.
In addition, distributions received from the Fund’s investments in U.S. real estate investment trusts (“REITs”) often include a “return of capital”, which is recorded by the Fund as a reduction of the cost basis of the securities held. The Internal Revenue Code of 1986, as amended (the “Code”) requires a REIT to distribute at least 95% of its taxable income to investors. In many cases, however, because of “non-cash” expenses such as property depreciation, a REIT’s cash flow will exceed its taxable income. The REIT may distribute this excess cash to offer a more competitive yield. This portion of the Fund’s distributions is deemed a return of capital and is generally not taxable to shareholders.
C. Expenses — Expenses incurred by the Fund, which may not specifically relate to the Fund, may be shared with other registered investment companies having management agreements with GSAM or its affiliates, as appropriate. These expenses are allocated to the Fund on a straight-line and/or pro-rata basis depending upon the nature of the expenses and are accrued daily. Non-class specific expenses are allocated daily to each share class of the respective Fund based upon the relative proportion of net assets of each class. Class specific expenses, where applicable, are borne by the respective share classes and include Distribution and Service and Transfer Agent fees.
D. Federal Taxes and Distributions to Shareholders — It is the Fund’s policy to comply with the requirements of the Code, applicable to regulated investment companies (mutual funds) and to distribute each year substantially all of its investment company taxable income and capital gains to its shareholders. Accordingly, the Fund is not required to make any provisions for the payment of federal income tax. Distributions to shareholders are recorded on the ex-dividend date. Income and capital gains distributions, if any, are declared and paid annually.
Net capital losses are carried forward to future fiscal years and may be used to the extent allowed by the Code to offset any future capital gains. Utilization of capital loss carryforwards will reduce the requirement of future capital gains distributions.
The characterization of distributions to shareholders for financial reporting purposes is determined in accordance with federal income tax rules, which may differ from GAAP. The source of the Fund’s distributions may be shown in the accompanying financial statements as either from net investment income, net realized gain or capital. Certain components of the Fund’s net assets on the Statement of Assets and Liabilities reflect permanent GAAP/tax differences based on the appropriate tax character.
E. Futures Contracts — Futures contracts are valued at the last settlement price, or in the absence of a sale, the last bid price, at the end of each day on the board of trade or exchange upon which they are traded. Upon entering into a futures contract, the Fund deposits cash or securities in an account on behalf of the broker in an amount sufficient to meet the initial margin requirement. Subsequent payments are made or received by the Fund equal to the daily change in the contract value and are recorded as variation margin receivable or payable with a corresponding offset in unrealized gains or losses. The Fund recognizes a realized gain or loss when a contract is closed or expires.
The use of futures contracts involves, to varying degrees, elements of market and counterparty risk which may exceed the amounts recognized in the Statement of Assets and Liabilities. Futures contracts may be illiquid, and exchanges may limit fluctuations in futures contract prices during a single day. Changes in the value of a futures contract may not directly correlate with changes in the value of the underlying securities. These risks may decrease the effectiveness of the Fund’s strategies and potentially result in a loss. The Fund must set aside liquid assets, or engage in other appropriate measures, to cover its obligations under these contracts.
GOLDMAN SACHS VARIABLE INSURANCE TRUST STRUCTURED U.S. EQUITY FUND
Notes to Financial Statements (continued)
June 30, 2011 (Unaudited)
| 3. FAIR VALUE OF INVESTMENTS |
The fair value of a financial instrument is the amount that would be received to sell an asset or paid to transfer a liability in an orderly transaction between market participants at the measurement date (i.e., the exit price). GAAP establishes a fair value hierarchy that prioritizes the inputs to valuation techniques used to measure fair value. The hierarchy gives the highest priority to unadjusted quoted prices in active markets for identical assets or liabilities (Level 1 measurements) and the lowest priority to unobservable inputs (Level 3 measurements). The three levels of the fair value hierarchy are described below:
Level 1 — Unadjusted quoted prices in active markets that are accessible at the measurement date for identical, unrestricted assets or liabilities;
Level 2 — Quoted prices in markets that are not active or financial instruments for which significant inputs are observable (including, but not limited to, quoted prices for similar securities, interest rates, foreign exchange rates, volatility and credit spreads), either directly or indirectly;
Level 3 — Prices or valuations that require significant unobservable inputs (including GSAM’s assumptions in determining fair value measurement).
The following is a summary of the Fund’s investments and derivatives categorized in the fair value hierarchy as of June 30, 2011:
| Investment Type | Level 1 | Level 2 | Level 3 | |||||||||
Assets | ||||||||||||
Common Stock and/or Other Equity Investments | $ | 416,983,503 | $ | — | $ | — | ||||||
| Short-term Investment | 8,860,962 | — | — | |||||||||
| Securities Lending Reinvestment Vehicle | 819,500 | — | — | |||||||||
Total | $ | 426,663,965 | $ | — | $ | — | ||||||
| Derivatives Type | ||||||||||||
Assets | ||||||||||||
Futures Contracts(a) | $ | 243,862 | $ | — | $ | — | ||||||
| (a) | Amount shown represents unrealized gain (loss) at period end. |
| 4. INVESTMENTS IN DERIVATIVES |
The Fund may make investments in derivative instruments, including, but not limited to options, futures, swaps, swaptions and other derivatives relating to foreign currency transactions. A derivative is an instrument whose value is derived from underlying assets, indices, reference rates or a combination of these factors. Derivative instruments may be privately negotiated contracts (often referred to as over the counter (“OTC”) derivatives) or they may be listed and traded on an exchange. Derivative contracts may involve future commitments to purchase or sell financial instruments or commodities at specified terms on a specified date, or to exchange interest payment streams or currencies based on a notional or contractual amount. Derivative instruments may involve a high degree of financial risk. The use of derivatives also involves the risk of loss if the investment adviser is incorrect in its expectation of the timing or level of fluctuations in securities prices, interest rates or currency prices. Investments in derivative instruments also include the risk of default by the counterparty, the risk that the investment may not be liquid and the risk that a small movement in the price of the underlying security or benchmark may result in a disproportionately large movement, unfavorable or favorable, in the price of the derivative instrument.
During the six months ended June 30, 2011, the Fund entered into futures contracts. These instruments were used to meet the Fund’s investment objectives and to obtain and/or manage exposure related to the risks below. The following table sets forth, by certain risk types, the gross value of these derivative contracts for trading activities as of June 30, 2011. The values in the table below exclude the effects of cash collateral received or posted pursuant to these derivative contracts, and therefore are not representative of the Fund’s net exposure.
GOLDMAN SACHS VARIABLE INSURANCE TRUST STRUCTURED U.S. EQUITY FUND
| 4. INVESTMENTS IN DERIVATIVES (continued) |
| Statement of | ||||||||||
| Assets and Liabilities | ||||||||||
| Risk | Location | Assets | ||||||||
| Equity | Due from broker — variation margin | $ | 243,862(a | ) | ||||||
| (a) | Includes unrealized gain (loss) on futures contracts described in the Additional Investment Information section of the Schedule of Investments. Only current day’s variation margin is reported within the Statement of Assets and Liabilities. |
The following table sets forth, by certain risk types, the Fund’s gains (losses) related to these derivatives and their indicative volumes for the six months ended June 30, 2011. These gains (losses) should be considered in the context that these derivative contracts may have been executed to economically hedge certain securities, and accordingly, certain gains (losses) on such derivative contracts may offset certain (losses) gains attributable to securities. These gains (losses) are included in “Net realized gain (loss)” or “Net change in unrealized gain (loss)” on the Statement of Operations:
| Net | Net Change in | Average | |||||||||||||
| Realized | Unrealized | Number of | |||||||||||||
| Risk | Statement of Operations Location | Gain (Loss) | Gain (Loss) | Contracts(a) | |||||||||||
| Equity | Net realized gain (loss) from futures transactions/Net change in unrealized gain (loss) on futures | $ | 315,993 | $ | 141,532 | 122 | |||||||||
| (a) | Average number of contracts is based on the average of month end balances for the six months ended June 30, 2011. |
| 5. AGREEMENTS AND AFFILIATED TRANSACTIONS |
A. Management Agreement — Under the Agreement, GSAM manages the Fund, subject to the general supervision of the trustees.
As compensation for the services rendered pursuant to the Agreement, the assumption of the expenses related thereto and administration of the Fund’s business affairs, including providing facilities, GSAM is entitled to a management fee accrued daily and paid monthly, equal to an annual percentage rate of the Fund’s average daily net assets.
For the six months ended June 30, 2011, contractual management fees with GSAM were at the following rates:
| Contractual Management Rate | ||||||||||||||||||||
| First | Next | Next | Next | Over | Effective | |||||||||||||||
| $1 billion | $1 billion | $3 billion | $3 billion | $8 billion | Rate | |||||||||||||||
| 0.62% | 0.59 | % | 0.56 | % | 0.55 | % | 0.54 | % | 0.62 | % | ||||||||||
B. Distribution and Service Plan — The Trust, on behalf of the Service Shares of the Fund, has adopted a Distribution and Service Plan (the “Plan”). Under the Plan, Goldman Sachs, which serves as distributor, is entitled to a fee accrued daily and paid monthly for distribution services, which may then be paid by Goldman Sachs to authorized dealers, equal to, on an annual basis, 0.25% of the Fund’s average daily net assets attributable to Service Shares. Goldman Sachs has agreed to waive distribution and service fees so as not to exceed an annual rate of 0.21% of the Fund’s average daily net assets attributable to Service Shares. The distribution and service fee waiver will remain in place through at least April 29, 2012, and prior to such date Goldman Sachs may not terminate the arrangement without the approval of the trustees. For the six months ended June 30, 2011, Goldman Sachs waived approximately $22,400 in distribution and service fees for the Fund’s Services Shares.
C. Transfer Agency Agreement — Goldman Sachs also serves as the transfer agent of the Fund for a fee pursuant to a Transfer Agency Agreement. The fees charged for such transfer agency services are accrued daily and paid monthly at an annual rate of 0.02% of the average daily net assets for Institutional and Service Shares.
GOLDMAN SACHS VARIABLE INSURANCE TRUST STRUCTURED U.S. EQUITY FUND
Notes to Financial Statements (continued)
June 30, 2011 (Unaudited)
| 5. AGREEMENTS AND AFFILIATED TRANSACTIONS (continued) |
D. Other Expense Agreements and Affiliated Transactions — GSAM has agreed to limit certain “Other Expense” of the Fund (excluding management fees, distribution and service fees, transfer agent fees and expenses, taxes, interest, brokerage fees and litigation, indemnification, shareholder meetings and other extraordinary expenses, exclusive of any custody and transfer agent fee credit reductions) to the extent such expenses exceed, on an annual basis, 0.004% of the average daily net assets of the Fund. Such Other Expense reimbursements, if any, are accrued daily and paid monthly. In addition, the Fund is not obligated to reimburse GSAM for prior fiscal year expense reimbursements, if any. These Other Expense reimbursements will remain in place through at least April 29, 2012, and prior to such date GSAM may not terminate the arrangements without the approval of the trustees. For the six months ended June 30, 2011, GSAM reimbursed approximately $130,770 to the Fund.
As of June 30, 2011, the amounts owed to affiliates were approximately $211,900, $18,800 and $6,800 for management, distribution and service, and transfer agent fees, respectively.
E. Line of Credit Facility — As of June 30, 2011, the Fund participated in a $580,000,000 committed, unsecured revolving line of credit facility (the “facility”) together with other funds of the Trust and registered investment companies having management agreements with GSAM or its affiliates. Pursuant to the terms of the facility, the Fund and other borrowers could increase the credit amount by an additional $340,000,000, for a total of up to $920,000,000. This facility is to be used solely for temporary or emergency purposes. The interest rate on borrowings is based on the federal funds rate. The facility also requires a fee to be paid by the Fund based on the amount of the commitment that has not been utilized. For the six months ended June 30, 2011, the Fund did not have any borrowings under the facility.
F. Other Transactions with Affiliates — For the six months ended June 30, 2011, Goldman Sachs earned approximately $900 in brokerage commissions from portfolio transactions, including futures transactions executed with Goldman Sachs as the Futures Commission Merchant, on behalf of the Fund.
| 6. PORTFOLIO SECURITIES TRANSACTIONS |
The cost of purchases and proceeds from sales and maturities of long-term securities for the six months ended June 30, 2011, were $68,417,643 and $102,826,669, respectively.
| 7. SECURITIES LENDING |
Pursuant to exemptive relief granted by the Securities and Exchange Commission (“SEC”) and the terms and conditions contained therein, the Fund may lend its securities through a securities lending agent, Goldman Sachs Agency Lending (“GSAL”), a wholly-owned subsidiary of Goldman Sachs, to certain qualified borrowers including Goldman Sachs and affiliates. In accordance with the Fund’s securities lending procedures, the Fund receives cash collateral at least equal to the market value of the securities on loan. The market value of the loaned securities is determined at the close of business of the Fund at their last sale price or official closing price on the principal exchange or system on which they are traded, and any additional required collateral is delivered to the Fund on the next business day. As with other extensions of credit, the Fund may experience a delay in the recovery of its securities or incur a loss should the borrower of the securities breach its agreement with the Fund or become insolvent at a time when the collateral is insufficient to cover the cost of repurchasing securities on loan.
The Fund invests the cash collateral received in connection with securities lending transactions in the Goldman Sachs Financial Square Money Market Fund (“Money Market Fund”), a series of Goldman Sachs Trust, a Delaware statutory trust. The Money Market Fund, deemed an affiliate of the Trust, is registered under the Act as an open end investment company, is subject to Rule 2a-7 under the Act, and is managed by GSAM, for which GSAM may receive an investment advisory fee of up to 0.205% on an annualized basis of the average daily net assets of the Money Market Fund.
Both the Fund and GSAL receive compensation relating to the lending of the Fund’s securities. The amount earned by the Fund for the six months ended June 30, 2011, is reported under Investment Income on the Statement of Operations. For the six months ended June 30, 2011, GSAL earned $664 in fees as securities lending agent.
GOLDMAN SACHS VARIABLE INSURANCE TRUST STRUCTURED U.S. EQUITY FUND
| 7. SECURITIES LENDING (continued) |
The following table provides information about the Fund’s investment in the Money Market Fund for the six months ended June 30, 2011 (in thousands):
| Number of | Number of | |||||||||||||||
| Shares Held | Shares Held | Value at End | ||||||||||||||
| Beginning of Period | Shares Bought | Shares Sold | End of Period | of Period | ||||||||||||
| 644 | 1,286 | (1,110 | ) | 820 | $ | 820 | ||||||||||
| 8. TAX INFORMATION |
As of the Fund’s most recent fiscal year end, December 31, 2010, the Fund’s capital loss carryforwards on a tax-basis were as follows:
Capital loss carryforward:(1) | ||||
| Expiring 2016 | $ | (100,034,314 | ) | |
| Expiring 2017 | (139,998,215 | ) | ||
| Total capital loss carryforward | $ | (240,032,529 | ) | |
| (1) | Expiration occurs on December 31 of the year indicated. |
As of June 30, 2011, the Fund’s aggregate security unrealized gains and losses based on cost for U.S. federal income tax purposes were as follows:
| Tax cost | $ | 343,934,348 | ||
| Gross unrealized gain | 90,471,127 | |||
| Gross unrealized loss | (7,741,510 | ) | ||
| Net unrealized security gain | $ | 82,729,617 | ||
The difference between GAAP-basis and tax-basis unrealized gains (losses), as of the most recent fiscal year end, is attributable primarily to wash sales and net mark to market gains (losses) on regulated futures contracts.
GSAM has reviewed the Fund’s tax positions for all open tax years (the current and prior three years, as applicable) and has concluded that no provision for income tax is required in the Fund’s financial statements. Such open tax years remain subject to examination and adjustment by tax authorities.
Under the recently enacted Regulated Investment Company Modernization Act of 2010, the Fund will be permitted to carry forward capital losses incurred in taxable years beginning after December 22, 2010 for an unlimited period. However, any losses incurred during those future taxable years will be required to be utilized prior to the losses incurred in pre-enactment taxable years. As a result of this ordering rule, pre-enactment capital loss carryforwards may be more likely to expire unused. Additionally, post-enactment capital losses that are carried forward will retain their character as either short-term or long-term capital losses rather than being considered all short-term as under previous law.
| 9. OTHER RISKS |
Fund’s Shareholder Concentration Risk — Certain participating insurance companies, accounts, or Goldman Sachs affiliates may from time to time own (beneficially or of record) or control a significant percentage of the Fund’s shares. Redemptions by these entities of their holdings in the Fund may impact the Fund’s liquidity and NAV. These redemptions may also force the Fund to sell securities.
GOLDMAN SACHS VARIABLE INSURANCE TRUST STRUCTURED U.S. EQUITY FUND
Notes to Financial Statements (continued)
June 30, 2011 (Unaudited)
| 9. OTHER RISKS (continued) |
Liquidity Risk — The Fund may make investments that may be illiquid or that may become less liquid in response to market developments or adverse investor perceptions. Liquidity risk may also refer to the risk that a Fund will not be able to pay redemption proceeds within the allowable time period because of unusual market conditions, an unusually high volume of redemption requests, or other reasons. To meet redemption requests, a Fund may be forced to sell investments at an unfavorable time and/or under unfavorable conditions.
Market and Credit Risks — In the normal course of business, the Fund trades financial instruments and enters into financial transactions where risk of potential loss exists due to changes in the market (market risk). Additionally, the Fund may also be exposed to credit risk in the event that an issuer fails to perform or that an institution or entity with which the Fund has unsettled or open transaction defaults.
| 10. INDEMNIFICATIONS |
Under the Trust’s organizational documents, its trustees, officers, employees and agents are indemnified, to the extent permitted by the Act, against certain liabilities that may arise out of performance of their duties to the Fund. Additionally, in the course of business, the Fund enters into contracts that contain a variety of indemnification clauses. The Fund’s maximum exposure under these arrangements is unknown, as this would involve future claims that may be made against the Fund that have not yet occurred. However, GSAM believes the risk of loss under these arrangements to be remote.
| 11. SUBSEQUENT EVENTS |
Subsequent events after the balance sheet date have been evaluated through the date the financial statements were issued. GSAM has concluded that there is no impact requiring adjustment or disclosure in the financial statements.
GOLDMAN SACHS VARIABLE INSURANCE TRUST STRUCTURED U.S. EQUITY FUND
| 12. SUMMARY OF SHARE TRANSACTIONS |
Share activity is as follows:
| For the Six Months Ended | ||||||||||||||||
| June 30, 2011 | For the Fiscal Year Ended | |||||||||||||||
| (Unaudited) | December 31, 2010 | |||||||||||||||
| Shares | Dollars | Shares | Dollars | |||||||||||||
Institutional Shares | ||||||||||||||||
| Shares sold | 131,265 | $ | 9,586,250 | 635,836 | $ | 5,898,249 | ||||||||||
| Reinvestment of distributions | — | — | 426,626 | 4,505,171 | ||||||||||||
| Shares redeemed | (3,027,868 | ) | (41,931,501 | ) | (6,622,266 | ) | (64,503,333 | ) | ||||||||
| (2,896,603 | ) | (32,345,251 | ) | (5,559,804 | ) | (54,099,913 | ) | |||||||||
Service Shares | ||||||||||||||||
| Shares sold | 55,463 | 3,512,055 | 264,407 | 2,548,331 | ||||||||||||
| Reinvestment of distributions | — | — | 126,097 | 1,334,105 | ||||||||||||
| Shares redeemed | (796,054 | ) | (11,778,646 | ) | (1,710,786 | ) | (16,667,741 | ) | ||||||||
| (740,591 | ) | (8,266,591 | ) | (1,320,282 | ) | (12,785,305 | ) | |||||||||
NET DECREASE | (3,637,194 | ) | $ | (40,611,842 | ) | (6,880,086 | ) | $ | (66,885,218 | ) | ||||||
GOLDMAN SACHS VARIABLE INSURANCE TRUST STRUCTURED U.S. EQUITY FUND
Statement Regarding Basis for Approval of Management Agreement (Unaudited)
Background
The Goldman Sachs Structured U.S. Equity Fund (the “Fund”) is an investment portfolio of Goldman Sachs Variable Insurance Trust (the “Trust”). The Board of Trustees oversees the management of the Trust and reviews the investment performance and expenses of the Fund at regularly scheduled meetings held during the year. In addition, the Board of Trustees determines annually whether to approve the continuance of the Trust’s investment management agreement (the “Management Agreement”) with Goldman Sachs Asset Management, L.P. (the “Investment Adviser”) on behalf of the Fund.
The Management Agreement was most recently approved for continuation until June 30, 2012 by the Board of Trustees, including those Trustees who are not parties to the Management Agreement or “interested persons” (as defined in the Investment Company Act of 1940, as amended) of any party thereto (the “Independent Trustees”), at a meeting held on June 15-16, 2011 (the “Annual Meeting”).
The review process undertaken by the Trustees spans the course of the year and culminates with the Annual Meeting. To assist the Trustees in their deliberations, the Trustees have established a Contract Review Committee (the “Committee”), comprised of the Independent Trustees. The Committee held three meetings over the course of the year since the Management Agreement was last approved. At those Committee meetings, regularly scheduled Board meetings and/or the Annual Meeting, the Board, or the Independent Trustees, as applicable, considered matters relating to the Management Agreement, including:
| (a) | the nature and quality of the advisory, administrative and other services provided to the Fund by the Investment Adviser and its affiliates, including information about: |
| (i) | the structure, staff and capabilities of the Investment Adviser and its portfolio management teams; | |
| (ii) | the groups within the Investment Adviser and its affiliates that support the portfolio management teams or provide other types of necessary services, including fund services groups (e.g., accounting and financial reporting, tax, shareholder services and operations), controls and risk management groups (e.g., legal, compliance, valuation oversight, credit risk management, internal audit, market risk analysis, finance and strategy and central funding), sales and distribution support groups and others (e.g., information technology and training); | |
| (iii) | trends in headcount; | |
| (iv) | the Investment Adviser’s financial resources and ability to hire and retain talented personnel and strengthen its operations; and | |
| (v) | the parent company’s support of the Investment Adviser and its mutual fund business, as expressed by the firm’s senior management; |
| (b) | information on the investment performance of the Fund, including comparisons to the performance of similar mutual funds, as provided by a third party mutual fund data provider engaged as part of the contract review process (the “Outside Data Provider”), and its benchmark performance index, and general investment outlooks in the markets in which the Fund invests; | |
| (c) | the terms of the Management Agreement and agreements with affiliated service providers entered into by the Trust on behalf of the Fund; | |
| (d) | expense information for the Fund, including: |
| (i) | the relative management fee and expense level of the Fund as compared to those of comparable funds managed by other advisers, as provided by the Outside Data Provider; | |
| (ii) | the Fund’s expense trends over time; and | |
| (iii) | to the extent the Investment Adviser manages institutional accounts or collective investment vehicles having investment objectives and policies similar to those of the Fund, comparative information on the advisory fees charged and services provided to those accounts by the Investment Adviser; |
GOLDMAN SACHS VARIABLE INSURANCE TRUST STRUCTURED U.S. EQUITY FUND
Statement Regarding Basis for Approval of Management Agreement (Unaudited) (continued)
| (e) | with respect to the extensive investment performance and expense comparison data provided by the Outside Data Provider, its processes in producing that data for the Fund; | |
| (f) | the undertakings of the Investment Adviser and Goldman, Sachs & Co. (“Goldman Sachs”), the Fund’s affiliated distributor, to reimburse certain expenses of the Fund and waive certain distribution and service fees that exceed specified levels, and a summary of contractual fee reductions made by the Investment Adviser and its affiliates over the past several years with respect to the Fund; | |
| (g) | information relating to the profitability of the Management Agreement and the transfer agency and distribution and service arrangements of the Fund and the Trust as a whole to the Investment Adviser and its affiliates; | |
| (h) | whether the Fund’s existing management fee schedule adequately addressed any economies of scale; | |
| (i) | a summary of the “fall-out” benefits derived by the Investment Adviser and its affiliates from their relationships with the Fund, including the fees received by the Investment Adviser’s affiliates from the Fund for transfer agency, securities lending, portfolio brokerage, distribution and other services; | |
| (j) | a summary of potential benefits derived by the Fund as a result of its relationship with the Investment Adviser; | |
| (k) | information regarding commissions paid by the Fund, portfolio trading and how the Investment Adviser carries out its duty to seek best execution; | |
| (l) | the manner in which portfolio manager compensation is determined, and the number and types of accounts managed by the portfolio managers; | |
| (m) | the nature and quality of the services provided to the Fund by its unaffiliated service providers, and the Investment Adviser’s general oversight and evaluation (including reports on due diligence) of those service providers as part of the administration services provided under the Management Agreement; and | |
| (n) | the Investment Adviser’s processes and policies addressing various types of potential conflicts of interest; its approach to risk management; the annual review of the effectiveness of the Fund’s compliance program; and compliance reports. |
The Trustees also received an overview of the Fund’s distribution arrangements. They received information regarding the Fund’s assets, share purchase and redemption activity and the payment of Rule 12b-1 distribution and service fees by the Fund’s Service Shares. Information was also provided to the Trustees relating to revenue sharing payments made by and services provided by the Investment Adviser and its affiliates to intermediaries that promote the sale, distribution and/or servicing of Fund shares.
The presentations made at the Board and Committee meetings and at the Annual Meeting encompassed the Fund and other mutual fund portfolios for which the Board of Trustees has responsibility. In evaluating the Management Agreement at the Annual Meeting, the Trustees relied upon their knowledge, resulting from their meetings and other interactions throughout the year, of the Investment Adviser, its affiliates, their services and the Fund. In conjunction with these meetings, the Trustees received written materials and oral presentations on the topics covered, and were advised by their independent legal counsel regarding their responsibilities and other regulatory requirements related to the approval and continuation of mutual fund investment management agreements under applicable law. In addition, the Investment Adviser and its affiliates provided the Independent Trustees with a written response to a formal request for information sent on behalf of the Independent Trustees by their independent legal counsel. During the course of their deliberations, the Independent Trustees met in executive sessions with their independent legal counsel, without representatives of the Investment Adviser or its affiliates present. The Independent Trustees also discussed the broad range of other investment choices that are available to Fund investors, including the availability of comparable funds managed by other advisers.
GOLDMAN SACHS VARIABLE INSURANCE TRUST STRUCTURED U.S. EQUITY FUND
Statement Regarding Basis for Approval of Management Agreement (Unaudited) (continued)
Nature, Extent and Quality of the Services Provided Under the Management Agreement
As part of their review, the Trustees considered the nature, extent and quality of the services provided by the Investment Adviser. In this regard, the Trustees considered both the investment advisory services, and the other, non-advisory services, that are provided to the Fund by the Investment Adviser and its affiliates. The Trustees noted the transition in the leadership and changes in personnel of various portfolio management teams, including the portfolio management team managing the Fund, that had occurred in recent periods, the potential benefit to the Fund of recent increases in headcount at the Investment Adviser and the ongoing recruitment efforts aimed at bringing high quality investment talent to the Investment Adviser. The Independent Trustees concluded that the Investment Adviser had committed substantial financial and operational resources to the Fund and expressed confidence that the Investment Adviser would continue to do so in the future. The Trustees also observed that the Investment Adviser had made significant commitments to address regulatory compliance requirements applicable to the Fund and the Investment Adviser.
Investment Performance
The Trustees also considered the investment performance of the Fund and the Investment Adviser. In this regard, they compared the Fund to its peers using the performance rankings and ratings compiled by the Outside Data Provider as of December 31, 2010, and updated performance information prepared by the Investment Adviser using the peer groups identified by the Outside Data provider. The information on the Fund’s investment performance was provided for the one-, three-, five- and ten-year periods ending on the applicable dates. The Trustees also reviewed the Fund’s investment performance over time on a year-by-year basis relative to its performance benchmark. In addition, they considered the investment performance trends of the Fund over time, and reviewed the investment performance of the Fund in light of its investment objective and policies, and market conditions. The Trustees considered whether the Fund had operated within its investment policies and had complied with its investment limitations.
In addition, the Trustees considered materials prepared and presentations made by the Investment Adviser’s senior management and portfolio management personnel, in which Fund performance was assessed. The Trustees also considered the Investment Adviser’s periodic reports with respect to the Fund’s risk profile, and how the Investment Adviser’s approach to risk monitoring and management influences portfolio management.
The Independent Trustees noted that for the one-year period ended May 31, 2011, the Fund ranked in the top half of its peer group. The Independent Trustees observed that the Fund had performance that was in the bottom half of its peer group for multiple time periods of greater than one-year. The Independent Trustees also noted that in response to market turmoil in 2009, the Investment Adviser had implemented measures intended to improve Fund performance, including adjusting the Quantitative Investment Strategies (“QIS”) team’s investment process used to manage the Fund (which among other things included changes in trading strategies and enhancements to the models) and making certain changes to the QIS team’s personnel, and that the changes seemed to have had a positive effect on performance. They recognized that despite some recent turnover in senior personnel on the QIS team, the team was dedicated to both retaining talent and attracting high quality new talent. The Independent Trustees also noted that they had received assurances from the Investment Adviser’s senior management that measures would continue to be taken to address the Fund’s performance.
GOLDMAN SACHS VARIABLE INSURANCE TRUST STRUCTURED U.S. EQUITY FUND
Statement Regarding Basis for Approval of Management Agreement (Unaudited) (continued)
Costs of Services Provided and Competitive Information
The Trustees considered the contractual fee rates payable by the Fund under the Management Agreement. In this regard, the Trustees considered information on the services rendered by the Investment Adviser to the Fund, which included both advisory and administrative services that were directed to the needs and operations of the Fund as a registered mutual fund.
In particular, the Trustees reviewed analyses prepared by the Outside Data Provider regarding the expense rankings of the Fund. The analyses provided a comparison of the Fund’s management fees and breakpoints to those of a relevant peer group and category universe; an expense analysis which compared the Fund’s expenses to a peer group and a category universe; and a five-year history comparing the Fund’s expenses to the peer and category medians. The analyses also compared the Fund’s transfer agency fees, custody and accounting fees, distribution fees, other expenses and fee waivers/reimbursements to those of other funds in the peer group and the peer group median. The Trustees concluded that the comparisons provided by the Outside Data Provider were useful in evaluating the reasonableness of the management fees and total expenses paid by the Fund.
In addition, the Trustees considered the Investment Adviser’s undertaking to limit the Fund’s “other expenses” ratio (excluding certain expenses) to a certain specified level and Goldman Sachs’ undertaking to waive a portion of the distribution and service fees paid by the Fund’s Service Shares. They also considered, to the extent that the Investment Adviser manages institutional accounts or collective investment vehicles having investment objectives and policies similar to those of the Fund, comparative fee information for services provided by the Investment Adviser to those accounts, and information that indicated that services provided to the Fund differed in various significant respects from the services provided to institutional accounts, which generally operated under less stringent legal and regulatory structures, required fewer services from the Investment Adviser to a smaller number of client contact points, were less time-intensive and paid lower fees. By contrast, the Trustees noted that the Investment Adviser provides substantial administrative services to the Fund under the terms of the Management Agreement.
In addition, the Trustees noted that shareholders are able to redeem their Fund shares at any time if they believe that the Fund fees and expenses are too high or if they are dissatisfied with the performance of the Fund.
Profitability
The Trustees reviewed the Investment Adviser’s revenues and pre-tax profit margins with respect to the Trust and the Fund. In this regard the Trustees noted that they had received, among other things, profitability analyses and summaries, revenue and expense schedules by Fund and by function (i.e., investment management, transfer agency and distribution and service) and the Investment Adviser’s expense allocation methodology. They observed that the profitability and expense figures are substantially similar to those used by the Investment Adviser for many internal purposes, including compensation decisions among various business groups, and are thus subject to a vigorous internal debate about how certain revenue and expenses should be allocated. The Trustees also reviewed the report of the internal audit group within the Goldman Sachs organization, which included an assessment of the reasonableness and consistency of the Investment Adviser’s expense allocation methodology and an evaluation of the accuracy of the Investment Adviser’s profitability analysis calculations. Profitability data for the Trust and the Fund were provided for 2010 and 2009, and the Trustees considered this information in relation to the Investment Adviser’s overall profitability. The Trustees considered the Investment Adviser’s revenues and pre-tax profit margins both in absolute terms and in comparison to information on the reported pre-tax profit margins earned by certain other asset management firms.
GOLDMAN SACHS VARIABLE INSURANCE TRUST STRUCTURED U.S. EQUITY FUND
Statement Regarding Basis for Approval of Management Agreement (Unaudited) (continued)
Economies of Scale
The Trustees considered the information that had been provided regarding the Investment Adviser’s profitability and the rationale for the Fund’s breakpoint structure. The Trustees also considered the breakpoints in the fee rate payable under the Management Agreement for the Fund at the following annual percentage rates of the average daily net assets of the Fund:
| First $1 billion | 0.62 | % | ||
| Next $1 billion | 0.59 | |||
| Next $3 billion | 0.56 | |||
| Next $3 billion | 0.55 | |||
| Over $8 billion | 0.54 |
The Trustees noted that the breakpoints at the $5 and $8 billion asset levels had been proposed by the Investment Adviser and approved by the Trustees in 2008 to further share potential economies of scale, if any, with the Fund and its shareholders as assets under management reach those asset levels. The Trustees considered the amounts of assets in the Fund; the Fund’s recent share purchase and redemption activity; the information provided by the Investment Adviser relating to the costs of the services provided by the Investment Adviser and its affiliates and their realized profits; information comparing fee rates charged by the Investment Adviser with fee rates charged to other funds in the peer group; and the Investment Adviser’s and Goldman Sachs’ undertakings to limit the Fund’s fees and “other expenses” ratio (excluding certain expenses) to a certain amount. Upon reviewing these matters at the Annual Meeting, the Trustees concluded that the fee breakpoints represented a means of assuring that benefits of scalability would be passed along to shareholders at the specified asset levels.
Other Benefits to the Investment Adviser and Its Affiliates
The Trustees also considered the other benefits derived by the Investment Adviser and its affiliates from their relationship with the Fund as stated above, including: (a) transfer agency fees received by Goldman Sachs; (b) brokerage and futures commissions earned by Goldman Sachs for executing securities and futures transactions on behalf of the Fund; (c) trading efficiencies resulting from aggregation of orders of the Fund with those for other funds or accounts managed by the Investment Adviser; (d) fees earned by Goldman Sachs Agency Lending, an affiliate of the Investment Adviser, as securities lending agent (and fees earned by the Investment Adviser for managing the portfolio in which the Fund’s cash collateral is invested); (e) the Investment Adviser’s ability to leverage the infrastructure designed to service the Fund on behalf of its other clients; (f) the Investment Adviser’s ability to cross-market other products and services to Fund shareholders; (g) Goldman Sachs’ retention of certain fees as Fund Distributor; (h) the Investment Adviser’s ability to negotiate better pricing with custodians on behalf of its other clients, as a result of the relationship with the Fund; and (i) the possibility that the working relationship between the Investment Adviser and the Fund’s third party service providers may cause those service providers to be open to doing business with other areas of Goldman Sachs. In the course of considering the foregoing, the Independent Trustees requested and received further information quantifying certain of the fall-out benefits. In looking at the benefits to Goldman Sachs Agency Lending and the Investment Adviser from the securities lending program, they noted that the Fund also benefited from its participation in the securities lending program.
GOLDMAN SACHS VARIABLE INSURANCE TRUST STRUCTURED U.S. EQUITY FUND
Statement Regarding Basis for Approval of Management Agreement (Unaudited) (continued)
Other Benefits to the Fund and Its Shareholders
The Trustees also noted that the Fund receives certain potential benefits as a result of its relationship with the Investment Adviser, including: (a) trading efficiencies resulting from aggregation of orders of the Fund with those of other funds or accounts managed by the Investment Adviser; (b) improved servicing and pricing from vendors because of the volume of business generated by the Investment Adviser and its affiliates; (c) improved servicing from broker-dealers because of the volume of business generated by the Investment Adviser and its affiliates; (d) the Investment Adviser’s ability to negotiate favorable terms with derivatives counterparties as a result of the size and reputation of the Goldman Sachs organization; (e) the advantages gained from the Investment Adviser’s knowledge and experience gained from managing other accounts and products; (f) the Investment Adviser’s ability to hire and retain qualified personnel to provide services to the Fund because of the reputation of the Goldman Sachs organization; (g) the Fund’s access, through the Investment Adviser, to certain firmwide resources (e.g., proprietary databases); and (h) the Fund’s access to certain affiliated distribution channels. The Trustees noted the competitive nature of the mutual fund marketplace, and noted further that many of the Fund’s shareholders invested in the Fund in part because of the Fund’s relationship with the Investment Adviser and that those shareholders have a general expectation that the relationship will continue.
Conclusion
In connection with their consideration of the Management Agreement, the Trustees gave weight to each of the factors described above, but did not identify any particular factor as controlling their decision. After deliberation and consideration of all of the information provided, including the factors described above, the Trustees concluded, in the exercise of their business judgment, that the management fees paid by the Fund were reasonable in light of the services provided to it by the Investment Adviser, the Investment Adviser’s costs and the Fund’s current and reasonably foreseeable asset levels. The Trustees unanimously concluded that the Investment Adviser’s continued management likely would benefit the Fund and its shareholders and that the Management Agreement should be approved and continued with respect to the Fund until June 30, 2012.
GOLDMAN SACHS VARIABLE INSURANCE TRUST STRUCTURED U.S. EQUITY FUND
Fund Expenses — Six Month Period Ended June 30, 2011 (Unaudited)
As a shareholder of Institutional or Service Shares of the Fund, you incur ongoing costs, including management fees, distribution and service (12b-1) fees (with respect to Service Shares) and other Fund expenses. This example is intended to help you understand your ongoing costs (in dollars) of investing in the Institutional Shares and Service Shares of the Fund and to compare these costs with the ongoing costs of investing in other mutual funds.
The example is based on an investment of $1,000 invested at the beginning of the period and held for the entire period from January 1, 2011 through June 30, 2011.
Actual Expenses — The first line under each share class in the table below provides information about actual account values and actual expenses. You may use the information in this line, together with the amount you invested, to estimate the expenses that you paid over the period. Simply divide your account value by $1,000 (for example, an $8,600 account value divided by $1,000=8.6), then multiply the result by the number in the first line under the heading entitled “Expenses Paid” to estimate the expenses you paid on your account during this period.
Hypothetical Example for Comparison Purposes — The second line under each share class in the table below provides information about hypothetical account values and hypothetical expenses based on the Fund’s actual net expense ratio and an assumed rate of return of 5% per year before expenses, which is not the Fund’s actual return. The hypothetical account values and expenses may not be used to estimate the actual ending account balance or expenses you paid for the period. You may use this information to compare the ongoing costs of investing in the Fund and other funds. To do so, compare this 5% hypothetical example with the 5% hypothetical examples that appear in the shareholder reports of the other funds.
Please note that the expenses shown in the table are meant to highlight your ongoing costs only. As a shareholder of the Fund, you do not incur any transaction costs, such as sales charges (loads), redemption fees, or exchange fees, but shareholders of other funds may incur such costs. The second line of the table is useful in comparing ongoing costs only, and will not help you determine the relative total costs of owning different funds whose shareholders may incur transaction costs.
| Expenses Paid | |||||||||||||||
| for the | |||||||||||||||
| Beginning | Ending | 6 Months | |||||||||||||
| Account Value | Account Value | Ended | |||||||||||||
| Share Class | 1/01/11 | 6/30/11 | 6/30/11* | ||||||||||||
Institutional | |||||||||||||||
| Actual | $ | 1,000 | $ | 1,082.30 | $ | 3.30 | |||||||||
| Hypothetical 5% return | 1,000 | 1,021.62 | + | 3.21 | |||||||||||
Service | |||||||||||||||
| Actual | 1,000 | 1,081.30 | 4.39 | ||||||||||||
| Hypothetical 5% return | 1,000 | 1,020.58 | + | 4.26 | |||||||||||
| * | Expenses for each share class are calculated using the Fund’s annualized net expense ratio for each class, which represents the ongoing expenses as a percentage of net assets for the six months ended June 30, 2011. Expenses are calculated by multiplying the annualized net expense ratio by the average account value for the period; then multiplying the result by the number of days in the most recent fiscal half year; and then dividing that result by the number of days in the fiscal year. The annualized net expense ratios for the period were 0.64% and 0.85% for Institutional and Service Shares, respectively. | |
| + | Hypothetical expenses are based on the Fund’s actual annualized net expense ratios and an assumed rate of return of 5% per year before expenses. |
| TRUSTEES Ashok N. Bakhru, Chairman Donald C. Burke John P. Coblentz, Jr. Diana M. Daniels Joseph P. LoRusso James A. McNamara Jessica Palmer Alan A. Shuch Richard P. Strubel | OFFICERS James A. McNamara, President George F. Travers, Principal Financial Officer Peter V. Bonanno, Secretary Scott M. McHugh, Treasurer | |
| GOLDMAN, SACHS & CO. Distributor and Transfer Agent | ||
| GOLDMAN SACHS ASSET MANAGEMENT, L.P. Investment Adviser 200 West Street, New York, New York 10282 | ||
| Visit our website at www.goldmansachsfunds.com/vit to obtain the most recent month-end returns. | ||
| The reports concerning the Fund included in this shareholder report may contain certain forward-looking statements about the factors that may affect the performance of the Fund in the future. These statements are based on Fund management’s predictions and expectations concerning certain future events and their expected impact on the Fund, such as performance of the economy as a whole and of specific industry sectors, changes in the levels of interest rates, the impact of developing world events, and other factors that may influence the future performance of the Fund. Management believes these forward-looking statements to be reasonable, although they are inherently uncertain and difficult to predict. Actual events may cause adjustments in portfolio management strategies from those currently expected to be employed. | ||
| A description of the policies and procedures that the Fund uses to determine how to vote proxies relating to portfolio securities and information regarding how the Fund voted proxies relating to portfolio securities during the most recent 12-month period ended June 30 is available (i) without charge, upon request by calling 1-800-621-2550; and (ii) on the Securities and Exchange Commission (“SEC”) website at http://www.sec.gov. | ||
| The Fund files its complete schedule of portfolio holdings with the SEC for the first and third quarters of each fiscal year on Form N-Q. The Fund’s Form N-Q is available on the SEC’s website at http://www.sec.gov within 60 days after the Fund’s first and third fiscal quarters. When available, the Fund’s Forms N-Q may be reviewed and copied at the SEC’s Public Reference Room in Washington, D.C. and information on the operation of the Public Reference Room may also be obtained by calling 1-800-SEC-0330. Forms N-Q may be obtained upon request and without charge by calling 1-800-621-2550. | ||
| Holdings and allocations shown may not be representative of current or future investments. Holdings and allocations may not include the Fund’s entire investment portfolio, which may change at any time. Fund holdings should not be relied on in making investment decisions and should not be construed as research or investment advice regarding particular securities. | ||
| Economic and market forecasts presented herein reflect our judgment as of the date of this presentation and are subject to change without notice. These forecasts do not take into account the specific investment objectives, restrictions, tax and financial situation or other needs of any specific client. Actual data will vary and may not be reflected here. These forecasts are subject to high levels of uncertainty that may affect actual performance. Accordingly, these forecasts should be viewed as merely representative of a broad range of possible outcomes. These forecasts are estimated, based on assumptions, and are subject to significant revision and may change materially as economic and market conditions change. Goldman Sachs has no obligation to provide updates or changes to these forecasts. Case studies and examples are for illustrative purposes only. | ||
| The Global Industry Classification Standard (“GICS”) was developed by and is the exclusive property and a service mark of Morgan Stanley Capital International Inc. (“MSCI”) and Standard & Poor’s, a division of The McGraw-Hill Companies, Inc. (“S&P”) and is licensed for use by Goldman Sachs. Neither MSCI, S&P nor any other party involved in making or compiling the GICS or any GICS classifications makes any express or implied warranties or representations with respect to such standard or classification (or the results to be obtained by the use thereof), and all such parties hereby expressly disclaim all warranties of originality, accuracy, completeness, merchantability or fitness for a particular purpose with respect to any of such standard or classification. Without limiting any of the foregoing, in no event shall MSCI, S&P, any of their affiliates or any third party involved in making or compiling the GICS or any GICS classifications have any liability for any direct, indirect, special, punitive, consequential or any other damages (including lost profits) even if notified of the possibility of such damages. | ||
| The portfolio risk management process includes an effort to monitor and manage risk, but does not imply low risk. | ||
| Shares of the Goldman Sachs VIT Funds are offered to separate accounts of participating life insurance companies for the purpose of funding variable annuity contracts and variable life insurance policies. Shares of the Fund are not offered directly to the general public. The variable annuity contracts and variable life insurance policies are described in the separate prospectuses issued by participating insurance companies. You should refer to those prospectuses for information about surrender charges, mortality and expense risk fees and other charges that may be assessed by participating insurance companies under the variable annuity contracts or variable life insurance policies. Such fees or charges, if any, may affect the return you may realize with respect to your investments. Ask your representative for more complete information. Please consider a fund’s objectives, risks and charges and expenses, and read the prospectus carefully before investing. The prospectus contains this and other information about the Fund. | ||
| This material is not authorized for distribution to prospective investors unless preceded or accompanied by a current Prospectus or summary prospectus, if applicable. Investors should consider a Fund’s objective, risks, and charges and expenses, and read the summary prospectus, if available, and/or the Prospectus carefully before investing or sending money. The summary prospectus, if available, and the Prospectus contain this and other information about a Fund and may be obtained from your authorized dealer or from Goldman, Sachs & Co. by calling 1-800-621-2550. | ||
| Toll Free (in U.S.): 800-292-4726 | ||
| This report is prepared for the general information of contract owners and is not an offer of shares of the Goldman Sachs Variable Insurance Trust: Goldman Sachs Structured U.S. Equity Fund. | ||
| © 2011 Goldman Sachs. All rights reserved. | ||
| VITUSSAR11/57661.MF.MED.TMPL/8/2011 | ||
Goldman
Sachs Variable Insurance Trust
Goldman Sachs
Money Market Fund
Semi-Annual Report
June 30, 2011
|
GOLDMAN SACHS VARIABLE INSURANCE TRUST MONEY MARKET FUND
Principal Investment Strategies and Risks
Shares of the Goldman Sachs Variable Insurance Trust — Goldman Sachs Money Market Fund are offered to separate accounts of participating life insurance companies for the purpose of funding variable annuity contracts and variable life insurance policies. Shares of the Fund are not offered directly to the general public. The variable annuity contracts and variable life insurance policies are described in the separate prospectuses issued by participating insurance companies. You should refer to those prospectuses for information about surrender charges, mortality and expense risk fees and other charges that may be assessed by participating insurance companies under the variable annuity contracts or variable life insurance policies. Such fees or charges, if any, may affect the return you realize with respect to your investments. Ask your representative for more complete information. Please consider the Fund’s objective, risks and charges and expenses, and read the Prospectus carefully before investing. The Prospectus contains this and other information about the Fund.
The Goldman Sachs Money Market Fund seeks to maximize current income to the extent consistent with the preservation of capital and the maintenance of liquidity by investing exclusively in high quality money market instruments. The Fund pursues its investment objective by investing in U.S. Government Securities (as defined in the Fund’s prospectus), obligations of U.S. banks, commercial paper and other short-term obligations of U.S. companies, states, municipalities and other entities and repurchase agreements. The Fund may also invest in U.S. dollar-denominated obligations of foreign banks, foreign companies and foreign governments.
GOLDMAN SACHS VARIABLE INSURANCE TRUST MONEY MARKET FUND
INVESTMENT OBJECTIVE
The Fund seeks to maximize current income to the extent consistent with the preservation of capital and the maintenance of liquidity by investing exclusively in high quality money market instruments.
Portfolio Management Discussion and Analysis
Below, the Goldman Sachs Money Market Portfolio Management Team discusses the performance of the Goldman Sachs Variable Insurance Trust — Goldman Sachs Money Market Fund (the “Fund”) and positioning for the six-month period ended June 30, 2011 (the “Reporting Period”).
How did the Fund perform during the Reporting Period?
The Fund’s standardized 7-day current yield was 0.00% and its standardized 7-day effective yield was 0.00% as of June 30, 2011. The Fund’s one-month simple average yield was 0.01% as of June 30, 2011. The Fund’s 7-day distribution yield as of June 30, 2011 was 0.01%.
An investment in the Money Market Fund is neither insured nor guaranteed by the Federal Deposit Insurance Corporation or any other government agency. Although the Fund seeks to preserve the value of an investment at $1.00 per share, it is possible to lose money by investing in the Fund.
What economic and market factors most influenced the money markets as a whole during the Reporting Period?
The Reporting Period was one wherein mixed U.S. and international economic data, exogenous geopolitical events, Federal Reserve System (the “Fed”) policy and supply/demand conditions within the repurchase agreement and Treasury securities markets combined to push money market yields lower.
Global economic growth remained strong throughout the Reporting Period, but new challenges emerged. During the first quarter of 2011, political upheaval across the Middle East and North Africa drove oil prices higher, and Japan’s devastating earthquake and tsunami raised concerns about a disruption in the global supply chain. In response, defensive buying of benchmark government bonds interrupted the rise in yields seen at the end of 2010, though demand for riskier assets eased only slightly. Certain economic data remained robust, with manufacturing indices in the U.S., U.K. and Germany hitting new cyclical highs. Global investment began to respond to low interest rates and healthy corporate balance sheets with a revival in hiring and demand for credit from consumers and businesses. Meanwhile, inflation concerns intensified in major developed economies. The European Central Bank surprised markets in March by signaling an imminent rate hike, as European Union leaders struggled for consensus on policies to address the Eurozone’s troubled peripheral economies. In the U.K., inflation reached more than double the nation’s official 2% target. By contrast, U.S. inflation remained modest, and the Fed indicated no intention to raise interest rates.
Against this backdrop, then, the money markets were focused on two competing themes during the first quarter — a better macroeconomic environment in the U.S. and uncertainty driven by the European sovereign debt crisis. These themes, in our view, should have ultimately helped to push U.S. Treasury yields higher. However, political unrest in the Middle East and North Africa, natural and nuclear disasters in Japan, the U.S. Treasury Department’s reduction of borrowing Supplemental Financing Program (SFP) bills, and the Fed’s asset repurchase or quantitative easing program known as QE2 combined instead to push yields at the short-term end of the U.S. Treasury yield curve, or spectrum of maturities, modestly lower. (The Supplementary Financing Program is a program enacted by the U.S. Treasury Department to provide supplementary funding to the Fed to offset the financial strain due to the creation of various liquidity programs and facilities during the financial crisis of 2008. The funds are acquired through the auction of Treasury bills and are placed into an account that the Fed may use for various initiatives.) Indeed, yields on three-month, six-month and one-year Treasury securities fell four basis points, two basis points and one basis point, respectively, during the first quarter. (A basis point is 1/100th of a percentage point.) Repurchase agreements (or repo) yields, on the other hand, ended the quarter softer than expected.
GOLDMAN SACHS VARIABLE INSURANCE TRUST MONEY MARKET FUND
Although economic data pointed to ongoing growth in the world’s largest economies, instead economic activity slowed during the second quarter of 2011. Disruptions in the global supply chain following Japan’s earthquake and tsunami and higher energy costs contributed to declines in leading indicators. Consequent expectations for lower economic growth and renewed fears of a sovereign debt restructuring in the Eurozone’s troubled peripheries drove safe-haven trading in global markets. In turn, benchmark government bond yields declined, and risk premiums rose across non-Treasury sectors. These trends reversed somewhat in late June, as oil prices eased from their April peak and markets scaled back interest rate hike expectations even as inflation pressures increased.
As U.S. Treasury yields declined during the second quarter overall, so, too, did money market yields. In April, a newly imposed change in the calculation of the FDIC (Federal Deposit Insurance Corporation) assessment fee for banks in the United States caused acute compression in the overnight markets, setting a tone that would carry throughout the quarter.
The Fed continued to reinforce similar rhetoric as had been in place for more than two years — that it intended to operate in an ultra-low interest rate environment for an “extended period.” Following both its April and June 2011 meetings, the Fed stated that it remained comfortable with increased inflation expectations and softer economic growth and that neither was outside of market expectations given muted reaction to these trends. The Fed decided to continue holding the targeted federal funds rate in a range between zero and 0.25%.
Toward the end of the Reporting Period, the traditional quarter-end collateral squeeze, or tightening of capital, was exaggerated both by building supply pressures and by the market’s flight to quality as driven by the Eurozone debt crisis. Concerns about the potential fallout from Greece’s severe sovereign debt and fiscal problems dominated investor sentiment, driving yields on government securities lower. Further, investors’ heightened concerns with money market funds’ exposure to European sovereign debt and European banks caused a shift from prime money market funds (meaning those invested in corporate instruments in addition to government instruments) to government money market funds.
The combination of all of these factors led the taxable money market yield curve to flatten, meaning that the difference between yields at the short-term end of the money market yield curve and the longer-term end narrowed.
What key factors were responsible for the Fund’s performance during the Reporting Period?
The Fund’s yields moved lower during the Reporting Period due primarily to the market factors discussed above. We shortened the Fund’s weighted average maturity as the Reporting Period progressed, as the money market yield curve was extremely flat and offered little value in extending further out the curve. In our opinion, the reward of another basis point of yield frequently did not warrant the risk of purchasing longer-dated maturities. In turn, the Fund’s yield drifted lower during the Reporting Period, as repurchase agreement yields were in the single-digit to low-teen range (in basis points), LIBOR levels moved lower and yields on U.S. Treasury securities compressed. (LIBOR, or London interbank offered rates, are floating interest rates that are widely used as reference rates in bank, corporate and government lending agreements.)
Our focus during the Reporting Period was on remaining liquid and short in duration so as to be more nimble to take advantage should yields begin to increase and risk premia be priced in accordingly. Thus, we felt comfortable that the Fund was appropriately positioned given the interest rate environment during the Reporting Period. That said, it should be noted that regardless of interest rate conditions, we manage the Fund consistently. Our investment approach has always been tri-fold — to seek preservation of capital, daily liquidity and maximization of yield potential. We manage interest and credit risk daily. Whether interest rates are historically low, high or in-between, we intend to continue to use our actively managed approach to provide the best possible return within the framework of the Fund’s guidelines and objectives.
GOLDMAN SACHS VARIABLE INSURANCE TRUST MONEY MARKET FUND
How did you manage the Fund’s weighted average maturity during the Reporting Period?
On December 31, 2010, the Fund’s weighted average maturity was 49 days. We subsequently targeted a weighted average maturity for the Fund of between 40 and 50 days through much of the first quarter of the Reporting Period. However, as yields at the short-term of the U.S. Treasury yield curve compressed, we shortened the weighted average maturity target range for the Fund to between 25 and 35 days, as we felt that buying longer-term securities did not offer a risk premium that justified increasing the Fund’s interest rate risk. The Fund’s weighted average maturity on June 30, 2011 was 22 days, which was in line with our target range and our outlook both on interest rates and the lack of risk premia being priced into the market. The weighted average maturity of a money market fund is a measure of its price sensitivity to changes in interest rates.
How did you manage the Fund’s weighted average life during the Reporting Period?
The weighted average life of the Fund was 62 days as of June 30, 2011. The weighted average life of a money market fund is a measure of a money market fund’s price sensitivity to changes in liquidity and/or credit risk.
Under amendments to SEC Rule 2a-7 that became effective in May 2010, the maximum allowable weighted average life of a money market fund is 120 days. While one of the goals of the Securities and Exchange Commission’s money market fund rule changes is to reinforce more conservative investment practices across the money market fund industry, our security selection process has long emphasized conservative investment choices.
How was the Fund invested during the Reporting Period?
The Fund had investments in repurchase agreements, asset-backed commercial paper, commercial paper, Treasury securities, government agency securities, tax-exempt municipal debt obligations and certificates of deposit during the Reporting Period. With the Fund’s focus on liquidity, an average of approximately 25% of the Fund’s total net assets was in securities that matured overnight during the Reporting Period. As mentioned earlier, this liquidity enabled us to be nimble in a volatile market environment, especially as the yield curve remained persistently flat and offered little value in extending duration. When prices declined and we were able to find value in longer maturities, our focus was primarily on securities with one- to three-month maturities, as we sought to lock in the higher yields then available.
Though money market yields moved lower during the Reporting Period, the Fund’s investment strategy helped it provide current income while meeting its two primary objectives — liquidity and capital preservation. The primary focal points for our management team are consistently interest rate risk and credit risk. We were able to navigate interest rate risk by adjusting the Fund’s weighted average maturity as market conditions shifted. We were able to mitigate potential credit risk by buying high quality, creditworthy names.
Did you make any changes in the Fund’s portfolio during the Reporting Period?
We increased the Fund’s exposure to tax-exempt municipal debt obligations during the Reporting Period, as we considered these instruments to be attractive from a risk-adjusted return perspective.
Also, as indicated earlier, we shortened the Fund’s weighted average maturity by building a higher Fund concentration in overnight securities as yields fell and as extending out the yield curve did not offer advantages from a risk-adjusted return view. We chose to maintain higher levels of liquidity than usual and to look for higher rates should they become priced into the market.
GOLDMAN SACHS VARIABLE INSURANCE TRUST MONEY MARKET FUND
What is the Fund’s tactical view and strategy for the months ahead?
Based on the Fed’s various statements during the Reporting Period, our view that the Fed will keep its monetary policy on hold through the remainder of 2011 and possibly well into 2012 was solidified. While the Fed ended its asset purchase, or quantitative easing, program as scheduled at the end of June 2011, which we believe is one of the first steps in the direction to an interest rate hike, we believe there will likely be additional steps taken before the Fed actually begins to tighten monetary policy. For example, we believe one sign the Fed is considering a tighter monetary policy that we might see before any actual action is taken would be a shift in the language the Fed uses in its statements that follow its meetings. Thus, we look for any changes in language that soften the Fed’s commitment to maintain the targeted federal funds rate at exceptionally low levels for an “extended period.”
From a Fund strategy perspective, we believe this sequence of possible indicators has two main implications. First, we do not believe we should necessarily be focused on the timing of the Fed’s first interest rate hike in assessing the prospects for higher short-term rates. As the Fed begins to manage the federal funds rate toward the top of its current 0% to 0.25% range, short-term rates could begin to rise well before the Fed signals an actual hike. Second, we believe the slight increase in yield to be garnered from extending the Fund’s weighted average maturity is not enough to compensate for increasing its credit risk. In our view, money market yields were compressed during the Reporting Period in large part due to an imbalance between supply and demand. Given these implications, our strategy is to be patient and to wait to extend the Fund’s weighted average maturity or to add credit risk until the return is more commensurate with the risk.
We will, of course, continue to closely monitor economic data, Fed policy and any shifts in the money market yield curve, as we strive to strategically navigate the interest rate environment.
The yields represent past performance. Past performance does not guarantee future results. Current performance may be lower or higher than the performance quoted above.
Yields will fluctuate as market conditions change. The yield quotations more closely reflect the current earnings of the Fund than total return quotations.
GOLDMAN SACHS VARIABLE INSURANCE TRUST MONEY MARKET FUND
| MONEY MARKET FUND† |
Security Type
(Percentage of Net Assets)
(Percentage of Net Assets)
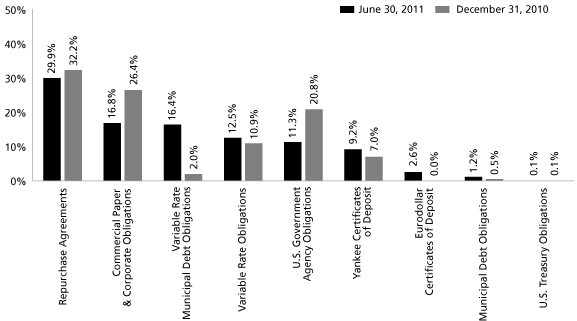
| † | The Fund is actively managed and, as such, its composition may differ over time. The percentage shown for each investment category reflects the value (based on amortized cost) of investments in that category as a percentage of net assets. Figures in the above chart may not sum to 100% due to the exclusion of other assets and liabilities. |
GOLDMAN SACHS VARIABLE INSURANCE TRUST MONEY MARKET FUND
Schedule of Investments
June 30, 2011 (Unaudited)
| Principal | Interest | Maturity | Amortized | |||||||||||
| Amount | Rate | Date | Cost | |||||||||||
Commercial Paper and Corporate Obligations – 16.8% | ||||||||||||||
| Amsterdam Funding Corp. | ||||||||||||||
| $ | 2,000,000 | 0.320 | % | 07/18/11 | $ | 1,999,698 | ||||||||
| Argento Variable Funding Co. LLC | ||||||||||||||
| 2,000,000 | 0.300 | 07/06/11 | 1,999,917 | |||||||||||
| Aspen Funding Corp. | ||||||||||||||
| 3,051,000 | 0.230 | 08/30/11 | 3,049,830 | |||||||||||
| BPCE SA | ||||||||||||||
| 3,000,000 | 0.310 | 09/01/11 | 2,998,398 | |||||||||||
| Charta LLC | ||||||||||||||
| 1,000,000 | 0.230 | 09/06/11 | 999,572 | |||||||||||
| Ciesco LLC | ||||||||||||||
| 1,000,000 | 0.230 | 09/06/11 | 999,572 | |||||||||||
| Grampian Funding LLC | ||||||||||||||
| 4,000,000 | 0.260 | 08/01/11 | 3,999,104 | |||||||||||
| Hannover Funding Co. LLC | ||||||||||||||
| 1,000,000 | 0.471 | 09/20/11 | 998,943 | |||||||||||
| Nationwide Building Society | ||||||||||||||
| 2,000,000 | 0.240 | 09/06/11 | 1,999,107 | |||||||||||
| Newport Funding Corp. | ||||||||||||||
| 2,000,000 | 0.270 | 07/06/11 | 1,999,925 | |||||||||||
| Northern Pines Funding LLC | ||||||||||||||
| 2,000,000 | 0.360 | 07/21/11 | 1,999,600 | |||||||||||
| Standard Chartered Bank | ||||||||||||||
| 1,500,000 | 0.290 | 07/11/11 | 1,499,879 | |||||||||||
| Tasman Funding, Inc. | ||||||||||||||
| 1,000,000 | 0.270 | 07/14/11 | 999,902 | |||||||||||
TOTAL COMMERCIAL PAPER AND CORPORATE OBLIGATIONS | $ | 25,543,447 | ||||||||||||
Eurodollar Certificates of Deposit – 2.6% | ||||||||||||||
| Credit Agricole SA | ||||||||||||||
| $ | 2,000,000 | 0.330 | % | 08/05/11 | $ | 2,000,019 | ||||||||
| 2,000,000 | 0.300 | 09/06/11 | 2,000,000 | |||||||||||
TOTAL EURODOLLAR CERTIFICATES OF DEPOSIT | $ | 4,000,019 | ||||||||||||
Municipal Debt Obligations – 1.2% | ||||||||||||||
| Georgia Municipal Electric Authority | ||||||||||||||
| $ | 1,150,000 | 0.500 | % | 08/03/11 | $ | 1,150,000 | ||||||||
| State of Texas TRANS Series 2010 | ||||||||||||||
| 650,000 | 2.000 | 08/31/11 | 651,763 | |||||||||||
TOTAL MUNICIPAL DEBT OBLIGATIONS | $ | 1,801,763 | ||||||||||||
U.S. Government Agency Obligations – 11.3% | ||||||||||||||
| Federal Farm Credit Bank | ||||||||||||||
| $ | 1,000,000 | 0.148 | %(a) | 01/27/12 | $ | 999,781 | ||||||||
| 200,000 | 0.311 | (a) | 11/01/12 | 200,000 | ||||||||||
| Federal Home Loan Bank | ||||||||||||||
| 500,000 | 0.090 | (a) | 07/11/11 | 499,992 | ||||||||||
| 1,000,000 | 0.310 | 10/05/11 | 999,989 | |||||||||||
| 700,000 | 0.300 | 10/21/11 | 700,000 | |||||||||||
| 1,000,000 | 0.151 | (a) | 01/26/12 | 999,826 | ||||||||||
| 1,000,000 | 0.143 | (a) | 01/30/12 | 999,789 | ||||||||||
| 1,000,000 | 0.143 | (a) | 02/03/12 | 999,814 | ||||||||||
| Federal Home Loan Mortgage Corp. | ||||||||||||||
| 300,000 | 0.202 | (a) | 08/05/11 | 299,994 | ||||||||||
| 4,000,000 | 0.291 | 09/13/11 | 3,997,616 | |||||||||||
| 1,400,000 | 0.110 | (a) | 01/11/12 | 1,399,629 | ||||||||||
| 1,000,000 | 0.140 | (a) | 05/03/13 | 999,255 | ||||||||||
| Federal National Mortgage Association | ||||||||||||||
| 3,000,000 | 0.432 | 07/07/11 | 2,999,785 | |||||||||||
| 1,000,000 | 0.216 | (a) | 12/28/12 | 999,703 | ||||||||||
TOTAL U.S. GOVERNMENT AGENCY OBLIGATIONS | $ | 17,095,173 | ||||||||||||
U.S. Treasury Obligation – 0.1% | ||||||||||||||
| United States Treasury Note | ||||||||||||||
| $ | 100,000 | 0.750 | % | 11/30/11 | $ | 100,185 | ||||||||
Variable Rate Municipal Debt Obligations(a) – 16.4% | ||||||||||||||
| Bay Area Toll Authority California Toll Bridge VRDN RB Series 2006 C2 RMKT (Morgan Stanley Bank LOC) | ||||||||||||||
| $ | 1,000,000 | 0.040 | % | 04/01/45 | $ | 1,000,000 | ||||||||
BlackRock MuniEnhanced Fund, Inc. VRDN Tax-Exempt Preferreds Series 2011 (Citibank N.A.)(b) | ||||||||||||||
| 300,000 | 0.290 | 06/01/41 | 300,000 | |||||||||||
BlackRock MuniHoldings Investment Quality Fund VRDN Tax-Exempt Preferreds Series 2011 W-7-2746 (Bank of America N.A.)(b) | ||||||||||||||
| 300,000 | 0.300 | 07/01/41 | 300,000 | |||||||||||
BlackRock MuniYield Fund, Inc. VRDN Tax-Exempt Preferreds Series 2011 W-7-2514 (Bank of America N.A.)(b) | ||||||||||||||
| 300,000 | 0.300 | 07/01/41 | 300,000 | |||||||||||
BlackRock MuniYield Investment Fund VRDN Tax-Exempt Preferreds Series 2011 (Citibank N.A.)(b) | ||||||||||||||
| 300,000 | 0.290 | 06/01/41 | 300,000 | |||||||||||
BlackRock Muniyield Quality Fund III, Inc. VRDN Tax-Exempt Preferreds Series 2011 (Citibank N.A.)(b) | ||||||||||||||
| 300,000 | 0.290 | 06/01/41 | 300,000 | |||||||||||
| California Health Facilities Financing Authority VRDN RB for Catholic Healthcare West Series 2005 H (Bank of America N.A. LOC) | ||||||||||||||
| 1,000,000 | 0.060 | 07/01/35 | 1,000,000 | |||||||||||
| California State Department of Water Resources Power Supply VRDN RB Series 2002 B6 (California State Teachers Retirement System and JPMorgan Bank N.A.) | ||||||||||||||
| 1,450,000 | 0.070 | 05/01/22 | 1,450,000 | |||||||||||
| California Statewide Communities Development Authority MF Hsg. VRDN RB for Hermosa Vista Apartments Series 2003 XX (FNMA) | ||||||||||||||
| 700,000 | 0.090 | 05/15/36 | 700,000 | |||||||||||
GOLDMAN SACHS VARIABLE INSURANCE TRUST MONEY MARKET FUND
Schedule of Investments (continued)
June 30, 2011 (Unaudited)
| Principal | Interest | Maturity | Amortized | |||||||||||
| Amount | Rate | Date | Cost | |||||||||||
Variable Rate Municipal Debt Obligations(a) – (continued) | ||||||||||||||
| Chicago, Illinois Board of Education GO VRDN Refunding Series 2009 B (U.S. Bank N.A. LOC) | ||||||||||||||
| $ | 600,000 | 0.050 | % | 03/01/31 | $ | 600,000 | ||||||||
| Colorado Educational & Cultural Facilities Authority VRDN RB Taxable for Nature Conservancy Series 2008 A (Bank of America N.A. SPA) | ||||||||||||||
| 1,000,000 | 0.150 | 07/01/33 | 1,000,000 | |||||||||||
| Connecticut State Health & Educational Facilities Authority VRDN RB for Yale University Series 1997 T2 (Credit Local de France, Toronto Dominion Bank, and Landesbank Hessen-Thueringen Girozentrale) | ||||||||||||||
| 1,500,000 | 0.030 | 07/01/29 | 1,500,000 | |||||||||||
| County of Mecklenburg, North Carolina GO VRDN Series 2006 A (Wells Fargo Bank N.A. SPA) | ||||||||||||||
| 500,000 | 0.080 | 02/01/26 | 500,000 | |||||||||||
| Indiana Finance Authority Hospital VRDN RB for Indiana University Health Series 2011 K (JPMorgan Chase Bank N.A. LOC) | ||||||||||||||
| 960,000 | 0.100 | 03/01/33 | 960,000 | |||||||||||
| Loudoun County, Virginia Industrial Development Authority VRDN RB for Howard Hughes Medical Institute Series 2003 C | ||||||||||||||
| 805,000 | 0.040 | 02/15/38 | 805,000 | |||||||||||
| Massachusetts State Development Finance Agency VRDN RB for Partners HealthCare Systems Series 2011 K2 (Barclays Bank SPA) | ||||||||||||||
| 1,000,000 | 0.030 | 07/01/46 | 1,000,000 | |||||||||||
| Massachusetts State Water Resources Authority VRDN RB Refunding Series 2008 A3 RMKT (GO of Authority) (Wells Fargo Bank N.A. SPA) | ||||||||||||||
| 1,300,000 | 0.060 | 08/01/37 | 1,300,000 | |||||||||||
| Missouri State Health & Educational Facilities Authority VRDN RB for Saint Luke’s Health System Series 2008 A (Bank of America N.A. LOC) | ||||||||||||||
| 1,100,000 | 0.100 | 11/15/40 | 1,100,000 | |||||||||||
| Nebraska Investment Finance Authority SF Hsg VRDN RB Series 2010 C (FHLMC) (FNMA) (GNMA) (FHLB SPA) | ||||||||||||||
| 1,000,000 | 0.070 | 09/01/32 | 1,000,000 | |||||||||||
| New York City, New York Transitional Finance Authority VRDN RB for Future Tax Secured Series 1998 A1 (Westdeutsche Landesbank AG SPA) | ||||||||||||||
| 1,000,000 | 0.070 | 11/15/28 | 1,000,000 | |||||||||||
| New York City, New York Transitional Finance Authority VRDN RB for Future Tax Secured Series 2001 B (Westdeutsche Landesbank AG) | ||||||||||||||
| 1,000,000 | 0.210 | 05/01/30 | 1,000,000 | |||||||||||
| New York City, New York Transitional Finance Authority VRDN RB Series 2002 Subseries 2F (Bayerische Landesbank) | ||||||||||||||
| 1,085,000 | 0.060 | 11/01/22 | 1,085,000 | |||||||||||
| New York State Local Government Assistance Corp. VRDN RB Refunding Series 2008 B-7V (GO of Corp.) (JPMorgan Chase Bank SPA) | ||||||||||||||
| 600,000 | 0.050 | 04/01/20 | 600,000 | |||||||||||
| North Carolina Medical Care Commission Hospital GO VRDN for Duke University Hospital Project Series 1993 A (Wells Fargo Bank N.A. SPA) | ||||||||||||||
| 650,000 | 0.060 | 06/01/23 | 650,000 | |||||||||||
| Private Colleges & Universities Authority VRDN RB for Emory University Series 2005 B1 | ||||||||||||||
| 1,350,000 | 0.050 | 09/01/35 | 1,350,000 | |||||||||||
| Tarrant County, Texas Cultural Education Facilities Finance Corp. VRDN RB for Texas Health Resources Series 2008 B | ||||||||||||||
| 1,000,000 | 0.050 | 11/15/33 | 1,000,000 | |||||||||||
| University of Alabama VRDN RB Series 1993 B | ||||||||||||||
| 900,000 | 0.260 | 10/01/13 | 900,000 | |||||||||||
| Washington State Housing Finance Commission MF Hsg. VRDN RB for Queen Anne Project Series 2004 A (FNMA) | ||||||||||||||
| 1,180,000 | 0.090 | % | 09/01/38 | 1,180,000 | ||||||||||
| Washington State Housing Finance Commission MF Hsg. VRDN RB for Vintage at Spokane Senior Living Project Series 2006 A (FNMA) | ||||||||||||||
| 795,000 | 0.100 | 08/15/40 | 795,000 | |||||||||||
TOTAL VARIABLE RATE MUNICIPAL DEBT OBLIGATIONS | $ | 24,975,000 | ||||||||||||
Variable Rate Obligations(a) – 12.5% | ||||||||||||||
| Bank of Nova Scotia | ||||||||||||||
| $ | 1,000,000 | 0.300 | % | 07/10/12 | $ | 1,000,000 | ||||||||
| BNP Paribas Securities Corp. | ||||||||||||||
| 1,000,000 | 0.440 | 09/09/11 | 1,000,000 | |||||||||||
| Commonwealth Bank of Australia | ||||||||||||||
| 2,000,000 | 0.273 | (b) | 05/25/12 | 1,999,813 | ||||||||||
| Cooperative Centrale Raiffeisen – Boerenleenbank BA | ||||||||||||||
| 1,000,000 | 0.400 | 10/18/11 | 1,000,000 | |||||||||||
| JPMorgan Chase Bank, N.A. | ||||||||||||||
| 1,000,000 | 0.304 | 07/17/12 | 1,000,000 | |||||||||||
| 3,000,000 | 0.226 | 07/20/12 | 3,000,000 | |||||||||||
| Lloyds TSB Bank PLC | ||||||||||||||
| 2,000,000 | 0.372 | 11/07/11 | 2,000,000 | |||||||||||
| Rabobank Nederland NV | ||||||||||||||
| 1,000,000 | 0.331 | (b) | 06/15/12 | 1,000,000 | ||||||||||
| Societe Generale | ||||||||||||||
| 2,000,000 | 0.470 | 09/09/11 | 2,000,000 | |||||||||||
| UBS AG | ||||||||||||||
| 2,000,000 | 0.354 | 10/07/11 | 2,000,000 | |||||||||||
| Westpac Banking Corp. | ||||||||||||||
| 1,000,000 | 0.333 | (b) | 07/06/12 | 1,000,000 | ||||||||||
| Westpac Securities New Zealand Ltd. | ||||||||||||||
| 1,000,000 | 0.296 | (b) | 10/18/11 | 1,000,000 | ||||||||||
| 1,000,000 | 0.353 | (b) | 11/04/11 | 1,000,000 | ||||||||||
TOTAL VARIABLE RATE OBLIGATIONS | $ | 18,999,813 | ||||||||||||
Yankee Certificates of Deposit – 9.2% | ||||||||||||||
| Credit Industriel et Commercial SA | ||||||||||||||
| $ | 4,000,000 | 0.290 | % | 09/02/11 | $ | 4,000,000 | ||||||||
| Lloyds TSB Bank PLC | ||||||||||||||
| 1,000,000 | 0.445 | 07/05/11 | 1,000,000 | |||||||||||
| Mitsubishi UFJ Trust and Banking Corp. | ||||||||||||||
| 2,000,000 | 0.250 | 07/15/11 | 2,000,000 | |||||||||||
GOLDMAN SACHS VARIABLE INSURANCE TRUST MONEY MARKET FUND
| Principal | Interest | Maturity | Amortized | |||||||||||
| Amount | Rate | Date | Cost | |||||||||||
Yankee Certificates of Deposit – (continued) | ||||||||||||||
| Mizuho Corporate Bank | ||||||||||||||
| $ | 4,000,000 | 0.260 | % | 07/05/11 | $ | 4,000,000 | ||||||||
| Norinchukin Bank | ||||||||||||||
| 2,000,000 | 0.310 | 08/11/11 | 2,000,000 | |||||||||||
| Sumitomo Mitsui Banking Corp. | ||||||||||||||
| 1,000,000 | 0.300 | 07/05/11 | 1,000,000 | |||||||||||
TOTAL YANKEE CERTIFICATES OF DEPOSIT | $ | 14,000,000 | ||||||||||||
TOTAL INVESTMENTS BEFORE REPURCHASE AGREEMENTS | $ | 106,515,400 | ||||||||||||
Repurchase Agreements(c) – 29.9% | ||||||||||||||
| Barclays Capital, Inc. | ||||||||||||||
| $ | 1,000,000 | 0.900 | %(d) | 04/24/12 | $ | 1,000,000 | ||||||||
| Maturity Value: $1,009,075 | ||||||||||||||
| Settlement Date: 04/27/11 | ||||||||||||||
| Collateralized by various corporate securities, 1.000% to 7.000%, due 05/01/14 to 12/15/37. The aggregate market value of the collateral, including accrued interest, was $1,100,302. | ||||||||||||||
| BNP Paribas Securities Corp. | ||||||||||||||
| 2,000,000 | 0.140 | 07/01/11 | 2,000,000 | |||||||||||
| Maturity Value: $2,000,008 | ||||||||||||||
| Collateralized by a corporate issuer, 5.750%, due 09/28/11. The market value of the collateral, including accrued interest, was $2,100,000. | ||||||||||||||
| 2,000,000 | 0.130 | 09/01/11 | 2,000,000 | |||||||||||
| Maturity Value: $2,000,874 | ||||||||||||||
| Settlement Date: 05/03/11 | ||||||||||||||
| Collateralized by Federal Home Loan Mortgage Corp., 3.500% to 1055.563%, due 03/15/17 to 01/15/40, Federal National Mortgage Association, 0.000% to 6.500%, due 06/25/21 to 11/25/36, and Government National Mortgage Association, 5.500%, due 01/20/32. The aggregate market value of the collateral, including accrued interest, was $2,083,823. | ||||||||||||||
| 1,000,000 | 0.745 | (d) | 03/16/12 | 1,000,000 | ||||||||||
| Maturity Value: $1,005,672 | ||||||||||||||
| Settlement Date: 06/13/11 | ||||||||||||||
| Collateralized by various corporate securities, 5.875% to 10.500%, due 07/15/12 to 05/15/15. The aggregate market value of the collateral, including accrued interest, was $1,115,387. | ||||||||||||||
| Deutsche Bank Securities, Inc. | ||||||||||||||
| 2,000,000 | 0.370 | 07/01/11 | 2,000,000 | |||||||||||
| Maturity Value: $2,000,021 | ||||||||||||||
| Collateralized by various corporate securities, 1.500% to 8.500%, due 10/15/11 to 12/31/49. The aggregate market value of the collateral, including accrued interest, was $2,200,074. | ||||||||||||||
| Joint Repurchase Agreement Account III | ||||||||||||||
| 32,400,000 | 0.064 | 07/01/11 | 32,400,000 | |||||||||||
| Morgan Stanley | ||||||||||||||
| 2,000,000 | 1.272 | (d) | 05/03/12 | 2,000,000 | ||||||||||
| Settlement Date: 05/05/11 | ||||||||||||||
| Collateralized by various asset-backed obligations, 0.000% to 5.890%, due 10/20/14 to 12/20/49, and mortgage-backed obligations, 0.000% to 6.786%, due 08/25/22 to 02/12/51. The aggregate market value of the collateral, including accrued interest, was $2,499,999. | ||||||||||||||
| RBS Securities, Inc. | ||||||||||||||
| 3,000,000 | 0.420 | 07/01/11 | 3,000,000 | |||||||||||
| Maturity Value: $3,000,035 | ||||||||||||||
| Collateralized by various mortgage-backed obligations, 0.466% to 1.055%, due 02/20/34 to 11/25/45. The aggregate market value of the collateral, including accrued interest, was $3,450,002. | ||||||||||||||
TOTAL REPURCHASE AGREEMENTS | $ | 45,400,000 | ||||||||||||
TOTAL INVESTMENTS – 100.0% | $ | 151,915,400 | ||||||||||||
OTHER ASSETS IN EXCESS OF LIABILITIES – 0.0% | 73,824 | |||||||||||||
NET ASSETS – 100.0% | $ | 151,989,224 | ||||||||||||
The percentage shown for each investment category reflects the value of investments in that category as a percentage of net assets.
| (a) | Variable or floating rate security. Interest rate disclosed is that which is in effect at June 30, 2011. | |
| (b) | Security not registered under the Securities Act of 1933, as amended. Such securities have been determined to be liquid by the Investment Adviser. At June 30, 2011, these securities amounted to $7,499,813 or approximately 4.9% of net assets. | |
| (c) | Unless noted, all repurchase agreements were entered into on June 30, 2011. Additional information on Joint Repurchase Agreement Account III appears on page 10. | |
| (d) | Security not registered under the Securities Act of 1933, as amended. Such securities have been determined to be illiquid by the Investment Adviser. At June 30, 2011, these securities amounted to $4,000,000 or approximately 2.6% of net assets. |
Interest rates represent either the stated coupon rate, annualized yield on date of purchase for discounted securities, or, for floating rate securities, the current reset rate, which is based upon current interest rate indices.
Maturity dates represent either the final legal maturity date on the security, the demand date for puttable securities, or the prerefunded date for those types of securities.
GOLDMAN SACHS VARIABLE INSURANCE TRUST MONEY MARKET FUND
Schedule of Investments (continued)
June 30, 2011 (Unaudited)
Investment Abbreviations: | ||||
| FHLB | — | Insured by Federal Home Loan Bank | ||
| FHLMC | — | Insured by Federal Home Loan Mortgage Corp. | ||
| FNMA | — | Insured by Federal National Mortgage Association | ||
| GNMA | — | Insured by Government National Mortgage Association | ||
| GO | — | General Obligation | ||
| LOC | — | Letter of Credit | ||
| MF Hsg. | — | Multi-Family Housing | ||
| RB | — | Revenue Bond | ||
| RMKT | — | Remarketed | ||
| SF Hsg | — | Single-Family Housing | ||
| SPA | — | Stand-by Purchase Agreement | ||
| TRANS | — | Tax Revenue Anticipation Notes | ||
| VRDN | — | Variable Rate Demand Notes | ||
| ADDITIONAL INVESTMENT INFORMATION |
JOINT REPURCHASE AGREEMENT ACCOUNT III — At June 30, 2011, the Fund had an undivided interest in the Joint Repurchase Agreement Account III which equaled $32,400,000 in principal amount and had a maturity value of $32,400,058.
REPURCHASE AGREEMENTS
| Interest | Principal | |||||||
| Counterparty | Rate | Amount | ||||||
| Barclays Capital, Inc. | 0.010 | % | $ | 1,768,881 | ||||
| BNP Paribas Securities Corp. | 0.080 | 3,832,575 | ||||||
| Citibank, N.A. | 0.080 | 1,474,067 | ||||||
| Citigroup Global Markets, Inc. | 0.080 | 2,004,732 | ||||||
| Deutsche Bank Securities, Inc. | 0.060 | 1,356,142 | ||||||
| UBS Securities LLC | 0.060 | 17,806,733 | ||||||
| Wells Fargo Securities LLC | 0.080 | 4,156,870 | ||||||
TOTAL | $ | 32,400,000 | ||||||
At June 30, 2011, the Joint Repurchase Agreement Account III was fully collateralized by:
| Interest | Maturity | |||||||
| Issuer | Rates | Dates | ||||||
| Federal Farm Credit Bank | 0.115% | 01/28/13 | ||||||
| Federal Home Loan Mortgage Corp. | 0.070 to 6.50% | 01/25/12 to 06/01/41 | ||||||
| Federal National Mortgage Association | 0.270 to 7.00% | 11/23/12 to 02/01/48 | ||||||
| Government National Mortgage Association | 3.500 to 5.500% | 05/15/25 to 05/20/41 | ||||||
The aggregate market value of the collateral, including accrued interest, was $33,267,639.
GOLDMAN SACHS VARIABLE INSURANCE TRUST MONEY MARKET FUND
Statement of Assets and Liabilities
June 30, 2011 (Unaudited)
Assets: | ||||
| Investments in securities, at value based on amortized cost | $ | 106,515,400 | ||
| Repurchase agreements, at value based on amortized cost | 45,400,000 | |||
| Cash | 96,468 | |||
| Receivables: | ||||
| Reimbursement from investment adviser | 52,338 | |||
| Interest | 42,522 | |||
| Other assets | 900 | |||
Total assets | 152,107,628 | |||
Liabilities: | ||||
| Payables: | ||||
| Amounts owed to affiliates | 29,245 | |||
| Accrued expenses | 88,453 | |||
Total liabilities | 117,698 | |||
Net Assets: | ||||
| Paid-in capital | 151,989,930 | |||
NET ASSETS | $ | 151,989,930 | ||
| Total Service Shares of beneficial interest outstanding, $0.001 par value (unlimited shares authorized) | 151,989,507 | |||
| Net asset value, offering and redemption price per share | $1.00 | |||
GOLDMAN SACHS VARIABLE INSURANCE TRUST MONEY MARKET FUND
Statement of Operations
For the Six Months Ended June 30, 2011 (Unaudited)
Investment Income: | ||||
| Interest | $ | 187,324 | ||
Expenses: | ||||
| Distribution and Service fees | 157,006 | |||
| Management fees | 128,745 | |||
| Professional fees | 68,118 | |||
| Custody and accounting fees | 39,866 | |||
| Printing and mailing costs | 21,822 | |||
| Transfer Agent fees | 12,560 | |||
| Trustee fees | 8,265 | |||
| Other | 4,158 | |||
Total expenses | 440,540 | |||
| Less — expense reductions | (256,921 | ) | ||
Net expenses | 183,619 | |||
NET INVESTMENT INCOME | 3,705 | |||
NET REALIZED GAIN FROM INVESTMENT TRANSACTIONS | 948 | |||
NET INCREASE IN NET ASSETS RESULTING FROM OPERATIONS | $ | 4,653 | ||
GOLDMAN SACHS VARIABLE INSURANCE TRUST MONEY MARKET FUND
Statements of Changes in Net Assets
| For the Six | For the Fiscal | |||||||
| Months Ended | Year Ended | |||||||
| June 30, 2011 (Unaudited) | December 31, 2010 | |||||||
From operations: | ||||||||
| Net investment income | $ | 3,705 | $ | 1,313 | ||||
| Net realized gain from investment transactions | 948 | 2,913 | ||||||
Net increase in net assets resulting from operations | 4,653 | 4,226 | ||||||
Distributions to shareholders: | ||||||||
| From net investment income | (3,705 | ) | (1,313 | ) | ||||
| From net realized gains | (948 | ) | (8,391 | ) | ||||
| From capital | — | (1,451 | ) | |||||
Total distributions to shareholders | (4,653 | ) | (11,155 | ) | ||||
From share transactions (at net asset value of $1.00 per share): | ||||||||
| Proceeds from sales of shares | 55,157,082 | 49,250,147 | ||||||
| Reinvestment of distributions | 4,653 | 11,155 | ||||||
| Cost of shares redeemed | (26,537,219 | ) | (69,236,185 | ) | ||||
Net increase (decrease) in net assets resulting from share transactions | 28,624,516 | (19,974,883 | ) | |||||
TOTAL INCREASE (DECREASE) | 28,624,516 | (19,981,812 | ) | |||||
Net assets: | ||||||||
| Beginning of period | 123,365,414 | 143,347,226 | ||||||
| End of period | $ | 151,989,930 | $ | 123,365,414 | ||||
GOLDMAN SACHS VARIABLE INSURANCE TRUST MONEY MARKET FUND
Financial Highlights
Selected Data for a Share Outstanding Throughout Each Period
| Ratio of | Ratio of | |||||||||||||||||||||||||||||||||||||
| Net asset | Distributions | Net asset | Net assets | Ratio of | total | net investment | ||||||||||||||||||||||||||||||||
| value, | Net | from net | value, | end of | net expenses | expenses | income | |||||||||||||||||||||||||||||||
| beginning | investment | investment | end | Total | period | to average | to average | to average | ||||||||||||||||||||||||||||||
| of period | income(a) | income(b) | of period | return(c) | (in 000’s) | net assets | net assets | net assets | ||||||||||||||||||||||||||||||
FOR THE SIX MONTHS ENDED JUNE 30, (UNAUDITED) | ||||||||||||||||||||||||||||||||||||||
| 2011 | $ | 1.00 | $ | — | (d) | $ | — | (d) | $ | 1.00 | 0.01 | % | $ | 151,990 | 0.29 | %(e) | 0.70 | %(e) | 0.01 | %(e) | ||||||||||||||||||
FOR THE FISCAL YEARS ENDED DECEMBER 31, | ||||||||||||||||||||||||||||||||||||||
| 2010 | 1.00 | — | (d) | — | (d) | $ | 1.00 | 0.01 | % | $ | 123,365 | 0.33 | % | 0.68 | % | — | %(f) | |||||||||||||||||||||
| 2009 | 1.00 | 0.002 | (g) | (0.002 | )(g) | $ | 1.00 | 0.15 | % | $ | 143,347 | 0.53 | % | 0.77 | % | 0.15 | % | |||||||||||||||||||||
| 2008 | 1.00 | 0.02 | (0.02 | ) | $ | 1.00 | 2.25 | % | $ | 194,871 | 0.63 | % | 0.71 | % | 2.27 | % | ||||||||||||||||||||||
| 2007 | 1.00 | 0.05 | (0.05 | ) | $ | 1.00 | 4.98 | % | $ | 205,518 | 0.48 | % | 0.71 | % | 4.87 | % | ||||||||||||||||||||||
2006(h) | 1.00 | 0.05 | (0.05 | ) | $ | 1.00 | 4.65 | % | $ | 199,439 | 0.49 | % | 0.71 | % | 4.59 | % | ||||||||||||||||||||||
| (a) | Calculated based on the average shares outstanding methodology. | |
| (b) | Distributions may not coincide with the current year net investment income or net realized gains as distributions may be paid from current or prior year earnings. | |
| (c) | Assumes reinvestment of all distributions. The Goldman Sachs Money Market Fund first began operations as the Allmerica Money Market Fund (the “Predecessor AIT Fund”) of the Allmerica Investment Trust. On January 9, 2006, the Predecessor AIT Fund was reorganized as a new portfolio for the Goldman Sachs Variable Insurance Trust. Performance prior to January 9, 2006, is that of the Predecessor AIT Fund. The Predecessor AIT Fund was considered the accounting survivor of the reorganization and as such, the historical total return information of the Predecessor AIT Fund is provided. | |
| (d) | Amount is less than $0.0001 per share. | |
| (e) | Annualized. | |
| (f) | Amount is less than 0.001% of average net assets. | |
| (g) | Net investment income and distributions from net investment income contain $0.0002 of net realized capital gains and distributions from net realized gains. | |
| (h) | The Predecessor AIT Fund was the accounting survivor of the reorganization and as such, the financial highlights reflect the financial information of the Predecessor AIT Fund through January 8, 2006. In connection with such reorganization, the Goldman Sachs Money Market Fund issued Service Shares to the former shareholders of the Predecessor AIT Fund. |
14
GOLDMAN SACHS VARIABLE INSURANCE TRUST MONEY MARKET FUND
Notes to Financial Statements
June 30, 2011 (Unaudited)
| 1. ORGANIZATION |
Goldman Sachs Variable Insurance Trust (the “Trust” or “VIT”) is a Delaware statutory trust registered under the Investment Company Act of 1940, as amended (the “Act”), as an open-end management investment company. The Trust includes the Goldman Sachs Money Market Fund (the “Fund”). The Fund is a diversified portfolio under the Act offering one class of shares — Service Shares.
Goldman Sachs Asset Management, L.P. (“GSAM”), an affiliate of Goldman, Sachs & Co. (“Goldman Sachs”), serves as investment adviser to the Fund pursuant to a management agreement (the “Agreement”) with the Trust.
| 2. SIGNIFICANT ACCOUNTING POLICIES |
The following is a summary of the significant accounting policies consistently followed by the Fund. The preparation of financial statements in conformity with accounting principles generally accepted in the United States of America (“GAAP”) requires management to make estimates and assumptions that may affect the amounts and disclosures in the financial statements. Actual results could differ from those estimates and assumptions.
A. Investment Valuation — It is the Fund’s policy to use the amortized-cost method permitted by Rule 2a-7 under the Act, which approximates market value, for valuing portfolio securities. Under this method, all investments purchased at a discount or premium are valued by accreting or amortizing the difference between the original purchase price and maturity value of the issue, as an adjustment to interest income. Under procedures and tolerances established by the trustees, GSAM evaluates the difference between the Fund’s net asset value per share (“NAV”) based upon the amortized cost of the Fund’s securities and the NAV based upon available market quotations (or permitted substitutes) at least once a week.
B. Security and Fund Share Transactions, and Investment Income — Security and Fund share transactions are reflected for financial reporting purposes as of the trade date. Realized gains and losses on sales of portfolio securities are calculated using the identified cost basis. Interest income is recorded on the basis of interest accrued, premium amortized and discount accreted.
C. Expenses — Expenses incurred by the Fund, which may not specifically relate to the Fund, may be shared with other registered investment companies having management agreements with GSAM or its affiliates, as appropriate. These expenses are allocated to the Fund on a straight-line and/or pro-rata basis depending upon the nature of the expenses and are accrued daily.
D. Federal Taxes and Distributions to Shareholders — It is the Fund’s policy to comply with the requirements of the Internal Revenue Code of 1986, as amended (the “Code”), applicable to regulated investment companies (mutual funds) and to distribute each year substantially all of its investment company taxable income and capital gains to its shareholders. Accordingly, the Fund is not required to make any provisions for the payment of federal income tax. Distributions to shareholders are declared and recorded daily and paid monthly by the Fund. Long-term capital gain distributions, if any, are declared and paid annually.
The characterization of distributions to shareholders for financial reporting purposes is determined in accordance with federal income tax rules, which may differ from GAAP. The source of the Fund’s distributions may be shown in the accompanying financial statements as either from net investment income, net realized gain or capital. The Fund’s capital accounts on the Statement of Assets and Liabilities reflect permanent GAAP/tax differences based on the appropriate tax character.
The amortized cost for the Fund stated in the accompanying Statement of Assets and Liabilities also represents aggregate cost for federal income tax purposes.
GSAM has reviewed the Fund’s tax positions for all open tax years (the current and prior three years, as applicable) and has concluded that no provision for income tax is required in the Fund’s financial statements. Such open tax years remain subject to examination and adjustment by tax authorities.
E. Repurchase Agreements — The Fund may enter into repurchase agreements which involve the purchase of securities subject to the seller’s agreement to repurchase the securities at a mutually agreed upon date and price. During the term of a repurchase agreement, the value of the underlying securities held as collateral on behalf of the Fund, including accrued interest, is required to exceed the value of the repurchase agreement, including accrued interest. If the seller defaults or becomes insolvent, realization of the collateral by the Fund may be delayed or limited and there may be a decline in the value of the collateral during
GOLDMAN SACHS VARIABLE INSURANCE TRUST MONEY MARKET FUND
Notes to Financial Statements (continued)
June 30, 2011 (Unaudited)
| 2. SIGNIFICANT ACCOUNTING POLICIES (continued) |
the period while the Fund seeks to assert its rights. The underlying securities for all repurchase agreements are held at the Fund’s custodian or designated sub-custodians under tri-party repurchase agreements. Under these agreements, the Fund is permitted to deliver or re-pledge these securities.
Pursuant to exemptive relief granted by the Securities and Exchange Commission and terms and conditions contained therein, the Fund, together with other registered investment companies having management agreements with GSAM, or its affiliates, may transfer uninvested cash into joint accounts, the daily aggregate balance of which is invested in one or more repurchase agreements. Under these joint accounts, the Fund’s credit exposure is allocated to the underlying repurchase agreements counterparties on a pro-rata basis. With the exception of certain transaction fees, the Fund is not subject to any expenses in relation to these investments.
| 3. FAIR VALUE OF INVESTMENTS |
The fair value of a financial instrument is the amount that would be received to sell an asset or paid to transfer a liability in an orderly transaction between market participants at the measurement date (i.e., the exit price). GAAP establishes a fair value hierarchy that prioritizes the inputs to valuation techniques used to measure fair value. The hierarchy gives the highest priority to unadjusted quoted prices in active markets for identical assets or liabilities (Level 1 measurements) and the lowest priority to unobservable inputs (Level 3 measurements). The three levels of the fair value hierarchy are described below:
Level 1 — Unadjusted quoted prices in active markets that are accessible at the measurement date for identical, unrestricted assets or liabilities;
Level 2 — Quoted prices in markets that are not active or financial instruments for which significant inputs are observable (including, but not limited to, quoted prices for similar securities, interest rates, foreign exchange rates, volatility and credit spreads), either directly or indirectly;
Level 3 — Prices or valuations that require significant unobservable inputs (including GSAM’s assumptions in determining fair value measurement).
The following is a summary of the Funds’ investments categorized in the fair value hierarchy as of June 30, 2011. While assets are reported at amortized cost, the Levels below are based on valuation characteristics of the investments’ market value.
| Level 1 | Level 2 | Level 3 | ||||||||||
Assets | ||||||||||||
| Corporate Obligations (including repurchase agreements) | $ | — | $ | 107,943,279 | $ | — | ||||||
| Municipal Debt Obligations | — | 26,776,763 | — | |||||||||
U.S. Treasuries and/or Other U.S. Government Obligations and Agencies | 100,185 | 17,095,173 | — | |||||||||
Total | $ | 100,185 | $ | 151,815,215 | $ | — | ||||||
| 4. AGREEMENTS AND AFFILIATED TRANSACTIONS |
A. Management Agreement — Under the Agreement, GSAM manages the Fund, subject to the general supervision of the trustees.
As compensation for the services rendered pursuant to the Agreement, the assumption of the expenses related thereto and administration of the Fund’s business affairs, including providing facilities, GSAM is entitled to a management fee, accrued daily and paid monthly, equal to an annual percentage rate of the Fund’s average daily net assets.
B. Distribution and Service Plan — The Trust, on behalf of the Service Shares of the Fund, has adopted a Distribution and Service Plan (the “Plan”). Under the Plan, Goldman Sachs, which serves as distributor, is entitled to a fee, accrued daily and paid
GOLDMAN SACHS VARIABLE INSURANCE TRUST MONEY MARKET FUND
| 4. AGREEMENTS AND AFFILIATED TRANSACTIONS (continued) |
monthly for distribution services, which may then be paid by Goldman Sachs to authorized dealers. This fee is equal to an annual percentage rate of the Fund’s average daily net assets.
C. Transfer Agency Agreement — Goldman Sachs also serves as the transfer agent of the Fund for a fee pursuant to a Transfer Agency Agreement. The fee charged for such transfer agency services is accrued daily and paid monthly and is equal to an annual percentage rate of the Fund’s average daily net assets.
D. Other Expense Agreements — GSAM has agreed to limit certain “Other Expense” of the Fund (excluding management fees, distribution and service fees, transfer agent fees and expenses, taxes, interest, brokerage fees and litigation, indemnification, shareholder meetings and other extraordinary expenses, exclusive of any custody and transfer agent fee credit reductions) to the extent that such expenses exceed, on an annual basis, 0.004% of the average daily net assets of the Fund. Such Other Expense reimbursements, if any, are computed daily and paid monthly. In addition, the Fund is not obligated to reimburse GSAM for prior fiscal year expense reimbursements, if any. These Other Expense reimbursements will remain in place through at least April 29, 2012, and prior to such date GSAM may not terminate the arrangement without the approval of the trustees. For the six months ended June 30, 2011, GSAM reimbursed approximately $140,000 to the Fund.
E. Total Fund Expenses — During the period ended June 30, 2011, Goldman Sachs, as distributor, agreed to waive a portion of distribution and service plan fees attributable to the Fund. These waivers may be modified or terminated at any time at the option of Goldman Sachs. The following table outlines such fees (net of waivers) and Other Expenses (net of reimbursements and custodian and transfer agent fee credit reductions) in order to determine the Fund’s net annualized expenses for the period. The Fund is not obligated to reimburse Goldman Sachs for prior fiscal year fee waivers, if any.
| Ratio of net expenses to | ||||
| average net assets | ||||
| Fee/Expense Type | for the six months ended | |||
| (contractual rate, if any) | June 30, 2011* | |||
| Management Fee (0.205%) | 0.21 | % | ||
| Distribution and Service Plan Fees (0.25%) | 0.06 | |||
| Transfer Agency Fee (0.02%) | 0.02 | |||
| Other Expenses | — | (a) | ||
| Net Expenses | 0.29 | % | ||
| * | Annualized | |
| (a) | Amount is less than 0.005% of average net assets. |
For the six months ended June 30, 2011, Goldman Sachs waived approximately $117,000 in distribution and service fees.
For the six months ended June 30, 2011, the amounts owed to affiliates of the Fund were approximately $24,000, $3,000, and $2,000 for management, distribution and service fees, and transfer agent fees, respectively.
F. Line of Credit Facility — As of June 30, 2011, the Fund participated in a $580,000,000 committed, unsecured revolving line of credit facility (the “facility”) together with other funds of the Trust and registered investment companies having management agreements with GSAM or its affiliates. Pursuant to the terms of the facility, the Fund and other borrowers could increase the credit amount by an additional $340,000,000, for a total of up to $920,000,000. This facility is to be used solely for temporary or emergency purposes. The interest rate on borrowings is based on the federal funds rate. The facility also requires a fee to be paid by the Fund based on the amount of the commitment that has not been utilized. For the six months ended June 30, 2011, the Fund did not have any borrowings under the facility.
GOLDMAN SACHS VARIABLE INSURANCE TRUST MONEY MARKET FUND
Notes to Financial Statements (continued)
June 30, 2011 (Unaudited)
| 5. OTHER RISKS |
Fund Shareholder Concentration Risk — Certain participating insurance companies, accounts or Goldman Sachs affiliates may from time to time own (beneficially or of record) or control a significant percentage of the Fund’s shares. Redemptions by these entities in the Fund may impact the Fund’s liquidity and NAV. These redemptions may also force the Fund to sell securities, which may increase the Fund’s brokerage costs.
Interest Rate Risk — In a low interest rate environment, low yields on the Fund’s holdings may have an adverse impact on the Fund’s ability to provide a positive yield to its shareholders. As a result, GSAM and/or Goldman Sachs may voluntarily agree to waive certain fees (such as distribution and service, transfer agency and management fees) which can fluctuate daily.
Market and Credit Risks — In the normal course of business, the Fund trades financial instruments and enters into financial transactions where risk of potential loss exists due to changes in the market (market risk). Additionally, the Fund may also be exposed to credit risk in the event that an issuer fails to perform or that an institution or entity with which the Fund has unsettled or open transaction defaults.
| 6. INDEMNIFICATIONS |
Under the Trust’s organizational documents, its trustees, officers, employees and agents are indemnified, to the extent permitted by the Act, against certain liabilities that may arise out of performance of their duties to the Fund. Additionally, in the course of business, the Fund enters into contracts that contain a variety of indemnification clauses. The Fund’s maximum exposure under these arrangements is unknown, as this would involve future claims that may be made against the Fund that have not yet occurred. However, GSAM believes the risk of loss under these arrangements to be remote.
| 7. SUBSEQUENT EVENTS |
Subsequent events after the balance sheet date have been evaluated through the date the financial statements were issued. GSAM has concluded that there is no impact requiring adjustment or disclosure in the financial statements.
GOLDMAN SACHS VARIABLE INSURANCE TRUST MONEY MARKET FUND
Statement Regarding Basis for Approval of Management Agreement (Unaudited)
Background
The Goldman Sachs Money Market Fund (the “Fund”) is an investment portfolio of Goldman Sachs Variable Insurance Trust (the “Trust”). The Board of Trustees oversees the management of the Trust and reviews the investment performance and expenses of the Fund at regularly scheduled meetings held during the year. In addition, the Board of Trustees determines annually whether to approve the continuance of the Trust’s investment management agreement (the “Management Agreement”) with Goldman Sachs Asset Management, L.P. (the “Investment Adviser”) on behalf of the Fund.
The Management Agreement was most recently approved for continuation until June 30, 2012 by the Board of Trustees, including those Trustees who are not parties to the Management Agreement or “interested persons” (as defined in the Investment Company Act of 1940, as amended) of any party thereto (the “Independent Trustees”), at a meeting held on June 15-16, 2011 (the “Annual Meeting”).
The review process undertaken by the Trustees spans the course of the year and culminates with the Annual Meeting. To assist the Trustees in their deliberations, the Trustees have established a Contract Review Committee (the “Committee”), comprised of the Independent Trustees. The Committee held three meetings over the course of the year since the Management Agreement was last approved. At those Committee meetings, regularly scheduled Board meetings and/or the Annual Meeting, the Board, or the Independent Trustees, as applicable, considered matters relating to the Management Agreement, including:
| (a) | the nature and quality of the advisory, administrative and other services provided to the Fund by the Investment Adviser and its affiliates, including information about: |
| (i) | the structure, staff and capabilities of the Investment Adviser and its portfolio management teams; | |
| (ii) | the groups within the Investment Adviser and its affiliates that support the portfolio management teams or provide other types of necessary services, including fund services groups (e.g., accounting and financial reporting, tax, shareholder services and operations), controls and risk management groups (e.g., legal, compliance, valuation oversight, credit risk management, internal audit, market risk analysis, finance and strategy and central funding), sales and distribution support groups and others (e.g., information technology and training); | |
| (iii) | trends in headcount; | |
| (iv) | the Investment Adviser’s financial resources and ability to hire and retain talented personnel and strengthen its operations; and | |
| (v) | the parent company’s support of the Investment Adviser and its mutual fund business, as expressed by the firm’s senior management; |
| (b) | information on the investment performance of the Fund, including comparisons to the performance of similar mutual funds, as provided by a third party mutual fund data provider engaged as part of the contract review process (the “Outside Data Provider”), and general investment outlooks in the markets in which the Fund invests; | |
| (c) | the terms of the Management Agreement and agreements with affiliated service providers entered into by the Trust on behalf of the Fund; | |
| (d) | expense information for the Fund, including: |
| (i) | the relative management fee and expense level of the Fund as compared to those of comparable funds managed by other advisers, as provided by the Outside Data Provider; | |
| (ii) | the Fund’s expense trends over time; and | |
| (iii) | to the extent the Investment Adviser manages institutional accounts or collective investment vehicles having investment objectives and policies similar to those of the Fund, comparative information on the advisory fees charged and services provided to those accounts by the Investment Adviser; |
GOLDMAN SACHS VARIABLE INSURANCE TRUST MONEY MARKET FUND
Statement Regarding Basis for Approval of Management Agreement (Unaudited) (continued)
| (e) | with respect to the extensive investment performance and expense comparison data provided by the Outside Data Provider, its processes in producing that data for the Fund; | |
| (f) | the undertakings of the Investment Adviser and Goldman, Sachs & Co. (“Goldman Sachs”), the Fund’s affiliated distributor and transfer agent, to waive certain fees in order to maintain positive yields for the Fund and reimburse certain expenses of the Fund that exceed a specified level, and a summary of contractual fee reductions made by the Investment Adviser and its affiliates over the past several years with respect to the Fund; | |
| (g) | information relating to the profitability of the Management Agreement and the transfer agency and distribution and service arrangements of the Fund and the Trust as a whole to the Investment Adviser and its affiliates; | |
| (h) | whether the Fund’s existing management fee schedule adequately addressed any economies of scale; | |
| (i) | a summary of the “fall-out” benefits derived by the Investment Adviser and its affiliates from their relationships with the Fund, including the fees received by the Investment Adviser’s affiliates from the Fund for transfer agency, distribution and other services; | |
| (j) | a summary of potential benefits derived by the Fund as a result of its relationship with the Investment Adviser; | |
| (k) | the nature and quality of the services provided to the Fund by its unaffiliated service providers, and the Investment Adviser’s general oversight and evaluation (including reports on due diligence) of those service providers as part of the administration services provided under the Management Agreement; and | |
| (l) | the Investment Adviser’s processes and policies addressing various types of potential conflicts of interest; its approach to risk management; the annual review of the effectiveness of the Fund’s compliance program; and compliance reports. |
The Trustees also received an overview of the Fund’s distribution arrangements. They received information regarding the Fund’s assets, share purchase and redemption activity and the payment of Rule 12b-1 distribution and service fees by the Fund’s Service Shares. Information was also provided to the Trustees relating to revenue sharing payments made by and services provided by the Investment Adviser and its affiliates to intermediaries that promote the sale, distribution and/or servicing of Fund shares.
The presentations made at the Board and Committee meetings and at the Annual Meeting encompassed the Fund and other mutual fund portfolios for which the Board of Trustees has responsibility. In evaluating the Management Agreement at the Annual Meeting, the Trustees relied upon their knowledge, resulting from their meetings and other interactions throughout the year, of the Investment Adviser, its affiliates, their services and the Fund. In conjunction with these meetings, the Trustees received written materials and oral presentations on the topics covered, and were advised by their independent legal counsel regarding their responsibilities and other regulatory requirements related to the approval and continuation of mutual fund investment management agreements under applicable law. In addition, the Investment Adviser and its affiliates provided the Independent Trustees with a written response to a formal request for information sent on behalf of the Independent Trustees by their independent legal counsel. During the course of their deliberations, the Independent Trustees met in executive sessions with their independent legal counsel, without representatives of the Investment Adviser or its affiliates present. The Independent Trustees also discussed the broad range of other investment choices that are available to Fund investors, including the availability of comparable funds managed by other advisers.
Nature, Extent and Quality of the Services Provided Under the Management Agreement
As part of their review, the Trustees considered the nature, extent and quality of the services provided by the Investment Adviser. In this regard, the Trustees considered both the investment advisory services, and the other, non-advisory services, that are provided to the Fund by the Investment Adviser and its affiliates. The Trustees noted the transition in the leadership and changes in personnel of various portfolio management teams that had occurred in recent periods, the potential benefit to the Fund of recent increases in headcount at the Investment Adviser and the ongoing recruitment efforts aimed at bringing high quality investment talent to the Investment Adviser. The Independent Trustees concluded that the Investment Adviser had committed substantial financial and operational resources to the Fund and expressed confidence that the Investment Adviser would continue to do so in the future. The Trustees also observed that the Investment Adviser had made significant commitments to address regulatory compliance requirements applicable to the Fund and the Investment Adviser.
GOLDMAN SACHS VARIABLE INSURANCE TRUST MONEY MARKET FUND
Statement Regarding Basis for Approval of Management Agreement (Unaudited) (continued)
Investment Performance
The Trustees also considered the investment performance of the Fund and the Investment Adviser. In this regard, they compared the Fund to its peers using the performance rankings and ratings compiled by the Outside Data Provider. The information on the Fund’s investment performance was provided for the one- and three-year periods ended December 31, 2010.
In addition, the Trustees considered materials prepared and presentations made by the Investment Adviser’s senior management and portfolio management personnel, in which Fund performance was assessed. The Trustees also considered the Investment Adviser’s periodic reports with respect to the Fund’s risk profile, and how the Investment Adviser’s approach to risk monitoring and management influences portfolio management.
The Independent Trustees considered the Fund’s investment performance in light of its investment objective and credit parameters. They also considered the difficult yield environment in which the Fund operated throughout 2009 and 2010. They noted that despite volatility in the financial markets in 2009 and 2010, the Investment Adviser was able to maintain a stable net asset value and positive yield to meet the demand of the Fund’s investors through voluntary fee waivers and expense reimbursements.
Costs of Services Provided and Competitive Information
The Trustees considered the contractual fee rates payable by the Fund under the Management Agreement. In this regard, the Trustees considered information on the services rendered by the Investment Adviser to the Fund, which included both advisory and administrative services that were directed to the needs and operations of the Fund as a registered mutual fund.
In particular, the Trustees reviewed analyses prepared by the Outside Data Provider regarding the expense rankings of the Fund. The analyses provided a comparison of the Fund’s management fee to those of a relevant peer group and category universe; an expense analysis which compared the Fund’s expenses to a peer group and a category universe; and a five-year history, comparing the Fund’s expenses to the peer and category medians. The analyses also compared the Fund’s transfer agency fees, custody and accounting fees, distribution fees, other expenses and fee waivers/reimbursements to those of other funds in the peer group and the peer group median. The Trustees concluded that the comparisons provided by the Outside Data Provider were useful in evaluating the reasonableness of the management fees and total expenses paid by the Fund.
In addition, the Trustees considered the Investment Adviser’s undertaking to limit the Fund’s “other expenses” ratio (excluding certain expenses) to a certain specified level. They noted that the Investment Adviser and Goldman Sachs took a number of steps, including waiving management, distribution and service and transfer agency fees and reimbursing expenses, in order to maintain positive yields for the Fund. They also considered, to the extent that the Investment Adviser manages institutional accounts or collective investment vehicles having investment objectives and policies similar to those of the Fund, comparative fee information for services provided by the Investment Adviser to those accounts, and information that indicated that services provided to the Fund differed in various significant respects from the services provided to institutional accounts, which generally operated under less stringent legal and regulatory structures, required fewer services from the Investment Adviser to a smaller number of client contact points, were less time-intensive and paid lower fees. By contrast, the Trustees noted that the Investment Adviser provides substantial administrative services to the Fund under the terms of the Management Agreement.
In addition, the Trustees noted that shareholders are able to redeem their Fund shares at any time if they believe that the Fund fees and expenses are too high or if they are dissatisfied with the performance of the Fund.
GOLDMAN SACHS VARIABLE INSURANCE TRUST MONEY MARKET FUND
Statement Regarding Basis for Approval of Management Agreement (Unaudited) (continued)
Profitability
The Trustees reviewed the Investment Adviser’s revenues and pre-tax profit margins with respect to the Trust and the Fund. In this regard the Trustees noted that they had received, among other things, profitability analyses and summaries, revenue and expense schedules by Fund and by function (i.e., investment management, transfer agency and distribution and service) and the Investment Adviser’s expense allocation methodology. They observed that the profitability and expense figures are substantially similar to those used by the Investment Adviser for many internal purposes, including compensation decisions among various business groups, and are thus subject to a vigorous internal debate about how certain revenue and expenses should be allocated. The Trustees also reviewed the report of the internal audit group within the Goldman Sachs organization, which included an assessment of the reasonableness and consistency of the Investment Adviser’s expense allocation methodology and an evaluation of the accuracy of the Investment Adviser’s profitability analysis calculations. Profitability data for the Trust and the Fund were provided for 2010 and 2009, and the Trustees considered this information in relation to the Investment Adviser’s overall profitability. The Trustees considered the Investment Adviser’s revenues and pre-tax profit margins both in absolute terms and in comparison to information on the reported pre-tax profit margins earned by certain other asset management firms.
Economies of Scale
The Trustees considered the information that had been provided regarding the Investment Adviser’s profitability and noted that the Fund does not have management fee breakpoints. The Trustees also noted that the Investment Adviser had agreed to reduce the contractual management fee rate paid to the Fund in 2010. They considered the amount of assets in the Fund; the Fund’s recent purchase and redemption activity; the information provided by the Investment Adviser relating to the costs of the services provided by the Investment Adviser and its affiliates and their realized profits; information comparing the contractual fee rates charged by the Investment Adviser with fee rates charged to other money market funds in the peer group; the Investment Adviser’s undertaking to limit the Fund’s “other expenses” ratio (excluding certain expenses) to a certain amount; and the willingness of the Investment Adviser and Goldman Sachs to waive certain fees on a temporary basis in order to maintain positive Fund yields. They considered a report prepared by the Outside Data Provider, which surveyed money market funds’ management fee arrangements and use of breakpoints. The Trustees also considered the competitive nature of the money market fund business and the competitiveness of the fees charged to the Fund by the Investment Adviser. They also observed that the Fund’s level of profitability was lower as a result of fee waivers and “other expenses” reimbursements.
Other Benefits to the Investment Adviser and Its Affiliates
The Trustees also considered the other benefits derived by the Investment Adviser and its affiliates from their relationship with the Fund as stated above, including: (a) transfer agency fees received by Goldman Sachs; (b) trading efficiencies resulting from aggregation of orders of the Fund with those for other funds or accounts managed by the Investment Adviser; (c) the Investment Adviser’s ability to leverage the infrastructure designed to service the Fund on behalf of its other clients; (d) the Investment Adviser’s ability to cross-market other products and services to Fund shareholders; (e) Goldman Sachs’ retention of certain fees as Fund Distributor; (f) Goldman Sachs’ ability to engage in principal transactions with the Fund under the SEC exemptive orders permitting such trades; (g) the Investment Adviser’s ability to negotiate better pricing with custodians on behalf of its other clients, as a result of the relationship with the Fund; and (h) the possibility that the working relationship between the Investment Adviser and the Fund’s third party service providers may cause those service providers to be open to doing business with other areas of Goldman Sachs. In the course of considering the foregoing, the Independent Trustees requested and received further information quantifying certain of the fall-out benefits.
GOLDMAN SACHS VARIABLE INSURANCE TRUST MONEY MARKET FUND
Statement Regarding Basis for Approval of Management Agreement (Unaudited) (continued)
Other Benefits to the Fund and Its Shareholders
The Trustees also noted that the Fund receives certain potential benefits as a result of its relationship with the Investment Adviser, including: (a) trading efficiencies resulting from aggregation of orders of the Fund with those of other funds or accounts managed by the Investment Adviser; (b) improved servicing and pricing from vendors because of the volume of business generated by the Investment Adviser and its affiliates; (c) improved servicing from broker-dealers because of the volume of business generated by the Investment Adviser and its affiliates; (d) the advantages gained from the Investment Adviser’s knowledge and experience gained from managing other accounts and products; (e) the Investment Adviser’s ability to hire and retain qualified personnel to provide services to the Fund because of the reputation of the Goldman Sachs organization; (f) the Fund’s access, through the Investment Adviser, to certain firmwide resources (e.g., proprietary databases); and (g) the Fund’s access to certain affiliated distribution channels. The Trustees noted the competitive nature of the mutual fund marketplace, and noted further that many of the Fund’s shareholders invested in the Fund in part because of the Fund’s relationship with the Investment Adviser and that those shareholders have a general expectation that the relationship will continue.
Conclusion
In connection with their consideration of the Management Agreement, the Trustees gave weight to each of the factors described above, but did not identify any particular factor as controlling their decision. After deliberation and consideration of all of the information provided, including the factors described above, the Trustees concluded, in the exercise of their business judgment, that the management fees paid by the Fund were reasonable in light of the services provided to it by the Investment Adviser, the Investment Adviser’s costs and the Fund’s current and reasonably foreseeable asset levels. The Trustees unanimously concluded that the Investment Adviser’s continued management likely would benefit the Fund and its shareholders and that the Management Agreement should be approved and continued with respect to the Fund until June 30, 2012.
GOLDMAN SACHS VARIABLE INSURANCE TRUST MONEY MARKET FUND
Fund Expenses — Six Month Period Ended June 30, 2011 (Unaudited)
As a shareholder of the Service Shares of the Fund, you incur ongoing costs, including management fees; distribution and service (12b-1) fees; and other Fund expenses. This Example is intended to help you understand your ongoing costs (in dollars) of investing in the Fund and to compare these costs with the ongoing costs of investing in other mutual funds.
The Example is based on an investment of $1,000 invested at the beginning of the period and held for the entire period from January 1, 2011 through June 30, 2011.
Actual Expenses — The first line in the table below provides information about actual account values and actual expenses. You may use the information in this line, together with the amount you invested, to estimate the expenses that you paid over the period. Simply divide your account value by $1,000 (for example, an $8,600 account value divided by $1,000=8.6), then multiply the result by the number in the first line under the heading entitled “Expenses Paid” to estimate the expenses you paid on your account during this period.
Hypothetical Example for Comparison Purposes — The second line in the table below provides information about hypothetical account values and hypothetical expenses based on the Fund’s actual net expense ratio and an assumed rate of return of 5% per year before expenses, which is not the Fund’s actual return. The hypothetical account values and expenses may not be used to estimate the actual ending account balance or expenses you paid for the period. You may use this information to compare the ongoing costs of investing in the Fund and other funds. To do so, compare this 5% hypothetical example with the 5% hypothetical examples that appear in the shareholder reports of the other funds.
Please note that the expenses shown in the table are meant to highlight your ongoing costs only and do not reflect any transactional costs, such as sales charges, redemption fees, or exchange fees. Therefore, the second line of the table is useful in comparing ongoing costs only, and will not help you determine the relative total costs of owning different funds. In addition, if these transactional costs were included, your costs would have been higher.
| Expense Paid | |||||||||||||||
| for the | |||||||||||||||
| Beginning | Ending | 6 Months | |||||||||||||
| Account Value | Account Value | Ended | |||||||||||||
| 01/01/11 | 06/30/11 | 06/30/11* | |||||||||||||
| Actual | $ | 1,000.00 | $ | 1,000.10 | $ | 1.44 | |||||||||
| Hypothetical 5% return | 1,000.00 | 1,023.36 | + | 1.45 | |||||||||||
| * | Expenses are calculated using the Fund’s annualized net expense ratio, which represents the ongoing expenses as a percentage of net assets for the six months ended June 30, 2011. Expenses are calculated by multiplying the annualized net expense ratio by the average account value for the period; then multiplying the result by the number of days in the most recent fiscal half year; and then dividing that result by the number of days in the fiscal year. The annualized net expense ratio for the period was 0.29%. | |
| + | Hypothetical expenses are based on the Fund’s actual annualized net expense ratio and an assumed rate of return of 5% per year before expenses. |
| TRUSTEES Ashok N. Bakhru, Chairman Donald C. Burke John P. Coblentz, Jr. Diana M. Daniels Joseph P. LoRusso James A. McNamara Jessica Palmer Alan A. Shuch Richard P. Strubel | OFFICERS James A. McNamara, President George F. Travers, Principal Financial Officer Peter V. Bonanno, Secretary Scott M. McHugh, Treasurer | |
| GOLDMAN, SACHS & CO. Distributor and Transfer Agent | ||
| GOLDMAN SACHS ASSET MANAGEMENT, L.P. Investment Adviser 200 West Street, New York New York 10282 | ||
| Visit our Web site at www.goldmansachsfunds.com/vit to obtain the most recent month-end returns. | ||
| The reports concerning the Fund included in this shareholder report may contain certain forward-looking statements about the factors that may affect the performance of the Fund in the future. These statements are based on Fund management’s predictions and expectations concerning certain future events and their expected impact on the Fund, such as performance of the economy as a whole and of specific industry sectors, changes in the levels of interest rates, the impact of developing world events, and other factors that may influence the future performance of the Fund. Management believes these forward-looking statements to be reasonable, although they are inherently uncertain and difficult to predict. Actual events may cause adjustments in portfolio management strategies from those currently expected to be employed. | ||
| A description of the policies and procedures that the Fund uses to determine how to vote proxies relating to portfolio securities and information regarding how the Fund voted proxies relating to portfolio securities during the most recent 12-month period ended June 30 is available (i) without charge, upon request by calling 1-800-621-2550; and (ii) on the Securities and Exchange Commission (“SEC”) Web site at http://www.sec.gov. | ||
| The Fund files its complete schedule of portfolio holdings with the SEC for the first and third quarters of each fiscal year on Form N-Q. The Fund’s Form N-Q is available on the SEC’s website at http://www.sec.gov within 60 days after the Fund’s first and third fiscal quarters. When available, the Fund’s Forms N-Q may be reviewed and copied at the SEC’s Public Reference Room in Washington, D.C. and information on the operation of the Public Reference Room may also be obtained by calling 1-800-SEC-0330. Forms N-Q may be obtained upon request and without charge by calling 1-800-621-2550. | ||
| Holdings and allocations shown may not be representative of current or future investments. Holdings and allocations may not include the Fund’s entire investment portfolio,which may change at any time. Fund holdings should not be relied on in making investment decisions and should not be construed as research or investment advice regarding particular securities. | ||
| Economic and market forecasts presented herein reflect our judgment as of the date of this presentation and are subject to change without notice. These forecasts do not take into account the specific investment objectives, restrictions, tax and financial situation or other needs of any specific client. Actual data will vary and may not be reflected here. These forecasts are subject to high levels of uncertainty that may affect actual performance. Accordingly, these forecasts should be viewed as merely representative of a broad range of possible outcomes. These forecasts are estimated, based on assumptions, and are subject to significant revision and may change materially as economic and market conditions change. Goldman Sachs has no obligation to provide updates or changes to these forecasts. Case studies and examples are for illustrative purposes only. | ||
| The portfolio risk management process includes an effort to monitor and manage risk, but does not imply low risk. | ||
| Shares of the Goldman Sachs VIT Funds are offered to separate accounts of participating life insurance companies for the purpose of funding variable annuity contracts and variable life insurance policies. Shares of the Fund are not offered directly to the general public. The variable annuity contracts and variable life insurance policies are described in the separate prospectuses issued by participating insurance companies. You should refer to those prospectuses for information about surrender charges, mortality and expense risk fees and other charges that may be assessed by participating insurance companies under the variable annuity contracts or variable life insurance policies. Such fees or charges, if any, may affect the return you may realize with respect to your investments. Ask your representative for more complete information. Please consider a fund’s objectives, risks and charges and expenses, and read the prospectus carefully before investing. The prospectus contains this and other information about the Fund. | ||
| This material is not authorized for distribution to prospective investors unless preceded or accompanied by a current Prospectus or summary prospectus, if applicable. Investors should consider a Fund’s objective, risks, and charges and expenses, and read the summary prospectus, if available, and/or the Prospectus carefully before investing or sending money. The summary prospectus, if available, and the Prospectus contain this and other information about a Fund and may be obtained from your authorized dealer or from Goldman, Sachs & Co. by calling 1-800-621-2550. | ||
| Toll Free (in U.S.): 800-292-4726 | ||
| This report is prepared for the general information of contract owners and is not an offer of shares of the Goldman Sachs Variable Insurance Trust: Goldman Sachs Money Market Fund. | ||
| © 2011 Goldman Sachs. All rights reserved. | ||
| VITMMSAR11/57685.MF.MED.TMPL/8/2011 | ||
| ITEM 2. | CODE OF ETHICS. |
| The information required by this Item is only required in an annual report on this Form N-CSR. |
| ITEM 3. | AUDIT COMMITTEE FINANCIAL EXPERT. | |
| The information required by this Item is only required in an annual report on this Form N-CSR. |
| ITEM 4. | PRINCIPAL ACCOUNTANT FEES AND SERVICES. | |
| The information required by this Item is only required in an annual report on this Form N-CSR. |
| ITEM 5. | AUDIT COMMITTEE OF LISTED REGISTRANTS. |
| Not applicable. |
| ITEM 6. | INVESTMENTS. |
| (a) | Schedules of Investments are included as part of the Semi-Annual Reports to Shareholders filed under Item 1 of this Form N-CSR. |
| (b) | Not applicable. |
| ITEM 7. | DISCLOSURE OF PROXY VOTING POLICIES AND PROCEDURES FOR CLOSED-END MANAGEMENT INVESTMENT COMPANIES. |
| Not applicable. |
| ITEM 8. | PORTFOLIO MANAGERS OF CLOSED-END MANAGEMENT INVESTMENT COMPANIES. |
| Not applicable. |
| ITEM 9. | PURCHASES OF EQUITY SECURITIES BY CLOSED-END MANAGEMENT INVESTMENT COMPANY AND AFFILIATED PURCHASERS. |
| Not applicable. |
| ITEM 10. | SUBMISSION OF MATTERS TO A VOTE OF SECURITY HOLDERS. |
| There have been no material changes to the procedures by which shareholders may recommend nominees to the registrant’s board of trustees. |
| ITEM 11. | CONTROLS AND PROCEDURES. |
| (a) | The registrant’s principal executive and principal financial officers or persons performing similar functions have concluded that the registrant’s disclosure controls and procedures (as defined in Rule 30a-3(c) under the Investment Company Act of 1940, as amended (the “1940 Act”)) are effective as of a date within 90 days of the filing date of this report that includes the disclosure required by this paragraph, based on the evaluation of these controls and procedures required by Rule 30a-3(b) under the 1940 Act and 15d-15(b) under the Securities Exchange Act of 1934, as amended. | ||
| (b) | There were no changes in the registrant’s internal control over financial reporting (as defined in Rule 30a-3(d) under the 1940 Act) that occurred during the registrant’s second fiscal quarter of the period covered by this report that have materially affected, or are reasonably likely to materially affect, the registrant’s internal control over financial reporting. |
| ITEM 12. | EXHIBITS. |
| (a)(1) | The information required by this Item is only required in an annual report on this Form N-CSR. | |||
| (a)(2) | Exhibit 99.906CERT | Certifications pursuant to Section 302 of the Sarbanes-Oxley Act of 2002 are filed herewith. | ||
| (a)(3) | Not applicable. | |||
| (b) | Exhibit 99.906CERT | Certifications pursuant to Section 906 of the Sarbanes-Oxley Act of 2002 are filed herewith. |
SIGNATURES
Pursuant to the requirements of the Securities Exchange Act of 1934 and the Investment Company Act of 1940, the registrant has duly caused this report to be signed on its behalf by the undersigned, thereunto duly authorized.
| Goldman Sachs Variable Insurance Trust | ||
| /s/ James A. McNamara | ||
| By: James A. McNamara | ||
| Principal Executive Officer of | ||
| Goldman Sachs Variable Insurance Trust | ||
| Date: August 24, 2011 | ||
| Pursuant to the requirements of the Securities Exchange Act of 1934 and the Investment Company Act of 1940, this report has been signed below by the following persons on behalf of the registrant and in the capacities and on the dates indicated. | ||
/s/ James A. McNamara | ||
| By: James A. McNamara | ||
| Principal Executive Officer of | ||
| Goldman Sachs Variable Insurance Trust | ||
| Date: August 24, 2011 | ||
/s/ George F. Travers | ||
| By: George F. Travers | ||
| Principal Financial Officer of | ||
| Goldman Sachs Variable Insurance Trust | ||
| Date: August 24, 2011 | ||