UNITED STATES
SECURITIES AND EXCHANGE COMMISSION
Washington, D.C. 20549
FORM N-CSR
CERTIFIED SHAREHOLDER REPORT OF REGISTERED
MANAGEMENT INVESTMENT COMPANIES
Investment Company Act file number 811-08361
Goldman Sachs Variable Insurance Trust
(Exact name of registrant as specified in charter)
71 South Wacker Drive, Chicago, Illinois 60606-6303
(Address of principal executive offices) (Zip code)
| Copies to: | ||
| Geoffrey R.T. Kenyon, Esq. | ||
Caroline Kraus | Dechert LLP | |
| Goldman, Sachs & Co. | 100 Oliver Street | |
| 200 West Street | 40th Floor | |
| New York, NY 10282 | Boston, MA 02110-2605 |
(Name and address of agents for service)
Registrant’s telephone number, including area code: (312) 655-4400
Date of fiscal year end: December 31
Date of reporting period: June 30, 2013
| ITEM 1. | REPORTS TO STOCKHOLDERS. |
| The Semi-Annual Reports to Stockholders are filed herewith. |
Goldman
Sachs Variable Insurance Trust
Goldman Sachs
Global Markets
Navigator Fund
Semi-Annual Report
June 30, 2013

GOLDMAN SACHS VARIABLE INSURANCE TRUST GLOBAL MARKETS NAVIGATOR FUND
Principal Investment Strategies and Risks
This is not a complete list of the risks that may affect the Fund. For additional information concerning the risks applicable to the Fund, please see the Fund’s Prospectus.
Shares of the Goldman Sachs Variable Insurance Trust — Goldman Sachs Global Markets Navigator Fund are offered to separate accounts of participating life insurance companies for the purpose of funding variable annuity contracts and variable life insurance policies. Shares of the Fund are not offered directly to the general public. The variable annuity contracts and variable life insurance policies are described in the separate prospectuses issued by participating insurance companies. You should refer to those prospectuses for information about surrender charges, mortality and expense risk fees and other charges that may be assessed by participating insurance companies under the variable annuity contracts or variable life insurance policies. Such fees or charges, if any, may affect the return you realize with respect to your investments. Ask your representative for more complete information. Please consider the Fund’s objective, risks and charges and expenses, and read the Prospectus carefully before investing. The Prospectus contains this and other information about the Fund.
The Goldman Sachs Global Markets Navigator Fund seeks to achieve investment results that approximate the performance of the Goldman Sachs Global Markets Navigator Index (the “Index”). The Index is comprised of, and allocates exposure to, a set of underlying indices representing various global asset classes including, but not limited to, global equity, fixed income and commodity assets. The Index is constructed using a proprietary methodology developed by the index provider, and is rebalanced at least monthly. The Fund’s performance may not match, and may vary substantially from, that of the Index. There can be no assurance that the methodology used by the index provider in constructing the Index will correctly forecast certain risks or make effective tactical decisions, and the Fund’s attempt to track this Index may cause it to underperform general securities markets and/or other asset classes. Derivative instruments (including swaps) may involve a high degree of financial risk. These risks include the risk that a small movement in the price of the underlying security or benchmark may result in a disproportionately large movement, unfavorable or favorable, in the price of the derivative instrument; risk of default by a counterparty; and liquidity risk. The Fund’s use of derivatives may result in leverage, which can make the Fund more volatile. Over-the-counter transactions are subject to less government regulation and supervision. The Fund’s equity investments are subject to market risk, which means that the value of its investments may go up or down in response to the prospects of individual companies, particular sectors and/or general economic conditions. The Fund’s fixed income investments are subject to the risks associated with debt securities generally, including credit, liquidity and interest rate risk. The Fund is also subject to the risk that the issuers of sovereign debt or the government authorities that control the payment of debt may be unable or unwilling to repay principal or interest when due. High yield, lower rated investments involve greater price volatility and present greater risks than higher rated fixed income securities. The value of the Fund’s treasury inflation protected securities (TIPS) generally fluctuates in response to inflationary concerns, and as inflationary concerns decrease, TIPS become less valuable. Any guarantee on U.S. government securities applies only to the underlying securities of the Fund if held to maturity and not to the value of the Fund’s shares. The Fund is subject to the risk that exposure to the commodities markets may subject the Fund to greater volatility than investments in traditional securities. Foreign and emerging markets investments may be more volatile and less liquid than investments in U.S. securities and are subject to the risks of currency fluctuations and adverse economic or political developments. At times, the Fund may be unable to sell certain of its portfolio securities without a substantial drop in price, if at all. The Fund’s investments in other investment companies (including ETFs) subject it to additional expenses. Because the Fund may concentrate its investments in an industry (only in the event that an industry represents 20% or more of
1
GOLDMAN SACHS VARIABLE INSURANCE TRUST GLOBAL MARKETS NAVIGATOR FUND
the Fund’s index), the Fund may be subject to greater risk of loss as a result of adverse economic, business or other developments affecting that industry. The Fund is “non-diversified” and may invest more of its assets in fewer issuers than “diversified” funds. Accordingly, the Fund may be more susceptible to adverse developments affecting any single issuer held in its portfolio and to greater losses resulting from these developments.
The “GS Global Markets Navigator Index” is a trademark or service mark of Goldman, Sachs & Co. and has been licensed for use by the Investment Adviser in connection with the Fund. As the licensor of this trademark or service mark, Goldman, Sachs & Co. does not make any representation regarding the advisability of investing in the Fund.
2
GOLDMAN SACHS VARIABLE INSURANCE TRUST GLOBAL MARKETS NAVIGATOR FUND
INVESTMENT OBJECTIVE
The Fund seeks to achieve investment results that approximate the performance of the GS Global Markets Navigator Index.
Portfolio Management Discussion and Analysis
Below, the Goldman Sachs Quantitative Investment Strategies Team discusses the Goldman Sachs Variable Insurance Trust — Goldman Sachs Global Markets Navigator Fund’s (the “Fund”) performance and positioning for the six-month period ended June 30, 2013 (the “Reporting Period”).
How did the Fund perform during the Reporting Period?
During the Reporting Period, the Fund’s Service Shares generated a cumulative total return of 6.37%. This return compares to the 8.30% cumulative total return of the Fund’s benchmark, the GS Global Markets Navigator Index (the “Index”), during the same time period. A blended index comprised 60% of the Standard & Poor’s® 500 Indexa (with dividends reinvested) and 40% of the Barclays U.S. Aggregate Bond Indexb (with dividends reinvested) generated a cumulative total return of 7.10% during the same time period.
The S&P 500® Index and the Barclays U.S. Aggregate Bond Index generated cumulative total returns of 13.82% and -2.44%, respectively, during the same time period.
Importantly, during the Reporting Period, the Fund’s overall annualized volatility was 10.50%, less than the S&P® 500 Index’s annualized volatility of 12.10% during the same time period.
What economic and market factors most influenced the Fund during the Reporting Period?
U.S. equity markets rallied during the first quarter of 2013 despite the overhang of automatic spending cuts, or sequestration, that went into effect in March 2013. U.S. equity performance reflected a variety of improving U.S. economic indicators — strong momentum in the housing market continued and the employment picture improved. However, in the second quarter of 2013, bullish sentiment began to fade, and the U.S. equity rally halted in mid-May 2013 when Federal Reserve (“Fed”) Chair Bernanke announced the potential “tapering” of the pace of quantitative easing asset purchases. U.S. equity markets reacted negatively again in June 2013 to news the slowing of the asset purchase program could begin later in the year, with the program ending by the middle of 2014 if the economy grows as expected. U.S. equity markets calmed toward the end of the month as a downward revision of first quarter Gross Domestic Product (“GDP”) from 2.4% to 1.8% supported reassurance from the Fed that it would only begin reducing asset purchases if the economy was clearly on track.
In the international equity markets, European equities managed gains during the Reporting Period overall, despite a banking crisis in Cyprus and further economic contraction in the Eurozone. Strong performance by the Japanese equity market dominated returns for the Reporting Period but was partially offset by weaker returns for the Asia ex-Japan region, where such returns were exaggerated by depreciating currencies. The yen weakened to its lowest level against the U.S. dollar since mid-2009 on expectations the new head of the Bank of Japan will aggressively pursue a 2% inflation target. Japanese equities hit a five-year high during May 2013 before taking a sharp turn down with a number of other global equity markets. However, after Fed Chair Bernanke’s comments about the potential “tapering” of the pace of quantitative easing asset purchases, the rally in international equities virtually halted. In June, international equity markets also reacted negatively to news the Fed could begin slowing its asset purchase program later in 2013.
The global fixed income markets, which had begun the Reporting Period in January 2013 with a rally, reversed course during February 2013, primarily on worries about U.S. fiscal policy gridlock and Italy’s elections. In March 2013, Cyprus’ bailout by Euro-area finance ministers raised the prospect of a tax on bank deposits, prompting fears of a more widespread run on European banks. Investors grew more defensive, and government bond yields declined. In contrast, spread, or non-U.S. Treasury, sectors
| a | The S&P 500 Index is the Standard & Poor’s 500 Composite Stock Prices Index of 500 stocks, an unmanaged index of common stock prices. The Index figures do not reflect any deduction for fees, expenses or taxes. It is not possible to invest directly in an unmanaged index. |
| b | The Barclays U.S. Aggregate Bond Index represents an unmanaged diversified portfolio of fixed income securities, including U.S. Treasuries, investment-grade corporate bonds, and mortgage-backed and asset-backed securities. The Index figures do not reflect any deduction for fees, expenses or taxes. It is not possible to invest directly in an unmanaged index. |
3
GOLDMAN SACHS VARIABLE INSURANCE TRUST GLOBAL MARKETS NAVIGATOR FUND
remained relatively firm. In early April 2013, government bond yields declined on disappointing economic data before stabilizing later in the month. Spread sectors performed well, as investors looked past sluggish economic data for higher yielding assets in the exceptionally low interest rate environment. After Fed Chair Bernanke said the U.S. central bank could begin reducing asset purchases, government bond yields rose substantially. At the same time, spread sectors grew more volatile, reflecting widespread uncertainty over how markets may function as the Fed withdraws support. In June 2013, bond investors focused on the U.S. economy and stronger than expected payrolls data, which reinforced expectations the Fed would start reducing its quantitative easing during 2013. Government bond yields continued to increase, as the Fed meeting and press conference were more hawkish than expected. Spread sectors remained volatile. Meanwhile, European economic data improved, with modest increases in the Eurozone Purchasing Managers Indices and accelerating expansion in the U.K. Japan’s economy continued to respond positively to its government and central bank policies. In contrast, China’s economic data raised concerns about the extent of that nation’s slowdown.
What key factors were responsible for the Fund’s performance during the Reporting Period?
The Fund seeks to achieve its objective by investing in financial instruments that provide exposure to the various underlying global equity and fixed income indices that comprise the Index. Using a momentum-based methodology, the Fund strives to manage risk and hedge this with “potential” in changing market environments.
Momentum investing seeks growth of capital by gaining exposure to asset classes that have exhibited trends in price performance over selected time periods. In managing the Fund, we use a methodology that evaluates historical three-, six- and nine-month returns, volatilities and correlations across a range of nine global asset classes. Represented by indices, these asset classes include, within the equities category, U.S. large-cap, Europe, Asia, emerging markets, U.K. and small-cap stocks. Within the fixed income category, the Fund may allocate assets to U.S., European and Japanese fixed income securities. The analysis of these asset classes drives the aggregate allocations of the Fund over time. We believe market price momentum — either positive or negative — has significant predictive power.
During the Reporting Period, the Fund’s fixed income allocations detracted from its relative performance. The Fund’s allocation to German government bonds hurt returns most, especially during May and June 2013. Its exposure to U.S. Treasury securities also detracted from relative returns during the Reporting Period.
On the positive side, the Fund’s positioning in equities added to its relative performance. In particular, the Fund benefited from its allocation to Japanese equities and its exposure to U.S. large-cap and small-cap stocks.
How did volatility affect the Fund during the Reporting Period?
As part of our investment approach, we seek to mitigate the Fund’s volatility. As mentioned earlier, during the Reporting Period, the Fund’s actual volatility (annualized, using daily returns) was 10.50% versus the S&P 500® Index’s annualized volatility of 12.10%.
How was the Fund positioned during the Reporting Period?
During the Reporting Period, we tactically managed the Fund’s allocations across equity and fixed income markets based on the momentum and volatility of these asset classes. When the Reporting Period began, the Fund’s allocations were split rather evenly between equities and fixed income. By the end of March 2013, the Fund’s allocation to equities had risen to approximately 80% of its total assets, as the Fund benefited from the strong first calendar quarter rally in the global equity markets. During the first quarter of 2013, we concentrated the Fund’s equity investments in U.S. and Japanese equities and eliminated its position in emerging markets equities.
Within its fixed income allocation at the beginning of the Reporting Period, the Fund had a weighting of approximately 40% of its total assets in U.S. Treasury securities. By the end of March 2013, the Fund’s weighting in U.S. Treasury securities had dipped to less than 5% of its total assets, and we held it near zero throughout the second quarter of 2013.
In addition, toward the end of June 2013, the Fund’s daily volatility control was triggered (that is, the Fund’s 90-day realized volatility exceeded our predetermined 10% threshold) and in keeping with our momentum-based methodology, we proportionally reduced portfolio risk by 20% and added an allocation to cash.
4
GOLDMAN SACHS VARIABLE INSURANCE TRUST GLOBAL MARKETS NAVIGATOR FUND
How did the Fund use derivatives and similar instruments during the Reporting Period?
During the Reporting Period, the Fund used exchange-traded index futures contracts to gain exposure to U.S. small-cap equities and to non-U.S. developed market equities, including those in Europe and Japan, as well as to gain exposure to U.S. and non-U.S. fixed income.
Were there any changes to the Fund’s portfolio management team during the Reporting Period?
After 33 years of distinguished service, Don Mulvihill, CIO of Customized Beta Strategies within the Quantitative Investment Strategies (“QIS”) team, decided to retire from the firm. As of June 2013, Gary Chropuvka assumed Mr. Mulvihill’s role as Head of the Customized Beta Strategies business, overseeing the team’s tax-efficient, rules-based and customized beta investment strategies. Mr. Chropuvka brings extensive experience having joined QIS in 1999 with Mr. Mulvihill to manage the team’s tax-efficient investment strategies. All of Mr. Mulvihill’s direct investment responsibilities were performed within a co-lead or team leadership structure and follow processes that provide continuity in day-to-day investment decision-making in each portfolio.
What is the Fund’s tactical asset allocation view and strategy for the months ahead?
By the end of the Reporting Period, we had reduced the Fund’s allocation to equities and fixed income. We had added a significant allocation to cash, as we sought to reduce risk, largely in response to heightened volatility and poor momentum across the financial markets during June 2013. In fixed income, at the end of the Reporting Period, the Fund had exposure to German and Japanese government bonds. Within equities, it had exposure to U.S. large-cap and small-cap equities. At the end of the Reporting Period, the Fund had a reduced allocation to Japanese equities because of the increased volatility in the Japanese equity market. The Fund, like the Index, had neutral exposure to emerging markets equities.
Going forward, we intend to position the Fund to provide exposure to price momentum from among nine underlying asset classes, while dynamically seeking to manage the volatility, or risk, of the overall portfolio. When volatility increases, our goal is to preserve capital by moving the Fund into less volatile assets such as fixed income. When we believe the financial markets have become more stable, we expect to allocate a greater portion of the Fund’s assets to equities. There is no guarantee the Fund’s dynamic management strategy will cause it to achieve its investment objective.
5
FUND BASICS
Global Markets Navigator Fund
as of June 30, 2013
STANDARDIZED TOTAL RETURNS1
| For the period ended 6/30/13 | One Year | Since Inception | Inception Date | |||||||
| Service | 11.81 | % | 8.50 | % | 4/16/12 | |||||
| 1 | Standardized Total Returns are average annual total returns as of the most recent calendar quarter-end. They assume reinvestment of all distributions at net asset value (“NAV”). Because Service Shares do not involve a sales charge, such a charge is not applied to their Standardized Total Returns. |
Total return figures in the above chart represent past performance and do not indicate future results, which will vary. The investment return and principal value of an investment will fluctuate and, therefore, an investor’s shares, when redeemed, may be worth more or less than their original cost. Current performance may be lower or higher than the total return figures in the above chart. Please visit www.goldmansachsfunds.com/vit to obtain the most recent month-end returns. Performance reflects fee waivers and/or expense limitations in effect during the periods shown. In their absence, performance would be reduced.
EXPENSE RATIOS2
| Net Expense Ratio (Current) | Gross Expense Ratio (Before Waivers) | |||||||
| Service | 1.08 | % | 3.78 | % | ||||
| 2 | The expense ratios of the Fund, both current (net of applicable fee waivers and/or expense limitations) and before waivers (gross of applicable fee waivers and/or expense limitations), are as set forth above according to the most recent publicly available Prospectus for the Fund and may differ from the expense ratios disclosed in the Financial Highlights in this report. The Fund’s waivers and/or expense limitations will remain in place through at least April 30, 2014, and prior to such date the Investment Adviser may not terminate the arrangements without the approval of the Fund’s Board of Trustees. If these arrangements are discontinued in the future, the expense ratios may change without shareholder approval. |
6
FUND BASICS
FUND COMPOSITION3
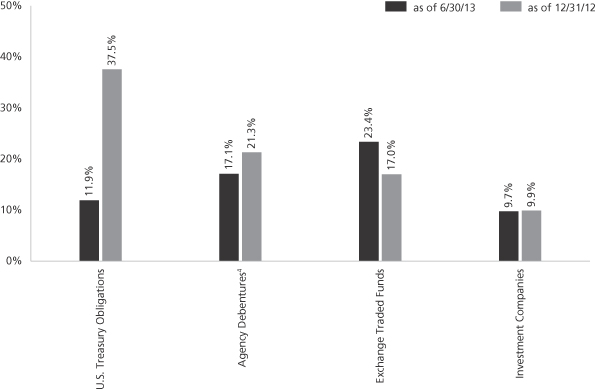
| 3 | The percentage shown for each investment category reflects the value of investments in that category as a percentage of net assets. Figures in the above graph may not sum to 100% due to the exclusion of other assets and liabilities. Underlying sector allocations of exchange traded funds (“ETFs”) held by the Fund are not reflected in the graph above. Consequently, the Fund’s overall sector allocations may differ from the percentages contained in the graph above. The graph depicts the Fund’s investments but may not represent the Fund’s market exposure due to the exclusion of certain derivatives, if any, as listed in the Additional Investment Information section of the Schedule of Investments. |
| 4 | “Agency Debentures” include agency securities offered by companies such as Federal Home Loan Bank and Federal Home Loan Mortgage Corporation, which operate under a government charter. While they are required to report to a government regulator, their assets are not explicitly guaranteed by the government and they otherwise operate like any other publicly traded company. |
7
GOLDMAN SACHS VARIABLE INSURANCE TRUST GLOBAL MARKETS NAVIGATOR FUND
Schedule of Investments
June 30, 2013 (Unaudited)
| Principal Amount | Interest Rate | Maturity Date | Value | |||||||||||
| Agency Debentures(a) – 17.1% | ||||||||||||||
| FHLB | ||||||||||||||
| $ | 4,724,000 | 0.000 | % | 09/20/13 | $ | 4,723,575 | ||||||||
| FNMA | ||||||||||||||
| 4,724,000 | 0.000 | 09/18/13 | 4,723,584 | |||||||||||
|
| |||||||||||||
| TOTAL AGENCY DEBENTURES | ||||||||||||||
| (Cost $9,445,376) | $ | 9,447,159 | ||||||||||||
|
| |||||||||||||
| Shares | Description | Values | ||||||||||||
| Exchange Traded Fund – 23.4% | ||||||||||||||
| 175,974 | Vanguard S&P 500 | $ | 12,916,492 | |||||||||||
| (Cost $12,537,769) | ||||||||||||||
|
| |||||||||||||
| Shares | Rate | Value | ||||||||||||
| Investment Company(b) – 9.7% | ||||||||||||||
| Goldman Sachs Financial Square Government Fund — | | ||||||||||||
| 5,372,192 | 0.006% | $ | 5,372,192 | |||||||||||
| (Cost $5,372,192) | ||||||||||||||
|
| |||||||||||||
| Principal Amount | Interest Rate | Maturity Date | Value | |||||||||||
| U.S. Treasury Obligations – 11.9% | ||||||||||||||
| United States Treasury Bill(a) |
| ||||||||||||
| $ | 6,028,000 | 0.000 | % | 08/01/13 | $ | 6,027,974 | ||||||||
| United States Treasury Note |
| ||||||||||||
| 535,000 | 3.125 | 05/15/21 | 574,435 | |||||||||||
|
| |||||||||||||
| TOTAL U.S. TREASURY OBLIGATIONS | ||||||||||||||
| (Cost $6,632,355) | $ | 6,602,409 | ||||||||||||
|
| |||||||||||||
| TOTAL INVESTMENTS – 62.1% | ||||||||||||||
| (Cost $33,987,692) | $ | 34,338,252 | ||||||||||||
|
| |||||||||||||
| OTHER ASSETS IN EXCESS OF | | 20,986,466 | |||||||||||
|
| |||||||||||||
| NET ASSETS – 100.0% | $ | 55,324,718 | ||||||||||||
|
| |||||||||||||
| The percentage shown for each investment category reflects the value of investments in that category as a percentage of net assets. | ||
| (a) | Issued with a zero coupon. Income is recognized through the accretion of discount. | |
| (b) | Represents an affiliated issuer. | |
| Investment Abbreviations: | ||||
FHLB | — | Federal Home Loan Bank | ||
| FNMA | — | Federal National Mortgage Association | ||
| ADDITIONAL INVESTMENT INFORMATION |
FUTURES CONTRACTS — At June 30, 2013, the Fund had the following futures contracts:
| ||||||||||||||
| Type | Number of Contracts Long (Short) | Expiration Date | Current Value | Unrealized Gain (Loss) | ||||||||||
| EURO STOXX 50 Index | 47 | September 2013 | $ | 1,589,393 | $ | (53,076 | ) | |||||||
| Euro-Bund | 53 | September 2013 | 9,763,104 | (112,234 | ) | |||||||||
| FTSE 100 Index | 29 | September 2013 | 2,717,687 | (50,452 | ) | |||||||||
| Russell 2000 Mini Index | 14 | September 2013 | 1,364,580 | 12,120 | ||||||||||
TSE TOPIX Index | 106 | September 2013 | 12,087,719 | 191,613 | ||||||||||
| TOTAL | $ | (12,029 | ) | |||||||||||
| 8 | The accompanying notes are an integral part of these financial statements. |
GOLDMAN SACHS VARIABLE INSURANCE TRUST GLOBAL MARKETS NAVIGATOR FUND
Statement of Assets and Liabilities
June 30, 2013 (Unaudited)
| Assets: | ||||
Investments of unaffiliated issuers, at value (cost $28,615,500) | $ | 28,966,060 | ||
Investments of affiliated issuer, at value (cost $5,372,192) | 5,372,192 | |||
Cash | 15,725,356 | |||
Receivables: | ||||
Investments sold | 2,924,705 | |||
Fund shares sold | 1,264,174 | |||
Collateral on certain derivative contracts(a) | 1,077,516 | |||
Futures variation margin | 223,908 | |||
Reimbursement from investment adviser | 16,595 | |||
Dividends and interest | 2,145 | |||
Other assets | 702 | |||
| Total assets | 55,573,353 | |||
| Liabilities: | ||||
Payables: | ||||
Investments purchased | 121,048 | |||
Amounts owed to affiliates | 40,249 | |||
Fund shares redeemed | 27,483 | |||
Accrued expenses | 59,855 | |||
| Total liabilities | 248,635 | |||
| Net Assets: | ||||
Paid-in capital | 52,491,158 | |||
Undistributed net investment loss | (22,055 | ) | ||
Accumulated net realized gain | 2,513,156 | |||
Net unrealized gain | 342,459 | |||
| NET ASSETS | $ | 55,324,718 | ||
Total Service Shares of beneficial interest outstanding $0.001 par value (unlimited shares authorized): | 5,018,547 | |||
Net asset value, offering and redemption price per share: | $11.02 | |||
(a) Represents cash on deposit with counterparty relating to initial margin requirements on future transactions of $1,077,516.
| The accompanying notes are an integral part of these financial statements. | 9 |
GOLDMAN SACHS VARIABLE INSURANCE TRUST GLOBAL MARKETS NAVIGATOR FUND
Statement of Operations
For the Six Months Ended June 30, 2013 (Unaudited)
| Investment income: | ||||
Dividends — unaffiliated issuers | $ | 102,685 | ||
Interest | 19,612 | |||
Dividends — affiliated issuer | 285 | |||
| Total investment income | 122,582 | |||
| Expenses: | ||||
Management fees | 156,686 | |||
Amortization of offering costs | 65,817 | |||
Distribution and Service fees — Service Class | 49,584 | |||
Professional fees | 38,344 | |||
Custody, accounting and administrative services | 29,076 | |||
Printing and mailing costs | 27,715 | |||
Trustee fees | 8,787 | |||
Transfer Agent fees | 3,966 | |||
Other | 4,763 | |||
| Total expenses | 384,738 | |||
Less — expense reductions | (182,946 | ) | ||
| Net expenses | 201,792 | |||
| NET INVESTMENT LOSS | (79,210 | ) | ||
| Realized and unrealized gain (loss): | ||||
Net realized gain (loss) from: | ||||
Investments | (146,845 | ) | ||
Futures contracts | 2,364,084 | |||
Foreign currency transactions | �� | (65,358 | ) | |
Net change in unrealized gain (loss) on: | ||||
Investments | 149,419 | |||
Futures contracts | (161,664 | ) | ||
Foreign currency translation | 9,432 | |||
| Net realized and unrealized gain | 2,149,068 | |||
| NET INCREASE IN NET ASSETS RESULTING FROM OPERATIONS | $ | 2,069,858 | ||
| 10 | The accompanying notes are an integral part of these financial statements. |
GOLDMAN SACHS VARIABLE INSURANCE TRUST GLOBAL MARKETS NAVIGATOR FUND
Statements of Changes in Net Assets
| For the Six Months Ended June 30, 2013 (Unaudited) | For the Period Ended December 31, 2012(a) | |||||||
| From operations: | ||||||||
Net investment income (loss) | $ | (79,210 | ) | $ | 20,384 | |||
Net realized gain | 2,151,881 | 430,993 | ||||||
Net change in unrealized gain (loss) | (2,813 | ) | 345,272 | |||||
| Net increase in net assets resulting from operations | 2,069,858 | 796,649 | ||||||
| Distributions to shareholders: | ||||||||
| From net realized gains | — | (33,093 | ) | |||||
| From share transactions: | ||||||||
Proceeds from sales of shares | 31,011,557 | 29,921,805 | ||||||
Reinvestment of distributions | — | 33,093 | ||||||
Cost of shares redeemed | (3,746,273 | ) | (4,728,878 | ) | ||||
| Net increase in net assets resulting from share transactions | 27,265,284 | 25,226,020 | ||||||
| TOTAL INCREASE | 29,335,142 | 25,989,576 | ||||||
| Net assets: | ||||||||
Beginning of period | 25,989,576 | — | ||||||
End of period | $ | 55,324,718 | $ | 25,989,576 | ||||
| Undistributed net investment income (loss) | $ | (22,055 | ) | $ | 57,155 | |||
| Summary of share transactions: | ||||||||
Shares sold | 2,848,414 | 2,978,079 | ||||||
Shares issued on reinvestment of distributions | — | 3,229 | ||||||
Shares redeemed | (339,529 | ) | (471,646 | ) | ||||
| NET INCREASE | 2,508,885 | 2,509,662 | ||||||
(a) Commenced operations on April 16, 2012.
| The accompanying notes are an integral part of these financial statements. | 11 |
GOLDMAN SACHS VARIABLE INSURANCE TRUST GLOBAL MARKETS NAVIGATOR FUND
Financial Highlights
Selected Data for a Share Outstanding Throughout Each Period
| Income (loss) from investment operations | ||||||||||||||||||||||||||||||||||||||||||||||||
| Year | Net asset value, beginning of period | Net investment income (loss)(a) | Net realized and unrealized gain | Total from investment operations | Distributions from net realized gains | Net asset value, end of period | Total return(b) | Net assets, end of period (in 000s) | Ratio of net expenses to average net assets(c) | Ratio of total expenses to average net assets(c) | Ratio of net investment income (loss) to average net assets | Portfolio turnover rate(d) | ||||||||||||||||||||||||||||||||||||
FOR THE SIX MONTHS ENDED JUNE 30, (UNAUDITED) | ||||||||||||||||||||||||||||||||||||||||||||||||
2013 | $ | 10.36 | $ | (0.02 | ) | $ | 0.68 | $ | 0.66 | $ | — | $ | 11.02 | 6.37 | % | $ | 55,325 | 1.77 | %(e) | 1.94 | %(e) | (0.40 | )%(e) | 177 | % | |||||||||||||||||||||||
FOR THE PERIOD ENDED DECEMBER 31, | ||||||||||||||||||||||||||||||||||||||||||||||||
2012 (Commenced April 16, 2012) | 10.00 | 0.02 | 0.35 | 0.37 | (0.01 | ) | 10.36 | 3.74 | 25,990 | 1.04 | (e) | 4.21 | (e) | 0.27 | (e) | 300 | ||||||||||||||||||||||||||||||||
| (a) | Calculated based on the average shares outstanding methodology. |
| (b) | Assumes investment at the net asset value at the beginning of the period, reinvestment of all distributions, and a complete redemption of the investment at the net asset value at the end of the period. Total returns for periods less than one full year are not annualized. |
| (c) | Expense ratios exclude expenses of the Underlying Funds in which the Fund invests. |
| (d) | The Fund’s portfolio turnover rate is calculated in accordance with regulatory requirements, without regard to transactions involving short term investments and certain derivatives. If such transactions were included, the Fund’s portfolio turnover rate may be higher. |
| (e) | Annualized. |
| The accompanying notes are an integral part of these financial statements. | 12 |
GOLDMAN SACHS VARIABLE INSURANCE TRUST GLOBAL MARKETS NAVIGATOR FUND
Notes to Financial Statements
June 30, 2013 (Unaudited)
1. ORGANIZATION
Goldman Sachs Variable Insurance Trust (the “Trust” or “VIT”) is a Delaware statutory trust registered under the Investment Company Act of 1940, as amended (the “Act”), as an open-end management investment company. The Trust includes the Goldman Sachs Global Markets Navigator Fund (the “Fund”). The Fund is a non-diversified portfolio under the Act offering one class of shares — Service Shares. Shares of the Trust are offered to separate accounts of participating life insurance companies for the purpose of funding variable annuity contracts and variable life insurance policies.
Goldman Sachs Asset Management, L.P. (“GSAM”), an affiliate of Goldman, Sachs & Co. (“Goldman Sachs”), serves as investment adviser to the Fund pursuant to a management agreement (the “Agreement”) with the Trust.
2. SIGNIFICANT ACCOUNTING POLICIES
The financial statements have been prepared in accordance with accounting principles generally accepted in the United States of America (“GAAP”) and require management to make estimates and assumptions that may affect the reported amounts and disclosures. Actual results may differ from those estimates and assumptions.
A. Investment Valuation — The Fund’s valuation policy is to value investments at fair value.
B. Investment Income and Investments — Investment income includes interest income and dividend income, net of any foreign withholding taxes, less any amounts reclaimable. Interest income is accrued daily and adjusted for amortization of premiums and accretion of discounts. Dividend income is recognized on ex-dividend date or, for certain foreign securities, as soon as such information is obtained subsequent to the ex-dividend date. Investment transactions are reflected on trade date. Realized gains and losses are calculated using identified cost. Investment transactions are recorded on the following business day for daily net asset value (“NAV”) calculations. Any foreign capital gains tax is accrued daily based upon net unrealized gains, and is payable upon sale of such investments.
For derivative contracts, realized gains and losses are recorded upon settlement of the contract.
C. Expenses — Expenses incurred directly by the Fund are charged to the Fund, and certain expenses incurred by the Trust that may not solely relate to the Fund are allocated to the Fund and the other funds of the Trust on a straight-line and/or pro-rata basis depending upon the nature of the expenses and are accrued daily.
D. Offering Costs — Offering costs paid in connection with the offering of shares of the Fund have been amortized on a straight-line basis over 12 months from the date of commencement of operations.
E. Federal Taxes and Distributions to Shareholders — It is the Fund’s policy to comply with the requirements of the Internal Revenue Code of 1986, as amended (the “Code”), applicable to regulated investment companies (mutual funds) and to distribute each year substantially all of its investment company taxable income and capital gains to its shareholders. Accordingly, the Fund is not required to make any provisions for the payment of federal income tax. Distributions to shareholders are recorded on the ex-dividend date. Income and capital gains distributions, if any, are declared and paid annually.
Net capital losses are carried forward to future fiscal years and may be used to the extent allowed by the Code to offset any future capital gains. Losses that are carried forward will retain their character as either short-term or long-term capital losses. Utilization of capital loss carryforwards will reduce the requirement of future capital gains distributions.
13
GOLDMAN SACHS VARIABLE INSURANCE TRUST GLOBAL MARKETS NAVIGATOR FUND
Notes to Financial Statements (continued)
June 30, 2013 (Unaudited)
2. SIGNIFICANT ACCOUNTING POLICIES (continued)
The characterization of distributions to shareholders for financial reporting purposes is determined in accordance with federal income tax rules, which may differ from GAAP. The source of the Fund’s distributions may be shown in the accompanying financial statements as either from net investment income, net realized gain or capital. Certain components of the Fund’s net assets on the Statement of Assets and Liabilities reflect permanent GAAP/tax differences based on the appropriate tax character.
F. Foreign Currency Translation — The accounting records and reporting currency of the Fund are maintained in United States (“U.S.”) dollars. Assets and liabilities denominated in foreign currencies are translated into U.S. dollars using the current exchange rates at the close of each business day. The effect of changes in foreign currency exchange rates on investments is included within net realized and unrealized gain (loss) on investments. Changes in the value of other assets and liabilities as a result of fluctuations in foreign exchange rates are included in the Statement of Operations within net change in unrealized gain (loss) on foreign currency transactions. Transactions denominated in foreign currencies are translated into U.S. dollars on the date the transaction occurred, the effects of which are included within net realized gain (loss) on foreign currency transactions.
3. INVESTMENTS AND FAIR VALUE MEASUREMENTS
The fair value of a financial instrument is the amount that would be received to sell an asset or paid to transfer a liability in an orderly transaction between market participants at the measurement date (i.e., the exit price). GAAP establishes a fair value hierarchy that prioritizes the inputs to valuation techniques used to measure fair value. The hierarchy gives the highest priority to unadjusted quoted prices in active markets for identical assets or liabilities (Level 1 measurements) and the lowest priority to unobservable inputs (Level 3 measurements). The levels used for classifying investments are not necessarily an indication of the risk associated with investing in these investments. The three levels of the fair value hierarchy are described below:
Level 1 — Unadjusted quoted prices in active markets that are accessible at the measurement date for identical, unrestricted assets or liabilities;
Level 2 — Quoted prices in markets that are not active or financial instruments for which significant inputs are observable (including, but not limited to, quoted prices for similar investments, interest rates, foreign exchange rates, volatility and credit spreads), either directly or indirectly;
Level 3 — Prices or valuations that require significant unobservable inputs (including GSAM’s assumptions in determining fair value measurement).
The Trustees have adopted Valuation Procedures that govern the valuation of the portfolio investments held by the Fund, including investments for which market quotations are not readily available. The Trustees have delegated to GSAM day-to-day responsibility for implementing and maintaining internal controls and procedures related to the valuation of the Fund’s portfolio investments. To assess the continuing appropriateness of pricing sources and methodologies, GSAM regularly performs price verification procedures and issues challenges as necessary to third party pricing vendors or brokers, and any differences are reviewed in accordance with the Valuation Procedures.
14
GOLDMAN SACHS VARIABLE INSURANCE TRUST GLOBAL MARKETS NAVIGATOR FUND
3. INVESTMENTS AND FAIR VALUE MEASUREMENTS (continued)
A. Level 1 and Level 2 Fair Value Investments — The valuation techniques and significant inputs used in determining the fair values for investments classified as Level 1 and Level 2 are as follows:
Equity Securities — Equity securities and investment companies traded on a U.S. securities exchange or the NASDAQ system, or those located on certain foreign exchanges, including but not limited to the Americas, are valued daily at their last sale price or official closing price on the principal exchange or system on which they are traded. If no sale occurs, equity securities and exchange traded investment companies are valued at the last bid price for long positions and at the last ask price for short positions. Investments in investment companies (other than those that are exchange traded) are valued at the NAV on the valuation date. To the extent these investments are actively traded, they are classified as Level 1 of the fair value hierarchy.
Unlisted equity securities for which market quotations are available are valued at the last sale price on the valuation date, or if no sale occurs, at the last bid price. Securities traded on certain foreign securities exchanges are valued daily at fair value determined by an independent fair value service (if available) under Valuation Procedures approved by the Trustees and consistent with applicable regulatory guidance. The independent fair value service takes into account multiple factors including, but not limited to, movements in the securities markets, certain depositary receipts, futures contracts and foreign currency exchange rates that have occurred subsequent to the close of the foreign securities exchange. These investments are generally classified as Level 2 of the fair value hierarchy.
Debt Securities — Debt securities for which market quotations are readily available are valued daily on the basis of quotations supplied by dealers or an independent pricing service approved by the Trustees. The pricing services may use valuation models or matrix pricing, which consider: (i) yield or price with respect to bonds that are considered comparable in characteristics such as rating, interest rate and maturity date or (ii) quotations from securities dealers to determine current value. Short-term debt obligations that mature in sixty days or less and that do not exhibit signs of credit deterioration are valued at amortized cost, which approximates fair value. With the exception of treasury securities, which are generally classified as Level 1, these investments are generally classified as Level 2 of the fair value hierarchy.
Derivative Contracts — A derivative is an instrument whose value is derived from underlying assets, indices, reference rates or a combination of these factors.
Exchange-traded derivatives, including futures contracts, typically fall within Level 1 of the fair value hierarchy. Over-the-counter (“OTC”) derivatives are valued using market transactions and other market evidence, including market-based inputs to models, calibration to market-clearing transactions, broker or dealer quotations, or other alternative pricing sources. Where models are used, the selection of a particular model to value an OTC derivative depends upon the contractual terms of, and specific risks inherent in, the instrument, as well as the availability of pricing information in the market. Valuation models require a variety of inputs, including contractual terms, market prices, yield curves, credit curves, measures of volatility, voluntary and involuntary prepayment rates, loss severity rates and correlations of such inputs. For OTC derivatives that trade in liquid markets, model inputs can generally be verified and model selection does not involve significant management judgment. OTC derivatives are classified within Level 2 of the fair value hierarchy when significant inputs are corroborated by market evidence.
i. Futures Contracts — Futures contracts are contracts to buy or sell a standardized quantity of a specified commodity or security and are valued based on exchanged settlement prices or independent market quotes. Futures contracts are valued at the last settlement price, or in the absence of a sale, the last bid price for long positions and at the last ask price for short positions, at the end of each day on the board of trade or exchange upon which they are traded. Upon entering into a futures contract, a Fund deposits cash or securities in an account on behalf of the broker in an amount sufficient to meet the initial margin requirement. Subsequent payments are made or received by the Fund equal to the daily change in the contract value and are recorded as variation margin receivable or payable with a corresponding offset to unrealized gains or losses.
15
GOLDMAN SACHS VARIABLE INSURANCE TRUST GLOBAL MARKETS NAVIGATOR FUND
Notes to Financial Statements (continued)
June 30, 2013 (Unaudited)
3. INVESTMENTS AND FAIR VALUE MEASUREMENTS (continued)
B. Level 3 Fair Value Investments — To the extent that the aforementioned significant inputs are unobservable, or if quotations are not readily available, or if GSAM believes that such quotations do not accurately reflect fair value, the fair value of the Fund’s investments may be determined under Valuation Procedures approved by the Trustees. GSAM, consistent with its procedures and applicable regulatory guidance, may make an adjustment to the most recent valuation prices of either domestic or foreign securities in light of significant events to reflect what it believes to be the fair value of the securities at the time of determining a Fund’s NAV. Significant events which could affect a large number of securities in a particular market may include, but are not limited to: significant fluctuations in U.S. or foreign markets; market dislocations; market disruptions; or unscheduled market closings. Significant events which could also affect a single issuer may include, but are not limited to: corporate actions such as reorganizations, mergers and buy-outs; ratings downgrades; and bankruptcies.
C. Fair Value Hierarchy — The following is a summary of the Fund’s investments and derivatives classified in the fair value hierarchy as of June 30, 2013:
| Investment Type | Level 1 | Level 2 | Level 3 | |||||||||
| Assets | ||||||||||||
| Fixed Income | ||||||||||||
Agency Debentures | $ | — | $ | 9,447,159 | $ | — | ||||||
U.S. Treasury Obligations and/or Other U.S. Government Agencies | 6,602,409 | — | — | |||||||||
Exchange Traded Fund | 12,916,492 | — | — | |||||||||
Investment Company | 5,372,192 | — | — | |||||||||
| Total | $ | 24,891,093 | $ | 9,447,159 | $ | — | ||||||
| Derivative Type | ||||||||||||
| Assets(a) | ||||||||||||
| Futures Contracts | $ | 203,733 | $ | — | $ | — | ||||||
| Liabilities(a) | ||||||||||||
| Futures Contracts | $ | (215,762 | ) | $ | — | $ | — | |||||
| (a) | Amount shown represents unrealized gain (loss) at period end. |
For further information regarding security characteristics, see the Schedule of Investments.
16
GOLDMAN SACHS VARIABLE INSURANCE TRUST GLOBAL MARKETS NAVIGATOR FUND
4. INVESTMENTS IN DERIVATIVES
The following table sets forth, by certain risk types, the gross value of derivative contracts as of June 30, 2013. These instruments were used to meet the Fund’s investment objectives and to obtain and/or manage exposure related to the risks below. The values in the table below exclude the effects of cash collateral received or posted pursuant to these derivative contracts, and therefore are not representative of the Fund’s net exposure.
| Risk | Statement of Assets and Liabilities | Assets(a) | Statement of Assets and Liabilities | Liabilities(a) | ||||||||
| Equity | Receivable for unrealized gain on futures variation margin | $ | 203,733 | Payable for unrealized loss on futures variation margin | $ | (103,528 | ) | |||||
| Interest Rate | — | — | Payable for unrealized loss on futures variation margin | (112,234 | ) | |||||||
| Total | $ | 203,733 | $ | (215,762 | ) | |||||||
| (a) | Includes unrealized gain (loss) on futures contracts described in the Additional Investment Information section of the Schedule of Investments. Only current day’s variation margin is reported within the Statement of Assets and Liabilities. |
The following table sets forth, by certain risk types, the Fund’s gains (losses) related to these derivatives and their indicative volumes for the six months ended June 30, 2013. These gains (losses) should be considered in the context that these derivative contracts may have been executed to economically hedge certain investments, and accordingly, certain gains (losses) on such derivative contracts may offset certain (losses) gains attributable to investments. These gains (losses) are included in “Net realized gain (loss)” or “Net change in unrealized gain (loss)” on the Statement of Operations:
| Risk | Statement of Operations | Net Realized Gain (Loss) | Net Change in Unrealized Gain (Loss) | Average Number of Contracts(a) | ||||||||||
| Equity | Net realized gain (loss) from futures contracts/Net change in unrealized gain (loss) on futures contracts | $ | 2,417,261 | $ | (38,542 | ) | 248 | |||||||
| Interest Rate | Net realized gain (loss) from futures contracts/Net change in unrealized gain (loss) on futures contracts | (53,177 | ) | (123,122 | ) | 41 | ||||||||
| (a) | Average number of contracts is based on the average of month end balances for the period ended June 30, 2013. |
In December 2011, the Financial Accounting Standards Board (“FASB”) issued an Accounting Standards Update (“ASU”) No. 2011-11: Disclosures about Offsetting Assets and Liabilities (“netting”) on the Statement of Assets and Liabilities that are subject to master netting arrangements or similar agreements. ASU 2011-11 was amended by ASU No. 2013-01, clarifying which investments and transactions are subject to the netting disclosure. The scope of the disclosure requirements is limited to derivative instruments, repurchase agreements and reverse repurchase agreements, and securities borrowing and securities lending transactions. This information is intended to enable users of the Fund’s financial statements to evaluate the effect or potential effect of netting arrangements on the Fund’s financial position. The ASU is effective for financial statements with fiscal years beginning on or after January 1, 2013, and interim periods within those fiscal years. The Fund adopted the disclosure requirement on netting for the current reporting period. Since these amended principles require additional disclosures concerning offsetting and related arrangements, adoption did not affect the Fund’s financial condition or result of operations.
17
GOLDMAN SACHS VARIABLE INSURANCE TRUST GLOBAL MARKETS NAVIGATOR FUND
Notes to Financial Statements (continued)
June 30, 2013 (Unaudited)
4. INVESTMENTS IN DERIVATIVES (continued)
For financial reporting purposes, the Fund does not offset financial assets and financial liabilities that are subject to master netting arrangements or similar agreements on the Statement of Assets and Liabilities.
In order to better define its contractual rights and to secure rights that will help a Fund mitigate its counterparty risk, a Fund may enter into an International Swaps and Derivatives Association, Inc. Master Agreement (“ISDA Master Agreement”) or similar agreement with its derivatives counterparties. An ISDA Master Agreement is a bilateral agreement between a Fund and a counterparty that governs OTC derivatives, including foreign exchange contracts, and typically contains, among other things, collateral posting terms and netting provisions in the event of a default and/or termination event. The provisions of the ISDA Master Agreement typically permit a single net payment in the event of a default (close-out netting) or similar event, including the bankruptcy or insolvency of the counterparty.
Collateral and margin requirements differ between exchange traded derivatives and OTC derivatives. Margin requirements are established by the broker or clearing house for exchange-traded and centrally cleared derivatives (financial futures contracts, options and centrally cleared swaps) pursuant to governing agreements for those instrument types. Brokers can ask for margin in excess of the minimum in certain circumstances. Collateral terms are contract-specific for OTC derivatives (foreign currency exchange contracts, options and certain swaps). For derivatives traded under an ISDA Master Agreement, the collateral requirements are typically calculated by netting the mark to market amount for each transaction under such agreement and comparing that amount to the value of any collateral currently pledged by a Fund and the counterparty. Additionally, a Fund may be required to post additional collateral to the counterparty in the form of initial margin, the terms of which would be outlined in the confirmation of the OTC transaction.
For financial reporting purposes, cash collateral that has been pledged to cover obligations of a Fund and cash collateral received from the counterparty, if any, is reported separately on the Statement of Assets and Liabilities as receivables/payables for collateral on certain derivative contracts. Non-cash collateral pledged by a Fund, if any, is noted in the Schedule of Investments. Generally, the amount of collateral due from or to a counterparty must exceed a minimum transfer amount threshold (e.g., $250,000) before a transfer is required to be made. To the extent amounts due to a Fund from its counterparties are not fully collateralized, contractually or otherwise, the Fund bears the risk of loss from counterparty nonperformance. A Fund attempts to mitigate counterparty risk by only entering into agreements with counterparties that it believes to be of good standing and by monitoring the financial stability of those counterparties.
Additionally, the netting of assets and liabilities and the offsetting of collateral pledged or received are based on contractual netting/set-off provisions in the ISDA Master Agreement or similar agreements, however, in the event of a default or insolvency of a counterparty, a court could determine that such rights are not enforceable due the restrictions or prohibitions against the right of setoff that may be imposed due to a particular jurisdiction’s bankruptcy or insolvency laws.
18
GOLDMAN SACHS VARIABLE INSURANCE TRUST GLOBAL MARKETS NAVIGATOR FUND
4. INVESTMENTS IN DERIVATIVES (continued)
The following table sets forth the Fund’s net exposure for derivative instruments that are subject to enforceable master netting arrangements or similar agreements as of June 30, 2013:
| Offsetting of Derivatives Assets: | Gross Amounts Available for Offset But Not Netted in the Statement of Assets and Liabilities | |||||||||||||||||||||||
| Derivatives | Gross Amounts of Recognized Assets | Gross Amounts offset in the Statement of Assets and Liabilities | Net Amounts of Assets Presented in the Statement of Assets and Liabilities | Financial Instruments | Cash Collateral Received | Net Amount(1) | ||||||||||||||||||
| Futures Contracts* | $ | 223,908 | $ | — | $ | 223,908 | $ | — | $ | — | $ | 223,908 | ||||||||||||
| * | Exchange Traded Futures — Credit Suisse Securities LLC as Futures Commission Merchant |
| (1) | Net amount represents the net amount due from the counterparty in the event of a default based on the contractual set-off rights under the agreement. |
5. AGREEMENTS AND AFFILIATED TRANSACTIONS
A. Management Agreement — Under the Agreement, GSAM manages the Fund, subject to the general supervision of the Trustees.
As compensation for the services rendered pursuant to the Agreement, the assumption of the expenses related thereto and administration of the Fund’s business affairs, including providing facilities, GSAM is entitled to a management fee, accrued daily and paid monthly, equal to an annual percentage rate of the Fund’s average daily net assets.
For the six months ended June 30, 2013, contractual and effective net management fees with GSAM were at the following rates:
| Contractual Management Fee Rate | ||||||||||||||||||||||||||
| First $1 billion | Next $1 billion | Next $3 billion | Next $3 billion | Over $8 billion | Effective Rate | Effective Net Management Fee Rate | ||||||||||||||||||||
| 0.79% | 0.71 | % | 0.68 | % | 0.66 | % | 0.65 | % | 0.79 | % | 0.77 | %* | ||||||||||||||
| * | GSAM has agreed to waive a portion of its management fee payable by the Fund in an amount equal to any management fees it earns as an investment adviser to any of the affiliated funds in which the Fund invests through at least April 30, 2014. Prior to such date GSAM may not terminate the arrangement without the approval of the Trustees. |
B. Distribution and Service Plan — The Trust, on behalf of the Service Shares of the Fund, has adopted a Distribution and Service Plan (the “Plan”). Under the Plan, Goldman Sachs, which serves as distributor (the “Distributor”), is entitled to a fee accrued daily and paid monthly for distribution services and personal and account maintenance services, which may then be paid by Goldman Sachs to authorized dealers, equal to, on an annual basis, 0.25% of the Fund’s average daily net assets.
C. Transfer Agency Agreement — Goldman Sachs also serves as the transfer agent of the Fund for a fee pursuant to Transfer Agency Agreement. The fees charged for such transfer agency services are accrued daily and paid monthly at an annual rate of 0.02% of the average daily net assets of the Fund.
19
GOLDMAN SACHS VARIABLE INSURANCE TRUST GLOBAL MARKETS NAVIGATOR FUND
Notes to Financial Statements (continued)
June 30, 2013 (Unaudited)
5. AGREEMENTS AND AFFILIATED TRANSACTIONS (continued)
D. Line of Credit Facility — As of June 30, 2013, the Fund participated in a $780,000,000 committed, unsecured revolving line of credit facility (the “facility”) together with other funds of the Trust and registered investment companies having management agreements with GSAM or its affiliates (“Other Borrowers”). Pursuant to the terms of the facility, the Fund and Other Borrowers could increase the credit amount by an additional $220,000,000, for a total of up to $1,000,000,000. This facility is to be used solely for temporary or emergency purposes, which may include the funding of redemptions. The interest rate on borrowings is based on the federal funds rate. The facility also requires a fee to be paid by the Fund based on the amount of the commitment that has not been utilized. For the six months ended June 30, 2013, the Fund did not have any borrowings under the facility. Prior to May 8, 2013, the committed amount available through the facility was $630,000,000.
E. Other Expense Agreements and Affiliated Transactions — GSAM has agreed to limit certain “Other Expense” of the Fund (excluding transfer agent fees and expenses, taxes, interest, brokerage fees, litigation, indemnification, shareholder meeting and other extraordinary expenses) to the extent such expenses exceed, on an annual basis, a percentage rate of the average daily net assets of the Fund. Such Other Expense reimbursements, if any, are accrued daily and paid monthly. In addition, the Fund is not obligated to reimburse GSAM for prior fiscal year expense reimbursements, if any. The Other Expense limitation as an annual percentage rate of average daily net assets for the Fund is 0.004%. This Other Expense limitation will remain in place through at least April 30, 2014, and prior to such date GSAM may not terminate the arrangement without the approval of the Trustees. For the six months ended June 30, 2013, GSAM reimbursed $173,706 to the Fund. In addition, the Fund has entered into certain offset arrangements with the custodian and the transfer agent, which may result in a reduction of the Fund’s expenses and are received irrespective of the application of the “Other Expense” limitation described above. For the six months ended June 30, 2013, custody fee credits were $5,069.
As of June 30, 2013, the amounts owed to affiliates of the Fund were $28,935, $10,476, and $838 for management, distribution and service, and transfer agent fees, respectively.
F. Other Transactions with Affiliates — The following table provides information about the investment in shares of a fund of which the Fund is an affiliate for the period ended June 30, 2013:
| Name of Affiliated Fund | Number of Shares Held Beginning of Period | Shares Bought | Shares Sold | Number of Shares Held End of Period | Value at End of Period | Dividend Income | ||||||||||||||||||
| Goldman Sachs Financial Square Government Fund | 2,562,496 | 3,380,892 | (571,196 | ) | 5,372,192 | $ | 5,372,192 | $ | 285 | |||||||||||||||
20
GOLDMAN SACHS VARIABLE INSURANCE TRUST GLOBAL MARKETS NAVIGATOR FUND
6. PORTFOLIO SECURITIES TRANSACTIONS
The cost of purchases and proceeds from sales and maturities of long-term securities for the six months ended June 30, 2013, were as follows:
Purchases of U.S. Government | Purchases (Excluding U.S. Government and Agency Obligations | Sales and Maturities of | Sales and Maturities (Excluding | |||||||||||
| $2,972,361 | $ | 17,168,145 | $ | 11,936,898 | $ | 8,859,514 | ||||||||
7. TAX INFORMATION
As of June 30, 2013, the Fund’s aggregate security unrealized gains and losses based on cost for U.S. federal income tax purposes were as follows:
| Tax cost | $ | 34,001,779 | ||
| Gross unrealized gain | 381,015 | |||
| Gross unrealized loss | (44,542 | ) | ||
| Net unrealized security gain | $ | 336,473 |
The difference between GAAP-basis and tax-basis unrealized gains (losses) is attributable primarily to wash sales and net mark to market gains (losses) on regulated futures contracts.
GSAM has reviewed the Fund’s tax positions for all open tax years (the current and prior three years, as applicable) and has concluded that no provision for income tax is required in the Fund’s financial statements. Such open tax years remain subject to examination and adjustment by tax authorities.
8. OTHER RISKS
The Fund’s risks include, but are not limited to, the following:
Foreign Custody Risk — A Fund that invests in foreign securities may hold such securities and foreign currency with foreign banks, agents, and securities depositories appointed by the Fund’s custodian (each a “Foreign Custodian”). In some countries, Foreign Custodians may be subject to little or no regulatory oversight or independent evaluation of their operations. Further, the laws of certain countries may place limitations on a Fund’s ability to recover its assets if a Foreign Custodian enters into bankruptcy. Investments in emerging markets may be subject to greater custody risks than investments in more developed markets. Custody services in emerging market countries are often undeveloped and may be less regulated than in more developed countries, and thus may not afford the same level of investor protection as would apply in developed countries.
Shareholder Concentration Risk — Certain funds, accounts, individuals, or Goldman Sachs affiliates may from time to time own (beneficially or of record) or control a significant percentage of the Fund’s shares. Redemptions by these entities of their holdings in the Fund may impact the Fund’s liquidity and NAV. These redemptions may also force the Fund to sell securities.
| The accompanying notes are an integral part of these financial statements. | 21 |
GOLDMAN SACHS VARIABLE INSURANCE TRUST GLOBAL MARKETS NAVIGATOR FUND
Notes to Financial Statements (continued)
June 30, 2013 (Unaudited)
8. OTHER RISKS (continued)
Investments in Other Investment Companies — As a shareholder of another investment company, including an exchange traded fund (“ETF”), a Fund will directly bear its proportionate share of any management fees and other expenses paid by such other investment companies, in addition to the fees and expenses regularly borne by the Fund. ETFs are subject to risks that do not apply to conventional mutual funds, including but not limited to the following: (i) the market price of the ETF’s shares may trade at a premium or a discount to their NAV; and (ii) an active trading market for an ETF’s shares may not develop or be maintained.
Liquidity Risk — The Fund may make investments that are illiquid or that may become less liquid in response to market developments or adverse investor perceptions. Illiquid investments may be more difficult to value. Liquidity risk may also refer to the risk that a Fund will not be able to pay redemption proceeds within the allowable time period because of unusual market conditions, an unusually high volume of redemption requests, or other reasons. To meet redemption requests, the Fund may be forced to sell investments at an unfavorable time and/or under unfavorable conditions.
Market and Credit Risks — In the normal course of business, the Fund trades financial instruments and enters into financial transactions where risk of potential loss exists due to changes in the market (market risk). Additionally, the Fund may also be exposed to credit risk in the event that an issuer fails to perform or that an institution or entity with which the Fund has unsettled or open transactions defaults.
Investing in foreign markets may involve special risks and considerations not typically associated with investing in the U.S. These risks include revaluation of currencies, high rates of inflation, repatriation restrictions on income and capital, and adverse political and economic developments. Moreover, securities issued in these markets may be less liquid, be subject to government ownership controls, have delayed settlements and their prices may be more volatile than those of comparable securities in the U.S.
Non-Diversification Risk — The Fund is non-diversified, meaning that is permitted to invest a larger percentage of its assets in fewer issuers than diversified mutual funds. Thus, the Fund may be more susceptible to adverse developments affecting any single issuer held in its portfolio, and may be more susceptible to greater losses because of these developments.
Industry Concentration Risk — The Fund will not invest more than 25% of the value of its total assets in the securities of one or more issuers conducting their principal business activities in the same industry, except that, to the extent that an industry represents 20% or more of the Fund’s index at the time of investment, the Fund may invest up to 35% of its assets in that industry. Concentrating Fund investments in issuers conducting business in the same industry will subject the Fund to a greater risk of loss as a result of adverse economic, business or other developments affecting that industry than if its investments were not so concentrated.
22
GOLDMAN SACHS VARIABLE INSURANCE TRUST GLOBAL MARKETS NAVIGATOR FUND
9. INDEMNIFICATIONS
Under the Trust’s organizational documents, its Trustees, officers, employees and agents are indemnified, to the extent permitted by the Act and state law, against certain liabilities that may arise out of performance of their duties to the Fund. Additionally, in the course of business, the Fund enters into contracts that contain a variety of indemnification clauses. The Fund’s maximum exposure under these arrangements is unknown, as this would involve future claims that may be made against the Fund that have not yet occurred. However, GSAM believes the risk of loss under these arrangements to be remote.
10. OTHER MATTERS
Other — On February 8, 2012, the Commodity Futures Trading Commission (CFTC) adopted amendments to several of its rules relating to commodity pool operators, including Rule 4.5. The Fund currently relies on Rule 4.5’s exclusion from CFTC regulation for regulated investment companies. GSAM is currently evaluating the amendments and their impact, if any, on the Fund’s financial statements.
11. SUBSEQUENT EVENTS
Subsequent events after the Statement of Assets and Liabilities date have been evaluated through the date the financial statements were issued. GSAM has concluded that there is no impact requiring adjustment or disclosure in the financial statements.
23
GOLDMAN SACHS VARIABLE INSURANCE TRUST GLOBAL MARKETS NAVIGATOR FUND
| Fund Expenses — Period Ended June 30, 2013 (Unaudited) |
As a shareholder of the Service Shares of the Fund, you incur ongoing costs, including management fees, distribution and service (12b-1) fees and other Fund expenses. This example is intended to help you understand your ongoing costs (in dollars) of investing in the Fund and to compare these costs with the ongoing costs of investing in other mutual funds.
The example is based on an investment of $1,000 invested at the beginning of the period and held for the entire period from January 1, 2013 through June 30, 2013.
Actual Expenses — The first line in the table below provides information about actual account values and actual expenses. You may use the information in this line, together with the amount you invested, to estimate the expenses that you paid over the period. Simply divide your account value by $1,000 (for example, an $8,600 account value divided by $1,000=8.6), then multiply the result by the number in the first line under the heading entitled “Expenses Paid” to estimate the expenses you paid on your account during this period.
Hypothetical Example for Comparison Purposes — The second line in the table below provides information about hypothetical account values and hypothetical expenses based on the Fund’s actual net expense ratio and an assumed rate of return of 5% per year before expenses, which is not the Fund’s actual return. The hypothetical account values and expenses may not be used to estimate the actual ending account balance or expenses you paid for the period. You may use this information to compare the ongoing costs of investing in the Fund and other funds. To do so, compare this 5% hypothetical example with the 5% hypothetical examples that appear in the shareholder reports of the other funds.
Please note that the expenses shown in the table are meant to highlight your ongoing costs only. As a shareholder of the Fund, you do not incur any transaction costs, such as sales charges, redemption fees, or exchange fees, but shareholders of other funds may incur such costs. The second line of the table is useful in comparing ongoing costs only, and will not help you determine the relative total costs of owning different funds whose shareholders may incur transaction costs.
| Beginning Account Value 1/01/13 | Ending Account Value 6/30/13 | Expenses Paid for the 6 Months Ended 6/30/13* | ||||||||||
| Actual | $ | 1,000 | $ | 1,063.70 | $ | 5.22 | ||||||
| Hypothetical 5% return | 1,000 | 1,019.74 | + | 5.11 | ||||||||
| * | Expenses are calculated using the Fund’s annualized net expense ratio, which represents the ongoing expenses as a percentage of net assets for the six months ended June 30, 2013. Expenses are calculated by multiplying the annualized net expense ratio by the average account value for the period; then multiplying the result by the number of days in the most recent fiscal half year; and then dividing that result by the number of days in the fiscal year. The annualized net expense ratio for the period was 1.02%. |
| + | Hypothetical expenses are based on the Fund’s actual annualized net expense ratio and an assumed rate of return of 5% per year before expenses. |
24
GOLDMAN SACHS VARIABLE INSURANCE TRUST GLOBAL MARKETS NAVIGATOR FUND
Statement Regarding Basis for Approval of Management Agreement (Unaudited)
Background
The Goldman Sachs Global Markets Navigator Fund (the “Fund”) is an investment portfolio of Goldman Sachs Variable Insurance Trust (the “Trust”). The Board of Trustees oversees the management of the Trust and reviews the investment performance and expenses of the Fund at regularly scheduled meetings held during the year. In addition, the Board of Trustees determines annually whether to approve the continuance of the Trust’s investment management agreement (the “Management Agreement”) with Goldman Sachs Asset Management, L.P. (the “Investment Adviser”) on behalf of the Fund.
The Management Agreement was most recently approved for continuation until June 30, 2014 by the Board of Trustees, including those Trustees who are not parties to the Management Agreement or “interested persons” (as defined in the Investment Company Act of 1940, as amended) of any party thereto (the “Independent Trustees”), at a meeting held on June 12-13, 2013 (the “Annual Meeting”).
The review process undertaken by the Trustees spans the course of the year and culminates with the Annual Meeting. To assist the Trustees in their deliberations, the Trustees have established a Contract Review Committee (the “Committee”), comprised of the Independent Trustees. The Committee held four meetings over the course of the year since the Management Agreement was last approved. At those Committee meetings, regularly scheduled Board or other committee meetings and/or the Annual Meeting, the Board, or the Independent Trustees, as applicable, considered matters relating to the Management Agreement, including:
| (a) | the nature and quality of the advisory, administrative and other services provided to the Fund by the Investment Adviser and its affiliates, including information about: |
| (i) | the structure, staff and capabilities of the Investment Adviser and its portfolio management teams; |
| (ii) | the groups within the Investment Adviser and its affiliates that support the portfolio management teams or provide other types of necessary services, including fund services groups (e.g., accounting and financial reporting, tax, shareholder services and operations), controls and risk management groups (e.g., legal, compliance, valuation oversight, credit risk management, internal audit, compliance testing, market risk analysis, finance and strategy and central funding), sales and distribution support groups and others (e.g., information technology and training); |
| (iii) | trends in headcount; |
| (iv) | the Investment Adviser’s financial resources and ability to hire and retain talented personnel and strengthen its operations; and |
| (v) | the parent company’s support of the Investment Adviser and its mutual fund business, as expressed by the firm’s senior management; |
| (b) | information on the investment performance of the Fund, including comparisons to the performance of a group of similar mutual funds, as provided by the Investment Adviser, using the peer group identified by a third party mutual fund data provider engaged as part of the contract review process (the “Outside Data Provider”), and a benchmark performance index, and general investment outlooks in the markets in which the Fund invests; |
| (c) | the terms of the Management Agreement and agreements with affiliated service providers entered into by the Trust on behalf of the Fund; |
| (d) | expense information for the Fund, including the relative management fee and expense levels of the Fund as compared to those of comparable funds managed by other advisers, as provided by the Outside Data Provider; |
| (e) | with respect to the extensive expense comparison data provided by the Outside Data Provider, its processes in producing that data for the Fund; |
| (f) | the undertaking of the Investment Adviser to limit certain expenses of the Fund that exceed a specified level; |
| (g) | information relating to the profitability of the Management Agreement and the transfer agency and distribution and service arrangements of the Fund and the Trust as a whole to the Investment Adviser and its affiliates; |
| (h) | whether the Fund’s existing management fee schedule adequately addressed any economies of scale; |
25
GOLDMAN SACHS VARIABLE INSURANCE TRUST GLOBAL MARKETS NAVIGATOR FUND
Statement Regarding Basis for Approval of Management Agreement (Unaudited) (continued)
| (i) | a summary of the “fall-out” benefits derived by the Investment Adviser and its affiliates from their relationships with the Fund, including the fees received by the Investment Adviser’s affiliates from the Fund for transfer agency, portfolio trading, distribution and other services; |
| (j) | a summary of potential benefits derived by the Fund as a result of its relationship with the Investment Adviser; |
| (k) | information regarding commissions paid by the Fund and broker oversight, other information regarding portfolio trading and how the Investment Adviser carries out its duty to seek best execution; |
| (l) | the manner in which portfolio manager compensation is determined, and the number and types of accounts managed by the portfolio managers; |
| (m) | the nature and quality of the services provided to the Fund by its unaffiliated service providers, and the Investment Adviser’s general oversight and evaluation (including reports on due diligence) of those service providers as part of the administration services provided under the Management Agreement; and |
| (n) | the Investment Adviser’s processes and policies addressing various types of potential conflicts of interest; its approach to risk management; the annual review of the effectiveness of the Fund’s compliance program; and periodic compliance reports. |
The Trustees also received an overview of the Fund’s distribution arrangements. They received information regarding the Fund’s assets, share purchase and redemption activity and the payment of Rule 12b-1 distribution and service fees paid by the Fund’s Service Shares. Information was also provided to the Trustees relating to revenue sharing payments made by and services provided by the Investment Adviser and its affiliates to intermediaries that promote the sale, distribution and/or servicing of Fund shares.
The presentations made at the Board and Committee meetings and at the Annual Meeting encompassed the Fund and other mutual fund portfolios for which the Board of Trustees has responsibility. In evaluating the Management Agreement at the Annual Meeting, the Trustees relied upon their knowledge, resulting from their meetings and other interactions throughout the year, of the Investment Adviser, its affiliates, their services and the Fund. In conjunction with these meetings, the Trustees received written materials and oral presentations on the topics covered, and were advised by their independent legal counsel regarding their responsibilities and other regulatory requirements related to the approval and continuation of mutual fund investment management agreements under applicable law. In addition, the Investment Adviser and its affiliates provided the Independent Trustees with a written response to a formal request for information sent on behalf of the Independent Trustees by their independent legal counsel. During the course of their deliberations, the Independent Trustees met in executive sessions with their independent legal counsel, without representatives of the Investment Adviser or its affiliates present. The Independent Trustees also discussed the broad range of other investment choices that are available to Fund investors, including the availability of comparable funds managed by other advisers.
Nature, Extent and Quality of the Services Provided Under the Management Agreement
As part of their review, the Trustees considered the nature, extent and quality of the services provided by the Investment Adviser. In this regard, the Trustees considered both the investment advisory services and non-advisory services that are provided to the Fund by the Investment Adviser and its affiliates. The Trustees noted the transition in the leadership and changes in personnel of various of the Investment Adviser’s portfolio management teams that had occurred in recent periods, and the ongoing recruitment efforts aimed at bringing high quality investment talent to the Investment Adviser. The Trustees concluded that the Investment Adviser continued to commit substantial financial and operational resources to the Fund and expressed confidence that the Investment Adviser would continue to do so in the future. The Trustees also recognized that the Investment Adviser had made significant commitments to address regulatory compliance requirements applicable to the Fund and the Investment Adviser.
26
GOLDMAN SACHS VARIABLE INSURANCE TRUST GLOBAL MARKETS NAVIGATOR FUND
Statement Regarding Basis for Approval of Management Agreement (Unaudited) (continued)
Investment Performance
The Trustees also considered the investment performance of the Fund. In this regard, they compared the investment performance of the Fund to its peers using performance information prepared by the Investment Adviser using the peer group identified by the Outside Data Provider. The Trustees also reviewed the Fund’s investment performance relative to its performance benchmark. In each case, this information was provided for the three-month period ending March 31, 2013 (the Fund commenced operations in April 2012). In addition, they reviewed the investment performance of the Fund in light of its investment objective and policies and market conditions.
In addition, the Trustees considered materials prepared and/or presentations made by the Investment Adviser’s senior management and portfolio management personnel, in which Fund performance was assessed. The Trustees also considered the Investment Adviser’s periodic reports with respect to how the Investment Adviser’s approach to risk monitoring and management influences portfolio management.
The Trustees noted that the Fund had launched on April 16, 2012 and did not yet have a meaningful performance history.
Costs of Services Provided and Competitive Information
The Trustees considered the contractual terms of the Management Agreement and the fee rates payable by the Fund thereunder. In this regard, the Trustees considered information on the services rendered by the Investment Adviser to the Fund, which included both advisory and administrative services that were directed to the needs and operations of the Fund as a registered mutual fund.
In particular, the Trustees reviewed analyses prepared by the Outside Data Provider regarding the expense rankings of the Fund. The analyses provided a comparison of the Fund’s management fees and breakpoints to those of a relevant peer group and a category universe; an expense analysis which compared the Fund’s overall net and gross expenses to a peer group and a category universe; and a 2012 comparison of the Fund’s net expenses to the peer and category medians. The analyses also compared the Fund’s transfer agency, custody, and distribution fees, other expenses and fee waivers/reimbursements to those of the peer group and category medians. The Trustees concluded that the comparisons provided by the Outside Data Provider were useful in evaluating the reasonableness of the management fees and total expenses paid by the Fund.
In addition, the Trustees considered the Investment Adviser’s undertaking to limit certain expenses of the Fund that exceed a specified level. They also noted that the Investment Adviser did not manage institutional accounts or collective investment vehicles having investment objectives and policies similar to those of the Fund, and therefore this type of fee comparison was not possible.
In addition, the Trustees noted that shareholders are able to redeem their Fund shares at any time if they believe that the Fund fees and expenses are too high or if they are dissatisfied with the performance of the Fund.
Profitability
The Trustees reviewed the Investment Adviser’s revenues and pre-tax profit margins with respect to the Trust and the Fund. In this regard the Trustees noted that they had received, among other things, profitability analyses and summaries, revenue and expense schedules by Fund and by function (i.e., investment management, transfer agency and distribution and service) and the Investment Adviser’s expense allocation methodology. They observed that the profitability and expense figures are substantially similar to those used by the Investment Adviser for many internal purposes, including compensation decisions among various business groups, and are thus subject to a vigorous internal debate about how certain revenue and expenses should be allocated. The Trustees also reviewed the report of the internal audit group within the Goldman Sachs organization, which included an assessment of the reasonableness and consistency of the Investment Adviser’s expense allocation methodology and an evaluation of the accuracy of the Investment Adviser’s profitability analysis calculations. Profitability data for the Trust and the Fund were provided for 2012, and the Trustees considered this information in relation to the Investment Adviser’s overall profitability. The Trustees considered the Investment Adviser’s revenues and pre-tax profit margins both in absolute terms and in comparison to information on the reported pre-tax profit margins earned by certain other asset management firms.
27
GOLDMAN SACHS VARIABLE INSURANCE TRUST GLOBAL MARKETS NAVIGATOR FUND
Statement Regarding Basis for Approval of Management Agreement (Unaudited) (continued)
Economies of Scale
The Trustees considered the information that had been provided regarding the Investment Adviser’s profitability. The Trustees also considered the breakpoints in the fee rate payable under the Management Agreement for the Fund at the following annual percentage rates of the average daily net assets of the Fund:
| First $1 billion | 0.79 | % | ||
| Next $1 billion | 0.71 | |||
| Next $3 billion | 0.68 | |||
| Next $3 billion | 0.66 | |||
| Over $8 billion | 0.65 |
The Trustees noted that the breakpoints were meant to share potential economies of scale, if any, with the Fund and its shareholders as assets under management reach those asset levels. The Trustees considered the amounts of assets in the Fund; the Fund’s recent share purchase and redemption activity; the information provided by the Investment Adviser relating to the costs of the services provided by the Investment Adviser and its affiliates and their realized profits; information comparing fee rates charged by the Investment Adviser with fee rates charged to other funds in the peer group; and the Investment Adviser’s undertaking to limit certain expenses of the Fund that a exceed specified level. Upon reviewing these matters at the Annual Meeting, the Trustees concluded that the fee breakpoints represented a means of assuring that benefits of scalability, if any, would be passed along to shareholders at the specified asset levels.
Other Benefits to the Investment Adviser and Its Affiliates
The Trustees also considered the other benefits derived by the Investment Adviser and its affiliates from their relationship with the Fund as stated above, including: (a) transfer agency fees received by Goldman, Sachs & Co. (“Goldman Sachs”); (b) brokerage and futures commissions earned by Goldman Sachs for executing securities and futures transactions on behalf of the Fund; (c) trading efficiencies resulting from aggregation of orders of the Fund with those for other funds or accounts managed by the Investment Adviser; (d) the Investment Adviser’s ability to leverage the infrastructure designed to service the Fund on behalf of its other clients; (e) the Investment Adviser’s ability to cross-market other products and services to Fund shareholders; (f) Goldman Sachs’ retention of certain fees as Fund Distributor; (g) the Investment Adviser’s ability to negotiate better pricing with custodians on behalf of its other clients, as a result of the relationship with the Fund; and (h) the possibility that the working relationship between the Investment Adviser and the Fund’s third party service providers may cause those service providers to be open to doing business with other areas of Goldman Sachs. In the course of considering the foregoing, the Independent Trustees requested and received further information quantifying certain of these fall-out benefits.
28
GOLDMAN SACHS VARIABLE INSURANCE TRUST GLOBAL MARKETS NAVIGATOR FUND
Statement Regarding Basis for Approval of Management Agreement (Unaudited) (continued)
Other Benefits to the Fund and Its Shareholders
The Trustees also noted that the Fund receives certain potential benefits as a result of its relationship with the Investment Adviser, including: (a) trading efficiencies resulting from aggregation of orders of the Fund with those of other funds or accounts managed by the Investment Adviser; (b) improved servicing from vendors because of the volume of business generated by the Investment Adviser and its affiliates; (c) improved servicing from broker-dealers because of the volume of business generated by the Investment Adviser and its affiliates; (d) the Investment Adviser’s ability to negotiate favorable terms with derivatives counterparties as a result of the size and reputation of the Goldman Sachs organization; (e) the Investment Adviser’s knowledge and experience gained from managing other accounts and products; (f) the Investment Adviser’s ability to hire and retain qualified personnel to provide services to the Fund because of the reputation of the Goldman Sachs organization; (g) the Fund’s access, through the Investment Adviser, to certain firmwide resources (e.g., proprietary risk management systems and databases), subject to certain restrictions; and (h) the Fund’s access to certain affiliated distribution channels. The Trustees noted the competitive nature of the mutual fund marketplace, and noted further that many of the Fund’s shareholders invested in the Fund in part because of the Fund’s relationship with the Investment Adviser and that those shareholders have a general expectation that the relationship will continue.
Conclusion
In connection with their consideration of the Management Agreement, the Trustees gave weight to each of the factors described above, but did not identify any particular factor as controlling their decision. After deliberation and consideration of all of the information provided, including the factors described above, the Trustees concluded, in the exercise of their business judgment, that the management fees paid by the Fund were reasonable in light of the services provided to it by the Investment Adviser, the Investment Adviser’s costs and the Fund’s current and reasonably foreseeable asset levels. The Trustees unanimously concluded that the Investment Adviser’s continued management likely would benefit the Fund and its shareholders and that the Management Agreement should be approved and continued with respect to the Fund until June 30, 2014.
29
| TRUSTEES | OFFICERS | |
Ashok N. Bakhru, Chairman Donald C. Burke John P. Coblentz, Jr. Diana M. Daniels Joseph P. LoRusso James A. McNamara Jessica Palmer Alan A. Shuch Richard P. Strubel
GOLDMAN, SACHS & CO. Distributor and Transfer Agent
| James A. McNamara, President George F. Travers, Principal Financial Officer Caroline L. Kraus, Secretary Scott M. McHugh, Treasurer | |
GOLDMAN SACHS ASSET MANAGEMENT, L.P. Investment Adviser 200 West Street, New York New York 10282 | ||
Visit our web site at www.goldmansachsfunds.com/vit to obtain the most recent month-end returns.
The reports concerning the Fund included in this shareholder report may contain certain forward-looking statements about the factors that may affect the performance of the Fund in the future. These statements are based on Fund management’s predictions and expectations concerning certain future events and their expected impact on the Fund, such as performance of the economy as a whole and of specific industry sectors, changes in the levels of interest rates, the impact of developing world events, and other factors that may influence the future performance of the Fund. Management believes these forward-looking statements to be reasonable, although they are inherently uncertain and difficult to predict. Actual events may cause adjustments in portfolio management strategies from those currently expected to be employed.
A description of the policies and procedures that the Fund uses to determine how to vote proxies relating to portfolio securities and information regarding how the Fund voted proxies relating to portfolio securities for the 12-month period ended June 30 is available (i) without charge, upon request by calling 1-800-621-2550; and (ii) on the Securities and Exchange Commission (“SEC”) web site at http://www.sec.gov.
The Fund files its complete schedule of portfolio holdings with the SEC for the first and third quarters of each fiscal year on Form N-Q. The Fund’s Form N-Q is available on the SEC’s web site at http://www.sec.gov within 60 days after the Fund’s first and third fiscal quarters. The Fund’s Forms N-Q may be reviewed and copied at the SEC’s Public Reference Room in Washington, D.C. and information on the operation of the Public Reference Room may also be obtained by calling 1-800-SEC-0330. Forms N-Q may be obtained upon request and without charge by calling 1-800-621-2550.
Holdings and allocations shown are as of June 30, 2013 and may not be representative of future investments. Fund holdings should not be relied on in making investment decisions and should not be construed as research or investment advice regarding particular securities. Current and future holdings are subject to risk.
The portfolio risk management process includes an effort to monitor and manage risk, but does not imply low risk.
Shares of the Goldman Sachs VIT Funds are offered to separate accounts of participating life insurance companies for the purpose of funding variable annuity contracts and variable life insurance policies. Shares of the Fund are not offered directly to the general public. The variable annuity contracts and variable life insurance policies are described in the separate prospectuses issued by participating insurance companies. You should refer to those prospectuses for information about surrender charges, mortality and expense risk fees and other charges that may be assessed by participating insurance companies under the variable annuity contracts or variable life insurance policies. Such fees or charges, if any, may affect the return you may realize with respect to your investments. Ask your representative for more complete information. Please consider a fund’s objectives, risks and charges and expenses, and read the prospectus carefully before investing. The prospectus contains this and other information about the Fund.
This material is not authorized for distribution to prospective investors unless preceded or accompanied by a current Prospectus or summary prospectus, if applicable. Investors should consider a Fund’s objective, risks, and charges and expenses, and read the summary prospectus, if available, and/or the Prospectus carefully before investing or sending money. The summary prospectus, if available, and the Prospectus contain this and other information about a Fund and may be obtained from your Authorized Institution or from Goldman, Sachs & Co. by calling 1-800-621-2550.
This report is prepared for the general information of contract owners and is not an offer of shares of the Goldman Sachs Variable Insurance Trust: Goldman Sachs Global Markets Navigator Fund.
© 2013 Goldman Sachs. All rights reserved.
VITNAVSAR13/106772.MF.MED.TMPL/8/2013
Goldman
Sachs Variable Insurance Trust
Goldman Sachs
Large Cap Value Fund
Semi-Annual Report
June 30, 2013

GOLDMAN SACHS VARIABLE INSURANCE TRUST LARGE CAP VALUE FUND
Principal Investment Strategies and Risks
This is not a complete list of risks that may affect the Fund. For additional information concerning the risks applicable to the Fund, please see the Fund’s Prospectus.
Shares of the Goldman Sachs Variable Insurance Trust — Goldman Sachs Large Cap Value Fund are offered to separate accounts of participating life insurance companies for the purpose of funding variable annuity contracts and variable life insurance policies. Shares of the Fund are not offered directly to the general public. The variable annuity contracts and variable life insurance policies are described in the separate prospectuses issued by participating insurance companies. You should refer to those prospectuses for information about surrender charges, mortality and expense risk fees and other charges that may be assessed by participating insurance companies under the variable annuity contracts or variable life insurance policies. Such fees or charges, if any, may affect the return you realize with respect to your investments. Ask your representative for more complete information. Please consider the Fund’s objective, risks and charges and expenses, and read the Prospectus carefully before investing. The Prospectus contains this and other information about the Fund.
The Goldman Sachs Large Cap Value Fund invests primarily in large-capitalization U.S. equity investments. The Fund’s equity investments are subject to market risk, which means that the value of the securities in which it invests may go up or down in response to the prospects of individual companies, particular sectors and/or general economic conditions. Different investment styles (e.g., “value”) tend to shift in and out of favor, and at times the Fund may underperform other funds that invest in similar asset classes.
1
GOLDMAN SACHS VARIABLE INSURANCE TRUST LARGE CAP VALUE FUND
INVESTMENT OBJECTIVE
The Fund seeks long-term capital appreciation.
Portfolio Management Discussion and Analysis
Below, the Goldman Sachs Value Portfolio Management Team discusses the Goldman Sachs Variable Insurance Trust — Goldman Sachs Large Cap Value Fund’s (the “Fund”) performance and positioning for the six-month period ended June 30, 2013 (the “Reporting Period”).
How did the Fund perform during the Reporting Period?
During the Reporting Period, the Fund’s Institutional and Service Shares generated cumulative total returns of 15.33% and 15.16%, respectively. These returns compare to the 15.90% cumulative total return of the Fund’s benchmark, the Russell 1000® Value Index (with dividends reinvested) (the “Russell Index”) during the same time period.
What economic and market factors most influenced the equity markets as a whole during the Reporting Period?
Representing the U.S. equity market, the S&P® 500 Index gained 13.82% during the Reporting Period, making it the strongest first half since 1998.
U.S. equities, as represented by the S&P® 500 Index, extended their rally from 2012 with a strong first quarter in 2013. Indeed, the S&P® 500 Index finished the first quarter of 2013 with significant gains, making a five-year high during these months. The Dow Jones Industrial Average also hit a new record high during the first calendar quarter.
Despite the overhang of automatic spending cuts, or sequestration, that went into effect in March 2013, U.S. equity markets reflected a variety of improving economic indicators. Strong momentum in the housing market continued, as the Case-Shiller Index of house prices rose 8.1% in January 2013, year-over-year the fastest pace since mid-2006. The employment picture also improved, with the unemployment rate dropping to 7.7%. Strong retail sales suggested consumers may have been feeling the effects of better housing and labor market conditions.
After a strong start to the second quarter of 2013, bullish sentiment began to fade, and the U.S. equity rally halted in mid-May 2013 when Federal Reserve (“Fed”) Chair Bernanke announced the potential “tapering” of the pace of quantitative easing asset purchases. U.S. equity markets reacted negatively again in June to news the slowing of the asset purchase program could begin later this year, with the program ending by the middle of 2014 if the economy grows as expected. U.S. equity markets calmed toward the end of the month as a downward revision of first quarter Gross Domestic Product (“GDP”) from 2.4% to 1.8% supported reassurance from the Fed that it would only begin reducing asset purchases if the economy was clearly on track. Still, the S&P® 500 Index declined modestly in June 2013, ending seven consecutive months of gains and muting returns for the quarter as a whole. Even with that, both the S&P® 500 Index and the Dow Jones Industrial Average made fresh record highs, fueled by the continued strong rebound in house prices during the second calendar quarter, and returns for the Reporting Period overall were still significantly up.
For the Reporting Period as a whole, all ten sectors within the S&P® 500 Index posted gains. Health care did best, followed closely by consumer discretionary and financials. Conversely, materials performed worst, as commodity prices were volatile in part due to a slowing Chinese economy. Information technology, utilities, telecommunication services and energy were also comparatively weak, though still producing positive returns.
All segments of the U.S. equity market advanced during the Reporting Period, with small-cap stocks, as measured by the Russell 2000® Index gaining most, followed by mid-cap stocks and then large-cap stocks, as measured by the Russell Midcap® Index and the Russell 1000® Index, respectively. From a style perspective, value-oriented stocks solidly outpaced growth-oriented stocks in the large-cap and mid-cap segments of the U.S. equity market; however, growth stocks substantially outperformed value stocks in the small-cap segment of the U.S. equity market. (All as measured by the Russell Investments indices.)
What key factors were responsible for the Fund’s performance during the Reporting Period?
Stock selection overall had the greatest effect on the Fund’s performance relative to the Russell Index during the Reporting Period.
2
GOLDMAN SACHS VARIABLE INSURANCE TRUST LARGE CAP VALUE FUND
Which equity market sectors most significantly affected Fund performance?
Stock selection in the information technology, consumer discretionary, utilities and consumer staples sectors hurt the Fund’s performance most relative to the Russell Index. Partially offsetting these detractors was effective stock selection in the health care, industrials and energy sectors, which contributed positively.
Which stocks detracted significantly from the Fund’s performance during the Reporting Period?
Detracting most from the Fund’s results relative to its benchmark index were positions in information storage provider EMC, fertilizer producer CF Industries Holdings and oil and gas exploration and production company Devon Energy.
During the Reporting Period, the Fund’s holding in EMC detracted from its performance and was the top detractor in the information technology sector. Shares of EMC were negatively impacted by disappointing results and guidance from virtualization software and services provider VMware, in which EMC holds a majority stake. In our view, VMware was facing tough results comparisons following rapid growth, and at the end of the Reporting Period, we continued to believe the outlook for virtualization is favorable. Additionally, we believed concerns surrounding EMC’s core data storage business stemmed from the unfavorable macro environment late in 2012 rather than from any company-specific issues. While governments’ technology budgets may be tightened in 2013, EMC’s management expects stronger global information technology spending by corporations to offset any weakness. In our view, EMC’s high-end and mid-tier storage products could continue to record consistent market share growth through both product innovation and channel expansion. As an industry leader, we found shares of EMC attractively valued and thus added to the Fund’s position in the information storage company during the Reporting Period.
We bought and sold the Fund’s position in CF Industries Holdings during the Reporting Period. Shares of the global manufacturer and distributor of nitrogen and phosphate fertilizer products traded lower following weak planting volumes, negative pressure on fertilizer prices due to excess supply, and a rise in natural gas prices, a fundamental cost component for CF Industries Holdings. Strict to our sell discipline, as a key point to our investment thesis became invalidated, we sold out of the stock in favor of other names with what we considered to have more favorable risk/reward profiles.
Shares of Devon Energy traded down during the Reporting Period, as oil prices declined. We continued to believe the value of Devon Energy’s large, North American asset base is not fully recognized at its market price at the end of the Reporting Period. We thus were positive on the company’s announcement to form a master limited partnership with assets from its midstream business1. Its management has indicated it is open to taking additional steps to unlock the value within the company’s large asset base. In our view, Devon Energy maintains a strong balance sheet, which, along with its joint venture partnerships, may help speed up the development of its oil properties. In addition, we believe the company’s cash flow should increase in 2013 as the company spends less on acquiring new acreage.
What were some of the Fund’s best-performing individual stocks?
The Fund benefited most relative to the Russell Index from positions in Vertex Pharmaceuticals, Boeing and Prudential Financial.
Vertex Pharmaceuticals was the top contributor to the Fund’s performance during the Reporting Period. Supportive trial data was released on one of its cystic fibrosis drugs in development, causing the company’s shares to spike with the now more likely regulatory approval of the treatment. At the end of the Reporting Period, we believed Vertex Pharmaceuticals had an attractive risk/reward profile and was well positioned to grow its addressable market through its cystic fibrosis franchise. In addition, we believe the value of the company’s hepatitis-C franchise has been underestimated by the market, which could lead to significant upside in its stock. In our view, Vertex Pharmaceuticals has a robust pipeline of new treatments and maintains a healthy balance sheet that could help fund research on additional therapies.
During the second quarter of 2013, aerospace and defense company Boeing benefited from strength in its commercial and defense businesses as well as from the resumption of 787 Dreamliner passenger flights and deliveries. At the end of the Reporting Period, we saw further upside for the stock and believed Boeing was on track to significantly increase its free cash flow generation as commercial aircraft delivery rates increase. In our view, Boeing maintains a strong backlog that provides high visibility into the company’s outlook.
| 1 | The midstream component of the energy industry is usually defined as those companies providing products or services that help link the supply side, i.e. energy producers, and the demand side, i.e. energy end-users, for any type of energy commodity. Such midstream business can include, but are not limited to, those that process, store, market and transport various energy commodities.) |
3
GOLDMAN SACHS VARIABLE INSURANCE TRUST LARGE CAP VALUE FUND
Shares of Prudential Financial gained as the company reported strong first quarter 2013 results and as the steepening yield curve was viewed as a positive for the broader financials sector. At the end of the Reporting Period, we continued to believe the company’s line of insurance, savings and other retirement products provide it with attractive growth prospects to serve aging populations in the U.S. and abroad. In addition, we believed Prudential Financial has substantial excess capital, which it has been returning to shareholders in the form of dividends and share repurchases. Toward the end of the Reporting Period, the company announced share repurchase authorizations up to $1.0 billion through the end of June 2014.
How did the Fund use derivatives and similar instruments during the Reporting Period?
During the Reporting Period, we did not use derivatives as part of an active management strategy.
Did the Fund make any significant purchases or sales during the Reporting Period?
We initiated a Fund position in Toll Brothers, a designer, builder and marketer of premium homes during the second quarter of 2013. In our view, shares of the home builder suffered from transient issues during the first quarter of 2013, providing a buying opportunity. We believe Toll Brothers should be positioned to benefit from continued recovery of the U.S. housing market, as new home orders and revenues are still well below peaks seen between 2005 and 2007. We feel Toll Brothers has a high quality asset base located in opportunistic regions of the U.S., including the mid-Atlantic and tri-state area. Furthermore, we expect a tightening in supply and demand to create a favorable pricing environment, which may lead to a rise in gross profit margins on new homes along with an increase in land values, which was not reflected in the share price at the time of our purchase of the stock.
Also during the second quarter of 2013, we established a Fund position in Covidien, a developer and manufacturer of medical devices. We expect the company to benefit from a pick-up in overall health care spending, along with a ramp-up in medical device utilization as reimbursement and regulatory uncertainties subside. In addition, we believe the company may spin out its pharmaceutical business, which could allow its management to better focus on its core medical device business.
We sold the Fund’s position in General Motors. Shares of General Motors declined after the company reported a weaker than expected fourth quarter 2012 profit, citing wider losses in Europe and higher costs in North America than anticipated. Despite attempts to break even in Europe during 2013, General Motors’ earnings declined 13.8% in the first quarter of 2013 on continued weakness in the European market. We grew concerned with General Motors’ business in both Europe and China. Although we continue to see upside in General Motors, particularly in the North American market, we decided to exit the Fund’s position in favor of what we considered to be more attractive risk/reward opportunities.
Since we initiated the Fund’s position in Occidental Petroleum in September 2007, the company gained an annualized 10.3% compared to 3.8% for the S&P 500 Index. Our price target for the company was reached following the strong share price appreciation in the second quarter of 2013. In our view, its shares had become fairly valued, and we decided to sell the Fund’s position.
Were there any notable changes in the Fund’s weightings during the Reporting Period?
In constructing the Fund’s portfolio, we focus on picking stocks rather than on making industry or sector bets. We seek to outpace the benchmark index by overweighting stocks that we expect to outperform and underweighting those that we think may lag. Consequently, changes in its sector weights are generally the direct result of individual stock selection or of stock appreciation or depreciation. That said, during the Reporting Period, the Fund’s exposure to health care, industrials, information technology and materials increased compared to the Russell Index. The Fund’s allocations compared to the benchmark index in consumer discretionary, consumer staples and utilities decreased. The Fund’s position in cash also decreased during the Reporting Period.
How was the Fund positioned relative to its benchmark index at the end of the Reporting Period?
At the end of June 2013, the Fund had overweighted positions relative to the Russell Index in the information technology, health care, consumer discretionary and industrials sectors. On the same date, the Fund had underweighted positions compared to the Russell Index in financials, telecommunication services, utilities and energy, and was rather neutrally weighted to the Russell Index in consumer staples and materials.
4
GOLDMAN SACHS VARIABLE INSURANCE TRUST LARGE CAP VALUE FUND
What is the Fund’s tactical view and strategy for the months ahead?
As we enter the second half of 2013, we continue to be constructive on the U.S. equity market. Despite a strong first half of 2013, we believe the case for investing in U.S. equities remains compelling. In our view, at the end of the Reporting Period, valuations were reasonable, as the S&P 500 Index was trading below its historical average price-to-earnings (P/E) multiple and offered a dividend yield of approximately 2%. We believe the strength of corporate balance sheets provides companies with a number of options to enhance shareholder value going forward. Signs of improving U.S. economic growth remained intact at the end of June 2013, supported by a continued recovery in the U.S. housing market and in consumer confidence. However, some headwinds also remained, given market concerns about the Fed tapering asset purchases, rising interest rates, fiscal policy’s drag on economic growth and global economic weakness. We believe it is important to recognize that rising interest rates and advancing equity markets are not necessarily mutually exclusive. We feel equities have the potential to continue to rise in an increasing rate environment driven by improving U.S. economic growth and given that the absolute level of rates still remains low by historical standards. Additional catalysts could be improved sentiment and increased flows into equities.
Our fundamental, bottom-up research process continues to drive our stock selection, while short-term “noise” in the market — headlines or sentiment — enables us to manage position sizes opportunistically. We have high conviction in the companies the Fund owns and believe they have the potential to outperform relative to the broader U.S. equity market regardless of economic growth conditions. As we look ahead to the second half of 2013, we continue to focus on undervalued companies in control of their own destiny, such as innovators with differentiated products in their industry, companies with low cost structures or companies with financial flexibility that have been investing in their own businesses and may be poised to gain market share. We maintain our discipline in seeking to identify companies with strong or improving balance sheets, led by quality management teams and trading at discounted valuations. As always, deep research resources, a forward-looking investment process and truly actively managed portfolios are keys, in our view, to both preserving capital and outperforming the market over the long term.
5
FUND BASICS
Large Cap Value Fund
as of June 30, 2013
STANDARDIZED TOTAL RETURNS1
| For the period ended 6/30/13 | One Year | Five Years | Ten Years | Since Inception | Inception Date | |||||||||||||
| Institutional | 26.36 | % | 3.49 | % | 6.86 | % | 3.84 | % | 1/12/98 | |||||||||
| Service | 26.08 | 3.23 | N/A | 0.73 | 7/24/07 | |||||||||||||
| 1 | The Standardized Total Returns are average annual total returns as of the most recent calendar quarter-end. They assume reinvestment of all distributions at net asset value (“NAV”). Because Institutional and Service Shares do not involve a sales charge, such a charge is not applied to their Standardized Total Returns. |
Total return figures in the above chart represent past performance and do not indicate future results, which will vary. The investment return and principal value of an investment will fluctuate and, therefore, an investor’s shares, when redeemed, may be worth more or less than their original cost. Current performance may be lower or higher than the total return figures in the above chart. Please visit www.goldmansachsfunds.com/vit to obtain the most recent month-end returns. Performance reflects fee waivers and/or expense limitations in effect during the periods shown. In their absence, performance would be reduced.
EXPENSE RATIOS2
| Net Expense Ratio (Current) | Gross Expense Ratio (Before Waivers) | |||||||
| Institutional | 0.74 | % | 0.78 | % | ||||
| Service | 0.99 | 1.03 | ||||||
| 2 | The expense ratios of the Fund, both current (net of applicable fee waivers and/or expense limitations) and before waivers (gross of applicable fee waivers and/or expense limitations) are as set forth above according to the most recent publicly available Prospectus for the Fund and may differ from the expense ratios disclosed in the Financial Highlights in this report. The Fund’s waivers and/or expense limitations will remain in place through at least April 30, 2014, and prior to such date the investment adviser may not terminate the arrangements without the approval of the Fund’s Board of Trustees. If these arrangements are discontinued in the future, the expense ratios may change without shareholder approval. |
TOP TEN HOLDINGS AS OF 6/30/133
| Holding | % of Net Assets | Line of Business | ||||
| General Electric Co. | 4.9% | Capital Goods | ||||
| Exxon Mobil Corp. | 4.8 | Energy | ||||
| Citigroup, Inc. | 3.2 | Diversified Financials | ||||
| JPMorgan Chase & Co. | 3.1 | Diversified Financials | ||||
| Pfizer, Inc. | 2.9 | Pharmaceuticals, Biotechnology & Life Sciences | ||||
| Merck & Co., Inc. | 2.9 | Pharmaceuticals, Biotechnology & Life Sciences | ||||
| The Boeing Co. | 2.5 | Capital Goods | ||||
| Bank of America Corp. | 2.5 | Diversified Financials | ||||
| Prudential Financial, Inc. | 2.3 | Insurance | ||||
| EMC Corp. | 2.3 | Technology Hardware & Equipment | ||||
| 3 | The top ten holdings may not be representative of the Fund’s future investments. |
6
FUND BASICS
FUND vs. BENCHMARK SECTOR ALLOCATIONS4
As of June 30, 2013
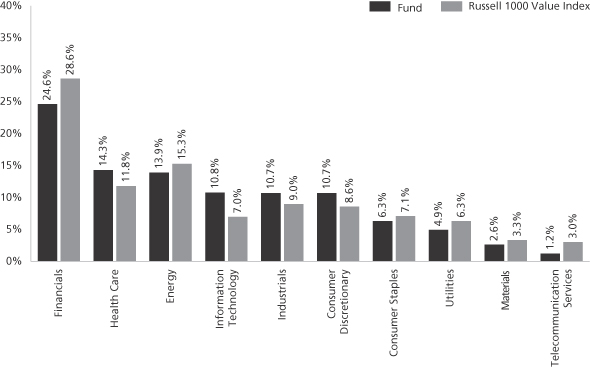
| 4 | The Fund is actively managed and, as such, its composition may differ over time. Consequently, the Fund’s overall sector allocations may differ from percentages contained in the graph above. The graph categorizes investments using Global Industry Classification Standard (“GICS”), however, the sector classifications used by the portfolio management team may differ from GICS. Underlying industry sector allocations of exchange traded funds (“ETFs”) held by the Fund are not reflected in the graph above. The percentage shown for each investment category reflects the value of investments in that category as a percentage of market value. The graph depicts the Fund’s investments but may not represent the Fund’s market exposure due to the exclusion of certain derivatives, if any, as listed in the Additional Investment Information section of the Schedule of Investments. |
7
GOLDMAN SACHS VARIABLE INSURANCE TRUST LARGE CAP VALUE FUND
Schedule of Investments
June 30, 2013 (Unaudited)
| Shares | Description | Value | ||||||
| Common Stocks – 99.4% | ||||||||
| Banks – 2.0% | |||||||
| 310,732 | Comerica, Inc. | $ | 12,376,455 | |||||
| 350,687 | SunTrust Banks, Inc. | 11,071,189 | ||||||
|
| |||||||
| 23,447,644 | ||||||||
|
| |||||||
| Capital Goods – 9.4% | |||||||
| 110,688 | General Dynamics Corp. | 8,670,191 | ||||||
| 2,439,868 | General Electric Co. | 56,580,539 | ||||||
| 547,584 | Textron, Inc. | 14,264,563 | ||||||
| 286,601 | The Boeing Co. | 29,359,407 | ||||||
|
| |||||||
| 108,874,700 | ||||||||
|
| |||||||
| Commercial & Professional Services – 1.3% | |||||||
| 362,841 | Waste Management, Inc. | 14,633,378 | ||||||
|
| |||||||
| Consumer Durables & Apparel – 2.3% | |||||||
| 79,474 | Fossil Group, Inc.* | 8,210,459 | ||||||
| 582,339 | Toll Brothers, Inc.* | 19,001,722 | ||||||
|
| |||||||
| 27,212,181 | ||||||||
|
| |||||||
| Consumer Services – 1.8% | |||||||
| 700,371 | MGM Resorts International* | 10,351,483 | ||||||
| 172,677 | Starwood Hotels & Resorts Worldwide, Inc. | 10,911,460 | ||||||
|
| |||||||
| 21,262,943 | ||||||||
|
| |||||||
| Diversified Financials – 12.2% | |||||||
| 2,222,859 | Bank of America Corp. | 28,585,967 | ||||||
| 262,644 | Capital One Financial Corp. | 16,496,670 | ||||||
| 784,700 | Citigroup, Inc. | 37,642,059 | ||||||
| 674,972 | JPMorgan Chase & Co. | 35,631,772 | ||||||
| 1,015,518 | SLM Corp. | 23,214,741 | ||||||
|
| |||||||
| 141,571,209 | ||||||||
|
| |||||||
| Energy – 13.8% | |||||||
| 102,643 | Apache Corp. | 8,604,563 | ||||||
| 409,266 | BP PLC ADR | 17,082,763 | ||||||
| 194,184 | ConocoPhillips | 11,748,132 | ||||||
| 491,453 | Devon Energy Corp. | 25,496,582 | ||||||
| 615,518 | Exxon Mobil Corp. | 55,612,051 | ||||||
| 578,885 | Halliburton Co. | 24,151,082 | ||||||
| 486,295 | Southwestern Energy Co.* | 17,764,356 | ||||||
|
| |||||||
| 160,459,529 | ||||||||
|
| |||||||
| Food & Staples Retailing – 2.2% | |||||||
| 202,530 | Walgreen Co. | 8,951,826 | ||||||
| 222,338 | Wal-Mart Stores, Inc. | 16,561,958 | ||||||
|
| |||||||
| 25,513,784 | ||||||||
|
| |||||||
| Food, Beverage & Tobacco – 4.1% | |||||||
| 194,109 | Anheuser-Busch InBev NV ADR | 17,520,278 | ||||||
| 259,497 | Mondelez International, Inc. Class A | 7,403,449 | ||||||
| 163,146 | Monster Beverage Corp.* | 9,914,383 | ||||||
| 141,639 | Philip Morris International, Inc. | 12,268,770 | ||||||
|
| |||||||
| 47,106,880 | ||||||||
|
| |||||||
| Common Stocks – (continued) | ||||||||
| Health Care Equipment & Services – 5.0% | |||||||
| 151,431 | Aetna, Inc. | $ | 9,621,926 | |||||
| 105,229 | C. R. Bard, Inc. | 11,436,288 | ||||||
| 299,524 | Covidien PLC | 18,822,088 | ||||||
| 271,474 | UnitedHealth Group, Inc. | 17,776,117 | ||||||
|
| |||||||
| 57,656,419 | ||||||||
|
| |||||||
| Insurance – 8.1% | |||||||
| 457,878 | American International Group, Inc.* | 20,467,147 | ||||||
| 112,874 | Everest Re Group Ltd. | 14,477,219 | ||||||
| 509,551 | Hartford Financial Services Group, Inc. | 15,755,317 | ||||||
| 370,097 | Prudential Financial, Inc. | 27,028,184 | ||||||
| 205,639 | The Travelers Companies, Inc. | 16,434,669 | ||||||
|
| |||||||
| 94,162,536 | ||||||||
|
| |||||||
| Materials – 2.6% | |||||||
| 254,862 | Eastman Chemical Co. | 17,842,888 | ||||||
| 186,491 | LyondellBasell Industries NV Class A | 12,356,894 | ||||||
|
| |||||||
| 30,199,782 | ||||||||
|
| |||||||
| Media – 4.0% | |||||||
| 388,546 | CBS Corp. Class B | 18,988,243 | ||||||
| 246,906 | Liberty Global PLC Series A* | 18,290,796 | ||||||
| 132,197 | Viacom, Inc. Class B | 8,996,006 | ||||||
|
| |||||||
| 46,275,045 | ||||||||
|
| |||||||
| Pharmaceuticals, Biotechnology & Life Sciences – 9.3% | |||||||
| 514,908 | Ariad Pharmaceuticals, Inc.* | 9,005,741 | ||||||
| 203,627 | Eli Lilly & Co. | 10,002,158 | ||||||
| 717,464 | Merck & Co., Inc. | 33,326,203 | ||||||
| 295,082 | Mylan, Inc.* | 9,156,395 | ||||||
| 1,206,032 | Pfizer, Inc. | 33,780,956 | ||||||
| 150,382 | Vertex Pharmaceuticals, Inc.* | 12,011,010 | ||||||
|
| |||||||
| 107,282,463 | ||||||||
|
| |||||||
| Real Estate Investment Trust – 2.1% | |||||||
| 102,994 | American Tower Corp. | 7,536,071 | ||||||
| 124,939 | AvalonBay Communities, Inc. | 16,855,520 | ||||||
|
| |||||||
| 24,391,591 | ||||||||
|
| |||||||
| Retailing – 2.5% | |||||||
| 311,868 | L Brands, Inc. | 15,359,499 | ||||||
| 320,173 | Lowe’s Companies, Inc. | 13,095,076 | ||||||
|
| |||||||
| 28,454,575 | ||||||||
|
| |||||||
| Semiconductors & Semiconductor Equipment – 2.9% | |||||||
| 670,208 | Altera Corp. | 22,110,162 | ||||||
| 263,775 | Lam Research Corp.* | 11,695,783 | ||||||
|
| |||||||
| 33,805,945 | ||||||||
|
| |||||||
| 8 | The accompanying notes are an integral part of these financial statements. |
GOLDMAN SACHS VARIABLE INSURANCE TRUST LARGE CAP VALUE FUND
| Shares | Description | Value | ||||||
| Common Stocks – (continued) | ||||||||
| Software & Services – 3.1% | |||||||
| 199,693 | Adobe Systems, Inc.* | $ | 9,098,013 | |||||
| 13,290 | Google, Inc. Class A* | 11,700,117 | ||||||
| 489,764 | Oracle Corp. | 15,045,550 | ||||||
|
| |||||||
| 35,843,680 | ||||||||
|
| |||||||
| Technology Hardware & Equipment – 4.7% | |||||||
| 39,912 | Apple, Inc. | 15,808,345 | ||||||
| 1,114,737 | EMC Corp. | 26,330,088 | ||||||
| 645,682 | Juniper Networks, Inc.* | 12,468,119 | ||||||
|
| |||||||
| 54,606,552 | ||||||||
|
| |||||||
| Telecommunication Services – 1.2% | |||||||
| 397,464 | AT&T, Inc. | 14,070,226 | ||||||
|
| |||||||
| Utilities – 4.8% | |||||||
| 141,114 | DTE Energy Co. | 9,456,049 | ||||||
| 440,306 | Exelon Corp. | 13,596,649 | ||||||
| 112,787 | NextEra Energy, Inc. | 9,189,885 | ||||||
| 260,633 | PG&E Corp. | 11,918,747 | ||||||
| 139,190 | Sempra Energy | 11,380,175 | ||||||
|
| |||||||
| 55,541,505 | ||||||||
|
| |||||||
| TOTAL INVESTMENTS – 99.4% | ||||||||
| (Cost $992,116,411) | $ | 1,152,372,567 | ||||||
|
| |||||||
| OTHER ASSETS IN EXCESS OF | 6,569,275 | ||||||
|
| |||||||
| NET ASSETS – 100.0% | $ | 1,158,941,842 | ||||||
|
| |||||||
| The percentage shown for each investment category reflects the value of investments in that category as a percentage of net assets. | ||
| * | Non-income producing security. | |
| Investment Abbreviation: | ||
| ADR | —American Depositary Receipt | |
| The accompanying notes are an integral part of these financial statements. | 9 |
GOLDMAN SACHS VARIABLE INSURANCE TRUST LARGE CAP VALUE FUND
Statement of Assets and Liabilities
June 30, 2013 (Unaudited)
| Assets: | ||||
Investments, at value (cost $992,116,411) | $ | 1,152,372,567 | ||
Cash | 4,025,397 | |||
Receivables: | ||||
Investments sold | 19,493,688 | |||
Dividends | 1,873,761 | |||
Fund shares sold | 438,850 | |||
Reimbursement from investment adviser | 53,728 | |||
Other assets | 4,440 | |||
| Total assets | 1,178,262,431 | |||
| Liabilities: | ||||
Payables: | ||||
Investments purchased | 17,683,349 | |||
Amounts owed to affiliates | 870,715 | |||
Fund shares redeemed | 649,655 | |||
Accrued expenses | 116,870 | |||
| Total liabilities | 19,320,589 | |||
| Net Assets: | ||||
Paid-in capital | 906,713,789 | |||
Undistributed net investment income | 8,149,054 | |||
Accumulated net realized gain | 83,822,843 | |||
Net unrealized gain | 160,256,156 | |||
| NET ASSETS | $ | 1,158,941,842 | ||
Net Assets: | ||||
Institutional | $ | 370,598,875 | ||
Service | 788,342,967 | |||
Total Net Assets | $ | 1,158,941,842 | ||
Shares of beneficial interest outstanding $0.001 par value (unlimited shares authorized): | ||||
Institutional | 29,872,647 | |||
Service | 63,678,724 | |||
Net asset value, offering and redemption price per share: | ||||
Institutional | $12.41 | |||
Service | 12.38 | |||
| 10 | The accompanying notes are an integral part of these financial statements. |
GOLDMAN SACHS VARIABLE INSURANCE TRUST LARGE CAP VALUE FUND
Statement of Operations
For the Six Months Ended June 30, 2013 (Unaudited)
Investment income: | ||||
Dividends (net of foreign taxes withheld of $21,749) | $ | 11,379,194 | ||
| Expenses: | ||||
Management fees | 4,258,053 | |||
Distribution and Service fees — Service Class | 976,792 | |||
Transfer Agent fees(a) | 115,018 | |||
Printing and mailing costs | 66,478 | |||
Custody, accounting and administrative services | 45,793 | |||
Professional fees | 37,788 | |||
Trustee fees | 9,306 | |||
Other | 13,154 | |||
| Total expenses | 5,522,382 | |||
Less — expense reductions | (196,377 | ) | ||
| Net expenses | 5,326,005 | |||
| NET INVESTMENT INCOME | 6,053,189 | |||
| Realized and unrealized gain: | ||||
Net realized gain from investments (including commissions recaptured of $115,720) | 86,611,616 | |||
Net change in unrealized gain on investments | 69,470,220 | |||
| Net realized and unrealized gain | 156,081,836 | |||
| NET INCREASE IN NET ASSETS RESULTING FROM OPERATIONS | $ | 162,135,025 | ||
(a) Institutional and Service Shares had Transfer Agent fees of $36,881 and $78,137, respectively.
| The accompanying notes are an integral part of these financial statements. | 11 |
GOLDMAN SACHS VARIABLE INSURANCE TRUST LARGE CAP VALUE FUND
Statements of Changes in Net Assets
For the Six Months Ended June 30, 2013 | For the Fiscal Year Ended December 31, 2012 | |||||||
| From operations: | ||||||||
Net investment income | $ | 6,053,189 | $ | 14,811,591 | ||||
Net realized gain | 86,611,616 | 115,785,338 | ||||||
Net change in unrealized gain | 69,470,220 | 76,484,258 | ||||||
| Net increase in net assets resulting from operations | 162,135,025 | 207,081,187 | ||||||
| Distributions to shareholders: | ||||||||
From net investment income | ||||||||
Institutional Shares | — | (4,850,997 | ) | |||||
Service Shares | — | (8,140,528 | ) | |||||
From net realized gains | ||||||||
Institutional Shares | — | (8,570,410 | ) | |||||
Service Shares | — | (17,965,988 | ) | |||||
| Total distributions to shareholders | — | (39,527,923 | ) | |||||
| From share transactions: | ||||||||
Proceeds from sales of shares | 33,769,315 | 111,767,606 | ||||||
Reinvestment of distributions | — | 39,527,923 | ||||||
Cost of shares redeemed | (123,216,968 | ) | (511,813,315 | ) | ||||
| Net decrease in net assets resulting from share transactions | (89,447,653 | ) | (360,517,786 | ) | ||||
| TOTAL INCREASE (DECREASE) | 72,687,372 | (192,964,522 | ) | |||||
| Net assets: | ||||||||
Beginning of period | 1,086,254,470 | 1,279,218,992 | ||||||
End of period | $ | 1,158,941,842 | $ | 1,086,254,470 | ||||
| Undistributed net investment income | $ | 8,149,054 | $ | 2,095,865 | ||||
| 12 | The accompanying notes are an integral part of these financial statements. |
GOLDMAN SACHS VARIABLE INSURANCE TRUST LARGE CAP VALUE FUND
Financial Highlights
Selected Data for a Share Outstanding Throughout Each Period
| Income (loss) from investment operations | Distributions to shareholders | |||||||||||||||||||||||||||||||||||||||||||||||||||||||
| Year - Share Class | Net asset value, beginning of period | Net investment income(a) | Net realized | Total from investment operations | From net investment income | From net realized gains | Total distributions | Net asset value, end of period | Total return(b) | Net assets, end of period (in 000s) | Ratio of net expenses to average net assets | Ratio of total expenses to average net assets | Ratio of to average net assets | Portfolio turnover rate(c) | ||||||||||||||||||||||||||||||||||||||||||
FOR THE SIX MONTHS ENDED JUNE 30, (UNAUDITED) | ||||||||||||||||||||||||||||||||||||||||||||||||||||||||
2013 - Institutional | $ | 10.76 | $ | 0.07 | $ | 1.58 | $ | 1.65 | $ | — | $ | — | $ | — | $ | 12.41 | 15.33 | % | $ | 370,599 | 0.76 | %(d) | 0.79 | %(d) | 1.22 | %(d) | 57 | % | ||||||||||||||||||||||||||||
2013 - Service | 10.75 | 0.06 | 1.57 | 1.63 | — | — | — | 12.38 | 15.16 | 788,343 | 1.01 | (d) | 1.04 | (d) | 0.97 | (d) | 57 | |||||||||||||||||||||||||||||||||||||||
FOR THE FISCAL YEARS ENDED DECEMBER 31, | ||||||||||||||||||||||||||||||||||||||||||||||||||||||||
2012 - Institutional | 9.39 | 0.15 | 1.64 | 1.79 | (0.15 | ) | (0.27 | ) | (0.42 | ) | 10.76 | 19.07 | 351,677 | 0.77 | 0.78 | 1.40 | 120 | |||||||||||||||||||||||||||||||||||||||
2012 - Service | 9.38 | 0.12 | 1.64 | 1.76 | (0.12 | ) | (0.27 | ) | (0.39 | ) | 10.75 | 18.77 | 734,577 | 1.02 | 1.03 | 1.15 | 120 | |||||||||||||||||||||||||||||||||||||||
2011 - Institutional | 10.24 | 0.14 | (e) | (0.86 | ) | (0.72 | ) | (0.13 | ) | — | (0.13 | ) | 9.39 | (7.05 | ) | 421,560 | 0.78 | 0.79 | 1.39 | (e) | 91 | |||||||||||||||||||||||||||||||||||
2011 - Service | 10.23 | 0.12 | (e) | (0.87 | ) | (0.75 | ) | (0.10 | ) | — | (0.10 | ) | 9.38 | (7.27 | ) | 857,659 | 1.03 | 1.04 | 1.23 | (e) | 91 | |||||||||||||||||||||||||||||||||||
2010 - Institutional | 9.28 | 0.10 | 0.94 | 1.04 | (0.08 | ) | — | (0.08 | ) | 10.24 | 11.20 | 507,146 | 0.80 | 0.80 | 1.02 | 95 | ||||||||||||||||||||||||||||||||||||||||
2010 - Service | 9.28 | 0.07 | 0.94 | 1.01 | (0.06 | ) | — | (0.06 | ) | 10.23 | 10.89 | 672,239 | 1.05 | 1.05 | 0.78 | 95 | ||||||||||||||||||||||||||||||||||||||||
2009 - Institutional | 7.97 | 0.18 | (f) | 1.28 | 1.46 | (0.15 | ) | — | (0.15 | ) | 9.28 | 18.32 | 487,962 | 0.81 | 0.81 | 2.18 | (f) | 84 | ||||||||||||||||||||||||||||||||||||||
2009 - Service | 7.98 | 0.16 | (f) | 1.28 | 1.44 | (0.14 | ) | — | (0.14 | ) | 9.28 | 17.87 | 391,053 | 1.06 | 1.06 | 1.92 | (f) | 84 | ||||||||||||||||||||||||||||||||||||||
2008 - Institutional | 12.53 | 0.25 | (4.59 | ) | (4.34 | ) | (0.22 | ) | — | (g) | (0.22 | ) | 7.97 | (34.45 | ) | 389,838 | 0.81 | 0.81 | 2.36 | 69 | ||||||||||||||||||||||||||||||||||||
2008 - Service | 12.52 | 0.19 | (4.51 | ) | (4.32 | ) | (0.22 | ) | — | (g) | (0.22 | ) | 7.98 | (34.32 | ) | 67,200 | 1.06 | 1.06 | 2.15 | 69 | ||||||||||||||||||||||||||||||||||||
| (a) | Calculated based on the average shares outstanding methodology. |
| (b) | Assumes investment at the net asset value at the beginning of the period, reinvestment of all distributions, and a complete redemption of the investment at the net asset value at the end of the period. Total returns for periods less than one full year are not annualized. |
| (c) | The Fund's portfolio turnover rate is calculated in accordance with regulatory requirements, without regard to transactions involving short term investments and certain derivatives. If such transactions were included, the Fund's portfolio turnover rate may be higher. |
| (d) | Annualized. |
| (e) | Reflects income recognized from special dividends which amounted to $0.02 per share and 0.19% of average net assets. |
| (f) | Reflects income recognized from special dividends which amounted to $0.02 per share and 0.24% of average net assets. |
| (g) | Amount is less than $0.005 per share. |
| 13 | The accompanying notes are an integral part of these financial statements. |
GOLDMAN SACHS VARIABLE INSURANCE TRUST LARGE CAP VALUE FUND
Notes to Financial Statements
June 30, 2013 (Unaudited)
1. ORGANIZATION
Goldman Sachs Variable Insurance Trust (the “Trust” or “VIT”) is a Delaware statutory trust registered under the Investment Company Act of 1940, as amended (the “Act”), as an open-end management investment company. The Trust includes the Goldman Sachs Large Cap Value Fund (the “Fund”). The Fund is a diversified portfolio under the Act offering two classes of shares — Institutional and Service Shares. Shares of the Trust are offered to separate accounts of participating life insurance companies for the purpose of funding variable annuity contracts and variable life insurance policies.
Goldman Sachs Asset Management, L.P. (“GSAM”), an affiliate of Goldman, Sachs & Co. (“Goldman Sachs”), serves as investment adviser to the Fund pursuant to a management agreement (the “Agreement”) with the Trust.
2. SIGNIFICANT ACCOUNTING POLICIES
The financial statements have been prepared in accordance with accounting principles generally accepted in the United States of America (“GAAP”) and require management to make estimates and assumptions that may affect the reported amounts and disclosures. Actual results may differ from those estimates and assumptions.
A. Investment Valuation — The Fund’s valuation policy is to value investments at fair value.
B. Investment Income and Investments — Investment income includes interest income and dividend income, net of any foreign withholding taxes, less any amounts reclaimable. Interest income is accrued daily and adjusted for amortization of premiums and accretion of discounts. Dividend income is recognized on ex-dividend date or, for certain foreign securities, as soon as such information is obtained subsequent to the ex-dividend date. Investment transactions are reflected on trade date. Realized gains and losses are calculated using identified cost. Investment transactions are recorded on the following business day for daily net asset value (“NAV”) calculations. Any foreign capital gains tax is accrued daily based upon net unrealized gains, and is payable upon sale of such investments. Distributions received from the Fund’s investments in United States (“U.S.”) real estate investment trusts (“REITs”) may be characterized as ordinary income, net capital gain or a return of capital. A return of capital is recorded by the Fund as a reduction to the cost basis of the REIT.
C. Class Allocations and Expenses — Investment income, realized and unrealized gain (loss), and non-class specific expenses of the Fund are allocated daily based upon the proportion of net assets of each class. Class specific expenses, where applicable, are borne by the respective share classes and include Distribution and Service, Transfer Agent and Service and Shareholder Administration fees. Non-class specific expenses directly incurred by a Fund are charged to that Fund, while such expenses incurred by the Trust are allocated across the respective Funds on a straight-line and/or pro-rata basis depending upon the nature of the expenses.
D. Federal Taxes and Distributions to Shareholders — It is the Fund’s policy to comply with the requirements of the Internal Revenue Code of 1986, as amended (the “Code”), applicable to regulated investment companies (mutual funds) and to distribute each year substantially all of its investment company taxable income and capital gains to its shareholders. Accordingly, the Fund is not required to make any provisions for the payment of federal income tax. Distributions to shareholders are recorded on the ex-dividend date. Income and capital gains distributions, if any, are declared and paid annually.
Net capital losses are carried forward to future fiscal years and may be used to the extent allowed by the Code to offset any future capital gains. Utilization of capital loss carryforwards will reduce the requirement of future capital gains distributions.
Under the Regulated Investment Company Modernization Act of 2010, the Fund is permitted to carry forward capital losses incurred in taxable years beginning after December 22, 2010 for an unlimited period. However, any losses incurred during those future taxable years will be required to be utilized prior to the losses incurred in pre-enactment taxable years. As a result of this ordering rule, pre-enactment capital loss carryforwards may be more likely to expire unused. Additionally, post-enactment capital losses that are carried forward will retain their character as either short-term or long-term capital losses rather than being considered all short-term as under previous law.
14
GOLDMAN SACHS VARIABLE INSURANCE TRUST LARGE CAP VALUE FUND
2. SIGNIFICANT ACCOUNTING POLICIES (continued)
The characterization of distributions to shareholders for financial reporting purposes is determined in accordance with federal income tax rules, which may differ from GAAP. The source of the Fund’s distributions may be shown in the accompanying financial statements as either from net investment income, net realized gain or capital. Certain components of the Fund’s net assets on the Statement of Assets and Liabilities reflect permanent GAAP/tax differences based on the appropriate tax character.
E. Commission Recapture — GSAM may direct portfolio trades, subject to seeking best execution, to various brokers who have agreed to rebate a portion of the commissions generated. Such rebates are made directly to the Fund as cash payments and are included in net realized gain (loss) from investments on the Statement Operations.
3. INVESTMENTS AND FAIR VALUE MEASUREMENTS
The fair value of a financial instrument is the amount that would be received to sell an asset or paid to transfer a liability in an orderly transaction between market participants at the measurement date (i.e., the exit price). GAAP establishes a fair value hierarchy that prioritizes the inputs to valuation techniques used to measure fair value. The hierarchy gives the highest priority to unadjusted quoted prices in active markets for identical assets or liabilities (Level 1 measurements) and the lowest priority to unobservable inputs (Level 3 measurements). The levels used for classifying investments are not necessarily an indication of the risk associated with investing in these investments. The three levels of the fair value hierarchy are described below:
Level 1 — Unadjusted quoted prices in active markets that are accessible at the measurement date for identical, unrestricted assets or liabilities;
Level 2 — Quoted prices in markets that are not active or financial instruments for which significant inputs are observable (including, but not limited to, quoted prices for similar investments, interest rates, foreign exchange rates, volatility and credit spreads), either directly or indirectly;
Level 3 — Prices or valuations that require significant unobservable inputs (including GSAM’s assumptions in determining fair value measurement).
The Trustees have adopted Valuation Procedures that govern the valuation of the portfolio investments held by the Fund, including investments for which market quotations are not readily available. The Trustees have delegated to GSAM day-to-day responsibility for implementing and maintaining internal controls and procedures related to the valuation of the Fund’s portfolio investments. To assess the continuing appropriateness of pricing sources and methodologies, GSAM regularly performs price verification procedures and issues challenges as necessary to third party pricing vendors or brokers, and any differences are reviewed in accordance with the Valuation Procedures.
A. Level 1 and Level 2 Fair Value Investments — The valuation techniques and significant inputs used in determining the fair values for investments classified as Level 1 and Level 2 are as follows:
Equity Securities — Equity securities and investment companies traded on a United States (“U.S.”) securities exchange or the NASDAQ system, or those located on certain foreign exchanges, including but not limited to the Americas, are valued daily at their last sale price or official closing price on the principal exchange or system on which they are traded. If no sale occurs, equity securities and exchange traded investment companies are valued at the last bid price for long positions and at the last ask price for short positions. Investments in investment companies (other than those that are exchange traded) are valued at the NAV on the valuation date. To the extent these investments are actively traded, they are classified as Level 1 of the fair value hierarchy.
Unlisted equity securities for which market quotations are available are valued at the last sale price on the valuation date, or if no sale occurs, at the last bid price. Securities traded on certain foreign securities exchanges are valued daily at fair value determined by an independent fair value service (if available) under Valuation Procedures approved by the Trustees and consistent with applicable regulatory guidance. The independent fair value service takes into account multiple factors including, but not limited to, movements in the securities markets, certain depositary receipts, futures contracts and foreign currency exchange rates that have occurred subsequent to the close of the foreign securities exchange. These investments are generally classified as Level 2 of the fair value hierarchy.
15
GOLDMAN SACHS VARIABLE INSURANCE TRUST LARGE CAP VALUE FUND
Notes to Financial Statements (continued)
June 30, 2013 (Unaudited)
3. INVESTMENTS AND FAIR VALUE MEASUREMENTS (continued)
Debt Securities — Debt securities for which market quotations are readily available are valued daily on the basis of quotations supplied by dealers or an independent pricing service approved by the Trustees. The pricing services may use valuation models or matrix pricing, which consider: (i) yield or price with respect to bonds that are considered comparable in characteristics such as rating, interest rate and maturity date or (ii) quotations from securities dealers to determine current value. Short-term debt obligations that mature in sixty days or less and that do not exhibit signs of credit deterioration are valued at amortized cost, which approximates fair value. With the exception of treasury securities, which are generally classified as Level 1, these investments are generally classified as Level 2 of the fair value hierarchy.
B. Level 3 Fair Value Investments — To the extent that the aforementioned significant inputs are unobservable, or if quotations are not readily available, or if GSAM believes that such quotations do not accurately reflect fair value, the fair value of the Fund’s investments may be determined under Valuation Procedures approved by the Trustees. GSAM, consistent with its procedures and applicable regulatory guidance, may make an adjustment to the most recent valuation prices of either domestic or foreign securities in light of significant events to reflect what it believes to be the fair value of the securities at the time of determining a Fund’s NAV. Significant events which could affect a large number of securities in a particular market may include, but are not limited to: significant fluctuations in U.S. or foreign markets; market dislocations; market disruptions; or unscheduled market closings. Significant events which could also affect a single issuer may include, but are not limited to: corporate actions such as reorganizations, mergers and buy-outs; ratings downgrades; and bankruptcies.
C. Fair Value Hierarchy — The following is a summary of the Fund’s investments classified in the fair value hierarchy as of June 30, 2013:
| Investment Type | Level 1 | Level 2 | Level 3 | |||||||||
| Assets | ||||||||||||
| Common Stock and/or Other Equity Investments | $ | 1,152,372,567 | $ | — | $ | — | ||||||
For further information regarding security characteristics, see the Schedule of Investments.
4. AGREEMENTS AND AFFILIATED TRANSACTIONS
A. Management Agreement — Under the Agreement, GSAM manages the Fund, subject to the general supervision of the Trustees.
As compensation for the services rendered pursuant to the Agreement, the assumption of the expenses related thereto and administration of the Fund’s business affairs, including providing facilities, GSAM is entitled to a management fee, accrued daily and paid monthly, equal to an annual percentage rate of the Fund’s average daily net assets.
For the six months ended June 30, 2013, contractual and effective net management fees with GSAM were at the following rates:
| Contractual Management Fee Rate | ||||||||||||||||||||||||||
| First $1 billion | Next $1 billion | Next $3 billion | Next $3 billion | Over $8 billion | Effective Rate | Effective Net Management Fee Rate | ||||||||||||||||||||
| 0.75% | 0.68 | % | 0.65 | % | 0.64 | % | 0.63 | % | 0.74 | % | 0.72 | %* | ||||||||||||||
| * | GSAM agreed to waive a portion of its management fee in order to achieve a effective net management fee rate of 0.72% through April 30, 2014. Prior to such date GSAM may not terminate the arrangement without the approval of the Trustees. For the six months ended June 30, 2013, GSAM waived $116,158 of its management fee. |
16
GOLDMAN SACHS VARIABLE INSURANCE TRUST LARGE CAP VALUE FUND
4. AGREEMENTS AND AFFILIATED TRANSACTIONS (continued)
B. Distribution and Service Plan — The Trust, on behalf of the Service Shares of the Fund, has adopted a Distribution and Service Plan (the “Plan”). Under the Plan, Goldman Sachs, which serves as distributor (the “Distributor”), is entitled to a fee accrued daily and paid monthly, for distribution services and personal and account maintenance services, which may then be paid by Goldman Sachs to authorized dealers, equal to, on an annual basis, 0.25% of the Fund’s average daily net assets attributable to Service Shares.
C. Transfer Agency Agreement — Goldman Sachs also serves as the transfer agent of the Fund for a fee pursuant to a Transfer Agency Agreement. The fees charged for such transfer agency services are accrued daily and paid monthly at an annual rate of 0.02% of the average daily net assets of Institutional and Service Shares.
D. Other Expense Agreements and Affiliated Transactions — GSAM has agreed to limit certain “Other Expense” of the Fund (excluding transfer agent fees and expenses, service fees and shareholder administration fees (as applicable), taxes, interest, brokerage fees, litigation, indemnification, shareholder meeting and other extraordinary expenses) to the extent such expenses exceed, on an annual basis, a percentage rate of the average daily net assets of the Fund. Such Other Expense reimbursements, if any, are accrued daily and paid monthly. In addition, the Fund is not obligated to reimburse GSAM for prior fiscal year expense reimbursements, if any. The Other Expense limitation as an annual percentage rate of average daily net assets for the Fund is 0.004%. Prior to April 30, 2013, the Other Expense limitation for the Fund was 0.114%. These Other Expense limitations will remain in place through at least April 30, 2014, and prior to such date GSAM may not terminate the arrangement without the approval of the Trustees. For the six months ended June 30, 2013, GSAM reimbursed $74,022 to the Fund. In addition, the Fund has entered into certain offset arrangements with the custodian and the transfer agent, which may result in a reduction of the Fund’s expenses and are received irrespective of the application of the “Other Expense” limitations described above. For the six months ended June 30, 2013, custody fee credits were $6,197.
As of June 30, 2013, the amounts owed to affiliates of the Fund were $687,684, $163,774, and $19,257 for management, distribution and service, and transfer agent fees, respectively.
E. Line of Credit Facility — As of June 30, 2013, the Fund participated in a $780,000,000 committed, unsecured revolving line of credit facility (the “facility”) together with other funds of the Trust and registered investment companies having management agreements with GSAM or its affiliates (“Other Borrowers”). Pursuant to the terms of the facility, the Fund and Other Borrowers could increase the credit amount by an additional $220,000,000, for a total of up to $1,000,000,000. This facility is to be used solely for temporary or emergency purposes, which may include the funding of redemptions. The interest rate on borrowings is based on the federal funds rate. The facility also requires a fee to be paid by the Fund based on the amount of the commitment that has not been utilized. For the six months ended June 30, 2013, the Fund did not have any borrowings under the facility. Prior to May 8, 2013, the committed amount available through the facility was $630,000,000.
F. Other Transactions with Affiliates — For the six months ended June 30, 2013, Goldman Sachs earned $3,471 in brokerage commissions from portfolio transactions on behalf of the Fund.
5. PORTFOLIO SECURITIES TRANSACTIONS
The cost of purchases and proceeds from sales and maturities of long-term securities for the six months ended June 30, 2013, were $646,731,579 and $724,981,385, respectively.
17
GOLDMAN SACHS VARIABLE INSURANCE TRUST LARGE CAP VALUE FUND
Notes to Financial Statements (continued)
June 30, 2013 (Unaudited)
6. TAX INFORMATION
As of June 30, 2013, the Fund’s aggregate security unrealized gains and losses based on cost for U.S. federal income tax purposes were as follows:
| Tax cost | $ | 1,003,340,682 | ||
| Gross unrealized gain | 172,378,755 | |||
| Gross unrealized loss | (23,346,870 | ) | ||
| Net unrealized security gain | $ | 149,031,885 |
The difference between GAAP-basis and tax-basis unrealized gains (losses), as of the most recent fiscal year end, is attributable primarily to wash sales.
GSAM has reviewed the Fund’s tax positions for all open tax years (the current and prior three years, as applicable) and has concluded that no provision for income tax is required in the Fund’s financial statements. Such open tax years remain subject to examination and adjustment by tax authorities.
7. OTHER RISKS
The Fund’s risks include, but are not limited to, the following:
Shareholder Concentration Risk — Certain funds, accounts, individuals, or Goldman Sachs affiliates may from time to time own (beneficially or of record) or control a significant percentage of the Fund’s shares. Redemptions by these entities of their holdings in the Fund may impact the Fund’s liquidity and NAV. These redemptions may also force the Fund to sell securities.
Liquidity Risk — The Fund may make investments that are illiquid or that may become less liquid in response to market developments or adverse investor perceptions. Illiquid investments may be more difficult to value. Liquidity risk may also refer to the risk that a Fund will not be able to pay redemption proceeds within the allowable time period because of unusual market conditions, an unusually high volume of redemption requests, or other reasons. To meet redemption requests, the Fund may be forced to sell investments at an unfavorable time and/or under unfavorable conditions.
Market and Credit Risks — In the normal course of business, the Fund trades financial instruments and enters into financial transactions where risk of potential loss exists due to changes in the market (market risk). Additionally, the Fund may also be exposed to credit risk in the event that an issuer fails to perform or that an institution or entity with which the Fund has unsettled or open transactions defaults.
8. INDEMNIFICATIONS
Under the Trust’s organizational documents, its Trustees, officers, employees and agents are indemnified, to the extent permitted by the Act and state law, against certain liabilities that may arise out of performance of their duties to the Fund. Additionally, in the course of business, the Fund enters into contracts that contain a variety of indemnification clauses. The Fund’s maximum exposure under these arrangements is unknown, as this would involve future claims that may be made against the Fund that have not yet occurred. However, GSAM believes the risk of loss under these arrangements to be remote.
9. SUBSEQUENT EVENTS
Subsequent events after the Statement of Assets and Liabilities date have been evaluated through the date the financial statements were issued. GSAM has concluded that there is no impact requiring adjustment or disclosure in the financial statements.
18
GOLDMAN SACHS VARIABLE INSURANCE TRUST LARGE CAP VALUE FUND
10. SUMMARY OF SHARE TRANSACTIONS
Share activity is as follows:
| For the Six Months Ended June 30, 2013 (Unaudited) | For the Fiscal Year Ended December 31, 2012 | |||||||||||||||
| Shares | Dollars | Shares | Dollars | |||||||||||||
| Institutional Shares | ||||||||||||||||
| Shares sold | 964,127 | $ | 11,450,348 | 2,229,900 | $ | 23,125,316 | ||||||||||
| Reinvestment of distributions | — | — | 1,248,503 | 13,421,407 | ||||||||||||
| Shares redeemed | (3,788,866 | ) | (44,955,406 | ) | (15,685,268 | ) | (161,397,158 | ) | ||||||||
| (2,824,739 | ) | (33,505,058 | ) | (12,206,865 | ) | (124,850,435 | ) | |||||||||
| Service Shares | ||||||||||||||||
| Shares sold | 1,880,979 | 22,318,967 | 8,685,922 | 88,642,290 | ||||||||||||
| Reinvestment of distributions | — | — | 2,430,775 | 26,106,516 | ||||||||||||
| Shares redeemed | (6,559,041 | ) | (78,261,562 | ) | (34,228,911 | ) | (350,416,157 | ) | ||||||||
| (4,678,062 | ) | (55,942,595 | ) | (23,112,214 | ) | (235,667,351 | ) | |||||||||
| NET DECREASE | (7,502,801 | ) | $ | (89,447,653 | ) | (35,319,079 | ) | $ | (360,517,786 | ) | ||||||
19
GOLDMAN SACHS VARIABLE INSURANCE TRUST LARGE CAP VALUE FUND
| Fund Expenses — Six Month Period Ended June 30, 2013 (Unaudited) |
As a shareholder of Institutional or Service Shares of the Fund, you incur ongoing costs, including management fees, distribution and service (12b-1) fees (with respect to Service Shares) and other Fund expenses. This example is intended to help you understand your ongoing costs (in dollars) of investing in the Institutional Shares and Service Shares of the Fund and to compare these costs with the ongoing costs of investing in other mutual funds.
The example is based on an investment of $1,000 invested at the beginning of the period and held for the entire period from January 1, 2013 through June 30, 2013.
Actual Expenses — The first line under each share class in the table below provides information about actual account values and actual expenses. You may use the information in this line, together with the amount you invested, to estimate the expenses that you paid over the period. Simply divide your account value by $1,000 (for example, an $8,600 account value divided by $1,000=8.6), then multiply the result by the number in the first line under the heading entitled “Expenses Paid” to estimate the expenses you paid on your account during this period.
Hypothetical Example for Comparison Purposes — The second line under each share class in the table below provides information about hypothetical account values and hypothetical expenses based on the Fund's actual net expense ratio and an assumed rate of return of 5% per year before expenses, which is not the Fund's actual return. The hypothetical account values and expenses may not be used to estimate the actual ending account balance or expenses you paid for the period. You may use this information to compare the ongoing costs of investing in the Fund and other funds. To do so, compare this 5% hypothetical example with the 5% hypothetical examples that appear in the shareholder reports of the other funds.
Please note that the expenses shown in the table are meant to highlight your ongoing costs only. As a shareholder of the Fund, you do not incur any transaction costs, such as sales charges, redemption fees, or exchange fees, but shareholders of other funds may incur such costs. The second line of the table is useful in comparing ongoing costs only, and will not help you determine the relative total costs of owning different funds whose shareholders may incur transaction costs.
| Share Class | Beginning Account Value 1/01/13 | Ending Account Value 6/30/13 | Expenses Paid for the 6 Months Ended 6/30/13* | |||||||||
| Institutional | ||||||||||||
| Actual | $ | 1,000 | $ | 1,153.30 | $ | 4.06 | ||||||
| Hypothetical 5% return | 1,000 | 1,021.03 | + | 3.81 | ||||||||
| Service | ||||||||||||
| Actual | 1,000 | 1,151.60 | 5.39 | |||||||||
| Hypothetical 5% return | 1,000 | 1,019.79 | + | 5.06 | ||||||||
| * | Expenses are calculated using the Fund’s annualized net expense ratio for each class, which represents the ongoing expenses as a percentage of net assets for the six months ended June 30, 2013. Expenses are calculated by multiplying the annualized net expense ratio by the average account value for the period; then multiplying the result by the number of days in the most recent fiscal half year; and then dividing that result by the number of days in the fiscal year. The annualized net expense ratios for the period were 0.76% and 1.01% for the Institutional and Service Shares, respectively. |
| + | Hypothetical expenses are based on the Fund’s actual annualized net expense ratios and an assumed rate of return of 5% per year before expenses. |
20
GOLDMAN SACHS VARIABLE INSURANCE TRUST LARGE CAP VALUE FUND
Statement Regarding Basis for Approval of Management Agreement (Unaudited)
Background
The Goldman Sachs Large Cap Value Fund (the “Fund”) is an investment portfolio of Goldman Sachs Variable Insurance Trust (the “Trust”). The Board of Trustees oversees the management of the Trust and reviews the investment performance and expenses of the Fund at regularly scheduled meetings held during the year. In addition, the Board of Trustees determines annually whether to approve the continuance of the Trust’s investment management agreement (the “Management Agreement”) with Goldman Sachs Asset Management, L.P. (the “Investment Adviser”) on behalf of the Fund.
The Management Agreement was most recently approved for continuation until June 30, 2014 by the Board of Trustees, including those Trustees who are not parties to the Management Agreement or “interested persons” (as defined in the Investment Company Act of 1940, as amended) of any party thereto (the “Independent Trustees”), at a meeting held on June 12-13, 2013 (the “Annual Meeting”).
The review process undertaken by the Trustees spans the course of the year and culminates with the Annual Meeting. To assist the Trustees in their deliberations, the Trustees have established a Contract Review Committee (the “Committee”), comprised of the Independent Trustees. The Committee held four meetings over the course of the year since the Management Agreement was last approved. At those Committee meetings, regularly scheduled Board or other committee meetings and/or the Annual Meeting, the Board, or the Independent Trustees, as applicable, considered matters relating to the Management Agreement, including:
| (a) | the nature and quality of the advisory, administrative and other services provided to the Fund by the Investment Adviser and its affiliates, including information about: |
| (i) | the structure, staff and capabilities of the Investment Adviser and its portfolio management teams; |
| (ii) | the groups within the Investment Adviser and its affiliates that support the portfolio management teams or provide other types of necessary services, including fund services groups (e.g., accounting and financial reporting, tax, shareholder services and operations), controls and risk management groups (e.g., legal, compliance, valuation oversight, credit risk management, internal audit, compliance testing, market risk analysis, finance and strategy and central funding), sales and distribution support groups and others (e.g., information technology and training); |
| (iii) | trends in headcount; |
| (iv) | the Investment Adviser’s financial resources and ability to hire and retain talented personnel and strengthen its operations; and |
| (v) | the parent company’s support of the Investment Adviser and its mutual fund business, as expressed by the firm’s senior management; |
| (b) | information on the investment performance of the Fund, including comparisons to the performance of a group of similar mutual funds, as provided by a third party mutual fund data provider engaged as part of the contract review process (the “Outside Data Provider”), its benchmark performance index, and a comparable institutional composite managed by the Investment Adviser, and general investment outlooks in the markets in which the Fund invests; |
| (c) | the terms of the Management Agreement and agreements with affiliated service providers entered into by the Trust on behalf of the Fund; |
| (d) | expense information for the Fund, including: |
| (i) | the relative management fee and expense level of the Fund as compared to those of comparable funds managed by other advisers, as provided by the Outside Data Provider; |
| (ii) | the Fund’s expense trends over time; and |
| (iii) | to the extent the Investment Adviser manages institutional accounts or collective investment vehicles having investment objectives and policies similar to those of the Fund, comparative information on the advisory fees charged and services provided to those accounts by the Investment Adviser; |
| (e) | with respect to the extensive investment performance and expense comparison data provided by the Outside Data Provider, its processes in producing that data for the Fund; |
| (f) | the undertakings of the Investment Adviser to waive certain fees and limit certain expenses of the Fund that exceed a specified level, and a summary of contractual fee reductions made by the Investment Adviser and its affiliates over the past several years with respect to the Fund; |
| (g) | information relating to the profitability of the Management Agreement and the transfer agency and distribution and service arrangements of the Fund and the Trust as a whole to the Investment Adviser and its affiliates; |
| (h) | whether the Fund’s existing management fee schedule adequately addressed any economies of scale; |
| (i) | a summary of the “fall-out” benefits derived by the Investment Adviser and its affiliates from their relationships with the Fund, including the fees received by the Investment Adviser’s affiliates from the Fund for transfer agency, portfolio trading, distribution and other services; |
21
GOLDMAN SACHS VARIABLE INSURANCE TRUST LARGE CAP VALUE FUND
Statement Regarding Basis for Approval of Management Agreement (Unaudited) (continued)
| (j) | a summary of potential benefits derived by the Fund as a result of its relationship with the Investment Adviser; |
| (k) | information regarding commissions paid by the Fund and broker oversight, an update on the Investment Adviser’s soft dollars practices, other information regarding portfolio trading and how the Investment Adviser carries out its duty to seek best execution; |
| (l) | the manner in which portfolio manager compensation is determined, and the number and types of accounts managed by the portfolio managers; |
| (m) | the nature and quality of the services provided to the Fund by its unaffiliated service providers, and the Investment Adviser’s general oversight and evaluation (including reports on due diligence) of those service providers as part of the administration services provided under the Management Agreement; and |
| (n) | the Investment Adviser’s processes and policies addressing various types of potential conflicts of interest; its approach to risk management; the annual review of the effectiveness of the Fund’s compliance program; and periodic compliance reports. |
The Trustees also received an overview of the Fund’s distribution arrangements. They received information regarding the Fund’s assets, share purchase and redemption activity and the payment of Rule 12b-1 distribution and service fees by the Fund’s Service Shares. Information was also provided to the Trustees relating to revenue sharing payments made by and services provided by the Investment Adviser and its affiliates to intermediaries that promote the sale, distribution and/or servicing of Fund shares.
The presentations made at the Board and Committee meetings and at the Annual Meeting encompassed the Fund and other mutual fund portfolios for which the Board of Trustees has responsibility. In evaluating the Management Agreement at the Annual Meeting, the Trustees relied upon their knowledge, resulting from their meetings and other interactions throughout the year, of the Investment Adviser, its affiliates, their services and the Fund. In conjunction with these meetings, the Trustees received written materials and oral presentations on the topics covered, and were advised by their independent legal counsel regarding their responsibilities and other regulatory requirements related to the approval and continuation of mutual fund investment management agreements under applicable law. In addition, the Investment Adviser and its affiliates provided the Independent Trustees with a written response to a formal request for information sent on behalf of the Independent Trustees by their independent legal counsel. During the course of their deliberations, the Independent Trustees met in executive sessions with their independent legal counsel, without representatives of the Investment Adviser or its affiliates present. The Independent Trustees also discussed the broad range of other investment choices that are available to Fund investors, including the availability of comparable funds managed by other advisers.
Nature, Extent and Quality of the Services Provided Under the Management Agreement
As part of their review, the Trustees considered the nature, extent and quality of the services provided by the Investment Adviser. In this regard, the Trustees considered both the investment advisory services and non-advisory services that are provided to the Fund by the Investment Adviser and its affiliates. The Trustees noted the transition in the leadership and changes in personnel of various of the Investment Adviser’s portfolio management teams that had occurred in recent periods, and the ongoing recruitment efforts aimed at bringing high quality investment talent to the Investment Adviser. The Trustees concluded that the Investment Adviser continued to commit substantial financial and operational resources to the Fund and expressed confidence that the Investment Adviser would continue to do so in the future. The Trustees also recognized that the Investment Adviser had made significant commitments to address regulatory compliance requirements applicable to the Fund and the Investment Adviser.
Investment Performance
The Trustees also considered the investment performance of the Fund. In this regard, they compared the investment performance of the Fund to its peers using rankings and ratings compiled by the Outside Data Provider as of December 31, 2012, and updated performance information prepared by the Investment Adviser using the peer group identified by the Outside Data Provider as of March 31, 2013. The information on the Fund’s investment performance was provided for the one-, three-, five- and ten-year periods ending on the applicable dates. The Trustees also reviewed the Fund’s investment performance over time (including on a year-by-year basis) relative to its performance benchmark. In addition, they considered the investment performance trends of the Fund over time, and reviewed the investment performance of the Fund in light of its investment objective and policies and market conditions. The Trustees also received information comparing the Fund’s performance to that of a comparable institutional composite managed by the Investment Adviser.
In addition, the Trustees considered materials prepared and presentations made by the Investment Adviser’s senior management and portfolio management personnel, in which Fund performance was assessed. The Trustees also considered the
22
GOLDMAN SACHS VARIABLE INSURANCE TRUST LARGE CAP VALUE FUND
Statement Regarding Basis for Approval of Management Agreement (Unaudited) (continued)
Investment Adviser’s periodic reports with respect to the Fund’s risk profile, and how the Investment Adviser’s approach to risk monitoring and management influences portfolio management.
The Trustees noted that the Fund’s Service Shares had placed in the second quartile of the Fund’s peer group for the one-year period and in the fourth quartile for the three- and five-year periods, and had underperformed the Fund’s benchmark index for the one-, three-, and five-year periods ended March 31, 2013. The Trustees took note of the Fund’s stronger performance relative to its peer group for the one-year period ended March 31, 2013. They also considered the Investment Adviser’s risk management enhancements, including the addition of certain key hires.
Costs of Services Provided and Competitive Information
The Trustees considered the contractual terms of the Management Agreement and the fee rates payable by the Fund thereunder. In this regard, the Trustees considered information on the services rendered by the Investment Adviser to the Fund, which included both advisory and administrative services that were directed to the needs and operations of the Fund as a registered mutual fund.
In particular, the Trustees reviewed analyses prepared by the Outside Data Provider regarding the expense rankings of the Fund. The analyses provided a comparison of the Fund’s management fees and breakpoints to those of a relevant peer group and a category universe; an expense analysis which compared the Fund’s overall net and gross expenses to a peer group and a category universe; and a five-year history comparing the Fund’s net expenses to the peer and category medians. The analyses also compared the Fund’s transfer agency, custody, and distribution fees, other expenses and fee waivers/reimbursements to those of the peer group and category medians. The Trustees concluded that the comparisons provided by the Outside Data Provider were useful in evaluating the reasonableness of the management fees and total expenses paid by the Fund.
In addition, the Trustees considered the Investment Adviser’s undertakings to waive a portion of its management fee and limit certain expenses of the Fund that exceed a specified level. They also considered, to the extent that the Investment Adviser manages institutional accounts or collective investment vehicles having investment objectives and policies similar to those of the Fund, comparative fee information for services provided by the Investment Adviser to those accounts, and information that indicated that services provided to the Fund differed in various significant respects from the services provided to institutional accounts, which generally operated under less stringent legal and regulatory structures, required fewer services from the Investment Adviser to a smaller number of client contact points, were less time-intensive and paid lower fees.
In addition, the Trustees noted that shareholders are able to redeem their Fund shares at any time if they believe that the Fund fees and expenses are too high or if they are dissatisfied with the performance of the Fund.
Profitability
The Trustees reviewed the Investment Adviser’s revenues and pre-tax profit margins with respect to the Trust and the Fund. In this regard the Trustees noted that they had received, among other things, profitability analyses and summaries, revenue and expense schedules by Fund and by function (i.e., investment management, transfer agency and distribution and service) and the Investment Adviser’s expense allocation methodology. They observed that the profitability and expense figures are substantially similar to those used by the Investment Adviser for many internal purposes, including compensation decisions among various business groups, and are thus subject to a vigorous internal debate about how certain revenue and expenses should be allocated. The Trustees also reviewed the report of the internal audit group within the Goldman Sachs organization, which included an assessment of the reasonableness and consistency of the Investment Adviser’s expense allocation methodology and an evaluation of the accuracy of the Investment Adviser’s profitability analysis calculations. Profitability data for the Trust and the Fund were provided for 2012 and 2011, and the Trustees considered this information in relation to the Investment Adviser’s overall profitability. The Trustees considered the Investment Adviser’s revenues and pre-tax profit margins both in absolute terms and in comparison to information on the reported pre-tax profit margins earned by certain other asset management firms.
23
GOLDMAN SACHS VARIABLE INSURANCE TRUST LARGE CAP VALUE FUND
Statement Regarding Basis for Approval of Management Agreement (Unaudited) (continued)
Economies of Scale
The Trustees considered the information that had been provided regarding the Investment Adviser’s profitability. The Trustees also considered the breakpoints in the fee rate payable under the Management Agreement for the Fund at the following annual percentage rates of the average daily net assets of the Fund:
| First $1 billion | 0.75 | % | ||
| Next $1 billion | 0.68 | |||
| Next $3 billion | 0.65 | |||
| Next $3 billion | 0.64 | |||
| Over $8 billion | 0.63 |
The Trustees noted that the breakpoints were meant to share potential economies of scale, if any, with the Fund and its shareholders as assets under management reach those asset levels. The Trustees considered the amounts of assets in the Fund; the Fund’s recent share purchase and redemption activity; the information provided by the Investment Adviser relating to the costs of the services provided by the Investment Adviser and its affiliates and their realized profits; information comparing fee rates charged by the Investment Adviser with fee rates charged to other funds in the peer group; and the Investment Adviser’s undertakings to waive certain fees and limit certain expenses of the Fund that exceed a specified level. Upon reviewing these matters at the Annual Meeting, the Trustees concluded that the fee breakpoints represented a means of assuring that benefits of scalability, if any, would be passed along to shareholders at the specified asset levels. They also noted that the Investment Adviser had passed along savings to shareholders of the Fund, which had asset levels above at least the first breakpoint during the prior fiscal year.
Other Benefits to the Investment Adviser and Its Affiliates
The Trustees also considered the other benefits derived by the Investment Adviser and its affiliates from their relationship with the Fund as stated above, including: (a) transfer agency fees received by Goldman, Sachs & Co. (“Goldman Sachs”); (b) brokerage and futures commissions earned by Goldman Sachs for executing securities and futures transactions on behalf of the Fund; (c) research received by the Investment Adviser from broker-dealers in exchange for executing certain transactions on behalf of the Fund; (d) trading efficiencies resulting from aggregation of orders of the Fund with those for other funds or accounts managed by the Investment Adviser; (e) the Investment Adviser’s ability to leverage the infrastructure designed to service the Fund on behalf of its other clients; (f) the Investment Adviser’s ability to cross-market other products and services to Fund shareholders; (g) Goldman Sachs’ retention of certain fees as Fund Distributor; (h) the Investment Adviser’s ability to negotiate better pricing with custodians on behalf of its other clients, as a result of the relationship with the Fund; and (i) the possibility that the working relationship between the Investment Adviser and the Fund’s third party service providers may cause those service providers to be open to doing business with other areas of Goldman Sachs. In the course of considering the foregoing, the Independent Trustees requested and received further information quantifying certain of these fall-out benefits.
Other Benefits to the Fund and Its Shareholders
The Trustees also noted that the Fund receives certain potential benefits as a result of its relationship with the Investment Adviser, including: (a) trading efficiencies resulting from aggregation of orders of the Fund with those of other funds or accounts managed by the Investment Adviser; (b) improved servicing from vendors because of the volume of business generated by the Investment Adviser and its affiliates; (c) improved servicing from broker-dealers because of the volume of business generated by the Investment Adviser and its affiliates; (d) the Investment Adviser’s ability to negotiate favorable terms with derivatives counterparties as a result of the size and reputation of the Goldman Sachs organization; (e) the Investment Adviser’s knowledge and experience gained from managing other accounts and products; (f) the Investment Adviser’s ability to hire and retain qualified personnel to provide services to the Fund because of the reputation of the Goldman Sachs organization; (g) the Fund’s access, through the Investment Adviser, to certain firmwide resources (e.g., proprietary risk management systems and databases), subject to certain restrictions; and (h) the Fund’s access to certain affiliated distribution channels. The Trustees noted the competitive nature of the mutual fund marketplace, and noted further that many of the Fund’s shareholders invested in the Fund in part because of the Fund’s relationship with the Investment Adviser and that those shareholders have a general expectation that the relationship will continue.
24
GOLDMAN SACHS VARIABLE INSURANCE TRUST LARGE CAP VALUE FUND
Statement Regarding Basis for Approval of Management Agreement (Unaudited) (continued)
Conclusion
In connection with their consideration of the Management Agreement, the Trustees gave weight to each of the factors described above, but did not identify any particular factor as controlling their decision. After deliberation and consideration of all of the information provided, including the factors described above, the Trustees concluded, in the exercise of their business judgment, that the management fees paid by the Fund were reasonable in light of the services provided to it by the Investment Adviser, the Investment Adviser’s costs and the Fund’s current and reasonably foreseeable asset levels. The Trustees unanimously concluded that the Investment Adviser’s continued management likely would benefit the Fund and its shareholders and that the Management Agreement should be approved and continued with respect to the Fund until June 30, 2014.
25
| TRUSTEES | OFFICERS | |
| Ashok N. Bakhru, Chairman | James A. McNamara, President | |
| Donald C. Burke | George F. Travers, Principal Financial Officer | |
| John P. Coblentz, Jr. | Caroline L. Kraus, Secretary | |
| Diana M. Daniels | Scott M. McHugh, Treasurer | |
| Joseph P. LoRusso | ||
| James A. McNamara | ||
| Jessica Palmer | ||
| Alan A. Shuch | ||
| Richard P. Strubel |
GOLDMAN, SACHS & CO.
Distributor and Transfer Agent
GOLDMAN SACHS ASSET MANAGEMENT, L.P.
Investment Adviser
200 West Street, New York
New York 10282
Visit our web site at www.goldmansachsfunds.com/vit to obtain the most recent month-end returns.
The reports concerning the Fund included in this shareholder report may contain certain forward-looking statements about the factors that may affect the performance of the Fund in the future. These statements are based on Fund management’s predictions and expectations concerning certain future events and their expected impact on the Fund, such as performance of the economy as a whole and of specific industry sectors, changes in the levels of interest rates, the impact of developing world events, and other factors that may influence the future performance of the Fund. Management believes these forward-looking statements to be reasonable, although they are inherently uncertain and difficult to predict. Actual events may cause adjustments in portfolio management strategies from those currently expected to be employed.
A description of the policies and procedures that the Fund uses to determine how to vote proxies relating to portfolio securities and information regarding how the Fund voted proxies relating to portfolio securities for the 12-month period ended June 30 is available (i) without charge, upon request by calling 1-800-621-2550; and (ii) on the Securities and Exchange Commission (“SEC”) web site at http://www.sec.gov.
The Fund files its complete schedule of portfolio holdings with the SEC for the first and third quarters of each fiscal year on Form N-Q. The Fund’s Form N-Q is available on the SEC’s web site at http://www.sec.gov within 60 days after the Fund’s first and third fiscal quarters. The Fund’s Forms N-Q may be reviewed and copied at the SEC’s Public Reference Room in Washington, D.C. and information on the operation of the Public Reference Room may also be obtained by calling 1-800-SEC-0330. Forms N-Q may be obtained upon request and without charge by calling 1-800-621-2550.
Holdings and allocations shown are as of June 30, 2013 and may not be representative of future investments. Fund holdings should not be relied on in making investment decisions and should not be construed as research or investment advice regarding particular securities. Current and future holdings are subject to risk.
The Global Industry Classification Standard (“GICS”) was developed by and is the exclusive property and a service mark of Morgan Stanley Capital International Inc. (“MSCI”) and Standard & Poor’s, a division of The McGraw-Hill Companies, Inc. (“S&P”) and is licensed for use by Goldman Sachs. Neither MSCI, S&P nor any other party involved in making or compiling the GICS or any GICS classifications makes any express or implied warranties or representations with respect to such standard or classification (or the results to be obtained by the use thereof), and all such parties hereby expressly disclaim all warranties of originality, accuracy, completeness, merchantability or fitness for a particular purpose with respect to any of such standard or classification. Without limiting any of the foregoing, in no event shall MSCI, S&P, any of their affiliates or any third party involved in making or compiling the GICS or any GICS classifications have any liability for any direct, indirect, special, punitive, consequential or any other damages (including lost profits) even if notified of the possibility of such damages.
The portfolio risk management process includes an effort to monitor and manage risk, but does not imply low risk.
Shares of the Goldman Sachs VIT Funds are offered to separate accounts of participating life insurance companies for the purpose of funding variable annuity contracts and variable life insurance policies. Shares of the Fund are not offered directly to the general public. The variable annuity contracts and variable life insurance policies are described in the separate prospectuses issued by participating insurance companies. You should refer to those prospectuses for information about surrender charges, mortality and expense risk fees and other charges that may be assessed by participating insurance companies under the variable annuity contracts or variable life insurance policies. Such fees or charges, if any, may affect the return you may realize with respect to your investments. Ask your representative for more complete information. Please consider a fund’s objectives, risks and charges and expenses, and read the prospectus carefully before investing. The prospectus contains this and other information about the Fund.
This material is not authorized for distribution to prospective investors unless preceded or accompanied by a current Prospectus or summary prospectus, if applicable. Investors should consider a Fund’s objective, risks, and charges and expenses, and read the summary prospectus, if available, and/or the Prospectus carefully before investing or sending money. The summary prospectus, if available, and the Prospectus contain this and other information about a Fund and may be obtained from your Authorized Institution or from Goldman, Sachs & Co. by calling 1-800-621-2550.
This report is prepared for the general information of contract owners and is not an offer of shares of the Goldman Sachs Variable Insurance Trust: Goldman Sachs Large Cap Value Fund.
© 2013 Goldman Sachs. All rights reserved.
VITLCVSAR13/106795.MF.MED.TMPL/8/2013
Goldman
Sachs Variable Insurance Trust
Goldman Sachs
Mid Cap Value Fund
Semi-Annual Report
June 30, 2013

GOLDMAN SACHS VARIABLE INSURANCE TRUST MID CAP VALUE FUND
Principal Investment Strategies and Risks
This is not a complete list of risks that may affect the Fund. For additional information concerning the risks applicable to the Fund, please see the Fund’s Prospectus.
Shares of the Goldman Sachs Variable Insurance Trust — Goldman Sachs Mid Cap Value Fund are offered to separate accounts of participating life insurance companies for the purpose of funding variable annuity contracts and variable life insurance policies. Shares of the Fund are not offered directly to the general public. The variable annuity contracts and variable life insurance policies are described in the separate prospectuses issued by participating insurance companies. You should refer to those prospectuses for information about surrender charges, mortality and expense risk fees and other charges that may be assessed by participating insurance companies under the variable annuity contracts or variable life insurance policies. Such fees or charges, if any, may affect the return you realize with respect to your investments. Ask your representative for more complete information. Please consider the Fund’s objective, risks and charges and expenses, and read the Prospectus carefully before investing. The Prospectus contains this and other information about the Fund.
The Goldman Sachs Mid Cap Value Fund invests primarily in mid-capitalization U.S. equity investments. The Fund’s equity investments are subject to market risk, which means that the value of the securities in which it invests may go up or down in response to the prospects of individual companies, particular sectors and/or general economic conditions. The securities of mid- and small-capitalization companies involve greater risks than those associated with larger, more established companies and may be subject to more abrupt or erratic price movements. Different investment styles (e.g., “value”) tend to shift in and out of favor, and at times the Fund may underperform other funds that invest in similar asset classes.
1
GOLDMAN SACHS VARIABLE INSURANCE TRUST MID CAP VALUE FUND
INVESTMENT OBJECTIVE
The Fund seeks long-term capital appreciation.
Portfolio Management Discussion and Analysis
Below, the Goldman Sachs Value Portfolio Management Team discusses the Goldman Sachs Variable Insurance Trust — Goldman Sachs Mid Cap Value Fund’s (the “Fund”) performance and positioning for the six-month period ended June 30, 2013 (the “Reporting Period”).
How did the Fund perform during the Reporting Period?
During the Reporting Period, the Fund’s Institutional and Service Shares generated cumulative total returns of 15.39% and 15.24%, respectively. These returns compare to the 16.10% cumulative total return of the Fund’s benchmark, the Russell Midcap® Value Index (with dividends reinvested) (the “Russell Index”), during the same time period.
What economic and market factors most influenced the equity markets as a whole during the Reporting Period?
Representing the U.S. equity market, the S&P® 500 Index gained 13.82% during the Reporting Period, making it the strongest first half since 1998.
U.S. equities, as represented by the S&P® 500 Index, extended their rally from 2012 with a strong first quarter in 2013. Indeed, the S&P® 500 Index finished the first quarter of 2013 with significant gains, making a five-year high during these months. The Dow Jones Industrial Average also hit a new record high during the first calendar quarter.
Despite the overhang of automatic spending cuts, or sequestration, that went into effect in March 2013, U.S. equity markets reflected a variety of improving economic indicators. Strong momentum in the housing market continued, as the Case-Shiller Index of house prices rose 8.1% in January 2013, year-over-year the fastest pace since mid-2006. The employment picture also improved, with the unemployment rate dropping to 7.7%. Strong retail sales suggested consumers may have been feeling the effects of better housing and labor market conditions.
After a strong start to the second quarter of 2013, bullish sentiment began to fade, and the U.S. equity rally halted in mid-May 2013 when Federal Reserve (“Fed”) Chair Ben Bernanke announced the potential “tapering” of the pace of quantitative easing asset purchases. U.S. equity markets reacted negatively again in June to news the slowing of the asset purchase program could begin later this year, with the program ending by the middle of 2014 if the economy grows as expected. U.S. equity markets calmed toward the end of the month as a downward revision of first quarter Gross Domestic Product (“GDP”) from 2.4% to 1.8% supported reassurance from the Fed that it would only begin reducing asset purchases if the economy was clearly on track. Still, the S&P® 500 Index declined modestly in June 2013, ending seven consecutive months of gains and muting returns for the quarter as a whole. Even with that, both the S&P® 500 Index and the Dow Jones Industrial Average made fresh record highs fueled by the continued strong rebound in house prices during the second calendar quarter, and returns for the Reporting Period overall were still significantly up.
For the Reporting Period as a whole, all ten sectors within the S&P® 500 Index posted gains. Health care did best, followed closely by consumer discretionary and financials. Conversely, materials performed worst, as commodity prices were volatile in part due to a slowing Chinese economy. Information technology, utilities, telecommunication services and energy were also comparatively weak, though still producing positive returns.
All segments of the U.S. equity market advanced during the Reporting Period, with small-cap stocks, as measured by the Russell 2000® Index gaining most, followed by mid-cap stocks and then large-cap stocks, as measured by the Russell Midcap® Index and the Russell 1000® Index, respectively. From a style perspective, value-oriented stocks solidly outpaced growth-oriented stocks in the large-cap and mid-cap segments of the U.S. equity market; however, growth stocks substantially outperformed value stocks in the small-cap segment of the U.S. equity market. (All as measured by the Russell Investments indices.)
What key factors were responsible for the Fund’s performance during the Reporting Period?
Stock selection overall had the greatest effect on the Fund’s performance relative to the Russell Index during the Reporting Period.
2
GOLDMAN SACHS VARIABLE INSURANCE TRUST MID CAP VALUE FUND
Which equity market sectors most significantly affected Fund performance?
Detracting from the Fund’s relative results most was stock selection in the information technology, industrials, utilities and consumer discretionary sectors, where company-specific issues weighed on certain holdings. Such detractors were only partially offset by effective stock selection in the energy, health care and financials sectors, which helped the Fund’s performance relative to the Russell Index.
Which stocks detracted significantly from the Fund’s performance during the Reporting Period?
Detracting from the Fund’s results relative to its benchmark index were positions in steel producer Carpenter Technology, semiconductor company Altera and fertilizer producer CF Industries Holdings.
Carpenter Technology was the biggest detractor from the Fund’s results during the Reporting Period. The metal fabricator announced that for its 2013 fiscal year, it expects its earnings to be lower than previously forecasted. At the end of the Reporting Period, we believed the company was well positioned in an industry with high barriers to entry and maintained our conviction in the stock over the long term given what we believe to be the company’s strong growth potential. Carpenter Technology announced the expansion of plant capacity in 2014 to meet increasing demand in a constrained market. In addition, the company’s balance sheet appears attractive, with a low net debt to earnings before interest, taxes, depreciation and amortization ratio and strong free cash flows should capital expenditures ramp down after 2014.
Within the information technology sector, Altera was the top detractor from returns. The global semiconductor company announced results for the first quarter of 2013 that fell short of analyst expectations, and management also provided conservative guidance on earnings prospects ahead. We believe there continued to be a degree of seasonality to forward guidance, and at the end of the Reporting Period, we maintained our conviction in the company over the long term, given we believe the company can continue to gain share against competitors and maintain its strong position in the programmable logic device market. In addition, we expect demand for its products to rise during the second half of 2013, as capital expenditures in the semiconductor industry are anticipated to increase alongside a more favorable macroeconomic environment.
We bought and sold the Fund’s position in CF Industries Holdings during the Reporting Period. Shares of the global manufacturer and distributor of nitrogen and phosphate fertilizer products traded lower following weak planting volumes, negative pressure on fertilizer prices due to excess supply, and a rise in natural gas prices, a fundamental cost component for CF Industries Holdings. Strict to our sell discipline, as a key point to our investment thesis became invalidated, we sold out of the stock in favor of other names with what we considered to have more favorable risk/reward profiles.
What were some of the Fund’s best-performing individual stocks?
The Fund benefited most relative to the Russell Index from positions in Vertex Pharmaceuticals, Aetna and ING U.S.
Vertex Pharmaceuticals was the top contributor to the Fund’s performance during the Reporting Period. Supportive trial data was released on one of its cystic fibrosis drugs in development, causing the company’s shares to spike with the now more likely regulatory approval of the treatment. At the end of the Reporting Period, we believed Vertex Pharmaceuticals had an attractive risk/reward profile and was well positioned to grow its addressable market through its cystic fibrosis franchise. In addition, we believe the value of the company’s hepatitis-C franchise has been underestimated by the market, which could lead to significant upside in its stock. In our view, Vertex Pharmaceuticals has a robust pipeline of new treatments and maintains a healthy balance sheet that could help fund research on additional therapies.
Aetna, a diversified national managed care provider, was also a top contributor to results. During the Reporting Period, the federal government announced an increase of Final Medicare Advantage Rates for 2014, which reversed preliminary proposals for a rate cut announced in February 2013. Having recently acquired Coventry Health Care in an attempt to grow its membership base and increase exposure to higher growth government programs, Aetna’s shares rose following the news. At the end of the Reporting Period, we maintained that the managed care industry should benefit in an environment where there is a growing focus on controlling health care costs and utilization continues to be muted. In addition, we believe synergies from Aetna’s acquisition of Coventry Health Care and its management team’s commitment to returning capital to shareholders should help the company to see operating earnings growth through 2014 and beyond.
3
GOLDMAN SACHS VARIABLE INSURANCE TRUST MID CAP VALUE FUND
We initiated a Fund position in ING U.S., which became publicly available during the Reporting Period as part of a 2008 bailout agreement entered into by its Dutch parent company ING Groep. We believed the offering share price of the life insurance and retirement product provider was attractive given its then-current level of returns. We also believed its management’s expectations for return on equity in 2016 created a favorable risk/reward opportunity. Although ING U.S. reported a first quarter 2013 loss, improvement from its retirement and annuities businesses was viewed positively by investors, driving its shares higher.
How did the Fund use derivatives and similar instruments during the Reporting Period?
During the Reporting Period, we did not use derivatives as part of an active management strategy.
Did the Fund make any significant purchases or sales during the Reporting Period?
In addition to the purchase of ING U.S., mentioned earlier, we initiated a Fund position in Liberty Media during the Reporting Period. Liberty Media engages in a range of media, communications and entertainment businesses. In our view, Liberty Media’s acquisition of a 22% stake in Charter Communications should be an accretive deal for both companies. The deal provides Liberty Media with the right to designate up to four directors for appointment to the Charter Communications board upon the closing of the transaction, and Liberty Media also retains the right to increase its beneficial ownership in Charter Communications up to nearly 40% after January 2016. During the Reporting Period, Liberty Media also announced its intent to acquire Virgin Media. Virgin Media is competitive amongst European peers in terms of technology and broadband service provided. We believe the deal provides Liberty Media with better than expected free cash flows and advantages of larger scale. We maintain a high conviction regarding the management team of Liberty Media based on its proven track record of success.
We sold the Fund’s position in industrial products and equipment manufacturer Dover during the Reporting Period. The company performed well, driven by a combination of its share buyback program and the company divesting its peripheral businesses. In our view, shares had become fairly valued, and we decided to exit the Fund’s position in favor of what we considered to be more attractive opportunities.
We exited the Fund’s position in J.M. Smucker, as the stock approached our price target. J.M. Smucker is widely considered to be a well positioned company in the high margin coffee business, and its shares appreciated largely due to declining coffee prices. As our investment thesis played out, we decided to sell the position in favor of names with what we considered to be a more favorable risk/reward profile.
Were there any notable changes in the Fund’s weightings during the Reporting Period?
In constructing the Fund’s portfolio, we focus on picking stocks rather than on making industry or sector bets. We seek to outpace the benchmark index by overweighting stocks that we believe should outperform and underweighting those that we think may lag. Consequently, changes in its sector weights are generally the direct result of individual stock selection or of stock appreciation or depreciation. That said, during the Reporting Period, the Fund’s exposure to industrials increased compared to the Russell Index. The Fund’s allocation compared to the benchmark index in consumer staples decreased. The Fund’s position in cash also decreased during the Reporting Period.
How was the Fund positioned relative to its benchmark index at the end of the Reporting Period?
At the end of June 2013, the Fund had overweighted positions relative to the Russell Index in the industrials and consumer discretionary sectors. On the same date, the Fund had underweighted positions compared to the Russell Index in consumer staples and financials and was rather neutrally weighted to the Russell Index in energy, health care, information technology, materials and utilities. The Fund had no exposure to telecommunication services at the end of the Reporting Period.
4
GOLDMAN SACHS VARIABLE INSURANCE TRUST MID CAP VALUE FUND
What is the Fund’s tactical view and strategy for the months ahead?
As we enter the second half of 2013, we continue to be constructive on the U.S. equity market. Despite a strong first half of 2013, we believe the case for investing in U.S. equities remains compelling. In our view, at the end of the Reporting Period, valuations were reasonable, as the S&P 500 Index was trading below its historical average price-to-earnings (P/E) multiple and offered a dividend yield of approximately 2%. We believe the strength of corporate balance sheets provides companies with a number of options to enhance shareholder value going forward. Signs of improving U.S. economic growth remained intact at the end of June 2013, supported by a continued recovery in the U.S. housing market and in consumer confidence. However, some headwinds also remained, given market concerns about the Fed tapering asset purchases, rising interest rates, fiscal policy’s drag on economic growth and global economic weakness. We believe it is important to recognize that rising interest rates and advancing equity markets are not necessarily mutually exclusive. We feel equities have the potential to continue to rise in an increasing rate environment driven by improving U.S. economic growth and given that the absolute level of rates still remains low by historical standards. Additional catalysts could be improved sentiment and increased flows into equities.
Our fundamental, bottom-up research process continues to drive our stock selection, while short-term “noise” in the market — headlines or sentiment — enables us to manage position sizes opportunistically. We have high conviction in the companies the Fund owns and believe they have the potential to outperform relative to the broader U.S. equity market regardless of economic growth conditions. As we look ahead to the second half of 2013, we continue to focus on undervalued companies in control of their own destiny, such as innovators with differentiated products in their industry, companies with low cost structures or companies with financial flexibility that have been investing in their own businesses and may be poised to gain market share. We maintain our discipline in seeking to identify companies with strong or improving balance sheets, led by quality management teams and trading at discounted valuations. As always, deep research resources, a forward-looking investment process and truly actively managed portfolios are keys, in our view, to both preserving capital and outperforming the market over the long term.
5
FUND BASICS
Mid Cap Value Fund
as of June 30, 2013
STANDARDIZED TOTAL RETURNS1
| For the period ended 6/30/13 | One Year | Five Years | Ten Years | Since Inception | Inception Date | |||||||||||||
| Institutional | 26.82 | % | 6.91 | % | 10.44 | % | 8.63 | % | 5/01/98 | |||||||||
| Service | 26.55 | 6.64 | N/A | 5.95 | 1/09/06 | |||||||||||||
| 1 | The Standardized Total Returns are average annual total returns as of the most recent calendar quarter-end. They assume reinvestment of all distributions at net asset value (“NAV”). Because Institutional Shares and Service Shares do not involve a sales charge, such a charge is not applied to their Standardized Total Returns. |
Total return figures in the above chart represent past performance and do not indicate future results, which will vary. The investment return and principal value of an investment will fluctuate and, therefore, an investor’s shares, when redeemed, may be worth more or less than their original cost. Current performance may be lower or higher than the total return figures in the above chart. Please visit www.goldmansachsfunds.com/vit to obtain the most recent month-end returns. Performance reflects fee waivers and/or expense limitations in effect during the periods shown. In their absence, performance would be reduced.
EXPENSE RATIOS2
| Net Expense Ratio (Current) | Gross Expense Ratio (Before Waivers) | |||||||
| Institutional | 0.84 | % | 0.87 | % | ||||
| Service | 1.09 | 1.12 | ||||||
| 2 | The expense ratios of the Fund, both current (net of any fee waivers and/or expense limitations) and before waivers (gross of any fee waivers and/or expense limitations) are as set forth above according to the most recent publicly available Prospectus for the Fund and may differ from the expense ratios disclosed in the Financial Highlights of this report. The Fund’s waivers and/or expense limitations will remain in place through at least April 30, 2014, and prior to such date the Investment Adviser may not terminate the arrangements without the approval of the Fund’s Board of Trustees. If these arrangements are discontinued in the future, the expense ratios may change without shareholder approval. |
TOP TEN HOLDINGS AS OF 6/30/133
| Holding | % of Net Assets | Line of Business | ||||
| M&T Bank Corp. | 2.0% | Banks | ||||
| Aetna, Inc. | 1.9 | Health Care Equipment & Services | ||||
| Altera Corp. | 1.8 | Semiconductors & Semiconductor Equipment | ||||
| AvalonBay Communities, Inc. | 1.8 | Real Estate Investment Trust | ||||
| SLM Corp. | 1.6 | Diversified Financials | ||||
| Principal Financial Group, Inc. | 1.6 | Insurance | ||||
| Invesco Ltd. | 1.5 | Diversified Financials | ||||
| Juniper Networks, Inc. | 1.4 | Technology Hardware & Equipment | ||||
| Pioneer Natural Resources Co. | 1.4 | Energy | ||||
| Sempra Energy | 1.3 | Utilities | ||||
| 3 | The top ten holdings may not be representative of the Fund’s future investments. |
6
FUND BASICS
FUND vs. BENCHMARK SECTOR ALLOCATIONS4
As of June 30, 2013
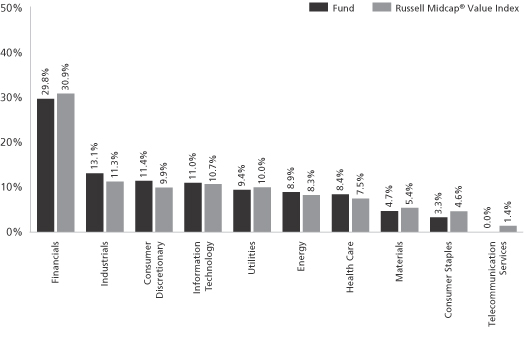
| 4 | The Fund is actively managed and, as such, its composition may differ over time. Consequently, the Fund’s overall sector allocations may differ from percentages contained in the graph above. The graph categorizes investments using Global Industry Classification (“GICS”), however, the sector classifications used by the portfolio management team may differ from GICS. The percentage shown for each investment category reflects the value of investments in that category as a percentage of market value. The graph depicts the Fund’s investments but may not represent the Fund’s market exposure due to the exclusion of certain derivatives, if any, as listed in the Additional Investment section of the Schedule of Investments. |
7
GOLDMAN SACHS VARIABLE INSURANCE TRUST MID CAP VALUE FUND
Schedule of Investments
June 30, 2013 (Unaudited)
| Shares | Description | Value | ||||||
| Common Stocks – 99.6% | ||||||||
| Automobiles & Components – 1.6% |
| ||||||
| 186,889 | Delphi Automotive PLC | $ | 9,473,403 | |||||
| 86,031 | TRW Automotive Holdings Corp.* | 5,715,900 | ||||||
|
| |||||||
| 15,189,303 | ||||||||
|
| |||||||
| Banks – 5.0% |
| ||||||
| 202,290 | CIT Group, Inc.* | 9,432,783 | ||||||
| 162,321 | First Republic Bank | 6,246,112 | ||||||
| 164,851 | M&T Bank Corp. | 18,422,099 | ||||||
| 61,321 | Signature Bank* | 5,090,870 | ||||||
| 242,925 | Zions Bancorporation | 7,015,674 | ||||||
|
| |||||||
| 46,207,538 | ||||||||
|
| |||||||
| Capital Goods – 12.2% |
| ||||||
| 152,109 | Carlisle Companies, Inc. | 9,477,912 | ||||||
| 142,851 | Flowserve Corp. | 7,715,382 | ||||||
| 64,679 | Hubbell, Inc. Class B | 6,403,221 | ||||||
| 151,382 | Jacobs Engineering Group, Inc.* | 8,345,689 | ||||||
| 77,346 | Lennox International, Inc. | 4,991,911 | ||||||
| 281,796 | Owens Corning* | 11,012,588 | ||||||
| 125,502 | Parker Hannifin Corp. | 11,972,891 | ||||||
| 185,473 | Sensata Technologies Holding NV* | 6,473,008 | ||||||
| 156,111 | Stanley Black & Decker, Inc. | 12,067,380 | ||||||
| 304,079 | Textron, Inc. | 7,921,258 | ||||||
| 186,449 | Timken Co. | 10,493,350 | ||||||
| 104,145 | Triumph Group, Inc. | 8,243,077 | ||||||
| 298,787 | Xylem, Inc. | 8,049,322 | ||||||
|
| |||||||
| 113,166,989 | ||||||||
|
| |||||||
| Commercial & Professional Services – 0.8% |
| ||||||
| 181,860 | Waste Connections, Inc. | 7,481,720 | ||||||
|
| |||||||
| Consumer Durables & Apparel – 2.9% |
| ||||||
| 69,669 | PVH Corp. | 8,712,108 | ||||||
| 290,772 | Toll Brothers, Inc.* | 9,487,890 | ||||||
| 74,218 | Whirlpool Corp. | 8,487,571 | ||||||
|
| |||||||
| 26,687,569 | ||||||||
|
| |||||||
| Consumer Services – 1.8% |
| ||||||
| 584,725 | MGM Resorts International* | 8,642,236 | ||||||
| 122,848 | Starwood Hotels & Resorts Worldwide, Inc. | 7,762,765 | ||||||
|
| |||||||
| 16,405,001 | ||||||||
|
| |||||||
| Diversified Financials – 7.2% |
| ||||||
| 424,302 | ING US, Inc.* | 11,481,612 | ||||||
| 428,429 | Invesco Ltd. | 13,624,042 | ||||||
| 170,189 | Lazard Ltd. Class A | 5,471,576 | ||||||
| 197,721 | Northern Trust Corp. | 11,448,046 | ||||||
| 57,680 | Raymond James Financial, Inc. | 2,479,087 | ||||||
| 667,213 | SLM Corp. | 15,252,489 | ||||||
| 209,680 | The NASDAQ OMX Group, Inc. | 6,875,407 | ||||||
|
| |||||||
| 66,632,259 | ||||||||
|
| |||||||
| Energy – 8.9% |
| ||||||
| 147,735 | Cameron International Corp.* | 9,035,473 | ||||||
| 513,638 | Chesapeake Energy Corp. | 10,467,942 | ||||||
| 105,375 | Concho Resources, Inc.* | 8,821,995 | ||||||
|
| |||||||
| Common Stocks – (continued) | ||||||||
| Energy – (continued) |
| ||||||
| 98,977 | EQT Corp. | $ | 7,855,804 | |||||
| 46,425 | HollyFrontier Corp. | 1,986,062 | ||||||
| 60,169 | Oil States International, Inc.* | 5,574,056 | ||||||
| 86,830 | Pioneer Natural Resources Co. | 12,568,643 | ||||||
| 114,432 | Range Resources Corp. | 8,847,882 | ||||||
| 230,474 | Southwestern Energy Co.* | 8,419,215 | ||||||
| 170,911 | Tesoro Corp. | 8,942,064 | ||||||
|
| |||||||
| 82,519,136 | ||||||||
|
| |||||||
| Food, Beverage & Tobacco – 3.3% |
| ||||||
| 155,094 | Constellation Brands, Inc. Class A* | 8,083,499 | ||||||
| 105,869 | Ingredion, Inc. | 6,947,124 | ||||||
| 159,275 | Monster Beverage Corp.* | 9,679,142 | ||||||
| 69,186 | The Hain Celestial Group, Inc.* | 4,495,014 | ||||||
| 32,472 | Tyson Foods, Inc. Class A | 833,881 | ||||||
|
| |||||||
| 30,038,660 | ||||||||
|
| |||||||
| Health Care Equipment & Services – 6.2% |
| ||||||
| 278,437 | Aetna, Inc. | 17,691,887 | ||||||
| 624,001 | Boston Scientific Corp.* | 5,784,489 | ||||||
| 241,486 | Cardinal Health, Inc. | 11,398,139 | ||||||
| 594,157 | Hologic, Inc.* | 11,467,230 | ||||||
| 134,875 | Humana, Inc. | 11,380,753 | ||||||
|
| |||||||
| 57,722,498 | ||||||||
|
| |||||||
| Insurance – 8.3% |
| ||||||
| 74,489 | Everest Re Group Ltd. | 9,553,959 | ||||||
| 698,510 | Genworth Financial, Inc. Class A* | 7,969,999 | ||||||
| 312,168 | Hartford Financial Services Group, Inc. | 9,652,234 | ||||||
| 59,883 | Lincoln National Corp. | 2,183,933 | ||||||
| 12,954 | Markel Corp.* | 6,826,110 | ||||||
| 401,655 | Principal Financial Group, Inc. | 15,041,980 | ||||||
| 173,544 | W.R. Berkley Corp. | 7,091,008 | ||||||
| 224,529 | Willis Group Holdings PLC | 9,156,293 | ||||||
| 299,944 | XL Group PLC | 9,094,302 | ||||||
|
| |||||||
| 76,569,818 | ||||||||
|
| |||||||
| Materials – 4.6% |
| ||||||
| 169,279 | Carpenter Technology Corp. | 7,629,404 | ||||||
| 208,911 | Celanese Corp. Series A | 9,359,213 | ||||||
| 137,611 | International Paper Co. | 6,097,543 | ||||||
| 105,661 | Packaging Corp. of America | 5,173,163 | ||||||
| 149,010 | Reliance Steel & Aluminum Co. | 9,769,096 | ||||||
| 205,841 | Sealed Air Corp. | 4,929,892 | ||||||
|
| |||||||
| 42,958,311 | ||||||||
|
| |||||||
| Media – 1.9% |
| ||||||
| 95,156 | Liberty Media Corp. Series A* | 12,061,975 | ||||||
| 84,465 | Scripps Networks Interactive, Inc. Class A | 5,638,883 | ||||||
|
| |||||||
| 17,700,858 | ||||||||
|
| |||||||
| Pharmaceuticals, Biotechnology & Life Sciences – 2.1% |
| ||||||
| 197,781 | Agilent Technologies, Inc. | 8,457,116 | ||||||
| 232,147 | Mylan, Inc.* | 7,203,521 | ||||||
|
| |||||||
| 8 | The accompanying notes are an integral part of these financial statements. |
GOLDMAN SACHS VARIABLE INSURANCE TRUST MID CAP VALUE FUND
| Shares | Description | Value | ||||||
| Common Stocks – (continued) | ||||||||
| Pharmaceuticals, Biotechnology & Life Sciences – (continued) |
| ||||||
| 46,515 | Vertex Pharmaceuticals, Inc.* | $ | 3,715,153 | |||||
|
| |||||||
| 19,375,790 | ||||||||
|
| |||||||
| Real Estate Investment Trust – 9.2% |
| ||||||
| 132,774 | Alexandria Real Estate Equities, Inc. | 8,725,907 | ||||||
| 122,449 | AvalonBay Communities, Inc. | 16,519,594 | ||||||
| 82,570 | Camden Property Trust | 5,708,890 | ||||||
| 361,181 | DDR Corp. | 6,013,664 | ||||||
| 149,851 | Digital Realty Trust, Inc. | 9,140,911 | ||||||
| 688,153 | MFA Financial, Inc. | 5,814,893 | ||||||
| 249,461 | Starwood Property Trust, Inc. | 6,174,160 | ||||||
| 210,863 | Tanger Factory Outlet Centers, Inc. | 7,055,476 | ||||||
| 85,801 | Taubman Centers, Inc. | 6,447,945 | ||||||
| 657,157 | Two Harbors Investment Corp. | 6,735,859 | ||||||
| 97,589 | Ventas, Inc. | 6,778,532 | ||||||
|
| |||||||
| 85,115,831 | ||||||||
|
| |||||||
| Retailing – 3.2% |
| ||||||
| 8,156 | AutoZone, Inc.* | 3,455,615 | ||||||
| 88,818 | Expedia, Inc. | 5,342,403 | ||||||
| 511,004 | Liberty Interactive Corp. Series A* | 11,758,202 | ||||||
| 184,140 | Macy’s, Inc. | 8,838,720 | ||||||
|
| |||||||
| 29,394,940 | ||||||||
|
| |||||||
| Semiconductors & Semiconductor Equipment – 4.3% |
| ||||||
| 517,026 | Altera Corp. | 17,056,688 | ||||||
| 124,645 | Avago Technologies Ltd. | 4,659,230 | ||||||
| 109,660 | KLA-Tencor Corp. | 6,111,352 | ||||||
| 271,672 | Lam Research Corp.* | 12,045,936 | ||||||
|
| |||||||
| 39,873,206 | ||||||||
|
| |||||||
| Software & Services – 3.1% |
| ||||||
| 130,745 | Computer Sciences Corp. | 5,722,708 | ||||||
| 212,751 | Fidelity National Information Services, Inc. | 9,114,253 | ||||||
| 356,791 | PTC Inc.* | 8,752,083 | ||||||
| 93,277 | Teradata Corp.* | 4,685,304 | ||||||
|
| |||||||
| 28,274,348 | ||||||||
|
| |||||||
| Technology Hardware & Equipment – 3.6% |
| ||||||
| 55,559 | Amphenol Corp. Class A | 4,330,269 | ||||||
| 660,419 | Juniper Networks, Inc.* | 12,752,691 | ||||||
| 248,496 | NetApp, Inc.* | 9,388,179 | ||||||
| 654,710 | Polycom, Inc.* | 6,900,643 | ||||||
|
| |||||||
| 33,371,782 | ||||||||
|
| |||||||
| Utilities – 9.4% |
| ||||||
| 435,400 | Calpine Corp.* | 9,243,542 | ||||||
| 300,749 | CMS Energy Corp. | 8,171,350 | ||||||
| 238,591 | NiSource, Inc. | 6,833,246 | ||||||
| 184,987 | Northeast Utilities | 7,773,154 | ||||||
| 71,636 | OGE Energy Corp. | 4,885,575 | ||||||
| 378,482 | PPL Corp. | 11,452,865 | ||||||
| 227,529 | Questar Corp. | 5,426,567 | ||||||
| 178,168 | SCANA Corp. | 8,748,049 | ||||||
| 149,061 | Sempra Energy | 12,187,228 | ||||||
|
| |||||||
| Common Stocks – (continued) | ||||||||
| Utilities – (continued) |
| ||||||
| 414,509 | Xcel Energy, Inc. | $ | 11,747,185 | |||||
|
| |||||||
| 86,468,761 | ||||||||
|
| |||||||
| TOTAL INVESTMENTS – 99.6% | ||||||||
| (Cost $812,692,747) | $ | 921,154,318 | ||||||
|
| |||||||
| OTHER ASSETS IN EXCESS OF | 3,837,300 | ||||||
|
| |||||||
| NET ASSETS – 100.0% | $ | 924,991,618 | ||||||
|
| |||||||
| The percentage shown for each investment category reflects the value of investments in that category as a percentage of net assets. | ||
| * | Non-income producing security. | |
| The accompanying notes are an integral part of these financial statements. | 9 |
GOLDMAN SACHS VARIABLE INSURANCE TRUST MID CAP VALUE FUND
Statement of Assets and Liabilities
June 30, 2013 (Unaudited)
| Assets: | ||||
Investments, at value (cost $812,692,747) | $ | 921,154,318 | ||
Cash | 10,688,437 | |||
Receivables: | ||||
Investments sold | 18,934,707 | |||
Dividends | 1,542,210 | |||
Fund shares sold | 156,550 | |||
Other assets | 4,688 | |||
| Total assets | 952,480,910 | |||
| Liabilities: | ||||
Payables: | ||||
Investments purchased | 25,895,819 | |||
Fund shares redeemed | 803,282 | |||
Amounts owed to affiliates | 661,016 | |||
Accrued expenses | 129,175 | |||
| Total liabilities | 27,489,292 | |||
| Net Assets: | ||||
Paid-in capital | 794,300,674 | |||
Undistributed net investment income | 7,524,876 | |||
Accumulated net realized gain | 14,704,497 | |||
Net unrealized gain | 108,461,571 | |||
| NET ASSETS | $ | 924,991,618 | ||
Net Assets: | ||||
Institutional | $ | 647,710,793 | ||
Service | 277,280,825 | |||
Total Net Assets | $ | 924,991,618 | ||
Shares of beneficial interest outstanding $0.001 par value (unlimited shares authorized): | ||||
Institutional | 36,609,198 | |||
Service | 15,675,186 | |||
Net asset value, offering and redemption price per share: | ||||
Institutional | $17.69 | |||
Service | 17.69 | |||
| 10 | The accompanying notes are an integral part of these financial statements. |
GOLDMAN SACHS VARIABLE INSURANCE TRUST MID CAP VALUE FUND
Statement of Operations
For the Six Months Ended June 30, 2013 (Unaudited)
| Investment income: | ||||
Dividends | $ | 7,528,302 | ||
| Expenses: | ||||
Management fees | 3,586,327 | |||
Distribution and Service fees — Service Class | 319,698 | |||
Transfer Agent fees(a) | 89,651 | |||
Printing and mailing costs | 75,724 | |||
Custody, accounting and administrative services | 48,235 | |||
Professional fees | 37,751 | |||
Trustee fees | 9,792 | |||
Other | 8,449 | |||
| Total expenses | 4,175,627 | |||
Less — expense reductions | (141,941 | ) | ||
| Net expenses | 4,033,686 | |||
| NET INVESTMENT INCOME | 3,494,616 | |||
| Realized and unrealized gain: | ||||
Net realized gain from investments (including commissions recaptured of $40,741) | 110,569,119 | |||
Net change in unrealized gain on investments | 11,276,544 | |||
| Net realized and unrealized gain | 121,845,663 | |||
| NET INCREASE IN NET ASSETS RESULTING FROM OPERATIONS | $ | 125,340,279 | ||
(a) Institutional and Service Shares had Transfer Agent fees of $64,077 and $25,574, respectively.
| The accompanying notes are an integral part of these financial statements. | 11 |
GOLDMAN SACHS VARIABLE INSURANCE TRUST MID CAP VALUE FUND
Statements of Changes in Net Assets
| For the Six Months Ended June 30, 2013 (Unaudited) | For the Fiscal Year Ended December 31, 2012 | |||||||
| From operations: | ||||||||
Net investment income | $ | 3,494,616 | $ | 9,613,542 | ||||
Net realized gain | 110,569,119 | 52,179,788 | ||||||
Net change in unrealized gain | 11,276,544 | 73,515,221 | ||||||
| Net increase in net assets resulting from operations | 125,340,279 | 135,308,551 | ||||||
| Distributions to shareholders: | ||||||||
From net investment income | ||||||||
Institutional Shares | — | (6,878,541 | ) | |||||
Service Shares | — | (2,044,953 | ) | |||||
| Total distributions to shareholders | — | (8,923,494 | ) | |||||
| From share transactions: | ||||||||
Proceeds from sales of shares | 49,619,734 | 77,172,149 | ||||||
Reinvestment of distributions | — | 8,923,494 | ||||||
Cost of shares redeemed | (73,504,428 | ) | (153,380,419 | ) | ||||
| Net decrease in net assets resulting from share transactions | (23,884,694 | ) | (67,284,776 | ) | ||||
| TOTAL INCREASE | 101,455,585 | 59,100,281 | ||||||
| Net assets: | ||||||||
Beginning of period | 823,536,033 | 764,435,752 | ||||||
End of period | $ | 924,991,618 | $ | 823,536,033 | ||||
| Undistributed net investment income | $ | 7,524,876 | $ | 4,030,260 | ||||
| 12 | The accompanying notes are an integral part of these financial statements. |
GOLDMAN SACHS VARIABLE INSURANCE TRUST MID CAP VALUE FUND
Financial Highlights
Selected Data for a Share Outstanding Throughout Each Period
| Income (loss) from investment operations | Distributions to shareholders | |||||||||||||||||||||||||||||||||||||||||||||||||||||||
| Year - Share Class | Net asset value, beginning of period | Net investment income(a) | Net realized and unrealized gain (loss) | Total from investment operations | From net investment income | From net realized gains | Total distributions | Net asset value, end of period | Total return(b) | Net assets, end of period (in 000s) | Ratio of net expenses to average net assets | Ratio of total expenses to average net assets | Ratio of net investment income to average net assets | Portfolio turnover rate(c) | ||||||||||||||||||||||||||||||||||||||||||
FOR THE SIX MONTHS ENDED JUNE 30, (UNAUDITED) | ||||||||||||||||||||||||||||||||||||||||||||||||||||||||
2013 - Institutional | $ | 15.33 | $ | 0.07 | $ | 2.29 | $ | 2.36 | $ | — | $ | — | $ | — | $ | 17.69 | 15.39 | % | $ | 647,711 | 0.83 | %(d) | 0.86 | %(d) | 0.84 | %(d) | 58 | % | ||||||||||||||||||||||||||||
2013 - Service | 15.35 | 0.05 | 2.29 | 2.34 | — | — | — | 17.69 | 15.24 | 277,281 | 1.08 | (d) | 1.11 | (d) | 0.62 | (d) | 58 | |||||||||||||||||||||||||||||||||||||||
FOR THE FISCAL YEARS ENDED DECEMBER 31, | ||||||||||||||||||||||||||||||||||||||||||||||||||||||||
2012 - Institutional | 13.09 | 0.18 | (e) | 2.24 | 2.42 | (0.18 | ) | — | (0.18 | ) | 15.33 | 18.41 | 601,620 | 0.84 | 0.87 | 1.24 | (e) | 79 | ||||||||||||||||||||||||||||||||||||||
2012 - Service | 13.11 | 0.15 | (e) | 2.23 | 2.38 | (0.14 | ) | — | (0.14 | ) | 15.35 | 18.13 | 221,917 | 1.09 | 1.12 | 1.05 | (e) | 79 | ||||||||||||||||||||||||||||||||||||||
2011 - Institutional | 14.10 | 0.11 | (1.01 | ) | (0.90 | ) | (0.11 | ) | — | (0.11 | ) | 13.09 | (6.38 | ) | 604,797 | 0.85 | 0.86 | 0.81 | 75 | |||||||||||||||||||||||||||||||||||||
2011 - Service | 14.12 | 0.08 | (1.01 | ) | (0.93 | ) | (0.08 | ) | — | (0.08 | ) | 13.11 | (6.59 | ) | 159,638 | 1.10 | 1.11 | 0.61 | 75 | |||||||||||||||||||||||||||||||||||||
2010 - Institutional | 11.35 | 0.08 | 2.76 | 2.84 | (0.09 | ) | — | (0.09 | ) | 14.10 | 25.00 | 769,552 | 0.87 | 0.87 | 0.65 | 88 | ||||||||||||||||||||||||||||||||||||||||
2010 - Service | 11.37 | 0.05 | 2.76 | 2.81 | (0.06 | ) | — | (0.06 | ) | 14.12 | 24.69 | 146,632 | 1.12 | 1.12 | 0.44 | 88 | ||||||||||||||||||||||||||||||||||||||||
2009 - Institutional | 8.66 | 0.14 | (f) | 2.73 | 2.87 | (0.18 | ) | — | (0.18 | ) | 11.35 | 33.15 | 834,376 | 0.86 | 0.86 | 1.46 | (f) | 111 | ||||||||||||||||||||||||||||||||||||||
2009 - Service | 8.68 | 0.12 | (f) | 2.73 | 2.85 | (0.16 | ) | — | (0.16 | ) | 11.37 | 32.78 | 122,402 | 1.11 | 1.11 | 1.21 | (f) | 111 | ||||||||||||||||||||||||||||||||||||||
2008 - Institutional | 14.02 | 0.14 | (g) | (5.34 | ) | (5.20 | ) | (0.14 | ) | (0.02 | ) | (0.16 | ) | 8.66 | (36.97 | ) | 748,682 | 0.84 | 0.84 | 1.16 | (g) | 93 | ||||||||||||||||||||||||||||||||||
2008 - Service | 14.03 | 0.11 | (g) | (5.34 | ) | (5.23 | ) | (0.10 | ) | (0.02 | ) | (0.12 | ) | 8.68 | (37.13 | ) | 111,437 | 1.09 | 1.09 | 0.91 | (g) | 93 | ||||||||||||||||||||||||||||||||||
| (a) | Calculated based on the average shares outstanding methodology. |
| (b) | Assumes investment at the net asset value at the beginning of the period, reinvestment of all distributions, and a complete redemption of the investment at the net asset value at the end of the period. Total returns for periods less than one full year are not annualized. |
| (c) | The Fund’s portfolio turnover rate is calculated in accordance with regulatory requirements, without regard to transactions involving short term investments and certain derivatives. If such transactions were included, the Fund’s portfolio turnover rate may be higher. |
| (d) | Annualized. |
| (e) | Reflects income recognized from special dividends which amounted to $0.04 per share and 0.31% of average net assets. |
| (f) | Reflects income recognized from special dividends which amounted to $0.03 per share and 0.37% of average net assets. |
| (g) | Reflects income recognized from special dividends which amounted to $0.01 per share and 0.11% of average net assets. |
| The accompanying notes are an integral part of these financial statements. | 13 |
GOLDMAN SACHS VARIABLE INSURANCE TRUST MID CAP VALUE FUND
Notes to Financial Statements
June 30, 2013 (Unaudited)
1. ORGANIZATION
Goldman Sachs Variable Insurance Trust (the “Trust” or “VIT”) is a Delaware statutory trust registered under the Investment Company Act of 1940, as amended (the “Act”), as an open-end management investment company. The Trust includes the Goldman Sachs Mid Cap Value Fund (the “Fund”). The Fund is a diversified portfolio under the Act offering two classes of shares — Institutional and Service Shares. Shares of the Trust are offered to separate accounts of participating life insurance companies for the purpose of funding variable annuity contracts and variable life insurance policies.
Goldman Sachs Asset Management, L.P. (“GSAM”), an affiliate of Goldman, Sachs & Co. (“Goldman Sachs”), serves as investment adviser to the Fund pursuant to a management agreement (the “Agreement”) with the Trust.
2. SIGNIFICANT ACCOUNTING POLICIES
The financial statements have been prepared in accordance with accounting principles generally accepted in the United States of America (“GAAP”) and require management to make estimates and assumptions that may affect the reported amounts and disclosures. Actual results may differ from those estimates and assumptions.
A. Investment Valuation — The Fund’s valuation policy is to value investments at fair value.
B. Investment Income and Investments — Investment income includes interest income and dividend income, net of any foreign withholding taxes, less any amounts reclaimable. Interest income is accrued daily and adjusted for amortization of premiums and accretion of discounts. Dividend income is recognized on ex-dividend date or, for certain foreign securities, as soon as such information is obtained subsequent to the ex-dividend date. Investment transactions are reflected on trade date. Realized gains and losses are calculated using identified cost. Investment transactions are recorded on the following business day for daily net asset value (“NAV”) calculations. Any foreign capital gains tax is accrued daily based upon net unrealized gains, and is payable upon sale of such investments. Distributions received from the Fund’s investments in United States (“U.S.”) real estate investment trusts (“REITs”) may be characterized as ordinary income, net capital gain or a return of capital. A return of capital is recorded by the Fund as a reduction to the cost basis of the REIT.
C. Class Allocations and Expenses — Investment income, realized and unrealized gain (loss), and non-class specific expenses of the Fund are allocated daily based upon the proportion of net assets of each class. Class specific expenses, where applicable, are borne by the respective share classes and include Distribution and Service and Transfer Agent fees. Non-class specific expenses directly incurred by a Fund are charged to that Fund, while such expenses incurred by the Trust are allocated across the respective Funds on a straight-line and/or pro-rata basis depending upon the nature of the expenses.
D. Federal Taxes and Distributions to Shareholders — It is the Fund’s policy to comply with the requirements of the Internal Revenue Code of 1986, as amended (the “Code”), applicable to regulated investment companies (mutual funds) and to distribute each year substantially all of its investment company taxable income and capital gains to its shareholders. Accordingly, the Fund is not required to make any provisions for the payment of federal income tax. Distributions to shareholders are recorded on the ex-dividend date. Income and capital gains distributions, if any, are declared and paid annually.
Net capital losses are carried forward to future fiscal years and may be used to the extent allowed by the Code to offset any future capital gains. Utilization of capital loss carryforwards will reduce the requirement of future capital gains distributions.
Under the Regulated Investment Company Modernization Act of 2010, the Fund is permitted to carry forward capital losses incurred in taxable years beginning after December 22, 2010 for an unlimited period. However, any losses incurred during those future taxable years will be required to be utilized prior to the losses incurred in pre-enactment taxable years. As a result of this ordering rule, pre-enactment capital loss carryforwards may be more likely to expire unused. Additionally, post-enactment capital losses that are carried forward will retain their character as either short-term or long-term capital losses rather than being considered all short-term as under previous law.
14
GOLDMAN SACHS VARIABLE INSURANCE TRUST MID CAP VALUE FUND
2. SIGNIFICANT ACCOUNTING POLICIES (continued)
The characterization of distributions to shareholders for financial reporting purposes is determined in accordance with federal income tax rules, which may differ from GAAP. The source of the Fund’s distributions may be shown in the accompanying financial statements as either from net investment income, net realized gain or capital. Certain components of the Fund’s net assets on the Statement of Assets and Liabilities reflect permanent GAAP/tax differences based on the appropriate tax character.
E. Commission Recapture — GSAM, on behalf of the Fund, may direct portfolio trades, subject to seeking best execution, to various brokers who have agreed to rebate a portion of the commissions generated. Such rebates are made directly to the Fund as cash payments and are included in net realized gain (loss) from investments on the Statement of Operations.
3. INVESTMENTS AND FAIR VALUE MEASUREMENTS
The fair value of a financial instrument is the amount that would be received to sell an asset or paid to transfer a liability in an orderly transaction between market participants at the measurement date (i.e., the exit price). GAAP establishes a fair value hierarchy that prioritizes the inputs to valuation techniques used to measure fair value. The hierarchy gives the highest priority to unadjusted quoted prices in active markets for identical assets or liabilities (Level 1 measurements) and the lowest priority to unobservable inputs (Level 3 measurements). The levels used for classifying investments are not necessarily an indication of the risk associated with investing in these investments. The three levels of the fair value hierarchy are described below:
Level 1 — Unadjusted quoted prices in active markets that are accessible at the measurement date for identical, unrestricted assets or liabilities;
Level 2 — Quoted prices in markets that are not active or financial instruments for which significant inputs are observable (including, but not limited to, quoted prices for similar investments, interest rates, foreign exchange rates, volatility and credit spreads), either directly or indirectly;
Level 3 — Prices or valuations that require significant unobservable inputs (including GSAM’s assumptions in determining fair value measurement).
The Trustees have adopted Valuation Procedures that govern the valuation of the portfolio investments held by the Fund, including investments for which market quotations are not readily available. The Trustees have delegated to GSAM day-to-day responsibility for implementing and maintaining internal controls and procedures related to the valuation of the Fund’s portfolio investments. To assess the continuing appropriateness of pricing sources and methodologies, GSAM regularly performs price verification procedures and issues challenges as necessary to third party pricing vendors or brokers, and any differences are reviewed in accordance with the Valuation Procedures.
A. Level 1 and Level 2 Fair Value Investments — The valuation techniques and significant inputs used in determining the fair values for investments classified as Level 1 and Level 2 are as follows:
Equity Securities — Equity securities and investment companies traded on a U.S. securities exchange or the NASDAQ system, or those located on certain foreign exchanges, including but not limited to the Americas, are valued daily at their last sale price or official closing price on the principal exchange or system on which they are traded. If no sale occurs, equity securities and exchange traded investment companies are valued at the last bid price for long positions and at the last ask price for short positions. Investments in investment companies (other than those that are exchange traded) are valued at the NAV on the valuation date. To the extent these investments are actively traded, they are classified as Level 1 of the fair value hierarchy.
Unlisted equity securities for which market quotations are available are valued at the last sale price on the valuation date, or if no sale occurs, at the last bid price. Securities traded on certain foreign securities exchanges are valued daily at fair value determined by an independent fair value service (if available) under Valuation Procedures approved by the Trustees and consistent with applicable regulatory guidance. The independent fair value service takes into account multiple factors including, but not limited to, movements in the securities markets, certain depositary receipts, futures contracts and foreign currency exchange rates
15
GOLDMAN SACHS VARIABLE INSURANCE TRUST MID CAP VALUE FUND
Notes to Financial Statements (continued)
June 30, 2013 (Unaudited)
3. INVESTMENTS AND FAIR VALUE MEASUREMENTS (continued)
that have occurred subsequent to the close of the foreign securities exchange. These investments are generally classified as Level 2 of the fair value hierarchy.
Debt Securities — Debt securities for which market quotations are readily available are valued daily on the basis of quotations supplied by dealers or an independent pricing service approved by the Trustees. The pricing services may use valuation models or matrix pricing, which consider: (i) yield or price with respect to bonds that are considered comparable in characteristics such as rating, interest rate and maturity date or (ii) quotations from securities dealers to determine current value. Short-term debt obligations that mature in sixty days or less and that do not exhibit signs of credit deterioration are valued at amortized cost, which approximates fair value. With the exception of treasury securities, which are generally classified as Level 1, these investments are generally classified as Level 2 of the fair value hierarchy.
B. Level 3 Fair Value Investments — To the extent that the aforementioned significant inputs are unobservable, or if quotations are not readily available, or if GSAM believes that such quotations do not accurately reflect fair value, the fair value of the Fund’s investments may be determined under Valuation Procedures approved by the Trustees. GSAM, consistent with its procedures and applicable regulatory guidance, may make an adjustment to the most recent valuation prices of either domestic or foreign securities in light of significant events to reflect what it believes to be the fair value of the securities at the time of determining a Fund’s NAV. Significant events which could affect a large number of securities in a particular market may include, but are not limited to: significant fluctuations in U.S. or foreign markets; market dislocations; market disruptions; or unscheduled market closings. Significant events which could also affect a single issuer may include, but are not limited to: corporate actions such as reorganizations, mergers and buy-outs; ratings downgrades; and bankruptcies.
C. Fair Value Hierarchy — The following is a summary of the Fund’s investments classified in the fair value hierarchy As of June 30, 2013:
| Investment Type | Level 1 | Level 2 | Level 3 | |||||||||
| Assets | ||||||||||||
| Common Stock and/or Other Equity Investments | $ | 921,154,318 | $ | — | $ | — | ||||||
For further information regarding security characteristics, see the Schedule of Investments.
4. AGREEMENTS AND AFFILIATED TRANSACTIONS
A. Management Agreement — Under the Agreement, GSAM manages the Fund, subject to the general supervision of the Trustees.
As compensation for the services rendered pursuant to the Agreement, the assumption of the expenses related thereto and administration of the Fund’s business affairs, including providing facilities, GSAM is entitled to a management fee, accrued daily and paid monthly, equal to an annual percentage rate of the Fund’s average daily net assets.
For the six months ended June 30, 2013, contractual and effective net management fees with GSAM were at the following rates:
| Contractual Management Fee Rate | ||||||||||||||||||||||
| First $2 billion | Next $3 billion | Next $3 billion | Over $8 billion | Effective Rate | Effective Net Management Fee Rate | |||||||||||||||||
| 0.80% | 0.72 | % | 0.68 | % | 0.67 | % | 0.80 | % | 0.77 | %* | ||||||||||||
| * | GSAM has agreed to waive a portion of its management fee in order to achieve a net management rate, as defined in the Fund’s most recent prospectus. This waiver will be effective through at least April 30, 2014, and prior to such date GSAM may not terminate the arrangement without approval of the Trustees. The Effective Net Management Rate above is calculated based on management rates before and after the waiver had been adjusted, if applicable. For the six months ended June 30, 2013, GSAM waived $134,484 of its management fee. |
16
GOLDMAN SACHS VARIABLE INSURANCE TRUST MID CAP VALUE FUND
4. AGREEMENTS AND AFFILIATED TRANSACTIONS (continued)
B. Distribution and Service Plan — The Trust, on behalf of the Service Shares of the Fund, has adopted a Distribution and Service Plan (the “Plan”). Under the Plan, Goldman Sachs, which serves as distributor (the “Distributor”), is entitled to a fee accrued daily and paid monthly, for distribution services and personal and account maintenance services, which may then be paid by Goldman Sachs to authorized dealers, equal to, on an annual basis, 0.25% of the Fund’s average daily net assets attributable to Service Shares.
C. Transfer Agency Agreement — Goldman Sachs also serves as the transfer agent of the Fund for a fee pursuant to a Transfer Agency Agreement. The fees charged for such transfer agency services are accrued daily and paid monthly at an annual rate of 0.02% of the average daily net assets of Institutional and Service Shares.
D. Other Expense Agreements and Affiliated Transactions — GSAM has agreed to limit certain “Other Expense” of the Fund (excluding transfer agent fees and expenses, taxes, interest, brokerage fees, litigation, indemnification, shareholder meeting and other extraordinary expenses) to the extent such expenses exceed, on an annual basis, a percentage rate of the average daily net assets of the Fund. Such Other Expense reimbursements, if any, are accrued daily and paid monthly. In addition, the Fund is not obligated to reimburse GSAM for prior fiscal year expense reimbursements, if any. The Other Expense limitation as an annual percentage rate of average daily net assets for the Fund is 0.054%. This Other Expense limitation will remain in place through at least April 30, 2014, and prior to such date GSAM may not terminate the arrangements without the approval of the Trustees. For the six months ended June 30, 2013, GSAM did not make any reimbursement to the Fund. In addition, the Fund has entered into certain offset arrangements with the custodian and the transfer agent, which may result in a reduction of the Fund’s expenses and are received irrespective of the application of the “Other Expense” limitation described above. For the six months ended June 30, 2013, custody fee credits were $7,457.
As of June 30, 2013, the amounts owed to affiliates of the Fund were $588,743, $56,982, and $15,291 for management, distribution and service, and transfer agent fees, respectively.
E. Line of Credit Facility — As of June 30, 2013, the Fund participated in a $780,000,000 committed, unsecured revolving line of credit facility (the “facility”) together with other funds of the Trust and registered investment companies having management agreements with GSAM or its affiliates (“Other Borrowers”). Pursuant to the terms of the facility, the Fund and Other Borrowers could increase the credit amount by an additional $220,000,000, for a total of up to $1,000,000,000. This facility is to be used solely for temporary or emergency purposes, which may include the funding of redemptions. The interest rate on borrowings is based on the federal funds rate. The facility also requires a fee to be paid by the Fund based on the amount of the commitment that has not been utilized. For the six months ended June 30, 2013, the Fund did not have any borrowings under the facility. Prior to May 8, 2013, the committed amount available through the facility was to $630,000,000.
F. Other Transactions with Affiliates — For the six months ended June 30, 2013, Goldman Sachs earned $31,750 in brokerage commissions from portfolio transactions on behalf of the Fund.
5. PORTFOLIO SECURITIES TRANSACTIONS
The cost of purchases and proceeds from sales and maturities of long-term securities for the six months ended June 30, 2013, were $516,335,828 and $522,252,294, respectively.
17
GOLDMAN SACHS VARIABLE INSURANCE TRUST MID CAP VALUE FUND
Notes to Financial Statements (continued)
June 30, 2013 (Unaudited)
6. TAX INFORMATION
As of the Fund’s most recent fiscal year end, December 31, 2012, the Fund’s capital loss carryforwards and certain timing differences on a tax-basis were as follows:
| Capital loss carryforwards:(1) | ||||
Expiring 2017 | $ | (91,647,805 | ) | |
| Timing differences (Deferred dividended income) | 223,558 |
| (1) | Expiration occurs on December 31 of the year indicated. |
As of June 30, 2013, the Fund’s aggregate security unrealized gains and losses based on cost for U.S. federal income tax purposes were as follows:
| Tax cost | $ | 816,892,243 | ||
| Gross unrealized gain | 119,921,119 | |||
| Gross unrealized loss | (15,659,044 | ) | ||
| Net unrealized security gain | $ | 104,262,075 |
The difference between GAAP-basis and tax-basis unrealized gains (losses) is attributable primarily to wash sales and differences in the tax treatment of partnership and real estate investment trust investments.
GSAM has reviewed the Fund’s tax positions for all open tax years (the current and prior three years, as applicable) and has concluded that no provision for income tax is required in the Fund’s financial statements. Such open tax years remain subject to examination and adjustment by tax authorities.
7. OTHER RISKS
The Fund’s risks include, but are not limited to, the following:
Shareholder Concentration Risk — Certain funds, accounts, individuals, or Goldman Sachs affiliates may from time to time own (beneficially or of record) or control a significant percentage of the Fund’s shares. Redemptions by these entities of their holdings in the Fund may impact the Fund’s liquidity and NAV. These redemptions may also force the Fund to sell securities.
Liquidity Risk — The Fund may make investments that are illiquid or that may become less liquid in response to market developments or adverse investor perceptions. Illiquid investments may be more difficult to value. Liquidity risk may also refer to the risk that a Fund will not be able to pay redemption proceeds within the allowable time period because of unusual market conditions, an unusually high volume of redemption requests, or other reasons. To meet redemption requests, the Fund may be forced to sell investments at an unfavorable time and/or under unfavorable conditions.
Market and Credit Risks — In the normal course of business, the Fund trades financial instruments and enters into financial transactions where risk of potential loss exists due to changes in the market (market risk). Additionally, the Fund may also be exposed to credit risk in the event that an issuer fails to perform or that an institution or entity with which the Fund has unsettled or open transactions defaults.
18
GOLDMAN SACHS VARIABLE INSURANCE TRUST MID CAP VALUE FUND
8. INDEMNIFICATIONS
Under the Trust’s organizational documents, its Trustees, officers, employees and agents are indemnified, to the extent permitted by the Act and state law, against certain liabilities that may arise out of performance of their duties to the Fund. Additionally, in the course of business, the Fund enters into contracts that contain a variety of indemnification clauses. The Fund’s maximum exposure under these arrangements is unknown, as this would involve future claims that may be made against the Fund that have not yet occurred. However, GSAM believes the risk of loss under these arrangements to be remote.
9. SUBSEQUENT EVENTS
Subsequent events after the Statement of Assets and Liabilities date have been evaluated through the date the financial statements were issued. GSAM has concluded that there is no impact requiring adjustment or disclosure in the financial statements.
10. SUMMARY OF SHARE TRANSACTIONS
Share activity is as follows:
| For the Six Months Ended June 30, 2013 (Unaudited) | For the Fiscal Year Ended December 31, 2012 | |||||||||||||||
| Shares | Dollars | Shares | Dollars | |||||||||||||
| Institutional Shares | ||||||||||||||||
| Shares sold | 985,528 | $ | 16,813,474 | 1,369,746 | $ | 19,890,419 | ||||||||||
| Reinvestment of distributions | — | — | 451,941 | 6,878,541 | ||||||||||||
| Shares redeemed | (3,609,103 | ) | (61,484,253 | ) | (8,781,130 | ) | (127,112,408 | ) | ||||||||
| (2,623,575 | ) | (44,670,779 | ) | (6,959,443 | ) | (100,343,448 | ) | |||||||||
| Service Shares | ||||||||||||||||
| Shares sold | 1,925,365 | 32,806,260 | 3,947,427 | 57,281,730 | ||||||||||||
| Reinvestment of distributions | — | — | 134,183 | 2,044,953 | ||||||||||||
| Shares redeemed | (706,795 | ) | (12,020,175 | ) | (1,801,047 | ) | (26,268,011 | ) | ||||||||
| 1,218,570 | 20,786,085 | 2,280,563 | 33,058,672 | |||||||||||||
| NET DECREASE | (1,405,005 | ) | $ | (23,884,694 | ) | (4,678,880 | ) | $ | (67,284,776 | ) | ||||||
19
GOLDMAN SACHS VARIABLE INSURANCE TRUST MID CAP VALUE FUND
| Fund Expenses — Six Month Period Ended June 30, 2013 (Unaudited) |
As a shareholder of Institutional or Service Shares of the Fund, you incur ongoing costs, including management fees, distribution and service (12b-1) fees (with respect to Service Shares) and other Fund expenses. This example is intended to help you understand your ongoing costs (in dollars) of investing in the Institutional Shares and Service Shares of the Fund and to compare these costs with the ongoing costs of investing in other mutual funds.
The example is based on an investment of $1,000 invested at the beginning of the period and held for the entire period from January 1, 2013 through June 30, 2013.
Actual Expenses — The first line under each share class in the table below provides information about actual account values and actual expenses. You may use the information in this line, together with the amount you invested, to estimate the expenses that you paid over the period. Simply divide your account value by $1,000 (for example, an $8,600 account value divided by $1,000=8.6), then multiply the result by the number in the first line under the heading entitled “Expenses Paid” to estimate the expenses you paid on your account during this period.
Hypothetical Example for Comparison Purposes — The second line under each share class in the table below provides information about hypothetical account values and hypothetical expenses based on the Fund’s actual net expense ratio and an assumed rate of return of 5% per year before expenses, which is not the Fund’s actual return. The hypothetical account values and expenses may not be used to estimate the actual ending account balance or expenses you paid for the period. You may use this information to compare the ongoing costs of investing in the Fund and other funds. To do so, compare this 5% hypothetical example with the 5% hypothetical examples that appear in the shareholder reports of the other funds.
Please note that the expenses shown in the table are meant to highlight your ongoing costs only. As a shareholder of the Fund you do not incur any transaction costs, such as sales charges, redemption fees, or exchange fees, but shareholders of other funds may incur such costs. The second line of the table is useful in comparing ongoing costs only, and will not help you determine the relative total costs of owning different funds whose shareholders may incur transaction costs.
| Share Class | Beginning Account Value 1/01/13 | Ending Account Value 6/30/13 | Expenses Paid for the 6 Months Ended 6/30/13* | |||||||||
| Institutional | ||||||||||||
| Actual | $ | 1,000 | $ | 1,153.90 | $ | 4.43 | ||||||
| Hypothetical 5% return | 1,000 | 1,020.68 | + | 4.16 | ||||||||
| Service | ||||||||||||
| Actual | 1,000 | 1,152.40 | 5.76 | |||||||||
| Hypothetical 5% return | 1,000 | 1,019.44 | + | 5.41 | ||||||||
| * | Expenses are calculated using the Fund’s annualized net expense ratio for each class, which represents the ongoing expenses as a percentage of net assets for the six months ended June 30, 2013. Expenses are calculated by multiplying the annualized net expense ratio by the average account value for the period; then multiplying the result by the number of days in the most recent fiscal half year; and then dividing that result by the number of days in the fiscal year. The annualized net expense ratios for the period were 0.83% and 1.08% for Institutional and Service Shares, respectively. |
| + | Hypothetical expenses are based on the Fund’s actual annualized net expense ratios and an assumed rate of return of 5% per year before expenses. |
20
GOLDMAN SACHS VARIABLE INSURANCE TRUST MID CAP VALUE FUND
Statement Regarding Basis for Approval of Management Agreement (Unaudited) (continued)
Background
The Goldman Sachs Mid Cap Value Fund (the “Fund”) is an investment portfolio of Goldman Sachs Variable Insurance Trust (the “Trust”). The Board of Trustees oversees the management of the Trust and reviews the investment performance and expenses of the Fund at regularly scheduled meetings held during the year. In addition, the Board of Trustees determines annually whether to approve the continuance of the Trust’s investment management agreement (the “Management Agreement”) with Goldman Sachs Asset Management, L.P. (the “Investment Adviser”) on behalf of the Fund.
The Management Agreement was most recently approved for continuation until June 30, 2014 by the Board of Trustees, including those Trustees who are not parties to the Management Agreement or “interested persons” (as defined in the Investment Company Act of 1940, as amended) of any party thereto (the “Independent Trustees”), at a meeting held on June 12-13, 2013 (the “Annual Meeting”).
The review process undertaken by the Trustees spans the course of the year and culminates with the Annual Meeting. To assist the Trustees in their deliberations, the Trustees have established a Contract Review Committee (the “Committee”), comprised of the Independent Trustees. The Committee held four meetings over the course of the year since the Management Agreement was last approved. At those Committee meetings, regularly scheduled Board or other committee meetings and/or the Annual Meeting, the Board, or the Independent Trustees, as applicable, considered matters relating to the Management Agreement, including:
| (a) | the nature and quality of the advisory, administrative and other services provided to the Fund by the Investment Adviser and its affiliates, including information about: |
| (i) | the structure, staff and capabilities of the Investment Adviser and its portfolio management teams; |
| (ii) | the groups within the Investment Adviser and its affiliates that support the portfolio management teams or provide other types of necessary services, including fund services groups (e.g., accounting and financial reporting, tax, shareholder services and operations), controls and risk management groups (e.g., legal, compliance, valuation oversight, credit risk management, internal audit, compliance testing, market risk analysis, finance and strategy and central funding), sales and distribution support groups and others (e.g., information technology and training); |
| (iii) | trends in headcount; |
| (iv) | the Investment Adviser’s financial resources and ability to hire and retain talented personnel and strengthen its operations; and |
| (v) | the parent company’s support of the Investment Adviser and its mutual fund business, as expressed by the firm’s senior management; |
| (b) | information on the investment performance of the Fund, including comparisons to the performance of a group of similar mutual funds, as provided by a third party mutual fund data provider engaged as part of the contract review process (the “Outside Data Provider”), its benchmark performance index, and a comparable institutional composite managed by the Investment Adviser, and general investment outlooks in the markets in which the Fund invests; |
| (c) | the terms of the Management Agreement and agreements with affiliated service providers entered into by the Trust on behalf of the Fund; |
| (d) | expense information for the Fund, including: |
| (i) | the relative management fee and expense level of the Fund as compared to those of comparable funds managed by other advisers, as provided by the Outside Data Provider; |
| (ii) | the Fund’s expense trends over time; and |
| (iii) | to the extent the Investment Adviser manages institutional accounts or collective investment vehicles having investment objectives and policies similar to those of the Fund, comparative information on the advisory fees charged and services provided to those accounts by the Investment Adviser; |
| (e) | with respect to the extensive investment performance and expense comparison data provided by the Outside Data Provider, its processes in producing that data for the Fund; |
| (f) | the undertakings of the Investment Adviser to waive certain fees and limit certain expenses of the Fund that exceed a specified level, and a summary of contractual fee reductions made by the Investment Adviser and its affiliates over the past several years with respect to the Fund; |
| (g) | information relating to the profitability of the Management Agreement and the transfer agency and distribution and service arrangements of the Fund and the Trust as a whole to the Investment Adviser and its affiliates; |
| (h) | whether the Fund’s existing management fee schedule adequately addressed any economies of scale; |
| (i) | a summary of the “fall-out” benefits derived by the Investment Adviser and its affiliates from their relationships with the Fund, including the fees received by the Investment Adviser’s affiliates from the Fund for transfer agency, portfolio trading, distribution and other services; |
21
GOLDMAN SACHS VARIABLE INSURANCE TRUST MID CAP VALUE FUND
Statement Regarding Basis for Approval of Management Agreement (Unaudited) (continued)
| (j) | a summary of potential benefits derived by the Fund as a result of its relationship with the Investment Adviser; |
| (k) | information regarding commissions paid by the Fund and broker oversight, an update on the Investment Adviser’s soft dollars practices, other information regarding portfolio trading and how the Investment Adviser carries out its duty to seek best execution; |
| (l) | the manner in which portfolio manager compensation is determined, and the number and types of accounts managed by the portfolio managers; |
| (m) | the nature and quality of the services provided to the Fund by its unaffiliated service providers, and the Investment Adviser’s general oversight and evaluation (including reports on due diligence) of those service providers as part of the administration services provided under the Management Agreement; and |
| (n) | the Investment Adviser’s processes and policies addressing various types of potential conflicts of interest; its approach to risk management; the annual review of the effectiveness of the Fund’s compliance program; and periodic compliance reports. |
The Trustees also received an overview of the Fund’s distribution arrangements. They received information regarding the Fund’s assets, share purchase and redemption activity and the payment of Rule 12b-1 distribution and service fees by the Fund’s Service Shares. Information was also provided to the Trustees relating to revenue sharing payments made by and services provided by the Investment Adviser and its affiliates to intermediaries that promote the sale, distribution and/or servicing of Fund shares.
The presentations made at the Board and Committee meetings and at the Annual Meeting encompassed the Fund and other mutual fund portfolios for which the Board of Trustees has responsibility. In evaluating the Management Agreement at the Annual Meeting, the Trustees relied upon their knowledge, resulting from their meetings and other interactions throughout the year, of the Investment Adviser, its affiliates, their services and the Fund. In conjunction with these meetings, the Trustees received written materials and oral presentations on the topics covered, and were advised by their independent legal counsel regarding their responsibilities and other regulatory requirements related to the approval and continuation of mutual fund investment management agreements under applicable law. In addition, the Investment Adviser and its affiliates provided the Independent Trustees with a written response to a formal request for information sent on behalf of the Independent Trustees by their independent legal counsel. During the course of their deliberations, the Independent Trustees met in executive sessions with their independent legal counsel, without representatives of the Investment Adviser or its affiliates present. The Independent Trustees also discussed the broad range of other investment choices that are available to Fund investors, including the availability of comparable funds managed by other advisers.
Nature, Extent and Quality of the Services Provided Under the Management Agreement
As part of their review, the Trustees considered the nature, extent and quality of the services provided by the Investment Adviser. In this regard, the Trustees considered both the investment advisory services and non-advisory services that are provided to the Fund by the Investment Adviser and its affiliates. The Trustees noted the transition in the leadership and changes in personnel of various of the Investment Adviser’s portfolio management teams that had occurred in recent periods, and the ongoing recruitment efforts aimed at bringing high quality investment talent to the Investment Adviser. The Trustees concluded that the Investment Adviser continued to commit substantial financial and operational resources to the Fund and expressed confidence that the Investment Adviser would continue to do so in the future. The Trustees also recognized that the Investment Adviser had made significant commitments to address regulatory compliance requirements applicable to the Fund and the Investment Adviser.
Investment Performance
The Trustees also considered the investment performance of the Fund. In this regard, they compared the investment performance of the Fund to its peers using rankings and ratings compiled by the Outside Data Provider as of December 31, 2012, and updated performance information prepared by the Investment Adviser using the peer group identified by the Outside Data Provider as of March 31, 2013. The information on the Fund’s investment performance was provided for the one-, three-, five- and ten-year periods ending on the applicable dates. The Trustees also reviewed the Fund’s investment performance over time (including on a year-by-year basis) relative to its performance benchmark. In addition, they considered the investment performance trends of the Fund over time, and reviewed the investment performance of the Fund in light of its investment objective and policies and market conditions. The Trustees also received information comparing the Fund’s performance to that of a comparable institutional composite managed by the Investment Adviser.
In addition, the Trustees considered materials prepared and presentations made by the Investment Adviser’s senior management and portfolio management personnel, in which Fund performance was assessed. The Trustees also considered the
Investment Adviser’s periodic reports with respect to the Fund’s risk profile, and how the Investment Adviser’s approach to risk monitoring and management influences portfolio management.
22
GOLDMAN SACHS VARIABLE INSURANCE TRUST MID CAP VALUE FUND
Statement Regarding Basis for Approval of Management Agreement (Unaudited) (continued)
The Trustees noted that the Fund’s Service Shares had placed in the top half of the Fund’s peer group for the one- and three-year periods and in the third quartile for the five-year period, and had underperformed the Fund’s benchmark index for the one-, three-, and five-year periods ended March 31, 2013. The Trustees took note of the favorable performance of the Fund’s Service Shares relative to the Fund’s peer group for the one- and three-year periods ended March 31, 2013. They also considered the Investment Adviser’s risk management enhancements, including the addition of certain key hires.
Costs of Services Provided and Competitive Information
The Trustees considered the contractual terms of the Management Agreement and the fee rates payable by the Fund thereunder. In this regard, the Trustees considered information on the services rendered by the Investment Adviser to the Fund, which included both advisory and administrative services that were directed to the needs and operations of the Fund as a registered mutual fund.
In particular, the Trustees reviewed analyses prepared by the Outside Data Provider regarding the expense rankings of the Fund. The analyses provided a comparison of the Fund’s management fees and breakpoints to those of a relevant peer group and a category universe; an expense analysis which compared the Fund’s overall net and gross expenses to a peer group and a category universe; and a five-year history comparing the Fund’s net expenses to the peer and category medians. The analyses also compared the Fund’s transfer agency, custody, and distribution fees, other expenses and fee waivers/reimbursements to those of the peer group and category medians. The Trustees concluded that the comparisons provided by the Outside Data Provider were useful in evaluating the reasonableness of the management fees and total expenses paid by the Fund.
In addition, the Trustees considered the Investment Adviser’s undertakings to waive a portion of its management fee and limit certain expenses of the Fund that exceed a specified level. They also considered, to the extent that the Investment Adviser manages institutional accounts or collective investment vehicles having investment objectives and policies similar to those of the Fund, comparative fee information for services provided by the Investment Adviser to those accounts, and information that indicated that services provided to the Fund differed in various significant respects from the services provided to institutional accounts, which generally operated under less stringent legal and regulatory structures, required fewer services from the Investment Adviser to a smaller number of client contact points, were less time-intensive and paid lower fees.
In addition, the Trustees noted that shareholders are able to redeem their Fund shares at any time if they believe that the Fund fees and expenses are too high or if they are dissatisfied with the performance of the Fund.
Profitability
The Trustees reviewed the Investment Adviser’s revenues and pre-tax profit margins with respect to the Trust and the Fund. In this regard the Trustees noted that they had received, among other things, profitability analyses and summaries, revenue and expense schedules by Fund and by function (i.e., investment management, transfer agency and distribution and service) and the Investment Adviser’s expense allocation methodology. They observed that the profitability and expense figures are substantially similar to those used by the Investment Adviser for many internal purposes, including compensation decisions among various business groups, and are thus subject to a vigorous internal debate about how certain revenue and expenses should be allocated. The Trustees also reviewed the report of the internal audit group within the Goldman Sachs organization, which included an assessment of the reasonableness and consistency of the Investment Adviser’s expense allocation methodology and an evaluation of the accuracy of the Investment Adviser’s profitability analysis calculations. Profitability data for the Trust and the Fund were provided for 2012 and 2011, and the Trustees considered this information in relation to the Investment Adviser’s overall profitability. The Trustees considered the Investment Adviser’s revenues and pre-tax profit margins both in absolute terms and in comparison to information on the reported pre-tax profit margins earned by certain other asset management firms.
Economies of Scale
The Trustees considered the information that had been provided regarding the Investment Adviser’s profitability. The Trustees also considered the breakpoints in the fee rate payable under the Management Agreement for the Fund at the following annual percentage rates of the average daily net assets of the Fund:
| First $2 billion | 0.80 | % | ||
| Next $3 billion | 0.72 | |||
| Next $3 billion | 0.68 | |||
| Over $8 billion | 0.67 |
23
GOLDMAN SACHS VARIABLE INSURANCE TRUST MID CAP VALUE FUND
Statement Regarding Basis for Approval of Management Agreement (Unaudited) (continued)
The Trustees noted that the breakpoints were meant to share potential economies of scale, if any, with the Fund and its shareholders as assets under management reach those asset levels. The Trustees considered the amounts of assets in the Fund; the Fund’s recent share purchase and redemption activity; the information provided by the Investment Adviser relating to the costs of the services provided by the Investment Adviser and its affiliates and their realized profits; information comparing fee rates charged by the Investment Adviser with fee rates charged to other funds in the peer group; and the Investment Adviser’s undertakings to waive certain fees and limit certain expenses of the Fund that exceed a specified level. Upon reviewing these matters at the Annual Meeting, the Trustees concluded that the fee breakpoints represented a means of assuring that benefits of scalability, if any, would be passed along to shareholders at the specified asset levels.
Other Benefits to the Investment Adviser and Its Affiliates
The Trustees also considered the other benefits derived by the Investment Adviser and its affiliates from their relationship with the Fund as stated above, including: (a) transfer agency fees received by Goldman, Sachs & Co. (“Goldman Sachs”); (b) brokerage and futures commissions earned by Goldman Sachs for executing securities and futures transactions on behalf of the Fund; (c) research received by the Investment Adviser from broker-dealers in exchange for executing certain transactions on behalf of the Fund; (d) trading efficiencies resulting from aggregation of orders of the Fund with those for other funds or accounts managed by the Investment Adviser; (e) the Investment Adviser’s ability to leverage the infrastructure designed to service the Fund on behalf of its other clients; (f) the Investment Adviser’s ability to cross-market other products and services to Fund shareholders; (g) Goldman Sachs’ retention of certain fees as Fund Distributor; (h) the Investment Adviser’s ability to negotiate better pricing with custodians on behalf of its other clients, as a result of the relationship with the Fund; and (i) the possibility that the working relationship between the Investment Adviser and the Fund’s third party service providers may cause those service providers to be open to doing business with other areas of Goldman Sachs. In the course of considering the foregoing, the Independent Trustees requested and received further information quantifying certain of these fall-out benefits.
Other Benefits to the Fund and Its Shareholders
The Trustees also noted that the Fund receives certain potential benefits as a result of its relationship with the Investment Adviser, including: (a) trading efficiencies resulting from aggregation of orders of the Fund with those of other funds or accounts managed by the Investment Adviser; (b) improved servicing from vendors because of the volume of business generated by the Investment Adviser and its affiliates; (c) improved servicing from broker-dealers because of the volume of business generated by the Investment Adviser and its affiliates; (d) the Investment Adviser’s ability to negotiate favorable terms with derivatives counterparties as a result of the size and reputation of the Goldman Sachs organization; (e) the Investment Adviser’s knowledge and experience gained from managing other accounts and products; (f) the Investment Adviser’s ability to hire and retain qualified personnel to provide services to the Fund because of the reputation of the Goldman Sachs organization; (g) the Fund’s access, through the Investment Adviser, to certain firmwide resources (e.g., proprietary risk management systems and databases), subject to certain restrictions; and (h) the Fund’s access to certain affiliated distribution channels. The Trustees noted the competitive nature of the mutual fund marketplace, and noted further that many of the Fund’s shareholders invested in the Fund in part because of the Fund’s relationship with the Investment Adviser and that those shareholders have a general expectation that the relationship will continue.
Conclusion
In connection with their consideration of the Management Agreement, the Trustees gave weight to each of the factors described above, but did not identify any particular factor as controlling their decision. After deliberation and consideration of all of the information provided, including the factors described above, the Trustees concluded, in the exercise of their business judgment, that the management fees paid by the Fund were reasonable in light of the services provided to it by the Investment Adviser, the Investment Adviser’s costs and the Fund’s current and reasonably foreseeable asset levels. The Trustees unanimously concluded that the Investment Adviser’s continued management likely would benefit the Fund and its shareholders and that the Management Agreement should be approved and continued with respect to the Fund until June 30, 2014.
24
| TRUSTEES | OFFICERS | |
| Ashok N. Bakhru, Chairman | James A. McNamara, President | |
| Donald C. Burke | George F. Travers, Principal Financial Officer | |
| John P. Coblentz, Jr. | Caroline L. Kraus, Secretary | |
| Diana M. Daniels | Scott M. McHugh, Treasurer | |
| Joseph P. LoRusso | ||
| James A. McNamara | ||
| Jessica Palmer | ||
| Alan A. Shuch | ||
| Richard P. Strubel |
GOLDMAN, SACHS & CO.
Distributor and Transfer Agent
GOLDMAN SACHS ASSET MANAGEMENT, L.P.
Investment Adviser
200 West Street, New York
New York 10282
Visit our web site at www.goldmansachsfunds.com/vit to obtain the most recent month-end returns.
The reports concerning the Fund included in this shareholder report may contain certain forward-looking statements about the factors that may affect the performance of the Fund in the future. These statements are based on Fund management’s predictions and expectations concerning certain future events and their expected impact on the Fund, such as performance of the economy as a whole and of specific industry sectors, changes in the levels of interest rates, the impact of developing world events, and other factors that may influence the future performance of the Fund. Management believes these forward-looking statements to be reasonable, although they are inherently uncertain and difficult to predict. Actual events may cause adjustments in portfolio management strategies from those currently expected to be employed.
A description of the policies and procedures that the Fund uses to determine how to vote proxies relating to portfolio securities and information regarding how the Fund voted proxies relating to portfolio securities for the 12-month period ended December 31 is available (i) without charge, upon request by calling 1-800-621-2550; and (ii) on the Securities and Exchange Commission (“SEC”) web site at http://www.sec.gov.
The Fund files its complete schedule of portfolio holdings with the SEC for the first and third quarters of each fiscal year on Form N-Q. The Fund’s Form N-Q is available on the SEC’s web site at http://www.sec.gov within 60 days after the Fund’s first and third fiscal quarters. The Fund’s Forms N-Q may be reviewed and copied at the SEC’s Public Reference Room in Washington, D.C. and information on the operation of the Public Reference Room may also be obtained by calling 1-800-SEC-0330. Forms N-Q may be obtained upon request and without charge by calling 1-800-621-2550.
Holdings and allocations shown are as of June 30, 2013 and may not be representative of future investments. Fund holdings should not be relied on in making investment decisions and should not be construed as research or investment advice regarding particular securities. Current and future holdings are subject to risk.
The Global Industry Classification Standard (“GICS”) was developed by and is the exclusive property and a service mark of Morgan Stanley Capital international Inc. (“MSCI”) and Standard & Poor’s, a division of The McGraw-Hill Companies, Inc. (“S&P”) and is licensed for use by Goldman Sachs. Neither MSCI, S&P nor any other party involved in making or compiling the GICS or any GICS classifications makes any express or implied warranties or representations with respect to such standard or classification (or the results to be obtained by the use thereof), and all such parties hereby expressly disclaim all warranties of originality, accuracy, completeness, merchantability or fitness for a particular purpose with respect to any of such standard or classification. Without limiting any of the foregoing, in no event shall MSCI, S&P, any of their affiliates or any third party involved in making or compiling the GICS or any GICS classifications have any liability for any direct, indirect, special, punitive, consequential or any other damages (including lost profits) even if notified of the possibility of such damages.
The portfolio risk management process includes an effort to monitor and manage risk, but does not imply low risk.
Shares of the Goldman Sachs VIT Funds are offered to separate accounts of participating life insurance companies for the purpose of funding variable annuity contracts and variable life insurance policies. Shares of the Fund are not offered directly to the general public. The variable annuity contracts and variable life insurance policies are described in the separate prospectuses issued by participating insurance companies. You should refer to those prospectuses for information about surrender charges, mortality and expense risk fees and other charges that may be assessed by participating insurance companies under the variable annuity contracts or variable life insurance policies. Such fees or charges, if any, may affect the return you may realize with respect to your investments. Ask your representative for more complete information. Please consider a fund’s objectives, risks and charges and expenses, and read the prospectus carefully before investing. The prospectus contains this and other information about the Fund.
This material is not authorized for distribution to prospective investors unless preceded or accompanied by a current Prospectus or summary prospectus, if applicable. Investors should consider a Fund’s objective, risks, and charges and expenses, and read the summary prospectus, if available, and/or the Prospectus carefully before investing or sending money. The summary prospectus, if available, and the Prospectus contain this and other information about a Fund and may be obtained from your Authorized Institution or from Goldman, Sachs & Co. by calling 1-800-621-2550.
This report is prepared for the general information of contract owners and is not an offer of shares of the Goldman Sachs Variable Insurance Trust: Goldman Sachs Mid Cap Value Fund.
© 2013 Goldman Sachs. All rights reserved.
VITMCVSAR13/106652.MF.MED.TMPL/8/2013
Goldman
Sachs Variable Insurance Trust
Goldman Sachs
Money Market Fund
Semi-Annual Report
June 30, 2013

GOLDMAN SACHS VARIABLE INSURANCE TRUST MONEY MARKET FUND
Principal Investment Strategies and Risks
This is not a complete list of risks that may affect the Fund. For additional information concerning the risks applicable to the Fund, please see the Fund’s Prospectus.
Shares of the Goldman Sachs Variable Insurance Trust — Goldman Sachs Money Market Fund are offered to separate accounts of participating life insurance companies for the purpose of funding variable annuity contracts and variable life insurance policies. Shares of the Fund are not offered directly to the general public. The variable annuity contracts and variable life insurance policies are described in the separate prospectuses issued by participating insurance companies. You should refer to those prospectuses for information about surrender charges, mortality and expense risk fees and other charges that may be assessed by participating insurance companies under the variable annuity contracts or variable life insurance policies. Such fees or charges, if any, may affect the return you realize with respect to your investments. Ask your representative for more complete information. Please consider the Fund’s objective, risks and charges and expenses, and read the Prospectus carefully before investing. The Prospectus contains this and other information about the Fund.
The Goldman Sachs Money Market Fund seeks to maximize current income to the extent consistent with the preservation of capital and the maintenance of liquidity by investing exclusively in high quality money market instruments. The Fund pursues its investment objective by investing in U.S. Government Securities (as defined in the Fund’s prospectus), obligations of U.S. banks, commercial paper and other short-term obligations of U.S. companies, states, municipalities and other entities and repurchase agreements. The Fund may also invest in U.S. dollar-denominated obligations of foreign banks, foreign companies and foreign governments.
An investment in the Fund is neither insured nor guaranteed by the Federal Deposit Insurance Corporation or any other government agency. Although the Fund seeks to preserve the value of an investment at $1.00 per share, it is possible to lose money by investing in the Fund.
1
GOLDMAN SACHS VARIABLE INSURANCE TRUST MONEY MARKET FUND
INVESTMENT OBJECTIVE
The Fund seeks to maximize current income to the extent consistent with the preservation of capital and the maintenance of liquidity by investing exclusively in high quality money market instruments.
Portfolio Management Discussion and Analysis
Below, the Goldman Sachs Money Market Portfolio Management Team discusses the Goldman Sachs Variable Insurance Trust — Goldman Sachs Money Market Fund’s (the “Fund”) performance and positioning for the six-month period ended June 30, 2013 (the “Reporting Period”).
How did the Fund perform during the Reporting Period?
The Fund’s standardized 7-day current yield was 0.00% and its standardized 7-day effective yield was also 0.00% as of June 30, 2013. The Fund’s one-month simple average yield was 0.01% as of June 30, 2013. The Fund’s 7-day distribution yield as of June 30, 2013 was 0.01%.
The yields represent past performance. Past performance does not guarantee future results. Current performance may be lower or higher than the performance quoted above. Please visit www.goldmansachsfunds.com to obtain the most recent month-end performance.
Yields will fluctuate as market conditions change.
What economic and market factors most influenced the money markets as a whole during the Reporting Period?
The Reporting Period was one wherein global monetary policy stimulus helped assuage investors’ concerns about the slow-moving U.S. economy and the potential for a financial crisis in the Eurozone. Fiscal policy, global market volatility, Federal Reserve Board (“Fed”) policy and supply/demand conditions within the repurchase agreement and U.S. Treasury securities markets combined to keep money market yields lower during the Reporting Period.
Macroeconomic data, as well as the trajectory of global economic growth, was mostly positive, with global growth momentum picking up toward the end of the Reporting Period. European data improved, with very modest increases in the Eurozone’s Purchasing Managers Index (“PMI”) numbers and accelerating expansion in the U.K. Japan’s economy continued to respond broadly positively to its government and central bank policies. Japan’s Gross Domestic Product (“GDP”) rose 4.1% on an annualized basis in the first quarter of 2013. U.S. economic data remained in focus as a key determinant of the policy outlook.
During the first quarter of 2013, U.S. economic data softened somewhat, despite a strong housing sector. Fourth quarter 2012 GDP was much weaker than expected, at -0.1% on the quarter versus the consensus expectation of +1.1%. The contraction was driven by weaker federal defense spending and inventory accumulation, with the former related to the expectation of automatic cuts under the sequester and the latter likely impacted by Hurricane Sandy. While the first revision showed real GDP for the fourth quarter of 2012 up to +0.1%, this was still below revised consensus expectations of +0.5%, as government spending and business inventories continued to be large drags on growth. The U.S. economy added an average of 207,000 jobs over the first quarter of 2013, and the U.S. unemployment rate slid to 7.6%. Additionally, housing sector data continued to beat expectations, with national house prices up 8.1% in January 2013, according to the latest Case-Shiller report. The positive trends in labor market and housing data fueled early debate about the possibility the Fed may choose to wind down its asset purchases under its quantitative easing program, dubbed QE3, earlier than anticipated.
Conversely, the Eurozone economy showed further signs of weakening during the first quarter of 2013. The composite PMI, measuring manufacturing and services sector activity, slid further below the 50 threshold separating expansion from contraction to 46.5. Following several months of strong German economic data, IFO Institute for Economic Research and jobs numbers weakened in March 2013. (IFO Institute for Economic Research is a Munich-based research organization; IFO is an acronym for Information and Forschung (research).) The IFO headline reading for business sentiment fell to 106.7 from 107.4 in February 2013. Germany’s manufacturing reading dipped into contraction, at 49. Eurozone unemployment remained at a record 12%. Italy’s elections drove volatility in global markets, as the Center-Left’s failure to gain a majority in the Upper House raised concerns about the prospects for a stable coalition government. Independent ratings agency Fitch downgraded Italy’s sovereign rating by one notch in March
2
GOLDMAN SACHS VARIABLE INSURANCE TRUST MONEY MARKET FUND
2013, from A- to BBB+, citing political uncertainty. Later in the month, European leaders agreed to a €10 billion rescue for Cyprus. The deal involved the closure of Laiki Bank and the restructure of Bank of Cyprus, the country’s largest bank. The deal insured only deposits under €100 thousand, and Cypriot officials imposed capital controls to limit withdrawals and international transfers.
The second quarter of 2013 saw heightened volatility in interest rates in anticipation of the Fed reducing asset purchases later this year. Benchmark yields in the U.S., Europe and Japan rose substantially. In his mid-May 2013 testimony to Congress, Fed Chair Bernanke said the U.S. central bank could begin reducing asset purchases in the next few meetings. According to Mr. Bernanke, the case for the “taper” is supported by more positive economic reports, including better payrolls, consumer confidence and housing data. The Fed meeting and press conference in June 2013 were more hawkish than markets expected, resulting in a sell-off in both U.S. Treasuries and what are considered risk assets as well as a significant tightening in financial conditions as investors anticipated the potentially earlier end to accommodative monetary policy. The Fed increased its expectations for 2014 and 2015 GDP growth and reduced its unemployment rate forecasts, which resulted in the 6.5% threshold moving into the lower boundary of its 2014 forecast. While inflation expectations were also lowered for 2013, the Fed was largely dismissive of recent softening in inflation, with Bernanke noting it partly reflected “transitory influences.” The U.S. nonfarm payrolls report was stronger than expected again in June 2013, with 195,000 new jobs for the month and an average of 196,000 jobs over the second calendar quarter. The latest Case-Shiller index showed national house prices up 2.5% on the month in April 2013, the biggest monthly gain in the index’s history. The U.S. Conference Board consumer confidence index jumped to 81.4 in June 2013, the highest level since January 2008.
European peripherals performed well despite weaker economic data. Italian President Giorgio Napolitano was re-elected and Enrico Letta was named as Prime Minister, easing political uncertainty in Italy. The European Central Bank (“ECB”) cut its main policy rate by 25 basis points to a record low 0.50% in May, citing weak growth and slowing inflation. (A basis point is 1/100th of a percentage point.) While the move was widely anticipated, markets reacted to the ECB’s suggestion it could cut the deposit rate to negative. The Eurozone’s composite PMI of manufacturing and services sector activity rose to 48.7 in June 2013, though the sub-50 reading still indicated contraction. Eurozone unemployment remained at a record high above 12%, with youth unemployment close to 24%. May 2013 consumer prices data showed Eurozone inflation picking up to 1.6% on the year, from 1.4% in May 2013. However, this reading was still well below the ECB’s target of just below 2%, and the core rate, which excludes volatile food and energy prices, held steady at 1.2%.
In April 2013, the Bank of Japan (“BoJ”) announced surprisingly aggressive new easing measures in its first policy meeting since the induction of Governor Haruhiko Kuroda and deputies Kazumasa Iwata and Hiroshi Nakaso. BoJ governors signaled an aggressive policy shift with the announcement of a two-year time horizon to get inflation up to its 2% target. Measures to help the bank achieve this rate included an increase in Japanese government bond (“JGB”) purchases from ¥4 trillion to ¥7 trillion per month as well as an expansion of its riskier asset holdings through additional purchases of exchange-traded funds (“ETFs”) and real estate investment trusts (“REITs”).
Finally, it is important to note there were a number of significant developments on the money market reform front during the Reporting Period. On June 5, 2013, the Securities and Exchange Commission (“SEC”) unanimously voted to release for public comment two primary proposals for amendments, or “alternative proposals”, to SEC Rule 2a-7, which regulates most money market funds. The proposals could be adopted alone or in combination. The proposed rule release did not constitute a final rule. Indeed, it may well take many months, if not years, before implementation of any changes.
Alternative one would require prime “institutional” money market funds to operate with a floating net asset value (“NAV”), rather than the current $1.00 stable share price. Alternative two would allow money market funds to continue to operate with a stable share price but would generally require the use of liquidity fees and permit redemption gates in times of stress. If the SEC combined both alternative proposals, prime institutional funds could be required to operate with a floating NAV, and all funds other than government money market funds could be able to impose liquidity fees or redemption gates in certain circumstances. The SEC also recommended additional proposals, including stress testing, diversification and disclosure measures that would be applied regardless of which of the two alternative proposals were adopted.
Following the 90-day comment period, the SEC will consider public feedback and, if it determines to pursue a final rule, draft a final rule. The SEC would need three of five Commissioners to approve a final rule before it could be released publicly. In a final rule release, the SEC would specify an implementation timeline for any new requirements. The SEC indicated that implementation of the rule proposal would occur in stages, and the process could take from nine months to two years, depending on the particular proposal, from the date the rule is finally adopted. For further details on the rule proposals, see http://www.sec.gov/rules/proposed/2013/33-9408.pdf .
3
GOLDMAN SACHS VARIABLE INSURANCE TRUST MONEY MARKET FUND
What key factors were responsible for the Fund’s performance during the Reporting Period?
The Fund’s yields remained low during the Reporting Period due primarily to the market factors discussed above. With the targeted federal funds rate near zero throughout the Reporting Period and no immediate indication of this changing despite the continued rhetoric from the Fed on moderating the monthly pace of asset purchases, money market yields were anchored near the same level with little difference between maturities. Further, the money market yield curve, or spectrum of maturities, was extremely flat during the Reporting Period.
That said, the Fund’s strategy differed between the first and second quarters of 2013. During the first quarter of 2013, repurchase agreement (“repo”) rates averaged more than 15 basis points. This provided us with opportunities to extend the Fund’s weighted average maturity at the longest end of the money market yield curve, positioning the Fund’s portfolio in a barbelled manner, wherein we invested primarily in overnight repurchase agreements and in securities with one-year maturities. The main factor driving the flatter money market yield curve during the first quarter of 2013 was higher than anticipated U.S. Treasury security supply, particularly in the U.S. Treasury bill market.
As we entered the second quarter of 2013, seasonal supply decreases in U.S. Treasury bill issuance were exacerbated by stronger than expected tax receipts. These factors, along with a more pronounced effect from the ongoing quantitative easing program from the Fed, caused repo rates to move lower and the longer end of the money market yield curve to rally as well. As a result of this change in supply and subsequent yield curve moves, we altered our Fund strategy to a more laddered approach, shifting some cash from what we considered to be the very expensive overnight sector into the three-month and four-month maturity sectors of the yield curve. We also allowed our longer-dated positions to roll down the yield curve.
The Fund’s weighted average maturity throughout the first half of 2013, regardless of the barbelled or laddered strategies being implemented, remained in the 30 to 55 day range.
We felt comfortable that the Fund was appropriately positioned given the interest rate environment during the Reporting Period. While conditions over the first half of 2013 did not provide bountiful opportunities to pick up yield, as the interest rate yield curve was fairly flat throughout, it should be noted that regardless of interest rate conditions, we manage the Fund consistently. Our investment approach has always been tri-fold — to seek preservation of capital, daily liquidity and maximization of yield potential. We manage interest and credit risk daily. Whether interest rates are historically low, high or in-between, we intend to continue to use our actively managed approach to seek to provide the best possible return within the framework of the Fund’s guidelines and objectives.
How did you manage the Fund’s weighted average maturity during the Reporting Period?
On December 31, 2012, the Fund’s weighted average maturity was 50 days. During the first quarter of 2013, we maintained the Fund’s weighted average maturity in a 30 to 55 day range. During the second quarter of 2013, we maintained the Fund’s weighted average maturity in a 40 to 55 day range. Throughout, we made adjustments in line with our outlook on interest rates, Fed policy and the shape of the yield curve over the near term. The Fund’s weighted average maturity on June 30, 2013 was 49 days. The weighted average maturity of a money market fund is a measure of its price sensitivity to changes in interest rates. Also known as effective maturity, weighted average maturity measures the weighted average of the maturity date of bonds held by the Fund taking into consideration any available maturity shortening features.
How did you manage the Fund’s weighted average life during the Reporting Period?
The weighted average life of the Fund was 82 days as of June 30, 2013. The weighted average life of a money market fund is a measure of a money market fund’s price sensitivity to changes in liquidity and/or credit risk.
Under amendments to SEC Rule 2a-7 that became effective in May 2010, the maximum allowable weighted average life of a money market fund is 120 days. While one of the goals of the SEC’s money market fund rule is to reinforce conservative investment practices across the money market fund industry, our security selection process has long emphasized conservative investment choices.
How was the Fund invested during the Reporting Period?
The Fund had investments in commercial paper, asset-backed commercial paper, U.S. Treasury securities, government agency securities, repurchase agreements, government guaranteed paper and certificates of deposit during the Reporting Period. We focused on securities across the maturity spectrum, from overnight repurchase agreements to securities with one-year maturities. We preferred secured positions to unsecured positions. We particularly made purchases in longer-dated agencies during the Reporting Period when prices declined and we had the opportunity to lock in the higher yields then available.
4
GOLDMAN SACHS VARIABLE INSURANCE TRUST MONEY MARKET FUND
With yields bound near zero, there was not a lot of dispersion in performance among securities available for purchase. Throughout, though, we stayed true to our investment discipline, favoring liquidity and high quality credits over added yield. The primary focal points for our team are consistently managing interest rate risk and credit risk. We were able to navigate interest rate risk by adjusting the Fund’s weighted average maturity longer or shorter as market conditions shifted and to mitigate potential credit risk by buying high quality, creditworthy names, strategies which added to the Fund’s performance during the Reporting Period.
Did you make any changes in the Fund’s portfolio during the Reporting Period?
We did not make any significant changes in the Fund’s portfolio during the Reporting Period. As indicated earlier, we made adjustments to the Fund’s weighted average maturity based on then-current market conditions, our near-term view, and anticipated and actual Fed monetary policy statements.
What is the Fund’s tactical view and strategy for the months ahead?
In our view, interest rates are likely to remain low at least through late 2015 or early 2016, with the Fed holding the targeted federal funds rate near zero. Although money market investment flows appear to have stabilized, we expect to keep the Fund conservatively positioned as we continue to focus on preservation of capital and daily liquidity. We do not believe there is value in sacrificing liquidity in exchange for opportunities that only modestly increase yield potential. We will continue to use our actively managed approach to seek the best possible return within the framework of the Fund’s investment guidelines and objectives. In addition, we will continue to manage interest, liquidity and credit risk daily.
We will, of course, continue to closely monitor economic data, Fed policy, and any shifts in the money market yield curve, as we strive to strategically navigate the interest rate environment.
5
FUND BASICS
SECTOR ALLOCATION†
Security Type
(Percentage of Net Assets)
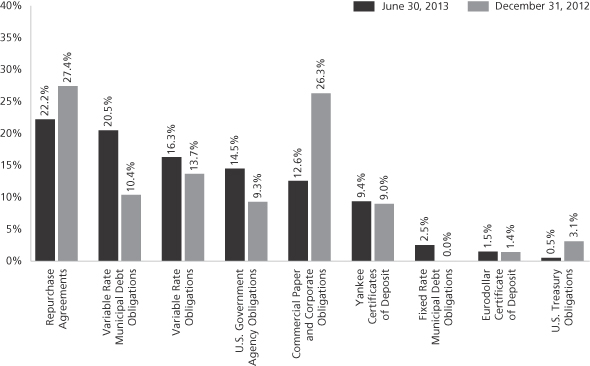
| † | The Fund is actively managed and, as such, its portfolio composition may differ over time. The percentage shown for each investment category reflects the value (based on amortized cost) of investments in that category as a percentage of net assets. Figures in the above chart may not sum to 100% due to the exclusion of other assets and liabilities. |
6
GOLDMAN SACHS VARIABLE INSURANCE TRUST MONEY MARKET FUND
Schedule of Investments
June 30, 2013 (Unaudited)
Principal Amount | Interest Rate | Maturity Date | Amortized Cost | |||||||||||
| Commercial Paper and Corporate Obligations – 12.6% | ||||||||||||||
| ABN Amro Funding (USA) LLC | ||||||||||||||
| $ | 5,000,000 | 0.190 | % | 08/05/13 | $ | 4,999,077 | ||||||||
| Bank of China Ltd. | ||||||||||||||
| 4,000,000 | 0.441 | 08/26/13 | 3,997,262 | |||||||||||
| Chariot Funding LLC | ||||||||||||||
| 5,000,000 | 0.301 | 02/26/14 | 4,990,000 | |||||||||||
| Gemini Securitization Corp. LLC | ||||||||||||||
| 5,167,000 | 0.240 | 08/06/13 | 5,165,760 | |||||||||||
| Jupiter Securitization Co. LLC | ||||||||||||||
| 5,000,000 | 0.301 | 03/14/14 | 4,989,333 | |||||||||||
| Nationwide Building Society | ||||||||||||||
| 5,000,000 | 0.290 | 08/01/13 | 4,998,751 | |||||||||||
| Nederlandse Waterschapsbank N.V. | ||||||||||||||
| 2,000,000 | 0.280 | 09/16/13 | 1,998,802 | |||||||||||
| 2,000,000 | 0.270 | 09/19/13 | 1,998,800 | |||||||||||
| Versailles Commercial Paper LLC | ||||||||||||||
| 5,000,000 | 0.230 | 08/02/13 | 4,998,978 | |||||||||||
| Victory Receivables Corp. | ||||||||||||||
| 4,564,000 | 0.180 | 07/22/13 | 4,563,521 | |||||||||||
|
| |||||||||||||
| | TOTAL COMMERCIAL PAPER AND CORPORATE OBLIGATIONS | | $ | 42,700,284 | ||||||||||
|
| |||||||||||||
| Eurodollar Certificate of Deposit – 1.5% | ||||||||||||||
| Sumitomo Mitsui Trust Bank Ltd. | ||||||||||||||
| $ | 5,000,000 | 0.270 | % | 07/11/13 | $ | 5,000,007 | ||||||||
|
| |||||||||||||
| Fixed Rate Municipal Debt Obligations – 2.5% | ||||||||||||||
| Rutgers State University | ||||||||||||||
| $ | 2,000,000 | 0.220 | % | 07/10/13 | $ | 2,000,000 | ||||||||
| 3,260,000 | 0.260 | 07/10/13 | 3,260,000 | |||||||||||
| State of California GO Series 2009 | ||||||||||||||
| 2,000,000 | 3.750 | 10/01/13 | 2,015,330 | |||||||||||
| State of California GO Series 2009-3 | ||||||||||||||
| 1,070,000 | 5.250 | 04/01/14 | 1,107,325 | |||||||||||
|
| |||||||||||||
| | TOTAL FIXED RATE MUNICIPAL DEBT OBLIGATIONS | | $ | 8,382,655 | ||||||||||
|
| |||||||||||||
| U.S. Government Agency Obligations – 14.5% | ||||||||||||||
| Federal Home Loan Bank |
| ||||||||||||
| $ | 370,000 | 0.250 | % | 07/05/13 | $ | 369,999 | ||||||||
| 1,000,000 | 0.133 | (a) | 07/08/13 | 999,990 | ||||||||||
| 260,000 | 0.350 | 07/09/13 | 260,005 | |||||||||||
| 1,000,000 | 0.133 | (a) | 07/15/13 | 999,981 | ||||||||||
| 4,000,000 | 0.280 | 09/16/13 | 4,000,568 | |||||||||||
| 100,000 | 0.125 | 09/25/13 | 99,977 | |||||||||||
| 1,000,000 | 0.210 | 10/01/13 | 999,968 | |||||||||||
| 400,000 | 0.210 | 10/10/13 | 399,994 | |||||||||||
| 1,700,000 | 0.200 | 10/18/13 | 1,699,935 | |||||||||||
| 140,000 | 0.300 | 10/18/13 | 140,034 | |||||||||||
|
| |||||||||||||
| U.S. Government Agency Obligations – (continued) | ||||||||||||||
| Federal Home Loan Bank – (continued) |
| ||||||||||||
| $ | 50,000 | 0.375 | % | 10/18/13 | $ | 50,023 | ||||||||
| 1,000,000 | 3.625 | 10/18/13 | 1,010,136 | |||||||||||
| 2,000,000 | 0.210 | 10/24/13 | 1,999,982 | |||||||||||
| 7,000,000 | 0.375 | 11/27/13 | 7,004,183 | |||||||||||
| 1,000,000 | 0.125 | (b) | 07/01/14 | 999,073 | ||||||||||
| 3,000,000 | 0.245 | (b) | 07/25/14 | 3,000,000 | ||||||||||
| 2,000,000 | 0.250 | 07/25/14 | 2,000,000 | |||||||||||
| Federal Home Loan Mortgage Corporation |
| ||||||||||||
| 1,000,000 | 4.500 | 07/15/13 | 1,001,626 | |||||||||||
| 3,000,000 | 0.150 | 10/08/13 | 2,998,763 | |||||||||||
| 3,000,000 | 0.150 | 10/10/13 | 2,998,738 | |||||||||||
| 150,000 | 0.375 | 10/15/13 | 150,068 | |||||||||||
| 130,000 | 0.875 | 10/28/13 | 130,278 | |||||||||||
| 500,000 | 0.375 | 10/30/13 | 500,269 | |||||||||||
| 5,000,000 | 0.130 | 02/07/14 | 4,999,454 | |||||||||||
| Federal National Mortgage Association |
| ||||||||||||
| 240,000 | 0.500 | 08/09/13 | 240,058 | |||||||||||
| 100,000 | 1.125 | 10/08/13 | 100,244 | |||||||||||
| 3,075,000 | 4.625 | 10/15/13 | 3,114,089 | |||||||||||
| 5,200,000 | 0.160 | 10/25/13 | 5,197,319 | |||||||||||
| Overseas Private Investment Corp. (USA) |
| ||||||||||||
| 2,000,000 | 0.140 | (a) | 07/08/13 | 2,000,000 | ||||||||||
|
| |||||||||||||
| | TOTAL U.S. GOVERNMENT AGENCY OBLIGATIONS | | $ | 49,464,754 | ||||||||||
|
| |||||||||||||
| U.S. Treasury Obligations – 0.5% | ||||||||||||||
| United States Treasury Notes |
| ||||||||||||
| $ | 300,000 | 1.000 | % | 07/15/13 | $ | 300,086 | ||||||||
| 800,000 | 0.125 | 09/30/13 | 799,838 | |||||||||||
| 700,000 | 3.125 | 09/30/13 | 705,086 | |||||||||||
|
| |||||||||||||
| | TOTAL U.S. TREASURY OBLIGATIONS | | $ | 1,805,010 | ||||||||||
|
| |||||||||||||
| Variable Rate Municipal Debt Obligations(a) – 20.5% | ||||||||||||||
| ABAG California Finance Authority for Non-profit Corporations | | ||||||||||||
| $ | 865,000 | 0.260 | % | 07/08/13 | $ | 865,000 | ||||||||
| ABAG California Finance Authority for Non-profit Corporations | | ||||||||||||
| 700,000 | 0.260 | 07/08/13 | 700,000 | |||||||||||
| ABAG California Finance Authority for Non-profit Corporations | | ||||||||||||
| 140,000 | 0.260 | 07/08/13 | 140,000 | |||||||||||
| ABAG California Finance Authority for Non-profit Corporations | | ||||||||||||
| 100,000 | 0.260 | 07/08/13 | 100,000 | |||||||||||
|
| |||||||||||||
| The accompanying notes are an integral part of these financial statements. | 7 |
GOLDMAN SACHS VARIABLE INSURANCE TRUST MONEY MARKET FUND
Schedule of Investments (continued)
June 30, 2013 (Unaudited)
Principal Amount | Interest Rate | Maturity Date | Amortized Cost | |||||||||||
| Variable Rate Municipal Debt Obligations(a) – (continued) | ||||||||||||||
| BlackRock Municipal Income Trust VRDN RB Putters | | ||||||||||||
| $ | 1,000,000 | 0.120 | %(c) | 07/01/13 | $ | 1,000,000 | ||||||||
| BlackRock MuniVest Fund, Inc. VRDN RB Putters | | ||||||||||||
| 950,000 | 0.120 | (c) | 07/01/13 | 950,000 | ||||||||||
| Charlotte-Mecklenburg, North Carolina Hospital Authority Health | | ||||||||||||
| 1,000,000 | 0.070 | 07/08/13 | 1,000,000 | |||||||||||
| City of Austin, Texas Hotel Occupancy Tax Subordinate Lien | | ||||||||||||
| 620,000 | 0.070 | 07/08/13 | 620,000 | |||||||||||
| City of Charlotte, North Carolina Water & Sewer System | | ||||||||||||
| 450,000 | 0.050 | 07/08/13 | 449,996 | |||||||||||
| City of Riverton Hospital VRDN RB Floater Certificates | | ||||||||||||
| 3,000,000 | 0.060 | (c) | 07/08/13 | 3,000,000 | ||||||||||
| Collier County, Florida Housing Finance Authority MF Hsg | | ||||||||||||
| 875,000 | 0.260 | 07/08/13 | 875,000 | |||||||||||
| Cook County, Illinois GO VRDN Series 2002 B (Bank of | | ||||||||||||
| 1,100,000 | 0.070 | 07/08/13 | 1,100,000 | |||||||||||
| Dekalb County, Georgia Development Authority VRDN RB for | | ||||||||||||
| 3,400,000 | 0.180 | 07/08/13 | 3,400,000 | |||||||||||
| Illinois Health Facilities Authority VRDN RB for | | ||||||||||||
| 1,000,000 | 0.070 | 07/08/13 | 1,000,000 | |||||||||||
| Kentucky Housing Corporation VRDN RB for Overlook Terrace | | ||||||||||||
| 690,000 | 0.260 | 07/08/13 | 690,000 | |||||||||||
| Los Angeles Community College District GO VRDN for Building | | ||||||||||||
| 10,250,000 | 0.450 | (c) | 07/08/13 | 10,250,000 | ||||||||||
| Massachusetts Health & Educational Facilities Authority VRDN | | ||||||||||||
| 1,600,000 | 0.050 | 07/08/13 | 1,600,000 | |||||||||||
| Massachusetts Housing Finance Agency VRDN RB | | ||||||||||||
| 6,204,000 | 0.250 | 07/08/13 | 6,204,000 | |||||||||||
| Missouri Health & Educational Facilities Authority VRDN RB for | | ||||||||||||
| 675,000 | 0.060 | 07/08/13 | 675,000 | |||||||||||
|
| |||||||||||||
| Variable Rate Municipal Debt Obligations(a) – (continued) | ||||||||||||||
| New York City GO VRDN Series 2007 Subseries D-4 | | ||||||||||||
| $ | 250,000 | 0.100 | % | 07/08/13 | $ | 250,000 | ||||||||
| New York City Municipal Water Finance Authority Water & | | ||||||||||||
| 1,000,000 | 0.070 | 07/01/13 | 1,000,000 | |||||||||||
| New York State Housing Finance Agency VRDN RB for Worth | | ||||||||||||
| 600,000 | 0.060 | 07/08/13 | 600,000 | |||||||||||
| New York State Housing Finance Agency VRDN RB | | ||||||||||||
| 300,000 | 0.200 | 07/08/13 | 300,000 | |||||||||||
| New York State Urban Development Corp. VRDN RB Putters | | ||||||||||||
| 4,985,000 | 0.120 | (c) | 07/01/13 | 4,985,000 | ||||||||||
| Nuveen Municipal Market Opportunity Fund, Inc. VRDN Tax- | | ||||||||||||
| 500,000 | 0.210 | (c) | 07/08/13 | 500,000 | ||||||||||
| Oglethorpe, Georgia Power Corp. VRDN RB Putters | | ||||||||||||
| 10,200,000 | 0.110 | (c) | 07/01/13 | 10,200,000 | ||||||||||
| Ohio State Higher Educational Facility Commission VRDN RB | | ||||||||||||
| 800,000 | 0.060 | (c) | 07/08/13 | 800,000 | ||||||||||
| Orange County, California Apartment Development VRDN RB | | ||||||||||||
| 4,000,000 | 0.060 | 07/08/13 | 4,000,000 | |||||||||||
| Port of Corpus Christi Authority of Nueces County VRDN RB for | | ||||||||||||
| 1,000,000 | 0.070 | 07/08/13 | 1,000,000 | |||||||||||
| Texas State GO VRDN Refunding for Taxable Veterans’ Land | | ||||||||||||
| 600,000 | 0.150 | 07/08/13 | 600,000 | |||||||||||
| Texas State GO VRDN Refunding for Taxable Veterans Land | | ||||||||||||
| 1,000,000 | 0.150 | 07/08/13 | 1,000,000 | |||||||||||
| Texas State GO VRDN Refunding Series 2010 D RMKT | | ||||||||||||
| 1,000,000 | 0.130 | 07/08/13 | 1,000,000 | |||||||||||
| University of Alabama VRDN RB Series 1993 B |
| ||||||||||||
| 900,000 | 0.170 | 07/08/13 | 900,000 | |||||||||||
| University of Massachusetts Building Authority Project | | ||||||||||||
| 1,500,000 | 0.100 | 07/08/13 | 1,500,000 | |||||||||||
| Utah County Hospital VRDN RB for IHC Health Services, Inc. | | ||||||||||||
| 850,000 | 0.050 | 07/08/13 | 850,000 | |||||||||||
|
| |||||||||||||
| 8 | The accompanying notes are an integral part of these financial statements. |
GOLDMAN SACHS VARIABLE INSURANCE TRUST MONEY MARKET FUND
Principal Amount | Interest Rate | Maturity Date | Amortized Cost | |||||||||||
| Variable Rate Municipal Debt Obligations(a) – (continued) | ||||||||||||||
| Washington State Housing Finance Commission VRDN RB for | | ||||||||||||
| $ | 150,000 | 0.280 | % | 07/08/13 | $ | 150,000 | ||||||||
| Wayne County, Michigan VRDN RB P-Floats-Series 2013 | | ||||||||||||
| 5,620,000 | 0.450 | (c) | 07/01/13 | 5,620,000 | ||||||||||
|
| |||||||||||||
| | TOTAL VARIABLE RATE MUNICIPAL DEBT OBLIGATIONS | | $ | 69,873,996 | ||||||||||
|
| |||||||||||||
| Variable Rate Obligations(a) – 16.3% | ||||||||||||||
| Australia & New Zealand Banking Group Ltd. | ||||||||||||||
| $ | 5,000,000 | 0.348 | %(c) | 07/18/14 | $ | 5,000,000 | ||||||||
| Bank of Nova Scotia (The) | ||||||||||||||
| 5,000,000 | 0.324 | 07/23/14 | 5,000,000 | |||||||||||
| Commonwealth Bank of Australia | ||||||||||||||
| 3,000,000 | 0.324 | (c) | 11/18/13 | 3,000,000 | ||||||||||
| 3,000,000 | 0.299 | (c) | 04/04/14 | 3,000,000 | ||||||||||
| Cooperatieve Centrale Raiffeisen-Boerenleenbank B.A. | ||||||||||||||
| 9,000,000 | 0.425 | 08/12/13 | 9,000,000 | |||||||||||
| Credit Suisse Securities (USA) LLC | ||||||||||||||
| 5,000,000 | 0.283 | 09/30/13 | 5,000,000 | |||||||||||
| Deutsche Bank AG | ||||||||||||||
| 5,000,000 | 0.253 | 09/30/13 | 5,000,000 | |||||||||||
| JPMorgan Chase Bank N.A. | ||||||||||||||
| 8,000,000 | 0.354 | 07/07/14 | 8,000,000 | |||||||||||
| Providence Health & Services (U.S. Bank N.A., SBPA) | ||||||||||||||
| 880,000 | 0.200 | 07/08/13 | 880,000 | |||||||||||
| Svenska Handelsbanken A.B. | ||||||||||||||
| 5,000,000 | 0.362 | 07/03/14 | 5,000,000 | |||||||||||
| Wells Fargo Bank N.A. | ||||||||||||||
| 2,500,000 | 0.322 | 07/18/14 | 2,500,000 | |||||||||||
| Westpac Banking Corp. | ||||||||||||||
| 4,000,000 | 0.385 | (c) | 07/01/14 | 4,000,000 | ||||||||||
|
| |||||||||||||
| | TOTAL VARIABLE RATE OBLIGATIONS | | $ | 55,380,000 | ||||||||||
|
| |||||||||||||
| Yankee Certificates of Deposit – 9.4% | ||||||||||||||
| Credit Industriel et Commercial | ||||||||||||||
| $ | 5,000,000 | 0.320 | % | 08/02/13 | $ | 5,000,022 | ||||||||
| Mitsubishi UFJ Trust & Banking Corp. | ||||||||||||||
| 5,000,000 | 0.260 | 07/08/13 | 5,000,000 | |||||||||||
| Mizuho Corporate Bank Ltd. | ||||||||||||||
| 5,000,000 | 0.250 | 08/21/13 | 5,000,000 | |||||||||||
| Norinchukin Bank | ||||||||||||||
| 5,000,000 | 0.240 | 09/10/13 | 5,000,000 | |||||||||||
| Societe Generale | ||||||||||||||
| 7,000,000 | 0.200 | 07/31/13 | 7,000,000 | |||||||||||
|
| |||||||||||||
| Yankee Certificates of Deposit – (continued) | ||||||||||||||
| Sumitomo Mitsui Banking Corp. | ||||||||||||||
| $ | 5,000,000 | 0.250 | % | 11/01/13 | $ | 5,000,000 | ||||||||
|
| |||||||||||||
| | TOTAL YANKEE CERTIFICATES OF DEPOSIT | | $ | 32,000,022 | ||||||||||
|
| |||||||||||||
| | TOTAL INVESTMENTS BEFORE REPURCHASE AGREEMENTS | | $ | 264,606,728 | ||||||||||
|
| |||||||||||||
| Repurchase Agreements(d) – 22.2% | ||||||||||||||
| ABN Amro Securities (USA) LLC |
| ||||||||||||
| $ | 1,000,000 | 0.260 | %(a) | 07/03/13 | $ | 1,000,000 | ||||||||
| Maturity Value: $1,000,051 |
| ||||||||||||
| Settlement Date: 06/26/13 |
| ||||||||||||
| Collateralized by various equity security issuers. The aggregate | | ||||||||||||
|
| |||||||||||||
| BNP Paribas Securities Corp. |
| ||||||||||||
| 2,000,000 | 0.430 | 07/01/13 | 2,000,000 | |||||||||||
| Maturity Value: $2,000,072 |
| ||||||||||||
| Collateralized by various asset-backed obligations, 0.000% to | | ||||||||||||
| 5,000,000 | 0.380 | (a) | 07/02/13 | 5,000,000 | ||||||||||
| Maturity Value: $5,000,369 |
| ||||||||||||
| Settlement Date: 06/25/13 |
| ||||||||||||
| Collateralized by various corporate security issuers, 0.350% to | | ||||||||||||
|
| |||||||||||||
| Credit Agricole Corporate and Investment Bank |
| ||||||||||||
| 5,000,000 | 0.190 | (a)(e) | 07/02/13 | 5,000,000 | ||||||||||
| Maturity Value: $5,003,246 |
| ||||||||||||
| Settlement Date: 03/01/13 |
| ||||||||||||
| Collateralized by Federal Home Loan Mortgage Corp., 3.000%, | | ||||||||||||
|
| |||||||||||||
| Deutsche Bank Securities, Inc. |
| ||||||||||||
| 3,000,000 | 0.380 | 07/01/13 | 3,000,000 | |||||||||||
| Maturity Value: $3,000,095 |
| ||||||||||||
| Collateralized by various corporate security issuers, 1.750% to | | ||||||||||||
| 5,000,000 | 0.200 | (f) | 09/13/13 | 5,000,000 | ||||||||||
| Maturity Value: $5,004,972 |
| ||||||||||||
| Settlement Date: 03/18/13 |
| ||||||||||||
| Collateralized by Government National Mortgage Association, | | ||||||||||||
|
| |||||||||||||
| The accompanying notes are an integral part of these financial statements. | 9 |
GOLDMAN SACHS VARIABLE INSURANCE TRUST MONEY MARKET FUND
Schedule of Investments (continued)
June 30, 2013 (Unaudited)
Principal Amount | Interest Rate | Maturity Date | Amortized Cost | |||||||||||
| Repurchase Agreements(d) – (continued) | ||||||||||||||
| ING Financial Markets LLC |
| ||||||||||||
| $ | 5,000,000 | 0.150 | % | 07/01/13 | $ | 5,000,000 | ||||||||
| Maturity Value: $5,000,063 |
| ||||||||||||
| Collateralized by various corporate security issuers, 2.050% to | | ||||||||||||
|
| |||||||||||||
| Joint Repurchase Agreement Account III |
| ||||||||||||
| 39,500,000 | 0.145 | 07/01/13 | 39,500,000 | |||||||||||
| Maturity Value: $39,500,478 |
| ||||||||||||
|
| |||||||||||||
| RBS Securities, Inc. |
| ||||||||||||
| 5,000,000 | 0.830 | (a)(f) | 08/02/13 | 5,000,000 | ||||||||||
| Maturity Value: $5,009,568 |
| ||||||||||||
| Settlement Date: 05/16/13 |
| ||||||||||||
| Collateralized by Federal Home Loan Mortgage Corp., 2.022% | | ||||||||||||
|
| |||||||||||||
| Wells Fargo Securities LLC |
| ||||||||||||
| 5,000,000 | 0.130 | 07/01/13 | 5,000,000 | |||||||||||
| Maturity Value: $5,000,054 |
| ||||||||||||
| Collateralized by various asset-backed obligations, 0.590% to | | ||||||||||||
|
| |||||||||||||
| TOTAL REPURCHASE AGREEMENTS | $ | 75,500,000 | ||||||||||||
|
| |||||||||||||
| TOTAL INVESTMENTS – 100.0% | $ | 340,106,728 | ||||||||||||
|
| |||||||||||||
| OTHER ASSETS IN EXCESS OF | | 93,487 | |||||||||||
|
| |||||||||||||
| NET ASSETS – 100.0% | $ | 340,200,215 | ||||||||||||
|
| |||||||||||||
| The percentage shown for each investment category reflects the value of investments in that category as a percentage of net assets. | ||
| (a) | Variable or floating rate security. Interest rate disclosed is that which is in effect at June 30, 2013. | |
| (b) | All or a portion represents a forward commitment. | |
| (c) | Security not registered under the Securities Act of 1933, as amended. Such securities have been determined to be liquid by the Investment Adviser. At June 30, 2013, these securities amounted to $52,305,000 or approximately 15.4% of net assets. | |
| (d) | Unless noted, all repurchase agreements were entered into on June 30, 2013. Additional information on Joint Repurchase Agreement Account III appears on page 11. | |
| (e) | The instrument is subject to a demand feature. | |
| (f) | Security has been determined to be illiquid by the Investment Adviser. At June 30, 2013, these securities amounted to $10,000,000 or approximately 2.9% of net assets. | |
Interest rates represent either the stated coupon rate, annualized yield on date of purchase for discounted securities, or, for floating rate securities, the current reset rate, which is based upon current interest rate indices.
Maturity dates represent either the final legal maturity date on the security, the demand date for puttable securities, or the prerefunded date for those types of securities. | ||
| Investment Abbreviations: | ||||
| FGIC | — | Insured by Financial Guaranty Insurance Co. | ||
| FHLMC | — | Insured by Federal Home Loan Mortgage Corp. | ||
| FNMA | — | Insured by Federal National Mortgage Association | ||
| GO | — | General Obligation | ||
| GTY AGMT | — | Guaranty Agreement | ||
| IHC | — | Intermountain Health Care | ||
| LIQ | — | Liquidity Agreement | ||
| LOC | — | Letter of Credit | ||
| MF Hsg | — | Multi-Family Housing | ||
| NATL-RE | — | National Reinsurance Corp. | ||
| RB | — | Revenue Bond | ||
| RMKT | — | Remarketed | ||
| SBPA | — | Standby Bond Purchase Agreement | ||
| SPA | — | Stand-by Purchase Agreement | ||
| VRDN | — | Variable Rate Demand Notes | ||
| 10 | The accompanying notes are an integral part of these financial statements. |
GOLDMAN SACHS VARIABLE INSURANCE TRUST MONEY MARKET FUND
ADDITIONAL INVESTMENT INFORMATION |
JOINT REPURCHASE AGREEMENT ACCOUNT III — At June 30, 2013, the Fund had undivided interests in the Joint Repurchase Agreement Account III, with a maturity date of July 1, 2013, as follows:
| Principal Amount | Maturity Value | Collateral Value | |||||||||||
| $39,500,000 | $ | 39,500,478 | $ | 40,508,818 | |||||||||
REPURCHASE AGREEMENTS — At June 30, 2013, the Principal Amounts of the Fund’s interest in the Joint Repurchase Agreement Account III were as follows:
| Counterparty | Interest Rate | Principal Amount | ||||||
| ABN Amro Bank N.V. | 0.150 | % | $21,127,907 | |||||
Crédit Agricole Corporate and Investment Bank | 0.140 | 18,372,093 | ||||||
| TOTAL | $ | 39,500,000 | ||||||
At June 30, 2013, the Joint Repurchase Agreement Account III was fully collateralized by cash and the following securities:
| Issuer | Interest Rates | Maturity Dates | ||||||
| Federal Home Loan Mortgage Corp. | 3.000 to 4.000 | % | 05/01/28 to 06/01/43 | |||||
| Federal National Mortgage Association | 0.375 to 4.500 | 03/16/15 to 05/01/43 | ||||||
| U.S. Treasury Bills | 0.000 | 11/21/13 to 06/26/14 | ||||||
| U.S. Treasury Bonds | 4.375 to 4.625 | 11/15/39 to 02/15/40 | ||||||
| U.S. Treasury Inflation Indexed Bond | 3.875 | 04/15/29 | ||||||
| U.S. Treasury Note | 0.250 to 1.625 | 12/15/15 to 11/15/22 | ||||||
| The accompanying notes are an integral part of these financial statements. | 11 |
GOLDMAN SACHS VARIABLE INSURANCE TRUST MONEY MARKET FUND
Statement of Assets and Liabilities
June 30, 2013 (Unaudited)
| Assets: | ||||
Investments based on amortized cost | $ | 264,606,728 | ||
Repurchase agreements based on amortized cost | 75,500,000 | |||
Cash | 52,100 | |||
Receivables: | ||||
Investments sold | 3,940,003 | |||
Interest | 187,407 | |||
Fund shares sold | 182,614 | |||
Reimbursement from investment adviser | 44,825 | |||
Other assets | 3,050 | |||
| Total assets | 344,516,727 | |||
| Liabilities: | ||||
Payables: | ||||
Investments purchased | 3,999,073 | |||
Fund shares redeemed | 180,096 | |||
Amounts owed to affiliates | 70,624 | |||
Accrued expenses | 66,719 | |||
| Total liabilities | 4,316,512 | |||
| Net Assets: | ||||
Paid-in capital | 340,197,396 | |||
Accumulated net realized gain from investments | 2,819 | |||
| NET ASSETS | $ | 340,200,215 | ||
Shares of beneficial interest outstanding, $0.001 par value (unlimited shares authorized) | 340,197,377 | |||
Net asset value, offering and redemption price per share | $1.00 | |||
| 12 | The accompanying notes are an integral part of these financial statements. |
GOLDMAN SACHS VARIABLE INSURANCE TRUST MONEY MARKET FUND
Statement of Operations
For the Six Months Ended June 30, 2013 (Unaudited)
| Investment Income: | ||||
Interest | $ | 485,455 | ||
| Expenses: | ||||
Distribution and Service fees | 429,401 | |||
Management fees | 352,108 | |||
Professional fees | 42,062 | |||
Transfer Agent fees | 34,349 | |||
Printing and mailing costs | 22,567 | |||
Trustee fees | 9,197 | |||
Custody, accounting and administrative services | 3,542 | |||
Other | 7,346 | |||
| Total expenses | 900,572 | |||
Less — expense reductions | (419,780 | ) | ||
| Net expenses | 480,792 | |||
| NET INVESTMENT INCOME | 4,663 | |||
| NET REALIZED GAIN FROM INVESTMENT TRANSACTIONS | 8,634 | |||
| NET INCREASE IN NET ASSETS RESULTING FROM OPERATIONS | $ | 13,297 | ||
| The accompanying notes are an integral part of these financial statements. | 13 |
GOLDMAN SACHS VARIABLE INSURANCE TRUST MONEY MARKET FUND
Statement of Changes in Net Assets
| For the Six Months Ended June 30, 2013 (Unaudited) | For the Fiscal Year Ended | |||||||
| From Operations: | ||||||||
Net investment income | $ | 4,663 | $ | 9,247 | ||||
Net realized gain | 8,634 | 4,734 | ||||||
| Net increase in net assets resulting from operations | 13,297 | 13,981 | ||||||
| Distributions to shareholders: | ||||||||
From net investment income | (4,663 | ) | (9,247 | ) | ||||
From net realized gains | (5,815 | ) | (4,734 | ) | ||||
| Total distributions to shareholders | (10,478 | ) | (13,981 | ) | ||||
| From share transactions (at net asset value of $1.00 per share): | ||||||||
Proceeds from sales of shares | 63,653,942 | 315,283,256 | ||||||
Reinvestment of distributions | 10,478 | 13,981 | ||||||
Cost of shares redeemed | (81,012,467 | ) | (101,924,898 | ) | ||||
| Net increase (decrease) in net assets resulting from share transactions | (17,348,047 | ) | 213,372,339 | |||||
| TOTAL INCREASE (DECREASE) | (17,345,228 | ) | 213,372,339 | |||||
| Net assets: | ||||||||
Beginning of period | 357,545,443 | 144,173,104 | ||||||
End of period | $ | 340,200,215 | $ | 357,545,443 | ||||
| 14 | The accompanying notes are an integral part of these financial statements. |
GOLDMAN SACHS VARIABLE INSURANCE TRUST MONEY MARKET FUND
Financial Highlights
Selected Data for a Share Outstanding Throughout Each Period
| Net asset value, beginning of period | Net investment income(a) | Distributions from net investment income(b) | Net asset value, end of period | Total return(c) | Net assets, period | Ratio of net expenses to average net assets | Ratio of total expenses to average net assets | Ratio of net investment income to average net assets | ||||||||||||||||||||||||||||||
| FOR THE SIX MONTHS ENDED JUNE 30, (UNAUDITED) | ||||||||||||||||||||||||||||||||||||||
2013 | $ | 1.00 | $ | — | (d) | $ | — | (d) | $ | 1.00 | — | %(e) | $ | 340,200 | 0.28 | %(f) | 0.52 | %(f) | — | %(f)(g) | ||||||||||||||||||
FOR THE FISCAL YEARS ENDED DECEMBER 31, | ||||||||||||||||||||||||||||||||||||||
2012 | 1.00 | — | (d) | — | (d) | 1.00 | 0.01 | 357,545 | 0.35 | 0.53 | — | (g) | ||||||||||||||||||||||||||
2011 | 1.00 | — | (d) | — | (d) | 1.00 | 0.01 | 144,173 | 0.30 | 0.66 | 0.01 | |||||||||||||||||||||||||||
2010 | 1.00 | — | (d) | — | (d) | 1.00 | 0.01 | 123,365 | 0.33 | 0.68 | — | (g) | ||||||||||||||||||||||||||
2009 | 1.00 | 0.002 | (h) | (0.002 | )(h) | 1.00 | 0.15 | 143,347 | 0.53 | 0.77 | 0.15 | |||||||||||||||||||||||||||
2008 | 1.00 | 0.02 | (0.02 | ) | 1.00 | 2.25 | 194,871 | 0.63 | 0.71 | 2.27 | ||||||||||||||||||||||||||||
| (a) | Calculated based on the average shares outstanding methodology. |
| (b) | Distributions may not coincide with the current year net investment income or net realized gains as distributions may be paid from current or prior year earnings. |
| (c) | Assumes reinvestment of all distributions. |
| (d) | Amount is less than $0.0005 per share. |
| (e) | Amount is less than 0.005%. |
| (f) | Annualized. |
| (g) | Amount is less than 0.005% of average net assets. |
| (h) | Net investment income and distributions from net investment income contain $0.0002 of net realized capital gains and distributions from net realized gains. |
| The accompanying notes are an integral part of these financial statements. | 15 |
GOLDMAN SACHS VARIABLE INSURANCE TRUST MONEY MARKET FUND
Notes to Financial Statements
June 30, 2013 (Unaudited)
1. ORGANIZATION
Goldman Sachs Variable Insurance Trust (the “Trust” or “VIT”) is a Delaware statutory trust registered under the Investment Company Act of 1940, as amended (the “Act”), as an open-end management investment company. The Trust includes the Goldman Sachs Money Market Fund (the “Fund”). The Fund is a diversified portfolio under the Act offering one class of shares — Service Shares. Shares of the Trust are offered to separate accounts of participating life insurance companies for the purpose of funding variable annuity contracts and variable life insurance policies.
Goldman Sachs Asset Management, L.P. (“GSAM”), an affiliate of Goldman, Sachs & Co. (“Goldman Sachs”), serves as investment adviser to the Fund pursuant to a management agreement (the “Agreement”) with the Trust.
2. SIGNIFICANT ACCOUNTING POLICIES
The financial statements have been prepared in accordance with accounting principles generally accepted in the United States of America (“GAAP”) and require management to make estimates and assumptions that may affect the reported amounts and disclosures. Actual results may differ from those estimates and assumptions.
A. Investment Valuation — The investment valuation policy of the Fund is to use the amortized-cost method permitted by Rule 2a-7 under the Act, which approximates market value, for valuing portfolio securities. Under this method, all investments purchased at a discount or premium are valued by accreting or amortizing the difference between the original purchase price and maturity value of the issue, as an adjustment to interest income. Under procedures and tolerances approved by the Trustees, GSAM evaluates the difference between the Fund’s net asset value per share (“NAV”) based upon the amortized cost of the Fund’s securities and the NAV based upon available market quotations (or permitted substitutes) at least once a week.
B. Investment Income and Investments — Interest income is accrued daily and adjusted for amortization of premiums and accretion of discounts. Investment transactions are reflected on trade date. Realized gains and losses are calculated using identified cost.
C. Expenses — Expenses incurred directly by the Fund are charged to the Fund, and certain expenses incurred by the Trust, that may not solely relate to the Fund, are allocated to the Fund and other funds of the Trust on a straight-line and/or pro-rata basis depending upon the nature of the expenses and are accrued daily.
D. Federal Taxes and Distributions to Shareholders — It is the Fund’s policy to comply with the requirements of the Internal Revenue Code of 1986, as amended (the “Code”), applicable to regulated investment companies (mutual funds) and to distribute each year substantially all of its investment company taxable and tax-exempt income and capital gains to its shareholders. Accordingly, the Fund is not required to make any provisions for the payment of federal income tax. Distributions to shareholders are declared and recorded daily and paid monthly by the Fund and may include short-term capital gains. Long-term capital gain distributions, if any, are declared and paid annually.
Under the Regulated Investment Company Modernization Act of 2010, the Fund is permitted to carry forward capital losses incurred in taxable years beginning after December 22, 2010 for an unlimited period. However, any losses incurred during those future taxable years will be required to be utilized prior to the losses incurred in pre-enactment taxable years. As a result of this ordering rule, pre-enactment capital loss carryforwards may be more likely to expire unused. Additionally, post-enactment capital losses that are carried forward will retain their character as either short-term or long-term capital losses rather than being considered all short-term as under previous law.
The characterization of distributions to shareholders for financial reporting purposes is determined in accordance with federal income tax rules, which may differ from GAAP. The source of the Fund’s distributions may be shown in the accompanying financial statements as either from net investment income, net realized gain or capital. Certain components of the Fund’s net assets on the Statement of Assets and Liabilities reflect permanent GAAP/tax differences based on the appropriate tax character.
The amortized cost for the Fund stated in the accompanying Statement of Assets and Liabilities also represents aggregate cost for U.S. federal income tax purposes.
16
GOLDMAN SACHS VARIABLE INSURANCE TRUST MONEY MARKET FUND
2. SIGNIFICANT ACCOUNTING POLICIES (continued)
GSAM has reviewed the Fund’s tax positions for all open tax years (the current and prior three years, as applicable) and has concluded that no provision for income tax is required in the Fund’s financial statements. Such open tax years remain subject to examination and adjustment by tax authorities.
E. Forward Commitment Transactions — A forward commitment involves entering into a contract to purchase or sell securities, typically on an extended settlement basis, for a fixed price at a future date. The purchase of securities involves a risk of loss if the value of the security to be purchased declines before the settlement date. Conversely, the sale of securities involves the risk that the value of the securities sold may increase before the settlement date. Although the Fund will generally purchase securities on a forward commitment basis with the intention of acquiring the securities for its portfolio, the Fund may dispose of forward commitments prior to settlement which may result in a realized gain or loss.
F. Repurchase Agreements — Repurchase agreements involve the purchase of securities subject to the seller’s agreement to repurchase the securities at a mutually agreed upon date and price, under the terms of a Master Repurchase Agreement (“MRA”). During the term of a repurchase agreement, the value of the underlying securities held as collateral on behalf of the Fund, including accrued interest, is required to exceed the value of the repurchase agreement, including accrued interest. The underlying securities for all repurchase agreements are held at the Fund’s custodian or designated sub-custodians under tri-party repurchase agreements.
In December 2011, the Financial Accounting Standards Board (“FASB”) issued an Accounting Standards Update (“ASU”) No. 2011-11: Disclosures about Offsetting Assets and Liabilities (“netting”) on the Statement of Assets and Liabilities that are subject to master netting arrangements or similar agreements. ASU 2011-11 was amended by ASU No. 2013-01, clarifying which investments and transactions are subject to the netting disclosure. The scope of the disclosure requirements is limited to derivative instruments, repurchase agreements and reverse repurchase agreements, and securities borrowing and securities lending transactions. This information is intended to enable users of the Fund’s financial statements to evaluate the effect or potential effect of netting arrangements on the Fund’s financial position. The ASU is effective for financial statements with fiscal years beginning on or after January 1, 2013, and interim periods within those fiscal years. The Fund adopted the disclosure requirement for the current reporting period. Since these amended principles require additional disclosures concerning offsetting and related arrangements, adoption did not affect the Fund’s financial condition or results of operations.
For financial reporting purposes, the Fund does not offset financial assets and financial liabilities that are subject to master netting arrangements or similar agreements on the Statement of Assets and Liabilities.
A MRA governs transactions between a Fund and select counterparties. A MRA contains provisions for, among other things, initiation, income payments, events of default and maintenance of securities for repurchase agreements. A MRA also permits offsetting with collateral to create one single net payment in the event of default or similar events, including the bankruptcy or insolvency of a counterparty.
If the seller defaults, a Fund could suffer a loss to the extent that the proceeds from the sale of the underlying securities and other collateral held by the Fund are less than the repurchase price and the Fund’s costs associated with delay and enforcement of the repurchase agreement. In addition, in the event of default or insolvency of the seller, a court could determine that a Fund’s interest in the collateral is not enforceable resulting in additional losses to the Fund.
Pursuant to exemptive relief granted by the Securities and Exchange Commission and terms and conditions contained therein, the Fund, together with other funds of the Trust and registered investment companies having management agreements with GSAM, or its affiliates, may transfer uninvested cash into joint accounts, the daily aggregate balance of which is invested in one or more repurchase agreements. Under these joint accounts, the Fund maintains pro-rata credit exposure to the underlying repurchase agreements’ counterparties. With the exception of certain transaction fees, the Fund is not subject to any expenses in relation to these investments.
17
GOLDMAN SACHS VARIABLE INSURANCE TRUST MONEY MARKET FUND
Notes to Financial Statements (continued)
June 30, 2013 (Unaudited)
2. SIGNIFICANT ACCOUNTING POLICIES (continued)
At June 30, 2013, the Fund’s investments in repurchase agreements were all subject to enforceable MRAs. Repurchase agreements on a net basis were as follows:
| Repurchase Agreements | ||||
| Total gross amount presented in Statement of Assets and Liabilities | $ | 75,500,000 | ||
| Non-cash Collateral offsetting(1) | (70,388,840 | ) | ||
| Cash Collateral offsetting(1) | (5,111,160 | ) | ||
| Net Amount(2) | $ | — | ||
| (1) | At June 30, 2013 the value of the collateral and cash received from each seller exceeded the value of the related repurchase agreements. |
| (2) | Net amount represents the net amount due from the counterparty in the event of a default based on the contractual set-off rights under the agreement. |
3. INVESTMENTS AND FAIR VALUE MEASUREMENTS
The fair value of a financial instrument is the amount that would be received to sell an asset or paid to transfer a liability in an orderly transaction between market participants at the measurement date (i.e., the exit price). GAAP establishes a fair value hierarchy that prioritizes the inputs to valuation techniques used to measure fair value. The hierarchy gives the highest priority to unadjusted quoted prices in active markets for identical assets or liabilities (Level 1 measurements) and the lowest priority to unobservable inputs (Level 3 measurements). The levels used for classifying investments are not necessarily an indication of the risk associated with investing in these investments. The three levels of the fair value hierarchy are described below:
Level 1 — Unadjusted quoted prices in active markets that are accessible at the measurement date for identical, unrestricted assets or liabilities;
Level 2 — Quoted prices in markets that are not active or financial instruments for which significant inputs are observable (including, but not limited to, quoted prices for similar investments, interest rates, foreign exchange rates, volatility and credit spreads), either directly or indirectly;
Level 3 — Prices or valuations that require significant unobservable inputs (including GSAM’s assumptions in determining fair value measurement).
The Trustees have adopted Valuation Procedures that govern the valuation of the portfolio investments held by the Fund, including investments for which market quotations are not readily available. The Trustees have delegated to GSAM day-to-day responsibility for implementing and maintaining internal controls and procedures related to the valuation of the Fund’s portfolio investments. To assess the continuing appropriateness of pricing sources and methodologies, GSAM regularly performs price verification procedures and issues challenges as necessary to third party pricing vendors or brokers, and any differences are reviewed in accordance with the Valuation Procedures.
As of June 30, 2013, all investments are classified as Level 2. Please refer to the Schedule of Investments for further detail.
4. AGREEMENTS AND AFFILIATED TRANSACTIONS
A. Management Agreement — Under the Agreement, GSAM manages the Fund, subject to the general supervision of the Trustees.
As compensation for the services rendered pursuant to the Agreement, the assumption of the expenses related thereto and administration of the Fund’s business affairs, including providing facilities, GSAM is entitled to a management fee, accrued daily and paid monthly, equal to an annual percentage rate of the Fund’s average daily net assets.
B. Distribution and Service Plan — The Trust, on behalf of the Service Shares of the Fund, has adopted a Distribution and Service Plan (the “Plan”). Under the Plan, Goldman Sachs, which serves as distributor, is entitled to a fee, accrued daily and paid
18
GOLDMAN SACHS VARIABLE INSURANCE TRUST MONEY MARKET FUND
4. AGREEMENTS AND AFFILIATED TRANSACTIONS (continued)
monthly for distribution services, which may then be paid by Goldman Sachs to authorized dealers. This fee is equal to an annual percentage rate of the Fund’s average daily net assets.
C. Transfer Agency Agreement — Goldman Sachs also serves as the transfer agent of the Fund for a fee pursuant to a Transfer Agency Agreement. The fee charged for such transfer agency services is accrued daily and paid monthly and is equal to an annual percentage rate of the Fund’s average daily net assets.
D. Other Expense Agreements — GSAM has agreed to limit certain “Other Expense” of the Fund (excluding transfer agent fees and expenses, taxes, interest, brokerage fees, litigation, indemnification, shareholder meetings and other extraordinary expenses) to the extent that such expenses exceed, on an annual basis, 0.004% of the average daily net assets of the Fund. Such Other Expense reimbursements, if any, are accrued daily and paid monthly. In addition, the Fund is not obligated to reimburse GSAM for prior fiscal year expense reimbursements, if any. This Other Expense limitation will remain in place through at least April 30, 2014, and prior to such date GSAM may not terminate the arrangement without the approval of the Trustees. For the six months ended June 30, 2013, GSAM reimbursed $77,843 to the Fund. In addition, the Fund has entered into certain offset arrangements with the custodian, which resulted in a reduction of $23 of the Fund’s expenses and are received irrespective of the application of the “Other Expense” limitation described above.
E. Contractual and Net Fund Expenses — During the six months ended June 30, 2013, Goldman Sachs, as distributor, voluntarily agreed to waive a portion of distribution and service plan fees attributable to the Fund. This waiver may be modified or terminated at any time at the option of Goldman Sachs. The following table outlines such fees (net of waivers) and Other Expenses (net of reimbursements and custodian and transfer agent fee credit reductions) in order to determine the Fund’s net annualized expenses for the fiscal period. The Fund is not obligated to reimburse Goldman Sachs for prior fiscal year fee waivers, if any.
| Fee/Expense Type | Contractual rate, if any | Ratio of net expenses to average net assets for the six months ended June 30, 2013* | ||||||
| Management Fee | 0.21 | %(a) | 0.21 | % | ||||
| Distribution and Service Fees | 0.25 | 0.05 | ||||||
| Transfer Agency Fee | 0.02 | 0.02 | ||||||
| Other Expenses | — | — | (b) | |||||
| Net Expenses | 0.28 | % | ||||||
| * | Annualized |
| (a) | Unrounded contractual rate is 0.205%. |
| (b) | Amount is less than 0.005% of average net assets. |
For the six months ended June 30, 2013, Goldman Sachs waived $341,914 in distribution and service fees.
For the six months ended June 30 2013, the amounts owed to affiliates of the Fund were $57,676, $7,321, and $5,627 for management, distribution and service fees, and transfer agent fees, respectively.
F. Line of Credit Facility — As of June 30, 2013, the Fund participated in a $780,000,000 committed, unsecured revolving line of credit facility (the “facility”) together with other funds of the Trust and registered investment companies having management agreements with GSAM or its affiliates (“Other Borrowers”). Pursuant to the terms of the facility, the Fund and Other Borrowers could increase the credit amount by an additional $220,000,000, for a total of up to $1,000,000,000. This facility is to be used solely for temporary or emergency purposes, which may include the funding of redemptions. The interest rate on borrowings is based on the federal funds rate. The facility also requires a fee to be paid by the Fund based on the amount of the commitment that has not been utilized. For the six months ended June 30, 2013, the Fund did not have any borrowings under the facility. Prior to May 8, 2013, the committed amount available through the facility was $630,000,000.
19
GOLDMAN SACHS VARIABLE INSURANCE TRUST MONEY MARKET FUND
Notes to Financial Statements (continued)
June 30, 2013 (Unaudited)
5. OTHER RISKS
The Fund’s risks include, but are not limited to, the following:
Fund Shareholder Concentration Risk — Certain participating insurance companies, accounts, or Goldman Sachs affiliates may from time to time own (beneficially or of record) or control a significant percentage of the Fund’s shares. Redemptions by these entities of their holdings in the Fund may impact the Fund’s liquidity and NAV. These redemptions may also force the Fund to sell securities.
Interest Rate Risk — When interest rates increase, the Fund’s yield will tend to be lower than prevailing market rates, and the market value of its securities or instruments may also be adversely affected. A low interest rate environment poses additional risks to the Fund, because low yields on the Fund’s portfolio holdings may have an adverse impact on the Fund’s ability to provide a positive yield to its shareholders, pay expenses out of Fund assets, or, at times, maintain a stable $1.00 share price.
Market and Credit Risks — In the normal course of business, the Fund trades financial instruments and enters into financial transactions where risk of potential loss exists due to changes in the market (market risk). Additionally, the Fund may also be exposed to credit risk in the event that an issuer fails to perform or that an institution or entity with which the Fund has unsettled or open transaction defaults.
6. INDEMNIFICATIONS
Under the Trust’s organizational documents, its Trustees, officers, employees and agents are indemnified, to the extent permitted by the Act and state law, against certain liabilities that may arise out of performance of their duties to the Fund. Additionally, in the course of business, the Fund enters into contracts that contain a variety of indemnification clauses. The Fund’s maximum exposure under these arrangements is unknown, as this would involve future claims that may be made against the Fund that have not yet occurred. However, GSAM believes the risk of loss under these arrangements to be remote.
7. SUBSEQUENT EVENTS
Subsequent events after the Statement of Assets and Liabilities date have been evaluated through the date the financial statements were issued. GSAM has concluded that there is no impact requiring adjustment or disclosure in the financial statements.
20
GOLDMAN SACHS VARIABLE INSURANCE TRUST MONEY MARKET FUND
| Fund Expenses — Six Month Period Ended June 30, 2013 (Unaudited) |
As a shareholder of the Service Shares of the Fund, you incur ongoing costs, including management fees; distribution and service (12b-1) fees; and other Fund expenses. This Example is intended to help you understand your ongoing costs (in dollars) of investing in the Fund and to compare these costs with the ongoing costs of investing in other mutual funds.
The example is based on an investment of $1,000 invested at the beginning of the period and held for the entire period from January 1, 2013 through June 30, 2013.
Actual Expenses — The first line in the table below provides information about actual account values and actual expenses. You may use the information in this line, together with the amount you invested, to estimate the expenses that you paid over the period. Simply divide your account value by $1,000 (for example, an $8,600 account value divided by $1,000=8.6), then multiply the result by the number in the first line under the heading entitled “Expenses Paid” to estimate the expenses you paid on your account during this period.
Hypothetical Example for Comparison Purposes — The second line in the table below provides information about hypothetical account values and hypothetical expenses based on the Fund’s actual net expense ratio and an assumed rate of return of 5% per year before expenses, which is not the Fund’s actual return. The hypothetical account values and expenses may not be used to estimate the actual ending account balance or expenses you paid for the period. You may use this information to compare the ongoing costs of investing in the Fund and other funds. To do so, compare this 5% hypothetical example with the 5% hypothetical examples that appear in the shareholder reports of the other funds.
Please note that the expenses shown in the table are meant to highlight your ongoing costs only and do not reflect any transactional costs, such as sales charges, redemption fees, or exchange fees. Therefore, the second line of the table is useful in comparing ongoing costs only, and will not help you determine the relative total costs of owning different funds. In addition, if these transactional costs were included, your costs would have been higher.
| Beginning Account Value 01/01/13 | Ending Account Value 06/30/13 | Expenses Paid for the 6 Months Ended 06/30/13* | ||||||||||
| Actual | $ | 1,000.00 | $ | 1,000.03 | $ | 1.39 | ||||||
| Hypothetical 5% return | 1,000.00 | 1,023.41 | + | 1.40 | ||||||||
| * | Expenses are calculated using the Fund’s annualized net expense ratio, which represents the ongoing expenses as a percentage of net assets for the six months ended June 30, 2013. Expenses are calculated by multiplying the annualized net expense ratio by the average account value for the period; then multiplying the result by the number of days in the most recent fiscal half year; and then dividing that result by the number of days in the fiscal year. The annualized net expense ratio for the period was 0.28%. |
| + | Hypothetical expenses are based on the Fund’s actual annualized net expense ratio and an assumed rate of return of 5% per year before expenses. |
21
GOLDMAN SACHS VARIABLE INSURANCE TRUST MONEY MARKET FUND
Statement Regarding Basis for Approval of Management Agreement (Unaudited)
Background
The Goldman Sachs Money Market Fund (the “Fund”) is an investment portfolio of Goldman Sachs Variable Insurance Trust (the “Trust”). The Board of Trustees oversees the management of the Trust and reviews the investment performance and expenses of the Fund at regularly scheduled meetings held during the year. In addition, the Board of Trustees determines annually whether to approve the continuance of the Trust’s investment management agreement (the “Management Agreement”) with Goldman Sachs Asset Management, L.P. (the “Investment Adviser”) on behalf of the Fund.
The Management Agreement was most recently approved for continuation until June 30, 2014 by the Board of Trustees, including those Trustees who are not parties to the Management Agreement or “interested persons” (as defined in the Investment Company Act of 1940, as amended) of any party thereto (the “Independent Trustees”), at a meeting held on June 12-13, 2013 (the “Annual Meeting”).
The review process undertaken by the Trustees spans the course of the year and culminates with the Annual Meeting. To assist the Trustees in their deliberations, the Trustees have established a Contract Review Committee (the “Committee”), comprised of the Independent Trustees. The Committee held four meetings over the course of the year since the Management Agreement was last approved. At those Committee meetings, regularly scheduled Board or other committee meetings and/or the Annual Meeting, the Board, or the Independent Trustees, as applicable, considered matters relating to the Management Agreement, including:
| (a) | the nature and quality of the advisory, administrative and other services provided to the Fund by the Investment Adviser and its affiliates, including information about: |
| (i) | the structure, staff and capabilities of the Investment Adviser and its portfolio management teams; |
| (ii) | the groups within the Investment Adviser and its affiliates that support the portfolio management teams or provide other types of necessary services, including fund services groups (e.g., accounting and financial reporting, tax, shareholder services and operations), controls and risk management groups (e.g., legal, compliance, valuation oversight, credit risk management, internal audit, compliance testing, market risk analysis, finance and strategy and central funding), sales and distribution support groups and others (e.g., information technology and training); |
| (iii) | trends in headcount; |
| (iv) | the Investment Adviser’s financial resources and ability to hire and retain talented personnel and strengthen its operations; and |
| (v) | the parent company’s support of the Investment Adviser and its mutual fund business, as expressed by the firm’s senior management; |
| (b) | information on the investment performance of the Fund, including comparisons to the performance of a group of similar mutual funds, as provided by a third party mutual fund data provider engaged as part of the contract review process (the “Outside Data Provider”), and general investment outlooks in the markets in which the Fund invests; |
| (c) | the terms of the Management Agreement and agreements with affiliated service providers entered into by the Trust on behalf of the Fund; |
| (d) | expense information for the Fund, including: |
| (i) | the relative management fee and expense level of the Fund as compared to those of comparable funds managed by other advisers, as provided by the Outside Data Provider; |
| (ii) | the Fund’s expense trends over time; and |
| (iii) | to the extent the Investment Adviser manages institutional accounts or collective investment vehicles having investment objectives and policies similar to those of the Fund, comparative information on the advisory fees charged and services provided to those accounts by the Investment Adviser; |
| (e) | with respect to the extensive investment performance and expense comparison data provided by the Outside Data Provider, its processes in producing that data for the Fund; |
| (f) | the undertakings of the Investment Adviser and Goldman, Sachs & Co. (“Goldman Sachs”), the Fund’s affiliated distributor, to waive certain fees in order to maintain a positive yield for the Fund and limit certain expenses of the Fund that exceed a specified level, and a summary of contractual fee reductions made by the Investment Adviser and its affiliates over the past several years with respect to the Fund; |
| (g) | information relating to the profitability of the Management Agreement and the transfer agency and distribution and service arrangements of the Fund and the Trust as a whole to the Investment Adviser and its affiliates; |
| (h) | whether the Fund’s existing management fee schedule adequately addressed any economies of scale; |
| (i) | a summary of the “fall-out” benefits derived by the Investment Adviser and its affiliates from their relationships with the Fund, including the fees received by the Investment Adviser’s affiliates from the Fund for transfer agency, distribution and other services; |
22
GOLDMAN SACHS VARIABLE INSURANCE TRUST MONEY MARKET FUND
Statement Regarding Basis for Approval of Management Agreement (Unaudited) (continued)
| (j) | a summary of potential benefits derived by the Fund as a result of its relationship with the Investment Adviser; |
| (k) | the nature and quality of the services provided to the Fund by its unaffiliated service providers, and the Investment Adviser’s general oversight and evaluation (including reports on due diligence) of those service providers as part of the administration services provided under the Management Agreement; and |
| (l) | the Investment Adviser’s processes and policies addressing various types of potential conflicts of interest; its approach to risk management; the annual review of the effectiveness of the Fund’s compliance program; and periodic compliance reports. |
The Trustees also received an overview of the Fund’s distribution arrangements. They received information regarding the Fund’s assets, share purchase and redemption activity and the payment of Rule 12b-1 distribution and service fees by the Fund. Information was also provided to the Trustees relating to revenue sharing payments made by and services provided by the Investment Adviser and its affiliates to intermediaries that promote the sale, distribution and/or servicing of Fund shares.
The presentations made at the Board and Committee meetings and at the Annual Meeting encompassed the Fund and other mutual fund portfolios for which the Board of Trustees has responsibility. In evaluating the Management Agreement at the Annual Meeting, the Trustees relied upon their knowledge, resulting from their meetings and other interactions throughout the year, of the Investment Adviser, its affiliates, their services and the Fund. In conjunction with these meetings, the Trustees received written materials and oral presentations on the topics covered, and were advised by their independent legal counsel regarding their responsibilities and other regulatory requirements related to the approval and continuation of mutual fund investment management agreements under applicable law. In addition, the Investment Adviser and its affiliates provided the Independent Trustees with a written response to a formal request for information sent on behalf of the Independent Trustees by their independent legal counsel. During the course of their deliberations, the Independent Trustees met in executive sessions with their independent legal counsel, without representatives of the Investment Adviser or its affiliates present. The Independent Trustees also discussed the broad range of other investment choices that are available to Fund investors, including the availability of comparable funds managed by other advisers.
Nature, Extent and Quality of the Services Provided Under the Management Agreement
As part of their review, the Trustees considered the nature, extent and quality of the services provided by the Investment Adviser. In this regard, the Trustees considered both the investment advisory services and non-advisory services that are provided to the Fund by the Investment Adviser and its affiliates. The Trustees noted the transition in the leadership and changes in personnel of various of the Investment Adviser’s portfolio management teams that had occurred in recent periods, and the ongoing recruitment efforts aimed at bringing high quality investment talent to the Investment Adviser. The Trustees concluded that the Investment Adviser continued to commit substantial financial and operational resources to the Fund and expressed confidence that the Investment Adviser would continue to do so in the future. The Trustees also recognized that the Investment Adviser had made significant commitments to address regulatory compliance requirements applicable to the Fund and the Investment Adviser.
Investment Performance
The Trustees also considered the investment performance of the Fund. In this regard, they compared the investment performance of the Fund to its peers using rankings compiled by the Outside Data Provider as of December 31, 2012. The information on the Fund’s investment performance was provided for the one-, three- and five-year periods ending on December 31, 2012.
In addition, the Trustees considered materials prepared and presentations made by the Investment Adviser’s senior management and portfolio management personnel, in which Fund performance was assessed. The Trustees also considered the Investment Adviser’s periodic reports with respect to the Fund’s risk profile, and how the Investment Adviser’s approach to risk monitoring and management influences portfolio management.
The Trustees considered the performance of the Fund in light of its investment objective and the credit parameters. They also considered the challenging yield environment in which the Fund had operated since 2009. They noted that despite volatility in the U.S. and global financial markets since 2009, the Investment Adviser had been able to maintain a stable net asset value and positive yield to meet the demand of the Fund’s investors, in many instances as the result of voluntary fee waivers and expense reimbursements. In light of these considerations, the Trustees believed that the Fund was providing investment performance within a competitive range for investors.
23
GOLDMAN SACHS VARIABLE INSURANCE TRUST MONEY MARKET FUND
Statement Regarding Basis for Approval of Management Agreement (Unaudited) (continued)
Costs of Services Provided and Competitive Information
The Trustees considered the contractual terms of the Management Agreement and the fee rates payable by the Fund thereunder. In this regard, the Trustees considered information on the services rendered by the Investment Adviser to the Fund, which included both advisory and administrative services that were directed to the needs and operations of the Fund as a registered mutual fund.
In particular, the Trustees reviewed analyses prepared by the Outside Data Provider regarding the expense rankings of the Fund. The analyses provided a comparison of the Fund’s management fee to those of a relevant peer group and category universe; an expense analysis which compared the Fund’s overall net and gross expenses to a peer group and a category universe; and a five-year history comparing the Fund’s net expenses to the peer and category medians. The analyses also compared the Fund’s transfer agency and custody fees, other expenses and fee waivers/reimbursements to those of the peer group and category medians. The Trustees concluded that the comparisons provided by the Outside Data Provider were useful in evaluating the reasonableness of the management fees and total expenses paid by the Fund.
In addition, the Trustees considered the Investment Adviser’s undertaking to limit certain expenses of the Fund that exceed a specified level. They noted that the Investment Adviser and Goldman Sachs had taken a number of steps, including waiving fees and reimbursing expenses, in order to maintain a positive yield for the Fund. They also considered, to the extent that the Investment Adviser manages institutional accounts or collective investment vehicles having investment objectives and policies similar to those of the Fund, comparative fee information for services provided by the Investment Adviser to those accounts, and information that indicated that services provided to the Fund differed in various significant respects from the services provided to institutional accounts, which generally operated under less stringent legal and regulatory structures, required fewer services from the Investment Adviser to a smaller number of client contact points, were less time-intensive and paid lower fees.
In addition, the Trustees noted that shareholders are able to redeem their Fund shares at any time if they believe that the Fund fees and expenses are too high or if they are dissatisfied with the performance of the Fund.
Profitability
The Trustees reviewed the Investment Adviser’s revenues and pre-tax profit margins with respect to the Trust and the Fund. In this regard the Trustees noted that they had received, among other things, profitability analyses and summaries, revenue and expense schedules by Fund and by function (i.e., investment management, transfer agency and distribution and service) and the Investment Adviser’s expense allocation methodology. They observed that the profitability and expense figures are substantially similar to those used by the Investment Adviser for many internal purposes, including compensation decisions among various business groups, and are thus subject to a vigorous internal debate about how certain revenue and expenses should be allocated. The Trustees also reviewed the report of the internal audit group within the Goldman Sachs organization, which included an assessment of the reasonableness and consistency of the Investment Adviser’s expense allocation methodology and an evaluation of the accuracy of the Investment Adviser’s profitability analysis calculations. Profitability data for the Trust and the Fund were provided for 2012 and 2011, and the Trustees considered this information in relation to the Investment Adviser’s overall profitability. The Trustees considered the Investment Adviser’s revenues and pre-tax profit margins both in absolute terms and in comparison to information on the reported pre-tax profit margins earned by certain other asset management firms.
Economies of Scale
The Trustees considered the information that had been provided regarding the Investment Adviser’s profitability. The Trustees noted that the Fund does not have management fee breakpoints. They considered the asset levels in the Fund; the Fund’s recent purchase and redemption activity; the information provided by the Investment Adviser relating to the costs of the services provided by the Investment Adviser and its affiliates and their realized profits; information comparing the contractual fee rates charged by the Investment Adviser with fee rates charged to other money market funds in the peer group; the Investment Adviser’s undertaking to limit certain expenses of the Fund that exceed a specified level; and the willingness of Goldman Sachs to waive certain fees on a temporary basis in order to maintain a positive Fund yield. They considered a report prepared by the Outside Data Provider, which surveyed money market funds’ management fee arrangements and use of breakpoints. The Trustees also considered the competitive nature of the money market fund business and the competitiveness of the fees charged to the Fund by the Investment Adviser. They also observed that the Investment Adviser’s (and its affiliates’) level of profitability had been reduced as a result of fee waivers and expense limitations.
24
GOLDMAN SACHS VARIABLE INSURANCE TRUST MONEY MARKET FUND
Statement Regarding Basis for Approval of Management Agreement (Unaudited) (continued)
Other Benefits to the Investment Adviser and Its Affiliates
The Trustees also considered the other benefits derived by the Investment Adviser and its affiliates from their relationship with the Fund as stated above, including: (a) transfer agency fees received by Goldman Sachs; (b) trading efficiencies resulting from aggregation of orders of the Fund with those for other funds or accounts managed by the Investment Adviser; (c) the Investment Adviser’s ability to leverage the infrastructure designed to service the Fund on behalf of its other clients; (d) the Investment Adviser’s ability to cross-market other products and services to Fund shareholders; (e) Goldman Sachs’ retention of certain fees as Fund Distributor; (f) Goldman Sachs’ ability to engage in principal transactions with the Fund under the SEC exemptive orders permitting such trades; (g) the Investment Adviser’s ability to negotiate better pricing with custodians on behalf of its other clients, as a result of the relationship with the Fund; and (h) the possibility that the working relationship between the Investment Adviser and the Fund’s third party service providers may cause those service providers to be open to doing business with other areas of Goldman Sachs. In the course of considering the foregoing, the Independent Trustees requested and received further information quantifying certain of these fall-out benefits.
Other Benefits to the Fund and Its Shareholders
The Trustees also noted that the Fund receives certain potential benefits as a result of its relationship with the Investment Adviser, including: (a) trading efficiencies resulting from aggregation of orders of the Fund with those of other funds or accounts managed by the Investment Adviser; (b) improved servicing from vendors because of the volume of business generated by the Investment Adviser and its affiliates; (c) improved servicing from broker-dealers because of the volume of business generated by the Investment Adviser and its affiliates; (d) the Investment Adviser’s knowledge and experience gained from managing other accounts and products; (e) the Investment Adviser’s ability to hire and retain qualified personnel to provide services to the Fund because of the reputation of the Goldman Sachs organization; (f) the Fund’s access, through the Investment Adviser, to certain firmwide resources (e.g., proprietary risk management systems and databases), subject to certain restrictions; and (g) the Fund’s access to certain affiliated distribution channels. The Trustees noted the competitive nature of the mutual fund marketplace, and noted further that many of the Fund’s shareholders invested in the Fund in part because of the Fund’s relationship with the Investment Adviser and that those shareholders have a general expectation that the relationship will continue.
Conclusion
In connection with their consideration of the Management Agreement, the Trustees gave weight to each of the factors described above, but did not identify any particular factor as controlling their decision. After deliberation and consideration of all of the information provided, including the factors described above, the Trustees concluded, in the exercise of their business judgment, that the management fees paid by the Fund were reasonable in light of the services provided to it by the Investment Adviser, the Investment Adviser’s costs and the Fund’s current and reasonably foreseeable asset levels. The Trustees unanimously concluded that the Investment Adviser’s continued management likely would benefit the Fund and its shareholders and that the Management Agreement should be approved and continued with respect to the Fund until June 30, 2014.
25
| TRUSTEES | OFFICERS | |
| Ashok N. Bakhru, Chairman | James A. McNamara, President | |
| Donald C. Burke | George F. Travers, Principal Financial Officer | |
| John P. Coblentz, Jr. | Caroline L. Kraus, Secretary | |
| Diana M. Daniels | Scott M. McHugh, Treasurer | |
| Joseph P. LoRusso | ||
| James A. McNamara | ||
| Jessica Palmer | ||
| Alan A. Shuch | ||
| Richard P. Strubel |
GOLDMAN, SACHS & CO.
Distributor and Transfer Agent
GOLDMAN SACHS ASSET MANAGEMENT, L.P.
Investment Adviser
200 West Street, New York
New York 10282
Visit our Website at www.goldmansachsfunds.com/vit to obtain the most recent month-end returns.
The reports concerning the Fund included in this shareholder report may contain certain forward-looking statements about the factors that may affect the performance of the Fund in the future. These statements are based on Fund management’s predictions and expectations concerning certain future events and their expected impact on the Fund, such as performance of the economy as a whole and of specific industry sectors, changes in the levels of interest rates, the impact of developing world events, and other factors that may influence the future performance of the Fund. Management believes these forward-looking statements to be reasonable, although they are inherently uncertain and difficult to predict. Actual events may cause adjustments in portfolio management strategies from those currently expected to be employed.
A description of the policies and procedures that the Fund uses to determine how to vote proxies relating to portfolio securities and information regarding how the Fund voted proxies relating to portfolio securities during the most recent 12-month period ended June 30 is available (i) without charge, upon request by calling 1-800-621-2550; and (ii) on the Securities and Exchange Commission (“SEC”) Web site at http://www.sec.gov.
The Fund files its complete schedule of portfolio holdings with the SEC for the first and third quarters of each fiscal year on Form N-Q. The Fund’s Form N-Q is available on the SEC’s website at http://www.sec.gov within 60 days after the Fund’s first and third fiscal quarters. The Fund’s Forms N-Q may be reviewed and copied at the SEC’s Public Reference Room in Washington, D.C. and information on the operation of the Public Reference Room may also be obtained by calling 1-800-SEC-0330. Form N-Q may be obtained upon request and without charge by calling 1-800-621-2550.
Holdings and allocations shown are as of June 30, 2013 and may not be representative of future investments. Fund holdings should not be relied on in making investment decisions and should not be construed as research or investment advice regarding particular securities. Current and future holdings are subject to risk.
The portfolio risk management process includes an effort to monitor and manage risk, but does not imply low risk.
Shares of the Goldman Sachs VIT Funds are offered to separate accounts of participating life insurance companies for the purpose of funding variable annuity contracts and variable life insurance policies. Shares of the Fund are not offered directly to the general public. The variable annuity contracts and variable life insurance policies are described in the separate prospectuses issued by participating insurance companies. You should refer to those prospectuses for information about surrender charges, mortality and expense risk fees and other charges that may be assessed by participating insurance companies under the variable annuity contracts or variable life insurance policies. Such fees or charges, if any, may affect the return you may realize with respect to your investments. Ask your representative for more complete information. Please consider a fund’s objectives, risks and charges and expenses, and read the prospectus carefully before investing. The prospectus contains this and other information about the Fund.
This material is not authorized for distribution to prospective investors unless preceded or accompanied by a current Prospectus or summary prospectus, if applicable. Investors should consider a Fund’s objective, risks, and charges and expenses, and read the summary prospectus, if available, and/or the Prospectus carefully before investing or sending money. The summary prospectus, if available, and the Prospectus contain this and other information about a Fund and may be obtained from your authorized dealer or from Goldman, Sachs & Co. by calling 1-800-621-2550.
This report is prepared for the general information of contract owners and is not an offer of shares of the Goldman Sachs Variable Insurance Trust: Goldman Sachs Money Market Fund.
© 2013 Goldman Sachs. All rights reserved.
VITMMSAR13/106788.MF.MED.TMPL/8/2013
Goldman
Sachs Variable Insurance Trust
Goldman Sachs Core Fixed Income Fund
Goldman Sachs Equity Index Fund
Goldman Sachs Growth Opportunities Fund
Goldman Sachs High Quality Floating Rate Fund*
Semi-Annual Report
June 30, 2013
| * | Formerly, Goldman Sachs Government Income Fund. Effective at the close of business April 30, 2013, the Fund changed its name to the Goldman Sachs High Quality Floating Rate Fund. |

GOLDMAN SACHS VARIABLE INSURANCE TRUST FUNDS
Principal Investment Strategies and Risks
This is not a complete list of the risks that may affect the Funds. For additional information concerning the risks applicable to the Funds, please see the Funds’ Prospectuses.
Shares of the Goldman Sachs Variable Insurance Trust Funds are offered to separate accounts of participating life insurance companies for the purpose of funding variable annuity contracts and variable life insurance policies. Shares of the Funds are not offered directly to the general public. The variable annuity contracts and variable life insurance policies are described in the separate prospectuses issued by participating insurance companies. You should refer to those prospectuses for information about surrender charges, mortality and expense risk fees and other charges that may be assessed by participating insurance companies under the variable annuity contracts or variable life insurance policies. Such fees or charges, if any, may affect the return you realize with respect to your investments. Ask your representative for more complete information. Please consider a Fund’s objective, risks and charges and expenses, and read the Prospectus carefully before investing. The Prospectus contains this and other information about a Fund.
The Goldman Sachs Core Fixed Income Fund invests primarily in fixed income securities, including U.S. government securities, corporate debt securities, privately issued mortgage-backed securities and asset-backed securities. The Fund’s investments in fixed income securities are subject to the risks associated with debt securities generally, including credit, liquidity and interest rate risk. Any guarantee on U.S. government securities applies only to the underlying securities of the Fund if held to maturity and not to the value of the Fund’s shares. Investments in mortgage-backed securities are also subject to prepayment risk (i.e., the risk that in a declining interest rate environment, issuers may pay principal more quickly than expected, causing the Fund to reinvest proceeds at lower prevailing interest rates). Foreign and emerging markets investments may be more volatile and less liquid than investments in U.S. securities and are subject to the risks of currency fluctuations and adverse economic and political developments. Derivative instruments may involve a high degree of financial risk. These risks include the risk that a small movement in the price of the underlying security or benchmark may result in a disproportionately large movement, unfavorable or favorable, in the price of the derivative instrument; risks of default by a counterparty; and liquidity risk (i.e., the risk that an investment may not be able to be sold without a substantial drop in price, if at all).
The Goldman Sachs Equity Index Fund attempts to replicate the aggregate price and yield performance of a benchmark index (i.e., the Standard & Poor’s 500 Index) that measures the investment returns of large capitalization stocks. The Fund’s equity investments are subject to market risk, which means that the value of the securities in which it invests may go up or down in response to the prospects of individual companies, particular sectors and/or general economic conditions. The Fund is not actively managed, and therefore the Fund will not typically dispose of a security until the security is removed from the index. Performance may vary substantially from the performance of the benchmark it tracks as a result of share purchases and redemptions, transaction costs, expenses and other factors.
The Goldman Sachs Growth Opportunities Fund invests primarily in U.S. equity investments with a primary focus on mid-capitalization companies. The Fund’s equity investments are subject to market risk, which means that the value of the securities in which it invests may go up or down in response to the prospects of individual companies, particular sectors and/or general economic conditions. The securities of mid-capitalization companies involve greater risks than those associated with larger, more established companies and may be subject to more abrupt or erratic price movements. Different investment styles (e.g., “growth”) tend to shift in and out of favor, and at times the Fund may underperform other funds that invest in similar asset classes.
1
GOLDMAN SACHS VARIABLE INSURANCE TRUST FUNDS
The Goldman Sachs High Quality Floating Rate Fund invests primarily in high quality floating rate or variable rate obligations, and the Fund considers “high quality” obligations to be (i) those rated AAA or Aaa by a nationally recognized statistical rating organization at the time of purchase (or, if unrated, determined by the Investment Adviser to be of comparable quality), and (ii) U.S. government securities, including mortgage-backed securities, and repurchase agreements collateralized by U.S. government securities. The Fund’s investments in fixed income securities are subject to the risks associated with debt securities generally, including credit, liquidity and interest rate risk. Any guarantee on U.S. government securities applies only to the underlying securities of the Fund if held to maturity and not to the value of the Fund’s shares. Investments in mortgage-backed securities are also subject to prepayment risk (i.e., the risk that in a declining interest rate environment, issuers may pay principal more quickly than expected, causing the Fund to reinvest proceeds at lower prevailing interest rates). Foreign investments may be more volatile and less liquid than investments in U.S. securities and are subject to the risks of adverse economic or political developments. Derivative instruments may involve a high degree of financial risk. These risks include the risk that a small movement in the price of the underlying security or benchmark may result in a disproportionately large movement, unfavorable or favorable, in the price of the derivative instrument; the risk of default by a counterparty; and liquidity risk. At times, the Fund may be unable to sell certain of its illiquid investments without a substantial drop in price, if at all.
2
MARKET REVIEW
Goldman Sachs Variable Insurance Trust Funds
Market Review
During the six months ended June 30, 2013 (the “Reporting Period”), U.S. equities recorded strong gains, while U.S. fixed income markets generally declined.
Equity Markets
U.S. equities, as represented by the S&P® 500 Index, extended their rally from 2012 with a strong first quarter in 2013. Indeed, the S&P® 500 Index finished the first quarter of 2013 with significant gains, making a five-year high during these months. The Dow Jones Industrial Average also hit a new record high during the first calendar quarter.
Despite the overhang of automatic spending cuts, or sequestration, that went into effect in March 2013, U.S. equity markets reflected a variety of improving economic indicators. Strong momentum in the housing market continued, as the Case-Shiller Index of house prices rose 8.1% in January 2013, year-over-year the fastest pace since mid-2006. The employment picture also improved, with the unemployment rate dropping to 7.7%. Strong retail sales suggested consumers may have been feeling the effects of better housing and labor market conditions.
After a strong start to the second quarter of 2013, bullish sentiment began to fade, and the U.S. equity rally halted in mid-May 2013 when Federal Reserve (“Fed”) Chair Bernanke announced the potential “tapering” of the pace of quantitative easing asset purchases. U.S. equity markets reacted negatively again in June to news the slowing of the asset purchase program could begin later this year, with the program ending by the middle of 2014 if the economy grows as expected. U.S. equity markets calmed toward the end of the month as a downward revision of first quarter Gross Domestic Product (“GDP”) from 2.4% to 1.8% supported reassurance from the Fed that it would only begin reducing asset purchases if the economy was clearly on track. Still, the S&P® 500 Index declined modestly in June 2013, ending seven consecutive months of gains and muting returns for the quarter as a whole. Even with that, both the S&P® 500 Index and the Dow Jones Industrial Average made fresh record highs, fueled by the continued strong rebound in house prices during the second calendar quarter, and returns for the Reporting Period overall were still significantly up.
For the Reporting Period as a whole, all ten sectors within the S&P® 500 Index posted gains. Health care did best, followed closely by consumer discretionary and financials. Conversely, materials performed worst, as commodity prices were volatile in part due to a slowing Chinese economy. Information technology, utilities, telecommunication services and energy were also comparatively weak, though still producing positive returns.
All segments of the U.S. equity market advanced during the Reporting Period, with small-cap stocks, as measured by the Russell 2000® Index, gaining most, followed by mid-cap stocks and then large-cap stocks, as measured by the Russell Midcap® Index and the Russell 1000® Index, respectively. From a style perspective, value-oriented stocks solidly outpaced growth-oriented stocks in the large-cap and mid-cap segments of the U.S. equity market; however, growth stocks substantially outperformed value stocks in the small-cap segment of the U.S. equity market. (All as measured by the Russell Investments indices.)
Fixed Income Markets
When the Reporting Period began in January 2013, risk appetite in the fixed income markets was supported by a last-minute deal on the fiscal cliff, as U.S. lawmakers agreed to extend the Bush-era tax cuts for all but the highest income earners. Spread, or non-U.S. Treasury, fixed income sectors rallied, and the yields on U.S. Treasury securities rose. This trend reversed itself during February 2013, as market volatility increased, primarily on worries about U.S. fiscal policy gridlock and Italy’s elections. The center-left’s failure to gain a majority in the upper house of Italy’s legislature raised concerns about the prospects for a stable coalition government and the country’s commitment to reform.
In March 2013, tensions resurfaced in the Eurozone, as Cyprus’ bailout by Euro-area finance ministers raised the prospect of a tax on bank deposits, prompting fears of a more widespread run on European banks. As investors grew more defensive, U.S. Treasury yields declined. Spread sectors remained relatively firm. In the U.S., Congress chose to not act on the automatic federal spending cuts known as the sequester, allowing them to start taking effect. Still, the U.S. housing and labor markets continued to show signs of strength, which was interpreted to mean the Fed could begin laying the groundwork for policy tightening.
3
MARKET REVIEW
In early April 2013, U.S. economic data softened somewhat but was followed later in the month by more positive signs —employment and housing market data were strong. U.S. Treasury yields declined on the disappointing economic data in early April, stabilizing later in the month. Spread sectors also performed well, as investors looked past sluggish economic data for higher yielding assets in the exceptionally low interest rate environment.
At the beginning of May 2013, U.S. economic data continued to show signs of recovery with strong housing price appreciation and improvement in the jobs picture. Later in May, during testimony to Congress, Fed Chair Ben Bernanke said the central bank could begin reducing asset purchases. The case for the “taper” was supported by more positive economic reports, including better payrolls, consumer confidence and housing data. In response to Bernanke’s testimony, U.S. Treasury yields rose substantially. At the same time, spread sectors grew more volatile, reflecting widespread uncertainty over how markets might function should the Fed withdraw support.
In June 2013, bond investors focused on the U.S. economy and stronger than expected payrolls data, which reinforced expectations the Fed may start reducing its quantitative easing during 2013. U.S. Treasury yields continued to rise, as the Fed meeting and press conference were more hawkish than expected. Spread sectors remained volatile.
Looking Ahead
Equity Markets
As we enter the second half of 2013, we continue to be constructive on the U.S. equity market. Despite a strong first half of 2013, we believe the case for investing in U.S. equities remains compelling. In our view, at the end of the Reporting Period, valuations were reasonable, as the S&P 500® Index was trading below its historical average price-to-earnings (P/E) multiple and offered an attractive dividend yield of approximately 2%. We believe the strength of corporate balance sheets provides companies with a number of options to enhance shareholder value going forward. Signs of improving U.S. economic growth remained intact at the end of June 2013, supported by a continued recovery in the U.S. housing market and in consumer confidence. However, some headwinds also remained, given market concerns about the Fed tapering asset purchases, rising interest rates, fiscal policy’s drag on economic growth and global economic weakness. We believe it is important to recognize that rising interest rates and advancing equity markets are not necessarily mutually exclusive. We feel equities have the potential to continue to rise in an increasing rate environment driven by improving U.S. economic growth and given that the absolute level of rates still remains low by historical standards. Additional catalysts could be improved sentiment and increased flows into equities.
Fixed Income Markets
In our view, strengthening U.S. economic growth is likely have a significant impact on global bond markets during the second half of 2013. Though we believe the Fed is unlikely to hike the federal funds target rate until at least 2015, the U.S. central bank’s comments about monetary tightening have pushed bond yields higher across the board. In the coming months, we expect fixed income markets to remain volatile as investors adjust to the prospect of a shift in Fed policy.
In the spread sectors, at the end of the Reporting Period, fundamental credit quality remained unchanged. U.S. corporate bonds continued to benefit from healthy balance sheets, solid profits and low defaults, while the emerging markets had relatively low debt-to-GDP ratios and sound fiscal balances. We believe the price declines during the Reporting Period brought value back into spread sectors, which had become expensive. Should markets stabilize, we expect to find a number of attractive investment opportunities.
4
GOLDMAN SACHS VARIABLE INSURANCE TRUST — GOLDMAN SACHS CORE FIXED INCOME FUND
INVESTMENT OBJECTIVE
The Fund seeks a total return consisting of capital appreciation and income that exceeds the total return of the Barclays U.S. Aggregate Bond Index.
Portfolio Management Discussion and Analysis
Below, the Goldman Sachs Fixed Income Investment Management Team discusses the Goldman Sachs Variable Insurance Trust — Goldman Sachs Core Fixed Income Fund’s (the “Fund”) performance and positioning for the six-month period ended June 30, 2013 (the “Reporting Period”).
How did the Fund perform during the Reporting Period?
During the Reporting Period, the Fund’s Service Shares generated a cumulative total return of -2.37%. This return compares to the -2.44% cumulative total return of the Fund’s benchmark, the Barclays U.S. Aggregate Bond Index (the “Barclays Index”), during the same time period. For the period since their inception on April 30, 2013 through June 30, 2013, the Fund’s Institutional Shares generated a cumulative total return of -3.36% compared to the -3.30% cumulative total return of the Barclays Index.
What key factors were responsible for the Fund’s performance during the Reporting Period?
During the Reporting Period, our top-down cross-sector strategy added to relative returns. Our cross-sector strategy is one in which we invest Fund assets across a variety of fixed income sectors, including some that may not be included in the Barclays Index. Also contributing positively was our bottom-up individual issue selection within the collateralized and corporate bond sectors.
The Fund’s tactical duration and U.S. yield curve positioning detracted from relative performance. Duration is a measure of the Fund’s sensitivity to changes in interest rates. Yield curve indicates a spectrum of maturities.
Which fixed income market sectors most affected Fund performance?
Early in the Reporting Period, as spread sectors rallied on increased economic confidence, the Fund benefited from its overweight relative to the Barclays Index to corporate credit risk and from its exposure to non-agency mortgage-backed securities. Later in the Reporting Period, our long volatility positioning, implemented with swaptions (or options on interest rate swap contracts) within our cross-sector strategy, enhanced relative returns as interest rates rose dramatically in May and June 2013. Our tactical positioning in agency mortgage-backed securities also contributed positively.
The Fund benefited from issue selection within the collateralized sector, particularly among agency pass-through mortgage-backed securities with a “down in coupon” bias (that is, a bias toward securities with lower coupons) and non-agency adjustable rate mortgages (“ARMs”). (Pass-through mortgages consist of a pool of residential mortgage loans, where homeowners’ monthly payments of principal, interest and prepayments pass from the original bank through a government agency or investment bank to investors.) The Fund also benefited from issue selection among industrial and financial corporate bonds.
The Fund was hurt by its overweight relative to the Barclays Index in emerging markets debt, particularly in June 2013 when emerging markets bond prices declined significantly from previous highs. Our issue selection within the government/agency sector also had a negative impact on the Fund’s relative performance.
Did the Fund’s duration and yield curve positioning strategy help or hurt its results during the Reporting Period?
Tactical management of the Fund’s duration and yield curve positioning detracted from its relative returns during the Reporting Period. The Fund was hurt by its short to neutral duration position relative to the duration of the Barclays Index, expressed through a steepening bias in the U.S. Treasury yield curve, during the much of the Reporting Period. This was particularly the case during April 2013 when interest rates declined in response to weak economic data. After the Fed indicated it could begin tapering its asset purchases sooner than the market anticipated, interest rates moved higher, and thus in May and June 2013, the Fund’s short duration positioning somewhat offset the earlier underperformance. U.S. Treasury yields increased during the Reporting Period overall, with the five-year U.S. Treasury yield rising 62 basis points; the 10-year U.S. Treasury yield rising 70 basis points; and the 30-year U.S. Treasury yield rising 56 basis points. (A basis point is 1/100th of a percentage point.)
How did the Fund use derivatives and similar instruments during the Reporting Period?
As market conditions warranted during the Reporting Period, currency transactions were carried out using primarily over-the-counter (“OTC”) forward foreign exchange contracts as well as purchased OTC options. Currency transactions were used as we
5
GOLDMAN SACHS VARIABLE INSURANCE TRUST — GOLDMAN SACHS CORE FIXED INCOME FUND
sought both to enhance returns and to hedge the Fund’s portfolio against currency exchange rate fluctuations. Swaptions were employed to express an outright term structure view and manage volatility (term structure, most often depicted as a yield curve, refers to the term structure of interest rates, which is the relationship between the yield to maturity and the time to maturity for pure discount bonds). In addition, the Fund used credit default swaps to manage exposure to fluctuations in credit spreads (or the differential in yields between U.S. Treasury securities and non-Treasury securities that are identical in all respects except for quality rating). Interest rate swaps were utilized to manage exposure to fluctuations in interest rates. Also, Treasury futures were used as warranted to facilitate specific duration, yield curve and country strategies. Overall, we employ derivatives and similar instruments for the efficient management of the Fund’s portfolio. Derivatives and similar instruments allow us to manage interest rate, credit and currency risks more effectively by allowing us both to hedge and to apply active investment views with greater versatility and to afford greater risk management precision than we would otherwise be able to implement.
Were there any notable changes in the Fund’s weightings during the Reporting Period?
During the Reporting Period, we shifted the Fund from an overweight position in agency mortgage-backed securities to an underweight relative to the Barclays Index. We also moved the Fund from an overweight in corporate credit risk to a neutral position compared to the Barclays Index.
How was the Fund positioned relative to the Barclays Index at the end of the Reporting Period?
At the end of the Reporting Period, the Fund was underweight U.S. government securities relative to the Barclays Index. It was overweight investment grade corporate bonds, residential mortgage-backed securities and asset-backed securities compared to the Barclays Index. It was more modestly overweight quasi-government bonds and slightly underweight commercial mortgage-backed securities and pass-through mortgage securities. In addition, the Fund had exposure to covered bonds and emerging markets debt. (Covered bonds are securities created from either mortgage loans or public sector loans.)
6
GOLDMAN SACHS VARIABLE INSURANCE TRUST — GOLDMAN SACHS EQUITY INDEX FUND
INVESTMENT OBJECTIVE
The Fund seeks to achieve investment results that correspond to the aggregate price and yield performance of a benchmark index that measures the investment returns of large capitalization stocks.
Portfolio Management Discussion and Analysis
Below, SSgA Funds Management, Inc. (“SSgA”), the Fund’s Subadvisor, discusses the Goldman Sachs Variable Insurance Trust — Goldman Sachs Equity Index Fund’s (the “Fund”) performance and positioning for the six-month period ended June 30, 2013 (the “Reporting Period”).
How did the Fund perform during the Reporting Period?
During the Reporting Period, the Fund’s Service Shares generated a cumulative total return of 13.57%. This return compares to the 13.82% cumulative total return of the Fund’s benchmark, the Standard & Poor’s® 500 Index (with dividends reinvested) (the “S&P 500 Index”), during the same time period.
During the Reporting Period, which sectors and which industries in the S&P 500 Index were the strongest contributors to the Fund’s performance?
All 10 sectors in the S&P 500 Index advanced during the Reporting Period. In terms of total return, the sectors that made the strongest positive contributions to the S&P 500 Index and to the Fund were health care, consumer discretionary and financials. The largest sector by weighting in the S&P 500 Index at the end of the Reporting Period was information technology at a weighting of 17.81%. The industries with the strongest performance in terms of total return were office electronics; diversified consumer services; biotechnology; airlines; and leisure equipment and products.
On the basis of impact (which takes both total returns and weightings into account), the sectors that made the strongest positive contributions to the S&P 500 Index and to the Fund were financials, health care and consumer discretionary. The industries with the strongest performance on the basis of impact were pharmaceuticals; insurance; oil, gas and consumable fuels; media; and diversified financial services.
Which sectors and industries in the S&P 500 Index were the weakest contributors to the Fund’s performance?
In terms of total return, during the Reporting Period, the weakest performing sectors were materials, information technology and energy. The weakest performing industries in terms of total return were metals and mining; computers and peripherals; construction materials; gas utilities; and real estate investment trusts.
On the basis of impact, the weakest performing sectors were materials, telecommunication services and utilities. The weakest performing industries were computers and peripherals; metals and mining; construction materials; gas utilities; and real estate management and development.
Which individual stocks were the top performers, and which were the greatest detractors?
On the basis of impact, the stocks that made the strongest positive contribution were Microsoft, Johnson & Johnson, Google, Berkshire Hathaway and Wells Fargo. The weakest performers were Apple, Oracle, Newmont Mining, Freeport-McMoRan Copper & Gold and EMC.
How did the Fund use derivatives and similar instruments during the Reporting Period?
During the Reporting Period, we did not use derivatives as part of an active management strategy to add value to the Fund’s results. However, we used equity index futures to equitize the Fund’s cash holdings. In other words, we put the Fund’s cash holdings to work by using them as collateral for the purchase of equity index futures. We also used these equity index futures to provide liquidity for daily cash flow requirements.
What changes were made to the makeup of the S&P 500 Index during the Reporting Period?
Seven stocks were removed from the S&P 500 Index during the Reporting Period. They were Federated Investors, Big Lots, MetroPCS Communications, Coventry Health Care, Dean Foods, H.J. Heinz and First Horizon National.
There were also seven additions to the S&P 500 Index during the Reporting Period. They were AbbVie, PVH, Regeneron Pharmaceuticals, Macerich, Kansas City Southern, General Motors and Zoetis.
7
GOLDMAN SACHS VARIABLE INSURANCE TRUST — GOLDMAN SACHS HIGH QUALITY FLOATING RATE FUND
INVESTMENT OBJECTIVE
The Fund seeks to provide a high level of current income, consistent with low volatility of principal.
Portfolio Management Discussion and Analysis
Effective after the close of business on April 30, 2013, the Goldman Sachs Variable Insurance Trust — Goldman Sachs Government Income Fund was renamed and repositioned as the Goldman Sachs Variable Insurance Trust — Goldman Sachs High Quality Floating Rate Fund (the “Fund”). At the same time, the Fund’s performance benchmark was changed from the Barclays Government/Mortgage Index (the “Barclays Index”) to the BofA ML Three-Month U.S. Treasury Bill Index (the “BofA Index”), which the Investment Adviser believes is a more appropriate benchmark against which to measure the Fund’s performance in light of changes to the Fund’s investment strategies. The performance information reported below is the combined performance of the Fund, reflecting current and prior investment objectives, strategies and policies.
Below, the Goldman Sachs Fixed Income Investment Management Team discusses the Fund’s performance and positioning for the six-month period ended June 30, 2013 (the “Reporting Period”).
How did the Fund perform during the Reporting Period?
During the Reporting Period, the Fund’s Service Shares generated a cumulative total return of -0.08%. This return compares to the 0.04% cumulative total return of the Fund’s new benchmark, the BofA Index for the same time period. To compare, the Fund’s former benchmark, the Barclays Index, generated a -2.02% cumulative total return during the same time period. For the period since their inception on April 30, 2013 through June 30, 2013, the Fund’s Institutional Shares generated a cumulative total return of -0.11% compared to the 0.02% cumulative total return of the BofA Index and a -2.62% cumulative total return of the Barclays Index.
How did the Fund’s investment strategy change as a result of its renaming and repositioning at the end of business on April 30, 2013?
The Fund’s investment objective changed from seeking “a high level of current income, consistent with safety of principal” to seeking “to provide a high level of current income, consistent with low volatility of principal.” The Fund, which formerly invested primarily in U.S. government securities, focuses, as of close of business on April 30, 2013, on high quality floating rate or variable rate obligations.
What key factors had the greatest impact on the Fund’s performance between January 1, 2013 and April 30, 2013 (“the initial part of the Reporting Period”)?
During the initial part of the Reporting Period, the Fund’s duration and yield curve positioning detracted from relative performance. Duration is a measure of the Fund’s sensitivity to changes in interest rates. Yield curve indicates a spectrum of maturities.
Contributing positively was our bottom-up individual issue selection in the collateralized sector. Our top-down cross-sector strategy also enhanced returns. In our cross-sector strategy, we invest Fund assets across a variety of fixed income sectors, including some that may not be included in the Barclays Index.
Which fixed income market sectors helped or hurt Fund performance during the initial part of the Reporting Period?
Issue selection within the collateralized sector added the most to relative performance during the initial part of the Reporting Period. In particular, the Fund benefited from our focus on mortgage pass-through securities, specifically those with lower coupons. We consider lower coupon mortgage pass-through securities less susceptible to prepayment risk. (Pass-through mortgages consist of a pool of residential mortgage loans, where homeowners’ monthly payments of principal, interest and prepayments pass from the original bank through a government agency or investment bank to investors.) Our issue selection among agency collateralized mortgage obligations (“CMOs”) also contributed positively. Detracting from the Fund’s relative returns was our issue selection of government and agency securities, particularly selection of Fannie Mae agency bonds and Tennessee Valley Authority (“TVA”) agency bonds. In addition, our selection of U.S. Treasury futures dampened Fund performance.
8
GOLDMAN SACHS VARIABLE INSURANCE TRUST — GOLDMAN SACHS HIGH QUALITY FLOATING RATE FUND
Within our cross-sector strategy, the Fund’s underweight relative to the Barclays Index in agency debentures was advantageous. However, the Fund’s exposure to U.S. swap spreads detracted from relative results. (A swap spread is the difference in yield between a fixed-rate interest rate swap and a U.S. government bond of the same maturity.)
Did the Fund’s duration and yield curve positioning strategy help or hurt its results during the initial part of the Reporting Period?
Tactical management of the Fund’s duration and yield curve positioning detracted from its relative performance during the initial part of the Reporting Period. The Fund was hurt by its underweight positions in the seven-year, 10-year and 20-year segments of the U.S. Treasury yield curve when yields increased during February 2013. This performance was somewhat offset by the positive contribution of the Fund’s steepening bias in the three-year and five-year segments of the U.S. Treasury yield curve. U.S. Treasury yields declined during the initial part of the Reporting Period, with the five-year U.S. Treasury yield dropping five basis points; the 10-year U.S. Treasury yield falling eight basis points; and the 30-year U.S. Treasury yield declining seven basis points. (A basis point is 1/100th of a percentage point.)
How did the Fund use derivatives and similar instruments during the initial part of the Reporting Period?
As market conditions warranted during the initial part of the Reporting Period, the Fund engaged in U.S. Treasury futures to hedge interest rate exposure and facilitate specific duration and yield curve strategies. In addition, interest rate swaps were used to manage exposure to fluctuations in interest rates. Swaptions (or options on interest rate swap contracts) were employed to express our investment views and manage volatility. Overall, we employed derivatives and similar instruments for the efficient management of the Fund’s portfolio. Derivatives and similar instruments allowed us to manage interest rate, credit and currency risks more effectively by allowing us both to hedge and to apply active investment views with greater versatility and to afford greater risk management precision than we would otherwise be able to implement.
Were there any notable changes in the Fund’s weightings during the initial part of the Reporting Period?
We shifted the Fund from a neutral duration position relative to the Barclays Index to a comparatively short duration position at the end of March 2013 and then to a more modest short duration position relative to the Barclays Index by the end of the initial part of the Reporting Period. We also increased the Fund’s long volatility positioning, accomplished through swaptions, during the initial part of the Reporting Period.
How was the Fund positioned relative to the Barclays Index at the end of the initial part of the Reporting Period?
At the end of the initial part of the Reporting Period, the Fund was significantly underweight U.S. government securities relative to the Barclays Index. It had investments in quasi-government bonds, asset-backed securities (“ABS”), agency CMOs and pass-through mortgage securities, none of which are represented in the benchmark.
What key factors had the greatest impact on the Fund’s performance between April 30, 2013 and June 30, 2013 (“the latter part of the Reporting Period”)?
During the latter part of the Reporting Period, our top-down cross-sector strategy detracted from relative performance. In our cross-sector strategy, we invest Fund assets across a variety of fixed income sectors, including some that may not be included in the BofA Index. Bottom-up issue selection of investment grade corporate bonds also dampened returns.
On the positive side, the Fund’s duration and yield curve positioning contributed positively. In addition, the Fund benefited from our issue selection in the collateralized sector and among government/agency bonds.
Which fixed income market sectors helped or hurt Fund performance during the latter part of the Reporting Period?
Within our cross-sector strategy, the Fund’s overweight compared to the BofA Index in mortgage-backed securities was the largest detractor from relative performance during the latter part of the Reporting Period. Concern that the Fed would begin tapering its asset purchases earlier than previously expected led to a sell-off in the mortgage-backed securities market and a widening of mortgage-backed securities spreads (yield differentials between mortgage-backed securities and comparable maturity U.S. Treasury securities). In addition, bottom-up issue selection of agency securities, mortgage pass-through securities and corporate bonds hampered results. In particular, the Fund was hurt by issue selection of short maturity, high credit quality corporate bonds. The Fund’s exposure to U.S. swap spreads also detracted from relative performance.
The Fund benefited from our issue selection in the collateralized sector, which was concentrated in agency adjustable rate mortgage-backed securities (“ARMs”) and agency collateralized CMOs. In addition, issue selection among U.S. Treasury securities and U.S. Treasury futures added to performance.
9
GOLDMAN SACHS VARIABLE INSURANCE TRUST — GOLDMAN SACHS HIGH QUALITY FLOATING RATE FUND
Did the Fund’s duration and yield curve positioning strategy help or hurt its results during the latter part of the Reporting Period?
Tactical management of the Fund’s duration and yield curve positioning added slightly to its relative performance during the latter part of the Reporting Period. Most of the positive return was attributable to the Fund’s underweighted positions relative to the BofA Index in the three-year, five-year, 10-year and 20-year segments of the U.S. Treasury yield curve, as core government bond markets sold off. These results were partially offset by the Fund’s overweighted positions relative to the BofA Index in the seven-year and 30-year segments of the U.S. Treasury yield curve. Interest rates increased and credit spreads (or yield differentials between bonds of similar maturities) widened during the latter part of the Reporting Period, as the prospect of potential Fed monetary tightening produced an uptick in volatility across the fixed income markets. U.S. Treasury yields rose during the latter part of the Reporting Period, with the five-year U.S. Treasury yield climbing 72 basis points; the 10-year U.S. Treasury yield rising 81 basis points; and the 30-year U.S. Treasury yield increasing 62 basis points.
How did the Fund use derivatives and similar instruments during the latter part of the Reporting Period?
As market conditions warranted during the latter part of the Reporting Period, the Fund engaged in U.S. Treasury futures to hedge interest rate exposure and facilitate specific duration and yield curve strategies. In addition, interest rate swaps were used to manage exposure to fluctuations in interest rates. Swaptions (or options on interest rate swap contracts) were employed to express our investment views and managed volatility. Overall, we employ derivatives and similar instruments for the efficient management of the Fund’s portfolio. Derivatives and similar instruments allow us to manage interest rate, credit and currency risks more effectively by allowing us both to hedge and to apply active investment views with greater versatility and to afford greater risk management precision than we would otherwise be able to implement.
Were there any notable changes in the Fund’s weightings during the latter part of the Reporting Period?
In the latter part of the Reporting Period, as the Fund’s investment strategy changed, we reduced its allocations to U.S. Treasury securities and agency securities and increased its allocations to mortgage-backed securities and ABS. More specifically, we increased the Fund’s overweight in agency mortgage-backed securities and non-agency mortgage-backed securities. We also increased the Fund’s long volatility positioning, accomplished through swaptions, during the latter part of the Reporting Period.
How was the Fund positioned relative to the BofA Index at the end of the Reporting Period?
At the end of the Reporting Period, the Fund was significantly underweight U.S. government securities relative to the BofA Index. It had positions in ABS, agency ARMs and agency CMOs, none of which are represented in the benchmark.
10
GOLDMAN SACHS VARIABLE INSURANCE TRUST — GOLDMAN SACHS GROWTH OPPORTUNITIES FUND
INVESTMENT OBJECTIVE
The Fund seeks long-term growth of capital.
Portfolio Management Discussion and Analysis
Below, the Goldman Sachs Growth Equity Management Team discusses the Goldman Sachs Variable Insurance Trust — Goldman Sachs Growth Opportunities Fund’s (the “Fund”) performance and positioning for the six-month period ended June 30, 2013 (the “Reporting Period”).
How did the Fund perform during the Reporting Period?
During the Reporting Period, the Fund’s Service Shares generated a cumulative total return of 10.82%. This return compares to the 14.70% cumulative total return of the Fund’s benchmark, the Russell Midcap® Growth Index (with dividends reinvested) (the “Russell Index”), during the same time period. For the period since their inception on April 30, 2013 through June 30, 2013, the Fund’s Institutional Shares generated a cumulative total return of 0.26% compared to the 1.89% cumulative total return of the Russell Index.
What key factors were responsible for the Fund’s performance during the Reporting Period?
The Fund underperformed the Russell Index largely because of stock selection.
Which equity market sectors contributed to Fund performance?
Our bottom-up approach focuses on security selection, and as a result, we do not make active sector-level investment decisions. That said, on a sector level, security selection in the consumer discretionary, information technology and industrials sectors detracted from the Fund’s relative performance. Stock picks in the financials and materials sectors contributed positively to Fund results.
Which individual stocks detracted from the Fund’s performance during the Reporting Period?
Rackspace Hosting, a leading provider of managed hosting and cloud computing services, detracted from the Fund’s relative performance during the Reporting Period. Rackspace Hosting reported disappointing results in its fiscal first quarter, with the slowdown in sales growth highlighting the company’s challenges in gaining traction with its new cloud offering and more specifically, its transitioning of large enterprise customers to the new offering. The company also indicated it would have to spend more to acquire new customers. In our opinion, the secular growth trends driving Rackspace Hosting remain intact as the architecture of computing and enterprise information technology spending continue to shift toward the cloud. However, we are mindful about managing the size of the Fund’s position to reflect changes in the company’s overall risk/reward profile.
Equinix, a leading data center solutions company, was another detractor from the Fund’s relative returns during the Reporting Period. Its shares fell as the potential for rising interest rates weighed broadly on yield-sensitive securities, such as bonds and real estate investment trusts (“REITs”). In addition, the U.S. Internal Revenue Service announced it would more closely evaluate how it defines a REIT and how it applies REIT status to particular companies. In 2012, Equinix announced its planned conversion to a REIT. In our view, this is a short-term headwind for the stock, as similar companies in the data center industry have already converted to a REIT structure. We believe that despite recent weakness, the company’s fundamentals remain strong and that Equinix continues to benefit from several secular growth drivers, including cloud computing, growth in Internet traffic and enterprise outsourcing, and rising demand for optimized network performance. We believe Equinix’s pricing power remains strong in all of the regions in which it operates and its global focus continues to be a significant differentiator versus its peers.
During the Reporting Period, wireless tower company SBA Communications hampered the Fund’s relative performance. Tower companies broadly underperformed the market during the first quarter of 2013, partly on concerns that growth in U.S. tower businesses may slow during 2014 after what analysts predict will be a strong 2013. The stock also underperformed in response to the potential impact of rising interest rates on REIT valuations. SBA Communications has indicated it is evaluating the potential to convert to a REIT. In our opinion, the fundamentals of the tower industry remain robust, and the company’s management indicated in recent quarterly earnings announcements that the business has significant growth potential through 2014. We believe SBA Communications should continue to see many years of strong growth both in the U.S. and internationally. We expect the rollout of high speed LTE (long-term evolution) wireless service, which is currently driving the U.S. leasing business, to be followed by
11
GOLDMAN SACHS VARIABLE INSURANCE TRUST — GOLDMAN SACHS GROWTH OPPORTUNITIES FUND
several years of growth as wireless carriers add capacity to these initial networks. Also, demand for mobile content shows no sign of slowing.
Which individual stocks added to the Fund’s relative performance during the Reporting Period?
Vertex Pharmaceuticals was the top contributor to the Fund’s relative performance during the Reporting Period. Its shares spiked after the release of supportive trial data on one of the cystic fibrosis drugs it had in development, making regulatory approval of the treatment more likely. At the end of the Reporting Period, we believed Vertex Pharmaceuticals had an attractive risk/reward profile and was well positioned to grow its total available market through its cystic fibrosis franchise. We also thought the market underestimated the value of Vertex’s hepatitis-C franchise, which we believe could ultimately lead to a higher stock price. In our opinion, Vertex has a robust pipeline of new treatments and maintains a healthy balance sheet that should help it fund research on additional therapies.
Pandora, a leading Internet radio service provider, was another notable contributor to the Fund’s relative returns during the Reporting Period. Pandora reported record results for the first quarter of its fiscal year and raised its full fiscal year guidance. Its stock was also bolstered by the company’s estimates that in 2013, one third of all new cars — more than 100 vehicle models — sold in the U.S. will have Pandora installed. If so, Pandora could gain a share of car listeners, potentially driving up its listening hours per user. We believe the company is well positioned to gain market share within the terrestrial radio market and should continue to grow its active user base as it builds its advertising sales force. In our opinion, Pandora’s differentiated business model, first-mover advantage and strong brand recognition also support sustainable growth.
Activision Blizzard, a leading publisher of gaming software and content, added to the Fund’s performance during the Reporting Period. The company reported solid fourth quarter 2012 results, driven by strong performance in its key franchises. Video game Skylanders, which was launched in 2011, has already crossed the $1 billion revenue threshold. The Call of Duty video game franchise has posted solid growth as well as an increase in online engagement for Black Ops 2, particularly during December 2012.
Did the Fund make any significant purchases or sales during the Reporting Period?
During the Reporting Period, we initiated a position in industrial machinery and equipment company W.W. Grainger. The company is the leading industrial distributor of maintenance, repair and operating supplies in North America. We believe the company’s smaller but growing international (non-European) exposure could create meaningful growth opportunities in the future. In our view, W. W. Grainger’s scale, technological advantages and strong management should allow the company to continue to expand its margins and increase market share. We also believe the company has a strong risk/reward profile and an attractive valuation.
We also initiated a position during the Reporting Period in electrical equipment manufacturer Hubbell. The company designs, manufactures and distributes electrical and power supplies for a range of residential and non-residential applications. In our opinion, Hubbell’s established brand name and distribution network position the company well to benefit from incremental improvements in the U.S. housing and construction markets.
In addition, during the Reporting Period, we initiated a position in Limited Brands. The specialty fashion retailer owns two flagship brands, Victoria’s Secret and Bath & Body Works. In our view, the company is focused on three key initiatives that should drive growth going forward—growth in Victoria’s Secret’s U.S. square footage, international expansion and expansion of operating margins through supply chain improvements that should lead to shorter lead times and allow stores to keep products fresh and reduce markdowns. At the beginning of the Reporting Period, we took advantage of share price weakness to establish a position in what we consider a high quality company with strong long-term growth potential.
During the Reporting Period, the Fund sold its position in Activision Blizzard. The company performed well during the Reporting Period, driven by a combination of expected share buybacks and optimism that the release of new consoles by Sony and Microsoft later in 2013 could result in greater demand for video games. In our view, Activision Blizzard’s shares had become fairly valued, and we decided to exit the Fund’s position in favor of what we considered to be more attractive opportunities.
We liquidated the Fund’s position in Family Dollar Stores. While we still favor the industry overall, we lost confidence in the turnaround story for Family Dollar Stores, especially as it relates to the strategic initiatives around tobacco. At the time of the sale, we increased the Fund’s position in Dollar General, which is a similar company but one that we believe should provide more consistent, steady growth.
During the Reporting Period, we exited the Fund’s position in NetApp, a company that develops data storage hardware and software for enterprise clients. The stock performed well after the company reported a solid set of earnings and announced it was doubling its existing share buyback program to approximately $3 billion. We sold the Fund’s position because we believe a number of other similar companies were trading at similar valuations and had more compelling growth prospects.
12
GOLDMAN SACHS VARIABLE INSURANCE TRUST — GOLDMAN SACHS GROWTH OPPORTUNITIES FUND
Were there any notable changes in the Fund’s weightings during the Reporting Period?
There were no notable changes in the Fund’s weightings during the Reporting Period.
How did the Fund use derivatives and similar instruments during the Reporting Period?
In keeping with its investment process, the Fund did not use derivatives during the Reporting Period.
How was the Fund positioned relative to the Russell Index at the end of the Reporting Period?
As mentioned, the Fund’s sector positioning relative to the Russell Index is the result of our stock selection, as we take a pure bottom-up, research-intensive approach to investing. From that perspective, then, at the end of the Reporting Period, the Fund’s portfolio was broadly diversified with overweighted positions compared to the Russell Index in the financials, health care and telecommunication services sectors. The Fund had smaller weightings than the Russell Index in the materials, utilities, consumer staples, industrials and consumer discretionary sectors. It was relatively neutral compared to the Russell Index in the energy and information technology sectors at the end of the Reporting Period.
13
FUND BASICS
Core Fixed Income Fund
as of June 30, 2013
STANDARDIZED TOTAL RETURNS1
| For the period ended 6/30/13 | One Year | Five Year | Since Inception | Inception Date | ||||||||||
| Service | 0.94 | % | 5.20 | % | 4.52 | % | 1/09/06 | |||||||
| Institutional | N/A | N/A | (3.36 | ) | 4/30/13 | |||||||||
| 1 | The Standardized Total Returns are average annual total returns as of the most recent calendar quarter-end. They assume reinvestment of all distributions at net asset value (“NAV”). Because Institutional and Service Shares do not involve a sales charge, such a charge is not applied to their Standardized Total Returns. |
Total return figures in the above chart represent past performance and do not indicate future results, which will vary. The investment return and principal value of an investment will fluctuate and, therefore, an investor’s shares, when redeemed, may be worth more or less than their original cost. Current performance may be lower or higher than the total return figures in the above chart. Please visit www.goldmansachsfunds.com/vit to obtain the most recent month-end returns. Performance reflects fee waivers and/or expense limitations in effect. In their absence, performance would be reduced.
EXPENSE RATIOS2
| Net Expense Ratio (Current) | Gross Expense Ratio (Before Waivers) | |||||||
| Service | 0.67 | % | 0.83 | % | ||||
| Institutional | 0.42 | 0.58 | ||||||
| 2 | The expense ratios of the Fund, both current (net of applicable fee waivers and/or expense limitations) and before waivers (gross of applicable fee waivers and/or expense limitations) are as set forth above according to the most recent publicly available Prospectus for the Fund and may differ from the expense ratios disclosed in the Financial Highlights in this report. The Fund’s waivers and/or expense limitations will remain in place through at least April 30, 2014, and prior to such date the Investment Adviser may not terminate the arrangements without the approval of the Fund’s Board of Trustees. If these arrangements are discontinued in the future, the expense ratios may change without shareholder approval. |
14
FUND BASICS
FUND COMPOSITION3
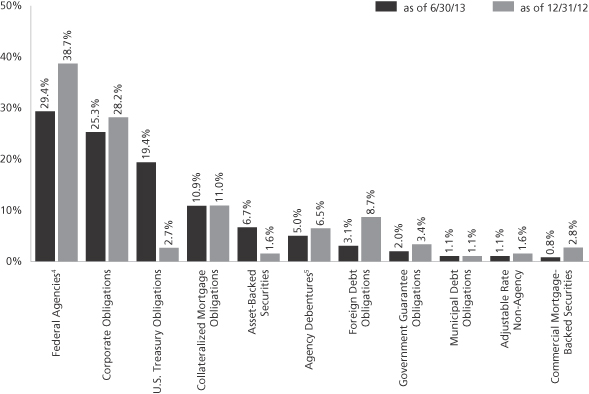
| 3 | The percentage shown for each investment category reflects the value of investments in that category as a percentage of net assets. Figures in the graph may not sum to 100% due to the exclusion of other assets and liabilities. The graph depicts the Fund’s investments but may not represent the Fund’s market exposure due to the exclusion of certain derivatives, if any, as listed in the Additional Investment Information section of the Schedule of Investments. |
| 4 | “Federal Agencies” are mortgage-backed securities guaranteed by the Government National Mortgage Association (“GNMA”), Federal National Mortgage Association (“FNMA”) and Federal Home Loan Mortgage Corp. (“FHLMC”). GNMA instruments are backed by the full faith and credit of the United States Government. |
| 5 | “Agency Debentures” include agency securities offered by companies such as FNMA and FHLMC, which operate under a government charter. While they are required to report to a government regulator, their assets are not explicitly guaranteed by the government and they otherwise operate like any other publicly traded company. |
15
FUND BASICS
Equity Index Fund
as of June 30, 2013
STANDARDIZED TOTAL RETURNS1
| For the period ended 6/30/13 | One Year | Five Year | Since Inception | Inception Date | ||||||||||
| Service | 20.11 | % | 6.69 | % | 4.96 | % | 1/09/06 | |||||||
| 1 | The Standardized Total Returns are average annual total returns as of the most recent calendar quarter-end. They assume reinvestment of all distributions at net asset value (“NAV”). Because Service Shares do not involve a sales charge, such a charge is not applied to their Standardized Total Returns. |
Total return figures in the above chart represent past performance and do not indicate future results, which will vary. The investment return and principal value of an investment will fluctuate and, therefore, an investor’s shares, when redeemed, may be worth more or less than their original cost. Current performance may be lower or higher than the total return figures in the above chart. Please visit www.goldmansachsfunds.com/vit to obtain the most recent month-end returns. Performance reflects fee waivers and/or expense limitations in effect. In their absence, performance would be reduced.
EXPENSE RATIOS2
| Net Expense Ratio (Current) | Gross Expense Ratio (Before Waivers) | |||||||
| Service | 0.48 | % | 0.74 | % | ||||
| 2 | The expense ratios of the Fund, both current (net of applicable fee waivers and/or expense limitations) and before waivers (gross of applicable fee waivers and/or expense limitations) are as set forth above according to the most recent publicly available Prospectus for the Fund and may differ from the expense ratios disclosed in the Financial Highlights in this report. The Fund’s waivers and/or expense limitations will remain in place through at least April 30, 2014, and prior to such date the investment adviser may not terminate the arrangements without the approval of the Fund’s Board of Trustees. If these arrangements are discontinued in the future, the expense ratios may change without shareholder approval. |
TOP TEN HOLDINGS AS OF 6/30/133
| Holding | % of Net Assets | Line of Business | ||||
| Exxon Mobil Corp. | 2.8% | Energy | ||||
| Apple, Inc. | 2.6 | Technology Hardware & Equipment | ||||
| Microsoft Corp. | 1.8 | Software & Services | ||||
| Johnson & Johnson | 1.7 | Pharmaceuticals, Biotechnology & Life Sciences | ||||
| General Electric Co. | 1.7 | Capital Goods | ||||
| Google, Inc. Class A | 1.6 | Software & Services | ||||
| Chevron Corp. | 1.6 | Energy | ||||
| The Procter & Gamble Co. | 1.5 | Household & Personal Products | ||||
| Berkshire Hathaway, Inc. Class B | 1.4 | Insurance | ||||
| Wells Fargo & Co. | 1.4 | Banks | ||||
| 3 | The top ten holdings may not be representative of the Fund’s future investments. |
16
FUND BASICS
FUND VS. BENCHMARK SECTOR ALLOCATIONS4
As of June 30, 2013
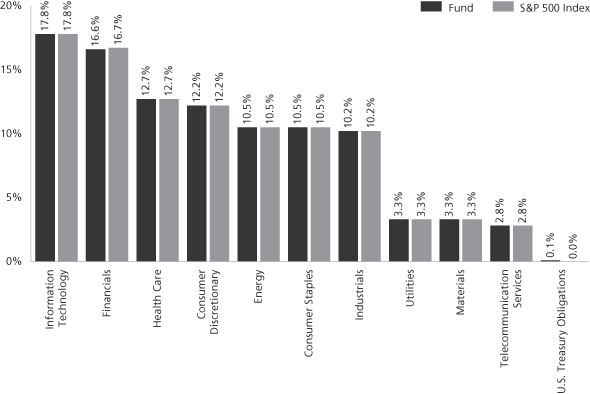
| 4 | The Fund’s composition may differ over time. Consequently, the Fund’s overall sector allocations may differ from percentages contained in the graph above. The graph categorizes investments using Global Industry Classification Standard (“GICS”), however, the sector classifications used by the portfolio management team may differ from GICS. The percentage shown for each investment category reflects the value of investments in that category as a percentage of market value. The graph depicts the Fund’s investments but may not represent the Fund’s market exposure due to the exclusion of certain derivatives, if any, as listed in the Additional Investment Information section of the Schedule of Investments. |
17
FUND BASICS
Growth Opportunities Fund
as of June 30, 2013
STANDARDIZED TOTAL RETURNS1
| For the period ended 6/30/13 | One Year | Five Year | Since Inception | Inception Date | ||||||||||
| Service | 18.69 | % | 8.28 | % | 7.70 | % | 1/09/06 | |||||||
| Institutional | N/A | N/A | 0.26 | 4/30/13 | ||||||||||
| 1 | The Standardized Total Returns are average annual total returns as of the most recent calendar quarter-end. They assume reinvestment of all distributions at net asset value (“NAV”). Because Institutional and Service Shares do not involve a sales charge, such a charge is not applied to their Standardized Total Returns. |
Total return figures in the above chart represent past performance and do not indicate future results, which will vary. The investment return and principal value of an investment will fluctuate and, therefore, an investor’s shares, when redeemed, may be worth more or less than their original cost. Current performance may be lower or higher than the total return figures in the above chart. Please visit www.goldmansachsfunds.com/vit to obtain the most recent month-end returns. Performance reflects fee waivers and/or expense limitations in effect during the periods shown. In their absence, performance would be reduced.
EXPENSE RATIOS2
| Net Expense Ratio (Current) | Gross Expense Ratio (Before Waivers) | |||||||
| Service | 1.15 | % | 1.39 | % | ||||
| Institutional | 0.99 | 1.14 | ||||||
| 2 | The expense ratios of the Fund, both current (net of applicable fee waivers and/or expense limitations) and before waivers (gross of applicable fee waivers and/or expense limitations) are as set forth above according to the most recent publicly available Prospectus for the Fund and may differ from the expense ratios disclosed in the Financial Highlights in this report. The Fund’s waivers and/or expense limitations will remain in place through at least April 30, 2014, and prior to such date the Investment Adviser may not terminate the arrangements without the approval of the Fund’s Board of Trustees. If these arrangements are discontinued in the future, the expense ratios may change without shareholder approval. |
TOP TEN HOLDINGS AS OF 6/30/133
| Holding | % of Net Assets | Line of Business | ||||
| SBA Communications Corp. Class A | 3.4% | Telecommunication Services | ||||
| Equinix, Inc. | 2.7 | Software & Services | ||||
| CBRE Group, Inc. Class A | 2.7 | Real Estate | ||||
| IntercontinentalExchange, Inc. | 2.5 | Diversified Financials | ||||
| Agilent Technologies, Inc. | 2.5 | Pharmaceuticals, Biotechnology & Life Sciences | ||||
| PVH Corp. | 2.4 | Consumer Durables & Apparel | ||||
| Xilinx, Inc. | 2.3 | Semiconductors & Semiconductor Equipment | ||||
| MSCI, Inc. | 2.2 | Diversified Financials | ||||
| Amphenol Corp. Class A | 2.2 | Technology Hardware & Equipment | ||||
| Dollar General Corp. | 2.1 | Retailing | ||||
| 3 | The top ten holdings may not be representative of the Fund’s future investments. |
18
FUND BASICS
FUND vs. BENCHMARK SECTOR ALLOCATIONS4
As of June 30, 2013
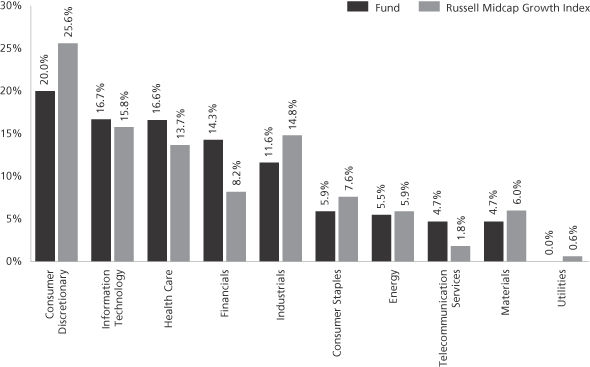
| 4 | The Fund is actively managed and, as such, its composition may differ over time. Consequently, the Fund’s overall sector allocations may differ from percentages contained in the graph above. The graph categorizes investments using Global Industry Classification Standard (“GICS”), however, the sector classifications used by the portfolio management team may differ from GICS. The percentage shown for each investment category reflects the value of investments in that category as a percentage of market value. The graph depicts the Fund’s investments but may not represent the Fund’s market exposure due to the exclusion of certain derivatives, if any, as listed in the Additional Investment Information section of the Schedule of Investments. |
19
FUND BASICS
High Quality Floating Rate Fund
as of June 30, 2013
STANDARDIZED TOTAL RETURNS1
| For the period ended 6/30/13 | One Year | Five Year | Since Inception | Inception Date | ||||||||||
| Service | 0.83 | % | 4.69 | % | 4.66 | % | 1/09/06 | |||||||
| Institutional | N/A | N/A | (0.11 | ) | 4/30/13 | |||||||||
| 1 | The Standardized Total Returns are average annual total returns as of the most recent calendar quarter-end. They assume reinvestment of all distributions at net asset value (“NAV”). Because Institutional and Service Shares do not involve a sales charge, such a charge is not applied to their Standardized Total Returns. |
Total return figures in the above chart represent past performance and do not indicate future results, which will vary. The investment return and principal value of an investment will fluctuate and, therefore, an investor’s shares, when redeemed, may be worth more or less than their original cost. Current performance may be lower or higher than the total return figures in the above chart. Please visit www.goldmansachsfunds.com/vit to obtain the most recent month-end returns. Performance reflects fee waivers and/or expense limitations in effect during the periods shown. In their absence, performance would be reduced.
EXPENSE RATIOS2
| Net Expense Ratio (Current) | Gross Expense Ratio (Before Waivers) | |||||||
| Service | 0.65 | % | 0.92 | % | ||||
| Institutional | 0.40 | 0.67 | ||||||
| 2 | The expense ratios of the Fund, both current (net of applicable fee waivers and/or expense limitations) and before waivers (gross of applicable fee waivers and/or expense limitations) are as set forth above according to the most recent publicly available Prospectus for the Fund and may differ from the expense ratios disclosed in the Financial Highlights in this report. The Fund’s waivers and/or expense limitations will remain in place through at least April 30, 2014, and prior to such date the Investment Adviser may not terminate the arrangements without the approval of the Fund’s Board of Trustees. If these arrangements are discontinued in the future, the expense ratios may change without shareholder approval. |
20
FUND BASICS
FUND COMPOSITION3
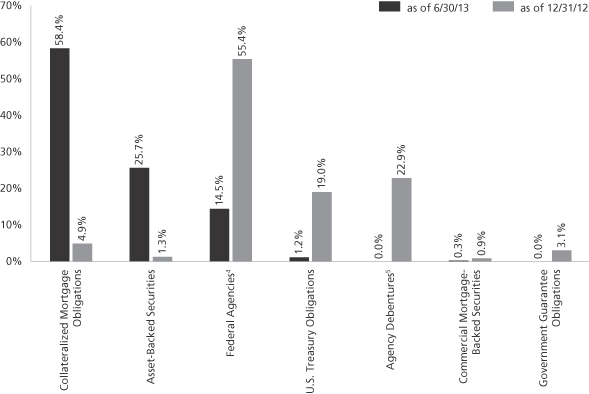
| 3 | The percentage shown for each investment category reflects the value of investments in that category as a percentage of net assets. Figures in the graph may not sum to 100% due to the exclusion of other assets and liabilities. The graph depicts the Fund’s investments but may not represent the Fund’s market exposure due to the exclusion of certain derivatives, if any, as listed in the Additional Investment Information section of the Schedule of Investments. |
| 4 | “Federal Agencies” are mortgage-backed securities guaranteed by the Government National Mortgage Association (“GNMA”), Federal National Mortgage Association (“FNMA”) and Federal Home Loan Mortgage Corp. (“FHLMC”). GNMA instruments are backed by the full faith and credit of the United States Government. |
| 5 | “Agency Debentures” include agency securities offered by companies such as FNMA and FHLMC, which operate under a government charter. While they are required to report to a government regulator, their assets are not explicitly guaranteed by the government and they otherwise operate like any other publicly traded company. |
21
GOLDMAN SACHS VARIABLE INSURANCE TRUST CORE FIXED INCOME FUND
Schedule of Investments
June 30, 2013 (Unaudited)
Principal Amount | Interest Rate | Maturity Date | Value | |||||||||||
| Corporate Obligations – 25.3% | ||||||||||||||
| Automobiles & Components – 0.5% |
| ||||||||||||
| Delphi Corp.(a) |
| ||||||||||||
| $ | 75,000 | 5.000 | % | 02/15/18 | $ | 77,062 | ||||||||
| Ford Motor Credit Co. LLC |
| ||||||||||||
| 525,000 | 3.984 | 06/15/16 | 548,095 | |||||||||||
|
| |||||||||||||
| 625,157 | ||||||||||||||
|
| |||||||||||||
| Banks – 6.8% |
| ||||||||||||
| Abbey National Treasury Services PLC |
| ||||||||||||
| 175,000 | 2.875 | 04/25/14 | 177,141 | |||||||||||
| ANZ Capital Trust II(a)(b) |
| ||||||||||||
| 425,000 | 5.360 | 12/15/15 | 425,000 | |||||||||||
| Bank of America Corp. |
| ||||||||||||
| 225,000 | 6.000 | 09/01/17 | 251,070 | |||||||||||
| 200,000 | 5.750 | 12/01/17 | 221,553 | |||||||||||
| 100,000 | 5.625 | 07/01/20 | 110,601 | |||||||||||
| Barclays Bank PLC(b) |
| ||||||||||||
| 125,000 | 6.050 | 12/04/17 | 135,215 | |||||||||||
| Capital One Financial Corp. |
| ||||||||||||
| 225,000 | 1.000 | 11/06/15 | 222,200 | |||||||||||
| CBA Capital Trust II(a)(b)(c) |
| ||||||||||||
| 325,000 | 6.024 | 12/31/49 | 329,875 | |||||||||||
| Citigroup, Inc. |
| ||||||||||||
| 375,000 | 5.000 | 09/15/14 | 389,504 | |||||||||||
| 150,000 | 3.375 | 03/01/23 | 142,991 | |||||||||||
| Compass Bank |
| ||||||||||||
| 175,000 | 5.500 | 04/01/20 | 178,736 | |||||||||||
| ING Bank NV(b) |
| ||||||||||||
| 450,000 | 2.000 | 09/25/15 | 453,816 | |||||||||||
| Intesa Sanpaolo SpA |
| ||||||||||||
| 225,000 | 3.125 | 01/15/16 | 220,054 | |||||||||||
| JPMorgan Chase & Co. |
| ||||||||||||
| 100,000 | 3.250 | 09/23/22 | 94,768 | |||||||||||
| Merrill Lynch & Co., Inc. |
| ||||||||||||
| 325,000 | 6.400 | 08/28/17 | 365,651 | |||||||||||
| Mizuho Corporate Bank Ltd.(b) |
| ||||||||||||
| 200,000 | 2.550 | 03/17/17 | 201,602 | |||||||||||
| Morgan Stanley & Co. |
| ||||||||||||
| 200,000 | 6.250 | 08/28/17 | 222,616 | |||||||||||
| 550,000 | 5.950 | 12/28/17 | 608,725 | |||||||||||
| Regions Bank |
| ||||||||||||
| 250,000 | 7.500 | 05/15/18 | 291,989 | |||||||||||
| Regions Financial Corp. |
| ||||||||||||
| 325,000 | 5.750 | 06/15/15 | 347,608 | |||||||||||
| Resona Bank Ltd.(a)(b)(c) |
| ||||||||||||
| 650,000 | 5.850 | 12/31/49 | 693,521 | |||||||||||
| Royal Bank of Scotland Group PLC |
| ||||||||||||
| 250,000 | 2.550 | 09/18/15 | 254,914 | |||||||||||
| Santander Holdings USA, Inc. |
| ||||||||||||
| 75,000 | 3.000 | (a) | 09/24/15 | 76,327 | ||||||||||
| 165,000 | 4.625 | 04/19/16 | 172,893 | |||||||||||
| Standard Chartered PLC(b) |
| ||||||||||||
| 150,000 | 5.500 | 11/18/14 | 157,905 | |||||||||||
| Swedbank AB(b) |
| ||||||||||||
| 500,000 | 1.750 | 03/12/18 | 485,800 | |||||||||||
|
| |||||||||||||
| Corporate Obligations – (continued) | ||||||||||||||
| Banks – (continued) |
| ||||||||||||
| The Bear Stearns Companies LLC |
| ||||||||||||
| $ | 400,000 | 7.250 | % | 02/01/18 | $ | 473,813 | ||||||||
| Union Bank NA |
| ||||||||||||
| 425,000 | 2.125 | 06/16/17 | 423,501 | |||||||||||
| Wachovia Bank NA |
| ||||||||||||
| 300,000 | 6.600 | 01/15/38 | 363,010 | |||||||||||
|
| |||||||||||||
| 8,492,399 | ||||||||||||||
|
| |||||||||||||
| Chemicals – 0.7% |
| ||||||||||||
| CF Industries, Inc. |
| ||||||||||||
| 150,000 | 3.450 | 06/01/23 | 143,653 | |||||||||||
| Eastman Chemical Co. |
| ||||||||||||
| 150,000 | 2.400 | 06/01/17 | 150,566 | |||||||||||
| 150,000 | 4.800 | (a) | 09/01/42 | 140,157 | ||||||||||
| Ecolab, Inc. |
| ||||||||||||
| 450,000 | 4.350 | 12/08/21 | 475,331 | |||||||||||
|
| |||||||||||||
| 909,707 | ||||||||||||||
|
| |||||||||||||
| Diversified Manufacturing – 0.4% |
| ||||||||||||
| Roper Industries, Inc. |
| ||||||||||||
| 275,000 | 2.050 | 10/01/18 | 269,368 | |||||||||||
| Xylem, Inc. |
| ||||||||||||
| 250,000 | 3.550 | 09/20/16 | 261,267 | |||||||||||
|
| |||||||||||||
| 530,635 | ||||||||||||||
|
| |||||||||||||
| Electric – 1.1% |
| ||||||||||||
| Florida Power & Light Co.(a) |
| ||||||||||||
| 193,000 | 4.125 | 02/01/42 | 183,771 | |||||||||||
| NV Energy, Inc. |
| ||||||||||||
| 200,000 | 6.250 | 11/15/20 | 234,325 | |||||||||||
| PPL WEM Holdings PLC(a)(b) |
| ||||||||||||
| 220,000 | 5.375 | 05/01/21 | 241,540 | |||||||||||
| Progress Energy, Inc. |
| ||||||||||||
| 350,000 | 7.000 | 10/30/31 | 424,256 | |||||||||||
| Puget Sound Energy, Inc. Series A(a)(c) |
| ||||||||||||
| 75,000 | 6.974 | 06/01/67 | 77,625 | |||||||||||
| Southern California Edison Co.(a) |
| ||||||||||||
| 175,000 | 4.050 | 03/15/42 | 163,947 | |||||||||||
|
| |||||||||||||
| 1,325,464 | ||||||||||||||
|
| |||||||||||||
| Energy – 2.8% |
| ||||||||||||
| BG Energy Capital PLC(a)(c) |
| ||||||||||||
| 325,000 | 6.500 | 11/30/72 | 346,694 | |||||||||||
| Dolphin Energy Ltd.(b) |
| ||||||||||||
| 170,712 | 5.888 | 06/15/19 | 184,689 | |||||||||||
| 200,000 | 5.500 | 12/15/21 | 215,000 | |||||||||||
| Gazprom OAO Via Gaz Capital SA(d) |
| ||||||||||||
| 350,000 | 9.250 | 04/23/19 | 425,250 | |||||||||||
| Nexen, Inc. |
| ||||||||||||
| 75,000 | 5.875 | 03/10/35 | 77,172 | |||||||||||
| 130,000 | 6.400 | 05/15/37 | 141,045 | |||||||||||
| Pemex Project Funding Master Trust |
| ||||||||||||
| 150,000 | 6.625 | 06/15/35 | 157,125 | |||||||||||
| Petrobras Global Finance BV |
| ||||||||||||
| 160,000 | 4.375 | 05/20/23 | 146,775 | |||||||||||
|
| |||||||||||||
| 22 | The accompanying notes are an integral part of these financial statements. |
GOLDMAN SACHS VARIABLE INSURANCE TRUST CORE FIXED INCOME FUND
Principal Amount | Interest Rate | Maturity Date | Value | |||||||||||
| Corporate Obligations – (continued) | ||||||||||||||
| Energy – (continued) |
| ||||||||||||
| Petrobras International Finance Co. |
| ||||||||||||
| $ | 40,000 | 5.750 | % | 01/20/20 | $ | 41,414 | ||||||||
| 190,000 | 5.375 | 01/27/21 | 192,188 | |||||||||||
| PTTEP Canada International Finance Ltd.(b) |
| ||||||||||||
| 240,000 | 5.692 | 04/05/21 | 256,459 | |||||||||||
| Ras Laffan Liquefied Natural Gas Co. Ltd. III(b) |
| ||||||||||||
| 250,000 | 5.500 | 09/30/14 | 260,823 | |||||||||||
| Rosneft Oil Co. via Rosneft International Finance Ltd.(b) |
| ||||||||||||
| 200,000 | 4.199 | 03/06/22 | 185,300 | |||||||||||
| TNK-BP Finance SA |
| ||||||||||||
| 140,000 | 7.875 | 03/13/18 | 159,250 | |||||||||||
| Transocean, Inc. |
| ||||||||||||
| 375,000 | 6.500 | 11/15/20 | 420,309 | |||||||||||
| 75,000 | 6.375 | 12/15/21 | 84,119 | |||||||||||
| Weatherford International Ltd. |
| ||||||||||||
| 175,000 | 9.625 | 03/01/19 | 221,311 | |||||||||||
|
| |||||||||||||
| 3,514,923 | ||||||||||||||
|
| |||||||||||||
| Entertainment – 0.1% |
| ||||||||||||
| The Walt Disney Co. |
| ||||||||||||
| 140,000 | 3.700 | 12/01/42 | 125,165 | |||||||||||
|
| |||||||||||||
| Food & Beverage – 1.2% |
| ||||||||||||
| ConAgra Foods, Inc. |
| ||||||||||||
| 300,000 | 1.900 | 01/25/18 | 296,036 | |||||||||||
| Kraft Foods Group, Inc. |
| ||||||||||||
| 275,000 | 6.125 | 08/23/18 | 322,890 | |||||||||||
| Mondelez International, Inc. |
| ||||||||||||
| 200,000 | 6.500 | 02/09/40 | 235,617 | |||||||||||
| Pernod-Ricard SA(b) |
| ||||||||||||
| 375,000 | 4.450 | 01/15/22 | 384,907 | |||||||||||
| SABMiller Holdings, Inc.(b) |
| ||||||||||||
| 275,000 | 2.450 | 01/15/17 | 279,364 | |||||||||||
|
| |||||||||||||
| 1,518,814 | ||||||||||||||
|
| |||||||||||||
| Food & Staples Retailing – 0.1% |
| ||||||||||||
| Walgreen Co. |
| ||||||||||||
| 175,000 | 1.800 | 09/15/17 | 172,419 | |||||||||||
|
| |||||||||||||
| Healthcare – 0.4% |
| ||||||||||||
| Cigna Corp. |
| ||||||||||||
| 150,000 | 2.750 | 11/15/16 | 155,417 | |||||||||||
| Coventry Health Care, Inc. |
| ||||||||||||
| 153,000 | 6.300 | 08/15/14 | 161,596 | |||||||||||
| DENTSPLY International, Inc. |
| ||||||||||||
| 125,000 | 2.750 | 08/15/16 | 126,328 | |||||||||||
|
| |||||||||||||
| 443,341 | ||||||||||||||
|
| |||||||||||||
| Household & Personal Products – 0.5% |
| ||||||||||||
| Avon Products, Inc. |
| ||||||||||||
| 325,000 | 4.600 | 03/15/20 | 327,588 | |||||||||||
| Kimberly-Clark Corp. |
| ||||||||||||
| 300,000 | 3.700 | 06/01/43 | 267,941 | |||||||||||
|
| |||||||||||||
| 595,529 | ||||||||||||||
|
| |||||||||||||
| Corporate Obligations – (continued) | ||||||||||||||
| Life Insurance – 0.8% |
| ||||||||||||
| American International Group, Inc. |
| ||||||||||||
| $ | 125,000 | 2.375 | % | 08/24/15 | $ | 126,660 | ||||||||
| Genworth Financial, Inc. |
| ||||||||||||
| 75,000 | 8.625 | 12/15/16 | 88,743 | |||||||||||
| 75,000 | 7.200 | 02/15/21 | 83,680 | |||||||||||
| 125,000 | 7.625 | 09/24/21 | 145,243 | |||||||||||
| Hartford Financial Services Group, Inc. |
| ||||||||||||
| 94,000 | 6.000 | 01/15/19 | 105,897 | |||||||||||
| Metropolitan Life Global Funding I(b) |
| ||||||||||||
| 200,000 | 3.875 | 04/11/22 | 202,619 | |||||||||||
| The Northwestern Mutual Life Insurance Co.(b) |
| ||||||||||||
| 200,000 | 6.063 | 03/30/40 | 225,168 | |||||||||||
|
| |||||||||||||
| 978,010 | ||||||||||||||
|
| |||||||||||||
| Media Non Cable – 0.4% |
| ||||||||||||
| NBCUniversal Media LLC |
| ||||||||||||
| 175,000 | 2.875 | 04/01/16 | 182,883 | |||||||||||
| WPP Finance UK |
| ||||||||||||
| 275,000 | 8.000 | 09/15/14 | 296,815 | |||||||||||
|
| |||||||||||||
| 479,698 | ||||||||||||||
|
| |||||||||||||
| Metals and Mining(b) – 0.6% |
| ||||||||||||
| Glencore Funding LLC |
| ||||||||||||
| 125,000 | 1.700 | 05/27/16 | 121,214 | |||||||||||
| 175,000 | 2.500 | 01/15/19 | 158,324 | |||||||||||
| Xstrata Finance Canada Ltd. |
| ||||||||||||
| 500,000 | 2.450 | 10/25/17 | 484,891 | |||||||||||
|
| |||||||||||||
| 764,429 | ||||||||||||||
|
| |||||||||||||
| Noncaptive-Financial – 0.6% |
| ||||||||||||
| General Electric Capital Corp. |
| ||||||||||||
| 300,000 | 5.875 | 01/14/38 | 326,080 | |||||||||||
| International Lease Finance Corp. |
| ||||||||||||
| 375,000 | 5.750 | 05/15/16 | 384,375 | |||||||||||
|
| |||||||||||||
| 710,455 | ||||||||||||||
|
| |||||||||||||
| Pharmaceuticals(b) – 0.7% |
| ||||||||||||
| AbbVie, Inc. |
| ||||||||||||
| 650,000 | 1.750 | 11/06/17 | 636,117 | |||||||||||
| Mylan, Inc.(a) |
| ||||||||||||
| 250,000 | 7.875 | 07/15/20 | 288,750 | |||||||||||
|
| |||||||||||||
| 924,867 | ||||||||||||||
|
| |||||||||||||
| Pipelines – 1.7% |
| ||||||||||||
| Buckeye Partners LP(a) |
| ||||||||||||
| 150,000 | 4.150 | 07/01/23 | 145,790 | |||||||||||
| El Paso Pipeline Partners Operating Co. LLC(a) |
| ||||||||||||
| 275,000 | 5.000 | 10/01/21 | 294,133 | |||||||||||
| Energy Transfer Partners LP |
| ||||||||||||
| 375,000 | 5.950 | 02/01/15 | 402,507 | |||||||||||
| Enterprise Products Operating LLC Series A(a)(c) |
| ||||||||||||
| 450,000 | 8.375 | 08/01/66 | 499,500 | |||||||||||
| Enterprise Products Operating LLC Series B(a)(c) |
| ||||||||||||
| 125,000 | 7.034 | 01/15/68 | 139,688 | |||||||||||
|
| |||||||||||||
| The accompanying notes are an integral part of these financial statements. | 23 |
GOLDMAN SACHS VARIABLE INSURANCE TRUST CORE FIXED INCOME FUND
Schedule of Investments (continued)
June 30, 2013 (Unaudited)
Principal Amount | Interest Rate | Maturity Date | Value | |||||||||||
| Corporate Obligations – (continued) | ||||||||||||||
| Pipelines – (continued) |
| ||||||||||||
| Tennessee Gas Pipeline Co. LLC |
| ||||||||||||
| $ | 200,000 | 8.375 | % | 06/15/32 | $ | 267,516 | ||||||||
| TransCanada Pipelines Ltd.(a)(c) |
| ||||||||||||
| 325,000 | 6.350 | 05/15/67 | 336,375 | |||||||||||
|
| |||||||||||||
| 2,085,509 | ||||||||||||||
|
| |||||||||||||
| Real Estate Development – 0.3% |
| ||||||||||||
| MDC Holdings, Inc. |
| ||||||||||||
| 200,000 | 5.625 | 02/01/20 | 212,000 | |||||||||||
| 125,000 | 6.000 | (a) | 01/15/43 | 116,110 | ||||||||||
|
| |||||||||||||
| 328,110 | ||||||||||||||
|
| |||||||||||||
| Real Estate Investment Trusts – 2.8% |
| ||||||||||||
| Camden Property Trust |
| ||||||||||||
| 325,000 | 5.700 | 05/15/17 | 361,410 | |||||||||||
| DDR Corp. | ||||||||||||||
| 225,000 | 7.875 | 09/01/20 | 278,648 | |||||||||||
| Developers Diversified Realty Corp. |
| ||||||||||||
| 375,000 | 7.500 | 04/01/17 | 434,957 | |||||||||||
| ERP Operating LP(a) |
| ||||||||||||
| 275,000 | 4.625 | 12/15/21 | 290,653 | |||||||||||
| HCP, Inc. |
| ||||||||||||
| 275,000 | 6.000 | 01/30/17 | 309,084 | |||||||||||
| 125,000 | 2.625 | (a) | 02/01/20 | 116,720 | ||||||||||
| Health Care REIT, Inc. |
| ||||||||||||
| 375,000 | 2.250 | 03/15/18 | 368,187 | |||||||||||
| Healthcare Realty Trust, Inc. |
| ||||||||||||
| 350,000 | 5.750 | 01/15/21 | 382,120 | |||||||||||
| Kilroy Realty LP |
| ||||||||||||
| 275,000 | 5.000 | 11/03/15 | 296,193 | |||||||||||
| 150,000 | 3.800 | (a) | 01/15/23 | 141,484 | ||||||||||
| Simon Property Group LP |
| ||||||||||||
| 350,000 | 10.350 | 04/01/19 | 482,259 | |||||||||||
|
| |||||||||||||
| 3,461,715 | ||||||||||||||
|
| |||||||||||||
| Technology – 0.6% |
| ||||||||||||
| Fidelity National Information Services, Inc.(a) |
| ||||||||||||
| 100,000 | 3.500 | 04/15/23 | 90,376 | |||||||||||
| Hewlett-Packard Co. |
| ||||||||||||
| 250,000 | 3.000 | 09/15/16 | 256,588 | |||||||||||
| 150,000 | 2.600 | 09/15/17 | 149,887 | |||||||||||
| 50,000 | 4.300 | 06/01/21 | 48,429 | |||||||||||
| NetApp, Inc. |
| ||||||||||||
| 250,000 | 2.000 | 12/15/17 | 241,998 | |||||||||||
|
| |||||||||||||
| 787,278 | ||||||||||||||
|
| |||||||||||||
| Tobacco – 0.5% |
| ||||||||||||
| Imperial Tobacco Finance PLC(b) |
| ||||||||||||
| 400,000 | 2.050 | 02/11/18 | 393,194 | |||||||||||
| 200,000 | 3.500 | (a) | 02/11/23 | 188,032 | ||||||||||
|
| |||||||||||||
| 581,226 | ||||||||||||||
|
| |||||||||||||
| Transportation – 0.6% |
| ||||||||||||
| Penske Truck Leasing Co. LP / PTL Finance Corp.(b) |
| ||||||||||||
| 250,000 | 3.125 | 05/11/15 | 257,218 | |||||||||||
| 225,000 | 2.500 | 03/15/16 | 228,270 | |||||||||||
|
| |||||||||||||
| Corporate Obligations – (continued) | ||||||||||||||
| Transportation – (continued) |
| ||||||||||||
| United Parcel Service, Inc. |
| ||||||||||||
| $ | 300,000 | 3.625 | % | 10/01/42 | $ | 264,588 | ||||||||
|
| |||||||||||||
| 750,076 | ||||||||||||||
|
| |||||||||||||
| Wirelines Telecommunications – 1.1% |
| ||||||||||||
| American Tower Corp. |
| ||||||||||||
| 150,000 | 4.700 | 03/15/22 | 151,055 | |||||||||||
| 125,000 | 3.500 | 01/31/23 | 114,622 | |||||||||||
| AT&T, Inc. |
| ||||||||||||
| 425,000 | 2.950 | 05/15/16 | 444,160 | |||||||||||
| 475,000 | 2.625 | (a) | 12/01/22 | 431,827 | ||||||||||
| Telefonica Emisiones SAU |
| ||||||||||||
| 175,000 | 3.192 | 04/27/18 | 169,084 | |||||||||||
| 100,000 | 5.462 | 02/16/21 | 103,078 | |||||||||||
|
| |||||||||||||
| 1,413,826 | ||||||||||||||
|
| |||||||||||||
| TOTAL CORPORATE OBLIGATIONS | ||||||||||||||
| (Cost $30,951,342) | $ | 31,518,752 | ||||||||||||
|
| |||||||||||||
| Mortgage-Backed Obligations – 42.2% | ||||||||||||||
| Adjustable Rate Non-Agency(c) – 1.1% |
| ||||||||||||
| Countrywide Alternative Loan Trust Series 2005-38, Class A1 |
| ||||||||||||
| $ | 221,296 | 1.668 | % | 09/25/35 | $ | 180,254 | ||||||||
| Indymac Index Mortgage Loan Trust Series 2006-AR4, | | ||||||||||||
| 822,690 | 0.403 | 05/25/46 | 654,725 | |||||||||||
| Lehman XS Trust Series 2005-7N, Class 1A1A |
| ||||||||||||
| 315,005 | 0.463 | 12/25/35 | 267,538 | |||||||||||
| Master Adjustable Rate Mortgages Trust Series 2006-OA2, | | ||||||||||||
| 435,484 | 1.018 | 12/25/46 | 206,343 | |||||||||||
|
| |||||||||||||
| 1,308,860 | ||||||||||||||
|
| |||||||||||||
| Collateralized Mortgage Obligations – 10.9% |
| ||||||||||||
| Agency Multi-Family – 5.1% |
| ||||||||||||
| FHLMC Multifamily Structured Pass Through Certificates | | ||||||||||||
| 600,000 | 2.630 | 01/25/23 | 571,543 | |||||||||||
| FHLMC Multifamily Structured Pass Through Certificates | | ||||||||||||
| 1,200,000 | 3.111 | 02/25/23 | 1,184,599 | |||||||||||
| FNMA |
| ||||||||||||
| 382,516 | 2.800 | 03/01/18 | 400,021 | |||||||||||
| 1,068,762 | 3.864 | 05/01/18 | 1,154,827 | |||||||||||
| 320,000 | 3.968 | 05/01/18 | 348,296 | |||||||||||
| 800,000 | 4.656 | 06/01/19 | 876,963 | |||||||||||
| 100,000 | 1.520 | 12/25/19 | 99,595 | |||||||||||
| 192,943 | 3.530 | 10/01/20 | 203,003 | |||||||||||
| 193,155 | 3.753 | 12/01/20 | 204,402 | |||||||||||
| 969,754 | 3.888 | 12/01/20 | 1,038,247 | |||||||||||
| 100,000 | 2.349 | 05/25/22 | 93,280 | |||||||||||
|
| |||||||||||||
| 24 | The accompanying notes are an integral part of these financial statements. |
GOLDMAN SACHS VARIABLE INSURANCE TRUST CORE FIXED INCOME FUND
Principal Amount | Interest Rate | Maturity Date | Value | |||||||||||
| Mortgage-Backed Obligations – (continued) | ||||||||||||||
| Agency Multi-Family – (continued) |
| ||||||||||||
| GNMA |
| ||||||||||||
| $ | 163,329 | 3.950 | % | 07/15/25 | $ | 171,585 | ||||||||
|
| |||||||||||||
| 6,346,361 | ||||||||||||||
|
| |||||||||||||
| Covered Bond(c) – 3.2% |
| ||||||||||||
| Abbey National Treasury Services PLC |
| ||||||||||||
| GBP | 200,000 | 2.106 | 02/16/15 | 309,818 | ||||||||||
| Northern Rock Asset Management PLC(b) |
| ||||||||||||
| $ | 900,000 | 5.625 | 06/22/17 | 1,019,088 | ||||||||||
| Sparebank 1 Boligkreditt AS(b) |
| ||||||||||||
| 1,500,000 | 2.625 | 05/27/16 | 1,554,255 | |||||||||||
| 600,000 | 2.300 | 06/30/17 | 611,158 | |||||||||||
| Stadshypotek AB(b) |
| ||||||||||||
| 500,000 | 1.875 | 10/02/19 | 478,150 | |||||||||||
|
| |||||||||||||
| 3,972,469 | ||||||||||||||
|
| |||||||||||||
| Regular Floater(c) – 2.4% |
| ||||||||||||
| Aire Valley Mortgages PLC Series 2004-1X, Class 3A2 |
| ||||||||||||
| EUR | 437,501 | 0.630 | 09/20/66 | 532,490 | ||||||||||
| Aire Valley Mortgages PLC Series 2006-1A, Class 1A(b) |
| ||||||||||||
| $ | 91,733 | 0.490 | 09/20/66 | 83,447 | ||||||||||
| Granite Master Issuer PLC Series 2003-3, Class 3A |
| ||||||||||||
| GBP | 52,704 | 0.884 | 01/20/44 | 78,766 | ||||||||||
| Granite Master Issuer PLC Series 2005-2, Class A7 |
| ||||||||||||
| 29,832 | 0.813 | 12/20/54 | 44,129 | |||||||||||
| Granite Master Issuer PLC Series 2006-1X, Class A7 |
| ||||||||||||
| 328,150 | 0.733 | 12/20/54 | 485,421 | |||||||||||
| Granite Master Issuer PLC Series 2006-3, Class A4 |
| ||||||||||||
| $ | 1,312,599 | 0.272 | 12/20/54 | 1,272,702 | ||||||||||
| Granite Master Issuer PLC Series 2006-3, Class A5 |
| ||||||||||||
| EUR | 29,832 | 0.342 | 12/20/54 | 37,767 | ||||||||||
| Granite Master Issuer PLC Series 2007-1, Class 2A1 |
| ||||||||||||
| $ | 298,318 | 0.332 | 12/20/54 | 289,250 | ||||||||||
| Granite Master Issuer PLC Series 2007-1, Class 3A2 |
| ||||||||||||
| EUR | 89,495 | 0.322 | 12/20/54 | 113,300 | ||||||||||
|
| |||||||||||||
| 2,937,272 | ||||||||||||||
|
| |||||||||||||
| Sequential Fixed Rate – 0.2% |
| ||||||||||||
| National Credit Union Administration Guaranteed Notes | | ||||||||||||
| $ | 300,000 | 3.000 | 06/12/19 | 313,773 | ||||||||||
|
| |||||||||||||
| | TOTAL COLLATERALIZED MORTGAGE OBLIGATIONS | | $ | 13,569,875 | ||||||||||
|
| |||||||||||||
| Commercial Mortgage-Backed Securities – 0.8% |
| ||||||||||||
| Sequential Fixed Rate – 0.8% |
| ||||||||||||
| GS Mortgage Securities Corp. II Series 2007-GG10, Class A4(c) |
| ||||||||||||
| $ | 300,000 | 5.982 | % | 08/10/45 | $ | 333,901 | ||||||||
| Morgan Stanley Bank of America Merrill Lynch Trust | | ||||||||||||
| 800,000 | 2.858 | 11/15/45 | 744,594 | |||||||||||
|
| |||||||||||||
| 1,078,495 | ||||||||||||||
|
| |||||||||||||
| | TOTAL COMMERCIAL MORTGAGE-BACKED SECURITIES | | $ | 1,078,495 | ||||||||||
|
| |||||||||||||
| Mortgage-Backed Obligations – (continued) | ||||||||||||||
| Federal Agencies – 29.4% |
| ||||||||||||
| Adjustable Rate FHLMC(c) – 1.1% |
| ||||||||||||
| $ | 1,284,390 | 2.407 | % | 09/01/35 | $ | 1,349,381 | ||||||||
|
| |||||||||||||
| Adjustable Rate FNMA(c) – 1.5% |
| ||||||||||||
| 433,234 | 2.098 | 05/01/33 | 452,937 | |||||||||||
| 634,087 | 2.333 | 05/01/35 | 671,023 | |||||||||||
| 702,147 | 2.610 | 09/01/35 | 751,168 | |||||||||||
|
| |||||||||||||
| 1,875,128 | ||||||||||||||
|
| |||||||||||||
| FHLMC – 1.4% |
| ||||||||||||
| 12,688 | 7.500 | 06/01/15 | 13,217 | |||||||||||
| 19,921 | 7.000 | 07/01/16 | 20,477 | |||||||||||
| 236,046 | 5.500 | 02/01/18 | 254,924 | |||||||||||
| 22,168 | 5.500 | 04/01/18 | 23,941 | |||||||||||
| 8,394 | 4.500 | 09/01/18 | 8,825 | |||||||||||
| 33,882 | 5.500 | 09/01/18 | 36,592 | |||||||||||
| 1,894 | 9.500 | 08/01/19 | 1,938 | |||||||||||
| 45 | 9.500 | 08/01/20 | 46 | |||||||||||
| 91,957 | 6.500 | 10/01/20 | 98,808 | |||||||||||
| 18,695 | 4.500 | 07/01/24 | 19,889 | |||||||||||
| 109,174 | 4.500 | 11/01/24 | 116,215 | |||||||||||
| 20,946 | 4.500 | 12/01/24 | 22,297 | |||||||||||
| 31,720 | 6.000 | 03/01/29 | 34,995 | |||||||||||
| 180 | 6.000 | 04/01/29 | 198 | |||||||||||
| 25,256 | 7.500 | 12/01/29 | 30,059 | |||||||||||
| 222,353 | 7.000 | 05/01/32 | 251,475 | |||||||||||
| 529 | 6.000 | 08/01/32 | 581 | |||||||||||
| 136,796 | 7.000 | 12/01/32 | 154,712 | |||||||||||
| 12,039 | 5.000 | 10/01/33 | 12,880 | |||||||||||
| 15,452 | 5.000 | 07/01/35 | 16,511 | |||||||||||
| 209,296 | 5.000 | 08/01/35 | 223,062 | |||||||||||
| 19,573 | 5.000 | 12/01/35 | 21,017 | |||||||||||
| 178,565 | 5.500 | 01/01/37 | 191,832 | |||||||||||
| 12,335 | 5.000 | 03/01/38 | 13,143 | |||||||||||
| 3,116 | 5.000 | 12/01/38 | 3,318 | |||||||||||
| 6,317 | 5.000 | 02/01/39 | 6,726 | |||||||||||
| 163,931 | 5.500 | 03/01/39 | 176,019 | |||||||||||
| 15,753 | 5.000 | 06/01/41 | 17,203 | |||||||||||
|
| |||||||||||||
| 1,770,900 | ||||||||||||||
|
| |||||||||||||
| FNMA – 24.0% |
| ||||||||||||
| 20,934 | 7.500 | 08/01/15 | 21,180 | |||||||||||
| 17,035 | 6.000 | 04/01/16 | 18,220 | |||||||||||
| 31,047 | 6.500 | 05/01/16 | 32,795 | |||||||||||
| 43,296 | 6.500 | 09/01/16 | 45,942 | |||||||||||
| 55,533 | 6.500 | 11/01/16 | 60,939 | |||||||||||
| 12,467 | 7.500 | 04/01/17 | 13,115 | |||||||||||
| 246,024 | 5.500 | 02/01/18 | 262,508 | |||||||||||
| 228,750 | 5.000 | 05/01/18 | 243,574 | |||||||||||
| 21,347 | 6.500 | 08/01/18 | 23,641 | |||||||||||
| 113,755 | 7.000 | 08/01/18 | 122,705 | |||||||||||
| 396,277 | 4.520 | 06/01/21 | 436,306 | |||||||||||
| 2,638 | 5.000 | 06/01/23 | 2,808 | |||||||||||
| 84,306 | 5.000 | 08/01/23 | 90,635 | |||||||||||
| 266,450 | 5.500 | 09/01/23 | 283,493 | |||||||||||
|
| |||||||||||||
| The accompanying notes are an integral part of these financial statements. | 25 |
GOLDMAN SACHS VARIABLE INSURANCE TRUST CORE FIXED INCOME FUND
Schedule of Investments (continued)
June 30, 2013 (Unaudited)
Principal Amount | Interest Rate | Maturity Date | Value | |||||||||||
| Mortgage-Backed Obligations – (continued) | ||||||||||||||
| FNMA – (continued) |
| ||||||||||||
| $ | 64,581 | 5.500 | % | 10/01/23 | $ | 68,822 | ||||||||
| 18,171 | 4.500 | 07/01/24 | 19,456 | |||||||||||
| 235,990 | 4.500 | 11/01/24 | 252,848 | |||||||||||
| 99,504 | 4.500 | 12/01/24 | 106,608 | |||||||||||
| 79 | 7.000 | 07/01/25 | 91 | |||||||||||
| 3,978 | 7.000 | 11/01/25 | 4,605 | |||||||||||
| 25,871 | 9.000 | 11/01/25 | 30,264 | |||||||||||
| 93,088 | 7.000 | 08/01/26 | 103,619 | |||||||||||
| 770 | 7.000 | 08/01/27 | 887 | |||||||||||
| 7,785 | 7.000 | 09/01/27 | 8,968 | |||||||||||
| 26,527 | 6.000 | 12/01/27 | 29,063 | |||||||||||
| 287 | 7.000 | 01/01/28 | 331 | |||||||||||
| 166,191 | 6.000 | 02/01/29 | 182,678 | |||||||||||
| 154,666 | 6.000 | 06/01/29 | 170,200 | |||||||||||
| 45,243 | 8.000 | 10/01/29 | 54,271 | |||||||||||
| 12,863 | 7.000 | 12/01/29 | 14,817 | |||||||||||
| 71,403 | 5.000 | 01/01/30 | 77,304 | |||||||||||
| 1,462 | 8.500 | 04/01/30 | 1,750 | |||||||||||
| 7,237 | 8.000 | 05/01/30 | 8,060 | |||||||||||
| 365 | 8.500 | 06/01/30 | 421 | |||||||||||
| 14,408 | 7.000 | 05/01/32 | 16,595 | |||||||||||
| 117,125 | 7.000 | 06/01/32 | 134,601 | |||||||||||
| 152,832 | 7.000 | 08/01/32 | 175,635 | |||||||||||
| 36,448 | 8.000 | 08/01/32 | 44,099 | |||||||||||
| 7,051 | 5.000 | 08/01/33 | 7,613 | |||||||||||
| 572,378 | 5.000 | 09/01/33 | 620,723 | |||||||||||
| 7,019 | 5.500 | 09/01/33 | 7,678 | |||||||||||
| 1,414,190 | 5.000 | 12/01/33 | 1,533,639 | |||||||||||
| 2,572 | 5.500 | 02/01/34 | 2,807 | |||||||||||
| 433 | 5.500 | 04/01/34 | 472 | |||||||||||
| 40,082 | 5.000 | 12/01/34 | 43,188 | |||||||||||
| 18,825 | 5.500 | 12/01/34 | 20,475 | |||||||||||
| 59,753 | 5.000 | 04/01/35 | 64,540 | |||||||||||
| 129,228 | 6.000 | 04/01/35 | 142,154 | |||||||||||
| 3,306 | 5.500 | 09/01/35 | 3,595 | |||||||||||
| 240 | 5.500 | 02/01/37 | 261 | |||||||||||
| 367 | 5.500 | 04/01/37 | 399 | |||||||||||
| 383 | 5.500 | 05/01/37 | 416 | |||||||||||
| 582 | 5.500 | 03/01/38 | 633 | |||||||||||
| 1,197,100 | 5.000 | 04/01/38 | 1,284,572 | |||||||||||
| 484 | 5.500 | 06/01/38 | 526 | |||||||||||
| 699 | 5.500 | 07/01/38 | 759 | |||||||||||
| 515 | 5.500 | 08/01/38 | 560 | |||||||||||
| 378 | 5.500 | 09/01/38 | 411 | |||||||||||
| 9,010 | 5.500 | 10/01/38 | 9,794 | |||||||||||
| 276 | 5.500 | 12/01/38 | 300 | |||||||||||
| 237,418 | 5.000 | 01/01/39 | 256,625 | |||||||||||
| 47,966 | 4.500 | 08/01/39 | 51,187 | |||||||||||
| 492,280 | 4.000 | 09/01/40 | 512,891 | |||||||||||
| 859,564 | 4.000 | 11/01/40 | 895,553 | |||||||||||
| 1,172,158 | 4.500 | 05/01/41 | 1,242,444 | |||||||||||
| 174,341 | 6.000 | 05/01/41 | 189,575 | |||||||||||
| 734,433 | 4.500 | 09/01/41 | 778,472 | |||||||||||
| 1,000,000 | 3.000 | TBA-15yr | (e) | 1,029,062 | ||||||||||
|
| |||||||||||||
| Mortgage-Backed Obligations – (continued) | ||||||||||||||
| FNMA – (continued) |
| ||||||||||||
| $ | 12,000,000 | 3.500 | % | TBA-30yr | (e) | $ | 12,187,500 | |||||||
| 1,000,000 | 4.000 | TBA-30yr | (e) | 1,042,109 | ||||||||||
| 5,000,000 | 3.000 | TBA-30yr | (e) | 4,889,063 | ||||||||||
|
| |||||||||||||
| 29,983,850 | ||||||||||||||
|
| |||||||||||||
| GNMA – 1.4% |
| ||||||||||||
| 5,725 | 7.000 | 10/15/25 | 6,637 | |||||||||||
| 14,295 | 7.000 | 11/15/25 | 16,572 | |||||||||||
| 2,458 | 7.000 | 02/15/26 | 2,860 | |||||||||||
| 8,185 | 7.000 | 04/15/26 | 9,521 | |||||||||||
| 3,948 | 7.000 | 03/15/27 | 4,606 | |||||||||||
| 83,753 | 7.000 | 11/15/27 | 97,261 | |||||||||||
| 4,802 | 7.000 | 01/15/28 | 5,603 | |||||||||||
| 33,749 | 7.000 | 02/15/28 | 39,372 | |||||||||||
| 8,461 | 7.000 | 03/15/28 | 9,870 | |||||||||||
| 3,822 | 7.000 | 04/15/28 | 4,459 | |||||||||||
| 523 | 7.000 | 05/15/28 | 610 | |||||||||||
| 8,396 | 7.000 | 06/15/28 | 9,795 | |||||||||||
| 18,291 | 7.000 | 07/15/28 | 21,338 | |||||||||||
| 13,992 | 7.000 | 08/15/28 | 16,323 | |||||||||||
| 16,179 | 7.000 | 09/15/28 | 18,875 | |||||||||||
| 4,068 | 7.000 | 11/15/28 | 4,746 | |||||||||||
| 4,481 | 7.500 | 11/15/30 | 4,555 | |||||||||||
| 598 | 7.000 | 12/15/31 | 696 | |||||||||||
| 380,034 | 6.000 | 08/20/34 | 427,594 | |||||||||||
| 1,000,000 | 3.000 | TBA-30yr | (e) | 989,687 | ||||||||||
|
| |||||||||||||
| 1,690,980 | ||||||||||||||
|
| |||||||||||||
| TOTAL FEDERAL AGENCIES | $ | 36,670,239 | ||||||||||||
|
| |||||||||||||
| TOTAL MORTGAGE-BACKED OBLIGATIONS | ||||||||||||||
| (Cost $52,480,503) | $ | 52,627,469 | ||||||||||||
|
| |||||||||||||
| Agency Debentures – 5.0% | ||||||||||||||
| Federal Home Loan Banks |
| ||||||||||||
| $ | 600,000 | 2.125 | % | 06/09/23 | $ | 544,612 | ||||||||
| FHLMC |
| ||||||||||||
| EUR | 300,000 | 4.375 | 01/15/14 | 398,071 | ||||||||||
| $ | 800,000 | 0.875 | 03/07/18 | 776,383 | ||||||||||
| 600,000 | 1.250 | 10/02/19 | 568,917 | |||||||||||
| 700,000 | 2.375 | 01/13/22 | 679,812 | |||||||||||
| FNMA |
| ||||||||||||
| 1,600,000 | 0.625 | 10/30/14 | 1,607,245 | |||||||||||
| 600,000 | 0.875 | 02/08/18 | 583,289 | |||||||||||
| 400,000 | 6.250 | 05/15/29 | 519,989 | |||||||||||
| Tennessee Valley Authority |
| ||||||||||||
| 500,000 | 5.375 | 04/01/56 | 582,545 | |||||||||||
|
| |||||||||||||
| TOTAL AGENCY DEBENTURES | ||||||||||||||
| (Cost $6,345,562) | $ | 6,260,863 | ||||||||||||
|
| |||||||||||||
| 26 | The accompanying notes are an integral part of these financial statements. |
GOLDMAN SACHS VARIABLE INSURANCE TRUST CORE FIXED INCOME FUND
Principal Amount | Interest Rate | Maturity Date | Value | |||||||||||
| Asset-Backed Securities – 6.7% | ||||||||||||||
| Collateralized Loan Obligations – 5.1% |
| ||||||||||||
| Aberdeen Loan Funding Ltd. Series 2008-1A, Class A(b)(c) |
| ||||||||||||
| $ | 965,558 | 0.924 | % | 11/01/18 | $ | 934,166 | ||||||||
| Acis CLO Ltd. Series 2013-1A(b) |
| ||||||||||||
| 1,500,000 | 1.558 | 04/18/24 | 1,436,730 | |||||||||||
| Black Diamond CLO Ltd. Series 2006-1A, Class AD(b)(c) |
| ||||||||||||
| 250,000 | 0.526 | 04/29/19 | 243,133 | |||||||||||
| Ocean Trails CLO I Series 2006-1X, Class A1(c) |
| ||||||||||||
| 1,984,502 | 0.527 | 10/12/20 | 1,927,144 | |||||||||||
| OFSI Fund V Ltd. Series 2013-5A(b) |
| ||||||||||||
| 950,000 | 1.618 | 04/17/25 | 908,926 | |||||||||||
| Red River CLO Ltd. Series 1A, Class A(b)(c) |
| ||||||||||||
| 864,357 | 0.544 | 07/27/18 | 837,961 | |||||||||||
|
| |||||||||||||
| 6,288,060 | ||||||||||||||
|
| |||||||||||||
| Home Equity – 0.2% |
| ||||||||||||
| GMAC Mortgage Corp. Loan Trust Series 2007-HE3, Class 1A1 |
| ||||||||||||
| 105,405 | 7.000 | 09/25/37 | 101,374 | |||||||||||
| GMAC Mortgage Corp. Loan Trust Series 2007-HE3, Class 2A1 |
| ||||||||||||
| 153,515 | 7.000 | 09/25/37 | 143,767 | |||||||||||
|
| |||||||||||||
| 245,141 | ||||||||||||||
|
| |||||||||||||
| Student Loans(c) – 1.4% |
| ||||||||||||
| Access Group, Inc. Series 2005-2, Class A3 |
| ||||||||||||
| 525,620 | 0.453 | 11/22/24 | 517,793 | |||||||||||
| College Loan Corp. Trust Series 2004-1, Class A4 |
| ||||||||||||
| 300,000 | 0.466 | 04/25/24 | 283,241 | |||||||||||
| College Loan Corp. Trust Series 2006-1, Class A3 |
| ||||||||||||
| 1,000,000 | 0.366 | 10/25/25 | 984,819 | |||||||||||
|
| |||||||||||||
| 1,785,853 | ||||||||||||||
|
| |||||||||||||
| TOTAL ASSET-BACKED SECURITIES | ||||||||||||||
| (Cost $8,384,866) | $ | 8,319,054 | ||||||||||||
|
| |||||||||||||
| Foreign Debt Obligations – 3.1% | ||||||||||||||
| Sovereign – 2.1% |
| ||||||||||||
| Chile Government International Bond |
| ||||||||||||
| $ | 150,000 | 3.625 | % | 10/30/42 | $ | 123,000 | ||||||||
| Colombia Government International Bond |
| ||||||||||||
| 209,000 | 4.375 | 07/12/21 | 216,838 | |||||||||||
| Indonesia Government International Bond |
| ||||||||||||
| 230,000 | 8.500 | 10/12/35 | 302,450 | |||||||||||
| Mexico Government International Bond |
| ||||||||||||
| 250,000 | 4.750 | 03/08/44 | 226,250 | |||||||||||
| Slovenia Government International Bond(b) |
| ||||||||||||
| 210,000 | 5.500 | 10/26/22 | 190,999 | |||||||||||
| United Kingdom Gilt |
| ||||||||||||
| GBP | 1,000,000 | 2.750 | 01/22/15 | 1,576,221 | ||||||||||
|
| |||||||||||||
| 2,635,758 | ||||||||||||||
|
| |||||||||||||
| Supranational – 1.0% |
| ||||||||||||
| Inter-American Development Bank |
| ||||||||||||
| 200,000 | 1.000 | 02/27/18 | 192,361 | |||||||||||
|
| |||||||||||||
| Foreign Debt Obligations – (continued) | ||||||||||||||
| Supranational – (continued) |
| ||||||||||||
| International Finance Corp. |
| ||||||||||||
| $ | 1,100,000 | 0.875 | % | 06/15/18 | $ | 1,067,170 | ||||||||
|
| |||||||||||||
| 1,259,531 | ||||||||||||||
|
| |||||||||||||
| TOTAL FOREIGN DEBT OBLIGATIONS | ||||||||||||||
| (Cost $4,069,519) | $ | 3,895,289 | ||||||||||||
|
| |||||||||||||
| Municipal Debt Obligations – 1.1% | ||||||||||||||
| California – 0.3% |
| ||||||||||||
| California State Various Purpose GO Bonds Series 2010 |
| ||||||||||||
| $ | 140,000 | 7.950 | % | 03/01/36 | $ | 166,139 | ||||||||
| 105,000 | 7.625 | 03/01/40 | 141,033 | |||||||||||
|
| |||||||||||||
| 307,172 | ||||||||||||||
|
| |||||||||||||
| Illinois – 0.2% |
| ||||||||||||
| Illinois State GO Bonds for Build America Bonds Series 2010-5 |
| ||||||||||||
| 250,000 | 7.350 | 07/01/35 | 275,477 | |||||||||||
|
| |||||||||||||
| New York – 0.4% |
| ||||||||||||
| Rensselaer Polytechnic Institute Taxable Bonds Series 2010 |
| ||||||||||||
| 475,000 | 5.600 | 09/01/20 | 527,934 | |||||||||||
|
| |||||||||||||
| Ohio – 0.2% |
| ||||||||||||
| American Municipal Power, Inc. RB Build America Bond Series | | ||||||||||||
| 250,000 | 6.270 | 02/15/50 | 266,190 | |||||||||||
|
| |||||||||||||
| TOTAL MUNICIPAL DEBT OBLIGATIONS | ||||||||||||||
| (Cost $1,224,996) | $ | 1,376,773 | ||||||||||||
|
| |||||||||||||
| Government Guarantee Obligations – 2.0% | ||||||||||||||
| Achmea Hypotheekbank NV(b)(f) |
| ||||||||||||
| $ | 105,000 | 3.200 | % | 11/03/14 | $ | 108,990 | ||||||||
| Israel Government AID Bond(g) |
| ||||||||||||
| 400,000 | 5.500 | 09/18/23 | 481,845 | |||||||||||
| 100,000 | 5.500 | 12/04/23 | 120,852 | |||||||||||
| 100,000 | 5.500 | 04/26/24 | 120,657 | |||||||||||
| Kommunalbanken AS(b)(f) |
| ||||||||||||
| 300,000 | 1.000 | 09/26/17 | 295,615 | |||||||||||
| Landwirtschaftliche Rentenbank(f) |
| ||||||||||||
| 1,400,000 | 4.125 | 07/15/13 | 1,401,792 | |||||||||||
|
| |||||||||||||
| TOTAL GOVERNMENT GUARANTEE OBLIGATIONS | ||||||||||||||
| (Cost $2,591,012) | $ | 2,529,751 | ||||||||||||
|
| |||||||||||||
| U.S. Treasury Obligations – 19.4% | ||||||||||||||
| United States Treasury Bonds |
| ||||||||||||
| $ | 400,000 | 3.125 | % | 11/15/41 | $ | 374,784 | ||||||||
| 1,100,000 | 3.125 | 02/15/42 | 1,029,248 | |||||||||||
| 1,100,000 | 3.000 | 05/15/42 | 1,001,913 | |||||||||||
| 200,000 | 3.125 | 02/15/43 | 186,544 | |||||||||||
| 900,000 | 2.875 | 05/15/43 | 796,293 | |||||||||||
|
| |||||||||||||
| The accompanying notes are an integral part of these financial statements. | 27 |
GOLDMAN SACHS VARIABLE INSURANCE TRUST CORE FIXED INCOME FUND
Schedule of Investments (continued)
June 30, 2013 (Unaudited)
Principal Amount | Interest Rate | Maturity Date | Value | |||||||||||
| U.S. Treasury Obligations – (continued) | ||||||||||||||
| United States Treasury Inflation-Protected Securities |
| ||||||||||||
| $ | 755,056 | 2.000 | % | 01/15/14 | $ | 766,047 | ||||||||
| 2,637,000 | 1.250 | 04/15/14 | 2,674,920 | |||||||||||
| 402,960 | 0.125 | 01/15/23 | 391,061 | |||||||||||
| United States Treasury Notes |
| ||||||||||||
| 2,600,000 | 0.125 | (h) | 12/31/14 | 2,595,216 | ||||||||||
| 700,000 | 0.125 | 04/30/15 | 697,333 | |||||||||||
| 1,300,000 | 0.750 | 03/31/18 | 1,265,017 | |||||||||||
| 600,000 | 0.625 | 04/30/18 | 579,684 | |||||||||||
| 3,800,000 | 1.000 | 05/31/18 | 3,733,652 | |||||||||||
| 1,200,000 | 1.375 | 06/30/18 | 1,199,160 | |||||||||||
| 800,000 | 1.875 | 06/30/20 | 796,904 | |||||||||||
| 5,000,000 | 1.625 | 11/15/22 | 4,665,150 | |||||||||||
| 300,000 | 1.750 | 05/15/23 | 280,899 | |||||||||||
| United States Treasury Principal-Only STRIPS |
| ||||||||||||
| 1,900,000 | 0.000 | (i) | 11/15/27 | 1,199,603 | ||||||||||
|
| |||||||||||||
| TOTAL U.S. TREASURY OBLIGATIONS | ||||||||||||||
| (Cost $24,978,998) | $ | 24,233,428 | ||||||||||||
|
| |||||||||||||
| TOTAL INVESTMENTS – 104.8% | ||||||||||||||
| (Cost $131,026,798) | $ | 130,761,379 | ||||||||||||
|
| |||||||||||||
| LIABILITIES IN EXCESS OF | | (5,995,604 | ) | ||||||||||
|
| |||||||||||||
| NET ASSETS – 100.0% | $ | 124,765,775 | ||||||||||||
|
| |||||||||||||
| The percentage shown for each investment category reflects the value of investments in that category as a percentage of net assets. | ||
| (a) | Securities with “Call” features with resetting interest rates. Maturity dates disclosed are the final maturity dates. | |
| (b) | Exempt from registration under Rule 144A of the Securities Act of 1933. Under procedures approved by the Board of Trustees, such securities have been determined to be liquid by the investment adviser and may be resold, normally to qualified institutional buyers in transactions exempt from registration. Total market value of Rule 144A securities amounts to $16,777,231, which represents approximately 13.4% of net assets as of June 30, 2013. | |
| (c) | Variable rate security. Interest rate disclosed is that which is in effect at June 30, 2013. | |
| (d) | Security with “Put” features and resetting interest rates. Maturity dates disclosed are the puttable dates. Interest rate disclosed is that which is in effect at June 30, 2013. | |
| (e) | TBA (To Be Announced) Securities are purchased/sold on a forward commitment basis with an approximate principal amount and no defined maturity date. The actual principal and maturity date will be determined upon settlement when the specific mortgage pools are assigned. Total market value of TBA securities (excluding forward sales contracts, if any) amounts to $20,137,421 which represents approximately 16.1% of net assets as of June 30, 2013. | |
| (f) | Guaranteed by a foreign government. Total market value of these securities amounts to $1,806,397, which represents 1.4% of net assets as of June 30, 2013. | |
| (g) | Guaranteed by the United States Government. Total market value of these securities amounts to $723,354, which represents 0.6% of net assets as of June 30, 2013. | |
| (h) | All or a portion of security is segregated as collateral for initial margin requirements on futures transactions. | |
| (i) | Issued with a zero coupon. Income is recognized through the accretion of discount. |
| Investment Abbreviations: | ||
| FHLMC | —Federal Home Loan Mortgage Corp. | |
| FNMA | —Federal National Mortgage Association | |
| GNMA | —Government National Mortgage Association | |
| GO | —General Obligation | |
| RB | —Revenue Bond | |
| RMKT | —Remarketed | |
| STRIPS | —Separate Trading of Registered Interest and Principal of Securities | |
| UK | —United Kingdom | |
| Currency Abbreviations: | ||
| AUD | —Australian Dollar | |
| CAD | —Canadian Dollar | |
| CHF | —Swiss Franc | |
| EUR | —Euro | |
| GBP | —British Pound | |
| JPY | —Japanese Yen | |
| MXN | —Mexican Peso | |
| NOK | —Norwegian Krone | |
| NZD | —New Zealand Dollar | |
| SEK | —Swedish Krona | |
| USD | —United States Dollar | |
| 28 | The accompanying notes are an integral part of these financial statements. |
GOLDMAN SACHS VARIABLE INSURANCE TRUST CORE FIXED INCOME FUND
ADDITIONAL INVESTMENT INFORMATION
FORWARD FOREIGN CURRENCY EXCHANGE CONTRACTS — At June 30, 2013, the Fund had the following forward foreign currency exchange contracts:
FORWARD FOREIGN CURRENCY EXCHANGE CONTRACTS WITH UNREALIZED GAIN
| Counterparty | Contracts to Buy/Sell | Settlement Date | Current Value | Unrealized Gain | ||||||||
| Bank of America NA | USD/EUR | 09/18/13 | $ | 207,035 | $ | 5,307 | ||||||
| Barclays Bank PLC | EUR/GBP | 09/18/13 | 104,169 | 838 | ||||||||
| EUR/USD | 09/18/13 | 104,169 | 120 | |||||||||
| USD/AUD | 09/18/13 | 48,869 | 1,841 | |||||||||
| USD/GBP | 09/18/13 | 205,220 | 5,944 | |||||||||
| BNP Paribas SA | EUR/GBP | 09/18/13 | 414,070 | 1,053 | ||||||||
| SEK/EUR | 09/18/13 | 104,268 | 99 | |||||||||
| USD/JPY | 09/18/13 | 204,734 | 2,266 | |||||||||
| Citibank NA | USD/AUD | 09/18/13 | 458,706 | 16,723 | ||||||||
| USD/EUR | 09/18/13 | 207,036 | 4,058 | |||||||||
| USD/JPY | 09/18/13 | 308,218 | 8,782 | |||||||||
| Credit Suisse International | CHF/EUR | 09/18/13 | 209,960 | 321 | ||||||||
| Deutsche Bank AG (London) | EUR/JPY | 09/18/13 | 205,733 | 2,044 | ||||||||
| JPY/USD | 09/18/13 | 104,163 | 163 | |||||||||
| USD/AUD | 09/18/13 | 359,600 | 6,949 | |||||||||
| USD/JPY | 09/18/13 | 101,757 | 1,243 | |||||||||
| HSBC Bank PLC | EUR/SEK | 09/18/13 | 710,656 | 9,028 | ||||||||
| USD/AUD | 09/18/13 | �� | 202,758 | 2,736 | ||||||||
| USD/GBP | 09/18/13 | 206,740 | 6,078 | |||||||||
| JPMorgan Chase Bank NA | EUR/NOK | 09/18/13 | 102,867 | 570 | ||||||||
| USD/EUR | 08/07/13 | 1,094,234 | 1,701 | |||||||||
| USD/EUR | 09/18/13 | 626,314 | 10,733 | |||||||||
| USD/GBP | 08/08/13 | 2,715,295 | 46,846 | |||||||||
| USD/JPY | 09/18/13 | 103,204 | 796 | |||||||||
| Morgan Stanley Co., Inc. | SEK/EUR | 09/18/13 | 104,624 | 1,758 | ||||||||
| USD/AUD | 09/18/13 | 102,234 | 1,796 | |||||||||
| USD/CHF | 09/18/13 | 1,049,833 | 9,804 | |||||||||
| USD/EUR | 09/18/13 | 102,866 | 2,884 | |||||||||
| USD/JPY | 09/18/13 | 206,698 | 2,302 | |||||||||
| Royal Bank of Canada | CAD/USD | 09/18/13 | 208,348 | 348 | ||||||||
| MXN/USD | 07/26/13 | 2,245,966 | 20,244 | |||||||||
| USD/CAD | 09/18/13 | 1,241,467 | 20,033 | |||||||||
| Royal Bank of Scotland | EUR/SEK | 09/18/13 | 205,733 | 781 | ||||||||
| USD/GBP | 09/18/13 | 206,740 | 5,185 | |||||||||
| USD/NZD | 09/18/13 | 208,822 | 450 | |||||||||
| Standard Chartered Bank | USD/AUD | 09/18/13 | 512,805 | 15,005 | ||||||||
| The accompanying notes are an integral part of these financial statements. | 29 |
GOLDMAN SACHS VARIABLE INSURANCE TRUST CORE FIXED INCOME FUND
Schedule of Investments (continued)
June 30, 2013 (Unaudited)
ADDITIONAL INVESTMENT INFORMATION (continued)
FORWARD FOREIGN CURRENCY EXCHANGE CONTRACTS WITH UNREALIZED GAIN (continued)
| Counterparty | Contracts to Buy/Sell | Settlement Date | Current Value | Unrealized Gain | ||||||||
| State Street Bank | EUR/USD | 09/18/13 | $ | 104,169 | $ | 108 | ||||||
| NOK/EUR | 09/18/13 | 104,478 | 1,612 | |||||||||
| USD/JPY | 09/18/13 | 312,381 | 2,619 | |||||||||
| UBS AG (London) | CHF/USD | 09/18/13 | 104,077 | 77 | ||||||||
| SEK/EUR | 09/18/13 | 104,010 | 1,144 | |||||||||
| USD/JPY | 09/18/13 | 102,082 | 3,918 | |||||||||
| Westpac Banking Corp. | NZD/USD | 09/18/13 | 207,280 | 271 | ||||||||
| USD/AUD | 09/18/13 | 1,278,404 | 41,018 | |||||||||
| USD/JPY | 09/18/13 | 535,229 | 23,872 | |||||||||
| TOTAL | $ | 291,468 | ||||||||||
FORWARD FOREIGN CURRENCY EXCHANGE CONTRACTS WITH UNREALIZED LOSS
| Counterparty | Contracts to Buy/Sell | Settlement Date | Current Value | Unrealized Loss | ||||||||
| Barclays Bank PLC | EUR/USD | 09/18/13 | $ | 102,867 | $ | (3,135 | ) | |||||
| USD/MXN | 07/26/13 | 2,197,356 | (47,839 | ) | ||||||||
| BNP Paribas SA | EUR/USD | 09/18/13 | 728,281 | (13,766 | ) | |||||||
| Citibank NA | EUR/USD | 09/18/13 | 333,340 | (5,348 | ) | |||||||
| JPY/EUR | 09/18/13 | 410,425 | (2,343 | ) | ||||||||
| JPY/USD | 09/18/13 | 407,040 | (17,960 | ) | ||||||||
| SEK/EUR | 09/18/13 | 105,043 | (428 | ) | ||||||||
| Credit Suisse International | CHF/USD | 09/18/13 | 206,671 | (3,329 | ) | |||||||
| EUR/CHF | 09/18/13 | 102,866 | (189 | ) | ||||||||
| EUR/USD | 09/18/13 | 104,169 | (120 | ) | ||||||||
| Deutsche Bank AG (London) | AUD/USD | 09/18/13 | 304,592 | (9,209 | ) | |||||||
| CAD/USD | 09/18/13 | 103,915 | (85 | ) | ||||||||
| JPY/USD | 09/18/13 | 207,776 | (5,224 | ) | ||||||||
| HSBC Bank PLC | GBP/EUR | 09/18/13 | 417,528 | (3,053 | ) | |||||||
| SEK/EUR | 09/18/13 | 29,297 | (108 | ) | ||||||||
| JPMorgan Chase Bank NA | EUR/CHF | 09/18/13 | 105,471 | (230 | ) | |||||||
| EUR/SEK | 09/18/13 | 102,867 | (1,027 | ) | ||||||||
| EUR/USD | 09/18/13 | 104,169 | (1,585 | ) | ||||||||
| JPY/USD | 09/18/13 | 467,239 | (5,761 | ) | ||||||||
| SEK/EUR | 09/18/13 | 313,023 | (1,723 | ) | ||||||||
| Royal Bank of Canada | CAD/USD | 09/18/13 | 413,923 | (7,077 | ) | |||||||
| EUR/USD | 09/18/13 | 207,035 | (5,533 | ) | ||||||||
| 30 | The accompanying notes are an integral part of these financial statements. |
GOLDMAN SACHS VARIABLE INSURANCE TRUST CORE FIXED INCOME FUND
ADDITIONAL INVESTMENT INFORMATION (continued)
FORWARD FOREIGN CURRENCY EXCHANGE CONTRACTS WITH UNREALIZED LOSS (continued)
| Counterparty | Contracts to Buy/Sell | Settlement Date | Current Value | Unrealized Loss | ||||||||
| Royal Bank of Scotland | AUD/USD | 09/18/13 | $ | 100,924 | $ | (3,578 | ) | |||||
| GBP/EUR | 09/18/13 | 209,714 | (1,159 | ) | ||||||||
| NZD/USD | 09/18/13 | 101,714 | (1,253 | ) | ||||||||
| State Street Bank | GBP/USD | 09/18/13 | 474,757 | (9,734 | ) | |||||||
| JPY/EUR | 09/18/13 | 205,006 | (2,029 | ) | ||||||||
| JPY/USD | 09/18/13 | 103,342 | (1,658 | ) | ||||||||
| UBS AG (London) | CHF/USD | 09/18/13 | 929,481 | (26,519 | ) | |||||||
| EUR/CHF | 09/18/13 | 210,941 | (983 | ) | ||||||||
| GBP/CHF | 09/18/13 | 206,740 | (1,091 | ) | ||||||||
| SEK/EUR | 09/18/13 | 149,997 | (1,047 | ) | ||||||||
| Westpac Banking Corp. | AUD/EUR | 09/18/13 | 508,458 | (7,176 | ) | |||||||
| AUD/USD | 09/18/13 | 1,946,659 | (56,897 | ) | ||||||||
| NZD/USD | 09/18/13 | 204,198 | (2,162 | ) | ||||||||
| USD/NZD | 09/18/13 | 208,821 | (613 | ) | ||||||||
| TOTAL | $ | (250,971 | ) | |||||||||
FORWARD SALES CONTRACTS — At June 30, 2013, the Fund had the following forward sales contracts:
| Description | Interest Rate | Maturity Date(e) | Settlement Date | Principal Amount | Value | |||||||||||||||
| FNMA | 4.500 | % | TBA-30yr | 08/12/13 | $ | (1,000,000 | ) | $ | (1,056,641 | ) | ||||||||||
| FNMA | 5.000 | % | TBA-30yr | 08/12/13 | (2,000,000 | ) | (2,150,469 | ) | ||||||||||||
FNMA | 5.000 | % | TBA-30yr | 07/15/13 | (1,000,000 | ) | (1,076,562 | ) | ||||||||||||
| TOTAL (Proceeds Receivable: $4,305,352) | $ | (4,283,672 | ) | |||||||||||||||||
| The accompanying notes are an integral part of these financial statements. | 31 |
GOLDMAN SACHS VARIABLE INSURANCE TRUST CORE FIXED INCOME FUND
Schedule of Investments (continued)
June 30, 2013 (Unaudited)
ADDITIONAL INVESTMENT INFORMATION (continued)
FUTURES CONTRACTS — At June 30, 2013, the Fund had the following futures contracts:
| Type | Number of Contracts Long (Short) | Expiration Date | Current Value | Unrealized Gain (Loss) | ||||||||||
| U.S. Long Bond | (20 | ) | September 2013 | $ | (2,716,875 | ) | $ | 68,171 | ||||||
| U.S. Ultra Long Treasury Bonds | 13 | September 2013 | 1,915,063 | (68,005 | ) | |||||||||
| 2 Year U.S. Treasury Notes | 30 | September 2013 | 6,600,000 | (8,020 | ) | |||||||||
| 5 Year U.S. Treasury Notes | 131 | September 2013 | 15,857,141 | (143,433 | ) | |||||||||
10 Year U.S. Treasury Notes | (154 | ) | September 2013 | (19,490,625 | ) | 414,076 | ||||||||
| TOTAL | $ | 262,789 | ||||||||||||
| 32 | The accompanying notes are an integral part of these financial statements. |
GOLDMAN SACHS VARIABLE INSURANCE TRUST EQUITY INDEX FUND
Schedule of Investments
June 30, 2013 (Unaudited)
Shares | Description | Value | ||||||
| Common Stocks – 99.2% | ||||||||
| Automobiles & Components – 1.1% |
| ||||||
| 1,415 | BorgWarner, Inc.* | $ | 121,902 | |||||
| 3,638 | Delphi Automotive PLC | 184,410 | ||||||
| 48,365 | Ford Motor Co. | 748,207 | ||||||
| 9,400 | General Motors Co.* | 313,114 | ||||||
| 2,777 | Harley-Davidson, Inc. | 152,235 | ||||||
| 8,374 | Johnson Controls, Inc. | 299,705 | ||||||
| 3,164 | The Goodyear Tire & Rubber Co.* | 48,378 | ||||||
|
| |||||||
| 1,867,951 | ||||||||
|
| |||||||
| Banks – 3.0% |
| ||||||
| 8,557 | BB&T Corp. | 289,911 | ||||||
| 2,265 | Comerica, Inc. | 90,215 | ||||||
| 10,963 | Fifth Third Bancorp | 197,882 | ||||||
| 5,842 | Hudson City Bancorp, Inc. | 53,513 | ||||||
| 10,683 | Huntington Bancshares, Inc. | 84,182 | ||||||
| 11,151 | KeyCorp | 123,107 | ||||||
| 1,490 | M&T Bank Corp. | 166,507 | ||||||
| 4,272 | People’s United Financial, Inc. | 63,653 | ||||||
| 17,150 | Regions Financial Corp. | 163,440 | ||||||
| 6,704 | SunTrust Banks, Inc. | 211,645 | ||||||
| 6,549 | The PNC Financial Services Group, Inc. | 477,553 | ||||||
| 22,706 | U.S. Bancorp | 820,822 | ||||||
| 60,177 | Wells Fargo & Co. | 2,483,505 | ||||||
| 2,189 | Zions Bancorporation | 63,218 | ||||||
|
| |||||||
| 5,289,153 | ||||||||
|
| |||||||
| Capital Goods – 7.7% |
| ||||||
| 7,777 | 3M Co. | 850,415 | ||||||
| 8,018 | Caterpillar, Inc. | 661,405 | ||||||
| 2,181 | Cummins, Inc. | 236,551 | ||||||
| 7,144 | Danaher Corp. | 452,215 | ||||||
| 4,798 | Deere & Co. | 389,838 | ||||||
| 2,184 | Dover Corp. | 169,609 | ||||||
| 5,836 | Eaton Corp. PLC | 384,067 | ||||||
| 8,888 | Emerson Electric Co. | 484,752 | ||||||
| 3,294 | Fastenal Co. | 151,030 | ||||||
| 1,770 | Flowserve Corp. | 95,598 | ||||||
| 1,982 | Fluor Corp. | 117,552 | ||||||
| 4,069 | General Dynamics Corp. | 318,725 | ||||||
| 126,934 | General Electric Co. | 2,943,599 | ||||||
| 9,647 | Honeywell International, Inc. | 765,393 | ||||||
| 5,139 | Illinois Tool Works, Inc. | 355,465 | ||||||
| 3,383 | Ingersoll-Rand PLC | 187,824 | ||||||
| 1,637 | Jacobs Engineering Group, Inc.* | 90,248 | ||||||
| 1,284 | Joy Global, Inc. | 62,313 | ||||||
| 1,110 | L-3 Communications Holdings, Inc. | 95,171 | ||||||
| 3,288 | Lockheed Martin Corp. | 356,617 | ||||||
| 4,447 | Masco Corp. | 86,672 | ||||||
| 2,896 | Northrop Grumman Corp. | 239,789 | ||||||
| 4,356 | PACCAR, Inc. | 233,743 | ||||||
| 1,352 | Pall Corp. | 89,813 | ||||||
| 1,827 | Parker Hannifin Corp. | 174,296 | ||||||
| 2,544 | Pentair Ltd. (Registered) | 146,763 | ||||||
|
| |||||||
| Common Stocks – (continued) | ||||||||
| Capital Goods – (continued) |
| ||||||
| 1,803 | Precision Castparts Corp. | $ | 407,496 | |||||
| 2,712 | Quanta Services, Inc.* | 71,760 | ||||||
| 3,986 | Raytheon Co. | 263,554 | ||||||
| 1,708 | Rockwell Automation, Inc. | 142,003 | ||||||
| 1,695 | Rockwell Collins, Inc. | 107,480 | ||||||
| 1,224 | Roper Industries, Inc. | 152,045 | ||||||
| 722 | Snap-on, Inc. | 64,532 | ||||||
| 1,944 | Stanley Black & Decker, Inc. | 150,271 | ||||||
| 3,365 | Textron, Inc. | 87,658 | ||||||
| 8,379 | The Boeing Co. | 858,345 | ||||||
| 10,335 | United Technologies Corp. | 960,535 | ||||||
| 733 | W.W. Grainger, Inc. | 184,848 | ||||||
| 2,378 | Xylem, Inc. | 64,063 | ||||||
|
| |||||||
| 13,654,053 | ||||||||
|
| |||||||
| Commercial & Professional Services – 0.7% |
| ||||||
| 1,302 | Avery Dennison Corp. | 55,673 | ||||||
| 1,254 | Cintas Corp. | 57,107 | ||||||
| 1,446 | Equifax, Inc. | 85,213 | ||||||
| 2,026 | Iron Mountain, Inc. | 53,912 | ||||||
| 2,600 | Pitney Bowes, Inc. | 38,168 | ||||||
| 3,638 | Republic Services, Inc. | 123,474 | ||||||
| 1,757 | Robert Half International, Inc. | 58,385 | ||||||
| 1,067 | Stericycle, Inc.* | 117,829 | ||||||
| 2,720 | The ADT Corp.* | 108,392 | ||||||
| 478 | The Dun & Bradstreet Corp. | 46,581 | ||||||
| 5,776 | Tyco International Ltd. | 190,319 | ||||||
| 5,415 | Waste Management, Inc. | 218,387 | ||||||
|
| |||||||
| 1,153,440 | ||||||||
|
| |||||||
| Consumer Durables & Apparel – 1.2% |
| ||||||
| 3,516 | Coach, Inc. | 200,728 | ||||||
| 3,336 | D.R. Horton, Inc. | 70,990 | ||||||
| 639 | Fossil Group, Inc.* | 66,015 | ||||||
| 1,400 | Garmin Ltd. | 50,624 | ||||||
| 823 | Harman International Industries, Inc. | 44,607 | ||||||
| 1,385 | Hasbro, Inc. | 62,090 | ||||||
| 1,800 | Leggett & Platt, Inc. | 55,962 | ||||||
| 2,101 | Lennar Corp. Class A | 75,720 | ||||||
| 4,247 | Mattel, Inc. | 192,432 | ||||||
| 3,478 | Newell Rubbermaid, Inc. | 91,297 | ||||||
| 8,934 | NIKE, Inc. Class B | 568,917 | ||||||
| 4,072 | PulteGroup, Inc.* | 77,246 | ||||||
| 943 | PVH Corp. | 117,922 | ||||||
| 735 | Ralph Lauren Corp. | 127,699 | ||||||
| 1,097 | VF Corp. | 211,787 | ||||||
| 989 | Whirlpool Corp. | 113,102 | ||||||
|
| |||||||
| 2,127,138 | ||||||||
|
| |||||||
| Consumer Services – 1.8% |
| ||||||
| 5,509 | Carnival Corp. | 188,904 | ||||||
| 377 | Chipotle Mexican Grill, Inc.* | 137,360 | ||||||
| 1,566 | Darden Restaurants, Inc. | 79,052 | ||||||
| 3,300 | H&R Block, Inc. | 91,575 | ||||||
|
| |||||||
| The accompanying notes are an integral part of these financial statements. | 33 |
GOLDMAN SACHS VARIABLE INSURANCE TRUST EQUITY INDEX FUND
Schedule of Investments (continued)
June 30, 2013 (Unaudited)
Shares | Description | Value | ||||||
| Common Stocks – (continued) | ||||||||
| Consumer Services – (continued) |
| ||||||
| 3,412 | International Game Technology | $ | 57,014 | |||||
| 3,067 | Marriott International, Inc. Class A | 123,815 | ||||||
| 12,297 | McDonald’s Corp. | 1,217,403 | ||||||
| 9,229 | Starbucks Corp. | 604,407 | ||||||
| 2,386 | Starwood Hotels & Resorts Worldwide, Inc. | 150,771 | ||||||
| 1,694 | Wyndham Worldwide Corp. | 96,948 | ||||||
| 983 | Wynn Resorts Ltd. | 125,824 | ||||||
| 5,594 | Yum! Brands, Inc. | 387,888 | ||||||
|
| |||||||
| 3,260,961 | ||||||||
|
| |||||||
| Diversified Financials – 7.0% |
| ||||||
| 11,733 | American Express Co. | 877,159 | ||||||
| 2,523 | Ameriprise Financial, Inc. | 204,060 | ||||||
| 132,774 | Bank of America Corp. | 1,707,474 | ||||||
| 1,536 | BlackRock, Inc. | 394,521 | ||||||
| 7,148 | Capital One Financial Corp. | 448,966 | ||||||
| 37,291 | Citigroup, Inc. | 1,788,849 | ||||||
| 3,816 | CME Group, Inc. | 289,940 | ||||||
| 6,084 | Discover Financial Services | 289,842 | ||||||
| 3,050 | E*TRADE Financial Corp.* | 38,613 | ||||||
| 1,709 | Franklin Resources, Inc. | 232,458 | ||||||
| 892 | IntercontinentalExchange, Inc.* | 158,562 | ||||||
| 5,385 | Invesco Ltd. | 171,243 | ||||||
| 46,399 | JPMorgan Chase & Co. | 2,449,403 | ||||||
| 1,500 | Legg Mason, Inc. | 46,515 | ||||||
| 3,700 | Leucadia National Corp. | 97,014 | ||||||
| 3,510 | McGraw Hill Financial, Inc. | 186,697 | ||||||
| 2,430 | Moody’s Corp. | 148,060 | ||||||
| 16,769 | Morgan Stanley | 409,667 | ||||||
| 2,650 | Northern Trust Corp. | 153,435 | ||||||
| 2,995 | NYSE Euronext | 123,993 | ||||||
| 5,499 | SLM Corp. | 125,707 | ||||||
| 5,651 | State Street Corp. | 368,502 | ||||||
| 3,186 | T. Rowe Price Group, Inc. | 233,056 | ||||||
| 14,308 | The Bank of New York Mellon Corp. | 401,339 | ||||||
| 13,465 | The Charles Schwab Corp. | 285,862 | ||||||
| 5,291 | The Goldman Sachs Group, Inc.(a) | 800,264 | ||||||
| 1,531 | The NASDAQ OMX Group, Inc. | 50,201 | ||||||
|
| |||||||
| 12,481,402 | ||||||||
|
| |||||||
| Energy – 10.5% |
| ||||||
| 6,164 | Anadarko Petroleum Corp. | 529,673 | ||||||
| 4,860 | Apache Corp. | 407,414 | ||||||
| 5,419 | Baker Hughes, Inc. | 249,978 | ||||||
| 2,590 | Cabot Oil & Gas Corp. | 183,942 | ||||||
| 3,075 | Cameron International Corp.* | 188,067 | ||||||
| 6,492 | Chesapeake Energy Corp. | 132,307 | ||||||
| 23,853 | Chevron Corp. | 2,822,764 | ||||||
| 15,039 | ConocoPhillips | 909,859 | ||||||
| 2,900 | CONSOL Energy, Inc. | 78,590 | ||||||
| 4,506 | Denbury Resources, Inc.* | 78,044 | ||||||
| 4,684 | Devon Energy Corp. | 243,006 | ||||||
| 819 | Diamond Offshore Drilling, Inc. | 56,339 | ||||||
|
| |||||||
| Common Stocks – (continued) | ||||||||
| Energy – (continued) |
| ||||||
| 2,883 | Ensco PLC Class A | $ | 167,560 | |||||
| 3,348 | EOG Resources, Inc. | 440,865 | ||||||
| 1,832 | EQT Corp. | 145,406 | ||||||
| 54,583 | Exxon Mobil Corp. | 4,931,574 | ||||||
| 2,922 | FMC Technologies, Inc.* | 162,697 | ||||||
| 11,528 | Halliburton Co. | 480,948 | ||||||
| 1,356 | Helmerich & Payne, Inc. | 84,682 | ||||||
| 3,676 | Hess Corp. | 244,417 | ||||||
| 7,730 | Kinder Morgan, Inc. | 294,899 | ||||||
| 8,622 | Marathon Oil Corp. | 298,149 | ||||||
| 3,987 | Marathon Petroleum Corp. | 283,316 | ||||||
| 2,220 | Murphy Oil Corp. | 135,176 | ||||||
| 3,602 | Nabors Industries Ltd. | 55,147 | ||||||
| 5,280 | National Oilwell Varco, Inc. | 363,792 | ||||||
| 1,660 | Newfield Exploration Co.* | 39,657 | ||||||
| 3,115 | Noble Corp. | 117,062 | ||||||
| 4,390 | Noble Energy, Inc. | 263,576 | ||||||
| 9,939 | Occidental Petroleum Corp. | 886,857 | ||||||
| 3,406 | Peabody Energy Corp. | 49,864 | ||||||
| 7,650 | Phillips 66 | 450,661 | ||||||
| 1,600 | Pioneer Natural Resources Co. | 231,600 | ||||||
| 2,242 | QEP Resources, Inc. | 62,283 | ||||||
| 1,998 | Range Resources Corp. | 154,485 | ||||||
| 1,600 | Rowan Companies PLC Class A* | 54,512 | ||||||
| 16,287 | Schlumberger Ltd. | 1,167,126 | ||||||
| 4,294 | Southwestern Energy Co.* | 156,860 | ||||||
| 8,242 | Spectra Energy Corp. | 284,019 | ||||||
| 1,656 | Tesoro Corp. | 86,642 | ||||||
| 8,424 | The Williams Companies, Inc. | 273,527 | ||||||
| 6,757 | Valero Energy Corp. | 234,941 | ||||||
| 2,604 | WPX Energy, Inc.* | 49,320 | ||||||
|
| |||||||
| 18,531,603 | ||||||||
|
| |||||||
| Food & Staples Retailing – 2.4% |
| ||||||
| 5,376 | Costco Wholesale Corp. | 594,424 | ||||||
| 15,086 | CVS Caremark Corp. | 862,618 | ||||||
| 2,923 | Safeway, Inc. | 69,158 | ||||||
| 7,315 | Sysco Corp. | 249,880 | ||||||
| 6,420 | The Kroger Co. | 221,747 | ||||||
| 10,642 | Walgreen Co. | 470,376 | ||||||
| 20,112 | Wal-Mart Stores, Inc. | 1,498,143 | ||||||
| 4,260 | Whole Foods Market, Inc. | 219,305 | ||||||
|
| |||||||
| 4,185,651 | ||||||||
|
| |||||||
| Food, Beverage & Tobacco – 5.7% |
| ||||||
| 24,624 | Altria Group, Inc. | 861,594 | ||||||
| 8,048 | Archer-Daniels-Midland Co. | 272,908 | ||||||
| 1,937 | Beam, Inc. | 122,244 | ||||||
| 1,832 | Brown-Forman Corp. Class B | 123,752 | ||||||
| 2,156 | Campbell Soup Co. | 96,567 | ||||||
| 3,243 | Coca-Cola Enterprises, Inc. | 114,024 | ||||||
| 5,157 | ConAgra Foods, Inc. | 180,134 | ||||||
| 1,800 | Constellation Brands, Inc. Class A* | 93,816 | ||||||
| 2,462 | Dr. Pepper Snapple Group, Inc. | 113,080 | ||||||
|
| |||||||
| 34 | The accompanying notes are an integral part of these financial statements. |
GOLDMAN SACHS VARIABLE INSURANCE TRUST EQUITY INDEX FUND
Shares | Description | Value | ||||||
| Common Stocks – (continued) | ||||||||
| Food, Beverage & Tobacco – (continued) |
| ||||||
| 7,960 | General Mills, Inc. | $ | 386,299 | |||||
| 1,716 | Hormel Foods Corp. | 66,203 | ||||||
| 3,064 | Kellogg Co. | 196,801 | ||||||
| 7,354 | Kraft Foods Group, Inc. | 410,868 | ||||||
| 4,726 | Lorillard, Inc. | 206,432 | ||||||
| 1,621 | McCormick & Co., Inc. | 114,053 | ||||||
| 2,505 | Mead Johnson Nutrition Co. | 198,471 | ||||||
| 1,923 | Molson Coors Brewing Co. Class B | 92,035 | ||||||
| 21,764 | Mondelez International, Inc. Class A | 620,927 | ||||||
| 1,743 | Monster Beverage Corp.* | 105,922 | ||||||
| 18,927 | PepsiCo, Inc. | 1,548,039 | ||||||
| 20,077 | Philip Morris International, Inc. | 1,739,070 | ||||||
| 4,001 | Reynolds American, Inc. | 193,528 | ||||||
| 47,037 | The Coca-Cola Co. | 1,886,654 | ||||||
| 1,828 | The Hershey Co. | 163,204 | ||||||
| 1,301 | The J.M. Smucker Co. | 134,198 | ||||||
| 3,436 | Tyson Foods, Inc. Class A | 88,236 | ||||||
|
| |||||||
| 10,129,059 | ||||||||
|
| |||||||
| Health Care Equipment & Services – 4.3% |
| ||||||
| 19,329 | Abbott Laboratories | 674,195 | ||||||
| 4,669 | Aetna, Inc. | 296,668 | ||||||
| 2,872 | AmerisourceBergen Corp. | 160,344 | ||||||
| 6,701 | Baxter International, Inc. | 464,178 | ||||||
| 2,368 | Becton, Dickinson and Co. | 234,029 | ||||||
| 16,598 | Boston Scientific Corp.* | 153,863 | ||||||
| 926 | C. R. Bard, Inc. | 100,638 | ||||||
| 4,168 | Cardinal Health, Inc. | 196,730 | ||||||
| 2,676 | CareFusion Corp.* | 98,611 | ||||||
| 1,802 | Cerner Corp.* | 173,154 | ||||||
| 3,543 | Cigna Corp. | 256,832 | ||||||
| 5,858 | Covidien PLC | 368,117 | ||||||
| 1,021 | DaVita HealthCare Partners, Inc.* | 123,337 | ||||||
| 1,805 | DENTSPLY International, Inc. | 73,933 | ||||||
| 1,394 | Edwards Lifesciences Corp.* | 93,677 | ||||||
| 10,016 | Express Scripts Holding Co.* | 617,887 | ||||||
| 1,927 | Humana, Inc. | 162,600 | ||||||
| 496 | Intuitive Surgical, Inc.* | 251,264 | ||||||
| 1,135 | Laboratory Corp. of America Holdings* | 113,613 | ||||||
| 2,782 | McKesson Corp. | 318,539 | ||||||
| 12,440 | Medtronic, Inc. | 640,287 | ||||||
| 1,081 | Patterson Companies, Inc. | 40,646 | ||||||
| 1,922 | Quest Diagnostics, Inc. | 116,531 | ||||||
| 3,553 | St. Jude Medical, Inc. | 162,123 | ||||||
| 3,584 | Stryker Corp. | 231,813 | ||||||
| 1,296 | Tenet Healthcare Corp.* | 59,746 | ||||||
| 12,521 | UnitedHealth Group, Inc. | 819,875 | ||||||
| 1,338 | Varian Medical Systems, Inc.* | 90,248 | ||||||
| 3,763 | WellPoint, Inc. | 307,964 | ||||||
| 2,117 | Zimmer Holdings, Inc. | 158,648 | ||||||
| �� |
|
| ||||||
| 7,560,090 | ||||||||
|
| |||||||
| Common Stocks – (continued) | ||||||||
| Household & Personal Products – 2.3% |
| ||||||
| 5,219 | Avon Products, Inc. | $ | 109,755 | |||||
| 10,760 | Colgate-Palmolive Co. | 616,440 | ||||||
| 4,736 | Kimberly-Clark Corp. | 460,055 | ||||||
| 1,622 | The Clorox Co. | 134,853 | ||||||
| 2,966 | The Estee Lauder Companies, Inc. Class A | 195,074 | ||||||
| 33,536 | The Procter & Gamble Co. | 2,581,937 | ||||||
|
| |||||||
| 4,098,114 | ||||||||
|
| |||||||
| Insurance – 4.4% |
| ||||||
| 4,158 | ACE Ltd. | 372,058 | ||||||
| 5,702 | Aflac, Inc. | 331,400 | ||||||
| 18,084 | American International Group, Inc.* | 808,355 | ||||||
| 3,814 | Aon PLC | 245,431 | ||||||
| 1,000 | Assurant, Inc. | 50,910 | ||||||
| 22,392 | Berkshire Hathaway, Inc. Class B* | 2,506,113 | ||||||
| 1,764 | Cincinnati Financial Corp. | 80,968 | ||||||
| 6,090 | Genworth Financial, Inc. Class A* | 69,487 | ||||||
| 5,361 | Hartford Financial Services Group, Inc. | 165,762 | ||||||
| 3,295 | Lincoln National Corp. | 120,169 | ||||||
| 3,772 | Loews Corp. | 167,477 | ||||||
| 6,783 | Marsh & McLennan Companies, Inc. | 270,777 | ||||||
| 13,493 | MetLife, Inc. | 617,440 | ||||||
| 3,357 | Principal Financial Group, Inc. | 125,720 | ||||||
| 5,715 | Prudential Financial, Inc. | 417,366 | ||||||
| 5,884 | The Allstate Corp. | 283,138 | ||||||
| 3,191 | The Chubb Corp. | 270,118 | ||||||
| 6,858 | The Progressive Corp. | 174,330 | ||||||
| 4,692 | The Travelers Companies, Inc. | 374,985 | ||||||
| 1,182 | Torchmark Corp. | 76,995 | ||||||
| 3,235 | Unum Group | 95,012 | ||||||
| 3,636 | XL Group PLC | 110,243 | ||||||
|
| |||||||
| 7,734,254 | ||||||||
|
| |||||||
| Materials – 3.2% |
| ||||||
| 2,540 | Air Products & Chemicals, Inc. | 232,588 | ||||||
| 834 | Airgas, Inc. | 79,614 | ||||||
| 13,050 | Alcoa, Inc. | 102,051 | ||||||
| 1,373 | Allegheny Technologies, Inc. | 36,124 | ||||||
| 1,895 | Ball Corp. | 78,718 | ||||||
| 1,300 | Bemis Co., Inc. | 50,882 | ||||||
| 723 | CF Industries Holdings, Inc. | 123,994 | ||||||
| 1,863 | Cliffs Natural Resources, Inc. | 30,274 | ||||||
| 11,299 | E.I. du Pont de Nemours & Co. | 593,197 | ||||||
| 1,862 | Eastman Chemical Co. | 130,359 | ||||||
| 3,295 | Ecolab, Inc. | 280,701 | ||||||
| 1,664 | FMC Corp. | 101,604 | ||||||
| 11,888 | Freeport-McMoRan Copper & Gold, Inc. | 328,228 | ||||||
| 1,007 | International Flavors & Fragrances, Inc. | 75,686 | ||||||
| 5,473 | International Paper Co. | 242,509 | ||||||
| 4,647 | LyondellBasell Industries NV Class A | 307,910 | ||||||
|
| |||||||
| The accompanying notes are an integral part of these financial statements. | 35 |
GOLDMAN SACHS VARIABLE INSURANCE TRUST EQUITY INDEX FUND
Schedule of Investments (continued)
June 30, 2013 (Unaudited)
Shares | Description | Value | ||||||
| Common Stocks – (continued) | ||||||||
| Materials – (continued) |
| ||||||
| 2,198 | MeadWestvaco Corp. | $ | 74,974 | |||||
| 6,560 | Monsanto Co. | 648,128 | ||||||
| 6,127 | Newmont Mining Corp. | 183,504 | ||||||
| 3,909 | Nucor Corp. | 169,338 | ||||||
| 1,932 | Owens-Illinois, Inc.* | 53,690 | ||||||
| 1,779 | PPG Industries, Inc. | 260,463 | ||||||
| 3,648 | Praxair, Inc. | 420,104 | ||||||
| 2,370 | Sealed Air Corp. | 56,761 | ||||||
| 1,511 | Sigma-Aldrich Corp. | 121,424 | ||||||
| 14,902 | The Dow Chemical Co. | 479,397 | ||||||
| 3,371 | The Mosaic Co. | 181,394 | ||||||
| 1,053 | The Sherwin-Williams Co. | 185,960 | ||||||
| 1,627 | United States Steel Corp. | 28,521 | ||||||
| 1,657 | Vulcan Materials Co. | 80,215 | ||||||
|
| |||||||
| 5,738,312 | ||||||||
|
| |||||||
| Media – 3.7% |
| ||||||
| 2,740 | Cablevision Systems Corp. Class A | 46,087 | ||||||
| 7,005 | CBS Corp. Class B | 342,334 | ||||||
| 32,516 | Comcast Corp. Class A | 1,361,770 | ||||||
| 6,857 | DIRECTV* | 422,528 | ||||||
| 3,063 | Discovery Communications, Inc. Class A* | 236,494 | ||||||
| 2,891 | Gannett Co., Inc. | 70,714 | ||||||
| 24,619 | News Corp. Class A | 802,579 | ||||||
| 3,183 | Omnicom Group, Inc. | 200,115 | ||||||
| 1,025 | Scripps Networks Interactive, Inc. Class A | 68,429 | ||||||
| 5,057 | The Interpublic Group of Companies, Inc. | 73,579 | ||||||
| 22,146 | The Walt Disney Co. | 1,398,520 | ||||||
| 50 | The Washington Post Co. Class B | 24,189 | ||||||
| 3,572 | Time Warner Cable, Inc. | 401,779 | ||||||
| 11,442 | Time Warner, Inc. | 661,577 | ||||||
| 5,477 | Viacom, Inc. Class B | 372,710 | ||||||
|
| |||||||
| 6,483,404 | ||||||||
|
| |||||||
| Pharmaceuticals, Biotechnology & Life Sciences – 8.3% |
| ||||||
| 19,451 | AbbVie, Inc. | 804,104 | ||||||
| 1,568 | Actavis, Inc.* | 197,913 | ||||||
| 4,296 | Agilent Technologies, Inc. | 183,697 | ||||||
| 2,389 | Alexion Pharmaceuticals, Inc.* | 220,361 | ||||||
| 3,639 | Allergan, Inc. | 306,549 | ||||||
| 9,211 | Amgen, Inc. | 908,757 | ||||||
| 2,905 | Biogen Idec, Inc.* | 625,156 | ||||||
| 20,204 | Bristol-Myers Squibb Co. | 902,917 | ||||||
| 5,169 | Celgene Corp.* | 604,308 | ||||||
| 12,216 | Eli Lilly & Co. | 600,050 | ||||||
| 2,922 | Forest Laboratories, Inc.* | 119,802 | ||||||
| 18,657 | Gilead Sciences, Inc.* | 955,425 | ||||||
| 1,973 | Hospira, Inc.* | 75,586 | ||||||
| 34,322 | Johnson & Johnson | 2,946,887 | ||||||
| 2,096 | Life Technologies Corp.* | 155,125 | ||||||
| 37,087 | Merck & Co., Inc. | 1,722,691 | ||||||
|
| |||||||
| Common Stocks – (continued) | ||||||||
| Pharmaceuticals, Biotechnology & Life Sciences – (continued) |
| ||||||
| 4,678 | Mylan, Inc.* | $ | 145,158 | |||||
| 1,321 | PerkinElmer, Inc. | 42,933 | ||||||
| 1,068 | Perrigo Co. | 129,228 | ||||||
| 81,919 | Pfizer, Inc. | 2,294,551 | ||||||
| 945 | Regeneron Pharmaceuticals, Inc.* | 212,512 | ||||||
| 4,402 | Thermo Fisher Scientific, Inc. | 372,541 | ||||||
| 1,055 | Waters Corp.* | 105,553 | ||||||
| 5,203 | Zoetis, Inc. | 160,721 | ||||||
|
| |||||||
| 14,792,525 | ||||||||
|
| |||||||
| Real Estate – 2.1% |
| ||||||
| 4,865 | American Tower Corp. (REIT) | 355,972 | ||||||
| 1,780 | Apartment Investment & Management Co. Class A (REIT) | 53,471 | ||||||
| 1,416 | AvalonBay Communities, Inc. (REIT) | 191,033 | ||||||
| 1,871 | Boston Properties, Inc. (REIT) | 197,334 | ||||||
| 3,639 | CBRE Group, Inc. Class A* | 85,007 | ||||||
| 3,926 | Equity Residential (REIT) | 227,944 | ||||||
| 5,617 | HCP, Inc. (REIT) | 255,236 | ||||||
| 3,294 | Health Care REIT, Inc. (REIT) | 220,797 | ||||||
| 8,840 | Host Hotels & Resorts, Inc. (REIT) | 149,131 | ||||||
| 5,016 | Kimco Realty Corp. (REIT) | 107,493 | ||||||
| 1,947 | Plum Creek Timber Co., Inc. (REIT) | 90,866 | ||||||
| 5,903 | Prologis, Inc. (REIT) | 222,661 | ||||||
| 1,756 | Public Storage (REIT) | 269,247 | ||||||
| 3,816 | Simon Property Group, Inc. (REIT) | 602,623 | ||||||
| 1,700 | The Macerich Co. (REIT) | 103,649 | ||||||
| 3,584 | Ventas, Inc. (REIT) | 248,945 | ||||||
| 2,076 | Vornado Realty Trust (REIT) | 171,997 | ||||||
| 6,714 | Weyerhaeuser Co. (REIT) | 191,282 | ||||||
|
| |||||||
| 3,744,688 | ||||||||
|
| |||||||
| Retailing – 4.4% |
| ||||||
| 1,040 | Abercrombie & Fitch Co. Class A | 47,060 | ||||||
| 4,482 | Amazon.com, Inc.* | 1,244,607 | ||||||
| 499 | AutoNation, Inc.* | 21,652 | ||||||
| 449 | AutoZone, Inc.* | 190,237 | ||||||
| 2,683 | Bed Bath & Beyond, Inc.* | 190,225 | ||||||
| 3,266 | Best Buy Co., Inc. | 89,260 | ||||||
| 2,859 | CarMax, Inc.* | 131,971 | ||||||
| 3,719 | Dollar General Corp.* | 187,549 | ||||||
| 2,750 | Dollar Tree, Inc.* | 139,810 | ||||||
| 1,183 | Expedia, Inc. | 71,158 | ||||||
| 1,184 | Family Dollar Stores, Inc. | 73,775 | ||||||
| 1,537 | GameStop Corp. Class A | 64,600 | ||||||
| 1,919 | Genuine Parts Co. | 149,816 | ||||||
| 1,710 | J.C. Penney Co., Inc.* | 29,207 | ||||||
| 2,649 | Kohl’s Corp. | 133,801 | ||||||
| 2,939 | L Brands, Inc. | 144,746 | ||||||
| 13,165 | Lowe’s Companies, Inc. | 538,449 | ||||||
| 4,710 | Macy’s, Inc. | 226,080 | ||||||
| 679 | Netflix, Inc.* | 143,330 | ||||||
| 1,829 | Nordstrom, Inc. | 109,630 | ||||||
| 1,389 | O’Reilly Automotive, Inc.* | 156,429 | ||||||
|
| |||||||
| 36 | The accompanying notes are an integral part of these financial statements. |
GOLDMAN SACHS VARIABLE INSURANCE TRUST EQUITY INDEX FUND
Shares | Description | Value | ||||||
| Common Stocks – (continued) | ||||||||
| Retailing – (continued) |
| ||||||
| 1,301 | PetSmart, Inc. | $ | 87,154 | |||||
| 624 | Priceline.com, Inc.* | 516,129 | ||||||
| 2,747 | Ross Stores, Inc. | 178,033 | ||||||
| 8,172 | Staples, Inc. | 129,608 | ||||||
| 7,877 | Target Corp. | 542,410 | ||||||
| 3,604 | The Gap, Inc. | 150,395 | ||||||
| 17,932 | The Home Depot, Inc. | 1,389,192 | ||||||
| 1,466 | Tiffany & Co. | 106,783 | ||||||
| 8,955 | TJX Companies, Inc. | 448,287 | ||||||
| 1,400 | TripAdvisor, Inc.* | 85,218 | ||||||
| 1,400 | Urban Outfitters, Inc.* | 56,308 | ||||||
|
| |||||||
| 7,772,909 | ||||||||
|
| |||||||
| Semiconductors & Semiconductor Equipment – 2.0% |
| ||||||
| 8,100 | Advanced Micro Devices, Inc.* | 33,048 | ||||||
| 3,863 | Altera Corp. | 127,440 | ||||||
| 3,718 | Analog Devices, Inc. | 167,533 | ||||||
| 14,634 | Applied Materials, Inc. | 218,193 | ||||||
| 6,529 | Broadcom Corp. Class A | 220,419 | ||||||
| 780 | First Solar, Inc.* | 34,890 | ||||||
| 60,677 | Intel Corp. | 1,469,597 | ||||||
| 2,046 | KLA-Tencor Corp. | 114,024 | ||||||
| 1,947 | Lam Research Corp.* | 86,330 | ||||||
| 2,798 | Linear Technology Corp. | 103,078 | ||||||
| 6,413 | LSI Corp.* | 45,789 | ||||||
| 2,471 | Microchip Technology, Inc. | 92,045 | ||||||
| 12,427 | Micron Technology, Inc.* | 178,079 | ||||||
| 6,964 | NVIDIA Corp. | 97,705 | ||||||
| 2,300 | Teradyne, Inc.* | 40,411 | ||||||
| 13,597 | Texas Instruments, Inc. | 474,127 | ||||||
| 3,161 | Xilinx, Inc. | 125,207 | ||||||
|
| |||||||
| 3,627,915 | ||||||||
|
| |||||||
| Software & Services – 9.4% |
| ||||||
| 7,920 | Accenture PLC Class A | 569,923 | ||||||
| 6,215 | Adobe Systems, Inc.* | 283,155 | ||||||
| 2,136 | Akamai Technologies, Inc.* | 90,887 | ||||||
| 2,828 | Autodesk, Inc.* | 95,982 | ||||||
| 6,009 | Automatic Data Processing, Inc. | 413,780 | ||||||
| 1,632 | BMC Software, Inc.* | 73,668 | ||||||
| 4,083 | CA, Inc. | 116,896 | ||||||
| 2,287 | Citrix Systems, Inc.* | 137,975 | ||||||
| 3,741 | Cognizant Technology Solutions Corp. Class A* | 234,224 | ||||||
| 1,861 | Computer Sciences Corp. | 81,456 | ||||||
| 14,362 | eBay, Inc.* | 742,803 | ||||||
| 3,626 | Electronic Arts, Inc.* | 83,289 | ||||||
| 3,559 | Fidelity National Information Services, Inc. | 152,468 | ||||||
| 1,621 | Fiserv, Inc.* | 141,692 | ||||||
| 3,279 | Google, Inc. Class A* | 2,886,733 | ||||||
| 12,795 | International Business Machines Corp. | 2,445,252 | ||||||
| 3,463 | Intuit, Inc. | 211,347 | ||||||
|
| |||||||
| Common Stocks – (continued) | ||||||||
| Software & Services – (continued) |
| ||||||
| 1,293 | Mastercard, Inc. Class A | $ | 742,829 | |||||
| 92,265 | Microsoft Corp. | 3,185,910 | ||||||
| 45,304 | Oracle Corp. | 1,391,739 | ||||||
| 3,998 | Paychex, Inc. | 146,007 | ||||||
| 2,359 | Red Hat, Inc.* | 112,807 | ||||||
| 3,392 | SAIC, Inc. | 47,251 | ||||||
| 6,632 | Salesforce.com, Inc.* | 253,210 | ||||||
| 8,584 | Symantec Corp. | 192,882 | ||||||
| 2,043 | Teradata Corp.* | 102,620 | ||||||
| 6,926 | The Western Union Co. | 118,504 | ||||||
| 1,891 | Total System Services, Inc. | 46,292 | ||||||
| 1,946 | VeriSign, Inc.* | 86,908 | ||||||
| 6,221 | Visa, Inc. Class A | 1,136,888 | ||||||
| 11,861 | Yahoo!, Inc.* | 297,830 | ||||||
|
| |||||||
| 16,623,207 | ||||||||
|
| |||||||
| Technology Hardware & Equipment – 6.2% |
| ||||||
| 1,945 | Amphenol Corp. Class A | 151,593 | ||||||
| 11,534 | Apple, Inc. | 4,568,387 | ||||||
| 65,419 | Cisco Systems, Inc. | 1,590,336 | ||||||
| 17,997 | Corning, Inc. | 256,097 | ||||||
| 18,172 | Dell, Inc. | 242,596 | ||||||
| 25,973 | EMC Corp. | 613,482 | ||||||
| 947 | F5 Networks, Inc.* | 65,154 | ||||||
| 1,832 | FLIR Systems, Inc. | 49,409 | ||||||
| 1,340 | Harris Corp. | 65,995 | ||||||
| 23,675 | Hewlett-Packard Co. | 587,140 | ||||||
| 2,394 | Jabil Circuit, Inc. | 48,790 | ||||||
| 2,854 | JDS Uniphase Corp.* | 41,041 | ||||||
| 6,459 | Juniper Networks, Inc.* | 124,723 | ||||||
| 1,725 | Molex, Inc. | 50,611 | ||||||
| 3,360 | Motorola Solutions, Inc. | 193,973 | ||||||
| 4,411 | NetApp, Inc.* | 166,648 | ||||||
| 21,166 | QUALCOMM, Inc. | 1,292,819 | ||||||
| 3,005 | SanDisk Corp.* | 183,606 | ||||||
| 3,983 | Seagate Technology PLC | 178,558 | ||||||
| 5,206 | TE Connectivity Ltd. | 237,081 | ||||||
| 2,654 | Western Digital Corp. | 164,787 | ||||||
| 15,146 | Xerox Corp. | 137,374 | ||||||
|
| |||||||
| 11,010,200 | ||||||||
|
| |||||||
| Telecommunication Services – 2.8% |
| ||||||
| 66,044 | AT&T, Inc. | 2,337,957 | ||||||
| 7,477 | CenturyLink, Inc. | 264,312 | ||||||
| 3,640 | Crown Castle International Corp.* | 263,500 | ||||||
| 12,349 | Frontier Communications Corp. | 50,013 | ||||||
| 37,253 | Sprint Nextel Corp.* | 261,516 | ||||||
| 35,074 | Verizon Communications, Inc. | 1,765,625 | ||||||
| 6,949 | Windstream Corp. | 53,577 | ||||||
|
| |||||||
| 4,996,500 | ||||||||
|
| |||||||
| Transportation – 1.7% |
| ||||||
| 1,985 | C.H. Robinson Worldwide, Inc. | 111,775 | ||||||
| 12,500 | CSX Corp. | 289,875 | ||||||
|
| |||||||
| The accompanying notes are an integral part of these financial statements. | 37 |
GOLDMAN SACHS VARIABLE INSURANCE TRUST EQUITY INDEX FUND
Schedule of Investments (continued)
June 30, 2013 (Unaudited)
` Shares | Description | Value | ||||||
| Common Stocks – (continued) | ||||||||
| Transportation – (continued) |
| ||||||
| 2,479 | Expeditors International of Washington, Inc. | $ | 94,227 | |||||
| 3,582 | FedEx Corp. | 353,114 | ||||||
| 1,341 | Kansas City Southern | 142,092 | ||||||
| 3,907 | Norfolk Southern Corp. | 283,843 | ||||||
| 600 | Ryder System, Inc. | 36,474 | ||||||
| 8,899 | Southwest Airlines Co. | 114,708 | ||||||
| 5,776 | Union Pacific Corp. | 891,121 | ||||||
| 8,722 | United Parcel Service, Inc. Class B | 754,279 | ||||||
|
| |||||||
| 3,071,508 | ||||||||
|
| |||||||
| Utilities – 3.3% |
| ||||||
| 7,565 | AES Corp. | 90,704 | ||||||
| 1,500 | AGL Resources, Inc. | 64,290 | ||||||
| 3,035 | Ameren Corp. | 104,525 | ||||||
| 5,936 | American Electric Power Co., Inc. | 265,814 | ||||||
| 5,252 | CenterPoint Energy, Inc. | 123,369 | ||||||
| 3,170 | CMS Energy Corp. | 86,129 | ||||||
| 3,618 | Consolidated Edison, Inc. | 210,966 | ||||||
| 7,035 | Dominion Resources, Inc. | 399,729 | ||||||
| 2,139 | DTE Energy Co. | 143,334 | ||||||
| 8,620 | Duke Energy Corp. | 581,850 | ||||||
| 3,982 | Edison International | 191,773 | ||||||
| 2,164 | Entergy Corp. | 150,788 | ||||||
| 10,521 | Exelon Corp. | 324,888 | ||||||
| 5,218 | FirstEnergy Corp. | 194,840 | ||||||
| 921 | Integrys Energy Group, Inc. | 53,906 | ||||||
| 5,220 | NextEra Energy, Inc. | 425,326 | ||||||
| 3,700 | NiSource, Inc. | 105,968 | ||||||
| 3,870 | Northeast Utilities | 162,617 | ||||||
| 3,885 | NRG Energy, Inc. | 103,730 | ||||||
| 2,532 | ONEOK, Inc. | 104,597 | ||||||
| 2,832 | Pepco Holdings, Inc. | 57,093 | ||||||
| 5,358 | PG&E Corp. | 245,021 | ||||||
| 1,395 | Pinnacle West Capital Corp. | 77,381 | ||||||
| 7,225 | PPL Corp. | 218,629 | ||||||
| 6,231 | Public Service Enterprise Group, Inc. | 203,504 | ||||||
| 1,546 | SCANA Corp. | 75,909 | ||||||
| 2,803 | Sempra Energy | 229,173 | ||||||
| 2,535 | TECO Energy, Inc. | 43,577 | ||||||
|
| |||||||
| Common Stocks – (continued) | ||||||||
| Utilities – (continued) |
| ||||||
| 10,691 | The Southern Co. | $ | 471,794 | |||||
| 2,828 | Wisconsin Energy Corp. | 115,920 | ||||||
| 5,948 | Xcel Energy, Inc. | 168,566 | ||||||
|
| |||||||
| 5,795,710 | ||||||||
|
| |||||||
| TOTAL COMMON STOCKS | ||||||||
| (Cost $115,039,799) | $ | 175,729,747 | ||||||
|
| |||||||
| Principal Amount | Interest Rate | Maturity Date | Value | |||||||||
| U.S. Treasury Obligations(b)(c) – 0.1% | ||||||||||||
| United States Treasury Bills |
| ||||||||||
| $100,000 | 0.000% | 08/08/13 | $ | 99,998 | ||||||||
| 40,000 | 0.000 | 09/12/13 | 39,999 | |||||||||
|
| |||||||||||
| TOTAL U.S. TREASURY OBLIGATIONS | ||||||||||||
| (Cost $139,993) | $ | 139,997 | ||||||||||
|
| |||||||||||
| TOTAL INVESTMENTS – 99.3% | ||||||||||||
| (Cost $115,179,792) | $ | 175,869,744 | ||||||||||
|
| |||||||||||
| OTHER ASSETS IN EXCESS OF | | 1,296,068 | |||||||||
|
| |||||||||||
| NET ASSETS – 100.0% | $ | 177,165,812 | ||||||||||
|
| |||||||||||
| The percentage shown for each investment category reflects the value of investments in that category as a percentage of net assets. | ||
| * | Non-income producing security. | |
| (a) | Represents an affiliated issuer. | |
| (b) | Issued with a zero coupon. Income is recognized through the accretion of discount. | |
| (c) | All or a portion of security is segregated as collateral for initial margin requirements on futures transactions. | |
| Investment Abbreviation: | ||||
| REIT | — | Real Estate Investment Trust | ||
ADDITIONAL INVESTMENT INFORMATION
FUTURES CONTRACTS — At June 30, 2013, the Fund had the following futures contracts:
| Type | Number of Contracts Long (Short) | Expiration Date | Current Value | Unrealized Gain (Loss) | ||||||||||
| S&P 500 E-mini Index | 15 | September 2013 | $ | 1,199,475 | $ | (21,271 | ) | |||||||
| 38 | The accompanying notes are an integral part of these financial statements. |
GOLDMAN SACHS VARIABLE INSURANCE TRUST GROWTH OPPORTUNITIES FUND
Schedule of Investments
June 30, 2013 (Unaudited)
| Shares | Description | Value | ||||||
| Common Stocks – 99.6% | ||||||||
| Banks – 1.7% |
| ||||||
| 80,338 | First Republic Bank | $ | 3,091,406 | |||||
|
| |||||||
| Capital Goods – 10.3% |
| ||||||
| 49,006 | Graco, Inc. | 3,097,669 | ||||||
| 26,048 | Hubbell, Inc. Class B | 2,578,752 | ||||||
| 68,831 | Kennametal, Inc. | 2,672,708 | ||||||
| 60,940 | Quanta Services, Inc.* | 1,612,472 | ||||||
| 19,736 | Rockwell Automation, Inc. | 1,640,851 | ||||||
| 16,741 | Roper Industries, Inc. | 2,079,567 | ||||||
| 91,510 | Sensata Technologies Holding NV* | 3,193,699 | ||||||
| 7,311 | W.W. Grainger, Inc. | 1,843,688 | ||||||
|
| |||||||
| 18,719,406 | ||||||||
|
| |||||||
| Commercial & Professional Services – 1.3% |
| ||||||
| 25,102 | Healthcare Services Group, Inc. | 615,501 | ||||||
| 90,130 | Ritchie Bros Auctioneers, Inc. | 1,732,299 | ||||||
|
| |||||||
| 2,347,800 | ||||||||
|
| |||||||
| Consumer Durables & Apparel – 5.5% |
| ||||||
| 47,659 | Deckers Outdoor Corp.* | 2,407,256 | ||||||
| 89,159 | Fifth & Pacific Companies, Inc.* | 1,991,812 | ||||||
| 20,044 | Lululemon Athletica, Inc.* | 1,313,283 | ||||||
| 34,983 | PVH Corp. | 4,374,624 | ||||||
|
| |||||||
| 10,086,975 | ||||||||
|
| |||||||
| Consumer Services – 4.2% |
| ||||||
| 5,175 | Chipotle Mexican Grill, Inc.* | 1,885,511 | ||||||
| 39,694 | Coinstar, Inc.* | 2,328,847 | ||||||
| 34,796 | Dunkin’ Brands Group, Inc. | 1,489,965 | ||||||
| 49,586 | Marriott International, Inc. Class A | 2,001,787 | ||||||
|
| |||||||
| 7,706,110 | ||||||||
|
| |||||||
| Diversified Financials – 9.9% |
| ||||||
| 25,432 | IntercontinentalExchange, Inc.* | 4,520,792 | ||||||
| 70,042 | Lazard Ltd. Class A | 2,251,850 | ||||||
| 118,674 | MSCI, Inc.* | 3,948,284 | ||||||
| 44,773 | Northern Trust Corp. | 2,592,357 | ||||||
| 101,251 | SLM Corp. | 2,314,598 | ||||||
| 32,285 | T. Rowe Price Group, Inc. | 2,361,648 | ||||||
|
| |||||||
| 17,989,529 | ||||||||
|
| |||||||
| Energy – 5.5% |
| ||||||
| 49,071 | Cameron International Corp.* | 3,001,182 | ||||||
| 10,423 | Core Laboratories NV | 1,580,752 | ||||||
| 18,413 | Dril-Quip, Inc.* | 1,662,510 | ||||||
| 16,408 | Pioneer Natural Resources Co. | 2,375,058 | ||||||
| 29,457 | Whiting Petroleum Corp.* | 1,357,673 | ||||||
|
| |||||||
| 9,977,175 | ||||||||
|
| |||||||
| Food, Beverage & Tobacco – 3.7% |
| ||||||
| 34,507 | Beam, Inc. | 2,177,737 | ||||||
| 16,039 | Monster Beverage Corp.* | 974,690 | ||||||
| 34,640 | The Hain Celestial Group, Inc.* | 2,250,561 | ||||||
| 20,551 | TreeHouse Foods, Inc.* | 1,346,912 | ||||||
|
| |||||||
| 6,749,900 | ||||||||
|
| |||||||
| Common Stocks – (continued) | ||||||||
| Health Care Equipment & Services – 6.4% |
| ||||||
| 34,619 | C. R. Bard, Inc. | $ | 3,762,393 | |||||
| 63,993 | CareFusion Corp.* | 2,358,142 | ||||||
| 25,322 | Henry Schein, Inc.* | 2,424,581 | ||||||
| 66,679 | HMS Holdings Corp.* | 1,553,621 | ||||||
| 10,196 | MEDNAX, Inc.* | 933,750 | ||||||
| 8,313 | Teleflex, Inc. | 644,174 | ||||||
|
| |||||||
| 11,676,661 | ||||||||
|
| |||||||
| Household & Personal Products – 2.2% |
| ||||||
| 40,345 | Church & Dwight Co., Inc. | 2,489,690 | ||||||
| 24,279 | The Estee Lauder Companies, Inc. Class A | 1,596,830 | ||||||
|
| |||||||
| 4,086,520 | ||||||||
|
| |||||||
| Materials – 4.6% |
| ||||||
| 31,981 | Airgas, Inc. | 3,052,906 | ||||||
| 34,225 | Ecolab, Inc. | 2,915,628 | ||||||
| 33,521 | International Flavors & Fragrances, Inc. | 2,519,438 | ||||||
|
| |||||||
| 8,487,972 | ||||||||
|
| |||||||
| Media – 2.3% |
| ||||||
| 25,195 | Discovery Communications, Inc. Class A* | 1,945,306 | ||||||
| 33,705 | Scripps Networks Interactive, Inc. Class A | 2,250,146 | ||||||
|
| |||||||
| 4,195,452 | ||||||||
|
| |||||||
| Pharmaceuticals, Biotechnology & Life Sciences – 10.1% |
| ||||||
| 104,662 | Agilent Technologies, Inc. | 4,475,347 | ||||||
| 10,283 | Alexion Pharmaceuticals, Inc.* | 948,504 | ||||||
| 34,661 | Ariad Pharmaceuticals, Inc.* | 606,221 | ||||||
| 25,377 | BioMarin Pharmaceutical, Inc.* | 1,415,783 | ||||||
| 58,969 | Cepheid, Inc.* | 2,029,713 | ||||||
| 25,061 | Medivation, Inc.* | 1,233,001 | ||||||
| 6,230 | Mettler-Toledo International, Inc.* | 1,253,476 | ||||||
| 8,951 | Pharmacyclics, Inc.* | 711,336 | ||||||
| 5,742 | Regeneron Pharmaceuticals, Inc.* | 1,291,261 | ||||||
| 19,947 | Shire PLC ADR | 1,897,159 | ||||||
| 32,242 | Vertex Pharmaceuticals, Inc.* | 2,575,169 | ||||||
|
| |||||||
| 18,436,970 | ||||||||
|
| |||||||
| Real Estate – 2.7% |
| ||||||
| 208,432 | CBRE Group, Inc. Class A* | 4,868,972 | ||||||
|
| |||||||
| Retailing – 7.9% |
| ||||||
| 33,184 | Dick’s Sporting Goods, Inc. | 1,661,191 | ||||||
| 75,219 | Dollar General Corp.* | 3,793,294 | ||||||
| 65,272 | L Brands, Inc. | 3,214,646 | ||||||
| 49,601 | PetSmart, Inc. | 3,322,771 | ||||||
| 21,254 | Tiffany & Co. | 1,548,141 | ||||||
| 9,465 | Ulta Salon, Cosmetics & Fragrance, Inc.* | 948,015 | ||||||
|
| |||||||
| 14,488,058 | ||||||||
|
| |||||||
| Semiconductors & Semiconductor Equipment – 4.6% |
| ||||||
| 77,779 | Altera Corp. | 2,565,929 | ||||||
| 43,341 | Linear Technology Corp. | 1,596,682 | ||||||
| 104,660 | Xilinx, Inc. | 4,145,583 | ||||||
|
| |||||||
| 8,308,194 | ||||||||
|
| |||||||
| The accompanying notes are an integral part of these financial statements. | 39 |
GOLDMAN SACHS VARIABLE INSURANCE TRUST GROWTH OPPORTUNITIES FUND
Schedule of Investments (continued)
June 30, 2013 (Unaudited)
| Shares | Description | Value | ||||||
| Common Stocks – (continued) | ||||||||
| Software & Services – 9.4% |
| ||||||
| 20,776 | Cognizant Technology Solutions Corp. Class A* | $ | 1,300,785 | |||||
| 26,822 | Equinix, Inc.* | 4,954,560 | ||||||
| 19,201 | FleetCor Technologies, Inc.* | 1,561,041 | ||||||
| 77,976 | Genpact Ltd. | 1,500,258 | ||||||
| 50,121 | MICROS Systems, Inc.* | 2,162,721 | ||||||
| 86,769 | Pandora Media, Inc.* | 1,596,550 | ||||||
| 57,367 | Rackspace Hosting, Inc.* | 2,173,636 | ||||||
| 51,430 | Salesforce.com, Inc.* | 1,963,597 | ||||||
|
| |||||||
| 17,213,148 | ||||||||
|
| |||||||
| Technology Hardware & Equipment – 2.6% |
| ||||||
| 50,613 | Amphenol Corp. Class A | 3,944,777 | ||||||
| 46,211 | Juniper Networks, Inc.* | 892,335 | ||||||
|
| |||||||
| 4,837,112 | ||||||||
|
| |||||||
| Telecommunication Services – 4.7% |
| ||||||
| 82,533 | SBA Communications Corp. Class A* | 6,117,346 | ||||||
| 89,905 | tw telecom, inc.* | 2,529,927 | ||||||
|
| |||||||
| 8,647,273 | ||||||||
|
| |||||||
| TOTAL INVESTMENTS – 99.6% | ||||||||
| (Cost $142,840,246) | $ | 181,914,633 | ||||||
|
| |||||||
| OTHER ASSETS IN EXCESS OF | 686,981 | ||||||
|
| |||||||
| NET ASSETS – 100.0% | $ | 182,601,614 | ||||||
|
| |||||||
| The percentage shown for each investment category reflects the value of investments in that category as a percentage of net assets. | ||
| * | Non-income producing security. | |
| Investment Abbreviation: | ||
| ADR | —American Depositary Receipt | |
| 40 | The accompanying notes are an integral part of these financial statements. |
GOLDMAN SACHS VARIABLE INSURANCE TRUST HIGH QUALITY FLOATING RATE FUND
Schedule of Investments
June 30, 2013 (Unaudited)
Principal Amount | Interest Rate | Maturity Date | Value | |||||||||||
| Mortgage-Backed Obligations – 73.2% | ||||||||||||||
| Collateralized Mortgage Obligations – 58.4% |
| ||||||||||||
| Agency Multi-Family – 3.2% |
| ||||||||||||
| FNMA |
| ||||||||||||
| $ | 191,258 | 2.800 | % | 03/01/18 | $ | 200,010 | ||||||||
| 485,801 | 3.864 | 05/01/18 | 524,921 | |||||||||||
| 110,000 | 3.968 | 05/01/18 | 119,727 | |||||||||||
| 400,000 | 4.656 | 06/01/19 | 438,481 | |||||||||||
| 96,471 | 3.530 | 10/01/20 | 101,502 | |||||||||||
| 96,577 | 3.753 | 12/01/20 | 102,201 | |||||||||||
| 387,902 | 3.888 | 12/01/20 | 415,299 | |||||||||||
| 198,139 | 4.520 | 06/01/21 | 218,153 | |||||||||||
| GNMA |
| ||||||||||||
| 81,664 | 3.950 | 07/15/25 | 85,793 | |||||||||||
|
| |||||||||||||
| 2,206,087 | ||||||||||||||
|
| |||||||||||||
| Regular Floater(a) – 51.8% |
| ||||||||||||
| Aire Valley Mortgages PLC Series 2006-1A, Class 1A(b) |
| ||||||||||||
| 2,140,431 | 0.490 | 09/20/66 | 1,947,090 | |||||||||||
| FHLMC REMIC Series 3208, Class FG |
| ||||||||||||
| 2,743,061 | 0.592 | 08/15/36 | 2,750,930 | |||||||||||
| FHLMC REMIC Series 3307, Class FT |
| ||||||||||||
| 3,862,511 | 0.433 | 07/15/34 | 3,861,657 | |||||||||||
| FHLMC REMIC Series 3311, Class KF |
| ||||||||||||
| 5,462,332 | 0.533 | 05/15/37 | 5,446,888 | |||||||||||
| FHLMC REMIC Series 3371, Class FA |
| ||||||||||||
| 1,812,431 | 0.793 | 09/15/37 | 1,821,345 | |||||||||||
| FHLMC REMIC Series 4174, Class FB |
| ||||||||||||
| 1,976,960 | 0.493 | 05/15/39 | 1,976,239 | |||||||||||
| FNMA REMIC Series 2006-96, Class FA |
| ||||||||||||
| 1,931,493 | 0.493 | 10/25/36 | 1,933,903 | |||||||||||
| FNMA REMIC Series 2007-85, Class FC |
| ||||||||||||
| 1,524,056 | 0.733 | 09/25/37 | 1,536,482 | |||||||||||
| FNMA REMIC Series 2008-8, Class FB |
| ||||||||||||
| 3,250,034 | 1.013 | 02/25/38 | 3,271,684 | |||||||||||
| FNMA REMIC Series 2011-110, Class FE |
| ||||||||||||
| 987,888 | 0.593 | 04/25/41 | 991,111 | |||||||||||
| FNMA REMIC Series 2012-35, Class QF |
| ||||||||||||
| 3,356,063 | 0.593 | 04/25/42 | 3,361,949 | |||||||||||
| GNMA Series 2005-48, Class AF |
| ||||||||||||
| 1,903,842 | 0.392 | 06/20/35 | 1,885,207 | |||||||||||
| Granite Master Issuer PLC Series 2007-1, Class 2A1 |
| ||||||||||||
| 1,789,908 | 0.332 | 12/20/54 | 1,735,503 | |||||||||||
| National Credit Union Administration Guaranteed Notes Trust | | ||||||||||||
| 3,577,029 | 0.643 | 01/08/20 | 3,591,281 | |||||||||||
|
| |||||||||||||
| 36,111,269 | ||||||||||||||
|
| |||||||||||||
| Sequential Fixed Rate – 3.4% |
| ||||||||||||
| FNMA REMIC Series 2006-82, Class F |
| ||||||||||||
| 2,378,069 | 0.763 | 09/25/36 | 2,392,855 | |||||||||||
|
| |||||||||||||
| | TOTAL COLLATERALIZED MORTGAGE OBLIGATIONS | | $ | 40,710,211 | ||||||||||
|
| |||||||||||||
| Mortgage-Backed Obligations – (continued) | ||||||||||||||
| Commercial Mortgage-Backed Security – 0.3% |
| ||||||||||||
| Sequential Fixed Rate – 0.3% |
| ||||||||||||
| Banc of America Commercial Mortgage Trust Series 2006-3, | | ||||||||||||
| $ | 200,000 | 5.889 | % | 07/10/44 | $ | 220,813 | ||||||||
|
| |||||||||||||
| Federal Agencies – 14.5% |
| ||||||||||||
| Adjustable Rate FHLMC(a) – 5.0% |
| ||||||||||||
| $ | 321,098 | 2.407 | % | 09/01/35 | $ | 337,345 | ||||||||
| 779,444 | 2.610 | 12/01/36 | 834,065 | |||||||||||
| 1,255,421 | 3.051 | 04/01/37 | 1,354,637 | |||||||||||
| 891,940 | 2.758 | 01/01/38 | 951,623 | |||||||||||
|
| |||||||||||||
| 3,477,670 | ||||||||||||||
|
| |||||||||||||
| Adjustable Rate FNMA(a) – 4.8% |
| ||||||||||||
| 144,411 | 2.098 | 05/01/33 | 150,979 | |||||||||||
| 317,044 | 2.333 | 05/01/35 | 335,511 | |||||||||||
| 1,328,329 | 4.671 | 06/01/35 | 1,414,548 | |||||||||||
| 1,193,730 | 2.616 | 11/01/35 | 1,269,350 | |||||||||||
| 193,857 | 2.704 | 12/01/35 | 203,810 | |||||||||||
|
| |||||||||||||
| 3,374,198 | ||||||||||||||
|
| |||||||||||||
| Adjustable Rate GNMA(a) – 1.0% |
| ||||||||||||
| 632,121 | 1.750 | 04/20/33 | 659,402 | |||||||||||
|
| |||||||||||||
| FNMA – 3.7% |
| ||||||||||||
| 500,000 | 4.000 | 04/01/25 | 523,320 | |||||||||||
| 2,000,000 | 3.500 | TBA-30yr(c) | 2,031,250 | |||||||||||
|
| |||||||||||||
| 2,554,570 | ||||||||||||||
|
| |||||||||||||
| TOTAL FEDERAL AGENCIES |
| $ | 10,065,840 | ||||||||||
|
| |||||||||||||
| TOTAL MORTGAGE-BACKED OBLIGATIONS | ||||||||||||||
| (Cost $51,005,614) | $ | 50,996,864 | ||||||||||||
|
| |||||||||||||
| Asset-Backed Securities – 25.7% | ||||||||||||||
| Auto(a) – 1.8% |
| ||||||||||||
| Ally Master Owner Trust Series 2013-1, Class A1 |
| ||||||||||||
| $ | 1,250,000 | 0.642 | % | 02/15/18 | $ | 1,245,064 | ||||||||
|
| |||||||||||||
| Collateralized Loan Obligations(a) – 9.6% |
| ||||||||||||
| Brentwood CLO Corp. Series 2006-1A, Class A1A(b) |
| ||||||||||||
| 1,263,398 | 0.544 | 02/01/22 | 1,219,371 | |||||||||||
| Brentwood CLO Corp. Series 2006-1A, Class A1B(b) |
| ||||||||||||
| 496,335 | 0.544 | 02/01/22 | 479,039 | |||||||||||
| KKR Financial CLO Corp. Series 2007-1A, Class A(b) |
| ||||||||||||
| 1,388,124 | 0.625 | 05/15/21 | 1,348,208 | |||||||||||
| Ocean Trails CLO I Series 2006-1X, Class A1 |
| ||||||||||||
| 992,251 | 0.527 | 10/12/20 | 963,572 | |||||||||||
| Westbrook CLO Ltd. Series 2006-1X, Class A1 |
| ||||||||||||
| 750,000 | 0.512 | 12/20/20 | 723,263 | |||||||||||
| Westchester CLO Ltd. Series 2007-1X, Class A1A |
| ||||||||||||
| 2,035,279 | 0.499 | 08/01/22 | 1,967,356 | |||||||||||
|
| |||||||||||||
| 6,700,809 | ||||||||||||||
|
| |||||||||||||
| The accompanying notes are an integral part of these financial statements. | 41 |
GOLDMAN SACHS VARIABLE INSURANCE TRUST HIGH QUALITY FLOATING RATE FUND
Schedule of Investments (continued)
June 30, 2013 (Unaudited)
Principal Amount | Interest Rate | Maturity Date | Value | |||||||||||
| Asset-Backed Securities – (continued) | ||||||||||||||
| Student Loans(a) – 14.3% |
| ||||||||||||
| Brazos Higher Education Authority Series 2005-3, Class A14 |
| ||||||||||||
| $ | 50,229 | 0.383 | % | 09/25/23 | $ | 50,162 | ||||||||
| College Loan Corp. Trust Series 2004-1, Class A4 |
| ||||||||||||
| 150,000 | 0.466 | 04/25/24 | 141,621 | |||||||||||
| Edsouth Indenture No. 1 LLC Series 2010-1, Class A1(b) |
| ||||||||||||
| 2,705,994 | 1.126 | 07/25/23 | 2,726,263 | |||||||||||
| Educational Funding of the South, Inc. Series 2011-1, Class A2 |
| ||||||||||||
| 1,000,000 | 0.926 | 04/25/35 | 994,644 | |||||||||||
| EFS Volunteer No. 3 LLC Series 2012-1, Class A2(b) |
| ||||||||||||
| 1,750,000 | 1.193 | 02/25/25 | 1,769,953 | |||||||||||
| Montana Higher Education Student Assistance Corp. | | ||||||||||||
| 1,300,000 | 1.192 | 05/20/30 | 1,322,024 | |||||||||||
| Panhandle-Plains Higher Education Authority, Inc. Series 2011-1, | | ||||||||||||
| 1,140,000 | 1.234 | 07/01/24 | 1,148,414 | |||||||||||
| SLM Student Loan Trust Series 2008-5, Class A4 |
| ||||||||||||
| 300,000 | 1.976 | 07/25/23 | 313,023 | |||||||||||
| SLM Student Loan Trust Series 2011-2, Class A1 |
| ||||||||||||
| 1,308,302 | 0.793 | 11/25/27 | 1,313,633 | |||||||||||
| SLM Student Loan Trust Series 2012-2, Class A |
| ||||||||||||
| 228,682 | 0.893 | 01/25/29 | 230,473 | |||||||||||
|
| |||||||||||||
| 10,010,210 | ||||||||||||||
|
| |||||||||||||
| TOTAL ASSET-BACKED SECURITIES | ||||||||||||||
| (Cost $18,083,698) | $ | 17,956,083 | ||||||||||||
|
| |||||||||||||
| U.S. Treasury Obligations – 1.2% | ||||||||||||||
| United States Treasury Notes |
| ||||||||||||
| $ | 200,000 | 1.000 | % | 05/31/18 | $ | 196,508 | ||||||||
| 200,000 | 1.375 | 06/30/18 | 199,860 | |||||||||||
| 100,000 | 1.375 | 05/31/20 | 96,484 | |||||||||||
|
| |||||||||||||
| U.S. Treasury Obligations – (continued) | ||||||||||||||
| United States Treasury Notes – (continued) |
| ||||||||||||
| $ | 100,000 | 1.875 | % | 06/30/20 | $ | 99,613 | ||||||||
| 300,000 | 1.750 | 05/15/23 | 280,899 | |||||||||||
|
| |||||||||||||
| TOTAL U.S. TREASURY OBLIGATIONS | ||||||||||||||
| (Cost $886,590) | $ | 873,364 | ||||||||||||
|
| |||||||||||||
| TOTAL INVESTMENTS – 100.1% | ||||||||||||||
| (Cost $69,975,902) | $ | 69,826,311 | ||||||||||||
|
| |||||||||||||
| LIABILITIES IN EXCESS OF OTHER | | (91,507 | ) | ||||||||||
|
| |||||||||||||
| NET ASSETS – 100.0% | $ | 69,734,804 | ||||||||||||
|
| |||||||||||||
| The percentage shown for each investment category reflects the value of investments in that category as a percentage of net assets. | ||
| (a) | Variable rate security. Interest rate disclosed is that which is in effect at June 30, 2013. | |
| (b) | Exempt from registration under Rule 144A of the Securities Act of 1933. Under procedures approved by the Board of Trustees, such securities have been determined to be liquid by the investment adviser and may be resold, normally to qualified institutional buyers in transactions exempt from registration. Total market value of Rule 144A securities amounts to $9,489,924, which represents approximately 13.6% of net assets as of June 30, 2013. | |
| (c) | TBA (To Be Announced) Securities are purchased/sold on a forward commitment basis with an approximate principal amount and no defined maturity date. The actual principal and maturity date will be determined upon settlement when the specific mortgage pools are assigned. Total market value of TBA securities (excluding forward sales contracts, if any) amounts to $2,031,250 which represents approximately 2.9% of net assets as of June 30, 2013. | |
| Investment Abbreviations: | ||
| FHLMC | —Federal Home Loan Mortgage Corp. | |
| FNMA | —Federal National Mortgage Association | |
| GNMA | —Government National Mortgage Association | |
| REMIC | —Real Estate Mortgage Investment Conduit | |
| 42 | The accompanying notes are an integral part of these financial statements. |
GOLDMAN SACHS VARIABLE INSURANCE TRUST HIGH QUALITY FLOATING RATE FUND
ADDITIONAL INVESTMENT INFORMATION
FUTURES CONTRACTS — At June 30, 2013, the Fund had the following futures contracts:
| Type | Number of Contracts Long (Short) | Expiration Date | Current Value | Unrealized Gain (Loss) | ||||||||
| U.S. Long Bond | (47) | September 2013 | $ | (6,384,656 | ) | $ | 182,117 | |||||
| U.S. Ultra Long Treasury Bonds | 7 | September 2013 | 1,031,188 | (36,618 | ) | |||||||
| 2 Year U.S. Treasury Notes | 43 | September 2013 | 9,460,000 | (11,059 | ) | |||||||
| 5 Year U.S. Treasury Notes | (60) | September 2013 | (7,262,813 | ) | 83,678 | |||||||
10 Year U.S. Treasury Notes | (3) | September 2013 | (379,688 | ) | (52 | ) | ||||||
| TOTAL | $ | 218,066 | ||||||||||
| The accompanying notes are an integral part of these financial statements. | 43 |
GOLDMAN SACHS VARIABLE INSURANCE TRUST FUNDS
Statements of Assets and Liabilities
June 30, 2013 (Unaudited)
Core Fixed Income Fund | Equity Index Fund | Growth Fund | High Quality Floating Rate Fund | |||||||||||||
| Assets: | ||||||||||||||||
Investments of unaffiliated issuers, at value (cost $131,026,798, $114,517,310, $142,840,246 and $69,975,902) | $ | 130,761,379 | $ | 175,069,480 | $ | 181,914,633 | $ | 69,826,311 | ||||||||
Investments of affiliated issuer, at value (cost $662,482 for Equity Index Fund) | — | 800,264 | — | — | ||||||||||||
Cash | 12,866,110 | 617,017 | 1,734,755 | 2,586,969 | ||||||||||||
Foreign currencies, at value (cost $2,245,129 for Core Fixed Income Fund) | 2,251,738 | — | — | — | ||||||||||||
Receivables: | — | — | — | — | ||||||||||||
Investments sold on an extended-settlement basis | 23,400,777 | — | — | 62,910 | ||||||||||||
Interest and dividends | 702,585 | 217,556 | 61,338 | 61,071 | ||||||||||||
Unrealized gain on forward foreign currency exchange contracts | 291,468 | — | — | — | ||||||||||||
Fund shares sold | 80,675 | 134,886 | 25,190 | 265,233 | ||||||||||||
Investments sold | 77,807 | 541,979 | — | — | ||||||||||||
Reimbursement from investment adviser | 41,020 | 60,089 | 33,585 | 34,647 | ||||||||||||
Futures variation margin | 24,606 | — | — | — | ||||||||||||
Collateral on certain derivative contracts | — | — | — | 346,000 | (a) | |||||||||||
Other assets | 1,960 | 994 | 1,052 | 492 | ||||||||||||
| Total assets | 170,500,125 | 177,442,265 | 183,770,553 | 73,183,633 | ||||||||||||
| Liabilities: | ||||||||||||||||
Payables: | ||||||||||||||||
Investments purchased on an extended-settlement basis | 39,021,992 | — | — | 3,222,095 | ||||||||||||
Forward sale contracts, at value (proceeds receivable $4,305,352 for Core Fixed Income Fund) | 4,283,672 | — | — | — | ||||||||||||
Investments purchased | 2,011,158 | 95,426 | 840,269 | 99,627 | ||||||||||||
Unrealized loss on forward foreign currency exchange contracts | 250,971 | — | — | — | ||||||||||||
Amounts owed to affiliates | 69,718 | 70,744 | 173,855 | 32,977 | ||||||||||||
Fund shares redeemed | 27,442 | 22,167 | 94,052 | 6,803 | ||||||||||||
Futures variation margin | — | 5,477 | — | 5,951 | ||||||||||||
Accrued expenses | 69,397 | 82,639 | 60,763 | 81,376 | ||||||||||||
| Total liabilities | 45,734,350 | 276,453 | 1,168,939 | 3,448,829 | ||||||||||||
| Net Assets: | ||||||||||||||||
Paid-in capital | 130,388,918 | 130,352,049 | 137,798,449 | 69,648,185 | ||||||||||||
Undistributed (distributions in excess of) net investment income (loss) | (273,203 | ) | 1,832,965 | (417,023 | ) | (178,892 | ) | |||||||||
Accumulated net realized gain (loss) | (5,395,429 | ) | (15,687,883 | ) | 6,145,801 | 197,036 | ||||||||||
Net unrealized gain | 45,489 | 60,668,681 | 39,074,387 | 68,475 | ||||||||||||
| NET ASSETS | $ | 124,765,775 | $ | 177,165,812 | $ | 182,601,614 | $ | 69,734,804 | ||||||||
Net Assets: | ||||||||||||||||
Institutional | $ | 24,164 | $ | — | $ | 25,077 | $ | 24,981 | ||||||||
Service | 124,741,611 | 177,165,812 | 182,576,537 | 69,709,823 | ||||||||||||
Total Net Assets | $ | 124,765,775 | $ | 177,165,812 | $ | 182,601,614 | $ | 69,734,804 | ||||||||
Shares of beneficial interest outstanding $0.001 par value (unlimited shares authorized): | ||||||||||||||||
Institutional | 2,305 | — | 3,264 | 2,372 | ||||||||||||
Service | 11,902,663 | 14,796,452 | 23,771,014 | 6,619,502 | ||||||||||||
Net asset value, offering and redemption price per share: | ||||||||||||||||
Institutional | $10.48 | — | $7.68 | $10.53 | ||||||||||||
Service | 10.48 | 11.97 | 7.68 | 10.53 | ||||||||||||
(a) Represents cash on deposit with counterparty relating to initial margin requirements on future transactions of $346,000 for High Quality Floating Rate Fund.
| 44 | The accompanying notes are an integral part of these financial statements. |
GOLDMAN SACHS VARIABLE INSURANCE TRUST FUNDS
Statements of Operations
For the Six Months Ended June 30, 2013 (Unaudited)
| Core Fixed Income Fund | Equity Index Fund | Growth Opportunities Fund | High Quality Floating Rate Fund | |||||||||||||
| Investment income: | ||||||||||||||||
Interest | $ | 1,554,262 | $ | 72 | $ | — | $ | 257,081 | ||||||||
Dividends — unaffiliated issuers (net of foreign taxes withheld of $0, $557, $5,327 and $0) | 926 | 1,878,111 | 626,809 | — | ||||||||||||
Dividends — affiliated issuer | — | 5,547 | — | — | ||||||||||||
| Total investment income | 1,555,188 | 1,883,730 | 626,809 | 257,081 | ||||||||||||
| Expenses: | ||||||||||||||||
Management fees | 260,567 | 264,597 | 906,005 | 165,948 | ||||||||||||
Distribution and Service fees | 162,843 | 220,497 | 226,490 | 84,388 | ||||||||||||
Custody, accounting and administrative services | 48,583 | 28,447 | 24,553 | 35,560 | ||||||||||||
Professional fees | 37,935 | 30,218 | 27,981 | 46,049 | ||||||||||||
Printing and mailing costs | 24,864 | 37,744 | 24,599 | 12,174 | ||||||||||||
Transfer Agent fees(a) | 13,027 | 17,638 | 18,118 | 6,751 | ||||||||||||
Trustee fees | 8,995 | 9,051 | 9,059 | 8,922 | ||||||||||||
Other | 5,519 | 43,373 | 5,580 | 3,048 | ||||||||||||
| Total expenses | 562,333 | 651,565 | 1,242,385 | 362,840 | ||||||||||||
Less — expense reductions | (127,687 | ) | (224,977 | ) | (197,950 | ) | (115,348 | ) | ||||||||
| Net expenses | 434,646 | 426,588 | 1,044,435 | 247,492 | ||||||||||||
| NET INVESTMENT INCOME (LOSS) | 1,120,542 | 1,457,142 | (417,626 | ) | 9,589 | |||||||||||
| Realized and unrealized gain (loss): | ||||||||||||||||
Net realized gain (loss) from: | ||||||||||||||||
Investments — unaffiliated issuers (including commissions recaptured of $2,801 for the Growth Opportunities Fund) | (236,983 | ) | (600,960 | ) | 5,653,370 | 711,173 | ||||||||||
Investments — affiliated issuer | — | (25,686 | ) | — | — | |||||||||||
Futures contracts | (286,872 | ) | 173,807 | — | 19,270 | |||||||||||
Forward foreign currency exchange contracts | 1,054,431 | — | — | — | ||||||||||||
Foreign currency transactions | (176,685 | ) | — | — | — | |||||||||||
Net change in unrealized gain (loss) on: | ||||||||||||||||
Investments — unaffiliated issuers | (4,857,188 | ) | 21,210,187 | 13,294,790 | (947,887 | ) | ||||||||||
Investments — affiliated issuer | — | 161,785 | — | — | ||||||||||||
Futures contracts | 201,335 | (20,764 | ) | — | 179,503 | |||||||||||
Forward foreign currency exchange contracts | 208,425 | — | — | — | ||||||||||||
Foreign currency translation | (15,801 | ) | — | — | — | |||||||||||
| Net realized and unrealized gain (loss) | (4,109,338 | ) | 20,898,369 | 18,948,160 | (37,941 | ) | ||||||||||
| NET INCREASE (DECREASE) IN NET ASSETS RESULTING FROM OPERATIONS | $ | (2,988,796 | ) | $ | 22,355,511 | $ | 18,530,534 | $ | (28,352 | ) | ||||||
(a) Class specific Transfer Agent fees were as follows:
| Transfer Agent Fees | ||||||||
Fund | Institutional | Service | ||||||
Core Fixed Income | $ | — | (b) | $ | 13,027 | |||
Equity Index | N/A | 17,638 | ||||||
Growth Opportunities | — | (b) | 18,118 | |||||
High Quality Floating Rate | — | (b) | 6,751 | |||||
(b) Commenced operations on April 30, 2013 for Core Fixed Income, Growth Opportunities and High Quality Floating Rate Funds.
| The accompanying notes are an integral part of these financial statements. | 45 |
GOLDMAN SACHS VARIABLE INSURANCE TRUST FUNDS
Statements of Changes in Net Assets
| Core Fixed Income Fund | Equity Index Fund | |||||||||||||||
For the Six Months Ended | For the Fiscal Year Ended | For the Six Months Ended June 30, 2013 | For the Fiscal Year Ended | |||||||||||||
| From operations: | ||||||||||||||||
Net investment income (loss) | $ | 1,120,542 | $ | 2,237,144 | $ | 1,457,142 | $ | 3,159,545 | ||||||||
Net realized gain (loss) | 353,891 | 4,328,117 | (452,839 | ) | 6,823,582 | |||||||||||
Net change in unrealized gain (loss) | (4,463,229 | ) | 2,738,834 | 21,351,208 | 15,220,753 | |||||||||||
| Net increase (decrease) in net assets resulting from operations | (2,988,796 | ) | 9,304,095 | 22,355,511 | 25,203,880 | |||||||||||
| Distributions to shareholders: | ||||||||||||||||
From net investment income | ||||||||||||||||
Institutional Shares | (146 | )(a) | — | — | — | |||||||||||
Service Shares | (1,730,621 | ) | (3,241,836 | ) | — | (3,068,378 | ) | |||||||||
From net realized gains | ||||||||||||||||
Service Shares | — | — | — | — | ||||||||||||
| Total distributions to shareholders | (1,730,767 | ) | (3,241,836 | ) | — | (3,068,378 | ) | |||||||||
| From share transactions: | ||||||||||||||||
Proceeds from sales of shares | 3,067,142 | 8,361,507 | 1,335,342 | 2,183,506 | ||||||||||||
Reinvestment of distributions | 1,730,767 | 3,241,836 | — | 3,068,378 | ||||||||||||
Cost of shares redeemed | (10,748,540 | ) | (30,344,108 | ) | (14,335,902 | ) | (29,287,642 | ) | ||||||||
Net increase (decrease) in net assets resulting from share transactions | (5,950,631 | ) | (18,740,765 | ) | (13,000,560 | ) | (24,035,758 | ) | ||||||||
| TOTAL INCREASE (DECREASE) | (10,670,194 | ) | (12,678,506 | ) | 9,354,951 | (1,900,256 | ) | |||||||||
| Net assets: | ||||||||||||||||
Beginning of period | 135,435,969 | 148,114,475 | 167,810,861 | 169,711,117 | ||||||||||||
End of period | $ | 124,765,775 | $ | 135,435,969 | $ | 177,165,812 | $ | 167,810,861 | ||||||||
| Undistributed (distributions in excess of) net investment income (loss) | $ | (273,203 | ) | $ | 337,022 | $ | 1,832,965 | $ | 375,823 | |||||||
(a) Commenced operations on April 30, 2013.
| 46 | The accompanying notes are an integral part of these financial statements. |
GOLDMAN SACHS VARIABLE INSURANCE TRUST FUNDS
| Growth Opportunities Fund | High Quality Floating Rate Fund | |||||||||||||||||||||
For the Six Months Ended | For the Fiscal Year Ended December 31, 2012 | For the Six Months Ended June 30, 2013 (Unaudited) | For the Fiscal Year Ended December 31, 2012 | |||||||||||||||||||
| $ | (417,626 | ) | $ | (442,180 | ) | $ | 9,589 | $ | 242,926 | |||||||||||||
| 5,653,370 | 12,350,130 | 730,443 | 1,459,709 | |||||||||||||||||||
| 13,294,790 | 18,219,850 | (768,384 | ) | 122,962 | ||||||||||||||||||
| 18,530,534 | 30,127,800 | (28,352 | ) | 1,825,597 | ||||||||||||||||||
| — | (a) | — | (44 | )(a) | — | |||||||||||||||||
| — | — | (266,963 | ) | (516,585 | ) | |||||||||||||||||
| — | (14,534,448 | ) | — | (2,117,284 | ) | |||||||||||||||||
| — | (14,534,448 | ) | (267,007 | ) | (2,633,869 | ) | ||||||||||||||||
| 4,972,427 | 5,879,360 | 8,041,552 | 15,052,010 | |||||||||||||||||||
| — | 14,534,448 | 267,007 | 2,633,869 | |||||||||||||||||||
| (12,771,116 | ) | (23,461,412 | ) | (7,171,890 | ) | (15,310,789 | ) | |||||||||||||||
| (7,798,689 | ) | (3,047,604 | ) | 1,136,669 | 2,375,090 | |||||||||||||||||
| 10,731,845 | 12,545,748 | 841,310 | 1,566,818 | |||||||||||||||||||
| 171,869,769 | 159,324,021 | 68,893,494 | 67,326,676 | |||||||||||||||||||
| $ | 182,601,614 | $ | 171,869,769 | $ | 69,734,804 | $ | 68,893,494 | |||||||||||||||
| $ | (417,023 | ) | $ | 603 | $ | (178,892 | ) | $ | 78,526 | |||||||||||||
| The accompanying notes are an integral part of these financial statements. | 47 |
GOLDMAN SACHS VARIABLE INSURANCE TRUST CORE FIXED INCOME FUND
Financial Highlights
Selected Data for a Share Outstanding Throughout Each Period
| Income (loss) from investment operations | ||||||||||||||||||||||||||||||||||||||||||||||||
| Year - Share Class | Net asset value, beginning of period | Net investment income(a) | Net realized and unrealized gain (loss) | Total from investment operations | Distributions to shareholders from net investment income | Net asset value, end of period | Total return(b) | Net assets, end of period (in 000s) | Ratio of net expenses to average net assets | Ratio of total expenses to average net assets | Ratio of net investment income to average net assets | Portfolio turnover rate(c) | ||||||||||||||||||||||||||||||||||||
FOR THE SIX MONTHS ENDED JUNE 30, (UNAUDITED) | ||||||||||||||||||||||||||||||||||||||||||||||||
2013 - Institutional (Commenced April 30, 2013) | $ | 10.91 | $ | 0.03 | $ | (0.40 | ) | $ | (0.37 | ) | $ | (0.06 | ) | $ | 10.48 | (3.36 | )% | $ | 24 | 0.41 | %(d) | 0.69 | %(d) | 1.94 | %(d) | 346 | % | |||||||||||||||||||||
2013 - Service | 10.88 | 0.09 | (0.35 | ) | (0.26 | ) | (0.14 | ) | 10.48 | (2.37 | ) | 124,742 | 0.67 | (d) | 0.86 | (d) | 1.72 | (d) | 346 | |||||||||||||||||||||||||||||
FOR THE FISCAL YEARS ENDED DECEMBER 31, | ||||||||||||||||||||||||||||||||||||||||||||||||
2012 - Service | 10.43 | 0.17 | 0.52 | 0.69 | (0.24 | ) | 10.88 | 6.70 | 135,436 | 0.67 | 0.83 | 1.57 | 727 | |||||||||||||||||||||||||||||||||||
2011 - Service | 10.00 | 0.23 | 0.46 | 0.69 | (0.26 | ) | 10.43 | 6.96 | 148,114 | 0.67 | 0.83 | 2.22 | 644 | |||||||||||||||||||||||||||||||||||
2010 - Service | 9.62 | 0.28 | 0.41 | 0.69 | (0.31 | ) | 10.00 | 7.18 | 170,720 | 0.67 | 0.81 | 2.80 | 399 | |||||||||||||||||||||||||||||||||||
2009 - Service | 8.81 | 0.39 | 0.87 | 1.26 | (0.45 | ) | 9.62 | 14.68 | 183,178 | 0.67 | 0.79 | 4.29 | 187 | |||||||||||||||||||||||||||||||||||
2008 - Service | 10.13 | 0.47 | (1.31 | ) | (0.84 | ) | (0.48 | ) | 8.81 | (8.56 | ) | 182,978 | 0.67 | 0.77 | 4.92 | 140 | ||||||||||||||||||||||||||||||||
| (a) | Calculated based on the average shares outstanding methodology. |
| (b) | Assumes investment at the net asset value at the beginning of the period, reinvestment of all distributions, and a complete redemption of the investment at the net asset value at the end of the period. Total returns for periods less than one full year are not annualized. |
| (c) | The Fund’s portfolio turnover rate is calculated in accordance with regulatory requirements, without regard to transactions involving short term investments and certain derivatives. If such transactions were included, the Fund’s portfolio turnover rate may be higher. |
| (d) | Annualized. |
| The accompanying notes are an integral part of these financial statements. | 48 |
GOLDMAN SACHS VARIABLE INSURANCE TRUST EQUITY INDEX FUND
Financial Highlights
Selected Data for a Share Outstanding Throughout Each Period
| Income (loss) from investment operations | Distributions to shareholders | |||||||||||||||||||||||||||||||||||||||||||||||||||||||
| Year | Net asset value, beginning of period | Net investment income(a) | Net realized and unrealized gain (loss) | Total from investment operations | From net investment income | From net | Total distributions | Net asset value, end of period | Total return(b) | Net assets, end of period (in 000s) | Ratio of net expenses to average net assets | Ratio of total expenses to average net assets | Ratio of net investment income to average net assets | Portfolio turnover rate(c) | ||||||||||||||||||||||||||||||||||||||||||
FOR THE SIX MONTHS ENDED JUNE 30, (UNAUDITED) | ||||||||||||||||||||||||||||||||||||||||||||||||||||||||
2013 | $ | 10.54 | $ | 0.09 | $ | 1.34 | $ | 1.43 | $ | — | $ | — | $ | — | $ | 11.97 | 13.57 | % | $ | 177,166 | 0.48 | %(d) | 0.74 | %(d) | 1.65 | %(d) | 1 | % | ||||||||||||||||||||||||||||
FOR THE FISCAL YEARS ENDED DECEMBER 31, | ||||||||||||||||||||||||||||||||||||||||||||||||||||||||
2012 | 9.29 | 0.19 | 1.26 | 1.45 | (0.20 | ) | — | (0.20 | ) | 10.54 | 15.50 | 167,811 | 0.48 | 0.72 | 1.82 | 3 | ||||||||||||||||||||||||||||||||||||||||
2011 | 9.29 | 0.15 | 0.01 | 0.16 | (0.16 | ) | — | (0.16 | ) | 9.29 | 1.75 | 169,711 | 0.48 | 0.70 | 1.59 | 3 | ||||||||||||||||||||||||||||||||||||||||
2010 | 8.22 | 0.13 | 1.08 | 1.21 | (0.14 | ) | — | (0.14 | ) | 9.29 | 14.92 | 193,874 | 0.51 | 0.71 | 1.52 | 4 | ||||||||||||||||||||||||||||||||||||||||
2009 | 6.61 | 0.14 | 1.62 | 1.76 | (0.15 | ) | — | (0.15 | ) | 8.22 | 26.28 | 198,588 | 0.59 | 0.68 | 1.97 | 5 | ||||||||||||||||||||||||||||||||||||||||
2008 | 11.42 | 0.17 | (4.46 | ) | (4.29 | ) | (0.18 | ) | (0.34 | ) | (0.52 | ) | 6.61 | (37.18 | ) | 187,383 | 0.60 | 0.69 | 1.81 | 4 | ||||||||||||||||||||||||||||||||||||
| (a) | Calculated based on the average shares outstanding methodology. |
| (b) | Assumes investment at the net asset value at the beginning of the period, reinvestment of all distributions, and a complete redemption of the investment at the net asset value at the end of the period. Total returns for periods less than one full year are not annualized. |
| (c) | The Fund’s portfolio turnover rate is calculated in accordance with regulatory requirements, without regard to transactions involving short term investments and certain derivatives. If such transactions were included, the Fund’s portfolio turnover rate may be higher. |
| (d) | Annualized. |
| The accompanying notes are an integral part of these financial statements. | 49 |
GOLDMAN SACHS VARIABLE INSURANCE TRUST GROWTH OPPORTUNITIES FUND
Financial Highlights
Selected Data for a Share Outstanding Throughout Each Period
| Income (loss) from investment operations | ||||||||||||||||||||||||||||||||||||||||||||||||
| Year - Share Class | Net asset value, beginning of period | Net investment loss(a) | Net realized and unrealized gain (loss) | Total from investment operations | Distribution to shareholders from net realized gains | Net asset value, end of period | Total return(b) | Net assets, end of period (in 000s) | Ratio of net expenses to average net assets | Ratio of total expenses to average net assets | Ratio of net investment loss to average net assets | Portfolio turnover rate(c) | ||||||||||||||||||||||||||||||||||||
FOR THE SIX MONTHS ENDED JUNE 30, (UNAUDITED) | ||||||||||||||||||||||||||||||||||||||||||||||||
2013 - Institutional (Commenced April 30, 2013) | $ | 7.66 | $ | — | (d) | $ | 0.02 | $ | 0.02 | $ | — | $ | 7.68 | 0.26 | % | $ | 25 | 0.99 | %(e) | 1.18 | %(e) | (0.09 | )%(e) | 20 | % | |||||||||||||||||||||||
2013 - Service | 6.93 | (0.02 | ) | 0.77 | 0.75 | — | 7.68 | 10.82 | 182,577 | 1.15 | (e) | 1.37 | (e) | (0.46 | )(e) | 20 | ||||||||||||||||||||||||||||||||
FOR THE FISCAL YEARS ENDED DECEMBER 31, | ||||||||||||||||||||||||||||||||||||||||||||||||
2012 - Service | 6.34 | (0.02 | )(f) | 1.25 | 1.23 | (0.64 | ) | 6.93 | 19.37 | 171,870 | 1.15 | 1.39 | (0.26 | )(f) | 46 | |||||||||||||||||||||||||||||||||
2011 - Service | 6.72 | (0.03 | ) | (0.24 | ) | (0.27 | ) | (0.11 | ) | 6.34 | (3.97 | ) | 159,324 | 1.17 | 1.41 | (0.46 | ) | 53 | ||||||||||||||||||||||||||||||
2010 - Service | 5.63 | (0.03 | ) | 1.12 | 1.09 | — | 6.72 | 19.36 | 145,904 | 1.18 | 1.43 | (0.56 | ) | 57 | ||||||||||||||||||||||||||||||||||
2009 - Service | 3.55 | (0.02 | ) | 2.10 | 2.08 | — | 5.63 | 58.59 | 127,710 | 1.18 | 1.43 | (0.50 | ) | 71 | ||||||||||||||||||||||||||||||||||
2008 - Service | 6.20 | (0.02 | ) | (2.52 | ) | (2.54 | ) | (0.11 | ) | 3.55 | (40.72 | ) | 95,237 | 1.18 | 1.37 | (0.32 | ) | 78 | ||||||||||||||||||||||||||||||
| (a) | Calculated based on the average shares outstanding methodology. |
| (b) | Assumes investment at the net asset value at the beginning of the period, reinvestment of all distributions, and a complete redemption of the investment at the net asset value at the end of the period. Total returns for periods less than one full year are not annualized. |
| (c) | The Fund’s portfolio turnover rate is calculated in accordance with regulatory requirements, without regard to transactions involving short term investments and certain derivatives. If such transactions were included, the Fund’s portfolio turnover rate may be higher. |
| (d) | Amount is less than $0.005 per share. |
| (e) | Annualized. |
| (f) | Reflects income recognized from special dividends which amounted to $0.01 per share and 0.18% of average net assets. |
| The accompanying notes are an integral part of these financial statements. | 50 |
GOLDMAN SACHS VARIABLE INSURANCE HIGH QUALITY FLOATING RATE FUND
Financial Highlights
Selected Data for a Share Outstanding Throughout Each Period
| Income (loss) from investment operations | Distributions to shareholders | |||||||||||||||||||||||||||||||||||||||||||||||||||||||
| Year - Share Class | Net asset value, beginning of period | Net investment income(a) | Net realized and unrealized gain (loss) | Total from investment operations | From net investment income | From net realized gains | Total distributions | Net asset value, end of period | Total return(b) | Net assets, end of period (in 000s) | Ratio of net expenses to average net assets | Ratio of total expenses to average net assets | Ratio of net investment income to average net assets | Portfolio turnover rate(c) | ||||||||||||||||||||||||||||||||||||||||||
FOR THE SIX MONTHS ENDED JUNE 30, (UNAUDITED) | ||||||||||||||||||||||||||||||||||||||||||||||||||||||||
2013 - Institutional (Commenced April 30, 2013) | $ | 10.56 | $ | 0.01 | $ | (0.02 | ) | $ | (0.01 | ) | $ | (0.02 | ) | $ | — | $ | (0.02 | ) | $ | 10.53 | (0.11 | )% | $ | 25 | 0.38 | %(d) | 0.85 | %(d) | 0.42 | %(d) | 469 | % | ||||||||||||||||||||||||
2013 - Service | 10.58 | — | (e) | (0.01 | ) | (0.01 | ) | (0.04 | ) | — | (0.04 | ) | 10.53 | (0.08 | ) | 69,710 | 0.73 | (d) | 1.07 | (d) | 0.03 | (d) | 469 | |||||||||||||||||||||||||||||||||
FOR THE FISCAL YEARS ENDED DECEMBER 31, | ||||||||||||||||||||||||||||||||||||||||||||||||||||||||
2012 - Service | 10.70 | 0.04 | 0.25 | 0.29 | (0.08 | ) | (0.33 | ) | (0.41 | ) | 10.58 | 2.78 | 68,893 | 0.79 | 1.06 | 0.36 | 1,045 | |||||||||||||||||||||||||||||||||||||||
2011 - Service | 10.56 | 0.09 | 0.57 | 0.66 | (0.10 | ) | (0.42 | ) | (0.52 | ) | 10.70 | 6.35 | 67,327 | 0.81 | 1.13 | 0.81 | 960 | |||||||||||||||||||||||||||||||||||||||
2010 - Service | 10.29 | 0.17 | 0.37 | 0.54 | (0.19 | ) | (0.08 | ) | (0.27 | ) | 10.56 | 5.19 | 72,311 | 0.81 | 1.08 | 1.56 | 614 | |||||||||||||||||||||||||||||||||||||||
2009 - Service | 10.14 | 0.31 | 0.33 | 0.64 | (0.36 | ) | (0.13 | ) | (0.49 | ) | 10.29 | 6.44 | 74,760 | 0.81 | 1.05 | 3.01 | 287 | |||||||||||||||||||||||||||||||||||||||
2008 - Service | 10.27 | 0.42 | (0.11 | ) | 0.31 | (0.44 | ) | — | (0.44 | ) | 10.14 | 3.14 | 87,050 | 0.81 | 1.04 | 4.12 | 244 | |||||||||||||||||||||||||||||||||||||||
| (a) | Calculated based on the average shares outstanding methodology. |
| (b) | Assumes investment at the net asset value at the beginning of the period, reinvestment of all distributions, and a complete redemption of the investment at the net asset value at the end of the period. Total returns for periods less than one full year are not annualized. |
| (c) | The Fund’s portfolio turnover rate is calculated in accordance with regulatory requirements, without regard to transactions involving short term investments and certain derivatives. If such transactions were included, the Fund’s portfolio turnover rate may be higher. |
| (d) | Annualized. |
| (e) | Amount is less than $0.005 per share. |
| The accompanying notes are an integral part of these financial statements. | 51 |
GOLDMAN SACHS VARIABLE INSURANCE TRUST FUNDS
Notes to Financial Statements
June 30, 2013 (Unaudited)
1. ORGANIZATION
Goldman Sachs Variable Insurance Trust (the “Trust” or “VIT”) is a Delaware statutory trust registered under the Investment Company Act of 1940, as amended (the “Act”), as an open-end management investment company. The following table lists those series of the Trust that are included in this report (collectively, the “Funds” or individually a “Fund”), along with their corresponding share classes and respective diversification status under the Act:
| Fund | Share Classes Offered | Diversified/ Non-diversified | ||||
| Core Fixed Income, Growth Opportunities and High Quality Floating Rate† | Institutional and Service | Diversified | ||||
| Equity Index | Service | Diversified | ||||
| † | Formerly, Goldman Sachs Government Income Fund. Effective at the close of business April 30, 2013, the Fund changed its name to the Goldman Sachs High Quality Floating Rate Fund. |
Goldman Sachs Asset Management, L.P. (“GSAM”), an affiliate of Goldman, Sachs & Co. (“Goldman Sachs”), serves as investment adviser to the Funds pursuant to management agreements (the “Agreements”) with the Trust.
2. SIGNIFICANT ACCOUNTING POLICIES
The financial statements have been prepared in accordance with accounting principles generally accepted in the United States of America (“GAAP”) and require management to make estimates and assumptions that may affect the reported amounts and disclosures. Actual results may differ from those estimates and assumptions.
A. Investment Valuation — The Funds’ valuation policy is to value investments at fair value.
B. Investment Income and Investments — Investment income includes interest income and dividend income, net of any foreign withholding taxes, less any amounts reclaimable. Interest income is accrued daily and adjusted for amortization of premiums and accretion of discounts. Dividend income is recognized on ex-dividend date or, for certain foreign securities, as soon as such information is obtained subsequent to the ex-dividend date. Investment transactions are reflected on trade date. Realized gains and losses are calculated using identified cost. Investment transactions are recorded on the following business day for daily net asset value (“NAV”) calculations. Any foreign capital gains tax is accrued daily based upon net unrealized gains, and is payable upon sale of such investments. Distributions received from the Funds’ investments in United States (“U.S.”) real estate investment trusts (“REITs”) may be characterized as ordinary income, net capital gain or a return of capital. A return of capital is recorded by the Funds as a reduction to the cost basis of the REIT.
For derivative contracts, realized gains and losses are recorded upon settlement of the contract. For securities with paydown provisions, principal payments received are treated as a proportionate reduction to the cost basis of the securities and excess or shortfall amounts are recorded as gains or losses. For treasury inflation protected securities (“TIPS”), adjustments to principal due to inflation/deflation are reflected as increases/decreases to interest income with a corresponding adjustment to cost.
C. Class Allocations and Expenses — Investment income, realized and unrealized gain (loss), and non-class specific expenses of each Fund are allocated daily based upon the proportion of net assets of each class. Class specific expenses, where applicable, are borne by the respective share classes and include Distribution and Service and Transfer Agent fees. Non-class specific expenses directly incurred by a Fund are charged to that Fund, while such expenses incurred by the Trust are allocated across the respective Funds on a straight-line and/or pro-rata basis depending upon the nature of the expenses.
D. Federal Taxes and Distributions to Shareholders — It is each Fund’s policy to comply with the requirements of the Internal Revenue Code of 1986, as amended (the “Code”), applicable to regulated investment companies (mutual funds) and to distribute each year substantially all of its investment company taxable income and capital gains to its shareholders. Accordingly,
52
GOLDMAN SACHS VARIABLE INSURANCE TRUST FUNDS
2. SIGNIFICANT ACCOUNTING POLICIES (continued)
the Funds are not required to make any provisions for the payment of federal income tax. Distributions to shareholders are recorded on the ex-dividend date. Income and capital gains distributions, if any, are declared and paid according to the following schedule:
| Fund | Income Distributions Declared/Paid | Capital Gains Distributions Declared/Paid | ||||
| Core Fixed Income and High Quality Floating Rate | Quarterly | Annually | ||||
| Equity Index and Growth Opportunities | Annually | Annually | ||||
Net capital losses are carried forward to future fiscal years and may be used to the extent allowed by the Code to offset any future capital gains. Utilization of capital loss carryforwards will reduce the requirement of future capital gains distributions.
Under the Regulated Investment Company Modernization Act of 2010, the Funds are permitted to carry forward capital losses incurred in taxable years beginning after December 22, 2010 for an unlimited period. However, any losses incurred during those future taxable years will be required to be utilized prior to the losses incurred in pre-enactment taxable years. As a result of this ordering rule, pre-enactment capital loss carryforwards may be more likely to expire unused. Additionally, post-enactment capital losses that are carried forward will retain their character as either short-term or long-term capital losses rather than being considered all short-term as under previous law.
The characterization of distributions to shareholders for financial reporting purposes is determined in accordance with federal income tax rules, which may differ from GAAP. The source of each Fund’s distributions may be shown in the accompanying financial statements as either from net investment income, net realized gain or capital. Certain components of the Funds’ net assets on the Statements of Assets and Liabilities reflect permanent GAAP/tax differences based on the appropriate tax character.
E. Foreign Currency Translation — The accounting records and reporting currency of the Funds are maintained in U.S. dollars. Assets and liabilities denominated in foreign currencies are translated into U.S. dollars using the current exchange rates at the close of each business day. The effect of changes in foreign currency exchange rates on investments is included within net realized and unrealized gain (loss) on investments. Changes in the value of other assets and liabilities as a result of fluctuations in foreign exchange rates are included in the Statements of Operations within net change in unrealized gain (loss) on foreign currency transactions. Transactions denominated in foreign currencies are translated into U.S. dollars on the date the transaction occurred, the effects of which are included within net realized gain (loss) on foreign currency transactions.
F. Commission Recapture — GSAM, on behalf of certain Funds, may direct portfolio trades, subject to seeking best execution, to various brokers who have agreed to rebate a portion of the commissions generated. Such rebates are made directly to a Fund as cash payments and are included in net realized gain (loss) from investments on the Statements of Operations.
3. INVESTMENTS AND FAIR VALUE MEASUREMENTS
The fair value of a financial instrument is the amount that would be received to sell an asset or paid to transfer a liability in an orderly transaction between market participants at the measurement date (i.e., the exit price). GAAP establishes a fair value hierarchy that prioritizes the inputs to valuation techniques used to measure fair value. The hierarchy gives the highest priority to unadjusted quoted prices in active markets for identical assets or liabilities (Level 1 measurements) and the lowest priority to unobservable inputs (Level 3 measurements). The levels used for classifying investments are not necessarily an indication of the risk associated with investing in these investments. The three levels of the fair value hierarchy are described below:
Level 1 — Unadjusted quoted prices in active markets that are accessible at the measurement date for identical, unrestricted assets or liabilities;
Level 2 — Quoted prices in markets that are not active or financial instruments for which significant inputs are observable (including, but not limited to, quoted prices for similar investments, interest rates, foreign exchange rates, volatility and credit spreads), either directly or indirectly;
Level 3 — Prices or valuations that require significant unobservable inputs (including GSAM’s assumptions in determining fair value measurement).
53
GOLDMAN SACHS VARIABLE INSURANCE TRUST FUNDS
Notes to Financial Statements (continued)
June 30, 2013 (Unaudited)
3. INVESTMENTS AND FAIR VALUE MEASUREMENTS (continued)
The Trustees have adopted Valuation Procedures that govern the valuation of the portfolio investments held by the Funds, including investments for which market quotations are not readily available. The Trustees have delegated to GSAM day-to-day responsibility for implementing and maintaining internal controls and procedures related to the valuation of the Funds’ portfolio investments. To assess the continuing appropriateness of pricing sources and methodologies, GSAM regularly performs price verification procedures and issues challenges as necessary to third party pricing vendors or brokers, and any differences are reviewed in accordance with the Valuation Procedures.
A. Level 1 and Level 2 Fair Value Investments — The valuation techniques and significant inputs used in determining the fair values for investments classified as Level 1 and Level 2 are as follows:
Equity Securities — Equity securities and investment companies traded on a U.S. securities exchange or the NASDAQ system, or those located on certain foreign exchanges, including but not limited to the Americas, are valued daily at their last sale price or official closing price on the principal exchange or system on which they are traded. If no sale occurs, equity securities and exchange traded investment companies are valued at the last bid price for long positions and at the last ask price for short positions. Investments in investment companies (other than those that are exchange traded) are valued at the NAV on the valuation date. To the extent these investments are actively traded, they are classified as Level 1 of the fair value hierarchy.
Unlisted equity securities for which market quotations are available are valued at the last sale price on the valuation date, or if no sale occurs, at the last bid price. Securities traded on certain foreign securities exchanges are valued daily at fair value determined by an independent fair value service (if available) under Valuation Procedures approved by the Trustees and consistent with applicable regulatory guidance. The independent fair value service takes into account multiple factors including, but not limited to, movements in the securities markets, certain depositary receipts, futures contracts and foreign currency exchange rates that have occurred subsequent to the close of the foreign securities exchange. These investments are generally classified as Level 2 of the fair value hierarchy.
Debt Securities — Debt securities for which market quotations are readily available are valued daily on the basis of quotations supplied by dealers or an independent pricing service approved by the Trustees. The pricing services may use valuation models or matrix pricing, which consider: (i) yield or price with respect to bonds that are considered comparable in characteristics such as rating, interest rate and maturity date or (ii) quotations from securities dealers to determine current value. Short-term debt obligations that mature in sixty days or less and that do not exhibit signs of credit deterioration are valued at amortized cost, which approximates fair value. With the exception of treasury securities, which are generally classified as Level 1, these investments are generally classified as Level 2 of the fair value hierarchy.
i. Mortgage-Backed and Asset-Backed Securities — Mortgage-backed securities represent direct or indirect participations in, or are collateralized by and payable from, mortgage loans secured by residential and/or commercial real estate property. Asset-backed securities include securities whose principal and interest payments are collateralized by pools of other assets or receivables. The value of certain mortgage-backed and asset-backed securities (including adjustable rate mortgage loans) may be particularly sensitive to changes in prevailing interest rates. The value of these securities may also fluctuate in response to the market’s perception of the creditworthiness of the issuers.
Asset-backed securities may present credit risks that are not presented by mortgage-backed securities because they generally do not have the benefit of a security interest in collateral that is comparable to mortgage assets. Some asset-backed securities may only have a subordinated claim on collateral.
Stripped mortgage-backed securities are usually structured with two different classes: one that receives substantially all interest payments (interest-only, or “IO” and/or high coupon rate with relatively low principal amount, or “IOette”), and the other that receives substantially all principal payments (principal-only, or “PO”) from a pool of mortgage loans. Little to no principal will be received at the maturity of an IO; as a result, periodic adjustments are recorded to reduce the cost of the security until maturity. These adjustments are included in interest income
54
GOLDMAN SACHS VARIABLE INSURANCE TRUST FUNDS
3. INVESTMENTS AND FAIR VALUE MEASUREMENTS (continued)
ii. Mortgage Dollar Rolls — Mortgage dollar rolls are transactions whereby a Fund sells mortgage-backed-securities and simultaneously contracts with the same counterparty to repurchase similar securities on a specified future date. During the settlement period, a Fund will not be entitled to accrue interest and receive principal payments on the securities sold.
iii. Treasury Inflation Protected Securities — TIPS are treasury securities in which the principal amount is adjusted daily to keep pace with inflation, as measured by the U.S. Consumer Pricing Index for Urban Consumers. The repayment of the original bond principal upon maturity is guaranteed by the full faith and credit of the U.S. Government.
iv. When-Issued Securities and Forward Commitments — When-issued securities, including TBA (“To Be Announced”) securities, are securities that are authorized but not yet issued in the market and purchased in order to secure what is considered to be an advantageous price or yield to a Fund. A forward commitment involves entering into a contract to purchase or sell securities, typically on an extended settlement basis, for a fixed price at a future date. The purchase of securities on a when-issued or forward commitment basis involves a risk of loss if the value of the security to be purchased declines before the settlement date. Conversely, the sale of securities on a forward commitment basis involves the risk that the value of the securities sold may increase before the settlement date. Although a Fund will generally purchase securities on a when-issued or forward commitment basis with the intention of acquiring the securities for its portfolio, the Fund may dispose of when-issued securities or forward commitments prior to settlement which may result in a realized gain or loss.
Derivative Contracts — A derivative is an instrument whose value is derived from underlying assets, indices, reference rates or a combination of these factors.
Exchange-traded derivatives, including futures contracts, typically fall within Level 1 of the fair value hierarchy. Over-the-counter (“OTC”) derivatives are valued using market transactions and other market evidence, including market-based inputs to models, calibration to market-clearing transactions, broker or dealer quotations, or other alternative pricing sources. Where models are used, the selection of a particular model to value an OTC derivative depends upon the contractual terms of, and specific risks inherent in, the instrument, as well as the availability of pricing information in the market. Valuation models require a variety of inputs, including contractual terms, market prices, yield curves, credit curves, measures of volatility, voluntary and involuntary prepayment rates, loss severity rates and correlations of such inputs. For OTC derivatives that trade in liquid markets, model inputs can generally be verified and model selection does not involve significant management judgment. OTC derivatives are classified within Level 2 of the fair value hierarchy when significant inputs are corroborated by market evidence.
i. Forward Foreign Currency Exchange Contracts — In a forward foreign currency contract, a Fund agrees to receive or deliver a fixed quantity of one currency for another, at a pre-determined price at a future date. All forward foreign currency exchange contracts are marked-to-market daily at the applicable forward rate.
ii. Futures Contracts — Futures contracts are contracts to buy or sell a standardized quantity of a specified commodity or security and are valued based on exchanged settlement prices or independent market quotes. Futures contracts are valued at the last settlement price, or in the absence of a sale, the last bid price for long positions and at the last ask price for short positions, at the end of each day on the board of trade or exchange upon which they are traded. Upon entering into a futures contract, a Fund deposits cash or securities in an account on behalf of the broker in an amount sufficient to meet the initial margin requirement. Subsequent payments are made or received by the Fund equal to the daily change in the contract value and are recorded as variation margin receivable or payable with a corresponding offset to unrealized gains or losses.
55
GOLDMAN SACHS VARIABLE INSURANCE TRUST FUNDS
Notes to Financial Statements (continued)
June 30, 2013 (Unaudited)
3. INVESTMENTS AND FAIR VALUE MEASUREMENTS (continued)
B. Level 3 Fair Value Investments — To the extent that the aforementioned significant inputs are unobservable, or if quotations are not readily available, or if GSAM believes that such quotations do not accurately reflect fair value, the fair value of the Funds’ investments may be determined under Valuation Procedures approved by the Trustees. GSAM, consistent with its procedures and applicable regulatory guidance, may make an adjustment to the most recent valuation prices of either domestic or foreign securities in light of significant events to reflect what it believes to be the fair value of the securities at the time of determining a Fund’s NAV. Significant events which could affect a large number of securities in a particular market may include, but are not limited to: significant fluctuations in U.S. or foreign markets; market dislocations; market disruptions; or unscheduled market closings. Significant events which could also affect a single issuer may include, but are not limited to: corporate actions such as reorganizations, mergers and buy-outs; ratings downgrades; and bankruptcies.
C. Fair Value Hierarchy — The following is a summary of the Funds’ investments and derivatives classified in the fair value hierarchy as of June 30, 2013:
| CORE FIXED INCOME | ||||||||||||
| Investment Type | Level 1 | Level 2 | Level 3 | |||||||||
| Assets | ||||||||||||
| Fixed Income | ||||||||||||
Corporate Obligations | $ | — | $ | 31,518,752 | $ | — | ||||||
Mortgage-Backed Obligations | — | 52,627,469 | — | |||||||||
U.S. Treasury Obligations and/or Other U.S. Government Agencies | 24,233,428 | 6,260,863 | — | |||||||||
Asset-Backed Securities | — | 8,319,054 | — | |||||||||
Foreign Debt Obligations | 1,576,221 | 2,319,068 | — | |||||||||
Municipal Debt Obligations | — | �� | 1,376,773 | — | ||||||||
Government Guarantee Obligations | — | 2,529,751 | — | |||||||||
| Total | $ | 25,809,649 | $ | 104,951,730 | $ | — | ||||||
| Liabilities | ||||||||||||
| Fixed Income | ||||||||||||
Mortgage-Backed Obligations — Forward Sales Contracts | $ | — | $ | (4,283,672 | ) | $ | — | |||||
| Derivative Type | ||||||||||||
| Assets(a) | ||||||||||||
| Futures Contracts | $ | 482,247 | $ | — | $ | — | ||||||
| Forward Foreign Currency Exchange Contracts | — | 291,468 | — | |||||||||
| Liabilities(a) | ||||||||||||
| Futures Contracts | $ | (219,458 | ) | $ | — | $ | — | |||||
| Forward Foreign Currency Exchange Contracts | — | (250,971 | ) | — | ||||||||
56
GOLDMAN SACHS VARIABLE INSURANCE TRUST FUNDS
3. INVESTMENTS AND FAIR VALUE MEASUREMENTS (continued)
| EQUITY INDEX | ||||||||||||
| Investment Type | Level 1 | Level 2 | Level 3 | |||||||||
| Assets | ||||||||||||
| Common Stock and/or Other Equity Investments | $ | 175,729,747 | $ | — | $ | — | ||||||
| U.S. Treasury Obligations and/or Other U.S. Government Agencies | 139,997 | — | — | |||||||||
| Total | $ | 175,869,744 | $ | — | $ | — | ||||||
| Derivative Type | ||||||||||||
| Liabilities(a) | ||||||||||||
| Futures Contracts | $ | (21,271 | ) | $ | — | $ | — | |||||
| GROWTH OPPORTUNITIES | ||||||||||||
| Investment Type | Level 1 | Level 2 | Level 3 | |||||||||
| Assets | ||||||||||||
| Common Stock and/or Other Equity Investments | $ | 181,914,633 | $ | — | $ | — | ||||||
| HIGH QUALITY FLOATING RATE | ||||||||||||
| Investment Type | Level 1 | Level 2 | Level 3 | |||||||||
| Assets | ||||||||||||
| Fixed Income | ||||||||||||
Mortgage-Backed Obligations | $ | — | $ | 50,996,864 | $ | — | ||||||
U.S. Treasury Obligations and/or Other U.S. Government Agencies | 873,364 | — | — | |||||||||
Asset-Backed Securities | — | 17,956,083 | — | |||||||||
| Total | $ | 873,364 | $ | 68,952,947 | $ | — | ||||||
| Derivative Type | ||||||||||||
| Assets(a) | ||||||||||||
| Futures Contracts | $ | 265,795 | $ | — | $ | — | ||||||
| Liabilities(a) | ||||||||||||
| Futures Contracts | $ | (47,729 | ) | $ | — | |||||||
| (a) | Amount shown represents unrealized gain (loss) at period end. |
For further information regarding security characteristics, see the Schedules of Investments.
57
GOLDMAN SACHS VARIABLE INSURANCE TRUST FUNDS
Notes to Financial Statements (continued)
June 30, 2013 (Unaudited)
4. INVESTMENTS IN DERIVATIVES
The following tables set forth, by certain risk types, the gross value of derivative contracts as of June 30, 2013. These instruments were used to meet the Funds’ investment objectives and to obtain and/or manage exposure related to the risks below. The values in the tables below exclude the effects of cash collateral received or posted pursuant to these derivative contracts, and therefore are not representative of the Funds’ net exposure.
| CORE FIXED INCOME | ||||||||
| Risk | Statements of Assets and Liabilities | Assets | Statements of Assets and Liabilities | Liabilities | ||||
| Interest Rate | Receivable for unrealized gain on futures variation margin | $482,247(a) | Payable for unrealized loss on futures variation margin | $(219,458)(a) | ||||
| Currency | Receivables for unrealized gain on forward foreign currency exchange contracts | 291,468 | Payable for unrealized loss on forward foreign currency exchange contracts | (250,971) | ||||
| Total | $773,715 | $(470,429) | ||||||
| Fund | Risk | Statements of Assets and Liabilities | Assets(a) | Statements of Assets and Liabilities | Liabilities(a) | |||||||||
| Equity Index | Equity | — | $ | — | Payable for unrealized loss on futures variation margin | $ | (21,271 | ) | ||||||
| High Quality Floating Rate | Interest Rate | Receivable for unrealized gain on futures variation margin | 265,795 | Payable for unrealized loss on futures variation margin | (47,729 | ) | ||||||||
| (a) | Includes unrealized gain (loss) on futures contracts described in the Additional Investment Information sections of the Schedules of Investments. Only current day’s variation margin is reported within the Statements of Assets and Liabilities. |
The following table sets forth, by certain risk types, the Funds’ gains (losses) related to these derivatives and their indicative volumes for the six months ended June 30, 2013. These gains (losses) should be considered in the context that these derivative contracts may have been executed to economically hedge certain investments, and accordingly, certain gains (losses) on such derivative contracts may offset certain (losses) gains attributable to investments. These gains (losses) are included in “Net realized gain (loss)” or “Net change in unrealized gain (loss)” on the Statements of Operations:
| CORE FIXED INCOME | ||||||||||||||
| Risk | Statements of Operations | Net Realized Gain (Loss) | Net Change in Unrealized Gain (Loss) | Average Number of Contracts(a) | ||||||||||
Interest Rate | Net realized gain (loss) from futures contracts/Net change in unrealized gain (loss) on futures contracts | $ | (286,872 | ) | $ | 201,335 | 498 | |||||||
Currency | Net realized gain (loss) from forward foreign currency exchange contracts/Net change in unrealized gain (loss) on forward foreign currency exchange contracts | 1,054,431 | 208,425 | 216 | ||||||||||
Total | $ | 767,559 | $ | 409,760 | 714 | |||||||||
| (a) | Average number of contracts is based on the average of month end balances for the six months ended June 30, 2013. |
The following table represents gains (losses) which are included in “Net realized gain (loss) from future transactions” and “Net change in unrealized gain (loss) on futures” in the Statements of Operations:
| Fund | Risk | Net Realized Gain (Loss) | Net Change in Unrealized Gain (Loss) | Average Number of Contracts(a) | ||||||||||||
Equity Index | Equity | $ | 173,807 | $ | (20,764 | ) | 19 | |||||||||
High Quality Floating Rate | Interest Rate | 19,270 | 179,503 | 198 | ||||||||||||
| (a) | Average number of contracts is based on the average of month end balances for the six months ended June 30, 2013. |
58
GOLDMAN SACHS VARIABLE INSURANCE TRUST FUNDS
4. INVESTMENTS IN DERIVATIVES (continued)
In December 2011, the Financial Accounting Standards Board (“FASB”) issued an Accounting Standards Update (“ASU”) No. 2011-11: Disclosures about Offsetting Assets and Liabilities (“netting”) on the Statements of Assets and Liabilities that are subject to master netting arrangements or similar agreements. ASU 2011-11 was amended by ASU No. 2013-01, clarifying which investments and transactions are subject to the netting disclosure. The scope of the disclosure requirements is limited to derivative instruments, repurchase agreements and reverse repurchase agreements, and securities borrowing and securities lending transactions. This information is intended to enable users of the Funds’ financial statements to evaluate the effect or potential effect of netting arrangements on the Funds’ financial position. The ASU is effective for financial statements with fiscal years beginning on or after January 1, 2013, and interim periods within those fiscal years. The Funds adopted the disclosure requirement on netting for the current reporting period. Since these amended principles require additional disclosures concerning offsetting and related arrangements, adoption did not affect the Portfolio’s financial condition or result of operations.
For financial reporting purposes, the Portfolios do not offset financial assets and financial liabilities that are subject to master netting arrangements or similar agreements on the Statement of Assets and Liabilities.
In order to better define its contractual rights and to secure rights that will help a Fund mitigate its counterparty risk, a Fund may enter into an International Swaps and Derivatives Association, Inc. Master Agreement (“ISDA Master Agreement”) or similar agreement with its derivatives counterparties. An ISDA Master Agreement is a bilateral agreement between a Fund and a counterparty that governs OTC derivatives, including foreign exchange contracts, and typically contains, among other things, collateral posting terms and netting provisions in the event of a default and/or termination event. The provisions of the ISDA Master Agreement typically permit a single net payment in the event of a default (close-out netting) or similar event, including the bankruptcy or insolvency of the counterparty.
Collateral and margin requirements differ between exchange traded derivatives and OTC derivatives. Margin requirements are established by the broker or clearing house for exchange-traded and centrally cleared derivatives (financial futures contracts, options and centrally cleared swaps) pursuant to governing agreements for those instrument types. Brokers can ask for margin in excess of the minimum in certain circumstances. Collateral terms are contract-specific for OTC derivatives (foreign currency exchange contracts, options and certain swaps). For derivatives traded under an ISDA Master Agreement, the collateral requirements are typically calculated by netting the mark to market amount for each transaction under such agreement and comparing that amount to the value of any collateral currently pledged by a Fund and the counterparty. Additionally, a Fund may be required to post additional collateral to the counterparty in the form of initial margin, the terms of which would be outlined in the confirmation of the OTC transaction.
For financial reporting purposes, cash collateral that has been pledged to cover obligations of a Fund and cash collateral received from the counterparty, if any, is reported separately on the Statements of Assets and Liabilities as receivables/payables for collateral on certain derivative contracts. Non-cash collateral pledged by a Fund, if any, is noted in the Schedules of Investments. Generally, the amount of collateral due from or to a counterparty must exceed a minimum transfer amount threshold (e.g., $250,000) before a transfer is required to be made. To the extent amounts due to a Fund from its counterparties are not fully collateralized, contractually or otherwise, the Fund bears the risk of loss from counterparty nonperformance. A Fund attempts to mitigate counterparty risk by only entering into agreements with counterparties that it believes to be of good standing and by monitoring the financial stability of those counterparties.
Additionally, the netting of assets and liabilities and the offsetting of collateral pledged or received are based on contractual netting/set-off provisions in the ISDA Master Agreement or similar agreements, however, in the event of a default or insolvency of a counterparty, a court could determine that such rights are not enforceable due the restrictions or prohibitions against the right of setoff that may be imposed due to a particular jurisdiction’s bankruptcy or insolvency laws.
59
GOLDMAN SACHS VARIABLE INSURANCE TRUST FUNDS
Notes to Financial Statements (continued)
June 30, 2013 (Unaudited)
4. INVESTMENTS IN DERIVATIVES (continued)
The following tables set forth the Funds’ net exposure for derivative instruments that are subject to enforceable master netting arrangements or similar agreements as of June 30, 2013:
CORE FIXED INCOME
Offsetting of Derivatives Assets:
| Derivatives | Gross Amount of Recognized Assets | Gross Amounts Offset in the Statement of Assets and Liabilities | Net Amounts of Assets Presented in the Statement of Assets and Liabilities | |||||||||||
| Over the Counter: | ||||||||||||||
Forward Currency Contracts | $ | 291,468 | $ | — | $ | 291,468 | ||||||||
| Exchange Traded: | ||||||||||||||
Futures Contracts | 24,606 | — | 24,606 | |||||||||||
| Total | $ | 316,074 | $ | — | $ | 316,074 | ||||||||
Derivative Assets and Collateral Received by Counterparty:
| Gross Amounts Available for Offset but Not Netted in the Statement of Assets and Liabilities | ||||||||||||||||
| Counterparty | Net Amounts of Assets in the Statement of Assets and | Financial Instruments | Cash Collateral Received | Net Amount(1) | ||||||||||||
| Bank of America NA | $ | 5,307 | $ | — | $ | — | $ | 5,307 | ||||||||
| Barclays Bank PLC | 8,743 | (8,743 | ) | — | — | |||||||||||
| BNP Paribas SA | 3,418 | (3,418 | ) | — | — | |||||||||||
| Citibank NA | 29,563 | (26,079 | ) | — | 3,484 | |||||||||||
| Credit Suisse International | 321 | (321 | ) | — | — | |||||||||||
| Deutsche Bank AG (London) | 10,399 | (10,399 | ) | — | — | |||||||||||
| Goldman Sachs & Co.* | 24,606 | — | — | 24,606 | ||||||||||||
| HSBC Bank PLC | 17,842 | (3,161 | ) | — | 14,681 | |||||||||||
| JPMorgan Chase Bank NA | 60,646 | (10,326 | ) | — | 50,320 | |||||||||||
| Morgan Stanley Co., Inc. | 18,544 | — | — | 18,544 | ||||||||||||
| Royal Bank of Canada | 40,625 | (12,610 | ) | — | 28,015 | |||||||||||
| Royal Bank of Scotland | 6,416 | (5,990 | ) | — | 426 | |||||||||||
| Standard Chartered Bank | 15,005 | — | — | 15,005 | ||||||||||||
| State Street Bank | 4,339 | (4,339 | ) | — | — | |||||||||||
| UBS AG (London) | 5,139 | (5,139 | ) | — | — | |||||||||||
Westpac Banking Corp. | 65,161 | (65,161 | ) | — | — | |||||||||||
| Total | $ | 316,074 | $ | (155,686 | ) | $ | — | $ | 160,388 | |||||||
| * | Exchange Traded Futures — Goldman Sachs & Co. as Futures Commission Merchant |
| (1) | Net amount represents the net amount due from the counterparty in the event of a default based on the contractual set-off rights under the agreement. |
60
GOLDMAN SACHS VARIABLE INSURANCE TRUST FUNDS
4. INVESTMENTS IN DERIVATIVES (continued)
Offsetting of Derivatives Liabilities:
| Derivatives | Gross Amount of Recognized Liabilities | Gross Amounts Offset in the Statement of Assets and Liabilities | Net Amounts of Liabilities Presented in the Statement of Assets and Liabilities | |||||||||||
| Over the Counter: | ||||||||||||||
Forward Currency Contracts | $ | 250,971 | $ | — | $ | 250,971 | ||||||||
Derivative Liabilities and Collateral Pledged by Counterparty:
| Gross Amounts Available for Offset but Not Netted in the Statement of Assets and Liabilities | ||||||||||||||||
| Counterparty | Net Amounts of Liabilities in the Statement of Assets and Liabilities | Financial Instruments | Cash Collateral Pledged | Net Amount(2) | ||||||||||||
| Barclays Bank PLC | $ | 50,974 | $ | (8,743 | ) | $ | — | $ | 42,231 | |||||||
| BNP Paribas SA | 13,766 | (3,418 | ) | — | 10,348 | |||||||||||
| Citibank NA | 26,079 | (26,079 | ) | — | — | |||||||||||
| Credit Suisse International | 3,638 | (321 | ) | — | 3,317 | |||||||||||
| Deutsche Bank AG (London) | 14,518 | (10,399 | ) | — | 4,119 | |||||||||||
| HSBC Bank PLC | 3,161 | (3,161 | ) | — | — | |||||||||||
| JPMorgan Chase Bank NA | 10,326 | (10,326 | ) | — | — | |||||||||||
| Royal Bank of Canada | 12,610 | (12,610 | ) | — | — | |||||||||||
| Royal Bank of Scotland | 5,990 | (5,990 | ) | — | — | |||||||||||
| State Street Bank | 13,421 | (4,339 | ) | — | 9,082 | |||||||||||
| UBS AG (London) | 29,640 | (5,139 | ) | — | 24,501 | |||||||||||
Westpac Banking Corp. | 66,848 | (65,161 | ) | — | 1,687 | |||||||||||
| Total | $ | 250,971 | $ | (155,686 | ) | $ | — | $ | 95,285 | |||||||
| (2) | Net amount represents the net amount due to the counterparty in the event of a default based on the contractual set-off rights under the agreement. |
EQUITY INDEX
Offsetting of Derivatives Liabilities:
| Derivatives | Gross Amount of Recognized Liabilities | Gross Amounts Offset in the Statement of Assets and Liabilities | Net Amounts of Liabilities Presented in the Statement of Assets and Liabilities | |||||||||
| Exchange Traded: | ||||||||||||
Futures Contracts | $ | 5,477 | $ | — | $ | 5,477 | ||||||
Derivative Liabilities and Collateral Pledged by Counterparty:
| Gross Amounts Available for Offset but Not Netted in the Statement of Assets and Liabilities | ||||||||||||||||
| Counterparty | Net Amounts of Liabilities in the Statement of Assets and Liabilities | Financial Instruments | Cash Collateral Pledged | Net Amount(1) | ||||||||||||
J.P. Morgan Securities LLC* | $ | 5,477 | $ | (5,477 | ) | $ | — | $ | — | |||||||
| * | Exchange Traded Futures — J.P. Morgan as Futures Commission Merchant |
| (1) | Net amount represents the net amount due to the counterparty in the event of a default based on the contractual set-off rights under the agreement. |
61
GOLDMAN SACHS VARIABLE INSURANCE TRUST FUNDS
Notes to Financial Statements (continued)
June 30, 2013 (Unaudited)
4. INVESTMENTS IN DERIVATIVES (continued)
HIGH QUALITY FLOATING RATE
Offsetting of Derivatives Liabilities:
| Derivatives | Gross Amount of Recognized Liabilities | Gross Amounts Offset in the Statement of Assets and Liabilities | Net Amounts of Liabilities Presented in the Statement of Assets and Liabilities | |||||||||
| Exchange Traded: | ||||||||||||
Futures Contracts | $ | 5,951 | $ | — | $ | 5,951 | ||||||
Derivative Liabilities and Collateral Pledged by Counterparty:
| Gross Amounts Available for Offset but Not Netted in the Statement of Assets and Liabilities | ||||||||||||||||
| Counterparty | Net Amounts of Liabilities in the Statement of Assets and Liabilities | Financial Instruments | Cash Collateral Pledged | Net Amount(1) | ||||||||||||
| Goldman Sachs & Co.* | $ | 5,951 | $ | — | $ | (5,951 | ) | $ | — | |||||||
| * | Exchange Traded Futures — Goldman Sachs & Co. as Futures Commission Merchant |
| (1) | Net amount represents the net amount due to the counterparty in the event of a default based on the contractual set-off rights under the agreement. |
5. AGREEMENTS AND AFFILIATED TRANSACTIONS
A. Management Agreement — Under the Agreements, GSAM manages the Funds, subject to the general supervision of the Trustees.
As compensation for the services rendered pursuant to the Agreements, the assumption of the expenses related thereto and administration of the Funds’ business affairs, including providing facilities, GSAM is entitled to a management fee, accrued daily and paid monthly, equal to an annual percentage rate of each Fund’s average daily net assets.
For the six months ended June 30, 2013, contractual and effective net management fees with GSAM were at the following rates:
| Contractual Management Fee Rate | ||||||||||||||||||||||||||||
| Fund | First $1 billion | Next $1 billion | Next $3 billion | Next $3 billion | Over $8 billion | Effective Rate | Effective Net Management Fee Rate | |||||||||||||||||||||
| Core Fixed Income | 0.40 | % | 0.36 | % | 0.34 | % | 0.33 | % | 0.32 | % | 0.40 | % | 0.40 | % | ||||||||||||||
| Growth Opportunities | 1.00 | 1.00 | 0.90 | 0.86 | 0.84 | 1.00 | 0.97 | * | ||||||||||||||||||||
| High Quality Floating Rate:** | ||||||||||||||||||||||||||||
| Effective 4/30/2013 | 0.40 | 0.36 | 0.34 | 0.33 | 0.32 | 0.49 | 0.46 | * | ||||||||||||||||||||
| Prior to 4/30/2013 | 0.54 | 0.49 | 0.47 | 0.46 | 0.45 | — | — | |||||||||||||||||||||
| * | GSAM has agreed to waive a portion of its management fee in order to achieve a net effective management fee rates, as defined in the Fund’s most recent prospectuses. These waivers will be effective through at least April 30, 2014, and prior to such date GSAM may not terminate the arrangement without approval of the Trustees. The Effective Net Management Rates above are calculated based on management rates before and after the waivers had been adjusted, if applicable. |
| ** | Effective April 30, 2013, the Fund’s management fee schedule has been reduced, as outlined in the table above. |
62
GOLDMAN SACHS VARIABLE INSURANCE TRUST FUNDS
5. AGREEMENTS AND AFFILIATED TRANSACTIONS (continued)
The Agreement for the Equity Index Fund provides for a contractual management fee at an annual rate equal to 0.30% of the Fund’s average daily net assets. For the six months ended June 30, 2013, GSAM agreed to waive a portion of its management fee in order to achieve the following effective annual rates which will remain in effect through April 30, 2014 and prior to such date GSAM may not terminate the arrangement without the approval of the Trustees:
| Management Rate | ||||||||||||||
| Fund | $0-$400 million | Over $400 million | Effective Rate | |||||||||||
| Equity Index | 0.21 | % | 0.20 | % | 0.21 | % | ||||||||
As authorized by the Agreement, GSAM has entered into a Sub-advisory Agreement with SSgA which serves as the sub-adviser to the Equity Index Fund and provides the day-to-day advice regarding the Fund’s portfolio transactions. As compensation for its services, SSgA is entitled to a fee, accrued daily and paid monthly by GSAM, at the following annual rates of the Fund’s average daily net assets: 0.03% on the first $50 million, 0.02% on the next $200 million, 0.01% on the next $750 million and 0.008% over $1 billion. The effective Sub-advisory fee was 0.02% for the six months ended June 30, 2013.
B. Distribution and Service Plans — The Trust, on behalf of each Fund, has adopted a Distribution and Service Plan (the “Plan”). Under the Plan, Goldman Sachs, which serves as distributor (the “Distributor”), is entitled to a fee accrued daily and paid monthly, for distribution services and personal and account maintenance services, which may then be paid by Goldman Sachs to authorized dealers, equal to, on an annual basis, 0.25% of the Fund’s average daily net assets attributable to Service Shares. For the six months ended June 30, 2013 for the Growth Opportunities Fund, Goldman Sachs agreed to waive distribution and services fees so as not to exceed an annual rate of 0.16% of average daily net assets of the Fund. This distribution and service fee waiver will remain in place through at least April 30, 2014, and prior to such date Goldman Sachs may not terminate the arrangement without the approval of the Trustees.
C. Transfer Agency Agreement — Goldman Sachs also serves as the transfer agent of the Funds for a fee pursuant to a Transfer Agency Agreement. The fees charged for such transfer agency services are accrued daily and paid monthly at an annual rate of 0.02% of the average daily net assets for Institutional and Service Shares.
D. Other Expense Agreements and Affiliated Transactions — GSAM has agreed to limit certain “Other Expense” of the Funds (excluding transfer agent fees and expenses, taxes, interest, brokerage fees, litigation, indemnification, shareholder meeting and other extraordinary expenses) to the extent such expenses exceed, on an annual basis, a percentage rate of the average daily net assets of each Fund. Such Other Expense reimbursements, if any, are accrued daily and paid monthly. In addition, the Funds are not obligated to reimburse GSAM for prior fiscal year expense reimbursements, if any. The Other Expense limitations as an annual percentage rate of average daily net assets for Core Fixed Income, Equity Index, Growth Opportunities and High Quality Floating Rate Funds are 0.004%, 0.004%, 0.004% and 0.074%, respectively. Prior to April 30, 2013, the Other Expense limitation for High Quality Floating Rate Fund was 0.004%. These Other Expense limitations will remain in place through at least April 30, 2014, and prior to such date GSAM may not terminate the arrangements without the approval of the Trustees. In addition, the Funds have entered into certain offset arrangements with the custodian and the transfer agent, which may result in a reduction of the Funds’ expenses and are received irrespective of the application of the “Other Expense” limitations described above.
63
GOLDMAN SACHS VARIABLE INSURANCE TRUST FUNDS
Notes to Financial Statements (continued)
June 30, 2013 (Unaudited)
5. AGREEMENTS AND AFFILIATED TRANSACTIONS (continued)
For the six months ended June 30, 2013, these expense reductions, including any fee waivers and Other Expense reimbursements, were as follows:
| Fund | Management Fee Waiver | Distribution and Service Fee Waiver | Custody Fee Credits | Other Expense Reimbursement | Total Expense Reductions | |||||||||||||||
| Core Fixed Income | $ | — | $ | — | $ | 4,396 | $ | 123,291 | $ | 127,687 | ||||||||||
| Equity Index | 79,381 | — | 294 | 145,302 | 224,977 | |||||||||||||||
| Growth Opportunities | 27,180 | 81,538 | 1,087 | 88,145 | 197,950 | |||||||||||||||
| High Quality Floating Rate | 10,512 | — | 8,609 | 96,227 | 115,348 | |||||||||||||||
As of June 30, 2013, the amounts owed to affiliates of the Funds were as follows:
| Fund | Management Fees | Distribution and Service Fees | Transfer Agent Fees | Total | ||||||||||||
| Core Fixed Income | $ | 41,626 | $ | 26,011 | $ | 2,081 | $ | 69,718 | ||||||||
| Equity Index | 30,950 | 36,846 | 2,948 | 70,744 | ||||||||||||
| Growth Opportunities | 146,647 | 24,185 | 3,023 | 173,855 | ||||||||||||
| High Quality Floating Rate | 17,627 | 14,213 | 1,137 | 32,977 | ||||||||||||
E. Line of Credit Facility — As of June 30, 2013, the Funds participated in a $780,000,000 committed, unsecured revolving line of credit facility (the “facility”) together with other funds of the Trust and registered investment companies having management agreements with GSAM or its affiliates (“Other Borrowers”). Pursuant to the terms of the facility, the Funds and Other Borrowers could increase the credit amount by an additional $220,000,000, for a total of up to $1,000,000,000. This facility is to be used solely for temporary or emergency purposes, which may include the funding of redemptions. The interest rate on borrowings is based on the federal funds rate. The facility also requires a fee to be paid by the Funds based on the amount of the commitment that has not been utilized. For the six months ended June 30, 2013, the Funds did not have any borrowings under the facility. Prior to May 8, 2013, the committed amount available through the facility was $630,000,000.
F. Other Transactions with Affiliates — For the six months ended June 30, 2013, Goldman Sachs earned $5 and $1,006 in brokerage commissions from portfolio transactions, including futures transactions executed with Goldman Sachs as the Futures Commission Merchant, on behalf of the Equity Index and Growth Opportunities Funds, respectively.
The following table provides information about the investment in shares of issuers of which a Fund is an affiliate for the six months ended June 30, 2013:
| Fund | Name of Affiliated Issuer | Number of Shares Held Beginning of Period | Shares Bought | Shares Sold | Number of Shares Held End of Period | Value at End of Year | Dividend Income | |||||||||||||||||||||
| Equity Index | The Goldman Sachs Group, Inc. | 5,761 | — | (470 | ) | 5,291 | $ | 800,264 | $ | 5,547 | ||||||||||||||||||
64
GOLDMAN SACHS VARIABLE INSURANCE TRUST FUNDS
6. PORTFOLIO SECURITIES TRANSACTIONS
The cost of purchases and proceeds from sales and maturities of long-term securities for the six months ended June 30, 2013, were as follows:
| Fund | Purchases of U.S. Government and Agency Obligations | Purchases (Excluding U.S. Government and Agency Obligations) | Sales and Maturities of U.S. Government and Agency Obligations | Sales and Maturities (Excluding U.S. Government and Agency Obligations) | ||||||||||||
| Core Fixed Income | $ | 430,968,033 | $ | 21,242,085 | $ | 426,180,390 | $ | 34,022,194 | ||||||||
| Equity Index | — | 1,318,232 | — | 13,274,867 | ||||||||||||
| Growth Opportunities | — | 36,470,766 | — | 43,342,345 | ||||||||||||
| High Quality Floating Rate | 271,174,883 | 26,347,522 | 295,589,717 | 5,665,452 | ||||||||||||
7. TAX INFORMATION
As of the Funds’ most recent fiscal year end, December 31, 2012, the Funds’ capital loss carryforwards and certain timing differences on a tax-basis were as follows:
| Core Fixed Income | Equity Index | Growth Opportunities | High Quality Floating Rate | |||||||||||||
| Capital loss carryforwards:(1) | ||||||||||||||||
Expiring 2017 | $ | (1,103,983 | ) | $ | (641,986 | ) | $ | — | $ | — | ||||||
Expiring 2018 | (4,488,774 | ) | — | — | — | |||||||||||
| Total capital loss carryforwards | $ | (5,592,757 | ) | $ | (641,986 | ) | $ | — | $ | — | ||||||
| Timing differences (Qualified late year loss and straddle loss deferrals and deferred dividend) | (349,074 | ) | 713 | (34,054 | ) | (511,071 | ) | |||||||||
| (1) | Expiration occurs on December 31 of the year indicated. |
As of June 30, 2013, the Funds’ aggregate security unrealized gains and losses based on cost for U.S. federal income tax purposes were as follows:
| Core Fixed Income | Equity Index | Growth Opportunities | High Quality Floating Rate | |||||||||||||
| Tax cost | $ | 131,035,225 | $ | 129,737,310 | $ | 143,241,138 | $ | 69,978,358 | ||||||||
| Gross unrealized gain | 2,374,561 | 68,311,161 | 41,638,007 | 248,968 | ||||||||||||
| Gross unrealized loss | (2,648,407 | ) | (22,178,727 | ) | (2,964,512 | ) | (401,015 | ) | ||||||||
| Net unrealized security gain(loss) | $ | (273,846 | ) | $ | 46,132,434 | $ | 38,673,495 | $ | (152,047 | ) | ||||||
The difference between GAAP-basis and tax-basis unrealized gains (losses) is attributable primarily to wash sales, net mark to market gains (losses) on regulated futures and forward foreign currency exchange contracts and differences related to the tax treatment of underlying fund investments, real estate investment trust investments, and securities on loan.
GSAM has reviewed the Funds’ tax positions for all open tax years (the current and prior three years, as applicable) and has concluded that no provision for income tax is required in the Funds’ financial statements. Such open tax years remain subject to examination and adjustment by tax authorities.
65
GOLDMAN SACHS VARIABLE INSURANCE TRUST FUNDS
Notes to Financial Statements (continued)
June 30, 2013 (Unaudited)
8. OTHER RISKS
The Funds’ risks include, but are not limited to, the following:
Shareholder Concentration Risk — Certain funds, accounts, individuals or Goldman Sachs affiliates may from time to time own (beneficially or of record) or control a significant percentage of the Funds’ shares. Redemptions by these entities of their holdings in the Funds may impact the Funds’ liquidity and NAV. These redemptions may also force the Funds to sell securities.
Liquidity Risk — The Funds may make investments that are illiquid or that may become less liquid in response to market developments or adverse investor perceptions. Illiquid investments may be more difficult to value. Liquidity risk may also refer to the risk that a Fund will not be able to pay redemption proceeds within the allowable time period because of unusual market conditions, an unusually high volume of redemption requests, or other reasons. To meet redemption requests, a Fund may be forced to sell investments at an unfavorable time and/or under unfavorable conditions.
Market and Credit Risks — In the normal course of business, the Funds trade financial instruments and enter into financial transactions where risk of potential loss exists due to changes in the market (market risk). Additionally, the Funds may also be exposed to credit risk in the event that an issuer fails to perform or that an institution or entity with which the Funds have unsettled or open transactions defaults.
9. INDEMNIFICATIONS
Under the Trust’s organizational documents, its Trustees, officers, employees and agents are indemnified, to the extent permitted by the Act and state law, against certain liabilities that may arise out of performance of their duties to the Funds. Additionally, in the course of business, the Funds enter into contracts that contain a variety of indemnification clauses. The Funds’ maximum exposure under these arrangements is unknown, as this would involve future claims that may be made against the Funds that have not yet occurred. However, GSAM believes the risk of loss under these arrangements to be remote.
10. SUBSEQUENT EVENTS
Subsequent events after the Statements of Assets and Liabilities date have been evaluated through the date the financial statements were issued. GSAM has concluded that there is no impact requiring adjustment or disclosure in the financial statements.
66
GOLDMAN SACHS VARIABLE INSURANCE TRUST FUNDS
11. SUMMARY OF SHARE TRANSACTIONS
Share activity is as follows:
| Core Fixed Income Fund | ||||||||||||||||
| For the Six Months Ended June 30, 2013 (Unaudited) | For the Fiscal Year Ended December 31, 2012 | |||||||||||||||
| Shares | Dollars | Shares | Dollars | |||||||||||||
| Institutional Shares(a) | ||||||||||||||||
| Shares sold | 2,291 | $ | 25,000 | — | $ | — | ||||||||||
| Reinvestment of distributions | 14 | 146 | — | — | ||||||||||||
| 2,305 | 25,146 | — | — | |||||||||||||
| Service Shares | ||||||||||||||||
| Shares sold | 281,720 | 3,042,142 | 786,585 | 8,361,507 | ||||||||||||
| Reinvestment of distributions | 162,192 | 1,730,621 | 304,260 | 3,241,836 | ||||||||||||
| Shares redeemed | (993,694 | ) | (10,748,540 | ) | (2,842,488 | ) | (30,344,108 | ) | ||||||||
| (549,782 | ) | (5,975,777 | ) | (1,751,643 | ) | (18,740,765 | ) | |||||||||
| NET DECREASE | (547,477 | ) | $ | (5,950,631 | ) | (1,751,643 | ) | $ | (18,740,765 | ) | ||||||
Share activity is as follows:
| Equity Index Fund | ||||||||||||||||
| For the Six Months Ended June 30, 2013 (Unaudited) | For the Fiscal Year Ended December 31, 2012 | |||||||||||||||
| Shares | Dollars | Shares | Dollars | |||||||||||||
| Service Shares | ||||||||||||||||
| Shares sold | 115,711 | $ | 1,335,342 | 212,773 | $ | 2,183,506 | ||||||||||
| Reinvestment of distributions | — | — | 290,291 | 3,068,378 | ||||||||||||
| Shares redeemed | (1,237,042 | ) | (14,335,902 | ) | (2,849,794 | ) | (29,287,642 | ) | ||||||||
| NET DECREASE | (1,121,331 | ) | $ | (13,000,560 | ) | (2,346,730 | ) | $ | (24,035,758 | ) | ||||||
| (a) | Commenced operations on April 30, 2013. |
67
GOLDMAN SACHS VARIABLE INSURANCE TRUST FUNDS
Notes to Financial Statements (continued)
June 30, 2013 (Unaudited)
11. SUMMARY OF SHARE TRANSACTIONS (continued)
Share activity is as follows:
| Growth Opportunities Fund | ||||||||||||||||
| For the Six Months Ended June 30, 2013 (Unaudited) | For the Fiscal Year Ended December 31, 2012 | |||||||||||||||
| Shares | Dollars | Shares | Dollars | |||||||||||||
| Institutional Shares(a) | ||||||||||||||||
| Shares sold | 3,264 | $ | 25,000 | — | $ | — | ||||||||||
| 3,264 | 25,000 | — | — | |||||||||||||
| Service Shares | ||||||||||||||||
| Shares sold | 656,404 | 4,947,427 | 837,085 | 5,879,360 | ||||||||||||
| Reinvestment of distributions | — | — | 2,112,565 | 14,534,448 | ||||||||||||
| Shares redeemed | (1,701,049 | ) | (12,771,116 | ) | (3,270,859 | ) | (23,461,412 | ) | ||||||||
| (1,044,645 | ) | (7,823,689 | ) | (321,209 | ) | (3,047,604 | ) | |||||||||
| NET DECREASE | (1,041,381 | ) | $ | (7,798,689 | ) | (321,209 | ) | $ | (3,047,604 | ) | ||||||
| (a) | Commenced operations on April 30, 2013. |
68
GOLDMAN SACHS VARIABLE INSURANCE TRUST FUNDS
11. SUMMARY OF SHARE TRANSACTIONS (continued)
Share activity is as follows:
| High Quality Floating Rate Fund | ||||||||||||||||
| For the Six Months Ended June 30, 2013 (Unaudited) | For the Fiscal Year Ended December 31, 2012 | |||||||||||||||
| Shares | Dollars | Shares | Dollars | |||||||||||||
| Institutional Shares(a) | ||||||||||||||||
| Shares sold | 2,368 | $ | 25,000 | — | $ | — | ||||||||||
| Reinvestment of distributions | 4 | 44 | — | — | ||||||||||||
| 2,372 | 25,044 | — | — | |||||||||||||
| Service Shares | ||||||||||||||||
| Shares sold | 760,572 | 8,016,552 | 1,391,077 | 15,052,010 | ||||||||||||
| Reinvestment of distributions | 25,404 | 266,963 | 248,434 | 2,633,869 | ||||||||||||
| Shares redeemed | (680,833 | ) | (7,171,890 | ) | (1,416,700 | ) | (15,310,789 | ) | ||||||||
| 105,143 | 1,111,625 | 222,811 | 2,375,090 | |||||||||||||
| NET INCREASE | 107,515 | $ | 1,136,669 | 222,811 | $ | 2,375,090 | ||||||||||
| (a) | Commenced operations on April 30, 2013. |
69
GOLDMAN SACHS VARIABLE INSURANCE TRUST FUNDS
| Fund Expenses — Six Month Period Ended June 30, 2013 (Unaudited) |
As a shareholder of Institutional or Service Shares of a Fund, you incur ongoing costs, including management fees, distribution and service (12b-1) fees (with respect to Service Shares) and other Fund expenses. This example is intended to help you understand your ongoing costs (in dollars) of investing in the Institutional Shares and Service Shares of the Funds and to compare these costs with the ongoing costs of investing in other mutual funds.
The example is based on an investment of $1,000 invested at the beginning of the period and held for the entire period from January 1, 2013 through June 30, 2013.
Actual Expenses — The first line under each share class in the table below provides information about actual account values and actual expenses. You may use the information in this line, together with the amount you invested, to estimate the expenses that you paid over the period. Simply divide your account value by $1,000 (for example, an $8,600 account value divided by $1,000=8.6), then multiply the result by the number in the first line under the heading entitled “Expenses Paid” to estimate the expenses you paid on your account during this period.
Hypothetical Example for Comparison Purposes — The second line under each share class in the table below provides information about hypothetical account values and hypothetical expenses based on the Funds’ actual net expense ratio and an assumed rate of return of 5% per year before expenses, which is not the Funds’ actual return. The hypothetical account values and expenses may not be used to estimate the actual ending account balance or expenses you paid for the period. You may use this information to compare the ongoing costs of investing in the Funds and other funds. To do so, compare this 5% hypothetical example with the 5% hypothetical examples that appear in the shareholder reports of the other funds.
Please note that the expenses shown in the table are meant to highlight your ongoing costs only. As a shareholder of the Fund you do not incur any transaction costs, such as sales charges, redemption fees, or exchange fees, but shareholders of other funds may incur such costs. The second line of the table is useful in comparing ongoing costs only, and will not help you determine the relative total costs of owning different funds whose shareholders may incur transaction costs.
| Core Fixed Income Fund | Equity Index Fund | Growth Opportunities Fund | High Quality Floating Rate Fund | |||||||||||||||||||||||||||||||||||||||||||||
| Share Class | Beginning Account Value 1/01/13 | Ending Account Value 6/30/13 | Expenses Paid for the 6 Months Ended 6/30/13* | Beginning Account Value 1/01/13 | Ending Account Value 6/30/13 | Expenses Paid for the 6 Months Ended 6/30/13* | Beginning Account Value 1/01/13 | Ending Account Value 6/30/13 | Expenses Paid for the 6 Months Ended 6/30/13* | Beginning Account Value 1/01/13 | Ending Account Value 6/30/13 | Expenses Paid for the 6 Months Ended 6/30/13* | ||||||||||||||||||||||||||||||||||||
| Institutional(a) | ||||||||||||||||||||||||||||||||||||||||||||||||
Actual | $ | 1,000 | $ | 966.40 | $ | 0.67 | N/A | N/A | N/A | $ | 1,000 | $ | 1,002.60 | $ | 1.66 | $ | 1,000 | $ | 998.90 | $ | 0.63 | |||||||||||||||||||||||||||
Hypothetical 5% return | 1,000 | 1,022.76 | + | 2.06 | N/A | N/A | N/A | 1,000 | 1,019.89 | + | 4.96 | 1,000 | 1,022.91 | 1.91 | ||||||||||||||||||||||||||||||||||
| Service | ||||||||||||||||||||||||||||||||||||||||||||||||
Actual | $ | 1,000 | $ | 976.30 | $ | 3.28 | $ | 1,000 | $ | 1,135.70 | $ | 2.54 | $ | 1,000 | $ | 1,108.20 | $ | 6.01 | $ | 1,000 | $ | 999.20 | $ | 3.62 | ||||||||||||||||||||||||
Hypothetical 5% return | 1,000 | 1,021.47 | + | 3.36 | 1,000 | 1,022.41 | + | 2.41 | 1,000 | 1,019.09 | + | 5.76 | 1,000 | 1,021.17 | + | 3.66 | ||||||||||||||||||||||||||||||||
| (a) | Commenced operations on April 30, 2013 |
| * | Expenses are calculated using each Fund’s annualized net expense ratio for each class, which represents the ongoing expenses as a percentage of net assets for the six months ended June 30, 2013. Expenses are calculated by multiplying the annualized net expense ratio by the average account value for the period; then multiplying the result by the number of days in the most recent fiscal half year; and then dividing that result by the number of days in the fiscal year. The annualized net expense ratios for the period were as follows: |
| Fund | Institutional | Service | ||||||
| Core Fixed Income | 0.41 | % | 0.67 | % | ||||
| Equity Index | N/A | 0.48 | ||||||
| Growth Opportunities | 0.99 | 1.15 | ||||||
| High Quality Floating Rate | 0.38 | 0.73 | ||||||
| + | Hypothetical expenses are based on each Fund’s actual annualized net expense ratios and an assumed rate of return of 5% per year before expenses. |
70
GOLDMAN SACHS VARIABLE INSURANCE TRUST FUNDS
Statement Regarding Basis for Approval of Management Agreements (Unaudited)
Background
The Goldman Sachs Core Fixed Income, Goldman Sachs Equity Index, Goldman Sachs Growth Opportunities and Goldman Sachs High Quality Floating Rate (formerly, Goldman Sachs Government Income) Funds (the “Funds”) are investment portfolios of Goldman Sachs Variable Insurance Trust (the “Trust”). The Board of Trustees oversees the management of the Trust and reviews the investment performance and expenses of the Funds at regularly scheduled meetings held during the year. In addition, the Board of Trustees determines annually whether to approve the continuance of the Trust’s investment management agreements (the “Management Agreements”) with Goldman Sachs Asset Management, L.P. (the “Investment Adviser”) on behalf of the Funds and the sub-advisory agreement (the “Sub-Advisory Agreement,” and together with the Management Agreements, the “Agreements”) between the Investment Adviser and SSgA Funds Management, Inc. (the “Sub-Adviser”) on behalf of the Equity Index Fund.
The Agreements were most recently approved for continuation until June 30, 2014 by the Board of Trustees, including those Trustees who are not parties to the Agreements or “interested persons” (as defined in the Investment Company Act of 1940, as amended) of any party thereto (the “Independent Trustees”), at a meeting held on June 12-13, 2013 (the “Annual Meeting”).
The review process undertaken by the Trustees spans the course of the year and culminates with the Annual Meeting. To assist the Trustees in their deliberations, the Trustees have established a Contract Review Committee (the “Committee”), comprised of the Independent Trustees. The Committee held four meetings over the course of the year since the Agreements were last approved. At those Committee meetings, regularly scheduled Board or other committee meetings and/or the Annual Meeting, the Board, or the Independent Trustees, as applicable, considered matters relating to the Management Agreements, including:
| (a) | the nature and quality of the advisory, administrative and other services provided to the Funds by the Investment Adviser and its affiliates, including information about: |
| (i) | the structure, staff and capabilities of the Investment Adviser and its portfolio management teams; |
| (ii) | the groups within the Investment Adviser and its affiliates that support the portfolio management teams or provide other types of necessary services, including fund services groups (e.g., accounting and financial reporting, tax, shareholder services and operations), controls and risk management groups (e.g., legal, compliance, valuation oversight, credit risk management, internal audit, compliance testing, market risk analysis, finance and strategy and central funding), sales and distribution support groups and others (e.g., information technology and training); |
| (iii) | trends in headcount; |
| (iv) | the Investment Adviser’s financial resources and ability to hire and retain talented personnel and strengthen its operations; and |
| (v) | the parent company’s support of the Investment Adviser and its mutual fund business, as expressed by the firm’s senior management; |
| (b) | information on the investment performance of the Funds, including comparisons to the performance of a group of similar mutual funds, as provided by a third party mutual fund data provider engaged as part of the contract review process (the “Outside Data Provider”), and benchmark performance indices, and (for Core Fixed Income and Growth Opportunities Funds) comparable institutional composites managed by the Investment Adviser, and general investment outlooks in the markets in which the Funds invest; |
| (c) | the terms of the Agreements and agreements with affiliated service providers entered into by the Trust on behalf of the Funds; |
| (d) | expense information for the Funds, including: |
| (i) | the relative management fee and expense levels of the Funds as compared to those of comparable funds managed by other advisers, as provided by the Outside Data Provider; |
| (ii) | each Fund’s expense trends over time; and |
| (iii) | to the extent the Investment Adviser manages institutional accounts or collective investment vehicles having investment objectives and policies similar to those of the Funds, comparative information on the advisory fees charged and services provided to those accounts by the Investment Adviser; |
| (e) | with respect to the extensive investment performance and expense comparison data provided by the Outside Data Provider, its processes in producing that data for the Funds; |
| (f) | the undertakings of the Investment Adviser to waive certain fees (with respect to Equity Index Fund and Growth Opportunities Fund) and limit certain expenses of each of the Funds that exceed specified levels; the undertaking of Goldman, Sachs & Co. (“Goldman Sachs”), the Funds’ affiliated distributor, to waive a portion of the distribution and service fees payable by the Growth Opportunities Fund’s Service Shares; and a summary of contractual fee reductions made by the Investment Adviser and its affiliates over the past several years with respect to the Funds; |
71
GOLDMAN SACHS VARIABLE INSURANCE TRUST FUNDS
Statement Regarding Basis for Approval of Management Agreements (Unaudited) (continued)
| (g) | information relating to the profitability of the Management Agreements and the transfer agency and distribution and service arrangements of each of the Funds and the Trust as a whole to the Investment Adviser and its affiliates; |
| (h) | whether each Fund’s existing management fee schedule adequately addressed any economies of scale; |
| (i) | a summary of the “fall-out” benefits derived by the Investment Adviser and its affiliates from their relationships with the Funds, including the fees received by the Investment Adviser’s affiliates from the Funds for transfer agency, portfolio trading, distribution and other services; |
| (j) | a summary of potential benefits derived by the Funds as a result of their relationship with the Investment Adviser; |
| (k) | information regarding commissions paid by the Growth Opportunities and Equity Index Funds (the “Equity Funds”) and broker oversight, an update on the Investment Adviser’s soft dollars practices (with respect to the Growth Opportunities Fund), and other information regarding portfolio trading and how the Investment Adviser carries out its duty to seek best execution; |
| (l) | the manner in which portfolio manager compensation is determined, and the number and types of accounts managed by the portfolio managers; |
| (m) | the nature and quality of the services provided to the Funds by their unaffiliated service providers (including the Equity Index Fund’s Sub-Adviser), and the Investment Adviser’s general oversight and evaluation (including reports on due diligence) of those service providers as part of the administration services provided under the Management Agreements; and |
| (n) | the Investment Adviser’s processes and policies addressing various types of potential conflicts of interest; its approach to risk management; the annual review of the effectiveness of the Funds’ compliance program; and periodic compliance reports. |
The Trustees also received an overview of the Funds’ distribution arrangements. They received information regarding the Funds’ assets, share purchase and redemption activity and the payment of Rule 12b-1 distribution and service fees by the Funds’ Service Shares. Information was also provided to the Trustees relating to revenue sharing payments made by and services provided by the Investment Adviser and its affiliates to intermediaries that promote the sale, distribution and/or servicing of Fund shares.
The presentations made at the Board and Committee meetings and at the Annual Meeting encompassed the Funds and other mutual fund portfolios for which the Board of Trustees has responsibility. In evaluating the Management Agreements at the Annual Meeting, the Trustees relied upon their knowledge, resulting from their meetings and other interactions throughout the year, of the Investment Adviser, its affiliates, their services and the Funds. In conjunction with these meetings, the Trustees received written materials and oral presentations on the topics covered, and were advised by their independent legal counsel regarding their responsibilities and other regulatory requirements related to the approval and continuation of mutual fund investment management agreements under applicable law. In addition, the Investment Adviser and its affiliates provided the Independent Trustees with a written response to a formal request for information sent on behalf of the Independent Trustees by their independent legal counsel. During the course of their deliberations, the Independent Trustees met in executive sessions with their independent legal counsel, without representatives of the Investment Adviser or its affiliates present. The Independent Trustees also discussed the broad range of other investment choices that are available to Fund investors, including the availability of comparable funds managed by other advisers.
Nature, Extent and Quality of the Services Provided Under the Management Agreements
As part of their review, the Trustees considered the nature, extent and quality of the services provided by the Investment Adviser. In this regard, the Trustees considered both the investment advisory services and non-advisory services (including, with respect to the Equity Index Fund, the Investment Adviser’s oversight of the Sub-Adviser) that are provided to the Funds by the Investment Adviser and its affiliates. The Trustees noted the transition in the leadership and changes in personnel of various of the Investment Adviser’s portfolio management teams that had occurred in recent periods, and the ongoing recruitment efforts aimed at bringing high quality investment talent to the Investment Adviser. The Trustees concluded that the Investment Adviser continued to commit substantial financial and operational resources to the Funds and expressed confidence that the Investment Adviser would continue to do so in the future. The Trustees also recognized that the Investment Adviser had made significant commitments to address regulatory compliance requirements applicable to the Funds and the Investment Adviser.
Investment Performance
The Trustees also considered the investment performance of the Funds. In this regard, they compared the investment performance of each Fund to its peers using rankings and ratings compiled by the Outside Data Provider as of December 31, 2012, and updated performance information prepared by the Investment Adviser using the peer groups identified by the Outside Data
72
GOLDMAN SACHS VARIABLE INSURANCE TRUST FUNDS
Statement Regarding Basis for Approval of Management Agreements (Unaudited) (continued)
Provider as of March 31, 2013. The information on each Fund’s investment performance was provided for the one-, three- and five-year periods ending on the applicable dates. The Trustees also reviewed each Fund’s investment performance over time (including on a year-by-year basis) relative to its performance benchmark. In addition, they considered the investment performance trends of the Funds over time, and reviewed the investment performance of each Fund in light of its investment objective and policies and market conditions. The Trustees also received information comparing the Core Fixed Income and Growth Opportunities Funds’ performance to that of comparable institutional composites managed by the Investment Adviser.
In addition, the Trustees considered materials prepared and presentations made by the Investment Adviser’s senior management and portfolio management personnel, in which Fund performance was assessed. The Trustees also considered the Investment Adviser’s periodic reports with respect to the Funds’ risk profiles, and how the Investment Adviser’s approach to risk monitoring and management influences portfolio management.
The Trustees observed that the Core Fixed Income Fund’s Service Shares had placed in the top half of the Fund’s peer group for the one- and three-year periods and in the third quartile for the five-year period, and had outperformed the Fund’s benchmark index for the one-, three-, and five-year periods ended March 31, 2013. They noted that the High Quality Floating Rate Fund’s Service Shares had placed in the top half of the Fund’s peer group for the five-year period and in the third quartile for the one- and three-year periods, and had outperformed the Fund’s benchmark index for the one-, three-, and five-year periods ended March 31, 2013. The Trustees also noted the addition of certain key hires to the portfolio management team of the Core Fixed Income and High Quality Floating Rate Funds (the “Fixed Income Funds”) in 2012.
The Trustees observed that the Equity Index Fund’s Service Shares had placed in the top half of the Fund’s peer group and underperformed the Fund’s benchmark index for the one-, three-, and five-year periods ended March 31, 2013. The Trustees noted that the Growth Opportunities Fund’s Service Shares had placed in the top half of the Fund’s peer group for the one-, three-, and five-year periods, and had outperformed the Fund’s benchmark index for the five-year period and underperformed for the one- and three-year periods ended March 31, 2013. The Trustees noted that the Growth Opportunities Fund experienced improved performance for the one-year period ended March 31, 2013. They considered the effects of certain personnel and process enhancements made at the end of 2011, as well as the addition of certain key hires to the portfolio management team, but noted the departure of several senior portfolio management personnel in April 2013.
Costs of Services Provided and Competitive Information
The Trustees considered the contractual terms of the Agreements and the fee rates payable by each Fund under its respective Management Agreement and payable by the Investment Adviser under the Sub-Advisory Agreement. In this regard, the Trustees considered information on the services rendered by the Investment Adviser to the Funds which included both advisory and administrative services that were directed to the needs and operations of the Funds as registered mutual funds.
In particular, the Trustees reviewed analyses prepared by the Outside Data Provider regarding the expense rankings of the Funds. The analyses provided a comparison of the Funds’ management fees and breakpoints (as applicable) to those of relevant peer groups and category universes; an expense analysis which compared each Fund’s overall net and gross expenses to a peer group and a category universe; and a five-year history comparing each Fund’s net expenses to the peer and category medians. The analyses also compared each Fund’s transfer agency, custody, and distribution fees, other expenses and fee waivers/reimbursements to those of the peer group and category medians. The Trustees concluded that the comparisons provided by the Outside Data Provider were useful in evaluating the reasonableness of the management fees and total expenses paid by the Funds.
In addition, the Trustees considered the Investment Adviser’s undertakings to waive a portion of the contractual management fees paid by the Equity Index Fund and Growth Opportunities Fund and to limit certain expenses of each of the Funds that exceed specified levels, as well as Goldman Sachs’ undertaking to waive a portion of the distribution and service fees paid by the Growth Opportunities Fund���s Service Shares. They also considered, to the extent that the Investment Adviser manages institutional accounts or collective investment vehicles having investment objectives and policies similar to those of the Funds, comparative fee information for services provided by the Investment Adviser to those accounts, and information that indicated that services provided to the Funds differed in various significant respects from the services provided to institutional accounts, which generally operated under less stringent legal and regulatory structures, required fewer services from the Investment Adviser to a smaller number of client contact points, were less time-intensive and paid lower fees.
In addition, the Trustees noted that shareholders are able to redeem their Fund shares at any time if they believe that the Fund fees and expenses are too high or if they are dissatisfied with the performance of the Fund.
73
GOLDMAN SACHS VARIABLE INSURANCE TRUST FUNDS
Statement Regarding Basis for Approval of Management Agreements (Unaudited) (continued)
Profitability
The Trustees reviewed the Investment Adviser’s revenues and pre-tax profit margins with respect to the Trust and each of the Funds. In this regard the Trustees noted that they had received, among other things, profitability analyses and summaries, revenue and expense schedules by Fund and by function (i.e., investment management, transfer agency and distribution and service) and the Investment Adviser’s expense allocation methodology. They observed that the profitability and expense figures are substantially similar to those used by the Investment Adviser for many internal purposes, including compensation decisions among various business groups, and are thus subject to a vigorous internal debate about how certain revenue and expenses should be allocated. The Trustees also reviewed the report of the internal audit group within the Goldman Sachs organization, which included an assessment of the reasonableness and consistency of the Investment Adviser’s expense allocation methodology and an evaluation of the accuracy of the Investment Adviser’s profitability analysis calculations. Profitability data for the Trust and each Fund were provided for 2012 and 2011, and the Trustees considered this information in relation to the Investment Adviser’s overall profitability. The Trustees considered the Investment Adviser’s revenues and pre-tax profit margins both in absolute terms and in comparison to information on the reported pre-tax profit margins earned by certain other asset management firms.
Economies of Scale
The Trustees considered the information that had been provided regarding the Investment Adviser’s profitability. The Trustees also considered the breakpoints in the fee rate payable under the Management Agreement for each of the Core Fixed Income, Growth Opportunities and High Quality Floating Rate Funds at the following annual percentage rates of the average daily net assets of the Funds:
Core Fixed Income Fund | Growth Opportunities Fund | High Quality Floating Rate Fund | ||||||||||
| First $1 billion | 0.40 | % | 1.00 | % | 0.40 | % | ||||||
| Next $1 billion | 0.36 | 1.00 | 0.36 | |||||||||
| Next $3 billion | 0.34 | 0.90 | 0.34 | |||||||||
| Next $3 billion | 0.33 | 0.86 | 0.33 | |||||||||
| Over $8 billion | 0.32 | 0.84 | 0.32 | |||||||||
The Trustees noted that the breakpoints were meant to share potential economies of scale, if any, with the Funds and their shareholders as assets under management reach those asset levels. The Trustees considered the amounts of assets in the Funds; the Funds’ recent share purchase and redemption activity; the information provided by the Investment Adviser relating to the costs of the services provided by the Investment Adviser and its affiliates and their realized profits; information comparing fee rates charged by the Investment Adviser with fee rates charged to other funds in the peer groups; and the Investment Adviser’s undertakings to waive certain fees (with respect to the Equity Index Fund and Growth Opportunities Fund) and limit certain expenses of each of the Funds that exceed specified levels. Upon reviewing these matters at the Annual Meeting, the Trustees concluded that the fee breakpoints represented a means of assuring that benefits of scalability, if any, would be passed along to shareholders at the specified asset levels.
With respect to the Equity Index Fund, the Trustees noted that, while its Management Agreement did not have breakpoints, the Investment Adviser had agreed to waive fees in order to achieve the following effective annual rates: 0.21% on the first $400 million of average daily net assets and 0.20% of average daily net assets in excess of $400 million. The Trustees considered the amounts of assets in the Fund; the Fund’s recent share purchase and redemption activity; the information provided by the Investment Adviser relating to the costs of the services provided by the Investment Adviser and its affiliates and their realized profits; and information comparing the contractual fee rate charged by the Investment Adviser with fee rates charged by other, unaffiliated investment managers to other funds in the peer group. The Trustees noted that, in addition to the Investment Adviser’s management fee waiver mentioned above, the Fund’s total expenses were further reduced by the Investment Adviser’s undertaking to limit certain expenses of the Fund that exceed a specified level.
74
GOLDMAN SACHS VARIABLE INSURANCE TRUST FUNDS
Statement Regarding Basis for Approval of Management Agreements (Unaudited) (continued)
The Trustees also considered and approved the following breakpoints in the contractual fee rate (paid by the Investment Adviser) in the Sub-Advisory Agreement:
Equity Index Fund (Sub-Advisory Fee) | ||||
| First $50 million | 0.03 | % | ||
| Next $200 million | 0.02 | |||
| Next $750 million | 0.01 | |||
| Over $1 billion | 0.008 | |||
With respect to the Equity Index Fund, the Independent Trustees also considered the relationship between the advisory and sub-advisory fee rate schedules and an explanation of asymmetrical waivers and breakpoints that had been provided by the Investment Adviser.
Other Benefits to the Investment Adviser and Its Affiliates
The Trustees also considered the other benefits derived by the Investment Adviser and its affiliates from their relationship with the Funds as stated above, including: (a) transfer agency fees received by Goldman Sachs; (b) brokerage and futures commissions earned by Goldman Sachs for executing securities transactions on behalf of the Equity Funds and futures transactions on behalf of each of the Funds; (c) research received by the Investment Adviser from broker-dealers in exchange for executing certain transactions on behalf of the Growth Opportunities Fund; (d) trading efficiencies resulting from aggregation of orders of the Funds with those for other funds or accounts managed by the Investment Adviser; (e) the Investment Adviser’s ability to leverage the infrastructure designed to service the Funds on behalf of its other clients; (f) the Investment Adviser’s ability to cross-market other products and services to Fund shareholders; (g) Goldman Sachs’ retention of certain fees as Fund Distributor; (h) the Investment Adviser’s ability to negotiate better pricing with custodians on behalf of its other clients, as a result of the relationship with the Funds; and (i) the possibility that the working relationship between the Investment Adviser and the Funds’ third party service providers may cause those service providers to be open to doing business with other areas of Goldman Sachs. In the course of considering the foregoing, the Independent Trustees requested and received further information quantifying certain of these fall-out benefits.
Other Benefits to the Funds and Their Shareholders
The Trustees also noted that the Funds receive certain potential benefits as a result of their relationship with the Investment Adviser, including: (a) trading efficiencies resulting from aggregation of orders of the Funds with those of other funds or accounts managed by the Investment Adviser; (b) improved servicing from vendors because of the volume of business generated by the Investment Adviser and its affiliates; (c) improved servicing from broker-dealers because of the volume of business generated by the Investment Adviser and its affiliates; (d) the Investment Adviser’s ability to negotiate favorable terms with derivatives counterparties as a result of the size and reputation of the Goldman Sachs organization; (e) the Investment Adviser’s knowledge and experience gained from managing other accounts and products; (f) the Investment Adviser’s ability to hire and retain qualified personnel to provide services to the Funds because of the reputation of the Goldman Sachs organization; (g) the Funds’ access, through the Investment Adviser, to certain firmwide resources (e.g., proprietary risk management systems and databases), subject to certain restrictions; and (h) the Funds’ access to certain affiliated distribution channels. The Trustees noted the competitive nature of the mutual fund marketplace, and noted further that many of the Funds’ shareholders invested in the Funds in part because of the Funds’ relationship with the Investment Adviser and that those shareholders have a general expectation that the relationship will continue.
Approval of the Sub-Advisory Agreement
The Independent Trustees concluded that the Sub-Advisory Agreement on behalf of the Equity Index Fund should be continued and approved. In reaching this determination, they relied on the information provided by the Investment Adviser and the Sub-Adviser. The Trustees reviewed the respective services provided for the Equity Index Fund by the Investment Adviser under its Management Agreement and by the Sub-Adviser under its Sub-Advisory Agreement. They considered the Sub-Adviser’s solid record in tracking the performance of the Fund’s benchmark in line with the investment objective of the Fund and noted that, gross of fees and expenses, the Fund slightly outperformed its benchmark (before expenses) in 2012 and for the one-year period ended March 31, 2013, due in large part to the receipt of class action settlement proceeds. They noted that the compensation paid to the Sub-Adviser was paid by the Investment Adviser, not by the Fund, and that the retention of the Sub-Adviser does not increase the
75
GOLDMAN SACHS VARIABLE INSURANCE TRUST FUNDS
Statement Regarding Basis for Approval of Management Agreements (Unaudited) (continued)
fees incurred by the Fund for advisory services. They also considered the Sub-Adviser’s experience in index investing and its compliance policies and procedures and code of ethics. After deliberation and consideration of the information provided, the Trustees unanimously concluded that the sub-advisory fee to be paid by the Investment Adviser to the Sub-Adviser with respect to the Equity Index Fund was reasonable in light of the services provided by the Sub-Adviser and the Fund’s reasonably foreseeable asset levels, and that the Sub-Advisory Agreement should be approved and continued until June 30, 2014.
Conclusion
In connection with their consideration of the Agreements, the Trustees gave weight to each of the factors described above, but did not identify any particular factor as controlling their decision. After deliberation and consideration of all of the information provided, including the factors described above, the Trustees concluded, in the exercise of their business judgment, that the management fees paid by each of the Funds were reasonable in light of the services provided to it by the Investment Adviser, the Investment Adviser’s costs and each Fund’s current and reasonably foreseeable asset levels. The Trustees unanimously concluded that the Investment Adviser’s continued management likely would benefit each Fund and its shareholders and that the Management Agreements should be approved and continued with respect to each Fund until June 30, 2014.
76
| TRUSTEES | OFFICERS | |
| Ashok N. Bakhru, Chairman | James A. McNamara, President | |
| Donald C. Burke | George F. Travers, Principal Financial Officer | |
| John P. Coblentz, Jr. | Caroline L. Kraus, Secretary | |
| Diana M. Daniels | Scott M. McHugh, Treasurer | |
| Joseph P. LoRusso | ||
| James A. McNamara | ||
| Jessica Palmer | ||
| Alan A. Shuch | ||
| Richard P. Strubel |
GOLDMAN, SACHS & CO.
Distributor and Transfer Agent
GOLDMAN SACHS ASSET MANAGEMENT, L.P.
Investment Adviser
200 West Street, New York, New York 10282
Visit our web site at www.goldmansachsfunds.com/vit to obtain the most recent month-end returns.
The reports concerning the Funds included in this shareholder report may contain certain forward-looking statements about the factors that may affect the performance of the Funds in the future. These statements are based on Fund management’s predictions and expectations concerning certain future events and their expected impact on the Funds, such as performance of the economy as a whole and of specific industry sectors, changes in the levels of interest rates, the impact of developing world events, and other factors that may influence the future performance of the Funds. Management believes these forward-looking statements to be reasonable, although they are inherently uncertain and difficult to predict. Actual events may cause adjustments in portfolio management strategies from those currently expected to be employed.
A description of the policies and procedures that the Funds use to determine how to vote proxies relating to portfolio securities and information regarding how the Funds voted proxies relating to portfolio securities for the 12-month period ended June 30 is available (i) without charge, upon request by calling 1-800-621-2550; and (ii) on the Securities and Exchange Commission (“SEC”) web site at http://www.sec.gov.
The Funds file their complete schedule of portfolio holdings with the SEC for the first and third quarters of each fiscal year on Form N-Q. The Funds’ Forms N-Q are available on the SEC’s web site at http://www.sec.gov within 60 days after the Funds’ first and third fiscal quarters. The Funds’ Forms N-Q may be reviewed and copied at the SEC’s Public Reference Room in Washington, D.C. and information on the operation of the Public Reference Room may also be obtained by calling 1-800-SEC-0330. Forms N-Q may be obtained upon request and without charge by calling 1-800-621-2550.
Holdings and allocations shown are as of June 30, 2013 and may not be representative of future investments. Fund holdings should not be relied on in making investment decisions and should not be construed as research or investment advice regarding particular securities. Current and future holdings are subject to risk.
The Global Industry Classification Standard (“GICS”) was developed by and is the exclusive property and a service mark of Morgan Stanley Capital International Inc. (“MSCI”) and Standard & Poor’s, a division of The McGraw-Hill Companies, Inc. (“S&P”) and is licensed for use by Goldman Sachs. Neither MSCI, S&P nor any other party involved in making or compiling the GICS or any GICS classifications makes any express or implied warranties or representations with respect to such standard or classification (or the results to be obtained by the use thereof), and all such parties hereby expressly disclaim all warranties of originality, accuracy, completeness, merchantability or fitness for a particular purpose with respect to any of such standard or classification. Without limiting any of the foregoing, in no event shall MSCI, S&P, any of their affiliates or any third party involved in making or compiling the GICS or any GICS classifications have any liability for any direct, indirect, special, punitive, consequential or any other damages (including lost profits) even if notified of the possibility of such damages.
The portfolio risk management process includes an effort to monitor and manage risk, but does not imply low risk.
Shares of the Goldman Sachs VIT Funds are offered to separate accounts of participating life insurance companies for the purpose of funding variable annuity contracts and variable life insurance policies. Shares of the Fund are not offered directly to the general public. The variable annuity contracts and variable life insurance policies are described in the separate prospectuses issued by participating insurance companies. You should refer to those prospectuses for information about surrender charges, mortality and expense risk fees and other charges that may be assessed by participating insurance companies under the variable annuity contracts or variable life insurance policies. Such fees or charges, if any, may affect the return you may realize with respect to your investments. Ask your representative for more complete information. Please consider a fund’s objectives, risks and charges and expenses, and read the prospectus carefully before investing. The prospectus contains this and other information about the Fund.
This material is not authorized for distribution to prospective investors unless preceded or accompanied by a current Prospectus or summary prospectus, if applicable. Investors should consider a Fund’s objective, risks, and charges and expenses, and read the summary prospectus, if available, and/or the Prospectus carefully before investing or sending money. The summary prospectus, if available, and the Prospectus contain this and other information about a Fund and may be obtained from your Authorized Institution or from Goldman, Sachs & Co. by calling 1-800-621-2550.
This report is prepared for the general information of contract owners and is not an offer of shares of the Goldman Sachs Variable Insurance Trust Funds.
© 2013 Goldman Sachs. All rights reserved.
VITMLTISAR13/106810.MF.MED.TMPL/8/2013
Goldman
Sachs Variable Insurance Trust
Goldman Sachs
Strategic Growth Fund
Semi-Annual Report
June 30, 2013

GOLDMAN SACHS VARIABLE INSURANCE TRUST STRATEGIC GROWTH FUND
Principal Investment Strategies and Risks
This is not a complete list of risks that may affect the Fund. For additional information concerning the risks applicable to the Fund, please see the Fund’s prospectus.
Shares of the Goldman Sachs Variable Insurance Trust — Goldman Sachs Strategic Growth Fund are offered to separate accounts of participating life insurance companies for the purpose of funding variable annuity contracts and variable life insurance policies. Shares of the Fund are not offered directly to the general public. The variable annuity contracts and variable life insurance policies are described in the separate prospectuses issued by participating insurance companies. You should refer to those prospectuses for information about surrender charges, mortality and expense risk fees and other charges that may be assessed by participating insurance companies under the variable annuity contracts or variable life insurance policies. Such fees or charges, if any, may affect the return you realize with respect to your investments. Ask your representative for more complete information. Please consider the Fund’s objective, risks and charges and expenses, and read the Prospectus carefully before investing. The Prospectus contains this and other information about the Fund.
The Goldman Sachs Strategic Growth Fund invests primarily in U.S. equity investments. The Fund’s equity investments are subject to market risk, which means that the value of the securities in which it invests may go up or down in response to the prospects of individual companies, particular sectors and/or general economic conditions. Different investment styles (e.g., “growth”) tend to shift in and out of favor, and at times the Fund may underperform other funds that invest in similar asset classes.
1
GOLDMAN SACHS VARIABLE INSURANCE TRUST STRATEGIC GROWTH FUND
INVESTMENT OBJECTIVE
The Fund seeks long-term growth of capital.
Portfolio Management Discussion and Analysis
Below, the Goldman Sachs Growth Portfolio Management Team discusses the Goldman Sachs Variable Insurance Trust — Goldman Sachs Strategic Growth Fund’s (the “Fund”) performance and positioning for the six-month period ended June 30, 2013 (the “Reporting Period”).
How did the Fund perform during the Reporting Period?
During the Reporting Period, the Fund’s Institutional and Service Shares generated cumulative total returns of 8.73% and 8.52%, respectively. These returns compare to the 11.80% cumulative total return of the Fund’s benchmark, the Russell 1000® Growth Index (with dividends reinvested) (the “Russell Index”), during the same time period.
What economic and market factors most influenced the equity markets as a whole during the Reporting Period?
Representing the U.S. equity market, the S&P® 500 Index gained 13.82% during the Reporting Period, making it the strongest first half since 1998.
U.S. equities, as represented by the S&P® 500 Index, extended their rally from 2012 with a strong first quarter in 2013. Indeed, the S&P® 500 Index finished the first quarter of 2013 with significant gains, making a five-year high during these months. The Dow Jones Industrial Average also hit a new record high during the first calendar quarter.
Despite the overhang of automatic spending cuts, or sequestration, that went into effect in March 2013, U.S. equity markets reflected a variety of improving economic indicators. Strong momentum in the housing market continued, as the Case-Shiller Index of house prices rose 8.1% in January 2013, year-over-year the fastest pace since mid-2006. The employment picture also improved, with the unemployment rate dropping to 7.7%. Strong retail sales suggested consumers may have been feeling the effects of better housing and labor market conditions.
After a strong start to the second quarter of 2013, bullish sentiment began to fade, and the U.S. equity rally halted in mid-May 2013 when Federal Reserve (“Fed”) Chair Bernanke announced the potential “tapering” of the pace of quantitative easing asset purchases. U.S. equity markets reacted negatively again in June to news the slowing of the asset purchase program could begin later this year, with the program ending by the middle of 2014 if the economy grows as expected. U.S. equity markets calmed toward the end of the month as a downward revision of first quarter Gross Domestic Product (“GDP”) from 2.4% to 1.8% supported reassurance from the Fed that it would only begin reducing asset purchases if the economy was clearly on track. Still, the S&P® 500 Index declined modestly in June 2013, ending seven consecutive months of gains and muting returns for the quarter as a whole. Even with that, both the S&P® 500 Index and the Dow Jones Industrial Average made fresh record highs fueled by the continued strong rebound in house prices during the second calendar quarter and returns for the Reporting Period overall were still significantly up.
For the Reporting Period as a whole, all ten sectors within the S&P® 500 Index posted gains. Health care did best, followed closely by consumer discretionary and financials. Conversely, materials performed worst, as commodity prices were volatile in part due to a slowing Chinese economy. Information technology, utilities, telecommunication services and energy were also comparatively weak, though still producing positive returns.
All segments of the U.S. equity market advanced during the Reporting Period, with small-cap stocks, as measured by the Russell 2000® Index gaining most, followed by mid-cap stocks and then large-cap stocks, as measured by the Russell Midcap® Index and the Russell 1000® Index, respectively. From a style perspective, value-oriented stocks solidly outpaced growth-oriented stocks in the large-cap and mid-cap segments of the U.S. equity market; however, growth stocks substantially outperformed value stocks in the small-cap segment of the U.S. equity market. (All as measured by the Russell Investments indices.)
What key factors were responsible for the Fund’s performance during the Reporting Period?
The Fund’s performance relative to the Russell Index during the Reporting Period can be attributed primarily to stock selection overall.
2
GOLDMAN SACHS VARIABLE INSURANCE TRUST STRATEGIC GROWTH FUND
Which equity market sectors most significantly affected Fund performance?
Detracting most from the Fund’s relative results during the Reporting Period was stock selection in the information technology, telecommunication services and consumer discretionary sectors. Partially offsetting such detractors was effective stock selection in the financials and industrials sectors, which contributed positively to the Fund’s performance relative to the Russell Index during the Reporting Period.
Which stocks detracted significantly from the Fund’s performance during the Reporting Period?
Detracting most from the Fund’s results relative to its benchmark index were positions in web-based information technology systems company Rackspace Hosting, personal computer and mobile device giant Apple and wireless tower company American Tower.
Rackspace Hosting, a leading provider of managed hosting and cloud computing services and a new purchase for the Fund during the Reporting Period, detracted from the Fund’s relative performance, as it reported disappointing fiscal first quarter results. The slowdown in its sales growth highlights the challenges the company is experiencing gaining traction with its new cloud offering, and more specifically, transitioning large enterprise customers to the new offering. The company also indicated it would have to spend more to acquire new customers. While the secular growth trends driving Rackspace Hosting remain intact as the architecture of computing and enterprise information technology spending continue to shift toward the cloud, we opted to eliminate the Fund’s position in the company by the end of the Reporting Period.
Apple’s stock was pressured during the Reporting Period due to concerns about slower iPhone revenue growth and increasing competition. We believe Apple actually reported a solid set of results for its fiscal second quarter, and the company alluded to a new product category coming in the fall, which could help to potentially restart the company’s growth. Thus, at the end of the Reporting Period, we maintained a positive outlook on Apple and believed there were a number of potential catalysts for additional growth on the horizon. In our view, an iPhone that targets the emerging market consumer could reaccelerate growth and help expand the overall market for Apple products. We also believe the market had been discounting the optionality in Apple’s stock from new product introductions. (Optionality is the condition of having choices or a condition wherein a stock can deliver outsized results when certain seemingly unlikely things occur.). Overall, we remained positive on Apple at the end of the Reporting Period and believed the stock was trading at a reasonable valuation for a high quality franchise with solid growth potential.
American Tower reported a strong fourth quarter of 2012 during the first quarter of 2013, with revenue beating expectations, and management indicated new business bookings were at record levels. However, tower companies underperformed the equity market broadly in the first quarter of 2013 due in part to concerns that growth in U.S. tower businesses may slow in 2014 following what analysts predict will be a strong 2013. At the end of the Reporting Period, we believed American Tower should continue to see many years of strong growth both domestically and internationally. In our view, the rollout of high speed LTE (long-term evolution) wireless services, which is currently driving the U.S. leasing business, should be followed by several years of growth from investment in adding capacity to these initial networks. We continued to have conviction in the tower companies over the long term, as demand for mobile content shows no sign of slowing, and wireless carriers are increasingly adding capacity to support higher usage, network upgrades and improved coverage.
What were some of the Fund’s best-performing individual stocks?
The Fund benefited relative to the Russell Index from positions in pharmaceuticals company Vertex Pharmaceuticals, gaming software and content publisher Activision Blizzard and leading global payments and business services company American Express.
Vertex Pharmaceuticals was the top contributor to the Fund’s performance during the Reporting Period. Supportive trial data was released on one of its cystic fibrosis drugs in development, causing the company’s shares to spike with the now more likely regulatory approval of the treatment. At the end of the Reporting Period, we believed Vertex Pharmaceuticals had an attractive risk/reward profile and was well positioned to grow its addressable market through its cystic fibrosis franchise. In addition, we believe the value of the company’s hepatitis-C franchise has been underestimated by the market, which could lead to significant upside in its stock. In our view, Vertex Pharmaceuticals has a robust pipeline of new treatments and maintains a healthy balance sheet that could help fund research on additional therapies.
Activision Blizzard performed well, as the company reported solid fourth quarter 2012 results during the Reporting Period, driven by strong performance in its key franchises. The video game Skylanders, which was launched in 2011, already crossed the $1 billion revenue threshold. Activision’s Call of Duty video game franchise posted solid growth and saw an increase in online engagement for Black Ops 2, particularly in December 2012. In our view, Activision Blizzard’s industry-leading franchises have
3
GOLDMAN SACHS VARIABLE INSURANCE TRUST STRATEGIC GROWTH FUND
solid growth potential. In addition, its newer properties and upcoming releases should lead, we believe, to overall corporate margin expansion. Because the company had performed well, driven by a combination of expected share buybacks and optimism around increased demand for video games following the release of new consoles from Sony and Microsoft later in 2013, we sold out of the Fund’s position in Activision Blizzard by the end of the Reporting Period. In our view, its shares had become fairly valued, and thus we decided to exit the position in favor of what we considered to be more attractive opportunities.
A position in American Express also contributed to the Fund’s relative performance. Its shares increased during the second quarter of 2013 under the sentiment that spending volumes should remain healthy for the near future. In addition, its management further committed to cost containment by reiterating its focus on controlling expenses. In our view, American Express has a strong franchise and business model with recurring transaction-based revenue and an attractive growth profile, which should help expand margins and drive operating leverage. The company has, to date, maintained a healthy balance sheet, allowing it to continue to return capital to shareholders through dividend payments and share repurchases. At the end of the Reporting Period, we remained positive on American Express’ long-term growth opportunity in mobile payments and its closed-loop payments network.
How did the Fund use derivatives and similar instruments during the Reporting Period?
During the Reporting Period, we did not use derivatives as part of an active management strategy.
Did the Fund make any significant purchases or sales during the Reporting Period?
Among the purchases initiated during the Reporting Period, we established a Fund position in metal component manufacturer Precision Castparts. The company has leading global positions in aerospace forgings, castings and aero structures as well as strong and growing businesses serving gas power generation and the oil industry. We believe these end markets provide attractive cyclical and secular growth trajectories, and that Precision Castparts’ differentiation from competitors attractively positions it to potentially benefit from these growth opportunities. Its shares had lagged the broader equity market just prior to our purchase date due to fears regarding potential production disruptions to Boeing’s 787. However, we believe those fears were overblown and took the opportunity to initiate a position in what we believe to be a high quality company with strong long-term growth potential.
We initiated a Fund position in biotechnology company Regeneron Pharmaceuticals. The company’s key approved drug is Eylea, which is used for the treatment of a common cause of blindness in the elderly. We believe this drug is best-in-class, and there is the potential for some positive data that could help to rapidly grow the company. Regeneron Pharmaceuticals also has an attractive product pipeline, in our view, for the treatment of asthma and high cholesterol. At the end of the Reporting Period, we believed its valuation presented a compelling risk-reward opportunity for owning the stock.
In addition to those sales already mentioned, we exited the Fund’s position in NetApp, a company that develops data storage hardware and software for enterprise clients. Its stock performed well after the company reported a solid set of earnings and announced it was doubling its existing share buyback to approximately $3 billion. We sold the Fund’s position in NetApp because we believed there were a number of names in this industry trading at similar valuation but with more compelling growth prospects.
We eliminated the Fund’s position in futures and options exchange CME Group during the Reporting Period. While we believe CME Group could benefit from regulatory changes that require over-the-counter derivatives transactions to be centrally cleared, we sold in favor of a higher conviction exchange opportunity.
Were there any notable changes in the Fund’s weightings during the Reporting Period?
In constructing the Fund’s portfolio, we focus on picking stocks rather than on making industry or sector bets. We seek to outpace the benchmark index by overweighting stocks that we expect to outperform and underweighting those that we think may lag. Consequently, changes in its sector weights are generally the direct result of individual stock selection or of stock appreciation or depreciation. That said, during the Reporting Period, the Fund’s exposure to energy and industrials increased compared to the Russell Index. The Fund’s allocations compared to the benchmark index in consumer discretionary, consumer staples, financials, information technology, materials and telecommunication services decreased.
How was the Fund positioned relative to its benchmark index at the end of the Reporting Period?
At the end of June 2013, the Fund had overweighted positions relative to the Russell Index in the financials and energy sectors. On the same date, the Fund had underweighted positions compared to the Russell Index in industrials, materials, consumer staples, telecommunication services and information technology and was rather neutrally weighted to the Russell Index in consumer discretionary and health care. The Fund had no exposure to the utilities sector at the end of the Reporting Period.
4
GOLDMAN SACHS VARIABLE INSURANCE TRUST STRATEGIC GROWTH FUND
Were there any changes to the Fund’s portfolio management team during the Reporting Period?
The Growth Equity investment team is lead by Steve Barry, Chief Investment Officer and partner. Mr. Barry has 28 years of investment experience and has been with the team since 1999. The Growth Equity team consists of 10 investment professionals and three risk professionals, with the senior leaders having been with the team for more than 10 years. By design, all investment decisions in the Growth Equity team were performed in a co-lead portfolio manager and team structure, with multiple subject matter experts. This strategic decision has been the cornerstone of our approach and ensures continuity in our shareholders’ portfolios. Effective April 17, 2013, alongside Steve Barry, the co-lead portfolio managers for our Growth Equity strategies are Tim Leahy and Steve Becker for Large Cap and Jeff Rabinowitz for Non Large Cap. Joe Hudepohl, Scott Kolar, Warren Fisher and Greg Frasca, formerly of the Growth Equity team have left the firm.
What is the Fund’s tactical view and strategy for the months ahead?
As we enter the second half of 2013, we continue to be constructive on the U.S. equity market. Despite a strong first half of 2013, we believe the case for investing in U.S. equities remains compelling. In our view, at the end of the Reporting Period, valuations were reasonable, as the S&P 500 Index was trading below its historical average price-to-earnings (P/E) multiple and offered a dividend yield of approximately 2%. We believe the strength of corporate balance sheets provides companies with a number of options to enhance shareholder value going forward. Signs of improving U.S. economic growth remained intact at the end of June 2013, supported by a continued recovery in the U.S. housing market and in consumer confidence. However, some headwinds also remained, given market concerns about the Fed tapering asset purchases, rising interest rates, fiscal policy’s drag on economic growth and global economic weakness. We believe it is important to recognize that rising interest rates and advancing equity markets are not necessarily mutually exclusive. We feel equities have the potential to continue to rise in an increasing rate environment driven by improving U.S. economic growth and given that the absolute level of rates still remains low by historical standards. Additional catalysts could be improved sentiment and increased flows into equities.
Our fundamental, bottom-up research process continues to drive our stock selection, while short-term “noise” in the market — headlines or sentiment — enables us to manage position sizes opportunistically. We have high conviction in the companies the Fund owns and believe they have the potential to outperform relative to the broader U.S. equity market regardless of economic growth conditions. As we look ahead to the second half of 2013, we maintain our discipline in seeking to identify companies with strong or improving balance sheets, defensible franchises, high barriers to entry and strong growth prospects, led by quality management teams and trading at discounted valuations. As always, deep research resources, a forward-looking investment process and truly actively managed portfolios are keys, in our view, to both preserving capital and outperforming the market over the long term.
5
FUND BASICS
Strategic Growth Fund
as of June 30, 2013
STANDARDIZED TOTAL RETURNS1
| For the period ended 6/30/13 | One Year | Five Years | Ten Years | Since Inception | Inception Date | |||||||||||||
| Institutional | 16.99 | % | 5.32 | % | 6.23 | % | 3.66 | % | 4/30/98 | |||||||||
| Service | 16.68 | 5.07 | N/A | 4.38 | 1/09/06 | |||||||||||||
| 1 | The Standardized Total Returns are average annual total returns as of the most recent calendar quarter-end. They assume reinvestment of all distributions at net asset value (“NAV”). Because Institutional Shares and Service Shares do not involve a sales charge, such a charge is not applied to their Standardized Total Returns. |
Total return figures in the above chart represent past performance and do not indicate future results, which will vary. The investment return and principal value of an investment will fluctuate and, therefore, an investor’s shares, when redeemed, may be worth more or less than their original cost. Current performance may be lower or higher than the total return figures in the above chart. Please visit www.goldmansachsfunds.com/vit to obtain the most recent month-end returns. Performance reflects fee waivers and/or expense limitations in effect during the periods shown. In their absence, performance would be reduced.
EXPENSE RATIOS2
| Net Expense Ratio (Current) | Gross Expense Ratio (Before Waivers) | |||||||
| Institutional | 0.80 | % | 0.84 | % | ||||
| Service | 1.05 | 1.09 | ||||||
| 2 | The expense ratios of the Fund, both current (net of applicable fee waivers and/or expense limitations) and before waivers (gross of applicable fee waivers and/or expense limitations) are as set forth above according to the most recent publicly available Prospectus for the Fund and may differ from the expense ratios disclosed in the Financial Highlights in this report. The Fund’s waivers and/or expense limitations will remain in place through at least April 30, 2014, and prior to such date the Investment Adviser may not terminate the arrangements without the approval of the Fund’s Board of Trustees. If these arrangements are discontinued in the future, the expense ratios may change without shareholder approval. |
TOP TEN HOLDINGS AS OF 6/30/133
| Holding | % of Net Assets | Line of Business | ||||
| Apple, Inc. | 4.6% | Technology Hardware & Equipment | ||||
| Google, Inc. Class A | 4.5 | Software & Services | ||||
| QUALCOMM, Inc. | 4.0 | Technology Hardware & Equipment | ||||
| American Tower Corp. (REIT) | 3.3 | Real Estate | ||||
| Schlumberger Ltd. | 2.9 | Energy | ||||
| Costco Wholesale Corp. | 2.9 | Food & Staples Retailing | ||||
| NIKE, Inc. Class B | 2.8 | Consumer Durables & Apparel | ||||
| Equinix, Inc. | 2.7 | Software & Services | ||||
| Amazon.com, Inc. | 2.6 | Retailing | ||||
| Xilinx, Inc. | 2.3 | Semiconductors & Semiconductor Equipment | ||||
| 3 | The top ten holdings may not be representative of the Fund’s future investments. |
6
FUND BASICS
FUND vs. BENCHMARK SECTOR ALLOCATIONS4
As of June 30, 2013
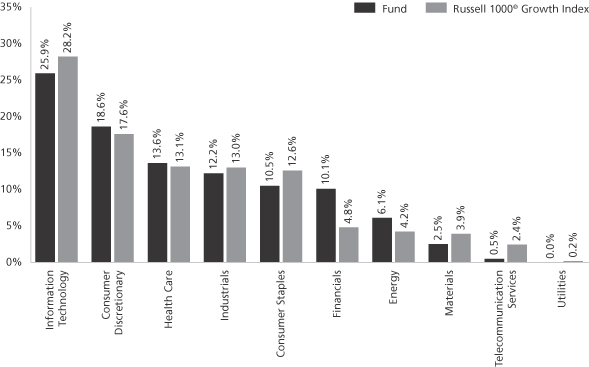
| 4 | The Fund is actively managed and, as such, its composition may differ over time. Consequently, the Fund’s overall sector allocations may differ from percentages contained in the graph above. The graph categorizes investments using Global Industry Classification Standard (“GICS”), however, the sector classifications used by the portfolio management team may differ from GICS. The percentage shown for each investment category reflects the value of investments in that category as a percentage of market value. The graph depicts the Fund’s investments but may not represent the Fund’s market exposure due to the exclusion of certain derivatives, if any, as listed in the Additional Investment Information section of the Schedule of Investments. |
7
GOLDMAN SACHS VARIABLE INSURANCE TRUST STRATEGIC GROWTH FUND
Schedule of Investments
June 30, 2013 (Unaudited)
| Shares | Description | Value | ||||||
| Common Stocks – 98.0% | ||||||||
| Capital Goods – 10.2% |
| ||||||
| 39,657 | Cummins, Inc. | $ | 4,301,198 | |||||
| 127,551 | Danaher Corp. | 8,073,978 | ||||||
| 124,338 | Honeywell International, Inc. | 9,864,977 | ||||||
| 38,330 | Precision Castparts Corp. | 8,662,963 | ||||||
| 35,185 | Rockwell Automation, Inc. | 2,925,281 | ||||||
| 68,404 | The Boeing Co. | 7,007,306 | ||||||
| 48,055 | United Technologies Corp. | 4,466,232 | ||||||
|
| |||||||
| 45,301,935 | ||||||||
|
| |||||||
| Consumer Durables & Apparel – 5.0% |
| ||||||
| 33,949 | Lululemon Athletica, Inc.* | 2,224,338 | ||||||
| 193,378 | NIKE, Inc. Class B | 12,314,311 | ||||||
| 61,875 | PVH Corp. | 7,737,469 | ||||||
|
| |||||||
| 22,276,118 | ||||||||
|
| |||||||
| Consumer Services – 3.2% |
| ||||||
| 11,230 | Chipotle Mexican Grill, Inc.* | 4,091,651 | ||||||
| 101,231 | Marriott International, Inc. Class A | 4,086,695 | ||||||
| 25,238 | McDonald’s Corp. | 2,498,562 | ||||||
| 48,623 | Yum! Brands, Inc. | 3,371,519 | ||||||
|
| |||||||
| 14,048,427 | ||||||||
|
| |||||||
| Diversified Financials – 4.3% |
| ||||||
| 89,668 | American Express Co. | 6,703,580 | ||||||
| 53,125 | IntercontinentalExchange, Inc.* | 9,443,500 | ||||||
| 43,454 | T. Rowe Price Group, Inc. | 3,178,660 | ||||||
|
| |||||||
| 19,325,740 | ||||||||
|
| |||||||
| Energy – 5.9% |
| ||||||
| 67,889 | Anadarko Petroleum Corp. | 5,833,702 | ||||||
| 95,063 | Halliburton Co. | 3,966,028 | ||||||
| 25,228 | Pioneer Natural Resources Co. | 3,651,753 | ||||||
| 180,829 | Schlumberger Ltd. | 12,958,206 | ||||||
|
| |||||||
| 26,409,689 | ||||||||
|
| |||||||
| Food & Staples Retailing – 2.9% |
| ||||||
| 115,246 | Costco Wholesale Corp. | 12,742,750 | ||||||
|
| |||||||
| Food, Beverage & Tobacco – 5.6% |
| ||||||
| 50,229 | Diageo PLC ADR | 5,773,823 | ||||||
| 94,587 | PepsiCo, Inc. | 7,736,271 | ||||||
| 55,501 | Philip Morris International, Inc. | 4,807,497 | ||||||
| 161,846 | The Coca-Cola Co. | 6,491,643 | ||||||
|
| |||||||
| 24,809,234 | ||||||||
|
| |||||||
| Health Care Equipment & Services – 3.5% |
| ||||||
| 150,225 | Abbott Laboratories | 5,239,848 | ||||||
| 47,366 | Becton, Dickinson and Co. | 4,681,182 | ||||||
| 31,509 | C. R. Bard, Inc. | 3,424,398 | ||||||
| 36,041 | Covidien PLC | 2,264,816 | ||||||
|
| |||||||
| 15,610,244 | ||||||||
|
| |||||||
| Household & Personal Products – 1.9% |
| ||||||
| 61,855 | The Estee Lauder Companies, Inc. Class A | 4,068,203 | ||||||
|
| |||||||
| Common Stocks – (continued) | ||||||||
| Household & Personal Products – (continued) |
| ||||||
| 59,038 | The Procter & Gamble Co. | $ | 4,545,336 | |||||
|
| |||||||
| 8,613,539 | ||||||||
|
| |||||||
| Materials – 2.4% |
| ||||||
| 40,725 | Ecolab, Inc. | 3,469,363 | ||||||
| 63,510 | Praxair, Inc. | 7,313,811 | ||||||
|
| |||||||
| 10,783,174 | ||||||||
|
| |||||||
| Media – 2.5% |
| ||||||
| 42,630 | Discovery Communications, Inc. Class A* | 3,291,462 | ||||||
| 116,142 | Viacom, Inc. Class B | 7,903,463 | ||||||
|
| |||||||
| 11,194,925 | ||||||||
|
| |||||||
| Pharmaceuticals, Biotechnology & Life Sciences – 9.8% |
| ||||||
| 163,282 | Agilent Technologies, Inc. | 6,981,938 | ||||||
| 52,654 | Amgen, Inc. | 5,194,844 | ||||||
| 30,394 | Celgene Corp.* | 3,553,362 | ||||||
| 122,392 | Gilead Sciences, Inc.* | 6,267,694 | ||||||
| 29,418 | Regeneron Pharmaceuticals, Inc.* | 6,615,520 | ||||||
| 50,470 | Roche Holding AG ADR | 3,122,327 | ||||||
| 157,217 | Sanofi ADR | 8,098,248 | ||||||
| 45,915 | Vertex Pharmaceuticals, Inc.* | 3,667,231 | ||||||
|
| |||||||
| 43,501,164 | ||||||||
|
| |||||||
| Real Estate – 5.6% |
| ||||||
| 203,420 | American Tower Corp. (REIT) | 14,884,242 | ||||||
| 429,534 | CBRE Group, Inc. Class A* | 10,033,914 | ||||||
|
| |||||||
| 24,918,156 | ||||||||
|
| |||||||
| Retailing – 7.5% |
| ||||||
| 40,982 | Amazon.com, Inc.* | 11,380,292 | ||||||
| 184,128 | Dollar General Corp.* | 9,285,575 | ||||||
| 146,544 | L Brands, Inc. | 7,217,292 | ||||||
| 6,868 | Priceline.com, Inc.* | 5,680,729 | ||||||
|
| |||||||
| 33,563,888 | ||||||||
|
| |||||||
| Semiconductors & Semiconductor Equipment – 2.3% |
| ||||||
| 253,947 | Xilinx, Inc. | 10,058,841 | ||||||
|
| |||||||
| Software & Services – 13.1% |
| ||||||
| 81,018 | eBay, Inc.* | 4,190,251 | ||||||
| 65,805 | Equinix, Inc.* | 12,155,500 | ||||||
| 78,464 | Facebook, Inc. Class A* | 1,950,615 | ||||||
| 22,983 | Google, Inc. Class A* | 20,233,544 | ||||||
| 14,241 | Mastercard, Inc. Class A | 8,181,454 | ||||||
| 143,268 | Oracle Corp. | 4,401,193 | ||||||
| 192,080 | Salesforce.com, Inc.* | 7,333,614 | ||||||
|
| |||||||
| 58,446,171 | ||||||||
|
| |||||||
| Technology Hardware & Equipment – 10.0% |
| ||||||
| 76,580 | Amphenol Corp. Class A | 5,968,645 | ||||||
| 51,141 | Apple, Inc. | 20,255,927 | ||||||
| 295,035 | QUALCOMM, Inc. | 18,020,738 | ||||||
|
| |||||||
| 44,245,310 | ||||||||
|
| |||||||
| 8 | The accompanying notes are an integral part of these financial statements. |
GOLDMAN SACHS VARIABLE INSURANCE TRUST STRATEGIC GROWTH FUND
| Shares | Description | Value | ||||||
| Common Stocks – (continued) | ||||||||
| Telecommunication Services – 0.5% |
| ||||||
| 32,738 | Crown Castle International Corp.* | $ | 2,369,904 | |||||
|
| |||||||
| Transportation – 1.8% |
| ||||||
| 78,700 | FedEx Corp. | 7,758,246 | ||||||
|
| |||||||
| TOTAL INVESTMENTS – 98.0% | ||||||||
| (Cost $338,269,731) | $ | 435,977,455 | ||||||
|
| |||||||
| OTHER ASSETS IN EXCESS OF | 9,002,088 | ||||||
|
| |||||||
| NET ASSETS – 100.0% | $ | 444,979,543 | ||||||
|
| |||||||
| The percentage shown for each investment category reflects the value of investments in that category as a percentage of net assets. | ||
| * | Non-income producing security. | |
| Investment Abbreviations: | ||
| ADR | —American Depositary Receipt | |
| REIT | —Real Estate Investment Trust | |
| The accompanying notes are an integral part of these financial statements. | 9 |
GOLDMAN SACHS VARIABLE INSURANCE TRUST STRATEGIC GROWTH FUND
Statement of Assets and Liabilities
June 30, 2013 (Unaudited)
| Assets: | ||||
Investments, at value (cost $338,269,731) | $ | 435,977,455 | ||
Cash | 4,028,657 | |||
Receivables: | ||||
Investments sold | 7,808,441 | |||
Dividends | 366,337 | |||
Fund shares sold | 94,466 | |||
Other assets | 2,507 | |||
| Total assets | 448,277,863 | |||
| Liabilities: | ||||
Payables: | ||||
Investments purchased | 2,602,580 | |||
Amounts owed to affiliates | 340,124 | |||
Fund shares redeemed | 226,071 | |||
Accrued expenses | 129,545 | |||
| Total liabilities | 3,298,320 | |||
| Net Assets: | ||||
Paid-in capital | 372,078,503 | |||
Undistributed net investment income | 1,182,244 | |||
Accumulated net realized loss | (25,988,928 | ) | ||
Net unrealized gain | 97,707,724 | |||
| NET ASSETS | $ | 444,979,543 | ||
Net Assets: | ||||
Institutional | $ | 107,354,277 | ||
Service | 337,625,266 | |||
Total Net Assets | $ | 444,979,543 | ||
Shares of beneficial interest outstanding $0.001 par value (unlimited shares authorized): | ||||
Institutional | 7,124,069 | |||
Service | 22,463,466 | |||
Net asset value, offering and redemption price per share: | ||||
Institutional | $15.07 | |||
Service | 15.03 | |||
| 10 | The accompanying notes are an integral part of these financial statements. |
GOLDMAN SACHS VARIABLE INSURANCE TRUST STRATEGIC GROWTH FUND
Statement of Operations
For the Six Months Ended June 30, 2013 (Unaudited)
| Investment income: | ||||
Dividends (net of foreign taxes withheld of $84,803) | $ | 2,812,518 | ||
| Expenses: | ||||
Management fees | 1,648,366 | |||
Distribution and Service fees — Service Class | 412,129 | |||
Printing and mailing costs | 86,813 | |||
Transfer Agent fees(a) | 43,953 | |||
Professional fees | 36,758 | |||
Custody, accounting and administrative services | 29,071 | |||
Trustee fees | 8,164 | |||
Other | 8,947 | |||
| Total expenses | 2,274,201 | |||
Less — expense reductions | (90,374 | ) | ||
| Net expenses | 2,183,827 | |||
| NET INVESTMENT INCOME | 628,691 | |||
| Realized and unrealized gain: | ||||
Net realized gain from investments (including commissions recaptured of $17,165) | 30,130,039 | |||
Net change in unrealized gain on investments | 4,579,046 | |||
| Net realized and unrealized gain | 34,709,085 | |||
| NET INCREASE IN NET ASSETS RESULTING FROM OPERATIONS | $ | 35,337,776 | ||
(a) Institutional and Service Shares had Transfer Agent fees of $10,985 and $32,968, respectively.
| The accompanying notes are an integral part of these financial statements. | 11 |
GOLDMAN SACHS VARIABLE INSURANCE TRUST STRATEGIC GROWTH FUND
Statements of Changes in Net Assets
For the Six Months Ended June 30, 2013 (Unaudited) | For the Fiscal Year Ended December 31, 2012 | |||||||
| From operations: | ||||||||
Net investment income | $ | 628,691 | $ | 2,435,203 | ||||
Net realized gain | 30,130,039 | 14,203,671 | ||||||
Net change in unrealized gain | 4,579,046 | 51,657,365 | ||||||
| Net increase in net assets resulting from operations | 35,337,776 | 68,296,239 | ||||||
| Distributions to shareholders: | ||||||||
From net investment income | ||||||||
Institutional Shares | — | (723,126 | ) | |||||
Service Shares | — | (1,362,167 | ) | |||||
| Total distributions to shareholders | — | (2,085,293 | ) | |||||
| From share transactions: | ||||||||
Proceeds from sales of shares | 24,704,928 | 45,783,221 | ||||||
Reinvestment of distributions | — | 2,085,293 | ||||||
Cost of shares redeemed | (25,247,084 | ) | (52,122,094 | ) | ||||
| Net decrease in net assets resulting from share transactions | (542,156 | ) | (4,253,580 | ) | ||||
| TOTAL INCREASE | 34,795,620 | 61,957,366 | ||||||
| Net assets: | ||||||||
Beginning of period | 410,183,923 | 348,226,557 | ||||||
End of period | $ | 444,979,543 | $ | 410,183,923 | ||||
| Undistributed net investment income | $ | 1,182,244 | $ | 553,553 | ||||
| 12 | The accompanying notes are an integral part of these financial statements. |
GOLDMAN SACHS VARIABLE INSURANCE TRUST STRATEGIC GROWTH FUND
Financial Highlights
Selected Data for a Share Outstanding Throughout Each Period
| Income (loss) from investment operations | ||||||||||||||||||||||||||||||||||||||||||||||||
| Year - Share Class | Net asset value, beginning of period | Net investment income (loss)(a) | Net realized and unrealized gain (loss) | Total from investment operations | Distributions from net investment income | Net asset | Total return(b) | Net assets, period (in 000s) | Ratio of net expenses to average net assets | Ratio of total expenses to average net assets | Ratio of net investment income (loss) to average net assets | Portfolio turnover rate(c) | ||||||||||||||||||||||||||||||||||||
FOR THE SIX MONTHS ENDED JUNE 30, (UNAUDITED) | ||||||||||||||||||||||||||||||||||||||||||||||||
2013 - Institutional | $ | 13.86 | $ | 0.03 | $ | 1.18 | $ | 1.21 | $ | — | $ | 15.07 | 8.73 | % | $ | 107,354 | 0.80 | %(d) | 0.85 | %(d) | 0.47 | %(d) | 31 | % | ||||||||||||||||||||||||
2013 - Service | 13.85 | 0.02 | 1.16 | 1.18 | — | 15.03 | 8.52 | 337,625 | 1.06 | (d) | 1.10 | (d) | 0.22 | (d) | 31 | |||||||||||||||||||||||||||||||||
FOR THE FISCAL YEARS ENDED DECEMBER 31, | ||||||||||||||||||||||||||||||||||||||||||||||||
2012 - Institutional | 11.64 | 0.10 | (e) | 2.21 | 2.31 | (0.09 | ) | 13.86 | 19.83 | 106,119 | 0.80 | 0.84 | 0.79 | (e) | 42 | |||||||||||||||||||||||||||||||||
2012 - Service | 11.63 | 0.07 | (e) | 2.21 | 2.28 | (0.06 | ) | 13.85 | 19.57 | 304,065 | 1.05 | 1.09 | 0.56 | (e) | 42 | |||||||||||||||||||||||||||||||||
2011 - Institutional | 12.01 | 0.06 | (0.37 | ) | (0.31 | ) | (0.06 | ) | 11.64 | (2.62 | ) | 102,018 | 0.83 | 0.85 | 0.47 | 35 | ||||||||||||||||||||||||||||||||
2011 - Service | 12.00 | 0.03 | (0.37 | ) | (0.34 | ) | (0.03 | ) | 11.63 | (2.86 | ) | 246,208 | 1.08 | 1.10 | 0.23 | 35 | ||||||||||||||||||||||||||||||||
2010 - Institutional | 10.89 | 0.05 | 1.12 | 1.17 | (0.05 | ) | 12.01 | 10.74 | 120,027 | 0.86 | 0.86 | 0.49 | 38 | |||||||||||||||||||||||||||||||||||
2010 - Service | 10.88 | 0.03 | 1.11 | 1.14 | (0.02 | ) | 12.00 | 10.50 | 238,353 | 1.11 | 1.11 | 0.24 | 38 | |||||||||||||||||||||||||||||||||||
2009 - Institutional | 7.40 | 0.03 | 3.50 | 3.53 | (0.04 | )(f) | 10.89 | 47.75 | 125,258 | 0.85 | 0.85 | 0.35 | 64 | |||||||||||||||||||||||||||||||||||
2009 - Service | 7.39 | 0.01 | 3.50 | 3.51 | (0.02 | )(f) | 10.88 | 47.50 | 219,909 | 1.10 | 1.10 | 0.10 | 64 | |||||||||||||||||||||||||||||||||||
2008 - Institutional | 12.73 | 0.02 | (5.34 | ) | (5.32 | ) | (0.01 | ) | 7.40 | (41.67 | ) | 95,218 | 0.81 | 0.81 | 0.20 | 44 | ||||||||||||||||||||||||||||||||
2008 - Service | 12.73 | (0.01 | ) | (5.33 | ) | (5.34 | ) | — | 7.39 | (41.86 | ) | 167,930 | 1.06 | 1.06 | (0.05 | ) | 44 | |||||||||||||||||||||||||||||||
| (a) | Calculated based on the average shares outstanding methodology. |
| (b) | Assumes investment at the net asset value at the beginning of the period, reinvestment of all distributions, and a complete redemption of the investment at the net asset value at the end of the period. Total returns for periods less than one full year are not annualized. |
| (c) | The Fund’s portfolio turnover rate is calculated in accordance with regulatory requirements, without regard to transactions involving short term investments and certain derivatives. If such transactions were included, the Fund’s portfolio turnover rate may be higher. |
| (d) | Annualized. |
| (e) | Reflects income recognized from special dividends which amounted to $0.04 per share and 0.27% of average net assets. |
| (f) | Includes a return of capital of less than $0.005 per share. |
| The accompanying notes are an integral part of these financial statements. | 13 |
GOLDMAN SACHS VARIABLE INSURANCE TRUST STRATEGIC GROWTH FUND
Notes to Financial Statements
June 30, 2013 (Unaudited)
1. ORGANIZATION
Goldman Sachs Variable Insurance Trust (the “Trust” or “VIT”) is a Delaware statutory trust registered under the Investment Company Act of 1940, as amended (the “Act”), as an open-end management investment company. The Trust includes the Goldman Sachs Strategic Growth Fund (the “Fund”). The Fund is a diversified portfolio under the Act offering two classes of shares — Institutional and Service Shares. Shares of the Trust are offered to separate accounts of participating life insurance companies for the purpose of funding variable annuity contracts and variable life insurance policies.
Goldman Sachs Asset Management, L.P. (“GSAM”), an affiliate of Goldman, Sachs & Co. (“Goldman Sachs”), serves as investment adviser to the Fund pursuant to a management agreement (the “Agreement”) with the Trust.
2. SIGNIFICANT ACCOUNTING POLICIES
The financial statements have been prepared in accordance with accounting principles generally accepted in the United States of America (“GAAP”) and require management to make estimates and assumptions that may affect the reported amounts and disclosures. Actual results may differ from those estimates and assumptions.
A. Investment Valuation — The Fund’s valuation policy is to value investments at fair value.
B. Investment Income and Investments — Investment income includes interest income and dividend income, net of any foreign withholding taxes, less any amounts reclaimable. Interest income is accrued daily and adjusted for amortization of premiums and accretion of discounts. Dividend income is recognized on ex-dividend date or, for certain foreign securities, as soon as such information is obtained subsequent to the ex-dividend date. Investment transactions are reflected on trade date. Realized gains and losses are calculated using identified cost. Investment transactions are recorded on the following business day for daily net asset value (“NAV”) calculations. Any foreign capital gains tax is accrued daily based upon net unrealized gains, and is payable upon sale of such investments. Distributions received from the Fund’s investments in United States (“U.S.”) real estate investment trusts (“REITs”) may be characterized as ordinary income, net capital gain or a return of capital. A return of capital is recorded by the Fund as a reduction to the cost basis of the REIT.
C. Class Allocations and Expenses — Investment income, realized and unrealized gain (loss), and non-class specific expenses of the Fund are allocated daily based upon the proportion of net assets of each class. Class specific expenses, where applicable, are borne by the respective share classes and include Distribution and Service and Transfer Agent fees. Non-class specific expenses directly incurred by a Fund are charged to that Fund, while such expenses incurred by the Trust are allocated across the respective Funds on a straight-line and/or pro-rata basis depending upon the nature of the expenses.
D. Federal Taxes and Distributions to Shareholders — It is the Fund’s policy to comply with the requirements of the Internal Revenue Code of 1986, as amended (the “Code”), applicable to regulated investment companies (mutual funds) and to distribute each year substantially all of its investment company taxable income and capital gains to its shareholders. Accordingly, the Fund is not required to make any provisions for the payment of federal income tax. Distributions to shareholders are recorded on the ex-dividend date. Income and capital gains distributions, if any, are declared and paid annually.
Net capital losses are carried forward to future fiscal years and may be used to the extent allowed by the Code to offset any future capital gains. Utilization of capital loss carryforwards will reduce the requirement of future capital gains distributions.
Under the Regulated Investment Company Modernization Act of 2010, the Fund is permitted to carry forward capital losses incurred in taxable years beginning after December 22, 2010 for an unlimited period. However, any losses incurred during those future taxable years will be required to be utilized prior to the losses incurred in pre-enactment taxable years. As a result of this ordering rule, pre-enactment capital loss carryforwards may be more likely to expire unused. Additionally, post-enactment capital losses that are carried forward will retain their character as either short-term or long-term capital losses rather than being considered all short-term as under previous law.
14
GOLDMAN SACHS VARIABLE INSURANCE TRUST STRATEGIC GROWTH FUND
2. SIGNIFICANT ACCOUNTING POLICIES (continued)
The characterization of distributions to shareholders for financial reporting purposes is determined in accordance with federal income tax rules, which may differ from GAAP. The source of the Fund’s distributions may be shown in the accompanying financial statements as either from net investment income, net realized gain or capital. Certain components of the Fund’s net assets on the Statement of Assets and Liabilities reflect permanent GAAP/tax differences based on the appropriate tax character.
E. Commission Recapture — GSAM, on behalf of the Fund, may direct portfolio trades, subject to seeking best execution, to various brokers who have agreed to rebate a portion of the commissions generated. Such rebates are made directly to the Fund as cash payments and are included in net realized gain (loss) from investments on the Statements of Operations.
3. INVESTMENTS AND FAIR VALUE MEASUREMENTS
The fair value of a financial instrument is the amount that would be received to sell an asset or paid to transfer a liability in an orderly transaction between market participants at the measurement date (i.e., the exit price). GAAP establishes a fair value hierarchy that prioritizes the inputs to valuation techniques used to measure fair value. The hierarchy gives the highest priority to unadjusted quoted prices in active markets for identical assets or liabilities (Level 1 measurements) and the lowest priority to unobservable inputs (Level 3 measurements). The levels used for classifying investments are not necessarily an indication of the risk associated with investing in these investments. The three levels of the fair value hierarchy are described below:
Level 1 — Unadjusted quoted prices in active markets that are accessible at the measurement date for identical, unrestricted assets or liabilities;
Level 2 — Quoted prices in markets that are not active or financial instruments for which significant inputs are observable (including, but not limited to, quoted prices for similar investments, interest rates, foreign exchange rates, volatility and credit spreads), either directly or indirectly;
Level 3 — Prices or valuations that require significant unobservable inputs (including GSAM’s assumptions in determining fair value measurement).
The Trustees have adopted Valuation Procedures that govern the valuation of the portfolio investments held by the Fund, including investments for which market quotations are not readily available. The Trustees have delegated to GSAM day-to-day responsibility for implementing and maintaining internal controls and procedures related to the valuation of the Fund’s portfolio investments. To assess the continuing appropriateness of pricing sources and methodologies, GSAM regularly performs price verification procedures and issues challenges as necessary to third party pricing vendors or brokers, and any differences are reviewed in accordance with the Valuation Procedures.
A. Level 1 and Level 2 Fair Value Investments — The valuation techniques and significant inputs used in determining the fair values for investments classified as Level 1 and Level 2 are as follows:
Equity Securities — Equity securities and investment companies traded on a U.S. securities exchange or the NASDAQ system, or those located on certain foreign exchanges, including but not limited to the Americas, are valued daily at their last sale price or official closing price on the principal exchange or system on which they are traded. If no sale occurs, equity securities and exchange traded investment companies are valued at the last bid price for long positions and at the last ask price for short positions. Investments in investment companies (other than those that are exchange traded) are valued at the NAV on the valuation date. To the extent these investments are actively traded, they are classified as Level 1 of the fair value hierarchy.
Unlisted equity securities for which market quotations are available are valued at the last sale price on the valuation date, or if no sale occurs, at the last bid price. Securities traded on certain foreign securities exchanges are valued daily at fair value determined by an independent fair value service (if available) under Valuation Procedures approved by the Trustees and consistent with applicable regulatory guidance. The independent fair value service takes into account multiple factors including, but not limited to, movements in the securities markets, certain depositary receipts, futures contracts and foreign currency exchange rates
15
GOLDMAN SACHS VARIABLE INSURANCE TRUST STRATEGIC GROWTH FUND
Notes to Financial Statements (continued)
June 30, 2013 (Unaudited)
3. INVESTMENTS AND FAIR VALUE MEASUREMENTS (continued)
that have occurred subsequent to the close of the foreign securities exchange. These investments are generally classified as Level 2 of the fair value hierarchy.
Debt Securities — Debt securities for which market quotations are readily available are valued daily on the basis of quotations supplied by dealers or an independent pricing service approved by the Trustees. The pricing services may use valuation models or matrix pricing, which consider: (i) yield or price with respect to bonds that are considered comparable in characteristics such as rating, interest rate and maturity date or (ii) quotations from securities dealers to determine current value. Short-term debt obligations that mature in sixty days or less and that do not exhibit signs of credit deterioration are valued at amortized cost, which approximates fair value. With the exception of treasury securities, which are generally classified as Level 1, these investments are generally classified as Level 2 of the fair value hierarchy.
B. Level 3 Fair Value Investments — To the extent that the aforementioned significant inputs are unobservable, or if quotations are not readily available, or if GSAM believes that such quotations do not accurately reflect fair value, the fair value of the Fund’s investments may be determined under Valuation Procedures approved by the Trustees. GSAM, consistent with its procedures and applicable regulatory guidance, may make an adjustment to the most recent valuation prices of either domestic or foreign securities in light of significant events to reflect what it believes to be the fair value of the securities at the time of determining a Fund’s NAV. Significant events which could affect a large number of securities in a particular market may include, but are not limited to: significant fluctuations in U.S. or foreign markets; market dislocations; market disruptions; or unscheduled market closings. Significant events which could also affect a single issuer may include, but are not limited to: corporate actions such as reorganizations, mergers and buy-outs; ratings downgrades; and bankruptcies.
C. Fair Value Hierarchy — The following is a summary of the Fund’s investments classified in the fair value hierarchy as of June 30, 2013:
| Investment Type | Level 1 | Level 2 | Level 3 | |||||||||
| Assets | ||||||||||||
| Common Stock and/or Other Equity Investments | $ | 435,977,455 | $ | — | $ | — | ||||||
For further information regarding security characteristics, see the Schedule of Investments.
4. AGREEMENTS AND AFFILIATED TRANSACTIONS
A. Management Agreement — Under the Agreement, GSAM manages the Fund, subject to the general supervision of the Trustees.
As compensation for the services rendered pursuant to the Agreement, the assumption of the expenses related thereto and administration of the Fund’s business affairs, including providing facilities, GSAM is entitled to a management fee, accrued daily and paid monthly, equal to an annual percentage rate of the Fund’s average daily net assets.
For the six months ended June 30, 2013, contractual and effective net management fees with GSAM were at the following rates:
| Contractual Management Fee Rate | ||||||||||||||||||||||||||
| First $1 billion | Next $1 billion | Next $3 billion | Next $3 billion | Over $8 billion | Effective Rate | Effective Net Management Fee Rate | ||||||||||||||||||||
| 0.75% | 0.68 | % | 0.65 | % | 0.64 | % | 0.63 | % | 0.75 | % | 0.71 | %* | ||||||||||||||
| * | GSAM has agreed to waive a portion of its management fee in order to achieve a net management rate, as defined in the Fund’s most recent prospectuses. The waiver will be effective through at least April 30, 2014, and prior to such date GSAM may not terminate the arrangement without approval of the Trustees. The Effective Net Management Rate above is calculated based on the management rate before and after the waiver had been adjusted, if applicable. For the six months ended June 30, 2013, GSAM waived $87,914 of its management fee. |
16
GOLDMAN SACHS VARIABLE INSURANCE TRUST STRATEGIC GROWTH FUND
4. AGREEMENTS AND AFFILIATED TRANSACTIONS (continued)
B. Distribution and Service Plan — The Trust, on behalf of the Service Shares of the Fund, has adopted a Distribution and Service Plan (the “Plan”). Under the Plan, Goldman Sachs, which serves as distributor (the “Distributor”), is entitled to a fee accrued daily and paid monthly, for distribution services and personal and account maintenance services, which may then be paid by Goldman Sachs to authorized dealers, equal to, on an annual basis, 0.25% of the Fund’s average daily net assets attributable to Service Shares.
C. Transfer Agency Agreement — Goldman Sachs also serves as the transfer agent of the Fund for a fee pursuant to Transfer Agency Agreement. The fees charged for such transfer agency services are accrued daily and paid monthly at an annual rate of 0.02% of the average daily net assets of Institutional and Service Shares.
D. Other Expense Agreements and Affiliated Transactions — GSAM has agreed to limit certain “Other Expense” of the Fund (excluding transfer agent fees and expenses, taxes, interest, brokerage fees, litigation, indemnification, shareholder meeting and other extraordinary expenses) to the extent such expenses exceed, on an annual basis, a percentage rate of the average daily net assets of the Fund. Such Other Expense reimbursements, if any, are accrued daily and paid monthly. In addition, the Fund is not obligated to reimburse GSAM for prior fiscal year expense reimbursements, if any. The Other Expense limitation as an annual percentage rate of average daily net assets for the Fund is 0.114%. This Other Expense limitation will remain in place through at least April 30, 2014, and prior to such date GSAM may not terminate the arrangement without the approval of the Trustees. For the six months ended June 30, 2013, GSAM did not make any reimbursements to the Fund. In addition, the Fund has entered into certain offset arrangements with the custodian and the transfer agent, which may result in a reduction of the Fund’s expenses and are received irrespective of the application of the “Other Expense” limitations described above. For the six months ended June 30, 2013, custody fee credits were $2,460.
As of June 30, 2013, the amounts owed to affiliates of the Fund were $262,701, $70,024, and $7,399 for management, distribution and service, and transfer agent fees, respectively.
E. Line of Credit Facility — As of June 30, 2013, the Fund participated in a $780,000,000 committed, unsecured revolving line of credit facility (the “facility”) together with other funds of the Trust and registered investment companies having management agreements with GSAM or its affiliates (“Other Borrowers”). Pursuant to the terms of the facility, the Fund and Other Borrowers could increase the credit amount by an additional $220,000,000, for a total of up to $1,000,000,000. This facility is to be used solely for temporary or emergency purposes, which may include the funding of redemptions. The interest rate on borrowings is based on the federal funds rate. The facility also requires a fee to be paid by the Fund based on the amount of the commitment that has not been utilized. For the six months ended June 30, 2013, the Fund did not have any borrowings under the facility. Prior to May 8, 2013, the committed amount available through the facility was $630,000,000.
F. Other Transactions with Affiliates — For the six months ended June 30, 2013, Goldman Sachs earned $226 in brokerage commissions from portfolio transactions.
5. PORTFOLIO SECURITIES TRANSACTIONS
The cost of purchases and proceeds from sales and maturities of long-term securities for the six months ended June 30, 2013, were $135,073,997 and $139,216,312, respectively.
17
GOLDMAN SACHS VARIABLE INSURANCE TRUST STRATEGIC GROWTH FUND
Notes to Financial Statements (continued)
June 30, 2013 (Unaudited)
6. TAX INFORMATION
As of the Fund’s most recent fiscal year end, December 31, 2012, the Fund’s capital loss carryforwards and certain timing differences, on a tax-basis were as follows:
| Capital loss carryforwards:(1) | ||||
Expiring 2016 | $ | (10,256,176 | ) | |
Expiring 2017 | (43,614,413 | ) | ||
| Total capital loss carryforwards | $ | (53,870,589 | ) | |
| Timing differences (Post October loss deferral) | $ | (1,048,023 | ) |
| (1) | Expiration occurs on December 31 of the year indicated. |
As of June 30, 2013, the Fund’s aggregate security unrealized gains and losses based on cost for U.S. federal income tax purposes were as follows:
| Tax cost | $ | 339,470,086 | ||
| Gross unrealized gain | 101,394,022 | |||
| Gross unrealized loss | (4,886,653 | ) | ||
| Net unrealized security gain | $ | 96,507,369 |
The difference between GAAP-basis and tax-basis unrealized gains (losses), as of the most recent fiscal year end, is attributable primarily to wash sales.
GSAM has reviewed the Fund’s tax positions for all open tax years (the current and prior three years, as applicable) and has concluded that no provision for income tax is required in the Fund’s financial statements. Such open tax years remain subject to examination and adjustment by tax authorities.
7. OTHER RISKS
The Fund’s risks include, but are not limited to, the following:
Shareholder Concentration Risk — Certain funds, accounts, individuals, or Goldman Sachs affiliates may from time to time own (beneficially or of record) or control a significant percentage of the Fund’s shares. Redemptions by these entities of their holdings in the Fund may impact the Fund’s liquidity and NAV. These redemptions may also force the Fund to sell securities.
Liquidity Risk — The Fund may make investments that are illiquid or that may become less liquid in response to market developments or adverse investor perceptions. Illiquid investments may be more difficult to value. Liquidity risk may also refer to the risk that a Fund will not be able to pay redemption proceeds within the allowable time period because of unusual market conditions, an unusually high volume of redemption requests, or other reasons. To meet redemption requests, the Fund may be forced to sell investments at an unfavorable time and/or under unfavorable conditions.
Market and Credit Risks — In the normal course of business, the Fund trades financial instruments and enters into financial transactions where risk of potential loss exists due to changes in the market (market risk). Additionally, the Fund may also be exposed to credit risk in the event that an issuer fails to perform or that an institution or entity with which the Fund has unsettled or open transactions defaults.
18
GOLDMAN SACHS VARIABLE INSURANCE TRUST STRATEGIC GROWTH FUND
8. INDEMNIFICATIONS
Under the Trust’s organizational documents, its Trustees, officers, employees and agents are indemnified, to the extent permitted by the Act and state law, against certain liabilities that may arise out of performance of their duties to the Fund. Additionally, in the course of business, the Fund enters into contracts that contain a variety of indemnification clauses. The Fund’s maximum exposure under these arrangements is unknown, as this would involve future claims that may be made against the Fund that have not yet occurred. However, GSAM believes the risk of loss under these arrangements to be remote.
9. SUBSEQUENT EVENTS
Subsequent events after the Statement of Assets and Liabilities date have been evaluated through the date the financial statements were issued. GSAM has concluded that there is no impact requiring adjustment or disclosure in the financial statements.
10. SUMMARY OF SHARE TRANSACTIONS
Share activity is as follows:
| For the Six Months Ended June 30, 2013 (Unaudited) | For the Fiscal Year Ended December 31, 2012 | |||||||||||||||
| Shares | Dollars | Shares | Dollars | |||||||||||||
| Institutional Shares | ||||||||||||||||
| Shares sold | 156,749 | $ | 2,313,478 | 423,916 | $ | 5,609,432 | ||||||||||
| Reinvestment of distributions | — | — | 52,249 | 723,126 | ||||||||||||
| Shares redeemed | (686,648 | ) | (10,249,268 | ) | (1,585,202 | ) | (21,069,391 | ) | ||||||||
| (529,899 | ) | (7,935,790 | ) | (1,109,037 | ) | (14,736,833 | ) | |||||||||
| Service Shares | ||||||||||||||||
| Shares sold | 1,510,223 | 22,391,450 | 3,030,601 | 40,173,789 | ||||||||||||
| Reinvestment of distributions | — | — | 98,565 | 1,362,167 | ||||||||||||
| Shares redeemed | (1,007,912 | ) | (14,997,816 | ) | (2,341,598 | ) | (31,052,703 | ) | ||||||||
| 502,311 | 7,393,634 | 787,568 | 10,483,253 | |||||||||||||
| NET DECREASE | (27,588 | ) | $ | (542,156 | ) | (321,469 | ) | $ | (4,253,580 | ) | ||||||
19
GOLDMAN SACHS VARIABLE INSURANCE TRUST STRATEGIC GROWTH FUND
| Fund Expenses — Six Month Period Ended June 30, 2013 (Unaudited) |
As a shareholder of Institutional or Service Shares of the Fund, you incur ongoing costs, including management fees, distribution and service (12b-1) fees (with respect to Service Shares) and other Fund expenses. This example is intended to help you understand your ongoing costs (in dollars) of investing in the Institutional Shares and Service Shares of the Fund and to compare these costs with the ongoing costs of investing in other mutual funds.
The example is based on an investment of $1,000 invested at the beginning of the period and held for the entire period from January 1, 2013 through June 30, 2013.
Actual Expenses — The first line under each share class in the table below provides information about actual account values and actual expenses. You may use the information in this line, together with the amount you invested, to estimate the expenses that you paid over the period. Simply divide your account value by $1,000 (for example, an $8,600 account value divided by $1,000=8.6), then multiply the result by the number in the first line under the heading entitled “Expenses Paid” to estimate the expenses you paid on your account during this period.
Hypothetical Example for Comparison Purposes — The second line under each share class in the table below provides information about hypothetical account values and hypothetical expenses based on the Fund’s actual net expense ratio and an assumed rate of return of 5% per year before expenses, which is not the Fund’s actual return. The hypothetical account values and expenses may not be used to estimate the actual ending account balance or expenses you paid for the period. You may use this information to compare the ongoing costs of investing in the Fund and other funds. To do so, compare this 5% hypothetical example with the 5% hypothetical examples that appear in the shareholder reports of the other funds.
Please note that the expenses shown in the table are meant to highlight your ongoing costs only. As a shareholder of the Fund you do not incur any transaction costs, such as sales charges, redemption fees, or exchange fees, but shareholders of other funds may incur such costs. The second line of the table is useful in comparing ongoing costs only, and will not help you determine the relative total costs of owning different funds whose shareholders may incur transaction costs.
| Share Class | Beginning Account Value 1/01/13 | Ending Account Value 6/30/13 | Expenses Paid for the | |||||||||
| Institutional | ||||||||||||
| Actual | $ | 1,000 | $ | 1,087.30 | $ | 4.14 | ||||||
| Hypothetical 5% return | 1,000 | 1,020.83 | + | 4.01 | ||||||||
| Service | ||||||||||||
| Actual | 1,000 | 1,085.20 | 5.48 | |||||||||
| Hypothetical 5% return | 1,000 | 1,019.54 | + | 5.31 | ||||||||
| * | Expenses are calculated using the Fund’s annualized net expense ratio for each class, which represents the ongoing expenses as a percentage of net assets for the six months ended June 30, 2013. Expenses are calculated by multiplying the annualized net expense ratio by the average account value for the period; then multiplying the result by the number of days in the most recent fiscal half year; and then dividing that result by the number of days in the fiscal year. The annualized net expense ratios for the period were 0.80% and 1.06% for the Institutional and Service Shares, respectively. |
| + | Hypothetical expenses are based on the Fund’s actual annualized net expense ratios and an assumed rate of return of 5% per year before expenses. |
20
GOLDMAN SACHS VARIABLE INSURANCE TRUST STRATEGIC GROWTH FUND
Statement Regarding Basis for Approval of Management Agreement (Unaudited)
Background
The Goldman Sachs Strategic Growth Fund (the “Fund”) is an investment portfolio of Goldman Sachs Variable Insurance Trust (the “Trust”). The Board of Trustees oversees the management of the Trust and reviews the investment performance and expenses of the Fund at regularly scheduled meetings held during the year. In addition, the Board of Trustees determines annually whether to approve the continuance of the Trust’s investment management agreement (the “Management Agreement”) with Goldman Sachs Asset Management, L.P. (the “Investment Adviser”) on behalf of the Fund.
The Management Agreement was most recently approved for continuation until June 30, 2014 by the Board of Trustees, including those Trustees who are not parties to the Management Agreement or “interested persons” (as defined in the Investment Company Act of 1940, as amended) of any party thereto (the “Independent Trustees”), at a meeting held on June 12-13, 2013 (the “Annual Meeting”).
The review process undertaken by the Trustees spans the course of the year and culminates with the Annual Meeting. To assist the Trustees in their deliberations, the Trustees have established a Contract Review Committee (the “Committee”), comprised of the Independent Trustees. The Committee held four meetings over the course of the year since the Management Agreement was last approved. At those Committee meetings, regularly scheduled Board or other committee meetings and/or the Annual Meeting, the Board, or the Independent Trustees, as applicable, considered matters relating to the Management Agreement, including:
| (a) | the nature and quality of the advisory, administrative and other services provided to the Fund by the Investment Adviser and its affiliates, including information about: |
| (i) | the structure, staff and capabilities of the Investment Adviser and its portfolio management teams; |
| (ii) | the groups within the Investment Adviser and its affiliates that support the portfolio management teams or provide other types of necessary services, including fund services groups (e.g., accounting and financial reporting, tax, shareholder services and operations), controls and risk management groups (e.g., legal, compliance, valuation oversight, credit risk management, internal audit, compliance testing, market risk analysis, finance and strategy and central funding), sales and distribution support groups and others (e.g., information technology and training); |
| (iii) | trends in headcount; |
| (iv) | the Investment Adviser’s financial resources and ability to hire and retain talented personnel and strengthen its operations; and |
| (v) | the parent company’s support of the Investment Adviser and its mutual fund business, as expressed by the firm’s senior management; |
| (b) | information on the investment performance of the Fund, including comparisons to the performance of a group of similar mutual funds, as provided by a third party mutual fund data provider engaged as part of the contract review process (the “Outside Data Provider”), its benchmark performance index, and a comparable institutional composite managed by the Investment Adviser, and general investment outlooks in the markets in which the Fund invests; |
| (c) | the terms of the Management Agreement and agreements with affiliated service providers entered into by the Trust on behalf of the Fund; |
| (d) | expense information for the Fund, including: |
| (i) | the relative management fee and expense level of the Fund as compared to those of comparable funds managed by other advisers, as provided by the Outside Data Provider; |
| (ii) | the Fund’s expense trends over time; and |
| (iii) | to the extent the Investment Adviser manages institutional accounts or collective investment vehicles having investment objectives and policies similar to those of the Fund, comparative information on the advisory fees charged and services provided to those accounts by the Investment Adviser; |
| (e) | with respect to the extensive investment performance and expense comparison data provided by the Outside Data Provider, its processes in producing that data for the Fund; |
| (f) | the undertakings of the Investment Adviser to waive certain fees and limit certain expenses of the Fund that exceed a specified level, and a summary of contractual fee reductions made by the Investment Adviser and its affiliates over the past several years with respect to the Fund; |
| (g) | information relating to the profitability of the Management Agreement and the transfer agency and distribution and service arrangements of the Fund and the Trust as a whole to the Investment Adviser and its affiliates; |
| (h) | whether the Fund’s existing management fee schedule adequately addressed any economies of scale; |
| (i) | a summary of the “fall-out” benefits derived by the Investment Adviser and its affiliates from their relationships with the Fund, including the fees received by the Investment Adviser’s affiliates from the Fund for transfer agency, portfolio trading, distribution and other services; |
21
GOLDMAN SACHS VARIABLE INSURANCE TRUST STRATEGIC GROWTH FUND
Statement Regarding Basis for Approval of Management Agreement (Unaudited) (continued)
| (j) | a summary of potential benefits derived by the Fund as a result of its relationship with the Investment Adviser; |
| (k) | information regarding commissions paid by the Fund and broker oversight, an update on the Investment Adviser’s soft dollars practices, other information regarding portfolio trading and how the Investment Adviser carries out its duty to seek best execution; |
| (l) | the manner in which portfolio manager compensation is determined, and the number and types of accounts managed by the portfolio managers; |
| (m) | the nature and quality of the services provided to the Fund by its unaffiliated service providers, and the Investment Adviser’s general oversight and evaluation (including reports on due diligence) of those service providers as part of the administration services provided under the Management Agreement; and |
| (n) | the Investment Adviser’s processes and policies addressing various types of potential conflicts of interest; its approach to risk management; the annual review of the effectiveness of the Fund’s compliance program; and periodic compliance reports. |
The Trustees also received an overview of the Fund’s distribution arrangements. They received information regarding the Fund’s assets, share purchase and redemption activity and the payment of Rule 12b-1 distribution and service fees by the Fund’s Service Shares. Information was also provided to the Trustees relating to revenue sharing payments made by and services provided by the Investment Adviser and its affiliates to intermediaries that promote the sale, distribution and/or servicing of Fund shares.
The presentations made at the Board and Committee meetings and at the Annual Meeting encompassed the Fund and other mutual fund portfolios for which the Board of Trustees has responsibility. In evaluating the Management Agreement at the Annual Meeting, the Trustees relied upon their knowledge, resulting from their meetings and other interactions throughout the year, of the Investment Adviser, its affiliates, their services and the Fund. In conjunction with these meetings, the Trustees received written materials and oral presentations on the topics covered, and were advised by their independent legal counsel regarding their responsibilities and other regulatory requirements related to the approval and continuation of mutual fund investment management agreements under applicable law. In addition, the Investment Adviser and its affiliates provided the Independent Trustees with a written response to a formal request for information sent on behalf of the Independent Trustees by their independent legal counsel. During the course of their deliberations, the Independent Trustees met in executive sessions with their independent legal counsel, without representatives of the Investment Adviser or its affiliates present. The Independent Trustees also discussed the broad range of other investment choices that are available to Fund investors, including the availability of comparable funds managed by other advisers.
Nature, Extent and Quality of the Services Provided Under the Management Agreement
As part of their review, the Trustees considered the nature, extent and quality of the services provided by the Investment Adviser. In this regard, the Trustees considered both the investment advisory services and non-advisory services that are provided to the Fund by the Investment Adviser and its affiliates. The Trustees noted the transition in the leadership and changes in personnel of various of the Investment Adviser’s portfolio management teams that had occurred in recent periods, and the ongoing recruitment efforts aimed at bringing high quality investment talent to the Investment Adviser. The Trustees concluded that the Investment Adviser continued to commit substantial financial and operational resources to the Fund and expressed confidence that the Investment Adviser would continue to do so in the future. The Trustees also recognized that the Investment Adviser had made significant commitments to address regulatory compliance requirements applicable to the Fund and the Investment Adviser.
Investment Performance
The Trustees also considered the investment performance of the Fund. In this regard, they compared the investment performance of the Fund to its peers using rankings and ratings compiled by the Outside Data Provider as of December 31, 2012, and updated performance information prepared by the Investment Adviser using the peer group identified by the Outside Data Provider as of March 31, 2013. The information on the Fund’s investment performance was provided for the one-, three-, five- and ten-year periods ending on the applicable dates. The Trustees also reviewed the Fund’s investment performance over time (including on a year-by-year basis) relative to its performance benchmark. In addition, they considered the investment performance trends of the Fund over time, and reviewed the investment performance of the Fund in light of its investment objective and policies and market conditions. The Trustees also received information comparing the Fund’s performance to that of a comparable institutional composite managed by the Investment Adviser.
In addition, the Trustees considered materials prepared and presentations made by the Investment Adviser’s senior management and portfolio management personnel, in which Fund performance was assessed. The Trustees also considered the Investment Adviser’s periodic reports with respect to the Fund’s risk profile, and how the Investment Adviser’s approach to risk monitoring and management influences portfolio management.
22
GOLDMAN SACHS VARIABLE INSURANCE TRUST STRATEGIC GROWTH FUND
Statement Regarding Basis for Approval of Management Agreement (Unaudited) (continued)
The Trustees observed that the Fund’s Service Shares had placed in the top half of the Fund’s peer group for the one- and five-year periods and in the third quartile for the three-year period, and had outperformed the Fund’s benchmark index for the one-year period and underperformed for the three- and five-year periods ended March 31, 2013. The Trustees noted that the Fund experienced improved performance for the one-year period ended March 31, 2013. They considered the generally positive effects of certain personnel and process enhancements made at the end of 2011, as well as the addition of certain key hires, but noted the departure of several senior portfolio management personnel in April 2013.
Costs of Services Provided and Competitive Information
The Trustees considered the contractual terms of the Management Agreement and the fee rates payable by the Fund thereunder. In this regard, the Trustees considered information on the services rendered by the Investment Adviser to the Fund, which included both advisory and administrative services that were directed to the needs and operations of the Fund as a registered mutual fund.
In particular, the Trustees reviewed analyses prepared by the Outside Data Provider regarding the expense rankings of the Fund. The analyses provided a comparison of the Fund’s management fees and breakpoints to those of a relevant peer group and a category universe; an expense analysis which compared the Fund’s overall net and gross expenses to a peer group and a category universe; and a five-year history comparing the Fund’s net expenses to the peer and category medians. The analyses also compared the Fund’s transfer agency, custody, and distribution fees, other expenses and fee waivers/reimbursements to those of the peer group and category medians. The Trustees concluded that the comparisons provided by the Outside Data Provider were useful in evaluating the reasonableness of the management fees and total expenses paid by the Fund.
In addition, the Trustees considered the Investment Adviser’s undertakings to waive a portion of its management fee and limit certain expenses of the Fund that exceed a specified level. They also considered, to the extent that the Investment Adviser manages institutional accounts or collective investment vehicles having investment objectives and policies similar to those of the Fund, comparative fee information for services provided by the Investment Adviser to those accounts, and information that indicated that services provided to the Fund differed in various significant respects from the services provided to institutional accounts, which generally operated under less stringent legal and regulatory structures, required fewer services from the Investment Adviser to a smaller number of client contact points, were less time-intensive and paid lower fees.
In addition, the Trustees noted that shareholders are able to redeem their Fund shares at any time if they believe that the Fund fees and expenses are too high or if they are dissatisfied with the performance of the Fund.
Profitability
The Trustees reviewed the Investment Adviser’s revenues and pre-tax profit margins with respect to the Trust and the Fund. In this regard the Trustees noted that they had received, among other things, profitability analyses and summaries, revenue and expense schedules by Fund and by function (i.e., investment management, transfer agency and distribution and service) and the Investment Adviser’s expense allocation methodology. They observed that the profitability and expense figures are substantially similar to those used by the Investment Adviser for many internal purposes, including compensation decisions among various business groups, and are thus subject to a vigorous internal debate about how certain revenue and expenses should be allocated. The Trustees also reviewed the report of the internal audit group within the Goldman Sachs organization, which included an assessment of the reasonableness and consistency of the Investment Adviser’s expense allocation methodology and an evaluation of the accuracy of the Investment Adviser’s profitability analysis calculations. Profitability data for the Trust and the Fund were provided for 2012 and 2011, and the Trustees considered this information in relation to the Investment Adviser’s overall profitability. The Trustees considered the Investment Adviser’s revenues and pre-tax profit margins both in absolute terms and in comparison to information on the reported pre-tax profit margins earned by certain other asset management firms.
Economies of Scale
The Trustees considered the information that had been provided regarding the Investment Adviser’s profitability. The Trustees also considered the breakpoints in the fee rate payable under the Management Agreement for the Fund at the following annual percentage rates of the average daily net assets of the Fund:
| First $1 billion | 0.75 | % | ||
| Next $1 billion | 0.68 | |||
| Next $3 billion | 0.65 | |||
| Next $3 billion | 0.64 | |||
| Over $8 billion | 0.63 |
23
GOLDMAN SACHS VARIABLE INSURANCE TRUST STRATEGIC GROWTH FUND
Statement Regarding Basis for Approval of Management Agreement (Unaudited) (continued)
The Trustees noted that the breakpoints were meant to share potential economies of scale, if any, with the Fund and its shareholders as assets under management reach those asset levels. The Trustees considered the amounts of assets in the Fund; the Fund’s recent share purchase and redemption activity; the information provided by the Investment Adviser relating to the costs of the services provided by the Investment Adviser and its affiliates and their realized profits; information comparing fee rates charged by the Investment Adviser with fee rates charged to other funds in the peer group; and the Investment Adviser’s undertakings to waive certain fees and limit certain expenses of the Fund that exceed a specified level. Upon reviewing these matters at the Annual Meeting, the Trustees concluded that the fee breakpoints represented a means of assuring that benefits of scalability, if any, would be passed along to shareholders at the specified asset levels.
Other Benefits to the Investment Adviser and Its Affiliates
The Trustees also considered the other benefits derived by the Investment Adviser and its affiliates from their relationship with the Fund as stated above, including: (a) transfer agency fees received by Goldman, Sachs & Co. (“Goldman Sachs”); (b) brokerage and futures commissions earned by Goldman Sachs for executing securities and futures transactions on behalf of the Fund; (c) research received by the Investment Adviser from broker-dealers in exchange for executing certain transactions on behalf of the Fund; (d) trading efficiencies resulting from aggregation of orders of the Fund with those for other funds or accounts managed by the Investment Adviser; (e) the Investment Adviser’s ability to leverage the infrastructure designed to service the Fund on behalf of its other clients; (f) the Investment Adviser’s ability to cross-market other products and services to Fund shareholders; (g) Goldman Sachs’ retention of certain fees as Fund Distributor; (h) the Investment Adviser’s ability to negotiate better pricing with custodians on behalf of its other clients, as a result of the relationship with the Fund; and (i) the possibility that the working relationship between the Investment Adviser and the Fund’s third party service providers may cause those service providers to be open to doing business with other areas of Goldman Sachs. In the course of considering the foregoing, the Independent Trustees requested and received further information quantifying certain of these fall-out benefits.
Other Benefits to the Fund and Its Shareholders
The Trustees also noted that the Fund receives certain potential benefits as a result of its relationship with the Investment Adviser, including: (a) trading efficiencies resulting from aggregation of orders of the Fund with those of other funds or accounts managed by the Investment Adviser; (b) improved servicing from vendors because of the volume of business generated by the Investment Adviser and its affiliates; (c) improved servicing from broker-dealers because of the volume of business generated by the Investment Adviser and its affiliates; (d) the Investment Adviser’s ability to negotiate favorable terms with derivatives counterparties as a result of the size and reputation of the Goldman Sachs organization; (e) the Investment Adviser’s knowledge and experience gained from managing other accounts and products; (f) the Investment Adviser’s ability to hire and retain qualified personnel to provide services to the Fund because of the reputation of the Goldman Sachs organization; (g) the Fund’s access, through the Investment Adviser, to certain firmwide resources (e.g., proprietary risk management systems and databases), subject to certain restrictions; and (h) the Fund’s access to certain affiliated distribution channels. The Trustees noted the competitive nature of the mutual fund marketplace, and noted further that many of the Fund’s shareholders invested in the Fund in part because of the Fund’s relationship with the Investment Adviser and that those shareholders have a general expectation that the relationship will continue.
Conclusion
In connection with their consideration of the Management Agreement, the Trustees gave weight to each of the factors described above, but did not identify any particular factor as controlling their decision. After deliberation and consideration of all of the information provided, including the factors described above, the Trustees concluded, in the exercise of their business judgment, that the management fees paid by the Fund were reasonable in light of the services provided to it by the Investment Adviser, the Investment Adviser’s costs and the Fund’s current and reasonably foreseeable asset levels. The Trustees unanimously concluded that the Investment Adviser’s continued management likely would benefit the Fund and its shareholders and that the Management Agreement should be approved and continued with respect to the Fund until June 30, 2014.
24
| TRUSTEES | OFFICERS | |
| Ashok N. Bakhru, Chairman | James A. McNamara, President | |
| Donald C. Burke | George F. Travers, Principal Financial Officer | |
| John P. Coblentz, Jr. | Caroline L. Kraus, Secretary | |
| Diana M. Daniels | Scott M. McHugh, Treasurer | |
| Joseph P. LoRusso | ||
| James A. McNamara | ||
| Jessica Palmer | ||
| Alan A. Shuch | ||
| Richard P. Strubel |
GOLDMAN, SACHS & CO.
Distributor and Transfer Agent
GOLDMAN SACHS ASSET MANAGEMENT, L.P.
Investment Adviser
200 West Street, New York
New York 10282
Visit our web site at www.goldmansachsfunds.com/vit to obtain the most recent month-end returns.
The reports concerning the Fund included in this shareholder report may contain certain forward-looking statements about the factors that may affect the performance of the Fund in the future. These statements are based on Fund management’s predictions and expectations concerning certain future events and their expected impact on the Fund, such as performance of the economy as a whole and of specific industry sectors, changes in the levels of interest rates, the impact of developing world events, and other factors that may influence the future performance of the Fund. Management believes these forward-looking statements to be reasonable, although they are inherently uncertain and difficult to predict. Actual events may cause adjustments in portfolio management strategies from those currently expected to be employed.
A description of the policies and procedures that the Fund uses to determine how to vote proxies relating to portfolio securities and information regarding how the Fund voted proxies relating to portfolio securities for the 12-month period ended June 30 is available (i) without charge, upon request by calling 1-800-621-2550; and (ii) on the Securities and Exchange Commission (“SEC”) web site at http://www.sec.gov.
The Fund files its complete schedule of portfolio holdings with the SEC for the first and third quarters of each fiscal year on Form N-Q. The Fund’s Form N-Q is available on the SEC’s web site at http://www.sec.gov within 60 days after the Fund’s first and third fiscal quarters. The Fund’s Forms N-Q may be reviewed and copied at the SEC’s Public Reference Room in Washington, D.C. and information on the operation of the Public Reference Room may also be obtained by calling 1-800-SEC-0330. Forms N-Q may be obtained upon request and without charge by calling 1-800-621-2550.
Holdings and allocations shown are as of June 30, 2013 and may not be representative of future investments. Fund holdings should not be relied on in making investment decisions and should not be construed as research or investment advice regarding particular securities. Current and future holdings are subject to risk.
The Global Industry Classification Standard (“GICS”) was developed by and is the exclusive property and a service mark of Morgan Stanley Capital International Inc. (“MSCI”) and Standard & Poor’s, a division of The McGraw-Hill Companies, Inc. (“S&P”) and is licensed for use by Goldman Sachs. Neither MSCI, S&P nor any other party involved in making or compiling the GICS or any GICS classifications makes any express or implied warranties or representations with respect to such standard or classification (or the results to be obtained by the use thereof), and all such parties hereby expressly disclaim all warranties of originality, accuracy, completeness, merchantability or fitness for a particular purpose with respect to any of such standard or classification. Without limiting any of the foregoing, in no event shall MSCI, S&P, any of their affiliates or any third party involved in making or compiling the GICS or any GICS classifications have any liability for any direct, indirect, special, punitive, consequential or any other damages (including lost profits) even if notified of the possibility of such damages.
The portfolio risk management process includes an effort to monitor and manage risk, but does not imply low risk.
Shares of the Goldman Sachs VIT Funds are offered to separate accounts of participating life insurance companies for the purpose of funding variable annuity contracts and variable life insurance policies. Shares of the Fund are not offered directly to the general public. The variable annuity contracts and variable life insurance policies are described in the separate prospectuses issued by participating insurance companies. You should refer to those prospectuses for information about surrender charges, mortality and expense risk fees and other charges that may be assessed by participating insurance companies under the variable annuity contracts or variable life insurance policies. Such fees or charges, if any, may affect the return you may realize with respect to your investments. Ask your representative for more complete information. Please consider a fund’s objectives, risks and charges and expenses, and read the prospectus carefully before investing. The prospectus contains this and other information about the Fund.
This material is not authorized for distribution to prospective investors unless preceded or accompanied by a current Prospectus or summary prospectus, if applicable. Investors should consider a Fund’s objective, risks, and charges and expenses, and read the summary prospectus, if available, and/or the Prospectus carefully before investing or sending money. The summary prospectus, if available, and the Prospectus contain this and other information about a Fund and may be obtained from your Authorized Institution or from Goldman, Sachs & Co. by calling 1-800-621-2550.
This report is prepared for the general information of contract owners and is not an offer of shares of the Goldman Sachs Variable Insurance Trust: Goldman Sachs Strategic Growth Fund.
©2013 Goldman Sachs. All rights reserved.
VITGRWSAR13/106651.MF.MED.TMPL/8/2013
Goldman
Sachs Variable Insurance Trust
Goldman Sachs
Strategic International Equity Fund
Semi-Annual Report
June 30, 2013

GOLDMAN SACHS VARIABLE INSURANCE TRUST STRATEGIC INTERNATIONAL EQUITY FUND
Principal Investment Strategies and Risks
This is not a complete list of risks that may affect the Fund. For additional information concerning the risks applicable to the Fund, please see the Fund’s Prospectus.
Shares of the Goldman Sachs Variable Insurance Trust — Goldman Sachs Strategic International Equity Fund are offered to separate accounts of participating life insurance companies for the purpose of funding variable annuity contracts and variable life insurance policies. Shares of the Fund are not offered directly to the general public. The variable annuity contracts and variable life insurance policies are described in the separate prospectuses issued by participating insurance companies. You should refer to those prospectuses for information about surrender charges, mortality and expense risk fees and other charges that may be assessed by participating insurance companies under the variable annuity contracts or variable life insurance policies. Such fees or charges, if any, may affect the return you realize with respect to your investments. Ask your representative for more complete information. Please consider the Fund’s objective, risks and charges and expenses, and read the Prospectus carefully before investing. The Prospectus contains this and other information about the Fund.
The Goldman Sachs Strategic International Equity Fund invests primarily in a diversified portfolio of equity investments in companies that are organized outside the United States or whose securities are principally traded outside the United States. The Fund’s equity investments are subject to market risk, which means that the value of the securities in which it invests may go up or down in response to the prospects of individual companies, particular sectors and/or general economic conditions. Foreign and emerging markets investments may be more volatile and less liquid than investments in U.S. securities and are subject to the risks of currency fluctuations and adverse economic or political developments.
1
GOLDMAN SACHS VARIABLE INSURANCE TRUST STRATEGIC INTERNATIONAL EQUITY FUND
INVESTMENT OBJECTIVE
The Fund seeks long-term growth of capital.
Portfolio Management Discussion and Analysis
Below, the Goldman Sachs International Equity Portfolio Management Team discusses the Goldman Sachs Variable Insurance Trust — Goldman Sachs Strategic International Equity Fund’s (the “Fund”) performance and positioning for the six-month period ended June 30, 2013 (the “Reporting Period”).
How did the Fund perform during the Reporting Period?
During the Reporting Period, the Fund’s Institutional and Service Shares generated cumulative total returns of 5.85% and 5.60%, respectively. These returns compare to the 4.10% cumulative total return of the Fund’s benchmark, the MSCI Europe, Australasia, Far East (EAFE) Index (net, unhedged) (the “MSCI EAFE Index”), during the same time period.
What economic and market factors most influenced the international equity markets as a whole during the Reporting Period?
International equities, as measured by the MSCI EAFE Index, gained 4.10% in U.S. dollar terms during the Reporting Period, extending their rally from 2012 for much of the Reporting Period before bullish sentiment began to fade in mid-May 2013.
European equity markets managed gains during the Reporting Period, despite a banking crisis in Cyprus and further economic contraction in the Eurozone. Strong performance by the Japanese equity market dominated returns for the Reporting Period but was partially offset by weaker returns for the Asia ex-Japan region, where such returns were exaggerated by depreciating currencies. The yen weakened to its lowest level against the U.S. dollar since mid-2009 on expectations the new head of the Bank of Japan will aggressively pursue a 2% inflation target. Japanese equities hit a five-year high during May 2013 before taking a sharp turn down with a number of other global equity markets.
In mid-May, U.S. Federal Reserve (“Fed”) Chair Bernanke announced the potential “tapering” of the pace of quantitative easing asset purchases, which led to a virtual halt in the broad global equity market rally. Equity markets, both in the U.S. and internationally, reacted negatively again in June to news the slowing of the asset purchase program could begin later this year, with the program ending by the middle of 2014 if the economy grows as expected.
In China, a sharp spike in interbank lending rates in June 2013 further pressured global equity markets. Concerns that tighter monetary conditions would exacerbate an already slowing Chinese economy weakened commodity prices.
Largely as a result of concerns about slowing demand from China and its impact on commodities, the materials and energy sectors were the only sectors in the MSCI EAFE Index to post negative returns during the Reporting Period as a whole. The consumer discretionary and health care sectors posted the best performance.
What key factors were responsible for the Fund’s performance during the Reporting Period?
The Fund’s outperformance of the MSCI EAFE Index during the Reporting Period can be primarily attributed to individual stock selection.
What were some of the Fund’s best-performing individual stocks?
The greatest contributors to Fund performance relative to the MSCI EAFE Index during the Reporting Period were Japanese financials firm Sumitomo Mitsui Financial Group, Japanese food retailer Seven & I Holdings and Swedish communications equipment company Ericsson.
Sumitomo Mitsui Financial Group performed well based on good fundamentals. Its securities business was particularly solid on the back of a strong market recovery. It also incurred trading gains of exchange-traded funds and fixed income. Sales of investment trusts to the retail market also boosted the firm’s results, as individual investors’ interest in the equity market heightened.
Seven & I Holdings was a top contributor to the Fund’s results during the Reporting Period. Its stock gained ground on a positive earnings forecast at the beginning of 2013, which exceeded expectations. As the stock had appreciated significantly, we opted to sell the Fund’s position in Seven & I Holdings by the end of the Reporting Period, taking profits.
2
GOLDMAN SACHS VARIABLE INSURANCE TRUST STRATEGIC INTERNATIONAL EQUITY FUND
Ericsson, the world’s largest maker of wireless network equipment, was also a top contributor to the Fund’s performance during the Reporting Period. The company saw its sales and profit margin increase sharply in the fourth quarter of 2012 and beat estimates. Specifically, its earnings report showed its sales in North America grew by 51%, as wireless operators increased their spending to adapt to a growing trend in data consumption. We believe this data consumption should trend to continue over the long term and still believed at the end of the Reporting Period that Ericsson was well positioned to benefit.
Which stocks detracted significantly from the Fund’s performance during the Reporting Period?
The biggest detractors from Fund performance relative to the MSCI EAFE Index during the Reporting Period were U.K. diversified mining company Rio Tinto, French oilfield services company CGG and Japanese building and home improvement materials producer Lixil Group.
Rio Tinto, a world leader in mining mineral resources, detracted from the Fund’s results during the Reporting Period. Iron ore prices were weak, moving from a high of $160 per metric ton at the end of January to $110 per metric ton in May. This price weakness, along with negative sentiment on China regarding demand, caused Rio Tinto’s share price to decline.
CGG was also a top detractor from the Fund’s performance during the Reporting Period. The company reported fourth quarter 2012 results that were modestly disappointing, and its 2013 earnings forecast was 10% to 15% below expectations. Despite this weakness, our long-term conviction in the stock remained unchanged at the end of the Reporting Period, and we continued to believe that as oil becomes increasingly difficult to find, seismic exploration methods, in which CGG specializes, may well become more utilized.
Lixil Group lagged the MSCI EAFE Index because investors had concerns the company might miss its guidance. There had been delays in launching a new product and cost reduction efforts did not go as well as anticipated as Lixil Group was found to be increasing employee bonuses. As a result, Lixil Group’s earnings momentum was not as strong as expected, and the stock underperformed. We sold the Fund’s position in Lixil Group by the end of the Reporting Period.
Which equity market sectors most significantly affected Fund performance?
Effective security selection within the financials, health care and consumer staples sectors contributed positively to the Fund’s performance relative to the MSCI EAFE Index during the Reporting Period. The Fund’s overweighted position in the comparatively strong health care sector relative to the MSCI EAFE Index also added value.
Security selection in the consumer discretionary sector and having a modestly underweighted position in the comparatively stronger energy sector compared to the MSCI EAFE Index detracted most from the Fund’s relative results during the Reporting Period. These were the only two sectors that detracted from Fund results on a relative basis during the Reporting Period.
Which countries or regions most affected the Fund’s performance during the Reporting Period?
Typically, the Fund’s individual stock holdings will significantly influence the Fund’s performance within a particular country or region relative to the MSCI EAFE Index. This effect may be even more pronounced in countries that represent only a modest proportion of the MSCI Index.
That said, the Fund’s underweighted position and effective stock selection in Australia and strong stock selection in Sweden and Germany contributed most positively to the Fund’s returns relative to the MSCI EAFE Index. The countries that detracted most from the Fund’s performance during the Reporting Period were India, Japan and Belgium, where positioning overall hurt.
How did the Fund use derivatives and similar instruments during the Reporting Period?
During the Reporting Period, we did not use derivatives to hedge positions or as part of an active management strategy, but we used index futures, on an opportunistic basis, to ensure the portfolio remained almost fully exposed to equities following cash inflows or stock sales.
Did the Fund make any significant purchases or sales during the Reporting Period?
During the Reporting Period, we established Fund positions in Australia & New Zealand Banking Group, Sanofi and Japan Tobacco, as we believe each is a quality company with an attractive valuation.
We established a Fund position in banking and financial services company Australia & New Zealand Banking Group because we believe the company’s Asia business, which accounts for approximately one-fourth of its revenues, is well positioned to continue to provide stable revenues and long-term growth opportunities. The company has also recently stabilized its cost base, so we are expecting this to come through in its margins over the near term.
3
GOLDMAN SACHS VARIABLE INSURANCE TRUST STRATEGIC INTERNATIONAL EQUITY FUND
We initiated a Fund position in Sanofi, a France-based global pharmaceutical company, because of its focus on “long duration assets,” which we characterize as less reliant on cyclical research and development investment and/or less exposed to intellectual property erosion. These long-term assets currently represent 60% of Sanofi’s sales, and we believe this proportion may grow to exceed this number by 2016. Compared to its peers, the company has high and diversified exposure to emerging markets.
We purchased shares of Japan Tobacco based on our expectations of its relatively stable single-digit growth, as driven by emerging market demand and price increases in its domestic market. We also expect Japan Tobacco’s dividend payout ratio to increase to 40% in 2014 and to 50%* in 2017.
We exited the Fund’s positions in Westpac Banking, Vinci and Toyota Motor during the Reporting Period. The stocks of Australian banking and financial services company Westpac Banking, French concessions and construction company Vinci and Japanese automobile manufacturer Toyota Motor had been performing well, so we decided to exit the Fund’s positions to take profits and invest in other opportunities.
Were there any notable changes in the Fund’s weightings during the Reporting Period?
In constructing the Fund’s portfolio, we focus on picking stocks rather than on making regional, country, sector or industry bets. We seek to outpace the benchmark index by overweighting stocks that we expect to outperform and underweighting those that we think may lag. Consequently, changes in its sector or country weights are generally the direct result of individual stock selection or of stock appreciation or depreciation. That said, there were no notable changes in the Fund’s sector or country weightings during the Reporting Period.
How was the Fund positioned relative to its benchmark index at the end of the Reporting Period?
At the end of June 2013, the Fund had greater weightings than the MSCI EAFE Index in the health care and information technology sectors. The Fund had underweighted allocations to the industrials, financials and utilities sectors and was rather neutrally weighted to the MSCI EAFE Index in the telecommunication services, consumer staples, energy, consumer discretionary and materials sectors at the end of the Reporting Period.
From a country perspective, the Fund had greater positions in France, Russia, Belgium, Finland, Taiwan, South Korea and China relative to the MSCI EAFE Index at the end of June 2013. The Fund had less exposure to Germany, Australia, Italy, Japan, Spain, Sweden and Hong Kong than the MSCI EAFE Index at the end of the Reporting Period. On the same date, the Fund had rather neutral exposures to the remaining components of the MSCI EAFE Index.
As always, we remained focused on individual stock selection, with sector and country positioning being a secondary, but closely monitored, effect.
What is the Fund’s tactical view and strategy for the months ahead?
At the end of the Reporting Period, we saw the global economic environment as uncertain, and we expected weak economic growth overall going forward. However, at the same time, we believe there are companies in all regions of the world that can grow faster than the global GDP average, which for 2013 we estimate to be 3.5%, and stocks that will return more than the broader market averages.
With the uncertainty in the markets, we believe our focus on companies with high quality balance sheets and secular growth opportunities should serve the Fund and its shareholders well. Uncertainty can create more opportunities for us to establish positions in quality stocks at compelling valuations. We were also, at the end of the Reporting Period, encouraged by the level of cash generation and profitability of companies.
Of course, we fully acknowledge that in addition to worries around weak global economic growth, other macro headwinds exist, including political uncertainty and sovereign debt concerns in Europe. However, given these macro concerns and the opportunities they may create, we believe fundamental analysis is even more critical in selecting companies that exhibit characteristics of what we deem to be a quality company. In our view, the micro environment is being masked by the negativity surrounding the macro situation. In addition to a focus on valuations, we seek companies that are differentiated, defendable and capable. As always, we continue to focus on building the Fund’s quality portfolio through intense bottom-up research and believe such a disciplined strategy should help us position the Fund effectively in these still uncertain times.
| * | Dividends are not guaranteed and a company’s future ability to pay dividends may be limited. |
4
FUND BASICS
Strategic International Equity Fund
as of June 30, 2013
STANDARDIZED TOTAL RETURNS1
| For the period ended 6/30/13 | One Year | Five Years | Ten Years | Since Inception | Inception Date | |||||||||||||
| Institutional | 19.22 | % | -0.69 | % | 5.70 | % | 3.41 | % | 1/12/98 | |||||||||
| Service | 18.93 | -0.95 | N/A | 0.40 | 1/09/06 | |||||||||||||
| 1 | The Standardized Total Returns are average annual total returns as of the most recent calendar quarter-end. They assume reinvestment of all distributions at net asset value (“NAV”). Because Institutional and Service Shares do not involve a sales charge, such a charge is not applied to their Standardized Total Returns. |
Total return figures in the above chart represent past performance and do not indicate future results, which will vary. The investment return and principal value of an investment will fluctuate and, therefore, an investor’s shares, when redeemed, may be worth more or less than their original cost. Current performance may be lower or higher than the total return figures in the above chart. Please visit www.goldmansachsfunds.com/vit to obtain the most recent month-end returns. Performance reflects fee waivers and/or expense limitations in effect during the periods shown. In their absence, performance would be reduced.
EXPENSE RATIOS2
| Net Expense Ratio (Current) | Gross Expense Ratio (Before Waivers) | |||||||
| Institutional | 0.99 | % | 1.05 | % | ||||
| Service | 1.24 | 1.30 | ||||||
| 2 | The expense ratios of the Fund, both current (net of applicable fee waivers and/or expense limitations) and before waivers (gross of applicable fee waivers and/or expense limitations), are as set forth above according to the most recent publicly available Prospectus for the Fund and may differ from the expense ratios disclosed in the Financial Highlights in this report. The Fund’s waivers and/or expense limitations will remain in place through at least April 30, 2014, and prior to such date the Investment Adviser may not terminate the arrangements without the approval of the Fund’s Board of Trustees. If these arrangements are discontinued in the future, the expense ratios may change without shareholder approval. |
TOP TEN HOLDINGS AS OF 6/30/133
| Holding | % of Net Assets | Line of Business | Country | |||
| Vodafone Group PLC | 3.3% | Telecommunication Services | United Kingdom | |||
| HSBC Holdings PLC | 3.2 | Banks | United Kingdom | |||
| Rio Tinto PLC | 2.5 | Materials | United Kingdom | |||
| Novartis AG (Registered) | 2.4 | Pharmaceuticals, Biotechnology & Life Sciences | Switzerland | |||
| Sumitomo Mitsui Financial Group, Inc. | 2.4 | Banks | Japan | |||
| Australia & New Zealand Banking Group Ltd. | 2.4 | Banks | Australia | |||
| Sanofi | 2.3 | Pharmaceuticals, Biotechnology & Life Sciences | France | |||
| Roche Holding AG | 2.3 | Pharmaceuticals, Biotechnology & Life Sciences | Switzerland | |||
| BNP Paribas SA | 2.1 | Banks | France | |||
| Anheuser-Busch InBev NV | 2.0 | Food, Beverage & Tobacco | Belgium |
| 3 | The top ten holdings may not be representative of the Fund’s future investments. |
5
FUND BASICS
FUND vs. BENCHMARK SECTOR ALLOCATIONS4
As of June 30, 2013
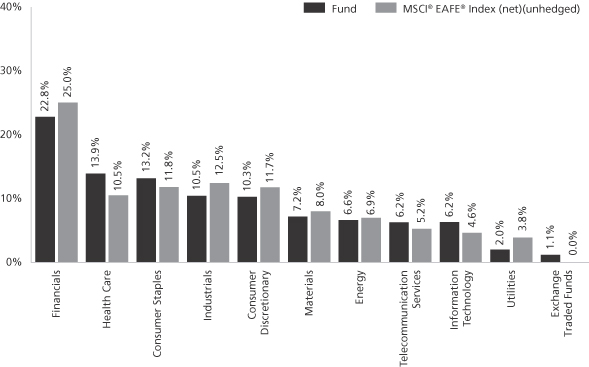
| 4 | The Fund is actively managed and, as such, its composition may differ over time. Consequently, the Fund’s overall sector allocations may differ from percentages contained in the graph above. The graph categorizes investments using Global Industry Classification Standard (“GICS”), however, the sector classifications used by the portfolio management team may differ from GICS. Underlying sector allocations of exchange traded funds (“ETFs”) held by the Fund are not reflected in the graph above. The percentage shown for each investment category reflects the value of investments in that category as a percentage of market value. The graph depicts the Fund’s investments but may not represent the Fund’s market exposure due to the exclusion of certain derivatives, if any, as listed in the Additional Investment Information section of the Schedule of Investments. |
6
GOLDMAN SACHS VARIABLE INSURANCE TRUST STRATEGIC INTERNATIONAL EQUITY FUND
Schedule of Investments
June 30, 2013 (Unaudited)
| Shares | Description | Value | ||||||
| Common Stocks – 97.6% | ||||||||
| Australia – 4.9% |
| ||||||
| 399,233 | Aurizon Holdings Ltd. (Transportation) | $ | 1,516,498 | |||||
| 180,609 | Australia & New Zealand Banking Group Ltd. (Banks) | 4,688,494 | ||||||
| 275,952 | Computershare Ltd. (Software & Services) | 2,587,332 | ||||||
| 400,500 | PanAust Ltd. (Materials) | 664,000 | ||||||
|
| |||||||
| 9,456,324 | ||||||||
|
| |||||||
| Belgium – 3.4% |
| ||||||
| 43,794 | Anheuser-Busch InBev NV (Food, Beverage & Tobacco) | 3,942,915 | ||||||
| 20,707 | Solvay SA (Materials) | 2,711,357 | ||||||
|
| |||||||
| 6,654,272 | ||||||||
|
| |||||||
| Denmark – 1.6% |
| ||||||
| 19,483 | Novo Nordisk A/S Class B (Pharmaceuticals, Biotechnology & Life Sciences) | 3,028,875 | ||||||
|
| |||||||
| Finland – 2.5% |
| ||||||
| 93,672 | Fortum Oyj (Utilities) | 1,754,790 | ||||||
| 74,258 | Nokian Renkaat Oyj (Automobiles & Components) | 3,021,653 | ||||||
|
| |||||||
| 4,776,443 | ||||||||
|
| |||||||
| France – 13.6% |
| ||||||
| 19,659 | Air Liquide SA (Materials) | 2,427,885 | ||||||
| 13,380 | Air Liquide SA-Prime De Fidelite (Materials)* | 1,652,429 | ||||||
| 101,529 | AXA SA (Insurance) | 2,001,412 | ||||||
| 73,750 | BNP Paribas SA (Banks) | 4,037,449 | ||||||
| 62,457 | CGGVeritas (Energy)* | 1,383,861 | ||||||
| 20,844 | LVMH Moet Hennessy Louis Vuitton SA (Consumer Durables & Apparel) | 3,384,117 | ||||||
| 63,057 | Safran SA (Capital Goods) | 3,291,980 | ||||||
| 43,086 | Sanofi (Pharmaceuticals, Biotechnology & Life Sciences) | 4,454,257 | ||||||
| 73,831 | Total SA (Energy) | 3,606,143 | ||||||
|
| |||||||
| 26,239,533 | ||||||||
|
| |||||||
| Germany – 4.4% |
| ||||||
| 27,600 | Bayer AG (Registered) (Pharmaceuticals, Biotechnology & Life Sciences) | 2,938,590 | ||||||
| 27,462 | Bayerische Motoren Werke AG (Automobiles & Components) | 2,396,781 | ||||||
| 35,625 | Beiersdorf AG (Household & Personal Products) | 3,103,258 | ||||||
|
| |||||||
| 8,438,629 | ||||||||
|
| |||||||
| Hong Kong – 3.0% |
| ||||||
| 852,595 | AIA Group Ltd. (Insurance) | 3,591,984 | ||||||
| 595,000 | China Mengniu Dairy Co. Ltd. (Food, Beverage & Tobacco) | 2,123,898 | ||||||
|
| |||||||
| 5,715,882 | ||||||||
|
| |||||||
| Common Stocks – (continued) | ||||||||
| India – 0.6% |
| ||||||
| 43,845 | Hero Motocorp Ltd. (Automobiles & Components) | $ | 1,223,102 | |||||
|
| |||||||
| Ireland – 2.2% |
| ||||||
| 37,587 | Kerry Group PLC Class A (Food, Beverage & Tobacco) | 2,074,425 | ||||||
| 70,833 | Shire PLC (Pharmaceuticals, Biotechnology & Life Sciences) | 2,244,713 | ||||||
|
| |||||||
| 4,319,138 | ||||||||
|
| |||||||
| Japan – 20.1% |
| ||||||
| 25,500 | Astellas Pharma, Inc. (Pharmaceuticals, Biotechnology & Life Sciences) | 1,385,265 | ||||||
| 115,400 | Credit Saison Co. Ltd. (Diversified Financials) | 2,899,664 | ||||||
| 198,000 | Ebara Corp. (Capital Goods) | 1,056,938 | ||||||
| 150,000 | Fujitec Co. Ltd. (Capital Goods) | 1,501,925 | ||||||
| 256,000 | Isuzu Motors Ltd. (Automobiles & Components) | 1,750,003 | ||||||
| 94,700 | Japan Tobacco, Inc. (Food, Beverage & Tobacco) | 3,342,678 | ||||||
| 52,000 | KDDI Corp. (Telecommunication Services) | 2,707,820 | ||||||
| 185,000 | Kubota Corp. (Capital Goods) | 2,692,373 | ||||||
| 35,400 | Makita Corp. (Capital Goods) | 1,903,185 | ||||||
| 137,900 | Nomura Real Estate Holdings, Inc. (Real Estate) | 3,046,171 | ||||||
| 26,400 | Rinnai Corp. (Consumer Durables & Apparel) | 1,877,187 | ||||||
| 102,500 | Sumitomo Mitsui Financial Group, Inc. (Banks) | 4,691,738 | ||||||
| 49,900 | Suntory Beverage & Food Ltd. (Food, Beverage & Tobacco)* | 1,559,689 | ||||||
| 98,400 | Taiyo Yuden Co. Ltd. (Technology Hardware & Equipment) | 1,496,479 | ||||||
| 391,000 | Tokyo Gas Co. Ltd. (Utilities) | 2,157,168 | ||||||
| 56,600 | Unicharm Corp. (Household & Personal Products) | 3,201,207 | ||||||
| 3,253 | Yahoo Japan Corp. (Software & Services) | 1,601,826 | ||||||
|
| |||||||
| 38,871,316 | ||||||||
|
| |||||||
| Netherlands – 1.9% |
| ||||||
| 93,627 | Unilever NV CVA (Food, Beverage & Tobacco) | 3,685,563 | ||||||
|
| |||||||
| Russia – 2.7% |
| ||||||
| 9,897 | Magnit OJSC (Food & Staples Retailing) | 2,274,632 | ||||||
| 27,952 | OAO Lukoil ADR (Energy) | 1,601,883 | ||||||
| 111,169 | Sberbank of Russia ADR (Banks) | 1,261,382 | ||||||
|
| |||||||
| 5,137,897 | ||||||||
|
| |||||||
| Singapore – 1.2% |
| ||||||
| 185,000 | DBS Group Holdings Ltd. (Banks) | 2,251,062 | ||||||
|
| |||||||
| The accompanying notes are an integral part of these financial statements. | 7 |
GOLDMAN SACHS VARIABLE INSURANCE TRUST STRATEGIC INTERNATIONAL EQUITY FUND
Schedule of Investments (continued)
June 30, 2013 (Unaudited)
| Shares | Description | Value | ||||||
| Common Stocks – (continued) | ||||||||
| South Africa – 0.8% |
| ||||||
| 467,751 | Nampak Ltd. (Materials) | $ | 1,555,863 | |||||
|
| |||||||
| South Korea – 1.0% |
| ||||||
| 37,859 | Kia Motors Corp. (Automobiles & Components) | 2,044,472 | ||||||
|
| |||||||
| Spain – 1.5% |
| ||||||
| 233,400 | Telefonica SA (Telecommunication Services) | 3,002,785 | ||||||
|
| |||||||
| Sweden – 2.0% |
| ||||||
| 71,871 | Scania AB Class B (Capital Goods) | 1,437,917 | ||||||
| 207,939 | Telefonaktiebolaget LM Ericsson Class B (Technology Hardware & Equipment) | 2,357,993 | ||||||
|
| |||||||
| 3,795,910 | ||||||||
|
| |||||||
| Switzerland – 10.3% |
| ||||||
| 125,019 | Credit Suisse Group AG (Registered) (Diversified Financials)* | 3,309,764 | ||||||
| 157,650 | Informa PLC (Media) | 1,174,448 | ||||||
| 75,855 | Julius Baer Group Ltd. (Diversified Financials)* | 2,960,499 | ||||||
| 66,486 | Novartis AG (Registered) (Pharmaceuticals, Biotechnology & Life Sciences) | 4,709,240 | ||||||
| 17,595 | Roche Holding AG (Pharmaceuticals, Biotechnology & Life Sciences) | 4,367,032 | ||||||
| 8,454 | Sulzer AG (Registered) (Capital Goods) | 1,349,961 | ||||||
| 42,219 | Wolseley PLC (Capital Goods) | 1,947,966 | ||||||
|
| |||||||
| 19,818,910 | ||||||||
|
| |||||||
| Taiwan – 1.4% |
| ||||||
| 120,000 | MediaTek, Inc. (Semiconductors & Semiconductor Equipment) | 1,383,431 | ||||||
| 75,955 | Taiwan Semiconductor Manufacturing Co. Ltd. ADR (Semiconductors & Semiconductor Equipment) | 1,391,495 | ||||||
|
| |||||||
| 2,774,926 | ||||||||
|
| |||||||
| United Kingdom – 18.5% |
| ||||||
| 329,319 | Abcam PLC (Pharmaceuticals, Biotechnology & Life Sciences) | 2,271,480 | ||||||
| 138,081 | BG Group PLC (Energy) | 2,346,557 | ||||||
| 531,431 | BP PLC (Energy) | 3,688,103 | ||||||
| 140,309 | Burberry Group PLC (Consumer Durables & Apparel) | 2,886,506 | ||||||
| 286,098 | Direct Line Insurance Group PLC (Insurance) | 1,016,593 | ||||||
| 591,549 | HSBC Holdings PLC (Banks) | 6,123,804 | ||||||
| 535,283 | Melrose Industries PLC (Capital Goods) | 2,028,860 | ||||||
|
| |||||||
| Common Stocks – (continued) | ||||||||
| United Kingdom – (continued) |
| ||||||
| 240,343 | Partnership Assurance Group PLC (Insurance)* | $ | 1,780,227 | |||||
| 118,028 | Rio Tinto PLC (Materials) | 4,800,076 | ||||||
| 34,434 | Spirax-Sarco Engineering PLC (Capital Goods) | 1,411,237 | ||||||
| 72,297 | Telecity Group PLC (Software & Services) | 1,114,102 | ||||||
| 2,191,828 | Vodafone Group PLC (Telecommunication Services) | 6,281,073 | ||||||
|
| |||||||
| 35,748,618 | ||||||||
|
| |||||||
| TOTAL COMMON STOCKS | ||||||||
| (Cost $181,292,962) | $ | 188,539,520 | ||||||
|
| |||||||
| Preferred Stock – 0.6% | ||||||||
| Germany – 0.6% |
| ||||||
| 11,715 | Sartorius AG Preference Shares (Health Care Equipment & Services) | $ | 1,260,163 | |||||
| (Cost $1,027,107) | ||||||||
|
| |||||||
| Exchange Traded Fund – 1.1% | ||||||||
| Japan – 1.1% |
| ||||||
| 186,541 | iShares MSCI Japan Index Fund | $ | 2,092,990 | |||||
| (Cost $2,126,567) | ||||||||
|
| |||||||
| TOTAL INVESTMENTS – 99.3% | ||||||||
| (Cost $184,446,636) | $ | 191,892,673 | ||||||
|
| |||||||
| OTHER ASSETS IN EXCESS OF | 1,255,594 | ||||||
|
| |||||||
| NET ASSETS – 100.0% | $ | 193,148,267 | ||||||
|
| |||||||
| The percentage shown for each investment category reflects the value of investments in that category as a percentage of net assets. | ||
| * | Non-income producing security. | |
| Investment Abbreviations: | ||
| ADR | —American Depositary Receipt | |
| CVA | —Dutch Certification | |
| 8 | The accompanying notes are an integral part of these financial statements. |
GOLDMAN SACHS VARIABLE INSURANCE TRUST STRATEGIC INTERNATIONAL EQUITY FUND
Statement of Assets and Liabilities
June 30, 2013 (Unaudited)
| Assets: | ||||
Investments, at value (cost $184,446,636) | $ | 191,892,673 | ||
Cash | 1,749,128 | |||
Foreign currencies, at value (cost $335,309) | 334,829 | |||
Receivables: | ||||
Investments sold | 1,316,002 | |||
Dividends | 343,702 | |||
Foreign tax reclaims | 307,383 | |||
Reimbursement from investment adviser | 29,275 | |||
Fund shares sold | 2,126 | |||
Other assets | 1,266 | |||
| Total assets | 195,976,384 | |||
| Liabilities: | ||||
Payables: | ||||
Investments purchased | 2,451,320 | |||
Amounts owed to affiliates | 162,723 | |||
Fund shares redeemed | 89,615 | |||
Accrued expenses | 124,459 | |||
| Total liabilities | 2,828,117 | |||
| Net Assets: | ||||
Paid-in capital | 292,023,430 | |||
Undistributed net investment income | 2,622,937 | |||
Accumulated net realized loss | (108,948,756 | ) | ||
Net unrealized gain | 7,450,656 | |||
| NET ASSETS | $ | 193,148,267 | ||
Net Assets: | ||||
Institutional | $ | 54,694,206 | ||
Service | 138,454,061 | |||
Total Net Assets | $ | 193,148,267 | ||
Shares of beneficial interest outstanding $0.001 par value (unlimited shares authorized): | ||||
Institutional | 6,043,912 | |||
Service | 15,293,323 | |||
Net asset value, offering and redemption price per share: | ||||
Institutional | $9.05 | |||
Service | 9.05 | |||
| The accompanying notes are an integral part of these financial statements. | 9 |
GOLDMAN SACHS VARIABLE INSURANCE TRUST STRATEGIC INTERNATIONAL EQUITY FUND
Statement of Operations
For the Six Months Ended June 30, 2013 (Unaudited)
| Investment income: | ||||
Dividends (net of foreign taxes withheld of $351,939) | $ | 3,509,697 | ||
| Expenses: | ||||
Management fees | 842,402 | |||
Distribution and Service fees — Service Class | 176,763 | |||
Custody, accounting and administrative services | 97,653 | |||
Printing and mailing costs | 40,451 | |||
Professional fees | 37,879 | |||
Transfer Agent fees(a) | 19,820 | |||
Trustee fees | 8,950 | |||
Other | 6,063 | |||
| Total expenses | 1,229,981 | |||
Less — expense reductions | (89,182 | ) | ||
| Net expenses | 1,140,799 | |||
| NET INVESTMENT INCOME | 2,368,898 | |||
| Realized and unrealized gain (loss): | ||||
Net realized gain (loss) from: | ||||
Investments | 17,630,717 | |||
Futures contracts | 45,161 | |||
Foreign currency transactions | (271,648 | ) | ||
Net change in unrealized gain (loss) on: | ||||
Investments | (8,643,448 | ) | ||
Futures contracts | 19,319 | |||
Foreign currency translation | (413 | ) | ||
| Net realized and unrealized gain | 8,779,688 | |||
| NET INCREASE IN NET ASSETS RESULTING FROM OPERATIONS | $ | 11,148,586 | ||
(a) Institutional and Service Shares had Transfer Agent fees of $5,680 and $14,140, respectively.
| 10 | The accompanying notes are an integral part of these financial statements. |
GOLDMAN SACHS VARIABLE INSURANCE TRUST STRATEGIC INTERNATIONAL EQUITY FUND
Statements of Changes in Net Assets
| For the Six Months Ended June 30, 2013 (Unaudited) | For the Fiscal Year Ended December 31, 2012 | |||||||
| From operations: | ||||||||
Net investment income | $ | 2,368,898 | $ | 3,578,978 | ||||
Net realized gain | 17,404,230 | 6,667,463 | ||||||
Net change in unrealized gain (loss) | (8,624,542 | ) | 26,262,974 | |||||
| Net increase in net assets resulting from operations | 11,148,586 | 36,509,415 | ||||||
| Distributions to shareholders: | ||||||||
From net investment income | ||||||||
Institutional Shares | — | (1,162,337 | ) | |||||
Service Shares | — | (2,511,176 | ) | |||||
| Total distributions to shareholders | — | (3,673,513 | ) | |||||
| From share transactions: | ||||||||
Proceeds from sales of shares | 2,041,451 | 6,049,759 | ||||||
Reinvestment of distributions | — | 3,673,513 | ||||||
Cost of shares redeemed | (16,163,494 | ) | (28,382,757 | ) | ||||
| Net decrease in net assets resulting from share transactions | (14,122,043 | ) | (18,659,485 | ) | ||||
| TOTAL INCREASE (DECREASE) | (2,973,457 | ) | 14,176,417 | |||||
| Net assets: | ||||||||
Beginning of period | 196,121,724 | 181,945,307 | ||||||
End of period | $ | 193,148,267 | $ | 196,121,724 | ||||
| Undistributed net investment income | $ | 2,622,937 | $ | 254,039 | ||||
| The accompanying notes are an integral part of these financial statements. | 11 |
GOLDMAN SACHS VARIABLE INSURANCE TRUST STRATEGIC INTERNATIONAL EQUITY FUND
Financial Highlights
Selected Data for a Share Outstanding Throughout Each Period
| Income (loss) from investment operations | Distributions to shareholders | |||||||||||||||||||||||||||||||||||||||||||||||||||||||
| Year - Share Class | Net asset value, beginning of period | Net investment income(a) | Net realized and unrealized gain (loss) | Total from investment operations | From net investment income | From net realized gains | Total distributions | Net asset value, end of period | Total return(b) | Net assets, end of period (in 000s) | Ratio of net expenses to average net assets | Ratio of total expenses to average net assets | Ratio of net investment income to average net assets | Portfolio turnover rate(c) | ||||||||||||||||||||||||||||||||||||||||||
FOR THE SIX MONTHS ENDED JUNE 30, (UNAUDITED) | ||||||||||||||||||||||||||||||||||||||||||||||||||||||||
2013 - Institutional | $ | 8.56 | $ | 0.11 | $ | 0.38 | $ | 0.49 | $ | — | $ | — | $ | — | $ | 9.05 | 5.85 | % | $ | 54,694 | 0.97 | %(d) | 1.06 | %(d) | 2.56 | %(d) | 57 | % | ||||||||||||||||||||||||||||
2013 - Service | 8.57 | 0.10 | 0.38 | 0.48 | — | — | — | 9.05 | 5.60 | 138,454 | 1.22 | (d) | 1.31 | (d) | 2.32 | (d) | 57 | |||||||||||||||||||||||||||||||||||||||
FOR THE FISCAL YEARS ENDED DECEMBER 31, | ||||||||||||||||||||||||||||||||||||||||||||||||||||||||
2012 - Institutional | 7.20 | 0.16 | 1.38 | 1.54 | (0.18 | ) | — | (0.18 | ) | 8.56 | 21.17 | 56,872 | 0.97 | 1.03 | 2.06 | 110 | ||||||||||||||||||||||||||||||||||||||||
2012 - Service | 7.22 | 0.14 | 1.37 | 1.51 | (0.16 | ) | — | (0.16 | ) | 8.57 | 20.82 | 139,250 | 1.22 | 1.28 | 1.80 | 110 | ||||||||||||||||||||||||||||||||||||||||
2011 - Institutional | 8.82 | 0.26 | (e) | (1.59 | ) | (1.33 | ) | (0.29 | ) | — | (0.29 | ) | 7.20 | (15.05 | ) | 55,954 | 0.99 | 1.04 | 3.03 | (e) | 143 | |||||||||||||||||||||||||||||||||||
2011 - Service | 8.83 | 0.24 | (e) | (1.58 | ) | (1.34 | ) | (0.27 | ) | — | (0.27 | ) | 7.22 | (15.16 | ) | 125,991 | 1.24 | 1.29 | 2.80 | (e) | 143 | |||||||||||||||||||||||||||||||||||
2010 - Institutional | 8.11 | 0.11 | 0.73 | 0.84 | (0.13 | ) | — | (0.13 | ) | 8.82 | 10.36 | 77,558 | 1.02 | 1.05 | 1.38 | 112 | ||||||||||||||||||||||||||||||||||||||||
2010 - Service | 8.12 | 0.09 | 0.73 | 0.82 | (0.11 | ) | — | (0.11 | ) | 8.83 | 10.09 | 159,214 | 1.27 | 1.30 | 1.13 | 112 | ||||||||||||||||||||||||||||||||||||||||
2009 - Institutional | 6.41 | 0.13 | 1.71 | 1.84 | (0.14 | ) | — | (0.14 | ) | 8.11 | 28.69 | 82,015 | 1.07 | 1.07 | 1.80 | 118 | ||||||||||||||||||||||||||||||||||||||||
2009 - Service | 6.42 | 0.11 | 1.71 | 1.82 | (0.12 | ) | — | (0.12 | ) | 8.12 | 28.37 | 157,359 | 1.32 | 1.32 | 1.51 | 118 | ||||||||||||||||||||||||||||||||||||||||
2008 - Institutional | 13.76 | 0.32 | (f) | (6.69 | ) | (6.37 | ) | (0.33 | ) | (0.65 | ) | (0.98 | ) | 6.41 | (45.87 | ) | 74,149 | 1.12 | 1.12 | 2.95 | (f) | 165 | ||||||||||||||||||||||||||||||||||
2008 - Service | 13.76 | 0.28 | (f) | (6.67 | ) | (6.39 | ) | (0.30 | ) | (0.65 | ) | (0.95 | ) | 6.42 | (46.00 | ) | 113,836 | 1.37 | 1.37 | 2.64 | (f) | 165 | ||||||||||||||||||||||||||||||||||
| (a) | Calculated based on the average shares outstanding methodology. |
| (b) | Assumes investment at the net asset value at the beginning of the period, reinvestment of all distributions, and a complete redemption of the investment at the net asset value at the end of the period. Total returns for periods less than one full year are not annualized. |
| (c) | The Fund’s portfolio turnover rate is calculated in accordance with regulatory requirements, without regard to transactions involving short term investments and certain derivatives. If such transactions were included, the Fund’s portfolio turnover rate may be higher. |
| (d) | Annualized. |
| (e) | Reflects income recognized from a corporate action which amounted to $0.11 per share and 1.33% of average net assets. |
| (f) | Reflects income recognized from special dividends which amounted to $0.12 per share and 1.12% of average net assets. |
| The accompanying notes are an integral part of these financial statements. | 12 |
GOLDMAN SACHS VARIABLE INSURANCE TRUST STRATEGIC INTERNATIONAL EQUITY FUND
Notes to Financial Statements
June 30, 2013 (Unaudited)
1. ORGANIZATION
Goldman Sachs Variable Insurance Trust (the “Trust” or “VIT”) is a Delaware statutory trust registered under the Investment Company Act of 1940, as amended (the “Act”), as an open-end management investment company. The Trust includes the Goldman Sachs Strategic International Equity Fund (the “Fund”). The Fund is a diversified portfolio under the Act offering two classes of shares — Institutional and Service Shares. Shares of the Trust are offered to separate accounts of participating life insurance companies for the purpose of funding variable annuity contracts and variable life insurance policies.
Goldman Sachs Asset Management International (“GSAMI”), an affiliate of Goldman, Sachs & Co. (“Goldman Sachs”), serves as investment adviser to the Fund pursuant to a management agreement (the “Agreement”) with the Trust.
2. SIGNIFICANT ACCOUNTING POLICIES
The financial statements have been prepared in accordance with accounting principles generally accepted in the United States of America (“GAAP”) and require management to make estimates and assumptions that may affect the reported amounts and disclosures. Actual results may differ from those estimates and assumptions.
A. Investment Valuation — The Fund’s valuation policy is to value investments at fair value.
B. Investment Income and Investments — Investment income includes interest income and dividend income, net of any foreign withholding taxes, less any amounts reclaimable. Interest income is accrued daily and adjusted for amortization of premiums and accretion of discounts. Dividend income is recognized on ex-dividend date or, for certain foreign securities, as soon as such information is obtained subsequent to the ex-dividend date. Investment transactions are reflected on trade date. Realized gains and losses are calculated using identified cost. Investment transactions are recorded on the following business day for daily net asset value (“NAV”) calculations. Any foreign capital gains tax is accrued daily based upon net unrealized gains, and is payable upon sale of such investments.
For derivative contracts, realized gains and losses are recorded upon settlement of the contract.
C. Class Allocations and Expenses — Investment income, realized and unrealized gain (loss), and non-class specific expenses of the Fund are allocated daily based upon the proportion of net assets of each class. Class specific expenses, where applicable, are borne by the respective share classes and include Distribution and Service and Transfer Agent fees. Non-class specific expenses directly incurred by a Fund are charged to that Fund, while such expenses incurred by the Trust are allocated across the respective Funds on a straight-line and/or pro-rata basis depending upon the nature of the expenses.
D. Federal Taxes and Distributions to Shareholders — It is the Fund’s policy to comply with the requirements of the Internal Revenue Code of 1986, as amended (the “Code”), applicable to regulated investment companies (mutual funds) and to distribute each year substantially all of its investment company taxable income and capital gains to its shareholders. Accordingly, the Fund is not required to make any provisions for the payment of federal income tax. Distributions to shareholders are recorded on the ex-dividend date. Income and capital gains distributions, if any, are declared and paid annually.
Net capital losses are carried forward to future fiscal years and may be used to the extent allowed by the Code to offset any future capital gains. Utilization of capital loss carryforwards will reduce the requirement of future capital gains distributions.
Under the Regulated Investment Company Modernization Act of 2010, the Fund is permitted to carry forward capital losses incurred in taxable years beginning after December 22, 2010 for an unlimited period. However, any losses incurred during those future taxable years will be required to be utilized prior to the losses incurred in pre-enactment taxable years. As a result of this ordering rule, pre-enactment capital loss carryforwards may be more likely to expire unused. Additionally, post-enactment capital losses that are carried forward will retain their character as either short-term or long-term capital losses rather than being considered all short-term as under previous law.
The characterization of distributions to shareholders for financial reporting purposes is determined in accordance with federal income tax rules, which may differ from GAAP. The source of the Fund’s distributions may be shown in the accompanying
13
GOLDMAN SACHS VARIABLE INSURANCE TRUST STRATEGIC INTERNATIONAL EQUITY FUND
Notes to Financial Statements (continued)
June 30, 2013 (Unaudited)
2. SIGNIFICANT ACCOUNTING POLICIES (continued)
financial statements as either from net investment income, net realized gain or capital. Certain components of the Fund’s net assets on the Statement of Assets and Liabilities reflect permanent GAAP/tax differences based on the appropriate tax character.
E. Foreign Currency Translation — The accounting records and reporting currency of the Fund are maintained in United States (“U.S.”) dollars. Assets and liabilities denominated in foreign currencies are translated into U.S. dollars using the current exchange rates at the close of each business day. The effect of changes in foreign currency exchange rates on investments is included within net realized and unrealized gain (loss) on investments. Changes in the value of other assets and liabilities as a result of fluctuations in foreign exchange rates are included in the Statement of Operations within net change in unrealized gain (loss) on foreign currency transactions. Transactions denominated in foreign currencies are translated into U.S. dollars on the date the transaction occurred, the effects of which are included within net realized gain (loss) on foreign currency transactions.
3. INVESTMENTS AND FAIR VALUE MEASUREMENTS
The fair value of a financial instrument is the amount that would be received to sell an asset or paid to transfer a liability in an orderly transaction between market participants at the measurement date (i.e., the exit price). GAAP establishes a fair value hierarchy that prioritizes the inputs to valuation techniques used to measure fair value. The hierarchy gives the highest priority to unadjusted quoted prices in active markets for identical assets or liabilities (Level 1 measurements) and the lowest priority to unobservable inputs (Level 3 measurements). The levels used for classifying investments are not necessarily an indication of the risk associated with investing in these investments. The three levels of the fair value hierarchy are described below:
Level 1 — Unadjusted quoted prices in active markets that are accessible at the measurement date for identical, unrestricted assets or liabilities;
Level 2 — Quoted prices in markets that are not active or financial instruments for which significant inputs are observable (including, but not limited to, quoted prices for similar investments, interest rates, foreign exchange rates, volatility and credit spreads), either directly or indirectly;
Level 3 — Prices or valuations that require significant unobservable inputs (including GSAMI’s assumptions in determining fair value measurement).
The Trustees have adopted Valuation Procedures that govern the valuation of the portfolio investments held by the Fund, including investments for which market quotations are not readily available. The Trustees have delegated to GSAMI day-to-day responsibility for implementing and maintaining internal controls and procedures related to the valuation of the Fund’s portfolio investments. To assess the continuing appropriateness of pricing sources and methodologies, GSAMI regularly performs price verification procedures and issues challenges as necessary to third party pricing vendors or brokers, and any differences are reviewed in accordance with the Valuation Procedures.
A. Level 1 and Level 2 Fair Value Investments — The valuation techniques and significant inputs used in determining the fair values for investments classified as Level 1 and Level 2 are as follows:
Equity Securities — Equity securities and investment companies traded on a U.S. securities exchange or the NASDAQ system, or those located on certain foreign exchanges, including but not limited to the Americas, are valued daily at their last sale price or official closing price on the principal exchange or system on which they are traded. If no sale occurs, equity securities and exchange traded investment companies are valued at the last bid price for long positions and at the last ask price for short positions. Investments in investment companies (other than those that are exchange traded) are valued at the NAV on the valuation date. To the extent these investments are actively traded, they are classified as Level 1 of the fair value hierarchy.
Unlisted equity securities for which market quotations are available are valued at the last sale price on the valuation date, or if no sale occurs, at the last bid price. Securities traded on certain foreign securities exchanges are valued daily at fair value determined by an independent fair value service (if available) under Valuation Procedures approved by the Trustees and consistent with applicable regulatory guidance. The independent fair value service takes into account multiple factors including, but not
14
GOLDMAN SACHS VARIABLE INSURANCE TRUST STRATEGIC INTERNATIONAL EQUITY FUND
3. INVESTMENTS AND FAIR VALUE MEASUREMENTS (continued)
limited to, movements in the securities markets, certain depositary receipts, futures contracts and foreign currency exchange rates that have occurred subsequent to the close of the foreign securities exchange. These investments are generally classified as Level 2 of the fair value hierarchy.
Debt Securities — Debt securities for which market quotations are readily available are valued daily on the basis of quotations supplied by dealers or an independent pricing service approved by the Trustees. The pricing services may use valuation models or matrix pricing, which consider: (i) yield or price with respect to bonds that are considered comparable in characteristics such as rating, interest rate and maturity date or (ii) quotations from securities dealers to determine current value. Short-term debt obligations that mature in sixty days or less and that do not exhibit signs of credit deterioration are valued at amortized cost, which approximates fair value. With the exception of treasury securities, which are generally classified as Level 1, these investments are generally classified as Level 2 of the fair value hierarchy.
Derivative contracts — A derivative is an instrument whose value is derived from underlying assets, indices, reference rates or a combination of these factors.
Exchange-traded derivatives, including futures contracts, typically fall within Level 1 of the fair value hierarchy. Over-the-counter (“OTC”) derivatives are valued using market transactions and other market evidence, including market-based inputs to models, calibration to market-clearing transactions, broker or dealer quotations, or other alternative pricing sources. Where models are used, the selection of a particular model to value an OTC derivative depends upon the contractual terms of, and specific risks inherent in, the instrument, as well as the availability of pricing information in the market. Valuation models require a variety of inputs, including contractual terms, market prices, yield curves, credit curves, measures of volatility, voluntary and involuntary prepayment rates, loss severity rates and correlations of such inputs. For OTC derivatives that trade in liquid markets, model inputs can generally be verified and model selection does not involve significant management judgment. OTC derivatives are classified within Level 2 of the fair value hierarchy when significant inputs are corroborated by market evidence.
i. Futures Contracts — Futures contracts are contracts to buy or sell a standardized quantity of a specified commodity or security and are valued based on exchanged settlement prices or independent market quotes. Futures contracts are valued at the last settlement price, or in the absence of a sale, the last bid price for long positions and at the last ask price for short positions, at the end of each day on the board of trade or exchange upon which they are traded. Upon entering into a futures contract, the Fund deposits cash or securities in an account on behalf of the broker in an amount sufficient to meet the initial margin requirement. Subsequent payments are made or received by the Fund equal to the daily change in the contract value and are recorded as variation margin receivable or payable with a corresponding offset to unrealized gains or losses.
B. Level 3 Fair Value Investments — To the extent that the aforementioned significant inputs are unobservable, or if quotations are not readily available, or if GSAMI believes that such quotations do not accurately reflect fair value, the fair value of the Fund’s investments may be determined under Valuation Procedures approved by the Trustees. GSAMI, consistent with its procedures and applicable regulatory guidance, may make an adjustment to the most recent valuation prices of either domestic or foreign securities in light of significant events to reflect what it believes to be the fair value of the securities at the time of determining a Fund’s NAV. Significant events which could affect a large number of securities in a particular market may include, but are not limited to: significant fluctuations in U.S. or foreign markets; market dislocations; market disruptions; or unscheduled market closings. Significant events which could also affect a single issuer may include, but are not limited to: corporate actions such as reorganizations, mergers and buy-outs; ratings downgrades; and bankruptcies.
15
GOLDMAN SACHS VARIABLE INSURANCE TRUST STRATEGIC INTERNATIONAL EQUITY FUND
Notes to Financial Statements (continued)
June 30, 2013 (Unaudited)
3. INVESTMENTS AND FAIR VALUE MEASUREMENTS (continued)
C. Fair Value Hierarchy — The following is a summary of the Fund’s investments and derivatives classified in the fair value hierarchy as of June 30, 2013:
| Investment Type | Level 1 | Level 2 | Level 3 | |||||||||
| Assets | ||||||||||||
| Common Stock and/or Other Equity Investments | ||||||||||||
North and South America | $ | — | $ | — | $ | — | ||||||
Other | 3,484,485 | 188,408,188 | (a) | — | ||||||||
| (a) | To adjust for the time difference between local market close and the calculation of net asset value, the Fund utilizes fair value model prices for international equities provided by an independent fair value service resulting in a Level 2 classification. |
For further information regarding security characteristics, see the Schedule of Investments.
4. INVESTMENTS IN DERIVATIVES
The following table sets forth, by certain risk types, the Fund’s gains (losses) related to these derivatives and their indicative volumes for the six months ended June 30, 2013. These instruments were used to meet the Fund’s investment objectives and to obtain and/or manage exposure related to the risks below. These gains (losses) should be considered in the context that these derivative contracts may have been executed to economically hedge certain investments, and accordingly, certain gains (losses) on such derivative contracts may offset certain (losses) gains attributable to investments. These gains (losses) are included in “Net realized gain (loss)” or “Net change in unrealized gain (loss)” on the Statement of Operations:
| Risk | Statement of Operations | Net Realized Gain (Loss) | Net Change in Unrealized Gain (Loss) | Average Number of Contracts(a) | ||||||||||
| Equity | Net realized gain (loss) from futures contracts/Net change in unrealized gain (loss) on futures contracts | $ | 45,161 | $ | 19,319 | 1 | ||||||||
| (a) | Average number of contracts is based on the average of month end balances for the six months ended June 30, 2013. |
5. AGREEMENTS AND AFFILIATED TRANSACTIONS
A. Management Agreement — Under the Agreement, GSAMI manages the Fund, subject to the general supervision of the Trustees.
As compensation for the services rendered pursuant to the Agreement, the assumption of the expenses related thereto and administration of the Fund’s business affairs, including providing facilities, GSAMI is entitled to a management fee, accrued daily and paid monthly, equal to an annual percentage rate of the Fund’s average daily net assets.
For the six months ended June 30, 2013, contractual and effective net management fees with GSAMI were at the following rates:
| Contractual Management Fee Rate | ||||||||||||||||||||||||||
| First $1 billion | Next $1 billion | Next $3 billion | Next $3 billion | Over $8 billion | Effective Rate | Effective Net Management Fee Rate | ||||||||||||||||||||
| 0.85% | 0.77 | % | 0.73 | % | 0.72 | % | 0.71 | % | 0.85 | % | 0.81 | %* | ||||||||||||||
| * | GSAMI has agreed to waive a portion of its management fee in order to achieve a net management rate, as defined in the Fund’s most recent prospectus. This waiver will be effective through at least April 30, 2014, and prior to such date GSAMI may not terminate the arrangement without approval of the Trustees. The Effective Net Management Rate above is calculated based on management rates before and after the waiver had been adjusted, if applicable. For the six months ended June 30, 2013, GSAMI waived $39,643 of its management fee. |
16
GOLDMAN SACHS VARIABLE INSURANCE TRUST STRATEGIC INTERNATIONAL EQUITY FUND
5. AGREEMENTS AND AFFILIATED TRANSACTIONS (continued)
B. Distribution and Service Plan — The Trust, on behalf of the Service Shares of the Fund, has adopted a Distribution and Service Plan (the “Plan”). Under the Plan, Goldman Sachs, which serves as distributor (the “Distributor”), is entitled to a fee accrued daily and paid monthly, for distribution services and personal and account maintenance services, which may then be paid by Goldman Sachs to authorized dealers, equal to, on an annual basis, 0.25% of the Fund’s average daily net assets attributable to Service Shares.
C. Transfer Agency Agreement — Goldman Sachs also serves as the transfer agent of the Fund for a fee pursuant to a Transfer Agency Agreement. The fees charged for such transfer agency services are accrued daily and paid monthly at an annual rate of 0.02% of the average daily net assets of Institutional and Service Shares.
D. Other Expense Agreements and Affiliated Transactions — GSAMI has agreed to limit certain “Other Expense” of the Fund (excluding transfer agent fees and expenses, taxes, interest, brokerage fees, litigation, indemnification, shareholder meetings and other extraordinary expenses) to the extent such expenses exceed, on an annual basis, a percentage rate of the average daily net assets of the Fund. Such Other Expense reimbursements, if any, are accrued daily and paid monthly. In addition, the Fund is not obligated to reimburse GSAMI for prior fiscal year expense reimbursements, if any. The Other Expense limitation as an annual percentage rate of average daily net assets for the Fund is 0.144%. This Other Expense limitation will remain in place through at least April 30, 2014, and prior to such date GSAMI may not terminate the arrangement without the approval of the Trustees. For the six months ended June 30, 2013, GSAMI reimbursed $48,247 to the Fund. In addition, the Fund has entered into certain offset arrangements with the custodian and the transfer agent, which may result in a reduction of the Fund’s expenses and are received irrespective of the application of the “Other Expense” limitation described above. For the six months ended June 30, 2013, custody fee credits were $1,292.
As of June 30, 2013, the amounts owed to affiliates of the Fund were $130,613, $28,885, and $3,225 for management, distribution and service, and transfer agent fees, respectively.
E. Line of Credit Facility — As of June 30, 2013, the Fund participated in a $780,000,000 committed, unsecured revolving line of credit facility (the “facility”) together with other funds of the Trust and registered investment companies having management agreements with GSAM or its affiliates (“Other Borrowers”). Pursuant to the terms of the facility, the Fund and Other Borrowers could increase the credit amount by an additional $220,000,000, for a total of up to $1,000,000,000. This facility is to be used solely for temporary or emergency purposes, which may include the funding of redemptions. The interest rate on borrowings is based on the federal funds rate. The facility also requires a fee to be paid by the Fund based on the amount of the commitment that has not been utilized. For the six months ended June 30, 2013, the Fund did not have any borrowings under the facility. Prior to May 8, 2013, the committed amount available through the facility was $630,000,000.
F. Other Transactions with Affiliates — For the six months ended June 30, 2013, Goldman Sachs earned $103 in brokerage commissions from portfolio transactions, including futures transactions executed with Goldman Sachs as the Futures Commission Merchant, on behalf of the Fund.
6. PORTFOLIO SECURITIES TRANSACTIONS
The cost of purchases and proceeds from sales and maturities of long-term securities for the six months ended June 30, 2013, were $112,381,321 and $123,284,314, respectively.
17
GOLDMAN SACHS VARIABLE INSURANCE TRUST STRATEGIC INTERNATIONAL EQUITY FUND
Notes to Financial Statements (continued)
June 30, 2013 (Unaudited)
7. TAX INFORMATION
As of the Fund’s most recent fiscal year end, December 31, 2012, the Fund’s capital loss carryforwards on a tax-basis were as follows:
| Capital loss carryforwards:(1) | ||||
Expiring 2016 | $ | (57,900,490 | ) | |
Expiring 2017 | (63,558,058 | ) | ||
Perpetual Long-term | (1,610,541 | ) | ||
Perpetual Short-term | (2,192,681 | ) | ||
| Total capital loss carryforwards | $ | (125,261,770 | ) |
| (1) | Expiration occurs on December 31 of the year indicated. |
As of June 30, 2013, the Fund’s aggregate security unrealized gains and losses based on cost for U.S. federal income tax purposes were as follows:
| Tax cost | $ | 185,773,422 | ||
| Gross unrealized gain | 14,519,857 | |||
| Gross unrealized loss | (8,400,606 | ) | ||
| Net unrealized security gain | $ | 6,119,251 |
The difference between GAAP-basis and tax-basis unrealized gains (losses), as of the most recent fiscal year end, is attributable primarily to wash sales and differences in the tax treatment of passive foreign investment company investments.
GSAMI has reviewed the Fund’s tax positions for all open tax years (the current and prior three years, as applicable) and has concluded that no provision for income tax is required in the Fund’s financial statements. Such open tax years remain subject to examination and adjustment by tax authorities.
8. OTHER RISKS
The Fund’s risks include, but are not limited to, the following:
Foreign Custody Risk — A Fund that invests in foreign securities may hold such securities and foreign currency with foreign banks, agents, and securities depositories appointed by the Fund’s custodian (each a “Foreign Custodian”). In some countries, Foreign Custodians may be subject to little or no regulatory oversight or independent evaluation of their operations. Further, the laws of certain countries may place limitations on a Fund’s ability to recover its assets if a Foreign Custodian enters into bankruptcy. Investments in emerging markets may be subject to greater custody risks than investments in more developed markets. Custody services in emerging market countries are often undeveloped and may be less regulated than in more developed countries, and thus may not afford the same level of investor protection as would apply in developed countries.
Shareholder Concentration Risk — Certain funds, accounts, individuals, or Goldman Sachs affiliates may from time to time own (beneficially or of record) or control a significant percentage of the Fund’s shares. Redemptions by these entities of their holdings in the Fund may impact the Fund’s liquidity and NAV. These redemptions may also force the Fund to sell securities.
Liquidity Risk — The Fund may make investments that are illiquid or that may become less liquid in response to market developments or adverse investor perceptions. Illiquid investments may be more difficult to value. Liquidity risk may also refer to the risk that a Fund will not be able to pay redemption proceeds within the allowable time period because of unusual market conditions, an unusually high volume of redemption requests, or other reasons. To meet redemption requests, the Fund may be forced to sell investments at an unfavorable time and/or under unfavorable conditions.
18
GOLDMAN SACHS VARIABLE INSURANCE TRUST STRATEGIC INTERNATIONAL EQUITY FUND
8. OTHER RISKS (continued)
Market and Credit Risks — In the normal course of business, the Fund trades financial instruments and enters into financial transactions where risk of potential loss exists due to changes in the market (market risk). Additionally, the Fund may also be exposed to credit risk in the event that an issuer fails to perform or that an institution or entity with which the Fund has unsettled or open transactions defaults.
Investing in foreign markets may involve special risks and considerations not typically associated with investing in the U.S. These risks include revaluation of currencies, high rates of inflation, repatriation restrictions on income and capital, and adverse political and economic developments. Moreover, securities issued in these markets may be less liquid, be subject to government ownership controls, have delayed settlements and their prices may be more volatile than those of comparable securities in the U.S.
9. INDEMNIFICATIONS
Under the Trust’s organizational documents, its Trustees, officers, employees and agents are indemnified, to the extent permitted by the Act and state law, against certain liabilities that may arise out of performance of their duties to the Fund. Additionally, in the course of business, the Fund enters into contracts that contain a variety of indemnification clauses. The Fund’s maximum exposure under these arrangements is unknown, as this would involve future claims that may be made against the Fund that have not yet occurred. However, GSAMI believes the risk of loss under these arrangements to be remote.
10. SUBSEQUENT EVENTS
Subsequent events after the Statement of Assets and Liabilities date have been evaluated through the date the financial statements were issued. GSAMI has concluded that there is no impact requiring adjustment or disclosure in the financial statements.
11. SUMMARY OF SHARE TRANSACTIONS
Share activity is as follows:
| For the Six Months Ended June 30, 2013 (Unaudited) | For the Fiscal Year Ended December 31, 2012 | |||||||||||||||
| Shares | Dollars | Shares | Dollars | |||||||||||||
| Institutional Shares | ||||||||||||||||
| Shares sold | 16,316 | $ | 145,983 | 73,062 | $ | 567,927 | ||||||||||
| Reinvestment of distributions | — | — | 137,392 | 1,162,337 | ||||||||||||
| Shares redeemed | (619,623 | ) | (5,610,291 | ) | (1,330,769 | ) | (10,618,859 | ) | ||||||||
| (603,307 | ) | (5,464,308 | ) | (1,120,315 | ) | (8,888,595 | ) | |||||||||
| Service Shares | ||||||||||||||||
| Shares sold | 209,971 | 1,895,468 | 701,586 | 5,481,832 | ||||||||||||
| Reinvestment of distributions | — | — | 296,479 | 2,511,176 | ||||||||||||
| Shares redeemed | (1,165,305 | ) | (10,553,203 | ) | (2,209,838 | ) | (17,763,898 | ) | ||||||||
| (955,334 | ) | (8,657,735 | ) | (1,211,773 | ) | (9,770,890 | ) | |||||||||
| NET DECREASE | (1,558,641 | ) | $ | (14,122,043 | ) | (2,332,088 | ) | $ | (18,659,485 | ) | ||||||
19
GOLDMAN SACHS VARIABLE INSURANCE TRUST STRATEGIC INTERNATIONAL EQUITY FUND
| Fund Expenses — Six Month Period Ended June 30, 2013 (Unaudited) |
As a shareholder of Institutional or Service Shares of the Fund, you incur ongoing costs, including management fees, distribution and service (12b-1) fees (with respect to Service Shares) and other Fund expenses. This example is intended to help you understand your ongoing costs (in dollars) of investing in the Institutional Shares and Service Shares of the Fund and to compare these costs with the ongoing costs of investing in other mutual funds.
The example is based on an investment of $1,000 invested at the beginning of the period and held for the entire period from January 1, 2013 through June 30, 2013.
Actual Expenses — The first line under each share class in the table below provides information about actual account values and actual expenses. You may use the information in this line, together with the amount you invested, to estimate the expenses that you paid over the period. Simply divide your account value by $1,000 (for example, an $8,600 account value divided by $1,000=8.6), then multiply the result by the number in the first line under the heading entitled “Expenses Paid” to estimate the expenses you paid on your account during this period.
Hypothetical Example for Comparison Purposes — The second line under each share class in the table below provides information about hypothetical account values and hypothetical expenses based on the Fund’s actual net expense ratio and an assumed rate of return of 5% per year before expenses, which is not the Fund’s actual return. The hypothetical account values and expenses may not be used to estimate the actual ending account balance or expenses you paid for the period. You may use this information to compare the ongoing costs of investing in the Fund and other funds. To do so, compare this 5% hypothetical example with the 5% hypothetical examples that appear in the shareholder reports of the other funds.
Please note that the expenses shown in the table are meant to highlight your ongoing costs only. As a shareholder of the Fund you do not incur any transaction costs, such as sales charges, redemption fees, or exchange fees, but shareholders of other funds may incur such costs. The second line of the table is useful in comparing ongoing costs only, and will not help you determine the relative total costs of owning different funds whose shareholders may incur transaction costs.
| Share Class | Beginning Account Value 1/01/13 | Ending Account Value 6/30/13 | Expenses Paid for the 6 Months Ended 6/30/13* | |||||||||
| Institutional | ||||||||||||
| Actual | $ | 1,000 | $ | 1,058.50 | $ | 4.95 | ||||||
| Hypothetical 5% return | 1,000 | 1,019.98 | + | 4.86 | ||||||||
| Service | ||||||||||||
| Actual | 1,000 | 1,056.00 | 6.22 | |||||||||
| Hypothetical 5% return | 1,000 | 1,018.74 | + | 6.11 | ||||||||
| * | Expenses are calculated using the Fund’s annualized net expense ratio for each class, which represents the ongoing expenses as a percentage of net assets for the six months ended June 30, 2013. Expenses are calculated by multiplying the annualized net expense ratio by the average account value for the period; then multiplying the result by the number of days in the most recent fiscal half year; and then dividing that result by the number of days in the fiscal year. The annualized net expense ratios for the period were 0.97% and 1.22% for Institutional and Service Shares, respectively. |
| + | Hypothetical expenses are based on the Fund’s actual annualized net expense ratios and an assumed rate of return of 5% per year before expenses. |
20
GOLDMAN SACHS VARIABLE INSURANCE TRUST STRATEGIC INTERNATIONAL EQUITY FUND
Statement Regarding Basis for Approval of Management Agreement (Unaudited)
Background
The Goldman Sachs Strategic International Equity Fund (the “Fund”) is an investment portfolio of Goldman Sachs Variable Insurance Trust (the “Trust”). The Board of Trustees oversees the management of the Trust and reviews the investment performance and expenses of the Fund at regularly scheduled meetings held during the year. In addition, the Board of Trustees determines annually whether to approve the continuance of the Trust’s investment management agreement (the “Management Agreement”) with Goldman Sachs Asset Management International (the “Investment Adviser”) on behalf of the Fund.
The Management Agreement was most recently approved for continuation until June 30, 2014 by the Board of Trustees, including those Trustees who are not parties to the Management Agreement or “interested persons” (as defined in the Investment Company Act of 1940, as amended) of any party thereto (the “Independent Trustees”), at a meeting held on June 12-13, 2013 (the “Annual Meeting”).
The review process undertaken by the Trustees spans the course of the year and culminates with the Annual Meeting. To assist the Trustees in their deliberations, the Trustees have established a Contract Review Committee (the “Committee”), comprised of the Independent Trustees. The Committee held four meetings over the course of the year since the Management Agreement was last approved. At those Committee meetings, regularly scheduled Board or other committee meetings and/or the Annual Meeting, the Board, or the Independent Trustees, as applicable, considered matters relating to the Management Agreement, including:
| (a) | the nature and quality of the advisory, administrative and other services provided to the Fund by the Investment Adviser and its affiliates, including information about: |
| (i) | the structure, staff and capabilities of the Investment Adviser and its portfolio management teams; |
| (ii) | the groups within the Investment Adviser and its affiliates that support the portfolio management teams or provide other types of necessary services, including fund services groups (e.g., accounting and financial reporting, tax, shareholder services and operations), controls and risk management groups (e.g., legal, compliance, valuation oversight, credit risk management, internal audit, compliance testing, market risk analysis, finance and strategy and central funding), sales and distribution support groups and others (e.g., information technology and training); |
| (iii) | trends in headcount; |
| (iv) | the Investment Adviser’s financial resources and ability to hire and retain talented personnel and strengthen its operations; and |
| (v) | the parent company’s support of the Investment Adviser and its mutual fund business, as expressed by the firm’s senior management; |
| (b) | information on the investment performance of the Fund, including comparisons to the performance of a group of similar mutual funds, as provided by a third party mutual fund data provider engaged as part of the contract review process (the “Outside Data Provider”), and its benchmark performance index, and general investment outlooks in the markets in which the Fund invests; |
| (c) | the terms of the Management Agreement and agreements with affiliated service providers entered into by the Trust on behalf of the Fund; |
| (d) | expense information for the Fund, including: |
| (i) | the relative management fee and expense level of the Fund as compared to those of comparable funds managed by other advisers, as provided by the Outside Data Provider; and |
| (ii) | the Fund’s expense trends over time; |
| (e) | with respect to the extensive investment performance and expense comparison data provided by the Outside Data Provider, its processes in producing that data for the Fund; |
| (f) | the undertakings of the Investment Adviser to waive certain fees and limit certain expenses of the Fund that exceed a specified level, and a summary of contractual fee reductions made by the Investment Adviser and its affiliates over the past several years with respect to the Fund; |
| (g) | information relating to the profitability of the Management Agreement and the transfer agency and distribution and service arrangements of the Fund and the Trust as a whole to the Investment Adviser and its affiliates; |
| (h) | whether the Fund’s existing management fee schedule adequately addressed any economies of scale; |
| (i) | a summary of the “fall-out” benefits derived by the Investment Adviser and its affiliates from their relationships with the Fund, including the fees received by the Investment Adviser’s affiliates from the Fund for transfer agency, portfolio trading, distribution and other services; |
| (j) | a summary of potential benefits derived by the Fund as a result of its relationship with the Investment Adviser; |
21
GOLDMAN SACHS VARIABLE INSURANCE TRUST STRATEGIC INTERNATIONAL EQUITY FUND
Statement Regarding Basis for Approval of Management Agreement (Unaudited) (continued)
| (k) | information regarding commissions paid by the Fund and broker oversight, an update on the Investment Adviser’s soft dollars practices, other information regarding portfolio trading and how the Investment Adviser carries out its duty to seek best execution; |
| (l) | the manner in which portfolio manager compensation is determined, and the number and types of accounts managed by the portfolio managers; |
| (m) | the nature and quality of the services provided to the Fund by its unaffiliated service providers, and the Investment Adviser’s general oversight and evaluation (including reports on due diligence) of those service providers as part of the administration services provided under the Management Agreement; and |
| (n) | the Investment Adviser’s processes and policies addressing various types of potential conflicts of interest; its approach to risk management; the annual review of the effectiveness of the Fund’s compliance program; and periodic compliance reports. |
The Trustees also received an overview of the Fund’s distribution arrangements. They received information regarding the Fund’s assets, share purchase and redemption activity and the payment of Rule 12b-1 distribution and service fees by the Fund’s Service Shares. Information was also provided to the Trustees relating to revenue sharing payments made by and services provided by the Investment Adviser and its affiliates to intermediaries that promote the sale, distribution and/or servicing of Fund shares.
The presentations made at the Board and Committee meetings and at the Annual Meeting encompassed the Fund and other mutual fund portfolios for which the Board of Trustees has responsibility. In evaluating the Management Agreement at the Annual Meeting, the Trustees relied upon their knowledge, resulting from their meetings and other interactions throughout the year, of the Investment Adviser, its affiliates, their services and the Fund. In conjunction with these meetings, the Trustees received written materials and oral presentations on the topics covered, and were advised by their independent legal counsel regarding their responsibilities and other regulatory requirements related to the approval and continuation of mutual fund investment management agreements under applicable law. In addition, the Investment Adviser and its affiliates provided the Independent Trustees with a written response to a formal request for information sent on behalf of the Independent Trustees by their independent legal counsel. During the course of their deliberations, the Independent Trustees met in executive sessions with their independent legal counsel, without representatives of the Investment Adviser or its affiliates present. The Independent Trustees also discussed the broad range of other investment choices that are available to Fund investors, including the availability of comparable funds managed by other advisers.
Nature, Extent and Quality of the Services Provided Under the Management Agreement
As part of their review, the Trustees considered the nature, extent and quality of the services provided by the Investment Adviser. In this regard, the Trustees considered both the investment advisory services and non-advisory services that are provided to the Fund by the Investment Adviser and its affiliates. The Trustees noted the transition in the leadership and changes in personnel of various of the Investment Adviser’s portfolio management teams that had occurred in recent periods, and the ongoing recruitment efforts aimed at bringing high quality investment talent to the Investment Adviser. The Trustees concluded that the Investment Adviser continued to commit substantial financial and operational resources to the Fund and expressed confidence that the Investment Adviser would continue to do so in the future. The Trustees also recognized that the Investment Adviser had made significant commitments to address regulatory compliance requirements applicable to the Fund and the Investment Adviser.
Investment Performance
The Trustees also considered the investment performance of the Fund. In this regard, they compared the investment performance of the Fund to its peers using rankings and ratings compiled by the Outside Data Provider as of December 31, 2012, and updated performance information prepared by the Investment Adviser using the peer group identified by the Outside Data Provider as of March 31, 2013. The information on the Fund’s investment performance was provided for the one-, three-, five- and ten-year periods ending on the applicable dates. The Trustees also reviewed the Fund’s investment performance over time (including on a year-by-year basis) relative to its performance benchmark. In addition, they considered the investment performance trends of the Fund over time, and reviewed the investment performance of the Fund in light of its investment objective and policies and market conditions.
In addition, the Trustees considered materials prepared and presentations made by the Investment Adviser’s senior management and portfolio management personnel, in which Fund performance was assessed. The Trustees also considered the Investment Adviser’s periodic reports with respect to the Fund’s risk profile, and how the Investment Adviser’s approach to risk monitoring and management influences portfolio management.
22
GOLDMAN SACHS VARIABLE INSURANCE TRUST STRATEGIC INTERNATIONAL EQUITY FUND
Statement Regarding Basis for Approval of Management Agreement (Unaudited) (continued)
The Trustees observed that the Fund’s Service Shares had placed in the first quartile of the Fund’s peer group for the one-year period and in the third quartile for the three- and five-year periods, and had outperformed the Fund’s benchmark index for the one-year period and underperformed for the three- and five-year periods ended March 31, 2013. They noted the portfolio management team’s increased emphasis on internal communication among its analysts and Chief Investment Officers and the recent improvement in the Fund’s performance relative to its peer group.
Costs of Services Provided and Competitive Information
The Trustees considered the contractual terms of the Management Agreement and the fee rates payable by the Fund thereunder. In this regard, the Trustees considered information on the services rendered by the Investment Adviser to the Fund, which included both advisory and administrative services that were directed to the needs and operations of the Fund as a registered mutual fund.
In particular, the Trustees reviewed analyses prepared by the Outside Data Provider regarding the expense rankings of the Fund. The analyses provided a comparison of the Fund’s management fees and breakpoints to those of a relevant peer group and a category universe; an expense analysis which compared the Fund’s overall net and gross expenses to a peer group and a category universe; and a five-year history comparing the Fund’s net expenses to the peer and category medians. The analyses also compared the Fund’s transfer agency, custody, and distribution fees, other expenses and fee waivers/reimbursements to those of the peer group and category medians. The Trustees concluded that the comparisons provided by the Outside Data Provider were useful in evaluating the reasonableness of the management fees and total expenses paid by the Fund.
In addition, the Trustees considered the Investment Adviser’s undertakings to waive a portion of its management fee and limit certain expenses of the Fund that exceed a specified level. The Trustees also noted that certain changes were being made to existing fee waiver or expense limitation arrangements of the Fund that would have the effect of lowering total Fund expenses, with such changes taking effect in connection with the Fund’s next annual registration statement update. They also noted that the Investment Adviser did not manage institutional accounts or collective investment vehicles having investment objectives and policies similar to those of the Fund, and therefore this type of fee comparison was not possible.
In addition, the Trustees noted that shareholders are able to redeem their Fund shares at any time if they believe that the Fund fees and expenses are too high or if they are dissatisfied with the performance of the Fund.
Profitability
The Trustees reviewed the Investment Adviser’s revenues and pre-tax profit margins with respect to the Trust and the Fund. In this regard the Trustees noted that they had received, among other things, profitability analyses and summaries, revenue and expense schedules by Fund and by function (i.e., investment management, transfer agency and distribution and service) and the Investment Adviser’s expense allocation methodology. They observed that the profitability and expense figures are substantially similar to those used by the Investment Adviser for many internal purposes, including compensation decisions among various business groups, and are thus subject to a vigorous internal debate about how certain revenue and expenses should be allocated. The Trustees also reviewed the report of the internal audit group within the Goldman Sachs organization, which included an assessment of the reasonableness and consistency of the Investment Adviser’s expense allocation methodology and an evaluation of the accuracy of the Investment Adviser’s profitability analysis calculations. Profitability data for the Trust and the Fund were provided for 2012 and 2011, and the Trustees considered this information in relation to the Investment Adviser’s overall profitability. The Trustees considered the Investment Adviser’s revenues and pre-tax profit margins both in absolute terms and in comparison to information on the reported pre-tax profit margins earned by certain other asset management firms.
Economies of Scale
The Trustees considered the information that had been provided regarding the Investment Adviser’s profitability. The Trustees also considered the breakpoints in the fee rate payable under the Management Agreement for the Fund at the following annual percentage rates of the average daily net assets of the Fund:
| First $1 billion | 0.85 | % | ||
| Next $1 billion | 0.77 | |||
| Next $3 billion | 0.73 | |||
| Next $3 billion | 0.72 | |||
| Over $8 billion | 0.71 |
23
GOLDMAN SACHS VARIABLE INSURANCE TRUST STRATEGIC INTERNATIONAL EQUITY FUND
Statement Regarding Basis for Approval of Management Agreement (Unaudited) (continued)
The Trustees noted that the breakpoints were meant to share potential economies of scale, if any, with the Fund and its shareholders as assets under management reach those asset levels. The Trustees considered the amounts of assets in the Fund; the Fund’s recent share purchase and redemption activity; the information provided by the Investment Adviser relating to the costs of the services provided by the Investment Adviser and its affiliates and their realized profits; information comparing fee rates charged by the Investment Adviser with fee rates charged to other funds in the peer group; and the Investment Adviser’s undertakings to waive certain fees and limit certain expenses of the Fund that exceed a specified level. Upon reviewing these matters at the Annual Meeting, the Trustees concluded that the fee breakpoints represented a means of assuring that benefits of scalability, if any, would be passed along to shareholders at the specified asset levels.
Other Benefits to the Investment Adviser and Its Affiliates
The Trustees also considered the other benefits derived by the Investment Adviser and its affiliates from their relationship with the Fund as stated above, including: (a) transfer agency fees received by Goldman, Sachs & Co. (“Goldman Sachs”); (b) brokerage and futures commissions earned by Goldman Sachs for executing securities and futures transactions on behalf of the Fund; (c) research received by the Investment Adviser from broker-dealers in exchange for executing certain transactions on behalf of the Fund; (d) trading efficiencies resulting from aggregation of orders of the Fund with those for other funds or accounts managed by the Investment Adviser; (e) the Investment Adviser’s ability to leverage the infrastructure designed to service the Fund on behalf of its other clients; (f) the Investment Adviser’s ability to cross-market other products and services to Fund shareholders; (g) Goldman Sachs’ retention of certain fees as Fund Distributor; (h) the Investment Adviser’s ability to negotiate better pricing with custodians on behalf of its other clients, as a result of the relationship with the Fund; and (i) the possibility that the working relationship between the Investment Adviser and the Fund’s third party service providers may cause those service providers to be open to doing business with other areas of Goldman Sachs. In the course of considering the foregoing, the Independent Trustees requested and received further information quantifying certain of these fall-out benefits.
Other Benefits to the Fund and Its Shareholders
The Trustees also noted that the Fund receives certain potential benefits as a result of its relationship with the Investment Adviser, including: (a) trading efficiencies resulting from aggregation of orders of the Fund with those of other funds or accounts managed by the Investment Adviser; (b) improved servicing from vendors because of the volume of business generated by the Investment Adviser and its affiliates; (c) improved servicing from broker-dealers because of the volume of business generated by the Investment Adviser and its affiliates; (d) the Investment Adviser’s ability to negotiate favorable terms with derivatives counterparties as a result of the size and reputation of the Goldman Sachs organization; (e) the Investment Adviser’s knowledge and experience gained from managing other accounts and products; (f) the Investment Adviser’s ability to hire and retain qualified personnel to provide services to the Fund because of the reputation of the Goldman Sachs organization; (g) the Fund’s access, through the Investment Adviser, to certain firmwide resources (e.g., proprietary risk management systems and databases), subject to certain restrictions; and (h) the Fund’s access to certain affiliated distribution channels. The Trustees noted the competitive nature of the mutual fund marketplace, and noted further that many of the Fund’s shareholders invested in the Fund in part because of the Fund’s relationship with the Investment Adviser and that those shareholders have a general expectation that the relationship will continue.
Conclusion
In connection with their consideration of the Management Agreement, the Trustees gave weight to each of the factors described above, but did not identify any particular factor as controlling their decision. After deliberation and consideration of all of the information provided, including the factors described above, the Trustees concluded, in the exercise of their business judgment, that the management fees paid by the Fund were reasonable in light of the services provided to it by the Investment Adviser, the Investment Adviser’s costs and the Fund’s current and reasonably foreseeable asset levels. The Trustees unanimously concluded that the Investment Adviser’s continued management likely would benefit the Fund and its shareholders and that the Management Agreement should be approved and continued with respect to the Fund until June 30, 2014.
24
| TRUSTEES | OFFICERS | |
| Ashok N. Bakhru, Chairman | James A. McNamara, President | |
| Donald C. Burke | George F. Travers, Principal Financial Officer | |
| John P. Coblentz, Jr. | Caroline L. Kraus, Secretary | |
| Diana M. Daniels | Scott M. McHugh, Treasurer | |
| Joseph P. LoRusso | ||
| James A. McNamara | ||
| Jessica Palmer | ||
| Alan A. Shuch | ||
| Richard P. Strubel |
GOLDMAN, SACHS & CO.
Distributor and Transfer Agent
GOLDMAN SACHS ASSET MANAGEMENT, L.P.
Investment Adviser
200 West Street, New York, New York 10282
GOLDMAN SACHS ASSET MANAGEMENT INTERNATIONAL
Investment Adviser
Christchurch Court, 10-15 Newgate Street London, EC1A 7HD, England, United Kingdom
Visit our web site at www.goldmansachsfunds.com/vit to obtain the most recent month-end returns.
The reports concerning the Fund included in this shareholder report may contain certain forward-looking statements about the factors that may affect the performance of the Fund in the future. These statements are based on Fund management’s predictions and expectations concerning certain future events and their expected impact on the Fund, such as performance of the economy as a whole and of specific industry sectors, changes in the levels of interest rates, the impact of developing world events, and other factors that may influence the future performance of the Fund. Management believes these forward-looking statements to be reasonable, although they are inherently uncertain and difficult to predict. Actual events may cause adjustments in portfolio management strategies from those currently expected to be employed.
A description of the policies and procedures that the Fund uses to determine how to vote proxies relating to portfolio securities and information regarding how the Fund voted proxies relating to portfolio securities during the most recent 12-month period ended June 30 is available (i) without charge, upon request by calling 1-800-621-2550; and (ii) on the Securities and Exchange Commission (“SEC”) web site at http://www.sec.gov.
The Fund files its complete schedule of portfolio holdings with the SEC for the first and third quarters of each fiscal year on Form N-Q. The Fund’s Form N-Q is available on the SEC’s web site at http://www.sec.gov within 60 days after the Fund’s first and third fiscal quarters. The Fund’s Forms N-Q may be reviewed and copied at the SEC’s Public Reference Room in Washington, D.C. and information on the operation of the Public Reference Room may also be obtained by calling 1-800-SEC-0330. Forms N-Q may be obtained upon request and without charge by calling 1-800-621-2550.
Economic and market forecasts presented herein reflect our judgment as of the date of this presentation and are subject to change without notice. These forecasts do not take into account the specific investment objectives, restrictions, tax and financial situation or other needs of any specific client. Actual data will vary and may not be reflected here. These forecasts are subject to high levels of uncertainty that may affect actual performance. Accordingly, these forecasts should be viewed as merely representative of a broad range of possible outcomes. These forecasts are estimated, based on assumptions, and are subject to significant revision and may change materially as economic and market conditions change. Goldman Sachs has no obligation to provide updates or changes to these forecasts. Case studies and examples are for illustrative purposes only.
Holdings and allocations shown are as of June 30, 2013 and may not be representative of future investments. Fund holdings should not be relied on in making investment decisions and should not be construed as research or investment advice regarding particular securities. Current and future holdings are subject to risk.
The Global Industry Classification Standard (“GICS”) was developed by and is the exclusive property and a service mark of Morgan Stanley Capital International Inc. (“MSCI”) and Standard & Poor’s, a division of The McGraw-Hill Companies, Inc. (“S&P”) and is licensed for use by Goldman Sachs. Neither MSCI, S&P nor any other party involved in making or compiling the GICS or any GICS classifications makes any express or implied warranties or representations with respect to such standard or classification (or the results to be obtained by the use thereof), and all such parties hereby expressly disclaim all warranties of originality, accuracy, completeness, merchantability or fitness for a particular purpose with respect to any of such standard or classification. Without limiting any of the foregoing, in no event shall MSCI, S&P, any of their affiliates or any third party involved in making or compiling the GICS or any GICS classifications have any liability for any direct, indirect, special, punitive, consequential or any other damages (including lost profits) even if notified of the possibility of such damages.
The portfolio risk management process includes an effort to monitor and manage risk, but does not imply low risk.
Shares of the Goldman Sachs VIT Funds are offered to separate accounts of participating life insurance companies for the purpose of funding variable annuity contracts and variable life insurance policies. Shares of the Fund are not offered directly to the general public. The variable annuity contracts and variable life insurance policies are described in the separate prospectuses issued by participating insurance companies. You should refer to those prospectuses for information about surrender charges, mortality and expense risk fees and other charges that may be assessed by participating insurance companies under the variable annuity contracts or variable life insurance policies. Such fees or charges, if any, may affect the return you may realize with respect to your investments. Ask your representative for more complete information. Please consider a fund’s objectives, risks and charges and expenses, and read the prospectus carefully before investing. The prospectus contains this and other information about the Fund.
This material is not authorized for distribution to prospective investors unless preceded or accompanied by a current Prospectus or summary prospectus, if applicable. Investors should consider a Fund’s objective, risks, and charges and expenses, and read the summary prospectus, if available, and/or the Prospectus carefully before investing or sending money. The summary prospectus, if available, and the Prospectus contain this and other information about a Fund and may be obtained from your Authorized Institution or from Goldman, Sachs & Co. by calling 1-800-621-2550.
This report is prepared for the general information of contract owners and is not an offer of shares of the Goldman Sachs Variable Insurance Trust: Goldman Sachs Strategic International Equity Fund.
© 2013 Goldman Sachs. All rights reserved.
VITINTLSAR13/106794.MF.MED.TMPL/8/2013
Goldman
Sachs Variable Insurance Trust
Goldman Sachs
Structured Small Cap Equity Fund
Semi-Annual Report
June 30, 2013

GOLDMAN SACHS VARIABLE INSURANCE TRUST STRUCTURED SMALL CAP EQUITY FUND
Principal Investment Strategies and Risks
This is not a complete list of risks that may affect the Fund. For additional information concerning the risks applicable to the Fund, please see the Fund’s Prospectus.
Shares of the Goldman Sachs Variable Insurance Trust — Goldman Sachs Structured Small Cap Equity Fund are offered to separate accounts of participating life insurance companies for the purpose of funding variable annuity contracts and variable life insurance policies. Shares of the Fund are not offered directly to the general public. The variable annuity contracts and variable life insurance policies are described in the separate prospectuses issued by participating insurance companies. You should refer to those prospectuses for information about surrender charges, mortality and expense risk fees and other charges that may be assessed by participating insurance companies under the variable annuity contracts or variable life insurance policies. Such fees or charges, if any, may affect the return you realize with respect to your investments. Ask your representative for more complete information. Please consider the Fund’s objective, risks and charges and expenses, and read the Prospectus carefully before investing. The Prospectus contains this and other information about the Fund.
The Goldman Sachs Structured Small Cap Equity Fund invests primarily in a broadly diversified portfolio of equity investments in small-capitalization U.S. issuers, including foreign issuers traded in the United States. The Fund’s equity investments will be subject to market risk, which means that the value of the securities in which it invests may go up or down in response to the prospects of individual companies, particular sectors and/or general economic conditions. The securities of mid- and small- capitalization companies involve greater risks than those associated with larger, more established companies and may be subject to more abrupt or erratic price movements. The Investment Adviser’s use of quantitative models to execute the Fund’s investment strategy may fail to produce the intended result. Different investment styles (e.g., “quantitative”) tend to shift in and out of favor, and at times the Fund may underperform other funds that invest in similar asset classes. The Fund may have a high rate of portfolio turnover, which involves correspondingly greater expenses which must be borne by the Fund, and is also likely to result in short-term capital gains taxable to shareholders.
1
GOLDMAN SACHS VARIABLE INSURANCE TRUST STRUCTURED SMALL CAP EQUITY FUND
INVESTMENT OBJECTIVE
The Fund seeks long-term growth of capital.
Portfolio Management Discussion and Analysis
Below, the Goldman Sachs Quantitative Investment Strategies Team discusses the Goldman Sachs Variable Insurance Trust — Goldman Sachs Structured Small Cap Equity Fund’s (the “Fund”) performance and positioning for the six-month period ended June 30, 2013 (the “Reporting Period”).
How did the Fund perform during the Reporting Period?
During the Reporting Period, the Fund’s Institutional and Service Shares generated cumulative total returns of 14.63% and 14.55%, respectively. These returns compare to the 15.86% cumulative total return of the Fund’s benchmark, the Russell 2000® Index (with dividends reinvested) (the “Russell Index”), during the same time period.
What economic and market factors most influenced the equity markets as a whole during the annual period?
Representing the U.S. equity market, the S&P® 500 Index gained 13.82% during the Reporting Period, making it the strongest first half since 1998.
U.S. equities, as represented by the S&P® 500 Index, extended their rally from 2012 with a strong first quarter in 2013. Indeed, the S&P® 500 Index finished the first quarter of 2013 with significant gains, making a five-year high during these months. The Dow Jones Industrial Average also hit a new record high during the first calendar quarter.
Despite the overhang of automatic spending cuts, or sequestration, that went into effect in March 2013, U.S. equity markets reflected a variety of improving economic indicators. Strong momentum in the housing market continued, as the Case-Shiller Index of house prices rose 8.1% in January 2013, year-over-year the fastest pace since mid-2006. The employment picture also improved, with the unemployment rate dropping to 7.7%. Strong retail sales suggested consumers may have been feeling the effects of better housing and labor market conditions.
After a strong start to the second quarter of 2013, bullish sentiment began to fade, and the U.S. equity rally halted in mid-May 2013 when Federal Reserve (“Fed”) Chair Bernanke announced the potential “tapering” of the pace of quantitative easing asset purchases. U.S. equity markets reacted negatively again in June to news the slowing of the asset purchase program could begin later this year, with the program ending by the middle of 2014 if the economy grows as expected. U.S. equity markets calmed toward the end of the month as a downward revision of first quarter Gross Domestic Product (“GDP”) from 2.4% to 1.8% supported reassurance from the Fed that it would only begin reducing asset purchases if the economy was clearly on track. Still, the S&P® 500 Index declined modestly in June 2013, ending seven consecutive months of gains and muting returns for the quarter as a whole. Even with that, both the S&P® 500 Index and the Dow Jones Industrial Average made fresh record highs fueled by the continued strong rebound in house prices during the second calendar quarter, and returns for the Reporting Period overall were still significantly up.
For the Reporting Period as a whole, the Russell Index, representing the U.S. small-cap equity market, rose 15.86%. All ten sectors in the Russell Index were up, with the consumer discretionary, consumer staples and health care sectors gaining the most. Materials, energy and utilities were weakest, though still producing positive returns.
All segments of the U.S. equity market advanced during the Reporting Period, with small-cap stocks, as measured by the Russell Index gaining most, followed by mid-cap stocks and then large-cap stocks, as measured by the Russell Midcap® Index and the Russell 1000® Index, respectively. From a style perspective, value-oriented stocks solidly outpaced growth-oriented stocks in the large-cap and mid-cap segments of the U.S. equity market; however, growth stocks substantially outperformed value stocks in the small-cap segment of the U.S. equity market. (All as measured by the Russell Investments indices.)
What key factors were responsible for the Fund’s performance during the Reporting Period?
The Fund underperformed the Russell Index during the Reporting Period. While our quantitative model’s investment themes added to relative performance overall, security selection dragged down relative results during the Reporting Period.
2
GOLDMAN SACHS VARIABLE INSURANCE TRUST STRUCTURED SMALL CAP EQUITY FUND
What impact did the Fund’s investment themes have on performance during the Reporting Period?
As expected, and in keeping with our investment approach, our quantitative model and its six investment themes — Valuation, Profitability, Quality, Management, Momentum and Sentiment — had the greatest impact on relative performance. We use these themes to take a long-term view of market patterns and look for inefficiencies, selecting stocks for the Fund and overweighting or underweighting the ones chosen by the model. Over time and by design, the performance of any one of the model’s investment themes tends to have a low correlation with the model’s other themes, demonstrating the diversification benefit of the Fund’s theme-driven quantitative model. The variance in performance supports our research indicating that the diversification provided by the Fund’s different investment themes is a significant investment advantage over the long term, even though the Fund may experience underperformance in the short term. Of course, diversification does not protect an investor from market risk nor does it ensure a profit.
During the Reporting Period, two of our six investment themes — Momentum and Valuation — contributed positively to the Fund’s relative performance. The Momentum theme seeks to predict drifts in stock prices caused by delayed investor reaction to company-specific information and information about related companies. Valuation attempts to capture potential mispricings of securities, typically by comparing a measure of the company’s intrinsic value to its market value.
The Fund’s Profitability, Management and Sentiment themes detracted. The Profitability theme assesses whether a company is earning more than its cost of capital. The Management theme assesses the characteristics, policies and strategic decisions of company management. The Sentiment theme reflects selected investment views and decisions of individuals and financial intermediaries. The Quality theme, which assesses both firm and financial quality, had a relatively neutral impact during the Reporting Period.
How did the Fund’s sector and industry allocations affect relative performance?
In constructing the Fund’s portfolio, we focus on picking stocks rather than making industry or sector bets. Consequently, the Fund is similar to its benchmark, the Russell Index, in terms of its sector allocation and style. We manage the Fund’s industry and sector exposure by including industry factors in our risk model and by explicitly penalizing industry and sector deviations from the benchmark index in optimization. Sector weights or changes in weights generally do not have a meaningful impact on relative performance.
Did stock selection help or hurt Fund performance during the Reporting Period?
We seek to outpace the Russell Index by overweighting stocks that we expect to outperform and underweighting those that we think may lag. We also build positions based on our thematic views. For example, the Fund aims to hold a basket of stocks with more favorable Momentum characteristics than the benchmark index. During the Reporting Period, stock selection overall detracted from the Fund’s relative performance.
Security selection in the consumer discretionary, energy and industrials sectors dampened the Fund’s results relative to the Russell Index. Stock selection in the information technology, consumer staples and materials sectors contributed positively to the Fund’s relative returns.
Which individual stock positions contributed the most to the Fund’s relative returns during the Reporting Period?
The Fund benefited most from overweight positions in e-commerce services provider Zillow, biopharmaceutical company Pharmacyclics and hardwood flooring retailer Lumber Liquidators Holdings. We chose to overweight Zillow because of our positive views on Momentum and Profitability. The Fund was overweight Pharmacyclics due to our positive views on Momentum and Valuation. The Fund was overweight Lumber Liquidators Holdings as a result of our positive views on Profitability and Quality.
Which individual positions detracted from the Fund’s results during the Reporting Period?
Detracting most from the Fund’s results relative to its benchmark index were overweight positions in biopharmaceutical company Affymax, air bed mattress retailer Select Comfort and oil refiner and convenience store operator Alon USA Energy. The Fund was overweight Affymax due to our positive views on Momentum and Quality. Our positive views on Profitability and Momentum led us to overweight Select Comfort. We chose to overweight Alon USA Energy because of our positive views on Quality and Valuation.
3
GOLDMAN SACHS VARIABLE INSURANCE TRUST STRUCTURED SMALL CAP EQUITY FUND
How did the Fund use derivatives during the Reporting Period?
During the Reporting Period, we did not use derivatives as part of an active management strategy to add value to the Fund’s results. However, we used equity index futures contracts, on an opportunistic basis, to equitize the Fund’s excess cash holdings. In other words, we put the Fund’s excess cash holdings to work by using them as collateral for the purchase of stock futures.
Did you make any enhancements to your quantitative models during the Reporting Period?
We continuously look for ways to improve our investment process. During the second quarter of 2013, we implemented enhancements to our Valuation theme through the introduction of more industry specific models, including a model tailored to the banking industry. We believe these industry specific models should allow us to capture industry-specific dynamics and local knowledge while retaining our systematic approach.
What was the Fund’s sector positioning relative to its benchmark index at the end of the Reporting Period?
As of June 30, 2013, the Fund was overweight the industrials and consumer discretionary sectors relative to the Russell Index. The Fund was underweight energy, information technology and utilities and was rather neutrally weighted in health care, materials, financials, consumer staples and telecommunication services compared to the benchmark index on the same date.
What is your strategy going forward for the Fund?
Looking ahead, we continue to believe that less expensive stocks should outpace more expensive stocks, and stocks with good momentum should outperform those with poor momentum. We intend to maintain our focus on seeking companies about which fundamental research analysts are becoming more positive as well as profitable companies with sustainable earnings and a track record of using their capital to enhance shareholder value. As such, we anticipate remaining fully invested with long-term performance likely to be the result of stock selection rather than sector or capitalization allocations.
We stand behind our investment philosophy that sound economic investment principles, coupled with a disciplined quantitative approach, can provide strong, uncorrelated returns over the long term. Our research agenda is robust, and we continue to enhance our existing models, add new proprietary forecasting signals and improve our trading execution as we seek to provide the most value to our shareholders.
4
FUND BASICS
Structured Small Cap Equity Fund
as of June 30, 2013
STANDARDIZED TOTAL RETURNS1
| For the period ended 6/30/2013 | One Year | Five Years | Ten Years | Since Inception | Inception Date | |||||||||||||
| Institutional | 19.98 | % | 9.43 | % | 7.55 | % | 5.63 | % | 2/13/98 | |||||||||
| Service | 19.70 | 9.13 | N/A | 4.93 | 8/31/07 | |||||||||||||
| 1 | The Standardized Total Returns are average annual total returns as of the most recent calendar quarter-end. They assume reinvestment of all distributions at net asset value (“NAV”). Because Institutional Shares and Service Shares do not involve a sales charge, such a charge is not applied to their Standardized Total Returns. |
Total return figures in the above chart represent past performance and do not indicate future results, which will vary. The investment return and principal value of an investment will fluctuate and, therefore, an investor’s shares, when redeemed, may be worth more or less than their original cost. Current performance may be lower or higher than the total return figures in the above chart. Please visit www.goldmansachsfunds.com/vit to obtain the most recent month-end returns. Performance reflects fee waivers and/or expense limitations in effect during the periods shown. In their absence, performance would be reduced.
EXPENSE RATIOS2
| Net Expense Ratio (Current) | Gross Expense Ratio (Before Waivers) | |||||||
| Institutional | 0.81 | % | 0.97 | % | ||||
| Service | 1.06 | 1.22 | ||||||
| 2 | The expense ratios of the Fund, both current (net of applicable fee waivers and/or expense limitations) and before waivers (gross of applicable fee waivers and/or expense limitations) are as set forth above according to the most recent publicly available Prospectus for the Fund and may differ from the expense ratios disclosed in the Financial Highlights in this report. The Fund’s waivers and/or expense limitations will remain in place through at least April 30, 2014, and prior to such date the Investment Adviser may not terminate the arrangements without the approval of the Fund’s Board of Trustees. If these arrangements are discontinued in the future, the expense ratios may change without shareholder approval. |
TOP TEN HOLDINGS AS OF 6/30/20133
| Holding | % of Total Net Assets | Line of Business | ||||
| Questcor Pharmaceuticals, Inc. | 0.8% | Pharmaceuticals, Biotechnology & Life Sciences | ||||
| Aspen Technology, Inc. | 0.7 | Software & Services | ||||
| Papa John’s International, Inc. | 0.7 | Consumer Services | ||||
| Pilgrim’s Pride Corp. | 0.7 | Food, Beverage & Tobacco | ||||
| Allegiant Travel Co. | 0.7 | Transportation | ||||
| Tenneco, Inc. | 0.7 | Automobiles & Components | ||||
| PrivateBancorp, Inc. | 0.7 | Banks | ||||
| Centene Corp. | 0.7 | Health Care Equipment & Services | ||||
| Biglari Holdings, Inc. | 0.7 | Consumer Services | ||||
| Hancock Holding Co. | 0.7 | Banks | ||||
| 3 | The top ten holdings may not be representative of the Fund’s future investments. |
5
FUND BASICS
FUND VS. BENCHMARK SECTOR ALLOCATIONS4
As of June 30, 2013
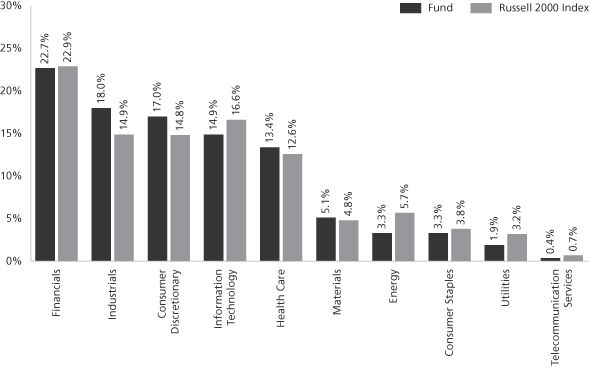
| 4 | The Fund is actively managed and, as such, its composition may differ over time. Consequently, the Fund’s overall sector allocations may differ from percentages contained in the graph above. The graph categorizes investments using Global Industry Classification Standard (“GICS”), however, the sector classifications used by the portfolio management team may differ from GICS. The percentage shown for each investment category reflects the value of investments in that category as a percentage of market value (excluding investments in the securities lending reinvestment vehicle, if any). Investments in securities lending reinvestment vehicle represents 5.6% of the Fund’s net assets at June 30, 2013. The graph depicts the Fund’s investments but may not represent the Fund’s market exposure due to the exclusion of certain derivatives, if any, as listed in the Additional Investment Information section of the Schedule of Investments. |
6
GOLDMAN SACHS VARIABLE INSURANCE TRUST STRUCTURED SMALL CAP EQUITY FUND
Schedule of Investments
June 30, 2013 (Unaudited)
| Shares | Description | Value | ||||||
| Common Stocks – 96.9% | ||||||||
| Automobiles & Components – 2.0% |
| ||||||
| 5,085 | Cooper Tire & Rubber Co. | $ | 168,670 | |||||
| 20,749 | Dana Holding Corp. | 399,626 | ||||||
| 5,542 | Gentex Corp. | 127,743 | ||||||
| 5,736 | Modine Manufacturing Co.* | 62,408 | ||||||
| 6,436 | Standard Motor Products, Inc. | 221,012 | ||||||
| 17,049 | Stoneridge, Inc.* | 198,450 | ||||||
| 11,232 | Superior Industries International, Inc. | 193,303 | ||||||
| 17,744 | Tenneco, Inc.* | 803,448 | ||||||
| 1,992 | Visteon Corp.* | 125,735 | ||||||
|
| |||||||
| 2,300,395 | ||||||||
|
| |||||||
| Banks – 5.7% |
| ||||||
| 4,876 | 1st Source Corp. | 115,854 | ||||||
| 24,418 | Astoria Financial Corp. | 263,226 | ||||||
| 3,420 | BancorpSouth, Inc. | 60,534 | ||||||
| 2,273 | BOK Financial Corp. | 145,586 | ||||||
| 17,261 | Columbia Banking System, Inc. | 410,984 | ||||||
| 12,928 | CVB Financial Corp. | 152,033 | ||||||
| 6,132 | First Bancorp, Inc. | 107,187 | ||||||
| 19,124 | First Financial Bancorp | 284,948 | ||||||
| 12,553 | First Interstate Bancsystem, Inc. | 260,224 | ||||||
| 9,402 | FirstMerit Corp. | 188,322 | ||||||
| 7,037 | Great Southern Bancorp, Inc. | 189,718 | ||||||
| 25,720 | Hancock Holding Co. | 773,400 | ||||||
| 1,042 | Home BancShares, Inc. | 27,061 | ||||||
| 18,697 | International Bancshares Corp. | 422,178 | ||||||
| 3,260 | Oritani Financial Corp. | 51,117 | ||||||
| 5,952 | PacWest Bancorp | 182,429 | ||||||
| 37,349 | PrivateBancorp, Inc. | 792,172 | ||||||
| 11,699 | Renasant Corp. | 284,754 | ||||||
| 1,689 | Republic Bancorp, Inc. Class A | 37,023 | ||||||
| 2,511 | State Bank Financial Corp. | 37,740 | ||||||
| 42,126 | Susquehanna Bancshares, Inc. | 541,319 | ||||||
| 1,506 | Texas Capital Bancshares, Inc.* | 66,806 | ||||||
| 46,228 | Umpqua Holdings Corp. | 693,882 | ||||||
| 10,374 | Wintrust Financial Corp. | 397,117 | ||||||
|
| |||||||
| 6,485,614 | ||||||||
|
| |||||||
| Capital Goods – 9.4% |
| ||||||
| 10,245 | AAR Corp. | 225,185 | ||||||
| 1,312 | Acuity Brands, Inc. | 99,082 | ||||||
| 3,473 | AECOM Technology Corp.* | 110,407 | ||||||
| 1,857 | Alamo Group, Inc. | 75,803 | ||||||
| 3,990 | Albany International Corp. Class A | 131,590 | ||||||
| 7,887 | Alliant Techsystems, Inc. | 649,337 | ||||||
| 3,352 | American Science & Engineering, Inc. | 187,712 | ||||||
| 5,860 | American Woodmark Corp.* | 203,342 | ||||||
| 8,625 | Astec Industries, Inc. | 295,751 | ||||||
| 14,104 | Brady Corp. Class A | 433,416 | ||||||
| 18,605 | Briggs & Stratton Corp. | 368,379 | ||||||
| 2,026 | Carlisle Companies, Inc. | 126,240 | ||||||
| 2,338 | Donaldson Co., Inc. | 83,373 | ||||||
| 6,847 | Ducommun, Inc.* | 145,567 | ||||||
| 8,338 | Encore Wire Corp. | 284,326 | ||||||
| 15,590 | EnerSys, Inc. | 764,534 | ||||||
|
| |||||||
| Common Stocks – (continued) | ||||||||
| Capital Goods – (continued) |
| ||||||
| 665 | Esterline Technologies Corp.* | $ | 48,073 | |||||
| 21,359 | Exelis, Inc. | 294,541 | ||||||
| 12,057 | Hyster-Yale Materials Handling, Inc. | 757,059 | ||||||
| 715 | IDEX Corp. | 38,474 | ||||||
| 13,364 | John Bean Technologies Corp. | 280,778 | ||||||
| 6,356 | Kadant, Inc. | 191,761 | ||||||
| 5,298 | Lennox International, Inc. | 341,933 | ||||||
| 22,793 | LSI Industries, Inc. | 184,395 | ||||||
| 8,267 | Lydall, Inc.* | 120,698 | ||||||
| 9,579 | Miller Industries, Inc. | 147,325 | ||||||
| 10,181 | Mueller Industries, Inc. | 513,428 | ||||||
| 14,516 | Orbital Sciences Corp.* | 252,143 | ||||||
| 23,539 | Spirit Aerosystems Holdings, Inc. Class A* | 505,618 | ||||||
| 9,156 | Taser International, Inc.* | 78,009 | ||||||
| 15,438 | Tecumseh Products Co. Class A* | 168,737 | ||||||
| 4,028 | Tennant Co. | 194,432 | ||||||
| 14,333 | Trex Co., Inc.* | 680,674 | ||||||
| 15,484 | Universal Forest Products, Inc. | 618,121 | ||||||
| 7,644 | WABCO Holdings, Inc.* | 570,930 | ||||||
| 3,891 | Watsco, Inc. | 326,688 | ||||||
| 4,280 | Watts Water Technologies, Inc. Class A | 194,055 | ||||||
|
| |||||||
| 10,691,916 | ||||||||
|
| |||||||
| Commercial & Professional Services – 3.3% |
| ||||||
| 11,013 | CDI Corp. | 155,944 | ||||||
| 3,172 | Consolidated Graphics, Inc.* | 149,116 | ||||||
| 9,051 | Deluxe Corp. | 313,617 | ||||||
| 8,302 | Heidrick & Struggles International, Inc. | 138,809 | ||||||
| 2,587 | ICF International, Inc.* | 81,516 | ||||||
| 11,844 | Insperity, Inc. | 358,873 | ||||||
| 41,384 | Kelly Services, Inc. Class A | 722,978 | ||||||
| 13,701 | Kforce, Inc. | 200,035 | ||||||
| 19,148 | Kimball International, Inc. Class B | 185,927 | ||||||
| 8,571 | Manpowergroup, Inc. | 469,691 | ||||||
| 2,003 | Mine Safety Appliances Co. | 93,240 | ||||||
| 4,136 | Quad/Graphics, Inc. | 99,678 | ||||||
| 50,203 | Steelcase, Inc. Class A | 731,960 | ||||||
|
| |||||||
| 3,701,384 | ||||||||
|
| |||||||
| Consumer Durables & Apparel – 3.0% |
| ||||||
| 4,349 | Beazer Homes USA, Inc.*(a) | 76,194 | ||||||
| 7,770 | Blyth, Inc.(a) | 108,469 | ||||||
| 17,024 | Brunswick Corp. | 543,917 | ||||||
| 2,494 | Columbia Sportswear Co.(a) | 156,249 | ||||||
| 2,729 | CSS Industries, Inc. | 68,034 | ||||||
| 11,917 | Ethan Allen Interiors, Inc. | 343,210 | ||||||
| 4,838 | Harman International Industries, Inc. | 262,220 | ||||||
| 94,917 | Hovnanian Enterprises, Inc. Class A*(a) | 532,484 | ||||||
| 3,533 | KB Home | 69,353 | ||||||
| 2,162 | Libbey, Inc.* | 51,823 | ||||||
| 10,087 | Movado Group, Inc. | 341,243 | ||||||
| 3,351 | NACCO Industries, Inc. Class A | 191,945 | ||||||
| 8,858 | Perry Ellis International, Inc. | 179,906 | ||||||
| 6,985 | PulteGroup, Inc.* | 132,505 | ||||||
|
| |||||||
| The accompanying notes are an integral part of these financial statements. | 7 |
GOLDMAN SACHS VARIABLE INSURANCE TRUST STRUCTURED SMALL CAP EQUITY FUND
Schedule of Investments (continued)
June 30, 2013 (Unaudited)
| Shares | Description | Value | ||||||
| Common Stocks – (continued) | ||||||||
| Consumer Durables & Apparel – (continued) |
| ||||||
| 2,266 | Skechers U.S.A., Inc. Class A* | $ | 54,407 | |||||
| 31,220 | Smith & Wesson Holding Corp.*(a) | 311,576 | ||||||
|
| |||||||
| 3,423,535 | ||||||||
|
| |||||||
| Consumer Services – 6.8% |
| ||||||
| 13,616 | Ameristar Casinos, Inc. | 357,965 | ||||||
| 28,198 | Apollo Group, Inc. Class A* | 499,668 | ||||||
| 9,497 | Ascent Capital Group, Inc. Class A* | 741,431 | ||||||
| 10,369 | Bally Technologies, Inc.* | 585,019 | ||||||
| 1,893 | Biglari Holdings, Inc.* | 776,887 | ||||||
| 27,212 | Boyd Gaming Corp.* | 307,496 | ||||||
| 1,148 | CEC Entertainment, Inc. | 47,114 | ||||||
| 12,665 | Coinstar, Inc.*(a) | 743,055 | ||||||
| 12,554 | Domino’s Pizza, Inc. | 730,015 | ||||||
| 12,097 | K12, Inc.* | 317,788 | ||||||
| 6,406 | Krispy Kreme Doughnuts, Inc.* | 111,785 | ||||||
| 12,539 | Papa John’s International, Inc.* | 819,674 | ||||||
| 2,360 | Red Robin Gourmet Burgers, Inc.* | 130,225 | ||||||
| 14,399 | Regis Corp. | 236,431 | ||||||
| 3,348 | Strayer Education, Inc.(a) | 163,483 | ||||||
| 28,631 | Texas Roadhouse, Inc. | 716,348 | ||||||
| 8,729 | The Cheesecake Factory, Inc. | 365,658 | ||||||
|
| |||||||
| 7,650,042 | ||||||||
|
| |||||||
| Diversified Financials – 7.5% |
| ||||||
| 84,534 | Apollo Investment Corp. | 654,293 | ||||||
| 1,383 | Arlington Asset Investment Corp. Class A | 36,981 | ||||||
| 58,847 | BGC Partners, Inc. Class A | 346,609 | ||||||
| 33,495 | BlackRock Kelso Capital Corp. | 313,513 | ||||||
| 8,920 | Cash America International, Inc. | 405,503 | ||||||
| 4,742 | CBOE Holdings, Inc. | 221,167 | ||||||
| 10,509 | Cohen & Steers, Inc. | 357,096 | ||||||
| 5,352 | DFC Global Corp.* | 73,911 | ||||||
| 677 | Diamond Hill Investment Group, Inc. | 57,579 | ||||||
| 22,035 | Federated Investors, Inc. Class B(a) | 603,979 | ||||||
| 2,184 | Financial Engines, Inc. | 99,569 | ||||||
| 4,733 | FXCM, Inc. Class A | 77,669 | ||||||
| 7,909 | GAMCO Investors, Inc. Class A | 438,238 | ||||||
| 14,135 | Gladstone Capital Corp. | 115,483 | ||||||
| 16,159 | Greenhill & Co., Inc. | 739,113 | ||||||
| 6,474 | Interactive Brokers Group, Inc. Class A | 103,390 | ||||||
| 4,080 | Investment Technology Group, Inc.* | 57,038 | ||||||
| 77,699 | Janus Capital Group, Inc. | 661,218 | ||||||
| 3,908 | LPL Financial Holdings, Inc. | 147,566 | ||||||
| 9,610 | MarketAxess Holdings, Inc. | 449,268 | ||||||
| 16,671 | Nelnet, Inc. Class A | 601,656 | ||||||
| 11,578 | NGP Capital Resources Co. | 70,973 | ||||||
| 19,949 | PHH Corp.* | 406,561 | ||||||
| 4,105 | Piper Jaffray Companies* | 129,759 | ||||||
| 4,181 | Safeguard Scientifics, Inc.* | 67,105 | ||||||
| 7,520 | The NASDAQ OMX Group, Inc. | 246,581 | ||||||
|
| |||||||
| Common Stocks – (continued) | ||||||||
| Diversified Financials – (continued) |
| ||||||
| 6,665 | Waddell & Reed Financial, Inc. Class A | $ | 289,928 | |||||
| 7,619 | Walter Investment Management Corp.* | 257,598 | ||||||
| 12,713 | WisdomTree Investments, Inc.* | 147,089 | ||||||
| 4,019 | World Acceptance Corp.*(a) | 349,412 | ||||||
|
| |||||||
| 8,525,845 | ||||||||
|
| |||||||
| Energy – 3.2% |
| ||||||
| 39,587 | Alon USA Energy, Inc. | 572,428 | ||||||
| 3,425 | Contango Oil & Gas Co. | 115,594 | ||||||
| 17,503 | Delek US Holdings, Inc. | 503,736 | ||||||
| 4,590 | EXCO Resources, Inc. | 35,068 | ||||||
| 14,187 | Exterran Holdings, Inc.* | 398,938 | ||||||
| 2,985 | Green Plains Renewable Energy, Inc.* | 39,760 | ||||||
| 5,326 | Helix Energy Solutions Group, Inc.* | 122,711 | ||||||
| 19,422 | Parker Drilling Co.* | 96,722 | ||||||
| 986 | SEACOR Holdings, Inc. | 81,887 | ||||||
| 19,820 | Ship Finance International Ltd. | 294,129 | ||||||
| 8,922 | Stone Energy Corp.* | 196,552 | ||||||
| 2,150 | Tesoro Corp. | 112,488 | ||||||
| 23,445 | W&T Offshore, Inc. | 335,029 | ||||||
| 26,005 | Western Refining, Inc. | 729,960 | ||||||
|
| |||||||
| 3,635,002 | ||||||||
|
| |||||||
| Food & Staples Retailing – 0.4% |
| ||||||
| 5,935 | Harris Teeter Supermarkets, Inc. | 278,114 | ||||||
| 11,024 | The Pantry, Inc.* | 134,272 | ||||||
|
| |||||||
| 412,386 | ||||||||
|
| |||||||
| Food, Beverage & Tobacco – 2.3% |
| ||||||
| 1,297 | J&J Snack Foods Corp. | 100,907 | ||||||
| 8,801 | Lancaster Colony Corp. | 686,390 | ||||||
| 54,325 | Pilgrim’s Pride Corp.* | 811,615 | ||||||
| 10,887 | Sanderson Farms, Inc. | 723,115 | ||||||
| 85 | Seaboard Corp. | 230,180 | ||||||
|
| |||||||
| 2,552,207 | ||||||||
|
| |||||||
| Health Care Equipment & Services – 5.3% |
| ||||||
| 807 | Align Technology, Inc.* | 29,891 | ||||||
| 7,711 | Amedisys, Inc.* | 89,602 | ||||||
| 10,455 | AMN Healthcare Services, Inc.* | 149,715 | ||||||
| 5,133 | Bio-Reference Labs, Inc.*(a) | 147,574 | ||||||
| 14,939 | Centene Corp.* | 783,700 | ||||||
| 8,512 | Cyberonics, Inc.* | 442,283 | ||||||
| 5,051 | Cynosure, Inc. Class A* | 131,225 | ||||||
| 8,987 | HealthSouth Corp.* | 258,825 | ||||||
| 9,557 | Hill-Rom Holdings, Inc. | 321,880 | ||||||
| 13,814 | Invacare Corp. | 198,369 | ||||||
| 31,683 | Kindred Healthcare, Inc.* | 415,998 | ||||||
| 7,286 | Magellan Health Services, Inc.* | 408,599 | ||||||
| 16,986 | Masimo Corp. | 360,103 | ||||||
| 3,166 | Meridian Bioscience, Inc. | 68,069 | ||||||
| 18,488 | Molina Healthcare, Inc.* | 687,384 | ||||||
| 13,358 | PharMerica Corp.* | 185,142 | ||||||
|
| |||||||
| 8 | The accompanying notes are an integral part of these financial statements. |
GOLDMAN SACHS VARIABLE INSURANCE TRUST STRUCTURED SMALL CAP EQUITY FUND
| Shares | Description | Value | ||||||
| Common Stocks – (continued) | ||||||||
| Health Care Equipment & Services – (continued) |
| ||||||
| 39,739 | Select Medical Holdings Corp. | $ | 325,860 | |||||
| 22,345 | Skilled Healthcare Group, Inc. Class A* | 149,265 | ||||||
| 3,704 | Triple-S Management Corp. Class B* | 79,525 | ||||||
| 8,175 | Vascular Solutions, Inc.* | 120,254 | ||||||
| 11,314 | Volcano Corp.* | 205,123 | ||||||
| 7,604 | WellCare Health Plans, Inc.* | 422,402 | ||||||
|
| |||||||
| 5,980,788 | ||||||||
|
| |||||||
| Household & Personal Products – 0.8% |
| ||||||
| 22,134 | Central Garden and Pet Co. Class A* | 152,725 | ||||||
| 2,720 | Nu Skin Enterprises, Inc. Class A | 166,246 | ||||||
| 7,863 | USANA Health Sciences, Inc.* | 569,124 | ||||||
|
| |||||||
| 888,095 | ||||||||
|
| |||||||
| Insurance – 1.7% |
| ||||||
| 19,600 | Amtrust Financial Services, Inc.(a) | 699,720 | ||||||
| 6,045 | First American Financial Corp. | 133,232 | ||||||
| 4,129 | Global Indemnity PLC* | 97,238 | ||||||
| 4,624 | Maiden Holdings Ltd. | 51,881 | ||||||
| 524 | StanCorp Financial Group, Inc. | 25,891 | ||||||
| 5,546 | Stewart Information Services Corp. | 145,250 | ||||||
| 45,967 | Symetra Financial Corp. | 735,012 | ||||||
|
| |||||||
| 1,888,224 | ||||||||
|
| |||||||
| Materials – 5.0% |
| ||||||
| 18,629 | A. Schulman, Inc. | 499,630 | ||||||
| 4,380 | Boise, Inc. | 37,405 | ||||||
| 2,685 | Chemtura Corp.* | 54,505 | ||||||
| 13,751 | Coeur Mining, Inc.* | 182,888 | ||||||
| 12,488 | Globe Specialty Metals, Inc. | 135,745 | ||||||
| 5,503 | Graphic Packaging Holding Co.* | 42,593 | ||||||
| 3,972 | Koppers Holdings, Inc. | 151,651 | ||||||
| 28,097 | Kraton Performance Polymers, Inc.* | 595,656 | ||||||
| 14,155 | Materion Corp. | 383,459 | ||||||
| 9,789 | Minerals Technologies, Inc. | 404,677 | ||||||
| 12,567 | OM Group, Inc.* | 388,572 | ||||||
| 5,686 | OMNOVA Solutions, Inc.* | 45,545 | ||||||
| 12,306 | Packaging Corp. of America | 602,502 | ||||||
| 20,594 | Resolute Forest Products, Inc.* | 271,223 | ||||||
| 13,090 | Schnitzer Steel Industries, Inc. Class A | 306,044 | ||||||
| 4,270 | Schweitzer-Mauduit International, Inc. | 212,988 | ||||||
| 48,974 | Senomyx, Inc.* | 106,763 | ||||||
| 12,931 | Stepan Co. | 719,093 | ||||||
| 7,613 | SunCoke Energy, Inc.* | 106,734 | ||||||
| 4,983 | The Valspar Corp. | 322,251 | ||||||
| 1,735 | Worthington Industries, Inc. | 55,017 | ||||||
|
| |||||||
| 5,624,941 | ||||||||
|
| |||||||
| Common Stocks – (continued) | ||||||||
| Media – 1.2% |
| ||||||
| 7,957 | Arbitron, Inc. | $ | 369,603 | |||||
| 8,061 | Entercom Communications Corp. Class A* | 76,096 | ||||||
| 7,679 | Harte-Hanks, Inc. | 66,040 | ||||||
| 25,431 | Journal Communications, Inc. Class A* | 190,478 | ||||||
| 6,827 | LIN TV Corp. Class A* | 104,453 | ||||||
| 8,126 | Live Nation Entertainment, Inc.* | 125,953 | ||||||
| 1,482 | Meredith Corp. | 70,691 | ||||||
| 11,925 | Scholastic Corp. | 349,283 | ||||||
|
| |||||||
| 1,352,597 | ||||||||
|
| |||||||
| Pharmaceuticals, Biotechnology & Life Sciences – 7.7% |
| ||||||
| 3,702 | Acorda Therapeutics, Inc.* | 122,129 | ||||||
| 35,100 | Affymetrix, Inc.* | 155,844 | ||||||
| 7,042 | Arena Pharmaceuticals, Inc.*(a) | 54,224 | ||||||
| 4,749 | Auxilium Pharmaceuticals, Inc.* | 78,976 | ||||||
| 1,638 | BioMarin Pharmaceutical, Inc.* | 91,384 | ||||||
| 14,355 | Cambrex Corp.* | 200,539 | ||||||
| 17,622 | Cepheid, Inc.* | 606,549 | ||||||
| 1,591 | Charles River Laboratories International, Inc.* | 65,279 | ||||||
| 14,815 | Cubist Pharmaceuticals, Inc.* | 715,565 | ||||||
| 22,468 | Curis, Inc.*(a) | 71,673 | ||||||
| 14,888 | Emergent Biosolutions, Inc.* | 214,685 | ||||||
| 21,806 | Genomic Health, Inc.* | 691,468 | ||||||
| 15,855 | Isis Pharmaceuticals, Inc.* | 426,024 | ||||||
| 6,289 | Luminex Corp.* | 129,616 | ||||||
| 21,278 | MannKind Corp.*(a) | 138,307 | ||||||
| 37,989 | Momenta Pharmaceuticals, Inc.* | 572,114 | ||||||
| 16,822 | PAREXEL International Corp.* | 772,803 | ||||||
| 82,833 | PDL BioPharma, Inc.(a) | 639,471 | ||||||
| 20,135 | Questcor Pharmaceuticals, Inc. | 915,337 | ||||||
| 5,588 | Sangamo Biosciences, Inc.* | 43,642 | ||||||
| 22,137 | Santarus, Inc.* | 465,984 | ||||||
| 25,949 | Sciclone Pharmaceuticals, Inc.* | 128,707 | ||||||
| 9,629 | Seattle Genetics, Inc.* | 302,928 | ||||||
| 8,709 | United Therapeutics Corp.* | 573,227 | ||||||
| 24,797 | Warner Chilcott PLC Class A | 492,964 | ||||||
|
| |||||||
| 8,669,439 | ||||||||
|
| |||||||
| Real Estate – 7.0% |
| ||||||
| 7,859 | Acadia Realty Trust (REIT) | 194,039 | ||||||
| 6,401 | Agree Realty Corp. (REIT) | 188,957 | ||||||
| 3,809 | Altisource Residential Corp.* | 63,572 | ||||||
| 9,162 | American Assets Trust, Inc. (REIT) | 282,739 | ||||||
| 1,545 | Aviv REIT, Inc. (REIT) | 39,073 | ||||||
| 8,729 | Corrections Corp. of America (REIT) | 295,651 | ||||||
| 37,814 | Cousins Properties, Inc. (REIT) | 381,921 | ||||||
| 22,685 | DCT Industrial Trust, Inc. (REIT) | 162,198 | ||||||
| 3,849 | DiamondRock Hospitality Co. (REIT) | 35,873 | ||||||
| 5,575 | EastGroup Properties, Inc. (REIT) | 313,705 | ||||||
| 2,179 | Extra Space Storage, Inc. (REIT) | 91,365 | ||||||
|
| |||||||
| The accompanying notes are an integral part of these financial statements. | 9 |
GOLDMAN SACHS VARIABLE INSURANCE TRUST STRUCTURED SMALL CAP EQUITY FUND
Schedule of Investments (continued)
June 30, 2013 (Unaudited)
| Shares | Description | Value | ||||||
| Common Stocks – (continued) | ||||||||
| Real Estate – (continued) |
| ||||||
| 20,890 | Franklin Street Properties Corp. (REIT) | $ | 275,748 | |||||
| 16,513 | Getty Realty Corp. (REIT) | 340,993 | ||||||
| 29,026 | Healthcare Realty Trust, Inc. (REIT) | 740,163 | ||||||
| 3,478 | Highwoods Properties, Inc. (REIT) | 123,852 | ||||||
| 7,161 | Inland Real Estate Corp. (REIT) | 73,185 | ||||||
| 2,515 | Jones Lang LaSalle, Inc. | 229,217 | ||||||
| 517 | National Health Investors, Inc. (REIT) | 30,948 | ||||||
| 5,580 | Pennsylvania Real Estate Investment Trust (REIT) | 105,350 | ||||||
| 18,524 | Potlatch Corp. (REIT) | 749,111 | ||||||
| 664 | PS Business Parks, Inc. (REIT) | 47,921 | ||||||
| 7,364 | Realogy Holdings Corp.* | 353,767 | ||||||
| 7,090 | Regency Centers Corp. (REIT) | 360,243 | ||||||
| 18,638 | Ryman Hospitality Properties (REIT)(a) | 727,068 | ||||||
| 7,051 | Taubman Centers, Inc. (REIT) | 529,883 | ||||||
| 21,629 | The Geo Group, Inc. (REIT) | 734,305 | ||||||
| 11,699 | The St. Joe Co.* | 246,264 | ||||||
| 3,365 | Urstadt Biddle Properties, Inc. Class A (REIT) | 67,872 | ||||||
| 6,926 | Washington Real Estate Investment Trust (REIT) | 186,379 | ||||||
|
| |||||||
| 7,971,362 | ||||||||
|
| |||||||
| Retailing – 3.4% |
| ||||||
| 23,351 | American Eagle Outfitters, Inc. | 426,389 | ||||||
| 10,565 | ANN, Inc.* | 350,758 | ||||||
| 1,689 | Blue Nile, Inc.* | 63,810 | ||||||
| 7,834 | Brown Shoe Co., Inc. | 168,666 | ||||||
| 3,287 | Destination Maternity Corp. | 80,860 | ||||||
| 4,673 | Express, Inc.* | 97,993 | ||||||
| 3,225 | Fred’s, Inc. Class A | 49,955 | ||||||
| 17,987 | GameStop Corp. Class A(a) | 755,994 | ||||||
| 3,812 | Hibbett Sports, Inc.* | 211,566 | ||||||
| 909 | Lithia Motors, Inc. Class A | 48,459 | ||||||
| 4,178 | Lumber Liquidators Holdings, Inc.* | 325,341 | ||||||
| 29,004 | OfficeMax, Inc. | 296,711 | ||||||
| 36,244 | Orbitz Worldwide, Inc.* | 291,039 | ||||||
| 5,630 | Penske Automotive Group, Inc. | 171,940 | ||||||
| 3,682 | Stage Stores, Inc. | 86,527 | ||||||
| 4,655 | The Buckle, Inc. | 242,153 | ||||||
| 3,767 | The Children’s Place Retail Stores, Inc.* | 206,432 | ||||||
| 582 | Vitamin Shoppe, Inc.* | 26,097 | ||||||
|
| |||||||
| 3,900,690 | ||||||||
|
| |||||||
| Semiconductors & Semiconductor Equipment – 4.0% |
| ||||||
| 19,137 | Advanced Energy Industries, Inc.* | 333,175 | ||||||
| 3,036 | Cabot Microelectronics Corp.* | 100,218 | ||||||
| 55,442 | Cypress Semiconductor Corp.* | 594,893 | ||||||
| 7,015 | DSP Group, Inc.* | 58,295 | ||||||
| 12,007 | First Solar, Inc.* | 537,073 | ||||||
| 10,463 | International Rectifier Corp.* | 219,095 | ||||||
|
| |||||||
| Common Stocks – (continued) | ||||||||
| Semiconductors & Semiconductor Equipment – (continued) |
| ||||||
| 28,994 | Micrel, Inc. | $ | 286,461 | |||||
| 3,572 | MKS Instruments, Inc. | 94,801 | ||||||
| 12,198 | OmniVision Technologies, Inc.* | 227,493 | ||||||
| 14,736 | Photronics, Inc.* | 118,772 | ||||||
| 27,640 | PLX Technology, Inc.* | 131,566 | ||||||
| 46,718 | Rambus, Inc.* | 401,308 | ||||||
| 9,655 | RF Micro Devices, Inc.* | 51,654 | ||||||
| 26,081 | Spansion, Inc. Class A* | 326,534 | ||||||
| 9,580 | SunEdison, Inc.* | 78,268 | ||||||
| 36,507 | SunPower Corp.*(a) | 755,695 | ||||||
| 7,557 | Veeco Instruments, Inc.* | 267,669 | ||||||
|
| |||||||
| 4,582,970 | ||||||||
|
| |||||||
| Software & Services – 6.9% |
| ||||||
| 19,752 | Accelrys, Inc.* | 165,917 | ||||||
| 20,407 | Acxiom Corp.* | 462,831 | ||||||
| 938 | AOL, Inc.* | 34,218 | ||||||
| 28,615 | Aspen Technology, Inc.* | 823,826 | ||||||
| 2,221 | Blucora, Inc.* | 41,177 | ||||||
| 3,064 | Cardtronics, Inc.* | 84,566 | ||||||
| 39,913 | Ciber, Inc.* | 133,309 | ||||||
| 3,961 | Convergys Corp. | 69,040 | ||||||
| 22,918 | CoreLogic, Inc.* | 531,010 | ||||||
| 11,209 | CSG Systems International, Inc.* | 243,235 | ||||||
| 18,157 | Digital River, Inc.* | 340,807 | ||||||
| 10,855 | Euronet Worldwide, Inc.* | 345,840 | ||||||
| 3,102 | Forrester Research, Inc. | 113,812 | ||||||
| 10,625 | Global Cash Access Holdings, Inc.* | 66,513 | ||||||
| 3,417 | Heartland Payment Systems, Inc. | 127,283 | ||||||
| 12,225 | Lionbridge Technologies, Inc.* | 35,453 | ||||||
| 3,391 | Manhattan Associates, Inc.* | 261,650 | ||||||
| 12,050 | ManTech International Corp. Class A | 314,746 | ||||||
| 29,241 | Marchex, Inc. Class B | 176,031 | ||||||
| 36,072 | Mentor Graphics Corp. | 705,208 | ||||||
| 3,180 | Monotype Imaging Holdings, Inc. | 80,804 | ||||||
| 6,823 | OpenTable, Inc.* | 436,331 | ||||||
| 2,340 | Pandora Media, Inc.* | 43,056 | ||||||
| 7,763 | QAD, Inc. Class A | 89,119 | ||||||
| 3,116 | RealPage, Inc.* | 57,148 | ||||||
| 4,286 | Take-Two Interactive Software, Inc.* | 64,161 | ||||||
| 8,794 | TeleTech Holdings, Inc.* | 206,043 | ||||||
| 4,485 | Travelzoo, Inc.* | 122,261 | ||||||
| 29,789 | ValueClick, Inc.* | 735,193 | ||||||
| 9,657 | VistaPrint NV*(a) | 476,766 | ||||||
| 15,136 | WebMD Health Corp.* | 444,544 | ||||||
|
| |||||||
| 7,831,898 | ||||||||
|
| |||||||
| Technology Hardware & Equipment – 3.5% |
| ||||||
| 48,347 | ARRIS Group, Inc.* | 693,779 | ||||||
| 8,559 | Aruba Networks, Inc.* | 131,466 | ||||||
| 17,986 | AVX Corp. | 211,335 | ||||||
| 18,055 | Benchmark Electronics, Inc.* | 362,906 | ||||||
| 4,725 | Calix, Inc.* | 47,723 | ||||||
|
| |||||||
| 10 | The accompanying notes are an integral part of these financial statements. |
GOLDMAN SACHS VARIABLE INSURANCE TRUST STRUCTURED SMALL CAP EQUITY FUND
| Shares | Description | Value | ||||||
| Common Stocks – (continued) | ||||||||
| Technology Hardware & Equipment – (continued) |
| ||||||
| 41,270 | Extreme Networks* | $ | 142,382 | |||||
| 1,565 | FEI Co. | 114,229 | ||||||
| 12,043 | Fusion-io, Inc.* | 171,492 | ||||||
| 17,225 | Harmonic, Inc.* | 109,379 | ||||||
| 31,123 | Imation Corp.* | 131,650 | ||||||
| 16,954 | InterDigital, Inc. | 756,996 | ||||||
| 4,552 | Methode Electronics, Inc. | 77,430 | ||||||
| 23,506 | Symmetricom, Inc.* | 105,542 | ||||||
| 10,352 | Synaptics, Inc.* | 399,173 | ||||||
| 3,393 | SYNNEX Corp.* | 143,456 | ||||||
| 49,840 | Tellabs, Inc. | 98,683 | ||||||
| 19,076 | Vishay Intertechnology, Inc.* | 264,966 | ||||||
|
| |||||||
| 3,962,587 | ||||||||
|
| |||||||
| Telecommunication Services – 0.4% |
| ||||||
| 15,011 | Cbeyond, Inc.* | 117,686 | ||||||
| 1,551 | Cogent Communications Group, Inc. | 43,661 | ||||||
| 8,305 | magicJack VocalTec Ltd.*(a) | 117,848 | ||||||
| 11,582 | USA Mobility, Inc. | 157,168 | ||||||
|
| |||||||
| 436,363 | ||||||||
|
| |||||||
| Transportation – 4.5% |
| ||||||
| 14,196 | Alaska Air Group, Inc.* | 738,192 | ||||||
| 7,607 | Allegiant Travel Co. | 806,266 | ||||||
| 9,765 | Celadon Group, Inc. | 178,211 | ||||||
| 1,457 | Con-way, Inc. | 56,765 | ||||||
| 24,604 | Heartland Express, Inc. | 341,257 | ||||||
| 70,802 | JetBlue Airways Corp.* | 446,053 | ||||||
| 22,013 | Knight Transportation, Inc. | 370,259 | ||||||
| 29,138 | Pacer International, Inc.* | 183,861 | ||||||
| 20,752 | Republic Airways Holdings, Inc.* | 235,120 | ||||||
| 11,514 | Saia, Inc.* | 345,074 | ||||||
| 24,874 | SkyWest, Inc. | 336,794 | ||||||
| 16,809 | Swift Transportation Co.* | 278,021 | ||||||
| 6,053 | Universal Truckload Services, Inc.* | 145,938 | ||||||
| 27,475 | Werner Enterprises, Inc. | 664,071 | ||||||
|
| |||||||
| 5,125,882 | ||||||||
|
| |||||||
| Utilities – 1.9% |
| ||||||
| 14,255 | Black Hills Corp. | 694,931 | ||||||
| 14,319 | Genie Energy Ltd. Class B* | 131,019 | ||||||
| 4,972 | Northwest Natural Gas Co. | 211,211 | ||||||
| 11,716 | Portland General Electric Co. | 358,392 | ||||||
| 12,972 | Southwest Gas Corp. | 606,960 | ||||||
| 1,914 | The Empire District Electric Co. | 42,701 | ||||||
| 2,046 | UIL Holdings Corp. | 78,260 | ||||||
|
| |||||||
| 2,123,474 | ||||||||
|
| |||||||
| | TOTAL INVESTMENTS BEFORE SECURITIES LENDING REINVESTMENT VEHICLE | | ||||||
| (Cost $96,529,840) | $ | 109,717,636 | ||||||
|
| |||||||
| Shares | Rate | Value | ||||||
| Securities Lending Reinvestment Vehicle(b)(c) – 5.6% | ||||||||
| Goldman Sachs Financial Square Money Market Fund — | | ||||||
| 6,378,759 | 0.069% | $ | 6,378,759 | |||||
| (Cost $6,378,759) | ||||||||
|
| |||||||
| TOTAL INVESTMENTS – 102.5% | ||||||||
| (Cost $102,908,599) | $ | 116,096,395 | ||||||
|
| |||||||
| LIABILITIES IN EXCESS OF | (2,851,036 | ) | |||||
|
| |||||||
| NET ASSETS – 100.0% | $ | 113,245,359 | ||||||
|
| |||||||
| The percentage shown for each investment category reflects the value of investments in that category as a percentage of net assets. | ||
| * | Non-income producing security. | |
| (a) | All or a portion of security is on loan. | |
| (b) | Variable rate security. Interest rate disclosed is that which is in effect at June 30, 2013. | |
| (c) | Represents an affiliated issuer. | |
| Investment Abbreviation: | ||
| REIT | —Real Estate Investment Trust | |
| The accompanying notes are an integral part of these financial statements. | 11 |
GOLDMAN SACHS VARIABLE INSURANCE TRUST STRUCTURED SMALL CAP EQUITY FUND
Statement of Assets and Liabilities
June 30, 2013 (Unaudited)
| Assets: | ||||
Investments in unaffiliated issuers, at value (cost $96,529,840)(a) | $ | 109,717,636 | ||
Investments in affiliated securities lending reinvestment vehicle, at value which equals cost | 6,378,759 | |||
Cash | 3,151,880 | |||
Receivables: | ||||
Investments sold | 4,159,087 | |||
Dividends | 132,407 | |||
Fund shares sold | 31,355 | |||
Reimbursement from investment adviser | 18,325 | |||
Securities lending income | 14,129 | |||
Other assets | 662 | |||
| Total assets | 123,604,240 | |||
| Liabilities: | ||||
Payables: | ||||
Payable upon return of securities loaned | 6,378,759 | |||
Investments purchased | 3,660,537 | |||
Fund shares redeemed | 178,852 | |||
Amounts owed to affiliates | 72,606 | |||
Accrued expenses | 68,127 | |||
| Total liabilities | 10,358,881 | |||
| Net Assets: | ||||
Paid-in capital | 94,211,174 | |||
Undistributed net investment income | 1,446,701 | |||
Accumulated net realized gain | 4,399,688 | |||
Net unrealized gain | 13,187,796 | |||
| NET ASSETS | $ | 113,245,359 | ||
Net Assets: | ||||
Institutional | $ | 88,910,609 | ||
Service | 24,334,750 | |||
Total Net Assets | $ | 113,245,359 | ||
Shares of beneficial interest outstanding $0.001 par value (unlimited shares authorized): | ||||
Institutional | 6,102,490 | |||
Service | 1,679,277 | |||
Net asset value, offering and redemption price per share: | ||||
Institutional | $14.57 | |||
Service | 14.49 | |||
(a) Includes loaned securities having a market value of $6,219,739.
| 12 | The accompanying notes are an integral part of these financial statements. |
GOLDMAN SACHS VARIABLE INSURANCE TRUST STRUCTURED SMALL CAP EQUITY FUND
Statement of Operations
For the Six Months Ended June 30, 2013 (Unaudited)
| Investment income: | ||||
Dividends | $ | 841,632 | ||
Securities lending income — affiliated issuer | 183,405 | |||
| Total investment income | 1,025,037 | |||
| Expenses: | ||||
Management fees | 419,598 | |||
Custody, accounting and administrative services | 35,909 | |||
Distribution and Service fees — Service Class | 30,143 | |||
Professional fees | 28,822 | |||
Printing and mailing costs | 21,741 | |||
Transfer Agent fees(a) | 11,188 | |||
Trustee fees | 8,870 | |||
Other | 5,496 | |||
| Total expenses | 561,767 | |||
Less — expense reductions | (77,808 | ) | ||
| Net expenses | 483,959 | |||
| NET INVESTMENT INCOME | 541,078 | |||
| Realized and unrealized gain (loss): | ||||
Net realized gain from: | ||||
Investments | 13,343,714 | |||
Futures contracts | 433,602 | |||
Net change in unrealized gain (loss) on: | ||||
Investments | 885,791 | |||
Futures contracts | (40,649 | ) | ||
| Net realized and unrealized gain | 14,622,458 | |||
| NET INCREASE IN NET ASSETS RESULTING FROM OPERATIONS | $ | 15,163,536 | ||
(a) Institutional and Service Shares had Transfer Agent fees of $8,777 and $2,411, respectively.
| The accompanying notes are an integral part of these financial statements. | 13 |
GOLDMAN SACHS VARIABLE INSURANCE TRUST STRUCTURED SMALL CAP EQUITY FUND
Statements of Changes in Net Assets
| For the Six Months Ended June 30, 2013 (Unaudited) | For the Fiscal Year Ended December 31, 2012 | |||||||
| From operations: | ||||||||
Net investment income | $ | 541,078 | $ | 1,680,469 | ||||
Net realized gain (includes payment by affiliate relating to certain investment transactions) | 13,777,316 | 18,963,045 | ||||||
Net change in unrealized gain (loss) | 845,142 | (7,217,052 | ) | |||||
| Net increase in net assets resulting from operations | 15,163,536 | 13,426,462 | ||||||
| Distributions to shareholders: | ||||||||
From net investment income | ||||||||
Institutional Shares | — | (973,309 | ) | |||||
Service Shares | — | (210,796 | ) | |||||
| Total distributions to shareholders | — | (1,184,105 | ) | |||||
| From share transactions: | ||||||||
Proceeds from sales of shares | 5,915,690 | 8,018,264 | ||||||
Reinvestment of distributions | — | 1,184,105 | ||||||
Cost of shares redeemed | (13,468,887 | ) | (26,738,222 | ) | ||||
| Net decrease in net assets resulting from share transactions | (7,553,197 | ) | (17,535,853 | ) | ||||
| TOTAL INCREASE (DECREASE) | 7,610,339 | (5,293,496 | ) | |||||
| Net assets: | ||||||||
Beginning of period | 105,635,020 | 110,928,516 | ||||||
End of period | $ | 113,245,359 | $ | 105,635,020 | ||||
| Undistributed net investment income | $ | 1,446,701 | $ | 905,623 | ||||
| 14 | The accompanying notes are an integral part of these financial statements. |
GOLDMAN SACHS VARIABLE INSURANCE TRUST STRUCTURED SMALL CAP EQUITY FUND
Financial Highlights
Selected Data for a Share Outstanding Throughout Each Period
| Income (loss) from investment operations | Distributions to shareholders | |||||||||||||||||||||||||||||||||||||||||||||||||||||||
| Year - Share Class | Net asset value, beginning of period | Net investment income | Net realized and unrealized gain (loss) | Total from investment operations | From net investment income | From net realized gains | Total distributions | Net asset value, end of period | Total return(a) | Net assets, end of period (in 000s) | Ratio of net expenses to average net assets | Ratio of total expenses to average net assets | Ratio of net investment income to average net assets | Portfolio turnover rate(b) | ||||||||||||||||||||||||||||||||||||||||||
FOR THE SIX MONTHS ENDED JUNE 30, (UNAUDITED) | ||||||||||||||||||||||||||||||||||||||||||||||||||||||||
2013 - Institutional | $ | 12.71 | $ | 0.07 | (c)(d) | $ | 1.79 | $ | 1.86 | $ | — | $ | — | $ | — | $ | 14.57 | 14.63 | % | $ | 88,911 | 0.81 | %(e) | 0.95 | %(e) | 1.02 | %(d)(e) | 82 | % | |||||||||||||||||||||||||||
2013 - Service | 12.65 | 0.05 | (c)(d) | 1.79 | 1.84 | — | — | — | 14.49 | 14.55 | 24,335 | 1.06 | (e) | 1.20 | (e) | 0.77 | (d)(e) | 82 | ||||||||||||||||||||||||||||||||||||||
FOR THE FISCAL YEARS ENDED DECEMBER 31, | ||||||||||||||||||||||||||||||||||||||||||||||||||||||||
2012 - Institutional | 11.40 | 0.19 | (c)(f) | 1.27 | (g) | 1.46 | (0.15 | ) | — | (0.15 | ) | 12.71 | 12.79 | (g) | 82,961 | 0.81 | 0.97 | 1.55 | (f) | 95 | ||||||||||||||||||||||||||||||||||||
2012 - Service | 11.35 | 0.17 | (c)(f) | 1.25 | (g) | 1.42 | (0.12 | ) | — | (0.12 | ) | 12.65 | 12.47 | (g) | 22,674 | 1.06 | 1.22 | 1.34 | (f) | 95 | ||||||||||||||||||||||||||||||||||||
2011 - Institutional | 11.42 | 0.06 | (c)(h) | 0.02 | (i) | 0.08 | (0.10 | ) | — | (0.10 | ) | 11.40 | 0.67 | 87,956 | 0.83 | 0.99 | 0.55 | (h) | 33 | |||||||||||||||||||||||||||||||||||||
2011 - Service | 11.37 | 0.03 | (c)(h) | 0.02 | (i) | 0.05 | (0.07 | ) | — | (0.07 | ) | 11.35 | 0.41 | 22,973 | 1.08 | 1.24 | 0.30 | (h) | 33 | |||||||||||||||||||||||||||||||||||||
2010 - Institutional | 8.82 | 0.08 | (c)(j) | 2.58 | 2.66 | (0.06 | ) | — | (0.06 | ) | 11.42 | 30.12 | 106,646 | 0.85 | 0.97 | 0.82 | (j) | 63 | ||||||||||||||||||||||||||||||||||||||
2010 - Service | 8.78 | 0.06 | (c)(j) | 2.56 | 2.62 | (0.03 | ) | — | (0.03 | ) | 11.37 | 29.86 | 27,428 | 1.10 | 1.22 | 0.58 | (j) | 63 | ||||||||||||||||||||||||||||||||||||||
2009 - Institutional | 6.98 | 0.08 | (c)(k) | 1.85 | 1.93 | (0.09 | ) | — | (0.09 | ) | 8.82 | 27.67 | 95,334 | 0.86 | 1.02 | 1.03 | (k) | 212 | ||||||||||||||||||||||||||||||||||||||
2009 - Service | 6.96 | 0.07 | (c)(k) | 1.83 | 1.90 | (0.08 | ) | — | (0.08 | ) | 8.78 | 27.26 | 23,291 | 1.11 | 1.27 | 0.83 | (k) | 212 | ||||||||||||||||||||||||||||||||||||||
2008 - Institutional | 10.71 | 0.09 | (l) | (3.74 | ) | (3.65 | ) | (0.06 | ) | (0.02 | ) | (0.08 | ) | 6.98 | (33.95 | ) | 86,253 | 0.86 | 1.06 | 0.85 | (l) | 189 | ||||||||||||||||||||||||||||||||||
2008 - Service | 10.71 | 0.06 | (l) | (3.73 | ) | (3.67 | ) | (0.06 | ) | (0.02 | ) | (0.08 | ) | 6.96 | (34.16 | ) | 6,464 | 1.11 | 1.31 | 1.92 | (l) | 189 | ||||||||||||||||||||||||||||||||||
| (a) | Assumes investment at the net asset value at the beginning of the period, reinvestment of all distributions, and a complete redemption of the investment at the net asset value at the end of the period. Total returns for periods less than one full year are not annualized. |
| (b) | The Fund’s portfolio turnover rate is calculated in accordance with regulatory requirements, without regard to transactions involving short term investments and certain derivatives. If such transactions were included, the Fund’s portfolio turnover rate may be higher. |
| (c) | Calculated based on the average shares outstanding methodology. |
| (d) | Reflects income recognized from special dividends which amounted to $0.02 per share and 0.27% of average net assets. |
| (e) | Annualized. |
| (f) | Reflects income recognized from special dividends which amounted to $0.08 per share and 0.62% of average net assets. |
| (g) | Reflects payment from affiliate relating to certain investment transactions which amounted to $0.04 per share. Excluding such payment, the total return would have been 12.44% and 12.12%, respectively. |
| (h) | Reflects income recognized from special dividends which amounted to $0.02 per share and 0.21% of average net assets. |
| (i) | Reflects an increase of $0.02 due to payments received for class action settlements received this year. |
| (j) | Reflects income recognized from special dividends which amounted to $0.04 per share and 0.43% of average net assets. |
| (k) | Reflects income recognized from special dividends which amounted to $0.03 per share and 0.43% of average net assets. |
| (l) | Reflects income recognized from special dividends which amounted to $0.01 per share and 0.14% of average net assets. |
| The accompanying notes are an integral part of these financial statements. | 15 |
GOLDMAN SACHS VARIABLE INSURANCE TRUST STRUCTURED SMALL CAP EQUITY FUND
Notes to Financial Statements
June 30, 2013 (Unaudited)
1. ORGANIZATION
Goldman Sachs Variable Insurance Trust (the “Trust” or “VIT”) is a Delaware statutory trust registered under the Investment Company Act of 1940, as amended (the “Act”), as an open-end management investment company. The Trust includes the Goldman Sachs Structured Small Cap Equity Fund (the “Fund”). The Fund is a diversified portfolio under the Act offering two classes of shares — Institutional and Service Shares. Shares of the Trust are offered to separate accounts of participating life insurance companies for the purpose of funding variable annuity contracts and variable life insurance policies.
Goldman Sachs Asset Management, L.P. (“GSAM”), an affiliate of Goldman, Sachs & Co. (“Goldman Sachs”), serves as investment adviser to the Fund pursuant to a management agreement (the “Agreement”) with the Trust.
2. SIGNIFICANT ACCOUNTING POLICIES
The financial statements have been prepared in accordance with accounting principles generally accepted in the United States of America (“GAAP”) and require management to make estimates and assumptions that may affect the reported amounts and disclosures. Actual results may differ from those estimates and assumptions.
A. Investment Valuation — The Fund’s valuation policy is to value investments at fair value.
B. Investment Income and Investments — Investment income includes interest income and dividend income, net of any foreign withholding taxes, less any amounts reclaimable. Interest income is accrued daily and adjusted for amortization of premiums and accretion of discounts. Dividend income is recognized on ex-dividend date or, for certain foreign securities, as soon as such information is obtained subsequent to the ex-dividend date. Investment transactions are reflected on trade date. Realized gains and losses are calculated using identified cost. Investment transactions are recorded on the following business day for daily net asset value (“NAV”) calculations. Any foreign capital gains tax is accrued daily based upon net unrealized gains, and is payable upon sale of such investments. Distributions received from the Fund’s investments in United States (“U.S.”) real estate investment trusts (“REITs”) may be characterized as ordinary income, net capital gain or a return of capital. A return of capital is recorded by the Fund as a reduction to the cost basis of the REIT.
For derivative contracts, realized gains and losses are recorded upon settlement of the contract.
C. Class Allocations and Expenses — Investment income, realized and unrealized gain (loss), and non-class specific expenses of the Fund are allocated daily based upon the proportion of net assets of each class. Class specific expenses, where applicable, are borne by the respective share classes and include Distribution and Service and Transfer Agent fees. Non-class specific expenses directly incurred by the Fund are charged to that Fund, while such expenses incurred by the Trust are allocated across the respective Funds on a straight-line and/or pro-rata basis depending upon the nature of the expenses.
D. Federal Taxes and Distributions to Shareholders — It is the Fund’s policy to comply with the requirements of the Internal Revenue Code of 1986, as amended (the “Code”), applicable to regulated investment companies (mutual funds) and to distribute each year substantially all of its investment company taxable income and capital gains to its shareholders. Accordingly, the Fund is not required to make any provisions for the payment of federal income tax. Distributions to shareholders are recorded on the ex-dividend date. Income and capital gains distributions, if any, are declared and paid annually.
Net capital losses are carried forward to future fiscal years and may be used to the extent allowed by the Code to offset any future capital gains. Utilization of capital loss carryforwards will reduce the requirement of future capital gains distributions.
Under the Regulated Investment Company Modernization Act of 2010, the Fund is permitted to carry forward capital losses incurred in taxable years beginning after December 22, 2010 for an unlimited period. However, any losses incurred during those future taxable years will be required to be utilized prior to the losses incurred in pre-enactment taxable years. As a result of this ordering rule, pre-enactment capital loss carryforwards may be more likely to expire unused. Additionally, post-enactment capital losses that are carried forward will retain their character as either short-term or long-term capital losses rather than being considered all short-term as under previous law.
16
GOLDMAN SACHS VARIABLE INSURANCE TRUST STRUCTURED SMALL CAP EQUITY FUND
2. SIGNIFICANT ACCOUNTING POLICIES (continued)
The characterization of distributions to shareholders for financial reporting purposes is determined in accordance with federal income tax rules, which may differ from GAAP. The source of the Fund’s distributions may be shown in the accompanying financial statements as either from net investment income, net realized gain or capital. Certain components of the Fund’s net assets on the Statement of Assets and Liabilities reflect permanent GAAP/tax differences based on the appropriate tax character.
3. INVESTMENTS AND FAIR VALUE MEASUREMENTS
The fair value of a financial instrument is the amount that would be received to sell an asset or paid to transfer a liability in an orderly transaction between market participants at the measurement date (i.e., the exit price). GAAP establishes a fair value hierarchy that prioritizes the inputs to valuation techniques used to measure fair value. The hierarchy gives the highest priority to unadjusted quoted prices in active markets for identical assets or liabilities (Level 1 measurements) and the lowest priority to unobservable inputs (Level 3 measurements). The levels used for classifying investments are not necessarily an indication of the risk associated with investing in these investments. The three levels of the fair value hierarchy are described below:
Level 1 — Unadjusted quoted prices in active markets that are accessible at the measurement date for identical, unrestricted assets or liabilities;
Level 2 — Quoted prices in markets that are not active or financial instruments for which significant inputs are observable (including, but not limited to, quoted prices for similar investments, interest rates, foreign exchange rates, volatility and credit spreads), either directly or indirectly;
Level 3 — Prices or valuations that require significant unobservable inputs (including GSAM’s assumptions in determining fair value measurement).
The Trustees have adopted Valuation Procedures that govern the valuation of the portfolio investments held by the Fund, including investments for which market quotations are not readily available. The Trustees have delegated to GSAM day-to-day responsibility for implementing and maintaining internal controls and procedures related to the valuation of the Fund’s portfolio investments. To assess the continuing appropriateness of pricing sources and methodologies, GSAM regularly performs price verification procedures and issues challenges as necessary to third party pricing vendors or brokers, and any differences are reviewed in accordance with the Valuation Procedures.
A. Level 1 and Level 2 Fair Value Investments — The valuation techniques and significant inputs used in determining the fair values for investments classified as Level 1 and Level 2 are as follows:
Equity Securities — Equity securities and investment companies traded on a U.S. securities exchange or the NASDAQ system, or those located on certain foreign exchanges, including but not limited to the Americas, are valued daily at their last sale price or official closing price on the principal exchange or system on which they are traded. If no sale occurs, equity securities and exchange traded investment companies are valued at the last bid price for long positions and at the last ask price for short positions. Investments in investment companies (other than those that are exchange traded) are valued at the NAV on the valuation date. To the extent these investments are actively traded, they are classified as Level 1 of the fair value hierarchy.
Unlisted equity securities for which market quotations are available are valued at the last sale price on the valuation date, or if no sale occurs, at the last bid price. Securities traded on certain foreign securities exchanges are valued daily at fair value determined by an independent fair value service (if available) under Valuation Procedures approved by the Trustees and consistent with applicable regulatory guidance. The independent fair value service takes into account multiple factors including, but not limited to, movements in the securities markets, certain depositary receipts, futures contracts and foreign currency exchange rates
17
GOLDMAN SACHS VARIABLE INSURANCE TRUST STRUCTURED SMALL CAP EQUITY FUND
Notes to Financial Statements (continued)
June 30, 2013 (Unaudited)
3. INVESTMENTS AND FAIR VALUE MEASUREMENTS (continued)
that have occurred subsequent to the close of the foreign securities exchange. These investments are generally classified as Level 2 of the fair value hierarchy.
Debt Securities — Debt securities for which market quotations are readily available are valued daily on the basis of quotations supplied by dealers or an independent pricing service approved by the Trustees. The pricing services may use valuation models or matrix pricing, which consider: (i) yield or price with respect to bonds that are considered comparable in characteristics such as rating, interest rate and maturity date or (ii) quotations from securities dealers to determine current value. Short-term debt obligations that mature in sixty days or less and that do not exhibit signs of credit deterioration are valued at amortized cost, which approximates fair value. With the exception of treasury securities, which are generally classified as Level 1, these investments are generally classified as Level 2 of the fair value hierarchy.
Derivative contracts — A derivative is an instrument whose value is derived from underlying assets, indices, reference rates or a combination of these factors.
Exchange-traded derivatives, including futures contracts, typically fall within Level 1 of the fair value hierarchy. Over-the-counter (“OTC”) derivatives are valued using market transactions and other market evidence, including market-based inputs to models, calibration to market-clearing transactions, broker or dealer quotations, or other alternative pricing sources. Where models are used, the selection of a particular model to value an OTC derivative depends upon the contractual terms of, and specific risks inherent in, the instrument, as well as the availability of pricing information in the market. Valuation models require a variety of inputs, including contractual terms, market prices, yield curves, credit curves, measures of volatility, voluntary and involuntary prepayment rates, loss severity rates and correlations of such inputs. For OTC derivatives that trade in liquid markets, model inputs can generally be verified and model selection does not involve significant management judgment. OTC derivatives are classified within Level 2 of the fair value hierarchy when significant inputs are corroborated by market evidence.
i. Futures Contracts — Futures contracts are contracts to buy or sell a standardized quantity of a specified commodity or security and are valued based on exchanged settlement prices or independent market quotes. Futures contracts are valued at the last settlement price, or in the absence of a sale, the last bid price for long positions and at the last ask price for short positions, at the end of each day on the board of trade or exchange upon which they are traded. Upon entering into a futures contract, the Fund deposits cash or securities in an account on behalf of the broker in an amount sufficient to meet the initial margin requirement. Subsequent payments are made or received by the Fund equal to the daily change in the contract value and are recorded as variation margin receivable or payable with a corresponding offset to unrealized gains or losses.
B. Level 3 Fair Value Investments — To the extent that the aforementioned significant inputs are unobservable, or if quotations are not readily available, or if GSAM believes that such quotations do not accurately reflect fair value, the fair value of the Fund’s investments may be determined under Valuation Procedures approved by the Trustees. GSAM, consistent with its procedures and applicable regulatory guidance, may make an adjustment to the most recent valuation prices of either domestic or foreign securities in light of significant events to reflect what it believes to be the fair value of the securities at the time of determining a Fund’s NAV. Significant events which could affect a large number of securities in a particular market may include, but are not limited to: significant fluctuations in U.S. or foreign markets; market dislocations; market disruptions; or unscheduled market closings. Significant events which could also affect a single issuer may include, but are not limited to: corporate actions such as reorganizations, mergers and buy-outs; ratings downgrades; and bankruptcies.
18
GOLDMAN SACHS VARIABLE INSURANCE TRUST STRUCTURED SMALL CAP EQUITY FUND
3. INVESTMENTS AND FAIR VALUE MEASUREMENTS (continued)
C. Fair Value Hierarchy — The following is a summary of the Fund’s investments and derivatives classified in the fair value hierarchy as of June 30, 2013:
| Investment Type | Level 1 | Level 2 | Level 3 | |||||||||
| Assets | ||||||||||||
| Common Stock and/or Other Equity Investments | $ | 109,717,636 | $ | — | $ | — | ||||||
| Securities Lending Reinvestment Vehicle | 6,378,759 | — | — | |||||||||
| Total | $ | 116,096,395 | $ | — | $ | — | ||||||
For further information regarding security characteristics, see the Schedule of Investments.
4. INVESTMENTS IN DERIVATIVES
The following table sets forth, by certain risk types, the Fund’s gains (losses) related to these derivatives and their indicative volumes for the six months ended June 30, 2013. These instruments were used to meet the Fund’s investment objectives and to obtain and/or manage exposure related to the risks below. These gains (losses) should be considered in the context that these derivative contracts may have been executed to economically hedge certain investments, and accordingly, certain gains (losses) on such derivative contracts may offset certain (losses) gains attributable to investments. These gains (losses) are included in “Net realized gain (loss)” or “Net change in unrealized gain (loss)” on the Statement of Operations:
| Risk | Statement of Operations | Net Realized | Net Change in Unrealized Gain (Loss) | Average Number of Contracts(a) | ||||||||||
| Equity | Net realized gain (loss) from futures contracts/Net change in unrealized gain (loss) on futures contracts | $ | 433,602 | $ | (40,649 | ) | 17 | |||||||
| (a) | Average number of contracts is based on the average of month end balances for the six months ended June 30, 2013. |
5. AGREEMENTS AND AFFILIATED TRANSACTIONS
A. Management Agreement — Under the Agreement, GSAM manages the Fund, subject to the general supervision of the Trustees.
As compensation for the services rendered pursuant to the Agreement, the assumption of the expenses related thereto and administration of the Fund’s business affairs, including providing facilities, GSAM is entitled to a management fee, accrued daily and paid monthly, equal to an annual percentage rate of the Fund’s average daily net assets.
For the six months ended June 30, 2013, contractual and effective net management fees with GSAM were at the following rates:
| Contractual Management Fee Rate | ||||||||||||||||||||||
| First $2 billion | Next $3 billion | Next $3 billion | Over $8 billion | Effective Rate | Effective Net Management Fee Rate | |||||||||||||||||
| 0.75% | 0.68 | % | 0.65 | % | 0.64 | % | 0.75 | % | 0.70 | %* | ||||||||||||
| * | GSAM has agreed to waive a portion of its management fee in order to achieve a net management rate, as defined in the Fund’s most recent prospectus. This waiver will be effective through at least April 30, 2014, and prior to such date GSAM may not terminate the arrangement without approval of the Trustees. The Effective Net Management Rate above is calculated based on management rates before and after the waivers had been adjusted, if applicable. For the six months ended June 30, 2013, GSAM waived $27,974 of its management fee. |
19
GOLDMAN SACHS VARIABLE INSURANCE TRUST STRUCTURED SMALL CAP EQUITY FUND
Notes to Financial Statements (continued)
June 30, 2013 (Unaudited)
5. AGREEMENTS AND AFFILIATED TRANSACTIONS (continued)
B. Distribution and Service Plan — The Trust, on behalf of the Service Shares of the Fund, has adopted a Distribution and Service Plan (the “Plan”). Under the Plan, Goldman Sachs, which serves as distributor (the “Distributor”), is entitled to a fee accrued daily and paid monthly, for distribution services and personal and account maintenance services, which may then be paid by Goldman Sachs to authorized dealers, equal to, on an annual basis, 0.25% of the Fund’s average daily net assets attributable to Service Shares.
C. Transfer Agency Agreement — Goldman Sachs also serves as the transfer agent of the Fund for a fee pursuant to Transfer Agency Agreement. The fees charged for such transfer agency services are accrued daily and paid monthly at an annual rate of 0.02% of the average daily net assets of Institutional and Service Shares.
D. Other Expense Agreements and Affiliated Transactions — GSAM has agreed to limit certain “Other Expense” of the Fund (excluding transfer agent fees and expenses, taxes, interest, brokerage fees, litigation, indemnification, shareholder meeting and other extraordinary expenses) to the extent such expenses exceed, on an annual basis, a percentage rate of the average daily net assets of the Fund. Such Other Expense reimbursements, if any, are accrued daily and paid monthly. In addition, the Fund is not obligated to reimburse GSAM for prior fiscal year expense reimbursements, if any. The Other Expense limitation as an annual percentage rate of average daily net assets for the Fund is 0.094%. This Other Expense limitation will remain in place through at least April 30, 2014, and prior to such date GSAM may not terminate the arrangement without the approval of the Trustees. For the six months ended June 30, 2013, GSAM reimbursed $48,210 to the Fund. In addition, the Fund has entered into certain offset arrangements with the custodian and the transfer agent, which may result in a reduction of the Fund’s expenses and are received irrespective of the application of the “Other Expense” limitation described above. For the six months ended June 30, 2013, custody fee credits were $1,624.
As of June 30, 2013, the amounts owed to affiliates of the Funds were $65,675, $5,055, and $1,876 for management, distribution and service, and transfer agent fees, respectively.
E. Line of Credit Facility — As of June 30, 2013, the Fund participated in a $780,000,000 committed, unsecured revolving line of credit facility (the “facility”) together with other funds of the Trust and registered investment companies having management agreements with GSAM or its affiliates (“Other Borrowers”). Pursuant to the terms of the facility, the Fund and Other Borrowers could increase the credit amount by an additional $220,000,000, for a total of up to $1,000,000,000. This facility is to be used solely for temporary or emergency purposes, which may include the funding of redemptions. The interest rate on borrowings is based on the federal funds rate. The facility also requires a fee to be paid by the Fund based on the amount of the commitment that has not been utilized. For the six months ended June 30, 2013, the Fund did not have any borrowings under the facility. Prior to May 8, 2013, the committed amount available through the facility was $630,000,000.
F. Other Transactions with Affiliates — For the six months ended June 30, 2013, Goldman Sachs earned $208 in brokerage commissions from portfolio transactions, including futures transactions executed with Goldman Sachs as the Futures Commission Merchant, on behalf of the Fund.
On October 1, 2012, GSAM reimbursed the Fund in the amount of $334,715 to rectify a data issue in its portfolio management decision making process.
6. PORTFOLIO SECURITIES TRANSACTIONS
The cost of purchases and proceeds from sales and maturities of long-term securities for the six months ended June 30, 2013, were $89,520,493 and $96,200,417, respectively.
20
GOLDMAN SACHS VARIABLE INSURANCE TRUST STRUCTURED SMALL CAP EQUITY FUND
7. SECURITIES LENDING
Pursuant to exemptive relief granted by the Securities and Exchange Commission (“SEC”) and the terms and conditions contained therein, the Fund may lend its securities through a securities lending agent, Goldman Sachs Agency Lending (“GSAL”), a wholly-owned subsidiary of Goldman Sachs, to certain qualified borrowers including Goldman Sachs and affiliates. In accordance with the Fund’s securities lending procedures, the Fund receives cash collateral at least equal to the market value of the securities on loan. The market value of the loaned securities is determined at the close of business of the Fund, at their last sale price or official closing price on the principal exchange or system on which they are traded, and any additional required collateral is delivered to the Fund on the next business day. As with other extensions of credit, the Fund may experience a delay in the recovery of its securities or incur a loss should the borrower of the securities breach its agreement with the Fund or become insolvent at a time when the collateral is insufficient to cover the cost of repurchasing securities on loan. Dividend income received from securities on loan may not be subject to withholding taxes and therefore withholding taxes paid may differ from the amounts listed in the Statement of Operations.
The Fund invests the cash collateral received in connection with securities lending transactions in the Goldman Sachs Financial Square Money Market Fund (“Money Market Fund”), a separate series of the Trust. The Money Market Fund, deemed an affiliate of the Trust, is registered under the Act as an open end investment company, is subject to Rule 2a-7 under the Act, and is managed by GSAM, for which GSAM may receive an investment advisory fee of up to 0.205% on an annualized basis of the average daily net assets of the Money Market Fund.
In December 2011, the Financial Accounting Standards Board (“FASB”) issued an Accounting Standards Update (“ASU”) No. 2011-11: Disclosures about Offsetting Assets and Liabilities (“netting”) on the Statement of Assets and Liabilities that are subject to master netting arrangements or similar agreements. ASU 2011-11 was amended by ASU No. 2013-01, clarifying which investments and transactions are subject to the netting disclosure. The scope of the disclosure requirements is limited to derivative instruments, repurchase agreements and reverse repurchase agreements, and securities borrowing and securities lending transactions. This information is intended to enable users of the Fund’s financial statements to evaluate the effect or potential effect of netting arrangements on the Fund’s financial position. The ASU is effective for financial statements with fiscal years beginning on or after January 1, 2013, and interim periods within those fiscal years. The Fund adopted the disclosure requirement on netting for the current reporting period. Since these amended principles require additional disclosures concerning offsetting and related arrangements, adoption did not affect the Fund’s financial condition or result of operations.
For financial reporting purposes, the Fund does not offset financial assets and financial liabilities that are subject to master netting arrangements or similar agreements on the Statement of Assets and Liabilities.
In the event of a default by a borrower with respect to any loan, GSAL will exercise any and all remedies provided under the applicable borrower agreement to make the Fund whole. These remedies include purchasing replacement securities by applying the collateral held from the defaulting broker against the purchase cost of the replacement securities. If, despite such efforts by GSAL to exercise these remedies, the Fund sustains losses as a result of a borrower’s default, GSAL indemnifies the Fund by purchasing replacement securities at its expense, or paying the Fund an amount equal to the market value of the replacement securities, subject to an exclusion for any shortfalls resulting from a loss of value in the cash collateral pool due to reinvestment risk and a requirement that the Fund agrees to assign rights to the collateral to GSAL for purpose of using the collateral to cover purchase of replacement securities as more fully described in the Securities Lending Agency Agreement.
At June 30, 2013, the Fund’s loaned securities were all subject to enforceable Securities Lending Agreements. Securities lending transactions on a net basis were as follows:
| Securities Lending Transactions | ||||
| Total gross amount presented in Statement of Assets and Liabilities | $ | 6,219,739 | ||
| Cash Collateral offsetting | (6,217,999 | ) | ||
| Net Amount(1)(2) | $ | 1,740 | ||
| (1) | Under-collateralized amount related to one borrower at June 30, 2013. Per standard market practice, the additional required collateral was delivered to the Fund on the next business day. |
| (2) | Net amount represents the net amount due from the borrower or GSAL in the event of a default based on the contractual set-off rights under the agreement. |
21
GOLDMAN SACHS VARIABLE INSURANCE TRUST STRUCTURED SMALL CAP EQUITY FUND
Notes to Financial Statements (continued)
June 30, 2013 (Unaudited)
7. SECURITIES LENDING (continued)
Both the Fund and GSAL received compensation relating to the lending of the Fund’s securities. The amount earned by the Fund for the six months ended June 30, 2013, is reported under Investment Income on the Statement of Operations. A portion of this amount, $50,988, represents compensation earned by the Fund from lending its securities to Goldman Sachs. For the six months ended June 30, 2013, GSAL earned $20,468 in fees as securities lending agent.
The following table provides information about the Fund’s investment in the Money Market Fund for the six months ended June 30, 2013:
Number of Shares Held Beginning of Period | Shares Bought | Shares Sold | Number of Shares Held | Value at End of Period | ||||||||||||||
| 6,912,300 | 31,651,384 | (32,184,925 | ) | 6,378,759 | $ | 6,378,759 | ||||||||||||
8. TAX INFORMATION
As of the Fund’s most recent fiscal year end, December 31, 2012, the Fund’s capital loss carryforwards and certain timing differences, on a tax-basis were as follows:
| Capital loss carryforwards:(1) | ||||
Expiring 2017 | $ | (7,962,084 | ) | |
| Timing differences (Post October Loss Deferrals and other timing differences relating to REITs and other investments) | $ | (1,006,470 | ) |
| (1) | Expiration occurs on December 31 of the year indicated. |
As of June 30, 2013, the Fund’s aggregate security unrealized gains and losses based on cost for U.S. federal income tax purposes were as follows:
| Tax cost | $ | 103,149,242 | ||
| Gross unrealized gain | 16,863,051 | |||
| Gross unrealized loss | (3,915,898 | ) | ||
| Net unrealized security gain | $ | 12,947,153 |
The difference between GAAP-basis and tax-basis unrealized gains (losses), as of the most recent fiscal year end, is attributable primarily to wash sales, net mark to market gains (losses) on regulated futures contracts and, differences in the tax treatment of underlying fund investments.
GSAM has reviewed the Fund’s tax positions for all open tax years (the current and prior three years, as applicable) and has concluded that no provision for income tax is required in the Fund’s financial statements. Such open tax years remain subject to examination and adjustment by tax authorities.
9. OTHER RISKS
The Fund’s risks include, but are not limited to, the following:
Shareholder Concentration Risk — Certain funds, accounts, individuals, or Goldman Sachs affiliates may from time to time own (beneficially or of record) or control a significant percentage of the Fund’s shares. Redemptions by these entities of their holdings in the Fund may impact the Fund’s liquidity and NAV. These redemptions may also force the Fund to sell securities.
22
GOLDMAN SACHS VARIABLE INSURANCE TRUST STRUCTURED SMALL CAP EQUITY FUND
9. OTHER RISKS (continued)
Liquidity Risk — The Fund may make investments that are illiquid or that may become less liquid in response to market developments or adverse investor perceptions. Illiquid investments may be more difficult to value. Liquidity risk may also refer to the risk that a Fund will not be able to pay redemption proceeds within the allowable time period because of unusual market conditions, an unusually high volume of redemption requests, or other reasons. To meet redemption requests, the Fund may be forced to sell investments at an unfavorable time and/or under unfavorable conditions.
Market and Credit Risks — In the normal course of business, the Fund trades financial instruments and enters into financial transactions where risk of potential loss exists due to changes in the market (market risk). Additionally, the Fund may also be exposed to credit risk in the event that an issuer fails to perform or that an institution or entity with which the Fund has unsettled or open transactions defaults.
10. INDEMNIFICATIONS
Under the Trust’s organizational documents, its Trustees, officers, employees and agents are indemnified, to the extent permitted by the Act and state law, against certain liabilities that may arise out of performance of their duties to the Fund. Additionally, in the course of business, the Fund enters into contracts that contain a variety of indemnification clauses. The Fund’s maximum exposure under these arrangements is unknown, as this would involve future claims that may be made against the Fund that have not yet occurred. However, GSAM believes the risk of loss under these arrangements to be remote.
11. SUBSEQUENT EVENTS
Subsequent events after the Statement of Assets and Liabilities date have been evaluated through the date the financial statements were issued. GSAM has concluded that there is no impact requiring adjustment or disclosure in the financial statements.
12. SUMMARY OF SHARE TRANSACTIONS
Share activity is as follows:
| For the Six Months Ended June 30, 2013 (Unaudited) | For the Fiscal Year Ended December 31, 2012 | |||||||||||||||
| Shares | Dollars | Shares | Dollars | |||||||||||||
| Institutional Shares | ||||||||||||||||
| Shares sold | 409,796 | $ | 5,773,195 | 620,226 | $ | 7,785,373 | ||||||||||
| Reinvestment of distributions | — | — | 77,554 | 973,309 | ||||||||||||
| Shares redeemed | (836,613 | ) | (11,740,808 | ) | (1,884,899 | ) | (23,416,189 | ) | ||||||||
| (426,817 | ) | (5,967,613 | ) | (1,187,119 | ) | (14,657,507 | ) | |||||||||
| Service Shares | ||||||||||||||||
| Shares sold | 10,446 | 142,495 | 18,946 | 232,891 | ||||||||||||
| Reinvestment of distributions | — | — | 16,864 | 210,796 | ||||||||||||
| Shares redeemed | (123,069 | ) | (1,728,079 | ) | (267,680 | ) | (3,322,033 | ) | ||||||||
| (112,623 | ) | (1,585,584 | ) | (231,870 | ) | (2,878,346 | ) | |||||||||
| NET DECREASE | (539,440 | ) | $ | (7,553,197 | ) | (1,418,989 | ) | $ | (17,535,853 | ) | ||||||
23
GOLDMAN SACHS VARIABLE INSURANCE TRUST STRUCTURED SMALL CAP EQUITY FUND
| Fund Expenses — Six Month Period Ended June 30, 2013 (Unaudited) |
As a shareholder of Institutional or Service Shares of the Fund, you incur ongoing costs, including management fees, distribution and service (12b-1) fees (with respect to Service Shares) and other Fund expenses. This example is intended to help you understand your ongoing costs (in dollars) of investing in the Institutional Shares and Service Shares of the Fund and to compare these costs with the ongoing costs of investing in other mutual funds.
The example is based on an investment of $1,000 invested at the beginning of the period and held for the entire period from January 1, 2013 through June 30, 2013.
Actual Expenses — The first line under each share class in the table below provides information about actual account values and actual expenses. You may use the information in this line, together with the amount you invested, to estimate the expenses that you paid over the period. Simply divide your account value by $1,000 (for example, an $8,600 account value divided by $1,000=8.6), then multiply the result by the number in the first line under the heading entitled “Expenses Paid” to estimate the expenses you paid on your account during this period.
Hypothetical Example for Comparison Purposes — The second line under each share class in the table below provides information about hypothetical account values and hypothetical expenses based on the Fund's actual net expense ratio and an assumed rate of return of 5% per year before expenses, which is not the Fund's actual return. The hypothetical account values and expenses may not be used to estimate the actual ending account balance or expenses you paid for the period. You may use this information to compare the ongoing costs of investing in the Fund and other funds. To do so, compare this 5% hypothetical example with the 5% hypothetical examples that appear in the shareholder reports of the other funds.
Please note that the expenses shown in the table are meant to highlight your ongoing costs only. As a shareholder of the Fund you do not incur any transaction costs, such as sales charges, redemption fees, or exchange fees, but shareholders of other funds may incur such costs. The second line of the table is useful in comparing ongoing costs only, and will not help you determine the relative total costs of owning different funds whose shareholders may incur transaction costs.
| Share Class | Beginning Account Value 1/01/13 | Ending Account Value 6/30/13 | Expenses Paid for the 6 Months Ended 6/30/13* | |||||||||
| Institutional | ||||||||||||
| Actual | $ | 1,000 | $ | 1,146.30 | $ | 4.31 | ||||||
| Hypothetical 5% return | 1,000 | 1,020.78 | + | 4.06 | ||||||||
| Service | ||||||||||||
| Actual | 1,000 | 1,145.50 | 5.64 | |||||||||
| Hypothetical 5% return | 1,000 | 1,019.54 | + | 5.31 | ||||||||
| * | Expenses are calculated using the Fund’s annualized net expense ratio for each class, which represents the ongoing expenses as a percentage of net assets for the six months ended June 30, 2013. Expenses are calculated by multiplying the annualized net expense ratio by the average account value for the period; then multiplying the result by the number of days in the most recent fiscal half year; and then dividing that result by the number of days in the fiscal year. The annualized net expense ratios for the period were 0.81% and 1.06% for Institutional and Service Shares, respectively. |
| + | Hypothetical expenses are based on the Fund’s actual annualized net expense ratios and an assumed rate of return of 5% per year before expenses. |
24
GOLDMAN SACHS VARIABLE INSURANCE TRUST STRUCTURED SMALL CAP EQUITY FUND
Statement Regarding Basis for Approval of Management Agreement (Unaudited)
Background
The Goldman Sachs Structured Small Cap Equity Fund (the “Fund”) is an investment portfolio of Goldman Sachs Variable Insurance Trust (the “Trust”). The Board of Trustees oversees the management of the Trust and reviews the investment performance and expenses of the Fund at regularly scheduled meetings held during the year. In addition, the Board of Trustees determines annually whether to approve the continuance of the Trust’s investment management agreement (the “Management Agreement”) with Goldman Sachs Asset Management, L.P. (the “Investment Adviser”) on behalf of the Fund.
The Management Agreement was most recently approved for continuation until June 30, 2014 by the Board of Trustees, including those Trustees who are not parties to the Management Agreement or “interested persons” (as defined in the Investment Company Act of 1940, as amended) of any party thereto (the “Independent Trustees”), at a meeting held on June 12-13, 2013 (the “Annual Meeting”).
The review process undertaken by the Trustees spans the course of the year and culminates with the Annual Meeting. To assist the Trustees in their deliberations, the Trustees have established a Contract Review Committee (the “Committee”), comprised of the Independent Trustees. The Committee held four meetings over the course of the year since the Management Agreement was last approved. At those Committee meetings, regularly scheduled Board or other committee meetings and/or the Annual Meeting, the Board, or the Independent Trustees, as applicable, considered matters relating to the Management Agreement, including:
| (a) | the nature and quality of the advisory, administrative and other services provided to the Fund by the Investment Adviser and its affiliates, including information about: |
| (i) | the structure, staff and capabilities of the Investment Adviser and its portfolio management teams; |
| (ii) | the groups within the Investment Adviser and its affiliates that support the portfolio management teams or provide other types of necessary services, including fund services groups (e.g., accounting and financial reporting, tax, shareholder services and operations), controls and risk management groups (e.g., legal, compliance, valuation oversight, credit risk management, internal audit, compliance testing, market risk analysis, finance and strategy and central funding), sales and distribution support groups and others (e.g., information technology and training); |
| (iii) | trends in headcount; |
| (iv) | the Investment Adviser’s financial resources and ability to hire and retain talented personnel and strengthen its operations; and |
| (v) | the parent company’s support of the Investment Adviser and its mutual fund business, as expressed by the firm’s senior management; |
| (b) | information on the investment performance of the Fund, including comparisons to the performance of a group of similar mutual funds, as provided by a third party mutual fund data provider engaged as part of the contract review process (the “Outside Data Provider”), and a benchmark performance index, and general investment outlooks in the markets in which the Fund invests; |
| (c) | the terms of the Management Agreement and agreements with affiliated service providers entered into by the Trust on behalf of the Fund; |
| (d) | expense information for the Fund, including: |
| (i) | the relative management fee and expense levels of the Fund as compared to those of comparable funds managed by other advisers, as provided by the Outside Data Provider; |
| (ii) | the Fund’s expense trends over time; and |
| (iii) | to the extent the Investment Adviser manages institutional accounts or collective investment vehicles having investment objectives and policies similar to those of the Fund, comparative information on the advisory fees charged and services provided to those accounts by the Investment Adviser; |
| (e) | with respect to the extensive investment performance and expense comparison data provided by the Outside Data Provider, its processes in producing that data for the Fund; |
| (f) | the undertakings of the Investment Adviser to waive certain fees and limit certain expenses of the Fund that exceed a specified level, and a summary of contractual fee reductions made by the Investment Adviser and its affiliates over the past several years with respect to the Fund; |
| (g) | information relating to the profitability of the Management Agreement and the transfer agency and distribution and service arrangements of the Fund and the Trust as a whole to the Investment Adviser and its affiliates; |
| (h) | whether the Fund’s existing management fee schedule adequately addressed any economies of scale; |
| (i) | a summary of the “fall-out” benefits derived by the Investment Adviser and its affiliates from their relationships with the Fund, including the fees received by the Investment Adviser’s affiliates from the Fund for transfer agency, securities lending, portfolio trading, distribution and other services; |
25
GOLDMAN SACHS VARIABLE INSURANCE TRUST STRUCTURED SMALL CAP EQUITY FUND
Statement Regarding Basis for Approval of Management Agreement (Unaudited) (continued)
| (j) | a summary of potential benefits derived by the Fund as a result of its relationship with the Investment Adviser; |
| (k) | information regarding commissions paid by the Fund and broker oversight, other information regarding portfolio trading and how the Investment Adviser carries out its duty to seek best execution; |
| (l) | the manner in which portfolio manager compensation is determined, and the number and types of accounts managed by the portfolio managers; |
| (m) | the nature and quality of the services provided to the Fund by its unaffiliated service providers, and the Investment Adviser’s general oversight and evaluation (including reports on due diligence) of those service providers as part of the administration services provided under the Management Agreement; and |
| (n) | the Investment Adviser’s processes and policies addressing various types of potential conflicts of interest; its approach to risk management; the annual review of the effectiveness of the Fund’s compliance program; and periodic compliance reports. |
The Trustees also received an overview of the Fund’s distribution arrangements. They received information regarding the Fund’s assets, share purchase and redemption activity and the payment of Rule 12b-1 distribution and service fees by the Fund’s Service Shares. Information was also provided to the Trustees relating to revenue sharing payments made by and services provided by the Investment Adviser and its affiliates to intermediaries that promote the sale, distribution and/or servicing of Fund shares.
The presentations made at the Board and Committee meetings and at the Annual Meeting encompassed the Fund and other mutual fund portfolios for which the Board of Trustees has responsibility. In evaluating the Management Agreement at the Annual Meeting, the Trustees relied upon their knowledge, resulting from their meetings and other interactions throughout the year, of the Investment Adviser, its affiliates, their services and the Fund. In conjunction with these meetings, the Trustees received written materials and oral presentations on the topics covered, and were advised by their independent legal counsel regarding their responsibilities and other regulatory requirements related to the approval and continuation of mutual fund investment management agreements under applicable law. In addition, the Investment Adviser and its affiliates provided the Independent Trustees with a written response to a formal request for information sent on behalf of the Independent Trustees by their independent legal counsel. During the course of their deliberations, the Independent Trustees met in executive sessions with their independent legal counsel, without representatives of the Investment Adviser or its affiliates present. The Independent Trustees also discussed the broad range of other investment choices that are available to Fund investors, including the availability of comparable funds managed by other advisers.
Nature, Extent and Quality of the Services Provided Under the Management Agreement
As part of their review, the Trustees considered the nature, extent and quality of the services provided by the Investment Adviser. In this regard, the Trustees considered both the investment advisory services and non-advisory services that are provided to the Fund by the Investment Adviser and its affiliates. The Trustees noted the transition in the leadership and changes in personnel of various of the Investment Adviser’s portfolio management teams that had occurred in recent periods, and the ongoing recruitment efforts aimed at bringing high quality investment talent to the Investment Adviser. The Trustees concluded that the Investment Adviser continued to commit substantial financial and operational resources to the Fund and expressed confidence that the Investment Adviser would continue to do so in the future. The Trustees also recognized that the Investment Adviser had made significant commitments to address regulatory compliance requirements applicable to the Fund and the Investment Adviser.
Investment Performance
The Trustees also considered the investment performance of the Fund. In this regard, they compared the investment performance of the Fund to its peers using rankings and ratings compiled by the Outside Data Provider as of December 31, 2012, and updated performance information prepared by the Investment Adviser using the peer group identified by the Outside Data Provider as of March 31, 2013. The information on the Fund’s investment performance was provided for the one-, three-, five- and ten-year periods ending on the applicable dates. The Trustees also reviewed the Fund’s investment performance over time (including on a year-by-year basis) relative to its performance benchmark. In addition, they considered the investment performance trends of the Fund over time, and reviewed the investment performance of the Fund in light of its investment objective and policies and market conditions.
In addition, the Trustees considered materials prepared and presentations made by the Investment Adviser’s senior management and portfolio management personnel, in which Fund performance was assessed. The Trustees also considered the Investment Adviser’s periodic reports with respect to the Fund’s risk profile, and how the Investment Adviser’s approach to risk monitoring and management influences portfolio management.
26
GOLDMAN SACHS VARIABLE INSURANCE TRUST STRUCTURED SMALL CAP EQUITY FUND
Statement Regarding Basis for Approval of Management Agreement (Unaudited) (continued)
The Trustees observed that the Fund’s Service Shares had placed in the top half of the Fund’s peer group for the three- and five-year periods and in the fourth quartile for the one-year period, and had outperformed the Fund’s benchmark index for the three- and five-year periods and underperformed its benchmark index for the one-year period ended March 31, 2013. They noted the additions of certain key hires to senior management in 2011, and recognized the portfolio management team’s continuing efforts to further enhance its investment models.
Costs of Services Provided and Competitive Information
The Trustees considered the contractual terms of the Management Agreement and the fee rates payable by the Fund thereunder. In this regard, the Trustees considered information on the services rendered by the Investment Adviser to the Fund, which included both advisory and administrative services that were directed to the needs and operations of the Fund as a registered mutual fund.
In particular, the Trustees reviewed analyses prepared by the Outside Data Provider regarding the expense rankings of the Fund. The analyses provided a comparison of the Fund’s management fees and breakpoints to those of a relevant peer group and a category universe; an expense analysis which compared the Fund’s overall net and gross expenses to a peer group and a category universe; and a five-year history comparing the Fund’s net expenses to the peer and category medians. The analyses also compared the Fund’s transfer agency, custody, and distribution fees, other expenses and fee waivers/reimbursements to those of the peer group and category medians. The Trustees concluded that the comparisons provided by the Outside Data Provider were useful in evaluating the reasonableness of the management fees and total expenses paid by the Fund.
In addition, the Trustees considered the Investment Adviser’s undertakings to waive a portion of its management fee and limit certain expenses of the Fund that exceed a specified level. They also considered, to the extent that the Investment Adviser manages institutional accounts or collective investment vehicles having investment objectives and policies similar to those of the Fund, comparative fee information for services provided by the Investment Adviser to those accounts, and information that indicated that services provided to the Fund differed in various significant respects from the services provided to institutional accounts, which generally operated under less stringent legal and regulatory structures, required fewer services from the Investment Adviser to a smaller number of client contact points, were less time-intensive and paid lower fees.
In addition, the Trustees noted that shareholders are able to redeem their Fund shares at any time if they believe that the Fund fees and expenses are too high or if they are dissatisfied with the performance of the Fund.
Profitability
The Trustees reviewed the Investment Adviser’s revenues and pre-tax profit margins with respect to the Trust and the Fund. In this regard the Trustees noted that they had received, among other things, profitability analyses and summaries, revenue and expense schedules by Fund and by function (i.e., investment management, transfer agency and distribution and service) and the Investment Adviser’s expense allocation methodology. They observed that the profitability and expense figures are substantially similar to those used by the Investment Adviser for many internal purposes, including compensation decisions among various business groups, and are thus subject to a vigorous internal debate about how certain revenue and expenses should be allocated. The Trustees also reviewed the report of the internal audit group within the Goldman Sachs organization, which included an assessment of the reasonableness and consistency of the Investment Adviser’s expense allocation methodology and an evaluation of the accuracy of the Investment Adviser’s profitability analysis calculations. Profitability data for the Trust and the Fund were provided for 2012 and 2011, and the Trustees considered this information in relation to the Investment Adviser’s overall profitability. The Trustees considered the Investment Adviser’s revenues and pre-tax profit margins both in absolute terms and in comparison to information on the reported pre-tax profit margins earned by certain other asset management firms.
Economies of Scale
The Trustees considered the information that had been provided regarding the Investment Adviser’s profitability. The Trustees also considered the breakpoints in the fee rate payable under the Management Agreement for the Fund at the following annual percentage rates of the average daily net assets of the Fund:
| First $2 billion | 0.75 | % | ||
| Next $3 billion | 0.68 | |||
| Next $3 billion | 0.65 | |||
| Over $8 billion | 0.64 |
27
GOLDMAN SACHS VARIABLE INSURANCE TRUST STRUCTURED SMALL CAP EQUITY FUND
Statement Regarding Basis for Approval of Management Agreement (Unaudited) (continued)
The Trustees noted that the breakpoints were meant to share potential economies of scale, if any, with the Fund and its shareholders as assets under management reach those asset levels. The Trustees considered the amounts of assets in the Fund; the Fund’s recent share purchase and redemption activity; the information provided by the Investment Adviser relating to the costs of the services provided by the Investment Adviser and its affiliates and their realized profits; information comparing fee rates charged by the Investment Adviser with fee rates charged to other funds in the peer group; and the Investment Adviser’s undertakings to waive certain fees and limit certain expenses of the Fund that exceed a specified level. Upon reviewing these matters at the Annual Meeting, the Trustees concluded that the fee breakpoints represented a means of assuring that benefits of scalability, if any, would be passed along to shareholders at the specified asset levels.
Other Benefits to the Investment Adviser and Its Affiliates
The Trustees also considered the other benefits derived by the Investment Adviser and its affiliates from their relationship with the Fund as stated above, including: (a) transfer agency fees received by Goldman, Sachs & Co. (“Goldman Sachs”); (b) brokerage and futures commissions earned by Goldman Sachs for executing securities and futures transactions on behalf of the Fund; (c) trading efficiencies resulting from aggregation of orders of the Fund with those for other funds or accounts managed by the Investment Adviser; (d) fees earned by Goldman Sachs Agency Lending, an affiliate of the Investment Adviser, as securities lending agent (and fees earned by the Investment Adviser for managing the fund in which the Fund’s cash collateral is invested); (e) the Investment Adviser’s ability to leverage the infrastructure designed to service the Fund on behalf of its other clients; (f) the Investment Adviser’s ability to cross-market other products and services to Fund shareholders; (g) Goldman Sachs’ retention of certain fees as Fund Distributor; (h) the Investment Adviser’s ability to negotiate better pricing with custodians on behalf of its other clients, as a result of the relationship with the Fund; and (i) the possibility that the working relationship between the Investment Adviser and the Fund’s third party service providers may cause those service providers to be open to doing business with other areas of Goldman Sachs. In the course of considering the foregoing, the Independent Trustees requested and received further information quantifying certain of these fall-out benefits. In looking at the benefits to Goldman Sachs Agency Lending and the Investment Adviser from the securities lending program, they noted that the Fund also benefited from its participation in the securities lending program.
Other Benefits to the Fund and Its Shareholders
The Trustees also noted that the Fund receives certain potential benefits as a result of its relationship with the Investment Adviser, including: (a) trading efficiencies resulting from aggregation of orders of the Fund with those of other funds or accounts managed by the Investment Adviser; (b) improved servicing from vendors because of the volume of business generated by the Investment Adviser and its affiliates; (c) improved servicing from broker-dealers because of the volume of business generated by the Investment Adviser and its affiliates; (d) the Investment Adviser’s ability to negotiate favorable terms with derivatives counterparties as a result of the size and reputation of the Goldman Sachs organization; (e) the Investment Adviser’s knowledge and experience gained from managing other accounts and products; (f) the Investment Adviser’s ability to hire and retain qualified personnel to provide services to the Fund because of the reputation of the Goldman Sachs organization; (g) the Fund’s access, through the Investment Adviser, to certain firmwide resources (e.g., proprietary risk management systems and databases), subject to certain restrictions; and (h) the Fund’s access to certain affiliated distribution channels. The Trustees noted the competitive nature of the mutual fund marketplace, and noted further that many of the Fund’s shareholders invested in the Fund in part because of the Fund’s relationship with the Investment Adviser and that those shareholders have a general expectation that the relationship will continue.
Conclusion
In connection with their consideration of the Management Agreement, the Trustees gave weight to each of the factors described above, but did not identify any particular factor as controlling their decision. After deliberation and consideration of all of the information provided, including the factors described above, the Trustees concluded, in the exercise of their business judgment, that the management fees paid by the Fund were reasonable in light of the services provided to it by the Investment Adviser, the Investment Adviser’s costs and the Fund’s current and reasonably foreseeable asset levels. The Trustees unanimously concluded that the Investment Adviser’s continued management likely would benefit the Fund and its shareholders and that the Management Agreement should be approved and continued with respect to the Fund until June 30, 2014.
28
| TRUSTEES | OFFICERS | |
| Ashok N. Bakhru, Chairman | James A. McNamara, President | |
| Donald C. Burke | George F. Travers, Principal Financial Officer | |
| John P. Coblentz, Jr. | Caroline L. Kraus, Secretary | |
| Diana M. Daniels | Scott M. McHugh, Treasurer | |
| Joseph P. LoRusso | ||
| James A. McNamara | ||
| Jessica Palmer | ||
| Alan A. Shuch | ||
| Richard P. Strubel |
GOLDMAN, SACHS & CO.
Distributor and Transfer Agent
GOLDMAN SACHS ASSET MANAGEMENT, L.P.
Investment Adviser
200 West Street, New York
New York 10282
Visit our web site at www.goldmansachsfunds.com/vit to obtain the most recent month-end returns.
The reports concerning the Fund included in this shareholder report may contain certain forward-looking statements about the factors that may affect the performance of the Fund in the future. These statements are based on Fund management’s predictions and expectations concerning certain future events and their expected impact on the Fund, such as performance of the economy as a whole and of specific industry sectors, changes in the levels of interest rates, the impact of developing world events, and other factors that may influence the future performance of the Fund. Management believes these forward-looking statements to be reasonable, although they are inherently uncertain and difficult to predict. Actual events may cause adjustments in portfolio management strategies from those currently expected to be employed.
A description of the policies and procedures that the Fund uses to determine how to vote proxies relating to portfolio securities and information regarding how the Fund voted proxies relating to portfolio securities for the 12-month period ended June 30 is available (i) without charge, upon request by calling 1-800-621-2550; and (ii) on the Securities and Exchange Commission (“SEC”) web site at http://www.sec.gov.
The Fund files its complete schedule of portfolio holdings with the SEC for the first and third quarters of each fiscal year on Form N-Q. The Fund’s Form N-Q is available on the SEC’s web site at http://www.sec.gov within 60 days after the Fund’s first and third fiscal quarters. The Fund’s Forms N-Q may be reviewed and copied at the SEC’s Public Reference Room in Washington, D.C. and information on the operation of the Public Reference Room may also be obtained by calling 1-800-SEC-0330. Forms N-Q may be obtained upon request and without charge by calling 1-800-621-2550.
Holdings and allocations shown are as of June 30, 2013 and may not be representative of future investments. Fund holdings should not be relied on in making investment decisions and should not be construed as research or investment advice regarding particular securities. Current and future holdings are subject to risk.
The Global Industry Classification Standard (“GICS”) was developed by and is the exclusive property and a service mark of Morgan Stanley Capital International Inc. (“MSCI”) and Standard & Poor’s, a division of The McGraw-Hill Companies, Inc. (“S&P”) and is licensed for use by Goldman Sachs. Neither MSCI, S&P nor any other party involved in making or compiling the GICS or any GICS classifications makes any express or implied warranties or representations with respect to such standard or classification (or the results to be obtained by the use thereof), and all such parties hereby expressly disclaim all warranties of originality, accuracy, completeness, merchantability or fitness for a particular purpose with respect to any of such standard or classification. Without limiting any of the foregoing, in no event shall MSCI, S&P, any of their affiliates or any third party involved in making or compiling the GICS or any GICS classifications have any liability for any direct, indirect, special, punitive, consequential or any other damages (including lost profits) even if notified of the possibility of such damages.
The portfolio risk management process includes an effort to monitor and manage risk, but does not imply low risk.
Shares of the Goldman Sachs VIT Funds are offered to separate accounts of participating life insurance companies for the purpose of funding variable annuity contracts and variable life insurance policies. Shares of the Fund are not offered directly to the general public. The variable annuity contracts and variable life insurance policies are described in the separate prospectuses issued by participating insurance companies. You should refer to those prospectuses for information about surrender charges, mortality and expense risk fees and other charges that may be assessed by participating insurance companies under the variable annuity contracts or variable life insurance policies. Such fees or charges, if any, may affect the return you may realize with respect to your investments. Ask your representative for more complete information. Please consider a fund’s objectives, risks and charges and expenses, and read the prospectus carefully before investing. The prospectus contains this and other information about the Fund.
This material is not authorized for distribution to prospective investors unless preceded or accompanied by a current Prospectus or summary prospectus, if applicable. Investors should consider a Fund’s objective, risks, and charges and expenses, and read the summary prospectus, if available, and/or the Prospectus carefully before investing or sending money. The summary prospectus, if available, and the Prospectus contain this and other information about a Fund and may be obtained from your Authorized Institution or from Goldman, Sachs & Co. by calling 1-800-621-2550.
This report is prepared for the general information of contract owners and is not an offer of shares of the Goldman Sachs Variable Insurance Trust: Goldman Sachs Structured Small Cap Equity Fund.
© 2013 Goldman Sachs. All rights reserved.
VITSCSAR13/106802.MF.MED.TMPL/8/2013
Goldman
Sachs Variable Insurance Trust
Goldman Sachs
Structured U.S. Equity Fund
Semi-Annual Report
June 30, 2013

GOLDMAN SACHS VARIABLE INSURANCE TRUST STRUCTURED U.S. EQUITY FUND
Principal Investment Strategies and Risks
This is not a complete list of risks that may affect the Fund. For additional information concerning the risks applicable to the Fund, please see the Fund’s Prospectus.
Shares of the Goldman Sachs Variable Insurance Trust — Goldman Sachs Structured U.S. Equity Fund are offered to separate accounts of participating life insurance companies for the purpose of funding variable annuity contracts and variable life insurance policies. Shares of the Fund are not offered directly to the general public. The variable annuity contracts and variable life insurance policies are described in the separate prospectuses issued by participating insurance companies. You should refer to those prospectuses for information about surrender charges, mortality and expense risk fees and other charges that may be assessed by participating insurance companies under the variable annuity contracts or variable life insurance policies. Such fees or charges, if any, may affect the return you realize with respect to your investments. Ask your representative for more complete information. Please consider the Fund’s objective, risks and charges and expenses, and read the Prospectus carefully before investing. The Prospectus contains this and other information about the Fund.
The Goldman Sachs Structured U.S. Equity Fund invests primarily in a diversified portfolio of equity investments in U.S. issuers, including foreign issuers traded in the United States. The Fund’s equity investments will be subject to market risk, which means that the value of the securities in which it invests may go up or down in response to the prospects of individual companies, particular sectors and/or general economic conditions. The Investment Adviser’s use of quantitative models to execute the Fund’s investment strategy may fail to produce the intended result. Different investment styles (e.g., “quantitative”) tend to shift in and out of favor, and at times the Fund may underperform other funds that invest in similar asset classes. The Fund may have a high rate of portfolio turnover, which involves correspondingly greater expenses which must be borne by the Fund, and is also likely to result in short-term capital gains taxable to shareholders.
1
GOLDMAN SACHS VARIABLE INSURANCE TRUST STRUCTURED U.S. EQUITY FUND
INVESTMENT OBJECTIVE
The Fund seeks long-term growth of capital and dividend income.
Portfolio Management Discussion and Analysis
Below, the Goldman Sachs Quantitative Investment Strategies Team discusses the Goldman Sachs Variable Insurance Trust — Goldman Sachs Structured U.S. Equity Fund’s (the “Fund”) performance and positioning for the six-month period ended June 30, 2013 (the “Reporting Period”).
How did the Fund perform during the Reporting Period?
During the Reporting Period, the Fund’s Institutional and Service Shares generated cumulative total returns of 15.65% and 15.54%, respectively. These returns compare to the 13.82% cumulative total return of the Fund’s benchmark, the Standard & Poor’s® 500 Index (with dividends reinvested) (the “S&P® 500 Index”), during the same time period.
What economic and market factors most influenced the equity markets as a whole during the Reporting Period?
Representing the U.S. equity market, the S&P® 500 Index gained 13.82% during the Reporting Period, making it the strongest first half since 1998.
U.S. equities, as represented by the S&P® 500 Index, extended their rally from 2012 with a strong first quarter in 2013. Indeed, the S&P® 500 Index finished the first quarter of 2013 with significant gains, making a five-year high during these months. The Dow Jones Industrial Average also hit a new record high during the first calendar quarter.
Despite the overhang of automatic spending cuts, or sequestration, that went into effect in March 2013, U.S. equity markets reflected a variety of improving economic indicators. Strong momentum in the housing market continued, as the Case-Shiller Index of house prices rose 8.1% in January 2013, year-over-year the fastest pace since mid-2006. The employment picture also improved, with the unemployment rate dropping to 7.7%. Strong retail sales suggested consumers may have been feeling the effects of better housing and labor market conditions.
After a strong start to the second quarter of 2013, bullish sentiment began to fade, and the U.S. equity rally halted in mid-May 2013 when Federal Reserve (“Fed”) Chair Bernanke announced the potential “tapering” of the pace of quantitative easing asset purchases. U.S. equity markets reacted negatively again in June to news the slowing of the asset purchase program could begin later this year, with the program ending by the middle of 2014 if the economy grows as expected. U.S. equity markets calmed toward the end of the month as a downward revision of first quarter Gross Domestic Product (“GDP”) from 2.4% to 1.8% supported reassurance from the Fed that it would only begin reducing asset purchases if the economy was clearly on track. Still, the S&P® 500 Index declined modestly in June 2013, ending seven consecutive months of gains and muting returns for the quarter as a whole. Even with that, both the S&P® 500 Index and the Dow Jones Industrial Average made fresh record highs fueled by the continued strong rebound in house prices during the second calendar quarter, and returns for the Reporting Period overall were still significantly up.
For the Reporting Period as a whole, all ten sectors within the S&P® 500 Index posted gains. Health care did best, followed closely by consumer discretionary and financials. Conversely, materials performed worst, as commodity prices were volatile in part due to a slowing Chinese economy. Information technology, utilities, telecommunication services and energy were also comparatively weak, though still producing positive returns.
All segments of the U.S. equity market advanced during the Reporting Period, with small-cap stocks, as measured by the Russell 2000® Index gaining most, followed by mid-cap stocks and then large-cap stocks, as measured by the Russell Midcap® Index and the Russell 1000® Index, respectively. From a style perspective, value-oriented stocks solidly outpaced growth-oriented stocks in the large-cap and mid-cap segments of the U.S. equity market; however, growth stocks substantially outperformed value stocks in the small-cap segment of the U.S. equity market. (All as measured by the Russell Investments indices.)
What key factors were responsible for the Fund’s performance during the Reporting Period?
The Fund outperformed the S&P 500 Index during the Reporting Period. Our stock selection and quantitative model’s investment themes added to relative performance overall.
2
GOLDMAN SACHS VARIABLE INSURANCE TRUST STRUCTURED U.S. EQUITY FUND
What impact did the Fund’s investment themes have on performance during the Reporting Period?
As expected, and in keeping with our investment approach, our quantitative model and its six investment themes (Valuation, Profitability, Quality, Management, Momentum and Sentiment) had the greatest impact on relative performance. We use these themes to take a long-term view of market patterns and look for inefficiencies, selecting stocks for the Fund and overweighting or underweighting the ones chosen by the model. Over time and by design, the performance of any one of the model’s investment themes tends to have a low correlation with the model’s other themes, demonstrating the diversification benefit of the Fund’s theme-driven quantitative model. The variance in performance supports our research indicating that the diversification provided by the Fund’s different investment themes is a significant investment advantage over the long term, even though the Fund may experience underperformance in the short term. Of course, diversification does not protect an investor from market risk nor does it ensure a profit.
During the Reporting Period, three of our six investment themes contributed positively to the Fund’s relative performance. The Momentum theme contributed most positively to the Fund’s relative performance during the Reporting Period, followed by Valuation and Sentiment. The Momentum theme seeks to predict drifts in stock prices caused by delayed investor reaction to company-specific information and information about related companies. The Valuation theme attempts to capture potential mispricings of securities, typically by comparing a measure of the company’s intrinsic value to its market value. The Sentiment theme reflects selected investment views and decisions of individuals and financial intermediaries.
The Fund’s Profitability and Management themes detracted. The Profitability theme assesses whether a company is earning more than its cost of capital. The Management theme assesses the characteristics, policies and strategic decisions of company managements. The Quality theme, which assesses both firm and financial quality, had a relatively neutral impact during the Reporting Period.
How did the Fund’s sector and industry allocations affect relative performance?
In constructing the Fund’s portfolio, we focus on picking stocks rather than making industry or sector bets. Consequently, the Fund is similar to its benchmark, the S&P 500 Index, in terms of its industry and sector allocation and style. We manage the Fund’s industry and sector exposure by including industry factors in our risk model and by explicitly penalizing industry and sector deviations from the benchmark index in optimization. Sector weights or changes in sector weights generally do not have a meaningful impact on relative performance.
Did stock selection help or hurt Fund performance during the Reporting Period?
We seek to outpace the S&P 500 Index by overweighting stocks that we expect to outperform and underweighting those that we think may lag. We also build positions based on our thematic views. For example, the Fund aims to hold a basket of stocks with more favorable Momentum characteristics than the benchmark index. During the Reporting Period, stock selection overall contributed positively to the Fund’s relative performance.
Effective stock selection in the financials, industrials and consumer staples sectors made the biggest positive contribution to the Fund’s results relative to its benchmark index. Partially offsetting these contributors was stock selection in the energy, information technology and consumer discretionary sectors, which detracted most from the Fund’s results relative to the S&P 500 Index.
Which individual stock positions contributed the most to the Fund’s relative returns during the Reporting Period?
The Fund benefited most from overweight positions in specialty electronic game and entertainment software retailer GameStop, biotechnology company Biogen Idec and biopharmaceutical company Celgene Group. We chose to overweight GameStop due to our positive views on Quality and Valuation. The overweight in Biogen Idec was the result of our positive views on Valuation and Momentum. The Fund was overweight Celgene Group given our positive views on Valuation and Sentiment.
Which individual positions detracted from the Fund’s results during the Reporting Period?
Detracting most from the Fund’s results relative to its benchmark index were overweight positions in specialty pharmaceuticals company Allergan and energy refiners Valero Energy and HollyFrontier. The Fund had an overweight position in Allergan due to our positive views on Profitability and Sentiment. The Fund was overweight Valero Energy and HollyFrontier because of our positive views on Valuation and Profitability.
3
GOLDMAN SACHS VARIABLE INSURANCE TRUST STRUCTURED U.S. EQUITY FUND
How did the Fund use derivatives during the Reporting Period?
During the Reporting Period, we did not use derivatives as part of an active management strategy to add value to the Fund’s results. However, we used equity index futures contracts, on an opportunistic basis, to equitize the Fund’s excess cash holdings. In other words, we put the Fund’s excess cash holdings to work by using them as collateral for the purchase of stock futures.
Did you make any enhancements to your quantitative models during the Reporting Period?
We continuously look for ways to improve our investment process. During the second quarter of 2013, we implemented enhancements to our Valuation theme through the introduction of more industry specific models, including a model tailored to the banking industry. We believe these industry specific models should allow us to capture industry-specific dynamics and local knowledge while retaining our systematic approach.
What was the Fund’s sector positioning relative to its benchmark index at the end of the Reporting Period?
As of June 30, 2013, the Fund was overweight the industrials, health care and consumer discretionary sectors relative to the S&P 500 Index. The Fund was underweight utilities, consumer staples and information technology and was rather neutrally weighted in financials, materials, telecommunication services and energy compared to the benchmark index on the same date.
What is your strategy going forward for the Fund?
Looking ahead, we continue to believe that less expensive stocks should outpace more expensive stocks, and stocks with good momentum should outperform those with poor momentum. We intend to maintain our focus on seeking companies about which fundamental research analysts are becoming more positive as well as profitable companies with sustainable earnings and a track record of using their capital to enhance shareholder value. As such, we anticipate remaining fully invested with long-term performance likely to be the result of stock selection rather than sector or capitalization allocations.
We stand behind our investment philosophy that sound economic investment principles, coupled with a disciplined quantitative approach, can provide strong, uncorrelated returns over the long term. Our research agenda is robust, and we continue to enhance our existing models, add new proprietary forecasting signals and improve our trading execution as we seek to provide the most value to our shareholders.
4
FUND BASICS
Structured U.S. Equity Fund
as of June 30, 2013
STANDARDIZED TOTAL RETURNS1
| For the period ended 6/30/13 | One Year | Five Years | Ten Years | Since Inception | Inception Date | |||||||||||||
| Institutional | 22.40 | % | 5.99 | % | 6.52 | % | 4.08 | % | 02/13/98 | |||||||||
| Service | 22.17 | 5.76 | N/A | 3.15 | 01/09/06 | |||||||||||||
| 1 | The Standardized Total Returns are average annual total returns as of the most recent calendar quarter-end. They assume reinvestment of all distributions at net asset value (“NAV”). Because Institutional and Service Shares do not involve a sales charge, such a charge is not applied to their Standardized Total Returns. |
Total return figures in the above chart represent past performance and do not indicate future results, which will vary. The investment return and principal value of an investment will fluctuate and, therefore, an investor’s shares, when redeemed, may be worth more or less than their original cost. Current performance may be lower or higher than the total return figures in the above chart. Please visit www.goldmansachsfunds.com/vit to obtain the most recent month-end returns. Performance reflects fee waivers and/or expense limitations in effect during the periods shown. In their absence, performance would be reduced.
EXPENSE RATIOS2
| Net Expense Ratio (Current) | Gross Expense Ratio (Before Waivers) | |||||||
| Institutional | 0.64 | % | 0.72 | % | ||||
| Service | 0.85 | 0.97 | ||||||
| 2 | The expense ratios of the Fund, both current (net of applicable fee waivers and/or expense limitations) and before waivers (gross of applicable fee waivers and/or expense limitations) are as set forth above according to the most recent publicly available Prospectus for the Fund and may differ from the expense ratios disclosed in the Financial Highlights in this report. The Fund’s waivers and/or expense limitations will remain in place through at least April 30, 2014, and prior to such date the Investment Adviser may not terminate the arrangements without the approval of the Fund’s Board of Trustees. If these arrangements are discontinued in the future, the expense ratios may change without shareholder approval. |
TOP TEN HOLDINGS AS OF 6/30/133
| Holding | % of Assets | Line of Business | ||||
| Exxon Mobil Corp. | 3.5% | Energy | ||||
| General Electric Co. | 2.7 | Capital Goods | ||||
| Google, Inc. Class A | 2.6 | Software & Services | ||||
| International Business Machines Corp. | 2.4 | Software & Services | ||||
| AT&T, Inc. | 2.4 | Telecommunication Services | ||||
| Apple, Inc. | 2.3 | Technology Hardware & Equipment | ||||
| Pfizer, Inc. | 2.3 | Pharmaceuticals, Biotechnology & Life Sciences | ||||
| Merck & Co., Inc. | 2.0 | Pharmaceuticals, Biotechnology & Life Sciences | ||||
| Philip Morris International, Inc. | 1.9 | Food, Beverage & Tobacco | ||||
| The Boeing Co. | 1.5 | Capital Goods | ||||
| 3 | The top ten holdings may not be representative of the Fund’s future investments. |
5
FUND BASICS
FUND vs. BENCHMARK SECTOR ALLOCATIONS4
As of June 30, 2013
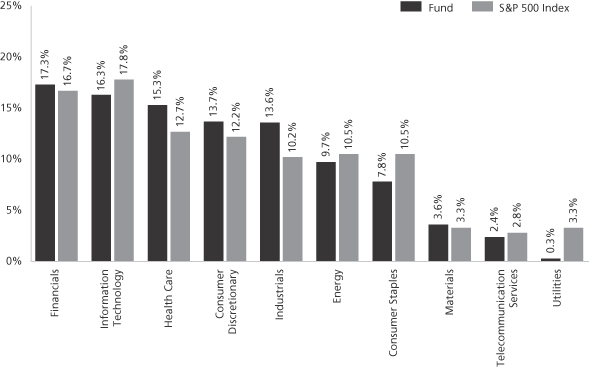
| 4 | The Fund is actively managed and, as such, its composition may differ over time. Consequently, the Fund’s overall sector allocations may differ from percentages contained in the graph above. The graph categorizes investments using Global Industry Classification Standard (“GICS”), however, the sector classifications used by the portfolio management team may differ from GICS. The percentage shown for each investment category reflects the value of investments in that category as a percentage of market value (excluding investments in the securities lending reinvestment vehicle, if any). Investments in the securities lending reinvestment vehicle represented approximately 1.1% of the Fund’s net assets at June 30, 2013. The graph depicts the Fund’s investments but may not represent the Fund’s market exposure due to the exclusion of certain derivatives, if any, as listed in the Additional Investment Information section of the Schedule of Investments. |
6
GOLDMAN SACHS VARIABLE INSURANCE TRUST STRUCTURED U.S. EQUITY FUND
Schedule of Investments
June 30, 2013 (Unaudited)
| Shares | Description | Value | ||||||
| Common Stocks – 96.9% | ||||||||
| Automobiles & Components – 1.3% |
| ||||||
| 49,668 | BorgWarner, Inc.* | $ | 4,278,898 | |||||
| 27,065 | Gentex Corp. | 623,848 | ||||||
|
| |||||||
| 4,902,746 | ||||||||
|
| |||||||
| Banks – 2.9% |
| ||||||
| 3,377 | Comerica, Inc. | 134,506 | ||||||
| 322,738 | Regions Financial Corp. | 3,075,693 | ||||||
| 74,106 | SunTrust Banks, Inc. | 2,339,527 | ||||||
| 138,912 | Wells Fargo & Co. | 5,732,898 | ||||||
|
| |||||||
| 11,282,624 | ||||||||
|
| |||||||
| Capital Goods – 10.9% |
| ||||||
| 24,280 | 3M Co. | 2,655,018 | ||||||
| 21,306 | Alliant Techsystems, Inc. | 1,754,123 | ||||||
| 77,506 | Danaher Corp. | 4,906,130 | ||||||
| 31,773 | Donaldson Co., Inc. | 1,133,025 | ||||||
| 448,097 | General Electric Co. | 10,391,370 | ||||||
| 67,887 | Illinois Tool Works, Inc. | 4,695,744 | ||||||
| 22,698 | Lockheed Martin Corp. | 2,461,825 | ||||||
| 8,268 | Masco Corp. | 161,143 | ||||||
| 10,800 | Northrop Grumman Corp. | 894,240 | ||||||
| 66,975 | Raytheon Co. | 4,428,387 | ||||||
| 57,387 | The Boeing Co. | 5,878,724 | ||||||
| 41,202 | WABCO Holdings, Inc.* | 3,077,377 | ||||||
|
| |||||||
| 42,437,106 | ||||||||
|
| |||||||
| Commercial & Professional Services – 0.7% |
| ||||||
| 47,353 | Manpowergroup, Inc. | 2,594,944 | ||||||
|
| |||||||
| Consumer Durables & Apparel – 1.8% |
| ||||||
| 57,990 | Garmin Ltd.(a) | 2,096,918 | ||||||
| 58,806 | Hasbro, Inc. | 2,636,273 | ||||||
| 25,997 | PulteGroup, Inc.* | 493,163 | ||||||
| 7,986 | Ralph Lauren Corp. | 1,387,488 | ||||||
| 2,046 | Whirlpool Corp. | 233,981 | ||||||
|
| |||||||
| 6,847,823 | ||||||||
|
| |||||||
| Consumer Services – 0.5% |
| ||||||
| 104,714 | Apollo Group, Inc. Class A* | 1,855,532 | ||||||
|
| |||||||
| Diversified Financials – 6.6% |
| ||||||
| 12,906 | Ameriprise Financial, Inc. | 1,043,837 | ||||||
| 79,313 | Capital One Financial Corp. | 4,981,650 | ||||||
| 15,086 | CBOE Holdings, Inc. | 703,611 | ||||||
| 64,308 | Citigroup, Inc. | 3,084,855 | ||||||
| 23,162 | Discover Financial Services | 1,103,438 | ||||||
| 32,912 | Janus Capital Group, Inc. | 280,081 | ||||||
| 71,228 | JPMorgan Chase & Co. | 3,760,126 | ||||||
| 14,581 | Moody’s Corp. | 888,420 | ||||||
| 101,197 | Morgan Stanley | 2,472,243 | ||||||
| 93,179 | SEI Investments Co. | 2,649,079 | ||||||
| 161,220 | TD Ameritrade Holding Corp. | 3,916,034 | ||||||
| 31,923 | The NASDAQ OMX Group, Inc. | 1,046,755 | ||||||
|
| |||||||
| 25,930,129 | ||||||||
|
| |||||||
| Common Stocks – (continued) | ||||||||
| Energy – 9.4% |
| ||||||
| 7,558 | EOG Resources, Inc. | $ | 995,237 | |||||
| 151,593 | Exxon Mobil Corp. | 13,696,427 | ||||||
| 63,810 | Hess Corp. | 4,242,727 | ||||||
| 37,797 | HollyFrontier Corp. | 1,616,956 | ||||||
| 55,717 | Marathon Petroleum Corp. | 3,959,250 | ||||||
| 83,466 | Phillips 66 | 4,916,982 | ||||||
| 66,841 | Tesoro Corp. | 3,497,121 | ||||||
| 6,540 | Ultra Petroleum Corp.*(a) | 129,623 | ||||||
| 102,806 | Valero Energy Corp. | 3,574,565 | ||||||
|
| |||||||
| 36,628,888 | ||||||||
|
| |||||||
| Food & Staples Retailing – 2.1% |
| ||||||
| 46,559 | Costco Wholesale Corp. | 5,148,029 | ||||||
| 59,760 | Safeway, Inc. | 1,413,921 | ||||||
| 21,892 | Wal-Mart Stores, Inc. | 1,630,735 | ||||||
|
| |||||||
| 8,192,685 | ||||||||
|
| |||||||
| Food, Beverage & Tobacco – 4.7% |
| ||||||
| 80,544 | Altria Group, Inc. | 2,818,234 | ||||||
| 12,555 | Kraft Foods Group, Inc. | 701,448 | ||||||
| 52,533 | Mead Johnson Nutrition Co. | 4,162,190 | ||||||
| 50,228 | Mondelez International, Inc. Class A | 1,433,005 | ||||||
| 85,835 | Philip Morris International, Inc. | 7,435,028 | ||||||
| 74,537 | Tyson Foods, Inc. Class A | 1,914,110 | ||||||
|
| |||||||
| 18,464,015 | ||||||||
|
| |||||||
| Health Care Equipment & Services – 5.0% |
| ||||||
| 148,848 | Abbott Laboratories | 5,191,818 | ||||||
| 167,279 | Boston Scientific Corp.* | 1,550,676 | ||||||
| 14,285 | Edwards Lifesciences Corp.* | 959,952 | ||||||
| 25,742 | Humana, Inc. | 2,172,110 | ||||||
| 101,282 | Medtronic, Inc. | 5,212,985 | ||||||
| 92,631 | St. Jude Medical, Inc. | 4,226,753 | ||||||
|
| |||||||
| 19,314,294 | ||||||||
|
| |||||||
| Household & Personal Products – 0.7% |
| ||||||
| 43,748 | Nu Skin Enterprises, Inc. Class A | 2,673,878 | ||||||
|
| |||||||
| Insurance – 3.7% |
| ||||||
| 81,103 | Aflac, Inc. | 4,713,706 | ||||||
| 107,673 | MetLife, Inc. | 4,927,117 | ||||||
| 66,831 | Prudential Financial, Inc. | 4,880,668 | ||||||
|
| |||||||
| 14,521,491 | ||||||||
|
| |||||||
| Materials – 3.5% |
| ||||||
| 167,325 | Alcoa, Inc. | 1,308,482 | ||||||
| 32,623 | LyondellBasell Industries NV Class A | 2,161,600 | ||||||
| 19,328 | PPG Industries, Inc. | 2,829,812 | ||||||
| 12,659 | Reliance Steel & Aluminum Co. | 829,924 | ||||||
| 23,513 | The Sherwin-Williams Co. | 4,152,396 | ||||||
| 36,301 | The Valspar Corp. | 2,347,586 | ||||||
|
| |||||||
| 13,629,800 | ||||||||
|
| |||||||
| Media – 2.8% |
| ||||||
| 8,418 | Cinemark Holdings, Inc. | 235,030 | ||||||
| 51,414 | Comcast Corp. Class A | 2,082,748 | ||||||
|
| |||||||
| The accompanying notes are an integral part of these financial statements. | 7 |
GOLDMAN SACHS VARIABLE INSURANCE TRUST STRUCTURED U.S. EQUITY FUND
Schedule of Investments (continued)
June 30, 2013 (Unaudited)
| Shares | Description | Value | ||||||
| Common Stocks – (continued) | ||||||||
| Media – (continued) |
| ||||||
| 116,488 | News Corp. Class A | $ | 3,797,509 | |||||
| 70,595 | Viacom, Inc. Class B | 4,803,990 | ||||||
|
| |||||||
| 10,919,277 | ||||||||
|
| |||||||
| Pharmaceuticals, Biotechnology & Life Sciences – 9.9% |
| ||||||
| 76,654 | AbbVie, Inc. | 3,168,876 | ||||||
| 48,003 | Alexion Pharmaceuticals, Inc.* | 4,427,797 | ||||||
| 36,197 | Allergan, Inc. | 3,049,235 | ||||||
| 22,394 | Biogen Idec, Inc.* | 4,819,189 | ||||||
| 22,595 | Celgene Corp.* | 2,641,581 | ||||||
| 22,279 | Eli Lilly & Co. | 1,094,345 | ||||||
| 33,500 | Johnson & Johnson | 2,876,310 | ||||||
| 164,040 | Merck & Co., Inc. | 7,619,658 | ||||||
| 317,915 | Pfizer, Inc. | 8,904,799 | ||||||
|
| |||||||
| 38,601,790 | ||||||||
|
| |||||||
| Real Estate Investment Trust – 3.5% |
| ||||||
| 59,665 | American Tower Corp. | 4,365,688 | ||||||
| 4,600 | Apartment Investment & Management Co. Class A | 138,184 | ||||||
| 74,134 | Equity Residential | 4,304,220 | ||||||
| 5,697 | Public Storage | 873,521 | ||||||
| 31,649 | Taubman Centers, Inc. | 2,378,422 | ||||||
| 21,182 | Vornado Realty Trust | 1,754,929 | ||||||
|
| |||||||
| 13,814,964 | ||||||||
|
| |||||||
| Retailing – 6.9% |
| ||||||
| 106,884 | American Eagle Outfitters, Inc. | 1,951,702 | ||||||
| 55,282 | Expedia, Inc. | 3,325,212 | ||||||
| 65,842 | GameStop Corp. Class A(a) | 2,767,339 | ||||||
| 37,711 | L Brands, Inc. | 1,857,267 | ||||||
| 91,037 | Lowe’s Companies, Inc. | 3,723,413 | ||||||
| 37,287 | O’Reilly Automotive, Inc.* | 4,199,262 | ||||||
| 2,977 | Priceline.com, Inc.* | 2,462,366 | ||||||
| 57,666 | Target Corp. | 3,970,881 | ||||||
| 50,335 | The Gap, Inc. | 2,100,480 | ||||||
| 17,788 | Urban Outfitters, Inc.* | 715,433 | ||||||
|
| |||||||
| 27,073,355 | ||||||||
|
| |||||||
| Semiconductors & Semiconductor Equipment – 0.2% |
| ||||||
| 2,320 | KLA-Tencor Corp. | 129,293 | ||||||
| 48,649 | LSI Corp.* | 347,354 | ||||||
| 9,409 | NXP Semiconductor NV* | 291,491 | ||||||
|
| |||||||
| 768,138 | ||||||||
|
| |||||||
| Software & Services – 11.2% |
| ||||||
| 133,753 | Activision Blizzard, Inc. | 1,907,318 | ||||||
| 38,797 | AOL, Inc.* | 1,415,315 | ||||||
| 35,318 | CoreLogic, Inc.* | 818,318 | ||||||
| 106,603 | eBay, Inc.* | 5,513,507 | ||||||
| 6,366 | Electronic Arts, Inc.* | 146,227 | ||||||
| 11,621 | Google, Inc. Class A* | 10,230,780 | ||||||
| 48,091 | International Business Machines Corp. | 9,190,671 | ||||||
| 7,419 | Mastercard, Inc. Class A | 4,262,215 | ||||||
| 166,026 | Microsoft Corp. | 5,732,878 | ||||||
|
| |||||||
| Common Stocks – (continued) | ||||||||
| Software & Services – (continued) |
| ||||||
| 85,241 | Oracle Corp. | $ | 2,618,603 | |||||
| 25,466 | Symantec Corp. | 572,221 | ||||||
| 20,998 | VMware, Inc. Class A* | 1,406,656 | ||||||
|
| |||||||
| 43,814,709 | ||||||||
|
| |||||||
| Technology Hardware & Equipment – 4.3% |
| ||||||
| 22,746 | Apple, Inc. | 9,009,236 | ||||||
| 12,887 | AVX Corp. | 151,422 | ||||||
| 304,385 | Corning, Inc. | 4,331,399 | ||||||
| 17,788 | Flextronics International Ltd.* | 137,679 | ||||||
| 15,024 | Polycom, Inc.* | 158,353 | ||||||
| 30,436 | Western Digital Corp. | 1,889,771 | ||||||
| 137,697 | Xerox Corp. | 1,248,912 | ||||||
|
| |||||||
| 16,926,772 | ||||||||
|
| |||||||
| Telecommunication Services – 2.4% |
| ||||||
| 259,460 | AT&T, Inc. | 9,184,884 | ||||||
|
| |||||||
| Transportation – 1.6% |
| ||||||
| 78,998 | Delta Air Lines, Inc.* | 1,478,053 | ||||||
| 28,911 | FedEx Corp. | 2,850,046 | ||||||
| 21,701 | United Parcel Service, Inc. Class B | 1,876,702 | ||||||
|
| |||||||
| 6,204,801 | ||||||||
|
| |||||||
| Utilities – 0.3% |
| ||||||
| 107,404 | AES Corp. | 1,287,774 | ||||||
|
| |||||||
| | TOTAL INVESTMENTS BEFORE SECURITIES LENDING REINVESTMENT VEHICLE | | ||||||
| (Cost $348,632,317) | $ | 377,872,419 | ||||||
|
| |||||||
| Shares | Rate | Value | ||||||
| Securities Lending Reinvestment Vehicle(b)(c) – 1.1% | ||||||||
Goldman Sachs Financial Square Money Market Fund — |
| |||||||
| 4,230,275 | 0.069 | % | $ | 4,230,275 | ||||
| (Cost $4,230,275) | ||||||||
| ||||||||
| TOTAL INVESTMENTS – 98.0% | ||||||||
| (Cost $352,862,592) | $ | 382,102,694 | ||||||
| ||||||||
OTHER ASSETS IN EXCESS OF LIABILITIES – 2.0% |
| 7,764,929 | ||||||
| ||||||||
| NET ASSETS – 100.0% | $ | 389,867,623 | ||||||
| ||||||||
| The percentage shown for each investment category reflects the value of investments in that category as a percentage of net assets. | ||
| * | Non-income producing security. | |
| (a) | All or a portion of security is on loan. | |
| (b) | Variable rate security. Interest rate disclosed is that which is in effect at June 30, 2013. | |
| (c) | Represents an affiliated issuer. | |
| 8 | The accompanying notes are an integral part of these financial statements. |
GOLDMAN SACHS VARIABLE INSURANCE TRUST STRUCTURED U.S. EQUITY FUND
Statement of Assets and Liabilities
June 30, 2013 (Unaudited)
| Assets: | ||||
Investments in unaffiliated issuers, at value (cost $348,632,317)(a) | $ | 377,872,419 | ||
Investments in affiliated securities lending reinvestment vehicle, at value which equals cost | 4,230,275 | |||
Cash | 12,470,484 | |||
Receivables: | ||||
Dividends | 483,406 | |||
Fund shares sold | 206,850 | |||
Reimbursement from investment adviser | 21,344 | |||
Securities lending income | 2,130 | |||
Other assets | 1,919 | |||
| Total assets | 395,288,827 | |||
| Liabilities: | ||||
Payables: | ||||
Payable upon return of securities loaned | 4,230,275 | |||
Fund shares redeemed | 288,684 | |||
Amounts owed to affiliates | 223,022 | |||
Accrued expenses and other liabilities | 679,223 | |||
| Total liabilities | 5,421,204 | |||
| Net Assets: | ||||
Paid-in capital | 450,289,796 | |||
Undistributed net investment income | 3,141,838 | |||
Accumulated net realized loss | (92,804,113 | ) | ||
Net unrealized gain | 29,240,102 | |||
| NET ASSETS | $ | 389,867,623 | ||
Net Assets: | ||||
Institutional | $ | 280,521,071 | ||
Service | 109,346,552 | |||
Total Net Assets | $ | 389,867,623 | ||
Shares of beneficial interest outstanding $0.001 par value (unlimited shares authorized): | ||||
Institutional | 19,986,138 | |||
Service | 7,783,720 | |||
Net asset value, offering and redemption price per share: | ||||
Institutional | $14.04 | |||
Service | 14.05 | |||
(a) Includes loaned securities having a market value of $4,192,719.
| The accompanying notes are an integral part of these financial statements. | 9 |
GOLDMAN SACHS VARIABLE INSURANCE TRUST STRUCTURED U.S. EQUITY FUND
Statement of Operations
For the Six Months Ended June 30, 2013 (Unaudited)
| Investment income: | ||||
Dividends (net of foreign taxes withheld of $5,324) | $ | 3,897,863 | ||
Securities lending income — affiliated issuer | 52,185 | |||
| Total investment income | 3,950,048 | |||
| Expenses: | ||||
Management fees | 1,197,020 | |||
Distribution and Service fees — Service Class | 133,922 | |||
Printing and mailing costs | 38,689 | |||
Transfer Agent fees(a) | 38,610 | |||
Professional fees | 37,271 | |||
Custody, accounting and administrative services | 35,925 | |||
Trustee fees | 8,515 | |||
Other | 7,355 | |||
| Total expenses | 1,497,307 | |||
Less — expense reductions | (145,854 | ) | ||
| Net expenses | 1,351,453 | |||
| NET INVESTMENT INCOME | 2,598,595 | |||
| Realized and unrealized gain (loss): | ||||
Net realized gain from: | ||||
Investments | 61,260,985 | |||
Futures contracts | 883,398 | |||
Net change in unrealized gain (loss) on: | ||||
Investments | (9,235,957 | ) | ||
Futures contracts | 34,739 | |||
| Net realized and unrealized gain | 52,943,165 | |||
| NET INCREASE IN NET ASSETS RESULTING FROM OPERATIONS | $ | 55,541,760 | ||
(a) Institutional and Service Shares had Transfer Agent fees of $27,897 and $10,713, respectively.
| 10 | The accompanying notes are an integral part of these financial statements. |
GOLDMAN SACHS VARIABLE INSURANCE TRUST STRUCTURED U.S. EQUITY FUND
Statements of Changes in Net Assets
For the Six Months Ended June 30, 2013 | For the Fiscal Year Ended December 31, 2012 | |||||||
| From operations: | ||||||||
Net investment income | $ | 2,598,595 | $ | 6,247,909 | ||||
Net realized gain (includes payment by affiliate relating to certain investment transactions) | 62,144,383 | 57,069,546 | ||||||
Net change in unrealized loss | (9,201,218 | ) | (12,263,199 | ) | ||||
| Net increase in net assets resulting from operations | 55,541,760 | 51,054,256 | ||||||
| Distributions to shareholders: | ||||||||
From net investment income | ||||||||
Institutional Shares | — | (4,750,506 | ) | |||||
Service Shares | — | (1,549,712 | ) | |||||
| Total distributions to shareholders | — | (6,300,218 | ) | |||||
| From share transactions: | ||||||||
Proceeds from sales of shares | 4,016,668 | 6,578,493 | ||||||
Reinvestment of distributions | — | 6,300,218 | ||||||
Cost of shares redeemed | (32,341,741 | ) | (68,247,499 | ) | ||||
| Net decrease in net assets resulting from share transactions | (28,325,073 | ) | (55,368,788 | ) | ||||
| TOTAL INCREASE (DECREASE) | 27,216,687 | (10,614,750 | ) | |||||
| Net assets: | ||||||||
Beginning of period | 362,650,936 | 373,265,686 | ||||||
End of period | $ | 389,867,623 | $ | 362,650,936 | ||||
| Undistributed net investment income | $ | 3,141,838 | $ | 543,243 | ||||
| The accompanying notes are an integral part of these financial statements. | 11 |
GOLDMAN SACHS VARIABLE INSURANCE TRUST STRUCTURED U.S. EQUITY FUND
Financial Highlights
Selected Data for a Share Outstanding Throughout Each Period
| Income (loss) from investment operations | Distributions to shareholders | |||||||||||||||||||||||||||||||||||||||||||||||||||||||
| Year - Share Class | Net asset value, beginning of period | Net investment income(a) | Net realized and unrealized gain (loss) | Total from investment operations | From net investment income | From net realized gains | Total distributions | Net asset value, end of period | Total return(b) | Net assets, period (in 000s) | Ratio of net expenses to average net assets | Ratio of total expenses to average net assets | Ratio of to average net assets | Portfolio turnover rate(c) | ||||||||||||||||||||||||||||||||||||||||||
FOR THE SIX MONTHS ENDED JUNE 30, (UNAUDITED) | ||||||||||||||||||||||||||||||||||||||||||||||||||||||||
2013 - Institutional | $ | 12.14 | $ | 0.09 | $ | 1.81 | $ | 1.90 | $ | — | $ | — | $ | — | $ | 14.04 | 15.65 | % | $ | 280,521 | 0.64 | %(d) | 0.71 | %(d) | 1.40 | %(d) | 101 | % | ||||||||||||||||||||||||||||
2013 - Service | 12.16 | 0.08 | 1.81 | 1.89 | — | — | — | 14.05 | 15.54 | 109,347 | 0.85 | (d) | 0.96 | (d) | 1.19 | (d) | 101 | |||||||||||||||||||||||||||||||||||||||
FOR THE FISCAL YEARS ENDED DECEMBER 31, | ||||||||||||||||||||||||||||||||||||||||||||||||||||||||
2012 - Institutional | 10.80 | 0.20 | 1.36 | (e) | 1.56 | (0.22 | ) | — | (0.22 | ) | 12.14 | 14.42 | (e) | 262,759 | 0.64 | 0.72 | 1.71 | 134 | ||||||||||||||||||||||||||||||||||||||
2012 - Service | 10.82 | 0.18 | 1.35 | (e) | 1.53 | (0.19 | ) | — | (0.19 | ) | 12.16 | 14.10 | (e) | 99,892 | 0.85 | 0.97 | 1.51 | 134 | ||||||||||||||||||||||||||||||||||||||
2011 - Institutional | 10.57 | 0.18 | (f) | 0.25 | 0.43 | (0.20 | ) | — | (0.20 | ) | 10.80 | 4.05 | 273,555 | 0.64 | 0.70 | 1.69 | (f) | 51 | ||||||||||||||||||||||||||||||||||||||
2011 - Service | 10.58 | 0.16 | (f) | 0.25 | 0.41 | (0.17 | ) | — | (0.17 | ) | 10.82 | 3.90 | 99,711 | 0.85 | 0.95 | 1.48 | (f) | 51 | ||||||||||||||||||||||||||||||||||||||
2010 - Institutional | 9.50 | 0.14 | 1.08 | 1.22 | (0.15 | ) | — | (0.15 | ) | 10.57 | 12.84 | 319,948 | 0.64 | 0.70 | 1.45 | 38 | ||||||||||||||||||||||||||||||||||||||||
2010 - Service | 9.51 | 0.12 | 1.08 | 1.20 | (0.13 | ) | — | (0.13 | ) | 10.58 | 12.60 | 111,171 | 0.85 | 0.95 | 1.25 | 38 | ||||||||||||||||||||||||||||||||||||||||
2009 - Institutional | 7.99 | 0.15 | 1.54 | 1.69 | (0.18 | ) | — | (0.18 | ) | 9.50 | 21.15 | 340,536 | 0.68 | 0.72 | 1.75 | 136 | ||||||||||||||||||||||||||||||||||||||||
2009 - Service | 8.00 | 0.13 | 1.54 | 1.67 | (0.16 | ) | — | (0.16 | ) | 9.51 | 20.89 | 112,530 | 0.89 | 0.97 | 1.53 | 136 | ||||||||||||||||||||||||||||||||||||||||
2008 - Institutional | 13.16 | 0.17 | (5.06 | ) | (4.89 | ) | (0.18 | ) | (0.10 | ) | (0.28 | ) | 7.99 | (36.92 | ) | 344,144 | 0.71 | 0.72 | 1.53 | 110 | ||||||||||||||||||||||||||||||||||||
2008 - Service | 13.16 | 0.14 | (5.04 | ) | (4.90 | ) | (0.16 | ) | (0.10 | ) | (0.26 | ) | 8.00 | (37.05 | ) | 106,586 | 0.92 | 0.97 | 1.34 | 110 | ||||||||||||||||||||||||||||||||||||
| (a) | Calculated based on the average shares outstanding methodology. |
| (b) | Assumes investment at the net asset value at the beginning of the period, reinvestment of all distributions, and a complete redemption of the investment at the net asset value at the end of the period. Total returns for periods less than one full year are not annualized. |
| (c) | The Fund's portfolio turnover rate is calculated in accordance with regulatory requirements, without regard to transactions involving short term investments and certain derivatives. If such transactions were included, the Fund's portfolio turnover rate may be higher. |
| (d) | Annualized. |
| (e) | Reflects payment from affiliate relating to certain investment transactions which amounted to $0.01 per share and 0.07% of average net assets. Excluding such payment, the total return would have been 14.32% and 14.01%, respectively. |
| (f) | Reflects income recognized from special dividends which amounted to $0.02 per share and 0.17% of average net assets. |
| The accompanying notes are an integral part of these financial statements. | 12 |
GOLDMAN SACHS VARIABLE INSURANCE TRUST STRUCTURED U.S. EQUITY FUND
Notes to Financial Statements
June 30, 2013 (Unaudited)
1. ORGANIZATION
Goldman Sachs Variable Insurance Trust (the “Trust” or “VIT”) is a Delaware statutory trust registered under the Investment Company Act of 1940, as amended (the “Act”), as an open-end management investment company. The Trust includes the Goldman Sachs Structured U.S. Equity Fund (the “Fund”). The Fund is a diversified portfolio under the Act offering two classes of shares — Institutional and Service Shares. Shares of the Trust are offered to separate accounts of participating life insurance companies for the purpose of funding variable annuity contracts and variable life insurance policies.
Goldman Sachs Asset Management, L.P. (“GSAM”), an affiliate of Goldman, Sachs & Co. (“Goldman Sachs”), serves as investment adviser to the Fund pursuant to a management agreement (the “Agreement”) with the Trust.
2. SIGNIFICANT ACCOUNTING POLICIES
The financial statements have been prepared in accordance with accounting principles generally accepted in the United States of America (“GAAP”) and require management to make estimates and assumptions that may affect the reported amounts and disclosures. Actual results may differ from those estimates and assumptions.
A. Investment Valuation — The Fund’s valuation policy is to value investments at fair value.
B. Investment Income and Investments — Investment income includes interest income and dividend income, net of any foreign withholding taxes, less any amounts reclaimable. Interest income is accrued daily and adjusted for amortization of premiums and accretion of discounts. Dividend income is recognized on ex-dividend date or, for certain foreign securities, as soon as such information is obtained subsequent to the ex-dividend date. Investment transactions are reflected on trade date. Realized gains and losses are calculated using identified cost. Investment transactions are recorded on the following business day for daily net asset value (“NAV”) calculations. Any foreign capital gains tax is accrued daily based upon net unrealized gains, and is payable upon sale of such investments. Distributions received from the Fund’s investments in United States (“U.S.”) real estate investment trusts (“REITs”) may be characterized as ordinary income, net capital gain or a return of capital. A return of capital is recorded by the Fund as a reduction to the cost basis of the REIT.
For derivative contracts, realized gains and losses are recorded upon settlement of the contract.
C. Class Allocations and Expenses — Investment income, realized and unrealized gain (loss), and non-class specific expenses of each Fund are allocated daily based upon the proportion of net assets of each class. Class specific expenses, where applicable, are borne by the respective share classes and include Distribution and Service and Transfer Agent fees. Non-class specific expenses directly incurred by a Fund are charged to that Fund, while such expenses incurred by the Trust are allocated across the respective Funds on a straight-line and/or pro-rata basis depending upon the nature of the expenses.
D. Federal Taxes and Distributions to Shareholders — It is the Fund’s policy to comply with the requirements of the Internal Revenue Code of 1986, as amended (the “Code”), applicable to regulated investment companies (mutual funds) and to distribute each year substantially all of its investment company taxable income and capital gains to its shareholders. Accordingly, the Fund is not required to make any provisions for the payment of federal income tax. Distributions to shareholders are recorded on the ex-dividend date. Income and capital gains distributions, if any, are declared and paid annually.
Net capital losses are carried forward to future fiscal years and may be used to the extent allowed by the Code to offset any future capital gains. Utilization of capital loss carryforwards will reduce the requirement of future capital gains distributions.
Under the Regulated Investment Company Modernization Act of 2010, the Fund is permitted to carry forward capital losses incurred in taxable years beginning after December 22, 2010 for an unlimited period. However, any losses incurred during those future taxable years will be required to be utilized prior to the losses incurred in pre-enactment taxable years. As a result of this ordering rule, pre-enactment capital loss carryforwards may be more likely to expire unused. Additionally, post-enactment capital
13
GOLDMAN SACHS VARIABLE INSURANCE TRUST STRUCTURED U.S. EQUITY FUND
Notes to Financial Statements (continued)
June 30, 2013 (Unaudited)
2. SIGNIFICANT ACCOUNTING POLICIES (continued)
losses that are carried forward will retain their character as either short-term or long-term capital losses rather than being considered all short-term as under previous law.
The characterization of distributions to shareholders for financial reporting purposes is determined in accordance with federal income tax rules, which may differ from GAAP. The source of the Fund’s distributions may be shown in the accompanying financial statements as either from net investment income, net realized gain or capital. Certain components of the Fund’s net assets on the Statement of Assets and Liabilities reflect permanent GAAP/tax differences based on the appropriate tax character.
3. INVESTMENTS AND FAIR VALUE MEASUREMENTS
The fair value of a financial instrument is the amount that would be received to sell an asset or paid to transfer a liability in an orderly transaction between market participants at the measurement date (i.e., the exit price). GAAP establishes a fair value hierarchy that prioritizes the inputs to valuation techniques used to measure fair value. The hierarchy gives the highest priority to unadjusted quoted prices in active markets for identical assets or liabilities (Level 1 measurements) and the lowest priority to unobservable inputs (Level 3 measurements). The levels used for classifying investments are not necessarily an indication of the risk associated with investing in these investments. The three levels of the fair value hierarchy are described below:
Level 1 — Unadjusted quoted prices in active markets that are accessible at the measurement date for identical, unrestricted assets or liabilities;
Level 2 — Quoted prices in markets that are not active or financial instruments for which significant inputs are observable (including, but not limited to, quoted prices for similar investments, interest rates, foreign exchange rates, volatility and credit spreads), either directly or indirectly;
Level 3 — Prices or valuations that require significant unobservable inputs (including GSAM’s assumptions in determining fair value measurement).
The Trustees have adopted Valuation Procedures that govern the valuation of the portfolio investments held by the Fund, including investments for which market quotations are not readily available. The Trustees have delegated to GSAM day-to-day responsibility for implementing and maintaining internal controls and procedures related to the valuation of the Fund’s portfolio investments. To assess the continuing appropriateness of pricing sources and methodologies, GSAM regularly performs price verification procedures and issues challenges as necessary to third party pricing vendors or brokers, and any differences are reviewed in accordance with the Valuation Procedures.
A. Level 1 and Level 2 Fair Value Investments — The valuation techniques and significant inputs used in determining the fair values for investments classified as Level 1 and Level 2 are as follows:
Equity Securities — Equity securities and investment companies traded on a U.S. securities exchange or the NASDAQ system, or those located on certain foreign exchanges, including but not limited to the Americas, are valued daily at their last sale price or official closing price on the principal exchange or system on which they are traded. If no sale occurs, equity securities and exchange traded investment companies are valued at the last bid price for long positions and at the last ask price for short positions. Investments in investment companies (other than those that are exchange traded) are valued at the NAV on the valuation date. To the extent these investments are actively traded, they are classified as Level 1 of the fair value hierarchy.
Unlisted equity securities for which market quotations are available are valued at the last sale price on the valuation date, or if no sale occurs, at the last bid price. Securities traded on certain foreign securities exchanges are valued daily at fair value determined by an independent fair value service (if available) under Valuation Procedures approved by the Trustees and consistent with applicable regulatory guidance. The independent fair value service takes into account multiple factors including, but not limited to, movements in the securities markets, certain depositary receipts, futures contracts and foreign currency exchange rates that have occurred subsequent to the close of the foreign securities exchange. These investments are generally classified as Level 2 of the fair value hierarchy.
14
GOLDMAN SACHS VARIABLE INSURANCE TRUST STRUCTURED U.S. EQUITY FUND
3. INVESTMENTS AND FAIR VALUE MEASUREMENTS (continued)
Debt Securities — Debt securities for which market quotations are readily available are valued daily on the basis of quotations supplied by dealers or an independent pricing service approved by the Trustees. The pricing services may use valuation models or matrix pricing, which consider: (i) yield or price with respect to bonds that are considered comparable in characteristics such as rating, interest rate and maturity date or (ii) quotations from securities dealers to determine current value. Short-term debt obligations that mature in sixty days or less and that do not exhibit signs of credit deterioration are valued at amortized cost, which approximates fair value. With the exception of treasury securities, which are generally classified as Level 1, these investments are generally classified as Level 2 of the fair value hierarchy.
Derivative Contracts — A derivative is an instrument whose value is derived from underlying assets, indices, reference rates or a combination of these factors.
Exchange-traded derivatives, including futures contracts, typically fall within Level 1 of the fair value hierarchy. Over-the-counter (“OTC”) derivatives are valued using market transactions and other market evidence, including market-based inputs to models, calibration to market-clearing transactions, broker or dealer quotations, or other alternative pricing sources. Where models are used, the selection of a particular model to value an OTC derivative depends upon the contractual terms of, and specific risks inherent in, the instrument, as well as the availability of pricing information in the market. Valuation models require a variety of inputs, including contractual terms, market prices, yield curves, credit curves, measures of volatility, voluntary and involuntary prepayment rates, loss severity rates and correlations of such inputs. For OTC derivatives that trade in liquid markets, model inputs can generally be verified and model selection does not involve significant management judgment. OTC derivatives are classified within Level 2 of the fair value hierarchy when significant inputs are corroborated by market evidence.
i. Futures Contracts — Futures contracts are contracts to buy or sell a standardized quantity of a specified commodity or security and are valued based on exchanged settlement prices or independent market quotes. Futures contracts are valued at the last settlement price, or in the absence of a sale, the last bid price for long positions and at the last ask price for short positions, at the end of each day on the board of trade or exchange upon which they are traded. Upon entering into a futures contract, a Fund deposits cash or securities in an account on behalf of the broker in an amount sufficient to meet the initial margin requirement. Subsequent payments are made or received by the Fund equal to the daily change in the contract value and are recorded as variation margin receivable or payable with a corresponding offset to unrealized gains or losses.
B. Level 3 Fair Value Investments — To the extent that the aforementioned significant inputs are unobservable, or if quotations are not readily available, or if GSAM believes that such quotations do not accurately reflect fair value, the fair value of the Fund’s investments may be determined under Valuation Procedures approved by the Trustees. GSAM, consistent with its procedures and applicable regulatory guidance, may make an adjustment to the most recent valuation prices of either domestic or foreign securities in light of significant events to reflect what it believes to be the fair value of the securities at the time of determining a Fund’s NAV. Significant events which could affect a large number of securities in a particular market may include, but are not limited to: significant fluctuations in U.S. or foreign markets; market dislocations; market disruptions; or unscheduled market closings. Significant events which could also affect a single issuer may include, but are not limited to: corporate actions such as reorganizations, mergers and buy-outs; ratings downgrades; and bankruptcies.
C. Fair Value Hierarchy — The following is a summary of the Fund’s investments and derivatives classified in the fair value hierarchy as of June 30, 2013:
| Investment Type | Level 1 | Level 2 | Level 3 | |||||||||
| Assets | ||||||||||||
| Common Stock and/or Other Equity Investments | $ | 377,872,419 | $ | — | $ | — | ||||||
| Securities Lending Reinvestment Vehicle | 4,230,275 | — | — | |||||||||
| Total | $ | 382,102,694 | $ | — | $ | — | ||||||
For further information regarding security characteristics, see the Schedule of Investments.
15
GOLDMAN SACHS VARIABLE INSURANCE TRUST STRUCTURED U.S. EQUITY FUND
Notes to Financial Statements (continued)
June 30, 2013 (Unaudited)
4. INVESTMENTS IN DERIVATIVES
The following table sets forth, by certain risk types, the Fund’s gains (losses) related to these derivatives and their indicative volumes for the six months ended June 30, 2013. These instruments were used to meet the Fund’s investment objectives and to obtain and/or manage exposure related to the risks below. These gains (losses) should be considered in the context that these derivative contracts may have been executed to economically hedge certain investments, and accordingly, certain gains (losses) on such derivative contracts may offset certain (losses) gains attributable to investments. These gains (losses) are included in “Net realized gain (loss)” or “Net change in unrealized gain (loss)” on the Statement of Operations:
| Risk | Statement of Operations | Net Realized Gain (Loss) | Net Change in Unrealized Gain (Loss) | Average Number of Contracts(a) | ||||||||||
| Equity | Net realized gain (loss) from futures contracts/Net change in unrealized gain (loss) on futures contracts | $ | 883,398 | $ | 34,739 | 68 | ||||||||
| (a) | Average number of contracts is based on the average of month end balances for the six months ended June 30, 2013. |
5. AGREEMENTS AND AFFILIATED TRANSACTIONS
A. Management Agreement — Under the Agreement, GSAM manages the Fund, subject to the general supervision of the Trustees.
As compensation for the services rendered pursuant to the Agreement, the assumption of the expenses related thereto and administration of the Fund’s business affairs, including providing facilities, GSAM is entitled to a management fee, accrued daily and paid monthly, equal to an annual percentage rate of the Fund’s average daily net assets.
For the six months ended June 30, 2013, contractual management fees with GSAM were at the following rates:
| Contractual Management Fee Rate | ||||||||||||||||||||||
First $1 billion | Next $1 billion | Next $3 billion | Next $3 billion | Over $8 billion | Effective Rate | |||||||||||||||||
| 0.62% | 0.59 | % | 0.56 | % | 0.55 | % | 0.54 | % | 0.62 | % | ||||||||||||
B. Distribution and Service Plan — The Trust, on behalf of the Service Shares of the Fund, has adopted a Distribution and Service Plan (the “Plan”). Under the Plan, Goldman Sachs, which serves as distributor (the “Distributor”), is entitled to a fee accrued daily and paid monthly for distribution services and personal and account maintenance services, which may then be paid by Goldman Sachs to authorized dealers, equal to, on an annual basis, 0.25% of the Fund’s average daily net assets attributable to Service Shares. Goldman Sachs has agreed to waive distribution and service fees so as not to exceed an annual rate of 0.21% of the Fund’s average daily net assets attributable to Service Shares. The distribution and service fee waiver will remain in place through at least April 30, 2014, and prior to such date Goldman Sachs may not terminate the arrangement without the approval of the Trustees. For the six months ended June 30, 2013, Goldman Sachs waived $21,428 in distribution and service fees for the Fund’s Services Shares.
C. Transfer Agency Agreement — Goldman Sachs also serves as the transfer agent of the Fund for a fee pursuant to Transfer Agency Agreement. The fees charged for such transfer agency services are accrued daily and paid monthly at an annual rate of 0.02% of the average daily net assets of Institutional and Service Shares.
D. Other Expense Agreements and Affiliated Transactions — GSAM has agreed to limit certain “Other Expense” of the Fund (excluding transfer agent fees and expenses, taxes, interest, brokerage fees, litigation, indemnification, shareholder meeting and other extraordinary expenses) to the extent such expenses exceed, on an annual basis, a percentage rate of the average daily net assets of the Fund. Such Other Expense reimbursements, if any, are accrued daily and paid monthly. In addition, the Fund is not
16
GOLDMAN SACHS VARIABLE INSURANCE TRUST STRUCTURED U.S. EQUITY FUND
5. AGREEMENTS AND AFFILIATED TRANSACTIONS (continued)
obligated to reimburse GSAM for prior fiscal year expense reimbursements, if any. The Other Expense limitation as an annual percentage rate of average daily net assets for the Fund is 0.004%. This Other Expense limitation will remain in place through at least April 30, 2014, and prior to such date GSAM may not terminate the arrangement without the approval of the Trustees. For the six months ended June 30, 2013, GSAM reimbursed $120,025 to the Fund. In addition, the Fund has entered into certain offset arrangements with the custodian and the transfer agent, which may result in a reduction of the Fund’s expenses and are received irrespective of the application of the “Other Expense” limitation described above. For the six months ended June 30, 2013, custody fee credits were $4,401.
As of June 30, 2013, the amounts owed to affiliates of the Fund were $201,253, $15,278, and $6,491 for management, distribution and service, and transfer agent fees, respectively.
E. Line of Credit Facility — As of June 30, 2013, the Fund participated in a $780,000,000 committed, unsecured revolving line of credit facility (the “facility”) together with other funds of the Trust and registered investment companies having management agreements with GSAM or its affiliates (“Other Borrowers”). Pursuant to the terms of the facility, the Fund and Other Borrowers could increase the credit amount by an additional $220,000,000, for a total of up to $1,000,000,000. This facility is to be used solely for temporary or emergency purposes, which may include the funding of redemptions. The interest rate on borrowings is based on the federal funds rate. The facility also requires a fee to be paid by the Fund based on the amount of the commitment that has not been utilized. For the six months ended June 30, 2013, the Fund did not have any borrowings under the facility. Prior to May 8, 2013, the committed amount available through the facility was $630,000,000.
F. Other Transactions with Affiliates — For the six months ended June 30, 2013, Goldman Sachs earned $590, in brokerage commissions from portfolio transactions, including futures transactions executed with Goldman Sachs as the Futures Commission Merchant, on behalf of the Fund.
On October 1, 2012, GSAM reimbursed the Fund in the amount of $253,295 to rectify a data issue in its portfolio management decision making process.
6. PORTFOLIO SECURITIES TRANSACTIONS
The cost of purchases and proceeds from sales and maturities of long-term securities for the six months ended June 30, 2013, were $381,289,404 and $409,812,320, respectively.
7. SECURITIES LENDING
Pursuant to exemptive relief granted by the Securities and Exchange Commission (“SEC”) and the terms and conditions contained therein, the Fund, may lend its securities through a securities lending agent, Goldman Sachs Agency Lending (“GSAL”), a wholly-owned subsidiary of Goldman Sachs, to certain qualified borrowers including Goldman Sachs and affiliates. In accordance with the Fund’s securities lending procedures, the Fund receives cash collateral at least equal to the market value of the securities on loan. The market value of the loaned securities is determined at the close of business of the Fund at their last sale price or official closing price on the principal exchange or system on which they are traded, and any additional required collateral is delivered to the Fund on the next business day. As with other extensions of credit, the Fund may experience delay in the recovery of its securities or incur a loss should the borrower of the securities breach its agreement with the Fund or become insolvent at a time when the collateral is insufficient to cover the cost of repurchasing securities on loan. Dividend income received from securities on loan may not be subject to withholding taxes and therefore withholding taxes paid may differ from the amounts listed in the Statement of Operations.
The Fund invests the cash collateral received in connection with securities lending transactions in the Goldman Sachs Financial Square Money Market Fund (“Money Market Fund”), a series of the Goldman Sachs Trust, a Delaware statutory trust. The Money Market Fund, deemed an affiliate of the Trust, is registered under the Act as an open end investment company, is
17
GOLDMAN SACHS VARIABLE INSURANCE TRUST STRUCTURED U.S. EQUITY FUND
Notes to Financial Statements (continued)
June 30, 2013 (Unaudited)
7. SECURITIES LENDING (continued)
subject to Rule 2a-7 under the Act, and is managed by GSAM, for which GSAM may receive an investment advisory fee of up to 0.205% on an annualized basis of the average daily net assets of the Money Market Fund.
In December 2011, the Financial Accounting Standards Board (“FASB”) issued an Accounting Standards Update (“ASU”) No. 2011-11: Disclosures about Offsetting Assets and Liabilities (“netting”) on the Statement of Assets and Liabilities that are subject to master netting arrangements or similar agreements. ASU 2011-11 was amended by ASU No. 2013-01, clarifying which investments and transactions are subject to the netting disclosure. The scope of the disclosure requirements is limited to derivative instruments, repurchase agreements and reverse repurchase agreements, and securities borrowing and securities lending transactions. This information is intended to enable users of the Fund’s financial statements to evaluate the effect or potential effect of netting arrangements on the Fund’s financial position. The ASU is effective for financial statements with fiscal years beginning on or after January 1, 2013, and interim periods within those fiscal years. The Fund adopted the disclosure requirement on netting for the current reporting period. Since these amended principles require additional disclosures concerning offsetting and related arrangements, adoption did not affect the Fund’s financial condition or result of operations.
For financial reporting purposes, the Fund does not offset financial assets and financial liabilities that are subject to master netting arrangements or similar agreements on the Statement of Assets and Liabilities.
In the event of a default by a borrower with respect to any loan, GSAL will exercise any and all remedies provided under the applicable borrower agreement to make the Fund whole. These remedies include purchasing replacement securities by applying the collateral held from the defaulting broker against the purchase cost of the replacement securities. If, despite such efforts by GSAL to exercise these remedies, the Fund sustains losses as a result of a borrower’s default, GSAL indemnifies the Fund by purchasing replacement securities at its expense, or paying the Fund an amount equal to the market value of the replacement securities, subject to an exclusion for any shortfalls resulting from a loss of value in the cash collateral pool due to reinvestment risk and a requirement that the Fund agrees to assign rights to the collateral to GSAL for purpose of using the collateral to cover purchase of replacement securities as more fully described in the Securities Lending Agency Agreement.
At June 30, 2013, the Fund’s loaned securities were all subject to enforceable Securities Lending Agreements. Securities lending transactions on a net basis were as follows:
| Securities Lending Transactions | ||||
| Total gross amount presented in Statement of Assets and Liabilities | $ | 4,192,719 | ||
| Cash Collateral offsetting | (4,178,859 | ) | ||
| Net Amount(1)(2) | $ | 13,860 | ||
| (1) | Under-collateralized amount related to one borrower at June 30, 2013. Per standard market practice, the additional required collateral was delivered to the Fund on the next business day. |
| (2) | Net amount represents the net amount due from the borrower or GSAL in the event of a default based on the contractual set-off rights under the agreement. |
Both the Fund and GSAL received compensation relating to the lending of the Fund’s securities. The amount earned by the Fund for the six months ended June 30, 2013, is reported under Investment Income on the Statement of Operations. A portion of this amount, $11,874, represents compensation earned by the Fund from lending its securities to Goldman Sachs. For the six months ended June 30, 2013, GSAL earned $5,798 in fees as securities lending agent.
The following table provides information about the Fund’s investment in the Money Market Fund for the six months ended June 30, 2013:
Number of Shares Held Beginning of Period | Shares Bought | Shares Sold | Number of Shares Held | Value at End of Period | ||||||||||||||
| 3,848,500 | 40,989,555 | (40,607,780 | ) | 4,230,275 | $ | 4,230,275 | ||||||||||||
18
GOLDMAN SACHS VARIABLE INSURANCE TRUST STRUCTURED U.S. EQUITY FUND
8. TAX INFORMATION
As of the Fund’s most recent fiscal year end, December 31, 2012, the Fund’s capital loss carryforwards on a tax-basis were as follows:
| Capital loss carryforwards:(1) | ||||
Expiring 2016 | $ | (14,576,277 | ) | |
Expiring 2017 | (139,998,215 | ) | ||
| Total capital loss carryforwards | $ | (154,574,492 | ) |
| (1) | Expiration occurs on December 31 of the year indicated. |
As of June 30, 2013, the Fund’s aggregate security unrealized gains and losses based on cost for U.S. federal income tax purposes were as follows:
| Tax cost | $ | 353,271,335 | ||
| Gross unrealized gain | 34,368,203 | |||
| Gross unrealized loss | (5,536,844 | ) | ||
| Net unrealized security gain | $ | 28,831,359 |
The difference between GAAP-basis and tax-basis unrealized gains (losses) is attributable primarily to wash sales and net mark to market gains (losses) on regulated futures contracts.
GSAM has reviewed the Fund’s tax positions for all open tax years (the current and prior three years, as applicable) and has concluded that no provision for income tax is required in the Fund’s financial statements. Such open tax years remain subject to examination and adjustment by tax authorities.
9. OTHER RISKS
The Fund’s risks include, but are not limited to, the following:
Shareholder Concentration Risk — Certain funds, accounts, individuals, or Goldman Sachs affiliates may from time to time own (beneficially or of record) or control a significant percentage of the Fund’s shares. Redemptions by these entities of their holdings in the Fund may impact the Fund’s liquidity and NAV. These redemptions may also force the Fund to sell securities.
Liquidity Risk —The Fund may make investments that are illiquid or that may become less liquid in response to market developments or adverse investor perceptions. Illiquid investments may be more difficult to value. Liquidity risk may also refer to the risk that a Fund will not be able to pay redemption proceeds within the allowable time period because of unusual market conditions, an unusually high volume of redemption requests, or other reasons. To meet redemption requests, the Fund may be forced to sell investments at an unfavorable time and/or under unfavorable conditions.
Market and Credit Risks — In the normal course of business, the Fund trades financial instruments and enters into financial transactions where risk of potential loss exists due to changes in the market (market risk). Additionally, the Fund may also be exposed to credit risk in the event that an issuer fails to perform or that an institution or entity with which the Fund has unsettled or open transactions defaults.
19
GOLDMAN SACHS VARIABLE INSURANCE TRUST STRUCTURED U.S. EQUITY FUND
Notes to Financial Statements (continued)
June 30, 2013 (Unaudited)
10. INDEMNIFICATIONS
Under the Trust’s organizational documents, its Trustees, officers, employees and agents are indemnified, to the extent permitted by the Act and state law, against certain liabilities that may arise out of performance of their duties to the Fund. Additionally, in the course of business, the Fund enters into contracts that contain a variety of indemnification clauses. The Fund’s maximum exposure under these arrangements is unknown, as this would involve future claims that may be made against the Fund that have not yet occurred. However, GSAM believes the risk of loss under these arrangements to be remote.
11. SUBSEQUENT EVENTS
Subsequent events after the Statement of Assets and Liabilities date have been evaluated through the date the financial statements were issued. GSAM has concluded that there is no impact requiring adjustment or disclosure in the financial statements.
12. SUMMARY OF SHARE TRANSACTIONS
Share activity is as follows:
| For the Six Months Ended June 30, 2013 (Unaudited) | For the Fiscal Year Ended December 31, 2012 | |||||||||||||||
| Shares | Dollars | Shares | Dollars | |||||||||||||
| Institutional Shares | ||||||||||||||||
| Shares sold | 121,863 | $ | 1,649,199 | 323,842 | $ | 3,824,620 | ||||||||||
| Reinvestment of distributions | — | — | 389,067 | 4,750,506 | ||||||||||||
| Shares redeemed | (1,786,555 | ) | (24,163,882 | ) | (4,386,993 | ) | (52,057,770 | ) | ||||||||
| (1,664,692 | ) | (22,514,683 | ) | (3,674,084 | ) | (43,482,644 | ) | |||||||||
| Service Shares | ||||||||||||||||
| Shares sold | 172,684 | 2,367,469 | 233,357 | 2,753,873 | ||||||||||||
| Reinvestment of distributions | — | — | 126,714 | 1,549,712 | ||||||||||||
| Shares redeemed | (604,122 | ) | (8,177,859 | ) | (1,362,510 | ) | (16,189,729 | ) | ||||||||
| (431,438 | ) | (5,810,390 | ) | (1,002,439 | ) | (11,886,144 | ) | |||||||||
| NET DECREASE | (2,096,130 | ) | $ | (28,325,073 | ) | (4,676,523 | ) | $ | (55,368,788 | ) | ||||||
20
GOLDMAN SACHS VARIABLE INSURANCE TRUST STRUCTURED U.S. EQUITY FUND
| Fund Expenses — Six Month Period Ended June 30, 2013 (Unaudited) |
As a shareholder of Institutional or Service Shares of the Fund, you incur ongoing costs, including management fees, distribution and service (12b-1) fees (with respect to Service Shares) and other Fund expenses. This example is intended to help you understand your ongoing costs (in dollars) of investing in the Institutional Shares and Service Shares of the Fund and to compare these costs with the ongoing costs of investing in other mutual funds.
The example is based on an investment of $1,000 invested at the beginning of the period and held for the entire period from January 1, 2013 through June 30, 2013.
Actual Expenses — The first line under each share class in the table below provides information about actual account values and actual expenses. You may use the information in this line, together with the amount you invested, to estimate the expenses that you paid over the period. Simply divide your account value by $1,000 (for example, an $8,600 account value divided by $1,000=8.6), then multiply the result by the number in the first line under the heading entitled “Expenses Paid” to estimate the expenses you paid on your account during this period.
Hypothetical Example for Comparison Purposes — The second line under each share class in the table below provides information about hypothetical account values and hypothetical expenses based on the Fund's actual net expense ratio and an assumed rate of return of 5% per year before expenses, which is not the Fund's actual return. The hypothetical account values and expenses may not be used to estimate the actual ending account balance or expenses you paid for the period. You may use this information to compare the ongoing costs of investing in the Fund and other funds. To do so, compare this 5% hypothetical example with the 5% hypothetical examples that appear in the shareholder reports of the other funds.
Please note that the expenses shown in the table are meant to highlight your ongoing costs only. As a shareholder of the Fund you do not incur any transaction costs, such as sales charges, redemption fees, or exchange fees, but shareholders of other funds may incur such costs. The second line of the table is useful in comparing ongoing costs only, and will not help you determine the relative total costs of owning different funds whose shareholders may incur transaction costs.
| Share Class | Beginning Account Value 1/01/13 | Ending Account Value | Expenses Paid for the 6 Months Ended | |||||||||
| Institutional | ||||||||||||
| Actual | $ | 1,000 | $ | 1,156.50 | $ | 3.42 | ||||||
| Hypothetical 5% return | 1,000 | 1,021.62 | + | 3.21 | ||||||||
| Service | ||||||||||||
| Actual | 1,000 | 1,155.40 | 4.54 | |||||||||
| Hypothetical 5% return | 1,000 | 1,020.58 | + | 4.26 | ||||||||
| * | Expenses are calculated using the Fund’s annualized net expense ratio for each class, which represents the ongoing expenses as a percentage of net assets for the six months ended June 30, 2013. Expenses are calculated by multiplying the annualized net expense ratio by the average account value for the period; then multiplying the result by the number of days in the most recent fiscal half year; and then dividing that result by the number of days in the fiscal year. The annualized net expense ratios for the period were 0.64% and 0.85% for Institutional and Service Shares, respectively. |
| + | Hypothetical expenses are based on the Fund’s actual annualized net expense ratios and an assumed rate of return of 5% per year before expenses. |
21
GOLDMAN SACHS VARIABLE INSURANCE TRUST STRUCTURED U.S. EQUITY FUND
Statement Regarding Basis for Approval of Management Agreement (Unaudited)
Background
The Goldman Sachs Structured U.S. Equity Fund (the “Fund”) is an investment portfolio of Goldman Sachs Variable Insurance Trust (the “Trust”). The Board of Trustees oversees the management of the Trust and reviews the investment performance and expenses of the Fund at regularly scheduled meetings held during the year. In addition, the Board of Trustees determines annually whether to approve the continuance of the Trust’s investment management agreement (the “Management Agreement”) with Goldman Sachs Asset Management, L.P. (the “Investment Adviser”) on behalf of the Fund.
The Management Agreement was most recently approved for continuation until June 30, 2014 by the Board of Trustees, including those Trustees who are not parties to the Management Agreement or “interested persons” (as defined in the Investment Company Act of 1940, as amended) of any party thereto (the “Independent Trustees”), at a meeting held on June 12-13, 2013 (the “Annual Meeting”).
The review process undertaken by the Trustees spans the course of the year and culminates with the Annual Meeting. To assist the Trustees in their deliberations, the Trustees have established a Contract Review Committee (the “Committee”), comprised of the Independent Trustees. The Committee held four meetings over the course of the year since the Management Agreement was last approved. At those Committee meetings, regularly scheduled Board or other committee meetings and/or the Annual Meeting, the Board, or the Independent Trustees, as applicable, considered matters relating to the Management Agreement, including:
| (a) | the nature and quality of the advisory, administrative and other services provided to the Fund by the Investment Adviser and its affiliates, including information about: |
| (i) | the structure, staff and capabilities of the Investment Adviser and its portfolio management teams; |
| (ii) | the groups within the Investment Adviser and its affiliates that support the portfolio management teams or provide other types of necessary services, including fund services groups (e.g., accounting and financial reporting, tax, shareholder services and operations), controls and risk management groups (e.g., legal, compliance, valuation oversight, credit risk management, internal audit, compliance testing, market risk analysis, finance and strategy and central funding), sales and distribution support groups and others (e.g., information technology and training); |
| (iii) | trends in headcount; |
| (iv) | the Investment Adviser’s financial resources and ability to hire and retain talented personnel and strengthen its operations; and |
| (v) | the parent company’s support of the Investment Adviser and its mutual fund business, as expressed by the firm’s senior management; |
| (b) | information on the investment performance of the Fund, including comparisons to the performance of a group of similar mutual funds, as provided by a third party mutual fund data provider engaged as part of the contract review process (the “Outside Data Provider”), and its benchmark performance index, and general investment outlooks in the markets in which the Fund invests; |
| (c) | the terms of the Management Agreement and agreements with affiliated service providers entered into by the Trust on behalf of the Fund; |
| (d) | expense information for the Fund, including: |
| (i) | the relative management fee and expense level of the Fund as compared to those of comparable funds managed by other advisers, as provided by the Outside Data Provider; and |
| (ii) | the Fund’s expense trends over time; |
| (e) | with respect to the extensive investment performance and expense comparison data provided by the Outside Data Provider, its processes in producing that data for the Fund; |
| (f) | the undertakings of the Investment Adviser and Goldman, Sachs & Co. (“Goldman Sachs”), the Fund’s affiliated distributor, to limit certain expenses of the Fund that exceed a specified level and waive certain distribution and service fees, and a summary of contractual fee reductions made by the Investment Adviser and its affiliates over the past several years with respect to the Fund; |
| (g) | information relating to the profitability of the Management Agreement and the transfer agency and distribution and service arrangements of the Fund and the Trust as a whole to the Investment Adviser and its affiliates; |
| (h) | whether the Fund’s existing management fee schedule adequately addressed any economies of scale; |
| (i) | a summary of the “fall-out” benefits derived by the Investment Adviser and its affiliates from their relationships with the Fund, including the fees received by the Investment Adviser’s affiliates from the Fund for transfer agency, securities lending, portfolio trading, distribution and other services; |
| (j) | a summary of potential benefits derived by the Fund as a result of its relationship with the Investment Adviser; |
22
GOLDMAN SACHS VARIABLE INSURANCE TRUST STRUCTURED U.S. EQUITY FUND
Statement Regarding Basis for Approval of Management Agreement (Unaudited) (continued)
| (k) | information regarding commissions paid by the Fund and broker oversight, other information regarding portfolio trading and how the Investment Adviser carries out its duty to seek best execution; |
| (l) | the manner in which portfolio manager compensation is determined, and the number and types of accounts managed by the portfolio managers; |
| (m) | the nature and quality of the services provided to the Fund by its unaffiliated service providers, and the Investment Adviser’s general oversight and evaluation (including reports on due diligence) of those service providers as part of the administration services provided under the Management Agreement; and |
| (n) | the Investment Adviser’s processes and policies addressing various types of potential conflicts of interest; its approach to risk management; the annual review of the effectiveness of the Fund’s compliance program; and periodic compliance reports. |
The Trustees also received an overview of the Fund’s distribution arrangements. They received information regarding the Fund’s assets, share purchase and redemption activity and the payment of Rule 12b-1 distribution and service fees by the Fund’s Service Shares. Information was also provided to the Trustees relating to revenue sharing payments made by and services provided by the Investment Adviser and its affiliates to intermediaries that promote the sale, distribution and/or servicing of Fund shares.
The presentations made at the Board and Committee meetings and at the Annual Meeting encompassed the Fund and other mutual fund portfolios for which the Board of Trustees has responsibility. In evaluating the Management Agreement at the Annual Meeting, the Trustees relied upon their knowledge, resulting from their meetings and other interactions throughout the year, of the Investment Adviser, its affiliates, their services and the Fund. In conjunction with these meetings, the Trustees received written materials and oral presentations on the topics covered, and were advised by their independent legal counsel regarding their responsibilities and other regulatory requirements related to the approval and continuation of mutual fund investment management agreements under applicable law. In addition, the Investment Adviser and its affiliates provided the Independent Trustees with a written response to a formal request for information sent on behalf of the Independent Trustees by their independent legal counsel. During the course of their deliberations, the Independent Trustees met in executive sessions with their independent legal counsel, without representatives of the Investment Adviser or its affiliates present. The Independent Trustees also discussed the broad range of other investment choices that are available to Fund investors, including the availability of comparable funds managed by other advisers.
Nature, Extent and Quality of the Services Provided Under the Management Agreement
As part of their review, the Trustees considered the nature, extent and quality of the services provided by the Investment Adviser. In this regard, the Trustees considered both the investment advisory services and non-advisory services that are provided to the Fund by the Investment Adviser and its affiliates. The Trustees noted the transition in the leadership and changes in personnel of various of the Investment Adviser’s portfolio management teams that had occurred in recent periods, and the ongoing recruitment efforts aimed at bringing high quality investment talent to the Investment Adviser. The Trustees concluded that the Investment Adviser continued to commit substantial financial and operational resources to the Fund and expressed confidence that the Investment Adviser would continue to do so in the future. The Trustees also recognized that the Investment Adviser had made significant commitments to address regulatory compliance requirements applicable to the Fund and the Investment Adviser.
Investment Performance
The Trustees also considered the investment performance of the Fund. In this regard, they compared the investment performance of the Fund to its peers using rankings and ratings compiled by the Outside Data Provider as of December 31, 2012, and updated performance information prepared by the Investment Adviser using the peer group identified by the Outside Data Provider as of March 31, 2013. The information on the Fund’s investment performance was provided for the one-, three-, five- and ten-year periods ending on the applicable dates. The Trustees also reviewed the Fund’s investment performance over time (including on a year-by-year basis) relative to its performance benchmark. In addition, they considered the investment performance trends of the Fund over time, and reviewed the investment performance of the Fund in light of its investment objective and policies and market conditions.
In addition, the Trustees considered materials prepared and presentations made by the Investment Adviser’s senior management and portfolio management personnel, in which Fund performance was assessed. The Trustees also considered the Investment Adviser’s periodic reports with respect to the Fund’s risk profile, and how the Investment Adviser’s approach to risk monitoring and management influences portfolio management.
23
GOLDMAN SACHS VARIABLE INSURANCE TRUST STRUCTURED U.S. EQUITY FUND
Statement Regarding Basis for Approval of Management Agreement (Unaudited) (continued)
The Trustees observed that the Fund’s Service Shares had placed in the top half of the Fund’s peer group for the one-, three-, and five-year periods, and had underperformed the Fund’s benchmark index for the one-, three-, and five-year periods ended March 31, 2013. They noted the additions of certain key hires to senior management in 2011, and recognized the portfolio management team’s continuing efforts to further enhance its investment models.
Costs of Services Provided and Competitive Information
The Trustees considered the contractual terms of the Management Agreement and the fee rates payable by the Fund thereunder. In this regard, the Trustees considered information on the services rendered by the Investment Adviser to the Fund, which included both advisory and administrative services that were directed to the needs and operations of the Fund as a registered mutual fund.
In particular, the Trustees reviewed analyses prepared by the Outside Data Provider regarding the expense rankings of the Fund. The analyses provided a comparison of the Fund’s management fees and breakpoints to those of a relevant peer group and a category universe; an expense analysis which compared the Fund’s overall net and gross expenses to a peer group and a category universe; and a five-year history comparing the Fund’s net expenses to the peer and category medians. The analyses also compared the Fund’s transfer agency, custody, and distribution fees, other expenses and fee waivers/reimbursements to those of the peer group and category medians. The Trustees concluded that the comparisons provided by the Outside Data Provider were useful in evaluating the reasonableness of the management fees and total expenses paid by the Fund.
In addition, the Trustees considered the Investment Adviser’s undertaking to limit certain expenses of the Fund that exceed a specified level and Goldman Sachs’ undertaking to waive a portion of the distribution and service fees paid by the Fund’s Service Shares. They also noted that the Investment Adviser did not manage institutional accounts or collective investment vehicles having investment objectives and policies similar to those of the Fund, and therefore this type of fee comparison was not possible.
In addition, the Trustees noted that shareholders are able to redeem their Fund shares at any time if they believe that the Fund fees and expenses are too high or if they are dissatisfied with the performance of the Fund.
Profitability
The Trustees reviewed the Investment Adviser’s revenues and pre-tax profit margins with respect to the Trust and the Fund. In this regard the Trustees noted that they had received, among other things, profitability analyses and summaries, revenue and expense schedules by Fund and by function (i.e., investment management, transfer agency and distribution and service) and the Investment Adviser’s expense allocation methodology. They observed that the profitability and expense figures are substantially similar to those used by the Investment Adviser for many internal purposes, including compensation decisions among various business groups, and are thus subject to a vigorous internal debate about how certain revenue and expenses should be allocated. The Trustees also reviewed the report of the internal audit group within the Goldman Sachs organization, which included an assessment of the reasonableness and consistency of the Investment Adviser’s expense allocation methodology and an evaluation of the accuracy of the Investment Adviser’s profitability analysis calculations. Profitability data for the Trust and the Fund were provided for 2012 and 2011, and the Trustees considered this information in relation to the Investment Adviser’s overall profitability. The Trustees considered the Investment Adviser’s revenues and pre-tax profit margins both in absolute terms and in comparison to information on the reported pre-tax profit margins earned by certain other asset management firms.
Economies of Scale
The Trustees considered the information that had been provided regarding the Investment Adviser’s profitability. The Trustees also considered the breakpoints in the fee rate payable under the Management Agreement for the Fund at the following annual percentage rates of the average daily net assets of the Fund:
| First $1 billion | 0.62 | % | ||
| Next $1 billion | 0.59 | |||
| Next $3 billion | 0.56 | |||
| Next $3 billion | 0.55 | |||
| Over $8 billion | 0.54 |
24
GOLDMAN SACHS VARIABLE INSURANCE TRUST STRUCTURED U.S. EQUITY FUND
Statement Regarding Basis for Approval of Management Agreement (Unaudited) (continued)
The Trustees noted that the breakpoints were meant to share potential economies of scale, if any, with the Fund and its shareholders as assets under management reach those asset levels. The Trustees considered the amounts of assets in the Fund; the Fund’s recent share purchase and redemption activity; the information provided by the Investment Adviser relating to the costs of the services provided by the Investment Adviser and its affiliates and their realized profits; information comparing fee rates charged by the Investment Adviser with fee rates charged to other funds in the peer group; and the Investment Adviser’s and Goldman Sachs’ undertakings to limit certain expenses of the Fund that exceed a specified level and waive a portion of the distribution and service fees paid by the Fund’s Service Shares. Upon reviewing these matters at the Annual Meeting, the Trustees concluded that the fee breakpoints represented a means of assuring that benefits of scalability, if any, would be passed along to shareholders at the specified asset levels.
Other Benefits to the Investment Adviser and Its Affiliates
The Trustees also considered the other benefits derived by the Investment Adviser and its affiliates from their relationship with the Fund as stated above, including: (a) transfer agency fees received by Goldman Sachs; (b) brokerage and futures commissions earned by Goldman Sachs for executing securities and futures transactions on behalf of the Fund; (c) trading efficiencies resulting from aggregation of orders of the Fund with those for other funds or accounts managed by the Investment Adviser; (d) fees earned by Goldman Sachs Agency Lending, an affiliate of the Investment Adviser, as securities lending agent (and fees earned by the Investment Adviser for managing the fund in which the Fund’s cash collateral is invested); (e) the Investment Adviser’s ability to leverage the infrastructure designed to service the Fund on behalf of its other clients; (f) the Investment Adviser’s ability to cross-market other products and services to Fund shareholders; (g) Goldman Sachs’ retention of certain fees as Fund Distributor; (h) the Investment Adviser’s ability to negotiate better pricing with custodians on behalf of its other clients, as a result of the relationship with the Fund; and (i) the possibility that the working relationship between the Investment Adviser and the Fund’s third party service providers may cause those service providers to be open to doing business with other areas of Goldman Sachs. In the course of considering the foregoing, the Independent Trustees requested and received further information quantifying certain of these fall-out benefits. In looking at the benefits to Goldman Sachs Agency Lending and the Investment Adviser from the securities lending program, they noted that the Fund also benefited from its participation in the securities lending program.
Other Benefits to the Fund and Its Shareholders
The Trustees also noted that the Fund receives certain potential benefits as a result of its relationship with the Investment Adviser, including: (a) trading efficiencies resulting from aggregation of orders of the Fund with those of other funds or accounts managed by the Investment Adviser; (b) improved servicing from vendors because of the volume of business generated by the Investment Adviser and its affiliates; (c) improved servicing from broker-dealers because of the volume of business generated by the Investment Adviser and its affiliates; (d) the Investment Adviser’s ability to negotiate favorable terms with derivatives counterparties as a result of the size and reputation of the Goldman Sachs organization; (e) the Investment Adviser’s knowledge and experience gained from managing other accounts and products; (f) the Investment Adviser’s ability to hire and retain qualified personnel to provide services to the Fund because of the reputation of the Goldman Sachs organization; (g) the Fund’s access, through the Investment Adviser, to certain firmwide resources (e.g., proprietary risk management systems and databases), subject to certain restrictions; and (h) the Fund’s access to certain affiliated distribution channels. The Trustees noted the competitive nature of the mutual fund marketplace, and noted further that many of the Fund’s shareholders invested in the Fund in part because of the Fund’s relationship with the Investment Adviser and that those shareholders have a general expectation that the relationship will continue.
Conclusion
In connection with their consideration of the Management Agreement, the Trustees gave weight to each of the factors described above, but did not identify any particular factor as controlling their decision. After deliberation and consideration of all of the information provided, including the factors described above, the Trustees concluded, in the exercise of their business judgment, that the management fees paid by the Fund were reasonable in light of the services provided to it by the Investment Adviser, the Investment Adviser’s costs and the Fund’s current and reasonably foreseeable asset levels. The Trustees unanimously concluded that the Investment Adviser’s continued management likely would benefit the Fund and its shareholders and that the Management Agreement should be approved and continued with respect to the Fund until June 30, 2014.
25
| TRUSTEES | OFFICERS | |
| Ashok N. Bakhru, Chairman | James A. McNamara, President | |
| Donald C. Burke | George F. Travers, Principal Financial Officer | |
| John P. Coblentz, Jr. | Caroline L. Kraus, Secretary | |
| Diana M. Daniels | Scott M. McHugh, Treasurer | |
| Joseph P. LoRusso | ||
| James A. McNamara | ||
| Jessica Palmer | ||
| Alan A. Shuch | ||
| Richard P. Strubel |
GOLDMAN, SACHS & CO.
Distributor and Transfer Agent
GOLDMAN SACHS ASSET MANAGEMENT, L.P.
Investment Adviser
200 West Street, New York
New York 10282
Visit our web site at www.goldmansachsfunds.com/vit to obtain the most recent month-end returns.
The reports concerning the Fund included in this shareholder report may contain certain forward-looking statements about the factors that may affect the performance of the Fund in the future. These statements are based on Fund management’s predictions and expectations concerning certain future events and their expected impact on the Fund, such as performance of the economy as a whole and of specific industry sectors, changes in the levels of interest rates, the impact of developing world events, and other factors that may influence the future performance of the Fund. Management believes these forward-looking statements to be reasonable, although they are inherently uncertain and difficult to predict. Actual events may cause adjustments in portfolio management strategies from those currently expected to be employed.
A description of the policies and procedures that the Fund uses to determine how to vote proxies relating to portfolio securities and information regarding how the Fund voted proxies relating to portfolio securities for the 12-month period ended June 30 is available (i) without charge, upon request by calling 1-800-621-2550; and (ii) on the Securities and Exchange Commission (“SEC”) web site at http://www.sec.gov.
The Fund files its complete schedule of portfolio holdings with the SEC for the first and third quarters of each fiscal year on Form N-Q. The Fund’s Form N-Q is available on the SEC’s web site at http://www.sec.gov within 60 days after the Fund’s first and third fiscal quarters. The Fund’s Forms N-Q may be reviewed and copied at the SEC’s Public Reference Room in Washington, D.C. and information on the operation of the Public Reference Room may also be obtained by calling 1-800-SEC-0330. Forms N-Q may be obtained upon request and without charge by calling 1-800-621-2550.
Holdings and allocations shown are as of June 30, 2013 and may not be representative of future investments. Fund holdings should not be relied on in making investment decisions and should not be construed as research or investment advice regarding particular securities. Current and future holdings are subject to risk.
The Global Industry Classification Standard (“GICS”) was developed by and is the exclusive property and a service mark of Morgan Stanley Capital International Inc. (“MSCI”) and Standard & Poor’s, a division of The McGraw-Hill Companies, Inc. (“S&P”) and is licensed for use by Goldman Sachs. Neither MSCI, S&P nor any other party involved in making or compiling the GICS or any GICS classifications makes any express or implied warranties or representations with respect to such standard or classification (or the results to be obtained by the use thereof), and all such parties hereby expressly disclaim all warranties of originality, accuracy, completeness, merchantability or fitness for a particular purpose with respect to any of such standard or classification. Without limiting any of the foregoing, in no event shall MSCI, S&P, any of their affiliates or any third party involved in making or compiling the GICS or any GICS classifications have any liability for any direct, indirect, special, punitive, consequential or any other damages (including lost profits) even if notified of the possibility of such damages.
The portfolio risk management process includes an effort to monitor and manage risk, but does not imply low risk.
Shares of the Goldman Sachs VIT Funds are offered to separate accounts of participating life insurance companies for the purpose of funding variable annuity contracts and variable life insurance policies. Shares of the Fund are not offered directly to the general public. The variable annuity contracts and variable life insurance policies are described in the separate prospectuses issued by participating insurance companies. You should refer to those prospectuses for information about surrender charges, mortality and expense risk fees and other charges that may be assessed by participating insurance companies under the variable annuity contracts or variable life insurance policies. Such fees or charges, if any, may affect the return you may realize with respect to your investments. Ask your representative for more complete information. Please consider a fund’s objectives, risks and charges and expenses, and read the prospectus carefully before investing. The prospectus contains this and other information about the Fund.
This material is not authorized for distribution to prospective investors unless preceded or accompanied by a current Prospectus or summary prospectus, if applicable. Investors should consider a Fund’s objective, risks, and charges and expenses, and read the summary prospectus, if available, and/or the Prospectus carefully before investing or sending money. The summary prospectus, if available, and the Prospectus contain this and other information about a Fund and may be obtained from your Authorized Institution or from Goldman, Sachs & Co. by calling 1-800-621-2550.
This report is prepared for the general information of contract owners and is not an offer of shares of the Goldman Sachs Variable Insurance Trust: Goldman Sachs Structured U.S. Equity Fund.
© 2013 Goldman Sachs. All rights reserved.
VITUSSAR13/106789.MF.MED.TMPL/8/2013
| ITEM 2. | CODE OF ETHICS. |
| The information required by this Item is only required in an annual report on this Form N-CSR |
| ITEM 3. | AUDIT COMMITTEE FINANCIAL EXPERT. |
| The information required by this Item is only required in an annual report on this Form N-CSR |
| ITEM 4. | PRINCIPAL ACCOUNTANT FEES AND SERVICES. |
| The information required by this Item is only required in an annual report on this Form N-CSR |
| ITEM 5. | AUDIT COMMITTEE OF LISTED REGISTRANTS. |
Not applicable.
| ITEM 6. | SCHEDULE OF INVESTMENTS |
Schedule of Investments is included as part of the Reports to Shareholders filed under Item 1.
| ITEM 7. | DISCLOSURE OF PROXY VOTING POLICIES AND PROCEDURES FOR CLOSED-END MANAGEMENT INVESTMENT COMPANIES. |
Not applicable.
| ITEM 8. | PORTFOLIO MANAGERS OF CLOSED-END MANAGEMENT INVESTMENT COMPANIES |
Not applicable.
| ITEM 9. | PURCHASES OF EQUITY SECURITIES BY CLOSED-END MANAGEMENT INVESTMENT COMPANY AND AFFILIATED PURCHASERS |
Not applicable.
| ITEM 10. | SUBMISSION OF MATTERS TO A VOTE OF SECURITY HOLDERS. |
There have been no material changes to the procedures by which shareholders may recommend nominees to the registrant’s board of trustees.
| ITEM 11. | CONTROLS AND PROCEDURES. |
| (a) | The registrant’s principal executive and principal financial officers or persons performing similar functions have concluded that the registrant’s disclosure controls and procedures (as defined in Rule 30a-3(c) under the Investment Company Act of 1940, as amended (the “1940 Act”)) are effective as of a date within 90 days of the filing date of this report that includes the disclosure required by this paragraph, based on the evaluation of these controls and procedures required by Rule 30a-3(b) under the 1940 Act and 15d-15(b) under the Securities Exchange Act of 1934, as amended. |
| (b) | There were no changes in the registrant’s internal control over financial reporting (as defined in Rule 30a-3(d) under the 1940 Act) that occurred during the registrant’s second fiscal quarter of the period covered by this report that has materially affected, or is reasonably likely to materially affect the registrant’s internal control over financial reporting. |
| ITEM 12. | EXHIBITS. |
(a)(1) | Goldman Sachs Variable Insurance Trust’s Code of Ethics for Principal Executive and Senior Financial Officers filed herewith |
(a)(2) | Exhibit 99.CERT | Certifications pursuant to Section 302 of the Sarbanes-Oxley Act of 2002 filed herewith | ||
(b) | Exhibit 99.906CERT | Certifications pursuant to Section 906 of the Sarbanes-Oxley Act of 2002 filed herewith | ||
SIGNATURES
Pursuant to the requirements of the Securities Exchange Act of 1934 and the Investment Company Act of 1940, the registrant has duly caused this report to be signed on its behalf by the undersigned, thereunto duly authorized.
Goldman Sachs Variable Insurance Trust | ||
/s/ James A. McNamara | ||
By: James A. McNamara | ||
Chief Executive Officer of | ||
Goldman Sachs Variable Insurance Trust | ||
Date: August 13, 2013 | ||
Pursuant to the requirements of the Securities Exchange Act of 1934 and the Investment Company Act of 1940, the report has been signed below by the following persons on behalf of the registrant and in the capacities and on the dates indicated.
/s/ James A. McNamara | ||
By: James A. McNamara | ||
Chief Executive Officer of | ||
Goldman Sachs Variable Insurance Trust | ||
Date: August 13, 2013 | ||
/s/ George F. Travers | ||
By: George F. Travers | ||
Chief Financial Officer of | ||
Goldman Sachs Variable Insurance Trust | ||
Date: August 14, 2013 | ||