UNITED STATES
SECURITIES AND EXCHANGE COMMISSION
Washington, D.C. 20549
FORM N-CSR
CERTIFIED SHAREHOLDER REPORT OF REGISTERED
MANAGEMENT INVESTMENT COMPANIES
Investment Company Act file number 811-08361
Goldman Sachs Variable Insurance Trust
(Exact name of registrant as specified in charter)
71 South Wacker Drive, Chicago, Illinois 60606-6303
(Address of principal executive offices) (Zip code)
Caroline Kraus
Goldman, Sachs & Co.
200 West Street
New York, NY 10282
Copies to:
Geoffrey R.T. Kenyon, Esq.
Dechert LLP
200 Clarendon Street
27th Floor Boston, MA 02116-5021
(Name and address of agents for service)
Registrant’s telephone number, including area code: (312) 655-4400
Date of fiscal year end: December 31
Date of reporting period: December 31, 2012
| ITEM 1. | REPORTS TO STOCKHOLDERS. |
| The Annual Reports to Stockholders are filed herewith. |
Goldman
Sachs Variable Insurance Trust
Goldman Sachs Core Fixed Income Fund
Goldman Sachs Equity Index Fund
Goldman Sachs Government Income Fund
Goldman Sachs Growth Opportunities Fund
Annual Report
December 31, 2012

GOLDMAN SACHS VARIABLE INSURANCE TRUST FUNDS
Principal Investment Strategies and Risks
This is not a complete list of the risks that may affect the Funds. For additional information concerning the risks applicable to the Funds, please see the Funds’ Prospectuses.
Shares of the Goldman Sachs Variable Insurance Trust Funds are offered to separate accounts of participating life insurance companies for the purpose of funding variable annuity contracts and variable life insurance policies. Shares of the Funds are not offered directly to the general public. The variable annuity contracts and variable life insurance policies are described in the separate prospectuses issued by participating insurance companies. You should refer to those prospectuses for information about surrender charges, mortality and expense risk fees and other charges that may be assessed by participating insurance companies under the variable annuity contracts or variable life insurance policies. Such fees or charges, if any, may affect the return you realize with respect to your investments. Ask your representative for more complete information. Please consider a Fund’s objective, risks and charges and expenses, and read the Prospectus carefully before investing. The Prospectus contains this and other information about a Fund.
The Goldman Sachs Core Fixed Income Fund invests primarily in fixed income securities, including U.S. government securities, corporate debt securities, privately issued mortgage-backed securities and asset-backed securities. The Fund’s investments in fixed income securities are subject to the risks associated with debt securities generally, including credit, liquidity and interest rate risk. Any guarantee on U.S. government securities applies only to the underlying securities of the Fund if held to maturity and not to the value of the Fund’s shares. The Fund’s investments in mortgage-backed securities are also subject to prepayment risk (i.e., the risk that in a declining interest rate environment, issuers may pay principal more quickly than expected, causing the Fund to reinvest proceeds at lower prevailing interest rates). The Fund may invest in foreign and emerging markets securities, which may be more volatile and less liquid than investments in U.S. securities and will be subject to the risks of currency fluctuations and adverse economic and political developments. Derivative instruments may involve a high degree of financial risk. These risks include the risk that a small movement in the price of the underlying security or benchmark may result in a disproportionately large movement, unfavorable or favorable, in the price of the derivative instrument; risks of default by a counterparty; and liquidity risk (i.e., the risk that an investment may not be able to be sold without a substantial drop in price, if at all).
The Goldman Sachs Equity Index Fund attempts to replicate the aggregate price and yield performance of a benchmark index (i.e., the Standard & Poor’s 500 Index) that measures the investment returns of large capitalization stocks. The Fund’s equity investments are subject to market risk, which means that the value of the securities in which it invests may go up or down in response to the prospects of individual companies, particular sectors and/or general economic conditions. The Fund is not actively managed, and therefore the Fund will not typically dispose of a security until the security is removed from the index. The Fund’s performance may vary substantially from the performance of the benchmark it tracks as a result of share purchases and redemptions, transaction costs, expenses and other factors.
The Goldman Sachs Government Income Fund invests primarily in U.S. government securities. The Fund’s investments in fixed income securities are subject to the risks associated with debt securities generally, including credit, liquidity and interest rate risk. The Fund’s net asset value and yield are not guaranteed by the U.S. government or by its agencies, instrumentalities or sponsored enterprises. Any guarantee on U.S. government securities applies only to the underlying securities of the Fund if held to maturity and not to the value of the Fund’s shares. The Fund’s investments in mortgage-backed securities are also subject to prepayment risk (i.e., the risk that in a declining interest rate environment, issuers may pay principal more quickly than expected, causing the Fund to reinvest proceeds at lower prevailing interest rates).
1
GOLDMAN SACHS VARIABLE INSURANCE TRUST FUNDS
Derivative instruments may involve a high degree of financial risk. These risks include the risk that a small movement in the price of the underlying security or benchmark may result in a disproportionately large movement, unfavorable or favorable, in the price of the derivative instrument; the risk of default by a counterparty; and liquidity risk.
The Goldman Sachs Growth Opportunities Fund invests primarily in U.S. equity investments with a primary focus on mid-capitalization companies. The Fund’s equity investments are subject to market risk, which means that the value of the securities in which it invests may go up or down in response to the prospects of individual companies, particular sectors and/or general economic conditions. The securities of mid-capitalization companies involve greater risks than those associated with larger, more established companies and may be subject to more abrupt or erratic price movements. Different investment styles (e.g., “growth”) tend to shift in and out of favor, and at times the Fund may underperform other funds that invest in similar asset classes.
2
MARKET REVIEW
Goldman Sachs Variable Insurance Trust Funds
Market Review
The U.S. equity and fixed income markets generated positive returns during the 12 months ended December 31, 2012 (the “Reporting Period”).
Equity Markets
Representing the U.S. equity market, the S&P® 500 Index rose 15.96% during the Reporting Period to mark the fourth straight year of gains. The year 2012 started with the strongest first quarter since 1998 for the S&P® 500 Index. Also during the first quarter of 2012, the Dow Jones Industrial Average closed above 13,000 for the first time since May 2008, and the NASDAQ reached a new 11-year high. U.S. equities rose largely on evidence that the labor and manufacturing markets were improving. In addition, the Federal Reserve Board (the “Fed”) reaffirmed its commitment to low interest rates until at least late-2014.
U.S. equity markets slid, however, during the second quarter of 2012, when first quarter Gross Domestic Product (“GDP”) was revised down from 2.2% to 1.9%, and employment reports suggested deterioration in the labor market. Spain’s banking system bailout and increasing concerns over Europe’s financial crisis weighed on global equity markets, including the U.S. equity market, as well. At the same time, disappointing economic reports from faster growing regions of the world renewed fears of a global economic slowdown.
During the summer of 2012, U.S. equity markets rallied back on more strong statements from central banks. In September, the Fed announced another round of quantitative easing, dubbed QE3, this time with no expiration date but with the explicit goal of reducing unemployment. The Fed also extended its policy of near-zero interest rates until at least mid-2015. In Europe, European Central Bank (“ECB”) president Mario Draghi voiced strong support for the euro and the European Monetary Union, which was well received by financial markets in the U.S. Continued improvements in home prices and the Fed’s commitment to buy mortgage-backed securities increased hopes of a recovery in the housing market, which helped offset the downward pressures of lackluster economic growth and a stalled labor market.
There were increasing signs of economic recovery seen early in the fourth quarter of 2012. The U.S. reported better than expected third quarter GDP growth of 2%, the 13th consecutive quarter of economic expansion, and the unemployment rate dropped to 7.8%, the lowest rate seen since January 2009. U.S. manufacturing activity increased, and the housing market showed further signs of improvement, as construction of new homes hit a four-year high. Despite this positive data, the U.S. equity market pulled back in October on some cautious corporate earnings guidance. Also pressuring the U.S. equity market were the worst storm in decades battering the East Coast and polls showing the U.S. presidential race tightening to a dead heat.
The U.S. equity market crept higher in November 2012, as election day preserved the status quo in the White House and Congress, even as the “fiscal cliff” drew nearer. Housing starts and measures of employment improved, and manufacturing and non-manufacturing surveys showed expansion in the economy. In December 2012, further clarification from the Fed, tying its low interest rate policy to the condition that unemployment drop to 6.5% or lower helped to offset increasing worries about the then-looming fiscal cliff of tax increases and spending cuts.
For the Reporting Period as a whole, all ten sectors within the S&P® 500 Index posted gains. The consistent and persistent commitment to accommodative monetary policy from the U.S. Fed and other central banks drove market-leading returns in the financials sector. The heavily weighted financials sector was also the largest positive contributor (weight times performance) to S&P® 500 Index returns. On optimism about the economy and improved consumer confidence, the consumer discretionary sector also performed well. Conversely, the energy sector posted positive returns but was comparatively weak during the Reporting Period, as oil prices remained relatively stable, balancing continued unrest in several oil-producing regions with potential supply increases from U.S. shale production and a modest outlook for global economic growth.
All segments of the U.S. equity market advanced during the Reporting Period, with mid-cap stocks, as measured by the Russell Midcap® Index, gaining most, followed by large-cap stocks and then small-cap stocks, as measured by the Russell 1000® Index and the Russell 2000® Index, respectively, which performed similarly to each other. From a style perspective, value-oriented stocks solidly outpaced growth-oriented stocks across the capitalization spectrum. (All as measured by the Russell Investments indices.)
3
MARKET REVIEW
Fixed Income Markets
The U.S. fixed income market, as represented by the Barclays U.S. Aggregate Bond Index (“Barclays Index”), returned 4.21% during the Reporting Period. Non-government sectors led the gains.
Spread, or non-U.S. Treasury, sectors started the Reporting Period on a rally that persisted through March 2012, helped by a global trend of improving economic data. In the U.S., manufacturing activity accelerated, and the unemployment rate fell faster than anticipated to a three-year low of 8.3%. Despite this favorable economic backdrop, persistent concerns about the Eurozone’s financial crisis continued to support demand for lower-risk government bonds. Highly accommodative monetary policy by global central banks also helped curb increases in U.S., Japanese and German government bond yields.
The positive trend for spread sectors reversed during the second quarter of 2012. Global economic data weakened, and concerns mounted about heavy losses in Spain’s banking sector and the possibility of Greece exiting the Eurozone. May was the toughest month in the Reporting Period overall for riskier asset classes. Equity indices fell sharply and emerging market sovereign bonds underperformed U.S. Treasuries by more than 5%. In June, investors’ risk appetite began to recover as a second round of Greek elections reaffirmed that country’s commitment to austerity and European Union leaders reached broad consensus on a recapitalization of Spanish banks. U.S. economic data began to improve, particularly in the housing sector with the Standard & Poor’s/Case-Shiller Home Price Indices showing a clear upward trend. Labor market data beat expectations again, and by the end of the Reporting Period, the U.S. unemployment rate had dropped to 7.8%. These factors sparked renewed rallies across spread sectors that persisted for most of the remainder of the Reporting Period, fueled primarily by investors’ search for yield in an extremely low interest rate environment.
Early in the third calendar quarter, U.S. and German interest rates traded near record lows — 1.39% for the U.S. 10-year Treasury bond and 1.17% for the German 10-year bund—on mounting expectations for further monetary stimulus. Central banks delivered on these expectations. In July 2012, the ECB cut its benchmark interest rate to 0.75% and its deposit rate to zero. In September, the ECB pledged to purchase potentially unlimited amounts of distressed government bonds in secondary markets as needed. As mentioned above, the Fed announced open-ended purchases of agency mortgage-backed securities in a third round of quantitative easing, dubbed QE3, and extended the likely period of low rates from mid-2014 to mid-2015.
Volatility increased in the lead-up to the November 2012 U.S. elections, though the reelection of President Obama had little impact on the fixed income markets. After a brief pause, spread sector rallies resumed, despite mounting uncertainty about the then-looming fiscal cliff. In the final days of the Reporting Period, the fixed income markets focused on the eleventh-hour negotiations in Washington, D.C., as lawmakers strived to reach agreement on fiscal policies ahead of the year-end deadline for automatic spending cuts and the expiration of Bush-era tax cuts.
During the Reporting Period as a whole, higher-yielding fixed income sectors outperformed U.S. Treasury securities. Non-agency mortgage-backed securities performed best, with an excess return of 29.2% over similar-duration U.S. Treasuries. Agency mortgage-backed securities were the weakest performers, generating an excess return of 0.9% over U.S. Treasuries during the Reporting Period.
Looking Ahead
Equity Markets
After a strong 2012, we continue to see opportunities as we enter 2013 and remain constructive in our view ahead for U.S. equities. We recognize fiscal policy may lead to a drag on economic growth, and recent steps taken by the Fed to provide additional monetary accommodation may not fully offset the impact. The political climate in the U.S., and the lack of clarity around the outcome of fiscal negotiations, has contributed to an elevated feeling of uncertainty for both businesses and individuals. However, corporate balance sheets remain strong, which we believe provides companies with the ability to generate shareholder value, even in a slower economic growth environment. The S&P 500 Index, as a broad measure of the U.S. equity market, was trading below its historical average price-to-earnings ratio at the end of the Reporting Period, while its dividend yield was greater than the yield
4
MARKET REVIEW
on the 10-year U.S. Treasury bond. Continued strength in the U.S. housing recovery should provide, in our view, support to the economy and boost confidence among consumers.
Through these conditions, our investment decisions remain driven by our long-standing process and philosophy. We dive deep into the fundamentals of our holdings, meet with companies’ managements and have continuous discussions and debates amongst ourselves to ensure that the portfolios are reflective of our highest conviction ideas. We construct the portfolios around businesses that we believe should create long-term value for shareholders and are leveraged to secular growth trends rather than to political outcomes or macroeconomic expectations.
In our view, companies with strong business franchises become more attractive in uncertain environments. Holding competitive advantages, a strong management team and the ability to allocate capital allows the business to adapt and continuously execute on its long-term plans regardless of current sentiment. Companies are not static entities. We believe strong management teams know they must adapt to regulatory changes, expand into new markets and improve their product offerings in order to remain competitive and grow. These are the types of investments we believe will reward our shareholders over the long term. As always, deep research resources, a forward-looking investment process and truly actively managed portfolios are keys, in our view, to both preserving capital and outperforming the market over the long term.
Fixed Income Markets
Just after the close of the Reporting Period, U.S. lawmakers struck a deal to avert triggering several automatic tax increases. However, the new Congress will need to revisit fiscal issues, including spending cuts and the raising of the U.S. debt ceiling.
In our opinion, the fiscal cliff agreement is far from ideal, but we believe the underlying momentum in the U.S. economy is healthy. Indeed, our view of 2013 economic growth is more optimistic than the consensus view. We believe pent-up investment demand will be released in the wake of the fiscal cliff resolution. We also expect a continued recovery in the housing market and an environment favorable to riskier asset classes. As a result, we expect the long-term end of the U.S. Treasury yield curve to remain under pressure.
Our fixed income positioning overall reflects the “risk-on” environment, with an underweight in U.S. interest rate risk relative to fixed income portfolio benchmarks and overweighted positions in corporate credit and mortgage-backed securities. At the end of the Reporting Period, we planned to maintain our core position — an overweight to lower coupon mortgage-backed securities that are the target of Fed purchases, an underweight to coupons that are most vulnerable to refinancing at current historically low rates, and an overweight to higher coupons that have already priced in this risk.
5
GOLDMAN SACHS VARIABLE INSURANCE TRUST CORE FIXED INCOME FUND
INVESTMENT OBJECTIVE
The Fund seeks a total return consisting of capital appreciation and income that exceeds the total return of the Barclays U.S. Aggregate Bond Index.
Portfolio Management Discussion and Analysis
Below, the Goldman Sachs Fixed Income Investment Management Team discusses the Goldman Sachs Variable Insurance Trust — Goldman Sachs Core Fixed Income Fund’s (the “Fund”) performance and positioning for the 12-month period ended December 31, 2012 (the “Reporting Period”).
How did the Fund perform during the Reporting Period?
During the Reporting Period, the Fund’s Service Shares generated an average annual total return of 6.70%. This return compares to the 4.21% average annual total return of the Fund’s benchmark, the Barclays U.S. Aggregate Bond Index (the “Barclays Index”), during the same time period.
What key factors were responsible for the Fund’s performance during the Reporting Period?
Our top-down cross-sector strategy contributed the most to the Fund’s relative outperformance during the Reporting Period. Our cross-sector strategy is one in which we invest Fund assets across a variety of fixed income sectors, including some that may not be included in the Barclays Index. The Fund’s duration and U.S. yield curve positioning relative to the Barclays Index also enhanced results. Duration is a measure of the Fund’s sensitivity to changes in interest rates. Yield curve indicates a spectrum of maturities. In addition, bottom-up individual issue selection was a strong driver of relative returns.
Which fixed income market sectors most affected Fund performance?
The Fund’s overweighted position in the strongly performing non-agency mortgage-backed securities sector contributed positively to relative results. An overweight to corporate credit, which also outperformed U.S. Treasuries during the Reporting Period, was advantageous as well.
Individual issue selection within the investment grade corporate bond and collateralized sectors enhanced relative performance. Among corporate bonds, investments in the financials and industrials sub-sectors boosted returns. Within the collateralized sector, the Fund benefited from its holdings in non-agency adjustable-rate mortgages (“ARMs”) and pass-through mortgage securities. (Pass-through mortgage securities consist of a pool of residential mortgage loans, where homeowners’ monthly payments of principal, interest and prepayments pass from the original bank through a government agency or investment bank to investors.) Our issue selection among asset-backed securities (“ABS”) and covered bonds also added value. Detracting slightly was issue selection among commercial mortgage-backed securities (“CMBS”).
Did the Fund’s duration and yield curve positioning strategy help or hurt its results during the Reporting Period?
Tactical management of the Fund’s duration and yield curve positioning added to its relative returns for the Reporting Period overall. At the beginning of the Reporting Period, the Fund held a short duration position relative to that of the Barclays Index because we believed that interest rates would begin to increase when the Fed’s Operation Twist concluded in June 2012. (Ultimately, the Fed extended Operation Twist to the end of December 2012.) In the second quarter, as riskier asset classes declined on further evidence of slowing global economic growth and renewed tensions in Europe, we maintained the Fund’s short duration positioning relative to the Barclays Index. We subsequently shifted the Fund to a longer duration position relative to the Barclays Index in response to the Fed’s commitment to keep short-term interest rates low and based on our outlook for subdued economic growth and deteriorating financial conditions in Europe. This positioning contributed positively as U.S. economic data weakened and concerns about Spanish and Italian debt increased. In addition, during the third quarter, the Fund benefited from its longer duration position in U.S. and German government bonds, concentrated in the intermediate segment of the yield curve, as yields declined. In the fourth quarter, as interest rates moved higher, this longer duration positioning detracted. By the end of the Reporting Period, we had shifted the Fund to a shorter duration position relative to the Barclays Index once again.
How did the Fund use derivatives and similar instruments during the Reporting Period?
As market conditions warranted during the Reporting Period, currency transactions were carried out using primarily over-the-counter (“OTC”) forward foreign exchange contracts. Currency transactions were used as we sought both to enhance
6
GOLDMAN SACHS VARIABLE INSURANCE TRUST CORE FIXED INCOME FUND
returns and to hedge the Fund’s portfolio against currency exchange rate fluctuations. Also, Treasury futures were used as warranted to facilitate specific duration, yield curve and country strategies. Overall, we employ derivatives and similar instruments for the efficient management of the Fund’s portfolio. Derivatives and similar instruments allow us to manage interest rate, credit and currency risks more effectively by allowing us both to hedge and to apply active investment views with greater versatility and to afford greater risk management precision than we would otherwise be able to implement.
Were there any notable changes in the Fund’s weightings during the Reporting Period?
As mentioned earlier, we actively adjusted the Fund’s duration as market conditions shifted. From a sector perspective, we maintained the Fund’s overweight in non-agency mortgage-backed securities. In July and August 2012, the Fund held a substantial overweight in agency mortgage-backed securities because we believed the Fed would re-enter the market and begin purchasing the securities. As the market similarly anticipated Fed action, spreads, or yield differentials to U.S. Treasuries, tightened, and we began unwinding the Fund’s position before the Fed actually announced its open-ended mortgage purchases. After the announcement, agency mortgage-backed security spreads tightened further.
During the first half of the Reporting Period, we shifted the Fund from an underweight in pass-through mortgage securities to a significant overweight. In the second half, we reduced the Fund’s allocation to pass-through mortgage securities to a more modest overweighted position. We increased the Fund’s already overweight position in corporate credit toward the end of the Reporting Period.
How was the Fund positioned relative to the Barclays Index at the end of the Reporting Period?
At the end of the Reporting Period, the Fund was underweight U.S. government securities and overweight investment grade corporate bonds relative to the Barclays Index. It was overweight quasi-government bonds, ABS, CMBS, residential mortgage-backed securities and pass-through mortgage securities. In addition, the Fund had exposure to covered bonds and emerging markets debt.
7
FUND BASICS
Core Fixed Income Fund
as of December 31, 2012
STANDARDIZED TOTAL RETURNS1
| For the period ended 12/31/12 | One Year | Five Year | Since Inception | Inception Date | ||||||||||
| Service | 6.70 | % | 5.10 | % | 5.21 | % | 1/09/06 | |||||||
| 1 | The Standardized Total Returns are average annual total returns as of the most recent calendar quarter-end. They assume reinvestment of all distributions at net asset value (“NAV”). Because Service Shares do not involve a sales charge, such a charge is not applied to their Standardized Total Returns. |
Total return figures in the above chart represent past performance and do not indicate future results, which will vary. The investment return and principal value of an investment will fluctuate and, therefore, an investor’s shares, when redeemed, may be worth more or less than their original cost. Current performance may be lower or higher than the total return figures in the above chart. Please visit www.goldmansachsfunds.com/vit to obtain the most recent month-end returns. Performance reflects fee waivers and/or expense limitations in effect. In their absence, performance would be reduced.
EXPENSE RATIOS2
| Net Expense Ratio (Current) | Gross Expense Ratio (Before Waivers) | |||||||
| Service | 0.67 | % | 0.83 | % | ||||
| 2 | The expense ratios of the Fund, both current (net of applicable fee waivers and/or expense limitations) and before waivers (gross of applicable fee waivers and/or expense limitations) are as set forth above according to the most recent publicly available Prospectus for the Fund and may differ from the expense ratios disclosed in the Financial Highlights in this report. The Fund’s waivers and/or expense limitations will remain in place through at least April 27, 2013, and prior to such date the investment adviser may not terminate the arrangements without the approval of the Fund’s Board of Trustees. If these arrangements are discontinued in the future, the expense ratios may change without shareholder approval. |
8
FUND BASICS
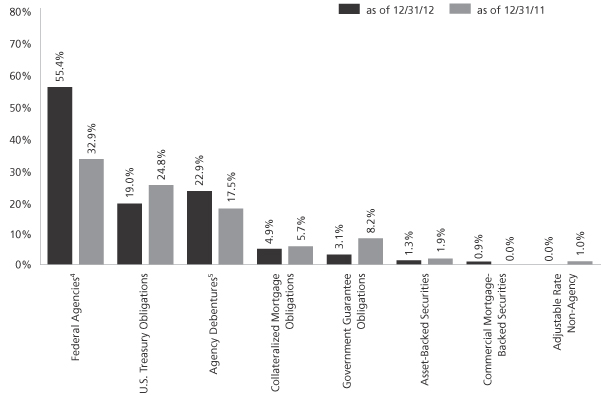
FUND COMPOSITION3
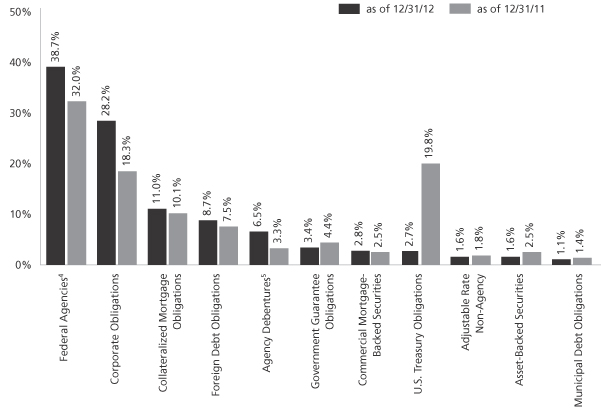
| 3 | The percentage shown for each investment category reflects the value of investments in that category as a percentage of net assets. Figures in the above graph may not sum to 100% due to the exclusion of other assets and liabilities. The graph depicts the Fund’s investments but may not represent the Fund’s market exposure due to the exclusion of certain derivatives, if any, as listed in the Additional Investment Information section of the Schedule of Investments. |
| 4 | “Federal Agencies” are mortgage-backed securities guaranteed by the Government National Mortgage Association (“GNMA”), Federal National Mortgage Association (“FNMA”) and Federal Home Loan Mortgage Corp. (“FHLMC”). GNMA instruments are backed by the full faith and credit of the United States Government. |
| 5 | “Agency Debentures” include agency securities offered by companies such as FNMA and FHLMC, which operate under a government charter. While they are required to report to a government regulator, their assets are not explicitly guaranteed by the government and they otherwise operate like any other publicly traded company. |
9
GOLDMAN SACHS VARIABLE INSURANCE TRUST CORE FIXED INCOME FUND
Performance Summary
December 31, 2012
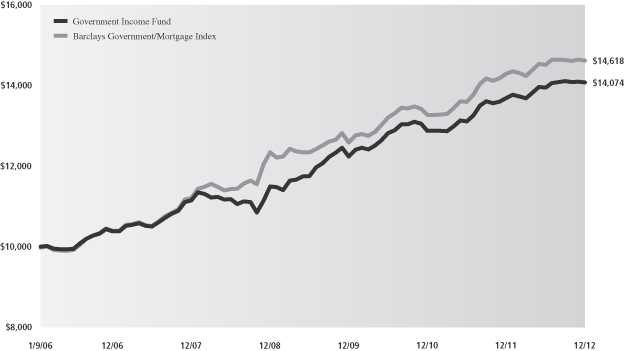
The following graph shows the value, as of December 31, 2012, of a $10,000 investment made in the Fund on January 9, 2006 (commencement of operations). For comparative purposes, the performance of the Fund’s benchmark, the Barclays U.S. Aggregate Bond Index, is shown. This performance data represents past performance and should not be considered indicative of future performance, which will fluctuate with changes in market conditions. These performance fluctuations will cause an investor’s shares, when redeemed, to be worth more or less than their original cost. Performance reflects Fund level expenses, but does not reflect fees and expenses associated with any variable annuity contract or variable life insurance policy that uses the Fund as an investment option for any contract or policy. Had performance reflected all of those fees and expenses, performance would have been reduced. Performance also would have been reduced had expense limitations not been in effect. In addition to the investment adviser’s decisions regarding issuer/industry/country investment selection and allocation, other factors may affect Fund performance. These factors include, but are not limited to, Fund operating fees and expenses, portfolio turnover, and subscription and redemption cash flows affecting the Fund.
Core Fixed Income Fund’s Lifetime Performance
Performance of a $10,000 investment, with distributions reinvested, from January 9, 2006 through December 31, 2012.
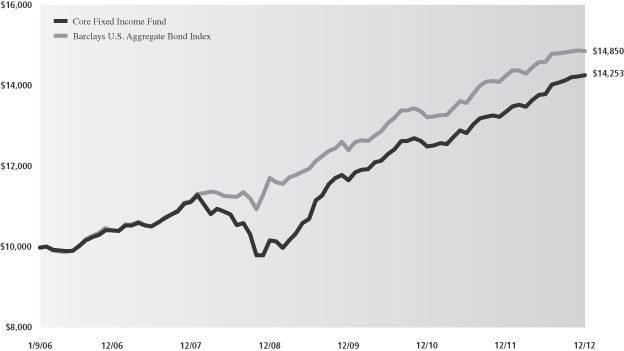
| Average Annual Total Return through December 31, 2012 | One Year | Five Years | Since Inception | |||
Core Fixed Income Fund (Commenced January 9, 2006) | 6.70% | 5.10% | 5.21% |
10
GOLDMAN SACHS VARIABLE INSURANCE TRUST EQUITY INDEX FUND
INVESTMENT OBJECTIVE
The Fund seeks to achieve investment results that correspond to the aggregate price and yield performance of a benchmark index that measures the investment returns of large capitalization stocks.
Portfolio Management Discussion and Analysis
Below, SSgA Funds Management, Inc. (“SSgA”), the Fund’s Subadvisor, discusses the Goldman Sachs Variable Insurance Trust — Goldman Sachs Equity Index Fund’s (the “Fund”) performance and positioning for the 12-month period ended December 31, 2012 (the “Reporting Period”).
How did the Fund perform during the Reporting Period?
During the Reporting Period, the Fund’s Service Shares generated an average annual total return of 15.50%. This return compares to the 15.96% average annual total return of the Fund’s benchmark, the Standard & Poor’s® 500 Index (with dividends reinvested) (the “S&P 500 Index”), during the same time period.
During the Reporting Period, which sectors and which industries in the S&P 500 Index were the strongest contributors to the Fund’s performance?
All 10 sectors in the S&P 500 Index recorded gains during the Reporting Period. In terms of total return, the sectors that made the strongest positive contributions to the S&P 500 Index and to the Fund were financials, consumer discretionary and health care. The largest sector by weighting in the S&P 500 Index at the end of the Reporting Period was information technology at a weighting of 19.03%. The industries with the strongest performance in terms of total return were diversified financials; media; retailing; banks; and customer durables and apparel.
On the basis of impact (which takes both total returns and weightings into account), the sectors that made the strongest positive contributions to the S&P 500 Index and to the Fund were financials, information technology and consumer discretionary. The industries with the strongest performance on the basis of impact were diversified financials; software and services; pharmaceuticals, biotechnology and life sciences; capital goods; and media.
Which sectors and industries in the S&P 500 Index were the weakest contributors to the Fund’s performance?
During the Reporting Period, the utilities, energy and consumer staples sectors were the weakest performing sectors in terms of total return. The weakest performing industries in terms of total return were semiconductors and semiconductor equipment; utilities; consumer services; energy; and transportation.
On the basis of impact, utilities, energy and materials were the weakest performing sectors. The weakest performing industries on the basis of impact were semiconductors and semiconductor equipment; utilities; consumer services; commercial and professional services; and transportation.
Which individual stocks were the top performers, and which were the greatest detractors?
On the basis of impact, the stocks that made the strongest positive contribution were Apple, Bank of America, JPMorgan Chase, Citigroup and Comcast. The weakest performers were Hewlett-Packard, Intel, Occidental Petroleum, McDonald’s and Exelon.
How did the Fund use derivatives and similar instruments during the Reporting Period?
During the Reporting Period, we did not use derivatives as part of an active management strategy to add value to the Fund’s results. However, we used equity index futures to equitize the Fund’s cash holdings. In other words, we put the Fund’s cash holdings to work by using them as collateral for the purchase of equity index futures. We also used these equity index futures to provide liquidity for daily cash flow requirements.
What changes were made to the makeup of the S&P 500 Index during the Reporting Period?
Eighteen stocks were removed from the S&P 500 Index during the Reporting Period. They were Compuware, Constellation Energy Group, Medco Health Solutions, Supervalu, Motorola Mobility Holdings, El Paso, Novellus Systems, Sara Lee, Progress Energy, Goodrich, Sears Holdings, Lexmark International, DeVry, Alpha Natural Resources, Sunoco, Cooper Industries, R.R. Donnelly and Sons, and Titanium Metals.
There were also 18 additions to the S&P 500 Index during the Reporting Period. They were WPX Energy, Crown Castle International, Fossil, Phillips 66, Kinder Morgan, Alexion Pharmaceuticals, Lam Research, Monster Beverage, Seagate Technology, Ensco, LyondellBasell Industries, ADT, Pentair, Kraft Foods Group, PetSmart, Dollar General, Garmin and Delphi Automotive.
11
FUND BASICS
Equity Index Fund
as of December 31, 2012
STANDARDIZED TOTAL RETURNS1
| For the period ended 12/31/12 | One Year | Five Year | Since Inception | Inception Date | ||||||||||
| Service | 15.50 | % | 1.37 | % | 3.42 | % | 1/09/06 | |||||||
| 1 | The Standardized Total Returns are average annual total returns as of the most recent calendar quarter-end. They assume reinvestment of all distributions at net asset value (“NAV”). Because Service Shares do not involve a sales charge, such a charge is not applied to their Standardized Total Returns. |
Total return figures in the above chart represent past performance and do not indicate future results, which will vary. The investment return and principal value of an investment will fluctuate and, therefore, an investor’s shares, when redeemed, may be worth more or less than their original cost. Current performance may be lower or higher than the total return figures in the above chart. Please visit www.goldmansachsfunds.com/vit to obtain the most recent month-end returns. Performance reflects fee waivers and/or expense limitations in effect. In their absence, performance would be reduced.
EXPENSE RATIOS2
| Net Expense Ratio (Current) | Gross Expense Ratio (Before Waivers) | |||||||
| Service | 0.48 | % | 0.70 | % | ||||
| 2 | The expense ratios of the Fund, both current (net of applicable fee waivers and/or expense limitations) and before waivers (gross of applicable fee waivers and/or expense limitations) are as set forth above according to the most recent publicly available Prospectus for the Fund and may differ from the expense ratios disclosed in the Financial Highlights in this report. The Fund’s waivers and/or expense limitations will remain in place through at least April 27, 2013, and prior to such date the investment adviser may not terminate the arrangements without the approval of the Fund’s Board of Trustees. If these arrangements are discontinued in the future, the expense ratios may change without shareholder approval. |
TOP TEN HOLDINGS AS OF 12/31/123
| Holding | % of Net Assets | Line of Business | ||||
| Apple, Inc. | 3.9% | Technology Hardware & Equipment | ||||
| Exxon Mobil Corp. | 3.1 | Energy | ||||
| General Electric Co. | 1.7 | Capital Goods | ||||
| Chevron Corp. | 1.7 | Energy | ||||
| International Business Machines Corp. | 1.6 | Software & Services | ||||
| Microsoft Corp. | 1.6 | Software & Services | ||||
| Johnson & Johnson | 1.5 | Pharmaceuticals, Biotechnology & Life Sciences | ||||
| AT&T, Inc. | 1.5 | Telecommunication Services | ||||
| Google, Inc. Class A | 1.5 | Software & Services | ||||
| The Procter & Gamble Co. | 1.4 | Household & Personal Products | ||||
| 3 | The top 10 holdings may not be representative of the Fund’s future investments. |
12
FUND BASICS
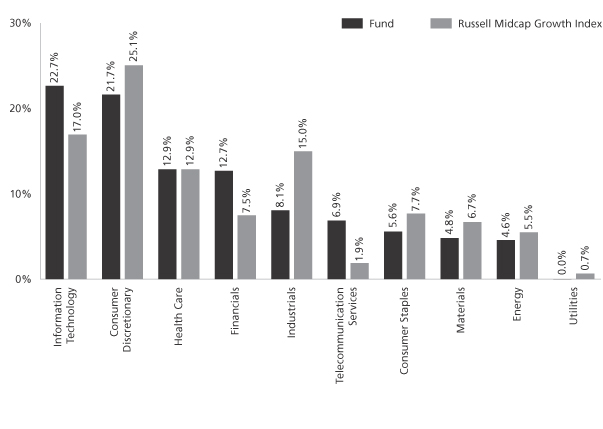
FUND VS. BENCHMARK SECTOR ALLOCATIONS4
As of December 31, 2012
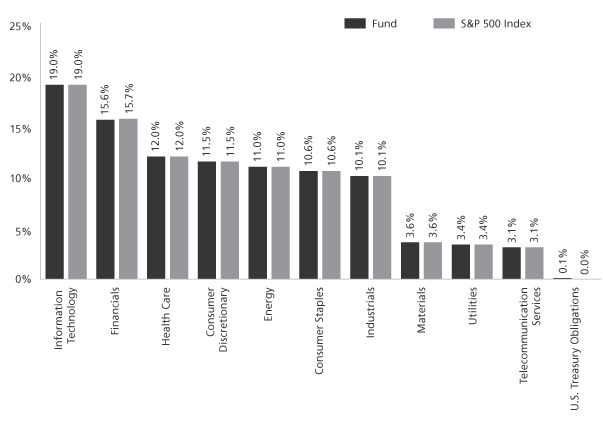
| 4 | The Fund’s composition may differ over time. Consequently, the Fund’s overall sector allocations may differ from percentages contained in the graph above. The graph categorizes investments using Global Industry Classification Standard (“GICS”), however, the sector classifications used by the portfolio management team may differ from GICS. The percentage shown for each investment category reflects the value of investments in that category as a percentage of market value. The graph depicts the Fund’s investments but may not represent the Fund’s market exposure due to the exclusion of certain derivatives, if any, as listed in the Additional Investment Information section of the Schedule of Investments. |
13
GOLDMAN SACHS VARIABLE INSURANCE TRUST EQUITY INDEX FUND
Performance Summary
December 31, 2012
The following graph shows the value, as of December 31, 2012, of a $10,000 investment made in the Fund on January 9, 2006 (commencement of operations). For comparative purposes, the performance of the Fund’s benchmark, the S&P 500 Index (with dividends reinvested), is shown. This performance data represents past performance and should not be considered indicative of future performance, which will fluctuate with changes in market conditions. These performance fluctuations will cause an investor’s shares, when redeemed, to be worth more or less than their original cost. Performance reflects Fund level expenses, but does not reflect fees and expenses associated with any variable annuity contract or variable life insurance policy that uses the Fund as an investment option for any contract or policy. Had performance reflected all of those fees and expenses, performance would have been reduced. Performance also would have been reduced had expense limitations not been in effect. In addition to the investment adviser’s decisions regarding issuer/industry investment selection and allocation, other factors may affect Fund performance. These factors include, but are not limited to, Fund operating fees and expenses, portfolio turnover, and subscription and redemption cash flows affecting the Fund.
Equity Index Fund’s Lifetime Performance
Performance of a $10,000 investment, with distributions reinvested, from January 9, 2006 through December 31, 2012.
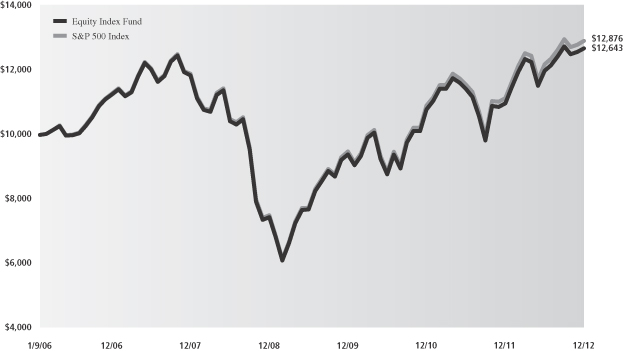
| Average Annual Total Return through December 31, 2012 | One Year | Five Years | Since Inception | |||
Equity Index Fund (Commenced January 9, 2006) | 15.50% | 1.37% | 3.42% |
14
GOLDMAN SACHS VARIABLE INSURANCE TRUST GOVERNMENT INCOME FUND
INVESTMENT OBJECTIVE
The Fund seeks a high level of current income, consistent with safety of principal.
Portfolio Management Discussion and Analysis
Below, the Goldman Sachs Fixed Income Investment Management Team discusses the Goldman Sachs Variable Insurance Trust — Goldman Sachs Government Income Fund’s (the “Fund”) performance and positioning for the 12-month period ended December 31, 2012 (the “Reporting Period”).
How did the Fund perform during the Reporting Period?
During the Reporting Period, the Fund’s Service Shares generated an average annual total return of 2.78%. This return compares to the 2.26% average annual total return of the Fund’s benchmark, the Barclays Government/Mortgage Index (the “Barclays Index”) during the same time period.
What key factors were responsible for the Fund’s performance during the Reporting Period?
Bottom-up individual issue selection within the collateralized sector added the most to the Fund’s relative returns during the Reporting Period. Our top-down cross-sector strategy also enhanced relative performance. Our cross-sector strategy is one in which we invest Fund assets across a variety of fixed income sectors, including some that may not be included in the Barclays Index. In addition, the Fund’s duration and U.S. yield curve positioning relative to the Barclays Index contributed positively. Duration is a measure of the Fund’s sensitivity to changes in interest rates. Yield curve indicates a spectrum of maturities.
Which fixed income market sectors most affected Fund performance?
As riskier asset classes rallied during the Reporting Period, the Fund benefited from its exposure to agency mortgage-backed securities, non-agency mortgage-backed securities (which are not represented in the Barclays Index) and asset-backed securities (“ABS”). More specifically, from the beginning of the Reporting Period until September 2012, when the Fed announced its third round of quantitative easing, the Fund’s overweight in agency mortgage-backed securities and its “down in coupon” focus (or, its emphasis on those securities with lower interest rates) added to relative results. In the fourth calendar quarter, the Fund’s investments in premium and super-premium agency mortgage-backed securities were particularly advantageous.
The Fund also benefited from individual issue selection within the collateralized sector. More specifically, the Fund’s holdings of pass-through mortgage securities boosted relative performance. (Pass-through mortgages consist of a pool of residential mortgage loans, where homeowners’ monthly payments of principal, interest and prepayments pass from the original bank through a government agency or investment bank to investors.) Our investments among commercial mortgage-backed securities (“CMBS”) also added to Fund performance. In addition, the Fund benefited from issue selection among both U.S. Treasury securities of between two-year and six-year maturities and longer maturity Treasury Inflation Protected Securities (“TIPS”).
Detracting was our individual issue selection within the government/agency sector, specifically the Fund’s exposure to select agency bonds.
Did the Fund’s duration and yield curve positioning strategy help or hurt its results during the Reporting Period?
Tactical management of the Fund’s duration and yield curve positioning added to its relative returns. The Fund benefited from its short duration position relative to that of the Barclays Index during the first quarter of 2012, as 10-year U.S. Treasury yields increased in response to improved U.S. economic data and subdued volatility surrounding the European sovereign debt crisis. During the second calendar quarter, 10-year U.S. Treasury yields fell sharply amidst renewed worries about Europe’s financial problems. We shifted the Fund to a longer duration position relative to the Barclays Index, which enhanced relative results. In the third calendar quarter, we shortened the Fund’s duration stance again, and its duration and yield curve positioning had a minimally positive impact on relative performance. During the fourth calendar quarter, the Fund’s short duration position relative to the Barclays Index detracted from relative returns. More specifically, the Fund’s underweight in U.S. Treasuries with 10-year and 30-year maturities was a drag on performance as interest rates fell during November.
15
GOLDMAN SACHS VARIABLE INSURANCE TRUST GOVERNMENT INCOME FUND
How did the Fund use derivatives and similar instruments during the Reporting Period?
As market conditions warranted during the Reporting Period, the Fund engaged in U.S. Treasury futures to hedge interest rate exposure and facilitate specific duration and yield curve strategies.
Were there any notable changes in the Fund’s weightings during the Reporting Period?
As mentioned earlier, in implementing our active duration strategy, we shifted the Fund’s duration from a shorter position than that of the Barclays Index to a comparatively longer duration position in late April in response to the Fed’s easing bias, our outlook for a continuation of subdued economic growth and deterioration in overall financial conditions. We then shifted the Fund to a shorter duration bias during the third calendar quarter as turmoil in Europe appeared to support an increase in interest rates.
From a sector perspective, we tactically shifted the Fund’s position in agency mortgage-backed securities, such that at the end of the second calendar quarter, the Fund was overweight agency mortgage-backed securities. We maintained a substantial overweight overall to agency mortgage-backed securities through September 2012 when the Fed announced a third round of quantitative easing. Because of improving housing fundamentals, the Fund had exposure to non agency mortgage-backed securities throughout the Reporting Period.
How was the Fund positioned relative to the Barclays Index at the end of the Reporting Period?
At the end of the Reporting Period, the Fund was significantly underweight U.S. government securities relative to the Barclays Index. It was overweight quasi-government bonds, ABS, residential mortgage-backed securities, agency collateralized mortgage obligations and pass-through mortgage securities.
16
FUND BASICS
Government Income Fund
as of December 31, 2012
STANDARDIZED TOTAL RETURNS1
| For the period ended 12/31/12 | One Year | Five Year | Since Inception | Inception Date | ||||||||||
| Service | 2.78 | % | 4.77 | % | 5.02 | % | 1/09/06 | |||||||
| 1 | The Standardized Total Returns are average annual total returns as of the most recent calendar quarter-end. They assume reinvestment of all distributions at net asset value (“NAV”). Because Service Shares do not involve a sales charge, such a charge is not applied to their Standardized Total Returns. |
Total return figures in the above chart represent past performance and do not indicate future results, which will vary. The investment return and principal value of an investment will fluctuate and, therefore, an investor’s shares, when redeemed, may be worth more or less than their original cost. Current performance may be lower or higher than the total return figures in the above chart. Please visit www.goldmansachsfunds.com/vit to obtain the most recent month-end returns. Performance reflects fee waivers and/or expense limitations in effect. In their absence, performance would be reduced.
EXPENSE RATIOS2
| Net Expense Ratio (Current) | Gross Expense Ratio (Before Waivers) | |||||||
| Service | 0.81 | % | 1.13 | % | ||||
| 2 | The expense ratios of the Fund, both current (net of applicable fee waivers and/or expense limitations) and before waivers (gross of applicable fee waivers and/or expense limitations) are as set forth above according to the most recent publicly available Prospectus for the Fund and may differ from the expense ratios disclosed in the Financial Highlights in this report. The Fund’s waivers and/or expense limitations will remain in place through at least April 27, 2013, and prior to such date the investment adviser may not terminate the arrangements without the approval of the Fund’s Board of Trustees. If these arrangements are discontinued in the future, the expense ratios may change without shareholder approval. |
17
FUND BASICS
FUND COMPOSITION3
| 3 | The percentage shown for each investment category reflects the value of investments in that category as a percentage of net assets. Figures in the graph may not sum to 100% due to the exclusion of other assets and liabilities. The graph depicts the Fund’s investments but may not represent the Fund’s market exposure due to the exclusion of certain derivatives, if any, as listed in the Additional Investment Information section of the Schedule of Investments. |
| 4 | “Federal Agencies” are mortgage-backed securities guaranteed by the Government National Mortgage Association (“GNMA”), Federal National Mortgage Association (“FNMA”) and Federal Home Loan Mortgage Corp. (“FHLMC”). GNMA instruments are backed by the full faith and credit of the United States Government. |
| 5 | “Agency Debentures” include agency securities offered by companies such as FNMA and FHLMC, which operate under a government charter. While they are required to report to a government regulator, their assets are not explicitly guaranteed by the government and they otherwise operate like any other publicly traded company. |
18
GOLDMAN SACHS VARIABLE INSURANCE TRUST GOVERNMENT INCOME FUND
Performance Summary
December 31, 2012
The following graph shows the value, as of December 31, 2012, of a $10,000 investment made in the Fund on January 9, 2006 (commencement of operations). For comparative purposes, the performance of the Fund’s benchmark, the Barclays Government/Mortgage Index, is shown. This performance data represents past performance and should not be considered indicative of future performance, which will fluctuate with changes in market conditions. These performance fluctuations will cause an investor’s shares, when redeemed, to be worth more or less than their original cost. Performance reflects Fund level expenses, but does not reflect fees and expenses associated with any variable annuity contract or variable life insurance policy that uses the Fund as an investment option for any contract or policy. Had performance reflected all of those fees and expenses, performance would have been reduced. Performance also would have been reduced had expense limitations not been in effect. In addition to the investment adviser’s decisions regarding issuer/industry investment selection and allocation, other factors may affect Fund performance. These factors include, but are not limited to, Fund operating fees and expenses, portfolio turnover, and subscription and redemption cash flows affecting the Fund.
Government Income Fund’s Lifetime Performance
Performance of a $10,000 investment, with distributions reinvested, from January 9, 2006 through December 31, 2012.
| Average Annual Total Return through December 31, 2012 | One Year | Five Years | Since Inception | |||
Government Income Fund (Commenced January 9, 2006) | 2.78% | 4.77% | 5.02% |
19
GOLDMAN SACHS VARIABLE INSURANCE TRUST GROWTH OPPORTUNITIES FUND
INVESTMENT OBJECTIVE
The Fund seeks long-term growth of capital.
Portfolio Management Discussion and Analysis
Below, the Goldman Sachs Growth Equity Management Team discusses the Goldman Sachs Variable Insurance Trust — Goldman Sachs Growth Opportunities Fund’s (the “Fund”) performance and positioning for the 12-month period ended December 31, 2012 (the “Reporting Period”).
How did the Fund perform during the Reporting Period?
During the Reporting Period, the Fund’s Service Shares generated an average annual total return of 19.37%. This return compares to the 15.76% average annual total return of the Fund’s benchmark, the Russell Midcap® Growth Index (with dividends reinvested) (the “Russell Index”), during the same time period.
What key factors were responsible for the Fund’s performance during the Reporting Period?
The Fund outperformed the Russell Index largely because of effective stock selection.
Which equity market sectors contributed to Fund performance?
Our bottom-up approach focuses on security selection, and as a result, we do not make active sector-level investment decisions. That said, on a sector level, security selection in the information technology, telecommunication services and consumer discretionary sectors added to the Fund’s relative performance. Stock selection in the industrials, health care and materials sectors detracted from relative returns.
Which individual stocks added to the Fund’s relative performance during the Reporting Period?
Equinix, a leading data center solutions company, was the top contributor to the Fund’s relative returns during the Reporting Period. The company’s core business remained strong and its pricing up in the three main markets in which it operates — the U.S., Europe and Asia. Equinix also acquired data centers in Frankfurt, Hong Kong, Shanghai and Singapore to further drive growth. During the third quarter of 2012, the company announced its plans to convert to a real estate investment trust (“REIT”), which in our opinion should provide tax and valuation benefits. Meanwhile, during the Reporting Period, the market began to recognize that Equinix was trading at a discount to other data center operators that are publicly traded REITs and also to appreciate the growth and stability of Equinix’s revenue stream. At the end of the Reporting Period, we maintained conviction in the company’s ability to drive revenue growth, as it benefits from several secular growth drivers, including cloud computing, growth in Internet traffic and enterprise outsourcing, and rising demand for optimized network performance.
Another notable contributor during the Reporting Period was wireless communications infrastructure operator SBA Communications. Its shares performed well as it benefited from secular growth trends that are driving the wireless communication industry. We expect the company’s leasing revenues to continue to grow as wireless providers build out their 4G (fourth generation) networks to support increasing demand for mobile data usage. Furthermore, the company’s management is evaluating the possibility of converting SBA Communications into a REIT, which we believe could unlock further shareholder value. In our view, the secular growth trends driving the wireless communication industry remain intact as the industry continues to evolve from voice to data usage and as carriers must make additional investments in their networks to support increasing demand. We believe SBA Communications is well positioned to benefit from increased data usage, network upgrades and improved coverage as well as from regulations that govern the construction of new towers, which create high barriers to entry.
The Fund’s investment in PVH also contributed positively to relative performance. Shares of the apparel maker performed especially well during the second half of the Reporting Period on news of better than expected second quarter earnings. Earlier in 2012, PVH had faced economic headwinds in Europe as well as high cotton prices. However, cotton prices declined later in the Reporting Period. During the second calendar quarter, PVH’s Tommy Hilfiger brand was particularly strong in Europe. In November, the company share price rose to an all-time high following the announcement of its planned acquisition of Warnaco Group. Should the acquisition be completed, PVH would have full control of the Calvin Klein brand, which is widely expected to expand the company’s presence in Europe, Asia and Latin America. (The deal is expected to close in early 2013.) In our opinion, the acquisition could boost the company’s earnings and enhance its growth profile. We believe that PVH’s higher-margin brands,
20
GOLDMAN SACHS VARIABLE INSURANCE TRUST GROWTH OPPORTUNITIES FUND
such as Tommy Hilfiger and Calvin Klein, are likely to grow faster than the company’s heritage business and as a result, the company’s operating profit could accelerate meaningfully.
Which individual stocks detracted from the Fund’s performance during the Reporting Period?
A position in Deckers Outdoor detracted from the Fund’s relative returns during the Reporting Period. The company’s earnings and earnings guidance were disappointing during 2012, as the footwear and apparel designer continued to deal with the impact of an unseasonably warm 2011 winter, which had pressured its inventory position and profitability. In our view, the inventory pressure should subside over the course of 2013. We continue to believe in the strength of the company’s Ugg brand and expect Deckers Outdoor to show improved sales and profit margin expansion in 2013.
An investment in Rovi also hampered relative performance during the Reporting Period. Rovi holds patents on interactive program guides for video delivery services and devices. The Fund held the stock because we saw the growth potential of Rovi’s electronic programming guide business. However, after some management execution errors and delays in the market development of this key business, we lost confidence in the company’s ability to capitalize on the opportunity. We eliminated the Fund’s position and reallocated the capital to higher conviction names.
Another key detractor from the Fund’s results during the Reporting Period was NetApp, a developer of data storage hardware and software for enterprise clients. The company cut its revenue guidance in the second calendar quarter, citing macroeconomic weakness and softening industry trends. In addition, investors appeared concerned about a possible drop in 2012 year-end business technology spending. NetApp’s share price suffered the most during the second quarter and in October, but it began to recover toward the end of Reporting Period. We continue to believe NetApp has a strong competitive position in an industry benefiting from several secular growth trends, such as virtualization, which should increase demand for the company storage products. For example, NetApp specializes in network-attached storage that we believe should continue to take market share from direct-attached products. In our opinion, the company’s storage devices are easier to buy, install and manage than competing products, which should also drive market share gains.
Did the Fund make any significant purchases or sales during the Reporting Period?
The Fund bought shares of Family Dollar Stores during the Reporting Period. The company operates a chain of more than 7,000 general merchandise retail discount stores in 44 states, providing consumers with a diverse array of merchandise in neighborhood stores. We have confidence in the business strategy presented by the company’s new chief executive officer, which we expect to be implemented during the next few calendar quarters.
During the Reporting Period, we purchased shares of Activision Blizzard, a worldwide publisher of online, personal computer, console, handheld and mobile interactive entertainment products. Activision Blizzard owns three of the largest franchises in the electronic gaming industry — Call of Duty and Skylanders on gaming consoles and World of Warcraft on personal computers. World of Warcraft is offered through a monthly subscription model that provides a large and reliable cash flow stream, which can be used to invest in newer intellectual properties, such as Skylanders or Call of Duty. In our view, these newer intellectual properties, as well as upcoming new releases, have profit margin structures larger than the corporate average, and we believe they should drive the company’s operating margins higher over the next few years.
We initiated a position in Chipotle Mexican Grill, which develops and operates fast casual, fresh Mexican food restaurants throughout the U.S. and in select international locations. We believe that Chipotle Mexican Grill, with its unique business model and strong brand recognition, is a best-in-class franchise with attractive expansion opportunities both domestically and internationally. We are also confident in the management team’s ability to execute and in the company’s ability to maintain strong year-over-year sales growth, driven by sustained menu pricing power and continued high operating margins.
During the Reporting Period, the Fund sold its position in electronic transaction processing provider Global Payments as the ramifications of a security breach continued to unfold. While the fundamentals of the business did not materially change, we believe Global Payments’ sterling reputation has been tarnished. In the aftermath of the security breach, we saw potential for slowing growth in the company’s important sales channels within North America, which account for 70% of its total revenue.
We liquidated the Fund’s position in Western Union, which provides global money transfer services. Though Western Union’s transaction-based business model and free cash flow generation remained attractive, we were concerned about the company’s inability to increase revenue growth. In addition, Western Union issued 2012 earnings per share guidance that fell below expectations. Consequently, we eliminated the Fund’s position and reallocated the capital to higher conviction names.
21
GOLDMAN SACHS VARIABLE INSURANCE TRUST GROWTH OPPORTUNITIES FUND
We eliminated the Fund’s position in St. Jude Medical during the Reporting Period. Reports of safety and quality issues continued to be an overhang for the global medical device company, allowing competitors to grow their market share. St. Jude Medical was also experiencing pricing headwinds, with negative price pressure amid flat to marginal volume growth.
Were there any notable changes in the Fund’s weightings during the Reporting Period?
There were no notable changes in the Fund’s weightings during the Reporting Period.
How did the Fund use derivatives and similar instruments during the Reporting Period?
In keeping with its investment process, the Fund did not use derivatives during the Reporting Period.
How was the Fund positioned relative to the Russell Index at the end of the Reporting Period?
As mentioned, the Fund’s sector positioning relative to the Russell Index is the result of our stock selection, as we take a pure bottom-up, research-intensive approach to investing. From that perspective, then, at the end of the Reporting Period, the Fund’s portfolio was broadly diversified with overweighted positions compared to the Russell Index in the information technology, telecommunication services and financials. The Fund had smaller weightings than the Russell Index in the industrials sector, consumer discretionary, energy, consumer staples, utilities and materials sectors. It was relatively neutral compared to the Russell Index in the health care sector at the end of the Reporting Period.
22
FUND BASICS
Growth Opportunities Fund
as of December 31, 2012
STANDARDIZED TOTAL RETURNS1
| For the period ended 12/31/12 | One Year | Five Year | Since Inception | Inception Date | ||||||||||
| Service | 19.37 | % | 5.14 | % | 6.68 | % | 1/09/06 | |||||||
| 1 | The Standardized Total Returns are average annual total returns as of the most recent calendar quarter-end. They assume reinvestment of all distributions at net asset value (“NAV”). Because Service Shares do not involve a sales charge, such a charge is not applied to their Standardized Total Returns. |
Total return figures in the above chart represent past performance and do not indicate future results, which will vary. The investment return and principal value of an investment will fluctuate and, therefore, an investor’s shares, when redeemed, may be worth more or less than their original cost. Current performance may be lower or higher than the total return figures in the above chart. Please visit www.goldmansachsfunds.com/vit to obtain the most recent month-end returns. Performance reflects fee waivers and/or expense limitations in effect. In their absence, performance would be reduced.
EXPENSE RATIOS2
| Net Expense Ratio (Current) | Gross Expense Ratio (Before Waivers) | |||||||
| Service | 1.15 | % | 1.41 | % | ||||
| 2 | The expense ratios of the Fund, both current (net of applicable fee waivers and/or expense limitations) and before waivers (gross of applicable fee waivers and/or expense limitations) are as set forth above according to the most recent publicly available Prospectus for the Fund and may differ from the expense ratios disclosed in the Financial Highlights in this report. The Fund’s waivers and/or expense limitations will remain in place through at least April 27, 2013, and prior to such date the investment adviser may not terminate the arrangements without the approval of the Fund’s Board of Trustees. If these arrangements are discontinued in the future, the expense ratios may change without shareholder approval. |
TOP TEN HOLDINGS AS OF 12/31/123
| Holding | % of Net Assets | Line of Business | ||||
| SBA Communications Corp. Class A | 3.6% | Telecommunication Services | ||||
| PVH Corp. | 2.7 | Consumer Durables & Apparel | ||||
| CBRE Group, Inc. Class A | 2.3 | Real Estate | ||||
| Equinix, Inc. | 2.2 | Software & Services | ||||
| Rackspace Hosting, Inc. | 2.1 | Software & Services | ||||
| PetSmart, Inc. | 2.1 | Retailing | ||||
| Amphenol Corp. Class A | 2.0 | Technology Hardware & Equipment | ||||
| Agilent Technologies, Inc. | 2.0 | Pharmaceuticals, Biotechnology & Life Sciences | ||||
| Xilinx, Inc. | 1.9 | Semiconductors & Semiconductor Equipment | ||||
| Crown Castle International Corp. | 1.9 | Telecommunication Services | ||||
| 3 | The top 10 holdings may not be representative of the Fund’s future investments. |
23
FUND BASICS
FUND vs. BENCHMARK SECTOR ALLOCATIONS4
As of December 31, 2012
| 4 | The Fund is actively managed and, as such, its composition may differ over time. Consequently, the Fund’s overall sector allocations may differ from percentages contained in the graph above. The graph categorizes investments using Global Industry Classification Standard (“GICS”), however, the sector classifications used by the portfolio management team may differ from GICS. The percentage shown for each investment category reflects the value of investments in that category as a percentage of market value. The graph depicts the Fund’s investments but may not represent the Fund’s market exposure due to the exclusion of certain derivatives, if any, as listed in the Additional Investment Information section of the Schedule of Investments. |
24
GOLDMAN SACHS VARIABLE INSURANCE TRUST GROWTH OPPORTUNITIES FUND
Performance Summary
December 31, 2012
The following graph shows the value, as of December 31, 2012, of a $10,000 investment made in the Fund on January 9, 2006 (commencement of operations). For comparative purposes, the performance of the Fund’s benchmark, the Russell Midcap Growth Index (with dividends reinvested), is shown. This performance data represents past performance and should not be considered indicative of future performance which will fluctuate with changes in market conditions. These performance fluctuations will cause an investor’s shares, when redeemed, to be worth more or less than their original cost. Performance reflects Fund level expenses, but does not reflect fees and expenses associated with any variable annuity contract or variable life insurance policy that uses the Fund as an investment option for any contract or policy. Had performance reflected all of those fees and expenses, performance would have been reduced. Performance also would have been reduced had expense limitations not been in effect. In addition to the investment adviser’s decisions regarding issuer/industry investment selection and allocation, other factors may affect Fund performance. These factors include, but are not limited to, Fund operating fees and expenses, portfolio turnover, and subscription and redemption cash flows affecting the Fund.
Growth Opportunities Fund’s Lifetime Performance
Performance of a $10,000 investment, with distributions reinvested, from January 9, 2006 through December 31, 2012.
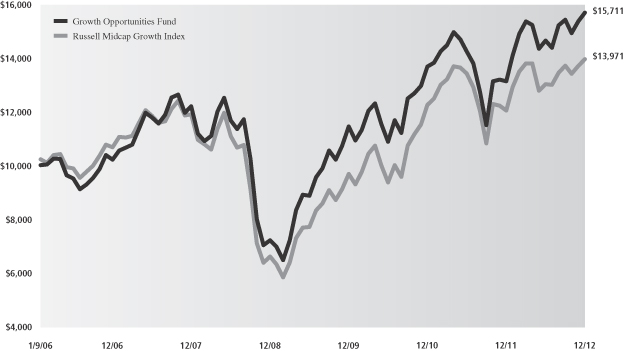
| Average Annual Total Return through December 31, 2012 | One Year | Five Years | Since Inception | |||
Growth Opportunities Fund (Commenced January 9, 2006) | 19.37% | 5.14% | 6.68% |
25
GOLDMAN SACHS VARIABLE INSURANCE TRUST CORE FIXED INCOME FUND
Schedule of Investments
December 31, 2012
| Principal Amount | Interest Rate | Maturity Date | Value | |||||||||
| Corporate Obligations – 28.2% | ||||||||||||
| Automobiles & Components – 0.4% |
| ||||||||||
| Ford Motor Credit Co. LLC |
| ||||||||||
| $ | 525,000 | 3.984% | 06/15/16 | $ | 553,875 | |||||||
|
| |||||||||||
| Banks – 6.9% |
| ||||||||||
| Abbey National Treasury Services PLC |
| ||||||||||
| 175,000 | 2.875 | 04/25/14 | 177,543 | |||||||||
| ANZ Capital Trust II(a)(b) |
| ||||||||||
| 425,000 | 5.360 | 12/15/53 | 433,500 | |||||||||
| Bank of America Corp. |
| ||||||||||
| 225,000 | 6.000 | 09/01/17 | 263,625 | |||||||||
| 200,000 | 5.750 | 12/01/17 | 232,744 | |||||||||
| 100,000 | 5.625 | 07/01/20 | 117,903 | |||||||||
| 350,000 | 5.700 | 01/24/22 | 420,900 | |||||||||
| Barclays Bank PLC(b) |
| ||||||||||
| 125,000 | 6.050 | 12/04/17 | 138,299 | |||||||||
| Capital One Bank NA |
| ||||||||||
| 300,000 | 8.800 | 07/15/19 | 404,797 | |||||||||
| Capital One Financial Corp. |
| ||||||||||
| 225,000 | 1.000 | 11/06/15 | 223,728 | |||||||||
| CBA Capital Trust II(a)(b)(c) |
| ||||||||||
| 325,000 | 6.024 | 12/31/49 | 331,849 | |||||||||
| Citigroup, Inc. |
| ||||||||||
| 600,000 | 5.000 | 09/15/14 | 632,064 | |||||||||
| 175,000 | 4.500 | 01/14/22 | 195,391 | |||||||||
| ING Bank N.V.(b) |
| ||||||||||
| 450,000 | 2.000 | 09/25/15 | 453,330 | |||||||||
| JPMorgan Chase & Co. |
| ||||||||||
| 100,000 | 3.250 | 09/23/22 | 102,971 | |||||||||
| Merrill Lynch & Co., Inc. |
| ||||||||||
| 325,000 | 6.400 | 08/28/17 | 382,485 | |||||||||
| Mizuho Corporate Bank Ltd.(b) |
| ||||||||||
| 200,000 | 2.550 | 03/17/17 | 209,142 | |||||||||
| 225,000 | 2.950 | 10/17/22 | 222,238 | |||||||||
| Morgan Stanley & Co. |
| ||||||||||
| 325,000 | 6.250 | 08/28/17 | 374,148 | |||||||||
| 450,000 | 5.950 | 12/28/17 | 512,984 | |||||||||
| 125,000 | 5.500 | 07/24/20 | 139,750 | |||||||||
| 125,000 | 5.500 | 07/28/21 | 141,922 | |||||||||
| 125,000 | 4.875 | 11/01/22 | 129,215 | |||||||||
| Regions Financial Corp. |
| ||||||||||
| 325,000 | 5.750 | 06/15/15 | 351,406 | |||||||||
| Resona Bank Ltd.(a)(b)(c) |
| ||||||||||
| 650,000 | 5.850 | 12/31/49 | 699,730 | |||||||||
| Royal Bank of Scotland Group PLC |
| ||||||||||
| 250,000 | 2.550 | 09/18/15 | 255,592 | |||||||||
| Santander Holdings USA, Inc. |
| ||||||||||
| 75,000 | 3.000(a) | 09/24/15 | 76,432 | |||||||||
| 165,000 | 4.625 | 04/19/16 | 174,334 | |||||||||
| Standard Chartered PLC(b) |
| ||||||||||
| 150,000 | 5.500 | 11/18/14 | 161,535 | |||||||||
| The Bear Stearns Companies LLC |
| ||||||||||
| 400,000 | 7.250 | 02/01/18 | 500,650 | |||||||||
| Union Bank NA |
| ||||||||||
| 425,000 | 2.125 | 06/16/17 | 436,106 | |||||||||
|
| |||||||||||
| Principal Amount | Interest Rate | Maturity Date | Value | |||||||||
| Corporate Obligations – (continued) | ||||||||||||
| Banks – (continued) |
| ||||||||||
| Wachovia Bank NA |
| ||||||||||
| $ | 300,000 | 6.600% | 01/15/38 | $ | 410,472 | |||||||
|
| |||||||||||
| 9,306,785 | ||||||||||||
|
| |||||||||||
| Chemicals – 1.0% |
| ||||||||||
| CF Industries, Inc. |
| ||||||||||
| 150,000 | 6.875 | 05/01/18 | 182,625 | |||||||||
| Eastman Chemical Co. |
| ||||||||||
| 150,000 | 2.400 | 06/01/17 | 155,379 | |||||||||
| 150,000 | 4.800(a) | 09/01/42 | 162,208 | |||||||||
| Ecolab, Inc. |
| ||||||||||
| 450,000 | 4.350 | 12/08/21 | 503,403 | |||||||||
| NewMarket Corp.(b) |
| ||||||||||
| 225,000 | 4.100 | 12/15/22 | 229,560 | |||||||||
| The Dow Chemical Co. |
| ||||||||||
| 137,000 | 7.600 | 05/15/14 | 149,384 | |||||||||
|
| |||||||||||
| 1,382,559 | ||||||||||||
|
| |||||||||||
| Diversified Manufacturing – 0.4% |
| ||||||||||
| General Electric Co. |
| ||||||||||
| 300,000 | 2.700 | 10/09/22 | 305,246 | |||||||||
| Xylem, Inc. |
| ||||||||||
| 250,000 | 3.550 | 09/20/16 | 266,257 | |||||||||
|
| |||||||||||
| 571,503 | ||||||||||||
|
| |||||||||||
| Electric – 0.6% |
| ||||||||||
| PPL WEM Holdings PLC(a)(b) |
| ||||||||||
| 220,000 | 5.375 | 05/01/21 | 247,871 | |||||||||
| Progress Energy, Inc. |
| ||||||||||
| 350,000 | 7.000 | 10/30/31 | 448,469 | |||||||||
| Puget Sound Energy, Inc. Series A(a)(c) |
| ||||||||||
| 75,000 | 6.974 | 06/01/67 | 79,594 | |||||||||
|
| |||||||||||
| 775,934 | ||||||||||||
|
| |||||||||||
| Energy – 4.1% |
| ||||||||||
| Anadarko Petroleum Corp. |
| ||||||||||
| 125,000 | 6.375 | 09/15/17 | 149,145 | |||||||||
| BG Energy Capital PLC(a)(c) |
| ||||||||||
| 325,000 | 6.500 | 11/30/72 | 349,102 | |||||||||
| BP Capital Markets PLC |
| ||||||||||
| 225,000 | 3.200 | 03/11/16 | 239,888 | |||||||||
| 500,000 | 4.500 | 10/01/20 | 576,627 | |||||||||
| 145,000 | 3.561 | 11/01/21 | 156,920 | |||||||||
| Dolphin Energy Ltd.(b) |
| ||||||||||
| 181,512 | 5.888 | 06/15/19 | 204,993 | |||||||||
| 200,000 | 5.500 | 12/15/21 | 233,300 | |||||||||
| Gazprom OAO Via Gaz Capital SA(d) |
| ||||||||||
| 350,000 | 9.250 | 04/23/19 | 460,687 | |||||||||
| Nexen, Inc. |
| ||||||||||
| 150,000 | 5.875 | 03/10/35 | 185,673 | |||||||||
| 305,000 | 6.400 | 05/15/37 | 396,480 | |||||||||
| Pemex Project Funding Master Trust |
| ||||||||||
| 150,000 | 6.625 | 06/15/35 | 190,125 | |||||||||
|
| |||||||||||
| 26 | The accompanying notes are an integral part of these financial statements. |
GOLDMAN SACHS VARIABLE INSURANCE TRUST CORE FIXED INCOME FUND
| Principal Amount | Interest Rate | Maturity Date | Value | |||||||||
| Corporate Obligations – (continued) | ||||||||||||
| Energy – (continued) |
| ||||||||||
| Petrobras International Finance Co. |
| ||||||||||
| $ | 40,000 | 5.750% | 01/20/20 | $ | 45,416 | |||||||
| 190,000 | 5.375 | 01/27/21 | 213,484 | |||||||||
| PTTEP Canada International Finance Ltd.(b) |
| ||||||||||
| 240,000 | 5.692 | 04/05/21 | 277,497 | |||||||||
| Ras Laffan Liquefied Natural Gas Co. Ltd. III(b) |
| ||||||||||
| 250,000 | 5.500 | 09/30/14 | 268,887 | |||||||||
| Rosneft Oil Co. via Rosneft International Finance Ltd.(b) |
| ||||||||||
| 200,000 | 4.199 | 03/06/22 | 204,586 | |||||||||
| TNK-BP Finance SA |
| ||||||||||
| 140,000 | 7.875 | 03/13/18 | 170,100 | |||||||||
| Transocean, Inc. |
| ||||||||||
| 100,000 | 4.950 | 11/15/15 | 109,451 | |||||||||
| 625,000 | 6.500 | 11/15/20 | 755,781 | |||||||||
| 125,000 | 6.375 | 12/15/21 | 151,868 | |||||||||
| Weatherford International Ltd. |
| ||||||||||
| 175,000 | 9.625 | 03/01/19 | 228,250 | |||||||||
|
| |||||||||||
| 5,568,260 | ||||||||||||
|
| |||||||||||
| Food & Beverage – 1.4% |
| ||||||||||
| Heineken NV(b) |
| ||||||||||
| 225,000 | 3.400 | 04/01/22 | 234,690 | |||||||||
| Kraft Foods Group, Inc.(b) |
| ||||||||||
| 275,000 | 6.125 | 08/23/18 | 336,628 | |||||||||
| Mondelez International, Inc. |
| ||||||||||
| 150,000 | 5.375 | 02/10/20 | 181,663 | |||||||||
| 200,000 | 6.500 | 02/09/40 | 268,667 | |||||||||
| Pernod-Ricard SA(b) |
| ||||||||||
| 575,000 | 4.450 | 01/15/22 | 635,751 | |||||||||
| SABMiller Holdings, Inc.(b) |
| ||||||||||
| 275,000 | 2.450 | 01/15/17 | 286,659 | |||||||||
|
| |||||||||||
| 1,944,058 | ||||||||||||
|
| |||||||||||
| Food & Staples Retailing – 0.6% |
| ||||||||||
| CVS Caremark Corp.(a) |
| ||||||||||
| 500,000 | 2.750 | 12/01/22 | 500,124 | |||||||||
| Walgreen Co. |
| ||||||||||
| 175,000 | 1.800 | 09/15/17 | 176,209 | |||||||||
| 150,000 | 3.100 | 09/15/22 | 151,289 | |||||||||
|
| |||||||||||
| 827,622 | ||||||||||||
|
| |||||||||||
| Healthcare – 1.0% |
| ||||||||||
| Cigna Corp. |
| ||||||||||
| 150,000 | 2.750 | 11/15/16 | 157,625 | |||||||||
| Coventry Health Care, Inc. |
| ||||||||||
| 153,000 | 6.300 | 08/15/14 | 165,505 | |||||||||
| DENTSPLY International, Inc. |
| ||||||||||
| 125,000 | 2.750 | 08/15/16 | 128,406 | |||||||||
| Express Scripts, Inc. |
| ||||||||||
| 500,000 | 3.125 | 05/15/16 | 528,028 | |||||||||
| PerkinElmer, Inc.(a) |
| ||||||||||
| 275,000 | 5.000 | 11/15/21 | 305,539 | |||||||||
|
| |||||||||||
| 1,285,103 | ||||||||||||
|
| |||||||||||
| Corporate Obligations – (continued) | ||||||||||||
| Life Insurance – 1.8% |
| ||||||||||
| American International Group, Inc. |
| ||||||||||
| $ | 125,000 | 2.375% | 08/24/15 | $ | 126,938 | |||||||
| Hartford Financial Services Group, Inc. |
| ||||||||||
| 200,000 | 6.000 | 01/15/19 | 234,154 | |||||||||
| MetLife Capital Trust X(a)(b) |
| ||||||||||
| 300,000 | 9.250 | 04/08/68 | 414,000 | |||||||||
| Metropolitan Life Global Funding I(b) |
| ||||||||||
| 200,000 | 3.875 | 04/11/22 | 217,512 | |||||||||
| Nippon Life Insurance Co.(a)(b)(c) |
| ||||||||||
| 475,000 | 5.000 | 10/18/42 | 501,714 | |||||||||
| Principal Financial Group, Inc. |
| ||||||||||
| 225,000 | 3.125 | 05/15/23 | 222,595 | |||||||||
| Prudential Financial, Inc.(a)(c) |
| ||||||||||
| 475,000 | 5.625 | 06/15/43 | 490,437 | |||||||||
| The Northwestern Mutual Life Insurance Co.(b) |
| ||||||||||
| 200,000 | 6.063 | 03/30/40 | 255,339 | |||||||||
|
| |||||||||||
| 2,462,689 | ||||||||||||
|
| |||||||||||
| Media Cable – 0.4% |
| ||||||||||
| COX Communications, Inc.(b) |
| ||||||||||
| 225,000 | 3.250 | 12/15/22 | 232,033 | |||||||||
| DIRECTV Holdings LLC / DIRECTV Financing Co., Inc. |
| ||||||||||
| 325,000 | 3.800 | 03/15/22 | 335,268 | |||||||||
|
| |||||||||||
| 567,301 | ||||||||||||
|
| |||||||||||
| Media Non Cable – 1.0% |
| ||||||||||
| NBCUniversal Media LLC |
| ||||||||||
| 175,000 | 2.875 | 04/01/16 | 184,506 | |||||||||
| 325,000 | 2.875 | 01/15/23 | 326,383 | |||||||||
| News America, Inc. |
| ||||||||||
| 375,000 | 6.150 | 02/15/41 | 474,802 | |||||||||
| WPP Finance UK |
| ||||||||||
| 275,000 | 8.000 | 09/15/14 | 304,472 | |||||||||
|
| |||||||||||
| 1,290,163 | ||||||||||||
|
| |||||||||||
| Metals and Mining – 0.5% |
| ||||||||||
| Freeport-McMoRan Copper & Gold, Inc.(a) |
| ||||||||||
| 225,000 | 3.550 | 03/01/22 | 222,441 | |||||||||
| Xstrata Finance Canada Ltd.(b) |
| ||||||||||
| 500,000 | 2.450 | 10/25/17 | 504,847 | |||||||||
|
| |||||||||||
| 727,288 | ||||||||||||
|
| |||||||||||
| Noncaptive-Financial – 0.9% |
| ||||||||||
| Blackstone Holdings Finance Co. LLC(b) |
| ||||||||||
| 100,000 | 4.750 | 02/15/23 | 106,306 | |||||||||
| 100,000 | 6.250 | 08/15/42 | 112,904 | |||||||||
| Discover Financial Services(b) |
| ||||||||||
| 250,000 | 3.850 | 11/21/22 | 257,968 | |||||||||
| General Electric Capital Corp. |
| ||||||||||
| 300,000 | 5.875 | 01/14/38 | 362,780 | |||||||||
| International Lease Finance Corp. |
| ||||||||||
| 375,000 | 5.750 | 05/15/16 | 394,688 | |||||||||
|
| |||||||||||
| 1,234,646 | ||||||||||||
|
| |||||||||||
| The accompanying notes are an integral part of these financial statements. | 27 |
GOLDMAN SACHS VARIABLE INSURANCE TRUST CORE FIXED INCOME FUND
Schedule of Investments (continued)
December 31, 2012
| Principal Amount | Interest Rate | Maturity Date | Value | |||||||||
| Corporate Obligations – (continued) | ||||||||||||
| Pharmaceuticals – 0.7% |
| ||||||||||
| AbbVie, Inc.(b) |
| ||||||||||
| $ | 650,000 | 1.750% | 11/06/17 | $ | 657,671 | |||||||
| Mylan, Inc.(a)(b) |
| ||||||||||
| 100,000 | 7.875 | 07/15/20 | 118,250 | |||||||||
| Watson Pharmaceuticals, Inc.(a) |
| ||||||||||
| 175,000 | 3.250 | 10/01/22 | 178,715 | |||||||||
|
| |||||||||||
| 954,636 | ||||||||||||
|
| |||||||||||
| Pipelines – 1.7% |
| ||||||||||
| Energy Transfer Partners LP |
| ||||||||||
| 375,000 | 5.950 | 02/01/15 | 410,482 | |||||||||
| 75,000 | 5.200 | 02/01/22 | (a) | 85,278 | ||||||||
| 125,000 | 6.500 | 02/01/42 | (a) | 152,600 | ||||||||
| Enterprise Products Operating LLC Series A(a)(c) |
| ||||||||||
| 400,000 | 8.375 | 08/01/66 | 456,500 | |||||||||
| Enterprise Products Operating LLC Series B(a)(c) |
| ||||||||||
| 125,000 | 7.034 | 01/15/68 | 143,281 | |||||||||
| Tennessee Gas Pipeline Co. LLC |
| ||||||||||
| 200,000 | 8.375 | 06/15/32 | 287,344 | |||||||||
| The Williams Companies, Inc.(a) |
| ||||||||||
| 200,000 | 3.700 | 01/15/23 | 202,007 | |||||||||
| TransCanada Pipelines Ltd.(a)(c) |
| ||||||||||
| 325,000 | 6.350 | 05/15/67 | 347,750 | |||||||||
| Western Gas Partners LP(a) |
| ||||||||||
| 175,000 | 4.000 | 07/01/22 | 184,044 | |||||||||
|
| |||||||||||
| 2,269,286 | ||||||||||||
|
| |||||||||||
| Property/Casualty Insurance – 0.2% |
| ||||||||||
| Transatlantic Holdings, Inc. |
| ||||||||||
| 175,000 | 8.000 | 11/30/39 | 230,738 | |||||||||
|
| |||||||||||
| Real Estate Investment Trusts – 2.6% |
| ||||||||||
| Camden Property Trust |
| ||||||||||
| 325,000 | 5.700 | 05/15/17 | 374,064 | |||||||||
| DDR Corp.(a) |
| ||||||||||
| 250,000 | 4.625 | 07/15/22 | 271,509 | |||||||||
| Developers Diversified Realty Corp. |
| ||||||||||
| 375,000 | 7.500 | 04/01/17 | 449,740 | |||||||||
| ERP Operating LP(a) |
| ||||||||||
| 275,000 | 4.625 | 12/15/21 | 306,856 | |||||||||
| HCP, Inc. |
| ||||||||||
| 275,000 | 6.000 | 01/30/17 | 314,218 | |||||||||
| 125,000 | 2.625 | 02/01/20 | (a) | 123,876 | ||||||||
| Healthcare Realty Trust, Inc. |
| ||||||||||
| 350,000 | 5.750 | 01/15/21 | 393,175 | |||||||||
| Kilroy Realty LP |
| ||||||||||
| 275,000 | 5.000 | 11/03/15 | 300,651 | |||||||||
| ProLogis LP(a)(d) |
| ||||||||||
| 175,000 | 1.875 | 11/15/37 | 175,193 | |||||||||
| Simon Property Group LP |
| ||||||||||
| 350,000 | 10.350 | 04/01/19 | 496,886 | |||||||||
| WEA Finance LLC(b) |
| ||||||||||
| 125,000 | 7.500 | 06/02/14 | 136,004 | |||||||||
|
| |||||||||||
| Corporate Obligations – (continued) | ||||||||||||
| Real Estate Investment Trusts – (continued) |
| ||||||||||
| $ | 175,000 | 3.375% | 10/03/22 | (a) | $ | 179,849 | ||||||
|
| |||||||||||
| 3,522,021 | ||||||||||||
|
| |||||||||||
| Retailers – 0.2% |
| ||||||||||
| LVMH Moet Hennessy Louis Vuitton SA(b) |
| ||||||||||
| 250,000 | 1.625 | 06/29/17 | 254,124 | |||||||||
|
| |||||||||||
| Technology – 0.5% |
| ||||||||||
| Hewlett-Packard Co. |
| ||||||||||
| 250,000 | 3.000 | 09/15/16 | 249,849 | |||||||||
| 150,000 | 2.600 | 09/15/17 | 145,988 | |||||||||
| 50,000 | 4.300 | 06/01/21 | 48,972 | |||||||||
| NetApp, Inc. |
| ||||||||||
| 250,000 | 2.000 | 12/15/17 | 249,219 | |||||||||
|
| |||||||||||
| 694,028 | ||||||||||||
|
| |||||||||||
| Tobacco – 0.1% |
| ||||||||||
| Altria Group, Inc. |
| ||||||||||
| 60,000 | 9.700 | 11/10/18 | 83,935 | |||||||||
| 100,000 | 2.850 | 08/09/22 | 98,779 | |||||||||
|
| |||||||||||
| 182,714 | ||||||||||||
|
| |||||||||||
| Transportation – 0.4% |
| ||||||||||
| Penske Truck Leasing Co. LP / PTL Finance Corp.(b) |
| ||||||||||
| 250,000 | 3.125 | 05/11/15 | 255,027 | |||||||||
| 225,000 | 2.500 | 03/15/16 | 224,570 | |||||||||
|
| |||||||||||
| 479,597 | ||||||||||||
|
| |||||||||||
| Wirelines Telecommunications – 0.8% |
| ||||||||||
| American Tower Corp. |
| ||||||||||
| 150,000 | 4.700 | 03/15/22 | 165,914 | |||||||||
| AT&T, Inc. |
| ||||||||||
| 425,000 | 2.950 | 05/15/16 | 449,989 | |||||||||
| 475,000 | 2.625 | 12/01/22 | (a) | 475,330 | ||||||||
| Telefonica Emisiones SAU |
| ||||||||||
| 50,000 | 5.462 | 02/16/21 | 52,875 | |||||||||
|
| |||||||||||
| 1,144,108 | ||||||||||||
|
| |||||||||||
| TOTAL CORPORATE OBLIGATIONS | ||||||||||||
| (Cost $35,572,497) | $ | 38,229,038 | ||||||||||
|
| |||||||||||
| Mortgage-Backed Obligations – 54.1% | ||||||||||||
| Adjustable Rate Non-Agency(c) – 1.6% |
| ||||||||||
| Bear Stearns Adjustable Rate Mortgage Trust Series 2004-1, | | ||||||||||
| $ | 19,519 | 2.673% | 04/25/34 | $ | 19,273 | |||||||
| Countrywide Alternative Loan Trust Series 2005-38, Class A1 |
| ||||||||||
| 234,285 | 1.665 | 09/25/35 | 177,699 | |||||||||
| Countrywide Home Loan Mortgage Pass-Through Trust | | ||||||||||
| 88,723 | 2.908 | 02/19/34 | 83,212 | |||||||||
| Countrywide Home Loan Mortgage Pass-Through Trust | | ||||||||||
| 16,518 | 2.934 | 11/21/34 | 15,273 | |||||||||
|
| |||||||||||
| 28 | The accompanying notes are an integral part of these financial statements. |
GOLDMAN SACHS VARIABLE INSURANCE TRUST CORE FIXED INCOME FUND
| Principal Amount | Interest Rate | Maturity Date | Value | |||||||||
| Mortgage-Backed Obligations – (continued) | ||||||||||||
| Adjustable Rate Non-Agency – (continued) |
| ||||||||||
| Indymac Index Mortgage Loan Trust Series 2005-AR15, Class A1 |
| ||||||||||
| $ | 408,738 | 4.787% | 09/25/35 | $ | 364,437 | |||||||
| Indymac Index Mortgage Loan Trust Series 2006-AR4, | | ||||||||||
| 866,985 | 0.420 | 05/25/46 | 666,479 | |||||||||
| Lehman XS Trust Series 2005-7N, Class 1A1A |
| ||||||||||
| 330,429 | 0.480 | 12/25/35 | 273,400 | |||||||||
| Master Adjustable Rate Mortgages Trust Series 2006-OA2, | | ||||||||||
| 493,123 | 1.015 | 12/25/46 | 191,729 | |||||||||
| Structured Adjustable Rate Mortgage Loan Trust Series 2004-12, | | ||||||||||
| 19,640 | 2.773 | 09/25/34 | 19,718 | |||||||||
| Structured Adjustable Rate Mortgage Loan Trust Series 2004-5, | | ||||||||||
| 43,352 | 2.804 | 05/25/34 | 44,707 | |||||||||
| Washington Mutual Mortgage Pass-Through Certificates | | ||||||||||
| 21,642 | 2.571 | 06/25/34 | 21,794 | |||||||||
| Washington Mutual Mortgage Pass-Through Certificates | | ||||||||||
| 522,451 | 0.865 | 03/25/47 | 376,075 | |||||||||
|
| |||||||||||
| 2,253,796 | ||||||||||||
|
| |||||||||||
| Collateralized Mortgage Obligations – 11.0% |
| ||||||||||
| Agency Multi-Family – 3.6% |
| ||||||||||
| FNMA |
| ||||||||||
| 386,523 | 2.800% | 03/01/18 | 413,102 | |||||||||
| 1,076,717 | 3.740 | 05/01/18 | 1,203,810 | |||||||||
| 320,000 | 3.840 | 05/01/18 | 359,194 | |||||||||
| 800,000 | 4.506 | 06/01/19 | 926,426 | |||||||||
| 100,000 | 1.520 | 12/25/19 | 102,269 | |||||||||
| 194,600 | 3.416 | 10/01/20 | 214,793 | |||||||||
| 194,765 | 3.632 | 12/01/20 | 215,357 | |||||||||
| 976,475 | 3.763 | 12/01/20 | 1,108,658 | |||||||||
| 100,000 | 2.349 | 05/25/22 | 101,161 | |||||||||
| GNMA |
| ||||||||||
| 171,225 | 3.950 | 07/15/25 | 187,857 | |||||||||
|
| |||||||||||
| 4,832,627 | ||||||||||||
|
| |||||||||||
| Covered Bond – 4.7%(c) |
| ||||||||||
| Abbey National Treasury Services PLC |
| ||||||||||
| GBP | 200,000 | 2.123 | 02/16/15 | 331,557 | ||||||||
| Bank of Scotland PLC(b) |
| ||||||||||
| $ | 400,000 | 5.250 | 02/21/17 | 457,294 | ||||||||
| Northern Rock Asset Management PLC(b) |
| ||||||||||
| 900,000 | 5.625 | 06/22/17 | 1,045,745 | |||||||||
| Sparebank 1 Boligkreditt AS(b) |
| ||||||||||
| 2,500,000 | 2.625 | 05/27/16 | 2,637,937 | |||||||||
| 700,000 | 2.300 | 06/30/18 | 730,520 | |||||||||
| 700,000 | 1.750 | 11/15/19 | 691,071 | |||||||||
| Stadshypotek AB(b) |
| ||||||||||
| 500,000 | 1.875 | 10/02/19 | 499,800 | |||||||||
|
| |||||||||||
| 6,393,924 | ||||||||||||
|
| |||||||||||
| Mortgage-Backed Obligations – (continued) | ||||||||||||
| Regular Floater(c) – 2.5% |
| ||||||||||
| Aire Valley Mortgages PLC Series 2004-1X, Class 3A2 |
| ||||||||||
| EUR | 453,207 | 0.604% | 09/20/66 | $ | 564,112 | |||||||
| Aire Valley Mortgages PLC Series 2006-1A, Class 1A(b) |
| ||||||||||
| $ | 95,026 | 0.529 | 09/20/66 | 88,350 | ||||||||
| Granite Master Issuer PLC Series 2005-2, Class A7 |
| ||||||||||
| GBP | 33,043 | 0.814 | 12/20/54 | 52,769 | ||||||||
| Granite Master Issuer PLC Series 2006-1X, Class A7 |
| ||||||||||
| GBP | 363,475 | 0.614 | 12/20/54 | 580,500 | ||||||||
| Granite Master Issuer PLC Series 2006-3, Class A4 |
| ||||||||||
| $ | 1,453,900 | 0.291 | 12/20/54 | 1,431,497 | ||||||||
| Granite Master Issuer PLC Series 2006-3, Class A5 |
| ||||||||||
| EUR | 33,043 | 0.330 | 12/20/54 | 42,988 | ||||||||
| Granite Master Issuer PLC Series 2007-1, Class 2A1 |
| ||||||||||
| $ | 330,432 | 0.351 | 12/20/54 | 325,340 | ||||||||
| Granite Master Issuer PLC Series 2007-1, Class 3A2 |
| ||||||||||
| EUR | 99,130 | 0.310 | 12/20/54 | 128,965 | ||||||||
| Granite Mortgages PLC Series 2003-3, Class 3A |
| ||||||||||
| GBP | 59,937 | 0.909 | 01/20/44 | 96,539 | ||||||||
|
| |||||||||||
| 3,311,060 | ||||||||||||
|
| |||||||||||
| Sequential Fixed Rate – 0.2% |
| ||||||||||
| National Credit Union Administration Guaranteed Notes | | ||||||||||
| 300,000 | 3.000 | 06/12/19 | 327,471 | |||||||||
|
| |||||||||||
| | TOTAL COLLATERALIZED MORTGAGE OBLIGATIONS | | $ | 14,865,082 | ||||||||
|
| |||||||||||
| Commercial Mortgage-Backed Securities – 2.8% |
| ||||||||||
| Sequential Fixed Rate – 2.8% |
| ||||||||||
| Commercial Mortgage Pass-Through Certificates | | ||||||||||
| $ | 150,000 | 4.063% | 12/12/44 | $ | 165,631 | |||||||
| Commercial Mortgage Pass-Through Certificates | | ||||||||||
| 125,000 | 4.934 | 12/12/44 | 139,901 | |||||||||
| Commercial Mortgage Pass-Through Certificates | | ||||||||||
| 100,000 | 5.649 | 12/12/44 | 112,444 | |||||||||
| GS Mortgage Securities Corp. II Series 2007-GG10, Class A4(c) |
| ||||||||||
| 300,000 | 5.789 | 08/10/45 | 345,681 | |||||||||
| J.P. Morgan Chase Commercial Mortgage Securities Corp. | | ||||||||||
| 400,000 | 2.829 | 10/15/45 | 410,016 | |||||||||
| JP Morgan Chase Commercial Mortgage Securities Corp. | | ||||||||||
| 500,000 | 2.840 | 12/15/47 | 512,513 | |||||||||
| LB-UBS Commercial Mortgage Trust Series 2007-C6, Class A4(c) |
| ||||||||||
| 1,100,000 | 5.858 | 07/15/40 | 1,312,025 | |||||||||
| Morgan Stanley Bank of America Merrill Lynch Trust | | ||||||||||
| 800,000 | 2.858 | 11/15/45 | 826,932 | |||||||||
|
| |||||||||||
| 3,825,143 | ||||||||||||
|
| |||||||||||
| | TOTAL COMMERCIAL MORTGAGE-BACKED SECURITIES | | $ | 3,825,143 | ||||||||
|
| |||||||||||
| The accompanying notes are an integral part of these financial statements. | 29 |
GOLDMAN SACHS VARIABLE INSURANCE TRUST CORE FIXED INCOME FUND
Schedule of Investments (continued)
December 31, 2012
| Principal Amount | Interest Rate | Maturity Date | Value | |||||||||
| Mortgage-Backed Obligations – (continued) | ||||||||||||
| Federal Agencies – 38.7% |
| ||||||||||
| Adjustable Rate FHLMC(c) – 1.2% |
| ||||||||||
| $ | 1,522,868 | 2.412% | 09/01/35 | $ | 1,633,789 | |||||||
|
| |||||||||||
| Adjustable Rate FNMA(c) – 1.6% |
| ||||||||||
| 465,834 | 2.342 | 05/01/33 | 491,207 | |||||||||
| 728,791 | 2.333 | 05/01/35 | 774,646 | |||||||||
| 769,653 | 2.611 | 09/01/35 | 827,067 | |||||||||
|
| |||||||||||
| 2,092,920 | ||||||||||||
|
| |||||||||||
| FHLMC – 10.4% |
| ||||||||||
| 15,895 | 7.500 | 06/01/15 | 16,824 | |||||||||
| 25,317 | 7.000 | 07/01/16 | 26,319 | |||||||||
| 287,765 | 5.500 | 02/01/18 | 311,661 | |||||||||
| 26,413 | 5.500 | 04/01/18 | 28,607 | |||||||||
| 10,491 | 4.500 | 09/01/18 | 11,165 | |||||||||
| 46,699 | 5.500 | 09/01/18 | 50,577 | |||||||||
| 2,554 | 9.500 | 08/01/19 | 2,785 | |||||||||
| 103 | 9.500 | 08/01/20 | 105 | |||||||||
| 107,605 | 6.500 | 10/01/20 | 119,976 | |||||||||
| 20,977 | 4.500 | 07/01/24 | 22,634 | |||||||||
| 126,862 | 4.500 | 11/01/24 | 137,199 | |||||||||
| 26,524 | 4.500 | 12/01/24 | 28,685 | |||||||||
| 32,920 | 6.000 | 03/01/29 | 36,337 | |||||||||
| 183 | 6.000 | 04/01/29 | 202 | |||||||||
| 29,007 | 7.500 | 12/01/29 | 33,372 | |||||||||
| 260,719 | 7.000 | 05/01/32 | 297,853 | |||||||||
| 730 | 6.000 | 08/01/32 | 806 | |||||||||
| 152,677 | 7.000 | 12/01/32 | 174,423 | |||||||||
| 17,138 | 5.000 | 10/01/33 | 18,518 | |||||||||
| 20,217 | 5.000 | 07/01/35 | 21,813 | |||||||||
| 281,112 | 5.000 | 08/01/35 | 302,895 | |||||||||
| 17,171 | 5.000 | 09/01/35 | 18,502 | |||||||||
| 66,451 | 5.000 | 12/01/35 | 71,718 | |||||||||
| 1,388,367 | 5.000 | 02/01/37 | 1,495,947 | |||||||||
| 27,708 | 6.000 | 09/01/37 | 30,499 | |||||||||
| 90,434 | 5.000 | 02/01/38 | 97,442 | |||||||||
| 38,826 | 6.000 | 02/01/38 | 42,796 | |||||||||
| 16,615 | 5.000 | 03/01/38 | 17,864 | |||||||||
| 120,371 | 6.000 | 07/01/38 | 132,925 | |||||||||
| 32,766 | 6.000 | 10/01/38 | 36,225 | |||||||||
| 4,530 | 5.000 | 12/01/38 | 4,868 | |||||||||
| 933,807 | 5.000 | 02/01/39 | 1,004,818 | |||||||||
| 20,405 | 5.000 | 06/01/41 | 22,191 | |||||||||
| 5,999,902 | 3.000 | 11/01/42 | 6,278,221 | |||||||||
| 2,000,001 | 3.000 | 12/01/42 | 2,092,832 | |||||||||
| 1,000,000 | 5.500 | TBA-30yr | (e) | 1,080,547 | ||||||||
|
| |||||||||||
| 14,070,151 | ||||||||||||
|
| |||||||||||
| FNMA – 24.9% |
| ||||||||||
| 29,948 | 7.500 | 08/01/15 | 31,206 | |||||||||
| 22,457 | 6.000 | 04/01/16 | 24,068 | |||||||||
| 38,938 | 6.500 | 05/01/16 | 42,254 | |||||||||
| 54,651 | 6.500 | 09/01/16 | 59,304 | |||||||||
| 70,325 | 6.500 | 11/01/16 | 76,313 | |||||||||
| 16,746 | 7.500 | 04/01/17 | 17,844 | |||||||||
|
| |||||||||||
| Mortgage-Backed Obligations – (continued) | ||||||||||||
| FNMA – (continued) |
| ||||||||||
| $ | 287,380 | 5.500% | 02/01/18 | $ | 308,294 | |||||||
| 277,015 | 5.000 | 05/01/18 | 299,804 | |||||||||
| 25,053 | 6.500 | 08/01/18 | 27,894 | |||||||||
| 136,959 | 7.000 | 08/01/18 | 153,233 | |||||||||
| 398,555 | 4.375 | 06/01/21 | 463,724 | |||||||||
| 3,639 | 5.000 | 06/01/23 | 3,941 | |||||||||
| 106,933 | 5.000 | 08/01/23 | 117,149 | |||||||||
| 336,497 | 5.500 | 09/01/23 | 362,375 | |||||||||
| 75,893 | 5.500 | 10/01/23 | 81,796 | |||||||||
| 20,139 | 4.500 | 07/01/24 | 21,974 | |||||||||
| 278,438 | 4.500 | 11/01/24 | 304,067 | |||||||||
| 113,881 | 4.500 | 12/01/24 | 124,397 | |||||||||
| 81 | 7.000 | 07/01/25 | 96 | |||||||||
| 4,231 | 7.000 | 11/01/25 | 4,990 | |||||||||
| 31,047 | 9.000 | 11/01/25 | 36,542 | |||||||||
| 114,820 | 7.000 | 08/01/26 | 131,767 | |||||||||
| 784 | 7.000 | 08/01/27 | 912 | |||||||||
| 9,472 | 7.000 | 09/01/27 | 11,011 | |||||||||
| 33,420 | 6.000 | 12/01/27 | 36,504 | |||||||||
| 329 | 7.000 | 01/01/28 | 383 | |||||||||
| 202,979 | 6.000 | 02/01/29 | 224,033 | |||||||||
| 186,710 | 6.000 | 06/01/29 | 206,375 | |||||||||
| 872,608 | 5.000 | 09/01/29 | 943,175 | |||||||||
| 49,089 | 8.000 | 10/01/29 | 60,124 | |||||||||
| 14,224 | 7.000 | 12/01/29 | 16,537 | |||||||||
| 83,777 | 5.000 | 01/01/30 | 90,552 | |||||||||
| 1,482 | 8.500 | 04/01/30 | 1,778 | |||||||||
| 7,341 | 8.000 | 05/01/30 | 8,366 | |||||||||
| 379 | 8.500 | 06/01/30 | 441 | |||||||||
| 16,663 | 7.000 | 05/01/32 | 19,373 | |||||||||
| 131,538 | 7.000 | 06/01/32 | 152,628 | |||||||||
| 184,609 | 7.000 | 08/01/32 | 214,208 | |||||||||
| 39,196 | 8.000 | 08/01/32 | 48,675 | |||||||||
| 37,853 | 5.000 | 04/01/33 | 41,080 | |||||||||
| 9,897 | 5.000 | 08/01/33 | 10,742 | |||||||||
| 766,452 | 5.000 | 09/01/33 | 831,797 | |||||||||
| 2,195 | 5.500 | 09/01/33 | 2,404 | |||||||||
| 1,893,319 | 5.000 | 12/01/33 | 2,054,736 | |||||||||
| 3,084 | 5.500 | 02/01/34 | 3,377 | |||||||||
| 499 | 5.500 | 04/01/34 | 546 | |||||||||
| 45,350 | 5.000 | 12/01/34 | 49,182 | |||||||||
| 24,456 | 5.500 | 12/01/34 | 26,730 | |||||||||
| 68,555 | 5.000 | 04/01/35 | 74,414 | |||||||||
| 157,984 | 6.000 | 04/01/35 | 174,611 | |||||||||
| 7,363 | 5.000 | 09/01/35 | 7,968 | |||||||||
| 4,054 | 5.500 | 09/01/35 | 4,424 | |||||||||
| 957,488 | 5.000 | 12/01/35 | 1,036,266 | |||||||||
| 336 | 5.500 | 02/01/37 | 365 | |||||||||
| 490 | 5.500 | 04/01/37 | 532 | |||||||||
| 651 | 5.500 | 05/01/37 | 707 | |||||||||
| 64,795 | 6.000 | 12/01/37 | 71,449 | |||||||||
| 758 | 5.500 | 03/01/38 | 824 | |||||||||
| 1,603,491 | 5.000 | 04/01/38 | 1,732,460 | |||||||||
| 34,869 | 6.000 | 05/01/38 | 38,565 | |||||||||
|
| |||||||||||
| 30 | The accompanying notes are an integral part of these financial statements. |
GOLDMAN SACHS VARIABLE INSURANCE TRUST CORE FIXED INCOME FUND
| Principal Amount | Interest Rate | Maturity Date | Value | |||||||||
| Mortgage-Backed Obligations – (continued) | ||||||||||||
| FNMA – (continued) |
| ||||||||||
| $ | 724 | 5.500% | 06/01/38 | $ | 787 | |||||||
| 28,994 | 6.000 | 06/01/38 | 32,067 | |||||||||
| 975 | 5.500 | 07/01/38 | 1,060 | |||||||||
| 73,465 | 6.000 | 07/01/38 | 81,250 | |||||||||
| 700 | 5.500 | 08/01/38 | 761 | |||||||||
| 29,173 | 6.000 | 08/01/38 | 32,265 | |||||||||
| 547 | 5.500 | 09/01/38 | 595 | |||||||||
| 700,031 | 6.000 | 09/01/38 | 763,343 | |||||||||
| 13,565 | 5.500 | 10/01/38 | 14,766 | |||||||||
| 31,238 | 6.000 | 10/01/38 | 34,631 | |||||||||
| 38,075 | 6.000 | 11/01/38 | 42,211 | |||||||||
| 361 | 5.500 | 12/01/38 | 393 | |||||||||
| 210,829 | 6.000 | 12/01/38 | 229,896 | |||||||||
| 276,574 | 5.000 | 01/01/39 | 300,472 | |||||||||
| 54,780 | 4.500 | 08/01/39 | 60,195 | |||||||||
| 120,236 | 4.500 | 07/01/40 | 129,938 | |||||||||
| 601,687 | 4.000 | 09/01/40 | 644,493 | |||||||||
| 1,132,373 | 4.000 | 11/01/40 | 1,212,932 | |||||||||
| 711,112 | 4.500 | 03/01/41 | 769,892 | |||||||||
| 1,336,027 | 4.500 | 05/01/41 | 1,446,463 | |||||||||
| 86,344 | 4.500 | 06/01/41 | 93,481 | |||||||||
| 845,399 | 4.500 | 09/01/41 | 915,280 | |||||||||
| 2,000,000 | 3.500 | TBA-30yr | (e) | 2,132,188 | ||||||||
| 3,000,000 | 4.000 | TBA-30yr | (e) | 3,215,391 | ||||||||
| 2,000,000 | 2.500 | TBA-15yr | (e) | 2,091,406 | ||||||||
| 7,000,000 | 4.500 | TBA-30yr | (e) | 7,562,187 | ||||||||
| 1,000,000 | 3.000 | TBA-30yr | (e) | 1,048,047 | ||||||||
|
| |||||||||||
| 33,747,676 | ||||||||||||
|
| |||||||||||
| GNMA – 0.6% |
| ||||||||||
| 6,162 | 7.000 | 10/15/25 | 7,273 | |||||||||
| 14,674 | 7.000 | 11/15/25 | 17,320 | |||||||||
| 2,575 | 7.000 | 02/15/26 | 3,055 | |||||||||
| 8,409 | 7.000 | 04/15/26 | 9,975 | |||||||||
| 4,029 | 7.000 | 03/15/27 | 4,801 | |||||||||
| 87,547 | 7.000 | 11/15/27 | 104,322 | |||||||||
| 4,917 | 7.000 | 01/15/28 | 5,782 | |||||||||
| 34,602 | 7.000 | 02/15/28 | 40,687 | |||||||||
| 14,205 | 7.000 | 03/15/28 | 16,703 | |||||||||
| 3,893 | 7.000 | 04/15/28 | 4,578 | |||||||||
| 538 | 7.000 | 05/15/28 | 633 | |||||||||
| 8,631 | 7.000 | 06/15/28 | 10,149 | |||||||||
| 18,844 | 7.000 | 07/15/28 | 22,158 | |||||||||
| 14,265 | 7.000 | 08/15/28 | 16,774 | |||||||||
| 26,756 | 7.000 | 09/15/28 | 31,462 | |||||||||
| 4,144 | 7.000 | 11/15/28 | 4,873 | |||||||||
| 4,654 | 7.500 | 11/15/30 | 4,730 | |||||||||
| 605 | 7.000 | 12/15/31 | 712 | |||||||||
| 453,331 | 6.000 | 08/20/34 | 510,654 | |||||||||
|
| |||||||||||
| 816,641 | ||||||||||||
|
| |||||||||||
| TOTAL FEDERAL AGENCIES | $ | 52,361,177 | ||||||||||
|
| |||||||||||
| TOTAL MORTGAGE-BACKED OBLIGATIONS | ||||||||||||
| (Cost $72,338,676) | $ | 73,305,198 | ||||||||||
|
| |||||||||||
| Agency Debentures – 6.5% | ||||||||||||
| FHLMC |
| ||||||||||
| EUR | 300,000 | 4.375% | 01/15/14 | $ | 409,279 | |||||||
| $ | 500,000 | 1.250 | 08/01/19 | 500,496 | ||||||||
| 1,400,000 | 2.375 | 01/13/22 | 1,462,767 | |||||||||
| FNMA |
| ||||||||||
| 1,600,000 | 0.625 | 10/30/14 | 1,610,201 | |||||||||
| 1,100,000 | 0.875 | 08/28/17 | 1,105,490 | |||||||||
| 1,900,000 | 0.875 | 10/26/17 | 1,906,255 | |||||||||
| 400,000 | 6.250 | 05/15/29 | 574,637 | |||||||||
| Tennessee Valley Authority |
| ||||||||||
| 900,000 | 5.375 | 04/01/56 | 1,218,528 | |||||||||
|
| |||||||||||
| TOTAL AGENCY DEBENTURES | ||||||||||||
| (Cost $8,384,723) | $ | 8,787,653 | ||||||||||
|
| |||||||||||
| Asset-Backed Securities – 1.6% | ||||||||||||
| Home Equity – 0.2% |
| ||||||||||
| GMAC Mortgage Corp. Loan Trust Series 2007-HE3, Class 1A1 |
| ||||||||||
| $ | 117,508 | 7.000% | 09/25/37 | $ | 101,289 | |||||||
| GMAC Mortgage Corp. Loan Trust Series 2007-HE3, Class 2A1 |
| ||||||||||
| 164,381 | 7.000 | 09/25/37 | 147,299 | |||||||||
|
| |||||||||||
| 248,588 | ||||||||||||
|
| |||||||||||
| Student Loans(c) – 1.4% |
| ||||||||||
| Access Group, Inc. Series 2005-2, Class A3 |
| ||||||||||
| 589,649 | 0.491 | 11/22/24 | 578,931 | |||||||||
| College Loan Corp. Trust Series 2004-1, Class A4 |
| ||||||||||
| 300,000 | 0.505 | 04/25/24 | 291,100 | |||||||||
| College Loan Corp. Trust Series 2006-1, Class A3 |
| ||||||||||
| 1,000,000 | 0.405 | 10/25/25 | 974,128 | |||||||||
| GCO Education Loan Funding Trust Series 2006-1, Class A11L |
| ||||||||||
| 100,000 | 0.542 | 05/25/36 | 86,442 | |||||||||
|
| |||||||||||
| 1,930,601 | ||||||||||||
|
| |||||||||||
| TOTAL ASSET-BACKED SECURITIES | ||||||||||||
| (Cost $2,206,401) | $ | 2,179,189 | ||||||||||
|
| |||||||||||
| Foreign Debt Obligations – 8.7% | ||||||||||||
| Sovereign – 8.7% |
| ||||||||||
| Chile Government International Bond |
| ||||||||||
| $ | 150,000 | 3.625% | 10/30/42 | $ | 147,000 | |||||||
| Colombia Government International Bond |
| ||||||||||
| 209,000 | 4.375 | 07/12/21 | 240,872 | |||||||||
| Indonesia Government International Bond |
| ||||||||||
| 230,000 | 8.500 | 10/12/35 | 369,725 | |||||||||
| Mexican Government |
| ||||||||||
| MXN | 29,166,090 | 0.000(f) | 06/27/13 | 2,208,954 | ||||||||
| Slovenia Government International Bond(b) |
| ||||||||||
| $ | 210,000 | 5.500 | 10/26/22 | 221,288 | ||||||||
|
| |||||||||||
| The accompanying notes are an integral part of these financial statements. | 31 |
GOLDMAN SACHS VARIABLE INSURANCE TRUST CORE FIXED INCOME FUND
Schedule of Investments (continued)
December 31, 2012
| Principal Amount | Interest Rate | Maturity Date | Value | |||||||||
| Foreign Debt Obligations – (continued) | ||||||||||||
| Sovereign – (continued) |
| ||||||||||
| United Kingdom Gilt |
| ||||||||||
| GBP | 4,200,000 | 4.500% | 03/07/13 | 6,873,178 | ||||||||
| 1,000,000 | 2.750 | 01/22/15 | 1,704,275 | |||||||||
|
| |||||||||||
| 11,765,292 | ||||||||||||
|
| |||||||||||
| TOTAL FOREIGN DEBT OBLIGATIONS | ||||||||||||
| (Cost $11,415,504) | $ | 11,765,292 | ||||||||||
|
| |||||||||||
| Municipal Debt Obligations – 1.1% | ||||||||||||
| California – 0.3% |
| ||||||||||
| California State Various Purpose GO Bonds Series 2010 |
| ||||||||||
| $ | 140,000 | 7.950% | 03/01/36 | $ | 173,977 | |||||||
| 105,000 | 7.625 | 03/01/40 | 151,693 | |||||||||
|
| |||||||||||
| 325,670 | ||||||||||||
|
| |||||||||||
| Illinois – 0.2% |
| ||||||||||
| Illinois State GO Bonds for Build America Bonds Series 2010-5 |
| ||||||||||
| 250,000 | 7.350 | 07/01/35 | 302,428 | |||||||||
|
| |||||||||||
| New York – 0.4% |
| ||||||||||
| Rensselaer Polytechnic Institute Taxable Bonds Series 2010 |
| ||||||||||
| 475,000 | 5.600 | 09/01/20 | 548,402 | |||||||||
|
| |||||||||||
| Ohio – 0.2% |
| ||||||||||
| American Municipal Power, Inc. RB Build America Bond | | ||||||||||
| 250,000 | 6.270 | 02/15/50 | 298,902 | |||||||||
|
| |||||||||||
| TOTAL MUNICIPAL DEBT OBLIGATIONS | ||||||||||||
| (Cost $1,225,008) | $ | 1,475,402 | ||||||||||
|
| |||||||||||
| Shares | Interest Rate | Value | ||||
| Preferred Stock – 0.0% | ||||||
Banks – 0.0% |
| |||||
CoBank ACB(b)(c) |
| |||||
| 613 | 6.250% | $ | 63,384 | |||
| ||||||
| TOTAL PREFERRED STOCK | ||||||
| (Cost $61,300) | ||||||
| ||||||
| Principal Amount | Interest Rate | Maturity Date | Value | |||||||||
| Government Guarantee Obligations(g) – 3.4% | ||||||||||||
| Achmea Hypotheekbank NV(b) |
| ||||||||||
| $ | 105,000 | 3.200% | 11/03/14 | $ | 110,071 | |||||||
| BRFkredit AS(b) |
| ||||||||||
| 1,700,000 | 2.050 | 04/15/13 | 1,708,121 | |||||||||
| Israel Government AID Bond |
| ||||||||||
| 400,000 | 5.500 | 09/18/23 | 524,144 | |||||||||
| 100,000 | 5.500 | 12/04/23 | 130,761 | |||||||||
| 100,000 | 5.500 | 04/26/24 | 132,159 | |||||||||
|
| |||||||||||
| Government Guarantee Obligations(g) – (continued) | ||||||||||||
| Kommunalbanken AS(b) |
| ||||||||||
| $ | 300,000 | 1.000% | 09/26/17 | $ | 299,620 | |||||||
| Landwirtschaftliche Rentenbank |
| ||||||||||
| 1,400,000 | 4.125 | 07/15/13 | 1,428,476 | |||||||||
| Swedbank AB(b) |
| ||||||||||
| 200,000 | 2.900 | 01/14/13 | 200,152 | |||||||||
|
| |||||||||||
| TOTAL GOVERNMENT GUARANTEE OBLIGATIONS | ||||||||||||
| (Cost $4,504,560) | $ | 4,533,504 | ||||||||||
|
| |||||||||||
| U.S. Treasury Obligations – 2.7% | ||||||||||||
| United States Treasury Bonds |
| ||||||||||
| $ | 2,000,000 | 0.000%(g) | 02/15/26 | $ | 1,476,340 | |||||||
| 400,000 | 4.375 | 05/15/41 | 520,856 | |||||||||
| 800,000 | 2.750 | 11/15/42 | 770,751 | |||||||||
| United States Treasury Inflation-Protected Securities |
| ||||||||||
| 121,143 | 1.625 | 01/15/15 | 128,752 | |||||||||
| 402,356 | 0.125(h) | 07/15/22 | 436,995 | |||||||||
| 307,110 | 0.750 | 02/15/42 | 336,718 | |||||||||
|
| |||||||||||
| TOTAL U.S. TREASURY OBLIGATIONS | ||||||||||||
| (Cost $3,685,627) | $ | 3,670,412 | ||||||||||
|
| |||||||||||
| TOTAL INVESTMENTS – 106.3% | ||||||||||||
| (Cost $139,394,296) | $ | 144,009,072 | ||||||||||
|
| |||||||||||
| LIABILITIES IN EXCESS OF | | (8,573,103 | ) | ||||||||
|
| |||||||||||
| NET ASSETS – 100.0% | $ | 135,435,969 | ||||||||||
|
| |||||||||||
| 32 | The accompanying notes are an integral part of these financial statements. |
GOLDMAN SACHS VARIABLE INSURANCE TRUST CORE FIXED INCOME FUND
The percentage shown for each investment category reflects the value of investments in that category as a percentage of net assets. | ||
| (a) | Securities with “Call” features with resetting interest rates. Maturity dates disclosed are the final maturity dates. | |
| (b) | Exempt from registration under Rule 144A of the Securities Act of 1933. Under procedures approved by the Board of Trustees, such securities have been determined to be liquid by the investment adviser and may be resold, normally to qualified institutional buyers in transactions exempt from registration. Total market value of Rule 144A securities amounts to $18,811,667, which represents approximately 13.9% of net assets as of December 31, 2012. | |
| (c) | Variable rate security. Interest rate disclosed is that which is in effect at December 31, 2012. | |
| (d) | Security with “Put” features and resetting interest rates. Maturity dates disclosed are the puttable dates. Interest rate disclosed is that which is in effect at December 31, 2012. | |
| (e) | TBA (To Be Announced) Securities are purchased/sold on a forward commitment basis with an approximate principal amount and no defined maturity date. The actual principal and maturity date will be determined upon settlement when the specific mortgage pools are assigned. Total market value of TBA securities (excluding forward sales contracts, if any) amounts to $17,129,766 which represents approximately 12.6% of net assets as of December 31, 2012. | |
| (f) | Issued with a zero coupon. Income is recognized through the accretion of discount. | |
| (g) | Guaranteed by a foreign government. | |
| (h) | All or a portion of security is segregated as collateral for initial margin requirements on futures transactions. | |
| Investment Abbreviations: | ||
| FHLMC | —Federal Home Loan Mortgage Corp. | |
| FNMA | —Federal National Mortgage Association | |
| GNMA | —Government National Mortgage Association | |
| GO | —General Obligation | |
| RB | —Revenue Bond | |
| RMKT | —Remarketed | |
| UK | —United Kingdom | |
| Currency Abbreviations: | ||
| AUD | —Australian Dollar | |
| CAD | —Canadian Dollar | |
| CHF | —Swiss Franc | |
| EUR | —Euro | |
| GBP | —British Pound | |
| JPY | —Japanese Yen | |
| MXN | —Mexican Peso | |
| NOK | —Norwegian Krone | |
| NZD | —New Zealand Dollar | |
| SEK | —Swedish Krona | |
| USD | —United States Dollar | |
| The accompanying notes are an integral part of these financial statements. | 33 |
GOLDMAN SACHS VARIABLE INSURANCE TRUST CORE FIXED INCOME FUND
Schedule of Investments (continued)
December 31, 2012
ADDITIONAL INVESTMENT INFORMATION
FORWARD FOREIGN CURRENCY EXCHANGE CONTRACTS — At December 31, 2012, the Fund had the following forward foreign currency exchange contracts:
FORWARD FOREIGN CURRENCY EXCHANGE CONTRACTS WITH UNREALIZED GAIN
| Counterparty | Contracts to Buy/Sell | Settlement Date | Current Value | Unrealized Gain | ||||||||
| Barclays Bank PLC | EUR/USD | 03/20/13 | $ | 85,855 | $ | 164 | ||||||
| GBP/USD | 03/20/13 | 115,146 | 1,451 | |||||||||
| Citibank NA | AUD/USD | 03/20/13 | 168,324 | 303 | ||||||||
| EUR/USD | 03/20/13 | 175,673 | 3,182 | |||||||||
| SEK/EUR | 03/20/13 | 87,960 | 2,105 | |||||||||
| USD/AUD | 03/20/13 | 167,291 | 2,386 | |||||||||
| USD/JPY | 03/21/13 | 995,781 | 36,513 | |||||||||
| USD/NZD | 03/20/13 | 166,941 | 2,783 | |||||||||
| Deutsche Bank AG (London) | EUR/USD | 03/20/13 | 1,973,433 | 17,014 | ||||||||
| GBP/USD | 03/20/13 | 84,451 | 439 | |||||||||
| NOK/EUR | 03/20/13 | 85,489 | 955 | |||||||||
| USD/EUR | 03/20/13 | 252,282 | 1,400 | |||||||||
| USD/JPY | 03/21/13 | 666,162 | 18,838 | |||||||||
| HSBC Bank PLC | NOK/EUR | 03/20/13 | 225,049 | 1,825 | ||||||||
| SEK/EUR | 03/20/13 | 435,258 | 5,983 | |||||||||
| USD/GBP | 03/20/13 | 168,902 | 550 | |||||||||
| JPMorgan Chase Bank NA | EUR/USD | 03/20/13 | 84,534 | 86 | ||||||||
| USD/EUR | 03/20/13 | 84,534 | 622 | |||||||||
| Morgan Stanley Co., Inc. | EUR/USD | 03/20/13 | 85,855 | 586 | ||||||||
| Royal Bank of Canada | USD/CAD | 03/20/13 | 168,276 | 724 | ||||||||
| State Street Bank | USD/JPY | 03/21/13 | 247,717 | 11,283 | ||||||||
| UBS AG (London) | EUR/USD | 03/20/13 | 173,031 | 1,506 | ||||||||
| USD/CAD | 03/20/13 | 358,396 | 948 | |||||||||
| USD/GBP | 03/20/13 | 168,903 | 243 | |||||||||
| USD/NZD | 03/20/13 | 166,941 | 398 | |||||||||
| Westpac Banking Corp. | NZD/AUD | 03/20/13 | 338,837 | 124 | ||||||||
| USD/AUD | 03/20/13 | 357,301 | 2,599 | |||||||||
| TOTAL | $ | 115,010 | ||||||||||
FORWARD FOREIGN CURRENCY EXCHANGE CONTRACTS WITH UNREALIZED LOSS
| Counterparty | Contracts to Buy/Sell | Settlement Date | Current Value | Unrealized Loss | ||||||||
| Barclays Bank PLC | JPY/USD | 03/21/13 | $ | 84,515 | $ | (486 | ) | |||||
| USD/CHF | 03/20/13 | 2,220,131 | (41,194 | ) | ||||||||
| Citibank NA | JPY/USD | 03/21/13 | 246,394 | (7,606 | ) | |||||||
| USD/EUR | 02/08/13 | 1,149,624 | (1,444 | ) | ||||||||
| Deutsche Bank AG (London) | EUR/USD | 03/20/13 | 85,855 | (114 | ) | |||||||
| JPY/USD | 03/21/13 | 417,079 | (7,921 | ) | ||||||||
| 34 | The accompanying notes are an integral part of these financial statements. |
GOLDMAN SACHS VARIABLE INSURANCE TRUST CORE FIXED INCOME FUND
ADDITIONAL INVESTMENT INFORMATION (continued)
FORWARD FOREIGN CURRENCY EXCHANGE CONTRACTS WITH UNREALIZED LOSS (continued)
| Counterparty | Contracts to Buy/Sell | Settlement Date | Current Value | Unrealized Loss | ||||||||
| HSBC Bank PLC | EUR/SEK | 03/20/13 | $ | 239,157 | $ | (2,280 | ) | |||||
| USD/NOK | 03/20/13 | 77,711 | (1,711 | ) | ||||||||
| JPMorgan Chase Bank NA | EUR/SEK | 03/20/13 | 348,704 | (3,095 | ) | |||||||
| USD/GBP | 01/09/13 | 9,939,305 | (203,780 | ) | ||||||||
| USD/MXN | 06/27/13 | 2,170,730 | (5,966 | ) | ||||||||
| Morgan Stanley Co., Inc. | EUR/NOK | 03/20/13 | 1,157,839 | (1,073 | ) | |||||||
| EUR/USD | 03/20/13 | 84,534 | (135 | ) | ||||||||
| Royal Bank of Canada | CAD/USD | 03/20/13 | 75,528 | (472 | ) | |||||||
| Royal Bank of Scotland | EUR/SEK | 03/20/13 | 84,534 | (177 | ) | |||||||
| NZD/USD | 03/20/13 | 173,092 | (570 | ) | ||||||||
| UBS AG (London) | EUR/SEK | 03/20/13 | 174,352 | (1,062 | ) | |||||||
| JPY/USD | 03/21/13 | 82,818 | (2,182 | ) | ||||||||
Westpac Banking Corp. | AUD/USD | 03/20/13 | 244,936 | (1,670 | ) | |||||||
| TOTAL | $ | (282,938 | ) | |||||||||
FORWARD SALES CONTRACTS — At December 31, 2012, the Fund had the following forward sales contracts:
| Description | Interest Rate | Maturity Date(e) | Settlement Date | Principal Amount | Value | |||||||||||||||
FNMA (Proceeds Receivable: $3,248,282) | 5.000 | % | TBA-30yr | 01/14/13 | $ | (3,000,000 | ) | $ | (3,249,609 | ) | ||||||||||
FUTURES CONTRACTS — At December 31, 2012, the Fund had the following futures contracts:
| Type | Number of Contracts Long (Short) | Expiration Date | Current Value | Unrealized Gain (Loss) | ||||||||||
| U.S. Long Bond | (79 | ) | March 2013 | $ | (11,652,500 | ) | $ | 132,828 | ||||||
| U.S. Ultra Long Treasury Bonds | 40 | March 2013 | 6,503,750 | (90,165 | ) | |||||||||
| 5 Year U.S. Treasury Notes | 152 | March 2013 | 18,910,938 | 22,011 | ||||||||||
10 Year U.S. Treasury Notes | (39 | ) | March 2013 | (5,178,469 | ) | (3,220 | ) | |||||||
| TOTAL | $ | 61,454 | ||||||||||||
| The accompanying notes are an integral part of these financial statements. | 35 |
GOLDMAN SACHS VARIABLE INSURANCE TRUST EQUITY INDEX FUND
Schedule of Investments
December 31, 2012
| Shares | Description | Value | ||||||
| Common Stocks – 99.5% | ||||||||
| Automobiles & Components – 0.8% |
| ||||||
| 1,500 | BorgWarner, Inc.* | $ | 107,430 | |||||
| 3,800 | Delphi Automotive PLC* | 145,350 | ||||||
| 50,049 | Ford Motor Co. | 648,134 | ||||||
| 3,040 | Harley-Davidson, Inc. | 148,474 | ||||||
| 9,085 | Johnson Controls, Inc. | 278,909 | ||||||
| 3,164 | The Goodyear Tire & Rubber Co.* | 43,695 | ||||||
|
| |||||||
| 1,371,992 | ||||||||
|
| |||||||
| Banks – 2.8% |
| ||||||
| 9,058 | BB&T Corp. | 263,678 | ||||||
| 2,550 | Comerica, Inc. | 77,367 | ||||||
| 12,146 | Fifth Third Bancorp | 184,498 | ||||||
| 3,534 | First Horizon National Corp. | 35,022 | ||||||
| 6,600 | Hudson City Bancorp, Inc. | 53,658 | ||||||
| 11,645 | Huntington Bancshares, Inc. | 74,411 | ||||||
| 12,400 | KeyCorp | 104,408 | ||||||
| 1,593 | M&T Bank Corp. | 156,863 | ||||||
| 4,789 | People’s United Financial, Inc. | 57,899 | ||||||
| 6,951 | PNC Financial Services Group, Inc. | 405,313 | ||||||
| 17,798 | Regions Financial Corp. | 126,722 | ||||||
| 6,954 | SunTrust Banks, Inc. | 197,146 | ||||||
| 24,603 | U.S. Bancorp | 785,820 | ||||||
| 64,341 | Wells Fargo & Co. | 2,199,175 | ||||||
| 2,430 | Zions Bancorporation | 52,002 | ||||||
|
| |||||||
| 4,773,982 | ||||||||
|
| |||||||
| Capital Goods – 7.8% |
| ||||||
| 8,321 | 3M Co. | 772,605 | ||||||
| 8,516 | Caterpillar, Inc. | 762,863 | ||||||
| 2,346 | Cummins, Inc. | 254,189 | ||||||
| 7,714 | Danaher Corp. | 431,213 | ||||||
| 5,133 | Deere & Co. | 443,594 | ||||||
| 2,401 | Dover Corp. | 157,770 | ||||||
| 6,056 | Eaton Corp. PLC | 328,235 | ||||||
| 9,465 | Emerson Electric Co. | 501,266 | ||||||
| 3,553 | Fastenal Co. | 165,890 | ||||||
| 635 | Flowserve Corp. | 93,218 | ||||||
| 2,247 | Fluor Corp. | 131,989 | ||||||
| 4,301 | General Dynamics Corp. | 297,930 | ||||||
| 137,369 | General Electric Co. | 2,883,375 | ||||||
| 10,248 | Honeywell International, Inc. | 650,441 | ||||||
| 5,600 | Illinois Tool Works, Inc. | 340,536 | ||||||
| 3,788 | Ingersoll-Rand PLC | 181,672 | ||||||
| 1,637 | Jacobs Engineering Group, Inc.* | 69,687 | ||||||
| 1,400 | Joy Global, Inc. | 89,292 | ||||||
| 1,300 | L-3 Communications Holdings, Inc. | 99,606 | ||||||
| 3,494 | Lockheed Martin Corp. | 322,461 | ||||||
| 4,800 | Masco Corp. | 79,968 | ||||||
| 3,273 | Northrop Grumman Corp. | 221,189 | ||||||
| 4,615 | PACCAR, Inc. | 208,644 | ||||||
| 1,552 | Pall Corp. | 93,524 | ||||||
| 1,968 | Parker Hannifin Corp. | 167,398 | ||||||
| 2,798 | Pentair Ltd. | 137,522 | ||||||
| 1,917 | Precision Castparts Corp. | 363,118 | ||||||
| 2,712 | Quanta Services, Inc.* | 74,010 | ||||||
|
| |||||||
| Common Stocks – (continued) | ||||||||
| Capital Goods – (continued) |
| ||||||
| 4,382 | Raytheon Co. | $ | 252,228 | |||||
| 1,816 | Rockwell Automation, Inc. | 152,526 | ||||||
| 1,853 | Rockwell Collins, Inc. | 107,789 | ||||||
| 1,224 | Roper Industries, Inc. | 136,452 | ||||||
| 803 | Snap-On, Inc. | 63,429 | ||||||
| 2,217 | Stanley Black & Decker, Inc. | 163,991 | ||||||
| 3,639 | Textron, Inc. | 90,211 | ||||||
| 8,907 | The Boeing Co. | 671,232 | ||||||
| 11,011 | United Technologies Corp. | 903,012 | ||||||
| 792 | W.W. Grainger, Inc. | 160,277 | ||||||
| 2,518 | Xylem, Inc. | 68,238 | ||||||
|
| |||||||
| 13,092,590 | ||||||||
|
| |||||||
| Commercial & Professional Services – 0.7% |
| ||||||
| 1,434 | Avery Dennison Corp. | 50,075 | ||||||
| 1,400 | Cintas Corp. | 57,260 | ||||||
| 578 | Dun & Bradstreet Corp. | 45,460 | ||||||
| 1,550 | Equifax, Inc. | 83,886 | ||||||
| 2,198 | Iron Mountain, Inc. | 68,248 | ||||||
| 2,600 | Pitney Bowes, Inc. | 27,664 | ||||||
| 3,925 | Republic Services, Inc. | 115,120 | ||||||
| 1,957 | Robert Half International, Inc. | 62,272 | ||||||
| 1,127 | Stericycle, Inc.* | 105,115 | ||||||
| 2,922 | The ADT Corp. | 135,844 | ||||||
| 5,989 | Tyco International Ltd. | 175,178 | ||||||
| 5,765 | Waste Management, Inc. | 194,511 | ||||||
|
| |||||||
| 1,120,633 | ||||||||
|
| |||||||
| Consumer Durables & Apparel – 1.1% |
| ||||||
| 3,769 | Coach, Inc. | 209,217 | ||||||
| 3,600 | D.R. Horton, Inc. | 71,208 | ||||||
| 700 | Fossil, Inc.* | 65,170 | ||||||
| 1,400 | Garmin Ltd. | 57,148 | ||||||
| 823 | Harman International Industries, Inc. | 36,739 | ||||||
| 1,521 | Hasbro, Inc. | 54,604 | ||||||
| 1,800 | Leggett & Platt, Inc. | 48,996 | ||||||
| 2,200 | Lennar Corp. Class A | 85,074 | ||||||
| 4,481 | Mattel, Inc. | 164,094 | ||||||
| 3,733 | Newell Rubbermaid, Inc. | 83,134 | ||||||
| 9,564 | NIKE, Inc. Class B | 493,502 | ||||||
| 4,513 | PulteGroup, Inc.* | 81,956 | ||||||
| 801 | Ralph Lauren Corp. | 120,086 | ||||||
| 1,142 | VF Corp. | 172,408 | ||||||
| 989 | Whirlpool Corp. | 100,631 | ||||||
|
| |||||||
| 1,843,967 | ||||||||
|
| |||||||
| Consumer Services – 1.9% |
| ||||||
| 1,200 | Apollo Group, Inc. Class A* | 25,104 | ||||||
| 5,828 | Carnival Corp. | 214,295 | ||||||
| 428 | Chipotle Mexican Grill, Inc.* | 127,313 | ||||||
| 1,766 | Darden Restaurants, Inc. | 79,594 | ||||||
| 3,300 | H&R Block, Inc. | 61,281 | ||||||
| 3,412 | International Game Technology | 48,348 | ||||||
| 3,321 | Marriott International, Inc. Class A | 123,774 | ||||||
| 13,160 | McDonald’s Corp. | 1,160,843 | ||||||
|
| |||||||
| 36 | The accompanying notes are an integral part of these financial statements. |
GOLDMAN SACHS VARIABLE INSURANCE TRUST EQUITY INDEX FUND
| Shares | Description | Value | ||||||
| Common Stocks – (continued) | ||||||||
| Consumer Services – (continued) |
| ||||||
| 9,695 | Starbucks Corp. | $ | 519,846 | |||||
| 2,600 | Starwood Hotels & Resorts Worldwide, Inc. | 149,136 | ||||||
| 1,828 | Wyndham Worldwide Corp. | 97,268 | ||||||
| 1,032 | Wynn Resorts Ltd. | 116,090 | ||||||
| 5,972 | Yum! Brands, Inc. | 396,541 | ||||||
|
| |||||||
| 3,119,433 | ||||||||
|
| |||||||
| Diversified Financials – 6.4% | |||||||
| 12,854 | American Express Co. | 738,848 | ||||||
| 2,716 | Ameriprise Financial, Inc. | 170,103 | ||||||
| 141,059 | Bank of America Corp. | 1,636,284 | ||||||
| 1,586 | BlackRock, Inc. | 327,842 | ||||||
| 7,658 | Capital One Financial Corp. | 443,628 | ||||||
| 38,287 | Citigroup, Inc. | 1,514,634 | ||||||
| 4,047 | CME Group, Inc. | 205,223 | ||||||
| 6,542 | Discover Financial Services | 252,194 | ||||||
| 3,050 | E*TRADE Financial Corp.* | 27,298 | ||||||
| 1,802 | Franklin Resources, Inc. | 226,511 | ||||||
| 932 | IntercontinentalExchange, Inc.* | 115,391 | ||||||
| 5,783 | Invesco Ltd. | 150,879 | ||||||
| 49,738 | JPMorgan Chase & Co. | 2,186,980 | ||||||
| 1,632 | Legg Mason, Inc. | 41,975 | ||||||
| 2,500 | Leucadia National Corp. | 59,475 | ||||||
| 2,530 | Moody’s Corp. | 127,310 | ||||||
| 18,247 | Morgan Stanley | 348,883 | ||||||
| 2,898 | Northern Trust Corp. | 145,364 | ||||||
| 3,171 | NYSE Euronext | 100,013 | ||||||
| 6,148 | SLM Corp. | 105,315 | ||||||
| 6,050 | State Street Corp. | 284,411 | ||||||
| 3,372 | T. Rowe Price Group, Inc. | 219,618 | ||||||
| 15,289 | The Bank of New York Mellon Corp. | 392,927 | ||||||
| 14,156 | The Charles Schwab Corp. | 203,280 | ||||||
| 5,761 | The Goldman Sachs Group, Inc.(a) | 734,873 | ||||||
| 1,683 | The NASDAQ OMX Group, Inc. | 42,092 | ||||||
|
| |||||||
| 10,801,351 | ||||||||
|
| |||||||
| Energy – 10.9% | |||||||
| 6,501 | Anadarko Petroleum Corp. | 483,089 | ||||||
| 5,124 | Apache Corp. | 402,234 | ||||||
| 5,691 | Baker Hughes, Inc. | 232,420 | ||||||
| 2,749 | Cabot Oil & Gas Corp. | 136,735 | ||||||
| 3,285 | Cameron International Corp.* | 185,471 | ||||||
| 7,017 | Chesapeake Energy Corp. | 116,623 | ||||||
| 25,638 | Chevron Corp. | 2,772,493 | ||||||
| 15,841 | ConocoPhillips | 918,620 | ||||||
| 2,900 | CONSOL Energy, Inc. | 93,090 | ||||||
| 5,267 | Denbury Resources, Inc.* | 85,325 | ||||||
| 4,923 | Devon Energy Corp. | 256,193 | ||||||
| 969 | Diamond Offshore Drilling, Inc. | 65,853 | ||||||
| 3,100 | Ensco PLC Class A | 183,768 | ||||||
| 3,511 | EOG Resources, Inc. | 424,094 | ||||||
| 2,017 | EQT Corp. | 118,963 | ||||||
| 59,739 | Exxon Mobil Corp. | 5,170,410 | ||||||
| 3,106 | FMC Technologies, Inc.* | 133,030 | ||||||
|
| |||||||
| Common Stocks – (continued) | ||||||||
| Energy – (continued) | |||||||
| 12,184 | Halliburton Co. | $ | 422,663 | |||||
| 1,356 | Helmerich & Payne, Inc. | 75,950 | ||||||
| 3,877 | Hess Corp. | 205,326 | ||||||
| 8,265 | Kinder Morgan, Inc. | 292,002 | ||||||
| 9,139 | Marathon Oil Corp. | 280,202 | ||||||
| 4,384 | Marathon Petroleum Corp. | 276,192 | ||||||
| 2,439 | Murphy Oil Corp. | 145,242 | ||||||
| 4,032 | Nabors Industries Ltd.* | 58,262 | ||||||
| 5,571 | National Oilwell Varco, Inc. | 380,778 | ||||||
| 1,900 | Newfield Exploration Co.* | 50,882 | ||||||
| 3,300 | Noble Corp. | 114,906 | ||||||
| 2,351 | Noble Energy, Inc. | 239,191 | ||||||
| 10,560 | Occidental Petroleum Corp. | 809,002 | ||||||
| 3,406 | Peabody Energy Corp. | 90,634 | ||||||
| 8,277 | Phillips 66 | 439,509 | ||||||
| 1,600 | Pioneer Natural Resources Co. | 170,544 | ||||||
| 2,242 | QEP Resources, Inc. | 67,865 | ||||||
| 2,085 | Range Resources Corp. | 131,001 | ||||||
| 1,600 | Rowan Companies PLC Class A* | 50,032 | ||||||
| 17,319 | Schlumberger Ltd. | 1,200,034 | ||||||
| 4,581 | Southwestern Energy Co.* | 153,051 | ||||||
| 8,675 | Spectra Energy Corp. | 237,521 | ||||||
| 1,900 | Tesoro Corp. | 83,695 | ||||||
| 8,801 | The Williams Companies, Inc. | 288,145 | ||||||
| 7,292 | Valero Energy Corp. | 248,803 | ||||||
| 2,881 | WPX Energy, Inc.* | 42,869 | ||||||
|
| |||||||
| 18,332,712 | ||||||||
|
| |||||||
| Food & Staples Retailing – 2.4% | |||||||
| 5,629 | Costco Wholesale Corp. | 555,976 | ||||||
| 16,287 | CVS Caremark Corp. | 787,476 | ||||||
| 3,176 | Safeway, Inc. | 57,454 | ||||||
| 7,654 | Sysco Corp. | 242,326 | ||||||
| 6,624 | The Kroger Co. | 172,357 | ||||||
| 11,276 | Walgreen Co. | 417,325 | ||||||
| 21,975 | Wal-Mart Stores, Inc. | 1,499,354 | ||||||
| 2,245 | Whole Foods Market, Inc. | 205,036 | ||||||
|
| |||||||
| 3,937,304 | ||||||||
|
| |||||||
| Food, Beverage & Tobacco – 5.9% | |||||||
| 26,719 | Altria Group, Inc. | 839,511 | ||||||
| 8,524 | Archer-Daniels-Midland Co. | 233,472 | ||||||
| 2,100 | Beam, Inc. | 128,289 | ||||||
| 2,020 | Brown-Forman Corp. Class B | 127,765 | ||||||
| 2,300 | Campbell Soup Co. | 80,247 | ||||||
| 3,643 | Coca-Cola Enterprises, Inc. | 115,593 | ||||||
| 5,355 | ConAgra Foods, Inc. | 157,973 | ||||||
| 1,800 | Constellation Brands, Inc. Class A* | 63,702 | ||||||
| 2,600 | Dean Foods Co.* | 42,926 | ||||||
| 2,800 | Dr. Pepper Snapple Group, Inc. | 123,704 | ||||||
| 8,417 | General Mills, Inc. | 340,131 | ||||||
| 4,206 | H.J. Heinz Co. | 242,602 | ||||||
| 1,800 | Hormel Foods Corp. | 56,178 | ||||||
| 3,234 | Kellogg Co. | 180,619 | ||||||
| 7,819 | Kraft Foods Group, Inc. | 355,530 | ||||||
|
| |||||||
| The accompanying notes are an integral part of these financial statements. | 37 |
GOLDMAN SACHS VARIABLE INSURANCE TRUST EQUITY INDEX FUND
Schedule of Investments (continued)
December 31, 2012
| Shares | Description | Value | ||||||
| Common Stocks – (continued) | ||||||||
| Food, Beverage & Tobacco – (continued) | |||||||
| 1,739 | Lorillard, Inc. | $ | 202,889 | |||||
| 1,709 | McCormick & Co., Inc. | 108,573 | ||||||
| 2,701 | Mead Johnson Nutrition Co. | 177,969 | ||||||
| 2,123 | Molson Coors Brewing Co. Class B | 90,843 | ||||||
| 23,354 | Mondelez International, Inc. Class A | 594,826 | ||||||
| 2,000 | Monster Beverage Corp.* | 105,760 | ||||||
| 20,330 | PepsiCo, Inc. | 1,391,182 | ||||||
| 21,849 | Philip Morris International, Inc. | 1,827,450 | ||||||
| 4,379 | Reynolds American, Inc. | 181,422 | ||||||
| 50,697 | The Coca-Cola Co. | 1,837,766 | ||||||
| 1,997 | The Hershey Co. | 144,223 | ||||||
| 1,437 | The J.M. Smucker Co. | 123,927 | ||||||
| 3,695 | Tyson Foods, Inc. Class A | 71,683 | ||||||
|
| |||||||
| 9,946,755 | ||||||||
|
| |||||||
| Health Care Equipment & Services – 4.6% | |||||||
| 20,685 | Abbott Laboratories | 1,354,867 | ||||||
| 4,424 | Aetna, Inc. | 204,831 | ||||||
| 3,022 | AmerisourceBergen Corp. | 130,490 | ||||||
| 7,193 | Baxter International, Inc. | 479,485 | ||||||
| 2,623 | Becton, Dickinson and Co. | 205,092 | ||||||
| 18,305 | Boston Scientific Corp.* | 104,888 | ||||||
| 994 | C. R. Bard, Inc. | 97,154 | ||||||
| 4,445 | Cardinal Health, Inc. | 183,045 | ||||||
| 2,842 | CareFusion Corp.* | 81,224 | ||||||
| 1,870 | Cerner Corp.* | 145,187 | ||||||
| 3,762 | Cigna Corp. | 201,117 | ||||||
| 1,711 | Coventry Health Care, Inc. | 76,704 | ||||||
| 6,134 | Covidien PLC | 354,177 | ||||||
| 1,100 | DaVita HealthCare Partners, Inc.* | 121,583 | ||||||
| 1,805 | DENTSPLY International, Inc. | 71,496 | ||||||
| 1,494 | Edwards Lifesciences Corp.* | 134,714 | ||||||
| 10,667 | Express Scripts Holding Co.* | 576,018 | ||||||
| 2,093 | Humana, Inc. | 143,643 | ||||||
| 527 | Intuitive Surgical, Inc.* | 258,425 | ||||||
| 1,235 | Laboratory Corp. of America Holdings* | 106,976 | ||||||
| 3,084 | McKesson Corp. | 299,025 | ||||||
| 13,221 | Medtronic, Inc. | 542,325 | ||||||
| 1,081 | Patterson Companies, Inc. | 37,003 | ||||||
| 2,034 | Quest Diagnostics, Inc. | 118,521 | ||||||
| 4,074 | St. Jude Medical, Inc. | 147,234 | ||||||
| 3,795 | Stryker Corp. | 208,042 | ||||||
| 1,437 | Tenet Healthcare Corp.* | 46,659 | ||||||
| 13,472 | UnitedHealth Group, Inc. | 730,721 | ||||||
| 1,486 | Varian Medical Systems, Inc.* | 104,377 | ||||||
| 3,968 | WellPoint, Inc. | 241,731 | ||||||
| 2,317 | Zimmer Holdings, Inc. | 154,451 | ||||||
|
| |||||||
| 7,661,205 | ||||||||
|
| |||||||
| Household & Personal Products – 2.3% | |||||||
| 5,486 | Avon Products, Inc. | 78,779 | ||||||
| 5,867 | Colgate-Palmolive Co. | 613,336 | ||||||
| 5,189 | Kimberly-Clark Corp. | 438,107 | ||||||
| 1,700 | The Clorox Co. | 124,474 | ||||||
|
| |||||||
| Common Stocks – (continued) | ||||||||
| Household & Personal Products – (continued) | |||||||
| 3,170 | The Estee Lauder Companies, Inc. Class A | $ | 189,756 | |||||
| 35,761 | The Procter & Gamble Co. | 2,427,815 | ||||||
|
| |||||||
| 3,872,267 | ||||||||
|
| |||||||
| Insurance – 4.0% | |||||||
| 4,473 | ACE Ltd. | 356,945 | ||||||
| 6,172 | Aflac, Inc. | 327,857 | ||||||
| 19,412 | American International Group, Inc.* | 685,244 | ||||||
| 4,239 | Aon PLC | 235,688 | ||||||
| 1,000 | Assurant, Inc. | 34,700 | ||||||
| 23,905 | Berkshire Hathaway, Inc. Class B* | 2,144,279 | ||||||
| 1,900 | Cincinnati Financial Corp. | 74,404 | ||||||
| 6,800 | Genworth Financial, Inc. Class A* | 51,068 | ||||||
| 5,711 | Hartford Financial Services Group, Inc. | 128,155 | ||||||
| 3,769 | Lincoln National Corp. | 97,617 | ||||||
| 4,046 | Loews Corp. | 164,875 | ||||||
| 7,079 | Marsh & McLennan Companies, Inc. | 244,013 | ||||||
| 14,235 | MetLife, Inc. | 468,901 | ||||||
| 3,627 | Principal Financial Group, Inc. | 103,442 | ||||||
| 6,113 | Prudential Financial, Inc. | 326,006 | ||||||
| 6,380 | The Allstate Corp. | 256,285 | ||||||
| 3,423 | The Chubb Corp. | 257,820 | ||||||
| 7,422 | The Progressive Corp. | 156,604 | ||||||
| 5,020 | The Travelers Companies, Inc. | 360,536 | ||||||
| 1,311 | Torchmark Corp. | 67,739 | ||||||
| 3,718 | Unum Group | 77,409 | ||||||
| 3,984 | XL Group PLC | 99,839 | ||||||
|
| |||||||
| 6,719,426 | ||||||||
|
| |||||||
| Materials – 3.6% | |||||||
| 2,798 | Air Products & Chemicals, Inc. | 235,088 | ||||||
| 900 | Airgas, Inc. | 82,161 | ||||||
| 13,800 | Alcoa, Inc. | 119,784 | ||||||
| 1,487 | Allegheny Technologies, Inc. | 45,145 | ||||||
| 2,095 | Ball Corp. | 93,751 | ||||||
| 1,300 | Bemis Co., Inc. | 43,498 | ||||||
| 832 | CF Industries Holdings, Inc. | 169,029 | ||||||
| 1,971 | Cliffs Natural Resources, Inc. | 76,002 | ||||||
| 12,111 | E.I. du Pont de Nemours & Co. | 544,632 | ||||||
| 1,953 | Eastman Chemical Co. | 132,902 | ||||||
| 3,484 | Ecolab, Inc. | 250,499 | ||||||
| 1,769 | FMC Corp. | 103,522 | ||||||
| 12,336 | Freeport-McMoRan Copper & Gold, Inc. | 421,891 | ||||||
| 1,083 | International Flavors & Fragrances, Inc. | 72,063 | ||||||
| 5,808 | International Paper Co. | 231,391 | ||||||
| 4,931 | LyondellBasell Industries NV Class A | 281,511 | ||||||
| 2,198 | MeadWestvaco Corp. | 70,050 | ||||||
| 7,015 | Monsanto Co. | 663,970 | ||||||
| 6,503 | Newmont Mining Corp. | 301,999 | ||||||
| 4,200 | Nucor Corp. | 181,356 | ||||||
| 2,162 | Owens-Illinois, Inc.* | 45,986 | ||||||
| 2,024 | PPG Industries, Inc. | 273,948 | ||||||
|
| |||||||
| 38 | The accompanying notes are an integral part of these financial statements. |
GOLDMAN SACHS VARIABLE INSURANCE TRUST EQUITY INDEX FUND
| Shares | Description | Value | ||||||
| Common Stocks – (continued) | ||||||||
| Materials – (continued) | |||||||
| 3,933 | Praxair, Inc. | $ | 430,467 | |||||
| 2,616 | Sealed Air Corp. | 45,806 | ||||||
| 1,600 | Sigma-Aldrich Corp. | 117,728 | ||||||
| 15,708 | The Dow Chemical Co. | 507,682 | ||||||
| 3,571 | The Mosaic Co. | 202,226 | ||||||
| 1,129 | The Sherwin-Williams Co. | 173,663 | ||||||
| 1,968 | United States Steel Corp. | 46,976 | ||||||
| 1,657 | Vulcan Materials Co. | 86,247 | ||||||
|
| |||||||
| 6,050,973 | ||||||||
|
| |||||||
| Media – 3.6% | |||||||
| 2,740 | Cablevision Systems Corp. Class A | 40,936 | ||||||
| 7,836 | CBS Corp. Class B | 298,160 | ||||||
| 34,992 | Comcast Corp. Class A | 1,308,001 | ||||||
| 7,890 | DIRECTV* | 395,762 | ||||||
| 3,063 | Discovery Communications, Inc. Class A* | 194,439 | ||||||
| 2,891 | Gannett Co., Inc. | 52,067 | ||||||
| 26,541 | News Corp. Class A | 677,857 | ||||||
| 3,447 | Omnicom Group, Inc. | 172,212 | ||||||
| 1,118 | Scripps Networks Interactive, Inc. Class A | 64,755 | ||||||
| 6,071 | The Interpublic Group of Companies, Inc. | 66,903 | ||||||
| 3,654 | The McGraw-Hill Companies, Inc. | 199,764 | ||||||
| 23,215 | The Walt Disney Co. | 1,155,875 | ||||||
| 63 | The Washington Post Co. Class B | 23,008 | ||||||
| 3,983 | Time Warner Cable, Inc. | 387,108 | ||||||
| 12,486 | Time Warner, Inc. | 597,205 | ||||||
| 6,011 | Viacom, Inc. Class B | 317,020 | ||||||
|
| |||||||
| 5,951,072 | ||||||||
|
| |||||||
| Pharmaceuticals, Biotechnology & Life Sciences – 7.4% |
| ||||||
| 4,496 | Agilent Technologies, Inc. | 184,066 | ||||||
| 2,518 | Alexion Pharmaceuticals, Inc.* | 236,214 | ||||||
| 4,026 | Allergan, Inc. | 369,305 | ||||||
| 10,052 | Amgen, Inc. | 867,689 | ||||||
| 3,044 | Biogen Idec, Inc.* | 446,463 | ||||||
| 21,581 | Bristol-Myers Squibb Co. | 703,325 | ||||||
| 5,537 | Celgene Corp.* | 435,873 | ||||||
| 13,443 | Eli Lilly & Co. | 663,009 | ||||||
| 3,077 | Forest Laboratories, Inc.* | 108,680 | ||||||
| 9,861 | Gilead Sciences, Inc.* | 724,290 | ||||||
| 2,290 | Hospira, Inc.* | 71,540 | ||||||
| 36,297 | Johnson & Johnson | 2,544,420 | ||||||
| 2,293 | Life Technologies Corp.* | 112,540 | ||||||
| 39,891 | Merck & Co., Inc. | 1,633,137 | ||||||
| 5,352 | Mylan, Inc.* | 147,073 | ||||||
| 1,500 | PerkinElmer, Inc. | 47,610 | ||||||
| 1,119 | Perrigo Co. | 116,409 | ||||||
| 96,387 | Pfizer, Inc. | 2,417,386 | ||||||
| 4,744 | Thermo Fisher Scientific, Inc. | 302,572 | ||||||
| 1,126 | Waters Corp.* | 98,097 | ||||||
| 1,700 | Watson Pharmaceuticals, Inc.* | 146,200 | ||||||
|
| |||||||
| 12,375,898 | ||||||||
|
| |||||||
| Common Stocks – (continued) | ||||||||
| Real Estate – 2.2% | |||||||
| 5,135 | American Tower Corp. (REIT) | $ | 396,781 | |||||
| 1,780 | Apartment Investment & Management Co. Class A (REIT) | 48,167 | ||||||
| 1,491 | AvalonBay Communities, Inc. (REIT) | 202,165 | ||||||
| 1,963 | Boston Properties, Inc. (REIT) | 207,705 | ||||||
| 3,915 | CBRE Group, Inc. Class A* | 77,909 | ||||||
| 4,138 | Equity Residential (REIT) | 234,500 | ||||||
| 5,900 | HCP, Inc. (REIT) | 266,562 | ||||||
| 3,400 | Health Care REIT, Inc. (REIT) | 208,386 | ||||||
| 9,593 | Host Hotels & Resorts, Inc. (REIT) | 150,322 | ||||||
| 5,300 | Kimco Realty Corp. (REIT) | 102,396 | ||||||
| 2,130 | Plum Creek Timber Co., Inc. (REIT) | 94,508 | ||||||
| 6,087 | Prologis, Inc. (REIT) | 222,115 | ||||||
| 1,856 | Public Storage (REIT) | 269,046 | ||||||
| 3,992 | Simon Property Group, Inc. (REIT) | 631,095 | ||||||
| 3,873 | Ventas, Inc. (REIT) | 250,661 | ||||||
| 2,252 | Vornado Realty Trust (REIT) | 180,340 | ||||||
| 7,155 | Weyerhaeuser Co. (REIT) | 199,052 | ||||||
|
| |||||||
| 3,741,710 | ||||||||
|
| |||||||
| Retailing – 4.1% | |||||||
| 1,135 | Abercrombie & Fitch Co. Class A | 54,446 | ||||||
| 4,720 | Amazon.com, Inc.* | 1,185,381 | ||||||
| 499 | AutoNation, Inc.* | 19,810 | ||||||
| 466 | AutoZone, Inc.* | 165,164 | ||||||
| 2,994 | Bed Bath & Beyond, Inc.* | 167,395 | ||||||
| 3,266 | Best Buy Co., Inc. | 38,702 | ||||||
| 900 | Big Lots, Inc.* | 25,614 | ||||||
| 3,000 | CarMax, Inc.* | 112,620 | ||||||
| 3,500 | Dollar General Corp.* | 154,315 | ||||||
| 3,064 | Dollar Tree, Inc.* | 124,276 | ||||||
| 1,183 | Expedia, Inc. | 72,695 | ||||||
| 1,302 | Family Dollar Stores, Inc. | 82,560 | ||||||
| 1,537 | GameStop Corp. Class A | 38,563 | ||||||
| 2,011 | Genuine Parts Co. | 127,859 | ||||||
| 2,000 | J.C. Penney Co., Inc. | 39,420 | ||||||
| 2,877 | Kohl’s Corp. | 123,654 | ||||||
| 3,137 | Limited Brands, Inc. | 147,627 | ||||||
| 14,702 | Lowe’s Companies, Inc. | 522,215 | ||||||
| 5,334 | Macy’s, Inc. | 208,133 | ||||||
| 708 | Netflix, Inc.* | 65,688 | ||||||
| 2,003 | Nordstrom, Inc. | 107,161 | ||||||
| 1,485 | O’Reilly Automotive, Inc.* | 132,789 | ||||||
| 1,394 | PetSmart, Inc. | 95,266 | ||||||
| 658 | Priceline.com, Inc.* | 408,750 | ||||||
| 2,915 | Ross Stores, Inc. | 157,847 | ||||||
| 8,854 | Staples, Inc. | 100,936 | ||||||
| 8,614 | Target Corp. | 509,690 | ||||||
| 3,950 | The Gap, Inc. | 122,608 | ||||||
| 19,674 | The Home Depot, Inc. | 1,216,837 | ||||||
| 1,556 | Tiffany & Co. | 89,221 | ||||||
| 9,585 | TJX Companies, Inc. | 406,883 | ||||||
| 1,400 | TripAdvisor, Inc.* | 58,744 | ||||||
| 1,400 | Urban Outfitters, Inc.* | 55,104 | ||||||
|
| |||||||
| 6,937,973 | ||||||||
|
| |||||||
| The accompanying notes are an integral part of these financial statements. | 39 |
GOLDMAN SACHS VARIABLE INSURANCE TRUST EQUITY INDEX FUND
Schedule of Investments (continued)
December 31, 2012
| Shares | Description | Value | ||||||
| Common Stocks – (continued) | ||||||||
| Semiconductors & Semiconductor Equipment – 2.0% | |||||||
| 8,100 | Advanced Micro Devices, Inc.* | $ | 19,440 | |||||
| 4,234 | Altera Corp. | 145,819 | ||||||
| 4,000 | Analog Devices, Inc. | 168,240 | ||||||
| 15,516 | Applied Materials, Inc. | 177,503 | ||||||
| 6,719 | Broadcom Corp. Class A* | 223,138 | ||||||
| 780 | First Solar, Inc.* | 24,087 | ||||||
| 65,310 | Intel Corp. | 1,347,345 | ||||||
| 2,166 | KLA-Tencor Corp. | 103,448 | ||||||
| 2,172 | Lam Research Corp.* | 78,474 | ||||||
| 2,967 | Linear Technology Corp. | 101,768 | ||||||
| 7,900 | LSI Corp.* | 55,932 | ||||||
| 2,471 | Microchip Technology, Inc. | 80,530 | ||||||
| 13,543 | Micron Technology, Inc.* | 85,998 | ||||||
| 7,902 | NVIDIA Corp. | 97,116 | ||||||
| 2,300 | Teradyne, Inc.* | 38,847 | ||||||
| 14,652 | Texas Instruments, Inc. | 453,333 | ||||||
| 3,500 | Xilinx, Inc. | 125,650 | ||||||
|
| |||||||
| 3,326,668 | ||||||||
|
| |||||||
| Software & Services – 9.5% | |||||||
| 8,352 | Accenture PLC Class A | 555,408 | ||||||
| 6,365 | Adobe Systems, Inc.* | 239,833 | ||||||
| 2,273 | Akamai Technologies, Inc.* | 92,988 | ||||||
| 3,000 | Autodesk, Inc.* | 106,050 | ||||||
| 6,337 | Automatic Data Processing, Inc. | 361,272 | ||||||
| 1,914 | BMC Software, Inc.* | 75,909 | ||||||
| 4,604 | CA, Inc. | 101,196 | ||||||
| 2,492 | Citrix Systems, Inc.* | 163,849 | ||||||
| 3,956 | Cognizant Technology Solutions Corp. Class A* | 292,942 | ||||||
| 1,996 | Computer Sciences Corp. | 79,940 | ||||||
| 15,155 | eBay, Inc.* | 773,208 | ||||||
| 4,436 | Electronic Arts, Inc.* | 64,455 | ||||||
| 3,200 | Fidelity National Information Services, Inc. | 111,392 | ||||||
| 1,776 | Fiserv, Inc.* | 140,357 | ||||||
| 3,461 | Google, Inc. Class A* | 2,455,130 | ||||||
| 13,936 | International Business Machines Corp. | 2,669,441 | ||||||
| 3,673 | Intuit, Inc. | 218,543 | ||||||
| 1,398 | Mastercard, Inc. Class A | 686,809 | ||||||
| 99,182 | Microsoft Corp. | 2,651,135 | ||||||
| 49,247 | Oracle Corp. | 1,640,910 | ||||||
| 4,180 | Paychex, Inc. | 130,165 | ||||||
| 2,500 | Red Hat, Inc.* | 132,400 | ||||||
| 3,833 | SAIC, Inc. | 43,390 | ||||||
| 1,658 | Salesforce.com, Inc.* | 278,710 | ||||||
| 9,281 | Symantec Corp.* | 174,576 | ||||||
| 2,165 | Teradata Corp.* | 133,992 | ||||||
| 8,019 | The Western Union Co. | 109,139 | ||||||
| 2,157 | Total System Services, Inc. | 46,203 | ||||||
| 2,106 | VeriSign, Inc.* | 81,755 | ||||||
| 6,790 | Visa, Inc. Class A | 1,029,228 | ||||||
| 13,712 | Yahoo!, Inc.* | 272,869 | ||||||
|
| |||||||
| 15,913,194 | ||||||||
|
| |||||||
| Common Stocks – (continued) | ||||||||
| Technology Hardware & Equipment – 7.5% | |||||||
| 2,126 | Amphenol Corp. Class A | $ | 137,552 | |||||
| 12,351 | Apple, Inc. | 6,583,454 | ||||||
| 69,274 | Cisco Systems, Inc. | 1,361,234 | ||||||
| 19,473 | Corning, Inc. | 245,749 | ||||||
| 18,967 | Dell, Inc. | 192,136 | ||||||
| 27,564 | EMC Corp.* | 697,369 | ||||||
| 1,034 | F5 Networks, Inc.* | 100,453 | ||||||
| 2,100 | FLIR Systems, Inc. | 46,851 | ||||||
| 1,521 | Harris Corp. | 74,468 | ||||||
| 25,735 | Hewlett-Packard Co. | 366,724 | ||||||
| 2,583 | Jabil Circuit, Inc. | 49,826 | ||||||
| 2,854 | JDS Uniphase Corp.* | 38,643 | ||||||
| 7,000 | Juniper Networks, Inc.* | 137,690 | ||||||
| 1,725 | Molex, Inc. | 47,144 | ||||||
| 3,654 | Motorola Solutions, Inc. | 203,455 | ||||||
| 4,822 | NetApp, Inc.* | 161,778 | ||||||
| 22,270 | QUALCOMM, Inc. | 1,381,185 | ||||||
| 3,123 | SanDisk Corp.* | 136,038 | ||||||
| 4,331 | Seagate Technology PLC | 132,009 | ||||||
| 5,649 | TE Connectivity Ltd. | 209,691 | ||||||
| 2,912 | Western Digital Corp. | 123,731 | ||||||
| 17,179 | Xerox Corp. | 117,161 | ||||||
|
| |||||||
| 12,544,341 | ||||||||
|
| |||||||
| Telecommunication Services – 3.0% | |||||||
| 74,362 | AT&T, Inc. | 2,506,743 | ||||||
| 8,104 | CenturyLink, Inc. | 317,028 | ||||||
| 3,825 | Crown Castle International Corp.* | 276,012 | ||||||
| 13,831 | Frontier Communications Corp. | 59,197 | ||||||
| 4,000 | MetroPCS Communications, Inc.* | 39,760 | ||||||
| 39,407 | Sprint Nextel Corp.* | 223,438 | ||||||
| 37,290 | Verizon Communications, Inc. | 1,613,538 | ||||||
| 7,681 | Windstream Corp. | 63,599 | ||||||
|
| |||||||
| 5,099,315 | ||||||||
|
| |||||||
| Transportation – 1.6% | |||||||
| 2,104 | C.H. Robinson Worldwide, Inc. | 133,015 | ||||||
| 13,475 | CSX Corp. | 265,862 | ||||||
| 2,814 | Expeditors International of Washington, Inc. | 111,294 | ||||||
| 3,849 | FedEx Corp. | 353,030 | ||||||
| 4,181 | Norfolk Southern Corp. | 258,553 | ||||||
| 600 | Ryder System, Inc. | 29,958 | ||||||
| 9,599 | Southwest Airlines Co. | 98,294 | ||||||
| 6,159 | Union Pacific Corp. | 774,309 | ||||||
| 9,368 | United Parcel Service, Inc. Class B | 690,702 | ||||||
|
| |||||||
| 2,715,017 | ||||||||
|
| |||||||
| Utilities – 3.4% | |||||||
| 1,500 | AGL Resources, Inc. | 59,955 | ||||||
| 3,035 | Ameren Corp. | 93,235 | ||||||
| 6,284 | American Electric Power Co., Inc. | 268,201 | ||||||
| 5,521 | CenterPoint Energy, Inc. | 106,279 | ||||||
| 3,400 | CMS Energy Corp. | 82,892 | ||||||
| 3,830 | Consolidated Edison, Inc. | 212,718 | ||||||
|
| |||||||
| 40 | The accompanying notes are an integral part of these financial statements. |
GOLDMAN SACHS VARIABLE INSURANCE TRUST EQUITY INDEX FUND
Shares | Description | Value | ||||||
| Common Stocks – (continued) | ||||||||
| Utilities – (continued) | |||||||
| 7,527 | Dominion Resources, Inc. | $ | 389,899 | |||||
| 2,228 | DTE Energy Co. | 133,791 | ||||||
| 9,242 | Duke Energy Corp. | 589,640 | ||||||
| 4,270 | Edison International | 192,961 | ||||||
| 2,360 | Entergy Corp. | 150,450 | ||||||
| 11,089 | Exelon Corp. | 329,787 | ||||||
| 5,565 | FirstEnergy Corp. | 232,394 | ||||||
| 1,031 | Integrys Energy Group, Inc. | 53,839 | ||||||
| 5,518 | NextEra Energy, Inc. | 381,790 | ||||||
| 3,700 | NiSource, Inc. | 92,093 | ||||||
| 4,110 | Northeast Utilities | 160,619 | ||||||
| 4,130 | NRG Energy, Inc. | 94,949 | ||||||
| 2,670 | Oneok, Inc. | 114,143 | ||||||
| 3,170 | Pepco Holdings, Inc. | 62,164 | ||||||
| 5,678 | PG&E Corp. | 228,142 | ||||||
| 1,395 | Pinnacle West Capital Corp. | 71,117 | ||||||
| 7,659 | PPL Corp. | 219,277 | ||||||
| 6,755 | Public Service Enterprise Group, Inc. | 206,703 | ||||||
| 1,546 | SCANA Corp. | 70,559 | ||||||
| 2,986 | Sempra Energy | 211,827 | ||||||
| 2,535 | TECO Energy, Inc. | 42,487 | ||||||
| 8,064 | The AES Corp. | 86,285 | ||||||
| 11,417 | The Southern Co. | 488,762 | ||||||
| 2,978 | Wisconsin Energy Corp. | 109,739 | ||||||
| 6,409 | Xcel Energy, Inc. | 171,184 | ||||||
|
| |||||||
| 5,707,881 | ||||||||
|
| |||||||
| TOTAL COMMON STOCKS | ||||||||
| (Cost $127,639,689) | $ | 166,957,659 | ||||||
|
| |||||||
| Principal Amount | Interest Rate | Maturity Date | Value | |||||||||
| U.S. Treasury Obligations(b)(c) – 0.1% |
| ||||||||||
| United States Treasury Bills | ||||||||||||
| $ 40,000 | 0.000% | 03/07/13 | $ | 39,997 | ||||||||
| 100,000 | 0.000 | 02/07/13 | 99,997 | |||||||||
|
| |||||||||||
| TOTAL U.S. TREASURY OBLIGATIONS | ||||||||||||
| (Cost $139,984) | $ | 139,994 | ||||||||||
|
| |||||||||||
| TOTAL INVESTMENTS – 99.6% | ||||||||||||
| (Cost $127,779,673) | $ | 167,097,653 | ||||||||||
|
| |||||||||||
| OTHER ASSETS IN EXCESS OF | | 713,208 | |||||||||
|
| |||||||||||
| NET ASSETS – 100.0% | $ | 167,810,861 | ||||||||||
|
| |||||||||||
| The percentage shown for each investment category reflects the value of investments in that category as a percentage of net assets. | ||
| * | Non-income producing security. | |
| (a) | Represents an affiliated issuer. | |
| (b) | Issued with a zero coupon. Income is recognized through the accretion of discount. | |
| (c) | All or a portion of security is segregated as collateral for initial margin requirements on futures transactions. | |
| Investment Abbreviation: | ||
| REIT | —Real Estate Investment Trust | |
| The accompanying notes are an integral part of these financial statements. | 41 |
GOLDMAN SACHS VARIABLE INSURANCE TRUST EQUITY INDEX FUND
Schedule of Investments (continued)
December 31, 2012
ADDITIONAL INVESTMENT INFORMATION
FUTURES CONTRACTS — At December 31, 2012, the Fund had the following futures contracts:
| Type | Number of Contracts Long (Short) | Expiration Date | Current Value | Unrealized Gain (Loss) | ||||||||||
| S&P 500 E-mini Index | 14 | March 2013 | $ | 994,070 | $ | (507 | ) | |||||||
| 42 | The accompanying notes are an integral part of these financial statements. |
GOLDMAN SACHS VARIABLE INSURANCE TRUST GOVERNMENT INCOME FUND
Schedule of Investments
December 31, 2012
| Principal Amount | Interest Rate | Maturity Date | Value | |||||||||||
| Mortgage-Backed Obligations – 61.2% | ||||||||||||||
| Collateralized Mortgage Obligations – 4.9% |
| ||||||||||||
| Agency Multi-Family – 3.4% |
| ||||||||||||
| FNMA |
| ||||||||||||
| $ | 193,261 | 2.800% | 03/01/18 | $ | 206,551 | |||||||||
| 489,417 | 3.740 | 05/01/18 | 547,186 | |||||||||||
| 110,000 | 3.840 | 05/01/18 | 123,473 | |||||||||||
| 400,000 | 4.506 | 06/01/19 | 463,213 | |||||||||||
| 97,300 | 3.416 | 10/01/20 | 107,396 | |||||||||||
| 97,382 | 3.632 | 12/01/20 | 107,679 | |||||||||||
| 390,590 | 3.763 | 12/01/20 | 443,463 | |||||||||||
| 199,277 | 4.375 | 06/01/21 | 231,862 | |||||||||||
| GNMA |
| ||||||||||||
| 85,613 | 3.950 | 07/15/25 | 93,929 | |||||||||||
|
| |||||||||||||
| 2,324,752 | ||||||||||||||
|
| |||||||||||||
| Regular Floater(a) – 0.6% |
| ||||||||||||
| National Credit Union Administration Guaranteed Notes | | ||||||||||||
| 400,000 | 0.232 | 06/12/13 | 400,004 | |||||||||||
|
| |||||||||||||
| Sequential Fixed Rate – 0.9% |
| ||||||||||||
| National Credit Union Administration Guaranteed Notes | | ||||||||||||
| 278,383 | 2.650 | 10/29/20 | 293,862 | |||||||||||
| National Credit Union Administration Guaranteed Notes | | ||||||||||||
| 300,000 | 3.000 | 06/12/19 | 327,471 | |||||||||||
|
| |||||||||||||
| 621,333 | ||||||||||||||
|
| |||||||||||||
| | TOTAL COLLATERALIZED MORTGAGE OBLIGATIONS | | $ | 3,346,089 | ||||||||||
|
| |||||||||||||
| Commercial Mortgage-Backed Securities – 0.9% |
| ||||||||||||
| Sequential Fixed Rate – 0.9% |
| ||||||||||||
| Banc of America Commercial Mortgage Trust Series 2006-3, | | ||||||||||||
| $ | 200,000 | 5.889% | 07/10/44 | $ | 228,365 | |||||||||
| JP Morgan Chase Commercial Mortgage Securities Corp. | | ||||||||||||
| 100,000 | 2.840 | 12/15/47 | 102,502 | |||||||||||
| UBS-Barclays Commercial Mortgage Trust Series 2012-C4, | | ||||||||||||
| 300,000 | 2.850 | 12/10/45 | 308,490 | |||||||||||
|
| |||||||||||||
| | TOTAL COMMERCIAL MORTGAGE-BACKED SECURITIES | | $ | 639,357 | ||||||||||
|
| |||||||||||||
| Federal Agencies – 55.4% |
| ||||||||||||
| Adjustable Rate FHLMC(a) – 0.6% |
| ||||||||||||
| $ | 380,717 | 2.412% | 09/01/35 | $ | 408,447 | |||||||||
|
| |||||||||||||
| Adjustable Rate FNMA(a) – 1.2% |
| ||||||||||||
| 155,278 | 2.342 | 05/01/33 | 163,736 | |||||||||||
| 364,396 | 2.333 | 05/01/35 | 387,323 | |||||||||||
| 236,033 | 2.707 | 12/01/35 | 252,853 | |||||||||||
|
| |||||||||||||
| 803,912 | ||||||||||||||
|
| |||||||||||||
| Mortgage-Backed Obligations – (continued) | ||||||||||||||
| FHLMC – 9.2% |
| ||||||||||||
| $ | 2,018 | 10.000 | % | 03/01/21 | $ | 2,370 | ||||||||
| 2,032,504 | 5.000 | 03/01/38 | 2,186,016 | |||||||||||
| 2,000,001 | 3.000 | 12/01/42 | 2,092,889 | |||||||||||
| 2,000,000 | 2.500 | TBA-15yr | (b) | 2,087,344 | ||||||||||
|
| |||||||||||||
| 6,368,619 | ||||||||||||||
|
| |||||||||||||
| FNMA – 42.8% |
| ||||||||||||
| 35,394 | 5.000 | 03/01/18 | 38,305 | |||||||||||
| 17,433 | 5.000 | 06/01/18 | 18,867 | |||||||||||
| 396,360 | 5.500 | 03/01/19 | 425,205 | |||||||||||
| 7,066 | 8.000 | 09/01/21 | 8,122 | |||||||||||
| 8,252 | 5.000 | 04/01/23 | 8,937 | |||||||||||
| 23,280 | 5.000 | 06/01/23 | 25,212 | |||||||||||
| 413,015 | 5.500 | 05/01/25 | 445,293 | |||||||||||
| 69 | 6.000 | 03/01/32 | 77 | |||||||||||
| 2,531 | 6.000 | 05/01/33 | 2,797 | |||||||||||
| 9,897 | 5.000 | 08/01/33 | 10,742 | |||||||||||
| 497 | 6.000 | 12/01/33 | 552 | |||||||||||
| 718 | 6.000 | 12/01/34 | 796 | |||||||||||
| 64,434 | 5.000 | 04/01/35 | 69,831 | |||||||||||
| 757 | 6.000 | 04/01/35 | 832 | |||||||||||
| 2,872,463 | 5.000 | 12/01/35 | 3,108,797 | |||||||||||
| 2,509 | 6.000 | 02/01/36 | 2,761 | |||||||||||
| 9,494 | 6.500 | 03/01/36 | 10,640 | |||||||||||
| 95,568 | 6.000 | 11/01/36 | 104,220 | |||||||||||
| 1,908,495 | 5.000 | 12/01/36 | 2,065,518 | |||||||||||
| 856,102 | 5.000 | 04/01/38 | 924,958 | |||||||||||
| 942,632 | 6.000 | 07/01/38 | 1,027,858 | |||||||||||
| 1,484,211 | 6.000 | 09/01/38 | 1,618,445 | |||||||||||
| 42,128 | 5.000 | 01/01/39 | 45,517 | |||||||||||
| 98,557 | 6.000 | 01/01/39 | 107,471 | |||||||||||
| 87,827 | 4.500 | 04/01/40 | 94,914 | |||||||||||
| 39,064 | 4.000 | 11/01/40 | 41,844 | |||||||||||
| 3,000,000 | 3.000 | TBA-30yr | (b) | 3,144,141 | ||||||||||
| 2,000,000 | 3.500 | TBA-30yr | (b) | 2,132,188 | ||||||||||
| 5,000,000 | 4.000 | TBA-30yr | (b) | 5,358,984 | ||||||||||
| 8,000,000 | 4.500 | TBA-30yr | (b) | 8,642,500 | ||||||||||
|
| |||||||||||||
| 29,486,324 | ||||||||||||||
|
| |||||||||||||
| GNMA – 1.6% |
| ||||||||||||
| 1,000,000 | 5.000 | TBA-30yr | (b) | 1,090,078 | ||||||||||
|
| |||||||||||||
| TOTAL FEDERAL AGENCIES | $ | 38,157,380 | ||||||||||||
|
| |||||||||||||
| TOTAL MORTGAGE-BACKED OBLIGATIONS | ||||||||||||||
| (Cost $41,786,935) | $ | 42,142,826 | ||||||||||||
|
| |||||||||||||
| Agency Debentures – 22.9% | ||||||||||||||
| FFCB |
| ||||||||||||
| $ | 500,000 | 5.400 | % | 06/08/17 | $ | 601,810 | ||||||||
| FHLB |
| ||||||||||||
| 800,000 | 0.210 | 01/04/13 | 800,004 | |||||||||||
| 3,400,000 | 0.375 | 01/29/14 | 3,406,296 | |||||||||||
|
| |||||||||||||
| The accompanying notes are an integral part of these financial statements. | 43 |
GOLDMAN SACHS VARIABLE INSURANCE TRUST GOVERNMENT INCOME FUND
Schedule of Investments (continued)
December 31, 2012
| Principal Amount | Interest Rate | Maturity Date | Value | |||||||||
| Agency Debentures – (continued) | ||||||||||||
| FHLB – (continued) |
| ||||||||||
| $ | 5,000,000 | 2.125% | 06/10/16 | $ | 5,261,817 | |||||||
| 200,000 | 5.625 | 06/11/21 | 259,386 | |||||||||
| FHLMC |
| ||||||||||
| 700,000 | 0.500 | 01/24/14 | 700,124 | |||||||||
| 500,000 | 0.375 | 02/27/14 | 500,787 | |||||||||
| 1,500,000 | 4.500 | 04/02/14 | 1,579,459 | |||||||||
| 300,000 | 1.250 | 08/01/19 | 300,297 | |||||||||
| 700,000 | 2.375 | 01/13/22 | 731,384 | |||||||||
| FNMA |
| ||||||||||
| 300,000 | 0.875 | 08/28/17 | 301,497 | |||||||||
| 800,000 | 0.875 | 10/26/17 | 802,634 | |||||||||
| 100,000 | 6.250 | 05/15/29 | 143,659 | |||||||||
| Tennessee Valley Authority |
| ||||||||||
| 300,000 | 5.375 | 04/01/56 | 406,176 | |||||||||
|
| |||||||||||
| TOTAL AGENCY DEBENTURES | ||||||||||||
| (Cost $15,457,623) | $ | 15,795,330 | ||||||||||
|
| |||||||||||
| Asset-Backed Securities – 1.3% | ||||||||||||
| Home Equity – 0.1% |
| ||||||||||
| GMAC Mortgage Corp. Loan Trust Series 2007-HE3, Class 1A1 |
| ||||||||||
| $ | 33,574 | 7.000% | 09/25/37 | $ | 28,940 | |||||||
| GMAC Mortgage Corp. Loan Trust Series 2007-HE3, Class 2A1 |
| ||||||||||
| 46,966 | 7.000 | 09/25/37 | 42,085 | |||||||||
|
| |||||||||||
| 71,025 | ||||||||||||
|
| |||||||||||
| Student Loans(a) – 1.2% |
| ||||||||||
| Brazos Higher Education Authority Series 2005-3, Class A14 |
| ||||||||||
| 81,002 | 0.420 | 09/25/23 | 80,901 | |||||||||
| College Loan Corp. Trust Series 2004-1, Class A4 |
| ||||||||||
| 150,000 | 0.505 | 04/25/24 | 145,550 | |||||||||
| SLM Student Loan Trust Series 2008-5, Class A4 |
| ||||||||||
| 300,000 | 2.015 | 07/25/23 | 315,414 | |||||||||
| SLM Student Loan Trust Series 2012-2, Class A |
| ||||||||||
| 240,491 | 0.910 | 01/25/29 | 242,871 | |||||||||
|
| |||||||||||
| 784,736 | ||||||||||||
|
| |||||||||||
| TOTAL ASSET-BACKED SECURITIES | ||||||||||||
| (Cost $856,955) | $ | 855,761 | ||||||||||
|
| |||||||||||
| Government Guarantee Obligations – 3.1% | ||||||||||||
| Israel Government AID Bond(c) |
| ||||||||||
| $ | 100,000 | 5.500% | 12/04/23 | $ | 130,761 | |||||||
| Private Export Funding Corp.(d) |
| ||||||||||
| 2,000,000 | 3.550 | 04/15/13 | 2,019,616 | |||||||||
|
| |||||||||||
| TOTAL GOVERNMENT GUARANTEE OBLIGATIONS | ||||||||||||
| (Cost $2,139,246) | $ | 2,150,377 | ||||||||||
|
| |||||||||||
| U.S. Treasury Obligations – 19.0% | ||||||||||||
| United States Treasury Bonds |
| ||||||||||
| $ | 1,600,000 | 0.000%(e) | 02/15/26 | $ | 1,181,072 | |||||||
| 800,000 | 4.375 | 05/15/41 | 1,041,712 | |||||||||
| 100,000 | 3.750 | 08/15/41 | 117,475 | |||||||||
| 400,000 | 2.750 | 11/15/42 | 385,375 | |||||||||
| United States Treasury Inflation-Protected Securities |
| ||||||||||
| 201,178 | 0.125 | 07/15/22 | 218,497 | |||||||||
| 204,740 | 0.750 | 02/15/42 | 224,479 | |||||||||
| United States Treasury Notes |
| ||||||||||
| 1,500,000 | 0.250(f) | 11/30/13 | 1,500,885 | |||||||||
| 700,000 | 0.250 | 04/30/14 | 700,322 | |||||||||
| 300,000 | 0.625 | 07/15/14 | 301,833 | |||||||||
| 1,000,000 | 0.125 | 07/31/14 | 998,270 | |||||||||
| 2,400,000 | 0.250 | 09/30/14 | 2,400,528 | |||||||||
| 1,000,000 | 0.375 | 03/15/15 | 1,001,940 | |||||||||
| 1,000,000 | 1.750 | 07/31/15 | 1,036,520 | |||||||||
| 400,000 | 0.750 | 10/31/17 | 401,324 | |||||||||
| 900,000 | 0.750 | 12/31/17 | 901,476 | |||||||||
| 700,000 | 1.125 | 12/31/19 | 698,089 | |||||||||
|
| |||||||||||
| TOTAL U.S. TREASURY OBLIGATIONS | ||||||||||||
| (Cost $13,000,896) | $ | 13,109,797 | ||||||||||
|
| |||||||||||
| TOTAL INVESTMENTS – 107.5% | ||||||||||||
| (Cost $73,241,655) | $ | 74,054,091 | ||||||||||
|
| |||||||||||
| LIABILITIES IN EXCESS OF | | (5,160,597 | ) | ||||||||
|
| |||||||||||
| NET ASSETS – 100.0% |
| $ | 68,893,494 | ||||||||
|
| |||||||||||
| The percentage shown for each investment category reflects the value of investments in that category as a percentage of net assets. | ||
| (a) | Variable rate security. Interest rate disclosed is that which is in effect at December 31, 2012. | |
| (b) | TBA (To Be Announced) Securities are purchased/sold on a forward commitment basis with an approximate principal amount and no defined maturity date. The actual principal and maturity date will be determined upon settlement when the specific mortgage pools are assigned. Total market value of TBA securities (excluding forward sales contracts, if any) amounts to $22,455,235 which represents approximately 32.6% of net assets as of December 31, 2012. | |
| (c) | Guaranteed by a foreign government. | |
| (d) | Guaranteed by the Export/Import Bank of the United States. | |
| (e) | Issued with a zero coupon. Income is recognized through the accretion of discount. | |
| (f) | All or a portion of security is segregated as collateral for initial margin requirements on futures transactions. | |
| 44 | The accompanying notes are an integral part of these financial statements. |
GOLDMAN SACHS VARIABLE INSURANCE TRUST GOVERNMENT INCOME FUND
| Investment Abbreviations: | ||
| FFCB | —Federal Farm Credit Bank | |
| FHLB | —Federal Home Loan Bank | |
| FHLMC | —Federal Home Loan Mortgage Corp. | |
| FNMA | —Federal National Mortgage Association | |
| GNMA | —Government National Mortgage Association | |
ADDITIONAL INVESTMENT INFORMATION
FORWARD SALES CONTRACTS — At December 31, 2012, the Fund had the following forward sales contracts:
| Description | Interest Rate | Maturity Date(b) | Settlement Date | Principal Amount | Value | |||||||||||
| FHLMC | 3.000 | % | TBA-30yr | 01/14/13 | $ | (1,000,000 | ) | $ | (1,045,312 | ) | ||||||
| FNMA | 3.000 | TBA-30yr | 02/12/13 | (2,000,000 | ) | (2,091,563 | ) | |||||||||
FNMA | 5.000 | TBA-30yr | 01/14/13 | (4,000,000 | ) | (4,332,812 | ) | |||||||||
| TOTAL (Proceeds Receivable: $7,455,547) | $ | (7,469,687 | ) | |||||||||||||
FUTURES CONTRACTS — At December 31, 2012, the Fund had the following futures contracts:
| Type | Number of Contracts Long (Short) | Expiration Date | Current Value | Unrealized Gain (Loss) | ||||||||||
| U.S. Long Bond | (36 | ) | March 2013 | $ | (5,310,000 | ) | $ | 59,743 | ||||||
| U.S. Ultra Long Treasury Bonds | 14 | March 2013 | 2,276,313 | (21,941 | ) | |||||||||
| 2 Year U.S. Treasury Notes | 13 | March 2013 | 2,866,094 | 1,197 | ||||||||||
| 5 Year U.S. Treasury Notes | 78 | March 2013 | 9,704,297 | 13,352 | ||||||||||
10 Year U.S. Treasury Notes | 20 | March 2013 | 2,655,625 | (13,788 | ) | |||||||||
| TOTAL | $ | 38,563 | ||||||||||||
| The accompanying notes are an integral part of these financial statements. | 45 |
GOLDMAN SACHS VARIABLE INSURANCE TRUST GROWTH OPPORTUNITIES FUND
Schedule of Investments
December 31, 2012
| Shares | Description | Value | ||||||
| Common Stocks – 98.8% | ||||||||
| Banks – 1.6% |
| ||||||
| 86,295 | First Republic Bank | $ | 2,828,750 | |||||
|
| |||||||
| Capital Goods – 5.9% |
| ||||||
| 34,823 | Graco, Inc. | 1,793,036 | ||||||
| 72,657 | Kennametal, Inc. | 2,906,280 | ||||||
| 64,213 | Quanta Services, Inc.* | 1,752,373 | ||||||
| 20,899 | Rockwell Automation, Inc. | 1,755,307 | ||||||
| 17,746 | Roper Industries, Inc. | 1,978,324 | ||||||
|
| |||||||
| 10,185,320 | ||||||||
|
| |||||||
| Commercial & Professional Services – 1.4% |
| ||||||
| 119,007 | Ritchie Bros Auctioneers, Inc. | 2,486,056 | ||||||
|
| |||||||
| Consumer Durables & Apparel – 4.7% |
| ||||||
| 46,607 | Deckers Outdoor Corp.* | 1,876,864 | ||||||
| 20,044 | Lululemon Athletica, Inc.* | 1,527,954 | ||||||
| 42,199 | PVH Corp. | 4,684,511 | ||||||
|
| |||||||
| 8,089,329 | ||||||||
|
| |||||||
| Consumer Services – 5.7% |
| ||||||
| 9,118 | Chipotle Mexican Grill, Inc.* | 2,712,240 | ||||||
| 61,651 | Coinstar, Inc.* | 3,206,469 | ||||||
| 43,580 | Dunkin’ Brands Group, Inc. | 1,445,984 | ||||||
| 64,941 | Marriott International, Inc. Class A | 2,420,351 | ||||||
|
| |||||||
| 9,785,044 | ||||||||
|
| |||||||
| Diversified Financials – 8.6% |
| ||||||
| 20,036 | IntercontinentalExchange, Inc.* | 2,480,657 | ||||||
| 74,085 | Lazard Ltd. Class A | 2,210,697 | ||||||
| 101,624 | MSCI, Inc. Class A* | 3,149,328 | ||||||
| 57,413 | Northern Trust Corp. | 2,879,836 | ||||||
| 108,202 | SLM Corp. | 1,853,500 | ||||||
| 34,180 | T. Rowe Price Group, Inc. | 2,226,143 | ||||||
|
| |||||||
| 14,800,161 | ||||||||
|
| |||||||
| Energy – 4.6% |
| ||||||
| 36,583 | Cameron International Corp.* | 2,065,476 | ||||||
| 11,039 | Core Laboratories NV | 1,206,673 | ||||||
| 24,920 | Dril-Quip, Inc.* | 1,820,406 | ||||||
| 13,154 | Pioneer Natural Resources Co. | 1,402,085 | ||||||
| 30,925 | Whiting Petroleum Corp.* | 1,341,217 | ||||||
|
| |||||||
| 7,835,857 | ||||||||
|
| |||||||
| Food, Beverage & Tobacco – 3.4% |
| ||||||
| 36,321 | Beam, Inc. | 2,218,850 | ||||||
| 41,785 | The Hain Celestial Group, Inc.* | 2,265,583 | ||||||
| 25,204 | TreeHouse Foods, Inc.* | 1,313,884 | ||||||
|
| |||||||
| 5,798,317 | ||||||||
|
| |||||||
| Health Care Equipment & Services – 5.0% | |||||||
| 29,427 | C. R. Bard, Inc. | 2,876,195 | ||||||
| 67,297 | CareFusion Corp.* | 1,923,348 | ||||||
| 26,637 | Henry Schein, Inc.* | 2,143,213 | ||||||
| 29,655 | HMS Holdings Corp.* | 768,658 | ||||||
| 10,603 | MEDNAX, Inc.* | 843,151 | ||||||
|
| |||||||
| 8,554,565 | ||||||||
|
| |||||||
| Common Stocks – (continued) | ||||||||
| Household & Personal Products – 2.2% | |||||||
| 41,948 | Church & Dwight Co., Inc. | $ | 2,247,154 | |||||
| 25,489 | The Estee Lauder Companies, Inc. Class A | 1,525,772 | ||||||
|
| |||||||
| 3,772,926 | ||||||||
|
| |||||||
| Materials – 4.7% | |||||||
| 34,076 | Airgas, Inc. | 3,110,798 | ||||||
| 36,266 | Ecolab, Inc. | 2,607,525 | ||||||
| 35,483 | International Flavors & Fragrances, Inc. | 2,361,039 | ||||||
|
| |||||||
| 8,079,362 | ||||||||
|
| |||||||
| Media – 2.9% | |||||||
| 26,532 | Discovery Communications, Inc. Class A* | 1,684,252 | ||||||
| 137,829 | Pandora Media, Inc.* | 1,265,270 | ||||||
| 35,102 | Scripps Networks Interactive, Inc. Class A | 2,033,108 | ||||||
|
| |||||||
| 4,982,630 | ||||||||
|
| |||||||
| Pharmaceuticals, Biotechnology & Life Sciences – 7.8% | |||||||
| 83,753 | Agilent Technologies, Inc. | 3,428,848 | ||||||
| 10,993 | Alexion Pharmaceuticals, Inc.* | 1,031,253 | ||||||
| 41,894 | Ariad Pharmaceuticals, Inc.* | 803,527 | ||||||
| 21,299 | BioMarin Pharmaceutical, Inc.* | 1,048,976 | ||||||
| 41,126 | Cepheid, Inc.* | 1,390,470 | ||||||
| 6,596 | Mettler-Toledo International, Inc.* | 1,275,007 | ||||||
| 20,993 | Shire PLC ADR | 1,935,135 | ||||||
| 57,731 | Vertex Pharmaceuticals, Inc.* | 2,421,238 | ||||||
|
| |||||||
| 13,334,454 | ||||||||
|
| |||||||
| Real Estate – 2.3% | |||||||
| 198,253 | CBRE Group, Inc. Class A* | 3,945,235 | ||||||
|
| |||||||
| Retailing – 8.1% | |||||||
| 26,709 | Bed Bath & Beyond, Inc.* | 1,493,300 | ||||||
| 35,503 | Dick’s Sporting Goods, Inc. | 1,615,032 | ||||||
| 22,873 | Dollar General Corp.* | 1,008,471 | ||||||
| 47,118 | Family Dollar Stores, Inc. | 2,987,752 | ||||||
| 52,243 | PetSmart, Inc. | 3,570,287 | ||||||
| 22,723 | Tiffany & Co. | 1,302,937 | ||||||
| 49,290 | Urban Outfitters, Inc.* | 1,940,054 | ||||||
|
| |||||||
| 13,917,833 | ||||||||
|
| |||||||
| Semiconductors & Semiconductor Equipment – 4.5% | |||||||
| 81,933 | Altera Corp. | 2,821,773 | ||||||
| 46,338 | Linear Technology Corp. | 1,589,393 | ||||||
| 91,701 | Xilinx, Inc. | 3,292,066 | ||||||
|
| |||||||
| 7,703,232 | ||||||||
|
| |||||||
| Software & Services – 13.1% | |||||||
| 266,823 | Activision Blizzard, Inc. | 2,833,660 | ||||||
| 24,408 | Citrix Systems, Inc.* | 1,604,826 | ||||||
| 22,079 | Cognizant Technology Solutions Corp. Class A* | 1,634,950 | ||||||
| 18,413 | Equinix, Inc.* | 3,796,760 | ||||||
|
| |||||||
| 46 | The accompanying notes are an integral part of these financial statements. |
GOLDMAN SACHS VARIABLE INSURANCE TRUST GROWTH OPPORTUNITIES FUND
| Shares | Description | Value | ||||||
| Common Stocks – (continued) | ||||||||
| Software & Services – (continued) |
| ||||||
| 45,472 | FleetCor Technologies, Inc.* | $ | 2,439,573 | |||||
| 82,571 | Genpact Ltd. | 1,279,850 | ||||||
| 52,972 | MICROS Systems, Inc.* | 2,248,132 | ||||||
| 49,269 | Rackspace Hosting, Inc.* | 3,659,209 | ||||||
| 13,479 | Salesforce.com, Inc.* | 2,265,820 | ||||||
| 25,960 | VeriFone Systems, Inc.* | 770,493 | ||||||
|
| |||||||
| 22,533,273 | ||||||||
|
| |||||||
| Technology Hardware & Equipment – 4.8% |
| ||||||
| 53,585 | Amphenol Corp. Class A | 3,466,949 | ||||||
| 48,508 | Juniper Networks, Inc.* | 954,152 | ||||||
| 80,158 | NetApp, Inc.* | 2,689,301 | ||||||
| 105,379 | RealD, Inc.* | 1,181,299 | ||||||
|
| |||||||
| 8,291,701 | ||||||||
|
| |||||||
| Telecommunication Services – 6.9% |
| ||||||
| 44,589 | Crown Castle International Corp.* | 3,217,542 | ||||||
| 87,090 | SBA Communications Corp. Class A* | 6,185,132 | ||||||
| 94,239 | tw telecom, inc.* | 2,400,267 | ||||||
|
| |||||||
| 11,802,941 | ||||||||
|
| |||||||
| Transportation – 0.6% |
| ||||||
| 17,727 | C.H. Robinson Worldwide, Inc. | 1,120,701 | ||||||
|
| |||||||
| TOTAL INVESTMENTS – 98.8% | ||||||||
| (Cost $144,068,090) | $ | 169,847,687 | ||||||
|
| |||||||
| OTHER ASSETS IN EXCESS OF | 2,022,082 | ||||||
|
| |||||||
| NET ASSETS – 100.0% | $ | 171,869,769 | ||||||
|
| |||||||
| The percentage shown for each investment category reflects the value of investments in that category as a percentage of net assets. | ||
| * | Non-income producing security. | |
| Investment Abbreviation: | ||
| ADR | —American Depositary Receipt | |
| The accompanying notes are an integral part of these financial statements. | 47 |
GOLDMAN SACHS VARIABLE INSURANCE TRUST FUNDS
Statements of Assets and Liabilities
December 31, 2012
| Core Fixed Income Fund | Equity Index Fund | Government Income Fund | Growth Opportunities Fund | |||||||||||||
| Assets: | ||||||||||||||||
Investments of unaffiliated issuers, at value (cost $139,394,296, $127,020,797, $73,241,655 and $144,068,090) | $ | 144,009,072 | $ | 166,362,780 | $ | 74,054,091 | $ | 169,847,687 | ||||||||
Investments of affiliated issuer, at value (cost $758,876 for Equity Index Fund) | — | 734,873 | — | — | ||||||||||||
Cash | 7,452,691 | 632,322 | 17,046,263 | 2,528,696 | ||||||||||||
Foreign currencies, at value (cost $14,454 for Core Fixed Income Fund) | 14,429 | — | — | — | ||||||||||||
Receivables: | ||||||||||||||||
Investments sold on an extended-settlement basis | 23,905,758 | — | 17,047,157 | — | ||||||||||||
Investments sold | — | 21,348 | — | — | ||||||||||||
Interest and dividends | 900,889 | 184,975 | 156,319 | 21,273 | ||||||||||||
Unrealized gain on forward foreign currency exchange contracts | 115,010 | — | — | — | ||||||||||||
Reimbursement from investment adviser | 58,295 | 74,880 | 33,725 | 54,160 | ||||||||||||
Futures variation margin | 18,974 | 32,170 | 5,358 | — | ||||||||||||
Fund shares sold | 6,049 | 7,535 | 145,864 | 16,530 | ||||||||||||
Foreign tax reclaims | 1,987 | 126 | — | — | ||||||||||||
| Total assets | 176,483,154 | 168,051,009 | 108,488,777 | 172,468,346 | ||||||||||||
| Liabilities: | ||||||||||||||||
Payables: | ||||||||||||||||
Investments purchased on an extended-settlement basis | 37,303,047 | — | 32,005,156 | — | ||||||||||||
Investments purchased | — | — | — | 267,026 | ||||||||||||
Forward sale contracts, at value (proceeds receivable $3,248,282, $0, $7,455,547 and $0) | 3,249,609 | — | 7,469,687 | — | ||||||||||||
Unrealized loss on forward foreign currency exchange contracts | 282,938 | — | — | — | ||||||||||||
Fund shares redeemed | 81,617 | 127,539 | 31,775 | 110,331 | ||||||||||||
Amounts owed to affiliates | 77,508 | 68,381 | 47,251 | 165,620 | ||||||||||||
Accrued expenses | 52,466 | 44,228 | 41,414 | 55,600 | ||||||||||||
| Total liabilities | 41,047,185 | 240,148 | 39,595,283 | 598,577 | ||||||||||||
| Net Assets: | ||||||||||||||||
Paid-in capital | 136,339,549 | 143,352,609 | 68,511,516 | 145,597,138 | ||||||||||||
Undistributed net investment income | 337,022 | 375,823 | 78,526 | 603 | ||||||||||||
Accumulated net realized gain (loss) | (5,749,320 | ) | (15,235,044 | ) | (533,407 | ) | 492,431 | |||||||||
Net unrealized gain | 4,508,718 | 39,317,473 | 836,859 | 25,779,597 | ||||||||||||
| NET ASSETS | $ | 135,435,969 | $ | 167,810,861 | $ | 68,893,494 | $ | 171,869,769 | ||||||||
Shares of beneficial interest outstanding $0.001 par value (unlimited shares authorized): | 12,452,445 | 15,917,783 | 6,514,359 | 24,815,659 | ||||||||||||
Net asset value, offering and redemption price per share: | $10.88 | $10.54 | $10.58 | $6.93 | ||||||||||||
| 48 | The accompanying notes are an integral part of these financial statements. |
GOLDMAN SACHS VARIABLE INSURANCE TRUST FUNDS
Statements of Operations
For the Fiscal Year Ended December 31, 2012
| Core Fixed Income Fund | Equity Index Fund | Government Income Fund | Growth Opportunities Fund | |||||||||||||
| Investment income: | ||||||||||||||||
Interest | $ | 3,187,508 | $ | 105 | $ | 779,642 | $ | — | ||||||||
Dividends — unaffiliated issuers (net of foreign taxes withheld of $0, $2,268, $0 and $9,864) | — | 3,986,900 | — | 1,537,336 | ||||||||||||
Dividends — affiliated issuer | — | 11,713 | — | — | ||||||||||||
| Total investment income | 3,187,508 | 3,998,718 | 779,642 | 1,537,336 | ||||||||||||
| Expenses: | ||||||||||||||||
Management fees | 571,376 | 520,613 | 367,618 | 1,716,767 | ||||||||||||
Distribution and Service fees | 357,109 | 433,845 | 170,193 | 429,192 | ||||||||||||
Professional fees | 92,178 | 81,636 | 86,111 | 79,628 | ||||||||||||
Custody and accounting fees | 72,156 | 53,185 | 39,061 | 47,922 | ||||||||||||
Printing and mailing costs | 42,334 | 56,945 | 22,883 | 54,060 | ||||||||||||
Transfer Agent fees | 28,566 | 34,705 | 13,614 | 34,332 | ||||||||||||
Trustee fees | 14,974 | 15,059 | 14,796 | 15,068 | ||||||||||||
Other | 6,496 | 45,727 | 5,906 | 7,522 | ||||||||||||
| Total expenses | 1,185,189 | 1,241,715 | 720,182 | 2,384,491 | ||||||||||||
Less — expense reductions | (234,825 | ) | (402,542 | ) | (183,466 | ) | (404,975 | ) | ||||||||
| Net expenses | 950,364 | 839,173 | 536,716 | 1,979,516 | ||||||||||||
| NET INVESTMENT INCOME (LOSS) | 2,237,144 | 3,159,545 | 242,926 | (442,180 | ) | |||||||||||
| Realized and unrealized gain (loss): | ||||||||||||||||
Net realized gain (loss) from: | ||||||||||||||||
Investments — unaffiliated issuers (including commissions recaptured of $8,460 for the Growth Opportunities Fund) | 3,684,069 | 6,551,675 | 1,094,812 | 12,350,130 | ||||||||||||
Investments — affiliated issuer | — | 47,814 | — | — | ||||||||||||
Futures contracts | 631,950 | 224,093 | 364,897 | — | ||||||||||||
Forward foreign currency exchange contracts | 12,480 | — | — | — | ||||||||||||
Foreign currency transactions | (382 | ) | — | — | — | |||||||||||
Net change in unrealized gain (loss) on: | ||||||||||||||||
Investments — unaffiliated issuers | 2,942,664 | 15,022,403 | 140,506 | 18,219,850 | ||||||||||||
Investments — affiliated issuer | — | 201,926 | — | — | ||||||||||||
Futures contracts | (52,366 | ) | (3,576 | ) | (17,544 | ) | — | |||||||||
Forward foreign currency exchange contracts | (155,069 | ) | — | — | — | |||||||||||
Foreign currency translation | 3,605 | — | — | — | ||||||||||||
| Net realized and unrealized gain | 7,066,951 | 22,044,335 | 1,582,671 | 30,569,980 | ||||||||||||
| NET INCREASE IN NET ASSETS RESULTING FROM OPERATIONS | $ | 9,304,095 | $ | 25,203,880 | $ | 1,825,597 | $ | 30,127,800 | ||||||||
| The accompanying notes are an integral part of these financial statements. | 49 |
GOLDMAN SACHS VARIABLE INSURANCE TRUST FUNDS
Statements of Changes in Net Assets
| Core Fixed Income Fund | ||||||||
For the Fiscal Year Ended | For the Fiscal Year Ended | |||||||
| From operations: | ||||||||
Net investment income (loss) | $ | 2,237,144 | $ | 3,537,938 | ||||
Net realized gain | 4,328,117 | 6,930,049 | ||||||
Net change in unrealized gain (loss) | 2,738,834 | 159,539 | ||||||
| Net increase (decrease) in net assets resulting from operations | 9,304,095 | 10,627,526 | ||||||
| Distributions to shareholders: | ||||||||
From net investment income | (3,241,836 | ) | (3,977,951 | ) | ||||
From net realized gains | — | — | ||||||
| Total distributions to shareholders | (3,241,836 | ) | (3,977,951 | ) | ||||
| From share transactions: | ||||||||
Proceeds from sales of shares | 8,361,507 | 9,969,434 | ||||||
Reinvestment of distributions | 3,241,836 | 3,977,951 | ||||||
Cost of shares redeemed | (30,344,108 | ) | (43,202,836 | ) | ||||
| Net increase (decrease) in net assets resulting from share transactions | (18,740,765 | ) | (29,255,451 | ) | ||||
| TOTAL INCREASE (DECREASE) | (12,678,506 | ) | (22,605,876 | ) | ||||
| Net assets: | ||||||||
Beginning of year | 148,114,475 | 170,720,351 | ||||||
End of year | $ | 135,435,969 | $ | 148,114,475 | ||||
| Undistributed net investment income | $ | 337,022 | $ | 363,935 | ||||
| Summary of share transactions: | ||||||||
Shares sold | 786,585 | 972,726 | ||||||
Shares issued on reinvestment of distributions | 304,260 | 391,617 | ||||||
Shares redeemed | (2,842,488 | ) | (4,224,590 | ) | ||||
| NET INCREASE (DECREASE) | (1,751,643 | ) | (2,860,247 | ) | ||||
| 50 | The accompanying notes are an integral part of these financial statements. |
GOLDMAN SACHS VARIABLE INSURANCE TRUST FUNDS
| Equity Index Fund | Government Income Fund | Growth Opportunities Fund | ||||||||||||||||||||||||||||||||
For the Fiscal Year Ended | For the Fiscal Year Ended December 31, 2011 | For the Fiscal Year Ended December 31, 2012 | For the Fiscal Year Ended | For the Fiscal Year Ended | For the Fiscal Year Ended | |||||||||||||||||||||||||||||
| $ | 3,159,545 | $ | 2,920,878 | $ | 242,926 | $ | 564,744 | $ | (442,180 | ) | $ | (704,148 | ) | |||||||||||||||||||||
| 6,823,582 | 4,710,923 | 1,459,709 | 3,524,061 | 12,350,130 | 12,953,975 | |||||||||||||||||||||||||||||
| 15,220,753 | (4,327,577 | ) | 122,962 | 179,428 | 18,219,850 | (18,317,287 | ) | |||||||||||||||||||||||||||
| 25,203,880 | 3,304,224 | 1,825,597 | 4,268,233 | 30,127,800 | (6,067,460 | ) | ||||||||||||||||||||||||||||
| (3,068,378 | ) | (2,889,650 | ) | (516,585 | ) | (645,189 | ) | — | — | |||||||||||||||||||||||||
| — | — | (2,117,284 | ) | (2,563,808 | ) | (14,534,448 | ) | (2,777,378 | ) | |||||||||||||||||||||||||
| (3,068,378 | ) | (2,889,650 | ) | (2,633,869 | ) | (3,208,997 | ) | (14,534,448 | ) | (2,777,378 | ) | |||||||||||||||||||||||
| 2,183,506 | 3,698,155 | 15,052,010 | 14,330,295 | 5,879,360 | 42,131,646 | |||||||||||||||||||||||||||||
| 3,068,378 | 2,889,650 | 2,633,869 | 3,208,997 | 14,534,448 | 2,777,378 | |||||||||||||||||||||||||||||
| (29,287,642 | ) | (31,165,262 | ) | (15,310,789 | ) | (23,583,089 | ) | (23,461,412 | ) | (22,643,830 | ) | |||||||||||||||||||||||
| (24,035,758 | ) | (24,577,457 | ) | 2,375,090 | (6,043,797 | ) | (3,047,604 | ) | 22,265,194 | |||||||||||||||||||||||||
| (1,900,256 | ) | (24,162,883 | ) | 1,566,818 | (4,984,561 | ) | 12,545,748 | 13,420,356 | ||||||||||||||||||||||||||
| 169,711,117 | 193,874,000 | 67,326,676 | 72,311,237 | 159,324,021 | 145,903,665 | |||||||||||||||||||||||||||||
| $ | 167,810,861 | $ | 169,711,117 | $ | 68,893,494 | $ | 67,326,676 | $ | 171,869,769 | $ | 159,324,021 | |||||||||||||||||||||||
| $ | 375,823 | $ | 288,397 | $ | 78,526 | $ | 65,636 | $ | 603 | $ | 37,967 | |||||||||||||||||||||||
| 212,773 | 389,956 | 1,391,077 | 1,330,747 | 837,085 | 6,377,019 | |||||||||||||||||||||||||||||
| 290,291 | 315,120 | 248,434 | 300,542 | 2,112,565 | 441,554 | |||||||||||||||||||||||||||||
| (2,849,794 | ) | (3,306,547 | ) | (1,416,700 | ) | (2,190,027 | ) | (3,270,859 | ) | (3,395,728 | ) | |||||||||||||||||||||||
| (2,346,730 | ) | (2,601,471 | ) | 222,811 | (558,738 | ) | (321,209 | ) | 3,422,845 | |||||||||||||||||||||||||
| The accompanying notes are an integral part of these financial statements. | 51 |
GOLDMAN SACHS VARIABLE INSURANCE TRUST CORE FIXED INCOME FUND
Financial Highlights
Selected Data for a Share Outstanding Throughout Each Year
| Income (loss) from investment operations | ||||||||||||||||||||||||||||||||||||||||||||||||
| Year | Net asset value, beginning of year | Net investment income(a) | Net realized and unrealized gain (loss) | Total from investment operations | Distributions to shareholders from net investment income | Net asset value, end of year | Total return(b) | Net assets, end of year (in 000s) | Ratio of net expenses to average net assets | Ratio of total expenses to average net assets | Ratio of net investment income to average net assets | Portfolio turnover rate(c) | ||||||||||||||||||||||||||||||||||||
FOR THE FISCAL YEARS ENDED DECEMBER 31, | ||||||||||||||||||||||||||||||||||||||||||||||||
2012 | $ | 10.43 | $ | 0.17 | $ | 0.52 | $ | 0.69 | $ | (0.24 | ) | $ | 10.88 | 6.70 | % | $ | 135,436 | 0.67 | % | 0.83 | % | 1.57 | % | 727 | % | |||||||||||||||||||||||
2011 | 10.00 | 0.23 | 0.46 | 0.69 | (0.26 | ) | 10.43 | 6.96 | 148,114 | 0.67 | 0.83 | 2.22 | 644 | |||||||||||||||||||||||||||||||||||
2010 | 9.62 | 0.28 | 0.41 | 0.69 | (0.31 | ) | 10.00 | 7.18 | 170,720 | 0.67 | 0.81 | 2.80 | 399 | |||||||||||||||||||||||||||||||||||
2009 | 8.81 | 0.39 | 0.87 | 1.26 | (0.45 | ) | 9.62 | 14.68 | 183,178 | 0.67 | 0.79 | 4.29 | 187 | |||||||||||||||||||||||||||||||||||
2008 | 10.13 | 0.47 | (1.31 | ) | (0.84 | ) | (0.48 | ) | 8.81 | (8.56 | ) | 182,978 | 0.67 | 0.77 | 4.92 | 140 | ||||||||||||||||||||||||||||||||
| (a) | Calculated based on the average shares outstanding methodology. |
| (b) | Assumes investment at the net asset value at the beginning of the year, reinvestment of all distributions, and a complete redemption of the investment at the net asset value at the end of the year. |
| (c) | The Fund’s portfolio turnover rate is calculated in accordance with regulatory requirements, without regard to transactions involving short term investments and certain derivatives. If such transactions were included, the Fund’s portfolio turnover rate may be higher. |
| The accompanying notes are an integral part of these financial statements. | 52 |
GOLDMAN SACHS VARIABLE INSURANCE TRUST EQUITY INDEX FUND
Financial Highlights
Selected Data for a Share Outstanding Throughout Each Year
| Income (loss) from investment operations | Distributions to shareholders | |||||||||||||||||||||||||||||||||||||||||||||||||||||||
| Year | Net asset value, beginning of year | Net investment income(a) | Net realized and unrealized gain (loss) | Total from investment operations | From net investment income | From net realized gains | Total distributions | Net asset value, end of year | Total return(b) | Net assets, end of year (in 000s) | Ratio of net expenses to average net assets | Ratio of total expenses to average net assets | Ratio of net investment income to average net assets | Portfolio turnover rate(c) | ||||||||||||||||||||||||||||||||||||||||||
FOR THE FISCAL YEARS ENDED DECEMBER 31, | ||||||||||||||||||||||||||||||||||||||||||||||||||||||||
2012 | $ | 9.29 | $ | 0.19 | $ | 1.26 | $ | 1.45 | $ | (0.20 | ) | $ | — | $ | (0.20 | ) | $ | 10.54 | 15.50 | % | $ | 167,811 | 0.48 | % | 0.72 | % | 1.82 | % | 3 | % | ||||||||||||||||||||||||||
2011 | 9.29 | 0.15 | 0.01 | 0.16 | (0.16 | ) | — | (0.16 | ) | 9.29 | 1.75 | 169,711 | 0.48 | 0.70 | 1.59 | 3 | ||||||||||||||||||||||||||||||||||||||||
2010 | 8.22 | 0.13 | 1.08 | 1.21 | (0.14 | ) | — | (0.14 | ) | 9.29 | 14.92 | 193,874 | 0.51 | 0.71 | 1.52 | 4 | ||||||||||||||||||||||||||||||||||||||||
2009 | 6.61 | 0.14 | 1.62 | 1.76 | (0.15 | ) | — | (0.15 | ) | 8.22 | 26.28 | 198,588 | 0.59 | 0.68 | 1.97 | 5 | ||||||||||||||||||||||||||||||||||||||||
2008 | 11.42 | 0.17 | (4.46 | ) | (4.29 | ) | (0.18 | ) | (0.34 | ) | (0.52 | ) | 6.61 | (37.18 | ) | 187,383 | 0.60 | 0.69 | 1.81 | 4 | ||||||||||||||||||||||||||||||||||||
| (a) | Calculated based on the average shares outstanding methodology. |
| (b) | Assumes investment at the net asset value at the beginning of the year, reinvestment of all distributions, and a complete redemption of the investment at the net asset value at the end of the year. |
| (c) | The Fund’s portfolio turnover rate is calculated in accordance with regulatory requirements, without regard to transactions involving short term investments and certain derivatives. If such transactions were included, the Fund’s portfolio turnover rate may be higher. |
| The accompanying notes are an integral part of these financial statements. | 53 |
GOLDMAN SACHS VARIABLE INSURANCE TRUST GOVERNMENT INCOME FUND
Financial Highlights
Selected Data for a Share Outstanding Throughout Each Year
| Income (loss) from investment operations | Distributions to shareholders | |||||||||||||||||||||||||||||||||||||||||||||||||||||||
| Year | Net asset value, beginning of year | Net investment income(a) | Net realized and unrealized gain (loss) | Total from investment operations | From net investment income | From net realized gains | Total distributions | Net asset value, end of year | Total return(b) | Net assets, end of year (in 000s) | Ratio of net expenses to average net assets | Ratio of total expenses to average net assets | Ratio of net investment income to average net assets | Portfolio turnover rate(c) | ||||||||||||||||||||||||||||||||||||||||||
FOR THE FISCAL YEARS ENDED DECEMBER 31, | ||||||||||||||||||||||||||||||||||||||||||||||||||||||||
2012 | $ | 10.70 | $ | 0.04 | $ | 0.25 | $ | 0.29 | $ | (0.08 | ) | $ | (0.33 | ) | $ | (0.41 | ) | $ | 10.58 | 2.78 | % | $ | 68,893 | 0.79 | % | 1.06 | % | 0.36 | % | 1045 | % | |||||||||||||||||||||||||
2011 | 10.56 | 0.09 | 0.57 | 0.66 | (0.10 | ) | (0.42 | ) | (0.52 | ) | 10.70 | 6.35 | 67,327 | 0.81 | 1.13 | 0.81 | 960 | |||||||||||||||||||||||||||||||||||||||
2010 | 10.29 | 0.17 | 0.37 | 0.54 | (0.19 | ) | (0.08 | ) | (0.27 | ) | 10.56 | 5.19 | 72,311 | 0.81 | 1.08 | 1.56 | 614 | |||||||||||||||||||||||||||||||||||||||
2009 | 10.14 | 0.31 | 0.33 | 0.64 | (0.36 | ) | (0.13 | ) | (0.49 | ) | 10.29 | 6.44 | 74,760 | 0.81 | 1.05 | 3.01 | 287 | |||||||||||||||||||||||||||||||||||||||
2008 | 10.27 | 0.42 | (0.11 | ) | 0.31 | (0.44 | ) | — | (0.44 | ) | 10.14 | 3.14 | 87,050 | 0.81 | 1.04 | 4.12 | 244 | |||||||||||||||||||||||||||||||||||||||
| (a) | Calculated based on the average shares outstanding methodology. |
| (b) | Assumes investment at the net asset value at the beginning of the year, reinvestment of all distributions, and a complete redemption of the investment at the net asset value at the end of the year. |
| (c) | The Fund’s portfolio turnover rate is calculated in accordance with regulatory requirements, without regard to transactions involving short term investments and certain derivatives. If such transactions were included, the Fund’s portfolio turnover rate may be higher. |
| The accompanying notes are an integral part of these financial statements. | 54 |
GOLDMAN SACHS VARIABLE INSURANCE TRUST GROWTH OPPORTUNITIES FUND
Financial Highlights
Selected Data for a Share Outstanding Throughout Each Year
| Income (loss) from investment operations | ||||||||||||||||||||||||||||||||||||||||||||||||
| Year | Net asset value, beginning of year | Net investment loss(a) | Net realized and unrealized gain (loss) | Total from investment operations | Distributions to shareholders from net realized gains | Net asset value, end of year | Total return(b) | Net assets, end of year (in 000s) | Ratio of net expenses to average net assets | Ratio of total expenses to average net assets | Ratio of net assets | Portfolio turnover rate(c) | ||||||||||||||||||||||||||||||||||||
FOR THE FISCAL YEARS ENDED DECEMBER 31, | ||||||||||||||||||||||||||||||||||||||||||||||||
2012 | $ | 6.34 | $ | (0.02 | )(d) | $ | 1.25 | $ | 1.23 | $ | (0.64 | ) | $ | 6.93 | 19.37 | % | $ | 171,870 | 1.15 | % | 1.39 | % | (0.26 | )%(d) | 46 | % | ||||||||||||||||||||||
2011 | 6.72 | (0.03 | ) | (0.24 | ) | (0.27 | ) | (0.11 | ) | 6.34 | (3.97 | ) | 159,324 | 1.17 | 1.41 | (0.46 | ) | 53 | ||||||||||||||||||||||||||||||
2010 | 5.63 | (0.03 | ) | 1.12 | 1.09 | — | 6.72 | 19.36 | 145,904 | 1.18 | 1.43 | (0.56 | ) | 57 | ||||||||||||||||||||||||||||||||||
2009 | 3.55 | (0.02 | ) | 2.10 | 2.08 | — | 5.63 | 58.59 | 127,710 | 1.18 | 1.43 | (0.50 | ) | 71 | ||||||||||||||||||||||||||||||||||
2008 | 6.20 | (0.02 | ) | (2.52 | ) | (2.54 | ) | (0.11 | ) | 3.55 | (40.72 | ) | 95,237 | 1.18 | 1.37 | (0.32 | ) | 78 | ||||||||||||||||||||||||||||||
| (a) | Calculated based on the average shares outstanding methodology. |
| (b) | Assumes investment at the net asset value at the beginning of the year, reinvestment of all distributions, and a complete redemption of the investment at the net asset value at the end of the year. |
| (c) | The Fund’s portfolio turnover rate is calculated in accordance with regulatory requirements, without regard to transactions involving short term investments and certain derivatives. If such transactions were included, the Fund’s portfolio turnover rate may be higher. |
| (d) | Reflects income recognized from non-recurring special dividends which amounted to $0.01 per share and 0.18% of average net assets. |
| The accompanying notes are an integral part of these financial statements. | 55 |
GOLDMAN SACHS VARIABLE INSURANCE TRUST FUNDS
Notes to Financial Statements
December 31, 2012
1. ORGANIZATION
Goldman Sachs Variable Insurance Trust (the “Trust” or “VIT”) is a Delaware statutory trust registered under the Investment Company Act of 1940, as amended (the “Act”), as an open-end management investment company. The Trust includes the Goldman Sachs Core Fixed Income Fund, Goldman Sachs Equity Index Fund, Goldman Sachs Government Income Fund and Goldman Sachs Growth Opportunities Fund (collectively, the “Funds” or individually a “Fund”). The Funds are diversified portfolios under the Act, each offering one class of shares — Service Shares. Shares of the Trust are offered to separate accounts of participating life insurance companies for the purpose of funding variable annuity contracts and variable life insurance policies.
Goldman Sachs Asset Management, L.P. (“GSAM”), an affiliate of Goldman, Sachs & Co. (“Goldman Sachs”), serves as investment adviser to the Funds pursuant to management agreements (the “Agreements”) with the Trust.
2. SIGNIFICANT ACCOUNTING POLICIES
The financial statements have been prepared in accordance with accounting principles generally accepted in the United States of America (“GAAP”) and require management to make estimates and assumptions that may affect the reported amounts and disclosures. Actual results may differ from those estimates and assumptions.
A. Investment Valuation — The Funds’ valuation policy is to value investments at fair value.
B. Investment Income and Investments — Investment income includes interest income and dividend income, net of any foreign withholding taxes, less any amounts reclaimable. Interest income is accrued daily and adjusted for amortization of premiums and accretion of discounts. Dividend income is recognized on ex-dividend date or, for certain foreign securities, as soon as such information is obtained subsequent to the ex-dividend date. Investment transactions are reflected on trade date. Realized gains and losses are calculated using identified cost. Investment transactions are recorded on the following business day for daily net asset value (“NAV”) calculations. Any foreign capital gains tax is accrued daily based upon net unrealized gains, and is payable upon sale of such investments. Distributions received from the Funds’ investments in United States (“U.S.”) real estate investment trusts (“REITs”) may be characterized as ordinary income, net capital gain or a return of capital. A return of capital is recorded by the Funds as a reduction to the cost basis of the REIT.
For derivative contracts, realized gains and losses are recorded upon settlement of the contract. Upfront payments on swaps are recognized over the contract’s term/event as realized gains or losses, with the exception of forward starting interest rate swaps whose realized gains or losses are recognized from the effective start date. For securities with paydown provisions, principal payments received are treated as a proportionate reduction to the cost basis of the securities and excess or shortfall amounts are recorded as gains or losses. For treasury inflation protected securities (“TIPS”), adjustments to principal due to inflation/deflation are reflected as increases/decreases to interest income with a corresponding adjustment to cost.
C. Expenses — Expenses directly incurred by a Fund are charged to that Fund, and certain expenses incurred by the Trust, which may not specifically relate to a Fund, are allocated across the Funds on a straight-line and/or pro-rata basis depending upon the nature of the expenses and are accrued daily.
56
GOLDMAN SACHS VARIABLE INSURANCE TRUST FUNDS
2. SIGNIFICANT ACCOUNTING POLICIES (continued)
D. Federal Taxes and Distributions to Shareholders — It is each Fund’s policy to comply with the requirements of the Internal Revenue Code of 1986, as amended (the “Code”), applicable to regulated investment companies (mutual funds) and to distribute each year substantially all of its investment company taxable income and capital gains to its shareholders. Accordingly, the Funds are not required to make any provisions for the payment of federal income tax. Distributions to shareholders are recorded on the ex-dividend date. Income and capital gains distributions, if any, are declared and paid according to the following schedule:
| Fund | Income Distributions Declared/Paid | Capital Gains Distributions Declared/Paid | ||||
| Core Fixed Income and Government Income | Quarterly | Annually | ||||
| Equity Index and Growth Opportunities | Annually | Annually |
Net capital losses are carried forward to future fiscal years and may be used to the extent allowed by the Code to offset any future capital gains. Utilization of capital loss carryforwards will reduce the requirement of future capital gains distributions.
Under the Regulated Investment Company Modernization Act of 2010, the Funds are permitted to carry forward capital losses incurred in taxable years beginning after December 22, 2010 for an unlimited period. However, any losses incurred during those future taxable years will be required to be utilized prior to the losses incurred in pre-enactment taxable years. As a result of this ordering rule, pre-enactment capital loss carryforwards may be more likely to expire unused. Additionally, post-enactment capital losses that are carried forward will retain their character as either short-term or long term capital losses rather than being considered all short-term as under previous law.
The characterization of distributions to shareholders for financial reporting purposes is determined in accordance with federal income tax rules, which may differ from GAAP. The source of each Fund’s distributions may be shown in the accompanying financial statements as either from net investment income, net realized gain or capital. Certain components of the Funds’ net assets on the Statements of Assets and Liabilities reflect permanent GAAP/tax differences based on the appropriate tax character.
E. Foreign Currency Translation — The accounting records and reporting currency of the Funds are maintained in U.S. dollars. Assets and liabilities denominated in foreign currencies are translated into U.S. dollars using the current exchange rates at the close of each business day. The effect of changes in foreign currency exchange rates on investments is included within net realized and unrealized gain (loss) on investments. Changes in the value of other assets and liabilities as a result of fluctuations in foreign exchange rates are included in the Statements of Operations within net change in unrealized gain (loss) on foreign currency transactions. Transactions denominated in foreign currencies are translated into U.S. dollars on the date the transaction occurred, the effects of which are included within net realized gain (loss) on foreign currency transactions.
F. Commission Recapture — GSAM, on behalf of certain Funds, may direct portfolio trades, subject to seeking best execution, to various brokers who have agreed to rebate a portion of the commissions generated. Such rebates are made directly to a Fund as cash payments and are included in net realized gain (loss) from investments on the Statements of Operations.
57
GOLDMAN SACHS VARIABLE INSURANCE TRUST FUNDS
Notes to Financial Statements (continued)
December 31, 2012
3. INVESTMENTS AND FAIR VALUE MEASUREMENTS
The fair value of a financial instrument is the amount that would be received to sell an asset or paid to transfer a liability in an orderly transaction between market participants at the measurement date (i.e., the exit price). GAAP establishes a fair value hierarchy that prioritizes the inputs to valuation techniques used to measure fair value. The hierarchy gives the highest priority to unadjusted quoted prices in active markets for identical assets or liabilities (Level 1 measurements) and the lowest priority to unobservable inputs (Level 3 measurements). The levels used for classifying investments are not necessarily an indication of the risk associated with investing in these investments. The three levels of the fair value hierarchy are described below:
Level 1 — Unadjusted quoted prices in active markets that are accessible at the measurement date for identical, unrestricted assets or liabilities;
Level 2 — Quoted prices in markets that are not active or financial instruments for which significant inputs are observable (including, but not limited to, quoted prices for similar investments, interest rates, foreign exchange rates, volatility and credit spreads), either directly or indirectly;
Level 3 — Prices or valuations that require significant unobservable inputs (including GSAM’s assumptions in determining fair value measurement).
The Trustees have adopted Valuation Procedures that govern the valuation of the portfolio investments held by the Funds, including investments for which market quotations are not readily available. The Trustees have delegated to GSAM day-to-day responsibility for implementing and maintaining internal controls and procedures related to the valuation of the Funds’ portfolio investment. To assess the continuing appropriateness of pricing sources and methodologies, GSAM regularly performs price verification procedures and issues challenges as necessary to third party pricing vendors or brokers, and any differences are reviewed in accordance with the Valuation Procedures.
A. Level 1 and Level 2 Fair Value Investments — The valuation techniques and significant inputs used in determining the fair values for investments classified as Level 1 and Level 2 are as follows:
Equity Securities — Equity securities and investment companies traded on a U.S. securities exchange or the NASDAQ system, or those located on certain foreign exchanges, including but not limited to the Americas, are valued daily at their last sale price or official closing price on the principal exchange or system on which they are traded. If no sale occurs, equity securities and exchange traded investment companies are valued at the last bid price for long positions and at the last ask price for short positions. Investments in investment companies (other than those that are exchange traded) are valued at the NAV on the valuation date. To the extent these investments are actively traded, they are classified as Level 1 of the fair value hierarchy.
Unlisted equity securities for which market quotations are available are valued at the last sale price on the valuation date, or if no sale occurs, at the last bid price. Securities traded on certain foreign securities exchanges are valued daily at fair value determined by an independent fair value service (if available) under valuation procedures approved by the trustees and consistent with applicable regulatory guidance. The independent fair value service takes into account multiple factors including, but not
58
GOLDMAN SACHS VARIABLE INSURANCE TRUST FUNDS
3. INVESTMENTS AND FAIR VALUE MEASUREMENTS (continued)
limited to, movements in the securities markets, certain depositary receipts, futures contracts and foreign currency exchange rates that have occurred subsequent to the close of the foreign securities exchange. Investments applying these valuation adjustments are classified as Level 2 of the fair value hierarchy.
Debt Securities — Debt securities for which market quotations are readily available are valued daily on the basis of quotations supplied by dealers or an independent pricing service approved by the trustees. The pricing services may use valuation models or matrix pricing, which consider: (i) yield or price with respect to bonds that are considered comparable in characteristics such as rating, interest rate and maturity date or (ii) quotations from securities dealers to determine current value. Short-term debt obligations that mature in sixty days or less and that do not exhibit signs of credit deterioration are valued at amortized cost, which approximates fair value. With the exception of treasury securities, which are generally classified as Level 1, these investments are generally classified as Level 2 of the fair value hierarchy.
i. Mortgage-Backed and Asset-Backed Securities — Mortgage-backed securities represent direct or indirect participations in, or are collateralized by and payable from, mortgage loans secured by residential and/or commercial real estate property. Asset-backed securities include securities whose principal and interest payments are collateralized by pools of other assets. The value of certain mortgage-backed and asset-backed securities (including adjustable rate mortgage loans) may be particularly sensitive to changes in prevailing interest rates. The value of these securities may also fluctuate in response to the market’s perception of the creditworthiness of the issuers.
Asset-backed securities may present credit risks that are not presented by mortgage-backed securities because they generally do not have the benefit of a security interest in collateral that is comparable to mortgage assets. Some asset-backed securities may only have a subordinated claim on collateral.
Stripped mortgage-backed securities are usually structured with two different classes: one that receives substantially all interest payments (interest-only, or “IO” and/or high coupon rate with relatively low principal amount, or “IOette”), and the other that receives substantially all principal payments (principal-only, or “PO”) from a pool of mortgage loans. Little to no principal will be received at the maturity of an IO; as a result, periodic adjustments are recorded to reduce the cost of the security until maturity. These adjustments are included in interest income.
ii. Mortgage Dollar Rolls — Mortgage dollar rolls are transactions whereby the Funds sell mortgage-backed-securities and simultaneously contract with the same counterparty to repurchase similar securities on a specified future date. During the settlement period, the Funds will not be entitled to accrue interest and receive principal payments on the securities sold.
iii. Treasury Inflation Protected Securities — TIPS are treasury securities in which the principal amount is adjusted daily to keep pace with inflation, as measured by the U.S. Consumer Pricing Index for Urban Consumers. The repayment of the original bond principal upon maturity is guaranteed by the full faith and credit of the U.S. Government.
iv. When-Issued Securities and Forward Commitments — When-issued securities, including TBA (“To Be Announced”) securities, are securities that are authorized but not yet issued in the market and purchased in order to secure what is considered to be an advantageous price or yield to a Fund. A forward commitment involves entering into a contract to
59
GOLDMAN SACHS VARIABLE INSURANCE TRUST FUNDS
Notes to Financial Statements (continued)
December 31, 2012
3. INVESTMENTS AND FAIR VALUE MEASUREMENTS (continued)
purchase or sell securities, typically on an extended settlement basis, for a fixed price at a future date. The purchase of securities on a when-issued or forward commitment basis involves a risk of loss if the value of the security to be purchased declines before the settlement date. Conversely, the sale of securities on a forward commitment basis involves the risk that the value of the securities sold may increase before the settlement date. Although a Fund will generally purchase securities on a when-issued or forward commitment basis with the intention of acquiring the securities for its portfolio, the Fund may dispose of when-issued securities or forward commitments prior to settlement which may result in a realized gain or loss.
Derivative contracts — A derivative is an instrument whose value is derived from underlying assets, indices, reference rates or a combination of these factors.
Exchange-traded derivatives, including futures contracts, typically fall within Level 1 of the fair value hierarchy. Over-the-counter (“OTC”) derivatives are valued using market transactions and other market evidence, including market-based inputs to models, calibration to market-clearing transactions, broker or dealer quotations, or other alternative pricing sources. Where models are used, the selection of a particular model to value an OTC derivative depends upon the contractual terms of, and specific risks inherent in, the instrument, as well as the availability of pricing information in the market. Valuation models require a variety of inputs, including contractual terms, market prices, yield curves, credit curves, measures of volatility, voluntary and involuntary prepayment rates, loss severity rates and correlations of such inputs. For OTC derivatives that trade in liquid markets, model inputs can generally be verified and model selection does not involve significant management judgment. OTC derivatives are classified within Level 2 of the fair value hierarchy when significant inputs are corroborated by market evidence.
i. Forward Foreign Currency Exchange Contracts — In a forward foreign currency contract, a Fund agrees to receive or deliver a fixed quantity of one currency for another, at a pre-determined price at a future date. All forward foreign currency exchange contracts are marked-to-market daily at the applicable forward rate.
ii. Futures Contracts — Futures contracts are contracts to buy or sell a standardized quantity of a specified commodity or security and are valued based on exchanged settlement prices or independent market quotes. Futures contracts are valued at the last settlement price, or in the absence of a sale, the last bid price for long positions and at the last ask price for short positions, at the end of each day on the board of trade or exchange upon which they are traded. Upon entering into a futures contract, a Fund deposits cash or securities in an account on behalf of the broker in an amount sufficient to meet the initial margin requirement. Subsequent payments are made or received by the Fund equal to the daily change in the contract value and are recorded as variation margin receivable or payable with a corresponding offset to unrealized gains or losses.
B. Level 3 Fair Value Investments — The valuation techniques and significant inputs used in determining the fair values for investments classified as Level 3 are as follows:
To the extent that the aforementioned significant inputs are unobservable, or if quotations are not readily available, or if GSAM believes that such quotations do not accurately reflect fair value, the fair value of the Funds’ investments may be determined under valuation procedures approved by the trustees. GSAM, consistent with its procedures and applicable regulatory guidance, may
60
GOLDMAN SACHS VARIABLE INSURANCE TRUST FUNDS
3. INVESTMENTS AND FAIR VALUE MEASUREMENTS (continued)
make an adjustment to the most recent valuation prices of either domestic or foreign securities in light of significant events to reflect what it believes to be the fair value of the securities at the time of determining a Fund’s NAV. Significant events which could affect a large number of securities in a particular market may include, but are not limited to: significant fluctuations in U.S. or foreign markets; market dislocations; market disruptions; or unscheduled market closings. Significant events which could also affect a single issuer may include, but are not limited to: corporate actions such as reorganizations, mergers and buy-outs; ratings downgrades; and bankruptcies.
C. Fair Value Hierarchy — The following is a summary of the Funds’ investments and derivatives classified in the fair value hierarchy as of December 31, 2012:
| CORE FIXED INCOME | ||||||||||||
| Investment Type | Level 1 | Level 2 | Level 3 | |||||||||
| Assets | ||||||||||||
| Fixed Income | ||||||||||||
Common Stock and/or Other Equity Investments | $ | — | $ | 63,384 | $ | — | ||||||
Corporate Obligations | — | 38,229,038 | — | |||||||||
Mortgage-Backed Obligations | — | 73,305,198 | — | |||||||||
U.S. Treasury Obligations and/or Other U.S. Government Agencies | 3,670,412 | 8,787,653 | — | |||||||||
Asset-Backed Securities | — | 2,179,189 | — | |||||||||
Foreign Debt Obligations | 8,577,453 | 3,187,839 | — | |||||||||
Municipal Debt Obligations | — | 1,475,402 | — | |||||||||
Government Guarantee Obligations | — | 4,533,504 | — | |||||||||
| Total | $ | 12,247,865 | $ | 131,761,207 | $ | — | ||||||
| Liabilities | ||||||||||||
| Fixed Income | ||||||||||||
Mortgage-Backed Obligations — Forward Sales Contracts | $ | — | $ | (3,249,609 | ) | $ | — | |||||
| Derivative Type | ||||||||||||
| Assets(a) | ||||||||||||
| Futures Contracts | $ | 154,839 | $ | — | $ | — | ||||||
| Forward Foreign Currency Exchange Contracts | — | 115,010 | — | |||||||||
| Liabilities(a) | ||||||||||||
| Futures Contracts | $ | (93,385 | ) | $ | — | $ | — | |||||
| Forward Foreign Currency Exchange Contracts | — | (282,938 | ) | — | ||||||||
61
GOLDMAN SACHS VARIABLE INSURANCE TRUST FUNDS
Notes to Financial Statements (continued)
December 31, 2012
3. INVESTMENTS AND FAIR VALUE MEASUREMENTS (continued)
| EQUITY INDEX | ||||||||||||
| Investment Type | Level 1 | Level 2 | Level 3 | |||||||||
| Assets(a) | ||||||||||||
| Common Stock and/or Other Equity Investments | $ | 166,957,659 | $ | — | $ | — | ||||||
| U.S. Treasury Obligations and/or Other U.S. Government Agencies | 139,994 | — | — | |||||||||
| Total | $ | 167,097,653 | $ | — | $ | — | ||||||
| Derivative Type | ||||||||||||
| Liabilities(a) | ||||||||||||
| Futures Contracts | $ | (507 | ) | $ | — | $ | — | |||||
| GOVERNMENT INCOME | ||||||||||||
| Investment Type | Level 1 | Level 2 | Level 3 | |||||||||
| Assets | ||||||||||||
| Fixed Income | ||||||||||||
Mortgage-Backed Obligations | $ | — | $ | 42,142,826 | $ | — | ||||||
U.S. Treasury Obligations and/or Other U.S. Government Agencies | 13,109,797 | 15,795,330 | — | |||||||||
Asset-Backed Securities | — | 855,761 | — | |||||||||
Government Guarantee Obligations | — | 2,150,377 | — | |||||||||
| Total | $ | 13,109,797 | $ | 60,944,294 | $ | — | ||||||
| Liabilities | ||||||||||||
| Fixed Income | ||||||||||||
Mortgage-Backed Obligations — Forward Sales Contracts | $ | — | $ | (7,469,687 | ) | $ | — | |||||
62
GOLDMAN SACHS VARIABLE INSURANCE TRUST FUNDS
3. INVESTMENTS AND FAIR VALUE MEASUREMENTS (continued)
| GOVERNMENT INCOME (continued) | ||||||||||||
| Derivative Type | Level 1 | Level 2 | Level 3 | |||||||||
| Assets(a) | ||||||||||||
| Futures Contracts | $ | 74,292 | $ | — | $ | — | ||||||
| Liabilities(a) | ||||||||||||
| Futures Contracts | $ | (35,729 | ) | $ | — | |||||||
| GROWTH OPPORTUNITIES | ||||||||||||
| Investment Type | Level 1 | Level 2 | Level 3 | |||||||||
| Assets(a) | ||||||||||||
| Common Stock and/or Other Equity Investments | $ | 169,847,687 | $ | — | $ | — | ||||||
| (a) | Amount shown represents unrealized gain (loss) at fiscal year end. |
For further information regarding security characteristics, see the Schedules of Investments.
4. INVESTMENTS IN DERIVATIVES
The following tables set forth, by certain risk types, the gross value of derivative contracts as of December 31, 2012. These instruments were used to meet the Funds’ investment objectives and to obtain and/or manage exposure related to the risks below. The values in the tables below exclude the effects of cash collateral received or posted pursuant to these derivative contracts, and therefore are not representative of the Funds’ net exposure.
| Core Fixed Income | ||||||||||||
| Risk | Statements of Assets and Liabilities | Assets | Statements of Assets and Liabilities | Liabilities | ||||||||
| Interest Rate | Unrealized gain on futures variation margin | $ | 154,839 | (a) | Unrealized loss on futures variation margin | $ | (93,385 | )(a) | ||||
| Currency | Receivables for unrealized gain on forward foreign currency exchange contracts | 115,010 | Payable for unrealized loss on forward foreign currency exchange contracts | (282,938 | ) | |||||||
| Total | $ | 269,849 | $ | (376,323 | ) | |||||||
63
GOLDMAN SACHS VARIABLE INSURANCE TRUST FUNDS
Notes to Financial Statements (continued)
December 31, 2012
4. INVESTMENTS IN DERIVATIVES (continued)
| Fund | Risk | Statements of Assets and Liabilities | Assets(a) | Statements of Assets and Liabilities | Liabilities(a) | |||||||||
| Equity Index | Equity | — | $ | — | Unrealized loss on futures variation margin | $ | (507 | ) | ||||||
| Government Income | Interest Rate | Unrealized gain on futures variation margin | 74,292 | Unrealized loss on futures variation margin | (35,729 | ) | ||||||||
| (a) | Represents unrealized gain (loss) on futures contracts described in the Additional Investment Information sections of the Schedules of Investments. Only current day’s variation margin is reported within the Statements of Assets and Liabilities. |
The following table sets forth, by certain risk types, the Funds’ gains (losses) related to these derivatives and their indicative volumes for the fiscal year ended December 31, 2012. These gains (losses) should be considered in the context that these derivative contracts may have been executed to economically hedge certain investments, and accordingly, certain gains (losses) on such derivative contracts may offset certain (losses) gains attributable to investments. These gains (losses) are included in “Net realized gain (loss)” or “Net change in unrealized gain (loss)” on the Statements of Operations:
| Core Fixed Income | ||||||||||||||
| Risk | Statements of Operations | Net Realized Gain (Loss) | Net Change in Unrealized Gain (Loss) | Average Number of Contracts(a) | ||||||||||
| Interest Rate | Net realized gain (loss) from futures contracts/Net change in unrealized gain (loss) on futures contracts | $ | 631,950 | $ | (52,366 | ) | 234 | |||||||
| Currency | Net realized gain (loss) from forward foreign currency exchange contracts/Net change in unrealized gain (loss) on forward foreign currency exchange contracts | 12,480 | (155,069 | ) | 172 | |||||||||
| Total | $ | 644,430 | $ | (207,435 | ) | 406 | ||||||||
The following table represents gains (losses) which are included in “Net realized gain (loss) from future transactions” and “Net change in unrealized gain (loss) on futures” on the Statements of Operations:
Fund | Risk | Net Realized Gain (Loss) | Net Change in Unrealized Gain (Loss) | Average Number of Contracts(a) | ||||||||||||
Equity Index | Equity | $ | 224,093 | $ | (3,576 | ) | 21 | |||||||||
Government Income | Interest Rate | 364,897 | (17,544 | ) | 137 | |||||||||||
| (a) | Average number of contracts is based on the average of month end balances for the fiscal year ended December 31, 2012. |
64
GOLDMAN SACHS VARIABLE INSURANCE TRUST FUNDS
5. AGREEMENTS AND AFFILIATED TRANSACTIONS
A. Management Agreements — Under the Agreements, GSAM manages the Funds, subject to the general supervision of the trustees.
As compensation for the services rendered pursuant to the Agreements, the assumption of the expenses related thereto and administration of the Funds’ business affairs, including providing facilities, GSAM is entitled to a management fee, accrued daily and paid monthly, equal to an annual percentage rate of each Fund’s average daily net assets.
For the fiscal year ended December 31, 2012, contractual and effective net management fees with GSAM were at the following rates:
| Contractual Management Fee Rate | ||||||||||||||||||||||||||||
| Fund | First $1 billion | Next $1 billion | Next $3 billion | Next $3 billion | Over $8 billion | Effective Rate | Effective Net Management Fee Rate | |||||||||||||||||||||
| Core Fixed Income | 0.40 | % | 0.36 | % | 0.34 | % | 0.33 | % | 0.32 | % | 0.40 | % | 0.40 | % | ||||||||||||||
| Government Income | 0.54 | 0.49 | 0.47 | 0.46 | 0.45 | 0.54 | 0.54 | |||||||||||||||||||||
| Growth Opportunities | 1.00 | 1.00 | 0.90 | 0.86 | 0.84 | 1.00 | 0.97 | * | ||||||||||||||||||||
| * | GSAM agreed to waive a portion of its management fee in order to achieve the effective net management fee rate shown above through at least April 27, 2013. Prior to such date GSAM may not terminate the arrangement without the approval of the trustees. |
The Agreement for the Equity Index Fund provides for a contractual management fee at an annual rate equal to 0.30% of the Fund’s average daily net assets. For the fiscal year ended December 31, 2012, GSAM agreed to waive a portion of its management fee in order to achieve the following effective annual rates which will remain in effect through at least April 27, 2013 and prior to such date GSAM may not terminate the arrangement without the approval of the trustees:
| Management Rate | ||||||||||||||
| Fund | $0-$400 million | Over $400 million | Effective Rate | |||||||||||
| Equity Index | 0.21 | % | 0.20 | % | 0.21 | % | ||||||||
As authorized by the Agreement, GSAM has entered into a Sub-advisory Agreement with SSgA which serves as the sub-adviser to the Equity Index Fund and provides the day-to-day advice regarding the Fund’s portfolio transactions. As compensation for its services, SSgA is entitled to a fee, accrued daily and paid monthly by GSAM, at the following annual rates of the Fund’s average daily net assets: 0.03% on the first $50 million, 0.02% on the next $200 million, 0.01% on the next $750 million and 0.008% over $1 billion. The effective Sub-advisory fee was 0.02% for the fiscal year ended December 31, 2012.
65
GOLDMAN SACHS VARIABLE INSURANCE TRUST FUNDS
Notes to Financial Statements (continued)
December 31, 2012
5. AGREEMENTS AND AFFILIATED TRANSACTIONS (continued)
B. Distribution and Service Plan — The Trust, on behalf of each Fund, has adopted a Distribution and Service Plan (the “Plan”). Under the Plan, Goldman Sachs, which serves as distributor (the “Distributor”), is entitled to a fee accrued daily and paid monthly, for distribution services and which may then be paid by Goldman Sachs to authorized dealers, equal to, on an annual basis, 0.25% of the Fund’s average daily net assets attributable to Service Shares. For the fiscal year ended December 31, 2012, for the Growth Opportunities Fund, Goldman Sachs agreed to waive distribution and services fees so as not to exceed an annual rate of 0.16% of average daily net assets of the Fund. This distribution and service fee waiver will remain in place through at least April 27, 2013, and prior to such date Goldman Sachs may not terminate the arrangement without the approval of the trustees.
C. Transfer Agency Agreement — Goldman Sachs also serves as the transfer agent of the Funds for a fee pursuant to a Transfer Agency Agreement. The fees charged for such transfer agency services are accrued daily and paid monthly at an annual rate of 0.02% of the average daily net assets of the Funds.
D. Other Expense Agreements and Affiliated Transactions — GSAM has agreed to limit certain “Other Expense” of the Funds (excluding management fees, distribution and service fees, acquired fund fees and expenses, transfer agent fees and expenses, taxes, interest, brokerage fees, litigation, indemnification, shareholder meeting and other extraordinary expenses) to the extent such expenses exceed, on an annual basis, a percentage rate of the average daily net assets of each Fund. Such Other Expense reimbursements, if any, are accrued daily and paid monthly. In addition, the Funds are not obligated to reimburse GSAM for prior fiscal year expense reimbursements, if any. The Other Expense limitation as an annual percentage rate of average daily net assets for each Fund is 0.004%. These Other Expense reimbursements will remain in place through at least April 27, 2013, and prior to such date GSAM may not terminate the arrangements without the approval of the trustees. In addition, the Funds have entered into certain offset arrangements with the custodian and the transfer agent, which may result in a reduction of the Funds’ expenses and are received irrespective of the application of the “Other Expense” limitations described above.
For the fiscal year ended December 31, 2012, these expense reductions, including any fee waivers and Other Expense reimbursements, were as follows (in thousands):
| Fund | Management Fee Waiver | Distribution and Service Fee Waiver | Custody Fee Credits | Other Expense Reimbursement | Total Expense Reductions | |||||||||||||||
| Core Fixed Income | $ | — | $ | — | $ | 12 | $ | 223 | $ | 235 | ||||||||||
| Equity Index | 156 | — | 1 | 246 | 403 | |||||||||||||||
| Government Income | — | — | 17 | 166 | 183 | |||||||||||||||
| Growth Opportunities | 52 | 154 | 2 | 197 | 405 | |||||||||||||||
66
GOLDMAN SACHS VARIABLE INSURANCE TRUST FUNDS
5. AGREEMENTS AND AFFILIATED TRANSACTIONS (continued)
As of December 31, 2012, the amounts owed to affiliates of the Funds were as follows (in thousands):
| Fund | Management Fees | Distribution and Service Fees | Transfer Agent Fees | Total | ||||||||||||
| Core Fixed Income | $ | 47 | $ | 29 | $ | 2 | $ | 78 | ||||||||
| Equity Index | 30 | 35 | 3 | 68 | ||||||||||||
| Government Income | 31 | 15 | 1 | 47 | ||||||||||||
| Growth Opportunities | 140 | 23 | 3 | 166 | ||||||||||||
E. Line of Credit Facility — As of December 31, 2012, the Funds participated in a $630,000,000 committed, unsecured revolving line of credit facility (the “facility”) together with other funds of the Trust and registered investment companies having management agreements with GSAM or its affiliates (“Other Borrowers”). Pursuant to the terms of the facility, the Funds and Other Borrowers could increase the credit amount by an additional $340,000,000, for a total of up to $970,000,000. This facility is to be used solely for temporary or emergency purposes, which may include the funding of redemptions. The interest rate on borrowings is based on the federal funds rate. The facility also requires a fee to be paid by the Funds based on the amount of the commitment that has not been utilized. For the fiscal year ended December 31, 2012, the Funds did not have any borrowings under the facility. Prior to May 8, 2012, the amount available through the facility was $580,000,000.
F. Other Transactions with Affiliates — The following table provides information about the investment in shares of issuers of which a Fund is an affiliate for the fiscal year ended December 31, 2012 (in thousands):
| Fund | Name of Affiliated Issuer | Number of Shares Held Beginning of Year | Shares Bought | Shares Sold | Number of Shares Held | Value at End of Year | Dividend Income | |||||||||||||||||
Equity Index | The Goldman Sachs Group, Inc. | 7 | — | (1 | ) | 6 | $ | 735 | $ | 12 | ||||||||||||||
67
GOLDMAN SACHS VARIABLE INSURANCE TRUST FUNDS
Notes to Financial Statements (continued)
December 31, 2012
6. PORTFOLIO SECURITIES TRANSACTIONS
The cost of purchases and proceeds from sales and maturities of long-term securities for the fiscal year ended December 31, 2012, were as follows:
| Fund | Purchases of U.S. Government and Agency Obligations | Purchases (Excluding U.S. Government and Agency Obligations) | Sales and Maturities of U.S. Government and Agency Obligations | Sales and Maturities (Excluding U.S. Government and Agency Obligations) | ||||||||||||
| Core Fixed Income | $ | 1,021,224,101 | $ | 49,681,121 | $ | 1,040,011,036 | $ | 47,314,400 | ||||||||
| Equity Index | — | 4,606,909 | — | 28,087,879 | ||||||||||||
| Government Income | 712,129,463 | 2,000,735 | 696,167,744 | 6,347,638 | ||||||||||||
| Growth Opportunities | — | 77,408,615 | — | 94,586,724 | ||||||||||||
7. TAX INFORMATION
The tax character of distributions paid during the fiscal year ended December 31, 2012, was as follows:
| Core Fixed Income | Equity Index | Government Income | Growth Opportunities | |||||||||||||
| Distributions paid from: | ||||||||||||||||
| Ordinary income | $ | 3,241,836 | $ | 3,068,378 | $ | 2,175,050 | $ | 492,616 | ||||||||
| Net long-term capital gains | — | — | 458,819 | 14,041,832 | ||||||||||||
| Total taxable distributions | $ | 3,241,836 | $ | 3,068,378 | $ | 2,633,869 | $ | 14,534,448 | ||||||||
The tax character of distributions paid during the fiscal year ended December 31, 2011 was as follows:
| Core Fixed Income | Equity Index | Government Income | Growth Opportunities | |||||||||||||
| Distributions paid from: | ||||||||||||||||
| Ordinary income | $ | 3,977,951 | $ | 2,889,650 | $ | 2,816,793 | $ | — | ||||||||
| Net long-term capital gains | — | — | 392,204 | 2,777,378 | ||||||||||||
| Total taxable distributions | $ | 3,977,951 | $ | 2,889,650 | $ | 3,208,997 | $ | 2,777,378 | ||||||||
68
GOLDMAN SACHS VARIABLE INSURANCE TRUST FUNDS
7. TAX INFORMATION (continued)
As of December 31, 2012, the components of accumulated earnings (losses) on a tax-basis were as follows:
| Core Fixed Income | Equity Index | Government Income | Growth Opportunities | |||||||||||||
| Undistributed ordinary income — net | $ | 431,486 | $ | 340,253 | $ | 93,860 | $ | 302,671 | ||||||||
| Undistributed long-term capital gain | — | — | 3,349 | 625,309 | ||||||||||||
| Total undistributed earnings | $ | 431,486 | $ | 340,253 | $ | 97,209 | $ | 927,980 | ||||||||
| Capital loss carryforwards:(1) | ||||||||||||||||
Expiring 2017 | $ | (1,103,983 | ) | $ | (641,986 | ) | $ | — | $ | — | ||||||
Expiring 2018 | (4,488,774 | ) | — | — | — | |||||||||||
| Total capital loss carryforwards | $ | (5,592,757 | ) | $ | (641,986 | ) | $ | — | $ | — | ||||||
| Timing differences (Qualified late year loss and straddle loss deferrals and deferred dividend) | (349,074 | ) | 713 | (511,071 | ) | (34,054 | ) | |||||||||
| Unrealized gains — net | 4,606,765 | 24,759,272 | 795,840 | 25,378,705 | ||||||||||||
| Total accumulated earnings (losses) — net | $ | (903,580 | ) | $ | 24,458,252 | $ | 381,978 | $ | 26,272,631 | |||||||
| (1) | Expiration occurs on December 31 of the year indicated. The Core Fixed Income and Equity Index Funds utilized $3,040,722 and $6,453,043, respectively, of capital losses in the current fiscal year. |
As of December 31, 2012, the Funds’ aggregate security unrealized gains and losses based on cost for U.S. federal income tax purposes were as follows:
| Core Fixed Income | Equity Index | Government Income | Growth Opportunities | |||||||||||||
| Tax cost | $ | 139,402,723 | $ | 142,338,381 | $ | 73,244,111 | $ | 144,468,982 | ||||||||
| Gross unrealized gain | 5,580,296 | 53,960,816 | 953,704 | 32,249,685 | ||||||||||||
| Gross unrealized loss | (973,947 | ) | (29,201,544 | ) | (143,724 | ) | (6,870,980 | ) | ||||||||
| Net unrealized security gain | $ | 4,606,349 | $ | 24,759,272 | $ | 809,980 | $ | 25,378,705 | ||||||||
| Net unrealized gain (loss) on other investments | 416 | — | (14,140 | ) | — | |||||||||||
| Net unrealized gain | $ | 4,606,765 | $ | 24,759,272 | $ | 795,840 | $ | 25,378,705 | ||||||||
69
GOLDMAN SACHS VARIABLE INSURANCE TRUST FUNDS
Notes to Financial Statements (continued)
December 31, 2012
7. TAX INFORMATION (continued)
The difference between GAAP-basis and tax-basis unrealized gains (losses) is attributable primarily to wash sales, net mark to market gains (losses) on regulated futures and forward foreign currency exchange contracts and differences related to the tax treatment of underlying fund investments, real estate investment trust investments, and securities on loan. In order to present certain components of the Funds’ capital accounts on a tax-basis, certain reclassifications have been recorded to the Funds’ accounts. These reclassifications have no impact on the net asset value of the Funds’ and result primarily from net operating losses, recognition of income and gains and losses of inflation protected securities and certain bonds and the difference in tax treatment of foreign currency transactions and paydown gains and losses.
| Fund | Paid-in Capital | Accumulated Net Realized Gain (Loss) | Undistributed Net Investment Income (Loss) | |||||||||
| Core Fixed Income | $ | — | $ | (977,779 | ) | $ | 977,779 | |||||
| Equity Index | 825 | 2,916 | (3,741 | ) | ||||||||
| Government Income | — | (286,549 | ) | 286,549 | ||||||||
| Growth Opportunities | 37,364 | (442,180 | ) | 404,816 | ||||||||
GSAM has reviewed the Funds’ tax positions for all open tax years (the current and prior three years, as applicable) and has concluded that no provision for income tax is required in the Funds’ financial statements. Such open tax years remain subject to examination and adjustment by tax authorities.
8. OTHER RISKS
The Funds’ risks include, but are not limited to, the following:
Shareholder Concentration Risk — Certain participating insurance companies, accounts, or Goldman Sachs affiliates may from time to time own (beneficially or of record) or control a significant percentage of the Funds’ shares. Redemptions by these entities of their holdings in the Funds may impact the Funds’ liquidity and NAV. These redemptions may also force the Funds to sell securities.
Liquidity Risk — The Funds may make investments that are illiquid or that may become less liquid in response to market developments or adverse investor perceptions. Illiquid investments may be more difficult to value. Liquidity risk may also refer to the risk that a Fund will not be able to pay redemption proceeds within the allowable time period because of unusual market conditions, an unusually high volume of redemption requests, or other reasons. To meet redemption requests, a Fund may be forced to sell investments at an unfavorable time and/or under unfavorable conditions.
70
GOLDMAN SACHS VARIABLE INSURANCE TRUST FUNDS
8. OTHER RISKS (continued)
Market and Credit Risks — In the normal course of business, the Funds trade financial instruments and enter into financial transactions where risk of potential loss exists due to changes in the market (market risk). Additionally, the Funds may also be exposed to credit risk in the event that an issuer fails to perform or that an institution or entity with which the Funds have unsettled or open transactions defaults.
9. INDEMNIFICATIONS
Under the Trust’s organizational documents, its trustees, officers, employees and agents are indemnified, to the extent permitted by the Act, against certain liabilities that may arise out of performance of their duties to the Funds. Additionally, in the course of business, the Funds enter into contracts that contain a variety of indemnification clauses. The Funds’ maximum exposure under these arrangements is unknown, as this would involve future claims that may be made against the Funds that have not yet occurred. However, GSAM believes the risk of loss under these arrangements to be remote.
10. OTHER MATTERS
New Accounting Pronouncement — In December 2011, the Financial Accounting Standards Board issued an Accounting Standards Update (“ASU”) to enhance disclosures about financial instruments and derivative instruments that are subject to offsetting (“netting”) on the Statement of Assets and Liabilities. This information will enable users of the Funds’ financial statements to evaluate the effect or potential effect of netting arrangements on the Funds’ financial position. The ASU is effective for financial statements with fiscal years beginning on or after January 1, 2013, and interim periods within those fiscal years. At this time, GSAM is evaluating the implications of these changes on the financial statements.
11. SUBSEQUENT EVENTS
Subsequent events after the balance sheet date have been evaluated through the date the financial statements were issued. Other than the item discussed below, GSAM has concluded that there is no impact requiring adjustment or disclosure in the financial statements.
At a meeting held on February 12, 2013, the Trustees approved a proposal to rename the Goldman Sachs Government Income Fund the “Goldman Sachs High Quality Floating Rate Fund”. In addition, the Fund’s new investment objective will be to seek to provide a high level of current income, consistent with low volatility of principal. The Fund will invest at least 80% of its net assets in high quality floating rate or variable rate obligations. This revised policy reflects a change in the Fund’s principal investments from fixed rate U.S. government securities to floating rate U.S. government and non-U.S. government obligations. These changes will be effective at the close of business on April 30, 2013.
71
Report of Independent Registered Public Accounting Firm
To the Board of Trustees and Shareholders of
Goldman Sachs Variable Insurance Trust:
In our opinion, the accompanying statements of assets and liabilities, including the schedules of investments, and the related statements of operations and of changes in net assets and the financial highlights present fairly, in all material respects, the financial position of Goldman Sachs Core Fixed Income Fund, Goldman Sachs Equity Index Fund, Goldman Sachs Government Income Fund and Goldman Sachs Growth Opportunities Fund (collectively the “Funds”), portfolios of Goldman Sachs Variable Insurance Trust, at December 31, 2012, the results of each of their operations, the changes in each of their net assets and the financial highlights for each of the periods indicated in conformity with accounting principles generally accepted in the United States of America. These financial statements and financial highlights (hereafter referred to as “financial statements”) are the responsibility of the Funds’ management. Our responsibility is to express an opinion on these financial statements based on our audits. We conducted our audits of these financial statements in accordance with the standards of the Public Company Accounting Oversight Board (United States). Those standards require that we plan and perform the audits to obtain reasonable assurance about whether the financial statements are free of material misstatement. An audit includes examining, on a test basis, evidence supporting the amounts and disclosures in the financial statements, assessing the accounting principles used and significant estimates made by management, and evaluating the overall financial statement presentation. We believe that our audits, which included confirmation of securities at December 31, 2012 by correspondence with the custodian, brokers, and the application of alternative auditing procedures where securities purchased confirmations had not been received, provide a reasonable basis for our opinion.
PricewaterhouseCoopers LLP
Boston, Massachusetts
February 14, 2013
72
GOLDMAN SACHS VARIABLE INSURANCE TRUST FUNDS
| Fund Expenses — Six Month Period Ended December 31, 2012 (Unaudited) |
As a shareholder of the Service Shares of the Funds, you incur ongoing costs, including management fees, distribution and service (12b-1) fees and other Fund expenses. This example is intended to help you understand your ongoing costs (in dollars) of investing in the Funds and to compare these costs with the ongoing costs of investing in other mutual funds.
The example is based on an investment of $1,000 invested at the beginning of the period and held for the entire period from July 1, 2012 through December 31, 2012.
Actual Expenses — The first line under each share class in the table below provides information about actual account values and actual expenses. You may use the information in this line, together with the amount you invested, to estimate the expenses that you paid over the period. Simply divide your account value by $1,000 (for example, an $8,600 account value divided by $1,000=8.6), then multiply the result by the number in the first line under the heading entitled “Expenses Paid” to estimate the expenses you paid on your account during this period.
Hypothetical Example for Comparison Purposes — The second line under each share class in the table below provides information about hypothetical account values and hypothetical expenses based on the Funds’ actual net expense ratio and an assumed rate of return of 5% per year before expenses, which is not the Funds’ actual return. The hypothetical account values and expenses may not be used to estimate the actual ending account balance or expenses you paid for the period. You may use this information to compare the ongoing costs of investing in the Funds and other funds. To do so, compare this 5% hypothetical example with the 5% hypothetical examples that appear in the shareholder reports of the other funds.
Please note that the expenses shown in the table are meant to highlight your ongoing costs only. As a shareholder of the Fund you do not incur any transaction costs, such as sales charges, redemption fees, or exchange fees, but shareholders of other funds may incur such costs. The second line of the table is useful in comparing ongoing costs only, and will not help you determine the relative total costs of owning different funds whose shareholders may incur transaction costs.
| Core Fixed Income Fund | Equity Index Fund | Government Income Fund | Growth Opportunities Fund | |||||||||||||||||||||||||||||||||||||||||||||
Beginning 07/01/12 | Ending Account 12/31/12 | Expenses Paid for the 12/31/12* | Beginning 07/01/12 | Ending Account 12/31/12 | Expenses Paid for the 12/31/12* | Beginning 07/01/12 | Ending Account 12/31/12 | Expenses Paid for the 12/31/12* | Beginning 07/01/12 | Ending Account 12/31/12 | Expenses Paid for the 12/31/12* | |||||||||||||||||||||||||||||||||||||
| Actual | $ | 1,000 | $ | 1,033.90 | $ | 3.37 | $ | 1,000 | $ | 1,057.60 | $ | 2.48 | $ | 1,000 | $ | 1,009.10 | $ | 3.94 | $ | 1,000 | $ | 1,071.00 | $ | 5.99 | ||||||||||||||||||||||||
| Hypothetical 5% return | 1,000 | 1,021.82 | + | 3.35 | 1,000 | 1,022.72 | + | 2.44 | 1,000 | 1,021.22 | + | 3.96 | 1,000 | 1019.36 | + | 5.84 | ||||||||||||||||||||||||||||||||
| * | Expenses are calculated using each Fund’s annualized net expense ratio for each class, which represents the ongoing expenses as a percentage of net assets for the six months ended December 31, 2012. Expenses are calculated by multiplying the annualized net expense ratio by the average account value for the period; then multiplying the result by the number of days in the most recent fiscal half year; and then dividing that result by the number of days in the fiscal year. The annualized net expense ratios for the period were as follows: |
| Fund | Service | |||
| Core Fixed Income | 0.66% | |||
| Equity Index | 0.48% | |||
| Government Income | 0.78% | |||
| Growth Opportunities | 1.15% | |||
| + | Hypothetical expenses are based on each Fund’s actual annualized net expense ratios and an assumed rate of return of 5% per year before expenses. |
73
GOLDMAN SACHS VARIABLE INSURANCE TRUST FUNDS
Trustees and Officers (Unaudited)
Independent Trustees
| Name, Address and Age1 | Position(s) Held with the Trust | Term of Office and Length of Time Served2 | Principal Occupation(s) During Past 5 Years | Number of Portfolios in Fund Complex Overseen by Trustee3 | Other Directorships Held by Trustee4 | |||||||
Ashok N. Bakhru Age: 70 | Chairman of the Board of Trustees | Since 1996 (Trustee since 1991) | Mr. Bakhru is retired. He is President, ABN Associates (1994-1996 and 1998-Present); Director, Apollo Investment Corporation (a business development company) (2008-Present); Member of Cornell University Council (1992-2004 and 2006-Present); and was formerly Trustee, Scholarship America (1998-2005); Trustee, Institute for Higher Education Policy (2003-2008); Director, Private Equity Investors — III and IV (1998-2007), and Equity-Linked Investors II (April 2002-2007).
Chairman of the Board of Trustees — Goldman Sachs Mutual Fund Complex. | 111 | Apollo Investment Corporation (a business development company) | |||||||
Donald C. Burke Age: 52 | Trustee | Since 2010 | Mr. Burke is retired. He is Director, Avista Corp. (2011-Present); and was formerly a Director, BlackRock Luxembourg and Cayman Funds (2006-2010); President and Chief Executive Officer, BlackRock U.S. Funds (2007-2009); Managing Director, BlackRock, Inc. (2006-2009); Managing Director, Merrill Lynch Investment Managers, L.P. (“MLIM”) (2006); First Vice President, MLIM (1997-2005); Chief Financial Officer and Treasurer, MLIM U.S. Funds (1999-2006).
Trustee — Goldman Sachs Mutual Fund Complex. | 110 | Avista Corp. (an energy company) | |||||||
John P. Coblentz, Jr. Age: 71 | Trustee | Since 2003 | Mr. Coblentz is retired. Formerly, he was Partner, Deloitte & Touche LLP (1975-2003); Director, Emerging Markets Group, Ltd. (2004-2006); and Director, Elderhostel, Inc. (2006-2012).
Trustee — Goldman Sachs Mutual Fund Complex. | 111 | None | |||||||
Diana M. Daniels Age: 63 | Trustee | Since 2007 | Ms. Daniels is retired. Formerly, she was Vice President, General Counsel and Secretary, The Washington Post Company (1991-2006). Ms. Daniels is a Vice Chairman of the Board of Trustees, Cornell University (2009-Present); Member, Advisory Board, Psychology Without Borders (international humanitarian aid organization) (2007-Present), and former Member of the Legal Advisory Board, New York Stock Exchange (2003-2006) and of the Corporate Advisory Board, Standish Mellon Management Advisors (2006-2007).
Trustee — Goldman Sachs Mutual Fund Complex. | 110 | None | |||||||
Joseph P. LoRusso Age: 55 | Trustee | Since 2010 | Mr. LoRusso is retired. Formerly, he was President, Fidelity Investments Institutional Services Co. (“FIIS”) (2002-2008); Director, FIIS (2002-2008); Director, Fidelity Investments Institutional Operations Company (2003-2007); Executive Officer, Fidelity Distributors Corporation (2007-2008).
Trustee — Goldman Sachs Mutual Fund Complex. | 110 | None | |||||||
Jessica Palmer Age: 63 | Trustee | Since 2007 | Ms. Palmer is retired. She is Director, Emerson Center for the Arts and Culture (2011-Present); and was formerly a Consultant, Citigroup Human Resources Department (2007-2008); Managing Director, Citigroup Corporate and Investment Banking (previously, Salomon Smith Barney/Salomon Brothers) (1984-2006). Ms. Palmer was a Member of the Board of Trustees of Indian Mountain School (private elementary and secondary school) (2004-2009).
Trustee — Goldman Sachs Mutual Fund Complex. | 110 | None | |||||||
Richard P. Strubel Age: 73 | Trustee | Since 1987 | Mr. Strubel is retired. Formerly, he was Director, Cardean Learning Group (provider of educational services via the internet) (2003-2008); Trustee, Emeritus, The University of Chicago (1987-Present).
Trustee — Goldman Sachs Mutual Fund Complex. | 111 | The Northern Trust Mutual Fund Complex (64 Portfolios) (Chairman of the Board of Trustees); Gildan Activewear Inc. (a clothing marketing and manufacturing company). | |||||||
74
GOLDMAN SACHS VARIABLE INSURANCE TRUST FUNDS
Trustees and Officers (Unaudited) (continued)
Interested Trustees
| Name, Address and Age1 | Position(s) Held with the Trust | Term of Office and | Principal Occupation(s) During Past 5 Years | Number of Portfolios in Fund Complex Overseen by Trustee3 | Other Directorships Held by Trustee4 | |||||||
James A. McNamara* Age: 50 | President and Trustee | Since 2007 | Managing Director, Goldman Sachs (December 1998-Present); Director of Institutional Fund Sales, GSAM (April 1998-December 2000); and Senior Vice President and Manager, Dreyfus Institutional Service Corporation (January 1993- April 1998).
President — Goldman Sachs Mutual Fund Complex (November 2007-Present); Senior Vice President — Goldman Sachs Mutual Fund Complex (May 2007-November 2007); and Vice President — Goldman Sachs Mutual Fund Complex (2001-2007).
Trustee — Goldman Sachs Mutual Fund Complex (since November 2007 and December 2002-May 2004). | 111 | None | |||||||
Alan A. Shuch* Age: 63 | Trustee | Since 1990 | Advisory Director — GSAM (May 1999-Present); Consultant to GSAM (December 1994-May 1999); and Limited Partner, Goldman Sachs (December 1994-May 1999).
Trustee — Goldman Sachs Mutual Fund Complex. | 110 | None | |||||||
| * | These persons are considered to be “Interested Trustees” because they hold positions with Goldman Sachs and own securities issued by The Goldman Sachs Group, Inc. Each Interested Trustee holds comparable positions with certain other companies of which Goldman Sachs, GSAM or an affiliate thereof is the investment adviser, administrator and/or distributor. |
| 1 | Each Trustee may be contacted by writing to the Trustee, c/o Goldman Sachs, 200 West Street, New York, New York, 10282, Attn: Caroline Kraus. Information is provided as of December 31, 2012. |
| 2 | Each Trustee holds office for an indefinite term until the earliest of: (a) the election of his or her successor; (b) the date the Trustee resigns or is removed by the Board of Trustees or shareholders, in accordance with the Trust’s Declaration of Trust; (c) the conclusion of the first Board meeting held subsequent to the day the Trustee attains the age of 74 years (in accordance with the current resolutions of the Board of Trustees, which may be changed by the Trustees without shareholder vote); or (d) the termination of the Trust. |
| 3 | The Goldman Sachs Mutual Fund Complex consists of the Trust, Goldman Sachs Trust II, Goldman Sachs Municipal Opportunity Fund, Goldman Sachs Credit Strategies Fund, and Goldman Sachs Trust. As of December 31, 2012, the Trust consisted of 12 portfolios. Goldman Sachs Trust II consisted of 1 portfolio (which did not offer shares to the public); Goldman Sachs Municipal Opportunity Fund did not offer shares to the public; and Goldman Sachs Trust consisted of 96 portfolios (80 of which offered shares to the public). |
| 4 | This column includes only directorships of companies required to report to the SEC under the Securities Exchange Act of 1934 (i.e., “public companies”) or other investment companies registered under the Act. |
Additional information about the Trustees is available in the Funds’ Statement of Additional Information, which can be obtained from Goldman Sachs free of charge by calling this toll-free number (in the United States of America): 1-800-292-4726.
75
GOLDMAN SACHS VARIABLE INSURANCE TRUST FUNDS
Trustees and Officers (Unaudited) (continued)
Officers of the Trust*
Name, Address and Age | Position(s) Held With the Trust | Term of Office and | Principal Occupation(s) During Past 5 Years | |||
James A. McNamara 200 West Street New York, NY 10282 Age: 50 | President and Trustee | Since 2007 | Managing Director, Goldman Sachs (December 1998-Present); Director of Institutional Fund Sales, GSAM (April 1998-December 2000); and Senior Vice President and Manager, Dreyfus Institutional Service Corporation (January 1993-April 1998). President — Goldman Sachs Mutual Fund Complex (November 2007-Present); Senior Vice President — Goldman Sachs Mutual Fund Complex (May 2007-November 2007); and Vice President — Goldman Sachs Mutual Fund Complex (2001-2007). Trustee — Goldman Sachs Mutual Fund Complex (November 2007-Present and December 2002-May 2004). | |||
George F. Travers 30 Hudson Street Jersey City, NJ 07302 Age: 44 | Senior Vice President and Principal Financial Officer | Since 2009 | Managing Director, Goldman Sachs (2007-Present); Managing Director, UBS Ag (2005-2007); and Partner, Deloitte & Touche LLP (1990-2005, partner from 2000-2005). Senior Vice President and Principal Financial Officer — Goldman Sachs Mutual Fund Complex. | |||
Caroline Kraus 200 West Street New York, NY 10282 Age: 35 | Secretary | Since 2012 | Vice President, Goldman Sachs (August 2006-Present); Associate General Counsel, Goldman Sachs (2012-Present); Assistant General Counsel, Goldman Sachs (August 2006-December 2011) and Associate, Weil, Gotshal & Manges-LLP (2002-2006). Secretary — Goldman Sachs Mutual Fund Complex (August 2012-Present) and Assistant Secretary — Goldman Sachs Mutual Fund Complex (June 2012-August 2012). | |||
Scott M. McHugh 200 West Street New York, NY 10282 Age: 41 | Treasurer and Senior Vice President | Since 2009 | Vice President, Goldman Sachs (February 2007-Present); Assistant Treasurer of certain mutual funds administered by DWS Scudder (2005-2007); and Director (2005-2007), Vice President (2000-2005) and Assistant Vice President (1998-2000), Deutsche Asset Management or its predecessor (1998-2007). Treasurer — Goldman Sachs Mutual Fund Complex (October 2009-Present); Senior Vice President — Goldman Sachs Mutual Fund Complex (November 2009-Present); and Assistant Treasurer — Goldman Sachs Mutual Fund Complex (May 2007-October 2009). | |||
| 1 | Officers hold office at the pleasure of the Board of Trustees or until their successors are duly elected and qualified. Each officer holds comparable positions with certain other companies of which Goldman Sachs, GSAM or an affiliate thereof is the investment adviser, administrator and/or distributor. Information is provided as of December 31, 2012. |
| * | Represents a partial list of officers of the Trust. Additional information about all the officers is available in the Funds’ Statement of Additional Information, which can be obtained from Goldman Sachs free of charge by calling this toll-free number (in the United States): 1-800-292-4726. |
Goldman Sachs Variable Insurance Trust — Tax Information (Unaudited)
For the year ended December 31, 2012, 100% of the dividends paid from net investment company taxable income by the Equity Index and Growth Opportunities Fund qualify for the dividends received deduction available to corporations.
Pursuant to Section 852 of the Internal Revenue Code, the Government Income and Growth Opportunities Funds designate $458,819 and $14,041,832, respectively, or, if different, the maximum amount allowable, as capital gain dividends paid during the year ended December 31, 2012.
76
| TRUSTEES | OFFICERS | |
| Ashok N. Bakhru, Chairman | James A. McNamara, President | |
| Donald C. Burke | George F. Travers, Principal Financial Officer | |
| John P. Coblentz, Jr. | Caroline L. Kraus, Secretary | |
| Diana M. Daniels | Scott M. McHugh, Treasurer | |
| Joseph P. LoRusso | ||
| James A. McNamara | ||
| Jessica Palmer | ||
| Alan A. Shuch | ||
| Richard P. Strubel |
GOLDMAN, SACHS & CO.
Distributor and Transfer Agent
GOLDMAN SACHS ASSET MANAGEMENT, L.P.
Investment Adviser
200 West Street, New York, New York 10282
Visit our website at www.goldmansachsfunds.com/vit to obtain the most recent month-end returns.
The reports concerning the Funds included in this shareholder report may contain certain forward-looking statements about the factors that may affect the performance of the Funds in the future. These statements are based on Fund management’s predictions and expectations concerning certain future events and their expected impact on the Funds, such as performance of the economy as a whole and of specific industry sectors, changes in the levels of interest rates, the impact of developing world events, and other factors that may influence the future performance of the Funds. Management believes these forward-looking statements to be reasonable, although they are inherently uncertain and difficult to predict. Actual events may cause adjustments in portfolio management strategies from those currently expected to be employed.
A description of the policies and procedures that the Funds use to determine how to vote proxies relating to portfolio securities and information regarding how the Funds voted proxies relating to portfolio securities for the 12-month period ended June 30 is available (i) without charge, upon request by calling 1-800-621-2550; and (ii) on the Securities and Exchange Commission (“SEC”) website at http://www.sec.gov.
The Funds file their complete schedule of portfolio holdings with the SEC for the first and third quarters of each fiscal year on Form N-Q. The Funds’ Forms N-Q are available on the SEC’s website at http://www.sec.gov within 60 days after the Funds’ first and third fiscal quarters. The Funds’ Forms N-Q may be reviewed and copied at the SEC’s Public Reference Room in Washington, D.C. and information on the operation of the Public Reference Room may also be obtained by calling 1-800-SEC-0330. Forms N-Q may be obtained upon request and without charge by calling 1-800-621-2550.
Holdings and allocations shown are as of December 31, 2012 and may not be representative of future investments. Fund holdings should not be relied on in making investment decisions and should not be construed as research or investment advice regarding particular securities.
The Global Industry Classification Standard (“GICS”) was developed by and is the exclusive property and a service mark of Morgan Stanley Capital International Inc. (“MSCI”) and Standard & Poor’s, a division of The McGraw-Hill Companies, Inc. (“S&P”) and is licensed for use by Goldman Sachs. Neither MSCI, S&P nor any other party involved in making or compiling the GICS or any GICS classifications makes any express or implied warranties or representations with respect to such standard or classification (or the results to be obtained by the use thereof), and all such parties hereby expressly disclaim all warranties of originality, accuracy, completeness, merchantability or fitness for a particular purpose with respect to any of such standard or classification. Without limiting any of the foregoing, in no event shall MSCI, S&P, any of their affiliates or any third party involved in making or compiling the GICS or any GICS classifications have any liability for any direct, indirect, special, punitive, consequential or any other damages (including lost profits) even if notified of the possibility of such damages.
The portfolio risk management process includes an effort to monitor and manage risk, but does not imply low risk.
Shares of the Goldman Sachs VIT Funds are offered to separate accounts of participating life insurance companies for the purpose of funding variable annuity contracts and variable life insurance policies. Shares of the Fund are not offered directly to the general public. The variable annuity contracts and variable life insurance policies are described in the separate prospectuses issued by participating insurance companies. You should refer to those prospectuses for information about surrender charges, mortality and expense risk fees and other charges that may be assessed by participating insurance companies under the variable annuity contracts or variable life insurance policies. Such fees or charges, if any, may affect the return you may realize with respect to your investments. Ask your representative for more complete information. Please consider a fund’s objectives, risks and charges and expenses, and read the prospectus carefully before investing. The prospectus contains this and other information about the Fund.
This material is not authorized for distribution to prospective investors unless preceded or accompanied by a current Prospectus or summary prospectus, if applicable. Investors should consider a Fund’s objective, risks, and charges and expenses, and read the summary prospectus, if available, and/or the Prospectus carefully before investing or sending money. The summary prospectus, if available, and the Prospectus contain this and other information about a Fund and may be obtained from your Authorized Institution or from Goldman, Sachs & Co. by calling 1-800-621-2550.
Toll Free (in U.S.): 800-292-4726
This report is prepared for the general information of contract owners and is not an offer of shares of the Goldman Sachs Variable Insurance Trust Funds.
© 2013 Goldman Sachs. All rights reserved.
VITSVCAR13/92505.MF.MED.TMPL/2/2013
Goldman
Sachs Variable Insurance Trust
Goldman Sachs
Global Markets
Navigator Fund
Annual Report
December 31, 2012

GOLDMAN SACHS VARIABLE INSURANCE TRUST GLOBAL MARKETS NAVIGATOR FUND
Principal Investment Strategies and Risks
This is not a complete list of the risks that may affect the Fund. For additional information concerning the risks applicable to the Fund, please see the Fund’s Prospectus.
Shares of the Goldman Sachs Variable Insurance Trust — Goldman Sachs Global Markets Navigator Fund are offered to separate accounts of participating life insurance companies for the purpose of funding variable annuity contracts and variable life insurance policies. Shares of the Fund are not offered directly to the general public. The variable annuity contracts and variable life insurance policies are described in the separate prospectuses issued by participating insurance companies. You should refer to those prospectuses for information about surrender charges, mortality and expense risk fees and other charges that may be assessed by participating insurance companies under the variable annuity contracts or variable life insurance policies. Such fees or charges, if any, may affect the return you realize with respect to your investments. Ask your representative for more complete information. Please consider the Fund’s objective, risks and charges and expenses, and read the Prospectus carefully before investing. The Prospectus contains this and other information about the Fund.
The Goldman Sachs Global Markets Navigator Fund seeks to achieve investment results that approximate the performance of the GS Global Markets Navigator Index (the “Index”). The Index is comprised of, and allocates exposure to, a set of underlying indices representing various global asset classes including, but not limited to, global equity, fixed income and commodity assets. The Index is constructed using a proprietary methodology developed by the index provider, and is rebalanced at least monthly. The Fund’s performance may not match, and may vary substantially from, that of the Index. There can be no assurance that the methodology used by the index provider in constructing the Index will correctly forecast certain risks or make effective tactical decisions, and the Fund’s attempt to track this Index may cause it to underperform general securities markets and/or other asset classes. Derivative investments (including swaps) may involve a high degree of financial risk. These risks include the risk that a small movement in the price of the underlying security or benchmark may result in a disproportionately large movement, unfavorable or favorable, in the price of the derivative instrument; risk of default by a counterparty; and liquidity risk. The Fund’s use of derivatives may result in leverage, which can make the Fund more volatile. The Fund’s over-the-counter transactions are subject to less government regulation and supervision. The Fund’s equity investments are subject to market risk, which means that the value of its investments may go up or down in response to the prospects of individual companies, particular sectors and/or general economic conditions. The Fund’s fixed income investments are subject to the risks associated with debt securities generally, including credit, liquidity and interest rate risk. The Fund is also subject to the risk that the issuers of sovereign debt or the government authorities that control the payment of debt may be unable or unwilling to repay principal or interest when due. High yield, lower rated securities involve greater price volatility and present greater risks than higher rated fixed income securities. The value of the Fund’s treasury inflation protected securities (TIPS) generally fluctuates in response to inflationary concerns, and as inflationary concerns decrease, TIPS become less valuable. Any guarantee on U.S. government securities applies only to the underlying securities of the Fund if held to maturity and not to the value of the Fund’s shares. The Fund is subject to the risk that exposure to the commodities markets may subject the Fund to greater volatility than investments in traditional securities. The Fund may also invest in foreign securities, including emerging markets securities, which may be more volatile and less liquid than investments in U.S. securities and are subject to the risks of currency fluctuations and adverse economic or political developments. At times, the Fund may be unable to sell certain of its portfolio securities without a substantial drop in price, if at all. The Fund’s investments in other investment companies (including ETFs) subject it to additional expenses. Because the Fund may concentrate its investments in an industry (only in the event that an industry represents 20% or more of
1
GOLDMAN SACHS VARIABLE INSURANCE TRUST GLOBAL MARKETS NAVIGATOR FUND
the Fund’s index), the Fund may be subject to greater risk of loss as a result of adverse economic, business or other developments affecting that industry. The Fund is “non-diversified” and may invest more of its assets in fewer issuers than “diversified” funds. Accordingly, the Fund may be more susceptible to adverse developments affecting any single issuer held in its portfolio and to greater losses resulting from these developments.
The “GS Global Markets Navigator Index” is a trademark or service mark of Goldman, Sachs & Co. and has been licensed for use by the Investment Adviser in connection with the Fund. As the licensor of this trademark or service mark, Goldman, Sachs & Co. does not make any representation regarding the advisability of investing in the Fund.
2
GOLDMAN SACHS VARIABLE INSURANCE TRUST GLOBAL MARKETS NAVIGATOR FUND
INVESTMENT OBJECTIVE
The Fund seeks to achieve investment results that approximate the performance of the GS Global Markets Navigator Index.
Portfolio Management Discussion and Analysis
Below, the Goldman Sachs Quantitative Investment Strategies Team discusses the Goldman Sachs Variable Insurance Trust — Goldman Sachs Global Markets Navigator Fund’s (the “Fund”) performance and positioning for the period since its inception on April 16, 2012 through December 31, 2012 (the “Reporting Period”).
How did the Fund perform during the Reporting Period?
During the Reporting Period, the Fund’s Service Shares generated a cumulative total return of 3.74%. This return compares to the 4.86% cumulative total return of the Fund’s benchmark, the GS Global Markets Navigator Index (the “Index”), during the same time period. A blended index comprised 60% of the Standard & Poor’s® 500 Index(a) (with dividends reinvested) and 40% of the Barclays U.S. Aggregate Bond Index(b) (with dividends reinvested) generated a cumulative total return of 4.89% during the same time period.
The S&P 500 Index and the Barclays U.S. Aggregate Bond Index generated cumulative total returns of 5.87% and 2.97%, respectively, during the same time period.
Importantly, since inception, the Fund’s overall annualized volatility was 4.30%, significantly less than the S&P® 500 Index’s annualized volatility of 13.10% during the same time period.
What economic and market factors most influenced the Fund during the Reporting Period?
During April 2012, optimism about Europe’s financial problems gave way to uncertainty and fear of a European Monetary Union (“EMU”) break-up. The changing political landscape unnerved markets. The French did not re-elect their president, who had worked closely with Germany’s chancellor since the start of the crisis, and elected a Socialist. The Dutch coalition government broke up. In addition, deepening concerns over the health of Spanish banks and Greece’s potential exit from the EMU weighed heavily on European markets, the euro and the financials sector, particularly large European banks. Despite further easing from the Bank of Japan, the yen continued to rise and pressured Japanese equities.
Meanwhile, economic data from the U.S. began to lose some momentum and called into question the U.S. recovery. The U.S. labor market, which had been reporting improvements, appeared to slow, as jobless claims increased for several weeks in a row, and deteriorated further in May. In addition, the initial first quarter U.S. Gross Domestic Product (“GDP”) estimate of 2.2% was lower than expected and was subsequently revised down to 1.9%. However, housing market data showed some signs of stabilization, and consumer confidence offered mixed signals.
In May, global equity markets declined. Investors sought relative safety in less risky assets, leading to a strong rally in bonds for the month. Disappointing economic reports from faster growing regions of the world renewed fears of a global economic slowdown. The gloomy mood prevailed into June as Spain’s banking system required a bailout and Moody’s Investors Service downgraded 15 international banks. However, markets rallied on the last day of June on the announcement of some coordinated action by European leaders following summit talks.
Global equity and bond markets were up slightly in July as worries over the EMU’s stability, Greece’s restructuring efforts and disappointing quarterly corporate earnings tempered investors’ optimism about the potential for further stimulus from the U.S. Federal Reserve (the “Fed”) and the European Central Bank (“ECB”). The markets rose further during August, as the Fed and ECB
3
| (a) | The S&P 500 Index is the Standard & Poor’s 500 Composite Stock Prices Index of 500 stocks, an unmanaged index of common stock prices. The Index figures do not reflect any deduction for fees, expenses or taxes. It is not possible to invest directly in an unmanaged index. |
| (b) | The Barclays Aggregate Bond Index represents an unmanaged diversified portfolio of fixed income securities, including U.S. Treasuries, investment-grade corporate bonds, and mortgage-backed and asset-backed securities. The Index figures do not reflect any deduction for fees, expenses or taxes. It is not possible to invest directly in an unmanaged index. |
GOLDMAN SACHS VARIABLE INSURANCE TRUST GLOBAL MARKETS NAVIGATOR FUND
reaffirmed their commitments to pursue further quantitative easing if deemed necessary. Investor optimism, however, was offset somewhat by ongoing concerns over the European sovereign debt crisis and weak Eurozone macroeconomic data.
During September, global equity markets were broadly up, with investors moving into equities following bold moves by the central banks in the U.S., Europe and Japan. The Fed announced another round of quantitative easing, dubbed QE3, this time with no expiration date but with the explicit goal of reducing unemployment. The Fed also extended its policy of near-zero interest rates until at least mid-2015. The ECB pledged unlimited monetary support, bolstering the bond markets of troubled countries like Spain and Italy, while the Bank of Japan announced it would increase the size of its planned asset purchases by $160 billion. Global bonds rose modestly toward the end September on renewed signs of global economic weakness.
Global equity markets paused in October ahead of a tight U.S. presidential election race and a pending leadership change in China. Global bonds were modestly up as investors focused on the post-election “fiscal cliff” of tax increases and spending cuts in the U.S. and the potential downgrade of Spanish government debt to junk status.
In November, global bonds were down. However, a number of positive developments around the world boosted investor sentiment and sparked a global equity rally into the end of 2012. The U.S. equity market crept higher as election day preserved the status quo in the White House and Congress, even as the fiscal cliff drew nearer. Housing starts and measures of employment improved, and manufacturing and non-manufacturing surveys showed expansion in the economy. In December, further clarification from the Fed, tying its low interest rate policy to the condition that unemployment drop to 6.5% or lower, helped to offset increasing worries about the then-looming fiscal cliff. Meanwhile, approval for Spain’s plan to restructure its banks and an agreement among finance ministers to reschedule some of Greece’s debt and release aid to the country lifted European equity markets late in 2012. The Japanese equity market rose sharply into year-end on hopes that the newly elected prime minister would focus on weakening the yen and establishing an inflation target. Indeed, the yen weakened notably against the U.S. dollar late in 2012, which drove strong returns in the local Japanese equity market, because it was perceived as good for Japan’s export-oriented economy. A rising yen tends to reduce equity returns expressed in U.S. dollars. Lastly, improving economic data from China and the U.S. late in 2012 improved sentiment on the global economy and lifted the broad global equity markets.
What key factors were responsible for the Fund’s performance during the Reporting Period?
The Fund seeks to achieve its objective by investing in financial instruments that provide exposure to the various underlying global equity and fixed income indices that comprise the GS Global Markets Navigator Index. Using a momentum-based methodology, the Fund strives to manage risk and hedge this with “potential” in changing market environments.
Momentum investing seeks growth of capital by gaining exposure to asset classes that have exhibited trends in price performance over selected time periods. In managing the Fund, we use a methodology that evaluates historical three-, six- and nine-month returns, volatilities and correlations across a range of nine global asset classes. Represented by indices, these asset classes include, within the equities category, the U.S. large cap, Europe, Asia, emerging markets, the U.K. and small-cap stocks. Within the fixed income category, the Fund may allocate assets to the U.S., European and Japanese fixed income securities. The analysis of these asset classes drives the aggregate allocations of the Fund over time. We believe market price momentum — either positive or negative — has significant predictive power.
During the Reporting Period, the Fund’s allocation to Japanese equities detracted from its relative returns, most significantly during April and May 2012. Its exposure to U.S. small-cap equities also hampered relative performance, particularly during May.
On the positive side, the Fund benefited from its allocations to European equities during the third and fourth quarters of 2012, its exposure to U.S. large-cap equities during the third quarter and its exposure to emerging markets equities in the fourth quarter. The Fund’s allocations to U.S. Treasury securities and German Bunds also contributed positively, especially near the beginning of the Reporting Period.
How did volatility affect the Fund during the Reporting Period?
As part of our investment approach, we seek to mitigate the Fund’s volatility. As mentioned earlier, during the Reporting Period, the Fund’s actual volatility (annualized, using daily returns) was 4.30% versus the S&P 500® Index’s annualized volatility of 13.10%.
How was the Fund positioned during the Reporting Period?
The Fund’s allocation to fixed income increased slightly during the month of May 2012 driven by the strong momentum of the asset class. In May, we shifted the Fund away from the declining equity markets, specifically in Europe. The Fund maintained
4
GOLDMAN SACHS VARIABLE INSURANCE TRUST GLOBAL MARKETS NAVIGATOR FUND
exposure to U.S. and Japanese equities largely based on the attractive returns these asset classes had seen overall during the first several months of 2012. In June, the Fund’s allocation to Japanese stocks was reduced to zero. In July, we increased the Fund’s allocation to U.S. fixed income because of the strong momentum of that asset class. At the same time, the Fund maintained its exposure to the U.S. equity market. In addition, we chose not to add exposure to European equities because of their weak momentum.
During August, we increased the Fund’s allocation to German Bunds as a result of strong momentum and low volatility. In addition, because of persistently benign volatility and modestly strong momentum in U.S. stocks, we maintained the Fund’s exposure to the U.S. equity market. In September, we increased the Fund’s allocation to European and U.S. small-cap equities in response to strong momentum and low volatility in the global equity markets. At the same time, we further increased the Fund’s allocation to German Bunds and reduced its exposure to U.S. Treasury securities. Near the end of the month, we decreased the Fund’s allocation to equities, including European stocks and U.S. large-cap and small-cap stocks. We also increased the Fund’s allocation to U.S. Treasury securities.
In October, we increased the Fund’s allocations to European equities and U.S. Treasury securities. In addition, we further reduced the Fund’s exposure to U.S. small-cap and large-cap equities. We also reduced the Fund’s allocation to U.K. equities. During November, because of strong momentum and relatively low volatility across the global equity markets, we increased the Fund’s allocations to equities, adding to its exposure to U.S. large-cap stocks and European, U.K., Japanese and emerging markets equities. At the same time, we reduced the Fund’s exposure to U.S. Treasury securities, maintained its allocation to German Bunds and modestly increased its exposure to Japanese government bonds.
In December, we increased the Fund’s allocation to U.S. Treasury securities in response to growing equity market volatility. We also decreased the Fund’s allocations to German Bunds and Japanese government bonds and increased its exposure to emerging markets and Japanese equities. In addition, we reduced the Fund’s allocation to U.S. large-cap equities to zero as a result of their relatively poor momentum.
How did the Fund use derivatives and similar instruments during the Reporting Period?
During the Reporting Period, the Fund used exchange-traded index futures contracts to gain exposure to U.S. large-cap and small-cap equities and to non-U.S. developed market equities, including those in Europe and Japan, as well as to gain exposure to U.S. and non-U.S. fixed income.
What is the Fund’s tactical asset allocation view and strategy for the months ahead?
At the end of the Reporting Period, the Fund had allocations to European, Japanese and emerging markets equities. It also had allocations to German Bunds and U.S. Treasury securities.
Going forward, we intend to position the Fund to provide exposure to price momentum from among nine underlying asset classes, while dynamically managing the volatility, or risk, of the overall portfolio. When volatility increases, our goal is to preserve capital by moving the Fund into less volatile assets such as fixed income. When we believe the financial markets have become more stable, we expect to allocate a greater portion of the Fund’s assets to equities. There is no guarantee that the Fund’s dynamic management strategy will cause it to achieve its investment objective.
5
FUND BASICS
Global Markets Navigator Fund
as of December 31, 2012
STANDARDIZED TOTAL RETURNS1
| For the period ended 12/31/12 | One Year | Five Years | Ten Years | Since Inception | Inception Date | |||||||||||||
| Service | N/A | N/A | N/A | 3.74 | % | 4/16/12 | ||||||||||||
| 1 | Standardized Total Returns are average annual total returns or cumulative total returns (only if the performance period is one year or less) as of the most recent calendar quarter-end. They assume reinvestment of all distributions at net asset value (“NAV”). Because Service Shares do not involve a sales charge, such a charge is not applied to their Standardized Total Returns. |
Total return figures in the above chart represent past performance and do not indicate future results, which will vary. The investment return and principal value of an investment will fluctuate and, therefore, an investor’s shares, when redeemed, may be worth more or less than their original cost. Current performance may be lower or higher than the total return figures in the above chart. Please visit www.goldmansachsfunds.com/vit to obtain the most recent month-end returns. Performance reflects fee waivers and/or expense limitations in effect. In their absence, performance would be reduced.
EXPENSE RATIOS2
| Net Expense Ratio (Current) | Gross Expense Ratio (Before Waivers) | |||||||
| Service | 1.09 | % | 1.41 | % | ||||
| 2 | The expense ratios of the Fund, both current (net of applicable fee waivers and/or expense limitations) and before waivers (gross of applicable fee waivers and/or expense limitations), are as set forth above according to the most recent publicly available Prospectus for the Fund and may differ from the expense ratios disclosed in the Financial Highlights in this report. The Fund’s waivers and/or expense limitations will remain in place through at least April 9, 2013, and prior to such date the investment adviser may not terminate the arrangements without the approval of the Fund’s Board of Trustees. If these arrangements are discontinued in the future, the expense ratios may change without shareholder approval. |
6
FUND BASICS
FUND COMPOSITION3
As of December 31, 2012
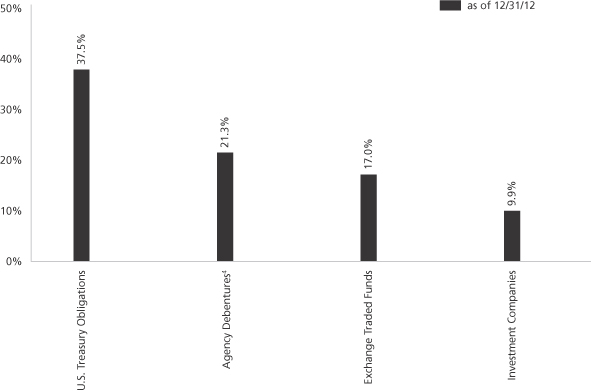
| 3 | The percentage shown for each investment category reflects the value of investments in that category as a percentage of net assets. Figures in the above graph may not sum to 100% due to the exclusion of other assets and liabilities. Underlying sector allocations of exchange traded funds (“ETFs”) held by the Fund are not reflected in the graph above. Consequently, the Fund’s overall sector allocations may differ from the percentages contained in the graph above. The graph depicts the Fund’s investments but may not represent the Fund’s market exposure due to the exclusion of certain derivatives, if any, as listed in the Additional Investment Information section of the Schedule of Investments. |
| 4 | “Agency Debentures” include agency securities offered by companies such as Federal Home Loan Bank and Federal Home Loan Mortgage Corporation, which operate under a government charter. While they are required to report to a government regulator, their assets are not explicitly guaranteed by the government and they otherwise operate like any other publicly traded company. |
7
GOLDMAN SACHS VARIABLE INSURANCE TRUST GLOBAL MARKETS NAVIGATOR FUND
Performance Summary
December 31, 2012
The following graph shows the value, as of December 31, 2012, of a $10,000 investment made on April 16, 2012 in Service Shares at NAV. For comparative purposes, the performance of the Fund’s benchmarks, GS Global Markets Navigator Index, S&P 500 Index (with dividends reinvested) and the Barclays U.S. Aggregate Bond Index is shown. This performance data represents past performance and should not be considered indicative of future performance, which will fluctuate with changes in market conditions. These performance fluctuations will cause an investor’s shares, when redeemed, to be worth more or less than their original cost. Performance reflects Fund level expenses but does not reflect fees and expenses associated with any variable annuity contract or variable life insurance policy that uses the Fund as an investment option for any contract or policy. Had performance reflected all of those fees and expenses, performance would have been reduced. Performance also would have been reduced had expense limitations not been in effect. In addition to the investment adviser’s decisions regarding issuer/industry investment selection and allocation, other factors may affect Fund performance. These factors include, but are not limited to, Fund operating fees and expenses, portfolio turnover, and subscription and redemption cash flows affecting the Fund.
Global Markets Navigator Fund’s Lifetime Performance
Performance of a $10,000 investment, with distributions reinvested, from April 16, 2012 through December 31, 2012.
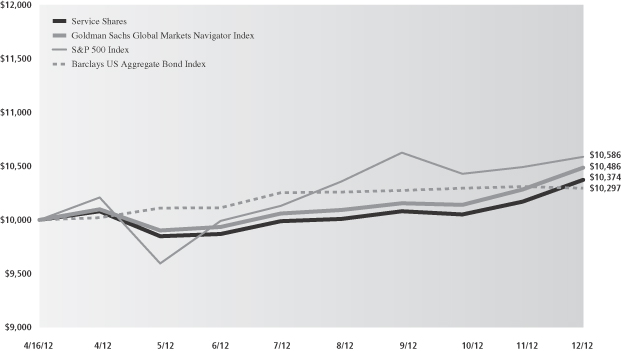
| Cumulative Total Return through December 31, 2012 | Since Inception | |
Service (Commenced April 16, 2012) | 3.74% |
8
GOLDMAN SACHS VARIABLE INSURANCE TRUST GLOBAL MARKETS NAVIGATOR FUND
Schedule of Investments
December 31, 2012
| Principal Amount | Interest Rate | Maturity Date | Value | |||||||||||
| Agency Debentures(a) – 21.3% | ||||||||||||||
| FHLB |
| ||||||||||||
| $2,509,000 | 0.000 | % | 03/22/13 | $ | 2,508,724 | |||||||||
| FHLMC |
| ||||||||||||
| 1,341,000 | 0.000 | 02/28/13 | 1,340,915 | |||||||||||
| 1,695,000 | 0.000 | 03/25/13 | 1,694,807 | |||||||||||
|
| |||||||||||||
| TOTAL AGENCY DEBENTURES | ||||||||||||||
| (Cost $5,543,440) | $ | 5,544,446 | ||||||||||||
|
| |||||||||||||
| Shares | Description | Values | ||||||||||||
| Exchange Traded Fund – 17.0% |
| ||||||||||||
| 98,944 | | Vanguard FTSE Emerging Markets | | $4,405,976 | ||||||||||
| (Cost $4,178,602) | ||||||||||||||
|
| |||||||||||||
| Shares | Rate | Value | ||||||||||||
| Investment Company(b) – 9.9% | ||||||||||||||
| Goldman Sachs Financial Square Government Fund — | | ||||||||||||
| 2,562,496 | 0.042% | $ | 2,562,496 | |||||||||||
| (Cost $2,562,496) | ||||||||||||||
|
| |||||||||||||
| Principal Amount | Interest Rate | Maturity Date | Value | |||||||||||
| U.S. Treasury Obligation – 37.5% | ||||||||||||||
| United States Treasury Notes |
| ||||||||||||
| $8,600,000 | 3.125 | % | 05/15/21 | $ | 9,752,057 | |||||||||
| (Cost $9,779,296) | ||||||||||||||
|
| |||||||||||||
| TOTAL INVESTMENTS – 85.7% | ||||||||||||||
| (Cost $22,063,834) | $ | 22,264,975 | ||||||||||||
|
| |||||||||||||
| OTHER ASSETS IN EXCESS OF | | 3,724,601 | |||||||||||
|
| |||||||||||||
| NET ASSETS – 100.0% |
| $ | 25,989,576 | ||||||||||
|
| |||||||||||||
| The percentage shown for each investment category reflects the value of investments in that category as a percentage of net assets. | ||
| (a) | Issued with a zero coupon. Income is recognized through the accretion of discount. | |
| (b) | Represents an affiliated issuer. | |
| Investment Abbreviations: | ||
| FHLB | — Federal Home Loan Bank | |
| FHLMC | — Federal Home Loan Mortgage Corp. | |
ADDITIONAL INVESTMENT INFORMATION
FUTURES CONTRACTS — At December 31, 2012, the Fund had the following futures contracts:
| Type | Number of Contracts Long (Short) | Expiration Date | Current Value | Unrealized Gain (Loss) | ||||||||||
| EURO STOXX 50 Index | 191 | March 2013 | $ | 6,592,688 | $ | (44,978 | ) | |||||||
| Euro-Bund | 10 | March 2013 | 1,922,375 | 10,887 | ||||||||||
| FTSE 100 Index | 2 | March 2013 | 189,996 | (1,510 | ) | |||||||||
TSE TOPIX Index | 22 | March 2013 | 2,187,684 | 185,236 | ||||||||||
| TOTAL | $ | 149,635 | ||||||||||||
| The accompanying notes are an integral part of these financial statements. | 9 |
GOLDMAN SACHS VARIABLE INSURANCE TRUST GLOBAL MARKETS NAVIGATOR FUND
Statement of Assets and Liabilities
December 31, 2012
| Assets: | ||||
Investments of unaffiliated issuers, at value (cost $19,501,338) | $ | 19,702,479 | ||
Investments of affiliated issuer, at value which equals cost | 2,562,496 | |||
Cash | 3,108,876 | |||
Receivables: | ||||
Futures variation margin(a) | 570,253 | |||
Fund shares sold | 173,020 | |||
Dividends and interest | 34,987 | |||
Reimbursement from investment adviser | 13,461 | |||
Deferred offering costs | 65,817 | |||
| Total assets | 26,231,389 | |||
| Liabilities: | ||||
Payables: | ||||
Investments purchased | 143,401 | |||
Fund shares redeemed | 40,956 | |||
Amounts owed to affiliates | 21,116 | |||
Accrued expenses | 36,340 | |||
| Total liabilities | 241,813 | |||
| Net Assets: | ||||
Paid-in capital | 25,225,874 | |||
Undistributed net investment income | 57,155 | |||
Net realized gain | 361,275 | |||
Net unrealized gain | 345,272 | |||
| NET ASSETS | $ | 25,989,576 | ||
Shares of beneficial interest outstanding $0.001 par value (unlimited shares authorized) | 2,509,662 | |||
Net asset value, offering and redemption price per share | $10.36 | |||
(a) Includes cash on deposit with counterparty relating to initial margin requirements on future transactions of $573,106.
| 10 | The accompanying notes are an integral part of these financial statements. |
GOLDMAN SACHS VARIABLE INSURANCE TRUST GLOBAL MARKETS NAVIGATOR FUND
Statement of Operations
For the Period Ended December 31, 2012(a)
| Investment income: | ||||
Dividends — unaffiliated issuers | $ | 58,426 | ||
Interest | 40,824 | |||
Dividends — affiliated issuer | 365 | |||
| Total investment income | 99,615 | |||
| Expenses: | ||||
Amortization of offering costs | 109,693 | |||
Professional fees | 89,084 | |||
Management fees | 59,840 | |||
Printing and mailing costs | 22,473 | |||
Distribution and Service fees | 18,937 | |||
Organization costs | 12,000 | |||
Trustee fees | 11,011 | |||
Custody and accounting fees | 10,820 | |||
Transfer Agent fees | 1,515 | |||
Other | 1,369 | |||
| Total expenses | 336,742 | |||
Less — expense reductions | (257,511 | ) | ||
| Net expenses | 79,231 | |||
| NET INVESTMENT INCOME | 20,384 | |||
| Realized and unrealized gain (loss): | ||||
Net realized gain from: | ||||
Investments — unaffiliated issuers | 55,860 | |||
Futures contracts | 371,899 | |||
Foreign currency transactions | 3,234 | |||
Net unrealized gain (loss) on: | ||||
Investments — unaffiliated issuers | 201,141 | |||
Futures contracts | 149,635 | |||
Foreign currency translation | (5,504 | ) | ||
| Net realized and unrealized gain | 776,265 | |||
| NET INCREASE IN NET ASSETS RESULTING FROM OPERATIONS | $ | 796,649 | ||
(a) Commenced operations on April 16, 2012.
| The accompanying notes are an integral part of these financial statements. | 11 |
GOLDMAN SACHS VARIABLE INSURANCE TRUST GLOBAL MARKETS NAVIGATOR FUND
Statement of Changes in Net Assets
For the Period Ended December 31, 2012(a) | ||||
| From operations: | ||||
Net investment income | $ | 20,384 | ||
Net realized gain | 430,993 | |||
Net unrealized gain | 345,272 | |||
| Net increase in net assets resulting from operations | 796,649 | |||
| Distributions to shareholders: | ||||
From net realized gains | (33,093 | ) | ||
| From share transactions: | ||||
Proceeds from sales of shares | 29,921,805 | |||
Reinvestment of distributions | 33,093 | |||
Cost of shares redeemed | (4,728,878 | ) | ||
| Net increase in net assets resulting from share transactions | 25,226,020 | |||
| TOTAL INCREASE | 25,989,576 | |||
| Net assets: | ||||
Beginning of period | — | |||
End of period | $ | 25,989,576 | ||
| Undistributed net investment income | $ | 57,155 | ||
| Summary of share transactions: | ||||
Shares sold | 2,978,079 | |||
Shares issued on reinvestment of distributions | 3,229 | |||
Shares redeemed | (471,646 | ) | ||
| NET INCREASE | 2,509,662 | |||
(a) Commenced operations on April 16, 2012.
| 12 | The accompanying notes are an integral part of these financial statements. |
GOLDMAN SACHS VARIABLE INSURANCE TRUST GLOBAL MARKETS NAVIGATOR FUND
Financial Highlights
Selected Data for a Share Outstanding Throughout the Period
| Income from investment operations | ||||||||||||||||||||||||||||||||||||||||||||||||
| Year | Net asset value, beginning of period | Net investment income(a) | Net realized and unrealized gain | Total from investment operations | Distributions from net realized gains | Net asset | Total return(b) | Net assets, end of period (in 000s) | Ratio of net expenses to average net assets(c) | Ratio of total expenses to average net assets(c) | Ratio of net investment income to average net assets | Portfolio turnover rate(d) | ||||||||||||||||||||||||||||||||||||
FOR THE PERIOD ENDED DECEMBER 31, | ||||||||||||||||||||||||||||||||||||||||||||||||
2012 (Commenced April 16, 2012) | $ | 10.00 | $ | 0.02 | $ | 0.35 | $ | 0.37 | $ | (0.01 | ) | $ | 10.36 | 3.74 | % | $ | 25,990 | 1.04 | %(e) | 4.21 | %(e) | 0.27 | %(e) | 300 | % | |||||||||||||||||||||||
| (a) | Calculated based on the average shares outstanding methodology. |
| (b) | Assumes investment at the net asset value at the beginning of the period, reinvestment of all distributions, and a complete redemption of the investment at the net asset value at the end of the period. Total returns for periods less than one full year are not annualized. |
| (c) | Expense ratios exclude expenses of the Underlying Funds in which the Fund invests. |
| (d) | The Fund’s portfolio turnover rate is calculated in accordance with regulatory requirements, without regard to transactions involving short term investments and certain derivatives. If such transactions were included, the Fund’s portfolio turnover rate may be higher. |
| (e) | Annualized. |
| The accompanying notes are an integral part of these financial statements. | 13 |
GOLDMAN SACHS VARIABLE INSURANCE TRUST GLOBAL MARKETS NAVIGATOR FUND
Notes to Financial Statements
December 31, 2012
1. ORGANIZATION
Goldman Sachs Variable Insurance Trust (the “Trust” or “VIT”) is a Delaware statutory trust registered under the Investment Company Act of 1940, as amended (the “Act”), as an open-end management investment company. The Trust includes the Goldman Sachs Global Markets Navigator Fund (the “Fund”). The Fund is a non-diversified portfolio under the Act offering one class of shares — Service Shares. Shares of the Trust are offered to separate accounts of participating life insurance companies for the purpose of funding variable annuity contracts and variable life insurance policies. The Fund commenced operations on April 16, 2012.
Goldman Sachs Asset Management, L.P. (“GSAM”), an affiliate of Goldman, Sachs & Co. (“Goldman Sachs”), serves as investment adviser to the Fund pursuant to a management agreement (the “Agreement”) with the Trust.
2. SIGNIFICANT ACCOUNTING POLICIES
The financial statements have been prepared in accordance with accounting principles generally accepted in the United States of America (“GAAP”) and require management to make estimates and assumptions that may affect the reported amounts and disclosures. Actual results may differ from those estimates and assumptions.
A. Investment Valuation — The Fund’s valuation policy is to value investments at fair value.
B. Investment Income and Investments — Investment income includes interest income and dividend income, net of any foreign withholding taxes, less any amounts reclaimable. Interest income is accrued daily and adjusted for amortization of premiums and accretion of discounts. Dividend income is recognized on ex-dividend date or, for certain foreign securities, as soon as such information is obtained subsequent to the ex-dividend date. Investment transactions are reflected on trade date. Realized gains and losses are calculated using identified cost. Investment transactions are recorded on the following business day for daily net asset value (“NAV”) calculations. Any foreign capital gains tax is accrued daily based upon net unrealized gains, and is payable upon sale of such investments.
For derivative contracts, realized gains and losses are recorded upon settlement of the contract. Upfront payments on swaps are recognized over the contract’s term/event as realized gains or losses, with the exception of forward starting interest rate swaps whose realized gains or losses are recognized from the effective start date. For securities with paydown provisions, principal payments received are treated as a proportionate reduction to the cost basis of the securities and excess amounts are recorded as gains. For treasury inflation protected securities (“TIPS”), adjustments to principal due to inflation/deflation are reflected as increases/decreases to interest income with a corresponding adjustment to cost.
C. Expenses — Expenses incurred by the Funds, which may not specifically relate to the Funds, may be shared with other registered investment companies having management agreements with GSAM or its affiliates, as appropriate. These expenses are allocated to the Funds on a straight-line and/or pro-rata basis depending upon the nature of the expenses and are accrued daily.
D. Offering and Organization Costs — Offering costs paid in connection with the offering of shares of the Fund are amortized on a straight-line basis over 12 months from the date of commencement of operations. Organization costs paid in connection with the organization of the Fund were expensed on the first day of operations.
E. Federal Taxes and Distributions to Shareholders — It is the Fund’s policy to comply with the requirements of the Internal Revenue Code of 1986, as amended (the “Code”), applicable to regulated investment companies (mutual funds) and to distribute each year substantially all of its investment company taxable income and capital gains to its shareholders. Accordingly, the Fund is not required to make any provisions for the payment of federal income tax. Distributions to shareholders are recorded on the ex-dividend date. Income and capital gains distributions, if any, are declared and paid annually.
14
GOLDMAN SACHS VARIABLE INSURANCE TRUST GLOBAL MARKETS NAVIGATOR FUND
2. SIGNIFICANT ACCOUNTING POLICIES (continued)
Net capital losses are carried forward to future fiscal years and may be used to the extent allowed by the Code to offset any future capital gains. Utilization of capital loss carryforwards will reduce the requirement of future capital gains distributions.
Under the Regulated Investment Company Modernization Act of 2010, the Fund is permitted to carry forward capital losses incurred in taxable years for an unlimited period. Capital losses that are carried forward will retain their character as either short-term or long term capital losses rather than being considered all short-term as under previous law.
The characterization of distributions to shareholders for financial reporting purposes is determined in accordance with federal income tax rules, which may differ from GAAP. The source of the Fund’s distributions may be shown in the accompanying financial statements as either from net investment income, net realized gain or capital. Certain components of the Fund’s net assets on the Statement of Assets and Liabilities reflect permanent GAAP/tax differences based on the appropriate tax character.
F. Foreign Currency Translation — The accounting records and reporting currency of the Fund are maintained in United States (“U.S.”) dollars. Assets and liabilities denominated in foreign currencies are translated into U.S. dollars using the current exchange rates at the close of each business day. The effect of changes in foreign currency exchange rates on investments is included within net realized and unrealized gain (loss) on investments. Changes in the value of other assets and liabilities as a result of fluctuations in foreign exchange rates are included in the Statement of Operations within net change in unrealized gain (loss) on foreign currency transactions. Transactions denominated in foreign currencies are translated into U.S. dollars on the date the transaction occurred, the effects of which are included within net realized gain (loss) on foreign currency transactions.
3. INVESTMENTS AND FAIR VALUE MEASUREMENTS
The fair value of a financial instrument is the amount that would be received to sell an asset or paid to transfer a liability in an orderly transaction between market participants at the measurement date (i.e., the exit price). GAAP establishes a fair value hierarchy that prioritizes the inputs to valuation techniques used to measure fair value. The hierarchy gives the highest priority to unadjusted quoted prices in active markets for identical assets or liabilities (Level 1 measurements) and the lowest priority to unobservable inputs (Level 3 measurements). The levels used for classifying investments are not necessarily an indication of the risk associated with investing in these investments. The three levels of the fair value hierarchy are described below:
Level 1 — Unadjusted quoted prices in active markets that are accessible at the measurement date for identical, unrestricted assets or liabilities;
Level 2 — Quoted prices in markets that are not active or financial instruments for which significant inputs are observable (including, but not limited to, quoted prices for similar investments, interest rates, foreign exchange rates, volatility and credit spreads), either directly or indirectly;
Level 3 — Prices or valuations that require significant unobservable inputs (including GSAM’s assumptions in determining fair value measurement).
The Trustees have adopted Valuation Procedures that govern the valuation of the portfolio investments held by the Fund, including investments for which market quotations are not readily available. The Trustees have delegated to GSAM day-to-day responsibility for implementing and maintaining internal controls and procedures related to the valuation of the Fund’s portfolio investment. To assess the continuing appropriateness of pricing sources and methodologies, GSAM regularly performs price verification procedures and issues challenges as necessary to third party pricing vendors or brokers, and any differences are reviewed in accordance with the Valuation Procedures.
15
GOLDMAN SACHS VARIABLE INSURANCE TRUST GLOBAL MARKETS NAVIGATOR FUND
Notes to Financial Statements (continued)
December 31, 2012
3. INVESTMENTS AND FAIR VALUE MEASUREMENTS (continued)
A. Level 1 and Level 2 Fair Value Investments — The valuation techniques and significant inputs used in determining the fair values for investments classified as Level 1 and Level 2 are as follows:
Equity Securities — Equity securities and investment companies traded on a U.S. securities exchange or the NASDAQ system, or those located on certain foreign exchanges, including but not limited to the Americas, are valued daily at their last sale price or official closing price on the principal exchange or system on which they are traded. If no sale occurs, equity securities and exchange traded investment companies are valued at the last bid price for long positions and at the last ask price for short positions. Investments in investment companies (other than those that are exchange traded) are valued at the NAV on the valuation date. To the extent these investments are actively traded, they are classified as Level 1 of the fair value hierarchy.
Unlisted equity securities for which market quotations are available are valued at the last sale price on the valuation date, or if no sale occurs, at the last bid price. Securities traded on certain foreign securities exchanges are valued daily at fair value determined by an independent fair value service (if available) under valuation procedures approved by the trustees and consistent with applicable regulatory guidance. The independent fair value service takes into account multiple factors including, but not limited to, movements in the securities markets, certain depositary receipts, futures contracts and foreign currency exchange rates that have occurred subsequent to the close of the foreign securities exchange. Investments applying these valuation adjustments are classified as Level 2 of the fair value hierarchy.
Debt Securities — Debt securities for which market quotations are readily available are valued daily on the basis of quotations supplied by dealers or an independent pricing service approved by the trustees. The pricing services may use valuation models or matrix pricing, which consider: (i) yield or price with respect to bonds that are considered comparable in characteristics such as rating, interest rate and maturity date or (ii) quotations from securities dealers to determine current value. Short-term debt obligations that mature in sixty days or less and that do not exhibit signs of credit deterioration are valued at amortized cost, which approximates fair value. With the exception of treasury securities, which are generally classified as Level 1, these investments are generally classified as Level 2 of the fair value hierarchy.
Derivative contracts — A derivative is an instrument whose value is derived from underlying assets, indices, reference rates or a combination of these factors.
Exchange-traded derivatives, including futures contracts, typically fall within Level 1 of the fair value hierarchy. Over-the-counter (“OTC”) derivatives are valued using market transactions and other market evidence, including market-based inputs to models, calibration to market-clearing transactions, broker or dealer quotations, or other alternative pricing sources. Where models are used, the selection of a particular model to value an OTC derivative depends upon the contractual terms of, and specific risks inherent in, the instrument, as well as the availability of pricing information in the market. Valuation models require a variety of inputs, including contractual terms, market prices, yield curves, credit curves, measures of volatility, voluntary and involuntary prepayment rates, loss severity rates and correlations of such inputs. For OTC derivatives that trade in liquid markets, model inputs can generally be verified and model selection does not involve significant management judgment. OTC derivatives are classified within Level 2 of the fair value hierarchy when significant inputs are corroborated by market evidence.
i. Futures Contracts — Futures contracts are contracts to buy or sell a standardized quantity of a specified commodity or security and are valued based on exchanged settlement prices or independent market quotes. Futures contracts are valued at the last settlement price, or in the absence of a sale, the last bid price for long positions and at the last ask price for short positions, at the end of each day on the board of trade or exchange upon which they are traded. Upon entering into a futures contract, the Fund deposits cash or securities in an account on behalf of the broker in an amount sufficient to meet the initial margin requirement. Subsequent payments are made or received by the Fund equal to the daily change in the contract value and are recorded as variation margin receivable or payable with a corresponding offset to unrealized gains or losses.
16
GOLDMAN SACHS VARIABLE INSURANCE TRUST GLOBAL MARKETS NAVIGATOR FUND
3. INVESTMENTS AND FAIR VALUE MEASUREMENTS (continued)
B. Level 3 Fair Value Investments — The valuation techniques and significant inputs used in determining the fair values for investments classified as Level 3 are as follows:
To the extent that the aforementioned significant inputs are unobservable, or if quotations are not readily available, or if GSAM believes that such quotations do not accurately reflect fair value, the fair value of the Fund’s investments may be determined under valuation procedures approved by the trustees. GSAM, consistent with its procedures and applicable regulatory guidance, may make an adjustment to the most recent valuation prices of either domestic or foreign securities in light of significant events to reflect what it believes to be the fair value of the securities at the time of determining a Fund’s NAV. Significant events which could affect a large number of securities in a particular market may include, but are not limited to: significant fluctuations in U.S. or foreign markets; market dislocations; market disruptions; or unscheduled market closings. Significant events which could also affect a single issuer may include, but are not limited to: corporate actions such as reorganizations, mergers and buy-outs; ratings downgrades; and bankruptcies.
C. Fair Value Hierarchy — The following is a summary of the Fund’s investments and derivatives classified in the fair value hierarchy as of December 31, 2012:
| Investment Type | Level 1 | Level 2 | Level 3 | |||||||||
| Assets | ||||||||||||
| Fixed Income | ||||||||||||
Agency Debentures | $ | — | $ | 5,544,446 | $ | — | ||||||
U.S. Treasury Obligations and/or Other U.S. Government Agencies | 9,752,057 | — | — | |||||||||
Exchange Traded Fund | 4,405,976 | — | — | |||||||||
Investment Company | 2,562,496 | — | — | |||||||||
| Total | $ | 16,720,529 | $ | 5,544,446 | $ | — | ||||||
| Derivative Type | ||||||||||||
| Assets(a) | ||||||||||||
| Futures Contracts | $ | 196,123 | $ | — | $ | — | ||||||
| Liabilities(a) | ||||||||||||
| Futures Contracts | $ | (46,488 | ) | $ | — | $ | — | |||||
| (a) | Amount shown represents unrealized gain (loss) at period end. |
For further information regarding security characteristics, see the Schedule of Investments.
17
GOLDMAN SACHS VARIABLE INSURANCE TRUST GLOBAL MARKETS NAVIGATOR FUND
Notes to Financial Statements (continued)
December 31, 2012
4. INVESTMENTS IN DERIVATIVES
The following table sets forth, by certain risk types, the gross value of derivative contracts as of December 31, 2012. These instruments were used to meet the Fund’s investment objectives and to obtain and/or manage exposure related to the risks below. The values in the table below exclude the effects of cash collateral received or posted pursuant to these derivative contracts, and therefore are not representative of the Fund’s net exposure.
| Risk | Statement of Assets and Liabilities | Assets(a) | Statement of Assets and Liabilities | Liabilities(a) | ||||||||
| Equity | Unrealized gain on futures variation margin | $ | 185,236 | Unrealized loss on futures variation margin | $ | (46,488 | ) | |||||
| Interest Rate | Unrealized gain on futures variation margin | 10,887 | — | — | ||||||||
| Total | $ | 196,123 | $ | (46,488 | ) | |||||||
| (a) | Includes unrealized gain (loss) on futures contracts described in the Additional Investment Information section of the Schedule of Investments. Only current day’s variation margin is reported within the Statement of Assets and Liabilities. |
The following table sets forth, by certain risk types, the Fund’s gains (losses) related to these derivatives and their indicative volumes for the period ended December 31, 2012. These gains (losses) should be considered in the context that these derivative contracts may have been executed to economically hedge certain investments, and accordingly, certain gains (losses) on such derivative contracts may offset certain (losses) gains attributable to investments. These gains (losses) are included in “Net realized gain (loss)” or “Net change in unrealized gain (loss)” on the Statement of Operations:
| Risk | Statement of Operations | Net Realized Gain (Loss) | Net Change in Unrealized Gain (Loss) | Average Number of Contracts(a) | ||||||||||||
Equity | Net realized gain (loss) from futures contracts/Net change in unrealized gain (loss) on futures contracts | $ | 322,920 | $ | 138,748 | 64 | ||||||||||
Interest Rate | Net realized gain (loss) from futures contracts/Net change in unrealized gain (loss) on futures contracts | 48,979 | 10,887 | 10 | ||||||||||||
| (a) | Average number of contracts is based on the average of month end balances for the period ended December 31, 2012. |
18
GOLDMAN SACHS VARIABLE INSURANCE TRUST GLOBAL MARKETS NAVIGATOR FUND
5. AGREEMENTS AND AFFILIATED TRANSACTIONS
A. Management Agreement — Under the Agreement, GSAM manages the Fund, subject to the general supervision of the trustees.
As compensation for the services rendered pursuant to the Agreement, the assumption of the expenses related thereto and administration of the Fund’s business affairs, including providing facilities, GSAM is entitled to a management fee, accrued daily and paid monthly, equal to an annual percentage rate of the Fund’s average daily net assets.
For the period ended December 31, 2012, contractual and effective net management fees with GSAM were at the following rates:
| Contractual Management Fee Rate | ||||||||||||||||||||||
| First $1 billion | Next $1 billion | Next $3 billion | Next $3 billion | Over $8 billion | Effective Rate | |||||||||||||||||
| 0.79% | 0.71 | % | 0.68 | % | 0.66 | % | 0.65 | % | 0.79 | % | ||||||||||||
B. Distribution and Service Plan — The Trust, on behalf of the Service Shares of the Fund, has adopted a Distribution and Service Plan (the “Plan”). Under the Plan, Goldman Sachs, which serves as distributor (the “Distributor”), is entitled to a fee accrued daily and paid monthly for distribution services, which may then be paid by Goldman Sachs to authorized dealers, equal to, on an annual basis, 0.25% of the Fund’s average daily net assets attributable to Service Shares.
C. Transfer Agency Agreement — Goldman Sachs also serves as the transfer agent of the Fund for a fee pursuant to a Transfer Agency Agreement. The fees charged for such transfer agency services are accrued daily and paid monthly at an annual rate of 0.02% of the average daily net assets of the Fund.
D. Other Expense Agreements and Affiliated Transactions — GSAM has agreed to limit certain “Other Expense” of the Fund (excluding management fees, distribution and service fees, acquired fund fees and expenses, transfer agent fees and expenses, taxes, interest, brokerage fees, litigation, indemnification, shareholder meeting and other extraordinary expenses) to the extent such expenses exceed, on an annual basis, a percentage rate of the average daily net assets of the Fund. Such Other Expense reimbursements, if any, are accrued daily and paid monthly. In addition, the Fund is not obligated to reimburse GSAM for prior fiscal year expense reimbursements, if any. The Other Expense limitation as an annual percentage rate of average daily net assets for the Fund is 0.004%. These Other Expense reimbursements will remain in place through at least April 9, 2013, and prior to such date GSAM may not terminate the arrangements without the approval of the trustees. For the period ended December 31, 2012, GSAM reimbursed approximately $256,100 to the Fund. In addition, the Fund has entered into certain offset arrangements with the custodian and the transfer agent, which may result in a reduction of the Fund’s expenses and are received irrespective of the application of the “Other Expense” limitations described above. For the period ended December 31, 2012, custody fee credits were approximately $1,400.
As of December 31, 2012, the amounts owed to affiliates of the Fund were approximately $15,700, $5,000, and $400 for management, distribution and service, and transfer agent fees, respectively.
E. Other Transactions with Affiliates — The following table provides information about the investment in shares of a fund of which the Fund is an affiliate for the period ended December 31, 2012:
| Name of Affiliated Fund | Number of Shares Held Beginning of Period | Shares Bought | Shares Sold | Number of Shares Held End of Period | Value at End of Period | Dividend Income | ||||||||||||||||||
| Goldman Sachs Financial Square Government Fund | — | 2,855,136 | (292,640 | ) | 2,562,496 | $ | 2,562,496 | $ | 365 | |||||||||||||||
19
GOLDMAN SACHS VARIABLE INSURANCE TRUST GLOBAL MARKETS NAVIGATOR FUND
Notes to Financial Statements (continued)
December 31, 2012
6. PORTFOLIO SECURITIES TRANSACTIONS
The cost of purchases and proceeds from sales and maturities of long-term securities for the period ended December 31, 2012, were as follows:
| Purchases of U.S. Government and Agency Obligations | Purchases (Excluding U.S. Government and Agency Obligations) | Sales and Maturities of U.S. Government and Agency Obligations | Sales and Maturities (Excluding U.S. Government and Agency Obligations) | |||||||||||
| $22,927,056 | $ | 9,464,253 | $ | 13,096,510 | $ | 5,355,117 | ||||||||
7. TAX INFORMATION
The tax character of distributions paid during the period ended December 31, 2012 was as follows:
| Distributions paid from: | ||||
| Ordinary income | $ | 4,661 | ||
| Net long-term capital gains | 28,432 | |||
| Total taxable distributions | $ | 33,093 |
As of December 31, 2012, the components of accumulated earnings (losses) on a tax-basis were as follows:
| Undistributed ordinary income — net | $ | 422,565 | ||
| Undistributed long-term capital gains | 8,437 | |||
| Total undistributed earnings | $ | 431,002 | ||
| Unrealized gains — net | 332,700 | |||
| Total accumulated gains — net | $ | 763,702 |
As of December 31, 2012, the Fund’s aggregate security unrealized gains and losses based on cost for U.S. federal income tax purposes were as follows:
| Tax cost | $ | 22,077,921 | ||
| Gross unrealized gain | 228,380 | |||
| Gross unrealized loss | (41,326 | ) | ||
| Net unrealized security gain | $ | 187,054 | ||
| Net unrealized gain on other investments | 145,646 | |||
| Net unrealized gain | 332,700 |
20
GOLDMAN SACHS VARIABLE INSURANCE TRUST GLOBAL MARKETS NAVIGATOR FUND
7. TAX INFORMATION (continued)
The difference between GAAP-basis and tax-basis unrealized gains (losses) is attributable primarily to wash sales and net mark to market gains (losses) on regulated futures contracts.
In order to present certain components of the Fund’s capital accounts on a tax-basis, the Fund has reclassified $146 and $36,625 from paid-in capital and accumulated net realized gain, respectively, to undistributed net investment income. These reclassifications have no impact on the net asset value of the Fund and result primarily from the differences in the tax treatment of foreign currency transactions and certain non-deductible expenses.
GSAM has reviewed the Fund’s tax positions for all open tax years (the current and prior three years, as applicable) and has concluded that no provision for income tax is required in the Fund’s financial statements. Such open tax years remain subject to examination and adjustment by tax authorities.
8. OTHER RISKS
The Fund’s risks include, but are not limited to, the following:
Foreign Custody Risk — A Fund that invests in foreign securities may hold such securities and foreign currency with foreign banks, agents, and securities depositories appointed by the Fund’s custodian (each a “Foreign Custodian”). In some countries, Foreign Custodians may be subject to little or no regulatory oversight or independent evaluation of their operations. Further, the laws of certain countries may place limitations on a Fund’s ability to recover its assets if a Foreign Custodian enters into bankruptcy. Investments in emerging markets may be subject to greater custody risks than investments in more developed markets. Custody services in emerging market countries are often undeveloped and may be less regulated than in more developed countries, and thus may not afford the same level of investor protection as would apply in developed countries.
Shareholder Concentration Risk — Certain participating insurance companies, accounts, or Goldman Sachs affiliates may from time to time own (beneficially or of record) or control a significant percentage of the Fund’s shares. Redemptions by these entities of their holdings in the Fund may impact the Fund’s liquidity and NAV. These redemptions may also force the Fund to sell securities.
Investments in Other Investment Companies — As a shareholder of another investment company, including an exchange traded fund (“ETF”), a Fund will directly bear its proportionate share of any management fees and other expenses paid by such other investment companies, in addition to the fees and expenses regularly borne by the Fund. ETFs are subject to risks that do not apply to conventional mutual funds, including but not limited to the following: (i) the market price of the ETF’s shares may trade at a premium or a discount to their NAV; and (ii) and active trading market for an ETF’s shares may not develop or be maintained.
Liquidity Risk — The Fund may make investments that are illiquid or that may become less liquid in response to market developments or adverse investor perceptions. Illiquid investments may be more difficult to value. Liquidity risk may also refer to the risk that a Fund will not be able to pay redemption proceeds within the allowable time period because of unusual market conditions, an unusually high volume of redemption requests, or other reasons. To meet redemption requests, the Fund may be forced to sell investments at an unfavorable time and/or under unfavorable conditions.
21
GOLDMAN SACHS VARIABLE INSURANCE TRUST GLOBAL MARKETS NAVIGATOR FUND
Notes to Financial Statements (continued)
December 31, 2012
8. OTHER RISKS (continued)
Market and Credit Risks — In the normal course of business, the Fund trades financial instruments and enters into financial transactions where risk of potential loss exists due to changes in the market (market risk). Additionally, the Fund may also be exposed to credit risk in the event that an issuer fails to perform or that an institution or entity with which the Fund has unsettled or open transactions defaults.
Investing in foreign markets may involve special risks and considerations not typically associated with investing in the U.S. These risks include revaluation of currencies, high rates of inflation, repatriation restrictions on income and capital, and adverse political and economic developments. Moreover, securities issued in these markets may be less liquid, be subject to government ownership controls, have delayed settlements and their prices may be more volatile than those of comparable securities in the U.S.
Non-Diversification Risk — The Fund is non-diversified and is permitted to invest more of its assets in fewer issuers than “diversified” mutual funds. Thus, the Fund may be more susceptible to adverse developments affecting any single issuer held in its portfolio, and may be more susceptible to greater losses because of these developments.
Industry Concentration Risk — The Fund will not invest more than 25% of the value of its total assets in the securities of one or more issuers conducting their principal business activities in the same industry, except that, to the extent that an industry represents 20% or more of the Fund’s index at the time of investment, the Fund may invest up to 35% of its assets in that industry. Concentrating Fund investments in issuers conducting business in the same industry will subject the Fund to a greater risk of loss as a result of adverse economic, business or other developments affecting that industry than if its investments were not so concentrated.
9. INDEMNIFICATIONS
Under the Trust’s organizational documents, its trustees, officers, employees and agents are indemnified, to the extent permitted by the Act, against certain liabilities that may arise out of performance of their duties to the Fund. Additionally, in the course of business, the Fund enters into contracts that contain a variety of indemnification clauses. The Fund’s maximum exposure under these arrangements is unknown, as this would involve future claims that may be made against the Fund that have not yet occurred. However, GSAM believes the risk of loss under these arrangements to be remote.
22
GOLDMAN SACHS VARIABLE INSURANCE TRUST GLOBAL MARKETS NAVIGATOR FUND
10. OTHER MATTERS
Other Matters — As of January 1, 2013, GSAM is subject to registration as a commodity pool operator (CPO) under the Commodity Exchange Act with respect to the Fund. However, as a result of proposed rulemaking by the Commodity Futures Trading Commission (“CFTC”) that has not yet been adopted, GSAM is not yet subject to CFTC recordkeeping, reporting and disclosure requirements and the impact of these requirements, including their impact on the Fund’s financial statements, remains uncertain.
New Accounting Pronouncement — In December 2011, the Financial Accounting Standards Board issued an Accounting Standards Update (“ASU”) to enhance disclosures about financial instruments and derivative instruments that are subject to offsetting (“netting”) on the Statement of Assets and Liabilities. This information will enable users of the Fund’s financial statements to evaluate the effect or potential effect of netting arrangements on the Fund’s financial position. The ASU is effective for financial statements with fiscal years beginning on or after January 1, 2013, and interim periods within those fiscal years. At this time, GSAM is evaluating the implications of these changes on the financial statements.
11. SUBSEQUENT EVENTS
Subsequent events after the Statement of Assets and Liabilities date have been evaluated through the date the financial statements were issued. GSAM has concluded that there is no impact requiring adjustment or disclosure in the financial statements.
23
Report of Independent Registered Public Accounting Firm
To the Board of Trustees and Shareholders of
Goldman Sachs Variable Insurance Trust — Goldman Sachs Global Markets Navigator Fund:
In our opinion, the accompanying statement of assets and liabilities, including the schedule of investments, and the related statements of operations and of changes in net assets and the financial highlights present fairly, in all material respects, the financial position of Goldman Sachs Global Markets Navigator Fund (the “Fund”) at December 31, 2012, the results of its operations, the changes in its net assets and the financial highlights for the period April 16, 2012 (commencement of operations) through December 31, 2012, in conformity with accounting principles generally accepted in the United States of America. These financial statements and financial highlights (hereafter referred to as “financial statements”) are the responsibility of the Fund’s management. Our responsibility is to express an opinion on these financial statements based on our audit. We conducted our audit of these financial statements in accordance with the standards of the Public Company Accounting Oversight Board (United States). Those standards require that we plan and perform the audit to obtain reasonable assurance about whether the financial statements are free of material misstatement. An audit includes examining, on a test basis, evidence supporting the amounts and disclosures in the financial statements, assessing the accounting principles used and significant estimates made by management, and evaluating the overall financial statement presentation. We believe that our audit, which included confirmation of securities at December 31, 2012 by correspondence with the custodian, transfer agent, broker and the application of alternative auditing procedures where securities purchased confirmations had not been received, provides a reasonable basis for our opinion.
PricewaterhouseCoopers LLP
Boston, Massachusetts
February 14, 2013
24
GOLDMAN SACHS VARIABLE INSURANCE TRUST GLOBAL MARKETS NAVIGATOR FUND
| Fund Expenses — Period Ended December 31, 2012 (Unaudited) |
As a shareholder of the Service Shares of the Fund, you incur ongoing costs, including management fees, distribution and service (12b-1) fees and other Fund expenses. This example is intended to help you understand your ongoing costs (in dollars) of investing in the Fund and to compare these costs with the ongoing costs of investing in other mutual funds.
The example is based on an investment of $1,000 invested at the beginning of the period and held for the entire period from July 1, 2012 through December 31, 2012.
Actual Expenses — The first line in the table below provides information about actual account values and actual expenses. You may use the information in this line, together with the amount you invested, to estimate the expenses that you paid over the period. Simply divide your account value by $1,000 (for example, an $8,600 account value divided by $1,000=8.6), then multiply the result by the number in the first line under the heading entitled “Expenses Paid” to estimate the expenses you paid on your account during this period.
Hypothetical Example for Comparison Purposes — The second line in the table below provides information about hypothetical account values and hypothetical expenses based on the Fund’s actual net expense ratio and an assumed rate of return of 5% per year before expenses, which is not the Fund’s actual return. The hypothetical account values and expenses may not be used to estimate the actual ending account balance or expenses you paid for the period. You may use this information to compare the ongoing costs of investing in the Fund and other funds. To do so, compare this 5% hypothetical example with the 5% hypothetical examples that appear in the shareholder reports of the other funds.
Please note that the expenses shown in the table are meant to highlight your ongoing costs only. As a shareholder of the Fund, you do not incur any transaction costs, such as sales charges, redemption fees, or exchange fees, but shareholders of other funds may incur such costs. The second line of the table is useful in comparing ongoing costs only, and will not help you determine the relative total costs of owning different funds whose shareholders may incur transaction costs.
Beginning Account Value | Ending Account Value 12/31/12 | Expenses Paid for the 6 Months Ended 12/31/12* | ||||||||||
| Actual | $ | 1,000 | $ | 1,049.60 | $ | 5.36 | ||||||
| Hypothetical 5% return | 1,000 | 1,019.91 | + | 5.28 | ||||||||
| * | Expenses are calculated using the Fund’s annualized net expense ratio, which represents the ongoing expenses as a percentage of net assets for the six months ended December 31, 2012. Expenses are calculated by multiplying the annualized net expense ratio by the average account value for the period; then multiplying the result by the number of days in the most recent fiscal half year; and then dividing that result by the number of days in the fiscal year. The annualized net expense ratio for the period was 1.04%. |
| + | Hypothetical expenses are based on the Fund’s actual annualized net expense ratio and an assumed rate of return of 5% per year before expenses. |
25
GOLDMAN SACHS VARIABLE INSURANCE TRUST GLOBAL MARKETS NAVIGATOR FUND
Trustees and Officers (Unaudited)
Independent Trustees
| Name, Address and Age1 | Position(s) Held with the Trust | Term of Office and | Principal Occupation(s) During Past 5 Years | Number of Portfolios in Fund Complex Overseen by Trustee3 | Other Directorships Held by Trustee4 | |||||||
Ashok N. Bakhru Age: 70 | Chairman of the Board of Trustees | Since 1996 (Trustee since 1991) | Mr. Bakhru is retired. He is President, ABN Associates (1994-1996 and 1998-Present); Director, Apollo Investment Corporation (a business development company) (2008-Present); Member of Cornell University Council (1992-2004 and 2006-Present); and was formerly Trustee, Scholarship America (1998-2005); Trustee, Institute for Higher Education Policy (2003-2008); Director, Private Equity Investors — III and IV (1998-2007), and Equity-Linked Investors II (April 2002-2007).
Chairman of the Board of Trustees — Goldman Sachs Mutual Fund Complex. | 111 | Apollo Investment Corporation (a business development company) | |||||||
Donald C. Burke Age: 52 | Trustee | Since 2010 | Mr. Burke is retired. He is Director, Avista Corp. (2011-Present); and was formerly a Director, BlackRock Luxembourg and Cayman Funds (2006-2010); President and Chief Executive Officer, BlackRock U.S. Funds (2007-2009); Managing Director, BlackRock, Inc. (2006-2009); Managing Director, Merrill Lynch Investment Managers, L.P. (“MLIM”) (2006); First Vice President, MLIM (1997-2005); Chief Financial Officer and Treasurer, MLIM U.S. Funds (1999-2006).
Trustee — Goldman Sachs Mutual Fund Complex. | 110 | Avista Corp. (an energy company) | |||||||
John P. Coblentz, Jr. Age: 71 | Trustee | Since 2003 | Mr. Coblentz is retired. Formerly, he was Partner, Deloitte & Touche LLP (1975-2003); Director, Emerging Markets Group, Ltd. (2004-2006); and Director, Elderhostel, Inc. (2006-2012).
Trustee — Goldman Sachs Mutual Fund Complex. | 111 | None | |||||||
Diana M. Daniels Age: 63 | Trustee | Since 2007 | Ms. Daniels is retired. Formerly, she was Vice President, General Counsel and Secretary, The Washington Post Company (1991-2006). Ms. Daniels is a Vice Chairman of the Board of Trustees, Cornell University (2009-Present); Member, Advisory Board, Psychology Without Borders (international humanitarian aid organization) (2007-Present), and former Member of the Legal Advisory Board, New York Stock Exchange (2003-2006) and of the Corporate Advisory Board, Standish Mellon Management Advisors (2006-2007).
Trustee — Goldman Sachs Mutual Fund Complex. | 110 | None | |||||||
Joseph P. LoRusso Age: 55 | Trustee | Since 2010 | Mr. LoRusso is retired. Formerly, he was President, Fidelity Investments Institutional Services Co. (“FIIS”) (2002-2008); Director, FIIS (2002-2008); Director, Fidelity Investments Institutional Operations Company (2003-2007); Executive Officer, Fidelity Distributors Corporation (2007-2008).
Trustee — Goldman Sachs Mutual Fund Complex. | 110 | None | |||||||
Jessica Palmer Age: 63 | Trustee | Since 2007 | Ms. Palmer is retired. She is Director, Emerson Center for the Arts and Culture (2011-Present); and was formerly a Consultant, Citigroup Human Resources Department (2007-2008); Managing Director, Citigroup Corporate and Investment Banking (previously, Salomon Smith Barney/Salomon Brothers) (1984-2006). Ms. Palmer was a Member of the Board of Trustees of Indian Mountain School (private elementary and secondary school) (2004-2009).
Trustee — Goldman Sachs Mutual Fund Complex. | 110 | None | |||||||
Richard P. Strubel Age: 73 | Trustee | Since 1987 | Mr. Strubel is retired. Formerly, he was Director, Cardean Learning Group (provider of educational services via the internet) (2003-2008); Trustee, Emeritus, The University of Chicago (1987-Present).
Trustee — Goldman Sachs Mutual Fund Complex. | 111 | The Northern Trust Mutual Fund Complex (64 Portfolios) (Chairman of the Board of Trustees); Gildan Activewear Inc. (a clothing marketing and manufacturing company). | |||||||
26
GOLDMAN SACHS VARIABLE INSURANCE TRUST GLOBAL MARKETS NAVIGATOR FUND
Trustees and Officers (Unaudited) (continued)
Interested Trustees
| Name, Address and Age1 | Position(s) Held with the Trust | Term of Office and | Principal Occupation(s) During Past 5 Years | Number of Portfolios in Fund Complex Overseen by Trustee3 | Other Directorships Held by Trustee4 | |||||||
James A. McNamara* Age: 50 | President and Trustee | Since 2007 | Managing Director, Goldman Sachs (December 1998-Present); Director of Institutional Fund Sales, GSAM (April 1998-December 2000); and Senior Vice President and Manager, Dreyfus Institutional Service Corporation (January 1993- April 1998).
President — Goldman Sachs Mutual Fund Complex (November 2007-Present); Senior Vice President — Goldman Sachs Mutual Fund Complex (May 2007-November 2007); and Vice President — Goldman Sachs Mutual Fund Complex (2001-2007).
Trustee — Goldman Sachs Mutual Fund Complex (since November 2007 and December 2002-May 2004). | 111 | None | |||||||
Alan A. Shuch* Age: 63 | Trustee | Since 1990 | Advisory Director — GSAM (May 1999-Present); Consultant to GSAM (December 1994-May 1999); and Limited Partner, Goldman Sachs (December 1994-May 1999).
Trustee — Goldman Sachs Mutual Fund Complex. | 110 | None | |||||||
| * | These persons are considered to be “Interested Trustees” because they hold positions with Goldman Sachs and own securities issued by The Goldman Sachs Group, Inc. Each Interested Trustee holds comparable positions with certain other companies of which Goldman Sachs, GSAM or an affiliate thereof is the investment adviser, administrator and/or distributor. |
| 1 | Each Trustee may be contacted by writing to the Trustee, c/o Goldman Sachs, 200 West Street, New York, New York, 10282, Attn: Caroline Kraus. Information is provided as of December 31, 2012. |
| 2 | Each Trustee holds office for an indefinite term until the earliest of: (a) the election of his or her successor; (b) the date the Trustee resigns or is removed by the Board of Trustees or shareholders, in accordance with the Trust’s Declaration of Trust; (c) the conclusion of the first Board meeting held subsequent to the day the Trustee attains the age of 74 years (in accordance with the current resolutions of the Board of Trustees, which may be changed by the Trustees without shareholder vote); or (d) the termination of the Trust. |
| 3 | The Goldman Sachs Mutual Fund Complex consists of the Trust, Goldman Sachs Trust II, Goldman Sachs Municipal Opportunity Fund, Goldman Sachs Credit Strategies Fund, and Goldman Sachs Trust. As of December 31, 2012, the Trust consisted of 12 portfolios. Goldman Sachs Trust II consisted of 1 portfolio (which did not offer shares to the public); Goldman Sachs Municipal Opportunity Fund did not offer shares to the public; and Goldman Sachs Trust consisted of 96 portfolios (80 of which offered shares to the public). |
| 4 | This column includes only directorships of companies required to report to the Securities and Exchange Commission under the Securities Exchange Act of 1934 (i.e., “public companies”) or other investment companies registered under the Act. |
Additional information about the Trustees is available in the Fund’s Statement of Additional Information, which can be obtained from Goldman Sachs free of charge by calling this toll-free number (in the United States of America): 1-800-292-4726.
27
GOLDMAN SACHS VARIABLE INSURANCE TRUST GLOBAL MARKETS NAVIGATOR FUND
Trustees and Officers (Unaudited) (continued)
Officers of the Trust*
| Name, Address and Age | Position(s) Held With the Trust | Term of Office and | Principal Occupation(s) During Past 5 Years | |||
| James A. McNamara 200 West Street | President and Trustee | Since 2007 | Managing Director, Goldman Sachs (December 1998-Present); Director of Institutional Fund Sales, GSAM (April 1998-December 2000); and Senior Vice President and Manager, Dreyfus Institutional Service Corporation (January 1993-April 1998). President — Goldman Sachs Mutual Fund Complex (November 2007-Present); Senior Vice President — Goldman Sachs Mutual Fund Complex (May 2007-November 2007); and Vice President — Goldman Sachs Mutual Fund Complex (2001-2007). Trustee — Goldman Sachs Mutual Fund Complex November 2007-Present and December 2002-May 2004). | |||
| George F. Travers 30 Hudson Street | Senior Vice President and Principal Financial Officer | Since 2009 | Managing Director, Goldman Sachs (2007-Present); Managing Director, UBS Ag (2005-2007); and Partner, Deloitte & Touche LLP (1990-2005, partner from 2000-2005). Senior Vice President and Principal Financial Officer — Goldman Sachs Mutual Fund Complex. | |||
| Caroline Kraus 200 West Street | Secretary | Since 2012 | Vice President, Goldman Sachs (August 2006-Present); Associate General Counsel, Goldman Sachs (2012-Present); Assistant General Counsel, Goldman Sachs (August 2006-December 2011) and Associate, Weil, Gotshal & Manges-LLP (2002-2006). Secretary — Goldman Sachs Mutual Fund Complex (August 2012-Present) and Assistant Secretary — Goldman Sachs Mutual Fund Complex (June 2012-August 2012). | |||
| Scott M. McHugh 200 West Street | Treasurer and Senior Vice President | Since 2009 | Vice President, Goldman Sachs (February 2007-Present); Assistant Treasurer of certain mutual funds administered by DWS Scudder (2005-2007); and Director (2005-2007), Vice President (2000-2005) and Assistant Vice President (1998-2000), Deutsche Asset Management or its predecessor (1998-2007). Treasurer — Goldman Sachs Mutual Fund Complex (October 2009-Present); Senior Vice President — Goldman Sachs Mutual Fund Complex (November 2009-Present); and Assistant Treasurer — Goldman Sachs Mutual Fund Complex (May 2007-October 2009). | |||
| 1 | Officers hold office at the pleasure of the Board of Trustees or until their successors are duly elected and qualified. Each officer holds comparable positions with certain other companies of which Goldman Sachs, GSAM or an affiliate thereof is the investment adviser, administrator and/or distributor. Information is provided as of December 31, 2012. |
| * | Represents a partial list of officers of the Trust. Additional information about all the officers is available in the Fund’s Statement of Additional Information, which can be obtained from Goldman Sachs free of charge by calling this toll-free number (in the United States): 1-800-292-4726. |
Goldman Sachs Variable Insurance Trust — Tax Information (Unaudited)
Pursuant to Section 852 of the Internal Revenue Code, the Global Markets Navigator Fund designates $28,432, or, if different, the maximum amount allowable, as capital gain dividends paid during the year ended December 31, 2012.
28
| TRUSTEES | OFFICERS | |
Ashok N. Bakhru, Chairman Donald C. Burke John P. Coblentz, Jr. Diana M. Daniels Joseph P. LoRusso James A. McNamara Jessica Palmer Alan A. Shuch Richard P. Strubel
GOLDMAN, SACHS & CO. Distributor and Transfer Agent
| James A. McNamara, President George F. Travers, Principal Financial Officer Caroline L. Kraus, Secretary Scott M. McHugh, Treasurer | |
GOLDMAN SACHS ASSET MANAGEMENT, L.P. Investment Adviser 200 West Street, New York New York 10282 | ||
Visit our website at www.goldmansachsfunds.com/vit to obtain the most recent month-end returns.
The reports concerning the Fund included in this shareholder report may contain certain forward-looking statements about the factors that may affect the performance of the Fund in the future. These statements are based on Fund management’s predictions and expectations concerning certain future events and their expected impact on the Fund, such as performance of the economy as a whole and of specific industry sectors, changes in the levels of interest rates, the impact of developing world events, and other factors that may influence the future performance of the Fund. Management believes these forward-looking statements to be reasonable, although they are inherently uncertain and difficult to predict. Actual events may cause adjustments in portfolio management strategies from those currently expected to be employed.
A description of the policies and procedures that the Fund uses to determine how to vote proxies relating to portfolio securities and information regarding how the Fund voted proxies relating to portfolio securities for the 12-month period ended June 30 is available (i) without charge, upon request by calling 1-800-621-2550; and (ii) on the Securities and Exchange Commission (“SEC”) website at http://www.sec.gov.
The Fund files its complete schedule of portfolio holdings with the SEC for the first and third quarters of each fiscal year on Form N-Q. The Fund’s Form N-Q is available on the SEC’s website at http://www.sec.gov within 60 days after the Fund’s first and third fiscal quarters. The Fund’s Forms N-Q may be reviewed and copied at the SEC’s Public Reference Room in Washington, D.C. and information on the operation of the Public Reference Room may also be obtained by calling 1-800-SEC-0330. Forms N-Q may be obtained upon request and without charge by calling 1-800-621-2550.
Holdings and allocations shown are as of December 31, 2012 and may not be representative of future investments. Fund holdings should not be relied on in making investment decisions and should not be construed as research or investment advice regarding particular securities.
The portfolio risk management process includes an effort to monitor and manage risk, but does not imply low risk.
Shares of the Goldman Sachs VIT Funds are offered to separate accounts of participating life insurance companies for the purpose of funding variable annuity contracts and variable life insurance policies. Shares of the Fund are not offered directly to the general public. The variable annuity contracts and variable life insurance policies are described in the separate prospectuses issued by participating insurance companies. You should refer to those prospectuses for information about surrender charges, mortality and expense risk fees and other charges that may be assessed by participating insurance companies under the variable annuity contracts or variable life insurance policies. Such fees or charges, if any, may affect the return you may realize with respect to your investments. Ask your representative for more complete information. Please consider a fund’s objectives, risks and charges and expenses, and read the prospectus carefully before investing. The prospectus contains this and other information about the Fund.
This material is not authorized for distribution to prospective investors unless preceded or accompanied by a current Prospectus or summary prospectus, if applicable. Investors should consider a Fund’s objective, risks, and charges and expenses, and read the summary prospectus, if available, and/or the Prospectus carefully before investing or sending money. The summary prospectus, if available, and the Prospectus contain this and other information about a Fund and may be obtained from your Authorized Institution or from Goldman, Sachs & Co. by calling 1-800-621-2550.
Toll Free (in U.S.): 800-292-4726
This report is prepared for the general information of contract owners and is not an offer of shares of the Goldman Sachs Variable Insurance Trust: Goldman Sachs Global Markets Navigator Fund.
© 2013 Goldman Sachs. All rights reserved.
VITNAVAR13/92376.MF.MED.TMPL/2/2013
Goldman
Sachs Variable Insurance Trust
Goldman Sachs
Large Cap Value Fund
Annual Report
December 31, 2012

GOLDMAN SACHS VARIABLE INSURANCE TRUST LARGE CAP VALUE FUND
Principal Investment Strategies and Risks
This is not a complete list of risks that may affect the Fund. For additional information concerning the risks applicable to the Fund, please see the Fund’s Prospectus.
Shares of the Goldman Sachs Variable Insurance Trust — Goldman Sachs Large Cap Value Fund are offered to separate accounts of participating life insurance companies for the purpose of funding variable annuity contracts and variable life insurance policies. Shares of the Fund are not offered directly to the general public. The variable annuity contracts and variable life insurance policies are described in the separate prospectuses issued by participating insurance companies. You should refer to those prospectuses for information about surrender charges, mortality and expense risk fees and other charges that may be assessed by participating insurance companies under the variable annuity contracts or variable life insurance policies. Such fees or charges, if any, may affect the return you realize with respect to your investments. Ask your representative for more complete information. Please consider the Fund’s objective, risks and charges and expenses, and read the Prospectus carefully before investing. The Prospectus contains this and other information about the Fund.
The Goldman Sachs Large Cap Value Fund invests primarily in large-capitalization U.S. equity investments. The Fund’s equity investments will be subject to market risk, which means that the value of the securities in which it invests may go up or down in response to the prospects of individual companies, particular sectors and/or general economic conditions. Different investment styles (e.g., “value”) tend to shift in and out of favor, and at times the Fund may underperform other funds that invest in similar asset classes.
1
GOLDMAN SACHS VARIABLE INSURANCE TRUST LARGE CAP VALUE FUND
INVESTMENT OBJECTIVE
The Fund seeks long-term capital appreciation.
Portfolio Management Discussion and Analysis
Below, the Goldman Sachs Value Portfolio Management Team discusses the Goldman Sachs Variable Insurance Trust — Goldman Sachs Large Cap Value Fund’s (the “Fund”) performance and positioning for the 12-month period ended December 31, 2012 (the “Reporting Period”).
How did the Fund perform during the Reporting Period?
During the Reporting Period, the Fund’s Institutional and Service Shares generated average annual total returns of 19.07% and 18.77%, respectively. These returns compare to the 17.46% average annual total return of the Fund’s benchmark, the Russell 1000® Value Index* (with dividends reinvested) (the “Russell Index”), during the same time period.
What economic and market factors most influenced the equity markets as a whole during the Reporting Period?
Representing the U.S. equity market, the S&P® 500 Index gained 15.96% during the Reporting Period to mark the fourth straight year of gains. The year 2012 started with the strongest first quarter since 1998 for the S&P® 500 Index. Also during the first quarter of 2012, the Dow Jones Industrial Average closed above 13,000 for the first time since May 2008, and the NASDAQ reached a new 11-year high. U.S. equities rose largely on evidence that the labor and manufacturing markets were improving. In addition, the Federal Reserve (the “Fed”) reaffirmed its commitment to low interest rates until at least late-2014.
U.S. equity markets slid, however, during the second quarter of 2012, when first quarter Gross Domestic Product (“GDP”) was revised down from 2.2% to 1.9% and employment reports suggested deterioration in the labor market. Spain’s banking system bailout and increasing concerns over Europe’s financial crisis weighed on global equity markets, including the U.S. equity market, as well. At the same time, disappointing economic reports from faster growing regions of the world renewed fears of a global economic slowdown.
During the summer of 2012, U.S. equity markets rallied back on more strong statements from central banks. In September, the Fed announced another round of quantitative easing, dubbed QE3, this time with no expiration date but with the explicit goal of reducing unemployment. The Fed also extended its policy of near-zero interest rates until at least mid-2015. In Europe, the European Central Bank (“ECB”) president Mario Draghi voiced strong support for the euro and the European Monetary Union, which was well received by financial markets in the U.S. Continued improvements in home prices and the Fed’s commitment to buy mortgage-backed securities increased hopes of a recovery in the housing market, which helped offset the downward pressures of lackluster economic growth and a stalled labor market.
There were increasing signs of economic recovery seen early in the fourth quarter of 2012. The U.S. reported better than expected third quarter GDP growth of 2%, the 13th consecutive quarter of economic expansion, and the unemployment rate dropped to 7.8%, the lowest rate seen since January 2009. U.S. manufacturing activity increased, and the housing market showed further signs of improvement, as construction of new homes hit a four-year high. Despite this positive data, the U.S. equity market pulled back in October on some cautious corporate earnings guidance. Also pressuring the U.S. equity market were the worst storm in decades battering the East Coast and polls showing the U.S. presidential race tightening to a dead heat.
The U.S. equity market crept higher in November 2012, as election day preserved the status quo in the White House and Congress, even as the “fiscal cliff” drew nearer. Housing starts and measures of employment improved, and manufacturing and non-manufacturing surveys showed expansion in the economy. In December 2012, further clarification from the Fed, tying its low interest rate policy to the condition that unemployment drop to 6.5% or lower, helped to offset increasing worries about the then-looming fiscal cliff of tax increases and spending cuts.
For the Reporting Period as a whole, all ten sectors within the S&P® 500 Index posted gains. The consistent and persistent commitment to accommodative monetary policy from the U.S. Fed and other central banks drove market-leading returns in the financials sector. The heavily weighted financials sector was also the largest positive contributor (weight times performance) to
| * | The Russell 1000 Value Index is an unmanaged market capitalization weighted index of the 1,000 largest U.S. companies with lower price-to-book ratios and higher forecasted growth values. The Index figures do not reflect any deduction for fees, expenses or taxes. It is not possible to invest directly in an unmanaged index. |
2
GOLDMAN SACHS VARIABLE INSURANCE TRUST LARGE CAP VALUE FUND
S&P® 500 Index returns. On optimism about the economy and improved consumer confidence, the consumer discretionary sector also performed well. Conversely, the energy sector posted positive returns but was comparatively weak during the Reporting Period, as oil prices remained relatively stable, balancing continued unrest in several oil-producing regions with potential supply increases from U.S. shale production and a modest outlook for global economic growth.
All segments of the U.S. equity market advanced during the Reporting Period, with mid-cap stocks, as measured by the Russell Midcap® Index, gaining most, followed by large-cap stocks and then small-cap stocks, as measured by the Russell 1000® Index and the Russell 2000® Index, respectively, which performed similarly to each other. From a style perspective, value-oriented stocks solidly outpaced growth-oriented stocks across the capitalization spectrum. (All as measured by the Russell Investments indices.)
What key factors were responsible for the Fund’s performance during the Reporting Period?
Stock selection overall had the greatest effect on the Fund’s performance relative to the Russell Index during the Reporting Period.
Which equity market sectors most significantly affected Fund performance?
Effective stock selection in the telecommunication services, materials and financials sectors helped the Fund’s performance most relative to the Russell Index. Only partially offsetting these positive contributors was stock selection in the energy and consumer staples sectors, which detracted from the Fund’s relative results as company-specific issues weighed on certain holdings.
What were some of the Fund’s best-performing individual stocks?
The Fund benefited most relative to the Russell Index from positions in U.S. mobile operator Sprint Nextel, super-regional bank SunTrust Banks and diversified financial institution JPMorgan Chase.
Telecommunications company Sprint Nextel was the top contributor to the Fund’s relative results during the Reporting Period. Its shares gained sharply after the company reported a significant increase in its average revenue per subscriber during the second calendar quarter and raised 2012 profit targets. We sold out of the Fund’s position in October 2012 after the company agreed to sell 70% of its shares to SoftBank, a Japanese telecommunications company. We believe our investment thesis played out and therefore directed proceeds from the sale to ideas with what we considered to have more favorable risk/reward potential.
SunTrust Banks is a diversified financial services holding company, whose businesses provide a range of financial services to consumer and corporate clients, including deposit, credit and trust and investment services. SunTrust Banks failed the Fed’s stress test during the first quarter of 2012 but offset the news with positive forward guidance. Housing market improvements continually drove its shares higher throughout 2012 as increased mortgage production led to higher fee revenues. Reducing risk, along with holding higher quality assets, fueled a reduction in non-performing loans, which, in turn, led to lower loss provisions, improving the bank’s bottom line. A large one-time transaction of a long-term Coca-Cola holding during the third quarter of 2012 was said to help improve capital adequacy ratios. SunTrust Banks also completed a $300 million cost-cutting program to help offset tighter lending spreads.
Early in the Reporting Period, JPMorgan Chase’s stock declined in the wake of a surprising trading loss out of a London derivatives desk, which was originally estimated at $2 billion but then ballooned to nearly $6 billion as time went on. The company then suspended its stock repurchasing, sending shares down further. The stock then rallied sharply in the third calendar quarter, as investor concern surrounding the company’s multi-billion dollar trading loss subsided amidst continued improvement in its overall businesses. Share prices continued to advance during the fourth quarter of 2012, as negative sentiment continued to subside, and the company reported better than expected third calendar quarter results. In addition, management discussed returning value to shareholders and assured investors the company is on track to meet Basel III capital requirements. At the end of the Reporting Period, we continued to have conviction in the management team of JPMorgan Chase and to believe the company will benefit from its strong balance sheet, resilient business model and robust capital generating franchises.
Which stocks detracted significantly from the Fund’s performance during the Reporting Period?
Detracting most from the Fund’s results relative to its benchmark index were positions in oil and gas exploration and production companies Devon Energy and Newfield Exploration and in global diversified financial services holding company Citigroup.
The Fund’s investments in the energy sector detracted from its relative performance during the Reporting Period, largely driven by Devon Energy, a North America-focused independent energy company engaged in the exploration, development and production of oil, natural gas and natural gas liquids. During the Reporting Period, shares of Devon Energy fell along with the broader energy sector due in part to a decline in oil and gas prices. The company has shifted production and resources toward oil and natural gas liquids over time, and as a result, shares fell further after the company reported third calendar quarter production levels that missed expectations due to operating issues. We recognize our investment thesis may well take longer to play out than originally expected.
3
GOLDMAN SACHS VARIABLE INSURANCE TRUST LARGE CAP VALUE FUND
However, we believe the value of Devon Energy’s large, North American asset base is not fully recognized at its current market price. The company maintains a strong balance sheet, in our view, which, along with its joint venture partnerships, should help speed up the development of its oil properties. In addition, at the end of the Reporting Period, we believed the company’s cash flow should increase in 2013 as the company projects to spend significantly less on acquiring new acreage. While Devon Energy still has a large exposure to natural gas, it increased the amount of production that is hedged, taking advantage of strong pricing in the second half of 2012.
Citigroup’s businesses provide consumers, corporations, governments and institutions with a broad range of financial products and services. In March 2012, its shares began to decline after the third largest U.S. bank failed to meet the Fed’s minimum requirements in a stress test when examiners considered the effects of the bank’s plan for managing capital. We believed Citigroup was overly exposed to Europe and thus trimmed the Fund’s position in June 2012. The resulting underweighted position hurt the Fund’s relative results, as Citigroup’s shares rose for the remainder of the year along with the financials sector broadly.
Newfield Exploration’s domestic areas of operation include the mid-U.S. continent, the Rocky Mountains and onshore Texas. Its shares fell as the price of natural gas declined during the Reporting Period. We agreed with its management’s decision to shift resources toward oil production and away from natural gas, but we sold the Fund’s position in Newfield Exploration in favor of higher conviction names in the energy sector.
How did the Fund use derivatives and similar instruments during the Reporting Period?
During the Reporting Period, we did not use derivatives as part of an active management strategy.
Did the Fund make any significant purchases or sales during the Reporting Period?
We re-initiated a Fund position in Bank of America after having sold the Fund’s position ahead of its fourth quarter 2011 earnings reports due to concerns the company would need to raise capital. However, in our view, the company has been making progress on legacy issues, particularly relating to its mortgage business, and recent settlements have reduced litigation risks. Bank of America has also increased its capital adequacy ratios over the past few years, and as the need to build additional reserves decreases, more capital can be deployed back into its businesses. On the expense side, Bank of America has lowered its funding costs and closed less profitable banking centers. As its management continues to take steps to reduce expenses, we believe additional cost savings should benefit the company’s earnings over the coming years. We believe the company’s earnings improvements in 2012 may well continue over the coming year and further believe the company should benefit from its high exposure to the improving housing market.
We established a Fund position in automobile manufacturer General Motors because we believe the company has a strong balance sheet, including a sizable amount of cash. In addition, we believe one of the largest catalysts for the company’s stock going into 2013 could be the 2013 truck cycle. Finally, we like its management team’s increased focus on core competencies.
Strict to our sell discipline, we also made some adjustments to the Fund’s positioning by selling out of holdings where our investment thesis had fundamentally changed and/or valuation levels were no longer attractive. As such, we exited the Fund’s position in Walt Disney after strong performance throughout the Reporting Period. The company reported fiscal third quarter earnings that beat consensus expectations, and margin expansion occurred in the company’s parks segment. Overall, Walt Disney’s stock price reached our stretch valuation, or the valuation we considered to be at the upper end of the range we considered reasonable, and so we decided to move the proceeds into a name that we believed had a more attractive risk/reward profile.
We sold the Fund’s position in General Mills during the Reporting Period. General Mills reported earnings that were lower than expected and guided lower for fiscal year 2012, primarily due to weak pricing and greater than expected spending on advertising. Although we believed General Mills remained a leading consumer foods company with a strong management team, we exited the Fund’s position as a reflection of the company’s execution difficulties and lower sales volumes across the industry.
Were there any notable changes in the Fund’s weightings during the Reporting Period?
In constructing the Fund’s portfolio, we focus on picking stocks rather than on making industry or sector bets. We seek to outpace the benchmark index by overweighting stocks that we expect to outperform and underweighting those that we think may lag. Consequently, changes in its sector weights are generally the direct result of individual stock selection or of stock appreciation or depreciation. That said, during the Reporting Period, the Fund’s exposure to consumer discretionary, consumer staples and utilities increased compared to the Russell Index. The Fund’s allocations compared to the benchmark index in energy, financials, information technology and materials decreased. The Fund’s position in cash also increased during the Reporting Period.
4
GOLDMAN SACHS VARIABLE INSURANCE TRUST LARGE CAP VALUE FUND
How was the Fund positioned relative to its benchmark index at the end of the Reporting Period?
On December 31, 2012, the Fund had overweighted positions relative to the Russell Index in the consumer discretionary, information technology and health care sectors. On the same date, the Fund had underweighted positions compared to the Russell Index in financials, materials, telecommunication services and energy and was rather neutrally weighted to the Russell Index in consumer staples, industrials and utilities.
What is the Fund’s tactical view and strategy for the months ahead?
After a strong 2012, we continue to see opportunities as we enter 2013 and remain constructive in our view ahead for U.S. equities. We recognize that fiscal policy may lead to a drag on economic growth and the recent steps taken by the Fed to provide additional monetary accommodation may not fully offset the impact. The political climate in the U.S., and the lack of clarity around the outcome of fiscal negotiations, has contributed to an elevated feeling of uncertainty for both businesses and individuals. However, corporate balance sheets remain strong, which we believe provides companies with the ability to generate shareholder value, even in a slower economic growth environment. U.S. equities remain inexpensive relative to both fixed income and history, and continued strength in the U.S. housing recovery should provide, in our view, support to the economy and boost confidence among consumers. Additional potential catalysts could be investors re-allocating to equities, multiple expansion, correlations trending down and increased merger and acquisition activity.
We maintain high conviction in the companies the Fund owns and believe they have the potential to outperform relative to the broader market regardless of economic growth conditions. We continue to focus on undervalued companies in control of their own destiny, such as innovators in their industry, or companies with financial flexibility that have been investing in their own businesses and may be poised to gain market share. As we look ahead into 2013, we maintain our discipline in seeking to identify companies with strong or improving balance sheets, led by quality management teams and trading at discounted valuations. As always, deep research resources, a forward-looking investment process and truly actively managed portfolios are keys, in our view, to both preserving capital and outperforming the market over the long term. (When large numbers of stocks see their earnings multiples, or price/earnings ratios (share price divided by earnings per share), increase, the equity market is said to be undergoing multiple expansion. Changes in the earnings multiple of an individual stock are often evaluated in the context of earnings multiples of the general market. Correlation is simply a statistical measure of how two securities move in relation to each other.)
5
FUND BASICS
Large Cap Value Fund
as of December 31, 2012
STANDARDIZED TOTAL RETURNS1
| For the period ended 12/31/12 | One Year | Five Years | Ten Years | Since Inception | Inception Date | |||||||||||||
| Institutional | 19.07 | % | –0.94 | % | 6.18 | % | 2.98 | % | 1/12/98 | |||||||||
| Service | 18.77 | –1.13 | N/A | –1.78 | 7/24/07 | |||||||||||||
| 1 | The Standardized Total Returns are average annual total returns as of the most recent calendar quarter-end. They assume reinvestment of all distributions at net asset value (“NAV”). Because Institutional Shares and Service Shares do not involve a sales charge, such a charge is not applied to their Standardized Total Returns. |
Total return figures in the above chart represent past performance and do not indicate future results, which will vary. The investment return and principal value of an investment will fluctuate and, therefore, an investor’s shares, when redeemed, may be worth more or less than their original cost. Current performance may be lower or higher than the total return figures in the above chart. Please visit www.goldmansachsfunds.com/vit to obtain the most recent month-end returns. Performance reflects fee waivers and/or expense limitations in effect. In their absence, performance would be reduced.
EXPENSE RATIOS2
| Net Expense Ratio (Current) | Gross Expense Ratio (Before Waivers) | |||||||
| Institutional | 0.78 | % | 0.79 | % | ||||
| Service | 1.03 | 1.04 | ||||||
| 2 | The expense ratios of the Fund, both current (net of applicable fee waivers and/or expense limitations) and before waivers (gross of applicable fee waivers and/or expense limitations) are as set forth above according to the most recent publicly available Prospectus for the Fund and may differ from the expense ratios disclosed in the Financial Highlights in this report. The Fund’s waivers and/or expense limitations will remain in place through at least April 27, 2013, and prior to such date the investment adviser may not terminate the arrangements without the approval of the Fund’s Board of Trustees. If these arrangements are discontinued in the future, the expense ratios may change without shareholder approval. |
TOP TEN HOLDINGS AS OF 12/31/123
| Holding | % of Net Assets | Line of Business | ||||
| Exxon Mobil Corp. | 4.4% | Energy | ||||
| General Electric Co. | 4.2 | Capital Goods | ||||
| JPMorgan Chase & Co. | 3.8 | Diversified Financials | ||||
| Pfizer, Inc. | 3.4 | Pharmaceuticals, Biotechnology & Life Sciences | ||||
| Devon Energy Corp. | 2.6 | Energy | ||||
| Bank of America Corp. | 2.5 | Diversified Financials | ||||
| Halliburton Co. | 2.5 | Energy | ||||
| Prudential Financial, Inc. | 2.3 | Insurance | ||||
| The Boeing Co. | 2.0 | Capital Goods | ||||
| General Motors Co. | 1.8 | Automobiles & Components | ||||
| 3 | The top 10 holdings may not be representative of the Fund’s future investments. |
6
FUND BASICS
FUND vs. BENCHMARK SECTOR ALLOCATIONS4
As of December 31, 2012
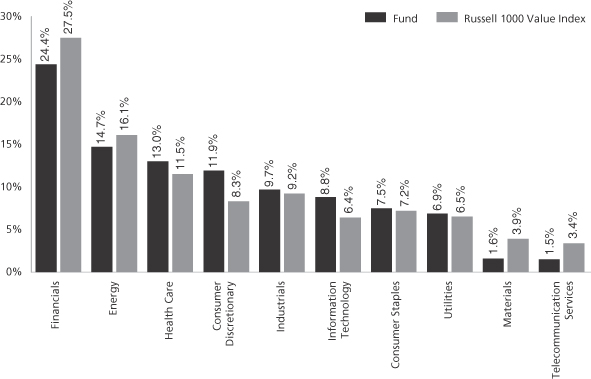
| 4 | The Fund is actively managed and, as such, its composition may differ over time. Consequently, the Fund’s overall sector allocations may differ from percentages contained in the graph above. The graph categorizes investments using Global Industry Classification Standard (“GICS”), however, the sector classifications used by the portfolio management team may differ from GICS. Underlying sector allocations of exchange traded funds (“ETFs”) held by the Fund are not reflected in the graph above. The percentage shown for each investment category reflects the value of investments in that category as a percentage of market value. The graph depicts the Fund’s investments but may not represent the Fund’s market exposure due to the exclusion of certain derivatives, if any, as listed in the Additional Investment Information section of the Schedule of Investments. |
7
GOLDMAN SACHS VARIABLE INSURANCE TRUST LARGE CAP VALUE FUND
Performance Summary
December 31, 2012
The following graph shows the value, as of December 31, 2012, of a $10,000 investment made on January 1, 2003 in the Institutional Shares at NAV. For comparative purposes, the performance of the Fund’s benchmark, the Russell 1000 Value Index (with dividends reinvested), is shown. This performance data represents past performance and should not be considered indicative of future performance, which will fluctuate with changes in market conditions. These performance fluctuations will cause an investor’s shares, when redeemed, to be worth more or less than their original cost. Performance reflects Fund level expenses but does not reflect fees and expenses associated with any variable annuity contract or variable life insurance policy that uses the Fund as an investment option for any contract or policy. Had performance reflected all of those fees and expenses, performance would have been reduced. Performance also would have been reduced had expense limitations not been in effect. Performance of Service Shares will vary from Institutional Shares due to differences in class specific fees. In addition to the investment adviser’s decisions regarding issuer/industry investment selection and allocation, other factors may affect Fund performance. These factors include, but are not limited to, Fund operating fees and expenses, portfolio turnover, and subscription and redemption cash flows affecting the Fund.
Large Cap Value Fund’s 10 Year Performance
Performance of a $10,000 investment, with distributions reinvested, from January 1, 2003 through December 31, 2012.
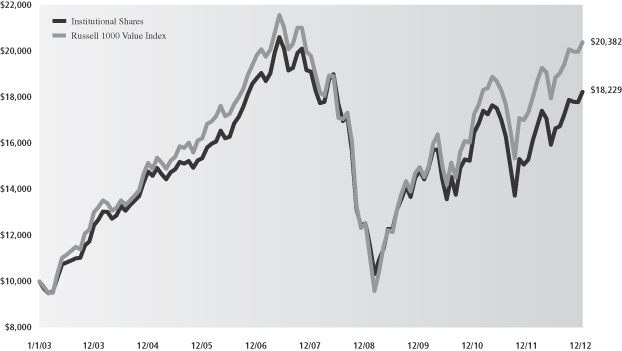
| Average Annual Total Return through December 31, 2012 | One Year | Five Years | Ten Years | Since Inception | ||||
Institutional (Commenced January 12, 1998) | 19.07% | -0.94% | 6.18% | 2.98% | ||||
Service (Commenced July 24, 2007) | 18.77% | -1.13% | N/A | -1.78% |
8
GOLDMAN SACHS VARIABLE INSURANCE TRUST LARGE CAP VALUE FUND
Schedule of Investments
December 31, 2012
| Shares | Description | Value | ||||||
| Common Stocks – 98.9% | ||||||||
| Automobiles & Components – 1.8% |
| ||||||
| 679,631 | General Motors Co.* | $ | 19,593,762 | |||||
|
| |||||||
| Banks – 2.6% |
| ||||||
| 491,533 | SunTrust Banks, Inc. | 13,934,961 | ||||||
| 440,250 | U.S. Bancorp | 14,061,585 | ||||||
|
| |||||||
| 27,996,546 | ||||||||
|
| |||||||
| Capital Goods – 8.8% |
| ||||||
| 166,404 | General Dynamics Corp. | 11,526,805 | ||||||
| 2,169,015 | General Electric Co. | 45,527,625 | ||||||
| 533,828 | Masco Corp. | 8,893,575 | ||||||
| 358,474 | Textron, Inc. | 8,886,570 | ||||||
| 282,322 | The Boeing Co. | 21,275,786 | ||||||
|
| |||||||
| 96,110,361 | ||||||||
|
| |||||||
| Commercial & Professional Services – 0.8% |
| ||||||
| 246,459 | Waste Management, Inc. | 8,315,527 | ||||||
|
| |||||||
| Consumer Services – 2.1% |
| ||||||
| 39,278 | Chipotle Mexican Grill, Inc.* | 11,683,634 | ||||||
| 1,002,621 | MGM Resorts International* | 11,670,508 | ||||||
|
| |||||||
| 23,354,142 | ||||||||
|
| |||||||
| Diversified Financials – 10.5% |
| ||||||
| 109,724 | Ameriprise Financial, Inc. | 6,872,014 | ||||||
| 2,350,812 | Bank of America Corp. | 27,269,419 | ||||||
| 217,941 | Citigroup, Inc. | 8,621,746 | ||||||
| 40,377 | IntercontinentalExchange, Inc.* | 4,999,076 | ||||||
| 950,400 | JPMorgan Chase & Co. | 41,789,088 | ||||||
| 533,163 | Morgan Stanley | 10,194,077 | ||||||
| 853,657 | SLM Corp. | 14,623,145 | ||||||
|
| |||||||
| 114,368,565 | ||||||||
|
| |||||||
| Energy – 14.5% |
| ||||||
| 141,255 | Chevron Corp. | 15,275,316 | ||||||
| 537,472 | Devon Energy Corp. | 27,970,043 | ||||||
| 553,522 | Exxon Mobil Corp. | 47,907,329 | ||||||
| 768,843 | Halliburton Co. | 26,671,164 | ||||||
| 213,273 | Occidental Petroleum Corp. | 16,338,844 | ||||||
| 320,715 | Southwestern Energy Co.* | 10,715,088 | ||||||
| 285,234 | Transocean Ltd. | 12,735,698 | ||||||
|
| |||||||
| 157,613,482 | ||||||||
|
| |||||||
| Food & Staples Retailing – 1.5% |
| ||||||
| 436,486 | Walgreen Co. | 16,154,347 | ||||||
|
| |||||||
| Food, Beverage & Tobacco – 5.3% |
| ||||||
| 115,655 | Anheuser-Busch InBev NV ADR | 10,109,404 | ||||||
| 79,979 | Diageo PLC ADR | 9,323,952 | ||||||
| 391,556 | Mondelez International, Inc. Class A | 9,972,931 | ||||||
| 205,330 | Philip Morris International, Inc. | 17,173,801 | ||||||
| 124,005 | The J.M. Smucker Co. | 10,694,191 | ||||||
|
| |||||||
| 57,274,279 | ||||||||
|
| |||||||
| Health Care Equipment & Services – 3.5% |
| ||||||
| 225,195 | Aetna, Inc. | 10,426,528 | ||||||
| 83,286 | C. R. Bard, Inc. | 8,140,374 | ||||||
|
| |||||||
| Common Stocks – (continued) | ||||||||
| Health Care Equipment & Services – (continued) |
| ||||||
| 285,822 | UnitedHealth Group, Inc. | $ | 15,502,985 | |||||
| 58,362 | Varian Medical Systems, Inc.* | 4,099,347 | ||||||
|
| |||||||
| 38,169,234 | ||||||||
|
| |||||||
| Household & Personal Products – 0.7% |
| ||||||
| 107,167 | The Procter & Gamble Co. | 7,275,568 | ||||||
|
| |||||||
| Insurance – 8.0% |
| ||||||
| 497,337 | American International Group, Inc.* | 17,555,996 | ||||||
| 153,739 | Everest Re Group Ltd. | 16,903,603 | ||||||
| 409,807 | Hartford Financial Services Group, Inc. | 9,196,069 | ||||||
| 471,289 | Prudential Financial, Inc. | 25,133,842 | ||||||
| 255,090 | The Travelers Companies, Inc. | 18,320,564 | ||||||
|
| |||||||
| 87,110,074 | ||||||||
|
| |||||||
| Materials – 1.6% |
| ||||||
| 141,747 | Eastman Chemical Co. | 9,645,883 | ||||||
| 128,078 | LyondellBasell Industries NV Class A | 7,311,973 | ||||||
|
| |||||||
| 16,957,856 | ||||||||
|
| |||||||
| Media – 3.6% |
| ||||||
| 293,524 | CBS Corp. Class B | 11,168,588 | ||||||
| 257,693 | DIRECTV* | 12,925,881 | ||||||
| 146,059 | DISH Network Corp. Class A | 5,316,548 | ||||||
| 189,167 | Viacom, Inc. Class B | 9,976,667 | ||||||
|
| |||||||
| 39,387,684 | ||||||||
|
| |||||||
| Pharmaceuticals, Biotechnology & Life Sciences – 9.3% |
| ||||||
| 67,543 | Celgene Corp.* | 5,316,985 | ||||||
| 257,937 | Eli Lilly & Co. | 12,721,453 | ||||||
| 165,397 | Johnson & Johnson | 11,594,330 | ||||||
| 426,616 | Merck & Co., Inc. | 17,465,659 | ||||||
| 157,134 | Mylan, Inc.* | 4,318,042 | ||||||
| 1,492,611 | Pfizer, Inc. | 37,434,684 | ||||||
| 294,263 | Vertex Pharmaceuticals, Inc.* | 12,341,390 | ||||||
|
| |||||||
| 101,192,543 | ||||||||
|
| |||||||
| Real Estate Investment Trust – 3.0% |
| ||||||
| 116,078 | American Tower Corp. | 8,969,347 | ||||||
| 91,709 | AvalonBay Communities, Inc. | 12,434,823 | ||||||
| 70,539 | Simon Property Group, Inc. | 11,151,511 | ||||||
|
| |||||||
| 32,555,681 | ||||||||
|
| |||||||
| Retailing – 4.2% |
| ||||||
| 292,032 | Bed Bath & Beyond, Inc.* | 16,327,509 | ||||||
| 513,332 | Lowe’s Companies, Inc. | 18,233,553 | ||||||
| 286,547 | Urban Outfitters, Inc.* | 11,278,490 | ||||||
|
| |||||||
| 45,839,552 | ||||||||
|
| |||||||
| Semiconductors & Semiconductor Equipment – 2.9% |
| ||||||
| 449,278 | Altera Corp. | 15,473,134 | ||||||
| 449,075 | Lam Research Corp.* | 16,225,080 | ||||||
|
| |||||||
| 31,698,214 | ||||||||
|
| |||||||
| The accompanying notes are an integral part of these financial statements. | 9 |
GOLDMAN SACHS VARIABLE INSURANCE TRUST LARGE CAP VALUE FUND
Schedule of Investments (continued)
December 31, 2012
| Shares | Description | Value | ||||||
| Common Stocks – (continued) | ||||||||
| Software & Services – 2.0% |
| ||||||
| 269,682 | Adobe Systems, Inc.* | $ | 10,161,618 | |||||
| 16,193 | Google, Inc. Class A* | 11,486,828 | ||||||
|
| |||||||
| 21,648,446 | ||||||||
|
| |||||||
| Technology Hardware & Equipment – 3.8% |
| ||||||
| 647,115 | Cisco Systems, Inc. | 12,715,810 | ||||||
| 570,976 | EMC Corp.* | 14,445,693 | ||||||
| 706,081 | Juniper Networks, Inc.* | 13,888,613 | ||||||
|
| |||||||
| 41,050,116 | ||||||||
|
| |||||||
| Telecommunication Services – 1.5% |
| ||||||
| 488,971 | AT&T, Inc. | 16,483,212 | ||||||
|
| |||||||
| Utilities – 6.9% |
| ||||||
| 318,749 | American Electric Power Co., Inc. | 13,604,207 | ||||||
| 237,095 | Duke Energy Corp. | 15,126,661 | ||||||
| 176,571 | Exelon Corp. | 5,251,222 | ||||||
| 333,592 | Northeast Utilities | 13,036,775 | ||||||
| 496,974 | PPL Corp. | 14,228,366 | ||||||
| 497,917 | Xcel Energy, Inc. | 13,299,363 | ||||||
|
| |||||||
| 74,546,594 | ||||||||
|
| |||||||
| TOTAL INVESTMENTS – 98.9% | ||||||||
| (Cost $983,909,849) | $ | 1,074,695,785 | ||||||
|
| |||||||
| OTHER ASSETS IN EXCESS OF | 11,558,685 | ||||||
|
| |||||||
| NET ASSETS – 100.0% | $ | 1,086,254,470 | ||||||
|
| |||||||
| The percentage shown for each investment category reflects the value of investments in that category as a percentage of net assets. | ||
| * | Non-income producing security. | |
| Investment Abbreviation: | ||
| ADR | —American Depositary Receipt | |
| 10 | The accompanying notes are an integral part of these financial statements. |
GOLDMAN SACHS VARIABLE INSURANCE TRUST LARGE CAP VALUE FUND
Statement of Assets and Liabilities
December 31, 2012
| Assets: | ||||
Investments, at value (cost $983,909,849) | $ | 1,074,695,785 | ||
Cash | 9,757,845 | |||
Receivables: | ||||
Investments sold | 1,451,246 | |||
Dividends | 1,378,172 | |||
Fund shares sold | 1,223,801 | |||
| Total assets | 1,088,506,849 | |||
| Liabilities: | ||||
Payables: | ||||
Fund shares redeemed | 1,348,095 | |||
Amounts owed to affiliates | 835,309 | |||
Accrued expenses | 68,975 | |||
| Total liabilities | 2,252,379 | |||
| Net Assets: | ||||
Paid-in capital | 996,161,442 | |||
Undistributed net investment income | 2,095,865 | |||
Accumulated net realized loss | (2,788,773 | ) | ||
Net unrealized gain | 90,785,936 | |||
| NET ASSETS | $ | 1,086,254,470 | ||
Net Assets: | ||||
Institutional | $ | 351,677,302 | ||
Service | 734,577,168 | |||
Total Net Assets | $ | 1,086,254,470 | ||
Shares of beneficial interest outstanding $0.001 par value (unlimited shares authorized): | ||||
Institutional | 32,697,386 | |||
Service | 68,356,786 | |||
Net asset value, offering and redemption price per share: | ||||
Institutional | $10.76 | |||
Service | 10.75 | |||
| The accompanying notes are an integral part of these financial statements. | 11 |
GOLDMAN SACHS VARIABLE INSURANCE TRUST LARGE CAP VALUE FUND
Statement of Operations
For the Fiscal Year Ended December 31, 2012
| Investment income: | ||||
Dividends (net of foreign taxes withheld of $17,345) | $ | 26,048,702 | ||
| Expenses: | ||||
Management fees | 8,877,242 | |||
Distribution and Service fees — Service Class | 2,031,482 | |||
Transfer Agent fees(a) | 240,486 | |||
Custody and accounting fees | 93,258 | |||
Printing and mailing costs | 91,110 | |||
Professional fees | 71,257 | |||
Trustee fees | 17,879 | |||
Other | 31,102 | |||
| Total expenses | 11,453,816 | |||
Less — expense reductions | (216,705 | ) | ||
| Net expenses | 11,237,111 | |||
| NET INVESTMENT INCOME | 14,811,591 | |||
| Realized and unrealized gain: | ||||
Net realized gain from investments (including commissions recaptured of $451,047) | 115,785,338 | |||
Net change in unrealized gain on Investments | 76,484,258 | |||
| Net realized and unrealized gain | 192,269,596 | |||
| NET INCREASE IN NET ASSETS RESULTING FROM OPERATIONS | $ | 207,081,187 | ||
(a) Institutional and Service Shares had Transfer Agent fees of $77,982 and $162,504, respectively.
| 12 | The accompanying notes are an integral part of these financial statements. |
GOLDMAN SACHS VARIABLE INSURANCE TRUST LARGE CAP VALUE FUND
Statements of Changes in Net Assets
For the Fiscal Year Ended | For the Fiscal Year Ended | |||||||
| From operations: | ||||||||
Net investment income | $ | 14,811,591 | $ | 15,962,647 | ||||
Net realized gain | 115,785,338 | 16,316,398 | ||||||
Net change in unrealized gain (loss) | 76,484,258 | (116,886,486 | ) | |||||
| Net increase (decrease) in net assets resulting from operations | 207,081,187 | (84,607,441 | ) | |||||
| Distributions to shareholders: | ||||||||
From net investment income | ||||||||
Institutional Shares | (4,850,997 | ) | (5,580,091 | ) | ||||
Service Shares | (8,140,528 | ) | (9,437,060 | ) | ||||
From net realized gains | ||||||||
Institutional Shares | (8,570,410 | ) | — | |||||
Service Shares | (17,965,988 | ) | — | |||||
| Total distributions to shareholders | (39,527,923 | ) | (15,017,151 | ) | ||||
| From share transactions: | ||||||||
Proceeds from sales of shares | 111,767,606 | 406,837,184 | ||||||
Reinvestment of distributions | 39,527,923 | 15,017,151 | ||||||
Cost of shares redeemed | (511,813,315 | ) | (222,396,415 | ) | ||||
| Net increase (decrease) in net assets resulting from share transactions | (360,517,786 | ) | 199,457,920 | |||||
| TOTAL INCREASE (DECREASE) | (192,964,522 | ) | 99,833,328 | |||||
| Net assets: | ||||||||
Beginning of year | 1,279,218,992 | 1,179,385,664 | ||||||
End of year | $ | 1,086,254,470 | $ | 1,279,218,992 | ||||
| Undistributed net investment income | $ | 2,095,865 | $ | 2,713,616 | ||||
| The accompanying notes are an integral part of these financial statements. | 13 |
GOLDMAN SACHS VARIABLE INSURANCE TRUST LARGE CAP VALUE FUND
Financial Highlights
Selected Data for a Share Outstanding Throughout Each Year
| Income (loss) from investment operations | Distributions to shareholders | |||||||||||||||||||||||||||||||||||||||||||||||||||||||
| Year - Share Class | Net asset value, beginning of year | Net investment income(a) | Net realized and unrealized gain (loss) | Total from investment operations | From net investment income | From net realized gains | Total distributions | Net asset value, end of year | Total return(b) | Net assets, end of year (in 000s) | Ratio of net expenses to average net assets | Ratio of total expenses to average net assets | Ratio of net investment income to average net assets | Portfolio turnover rate(c) | ||||||||||||||||||||||||||||||||||||||||||
FOR THE FISCAL YEARS ENDED DECEMBER 31, | ||||||||||||||||||||||||||||||||||||||||||||||||||||||||
2012 - Institutional | $ | 9.39 | $ | 0.15 | $ | 1.64 | $ | 1.79 | $ | (0.15 | ) | $ | (0.27 | ) | $ | (0.42 | ) | $ | 10.76 | 19.07 | % | $ | 351,677 | 0.77 | % | 0.78 | % | 1.40 | % | 120 | % | |||||||||||||||||||||||||
2012 - Service | 9.38 | 0.12 | 1.64 | 1.76 | (0.12 | ) | (0.27 | ) | (0.39 | ) | 10.75 | 18.77 | 734,577 | 1.02 | 1.03 | 1.15 | 120 | |||||||||||||||||||||||||||||||||||||||
2011 - Institutional | 10.24 | 0.14 | (d) | (0.86 | ) | (0.72 | ) | (0.13 | ) | — | (0.13 | ) | 9.39 | (7.05 | ) | 421,560 | 0.78 | 0.79 | 1.39 | (d) | 91 | |||||||||||||||||||||||||||||||||||
2011 - Service | 10.23 | 0.12 | (d) | (0.87 | ) | (0.75 | ) | (0.10 | ) | — | (0.10 | ) | 9.38 | (7.27 | ) | 857,659 | 1.03 | 1.04 | 1.23 | (d) | 91 | |||||||||||||||||||||||||||||||||||
2010 - Institutional | 9.28 | 0.10 | 0.94 | 1.04 | (0.08 | ) | — | (0.08 | ) | 10.24 | 11.20 | 507,146 | 0.80 | 0.80 | 1.02 | 95 | ||||||||||||||||||||||||||||||||||||||||
2010 - Service | 9.28 | 0.07 | 0.94 | 1.01 | (0.06 | ) | — | (0.06 | ) | 10.23 | 10.89 | 672,239 | 1.05 | 1.05 | 0.78 | 95 | ||||||||||||||||||||||||||||||||||||||||
2009 - Institutional | 7.97 | 0.18 | (e) | 1.28 | 1.46 | (0.15 | ) | — | (0.15 | ) | 9.28 | 18.32 | 487,962 | 0.81 | 0.81 | 2.18 | (e) | 84 | ||||||||||||||||||||||||||||||||||||||
2009 - Service | 7.98 | 0.16 | (e) | 1.28 | 1.44 | (0.14 | ) | — | (0.14 | ) | 9.28 | 17.87 | 391,053 | 1.06 | 1.06 | 1.92 | (e) | 84 | ||||||||||||||||||||||||||||||||||||||
2008 - Institutional | 12.53 | 0.25 | (4.59 | ) | (4.34 | ) | (0.22 | ) | — | (f) | (0.22 | ) | 7.97 | (34.45 | ) | 389,838 | 0.81 | 0.81 | 2.36 | 69 | ||||||||||||||||||||||||||||||||||||
2008 - Service | 12.52 | 0.19 | (4.51 | ) | (4.32 | ) | (0.22 | ) | — | (f) | (0.22 | ) | 7.98 | (34.32 | ) | 67,200 | 1.06 | 1.06 | 2.15 | 69 | ||||||||||||||||||||||||||||||||||||
| (a) | Calculated based on the average shares outstanding methodology. |
| (b) | Assumes investment at the net asset value at the beginning of the year, reinvestment of all distributions, and a complete redemption of the investment at the net asset value at the end of the year. |
| (c) | The Fund's portfolio turnover rate is calculated in accordance with regulatory requirements, without regard to transactions involving short term investments and certain derivatives. If such transactions were included, the Fund's portfolio turnover rate may be higher. |
| (d) | Reflects income recognized from non-recurring special dividends which amounted to $0.02 per share and 0.19% of average net assets. |
| (e) | Reflects income recognized from non-recurring special dividends which amounted to $0.02 per share and 0.24% of average net assets. |
| (f) | Amount is less than $0.005 per share. |
| The accompanying notes are an integral part of these financial statements. | 14 |
GOLDMAN SACHS VARIABLE INSURANCE TRUST LARGE CAP VALUE FUND
Notes to Financial Statements
December 31, 2012
1. ORGANIZATION
Goldman Sachs Variable Insurance Trust (the “Trust” or “VIT”) is a Delaware statutory trust registered under the Investment Company Act of 1940, as amended (the “Act”), as an open-end management investment company. The Trust includes the Goldman Sachs Large Cap Value Fund (the “Fund”). The Fund is a diversified portfolio under the Act offering two classes of shares — Institutional Shares and Service Shares. Shares of the Trust are offered to separate accounts of participating life insurance companies for the purpose of funding variable annuity contracts and variable life insurance policies.
Goldman Sachs Asset Management, L.P. (“GSAM”), an affiliate of Goldman, Sachs & Co. (“Goldman Sachs”), serves as investment adviser to the Fund pursuant to a management agreement (the “Agreement”) with the Trust.
2. SIGNIFICANT ACCOUNTING POLICIES
The financial statements have been prepared in accordance with accounting principles generally accepted in the United States of America (“GAAP”) and require management to make estimates and assumptions that may affect the reported amounts and disclosures. Actual results may differ from those estimates and assumptions.
A. Investment Valuation — The Fund’s valuation policy is to value investments at fair value.
B. Investment Income and Investments — Investment income includes interest income and dividend income, net of any foreign withholding taxes, less any amounts reclaimable. Interest income is accrued daily and adjusted for amortization of premiums and accretion of discounts. Dividend income is recognized on ex-dividend date or, for certain foreign securities, as soon as such information is obtained subsequent to the ex-dividend date. Investment transactions are reflected on trade date. Realized gains and losses are calculated using identified cost. Investment transactions are recorded on the following business day for daily net asset value (“NAV”) calculations. Any foreign capital gains tax is accrued daily based upon net unrealized gains, and is payable upon sale of such investments. Distributions received from the Fund’s investments in United States (“U.S.”) real estate investment trusts (“REITs”) may be characterized as ordinary income, net capital gain or a return of capital. A return of capital is recorded by the Fund as a reduction to the cost basis of the REIT.
C. Class Allocations and Expenses — Investment income, realized and unrealized gain (loss), and non-class specific expenses of the Fund are allocated daily based upon the proportion of net assets of each class. Class specific expenses, where applicable, are borne by the respective share classes and include Distribution and Service and Transfer Agent fees. Non-class specific expenses directly incurred by a Fund are charged to that Fund, while such expenses incurred by the Trust are allocated across the respective Funds on a straight-line and/or pro-rata basis depending upon the nature of the expenses.
D. Federal Taxes and Distributions to Shareholders — It is the Fund’s policy to comply with the requirements of the Internal Revenue Code of 1986, as amended (the “Code”), applicable to regulated investment companies (mutual funds) and to distribute each year substantially all of its investment company taxable income and capital gains to its shareholders. Accordingly, the Fund is not required to make any provisions for the payment of federal income tax. Distributions to shareholders are recorded on the ex-dividend date. Income and capital gains distributions, if any, are declared and paid annually.
15
GOLDMAN SACHS VARIABLE INSURANCE TRUST LARGE CAP VALUE FUND
Notes to Financial Statements (continued)
December 31, 2012
2. SIGNIFICANT ACCOUNTING POLICIES (continued)
Net capital losses are carried forward to future fiscal years and may be used to the extent allowed by the Code to offset any future capital gains. Utilization of capital loss carryforwards will reduce the requirement of future capital gains distributions.
Under the Regulated Investment Company Modernization Act of 2010, the Fund is permitted to carryforward capital losses incurred in taxable years beginning after December 22, 2010 for an unlimited period. However, any losses incurred during those future taxable years will be required to be utilized prior to the losses incurred in pre-enactment taxable years. As a result of this ordering rule, pre-enactment capital loss carryforwards may be more likely to expire unused. Additionally, post-enactment capital losses that are carried forward will retain their character as either short-term or long term capital losses rather than being considered all short-term as under previous law.
The characterization of distributions to shareholders for financial reporting purposes is determined in accordance with federal income tax rules, which may differ from GAAP. The source of the Fund’s distributions may be shown in the accompanying financial statements as either from net investment income, net realized gain or capital. Certain components of the Fund’s net assets on the Statement of Assets and Liabilities reflect permanent GAAP/tax differences based on the appropriate tax character.
E. Commission Recapture — GSAM, on behalf of the Fund, may direct portfolio trades, subject to seeking best execution, to various brokers who have agreed to rebate a portion of the commissions generated. Such rebates are made directly to the Fund as cash payments and are included in net realized gain (loss) from investments on the Statement of Operations.
3. INVESTMENTS AND FAIR VALUE MEASUREMENTS
The fair value of a financial instrument is the amount that would be received to sell an asset or paid to transfer a liability in an orderly transaction between market participants at the measurement date (i.e., the exit price). GAAP establishes a fair value hierarchy that prioritizes the inputs to valuation techniques used to measure fair value. The hierarchy gives the highest priority to unadjusted quoted prices in active markets for identical assets or liabilities (Level 1 measurements) and the lowest priority to unobservable inputs (Level 3 measurements). The levels used for classifying investments are not necessarily an indication of the risk associated with investing in these investments. The three levels of the fair value hierarchy are described below:
Level 1 — Unadjusted quoted prices in active markets that are accessible at the measurement date for identical, unrestricted assets or liabilities;
Level 2 — Quoted prices in markets that are not active or financial instruments for which significant inputs are observable (including, but not limited to, quoted prices for similar investments, interest rates, foreign exchange rates, volatility and credit spreads), either directly or indirectly;
Level 3 — Prices or valuations that require significant unobservable inputs (including GSAM’s assumptions in determining fair value measurement).
16
GOLDMAN SACHS VARIABLE INSURANCE TRUST LARGE CAP VALUE FUND
3. INVESTMENTS AND FAIR VALUE MEASUREMENTS (continued)
The Trustees have adopted Valuation Procedures that govern the valuation of the portfolio investments held by the Fund, including investments for which market quotations are not readily available. The Trustees have delegated to GSAM day-to-day responsibility for implementing and maintaining internal controls and procedures related to the valuation of the Fund’s portfolio investment. To assess the continuing appropriateness of pricing sources and methodologies, GSAM regularly performs price verification procedures and issues challenges as necessary to third party pricing vendors or brokers, and any differences are reviewed in accordance with the Valuation Procedures.
A. Level 1 and Level 2 Fair Value Investments — The valuation techniques and significant inputs used in determining the fair values for investments classified as Level 1 and Level 2 are as follows:
Equity Securities — Equity securities and investment companies traded on a U.S. securities exchange or the NASDAQ system, or those located on certain foreign exchanges, including but not limited to the Americas, are valued daily at their last sale price or official closing price on the principal exchange or system on which they are traded. If no sale occurs, equity securities and exchange traded investment companies are valued at the last bid price for long positions and at the last ask price for short positions. Investments in investment companies (other than those that are exchange traded) are valued at the NAV on the valuation date. To the extent these investments are actively traded, they are classified as Level 1 of the fair value hierarchy.
Unlisted equity securities for which market quotations are available are valued at the last sale price on the valuation date, or if no sale occurs, at the last bid price. Securities traded on certain foreign securities exchanges are valued daily at fair value determined by an independent fair value service (if available) under valuation procedures approved by the trustees and consistent with applicable regulatory guidance. The independent fair value service takes into account multiple factors including, but not limited to, movements in the securities markets, certain depositary receipts, futures contracts and foreign currency exchange rates that have occurred subsequent to the close of the foreign securities exchange. Investments applying these valuation adjustments are classified as Level 2 of the fair value hierarchy.
Debt Securities — Debt securities for which market quotations are readily available are valued daily on the basis of quotations supplied by dealers or an independent pricing service approved by the trustees. The pricing services may use valuation models or matrix pricing, which consider: (i) yield or price with respect to bonds that are considered comparable in characteristics such as rating, interest rate and maturity date or (ii) quotations from securities dealers to determine current value. Short-term debt obligations that mature in sixty days or less and that do not exhibit signs of credit deterioration are valued at amortized cost, which approximates fair value. With the exception of treasury securities, which are generally classified as Level 1, these investments are generally classified as Level 2 of the fair value hierarchy.
17
GOLDMAN SACHS VARIABLE INSURANCE TRUST LARGE CAP VALUE FUND
Notes to Financial Statements (continued)
December 31, 2012
3. INVESTMENTS AND FAIR VALUE MEASUREMENTS (continued)
B. Level 3 Fair Value Investments — The valuation techniques and significant inputs used in determining the fair values for investments classified as Level 3 are as follows:
To the extent that the aforementioned significant inputs are unobservable, or if quotations are not readily available, or if GSAM believes that such quotations do not accurately reflect fair value, the fair value of the Fund’s investments may be determined under valuation procedures approved by the trustees. GSAM, consistent with its procedures and applicable regulatory guidance, may make an adjustment to the most recent valuation prices of either domestic or foreign securities in light of significant events to reflect what it believes to be the fair value of the securities at the time of determining the Fund’s NAV. Significant events which could affect a large number of securities in a particular market may include, but are not limited to: significant fluctuations in U.S. or foreign markets; market dislocations; market disruptions; or unscheduled market closings. Significant events which could also affect a single issuer may include, but are not limited to: corporate actions such as reorganizations, mergers and buy-outs; ratings downgrades; and bankruptcies.
C. Fair Value Hierarchy — The following is a summary of the Fund’s investments classified in the fair value hierarchy as of December 31, 2012:
| Investment Type | Level 1 | Level 2 | Level 3 | |||||||||
| Assets | ||||||||||||
Common Stock and/or Other Equity Investments | $ | 1,074,695,785 | $ | — | $ | — | ||||||
For further information regarding security characteristics, see the Schedule of Investments.
4. AGREEMENTS AND AFFILIATED TRANSACTIONS
A. Management Agreement — Under the Agreement, GSAM manages the Fund, subject to the general supervision of the trustees.
As compensation for the services rendered pursuant to the Agreement, the assumption of the expenses related thereto and administration of the Fund’s business affairs, including providing facilities, GSAM is entitled to a management fee, accrued daily and paid monthly, equal to an annual percentage rate of the Fund’s average daily net assets.
For the fiscal year ended December 31, 2012, contractual and effective net management fees with GSAM were at the following rates:
| Contractual Management Fee Rate | ||||||||||||||||||||||||||
| First $1 billion | Next $1 billion | Next $3 billion | Next $3 billion | Over $8 billion | Effective Rate | Effective Net Management Fee Rate | ||||||||||||||||||||
| 0.75% | 0.68 | % | 0.65 | % | 0.64 | % | 0.63 | % | 0.74 | % | 0.72 | %* | ||||||||||||||
| * | GSAM agreed to waive a portion of its management fee in order to achieve the effective net management rate shown above through at least April 27, 2013. Prior to such date GSAM may not terminate the arrangement without the approval of the trustees. For the fiscal year ended December 31, 2012, GSAM waived approximately $200,000 of its management fee. |
18
GOLDMAN SACHS VARIABLE INSURANCE TRUST LARGE CAP VALUE FUND
4. AGREEMENTS AND AFFILIATED TRANSACTIONS (continued)
B. Distribution and Service Plan — The Trust, on behalf of the Service Shares of the Fund, has adopted a Distribution and Service Plan (the “Plan”). Under the Plan, Goldman Sachs, which serves as distributor (the “Distributor”), is entitled to a fee accrued daily and paid monthly for distribution services, which may then be paid by Goldman Sachs to authorized dealers, equal to, on an annual basis, 0.25% of the Fund’s average daily net assets attributable to Service Shares.
C. Transfer Agency Agreement — Goldman Sachs also serves as the transfer agent of the Fund for a fee pursuant to a Transfer Agency Agreement. The fees charged for such transfer agency services are accrued daily and paid monthly at an annual rate of 0.02% of the average daily net assets of Institutional and Service Shares.
D. Other Expense Agreements and Affiliated Transactions — GSAM has agreed to limit certain “Other Expense” of the Fund (excluding management fees, distribution and service fees, acquired fund fees and expenses, transfer agent fees and expenses, taxes, interest, brokerage fees, litigation, indemnification, shareholder meeting and other extraordinary expenses) to the extent such expenses exceed, on an annual basis, a percentage rate of the average daily net assets of the Fund. Such Other Expense reimbursements, if any, are accrued daily and paid monthly. In addition, the Fund is not obligated to reimburse GSAM for prior fiscal year expense reimbursements, if any. The Other Expense limitation as an annual percentage rate of average daily net assets for the Fund is 0.114%. These Other Expense reimbursements will remain in place through at least April 27, 2013, and prior to such date GSAM may not terminate the arrangement without the approval of the trustees. For the fiscal year ended December 31, 2012, GSAM did not make any reimbursements to the Fund. In addition, the Fund has entered into certain offset arrangements with the custodian and transfer agent, which may result in a reduction of the Fund’s expenses and are received irrespective of the application of the “Other Expense” limitation described above. For the fiscal year ended December 31, 2012, custody fee credits were approximately $16,700.
As of December 31, 2012, the amounts owed to affiliates of the Fund were approximately $662,800, $154,200, and $18,300 for management, distribution and service, and transfer agent fees, respectively.
E. Line of Credit Facility — As of December 31, 2012, the Fund participated in a $630,000,000 committed, unsecured revolving line of credit facility (the “facility”) together with other funds of the Trust and registered investment companies having management agreements with GSAM or its affiliates (“Other Borrowers”). Pursuant to the terms of the facility, the Fund and Other Borrowers could increase the credit amount by an additional $340,000,000, for a total of up to $970,000,000. This facility is to be used solely for temporary or emergency purposes, which may include the funding of redemptions. The interest rate on borrowings is based on the federal funds rate. The facility also requires a fee to be paid by the Fund based on the amount of the commitment that has not been utilized. For the fiscal year ended December 31, 2012, the Fund did not have any borrowings under the facility. Prior to May 8, 2012, the amount available through the facility was $580,000,000.
F. Other Transactions with Affiliates — For the fiscal year ended December 31, 2012, Goldman Sachs earned approximately $4,000 in brokerage commissions from portfolio transactions on behalf of the Fund.
19
GOLDMAN SACHS VARIABLE INSURANCE TRUST LARGE CAP VALUE FUND
Notes to Financial Statements (continued)
December 31, 2012
5. PORTFOLIO SECURITIES TRANSACTIONS
The cost of purchases and proceeds from sales and maturities of long-term securities for the fiscal year ended December 31, 2012, were $1,430,019,733 and $1,795,808,221, respectively.
6. TAX INFORMATION
The tax character of distributions paid during the fiscal years ended December 31, 2011 and December 31, 2012 was as follows:
| 2011 | 2012 | |||||||
| Distributions paid from: | ||||||||
| Ordinary income | $ | 15,017,151 | $ | 26,723,306 | ||||
| Net long-term capital gains | — | 12,804,617 | ||||||
| Total taxable distributions | $ | 15,017,151 | $ | 39,527,923 | ||||
As of December 31, 2012, the components of accumulated earnings (losses) on a tax-basis were as follows:
| Undistributed ordinary income — net | $ | 7,378,317 | ||
| Undistributed long-term capital gains | 3,153,046 | |||
| Total undistributed earnings | $ | 10,531,363 | ||
| Unrealized gains — net | 79,561,665 | |||
| Total accumulated gains — net | $ | 90,093,028 |
| The | Fund utilized $43,690,156 of capital losses in the current fiscal year. |
As of December 31, 2012, the Fund’s aggregate security unrealized gains and losses based on cost for U.S. federal income tax purposes were as follows:
| Tax cost | $ | 995,134,120 | ||
| Gross unrealized gain | 106,230,503 | |||
| Gross unrealized loss | (26,668,838 | ) | ||
| Net unrealized security gain | $ | 79,561,665 |
20
GOLDMAN SACHS VARIABLE INSURANCE TRUST LARGE CAP VALUE FUND
6. TAX INFORMATION (continued)
The difference between GAAP-basis and tax-basis unrealized gains (losses) is attributable primarily to wash sales.
In order to present certain components of the Fund’s capital accounts on a tax-basis, the Fund has reclassified $2,437,817 from undistributed net investment income to accumulated net realized gain (loss). These reclassifications have no impact on the net asset value of the Fund and result primarily from differences in the tax treatment of underlying fund investments.
GSAM has reviewed the Fund’s tax positions for all open tax years (the current and prior three years, as applicable) and has concluded that no provision for income tax is required in the Fund’s financial statements. Such open tax years remain subject to examination and adjustment by tax authorities.
7. OTHER RISKS
The Fund’s risks include, but are not limited to, the following:
Shareholder Concentration Risk — Certain participating insurance companies, accounts, or Goldman Sachs affiliates may from time to time own (beneficially or of record) or control a significant percentage of the Fund’s shares. Redemptions by these entities of their holdings in the Fund may impact the Fund’s liquidity and NAV. These redemptions may also force the Fund to sell securities.
Liquidity Risk — The Fund may make investments that are illiquid or that may become less liquid in response to market developments or adverse investor perceptions. Illiquid investments may be more difficult to value. Liquidity risk may also refer to the risk that the Fund will not be able to pay redemption proceeds within the allowable time period because of unusual market conditions, an unusually high volume of redemption requests, or other reasons. To meet redemption requests, the Fund may be forced to sell investments at an unfavorable time and/or under unfavorable conditions.
Market and Credit Risks — In the normal course of business, the Fund trades financial instruments and enters into financial transactions where risk of potential loss exists due to changes in the market (market risk). Additionally, the Fund may also be exposed to credit risk in the event that an issuer fails to perform or that an institution or entity with which the Fund has unsettled or open transactions defaults.
21
GOLDMAN SACHS VARIABLE INSURANCE TRUST LARGE CAP VALUE FUND
Notes to Financial Statements (continued)
December 31, 2012
8. INDEMNIFICATIONS
Under the Trust’s organizational documents, its trustees, officers, employees and agents are indemnified, to the extent permitted by the Act, against certain liabilities that may arise out of performance of their duties to the Fund. Additionally, in the course of business, the Fund enters into contracts that contain a variety of indemnification clauses. The Fund’s maximum exposure under these arrangements is unknown, as this would involve future claims that may be made against the Fund that have not yet occurred. However, GSAM believes the risk of loss under these arrangements to be remote.
9. OTHER MATTERS
New Accounting Pronouncement — In December 2011, the Financial Accounting Standards Board issued an Accounting Standards Update (“ASU”) to enhance disclosures about financial instruments and derivative instruments that are subject to offsetting (“netting”) on the Statement of Assets and Liabilities. This information will enable users of the Fund’s financial statements to evaluate the effect or potential effect of netting arrangements on the Fund’s financial position. The ASU is effective for financial statements with fiscal years beginning on or after January 1, 2013, and interim periods within those fiscal years. At this time, GSAM is evaluating the implications of these changes on the financial statements.
10. SUBSEQUENT EVENTS
Subsequent events after the Statement of Assets and Liabilities date have been evaluated through the date the financial statements were issued. GSAM has concluded that there is no impact requiring adjustment or disclosure in the financial statements.
22
GOLDMAN SACHS VARIABLE INSURANCE TRUST LARGE CAP VALUE FUND
11. SUMMARY OF SHARE TRANSACTIONS
Share activity is as follows:
| For the Fiscal Year Ended December 31, 2012 | For the Fiscal Year Ended December 31, 2011 | |||||||||||||||
| Shares | Dollars | Shares | Dollars | |||||||||||||
| Institutional Shares | ||||||||||||||||
| Shares sold | 2,229,900 | $ | 23,125,316 | 5,453,432 | $ | 52,432,441 | ||||||||||
| Reinvestment of distributions | 1,248,503 | 13,421,407 | 604,560 | 5,580,091 | ||||||||||||
| Shares redeemed | (15,685,268 | ) | (161,397,158 | ) | (10,688,404 | ) | (108,271,184 | ) | ||||||||
| (12,206,865 | ) | (124,850,435 | ) | (4,630,412 | ) | (50,258,652 | ) | |||||||||
| Service Shares | ||||||||||||||||
| Shares sold | 8,685,922 | 88,642,290 | 36,038,573 | 354,404,743 | ||||||||||||
| Reinvestment of distributions | 2,430,775 | 26,106,516 | 1,023,542 | 9,437,060 | ||||||||||||
| Shares redeemed | (34,228,911 | ) | (350,416,157 | ) | (11,307,596 | ) | (114,125,231 | ) | ||||||||
| (23,112,214 | ) | (235,667,351 | ) | 25,754,519 | 249,716,572 | |||||||||||
| NET INCREASE (DECREASE) | (35,319,079 | ) | $ | (360,517,786 | ) | 21,124,107 | $ | 199,457,920 | ||||||||
23
Report of Independent Registered Public Accounting Firm
To the Board of Trustees and Shareholders of
Goldman Sachs Variable Insurance Trust — Goldman Sachs Large Cap Value Fund:
In our opinion, the accompanying statement of assets and liabilities, including the schedule of investments, and the related statements of operations and of changes in net assets and the financial highlights present fairly, in all material respects, the financial position of Goldman Sachs Large Cap Value Fund (the “Fund”) at December 31, 2012, the results of its operations, the changes in its net assets and the financial highlights for each of the periods indicated, in conformity with accounting principles generally accepted in the United States of America. These financial statements and financial highlights (hereafter referred to as “financial statements”) are the responsibility of the Fund’s management. Our responsibility is to express an opinion on these financial statements based on our audit. We conducted our audit of these financial statements in accordance with the standards of the Public Company Accounting Oversight Board (United States). Those standards require that we plan and perform the audit to obtain reasonable assurance about whether the financial statements are free of material misstatement. An audit includes examining, on a test basis, evidence supporting the amounts and disclosures in the financial statements, assessing the accounting principles used and significant estimates made by management, and evaluating the overall financial statement presentation. We believe that our audit, which included confirmation of securities at December 31, 2012 by correspondence with the custodian, brokers, and the application of alternative auditing procedures where securities purchased confirmations had not been received, provides a reasonable basis for our opinion.
PricewaterhouseCoopers LLP
Boston, Massachusetts
February 14, 2013
24
GOLDMAN SACHS VARIABLE INSURANCE TRUST LARGE CAP VALUE FUND
| Fund Expenses — Six Month Period Ended December 31, 2012 (Unaudited) |
As a shareholder of Institutional or Service Shares of the Fund, you incur ongoing costs, including management fees, distribution and service (12b-1) fees (with respect to Service Shares) and other Fund expenses. This example is intended to help you understand your ongoing costs (in dollars) of investing in the Institutional Shares and Service Shares of the Fund and to compare these costs with the ongoing costs of investing in other mutual funds.
The example is based on an investment of $1,000 invested at the beginning of the period and held for the entire period from July 1, 2012 through December 31, 2012.
Actual Expenses — The first line under each share class in the table below provides information about actual account values and actual expenses. You may use the information in this line, together with the amount you invested, to estimate the expenses that you paid over the period. Simply divide your account value by $1,000 (for example, an $8,600 account value divided by $1,000=8.6), then multiply the result by the number in the first line under the heading entitled “Expenses Paid” to estimate the expenses you paid on your account during this period.
Hypothetical Example for Comparison Purposes — The second line under each share class in the table below provides information about hypothetical account values and hypothetical expenses based on the Fund's actual net expense ratio and an assumed rate of return of 5% per year before expenses, which is not the Fund's actual return. The hypothetical account values and expenses may not be used to estimate the actual ending account balance or expenses you paid for the period. You may use this information to compare the ongoing costs of investing in the Funds and other funds. To do so, compare this 5% hypothetical example with the 5% hypothetical examples that appear in the shareholder reports of the other funds.
Please note that the expenses shown in the table are meant to highlight your ongoing costs only. As a shareholder of the Fund, you do not incur any transaction costs, such as sales charges, redemption fees, or exchange fees, but shareholders of other funds may incur such costs. The second line of the table is useful in comparing ongoing costs only, and will not help you determine the relative total costs of owning different funds whose shareholders may incur transaction cost.
| Share Class | Beginning Account Value 7/01/12 | Ending Account Value 12/31/12 | Expenses Paid for 6 Months Ended 12/31/12* | |||||||||
| Institutional | ||||||||||||
| Actual | $ | 1,000 | $ | 1,095.60 | $ | 4.00 | ||||||
| Hypothetical 5% return | 1,000 | 1,021.32 | + | 3.86 | ||||||||
| Service | ||||||||||||
| Actual | 1,000 | 1,094.80 | 5.32 | |||||||||
| Hypothetical 5% return | 1,000 | 1,020.06 | + | 5.13 | ||||||||
| * | Expenses are calculated using the Fund’s annualized net expense ratio for each class, which represents the ongoing expenses as a percentage of net assets for the six months ended December 31, 2012. Expenses are calculated by multiplying the annualized net expense ratio by the average account value for the period; then multiplying the result by the number of days in the most recent fiscal half year; and then dividing that result by the number of days in the fiscal year. The annualized net expense ratios for the period were 0.76% and 1.01% for the Institutional and Service Shares, respectively. |
| + | Hypothetical expenses are based on the Fund’s actual annualized net expense ratios and an assumed rate of return of 5% per year before expenses. |
25
GOLDMAN SACHS VARIABLE INSURANCE TRUST LARGE CAP VALUE FUND
Trustees and Officers (Unaudited)
Independent Trustees
| Name, Address and Age1 | Position(s) Held with the Trust | Term of Office and | Principal Occupation(s) During Past 5 Years | Number of Portfolios in Fund Complex Overseen by Trustee3 | Other Directorships Held by Trustee4 | |||||||
Ashok N. Bakhru Age: 70 | Chairman of the Board of Trustees | Since 1996 (Trustee since 1991) | Mr. Bakhru is retired. He is President, ABN Associates (1994-1996 and 1998-Present); Director, Apollo Investment Corporation (a business development company) (2008-Present); Member of Cornell University Council (1992-2004 and 2006-Present); and was formerly Trustee, Scholarship America (1998-2005); Trustee, Institute for Higher Education Policy (2003-2008); Director, Private Equity Investors — III and IV (1998-2007), and Equity-Linked Investors II (April 2002-2007).
Chairman of the Board of Trustees — Goldman Sachs Mutual Fund Complex. | 111 | Apollo Investment Corporation (a business development company) | |||||||
Donald C. Burke Age: 52 | Trustee | Since 2010 | Mr. Burke is retired. He is Director, Avista Corp. (2011-Present); and was formerly a Director, BlackRock Luxembourg and Cayman Funds (2006-2010); President and Chief Executive Officer, BlackRock U.S. Funds (2007-2009); Managing Director, BlackRock, Inc. (2006-2009); Managing Director, Merrill Lynch Investment Managers, L.P. (“MLIM”) (2006); First Vice President, MLIM (1997-2005); Chief Financial Officer and Treasurer, MLIM U.S. Funds (1999-2006).
Trustee — Goldman Sachs Mutual Fund Complex. | 110 | Avista Corp. (an energy company) | |||||||
John P. Coblentz, Jr. Age: 71 | Trustee | Since 2003 | Mr. Coblentz is retired. Formerly, he was Partner, Deloitte & Touche LLP (1975-2003); Director, Emerging Markets Group, Ltd. (2004-2006); and Director, Elderhostel, Inc. (2006-2012).
Trustee — Goldman Sachs Mutual Fund Complex. | 111 | None | |||||||
Diana M. Daniels Age: 63 | Trustee | Since 2007 | Ms. Daniels is retired. Formerly, she was Vice President, General Counsel and Secretary, The Washington Post Company (1991-2006). Ms. Daniels is a Vice Chairman of the Board of Trustees, Cornell University (2009-Present); Member, Advisory Board, Psychology Without Borders (international humanitarian aid organization) (2007-Present), and former Member of the Legal Advisory Board, New York Stock Exchange (2003-2006) and of the Corporate Advisory Board, Standish Mellon Management Advisors (2006-2007).
Trustee — Goldman Sachs Mutual Fund Complex. | 110 | None | |||||||
Joseph P. LoRusso Age: 55 | Trustee | Since 2010 | Mr. LoRusso is retired. Formerly, he was President, Fidelity Investments Institutional Services Co. (“FIIS”) (2002-2008); Director, FIIS (2002-2008); Director, Fidelity Investments Institutional Operations Company (2003-2007); Executive Officer, Fidelity Distributors Corporation (2007-2008).
Trustee — Goldman Sachs Mutual Fund Complex. | 110 | None | |||||||
Jessica Palmer Age: 63 | Trustee | Since 2007 | Ms. Palmer is retired. She is Director, Emerson Center for the Arts and Culture (2011-Present); and was formerly a Consultant, Citigroup Human Resources Department (2007-2008); Managing Director, Citigroup Corporate and Investment Banking (previously, Salomon Smith Barney/Salomon Brothers) (1984-2006). Ms. Palmer was a Member of the Board of Trustees of Indian Mountain School (private elementary and secondary school) (2004-2009).
Trustee — Goldman Sachs Mutual Fund Complex. | 110 | None | |||||||
Richard P. Strubel Age: 73 | Trustee | Since 1987 | Mr. Strubel is retired. Formerly, he was Director, Cardean Learning Group (provider of educational services via the internet) (2003-2008); Trustee, Emeritus, The University of Chicago (1987-Present).
Trustee — Goldman Sachs Mutual Fund Complex. | 111 | The Northern Trust Mutual Fund Complex (64 Portfolios) (Chairman of the Board of Trustees); Gildan Activewear Inc. (a clothing marketing and manufacturing company). | |||||||
26
GOLDMAN SACHS VARIABLE INSURANCE TRUST LARGE CAP VALUE FUND
Trustees and Officers (Unaudited) (continued)
Interested Trustees
| Name, Address and Age1 | Position(s) Held with the Trust | Term of Office and | Principal Occupation(s) During Past 5 Years | Number of Portfolios in Fund Complex Overseen by Trustee3 | Other Directorships Held by Trustee4 | |||||||
James A. McNamara* Age: 50 | President and Trustee | Since 2007 | Managing Director, Goldman Sachs (December 1998-Present); Director of Institutional Fund Sales, GSAM (April 1998-December 2000); and Senior Vice President and Manager, Dreyfus Institutional Service Corporation (January 1993- April 1998).
President — Goldman Sachs Mutual Fund Complex (November 2007-Present); Senior Vice President — Goldman Sachs Mutual Fund Complex (May 2007-November 2007); and Vice President — Goldman Sachs Mutual Fund Complex (2001-2007).
Trustee — Goldman Sachs Mutual Fund Complex (since November 2007 and December 2002-May 2004). | 111 | None | |||||||
Alan A. Shuch* Age: 63 | Trustee | Since 1990 | Advisory Director — GSAM (May 1999-Present); Consultant to GSAM (December 1994-May 1999); and Limited Partner, Goldman Sachs (December 1994-May 1999).
Trustee — Goldman Sachs Mutual Fund Complex. | 110 | None | |||||||
| * | These persons are considered to be “Interested Trustees” because they hold positions with Goldman Sachs and own securities issued by The Goldman Sachs Group, Inc. Each Interested Trustee holds comparable positions with certain other companies of which Goldman Sachs, GSAM or an affiliate thereof is the investment adviser, administrator and/or distributor. |
| 1 | Each Trustee may be contacted by writing to the Trustee, c/o Goldman Sachs, 200 West Street, New York, New York, 10282, Attn: Caroline Kraus. Information is provided as of December 31, 2012. |
| 2 | Each Trustee holds office for an indefinite term until the earliest of: (a) the election of his or her successor; (b) the date the Trustee resigns or is removed by the Board of Trustees or shareholders, in accordance with the Trust’s Declaration of Trust; (c) the conclusion of the first Board meeting held subsequent to the day the Trustee attains the age of 74 years (in accordance with the current resolutions of the Board of Trustees, which may be changed by the Trustees without shareholder vote); or (d) the termination of the Trust. |
| 3 | The Goldman Sachs Mutual Fund Complex consists of the Trust, Goldman Sachs Trust II, Goldman Sachs Municipal Opportunity Fund, Goldman Sachs Credit Strategies Fund, and Goldman Sachs Trust. As of December 31, 2012, the Trust consisted of 12 portfolios. Goldman Sachs Trust II consisted of 1 portfolio (which did not offer shares to the public); Goldman Sachs Municipal Opportunity Fund did not offer shares to the public; and Goldman Sachs Trust consisted of 96 portfolios (80 of which offered shares to the public). |
| 4 | This column includes only directorships of companies required to report to the Securities and Exchange Commission under the Securities Exchange Act of 1934 (i.e., “public companies”) or other investment companies registered under the Act. |
Additional information about the Trustees is available in the Fund’s Statement of Additional Information, which can be obtained from Goldman Sachs free of charge by calling this toll-free number (in the United States of America): 1-800-292-4726.
27
GOLDMAN SACHS VARIABLE INSURANCE TRUST LARGE CAP VALUE FUND
Trustees and Officers (Unaudited) (continued)
Officers of the Trust*
| Name, Address and Age | Position(s) Held With the Trust | Term of Office and | Principal Occupation(s) During Past 5 Years | |||
James A. McNamara 200 West Street New York, NY 10282 Age: 50 | President and Trustee | Since 2007 | Managing Director, Goldman Sachs (December 1998-Present); Director of Institutional Fund Sales, GSAM (April 1998-December 2000); and Senior Vice President and Manager, Dreyfus Institutional Service Corporation (January 1993-April 1998). President — Goldman Sachs Mutual Fund Complex (November 2007-Present); Senior Vice President — Goldman Sachs Mutual Fund Complex (May 2007-November 2007); and Vice President — Goldman Sachs Mutual Fund Complex (2001-2007). Trustee — Goldman Sachs Mutual Fund Complex (November 2007-Present and December 2002-May 2004). | |||
George F. Travers 30 Hudson Street Jersey City, NJ 07302 Age: 44 | Senior Vice President and Principal Financial Officer | Since 2009 | Managing Director, Goldman Sachs (2007-Present); Managing Director, UBS Ag (2005-2007); and Partner, Deloitte & Touche LLP (1990-2005, partner from 2000-2005). Senior Vice President and Principal Financial Officer — Goldman Sachs Mutual Fund Complex. | |||
Caroline Kraus 200 West Street New York, NY 10282 Age: 35 | Secretary | Since 2012 | Vice President, Goldman Sachs (August 2006-Present); Associate General Counsel, Goldman Sachs (2012-Present); Assistant General Counsel, Goldman Sachs (August 2006-December 2011) and Associate, Weil, Gotshal & Manges-LLP (2002-2006). Secretary — Goldman Sachs Mutual Fund Complex (August 2012-Present) and Assistant Secretary — Goldman Sachs Mutual Fund Complex (June 2012-August 2012). | |||
Scott M. McHugh 200 West Street New York, NY 10282 Age: 41 | Treasurer and Senior Vice President | Since 2009 | Vice President, Goldman Sachs (February 2007-Present); Assistant Treasurer of certain mutual funds administered by DWS Scudder (2005-2007); and Director (2005-2007), Vice President (2000-2005) and Assistant Vice President (1998-2000), Deutsche Asset Management or its predecessor (1998-2007). Treasurer — Goldman Sachs Mutual Fund Complex (October 2009-Present); Senior Vice President — Goldman Sachs Mutual Fund Complex (November 2009-Present); and Assistant Treasurer — Goldman Sachs Mutual Fund Complex (May 2007-October 2009). | |||
| 1 | Officers hold office at the pleasure of the Board of Trustees or until their successors are duly elected and qualified. Each officer holds comparable positions with certain other companies of which Goldman Sachs, GSAM or an affiliate thereof is the investment adviser, administrator and/or distributor. Information is provided as of December 31, 2012. |
| * | Represents a partial list of officers of the Trust. Additional information about all the officers is available in the Fund’s Statement of Additional Information, which can be obtained from Goldman Sachs free of charge by calling this toll-free number (in the United States): 1-800-292-4726. |
Goldman Sachs Variable Insurance Trust — Tax Information (Unaudited)
For the year ended December 31, 2012, 71.03% of the dividends paid from net investment company taxable income by the Large Cap Value Fund qualify for the dividends received deduction available to corporations.
Pursuant to Section 852 of the Internal Revenue Code, the Large Cap Value Fund designates $12,804,617, or, if different, the maximum amount allowable, as capital gain dividends paid during the fiscal year ended December 31, 2012.
28
| TRUSTEES | OFFICERS | |
| Ashok N. Bakhru, Chairman | James A. McNamara, President | |
| Donald C. Burke | George F. Travers, Principal Financial Officer | |
| John P. Coblentz, Jr. | Caroline L. Kraus, Secretary | |
| Diana M. Daniels | Scott M. McHugh, Treasurer | |
| Joseph P. LoRusso | ||
| James A. McNamara | ||
| Jessica Palmer | ||
| Alan A. Shuch | ||
| Richard P. Strubel |
GOLDMAN, SACHS & CO.
Distributor and Transfer Agent
GOLDMAN SACHS ASSET MANAGEMENT, L.P.
Investment Adviser
200 West Street, New York
New York 10282
Visit our website at www.goldmansachsfunds.com/vit to obtain the most recent month-end returns.
The reports concerning the Fund included in this shareholder report may contain certain forward-looking statements about the factors that may affect the performance of the Fund in the future. These statements are based on Fund management’s predictions and expectations concerning certain future events and their expected impact on the Fund, such as performance of the economy as a whole and of specific industry sectors, changes in the levels of interest rates, the impact of developing world events, and other factors that may influence the future performance of the Fund. Management believes these forward-looking statements to be reasonable, although they are inherently uncertain and difficult to predict. Actual events may cause adjustments in portfolio management strategies from those currently expected to be employed.
A description of the policies and procedures that the Fund uses to determine how to vote proxies relating to portfolio securities and information regarding how the Fund voted proxies relating to portfolio securities for the 12-month period ended June 30 is available (i) without charge, upon request by calling 1-800-621-2550; and (ii) on the Securities and Exchange Commission (“SEC”) website at http://www.sec.gov.
The Fund files its complete schedule of portfolio holdings with the SEC for the first and third quarters of each fiscal year on Form N-Q. The Fund’s Form N-Q is available on the SEC’s website at http://www.sec.gov within 60 days after the Fund’s first and third fiscal quarters. The Fund’s Forms N-Q may be reviewed and copied at the SEC’s Public Reference Room in Washington, D.C. and information on the operation of the Public Reference Room may also be obtained by calling 1-800-SEC-0330. Forms N-Q may be obtained upon request and without charge by calling 1-800-621-2550.
Holdings and allocations shown are as of December 31, 2012 and may not be representative of future investments. Fund holdings should not be relied on in making investment decisions and should not be construed as research or investment advice regarding particular securities.
The Global Industry Classification Standard (“GICS”) was developed by and is the exclusive property and a service mark of Morgan Stanley Capital International Inc. (“MSCI”) and Standard & Poor’s, a division of The McGraw-Hill Companies, Inc. (“S&P”) and is licensed for use by Goldman Sachs. Neither MSCI, S&P nor any other party involved in making or compiling the GICS or any GICS classifications makes any express or implied warranties or representations with respect to such standard or classification (or the results to be obtained by the use thereof), and all such parties hereby expressly disclaim all warranties of originality, accuracy, completeness, merchantability or fitness for a particular purpose with respect to any of such standard or classification. Without limiting any of the foregoing, in no event shall MSCI, S&P, any of their affiliates or any third party involved in making or compiling the GICS or any GICS classifications have any liability for any direct, indirect, special, punitive, consequential or any other damages (including lost profits) even if notified of the possibility of such damages.
The portfolio risk management process includes an effort to monitor and manage risk, but does not imply low risk.
Shares of the Goldman Sachs VIT Funds are offered to separate accounts of participating life insurance companies for the purpose of funding variable annuity contracts and variable life insurance policies. Shares of the Fund are not offered directly to the general public. The variable annuity contracts and variable life insurance policies are described in the separate prospectuses issued by participating insurance companies. You should refer to those prospectuses for information about surrender charges, mortality and expense risk fees and other charges that may be assessed by participating insurance companies under the variable annuity contracts or variable life insurance policies. Such fees or charges, if any, may affect the return you may realize with respect to your investments. Ask your representative for more complete information. Please consider a fund’s objectives, risks and charges and expenses, and read the prospectus carefully before investing. The prospectus contains this and other information about the Fund.
This material is not authorized for distribution to prospective investors unless preceded or accompanied by a current Prospectus or summary prospectus, if applicable. Investors should consider a Fund’s objective, risks, and charges and expenses, and read the summary prospectus, if available, and/or the Prospectus carefully before investing or sending money. The summary prospectus, if available, and the Prospectus contain this and other information about a Fund and may be obtained from your Authorized Institution or from Goldman, Sachs & Co. by calling 1-800-621-2550.
Toll Free (in U.S.): 800-292-4726
This report is prepared for the general information of contract owners and is not an offer of shares of the Goldman Sachs Variable Insurance Trust: Goldman Sachs Large Cap Value Fund.
© 2013 Goldman Sachs. All rights reserved.
VITLCVAR13/92372.MF.MED.TMPL/2/2013
Goldman
Sachs Variable Insurance Trust
Goldman Sachs
Mid Cap Value Fund
Annual Report
December 31, 2012

GOLDMAN SACHS VARIABLE INSURANCE TRUST MID CAP VALUE FUND
Principal Investment Strategies and Risks
This is not a complete list of risks that may affect the Fund. For additional information concerning the risks applicable to the Fund, please see the Fund’s Prospectus.
Shares of the Goldman Sachs Variable Insurance Trust — Goldman Sachs Mid Cap Value Fund are offered to separate accounts of participating life insurance companies for the purpose of funding variable annuity contracts and variable life insurance policies. Shares of the Fund are not offered directly to the general public. The variable annuity contracts and variable life insurance policies are described in the separate prospectuses issued by participating insurance companies. You should refer to those prospectuses for information about surrender charges, mortality and expense risk fees and other charges that may be assessed by participating insurance companies under the variable annuity contracts or variable life insurance policies. Such fees or charges, if any, may affect the return you realize with respect to your investments. Ask your representative for more complete information. Please consider the Fund’s objective, risks and charges and expenses, and read the Prospectus carefully before investing. The Prospectus contains this and other information about the Fund.
The Goldman Sachs Mid Cap Value Fund invests primarily in mid-capitalization U.S. equity investments. The Fund’s equity investments are subject to market risk, which means that the value of the securities in which it invests may go up or down in response to the prospects of individual companies, particular industry sectors and/or general economic conditions. The securities of mid-capitalization companies involve greater risks than those associated with larger, more established companies and may be subject to more abrupt or erratic price movements. Different investment styles (e.g., “value”) tend to shift in and out of favor, and at times the Fund may underperform other funds that invest in similar asset classes.
1
GOLDMAN SACHS VARIABLE INSURANCE TRUST MID CAP VALUE FUND
INVESTMENT OBJECTIVE
The Fund seeks long-term capital appreciation.
Portfolio Management Discussion and Analysis
Below, the Goldman Sachs Value Portfolio Management Team discusses the Goldman Sachs Variable Insurance Trust — Goldman Sachs Mid Cap Value Fund’s (the “Fund”) performance and positioning for the 12-month period ended December 31, 2012 (the “Reporting Period”).
How did the Fund perform during the Reporting Period?
During the Reporting Period, the Fund’s Institutional and Service Shares generated average annual total returns of 18.41% and 18.13%, respectively. These returns compare to the 18.45% average annual total return of the Fund’s benchmark, the Russell Midcap® Value Index* (with dividends reinvested) (the “Russell Index”), during the same time period.
What economic and market factors most influenced the equity markets as a whole during the Reporting Period?
Representing the U.S. equity market, the S&P® 500 Index gained 15.96% during the Reporting Period to mark the fourth straight year of gains. The year 2012 started with the strongest first quarter since 1998 for the S&P® 500 Index. Also during the first quarter of 2012, the Dow Jones Industrial Average closed above 13,000 for the first time since May 2008, and the NASDAQ reached a new 11-year high. U.S. equities rose largely on evidence that the labor and manufacturing markets were improving. In addition, the Federal Reserve (the “Fed”) reaffirmed its commitment to low interest rates until at least late-2014.
U.S. equity markets slid, however, during the second quarter of 2012, when first quarter Gross Domestic Product (“GDP”) was revised down from 2.2% to 1.9% and employment reports suggested deterioration in the labor market. Spain’s banking system bailout and increasing concerns over Europe’s financial crisis weighed on global equity markets, including the U.S. equity market, as well. At the same time, disappointing economic reports from faster growing regions of the world renewed fears of a global economic slowdown.
During the summer of 2012, U.S. equity markets rallied back on more strong statements from central banks. In September, the Fed announced another round of quantitative easing, dubbed QE3, this time with no expiration date but with the explicit goal of reducing unemployment. The Fed also extended its policy of near-zero interest rates until at least mid-2015. In Europe, the European Central Bank (“ECB”) president Mario Draghi voiced strong support for the euro and the European Monetary Union, which was well received by financial markets in the U.S. Continued improvements in home prices and the Fed’s commitment to buy mortgage-backed securities increased hopes of a recovery in the housing market, which helped offset the downward pressures of lackluster economic growth and a stalled labor market.
There were increasing signs of economic recovery seen early in the fourth quarter of 2012. The U.S. reported better than expected third quarter GDP growth of 2%, the 13th consecutive quarter of economic expansion, and the unemployment rate dropped to 7.8%, the lowest rate seen since January 2009. U.S. manufacturing activity increased, and the housing market showed further signs of improvement, as construction of new homes hit a four-year high. Despite this positive data, the U.S. equity market pulled back in October on some cautious corporate earnings guidance. Also pressuring the U.S. equity market were the worst storm in decades battering the East Coast and polls showing the U.S. presidential race tightening to a dead heat.
The U.S. equity market crept higher in November 2012, as election day preserved the status quo in the White House and Congress, even as the “fiscal cliff” drew nearer. Housing starts and measures of employment improved, and manufacturing and non-manufacturing surveys showed expansion in the economy. In December 2012, further clarification from the Fed, tying its low interest rate policy to the condition that unemployment drop to 6.5% or lower helped to offset increasing worries about the then-looming fiscal cliff of tax increases and spending cuts.
For the Reporting Period as a whole, all ten sectors within the S&P® 500 Index posted gains. The consistent and persistent commitment to accommodative monetary policy from the U.S. Fed and other central banks drove market-leading returns in the
| * | The Russell Midcap Value Index is an unmanaged index of common stock prices that measures the performance of those Russell Midcap companies with lower price-to-book ratios and lower forecasted growth values. The Index figures do not reflect any deduction for fees, expenses or taxes. It is not possible to invest directly in an unmanaged index. |
2
GOLDMAN SACHS VARIABLE INSURANCE TRUST MID CAP VALUE FUND
financials sector. The heavily weighted financials sector was also the largest positive contributor (weight times performance) to S&P® 500 Index returns. On optimism about the economy and improved consumer confidence, the consumer discretionary sector also performed well. Conversely, the energy sector posted positive returns but was comparatively weak during the Reporting Period, as oil prices remained relatively stable, balancing continued unrest in several oil-producing regions with potential supply increases from U.S. shale production and a modest outlook for global economic growth.
All segments of the U.S. equity market advanced during the Reporting Period, with mid-cap stocks, as measured by the Russell Midcap® Index, gaining most, followed by large-cap stocks and then small-cap stocks, as measured by the Russell 1000® Index and the Russell 2000® Index, respectively, which performed similarly to each other. From a style perspective, value-oriented stocks solidly outpaced growth-oriented stocks across the capitalization spectrum. (All as measured by the Russell Investments indices.)
What key factors were responsible for the Fund’s performance during the Reporting Period?
Stock selection overall had the greatest effect on the Fund’s performance relative to the Russell Index during the Reporting Period.
Which equity market sectors most significantly affected Fund performance?
Detracting from the Fund’s relative results most was stock selection in the industrials, information technology and health care sectors, where company-specific issues weighed on certain holdings. Such detractors were only partially offset by effective stock selection in the financials, telecommunication service and materials sectors, which helped the Fund’s performance relative to the Russell Index.
Which stocks detracted significantly from the Fund’s performance during the Reporting Period?
Detracting from the Fund’s results relative to its benchmark index were positions in oilfield services firm Key Energy Services, communications equipment provider Polycom and mattress and pillow manufacturer Tempur-Pedic International.
In April 2012, Key Energy Services reported first calendar quarter earnings that missed profit expectations due to slow growth in U.S. natural gas drilling and increased costs associated with moving from a focus on natural gas to oil. Key Energy Services’ shares fell after the company’s earnings announcement, yet we felt the challenges the company faced could be temporary due to the transitional costs of shifting its business focus. However, in mid-June 2012, Key Energy Services again disappointed by lowering its second quarter and full-year forecasts, citing softer than expected revenue and decelerating growth in the liquid shale markets. Given our reduced conviction in the company, we subsequently sold the Fund’s position in Key Energy Services.
During the first three quarters of 2012, Polycom underperformed after pre-announcing that both revenue and earnings would miss expectations. The negative guidance was primarily driven by shortfalls in its Asia-Pacific and North America markets, as the company attempts to transition to a more software-oriented company. However, despite these near-term execution headwinds, we remained, at the end of the Reporting Period, positive on the company’s secular growth over the long term. We believe expectations for the company have been reset and that Polycom should be able to report strong earnings in the future, driven by product ramp execution and leverage to its new unified communications platform, Microsoft Lync.
Shares of Tempur-Pedic International fell as the company lowered its full year guidance for revenue growth. Also, its management indicated the company was facing increased competition, particularly from specialty mattress shops. While we continued, at the end of the Reporting Period, to believe there is significant opportunity for gross profit margin expansion, we exited the Fund’s position, as we believed our investment thesis may take longer to play out than originally anticipated.
What were some of the Fund’s best-performing individual stocks?
The Fund benefited most relative to the Russell Index from positions in specialty media company Scripps Networks Interactive, wine and spirits producer Constellation Brands and U.S. mobile operator Sprint Nextel.
During the Reporting Period, Scripps Networks Interactive, a cable television network that operates channels such as HGTV, the Food Network and the Travel Channel, was the top overall contributor to Fund returns. Its shares gained through 2012, as higher than expected affiliate fee and advertising growth drove earnings and revenues that exceeded analysts’ predictions. True to our sell discipline, we exited the position toward the end of the fourth calendar quarter.
Constellation Brands lowered guidance in early April 2012 due to higher than expected spending on advertising and new brand launches, causing the stock to sell off and creating what we felt was an attractive entry point for the Fund. Despite the market’s reaction, we were encouraged by the company reinvesting in its core business, and we thought the market was under-appreciating the volume acceleration that should occur as a result of the advertising. In late June, as Anheuser-Busch InBev purchased the remaining shares of Grupo Modelo, Constellation Brands made its own side deal with Anheuser-Busch InBev to purchase the rest
3
GOLDMAN SACHS VARIABLE INSURANCE TRUST MID CAP VALUE FUND
of its joint venture with Grupo Modelo. With the deal, Constellation Brands greatly decreased its funding costs and acquired a strong business for what we believe was an attractive price. At the end of the Reporting Period, we believed the wine and spirits market was fundamentally strong, which should allow Constellation Brands, in our view, to increase prices and maintain margins going forward.
Within the telecommunication services sectors, Sprint Nextel was the top contributor to the Fund’s relative results during the Reporting Period. Its shares gained sharply after the company reported a significant increase in its average revenue per subscriber during the second calendar quarter and raised 2012 profit targets. We sold out of the Fund’s position in October 2012 after the company agreed to sell 70% of its shares to SoftBank, a Japanese telecommunications company. We believe our investment thesis played out and therefore directed proceeds from the sale to ideas with what we considered to have more favorable risk/reward potential.
How did the Fund use derivatives and similar instruments during the Reporting Period?
During the Reporting Period, we did not use derivatives as part of an active management strategy.
Did the Fund make any significant purchases or sales during the Reporting Period?
During the Reporting Period, we initiated a Fund position in Lam Research, a supplier of integrated circuit processing equipment to the semiconductor industry. We believe the semiconductor cycle is currently bottoming out, driving potential for Lam Research to gain market share. We expect revenue and operating expenditure synergies from its recent deal with Novellus Systems coupled with its restructuring plan that we believe may increase its margins. Smart phone and tablet demand will, we believe, continue to drive the recovery in Lam Research’s end markets, with emerging market countries expected to fuel growth in the future. Lam Research continues to benefit from competition in the consumer electronics space, as companies attempt to push new products to remain competitive. We believe its increased scale and diversified product portfolio has better positioned Lam Research to gain market share and benefit from a recovery in semiconductor equipment spending. We also like that the company has continued to return excess capital to shareholders through its large share repurchase program.
We established a Fund position in Stanley Black & Decker, a diversified provider of power and hand tools as well as electronic monitoring and security systems. With an industry-leading position, we think the company’s advanced technology and differentiated products should continue to drive growth and market share gains. Moreover, the company recently announced its plans to divest its hardware and home improvement business to focus on higher growth and margins businesses, and we felt this was a positive development that gives us confidence in the company’s management team and its focus on shareholders. Finally, the company’s most recent $1.2 billion share repurchase authorization and debt reduction plan demonstrates to us the strength of its balance sheet, and we believe its valuation was compelling, especially relative to companies with exposure to construction end-markets, a segment we feel may well continue to see improvement.
In addition to the sale of Scripps Networks Interactive, already mentioned, we exited the Fund’s position in EQT, an integrated energy company with an emphasis on Appalachian area natural gas supply, transmission and distribution. EQT had been under pressure due to weak natural gas prices driven, in turn, by unusually warm winter conditions and excess supply from more efficient drilling techniques. Consequently, we decided to move the proceeds into higher conviction names within the energy sector.
Were there any notable changes in the Fund’s weightings during the Reporting Period?
In constructing the Fund’s portfolio, we focus on picking stocks rather than on making industry or sector bets. We seek to outpace the benchmark index by overweighting stocks that we expect to outperform and underweighting those that we think may lag. Consequently, changes in its sector weights are generally the direct result of individual stock selection or of stock appreciation or depreciation. That said, during the Reporting Period, the Fund’s exposure to consumer staples and materials increased compared to the Russell Index. The Fund’s allocation compared to the benchmark index in industrials and telecommunication services decreased. The Fund’s position in cash also decreased during the Reporting Period.
How was the Fund positioned relative to its benchmark index at the end of the Reporting Period?
At the end of December 2012, the Fund had an overweighted position relative to the Russell Index in the consumer discretionary sector. On the same date, the Fund had underweighted positions compared to the Russell Index in financials and industrials and was rather neutrally weighted to the Russell Index in consumer staples, energy, health care, information technology, materials and utilities. The Fund had no exposure to telecommunication services at the end of the Reporting Period.
4
GOLDMAN SACHS VARIABLE INSURANCE TRUST MID CAP VALUE FUND
What is the Fund’s tactical view and strategy for the months ahead?
After a strong 2012, we continue to see opportunities as we enter 2013 and remain constructive in our view ahead for U.S. equities. We recognize that fiscal policy may lead to a drag on economic growth and the recent steps taken by the Fed to provide additional monetary accommodation may not fully offset the impact. The political climate in the U.S., and the lack of clarity around the outcome of fiscal negotiations, has contributed to an elevated feeling of uncertainty for both businesses and individuals. However, corporate balance sheets remain strong, which we believe provides companies with the ability to generate shareholder value, even in a slower economic growth environment. U.S. equities remain inexpensive relative to both fixed income and history, and continued strength in the U.S. housing recovery should provide, in our view, support to the economy and boost confidence among consumers. Additional potential catalysts could be investors re-allocating to equities, multiple expansion, correlations trending down and increased merger and acquisition activity. “(When large numbers of stocks see their earnings multiples, or price/earnings ratios (share price divided by earnings per share), increase, the equity market is said to be undergoing multiple expansion. Changes in the earnings multiple of an individual stock are often evaluated in the context of earnings multiples of the general market. Correlation is simply a statistical measure of how two securities move in relation to each other.)”
We maintain high conviction in the companies the Fund owns and believe they have the potential to outperform relative to the broader market regardless of economic growth conditions. We continue to focus on undervalued companies in control of their own destiny, such as innovators in their industry, or companies with financial flexibility that have been investing in their own businesses and may be poised to gain market share. As we look ahead into 2013, we maintain our discipline in seeking to identify companies with strong or improving balance sheets, led by quality management teams and trading at discounted valuations. As always, deep research resources, a forward-looking investment process and truly actively managed portfolios are keys, in our view, to both preserving capital and outperforming the market over the long term.
5
FUND BASICS
Mid Cap Value Fund
as of December 31, 2012
STANDARDIZED TOTAL RETURNS1
| For the period ended 12/31/12 | One Year | Five Years | Ten Years | Since Inception | Inception Date | |||||||||||||
| Institutional | 18.41 | % | 3.05 | % | 9.76 | % | 7.88 | % | 5/01/98 | |||||||||
| Service | 18.13 | 2.79 | N/A | 4.24 | 1/09/06 | |||||||||||||
| 1 | The Standardized Total Returns are average annual total returns as of the most recent calendar quarter-end. They assume reinvestment of all distributions at net asset value (“NAV”). Because Institutional Shares and Service Shares do not involve a sales charge, such a charge is not applied to their Standardized Total Returns. |
Total return figures in the above chart represent past performance and do not indicate future results, which will vary. The investment return and principal value of an investment will fluctuate and, therefore, an investor’s shares, when redeemed, may be worth more or less than their original cost. Current performance may be lower or higher than the total return figures in the above chart. Please visit www.goldmansachsfunds.com/vit to obtain the most recent month-end returns. Performance reflects fee waivers and/or expense limitations in effect. In their absence, performance would be reduced.
EXPENSE RATIOS2
| Net Expense Ratio (Current) | Gross Expense Ratio (Before Waivers) | |||||||
| Institutional | 0.83 | % | 0.86 | % | ||||
| Service | 1.08 | 1.11 | ||||||
| 2 | The expense ratios of the Fund, both current (net of any fee waivers and/or expense limitations) and before waivers (gross of any fee waivers and/or expense limitations) are as set forth above according to the most recent publicly available Prospectus for the Fund and may differ from the expense ratios disclosed in the Financial Highlights of this report. The Fund’s waivers and/or expense limitations will remain in place through at least April 27, 2013, and prior to such date the investment adviser may not terminate the arrangements without the approval of the Fund’s Board of Trustees. If these arrangements are discontinued in the future, the expense ratios may change without shareholder approval. |
TOP TEN HOLDINGS AS OF 12/31/123
| Holding | % of Net Assets | Line of Business | ||||
| M&T Bank Corp. | 2.0% | Banks | ||||
| Aetna, Inc. | 1.9 | Health Care Equipment & Services | ||||
| Lam Research Corp. | 1.8 | Semiconductors & Semiconductor Equipment | ||||
| Principal Financial Group, Inc. | 1.7 | Insurance | ||||
| Cameron International Corp. | 1.6 | Energy | ||||
| SLM Corp. | 1.6 | Diversified Financials | ||||
| Invesco Ltd. | 1.6 | Diversified Financials | ||||
| Dover Corp. | 1.5 | Capital Goods | ||||
| Ventas, Inc. | 1.5 | Real Estate Investment Trust | ||||
| Stanley Black & Decker, Inc. | 1.4 | Capital Goods | ||||
| 3 | The top 10 holdings may not be representative of the Fund’s future investments. |
6
FUND BASICS
FUND vs. BENCHMARK SECTOR ALLOCATIONS4
As of December 31, 2012
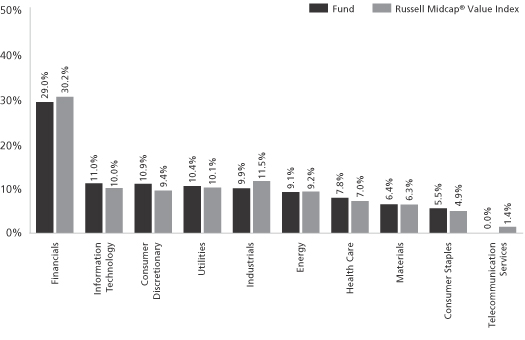
| 4 | The Fund is actively managed and, as such, its composition may differ over time. Consequently, the Fund’s overall sector allocations may differ from percentages contained in the graph above. The graph categorizes investments using Global Industry Classification (“GICS”), however, the sector classifications used by the portfolio management team may differ from GICS. The percentage shown for each investment category reflects the value of investments in that category as a percentage of market value. The graph depicts the Fund’s investments but may not represent the Fund’s market exposure due to the exclusion of certain derivatives, if any, as listed in the Additional Investment section of the Schedule of Investments. |
7
GOLDMAN SACHS VARIABLE INSURANCE TRUST MID CAP VALUE FUND
Performance Summary
December 31, 2012
The following graph shows the value, as of December 31, 2012, of a $10,000 investment made on January 1, 2003 in the Institutional Shares at NAV. For comparative purposes, the performance of the Fund’s benchmark, the Russell Midcap Value Index (with dividends reinvested), is shown. This performance data represents past performance and should not be considered indicative of future performance, which will fluctuate with changes in market conditions. These performance fluctuations will cause an investor’s shares, when redeemed, to be worth more or less than their original cost. Performance reflects Fund level expenses but does not reflect fees and expenses associated with any variable annuity contract or variable life insurance policy that uses the Fund as an investment option for any contract or policy. Had performance reflected all of those fees and expenses, performance would have been reduced. Performance also would have been reduced had expense limitations not been in effect. Performance of Service Shares will vary from Institutional Shares due to differences in class specific fees. In addition to the investment adviser’s decisions regarding issuer/industry investment selection and allocation, other factors may affect Fund performance. These factors include, but are not limited to, Fund operating fees and expenses, portfolio turnover, and subscription and redemption cash flows affecting the Fund.
Mid Cap Value Fund’s 10 Year Performance
Performance of a $10,000 investment, with distributions reinvested, from January 1, 2003 through December 31, 2012.
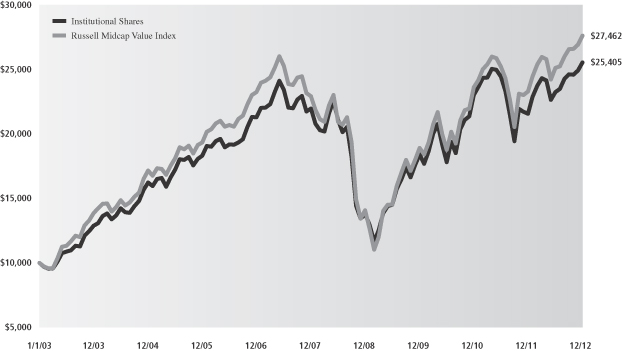
| Average Annual Total Return through December 31, 2012 | One Year | Five Years | Ten Years | Since Inception | ||||
Institutional (Commenced May 1, 1998) | 18.41% | 3.05% | 9.76% | 7.88% | ||||
Service (Commenced January 9, 2006) | 18.13% | 2.79% | N/A | 4.24% |
8
GOLDMAN SACHS VARIABLE INSURANCE TRUST MID CAP VALUE FUND
Schedule of Investments
December 31, 2012
| Shares | Description | Value | ||||||
| Common Stocks – 97.8% | ||||||||
| Automobiles & Components – 1.2% |
| ||||||
| 117,714 | Delphi Automotive PLC* | $ | 4,502,561 | |||||
| 101,309 | TRW Automotive Holdings Corp.* | 5,431,175 | ||||||
|
| |||||||
| 9,933,736 | ||||||||
|
| |||||||
| Banks – 4.1% |
| ||||||
| 228,229 | CIT Group, Inc.* | 8,818,769 | ||||||
| 168,753 | First Republic Bank | 5,531,723 | ||||||
| 166,641 | M&T Bank Corp. | 16,409,139 | ||||||
| 92,996 | SunTrust Banks, Inc. | 2,636,437 | ||||||
|
| |||||||
| 33,396,068 | ||||||||
|
| |||||||
| Capital Goods – 9.1% |
| ||||||
| 108,867 | B/E Aerospace, Inc.* | 5,378,030 | ||||||
| 5,789 | Carlisle Companies, Inc. | 340,162 | ||||||
| 192,392 | Dover Corp. | 12,642,078 | ||||||
| 2,147 | Flowserve Corp. | 315,179 | ||||||
| 284,417 | Fortune Brands Home & Security, Inc.* | 8,310,665 | ||||||
| 46,524 | Gardner Denver, Inc. | 3,186,894 | ||||||
| 158,368 | Lennox International, Inc. | 8,317,487 | ||||||
| 75,131 | Lincoln Electric Holdings, Inc. | 3,657,377 | ||||||
| 120,607 | Pentair Ltd. | 5,927,834 | ||||||
| 81,007 | Rockwell Automation, Inc. | 6,803,778 | ||||||
| 72,229 | Rockwell Collins, Inc. | 4,201,561 | ||||||
| 278,544 | Spirit Aerosystems Holdings, Inc. Class A* | 4,726,892 | ||||||
| 151,879 | Stanley Black & Decker, Inc. | 11,234,490 | ||||||
|
| |||||||
| 75,042,427 | ||||||||
|
| |||||||
| Commercial & Professional Services – 0.5% |
| ||||||
| 130,627 | Waste Connections, Inc. | 4,413,886 | ||||||
|
| |||||||
| Consumer Durables & Apparel – 2.1% |
| ||||||
| 227,177 | D.R. Horton, Inc. | 4,493,561 | ||||||
| 80,866 | PVH Corp. | 8,976,935 | ||||||
| 123,162 | Toll Brothers, Inc.* | 3,981,827 | ||||||
|
| |||||||
| 17,452,323 | ||||||||
|
| |||||||
| Consumer Services – 2.7% |
| ||||||
| 26,709 | Chipotle Mexican Grill, Inc.* | 7,944,859 | ||||||
| 742,403 | MGM Resorts International* | 8,641,571 | ||||||
| 92,576 | Starwood Hotels & Resorts Worldwide, Inc. | 5,310,159 | ||||||
|
| |||||||
| 21,896,589 | ||||||||
|
| |||||||
| Diversified Financials – 6.1% |
| ||||||
| 156,664 | Ameriprise Financial, Inc. | 9,811,866 | ||||||
| 500,001 | Invesco Ltd. | 13,045,026 | ||||||
| 122,623 | Lazard Ltd. Class A | 3,659,071 | ||||||
| 764,156 | SLM Corp. | 13,089,992 | ||||||
| 417,480 | The NASDAQ OMX Group, Inc. | 10,441,175 | ||||||
|
| |||||||
| 50,047,130 | ||||||||
|
| |||||||
| Energy – 8.9% |
| ||||||
| 240,570 | Cameron International Corp.* | 13,582,582 | ||||||
| 78,187 | Concho Resources, Inc.* | 6,298,745 | ||||||
|
| |||||||
| Common Stocks – (continued) | ||||||||
| Energy – (continued) |
| ||||||
| 168,576 | HollyFrontier Corp. | $ | 7,847,213 | |||||
| 168,559 | Marathon Petroleum Corp. | 10,619,217 | ||||||
| 158,757 | Peabody Energy Corp. | 4,224,524 | ||||||
| 83,709 | Pioneer Natural Resources Co. | 8,922,542 | ||||||
| 130,995 | Range Resources Corp. | 8,230,416 | ||||||
| 254,642 | Southwestern Energy Co.* | 8,507,589 | ||||||
| 113,265 | Tesoro Corp. | 4,989,323 | ||||||
|
| |||||||
| 73,222,151 | ||||||||
|
| |||||||
| Food, Beverage & Tobacco – 4.6% |
| ||||||
| 243,733 | Coca-Cola Enterprises, Inc. | 7,733,648 | ||||||
| 173,356 | Constellation Brands, Inc. Class A* | 6,135,069 | ||||||
| 30,338 | Ingredion, Inc. | 1,954,677 | ||||||
| 42,307 | Lorillard, Inc. | 4,935,958 | ||||||
| 116,991 | Monster Beverage Corp.* | 6,186,484 | ||||||
| 125,858 | The J.M. Smucker Co. | 10,853,994 | ||||||
|
| |||||||
| 37,799,830 | ||||||||
|
| |||||||
| Health Care Equipment & Services – 4.9% |
| ||||||
| 329,152 | Aetna, Inc. | 15,239,738 | ||||||
| 145,479 | AmerisourceBergen Corp. | 6,281,783 | ||||||
| 1,626,948 | Boston Scientific Corp.* | 9,322,412 | ||||||
| 471,913 | Hologic, Inc.* | 9,452,417 | ||||||
|
| |||||||
| 40,296,350 | ||||||||
|
| |||||||
| Household & Personal Products – 0.8% |
| ||||||
| 121,801 | Church & Dwight Co., Inc. | 6,524,880 | ||||||
|
| |||||||
| Insurance – 7.9% |
| ||||||
| 99,157 | Everest Re Group Ltd. | 10,902,312 | ||||||
| 285,847 | Hartford Financial Services Group, Inc. | 6,414,407 | ||||||
| 87,473 | PartnerRe Ltd. | 7,040,702 | ||||||
| 489,715 | Principal Financial Group, Inc. | 13,966,672 | ||||||
| 259,884 | W.R. Berkley Corp. | 9,808,022 | ||||||
| 193,797 | Willis Group Holdings PLC | 6,498,013 | ||||||
| 408,720 | XL Group PLC | 10,242,523 | ||||||
|
| |||||||
| 64,872,651 | ||||||||
|
| |||||||
| Materials – 6.2% |
| ||||||
| 98,631 | Albemarle Corp. | 6,126,958 | ||||||
| 174,175 | Carpenter Technology Corp. | 8,992,655 | ||||||
| 175,659 | Celanese Corp. Series A | 7,822,095 | ||||||
| 47,608 | Crown Holdings, Inc.* | 1,752,451 | ||||||
| 23,388 | Cytec Industries, Inc. | 1,609,796 | ||||||
| 56,105 | Martin Marietta Materials, Inc. | 5,289,579 | ||||||
| 45,145 | Packaging Corp. of America | 1,736,728 | ||||||
| 133,826 | Reliance Steel & Aluminum Co. | 8,310,595 | ||||||
| 562,217 | Sealed Air Corp. | 9,844,420 | ||||||
|
| |||||||
| 51,485,277 | ||||||||
|
| |||||||
| Media – 0.2% |
| ||||||
| 24,334 | Charter Communications, Inc. Class A* | 1,855,224 | ||||||
|
| |||||||
| The accompanying notes are an integral part of these financial statements. | 9 |
GOLDMAN SACHS VARIABLE INSURANCE TRUST MID CAP VALUE FUND
Schedule of Investments (continued)
December 31, 2012
| Shares | Description | Value | ||||||
| Common Stocks – (continued) | ||||||||
| Pharmaceuticals, Biotechnology & Life Sciences – 2.7% |
| ||||||
| 132,200 | Life Technologies Corp.* | $ | 6,488,376 | |||||
| 403,499 | Mylan, Inc.* | 11,088,152 | ||||||
| 108,254 | Vertex Pharmaceuticals, Inc.* | 4,540,173 | ||||||
|
| |||||||
| 22,116,701 | ||||||||
|
| |||||||
| Real Estate Investment Trust – 10.4% |
| ||||||
| 132,774 | Alexandria Real Estate Equities, Inc. | 9,203,894 | ||||||
| 75,969 | AvalonBay Communities, Inc. | 10,300,637 | ||||||
| 82,570 | Camden Property Trust | 5,632,100 | ||||||
| 146,047 | Douglas Emmett, Inc. | 3,402,895 | ||||||
| 614,075 | Host Hotels & Resorts, Inc. | 9,622,555 | ||||||
| 410,838 | Kimco Realty Corp. | 7,937,390 | ||||||
| 258,770 | Liberty Property Trust | 9,256,203 | ||||||
| 826,820 | MFA Financial, Inc. | 6,705,510 | ||||||
| 203,343 | Piedmont Office Realty Trust, Inc. | 3,670,341 | ||||||
| 210,863 | Tanger Factory Outlet Centers, Inc. | 7,211,515 | ||||||
| 192,142 | Ventas, Inc. | 12,435,430 | ||||||
|
| |||||||
| 85,378,470 | ||||||||
|
| |||||||
| Retailing – 4.5% |
| ||||||
| 16,249 | AutoZone, Inc.* | 5,759,133 | ||||||
| 529,300 | Liberty Interactive Corp. Class A* | 10,416,624 | ||||||
| 81,422 | Limited Brands, Inc. | 3,831,719 | ||||||
| 211,945 | Macy’s, Inc. | 8,270,094 | ||||||
| 62,615 | PetSmart, Inc. | 4,279,109 | ||||||
| 108,274 | Urban Outfitters, Inc.* | 4,261,665 | ||||||
|
| |||||||
| 36,818,344 | ||||||||
|
| |||||||
| Semiconductors & Semiconductor Equipment – 4.1% |
| ||||||
| 301,281 | Altera Corp. | 10,376,118 | ||||||
| 402,480 | Lam Research Corp.* | 14,541,602 | ||||||
| 496,713 | LSI Corp.* | 3,516,728 | ||||||
| 802,411 | ON Semiconductor Corp.* | 5,656,998 | ||||||
|
| |||||||
| 34,091,446 | ||||||||
|
| |||||||
| Software & Services – 3.5% |
| ||||||
| 177,565 | Adobe Systems, Inc.* | 6,690,649 | ||||||
| 84,264 | Check Point Software Technologies Ltd.* | 4,014,337 | ||||||
| 219,557 | Fidelity National Information Services, Inc. | 7,642,779 | ||||||
| 400,834 | Parametric Technology Corp.* | 9,022,774 | ||||||
| 60,615 | Paychex, Inc. | 1,887,551 | ||||||
|
| |||||||
| 29,258,090 | ||||||||
|
| |||||||
| Technology Hardware & Equipment – 3.1% |
| ||||||
| 69,481 | Amphenol Corp. Class A | 4,495,421 | ||||||
| 548,735 | Juniper Networks, Inc.* | 10,793,617 | ||||||
| 168,721 | NetApp, Inc.* | 5,660,590 | ||||||
| 419,657 | Polycom, Inc.* | 4,389,612 | ||||||
|
| |||||||
| 25,339,240 | ||||||||
|
| |||||||
| Utilities – 10.2% |
| ||||||
| 378,850 | Calpine Corp.* | 6,868,550 | ||||||
| 251,089 | CMS Energy Corp. | 6,121,550 | ||||||
|
| |||||||
| Common Stocks – (continued) | ||||||||
| Utilities – (continued) |
| ||||||
| 187,794 | Edison International | $ | 8,486,411 | |||||
| 101,993 | Great Plains Energy, Inc. | 2,071,478 | ||||||
| 234,891 | Northeast Utilities | 9,179,540 | ||||||
| 314,993 | NV Energy, Inc. | 5,713,973 | ||||||
| 117,817 | Pinnacle West Capital Corp. | 6,006,310 | ||||||
| 343,963 | PPL Corp. | 9,847,661 | ||||||
| 180,803 | Questar Corp. | 3,572,667 | ||||||
| 162,384 | SCANA Corp. | 7,411,206 | ||||||
| 125,620 | Sempra Energy | 8,911,483 | ||||||
| 370,501 | Xcel Energy, Inc. | 9,896,082 | ||||||
|
| |||||||
| 84,086,911 | ||||||||
|
| |||||||
| TOTAL INVESTMENTS – 97.8% | ||||||||
| (Cost $708,142,697) | $ | 805,327,724 | ||||||
|
| |||||||
| OTHER ASSETS IN EXCESS OF | 18,208,309 | ||||||
|
| |||||||
| NET ASSETS – 100.0% | $ | 823,536,033 | ||||||
|
| |||||||
| The percentage shown for each investment category reflects the value of investments in that category as a percentage of net assets. | ||
| * | Non-income producing security. | |
| 10 | The accompanying notes are an integral part of these financial statements. |
GOLDMAN SACHS VARIABLE INSURANCE TRUST MID CAP VALUE FUND
Statement of Assets and Liabilities
December 31, 2012
| Assets: | ||||
Investments, at value (cost $708,142,697) | $ | 805,327,724 | ||
Cash | 19,114,768 | |||
Receivables: | ||||
Investments sold | 4,908,380 | |||
Dividends | 1,272,267 | |||
Fund shares sold | 192,215 | |||
| Total assets | 830,815,354 | |||
| Liabilities: | ||||
Payables: | ||||
Investments purchased | 5,177,353 | |||
Fund shares redeemed | 1,396,122 | |||
Amounts owed to affiliates | 592,904 | |||
Accrued expenses | 112,942 | |||
| Total liabilities | 7,279,321 | |||
| Net Assets: | ||||
Paid-in capital | 818,185,368 | |||
Undistributed net investment income | 4,030,260 | |||
Accumulated net realized loss | (95,864,622 | ) | ||
Net unrealized gain | 97,185,027 | |||
| NET ASSETS | $ | 823,536,033 | ||
Net Assets: | ||||
Institutional | $ | 601,619,528 | ||
Service | 221,916,505 | |||
Total Net Assets | $ | 823,536,033 | ||
Shares of beneficial interest outstanding $0.001 par value (unlimited shares authorized): | ||||
Institutional | 39,232,773 | |||
Service | 14,456,616 | |||
Net asset value, offering and redemption price per share: | ||||
Institutional | $15.33 | |||
Service | 15.35 | |||
| The accompanying notes are an integral part of these financial statements. | 11 |
GOLDMAN SACHS VARIABLE INSURANCE TRUST MID CAP VALUE FUND
Statement of Operations
For the Fiscal Year Ended December 31, 2012
| Investment income: | ||||
Dividends (net of foreign taxes withheld of $366) | $ | 16,811,031 | ||
| Expenses: | ||||
Management fees | 6,431,403 | |||
Distribution and Service fees — Service Class | 476,856 | |||
Printing and mailing costs | 190,953 | |||
Transfer Agent fees(a) | 160,771 | |||
Custody and accounting fees | 78,403 | |||
Professional fees | 71,756 | |||
Trustee fees | 16,769 | |||
Other | 22,364 | |||
| Total expenses | 7,449,275 | |||
Less — expense reductions | (251,786 | ) | ||
| Net expenses | 7,197,489 | |||
| NET INVESTMENT INCOME | 9,613,542 | |||
| Realized and unrealized gain: | ||||
Net realized gain from investments (including commissions recaptured of $130,896) | 52,179,788 | |||
Net change in unrealized gain on investments | 73,515,221 | |||
| Net realized and unrealized gain | 125,695,009 | |||
| NET INCREASE IN NET ASSETS RESULTING FROM OPERATIONS | $ | 135,308,551 | ||
(a) Institutional and Service Shares had Transfer Agent fees of $122,626 and $38,145, respectively.
| 12 | The accompanying notes are an integral part of these financial statements. |
GOLDMAN SACHS VARIABLE INSURANCE TRUST MID CAP VALUE FUND
Statements of Changes in Net Assets
| For the Fiscal Year Ended December 31, 2012 | For the Fiscal Year Ended December 31, 2011 | |||||||
| From operations: | ||||||||
Net investment income | $ | 9,613,542 | $ | 6,667,015 | ||||
Net realized gain | 52,179,788 | 80,337,958 | ||||||
Net change in unrealized gain (loss) | 73,515,221 | (139,903,556 | ) | |||||
| Net increase (decrease) in net assets resulting from operations | 135,308,551 | (52,898,583 | ) | |||||
| Distributions to shareholders: | ||||||||
From net investment income | ||||||||
Institutional Shares | (6,878,541 | ) | (5,031,254 | ) | ||||
Service Shares | (2,044,953 | ) | (935,469 | ) | ||||
| Total distributions to shareholders | (8,923,494 | ) | (5,966,723 | ) | ||||
| From share transactions: | ||||||||
Proceeds from sales of shares | 77,172,149 | 87,019,443 | ||||||
Reinvestment of distributions | 8,923,494 | 5,966,723 | ||||||
Cost of shares redeemed | (153,380,419 | ) | (185,869,286 | ) | ||||
| Net decrease in net assets resulting from share transactions | (67,284,776 | ) | (92,883,120 | ) | ||||
| TOTAL INCREASE (DECREASE) | 59,100,281 | (151,748,426 | ) | |||||
| Net assets: | ||||||||
Beginning of year | 764,435,752 | 916,184,178 | ||||||
End of year | $ | 823,536,033 | $ | 764,435,752 | ||||
| Undistributed net investment income | $ | 4,030,260 | $ | 3,371,934 | ||||
| The accompanying notes are an integral part of these financial statements. | 13 |
GOLDMAN SACHS VARIABLE INSURANCE TRUST MID CAP VALUE FUND
Financial Highlights
Selected Data for a Share Outstanding Throughout Each Year
| Income (loss) from investment operations | Distributions to shareholders | |||||||||||||||||||||||||||||||||||||||||||||||||||||||
| Year - Share Class | Net asset value, beginning of year | Net investment income(a) | Net realized and unrealized gain (loss) | Total from investment operations | From net investment income | From net realized gains | Total distributions | Net asset value, end of year | Total return(b) | Net assets, end of year (in 000s) | Ratio of net expenses to average net assets | Ratio of total expenses to average net assets | Ratio of net investment income to average net assets | Portfolio turnover rate(c) | ||||||||||||||||||||||||||||||||||||||||||
FOR THE FISCAL YEARS ENDED DECEMBER 31, | ||||||||||||||||||||||||||||||||||||||||||||||||||||||||
2012 - Institutional | $ | 13.09 | $ | 0.18 | (d) | $ | 2.24 | $ | 2.42 | $ | (0.18 | ) | $ | — | $ | (0.18 | ) | $ | 15.33 | 18.41 | % | $ | 601,620 | 0.84 | % | 0.87 | % | 1.24 | %(d) | 79 | % | |||||||||||||||||||||||||
2012 - Service | 13.11 | 0.15 | (d) | 2.23 | 2.38 | (0.14 | ) | — | (0.14 | ) | 15.35 | 18.13 | 221,917 | 1.09 | 1.12 | 1.05 | (d) | 79 | ||||||||||||||||||||||||||||||||||||||
2011 - Institutional | 14.10 | 0.11 | (1.01 | ) | (0.90 | ) | (0.11 | ) | — | (0.11 | ) | 13.09 | (6.38 | ) | 604,797 | 0.85 | 0.86 | 0.81 | 75 | |||||||||||||||||||||||||||||||||||||
2011 - Service | 14.12 | 0.08 | (1.01 | ) | (0.93 | ) | (0.08 | ) | — | (0.08 | ) | 13.11 | (6.59 | ) | 159,638 | 1.10 | 1.11 | 0.61 | 75 | |||||||||||||||||||||||||||||||||||||
2010 - Institutional | 11.35 | 0.08 | 2.76 | 2.84 | (0.09 | ) | — | (0.09 | ) | 14.10 | 25.00 | 769,552 | 0.87 | 0.87 | 0.65 | 88 | ||||||||||||||||||||||||||||||||||||||||
2010 - Service | 11.37 | 0.05 | 2.76 | 2.81 | (0.06 | ) | — | (0.06 | ) | 14.12 | 24.69 | 146,632 | 1.12 | 1.12 | 0.44 | 88 | ||||||||||||||||||||||||||||||||||||||||
2009 - Institutional | 8.66 | 0.14 | (e) | 2.73 | 2.87 | (0.18 | ) | — | (0.18 | ) | 11.35 | 33.15 | 834,376 | 0.86 | 0.86 | 1.46 | (e) | 111 | ||||||||||||||||||||||||||||||||||||||
2009 - Service | 8.68 | 0.12 | (e) | 2.73 | 2.85 | (0.16 | ) | — | (0.16 | ) | 11.37 | 32.78 | 122,402 | 1.11 | 1.11 | 1.21 | (e) | 111 | ||||||||||||||||||||||||||||||||||||||
2008 - Institutional | 14.02 | 0.14 | (f) | (5.34 | ) | (5.20 | ) | (0.14 | ) | (0.02 | ) | (0.16 | ) | 8.66 | (36.97 | ) | 748,682 | 0.84 | 0.84 | 1.16 | (f) | 93 | ||||||||||||||||||||||||||||||||||
2008 - Service | 14.03 | 0.11 | (f) | (5.34 | ) | (5.23 | ) | (0.10 | ) | (0.02 | ) | (0.12 | ) | 8.68 | (37.13 | ) | 111,437 | 1.09 | 1.09 | 0.91 | (f) | 93 | ||||||||||||||||||||||||||||||||||
| (a) | Calculated based on the average shares outstanding methodology. |
| (b) | Assumes investment at the net asset value at the beginning of the year, reinvestment of all distributions, and a complete redemption of the investment at the net asset value at the end of the year. |
| (c) | The Fund’s portfolio turnover rate is calculated in accordance with regulatory requirements, without regard to transactions involving short term investments and certain derivatives. If such transactions were included, the Fund’s portfolio turnover rate may be higher. |
| (d) | Reflects income recognized from non-recurring special dividends which amounted to $0.04 per share and 0.31% of average net assets. |
| (e) | Reflects income recognized from non-recurring special dividends which amounted to $0.03 per share and 0.37% of average net assets. |
| (f) | Reflects income recognized from non-recurring special dividends which amounted to $0.01 per share and 0.11% of average net assets. |
| The accompanying notes are an integral part of these financial statements. | 14 |
GOLDMAN SACHS VARIABLE INSURANCE TRUST MID CAP VALUE FUND
Notes to Financial Statements
December 31, 2012
1. ORGANIZATION
Goldman Sachs Variable Insurance Trust (the “Trust” or “VIT”) is a Delaware statutory trust registered under the Investment Company Act of 1940, as amended (the “Act”), as an open-end management investment company. The Trust includes the Goldman Sachs Mid Cap Value Fund (the “Fund”). The Fund is a diversified portfolio under the Act offering two classes of shares — Institutional Shares and Service Shares. Shares of the Trust are offered to separate accounts of participating life insurance companies for the purpose of funding variable annuity contracts and variable life insurance policies.
Goldman Sachs Asset Management, L.P. (“GSAM”), an affiliate of Goldman, Sachs & Co. (“Goldman Sachs”), serves as investment adviser to the Fund pursuant to a management agreement (the “Agreement”) with the Trust.
2. SIGNIFICANT ACCOUNTING POLICIES
The financial statements have been prepared in accordance with accounting principles generally accepted in the United States of America (“GAAP”) and require management to make estimates and assumptions that may affect the reported amounts and disclosures. Actual results may differ from those estimates and assumptions.
A. Investment Valuation — The Fund’s valuation policy is to value investments at fair value.
B. Investment Income and Investments — Investment income includes interest income and dividend income, net of any foreign withholding taxes, less any amounts reclaimable. Interest income is accrued daily and adjusted for amortization of premiums and accretion of discounts. Dividend income is recognized on ex-dividend date or, for certain foreign securities, as soon as such information is obtained subsequent to the ex-dividend date. Investment transactions are reflected on trade date. Realized gains and losses are calculated using identified cost. Investment transactions are recorded on the following business day for daily net asset value (“NAV”) calculations. Any foreign capital gains tax is accrued daily based upon net unrealized gains, and is payable upon sale of such investments. Distributions received from the Fund’s investments in United States (“U.S.”) real estate investment trusts (“REITs”) may be characterized as ordinary income, net capital gain or a return of capital. A return of capital is recorded by the Fund as a reduction to the cost basis of the REIT.
C. Class Allocations and Expenses — Investment income, realized and unrealized gain (loss), and non-class specific expenses of the Fund are allocated daily based upon the proportion of net assets of each class. Class specific expenses, where applicable, are borne by the respective share classes and include Distribution and Service and Transfer Agent fees. Non-class specific expenses directly incurred by a Fund are charged to that Fund, while such expenses incurred by the Trust are allocated across the respective Funds on a straight-line and/or pro-rata basis depending upon the nature of the expenses.
D. Federal Taxes and Distributions to Shareholders — It is the Fund’s policy to comply with the requirements of the Internal Revenue Code of 1986, as amended (the “Code”), applicable to regulated investment companies (mutual funds) and to distribute each year substantially all of its investment company taxable income and capital gains to its shareholders. Accordingly, the Fund is not required to make any provisions for the payment of federal income tax. Distributions to shareholders are recorded on the ex-dividend date. Income and capital gains distributions, if any, are declared and paid annually.
15
GOLDMAN SACHS VARIABLE INSURANCE TRUST MID CAP VALUE FUND
Notes to Financial Statements (continued)
December 31, 2012
2. SIGNIFICANT ACCOUNTING POLICIES (continued)
Net capital losses are carried forward to future fiscal years and may be used to the extent allowed by the Code to offset any future capital gains. Utilization of capital loss carryforwards will reduce the requirement of future capital gains distributions.
Under the Regulated Investment Company Modernization Act of 2010, the Fund is permitted to carry forward capital losses incurred in taxable years beginning after December 22, 2010 for an unlimited period. However, any losses incurred during those future taxable years will be required to be utilized prior to the losses incurred in pre-enactment taxable years. As a result of this ordering rule, pre-enactment capital loss carryforwards may be more likely to expire unused. Additionally, post-enactment capital losses that are carried forward will retain their character as either short-term or long term capital losses rather than being considered all short-term as under previous law.
The characterization of distributions to shareholders for financial reporting purposes is determined in accordance with federal income tax rules, which may differ from GAAP. The source of the Fund’s distributions may be shown in the accompanying financial statements as either from net investment income, net realized gain or capital. Certain components of the Fund’s net assets on the Statement of Assets and Liabilities reflect permanent GAAP/tax differences based on the appropriate tax character.
E. Commission Recapture — GSAM, on behalf of the Fund, may direct portfolio trades, subject to seeking best execution, to various brokers who have agreed to rebate a portion of the commissions generated. Such rebates are made directly to the Fund as cash payments and are included in net realized gain (loss) from investments on the Statement of Operations.
3. INVESTMENTS AND FAIR VALUE MEASUREMENTS
The fair value of a financial instrument is the amount that would be received to sell an asset or paid to transfer a liability in an orderly transaction between market participants at the measurement date (i.e., the exit price). GAAP establishes a fair value hierarchy that prioritizes the inputs to valuation techniques used to measure fair value. The hierarchy gives the highest priority to unadjusted quoted prices in active markets for identical assets or liabilities (Level 1 measurements) and the lowest priority to unobservable inputs (Level 3 measurements). The levels used for classifying investments are not necessarily an indication of the risk associated with investing in these investments. The three levels of the fair value hierarchy are described below:
Level 1 — Unadjusted quoted prices in active markets that are accessible at the measurement date for identical, unrestricted assets or liabilities;
Level 2 — Quoted prices in markets that are not active or financial instruments for which significant inputs are observable (including, but not limited to, quoted prices for similar investments, interest rates, foreign exchange rates, volatility and credit spreads), either directly or indirectly;
Level 3 — Prices or valuations that require significant unobservable inputs (including GSAM’s assumptions in determining fair value measurement).
The Trustees have adopted Valuation Procedures that govern the valuation of the portfolio investments held by the Fund, including investments for which market quotations are not readily available. The Trustees have delegated to GSAM day-to-day responsibility for implementing and maintaining internal controls and procedures related to the valuation of the Fund’s portfolio investment. To assess the continuing appropriateness of pricing sources and methodologies, GSAM regularly performs price verification procedures and issues challenges as necessary to third party pricing vendors or brokers, and any differences are reviewed in accordance with the Valuation Procedures.
16
GOLDMAN SACHS VARIABLE INSURANCE TRUST MID CAP VALUE FUND
3. INVESTMENTS AND FAIR VALUE MEASUREMENTS (continued)
A. Level 1 and Level 2 Fair Value Investments — The valuation techniques and significant inputs used in determining the fair values for investments classified as Level 1 and Level 2 are as follows:
Equity Securities — Equity securities and investment companies traded on a U.S. securities exchange or the NASDAQ system, or those located on certain foreign exchanges, including but not limited to the Americas, are valued daily at their last sale price or official closing price on the principal exchange or system on which they are traded. If no sale occurs, equity securities and exchange traded investment companies are valued at the last bid price for long positions and at the last ask price for short positions. Investments in investment companies (other than those that are exchange traded) are valued at the NAV on the valuation date. To the extent these investments are actively traded, they are classified as Level 1 of the fair value hierarchy.
Unlisted equity securities for which market quotations are available are valued at the last sale price on the valuation date, or if no sale occurs, at the last bid price. Securities traded on certain foreign securities exchanges are valued daily at fair value determined by an independent fair value service (if available) under valuation procedures approved by the trustees and consistent with applicable regulatory guidance. The independent fair value service takes into account multiple factors including, but not limited to, movements in the securities markets, certain depositary receipts, futures contracts and foreign currency exchange rates that have occurred subsequent to the close of the foreign securities exchange. Investments applying these valuation adjustments are classified as Level 2 of the fair value hierarchy.
Debt Securities — Debt securities for which market quotations are readily available are valued daily on the basis of quotations supplied by dealers or an independent pricing service approved by the trustees. The pricing services may use valuation models or matrix pricing, which consider: (i) yield or price with respect to bonds that are considered comparable in characteristics such as rating, interest rate and maturity date or (ii) quotations from securities dealers to determine current value. Short-term debt obligations that mature in sixty days or less and that do not exhibit signs of credit deterioration are valued at amortized cost, which approximates fair value. With the exception of treasury securities, which are generally classified as Level 1, these investments are generally classified as Level 2 of the fair value hierarchy.
B. Level 3 Fair Value Investments — The valuation techniques and significant inputs used in determining the fair values for investments classified as Level 3 are as follows:
To the extent that the aforementioned significant inputs are unobservable, or if quotations are not readily available, or if GSAM believes that such quotations do not accurately reflect fair value, the fair value of the Fund’s investments may be determined under valuation procedures approved by the trustees. GSAM, consistent with its procedures and applicable regulatory guidance, may make an adjustment to the most recent valuation prices of either domestic or foreign securities in light of significant events to reflect what it believes to be the fair value of the securities at the time of determining a Fund’s NAV. Significant events which could affect a large number of securities in a particular market may include, but are not limited to: significant fluctuations in U.S. or foreign markets; market dislocations; market disruptions; or unscheduled market closings. Significant events which could also affect a single issuer may include, but are not limited to: corporate actions such as reorganizations, mergers and buy-outs; ratings downgrades; and bankruptcies.
17
GOLDMAN SACHS VARIABLE INSURANCE TRUST MID CAP VALUE FUND
Notes to Financial Statements (continued)
December 31, 2012
3. INVESTMENTS AND FAIR VALUE MEASUREMENTS (continued)
C. Fair Value Hierarchy — The following is a summary of the Fund’s investments classified in the fair value hierarchy as of December 31, 2012:
| Investment Type | Level 1 | Level 2 | Level 3 | |||||||||
| Assets | ||||||||||||
| Common Stock and/or Other Equity Investments | $ | 805,327,724 | $ | — | $ | — | ||||||
For further information regarding security characteristics, see the Schedule of Investments.
4. AGREEMENTS AND AFFILIATED TRANSACTIONS
A. Management Agreement — Under the Agreement, GSAM manages the Fund, subject to the general supervision of the trustees.
As compensation for the services rendered pursuant to the Agreement, the assumption of the expenses related thereto and administration of the Fund’s business affairs, including providing facilities, GSAM is entitled to a management fee, accrued daily and paid monthly, equal to an annual percentage rate of the Fund’s average daily net assets.
For the fiscal year ended December 31, 2012, contractual and effective net management fees with GSAM were at the following rates:
| Contractual Management Fee Rate | ||||||||||||||||||||||
First $2 billion | Next $3 billion | Next $3 billion | Over $8 billion | Effective Rate | Effective Net Management Fee Rate | |||||||||||||||||
| 0.80% | 0.72 | % | 0.68 | % | 0.67 | % | 0.80 | % | 0.77 | %* | ||||||||||||
| * | GSAM agreed to waive a portion of its management fee in order to achieve the effective net management rate shown above through at least April 27, 2013. Prior to such date GSAM may not terminate the arrangement without the approval of the trustees. For the fiscal year ended December 31, 2012, GSAM waived approximately $241,200 of its management fee. |
B. Distribution and Service Plan — The Trust, on behalf of the Service Shares of the Fund, has adopted a Distribution and Service Plan (the “Plan”). Under the Plan, Goldman Sachs, which serves as distributor (the “Distributor”), is entitled to a fee accrued daily and paid monthly, for distribution services, which may then be paid by Goldman Sachs to authorized dealers, equal to, on an annual basis, 0.25% of the Fund’s average daily net assets attributable to Service Shares.
C. Transfer Agency Agreement — Goldman Sachs also serves as the transfer agent of the Fund for a fee pursuant to a Transfer Agency Agreement. The fees charged for such transfer agency services are accrued daily and paid monthly at an annual rate of 0.02% of the average daily net assets of Institutional and Service Shares.
18
GOLDMAN SACHS VARIABLE INSURANCE TRUST MID CAP VALUE FUND
4. AGREEMENTS AND AFFILIATED TRANSACTIONS (continued)
D. Other Expense Agreements and Affiliated Transactions — GSAM has agreed to limit certain “Other Expense” of the Fund (excluding management fees, distribution and service fees, acquired fund fees and expenses, transfer agent fees and expenses, taxes, interest, brokerage fees, litigation, indemnification, shareholder meeting and other extraordinary expenses) to the extent such expenses exceed, on an annual basis, a percentage rate of the average daily net assets of the Fund. Such Other Expense reimbursements, if any, are accrued daily and paid monthly. In addition, the Fund is not obligated to reimburse GSAM for prior fiscal year expense reimbursements, if any. The Other Expense limitation as an annual percentage rate of average daily net assets for the Fund is 0.054%. These Other Expense reimbursements will remain in place through at least April 27, 2013, and prior to such date GSAM may not terminate the arrangements without the approval of the trustees. For the fiscal year ended December 31, 2012, GSAM did not make any reimbursement to the Fund. In addition, the Fund has entered into certain offset arrangements with the custodian and the transfer agent, which may result in a reduction of the Fund’s expenses and are received irrespective of the application of the “Other Expense” limitation described above. For the fiscal year ended December 31, 2012, custody fee credits were approximately $10,600.
As of December 31, 2012, the amounts owed to affiliates of the Fund were approximately $532,900, $46,200, and $13,800 for management, distribution and service, and transfer agent fees, respectively.
E. Line of Credit Facility — As of December 31, 2012, the Fund participated in a $630,000,000 committed, unsecured revolving line of credit facility (the “facility”) together with other funds of the Trust and registered investment companies having management agreements with GSAM or its affiliates (“Other Borrowers”). Pursuant to the terms of the facility, the Fund and Other Borrowers could increase the credit amount by an additional $340,000,000, for a total of up to $970,000,000. This facility is to be used solely for temporary or emergency purposes, which may include the funding of redemptions. The interest rate on borrowings is based on the federal funds rate. The facility also requires a fee to be paid by the Fund based on the amount of the commitment that has not been utilized. For the fiscal year ended December 31, 2012, the Fund did not have any borrowings under the facility. Prior to May 8, 2012, the amount available through the facility was $580,000,000.
F. Other Transactions with Affiliates — For the fiscal year ended December 31, 2012, Goldman Sachs earned approximately $38,300 in brokerage commissions from portfolio transactions on behalf of the Fund.
5. PORTFOLIO SECURITIES TRANSACTIONS
The cost of purchases and proceeds from sales and maturities of long-term securities for the fiscal year ended December 31, 2012, were $623,010,994 and $679,086,269, respectively.
19
GOLDMAN SACHS VARIABLE INSURANCE TRUST MID CAP VALUE FUND
Notes to Financial Statements (continued)
December 31, 2012
6. TAX INFORMATION
The tax character of distributions paid during the fiscal years ended December 31, 2011 and December 31, 2012 was as follows:
| 2011 | 2012 | |||||||
| Distributions paid from ordinary income | $ | 5,966,723 | $ | 8,923,494 | ||||
As of December 31, 2012, the components of accumulated earnings (losses) on a tax-basis were as follows:
| Undistributed ordinary income — net | $ | 3,789,381 | ||
| Capital loss carryforwards:(1) | ||||
Expiring 2017 | $ | (91,647,805 | ) | |
| Timing differences (Deferred dividend income) | 223,558 | |||
| Unrealized gains — net | 92,985,531 | |||
| Total accumulated gains — net | $ | 5,350,665 |
| (1) | Expiration occurs on December 31 of the year indicated. The Fund utilized $38,308,158 of capital losses in the current fiscal year. |
As of December 31, 2012, the Fund’s aggregate security unrealized gains and losses based on cost for U.S. federal income tax purposes were as follows:
| Tax cost | $ | 712,342,193 | ||
| Gross unrealized gain | 109,999,826 | |||
| Gross unrealized loss | (17,014,295 | ) | ||
| Net unrealized security gain | $ | 92,985,531 |
The difference between GAAP-basis and tax-basis unrealized gains (losses) is attributable primarily to wash sales and differences in the tax treatment of partnership and real estate investment trust investments.
In order to present certain components of the Fund’s capital accounts on a tax-basis, the Fund has reclassified $31,722 from undistributed net investment income to accumulated net realized gain (loss). These reclassifications have no impact on the net asset value of the Fund and result primarily from differences in the tax treatment of real estate investment trust investments.
GSAM has reviewed the Fund’s tax positions for all open tax years (the current and prior three years, as applicable) and has concluded that no provision for income tax is required in the Fund’s financial statements. Such open tax years remain subject to examination and adjustment by tax authorities.
20
GOLDMAN SACHS VARIABLE INSURANCE TRUST MID CAP VALUE FUND
7. OTHER RISKS
The Fund’s risks include, but are not limited to, the following:
Shareholder Concentration Risk — Certain participating insurance companies, accounts, or Goldman Sachs affiliates may from time to time own (beneficially or of record) or control a significant percentage of the Fund’s shares. Redemptions by these entities of their holdings in the Fund may impact the Fund’s liquidity and NAV. These redemptions may also force the Fund to sell securities.
Liquidity Risk — The Fund may make investments that are illiquid or that may become less liquid in response to market developments or adverse investor perceptions. Illiquid investments may be more difficult to value. Liquidity risk may also refer to the risk that a Fund will not be able to pay redemption proceeds within the allowable time period because of unusual market conditions, an unusually high volume of redemption requests, or other reasons. To meet redemption requests, the Fund may be forced to sell investments at an unfavorable time and/or under unfavorable conditions.
Market and Credit Risks — In the normal course of business, the Fund trades financial instruments and enters into financial transactions where risk of potential loss exists due to changes in the market (market risk). Additionally, the Fund may also be exposed to credit risk in the event that an issuer fails to perform or that an institution or entity with which the Fund has unsettled or open transactions defaults.
21
GOLDMAN SACHS VARIABLE INSURANCE TRUST MID CAP VALUE FUND
Notes to Financial Statements (continued)
December 31, 2012
8. INDEMNIFICATIONS
Under the Trust’s organizational documents, its trustees, officers, employees and agents are indemnified, to the extent permitted by the Act, against certain liabilities that may arise out of performance of their duties to the Fund. Additionally, in the course of business, the Fund enters into contracts that contain a variety of indemnification clauses. The Fund’s maximum exposure under these arrangements is unknown, as this would involve future claims that may be made against the Fund that have not yet occurred. However, GSAM believes the risk of loss under these arrangements to be remote.
9. OTHER MATTERS
New Accounting Pronouncement — In December 2011, the Financial Accounting Standards Board issued an Accounting Standards Update (“ASU”) to enhance disclosures about financial instruments and derivative instruments that are subject to offsetting (“netting”) on the Statement of Assets and Liabilities. This information will enable users of the Fund’s financial statements to evaluate the effect or potential effect of netting arrangements on the Fund’s financial position. The ASU is effective for financial statements with fiscal years beginning on or after January 1, 2013, and interim periods within those fiscal years. At this time, GSAM is evaluating the implications of these changes on the financial statements.
10. SUBSEQUENT EVENTS
Subsequent events after the Statement of Assets and Liabilities date have been evaluated through the date the financial statements were issued. GSAM has concluded that there is no impact requiring adjustment or disclosure in the financial statements.
22
GOLDMAN SACHS VARIABLE INSURANCE TRUST MID CAP VALUE FUND
11. SUMMARY OF SHARE TRANSACTIONS
Share activity is as follows:
| For the Fiscal Year Ended December 31, 2012 | For the Fiscal Year Ended December 31, 2011 | |||||||||||||||
| Shares | Dollars | Shares | Dollars | |||||||||||||
| Institutional Shares | ||||||||||||||||
| Shares sold | 1,369,746 | $ | 19,890,419 | 2,829,878 | $ | 39,771,062 | ||||||||||
| Reinvestment of distributions | 451,941 | 6,878,541 | 390,625 | 5,031,254 | ||||||||||||
| Shares redeemed | (8,781,130 | ) | (127,112,408 | ) | (11,606,383 | ) | (162,091,250 | ) | ||||||||
| (6,959,443 | ) | (100,343,448 | ) | (8,385,880 | ) | (117,288,934 | ) | |||||||||
| Service Shares | ||||||||||||||||
| Shares sold | 3,947,427 | 57,281,730 | 3,411,041 | 47,248,381 | ||||||||||||
| Reinvestment of distributions | 134,183 | 2,044,953 | 72,573 | 935,469 | ||||||||||||
| Shares redeemed | (1,801,047 | ) | (26,268,011 | ) | (1,691,746 | ) | (23,778,036 | ) | ||||||||
| 2,280,563 | 33,058,672 | 1,791,868 | 24,405,814 | |||||||||||||
| NET DECREASE | (4,678,880 | ) | $ | (67,284,776 | ) | (6,594,012 | ) | $ | (92,883,120 | ) | ||||||
23
Report of Independent Registered Public Accounting Firm
To the Board of Trustees and Shareholders of
Goldman Sachs Variable Insurance Trust — Goldman Sachs Mid Cap Value Fund:
In our opinion, the accompanying statement of assets and liabilities, including the schedule of investments, and the related statements of operations and of changes in net assets and the financial highlights present fairly, in all material respects, the financial position of Goldman Sachs Mid Cap Value Fund (the “Fund”) at December 31, 2012 and the results of its operations, the changes in its net assets and the financial highlights for each of the periods indicated, in conformity with accounting principles generally accepted in the United States of America. These financial statements and financial highlights (hereafter referred to as “financial statements”) are the responsibility of the Fund’s management. Our responsibility is to express an opinion on these financial statements based on our audit. We conducted our audit of these financial statements in accordance with the standards of the Public Company Accounting Oversight Board (United States). Those standards require that we plan and perform the audit to obtain reasonable assurance about whether the financial statements are free of material misstatement. An audit includes examining, on a test basis, evidence supporting the amounts and disclosures in the financial statements, assessing the accounting principles used and significant estimates made by management, and evaluating the overall financial statement presentation. We believe that our audit, which included confirmation of securities at December 31, 2012 by correspondence with the custodian, brokers, and the application of alternative auditing procedures where securities purchased confirmations had not been received, provides a reasonable basis for our opinion.
PricewaterhouseCoopers LLP
Boston, Massachusetts
February 14, 2013
24
GOLDMAN SACHS VARIABLE INSURANCE TRUST MID CAP VALUE FUND
| Fund Expenses — Six Month Period Ended December 31, 2012 (Unaudited) |
As a shareholder of Institutional or Service Shares of the Fund, you incur ongoing costs, including management fees, distribution and service (12b-1) fees (with respect to Service Shares) and other Fund expenses. This example is intended to help you understand your ongoing costs (in dollars) of investing in the Institutional Shares and Service Shares of the Funds and to compare these costs with the ongoing costs of investing in other mutual funds.
The example is based on an investment of $1,000 invested at the beginning of the period and held for the entire period from July 1, 2012 through December 31, 2012.
Actual Expenses — The first line under each share class in the table below provides information about actual account values and actual expenses. You may use the information in this line, together with the amount you invested, to estimate the expenses that you paid over the period. Simply divide your account value by $1,000 (for example, an $8,600 account value divided by $1,000=8.6), then multiply the result by the number in the first line under the heading entitled “Expenses Paid” to estimate the expenses you paid on your account during this period.
Hypothetical Example for Comparison Purposes — The second line under each share class in the table below provides information about hypothetical account values and hypothetical expenses based on the Fund's actual net expense ratio and an assumed rate of return of 5% per year before expenses, which is not the Fund's actual return. The hypothetical account values and expenses may not be used to estimate the actual ending account balance or expenses you paid for the period. You may use this information to compare the ongoing costs of investing in the Fund and other funds. To do so, compare this 5% hypothetical example with the 5% hypothetical examples that appear in the shareholder reports of the other funds.
Please note that the expenses shown in the table are meant to highlight your ongoing costs only. As a shareholder of the Fund you do not incur any transaction costs, such as sales charges, redemption fees, or exchange fees, but shareholders of other funds may incur such costs. The second line of the table is useful in comparing ongoing costs only, and will not help you determine the relative total costs of owning different funds whose shareholders may incur transaction costs.
| Share Class | Beginning Account Value 7/01/12 | Ending Account Value 12/31/12 | Expenses Paid for the 6 Months Ended 12/31/12* | |||||||||
| Institutional | ||||||||||||
| Actual | $ | 1,000 | $ | 1,099.00 | $ | 4.43 | ||||||
| Hypothetical 5% return | 1,000 | 1,020.91 | + | 4.27 | ||||||||
| Service | ||||||||||||
| Actual | 1,000 | 1,098.10 | 5.75 | |||||||||
| Hypothetical 5% return | 1,000 | 1,019.66 | + | 5.53 | ||||||||
| * | Expenses are calculated using the Fund’s annualized net expense ratio for each class, which represents the ongoing expenses as a percentage of net assets for the six months ended December 31, 2012. Expenses are calculated by multiplying the annualized net expense ratio by the average account value for the period; then multiplying the result by the number of days in the most recent fiscal half year; and then dividing that result by the number of days in the fiscal year. The annualized net expense ratios for the period were 0.84% and 1.09% for Institutional and Service Shares, respectively. |
| + | Hypothetical expenses are based on the Fund’s actual annualized net expense ratios and an assumed rate of return of 5% per year before expenses. |
25
GOLDMAN SACHS VARIABLE INSURANCE TRUST MID CAP VALUE FUND
Trustees and Officers (Unaudited)
Independent Trustees
| Name, Address and Age1 | Position(s) Held with the Trust | Term of Office and | Principal Occupation(s) During Past 5 Years | Number of Portfolios in Fund Complex Overseen by Trustee3 | Other Directorships Held by Trustee4 | |||||||
Ashok N. Bakhru Age: 70 | Chairman of the Board of Trustees | Since 1996 (Trustee since 1991) | Mr. Bakhru is retired. He is President, ABN Associates (1994-1996 and 1998-Present); Director, Apollo Investment Corporation (a business development company) (2008-Present); Member of Cornell University Council (1992-2004 and 2006-Present); and was formerly Trustee, Scholarship America (1998-2005); Trustee, Institute for Higher Education Policy (2003-2008); Director, Private Equity Investors — III and IV (1998-2007), and Equity-Linked Investors II (April 2002-2007).
Chairman of the Board of Trustees — Goldman Sachs Mutual Fund Complex. | 111 | Apollo Investment Corporation (a business development company) | |||||||
Donald C. Burke Age: 52 | Trustee | Since 2010 | Mr. Burke is retired. He is Director, Avista Corp. (2011-Present); and was formerly a Director, BlackRock Luxembourg and Cayman Funds (2006-2010); President and Chief Executive Officer, BlackRock U.S. Funds (2007-2009); Managing Director, BlackRock, Inc. (2006-2009); Managing Director, Merrill Lynch Investment Managers, L.P. (“MLIM”) (2006); First Vice President, MLIM (1997-2005); Chief Financial Officer and Treasurer, MLIM U.S. Funds (1999-2006).
Trustee — Goldman Sachs Mutual Fund Complex. | 110 | Avista Corp. (an energy company) | |||||||
John P. Coblentz, Jr. Age: 71 | Trustee | Since 2003 | Mr. Coblentz is retired. Formerly, he was Partner, Deloitte & Touche LLP (1975-2003); Director, Emerging Markets Group, Ltd. (2004-2006); and Director, Elderhostel, Inc. (2006-2012).
Trustee — Goldman Sachs Mutual Fund Complex. | 111 | None | |||||||
Diana M. Daniels Age: 63 | Trustee | Since 2007 | Ms. Daniels is retired. Formerly, she was Vice President, General Counsel and Secretary, The Washington Post Company (1991-2006). Ms. Daniels is a Vice Chairman of the Board of Trustees, Cornell University (2009-Present); Member, Advisory Board, Psychology Without Borders (international humanitarian aid organization) (2007-Present), and former Member of the Legal Advisory Board, New York Stock Exchange (2003-2006) and of the Corporate Advisory Board, Standish Mellon Management Advisors (2006-2007).
Trustee — Goldman Sachs Mutual Fund Complex. | 110 | None | |||||||
Joseph P. LoRusso Age: 55 | Trustee | Since 2010 | Mr. LoRusso is retired. Formerly, he was President, Fidelity Investments Institutional Services Co. (“FIIS”) (2002-2008); Director, FIIS (2002-2008); Director, Fidelity Investments Institutional Operations Company (2003-2007); Executive Officer, Fidelity Distributors Corporation (2007-2008).
Trustee — Goldman Sachs Mutual Fund Complex. | 110 | None | |||||||
Jessica Palmer Age: 63 | Trustee | Since 2007 | Ms. Palmer is retired. She is Director, Emerson Center for the Arts and Culture (2011-Present); and was formerly a Consultant, Citigroup Human Resources Department (2007-2008); Managing Director, Citigroup Corporate and Investment Banking (previously, Salomon Smith Barney/Salomon Brothers) (1984-2006). Ms. Palmer was a Member of the Board of Trustees of Indian Mountain School (private elementary and secondary school) (2004-2009).
Trustee — Goldman Sachs Mutual Fund Complex. | 110 | None | |||||||
Richard P. Strubel Age: 73 | Trustee | Since 1987 | Mr. Strubel is retired. Formerly, he was Director, Cardean Learning Group (provider of educational services via the internet) (2003-2008); Trustee, Emeritus, The University of Chicago (1987-Present).
Trustee — Goldman Sachs Mutual Fund Complex. | 111 | The Northern Trust Mutual Fund Complex (64 Portfolios) (Chairman of the Board of Trustees); Gildan Activewear Inc. (a clothing marketing and manufacturing company). | |||||||
26
GOLDMAN SACHS VARIABLE INSURANCE TRUST MID CAP VALUE FUND
Trustees and Officers (Unaudited) (continued)
Interested Trustees
| Name, Address and Age1 | Position(s) Held with the Trust | Term of Office and | Principal Occupation(s) During Past 5 Years | Number of Portfolios in Fund Complex Overseen by Trustee3 | Other Directorships Held by Trustee4 | |||||||
James A. McNamara* Age: 50 | President and Trustee | Since 2007 | Managing Director, Goldman Sachs (December 1998-Present); Director of Institutional Fund Sales, GSAM (April 1998-December 2000); and Senior Vice President and Manager, Dreyfus Institutional Service Corporation (January 1993- April 1998).
President — Goldman Sachs Mutual Fund Complex (November 2007-Present); Senior Vice President — Goldman Sachs Mutual Fund Complex (May 2007-November 2007); and Vice President — Goldman Sachs Mutual Fund Complex (2001-2007).
Trustee — Goldman Sachs Mutual Fund Complex (since November 2007 and December 2002-May 2004). | 111 | None | |||||||
Alan A. Shuch* Age: 63 | Trustee | Since 1990 | Advisory Director — GSAM (May 1999-Present); Consultant to GSAM (December 1994-May 1999); and Limited Partner, Goldman Sachs (December 1994-May 1999).
Trustee — Goldman Sachs Mutual Fund Complex. | 110 | None | |||||||
| * | These persons are considered to be “Interested Trustees” because they hold positions with Goldman Sachs and own securities issued by The Goldman Sachs Group, Inc. Each Interested Trustee holds comparable positions with certain other companies of which Goldman Sachs, GSAM or an affiliate thereof is the investment adviser, administrator and/or distributor. |
| 1 | Each Trustee may be contacted by writing to the Trustee, c/o Goldman Sachs, 200 West Street, New York, New York, 10282, Attn: Caroline Kraus. Information is provided as of December 31, 2012. |
| 2 | Each Trustee holds office for an indefinite term until the earliest of: (a) the election of his or her successor; (b) the date the Trustee resigns or is removed by the Board of Trustees or shareholders, in accordance with the Trust’s Declaration of Trust; (c) the conclusion of the first Board meeting held subsequent to the day the Trustee attains the age of 74 years (in accordance with the current resolutions of the Board of Trustees, which may be changed by the Trustees without shareholder vote); or (d) the termination of the Trust. |
| 3 | The Goldman Sachs Mutual Fund Complex consists of the Trust, Goldman Sachs Trust II, Goldman Sachs Municipal Opportunity Fund, Goldman Sachs Credit Strategies Fund, and Goldman Sachs Trust. As of December 31, 2012, the Trust consisted of 12 portfolios. Goldman Sachs Trust II consisted of 1 portfolio (which did not offer shares to the public); Goldman Sachs Municipal Opportunity Fund did not offer shares to the public; and Goldman Sachs Trust consisted of 96 portfolios (80 of which offered shares to the public). |
| 4 | This column includes only directorships of companies required to report to the SEC under the Securities Exchange Act of 1934 (i.e., “public companies”) or other investment companies registered under the Act. |
Additional information about the Trustees is available in the Fund’s Statement of Additional Information, which can be obtained from Goldman Sachs free of charge by calling this toll-free number (in the United States of America): 1-800-292-4726.
27
GOLDMAN SACHS VARIABLE INSURANCE TRUST MID CAP VALUE FUND
Trustees and Officers (Unaudited) (continued)
Officers of the Trust*
| Name, Address and Age | Position(s) Held With the Trust | Term of Office and | Principal Occupation(s) During Past 5 Years | |||
James A. McNamara 200 West Street New York, NY 10282 Age: 50 | President and Trustee | Since 2007 | Managing Director, Goldman Sachs (December 1998-Present); Director of Institutional Fund Sales, GSAM (April 1998-December 2000); and Senior Vice President and Manager, Dreyfus Institutional Service Corporation (January 1993-April 1998). President — Goldman Sachs Mutual Fund Complex (November 2007-Present); Senior Vice President — Goldman Sachs Mutual Fund Complex (May 2007-November 2007); and Vice President — Goldman Sachs Mutual Fund Complex (2001-2007). Trustee — Goldman Sachs Mutual Fund Complex (November 2007-Present and December 2002-May 2004). | |||
George F. Travers 30 Hudson Street Jersey City, NJ 07302 Age: 44 | Senior Vice President and Principal Financial Officer | Since 2009 | Managing Director, Goldman Sachs (2007-Present); Managing Director, UBS Ag (2005-2007); and Partner, Deloitte & Touche LLP (1990-2005, partner from 2000-2005). Senior Vice President and Principal Financial Officer — Goldman Sachs Mutual Fund Complex. | |||
Caroline Kraus 200 West Street New York, NY 10282 Age: 35 | Secretary | Since 2012 | Vice President, Goldman Sachs (August 2006-Present); Associate General Counsel, Goldman Sachs (2012-Present); Assistant General Counsel, Goldman Sachs (August 2006-December 2011) and Associate, Weil, Gotshal & Manges-LLP (2002-2006). Secretary — Goldman Sachs Mutual Fund Complex (August 2012-Present) and Assistant Secretary — Goldman Sachs Mutual Fund Complex (June 2012-August 2012). | |||
Scott M. McHugh 200 West Street New York, NY 10282 Age: 41 | Treasurer and Senior Vice President | Since 2009 | Vice President, Goldman Sachs (February 2007-Present); Assistant Treasurer of certain mutual funds administered by DWS Scudder (2005-2007); and Director (2005-2007), Vice President (2000-2005) and Assistant Vice President (1998-2000), Deutsche Asset Management or its predecessor (1998-2007). Treasurer — Goldman Sachs Mutual Fund Complex (October 2009-Present); Senior Vice President — Goldman Sachs Mutual Fund Complex (November 2009-Present); and Assistant Treasurer — Goldman Sachs Mutual Fund Complex (May 2007-October 2009). | |||
| 1 | Officers hold office at the pleasure of the Board of Trustees or until their successors are duly elected and qualified. Each officer holds comparable positions with certain other companies of which Goldman Sachs, GSAM or an affiliate thereof is the investment adviser, administrator and/or distributor. Information is provided as of December 31, 2012. |
| * | Represents a partial list of officers of the Trust. Additional information about all the officers is available in the Fund’s Statement of Additional Information, which can be obtained from Goldman Sachs free of charge by calling this toll-free number (in the United States): 1-800-292-4726. |
Goldman Sachs Variable Insurance Trust — Tax Information (Unaudited)
For the year ended December 31, 2012, 100% of the dividends paid from net investment company taxable income by the Mid Cap Value Fund qualify for the dividends received deduction available to corporations.
28
| TRUSTEES | OFFICERS | |
| Ashok N. Bakhru, Chairman | James A. McNamara, President | |
| Donald C. Burke | George F. Travers, Principal Financial Officer | |
| John P. Coblentz, Jr. | Caroline L. Kraus, Secretary | |
| Diana M. Daniels | Scott M. McHugh, Treasurer | |
| Joseph P. LoRusso | ||
| James A. McNamara | ||
| Jessica Palmer | ||
| Alan A. Shuch | ||
| Richard P. Strubel |
GOLDMAN, SACHS & CO.
Distributor and Transfer Agent
GOLDMAN SACHS ASSET MANAGEMENT, L.P.
Investment Adviser
200 West Street, New York
New York 10282
Visit our website at www.goldmansachsfunds.com/vit to obtain the most recent month-end returns.
The reports concerning the Fund included in this shareholder report may contain certain forward-looking statements about the factors that may affect the performance of the Fund in the future. These statements are based on Fund management’s predictions and expectations concerning certain future events and their expected impact on the Fund, such as performance of the economy as a whole and of specific industry sectors, changes in the levels of interest rates, the impact of developing world events, and other factors that may influence the future performance of the Fund. Management believes these forward-looking statements to be reasonable, although they are inherently uncertain and difficult to predict. Actual events may cause adjustments in portfolio management strategies from those currently expected to be employed.
A description of the policies and procedures that the Fund uses to determine how to vote proxies relating to portfolio securities and information regarding how the Fund voted proxies relating to portfolio securities for the 12-month period ended December 31 is available (i) without charge, upon request by calling 1-800-621-2550; and (ii) on the Securities and Exchange Commission (“SEC”) website at http://www.sec.gov.
The Fund files its complete schedule of portfolio holdings with the SEC for the first and third quarters of each fiscal year on Form N-Q. The Fund’s Form N-Q is available on the SEC’s website at http://www.sec.gov within 60 days after the Fund’s first and third fiscal quarters. The Fund’s Forms N-Q may be reviewed and copied at the SEC’s Public Reference Room in Washington, D.C. and information on the operation of the Public Reference Room may also be obtained by calling 1-800-SEC-0330. Forms N-Q may be obtained upon request and without charge by calling 1-800-621-2550.
Holdings and allocations shown are as of December 31, 2012 and may not be representative of future investments. Fund holdings should not be relied on in making investment decisions and should not be construed as research or investment advice regarding particular securities.
The Global Industry Classification Standard (“GICS”) was developed by and is the exclusive property and a service mark of Morgan Stanley Capital international Inc. (“MSCI”) and Standard & Poor’s, a division of The McGraw-Hill Companies, Inc. (“S&P”) and is licensed for use by Goldman Sachs. Neither MSCI, S&P nor any other party involved in making or compiling the GICS or any GICS classifications makes any express or implied warranties or representations with respect to such standard or classification (or the results to be obtained by the use thereof), and all such parties hereby expressly disclaim all warranties of originality, accuracy, completeness, merchantability or fitness for a particular purpose with respect to any of such standard or classification. Without limiting any of the foregoing, in no event shall MSCI, S&P, any of their affiliates or any third party involved in making or compiling the GICS or any GICS classifications have any liability for any direct, indirect, special, punitive, consequential or any other damages (including lost profits) even if notified of the possibility of such damages.
The portfolio risk management process includes an effort to monitor and manage risk, but does not imply low risk.
Shares of the Goldman Sachs VIT Funds are offered to separate accounts of participating life insurance companies for the purpose of funding variable annuity contracts and variable life insurance policies. Shares of the Fund are not offered directly to the general public. The variable annuity contracts and variable life insurance policies are described in the separate prospectuses issued by participating insurance companies. You should refer to those prospectuses for information about surrender charges, mortality and expense risk fees and other charges that may be assessed by participating insurance companies under the variable annuity contracts or variable life insurance policies. Such fees or charges, if any, may affect the return you may realize with respect to your investments. Ask your representative for more complete information. Please consider a fund’s objectives, risks and charges and expenses, and read the prospectus carefully before investing. The prospectus contains this and other information about the Fund.
This material is not authorized for distribution to prospective investors unless preceded or accompanied by a current Prospectus or summary prospectus, if applicable. Investors should consider a Fund’s objective, risks, and charges and expenses, and read the summary prospectus, if available, and/or the Prospectus carefully before investing or sending money. The summary prospectus, if available, and the Prospectus contain this and other information about a Fund and may be obtained from your Authorized Institution or from Goldman, Sachs & Co. by calling 1-800-621-2550.
Toll Free (in U.S.): 800-292-4726
This report is prepared for the general information of contract owners and is not an offer of shares of the Goldman Sachs Variable Insurance Trust: Goldman Sachs Mid Cap Value Fund.
© 2013 Goldman Sachs. All rights reserved.
VITMIDCAR13/92373.MF.MED.TMPL/2/2013
Goldman
Sachs Variable Insurance Trust
Goldman Sachs
Money Market Fund
Annual Report
December 31, 2012

GOLDMAN SACHS VARIABLE INSURANCE TRUST MONEY MARKET FUND
Principal Investment Strategies and Risks
This is not a complete list of risks that may affect the Fund. For additional information concerning the risks applicable to the Fund, please see the Fund’s Prospectus.
Shares of the Goldman Sachs Variable Insurance Trust — Goldman Sachs Money Market Fund are offered to separate accounts of participating life insurance companies for the purpose of funding variable annuity contracts and variable life insurance policies. Shares of the Fund are not offered directly to the general public. The variable annuity contracts and variable life insurance policies are described in the separate prospectuses issued by participating insurance companies. You should refer to those prospectuses for information about surrender charges, mortality and expense risk fees and other charges that may be assessed by participating insurance companies under the variable annuity contracts or variable life insurance policies. Such fees or charges, if any, may affect the return you realize with respect to your investments. Ask your representative for more complete information. Please consider the Fund’s objective, risks and charges and expenses, and read the Prospectus carefully before investing. The Prospectus contains this and other information about the Fund.
The Goldman Sachs Money Market Fund seeks to maximize current income to the extent consistent with the preservation of capital and the maintenance of liquidity by investing exclusively in high quality money market instruments. The Fund pursues its investment objective by investing in U.S. Government Securities (as defined in the Fund’s prospectus), obligations of U.S. banks, commercial paper and other short-term obligations of U.S. companies, states, municipalities and other entities and repurchase agreements. The Fund may also invest in U.S. dollar-denominated obligations of foreign banks, foreign companies and foreign governments.
An investment in the Fund is neither insured nor guaranteed by the Federal Deposit Insurance Corporation or any other government agency. Although the Fund seeks to preserve the value of an investment at $1.00 per share, it is possible to lose money by investing in the Fund.
1
GOLDMAN SACHS VARIABLE INSURANCE TRUST MONEY MARKET FUND
INVESTMENT OBJECTIVE
The Fund seeks to maximize current income to the extent consistent with the preservation of capital and the maintenance of liquidity by investing exclusively in high quality money market instruments.
Portfolio Management Discussion and Analysis
Below, the Goldman Sachs Global Liquidity Management Team discusses the Goldman Sachs Variable Insurance Trust — Goldman Sachs Money Market Fund’s (the “Fund”) performance and positioning for the 12-month period ended December 31, 2012 (the “Reporting Period”).
How did the Fund perform during the Reporting Period?
The Fund’s standardized 7-day current yield was 0.00% and its standardized 7-day effective yield was also 0.00% as of December 31, 2012. The Fund’s one-month simple average yield was 0.01% as of December 31, 2012. The Fund’s 7-day distribution yield as of December 31, 2012 was 0.01%.
The yields represent past performance. Past performance does not guarantee future results. Current performance may be lower or higher than the performance quoted above.
Yields will fluctuate as market conditions change.
What economic and market factors most influenced the money markets as a whole during the Reporting Period?
The Reporting Period was one wherein mixed U.S. and international economic data, political uncertainty, Federal Reserve Board (“Fed”) policy and supply/demand conditions within the repurchase agreement and U.S. Treasury securities markets combined to push money market yields lower.
During the first quarter of 2012, global economic data showed signs of stabilization well supported by quantitative easing programs in Japan and the U.K. and by the European Central Bank’s (“ECB”) second round of three-year loans for banks, known as its long-term refinancing operation (“LTRO”). Early in the quarter, increased risk appetite helped pull credit spreads, or the difference in yields between U.S. Treasury securities and non-Treasury securities that are identical in all respects except for quality rating, tighter and drive down interbank lending rates. At the same time, general collateral rates and yields on high quality assets were pressured higher by a combination of outflows from money market funds and cash rotating into risk assets and of continued increases in net supply of U.S. Treasury securities. In March, Greece secured a near-full participation rate among private creditors for the largest sovereign debt restructure on record. Credit default swaps were triggered without a substantial market impact. In response, the peripheral European bond markets experienced some relief as investors bought risk assets. Money market rates experienced strong upward pressure around mid-February 2012 as a result of large U.S. Treasury settlements. This supply lifted repurchase agreement, or repo, rates. Yields in perceived “safe haven” markets in the U.S., U.K. and Germany rose during the first calendar quarter. Economic data in the U.S. remained robust, especially in the labor, manufacturing and consumer spending segments of the economy. On the other hand, Eurozone economic reports generally reinforced the widespread view that the region was close to, or already in, recession.
The second calendar quarter saw rates for so-called “safe haven” assets hitting historic lows on the back of political uncertainty and deterioration of global economic data. The Dutch government collapsed in April, and markets focused on the broader implications of new leadership in both France and Greece. The elections reinforced the theme of a stronger political backlash against the principles of austerity dominating the European, and specifically the German, response to the sovereign debt crisis to date. Eurozone economic reports generally reinforced widespread weakness in the region. To add to investor unease, manufacturing PMI (Purchasing Managers Index) readings out of China during the second quarter raised concerns about the pace of that nation’s economic growth. Here in the U.S., economic data in the labor, retail and manufacturing segments disappointed. Together, the economic data boosted market expectations for additional stimulus by the Fed.
Against this backdrop, the Fed announced in June the extension of its Operation Twist program, wherein it sold short-term U.S. Treasury holdings and bought long-term U.S. Treasuries. In Greece, New Democracy, a pro-bailout and pro-euro party, won the parliamentary elections and was able to form a government. It was widely expected the new government would negotiate terms of the bailout with the troika of the International Monetary Fund, European Union and ECB such that harsh austerity targets may be
2
GOLDMAN SACHS VARIABLE INSURANCE TRUST MONEY MARKET FUND
loosened. Spain was widely expected to receive up to $126 billion in rescue loans to recapitalize its struggling banking sector, with the money initially coming from the European Stability Mechanism (“ESM”), planned as an institution to manage a permanent rescue funding program in the Eurozone. While the rescue loan money would first count as government debt, it would not take seniority over existing bonds. Indeed, at the late June European Union summit, Eurozone leaders agreed to let the permanent rescue fund directly inject funds into Spanish banks and buy bonds in the open market to reduce the borrowing costs for struggling European Union states. Throughout the month of June, we held the belief that the ECB would likely cut interest rates further. On July 5th, the ECB did cut its benchmark interest rate by 25 basis points (a basis point is 1/100th of a percentage point) to 0.75% and its deposit rate to zero from 0.25%.
As U.S. Treasury yields declined during the first half of the Reporting Period overall, so, too, did money market yields. The Fed continued to reinforce similar rhetoric as had been in place for more than two years — it intended to operate in an ultra-low interest rate environment for an “extended period.” Still, Fed communications following its April 2012 meeting were generally less accommodative than expected. The Fed’s statement was, on the whole, barely changed from that following the March 2012 meeting, with the committee retaining its guidance that the targeted federal funds rate would likely remain exceptionally low “at least through late 2014.” The Fed also decided to continue the ongoing maturity extension program (“MEP”) of selling short-term U.S. Treasury securities and buying longer-term U.S. Treasuries, and mentioned again that it was prepared to adjust policy “as appropriate to promote a stronger economic recovery in a context of price stability.” Following further weakening in economic data, the Fed announced the extension of Operation Twist to year-end 2012, which was anticipated to result in net purchases of $300 billion in 10-year U.S. Treasuries. The program was expected to remain in U.S. Treasuries and to exhaust the potential for further Twist operations, as it would likely entail the selling of all of the Fed’s holdings of short-term U.S. Treasuries. Importantly, the Fed’s statement left the door open to further easing should the economy deteriorate further.
In July 2012, core government yields reached historic lows but then reversed the rally to end the third calendar quarter mostly flat, as ECB president Mario Draghi reiterated the central bank’s readiness to enact new measures to sustain the euro. Accommodative monetary policy was a major theme during the third quarter of 2012, with the Fed, ECB, Bank of Japan (“BoJ”) and Reserve Bank of Australia (“RBA”) each carrying out a form of additional monetary easing.
At its September 2012 meeting, the ECB delivered on heightened market expectations with the launch of a new bond purchase facility, known as Outright Monetary Transactions (“OMT”), to help lower government borrowing costs in troubled Eurozone economies. Unlike its former securities markets program, the OMT is unlimited in size, and the ECB would not be senior to other bondholders. In the U.S., the Fed exceeded most expectations in September by extending the likely period of near-zero interest rates to at least mid-2015 and by breaking new ground with an open-ended commitment to asset purchases. The planned $40 billion a month of agency mortgage-backed securities purchases would continue until the outlook for the labor market improved substantially, depending on incoming data. Policy easing continued in the Asia-Pacific region as well. The People’s Bank of China injected more liquidity into its banking system via seven-day and 28-day repurchase operations, and the RBA delivered a surprise 25 basis point rate cut. Economic data from the U.S. and Europe continued to indicate a fragile global recovery, with Japan and China also posting a slowdown in exports and domestic demand.
President Obama’s re-election in November 2012 lowered the risk of market speculation about a shift in Fed policy to a less accommodative stance. It also reinforced expectations for a low volatility environment and for stable U.S. economic growth around 2%.
In December, the Fed met market expectations by committing to an open-ended purchase program of $85 billion per month, inclusive of the $40 billion per month in continuing mortgage-backed securities purchases. The Fed also offered two unexpected items. First, it replaced calendar-based fed funds guidance with guidance based on unemployment and inflation data thresholds. Second, the Fed shifted the distribution of its U.S. Treasury purchases amongst maturity buckets, shortening the average maturity length while keeping duration roughly constant. After much brinksmanship and a technical breach of the year-end deadline, the U.S. Congress was able to come to an agreement to avoid the majority of the fiscal contraction that would have taken place as part of the fiscal cliff. The sequester on spending cuts was postponed until March 2013.
With the Fed keeping the targeted federal funds rate unchanged at its 0% to 0.25% range throughout the Reporting Period and with no near-term indication of this changing, money market yields remained anchored near zero, and the taxable money market yield curve was extremely flat, meaning the difference between yields at the short-term end of the money market yield curve and the longer-term end was quite narrow.
Finally, it is important to note that there were a number of significant developments on the money market reform front after Securities and Exchange Commission (“SEC”) Chair Mary Schapiro was unable to persuade a majority of the Commission to vote
3
GOLDMAN SACHS VARIABLE INSURANCE TRUST MONEY MARKET FUND
in favor of making the proposal available for public comment at the end of August. SEC commissioner Daniel Gallagher, who voted against issuing Ms. Schapiro’s reform plan for public comment, expressed his potential support for further reforms. In turn, in November, the Financial Stability Oversight Council (“FSOC”) proposed three alternative reform scenarios for the industry — floating net asset value (“NAV”) per share; stable NAV per share, provided that a fund maintains a “buffer” of up to 1% of fund assets, plus a 3% “minimum balance at risk” of a shareholder’s account be made available for redemption on a delayed basis; and stable NAV per share, provided that a fund maintains a “buffer” of 3% of fund assets, plus agrees to take potential steps to reduce portfolio risks (including further diversification and liquidity requirements). The immediate next steps were a 60-day comment period on the FSOC recommendations, followed by a potential final recommendation to the SEC in late January 2013. According to the U.S. Department of the Treasury, the FSOC announced on January 15, 2013 that it had extended the comment period for proposed recommendations for money market mutual fund reform until February 15, 2013 to allow the public more time to review, consider and comment on the proposed recommendations. This also allowed the public to consider the information in the SEC staff report issued on November 30, 2012.
What key factors were responsible for the Fund’s performance during the Reporting Period?
The Fund’s yields remained low during the Reporting Period due primarily to the market factors discussed above. With the targeted federal funds rate near zero throughout the Reporting Period, money market yields were anchored near the same level with little difference between maturities. During the first half of the Reporting Period, we used a barbelled strategy in managing the Fund’s duration, wherein we invested primarily in securities with one-month to three-month maturities and in overnight repurchase agreements. In addition, we sought to take advantage of opportunities at the longer end of the yield curve, or spectrum of maturities, by purchasing longer-dated agency securities. Repurchase agreement yields were in the single-digit to low-teen range; LIBOR levels moved lower; and yields on U.S. Treasury securities compressed. (LIBOR, or London interbank offered rates, are floating interest rates that are widely used as reference rates in bank, corporate and government lending agreements.)
During the second half of the Reporting Period, the Fund remained highly liquid, as the stress in the Eurozone continued to create uncertainty in the market. Indeed, we kept a healthy portion of the Fund’s assets in overnight positions. With the Fed reinforcing maintenance of its targeted federal funds rate at its near-zero level on an open-ended basis, dependent on unemployment and inflation data, we selectively bought agency paper in the six-month and one-year part of the curve.
We felt comfortable that the Fund was appropriately positioned given the interest rate environment during the Reporting Period. While conditions over the year did not provide bountiful opportunities to pick up yield, as interest rates remained near zero or at times securities were offered at negative rates, it should be noted that regardless of interest rate conditions, we manage the Fund consistently. Our investment approach has always been tri-fold — to seek preservation of capital, daily liquidity and maximization of yield potential. We manage interest and credit risk daily. Whether interest rates are historically low, high or in-between, we intend to continue to use our actively managed approach to provide the best possible return within the framework of the Fund’s guidelines and objectives.
How did you manage the Fund’s weighted average maturity during the Reporting Period?
On December 31, 2011, the Fund’s weighted average maturity was 45 days. During the first quarter of 2012, we maintained the Fund’s weighted average maturity in a 35 to 50 day range. Through the remaining months of the Reporting Period, we maintained the Fund’s weighted average maturity in a 45 to 55 day range. Throughout, we made adjustments in line with our outlook on interest rates, Fed policy and the shape of the yield curve over the near term. The Fund’s weighted average maturity on December 31, 2012 was 50 days. The weighted average maturity of a money market fund is a measure of its price sensitivity to changes in interest rates. Also known as effective maturity, weighted average maturity measures the weighted average of the maturity date of bonds held by the Fund taking into consideration any available maturity shortening features.
How did you manage the Fund’s weighted average life during the Reporting Period?
The weighted average life of the Fund was 81 days as of December 31, 2012. The weighted average life of a money market fund is a measure of a money market fund’s price sensitivity to changes in liquidity and/or credit risk.
Under amendments to SEC Rule 2a-7 that became effective in May 2010, the maximum allowable weighted average life of a money market fund is 120 days. While one of the goals of the SEC’s money market fund rule is to reinforce conservative investment practices across the money market fund industry, our security selection process has long emphasized conservative investment choices.
4
GOLDMAN SACHS VARIABLE INSURANCE TRUST MONEY MARKET FUND
How was the Fund invested during the Reporting Period?
The Fund had investments in commercial paper, asset-backed commercial paper, U.S. Treasury securities, government agency securities, repurchase agreements, government guaranteed paper, tax-exempt municipal debt obligations and certificates of deposit during the Reporting Period. We focused on securities across the maturity spectrum, including overnight repurchase agreements, securities with one-month to three-month maturities, and tax-exempt variable rate demand notes. We particularly made purchases in longer-dated agencies during the second half of the Reporting Period when prices declined and we had the opportunity to lock in the higher yields then available.
With yields bound near zero, there was not a lot of dispersion in performance among securities available for purchase. Throughout, though, we stayed true to our investment discipline, favoring liquidity and high quality credits over added yield. The primary focal points for our team are consistently managing interest rate risk and credit risk. We were able to navigate interest rate risk by adjusting the Fund’s weighted average maturity longer or shorter as market conditions shifted and to mitigate potential credit risk by buying high quality, creditworthy names, strategies which added to the Fund’s performance during the Reporting Period.
Did you make any changes in the Fund’s portfolio during the Reporting Period?
We did not make any significant changes in the Fund’s portfolio during the Reporting Period. As indicated earlier, we made adjustments to the Fund’s weighted average maturity based on then-current market conditions, our near-term view, and anticipated and actual Fed monetary policy statements.
What is the Fund’s tactical view and strategy for the months ahead?
In our view, the themes for a decrease, or what is known as richening, in funding rates remained in place at the end of the Reporting Period, as the Fed’s third round of quantitative easing, dubbed QE3, leads to a build-up of reserves, and the end of Operation Twist, which expired at the end of December 2012, resulted in less collateral in the market. We believe the potential for a further influx of cash into the short-term end of the money market yield curve as a result of the expiration of the Temporary Account Guarantee (“TAG”) program on December 31, 2012 as well as a potential flight to quality move as a result of the upcoming U.S. debt ceiling negotiations have the potential to put further downward pressure on money market yields. (During the worst of the recent financial crisis, the Federal Deposit Insurance Corporation (“FDIC”) instituted the TAG program to temporarily provide unlimited insurance for, among other accounts, certain large, noninterest-bearing transaction accounts. The Dodd-Frank Act authorized continuation of the program at no cost for participants until December 31, 2012. Congress failed to pass industry-supported legislation to extend the program.)
Indeed, in our opinion, short-term interest rates are likely to remain low at least into 2014 with the Fed holding the targeted federal funds rate near zero. Although money market investment flows appear to have stabilized, we expect to keep the Fund conservatively positioned as we continue to focus on preservation of capital and daily liquidity. We do not believe there is value in sacrificing liquidity in exchange for opportunities that only modestly increase yield potential. We will continue to use our actively managed approach to seek the best possible return within the framework of the Fund’s investment guidelines and objectives. In addition, we will continue to manage interest, liquidity and credit risk daily. In our view, Fed policy risks remained, at the end of the Reporting Period, skewed to the side of easier monetary policy and further accommodation.
We will, of course, continue to closely monitor economic data, Fed policy, and any shifts in the money market yield curve, as we strive to strategically navigate the interest rate environment.
5
FUND BASICS
SECTOR ALLOCATION†
Security Type
(Percentage of Net Assets)
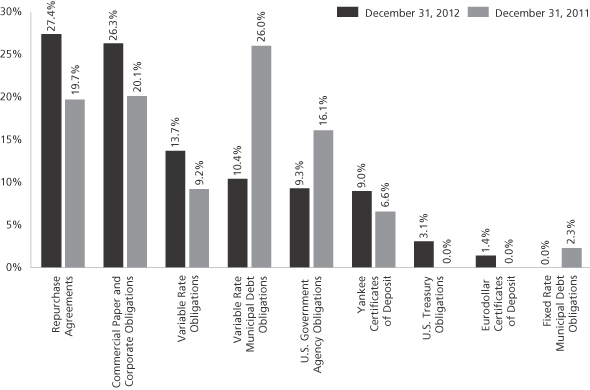
| † | The Fund is actively managed and, as such, its portfolio composition may differ over time. The percentage shown for each investment category reflects the value (based on amortized cost) of investments in that category as a percentage of net assets. Figures in the above chart may not sum to 100% due to the exclusion of other assets and liabilities. |
6
GOLDMAN SACHS VARIABLE INSURANCE TRUST MONEY MARKET FUND
Schedule of Investments
December 31, 2012
| Principal Amount | Interest Rate | Maturity Date | Amortized Cost | |||||||||||
| Commercial Paper and Corporate Obligations – 26.3% | ||||||||||||||
| ABN Amro Funding (USA) LLC | ||||||||||||||
| $ | 5,000,000 | 0.441 | % | 02/04/13 | $ | 4,997,922 | ||||||||
| 2,000,000 | 0.401 | 03/01/13 | 1,998,689 | |||||||||||
| Aspen Funding Corp. | ||||||||||||||
| 5,044,000 | 0.310 | 02/13/13 | 5,042,132 | |||||||||||
| Atlantic Asset Securitization LLC | ||||||||||||||
| 8,000,000 | 0.270 | 01/18/13 | 7,998,980 | |||||||||||
| Atlantis One Funding Corp. | ||||||||||||||
| 9,000,000 | 0.491 | 02/22/13 | 8,993,630 | |||||||||||
| Bank of China Ltd. | ||||||||||||||
| 5,000,000 | 0.651 | 03/18/13 | 4,993,139 | |||||||||||
| Chariot Funding LLC | ||||||||||||||
| 5,000,000 | 0.321 | 06/11/13 | 4,992,844 | |||||||||||
| Erste Abwicklungsanstalt | ||||||||||||||
| 10,000,000 | 0.431 | 01/25/13 | 9,997,133 | |||||||||||
| Gemini Securitization Corp. LLC | ||||||||||||||
| 2,000,000 | 0.320 | 01/08/13 | 1,999,876 | |||||||||||
| 5,192,000 | 0.290 | 02/04/13 | 5,190,578 | |||||||||||
| Hannover Funding Co. LLC | ||||||||||||||
| 8,000,000 | 0.350 | 01/22/13 | 7,998,367 | |||||||||||
| Kells Funding LLC | ||||||||||||||
| 9,000,000 | 0.511 | 01/08/13 | 8,999,108 | |||||||||||
| LMA Americas LLC | ||||||||||||||
| 2,000,000 | 0.380 | 01/07/13 | 1,999,873 | |||||||||||
| 2,000,000 | 0.360 | 02/13/13 | 1,999,140 | |||||||||||
| Regency Markets No. 1 LLC | ||||||||||||||
| 6,919,000 | 0.235 | 01/22/13 | 6,918,052 | |||||||||||
| Royal Park Investments Funding Corp. | ||||||||||||||
| 5,000,000 | 1.005 | 04/17/13 | 4,985,278 | |||||||||||
| Versailles Commercial Paper LLC | ||||||||||||||
| 5,000,000 | 0.340 | 01/10/13 | 4,999,575 | |||||||||||
|
| |||||||||||||
| | TOTAL COMMERCIAL PAPER AND CORPORATE OBLIGATIONS | | $ | 94,104,316 | ||||||||||
|
| |||||||||||||
| Eurodollar Certificate of Deposit – 1.4% | ||||||||||||||
| Sumitomo Mitsui Trust Bank Ltd. |
| ||||||||||||
| $ | 5,000,000 | 0.400 | % | 01/25/13 | $ | 5,000,016 | ||||||||
|
| |||||||||||||
| U.S. Government Agency Obligations – 9.3% | ||||||||||||||
| Federal Home Loan Bank |
| ||||||||||||
| $ | 300,000 | 0.210 | % | 05/17/13 | $ | 299,952 | ||||||||
| 350,000 | 0.200 | 05/22/13 | 349,929 | |||||||||||
| 200,000 | 0.230 | 05/23/13 | 199,982 | |||||||||||
| 20,000 | 0.230 | 05/24/13 | 19,998 | |||||||||||
| 1,000,000 | 0.240 | 05/24/13 | 999,948 | |||||||||||
| 500,000 | 0.230 | 05/29/13 | 499,953 | |||||||||||
| 500,000 | 0.240 | 06/06/13 | 499,972 | |||||||||||
| 100,000 | 0.230 | 06/07/13 | 99,990 | |||||||||||
| 50,000 | 0.280 | 06/10/13 | 50,000 | |||||||||||
| 200,000 | 0.350 | 06/10/13 | 200,084 | |||||||||||
| 300,000 | 0.230 | 06/12/13 | 299,969 | |||||||||||
|
| |||||||||||||
| U.S. Government Agency Obligations – (continued) | ||||||||||||||
| Federal Home Loan Bank – (continued) |
| ||||||||||||
| $ | 90,000 | 1.625 | % | 06/14/13 | $ | 90,549 | ||||||||
| 350,000 | 0.230 | 06/18/13 | 349,962 | |||||||||||
| 400,000 | 0.420 | 06/21/13 | 400,311 | |||||||||||
| 100,000 | 1.875 | 06/21/13 | 100,757 | |||||||||||
| 300,000 | 0.125 | 06/28/13 | 299,798 | |||||||||||
| 600,000 | 0.240 | 06/28/13 | 599,953 | |||||||||||
| 370,000 | 0.250 | 07/05/13 | 369,975 | |||||||||||
| 1,000,000 | 0.153 | (a) | 07/08/13 | 999,739 | ||||||||||
| 260,000 | 0.350 | 07/09/13 | 260,116 | |||||||||||
| 1,000,000 | 0.149 | (a) | 07/15/13 | 999,729 | ||||||||||
| 4,000,000 | 0.280 | 09/16/13 | 4,001,902 | |||||||||||
| 100,000 | 0.125 | 09/25/13 | 99,928 | |||||||||||
| 1,000,000 | 0.210 | 10/01/13 | 999,903 | |||||||||||
| 400,000 | 0.210 | 10/10/13 | 399,984 | |||||||||||
| 1,700,000 | 0.200 | 10/18/13 | 1,699,827 | |||||||||||
| 140,000 | 0.300 | 10/18/13 | 140,091 | |||||||||||
| 50,000 | 0.375 | 10/18/13 | 50,062 | |||||||||||
| 1,000,000 | 3.625 | 10/18/13 | 1,026,967 | |||||||||||
| 2,000,000 | 0.210 | 10/24/13 | 1,999,955 | |||||||||||
| 7,000,000 | 0.375 | 11/27/13 | 7,009,264 | |||||||||||
| Federal Home Loan Mortgage Corporation |
| ||||||||||||
| 1,000,000 | 0.164 | (a) | 05/03/13 | 999,865 | ||||||||||
| 30,000 | 4.000 | 06/12/13 | 30,496 | |||||||||||
| 1,000,000 | 4.500 | 07/15/13 | 1,022,648 | |||||||||||
| 150,000 | 0.375 | 10/15/13 | 150,185 | |||||||||||
| 130,000 | 0.875 | 10/28/13 | 130,702 | |||||||||||
| 500,000 | 0.375 | 10/30/13 | 500,671 | |||||||||||
| Federal National Mortgage Association |
| ||||||||||||
| 1,500,000 | 0.221 | (a) | 05/17/13 | 1,499,828 | ||||||||||
| 240,000 | 0.500 | 08/09/13 | 240,325 | |||||||||||
| 100,000 | 1.125 | 10/08/13 | 100,691 | |||||||||||
| 3,075,000 | 4.625 | 10/15/13 | 3,180,835 | |||||||||||
|
| |||||||||||||
| | TOTAL U.S. GOVERNMENT AGENCY OBLIGATIONS | | $ | 33,274,795 | ||||||||||
|
| |||||||||||||
| U.S. Treasury Obligations – 3.1% | ||||||||||||||
| United States Treasury Notes |
| ||||||||||||
| $ | 500,000 | 3.875 | % | 02/15/13 | $ | 502,245 | ||||||||
| 1,000,000 | 0.625 | 02/28/13 | 1,000,664 | |||||||||||
| 1,600,000 | 0.750 | 03/31/13 | 1,602,128 | |||||||||||
| 1,000,000 | 2.500 | 03/31/13 | 1,005,480 | |||||||||||
| 300,000 | 1.000 | 07/15/13 | 301,195 | |||||||||||
| 800,000 | 0.125 | 09/30/13 | 799,514 | |||||||||||
| 700,000 | 3.125 | 09/30/13 | 715,203 | |||||||||||
| 5,200,000 | 0.500 | 10/15/13 | 5,211,907 | |||||||||||
|
| |||||||||||||
| | TOTAL U.S. TREASURY OBLIGATIONS | | $ | 11,138,336 | ||||||||||
|
| |||||||||||||
| The accompanying notes are an integral part of these financial statements. | 7 |
GOLDMAN SACHS VARIABLE INSURANCE TRUST MONEY MARKET FUND
Schedule of Investments (continued)
December 31, 2012
| Principal Amount | Interest Rate | Maturity Date | Amortized Cost | |||||||||||
| Variable Rate Municipal Debt Obligations(a) – 10.4% | ||||||||||||||
| Alaska Housing Finance Corp. VRDN RB Taxable General | | ||||||||||||
| $ | 500,000 | 0.160 | % | 01/07/13 | $ | 500,000 | ||||||||
| BlackRock Municipal Income Trust VRDN RB Putters | | ||||||||||||
| 1,000,000 | 0.200 | (b) | 01/02/13 | 1,000,000 | ||||||||||
| BlackRock MuniHoldings Investment Quality Fund VRDN Tax- | | ||||||||||||
| 300,000 | 0.330 | (b) | 01/07/13 | 300,000 | ||||||||||
| BlackRock MuniVest Fund, Inc. VRDN RB Putters | | ||||||||||||
| 950,000 | 0.200 | (b) | 01/02/13 | 950,000 | ||||||||||
| BlackRock MuniYield Fund, Inc. VRDN Tax-Exempt Preferred | | ||||||||||||
| 300,000 | 0.530 | (b) | 01/07/13 | 300,000 | ||||||||||
| City of Durham, North Carolina GO VRDN for Taxable Housing | | ||||||||||||
| 1,190,000 | 0.330 | 01/07/13 | 1,190,000 | |||||||||||
| City of Los Angeles, California Department of Airports VRDN | | ||||||||||||
| 1,490,000 | 0.190 | (b) | 01/07/13 | 1,490,000 | ||||||||||
| Cook County, Illinois GO VRDN Series 2002 B (Bank of | | ||||||||||||
| 1,100,000 | 0.150 | 01/07/13 | 1,100,000 | |||||||||||
| Dekalb County, Georgia Development Authority VRDN RB for | | ||||||||||||
| 3,400,000 | 0.190 | 01/07/13 | 3,400,000 | |||||||||||
| Los Angeles Community College District GO VRDN for Building | | ||||||||||||
| 11,000,000 | 0.460 | (b) | 01/07/13 | 11,000,000 | ||||||||||
| Montgomery County, Virginia Industrial Development Authority | | ||||||||||||
| 1,120,000 | 0.210 | 01/07/13 | 1,120,000 | |||||||||||
| New Jersey State Turnpike Authority VRDN RB P-Floats- | | ||||||||||||
| 480,000 | 0.280 | (b) | 01/07/13 | 480,000 | ||||||||||
| New York City GO VRDN Series 2007 Subseries D-4 (Calyon | | ||||||||||||
| 250,000 | 0.190 | 01/07/13 | 250,000 | |||||||||||
| New York City Transitional Finance Authority VRDN RB for | | ||||||||||||
| 700,000 | 0.120 | 01/07/13 | 700,000 | |||||||||||
| Nuveen Municipal Market Opportunity Fund, Inc. VRDN Tax- | | ||||||||||||
| 500,000 | 0.270 | (b) | 01/07/13 | 500,000 | ||||||||||
| Port Authority of New York & New Jersey VRDN RB P-Floats- | | ||||||||||||
| 3,790,000 | 0.220 | (b) | 01/07/13 | 3,790,000 | ||||||||||
|
| |||||||||||||
| Variable Rate Municipal Debt Obligations(a) – (continued) | ||||||||||||||
| Port of Corpus Christi Authority of Nueces County VRDN RB for | | ||||||||||||
| $ | 2,000,000 | 0.200 | % | 01/07/13 | $ | 2,000,000 | ||||||||
| State of Texas GO VRDN Refunding for Taxable Veterans’ Land | | ||||||||||||
| 600,000 | 0.210 | 01/07/13 | 600,000 | |||||||||||
| State of Texas GO VRDN Refunding for Taxable Veterans’ Land | | ||||||||||||
| 455,000 | 0.220 | 01/07/13 | 455,000 | |||||||||||
| Texas State GO VRDN Refunding Series 2010 D RMKT (Bank of | | ||||||||||||
| 1,000,000 | 0.200 | 01/07/13 | 1,000,000 | |||||||||||
| Texas State VRDN RN Series 2012-4262 (JP Morgan Chase Bank | | ||||||||||||
| 4,000,000 | 0.140 | (b) | 01/02/13 | 4,000,000 | ||||||||||
| University of Alabama VRDN RB Series 1993 B |
| ||||||||||||
| 800,000 | 0.270 | 01/07/13 | 800,000 | |||||||||||
| University of Utah VRDN RB for Auxiliary & Campus Facilities | | ||||||||||||
| 345,000 | 0.220 | 01/07/13 | 345,000 | |||||||||||
|
| |||||||||||||
| | TOTAL VARIABLE RATE MUNICIPAL DEBT OBLIGATIONS | | $ | 37,270,000 | ||||||||||
|
| |||||||||||||
| Variable Rate Obligations(a) – 13.7% | ||||||||||||||
| Australia & New Zealand Banking Group Ltd. |
| ||||||||||||
| $ | 5,000,000 | 0.400 | %(b) | 01/16/14 | $ | 5,000,000 | ||||||||
| Bank of Nova Scotia |
| ||||||||||||
| 5,000,000 | 0.362 | 01/24/14 | 5,000,000 | |||||||||||
| Commonwealth Bank of Australia |
| ||||||||||||
| 3,000,000 | 0.362 | (b) | 11/18/13 | 3,000,000 | ||||||||||
| Cooperatieve Centrale Raiffeisen-Boerenleenbank B.A. |
| ||||||||||||
| 9,000,000 | 0.460 | 08/12/13 | 9,000,000 | |||||||||||
| Credit Suisse Securities (USA) LLC |
| ||||||||||||
| 5,000,000 | 0.270 | (c) | 04/01/13 | 5,000,000 | ||||||||||
| Deutsche Bank AG |
| ||||||||||||
| 2,000,000 | 0.708 | (c) | 03/15/13 | 2,000,000 | ||||||||||
| JPMorgan Chase Bank N.A. |
| ||||||||||||
| 1,000,000 | 0.395 | 06/18/13 | 1,000,000 | |||||||||||
| 3,000,000 | 0.331 | 06/21/13 | 3,000,000 | |||||||||||
| Overseas Private Investment Corp. (USA) |
| ||||||||||||
| 1,500,000 | 0.170 | (c) | 01/07/13 | 1,500,000 | ||||||||||
| 2,000,000 | 0.170 | (c) | 01/07/13 | 2,000,000 | ||||||||||
| Providence Health & Services (U.S. Bank N.A.) |
| ||||||||||||
| 880,000 | 0.220 | (c) | 01/07/13 | 880,000 | ||||||||||
| Svenska Handelsbanken AB |
| ||||||||||||
| 5,000,000 | 0.434 | 01/03/14 | 5,000,000 | |||||||||||
|
| |||||||||||||
| 8 | The accompanying notes are an integral part of these financial statements. |
GOLDMAN SACHS VARIABLE INSURANCE TRUST MONEY MARKET FUND
| Principal Amount | Interest Rate | Maturity Date | Amortized Cost | |||||||||||
| Variable Rate Obligations(a) – (continued) | ||||||||||||||
| Wells Fargo Bank N.A. |
| ||||||||||||
| $ | 2,500,000 | 0.359 | % | 01/21/14 | $ | 2,500,000 | ||||||||
| Westpac Banking Corp. |
| ||||||||||||
| 4,000,000 | 0.390 | (b) | 01/31/14 | 4,000,000 | ||||||||||
|
| |||||||||||||
| | TOTAL VARIABLE RATE OBLIGATIONS | | $ | 48,880,000 | ||||||||||
|
| |||||||||||||
| Yankee Certificates of Deposit – 9.0% | ||||||||||||||
| BNP Paribas Securities Corp. |
| ||||||||||||
| $ | 5,000,000 | 0.310 | % | 03/15/13 | $ | 5,000,000 | ||||||||
| Norinchukin Bank |
| ||||||||||||
| 5,000,000 | 0.490 | 03/01/13 | 5,001,102 | |||||||||||
| Societe Generale |
| ||||||||||||
| 7,000,000 | 0.310 | 01/31/13 | 7,000,000 | |||||||||||
| Standard Chartered Bank |
| ||||||||||||
| 7,000,000 | 0.490 | 01/07/13 | 7,000,000 | |||||||||||
| Toronto-Dominion Bank |
| ||||||||||||
| 8,000,000 | 0.200 | 01/08/13 | 7,999,969 | |||||||||||
|
| |||||||||||||
| | TOTAL YANKEE CERTIFICATES OF DEPOSIT | | $ | 32,001,071 | ||||||||||
|
| |||||||||||||
| | TOTAL INVESTMENTS BEFORE REPURCHASE AGREEMENTS | | $ | 261,668,534 | ||||||||||
|
| |||||||||||||
| Repurchase Agreements(d) – 27.4% | ||||||||||||||
| ABN Amro Securities (USA) LLC |
| ||||||||||||
| $ | 1,000,000 | 0.300 | %(a) | 01/02/13 | $ | 1,000,000 | ||||||||
| Maturity Value: $1,000,058 |
| ||||||||||||
| Settlement Date: 12/26/12 |
| ||||||||||||
| Collateralized by various equity securities. The aggregate market | | ||||||||||||
|
| |||||||||||||
| BNP Paribas Securities Corp. |
| ||||||||||||
| 2,000,000 | 0.470 | 01/02/13 | 2,000,000 | |||||||||||
| Maturity Value: $2,000,052 |
| ||||||||||||
| Collateralized by various asset-backed obligations, 4.806% to | | ||||||||||||
|
| |||||||||||||
| Credit Agricole Corporate and Investment Bank |
| ||||||||||||
| 5,000,000 | 0.240 | (a)(c) | 01/07/13 | 5,000,000 | ||||||||||
| Maturity Value: $5,003,067 |
| ||||||||||||
| Settlement Date: 10/15/12 |
| ||||||||||||
| Collateralized by Federal Home Loan Mortgage Corp., 3.500%, | | ||||||||||||
|
| |||||||||||||
| Repurchase Agreements(d) – (continued) | ||||||||||||||
| Deutsche Bank Securities, Inc. |
| ||||||||||||
| $ | 5,000,000 | 0.190 | % | 01/02/13 | $ | 5,000,000 | ||||||||
| Maturity Value: $5,000,053 |
| ||||||||||||
| Collateralized by various corporate security issuers, 2.125% to | | ||||||||||||
| 3,000,000 | 0.420 | 01/02/13 | 3,000,000 | |||||||||||
| Maturity Value: $3,000,070 |
| ||||||||||||
| Collateralized by various corporate security issuers, 2.500% to | | ||||||||||||
| 8,000,000 | 0.240 | 03/18/13 | 8,000,000 | |||||||||||
| Maturity Value: $8,006,347 |
| ||||||||||||
| Settlement Date: 11/19/12 |
| ||||||||||||
| Collateralized by Federal Home Loan Mortgage Corp., 4.500% to | | ||||||||||||
| 400,000 | 0.250 | 04/03/13 | 400,000 | |||||||||||
| Maturity Value: $400,336 |
| ||||||||||||
| Settlement Date: 12/03/12 |
| ||||||||||||
| Collateralized by Federal National Mortgage Association, 3.790% | | ||||||||||||
|
| |||||||||||||
| ING Financial Markets LLC |
| ||||||||||||
| 5,000,000 | 0.190 | 01/02/13 | 5,000,000 | |||||||||||
| Maturity Value: $5,000,053 |
| ||||||||||||
| Collateralized by Federal Home Loan Mortgage Corp., 2.500%, | | ||||||||||||
|
| |||||||||||||
| Joint Repurchase Agreement Account III |
| ||||||||||||
| 61,800,000 | 0.206 | 01/02/13 | 61,800,000 | |||||||||||
| Maturity Value: $61,800,707 |
| ||||||||||||
|
| |||||||||||||
| Merrill Lynch, Pierce, Fenner & Smith, Inc. |
| ||||||||||||
| 2,000,000 | 0.340 | 01/02/13 | 2,000,000 | |||||||||||
| Maturity Value: $2,000,132 |
| ||||||||||||
| Settlement Date: 12/26/12 |
| ||||||||||||
| Collateralized by various corporate security issuers, 0.375% to | | ||||||||||||
|
| |||||||||||||
| The accompanying notes are an integral part of these financial statements. | 9 |
GOLDMAN SACHS VARIABLE INSURANCE TRUST MONEY MARKET FUND
Schedule of Investments (continued)
December 31, 2012
| Principal Amount | Interest Rate | Maturity Date | Amortized Cost | |||||||||||
| Repurchase Agreements(d) – (continued) | ||||||||||||||
| RBS Securities, Inc. |
| ||||||||||||
| $ | 5,000,000 | 0.370 | % | 01/02/13 | $ | 5,000,000 | ||||||||
| Maturity Value: $5,000,103 |
| ||||||||||||
| Collateralized by Government National Mortgage Association, | | ||||||||||||
|
| |||||||||||||
| TOTAL REPURCHASE AGREEMENTS | $ | 98,200,000 | ||||||||||||
|
| |||||||||||||
| TOTAL INVESTMENTS – 100.6% | $ | 359,868,534 | ||||||||||||
|
| |||||||||||||
| LIABILITIES IN EXCESS OF | | (2,323,091 | ) | ||||||||||
|
| |||||||||||||
| NET ASSETS – 100.0% | $ | 357,545,443 | ||||||||||||
|
| |||||||||||||
| The percentage shown for each investment category reflects the value of investments in that category as a percentage of net assets. | ||
| (a) | Variable or floating rate security. Interest rate disclosed is that which is in effect at December 31, 2012. | |
| (b) | Security not registered under the Securities Act of 1933, as amended. Such securities have been determined to be liquid by the Investment Adviser. At December 31, 2012, these securities amounted to $35,810,000 or approximately 10.0% of net assets. | |
| (c) | The instrument is subject to a demand feature. | |
| (d) | Unless noted, all repurchase agreements were entered into on December 31, 2012. Additional information on Joint Repurchase Agreement Account III appears on page 11.
| |
| Interest rates represent either the stated coupon rate, annualized yield on date of purchase for discounted securities, or, for floating rate securities, the current reset rate, which is based upon current interest rate indices. | ||
Maturity dates represent either the final legal maturity date on the security, the demand date for puttable securities, or the prerefunded date for those types of securities. | ||
| Investment Abbreviations: | ||
| AGM | — Insured by Assured Guaranty Municipal Corp. | |
| GO | — General Obligation | |
| GTY AGMT | — Guaranty Agreement | |
| LIQ | — Liquidity Agreement | |
| RB | — Revenue Bond | |
| RN | — Revenue Notes | |
| RMKT | — Remarketed | |
| SPA | — Stand-by Purchase Agreement | |
| VRDN | — Variable Rate Demand Notes | |
| 10 | The accompanying notes are an integral part of these financial statements. |
GOLDMAN SACHS VARIABLE INSURANCE TRUST MONEY MARKET FUND
ADDITIONAL INVESTMENT INFORMATION
JOINT REPURCHASE AGREEMENT ACCOUNT III — At December 31, 2012, the Fund had undivided interests in the Joint Repurchase Agreement Account III, with a maturity date of January 2, 2013, as follows:
| Principal Amount | Maturity Value | Collateral Value | |||||||||||
| $61,800,000 | $ | 61,800,707 | $ | 63,564,461 | |||||||||
REPURCHASE AGREEMENTS — At December 31, 2012, the Principal Amounts of the Fund’s interest in the Joint Repurchase Agreement Account III were as follows:
| Counterparty | Interest Rate | Principal Amount | ||||||
| BNP Paribas Securities Corp. | 0.210 | % | $ | 7,436,823 | ||||
| Bank of Nova Scotia (The) | 0.210 | 4,908,303 | ||||||
| Crédit Agricole Corporate and Investment Bank | 0.200 | 34,953,069 | ||||||
| Merrill Lynch, Pierce, Fenner & Smith Inc. | 0.200 | 10,039,711 | ||||||
Wells Fargo Securities LLC | 0.220 | 4,462,094 | ||||||
| TOTAL | $ | 61,800,000 | ||||||
At December 31, 2012, the Joint Repurchase Agreement Account III was fully collateralized by:
| Issuer | Interest Rates | Maturity Dates | ||||||
| Federal Home Loan Mortgage Corp. | 2.500 to 5.000 | % | 10/01/26 to 12/01/42 | |||||
| Federal National Mortgage Association | 3.000 to 5.500 | 02/01/26 to 12/01/42 | ||||||
| Government National Mortgage Association | 3.000 | 09/15/42 | ||||||
| U.S. Treasury Bond | 6.125 | 11/15/27 | ||||||
| The accompanying notes are an integral part of these financial statements. | 11 |
GOLDMAN SACHS VARIABLE INSURANCE TRUST MONEY MARKET FUND
Statement of Assets and Liabilities
December 31, 2012
| Assets: | ||||
Investments based on amortized cost | $ | 261,668,534 | ||
Repurchase agreements based on amortized cost | 98,200,000 | |||
Cash | 51,278 | |||
Receivables: | ||||
Interest | 189,430 | |||
Fund shares sold | 141,714 | |||
| Total assets | 360,250,956 | |||
| Liabilities: | ||||
Payables: | ||||
Fund shares redeemed | 2,513,870 | |||
Amounts owed to affiliates | 96,323 | |||
Accrued expenses | 95,320 | |||
| Total liabilities | 2,705,513 | |||
| Net Assets: | ||||
Paid-in capital | 357,545,443 | |||
| NET ASSETS | $ | 357,545,443 | ||
Shares of beneficial interest outstanding, $0.001 par value (unlimited shares authorized) | 357,545,424 | |||
Net asset value, offering and redemption price per share | $1.00 | |||
| 12 | The accompanying notes are an integral part of these financial statements. |
GOLDMAN SACHS VARIABLE INSURANCE TRUST MONEY MARKET FUND
Statement of Operations
For the Fiscal Year Ended December 31, 2012
| Investment Income: | ||||
Interest | $ | 818,843 | ||
| Expenses: | ||||
Distribution and Service fees | 572,929 | |||
Management fees | 469,802 | |||
Professional fees | 51,326 | |||
Transfer Agent fees | 45,830 | |||
Printing and mailing costs | 44,802 | |||
Trustee fees | 14,692 | |||
Custody and accounting fees | 13,618 | |||
| Total expenses | 1,212,999 | |||
Less — expense reductions | (403,403 | ) | ||
| Net expenses | 809,596 | |||
| NET INVESTMENT INCOME | 9,247 | |||
| NET REALIZED GAIN FROM INVESTMENT TRANSACTIONS | 4,734 | |||
| NET INCREASE IN NET ASSETS RESULTING FROM OPERATIONS | $ | 13,981 | ||
| The accompanying notes are an integral part of these financial statements. | 13 |
GOLDMAN SACHS VARIABLE INSURANCE TRUST MONEY MARKET FUND
Statements of Changes in Net Assets
| For the Fiscal Year Ended December 31, 2012 | For the Fiscal Year Ended December 31, 2011 | |||||||
| From Operations: | ||||||||
Net investment income | $ | 9,247 | $ | 7,497 | ||||
Net realized gain | 4,734 | 1,380 | ||||||
| Net increase in net assets resulting from operations | 13,981 | 8,877 | ||||||
| Distributions to shareholders: | ||||||||
From net investment income | (9,247 | ) | (7,497 | ) | ||||
From net realized gains | (4,734 | ) | (1,380 | ) | ||||
From capital | — | (387 | ) | |||||
| Total distributions to shareholders | (13,981 | ) | (9,264 | ) | ||||
| From share transactions (at net asset value of $1.00 per share): | ||||||||
Proceeds from sales of shares | 315,283,256 | 77,973,255 | ||||||
Reinvestment of distributions | 13,981 | 9,264 | ||||||
Cost of shares redeemed | (101,924,898 | ) | (57,174,442 | ) | ||||
| Net increase in net assets resulting from share transactions | 213,372,339 | 20,808,077 | ||||||
| TOTAL INCREASE | 213,372,339 | 20,807,690 | ||||||
| Net assets: | ||||||||
Beginning of year | 144,173,104 | 123,365,414 | ||||||
End of year | $ | 357,545,443 | $ | 144,173,104 | ||||
| 14 | The accompanying notes are an integral part of these financial statements. |
GOLDMAN SACHS VARIABLE INSURANCE TRUST MONEY MARKET FUND
Financial Highlights
Selected Data for a Share Outstanding Throughout Each Year
| Net asset value, beginning of year | Net investment income(a) | Distributions from net investment income(b) | Net asset value, end of year | Total return(c) | Net assets, end of year (in 000's) | Ratio of net expenses to average net assets | Ratio of total expenses to average net assets | Ratio of net investment income to average net assets | ||||||||||||||||||||||||||||
FOR THE FISCAL YEARS ENDED DECEMBER 31, | ||||||||||||||||||||||||||||||||||||
2012 | $ | 1.00 | $ | — | (d) | $ | — | (d) | $ | 1.00 | 0.01 | % | $ | 357,545 | 0.35 | % | 0.53 | % | — | %(e) | ||||||||||||||||
2011 | 1.00 | — | (d) | — | (d) | 1.00 | 0.01 | 144,173 | 0.30 | 0.66 | 0.01 | |||||||||||||||||||||||||
2010 | 1.00 | — | (d) | — | (d) | 1.00 | 0.01 | 123,365 | 0.33 | 0.68 | — | (e) | ||||||||||||||||||||||||
2009 | 1.00 | 0.002 | (f) | (0.002 | )(f) | 1.00 | 0.15 | 143,347 | 0.53 | 0.77 | 0.15 | |||||||||||||||||||||||||
2008 | 1.00 | 0.02 | (0.02 | ) | 1.00 | 2.25 | 194,871 | 0.63 | 0.71 | 2.27 | ||||||||||||||||||||||||||
| (a) | Calculated based on the average shares outstanding methodology. |
| (b) | Distributions may not coincide with the current year net investment income or net realized gains as distributions may be paid from current or prior year earnings. |
| (c) | Assumes reinvestment of all distributions. |
| (d) | Amount is less than $0.0005 per share. |
| (e) | Amount is less than 0.005% of average net assets. |
| (f) | Net investment income and distributions from net investment income contain $0.0002 of net realized capital gains and distributions from net realized gains. |
| The accompanying notes are an integral part of these financial statements. | 15 |
GOLDMAN SACHS VARIABLE INSURANCE TRUST MONEY MARKET FUND
Notes to Financial Statements
December 31, 2012
1. ORGANIZATION
Goldman Sachs Variable Insurance Trust (the “Trust” or “VIT”) is a Delaware statutory trust registered under the Investment Company Act of 1940, as amended (the “Act”), as an open-end management investment company. The Trust includes the Goldman Sachs Money Market Fund (the “Fund”). The Fund is a diversified portfolio under the Act offering one class of shares — Service Shares. Shares of the Trust are offered to separate accounts of participating life insurance companies for the purpose of funding variable annuity contracts and variable life insurance policies.
Goldman Sachs Asset Management, L.P. (“GSAM”), an affiliate of Goldman, Sachs & Co. (“Goldman Sachs”), serves as investment adviser to the Fund pursuant to a management agreement (the “Agreement”) with the Trust.
| 2. SIGNIFICANT ACCOUNTING POLICIES |
The financial statements have been prepared in accordance with accounting principles generally accepted in the United States of America (“GAAP”) and require management to make estimates and assumptions that may affect the reported amounts and disclosures. Actual results may differ from those estimates and assumptions.
A. Investment Valuation — The investment valuation policy of the Fund is to use the amortized-cost method permitted by Rule 2a-7 under the Act, which approximates market value, for valuing portfolio securities. Under this method, all investments purchased at a discount or premium are valued by accreting or amortizing the difference between the original purchase price and maturity value of the issue, as an adjustment to interest income. Under procedures and tolerances approved by the trustees, GSAM evaluates the difference between the Fund’s net asset value per share (“NAV”) based upon the amortized cost of the Fund’s securities and the NAV based upon available market quotations (or permitted substitutes) at least once a week.
B. Investment Income and Investments — Interest income is accrued daily and adjusted for amortization of premiums and accretion of discounts. Investment transactions are reflected on trade date. Realized gains and losses are calculated using identified cost.
C. Expenses — Expenses incurred directly by the Fund are charged to the Fund, and certain expenses incurred by the Trust, which may not specifically relate to the Fund, are allocated across its funds (including the Fund) on a straight-line and/or pro-rata basis depending upon the nature of the expenses and are accrued daily.
16
GOLDMAN SACHS VARIABLE INSURANCE TRUST MONEY MARKET FUND
Notes to Financial Statements (continued)
December 31, 2012
2. SIGNIFICANT ACCOUNTING POLICIES (continued)
D. Federal Taxes and Distributions to Shareholders — It is the Fund’s policy to comply with the requirements of the Internal Revenue Code of 1986, as amended (the “Code”), applicable to regulated investment companies (mutual funds) and to distribute each year substantially all of its investment company taxable and tax-exempt income and capital gains to its shareholders. Accordingly, the Fund is not required to make any provisions for the payment of federal income tax. Distributions to shareholders are declared and recorded daily and paid monthly by the Fund and may include short-term capital gains. Long-term capital gain distributions, if any, are declared and paid annually.
Under the Regulated Investment Company Modernization Act of 2010, the Fund is permitted to carry forward capital losses incurred in taxable years beginning after December 22, 2010 for an unlimited period. However, any losses incurred during those future taxable years will be required to be utilized prior to the losses incurred in pre-enactment taxable years. As a result of this ordering rule, pre-enactment capital loss carryforwards may be more likely to expire unused. Additionally, post-enactment capital losses that are carried forward will retain their character as either short-term or long term capital losses rather than being considered all short-term as under previous law.
The characterization of distributions to shareholders for financial reporting purposes is determined in accordance with federal income tax rules, which may differ from GAAP. The source of the Fund’s distributions may be shown in the accompanying financial statements as either from net investment income, net realized gain or capital. Certain components of the Fund’s net assets on the Statement of Assets and Liabilities reflect permanent GAAP/tax differences based on the appropriate tax character.
The tax character of distributions paid during the fiscal years ended December 31, 2012 and December 31, 2011, were as follows:
| 2012 | 2011 | |||||||
| Distributions paid from: | ||||||||
| Ordinary income | $ | 13,956 | $ | 8,877 | ||||
| Net long-term capital gains | 25 | — | ||||||
Total taxable distributions | $ | 13,981 | $ | 8,877 | ||||
| Tax return of capital | $ | — | $ | 387 | ||||
The amortized cost for the Fund stated in the accompanying Statement of Assets and Liabilities also represents aggregate cost for U.S. federal income tax purposes.
GSAM has reviewed the Fund’s tax positions for all open tax years (the current and prior three years, as applicable) and has concluded that no provision for income tax is required in the Fund’s financial statements. Such open tax years remain subject to examination and adjustment by tax authorities.
17
GOLDMAN SACHS VARIABLE INSURANCE TRUST MONEY MARKET FUND
Notes to Financial Statements (continued)
December 31, 2012
2. SIGNIFICANT ACCOUNTING POLICIES (continued)
E. Repurchase Agreements — Repurchase agreements involve the purchase of securities subject to the seller’s agreement to repurchase the securities at a mutually agreed upon date and price. During the term of a repurchase agreement, the value of the underlying securities held as collateral on behalf of the Fund, including accrued interest, is required to exceed the value of the repurchase agreement, including accrued interest. The underlying securities for all repurchase agreements are held at the Fund’s custodian or designated sub-custodians under tri-party repurchase agreements.
Pursuant to exemptive relief granted by the Securities and Exchange Commission (“SEC”) and terms and conditions contained therein, the Fund, together with other registered investment companies having management agreements with GSAM, or its affiliates, may transfer uninvested cash into joint accounts, the daily aggregate balance of which is invested in one or more repurchase agreements. Under these joint accounts, the Fund maintains pro-rata credit exposure to the underlying repurchase agreements’ counterparties. With the exception of certain transaction fees, the Fund is not subject to any expenses in relation to these investments.
| 3. INVESTMENTS AND FAIR VALUE MEASUREMENTS |
The fair value of a financial instrument is the amount that would be received to sell an asset or paid to transfer a liability in an orderly transaction between market participants at the measurement date (i.e., the exit price). GAAP establishes a fair value hierarchy that prioritizes the inputs to valuation techniques used to measure fair value. The hierarchy gives the highest priority to unadjusted quoted prices in active markets for identical assets or liabilities (Level 1 measurements) and the lowest priority to unobservable inputs (Level 3 measurements). The levels used for classifying investments are not necessarily an indication of the risk associated with investing in these investments. The three levels of the fair value hierarchy are described below:
Level 1 — Unadjusted quoted prices in active markets that are accessible at the measurement date for identical, unrestricted assets or liabilities;
Level 2 — Quoted prices in markets that are not active or financial instruments for which significant inputs are observable (including, but not limited to, quoted prices for similar investments, interest rates, foreign exchange rates, volatility and credit spreads), either directly or indirectly;
Level 3 — Prices or valuations that require significant unobservable inputs (including GSAM’s assumptions in determining fair value measurement).
As of December 31, 2012, all investments are classified as Level 2. Please refer to the Schedule of Investments for further detail.
18
GOLDMAN SACHS VARIABLE INSURANCE TRUST MONEY MARKET FUND
Notes to Financial Statements (continued)
December 31, 2012
4. AGREEMENTS AND AFFILIATED TRANSACTIONS
A. Management Agreement — Under the Agreement, GSAM manages the Fund, subject to the general supervision of the trustees.
As compensation for the services rendered pursuant to the Agreement, the assumption of the expenses related thereto and administration of the Fund’s business affairs, including providing facilities, GSAM is entitled to a management fee, accrued daily and paid monthly, equal to an annual percentage rate of the Fund’s average daily net assets.
B. Distribution and Service Plan — The Trust, on behalf of the Service Shares of the Fund, has adopted a Distribution and Service Plan (the “Plan”). Under the Plan, Goldman Sachs, which serves as distributor, is entitled to a fee, accrued daily and paid monthly for distribution services, which may then be paid by Goldman Sachs to authorized dealers. This fee is equal to an annual percentage rate of the Fund’s average daily net assets.
C. Transfer Agency Agreement — Goldman Sachs also serves as the transfer agent of the Fund for a fee pursuant to a Transfer Agency Agreement. The fee charged for such transfer agency services is accrued daily and paid monthly and is equal to an annual percentage rate of the Fund’s average daily net assets.
D. Other Expense Agreements — GSAM has agreed to limit certain “Other Expense” of the Fund (excluding management fees, distribution and service fees, acquired fund fees and expenses, transfer agent fees and expenses, taxes, interest, brokerage fees, litigation, indemnification, shareholder meetings and other extraordinary expenses) to the extent that such expenses exceed, on an annual basis, 0.004% of the average daily net assets of the Fund. Such Other Expense reimbursements, if any, are accrued daily and paid monthly. In addition, the Fund is not obligated to reimburse GSAM for prior fiscal year expense reimbursements, if any. These Other Expense reimbursements will remain in place through at least April 27, 2013, and prior to such date GSAM may not terminate the arrangement without the approval of the trustees. For the fiscal year ended December 31, 2012, GSAM reimbursed approximately $115,000 to the Fund. In addition, the Fund has entered into certain offset arrangements with the custodian and the transfer agent, which may result in a reduction of the Fund’s expenses and are received irrespective of the application of the “Other Expense” limitation described above.
19
GOLDMAN SACHS VARIABLE INSURANCE TRUST MONEY MARKET FUND
Notes to Financial Statements (continued)
December 31, 2012
4. AGREEMENTS AND AFFILIATED TRANSACTIONS (continued)
E. Contractual and Net Fund Expenses — During the fiscal year ended December 31, 2012, Goldman Sachs, as distributor, voluntarily agreed to waive a portion of distribution and service plan fees attributable to the Fund. This waiver may be modified or terminated at any time at the option of Goldman Sachs. The following table outlines such fees (net of waivers) and Other Expenses (net of reimbursements and custodian and transfer agent fee credit reductions) in order to determine the Fund’s net annualized expenses for the fiscal year. The Fund is not obligated to reimburse Goldman Sachs for prior fiscal year fee waivers, if any.
| Fee/Expense Type | Contractual rate, if any | Ratio of net expenses to for the fiscal year ended | ||||||||
| Management Fee | 0.21 | %(a) | 0.21 | % | ||||||
| Distribution and Service Fees | 0.25 | 0.12 | ||||||||
| Transfer Agency Fee | 0.02 | 0.02 | ||||||||
| Other Expenses | — | — | (b) | |||||||
| Net Expenses | 0.35 | % | ||||||||
| (a) | Unrounded contractual rate is 0.205%. |
| (b) | Amount is less than 0.005% of average net assets. |
For the fiscal year ended December 31, 2012, Goldman Sachs waived approximately $288,000 in distribution and service fees.
For the fiscal year ended December 31 2012, the amounts owed to affiliates of the Fund were approximately $62,000, $28,000, and $6,000 for management fees, distribution and service fees, and transfer agent fees, respectively.
F. Line of Credit Facility — As of December 31, 2012, the Fund participated in a $630,000,000 committed, unsecured revolving line of credit facility (the “facility”) together with other funds of the Trust and registered investment companies having management agreements with GSAM or its affiliates (“Other Borrowers”). Pursuant to the terms of the facility, the Fund and Other Borrowers could increase the credit amount by an additional $340,000,000, for a total of up to $970,000,000. This facility is to be used solely for temporary or emergency purposes, which may include the funding of redemptions. The interest rate on borrowings is based on the federal funds rate. The facility also requires a fee to be paid by the Fund based on the amount of the commitment that has not been utilized. For the fiscal year ended December 31, 2012, the Fund did not have any borrowings under the facility. Prior to May 8, 2012, the amount available through the facility was $580,000,000.
20
GOLDMAN SACHS VARIABLE INSURANCE TRUST MONEY MARKET FUND
Notes to Financial Statements (continued)
December 31, 2012
5. OTHER RISKS
The Fund’s risks include, but are not limited to, the following:
Fund Shareholder Concentration Risk — Certain participating insurance companies, accounts, or Goldman Sachs affiliates may from time to time own (beneficially or of record) or control a significant percentage of the Fund’s shares. Redemptions by these entities of their holdings in the Fund may impact the Fund’s liquidity and NAV. These redemptions may also force the Fund to sell securities.
Interest Rate Risk — When interest rates increase, the Fund’s yield will tend to be lower than prevailing market rates, and the market value of its securities or instruments may also be adversely affected. A low interest rate environment poses additional risks to the Fund, because low yields on the Fund’s portfolio holdings may have an adverse impact on the Fund’s ability to provide a positive yield to its shareholders, pay expenses out of Fund assets, or, at times, maintain a stable $1.00 share price.
Market and Credit Risks — In the normal course of business, the Fund trades financial instruments and enters into financial transactions where risk of potential loss exists due to changes in the market (market risk). Additionally, the Fund may also be exposed to credit risk in the event that an issuer fails to perform or that an institution or entity with which the Fund has unsettled or open transaction defaults.
6. INDEMNIFICATIONS
|
Under the Trust’s organizational documents, its trustees, officers, employees and agents are indemnified, to the extent permitted by the Act, against certain liabilities that may arise out of performance of their duties to the Fund. Additionally, in the course of business, the Fund enters into contracts that contain a variety of indemnification clauses. The Fund’s maximum exposure under these arrangements is unknown, as this would involve future claims that may be made against the Fund that have not yet occurred. However, GSAM believes the risk of loss under these arrangements to be remote.
.
21
GOLDMAN SACHS VARIABLE INSURANCE TRUST MONEY MARKET FUND
Notes to Financial Statements (continued)
December 31, 2012
7. OTHER MATTERS
New Accounting Pronouncement — In December 2011, the Financial Accounting Standards Board issued an Accounting Standards Update (“ASU”) to enhance disclosures about financial instruments and derivative instruments that are subject to offsetting (“netting”) on the Statement of Assets and Liabilities. This information will enable users of the Fund’s financial statements to evaluate the effect or potential effect of netting arrangements on the Fund’s financial position. The ASU is effective for financial statements with fiscal years beginning on or after January 1, 2013, and interim periods within those fiscal years. At this time, GSAM is evaluating the implications of these changes on the financial statements.
8. SUBSEQUENT EVENTS |
Subsequent events after the Statement of Assets and Liabilities date have been evaluated through the date the financial statements were issued. GSAM has concluded that there is no impact requiring adjustment or disclosure in the financial statements.
22
Report of Independent Registered Public Accounting Firm
To the Board of Trustees and Shareholders of
Goldman Sachs Variable Insurance Trust — Goldman Sachs Money Market Fund:
In our opinion, the accompanying statement of assets and liabilities, including the schedule of investments, and the related statements of operations and of changes in net assets and the financial highlights present fairly, in all material respects, the financial position of Goldman Sachs Money Market Fund (the “Fund”) at December 31, 2012, the results of its operations for the year then ended, the changes in its net assets for each of the two years in the period then ended and the financial highlights for the periods indicated, in conformity with accounting principles generally accepted in the United States of America. These financial statements and financial highlights (hereafter referred to as “financial statements”) are the responsibility of the Fund’s management. Our responsibility is to express an opinion on these financial statements based on our audit. We conducted our audit of these financial statements in accordance with the standards of the Public Company Accounting Oversight Board (United States). Those standards require that we plan and perform the audit to obtain reasonable assurance about whether the financial statements are free of material misstatement. An audit includes examining, on a test basis, evidence supporting the amounts and disclosures in the financial statements, assessing the accounting principles used and significant estimates made by management, and evaluating the overall financial statement presentation. We believe that our audit, which included confirmation of securities at December 31, 2012 by correspondence with the custodian, brokers, and the application of alternative auditing procedures where securities purchased confirmations have not been received, provides a reasonable basis for our opinion.
PricewaterhouseCoopers LLP
Boston, Massachusetts
February 14, 2013
23
GOLDMAN SACHS VARIABLE INSURANCE TRUST MONEY MARKET FUND
| Fund Expenses — Six Month Period Ended December 31, 2012 (Unaudited) |
As a shareholder of the Service Shares of the Fund, you incur ongoing costs, including management fees; distribution and service (12b-1) fees; and other Fund expenses. This Example is intended to help you understand your ongoing costs (in dollars) of investing in the Fund and to compare these costs with the ongoing costs of investing in other mutual funds.
The example is based on an investment of $1,000 invested at the beginning of the period and held for the entire period from July 1, 2012 through December 31, 2012.
Actual Expenses — The first line in the table below provides information about actual account values and actual expenses. You may use the information in this line, together with the amount you invested, to estimate the expenses that you paid over the period. Simply divide your account value by $1,000 (for example, an $8,600 account value divided by $1,000=8.6), then multiply the result by the number in the first line under the heading entitled “Expenses Paid” to estimate the expenses you paid on your account during this period.
Hypothetical Example for Comparison Purposes — The second line in the table below provides information about hypothetical account values and hypothetical expenses based on the Fund’s actual net expense ratio and an assumed rate of return of 5% per year before expenses, which is not the Fund’s actual return. The hypothetical account values and expenses may not be used to estimate the actual ending account balance or expenses you paid for the period. You may use this information to compare the ongoing costs of investing in the Fund and other funds. To do so, compare this 5% hypothetical example with the 5% hypothetical examples that appear in the shareholder reports of the other funds.
Please note that the expenses shown in the table are meant to highlight your ongoing costs only and do not reflect any transactional costs, such as sales charges, redemption fees, or exchange fees. Therefore, the second line of the table is useful in comparing ongoing costs only, and will not help you determine the relative total costs of owning different funds. In addition, if these transactional costs were included, your costs would have been higher.
| Beginning Account Value 07/01/12 | Ending Account Value 12/31/12 | Expenses Paid for the 6 Months Ended 12/31/12* | ||||||||||
| Actual | $ | 1,000.00 | $ | 1,000.03 | $ | 1.75 | ||||||
| Hypothetical 5% return | 1,000.00 | 1,023.38 | + | 1.77 | ||||||||
| * | Expenses are calculated using the Fund’s annualized net expense ratio, which represents the ongoing expenses as a percentage of net assets for the six months ended December 31, 2012. Expenses are calculated by multiplying the annualized net expense ratio by the average account value for the period; then multiplying the result by the number of days in the most recent fiscal half year; and then dividing that result by the number of days in the fiscal year. The annualized net expense ratio for the period was 0.35%. |
| + | Hypothetical expenses are based on the Fund’s actual annualized net expense ratio and an assumed rate of return of 5% per year before expenses. |
24
GOLDMAN SACHS VARIABLE INSURANCE TRUST MONEY MARKET FUND
Trustees and Officers (Unaudited)
Independent Trustees
Name, Address and Age1 | Position(s) Held with the Trust | Term of Office and Length of Time Served2 | Principal Occupation(s) During Past 5 Years | Number of Portfolios in Fund Complex Trustee3 | Other Directorships Held by Trustee4 | |||||||
Ashok N. Bakhru Age: 70 | Chairman of the Board of Trustees | Since 1996 (Trustee since 1991) | Mr. Bakhru is retired. He is President, ABN Associates (1994-1996 and 1998-Present); Director, Apollo Investment Corporation (a business development company) (2008-Present); Member of Cornell University Council (1992-2004 and 2006-Present); and was formerly Trustee, Scholarship America (1998-2005); Trustee, Institute for Higher Education Policy (2003-2008); Director, Private Equity Investors — III and IV (1998-2007), and Equity-Linked Investors II (April 2002-2007).
Chairman of the Board of Trustees — Goldman Sachs Mutual Fund Complex. | 111 | Apollo Investment Corporation (a business development company) | |||||||
Donald C. Burke Age: 52 | Trustee | Since 2010 | Mr. Burke is retired. He is Director, Avista Corp. (2011-Present); and was formerly a Director, BlackRock Luxembourg and Cayman Funds (2006-2010); President and Chief Executive Officer, BlackRock U.S. Funds (2007-2009); Managing Director, BlackRock, Inc. (2006-2009); Managing Director, Merrill Lynch Investment Managers, L.P. (“MLIM”) (2006); First Vice President, MLIM (1997-2005); Chief Financial Officer and Treasurer, MLIM U.S. Funds (1999-2006).
Trustee — Goldman Sachs Mutual Fund Complex. | 110 | Avista Corp. (an energy company) | |||||||
John P. Coblentz, Jr. Age: 71 | Trustee | Since 2003 | Mr. Coblentz is retired. Formerly, he was Partner, Deloitte & Touche LLP (1975-2003); Director, Emerging Markets Group, Ltd. (2004-2006); and Director, Elderhostel, Inc. (2006-2012).
Trustee — Goldman Sachs Mutual Fund Complex. | 111 | None | |||||||
Diana M. Daniels Age: 63 | Trustee | Since 2007 | Ms. Daniels is retired. Formerly, she was Vice President, General Counsel and Secretary, The Washington Post Company (1991-2006). Ms. Daniels is a Vice Chairman of the Board of Trustees of Cornell University (2009-Present); Member, Advisory Board, Psychology Without Borders (international humanitarian aid organization) (2007-Present), and former Member of the Legal Advisory Board, New York Stock Exchange (2003-2006) and of the Corporate Advisory Board, Standish Mellon Management Advisors (2006-2007).
Trustee — Goldman Sachs Mutual Fund Complex. | 110 | None | |||||||
Joseph P. LoRusso Age: 55 | Trustee | Since 2010 | Mr. LoRusso is retired. Formerly, he was President, Fidelity Investments Institutional Services Co. (“FIIS”) (2002-2008); Director, FIIS (2002-2008); Director, Fidelity Investments Institutional Operations Company (2003-2007); Executive Officer, Fidelity Distributors Corporation (2007-2008).
Trustee — Goldman Sachs Mutual Fund Complex. | 110 | None | |||||||
Jessica Palmer Age: 63 | Trustee | Since 2007 | Ms. Palmer is retired. She is Director, Emerson Center for the Arts and Culture (2011-Present); and was formerly a Consultant, Citigroup Human Resources Department (2007-2008); Managing Director, Citigroup Corporate and Investment Banking (previously, Salomon Smith Barney/Salomon Brothers) (1984-2006). Ms. Palmer was a Member of the Board of Trustees of Indian Mountain School (private elementary and secondary school) (2004-2009).
Trustee — Goldman Sachs Mutual Fund Complex. | 110 | None | |||||||
Richard P. Strubel Age: 73 | Trustee | Since 1987 | Mr. Strubel is retired. Formerly, he was Director, Cardean Learning Group (provider of educational services via the internet) (2003-2008); Trustee, Emeritus, The University of Chicago (1987-Present).
Trustee — Goldman Sachs Mutual Fund Complex. | 111 | The Northern Trust Mutual Fund Complex (64 Portfolios) (Chairman of the Board of Trustees). Gildan Activewear Inc. (a clothing marketing and manufacturing company). | |||||||
25
GOLDMAN SACHS VARIABLE INSURANCE TRUST MONEY MARKET FUND
Trustees and Officers (Unaudited) (continued)
Interested Trustees
Name, Address and Age1 | Position(s) Held with the Trust | Term of Length of | Principal Occupation(s) During Past 5 Years | Number of Portfolios in Fund Complex Overseen by Trustee3 | Other Directorships Held by Trustee4 | |||||||
James A. McNamara* Age: 50 | President and Trustee | Since 2007 | Managing Director, Goldman Sachs (December 1998-Present); Director of Institutional Fund Sales, GSAM (April 1998-December 2000); and Senior Vice President and Manager, Dreyfus Institutional Service Corporation (January 1993- April 1998).
President — Goldman Sachs Mutual Fund Complex (November 2007-Present); Senior Vice President — Goldman Sachs Mutual Fund Complex (May 2007-November 2007); and Vice President — Goldman Sachs Mutual Fund Complex (2001-2007).
Trustee — Goldman Sachs Mutual Fund Complex (since November 2007 and December 2002-May 2004). | 111 | None | |||||||
Alan A. Shuch* Age: 63 | Trustee | Since 1990 | Advisory Director — GSAM (May 1999-Present); Consultant to GSAM (December 1994-May 1999); and Limited Partner, Goldman Sachs (December 1994-May 1999).
Trustee — Goldman Sachs Mutual Fund Complex. | 110 | None | |||||||
| * | These persons are considered to be “Interested Trustees” because they hold positions with Goldman Sachs and own securities issued by The Goldman Sachs Group, Inc. Each Interested Trustee holds comparable positions with certain other companies of which Goldman Sachs, GSAM or an affiliate thereof is the investment adviser, administrator and/or distributor |
| 1 | Each Trustee may be contacted by writing to the Trustee, c/o Goldman Sachs, 200 West Street, New York, New York, 10282, Attn: Caroline L. Kraus. Information is provided as of December 31, 2012. |
| 2 | Each Trustee holds office for an indefinite term until the earliest of: (a) the election of his or her successor; (b) the date the Trustee resigns or is removed by the Board of Trustees or shareholders, in accordance with the Trust’s Declaration of Trust; (c) the conclusion of the first Board meeting held subsequent to the day the Trustee attains the age of 74 years (in accordance with the current resolutions of the Board of Trustees, which may be changed by the Trustees without shareholder vote); or (d) the termination of the Trust. |
| 3 | The Goldman Sachs Mutual Fund Complex consists of the Trust, Goldman Sachs Trust II, Goldman Sachs Municipal Opportunity Fund, Goldman Sachs Credit Strategies Fund, and Goldman Sachs Trust. As of December 31, 2012, the Trust consisted of 12 portfolios. Goldman Sachs Trust II consisted of 1 portfolio (which did not offer shares to the public); Goldman Sachs Municipal Opportunity Fund did not offer shares to the public; and Goldman Sachs Trust consisted of 96 portfolios (80 of which offered shares to the public). |
| 4 | This column includes only directorships of companies required to report to the SEC under the Securities Exchange Act of 1934 (i.e., “public companies”) or other investment companies registered under the Act. |
Additional information about the Trustees is available in the Fund’s Statement of Additional Information which can be obtained from Goldman Sachs free of charge by calling this toll-free number (in the United States of America): 1-800-292-4726.
26
GOLDMAN SACHS VARIABLE INSURANCE TRUST MONEY MARKET FUND
Trustees and Officers (Unaudited) (continued)
Officers of the Trust*
| Name, Address and Age | Position(s) Held With the Trust | Term of Office and Length of Time Served1 | Principal Occupation(s) During Past 5 Years | |||
| James A. McNamara 200 West Street New York, NY 10282 Age: 50 | President and Trustee | Since 2007 | Managing Director, Goldman Sachs (December 1998-Present); Director of Institutional Fund Sales, GSAM (April 1998-December 2000); and Senior Vice President and Manager, Dreyfus Institutional Service Corporation (January 1993-April 1998).
President — Goldman Sachs Mutual Fund Complex (November 2007-Present); Senior Vice President — Goldman Sachs Mutual Fund Complex (May 2007-November 2007); and Vice President — Goldman Sachs Mutual Fund Complex (2001-2007).
Trustee — Goldman Sachs Mutual Fund Complex (since November 2007 and December 2002-May 2004). | |||
| George F. Travers 30 Hudson Street | Senior Vice President and Principal Financial Officer | Since 2009 | Managing Director, Goldman Sachs (2007-present); Managing Director, UBS Ag (2005-2007); and Partner, Deloitte & Touche LLP (1990-2005, partner from 2000-2005).
Senior Vice President and Principal Financial Officer — Goldman Sachs Mutual Fund Complex. | |||
| Caroline L. Kraus 200 West Street New York, NY 10282 Age: 35 | Secretary | Since 2012 | Vice President, Goldman Sachs (August 2006-Present); Associate General Counsel, Goldman Sachs (2012-Present); Assistant General Counsel, Goldman Sachs (August 2006-December 2011); Associate; Weil, Gotshal & Manges-LLP (2002-2006).
Secretary — Goldman Sachs Mutual Fund Complex (August 2012-Present); Assistant Secretary — Goldman Sachs Mutual Fund Complex (June 2012-August 2012). | |||
| Scott M. McHugh 200 West Street New York, NY 10282 Age: 41 | Treasurer and Senior Vice President | Since 2009 | Vice President, Goldman Sachs (February 2007-Present); Assistant Treasurer of certain mutual funds administered by DWS Scudder (2005-2007); and Director (2005-2007), Vice President (2000-2005), Assistant Vice President (1998-2000), Deutsche Asset Management or its predecessor (1998-2007).
Treasurer — Goldman Sachs Mutual Fund Complex (October 2009-Present); Senior Vice President — Goldman Sachs Mutual Fund Complex (November 2009-Present); and Assistant Treasurer — Goldman Sachs Mutual Fund Complex (May 2007-October 2009). | |||
| 1 | Officers hold office at the pleasure of the Board of Trustees or until their successors are duly elected and qualified. Each officer holds comparable positions with certain other companies of which Goldman Sachs, GSAM or an affiliate thereof is the investment adviser, administrator and/or distributor. Information is provided as of December 31, 2012. |
| * | Represents a partial list of officers of the Trust. Additional information about all the officers is available in the Fund’s Statement of Additional Information which can be obtained from Goldman Sachs free of charge by calling this toll-free number (in the United States): 1-800-292-4726. |
27
GOLDMAN SACHS VARIABLE INSURANCE TRUST MONEY MARKET FUND
Goldman Sachs Variable Insurance Trust — Tax Information (Unaudited)
Pursuant to Section 852 of the Internal Revenue Code, the Money Market Fund designates $25, or, if different, the maximum amount allowable, as capital gain dividends paid during the fiscal year ended December 31, 2012.
28
| TRUSTEES | OFFICERS | |
| Ashok N. Bakhru, Chairman | James A. McNamara, President | |
| Donald C. Burke | George F. Travers, Principal Financial Officer | |
| John P. Coblentz, Jr. | Caroline L. Kraus, Secretary | |
| Diana M. Daniels | Scott M. McHugh, Treasurer | |
| Joseph P. LoRusso | ||
| James A. McNamara | ||
| Jessica Palmer | ||
| Alan A. Shuch | ||
| Richard P. Strubel |
GOLDMAN, SACHS & CO.
Distributor and Transfer Agent
GOLDMAN SACHS ASSET MANAGEMENT, L.P.
Investment Adviser
200 West Street, New York
New York 10282
Visit our Website at www.goldmansachsfunds.com/vit to obtain the most recent month-end returns.
The reports concerning the Fund included in this shareholder report may contain certain forward-looking statements about the factors that may affect the performance of the Fund in the future. These statements are based on Fund management’s predictions and expectations concerning certain future events and their expected impact on the Fund, such as performance of the economy as a whole and of specific industry sectors, changes in the levels of interest rates, the impact of developing world events, and other factors that may influence the future performance of the Fund. Management believes these forward-looking statements to be reasonable, although they are inherently uncertain and difficult to predict. Actual events may cause adjustments in portfolio management strategies from those currently expected to be employed.
A description of the policies and procedures that the Fund uses to determine how to vote proxies relating to portfolio securities and information regarding how the Fund voted proxies relating to portfolio securities during the most recent 12-month period ended June 30 is available (i) without charge, upon request by calling 1-800-621-2550; and (ii) on the Securities and Exchange Commission (“SEC”) Web site at http://www.sec.gov.
The Fund files its complete schedule of portfolio holdings with the SEC for the first and third quarters of each fiscal year on Form N-Q. The Fund’s Form N-Q is available on the SEC’s website at http://www.sec.gov within 60 days after the Fund’s first and third fiscal quarters. The Fund’s Forms N-Q may be reviewed and copied at the SEC’s Public Reference Room in Washington, D.C. and information on the operation of the Public Reference Room may also be obtained by calling 1-800-SEC-0330. Form N-Q may be obtained upon request and without charge by calling 1-800-621-2550.
Holdings and allocations shown are as of December 31, 2012 and may not be representative of current or future investments. Fund holdings should not be relied on in making investment decisions and should not be construed as research or investment advice regarding particular securities.
The portfolio risk management process includes an effort to monitor and manage risk, but does not imply low risk.
Shares of the Goldman Sachs VIT Funds are offered to separate accounts of participating life insurance companies for the purpose of funding variable annuity contracts and variable life insurance policies. Shares of the Fund are not offered directly to the general public. The variable annuity contracts and variable life insurance policies are described in the separate prospectuses issued by participating insurance companies. You should refer to those prospectuses for information about surrender charges, mortality and expense risk fees and other charges that may be assessed by participating insurance companies under the variable annuity contracts or variable life insurance policies. Such fees or charges, if any, may affect the return you may realize with respect to your investments. Ask your representative for more complete information. Please consider a fund’s objectives, risks and charges and expenses, and read the prospectus carefully before investing. The prospectus contains this and other information about the Fund.
This material is not authorized for distribution to prospective investors unless preceded or accompanied by a current Prospectus or summary prospectus, if applicable. Investors should consider a Fund’s objective, risks, and charges and expenses, and read the summary prospectus, if available, and/or the Prospectus carefully before investing or sending money. The summary prospectus, if available, and the Prospectus contain this and other information about a Fund and may be obtained from your authorized dealer or from Goldman, Sachs & Co. by calling 1-800-621-2550.
Toll Free (in U.S.): 800-292-4726
This report is prepared for the general information of contract owners and is not an offer of shares of the Goldman Sachs Variable Insurance Trust: Goldman Sachs Money Market Fund.
© 2013 Goldman Sachs. All rights reserved.
VITMMAR13/92371.MF.MED.TMPL/2/2013
Goldman
Sachs Variable Insurance Trust
Goldman Sachs
Strategic Growth Fund
Annual Report
December 31, 2012

GOLDMAN SACHS VARIABLE INSURANCE TRUST STRATEGIC GROWTH FUND
Principal Investment Strategies and Risks
This is not a complete list of risks that may affect the Fund. For additional information concerning the risks applicable to the Fund, please see the Fund’s prospectus.
Shares of the Goldman Sachs Variable Insurance Trust — Goldman Sachs Strategic Growth Fund are offered to separate accounts of participating life insurance companies for the purpose of funding variable annuity contracts and variable life insurance policies. Shares of the Fund are not offered directly to the general public. The variable annuity contracts and variable life insurance policies are described in the separate prospectuses issued by participating insurance companies. You should refer to those prospectuses for information about surrender charges, mortality and expense risk fees and other charges that may be assessed by participating insurance companies under the variable annuity contracts or variable life insurance policies. Such fees or charges, if any, may affect the return you realize with respect to your investments. Ask your representative for more complete information. Please consider the Fund’s objective, risks and charges and expenses, and read the Prospectus carefully before investing. The Prospectus contains this and other information about the Fund.
The Goldman Sachs Strategic Growth Fund invests primarily in U.S. equity investments. The Fund’s equity investments are subject to market risk, which means that the value of the securities in which it invests may go up or down in response to the prospects of individual companies, particular sectors and/or general economic conditions. Different investment styles (e.g., “growth”) tend to shift in and out of favor, and at times the Fund may underperform other funds that invest in similar asset classes.
1
GOLDMAN SACHS VARIABLE INSURANCE TRUST STRATEGIC GROWTH FUND
INVESTMENT OBJECTIVE
The Fund seeks long-term growth of capital.
Portfolio Management Discussion and Analysis
Below, the Goldman Sachs Growth Portfolio Management Team discusses the Goldman Sachs Variable Insurance Trust — Goldman Sachs Strategic Growth Fund’s (the “Fund”) performance and positioning for the 12-month period ended December 31, 2012 (the “Reporting Period”).
How did the Fund perform during the Reporting Period?
During the Reporting Period, the Fund’s Institutional and Service Shares generated average annual total returns of 19.83% and 19.57%, respectively. These returns compare to the 15.21% average annual total return of the Fund’s benchmark, the Russell 1000® Growth Index* (with dividends reinvested) (the “Russell Index”), during the same time period.
What economic and market factors most influenced the equity markets as a whole during the Reporting Period?
Representing the U.S. equity market, the S&P® 500 Index gained 15.96% during the Reporting Period to mark the fourth straight year of gains. The year 2012 started with the strongest first quarter since 1998 for the S&P® 500 Index. Also during the first quarter of 2012, the Dow Jones Industrial Average closed above 13,000 for the first time since May 2008, and the NASDAQ reached a new 11-year high. U.S. equities rose largely on evidence that the labor and manufacturing markets were improving. In addition, the Federal Reserve (the “Fed”) reaffirmed its commitment to low interest rates until at least late-2014.
U.S. equity markets slid, however, during the second quarter of 2012, when first quarter Gross Domestic Product (“GDP”) was revised down from 2.2% to 1.9% and employment reports suggested deterioration in the labor market. Spain’s banking system bailout and increasing concerns over Europe’s financial crisis weighed on global equity markets, including the U.S. equity market, as well. At the same time, disappointing economic reports from faster growing regions of the world renewed fears of a global economic slowdown.
During the summer of 2012, U.S. equity markets rallied back on more strong statements from central banks. In September, the Fed announced another round of quantitative easing, dubbed QE3, this time with no expiration date but with the explicit goal of reducing unemployment. The Fed also extended its policy of near-zero interest rates until at least mid-2015. In Europe, the European Central Bank (“ECB”) president Mario Draghi voiced strong support for the euro and the European Monetary Union, which was well received by financial markets in the U.S. Continued improvements in home prices and the Fed’s commitment to buy mortgage-backed securities increased hopes of a recovery in the housing market, which helped offset the downward pressures of lackluster economic growth and a stalled labor market.
There were increasing signs of economic recovery seen early in the fourth quarter of 2012. The U.S. reported better than expected third quarter GDP growth of 2%, the 13th consecutive quarter of economic expansion, and the unemployment rate dropped to 7.8%, the lowest rate seen since January 2009. U.S. manufacturing activity increased, and the housing market showed further signs of improvement, as construction of new homes hit a four-year high. Despite this positive data, the U.S. equity market pulled back in October on some cautious corporate earnings guidance. Also pressuring the U.S. equity market were the worst storm in decades battering the East Coast and polls showing the U.S. presidential race tightening to a dead heat.
The U.S. equity market crept higher in November 2012, as election day preserved the status quo in the White House and Congress, even as the “fiscal cliff” drew nearer. Housing starts and measures of employment improved, and manufacturing and non-manufacturing surveys showed expansion in the economy. In December 2012, further clarification from the Fed, tying its low interest rate policy to the condition that unemployment drop to 6.5% or lower, helped to offset increasing worries about the then-looming fiscal cliff of tax increases and spending cuts.
For the Reporting Period as a whole, all ten sectors within the S&P® 500 Index posted gains. The consistent and persistent commitment to accommodative monetary policy from the U.S. Fed and other central banks drove market-leading returns in the financials sector. The heavily weighted financials sector was also the largest positive contributor (weight times performance) to
| * | The Russell 1000 Growth Index is an unmanaged index that measures the performance of those Russell 1000 companies with higher price-to-book ratios and higher forecasted growth values. The Index figures do not reflect any deduction for fees, expenses or taxes. It is not possible to invest directly in an unmanaged index. |
2
GOLDMAN SACHS VARIABLE INSURANCE TRUST STRATEGIC GROWTH FUND
S&P® 500 Index returns. On optimism about the economy and improved consumer confidence, the consumer discretionary sector also performed well. Conversely, the energy sector posted positive returns but was comparatively weak during the Reporting Period, as oil prices remained relatively stable, balancing continued unrest in several oil-producing regions with potential supply increases from U.S. shale production and a modest outlook for global economic growth.
All segments of the U.S. equity market advanced during the Reporting Period, with mid-cap stocks, as measured by the Russell Midcap® Index, gaining most, followed by large-cap stocks and then small-cap stocks, as measured by the Russell 1000® Index and the Russell 2000® Index, respectively, which performed similarly to each other. From a style perspective, value-oriented stocks solidly outpaced growth-oriented stocks across the capitalization spectrum. (All as measured by the Russell Investments indices.)
What key factors were responsible for the Fund’s performance during the Reporting Period?
Stock selection overall contributed most to the Fund’s performance relative to the Russell Index during the Reporting Period.
Which equity market sectors most significantly affected Fund performance?
Contributing most positively to the Fund’s relative results during the Reporting Period was effective stock selection in the information technology, consumer discretionary and telecommunication services sectors. Only partially offsetting such contributors was stock selection in materials and industrials, which detracted from the Fund’s performance relative to the Russell Index during the Reporting Period.
What were some of the Fund’s best-performing individual stocks?
The Fund benefited relative to the Russell Index from positions in leading data center solutions company Equinix, wireless tower company Crown Castle and apparel and footwear company PVH.
Equinix’s shares performed well during the first half of the Reporting Period as its core business remained strong and its pricing was up in the three main areas in which the company operates — the U.S., Europe and Asia. Its shares continued to perform well following reports of solid second quarter results, fueled in large part by explosive demand for data center space from cloud computing companies. Throughout, the company evaluated the potential to convert to a real estate investment trust (“REIT”), which may provide tax and valuation benefits. In the meantime, it appears the market has begun to recognize that Equinix is trading at a discount to other data center operators that are publicly traded REITs and to appreciate the growth and stability of Equinix’s revenue stream. At the end of the Reporting Period, we maintained conviction in the company’s ability to drive revenue growth, as it benefits from several secular growth drivers, including cloud computing, growth in Internet traffic and enterprise outsourcing, and rising demand for optimized network performance.
A position in Crown Castle also contributed to the Fund’s relative performance. Its shares rose after the company announced strong first calendar quarter results, driven by better than expected revenues and a significant increase in new leases signed during the quarter compared to last year. The company also raised 2012 guidance due in large part to the acquisition of outdoor distributed antennae systems (“DAS”) company NextG Networks. Crown Castle’s shares continued to rise after the company closed its transaction to acquire exclusive rights to T-Mobile’s approximately 7,100 towers in its second largest acquisition in 2012 after that of NextG Networks. At the end of the Reporting Period, we maintained conviction in the tower companies broadly over the long term, as demand for mobile content shows no signs of slowing, and wireless carriers are increasingly adding capacity in order to support increased usage, network upgrades and improved coverage.
During the Reporting Period, PVH contributed to Fund returns as its shares rose to an all-time high in November 2012 following its announced acquisition of Warnaco Group. The acquisition brings full control of the Calvin Klein brand to PVH and expands PVH’s presence in Europe, Asia and Latin America. The deal is expected to close in early 2013. We view the acquisition positively and expect the deal to prove additive to earnings and enhance the company’s growth profile. We believe that should the higher margin brands like Tommy Hilfiger and Calvin Klein grow faster than PVH’s Heritage business, as anticipated, the company’s operating profit growth may well accelerate meaningfully.
Which stocks detracted significantly from the Fund’s performance during the Reporting Period?
Detracting most from the Fund’s results relative to its benchmark index were positions in social networking company Facebook, oil and gas exploration and production company Devon Energy and global medical device company St. Jude Medical.
Facebook initially detracted from the Fund’s relative performance during the Reporting Period, as its shares fell after the company’s rocky initial public offering (“IPO”). As the Reporting Period progressed, the company delivered in-line second quarter earnings on a strong increase in ad revenue, but payments revenue growth was challenged and a large amount of insider selling, due
3
GOLDMAN SACHS VARIABLE INSURANCE TRUST STRATEGIC GROWTH FUND
to the expiration of the IPO lock-up, caused material weakness in the stock. In our view, Facebook has achieved tremendous scale in the U.S. and has a large market opportunity as its networking effect creates stickiness in its user base. Creating stickiness means gaining the attention of a customer base, attracting them to one’s business and then keeping them engaged over the longer term. At the end of the Reporting Period, we continued to believe Facebook was well positioned to benefit from targeted advertising on its platform as a result of the data it has on its users as well as the potential to monetize new ad formats and the social networking ad medium over time.
Devon Energy was a top detractor from the Fund’s relative performance as a result of the company’s mis-execution during the Reporting Period, which poorly positioned the company relative to its peers. In our view, Devon Energy failed to execute on an unconventional Permian Basin strategy and has amassed a scattered portfolio that may well pose challenges generating economies of scale. Furthermore, we believe that Canadian crude oil and natural gas liquid price differentials, to which Devon Energy is particularly exposed, are likely to stay wider for longer than estimated by consensus due to North American transportation infrastructure issues. We believe Devon Energy will grow production below consensus views and its peers over the near term. Therefore, we exited the Fund’s position in favor of higher conviction opportunities in the energy sector.
Weighing on St. Jude Medical were reports of safety and quality issues, which many feel may lead to market share loss. In addition, St. Jude Medical was experiencing pricing pressure combined with weak volume growth. We decided to sell out of the Fund’s position in favor of what we considered to be more attractive opportunities elsewhere.
How did the Fund use derivatives and similar instruments during the Reporting Period?
During the Reporting Period, we did not use derivatives as part of an active management strategy.
Did the Fund make any significant purchases or sales during the Reporting Period?
Among the Fund positions initiated during the Reporting Period, we established a Fund position in global parcel company FedEx. FedEx provides transportation, e-commerce and business services in the U.S. and internationally. In our view, FedEx is well positioned to increase its domestic market share as the U.S. parcel carriers industry moves toward a duopoly. We also believe it has attractive international exposure to high growth markets in Asia and Latin America. We believe the company should benefit from secular growth in e-commerce and international trade expansion. Further, in our view, FedEx has a solid management team that can execute on these growth opportunities by increasing market share in an industry with high barriers to entry. We feel FedEx has greater margin expansion upside potential than its primary competitor, and its shares, in our view, were attractively valued at the time of purchase.
During the Reporting Period, we established a Fund position in aerospace and defense company Boeing. We believe the most important growth drivers for Boeing will come from increasing the production rate and deliveries of its 787 program and the successful development of its new 737 MAX. We believe cash flows should improve substantially as the new planes are delivered. We feel confident about the outlook for the 787, and believe the headlines are moving away from the production issues that delayed its initial launch. Boeing also maintains a multi-year head start on competitor Airbus’ next generation plane, an important lead in a duopolistic industry.
We sold the Fund’s position in home improvement retailer Lowe’s during the Reporting Period. Lowe’s recently announced its plan to acquire Canadian home improvement retailer Rona in the midst of a turnaround strategy of its stores and various other aspects of its business. We believe this move challenges the credibility of the management team and makes it increasingly difficult to believe in the turnaround in its U.S. business. While we continue to believe Lowe’s should benefit as the fundamentals of the home improvement industry improve and the housing market recovers, we believe the risk of integrating a sizable acquisition in the midst of these strategic initiatives raises the risk profile for Lowe’s and so we decided to sell out of the position.
We exited the Fund’s position in electronic and electrical equipment manufacturer Emerson Electric. While we remain attracted to Emerson Electric’s high quality franchise, we believe there is less upside in the stock relative to other opportunities within the industrials sector. Emerson Electric has produced an extremely attractive growth trajectory over the past ten years through market share gains from weaker competitors. In our view, however, the company is facing tougher competition going forward and slower growth from some of its key end markets and emerging market geographies. As a result, we believe the company’s risk/reward profile has become less attractive, and so we decided to eliminate the position.
Were there any notable changes in the Fund’s weightings during the Reporting Period?
In constructing the Fund’s portfolio, we focus on picking stocks rather than on making industry or sector bets. We seek to outpace the benchmark index by overweighting stocks that we expect to outperform and underweighting those that we think may lag.
4
GOLDMAN SACHS VARIABLE INSURANCE TRUST STRATEGIC GROWTH FUND
Consequently, changes in its sector weights are generally the direct result of individual stock selection or of stock appreciation or depreciation. That said, there were no meaningful changes in the Fund’s sector weightings compared to the Russell Index during the Reporting Period.
How was the Fund positioned relative to its benchmark index at the end of the Reporting Period?
At the end of December 2012, the Fund had overweighted positions relative to the Russell Index in the financials, consumer discretionary and telecommunication services sectors. On the same date, the Fund had underweighted positions compared to the Russell Index in industrials, consumer staples and materials and was rather neutrally weighted to the Russell Index in energy, information technology and health care. The Fund had no exposure to the utilities sector at the end of the Reporting Period.
What is the Fund’s tactical view and strategy for the months ahead?
After a strong 2012, we continue to see opportunities as we enter 2013 and remain constructive in our view ahead for U.S. equities. We recognize that fiscal policy may lead to a drag on economic growth and the recent steps taken by the Fed to provide additional monetary accommodation may not fully offset the impact. The political climate in the U.S., and the lack of clarity around the outcome of fiscal negotiations, has contributed to an elevated feeling of uncertainty for both businesses and individuals. However, corporate balance sheets remain strong, which we believe provides companies with the ability to generate shareholder value, even in a slower economic growth environment. The S&P 500 Index, as a broad measure of the U.S. equity market, was trading below its historical average price-to-earnings ratio at the end of the Reporting Period, while its dividend yield was greater than the yield on the 10-year U.S. Treasury. Continued strength in the U.S. housing recovery should provide, in our view, support to the economy and boost confidence among consumers.
Through these conditions, our investment decisions remain driven by our long-standing process and philosophy. We dive deep into the fundamentals of our holdings, meet with companies’ managements and have continuous discussions and debates amongst ourselves to ensure that the portfolio is reflective of our highest conviction ideas. We construct the portfolio around businesses that we believe should create long-term value for shareholders and are leveraged to secular growth trends rather than to political outcomes or macroeconomic expectations.
In our view, companies with strong business franchises become more attractive in uncertain environments. Holding competitive advantages, a strong management team and the ability to allocate capital allows the business to adapt and continuously execute on its long-term plans regardless of current sentiment. Companies are not static entities. We believe strong management teams know they must adapt to regulatory changes, expand into new markets and improve their product offerings in order to remain competitive and grow. These are the types of investments we believe should reward our shareholders over long term. As always, deep research resources, a forward-looking investment process and truly actively managed portfolios are keys, in our view, to both preserving capital and potentially outperforming the market over the long term.
5
FUND BASICS
Strategic Growth Fund
as of December 31, 2012
STANDARDIZED TOTAL RETURNS1
| For the period ended 12/31/12 | One Year | Five Years | Ten Years | Since Inception | Inception Date | |||||||||||||
| Institutional | 19.83 | % | 2.15 | % | 6.33 | % | 3.20 | % | 4/30/98 | |||||||||
| Service | 19.57 | 1.91 | N/A | 3.48 | 1/09/06 | |||||||||||||
| 1 | The Standardized Total Returns are average annual total returns as of the most recent calendar quarter-end. They assume reinvestment of all distributions at net asset value (“NAV”). Because Institutional Shares and Service Shares do not involve a sales charge, such a charge is not applied to their Standardized Total Returns. |
Total return figures in the above chart represent past performance and do not indicate future results, which will vary. The investment return and principal value of an investment will fluctuate and, therefore, an investor’s shares, when redeemed, may be worth more or less than their original cost. Current performance may be lower or higher than the total return figures in the above chart. Please visit www.goldmansachsfunds.com/vit to obtain the most recent month-end returns. Performance reflects fee waivers and/or expense limitations in effect. In their absence, performance would be reduced.
EXPENSE RATIOS2
| Net Expense Ratio (Current) | Gross Expense Ratio (Before Waivers) | |||||||
| Institutional | 0.81 | % | 0.85 | % | ||||
| Service | 1.06 | 1.10 | ||||||
| 2 | The expense ratios of the Fund, both current (net of applicable fee waivers and/or expense limitations) and before waivers (gross of applicable fee waivers and/or expense limitations) are as set forth above according to the most recent publicly available Prospectus for the Fund and may differ from the expense ratios disclosed in the Financial Highlights in this report. The Fund’s waivers and/or expense limitations will remain in place through at least April 27, 2013, and prior to such date the investment adviser may not terminate the arrangements without the approval of the Fund’s Board of Trustees. If these arrangements are discontinued in the future, the expense ratios may change without shareholder approval. |
TOP TEN HOLDINGS AS OF 12/31/123
| Holding | % of Net Assets | Line of Business | ||||
| Apple, Inc. | 8.4% | Technology Hardware & Equipment | ||||
| Google, Inc. Class A | 4.7 | Software & Services | ||||
| QUALCOMM, Inc. | 4.4 | Technology Hardware & Equipment | ||||
| American Tower Corp. (REIT) | 3.8 | Real Estate | ||||
| Crown Castle International Corp. | 3.3 | Telecommunication Services | ||||
| Schlumberger Ltd. | 3.3 | Energy | ||||
| Costco Wholesale Corp. | 2.8 | Food & Staples Retailing | ||||
| NIKE, Inc. Class B | 2.6 | Consumer Durables & Apparel | ||||
| Abbott Laboratories | 2.6 | Health Care Equipment & Services | ||||
| Amazon.com, Inc. | 2.5 | Retailing | ||||
| 3 | The top 10 holdings may not be representative of the Fund’s future investments. |
6
FUND BASICS
FUND vs. BENCHMARK SECTOR ALLOCATIONS4
As of December 31, 2012
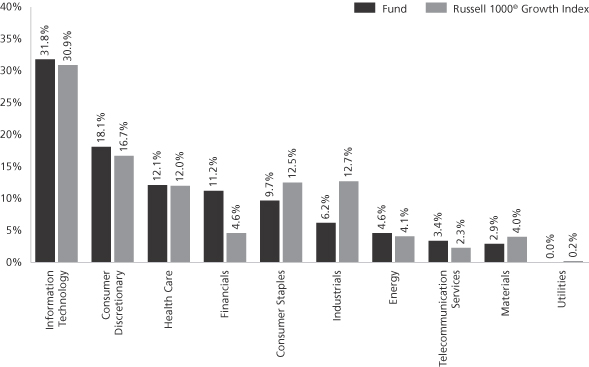
| 4 | The Fund is actively managed and, as such, its composition may differ over time. Consequently, the Fund’s overall sector allocations may differ from percentages contained in the graph above. The graph categorizes investments using Global Industry Classification Standard (“GICS”), however, the sector classifications used by the portfolio management team may differ from GICS. The percentage shown for each investment category reflects the value of investments in that category as a percentage of market value. The graph depicts the Fund’s investments but may not represent the Fund’s market exposure due to the exclusion of certain derivatives, if any, as listed in the Additional Investment Information section of the Schedule of Investments. |
7
GOLDMAN SACHS VARIABLE INSURANCE TRUST STRATEGIC GROWTH FUND
Performance Summary
December 31, 2012
The following graph shows the value, as of December 31, 2012, of a $10,000 investment made on January 1, 2003 in the Institutional Shares at NAV. For comparative purposes, the performance of the Fund’s benchmark, the Russell 1000® Growth Index (with dividends reinvested), is shown. This performance data represents past performance and should not be considered indicative of future performance, which will fluctuate with changes in market conditions. These performance fluctuations will cause an investor’s shares, when redeemed, to be worth more or less than their original cost. Performance reflects Fund level expenses but does not reflect fees and expenses associated with any variable annuity contract or variable life insurance policy that uses the Fund as an investment option for any contract or policy. Had performance reflected all of those fees and expenses, performance would have been reduced. Performance also would have been reduced had expense limitations not been in effect. Performance of Service Shares will vary from Institutional Shares due to differences in class specific fees. In addition to the investment adviser’s decisions regarding issuer/industry investment selection and allocation, other factors may affect Fund performance. These factors include, but are not limited to, Fund operating fees and expenses, portfolio turnover, and subscription and redemption cash flows affecting the Fund.
Strategic Growth Fund’s 10 Year Performance
Performance of a $10,000 investment, with distributions reinvested, from January 1, 2003 through December 31, 2012.
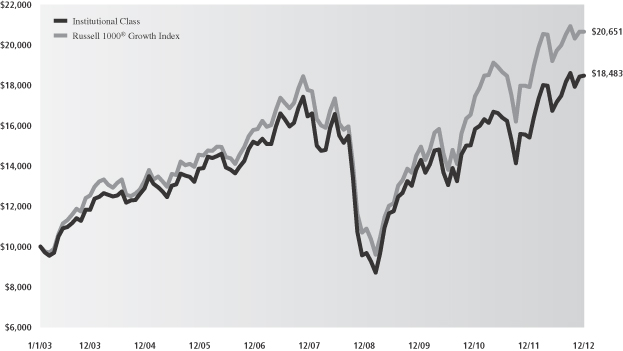
| Average Annual Total Return through December 31, 2012 | One Year | Five Years | Ten Years | Since Inception | ||||
Institutional (Commenced April 30, 1998) | 19.83% | 2.15% | 6.33% | 3.20% | ||||
Service (Commenced January 9, 2006) | 19.57% | 1.91% | N/A | 3.48% |
8
GOLDMAN SACHS VARIABLE INSURANCE TRUST STRATEGIC GROWTH FUND
Schedule of Investments
December 31, 2012
| Shares | Description | Value | ||||||
| Common Stocks – 98.8% | ||||||||
| Capital Goods – 5.1% |
| ||||||
| 112,632 | Danaher Corp. | $ | 6,296,129 | |||||
| 123,573 | Honeywell International, Inc. | 7,843,178 | ||||||
| 35,022 | Rockwell Automation, Inc. | 2,941,498 | ||||||
| 53,301 | The Boeing Co. | 4,016,763 | ||||||
|
| |||||||
| 21,097,568 | ||||||||
|
| |||||||
| Consumer Durables & Apparel – 4.9% |
| ||||||
| 33,953 | Lululemon Athletica, Inc.* | 2,588,237 | ||||||
| 207,068 | NIKE, Inc. Class B | 10,684,709 | ||||||
| 61,495 | PVH Corp. | 6,826,560 | ||||||
|
| |||||||
| 20,099,506 | ||||||||
|
| |||||||
| Consumer Services – 4.8% |
| ||||||
| 23,166 | Chipotle Mexican Grill, Inc.* | 6,890,958 | ||||||
| 62,182 | Las Vegas Sands Corp. | 2,870,321 | ||||||
| 121,215 | Marriott International, Inc. Class A | 4,517,683 | ||||||
| 25,083 | McDonald’s Corp. | 2,212,572 | ||||||
| 48,407 | Yum! Brands, Inc. | 3,214,225 | ||||||
|
| |||||||
| 19,705,759 | ||||||||
|
| |||||||
| Diversified Financials – 5.5% |
| ||||||
| 129,501 | American Express Co. | 7,443,717 | ||||||
| 93,849 | CME Group, Inc. | 4,759,083 | ||||||
| 22,801 | IntercontinentalExchange, Inc.* | 2,822,992 | ||||||
| 93,641 | Northern Trust Corp. | 4,697,033 | ||||||
| 43,511 | T. Rowe Price Group, Inc. | 2,833,871 | ||||||
|
| |||||||
| 22,556,696 | ||||||||
|
| |||||||
| Energy – 4.6% |
| ||||||
| 94,676 | Halliburton Co. | 3,284,311 | ||||||
| 27,263 | National Oilwell Varco, Inc. | 1,863,426 | ||||||
| 196,980 | Schlumberger Ltd. | 13,648,744 | ||||||
|
| |||||||
| 18,796,481 | ||||||||
|
| |||||||
| Food & Staples Retailing – 2.8% |
| ||||||
| 114,536 | Costco Wholesale Corp. | 11,312,721 | ||||||
|
| |||||||
| Food, Beverage & Tobacco – 4.3% |
| ||||||
| 50,300 | Diageo PLC ADR | 5,863,974 | ||||||
| 101,856 | PepsiCo, Inc. | 6,970,006 | ||||||
| 56,228 | Philip Morris International, Inc. | 4,702,910 | ||||||
|
| |||||||
| 17,536,890 | ||||||||
|
| |||||||
| Health Care Equipment & Services – 3.9% |
| ||||||
| 162,382 | Abbott Laboratories | 10,636,021 | ||||||
| 19,956 | C. R. Bard, Inc. | 1,950,500 | ||||||
| 7,414 | Intuitive Surgical, Inc.* | 3,635,603 | ||||||
|
| |||||||
| 16,222,124 | ||||||||
|
| |||||||
| Household & Personal Products – 2.5% |
| ||||||
| 173,257 | Avon Products, Inc. | 2,487,971 | ||||||
| 33,759 | The Estee Lauder Companies, Inc. Class A | 2,020,814 | ||||||
| 85,350 | The Procter & Gamble Co. | 5,794,411 | ||||||
|
| |||||||
| 10,303,196 | ||||||||
|
| |||||||
| Common Stocks – (continued) | ||||||||
| Materials – 2.9% |
| ||||||
| 40,627 | Ecolab, Inc. | $ | 2,921,081 | |||||
| 81,911 | Praxair, Inc. | 8,965,159 | ||||||
|
| |||||||
| 11,886,240 | ||||||||
|
| |||||||
| Media – 2.1% |
| ||||||
| 42,368 | Discovery Communications, Inc. Class A* | 2,689,521 | ||||||
| 115,426 | Viacom, Inc. Class B | 6,087,567 | ||||||
|
| |||||||
| 8,777,088 | ||||||||
|
| |||||||
| Pharmaceuticals, Biotechnology & Life Sciences – 8.0% |
| ||||||
| 89,207 | Agilent Technologies, Inc. | 3,652,135 | ||||||
| 30,883 | Allergan, Inc. | 2,832,898 | ||||||
| 44,151 | Celgene Corp.* | 3,475,567 | ||||||
| 98,387 | Gilead Sciences, Inc.* | 7,226,525 | ||||||
| 28,770 | Johnson & Johnson | 2,016,777 | ||||||
| 94,462 | Sanofi ADR | 4,475,609 | ||||||
| 45,512 | Shire PLC ADR | 4,195,296 | ||||||
| 43,168 | Teva Pharmaceutical Industries Ltd. ADR | 1,611,893 | ||||||
| 75,059 | Vertex Pharmaceuticals, Inc.* | 3,147,974 | ||||||
|
| |||||||
| 32,634,674 | ||||||||
|
| |||||||
| Real Estate – 5.6% |
| ||||||
| 202,167 | American Tower Corp. (REIT) | 15,621,444 | ||||||
| 363,071 | CBRE Group, Inc. Class A* | 7,225,113 | ||||||
|
| |||||||
| 22,846,557 | ||||||||
|
| |||||||
| Retailing – 6.1% |
| ||||||
| 40,831 | Amazon.com, Inc.* | 10,254,297 | ||||||
| 108,743 | Dollar General Corp.* | 4,794,479 | ||||||
| 29,102 | Family Dollar Stores, Inc. | 1,845,358 | ||||||
| 6,875 | Priceline.com, Inc.* | 4,270,750 | ||||||
| 96,483 | Urban Outfitters, Inc.* | 3,797,571 | ||||||
|
| |||||||
| 24,962,455 | ||||||||
|
| |||||||
| Semiconductors & Semiconductor Equipment – 2.2% |
| ||||||
| 252,803 | Xilinx, Inc. | 9,075,628 | ||||||
|
| |||||||
| Software & Services – 13.7% |
| ||||||
| 465,703 | Activision Blizzard, Inc. | 4,945,766 | ||||||
| 36,026 | Equinix, Inc.* | 7,428,561 | ||||||
| 78,557 | Facebook, Inc. Class A* | 2,091,973 | ||||||
| 26,925 | Google, Inc. Class A* | 19,099,787 | ||||||
| 15,667 | Mastercard, Inc. Class A | 7,696,884 | ||||||
| 258,126 | Oracle Corp. | 8,600,758 | ||||||
| 38,223 | Salesforce.com, Inc.* | 6,425,286 | ||||||
|
| |||||||
| 56,289,015 | ||||||||
|
| |||||||
| Technology Hardware & Equipment – 15.5% |
| ||||||
| 76,222 | Amphenol Corp. Class A | 4,931,563 | ||||||
| 64,706 | Apple, Inc. | 34,490,239 | ||||||
| 175,968 | NetApp, Inc.* | 5,903,726 | ||||||
| 293,879 | QUALCOMM, Inc. | 18,226,376 | ||||||
|
| |||||||
| 63,551,904 | ||||||||
|
| |||||||
| The accompanying notes are an integral part of these financial statements. | 9 |
GOLDMAN SACHS VARIABLE INSURANCE TRUST STRATEGIC GROWTH FUND
Schedule of Investments (continued)
December 31, 2012
| Shares | Description | Value | ||||||
| Common Stocks – (continued) | ||||||||
| Telecommunication Services – 3.3% |
| ||||||
| 190,306 | Crown Castle International Corp.* | $ | 13,732,481 | |||||
|
| |||||||
| Transportation – 1.0% |
| ||||||
| 44,109 | FedEx Corp. | 4,045,677 | ||||||
|
| |||||||
| TOTAL INVESTMENTS – 98.8% | ||||||||
| (Cost $312,303,982) | $ | 405,432,660 | ||||||
|
| |||||||
| OTHER ASSETS IN EXCESS OF | 4,751,263 | ||||||
|
| |||||||
| NET ASSETS – 100.0% | $ | 410,183,923 | ||||||
|
| |||||||
| The percentage shown for each investment category reflects the value of investments in that category as a percentage of net assets. | ||
| * | Non-income producing security. | |
| Investment Abbreviations: | ||
| ADR | —American Depositary Receipt | |
| REIT | —Real Estate Investment Trust | |
| 10 | The accompanying notes are an integral part of these financial statements. |
GOLDMAN SACHS VARIABLE INSURANCE TRUST STRATEGIC GROWTH FUND
Statement of Assets and Liabilities
December 31, 2012
| Assets: | ||||
Investments, at value (cost $312,303,982) | $ | 405,432,660 | ||
Cash | 1,790,997 | |||
Receivables: | ||||
Investments sold | 3,002,459 | |||
Fund shares sold | 420,822 | |||
Dividends | 167,578 | |||
| Total assets | 410,814,516 | |||
| Liabilities: | ||||
Payables: | ||||
Amounts owed to affiliates | 315,159 | |||
Fund shares redeemed | 243,120 | |||
Accrued expenses | 72,314 | |||
| Total liabilities | 630,593 | |||
| Net Assets: | ||||
Paid-in capital | 372,620,659 | |||
Undistributed net investment income | 553,553 | |||
Accumulated net realized loss | (56,118,967 | ) | ||
Net unrealized gain | 93,128,678 | |||
| NET ASSETS | $ | 410,183,923 | ||
Net Assets: | ||||
Institutional | $ | 106,119,159 | ||
Service | 304,064,764 | |||
Total Net Assets | $ | 410,183,923 | ||
Shares of beneficial interest outstanding $0.001 par value (unlimited shares authorized): | ||||
Institutional | 7,653,968 | |||
Service | 21,961,155 | |||
Net asset value, offering and redemption price per share: | ||||
Institutional | $13.86 | |||
Service | 13.85 | |||
| The accompanying notes are an integral part of these financial statements. | 11 |
GOLDMAN SACHS VARIABLE INSURANCE TRUST STRATEGIC GROWTH FUND
Statement of Operations
For the Fiscal Year Ended December 31, 2012
| Investment income: | ||||
Dividends | $ | 6,270,510 | ||
| Expenses: | ||||
Management fees | 2,933,593 | |||
Distribution and Service fees — Service Class | 707,497 | |||
Printing and mailing costs | 117,147 | |||
Professional fees | 79,086 | |||
Transfer Agent fees(a) | 78,222 | |||
Custody and accounting fees | 53,316 | |||
Trustee fees | 15,740 | |||
Other | 10,669 | |||
| Total expenses | 3,995,270 | |||
Less — expense reductions | (159,963 | ) | ||
| Net expenses | 3,835,307 | |||
| NET INVESTMENT INCOME | 2,435,203 | |||
| Realized and unrealized gain: | ||||
Net realized gain from investments (including commissions recaptured of $27,848) | 14,203,671 | |||
Net change in unrealized gain on investments | 51,657,365 | |||
| Net realized and unrealized gain | 65,861,036 | |||
| NET INCREASE IN NET ASSETS RESULTING FROM OPERATIONS | $ | 68,296,239 | ||
(a) Institutional and Service Shares had Transfer Agent fees of $21,627 and $56,595, respectively.
| 12 | The accompanying notes are an integral part of these financial statements. |
GOLDMAN SACHS VARIABLE INSURANCE TRUST STRATEGIC GROWTH FUND
Statements of Changes in Net Assets
| For the Fiscal Year Ended December 31, 2012 | For the Fiscal Year Ended December 31, 2011 | |||||||
| From operations: | ||||||||
Net investment income | $ | 2,435,203 | $ | 1,084,311 | ||||
Net realized gain | 14,203,671 | 1,716,156 | ||||||
Net change in unrealized gain (loss) | 51,657,365 | (12,855,759 | ) | |||||
| Net increase (decrease) in net assets resulting from operations | 68,296,239 | (10,055,292 | ) | |||||
| Distributions to shareholders: | ||||||||
From net investment income | ||||||||
Institutional Shares | (723,126 | ) | (485,834 | ) | ||||
Service Shares | (1,362,167 | ) | (559,643 | ) | ||||
| Total distributions to shareholders | (2,085,293 | ) | (1,045,477 | ) | ||||
| From share transactions: | ||||||||
Proceeds from sales of shares | 45,783,221 | 51,059,219 | ||||||
Reinvestment of distributions | 2,085,293 | 1,045,477 | ||||||
Cost of shares redeemed | (52,122,094 | ) | (51,157,583 | ) | ||||
| Net increase (decrease) in net assets resulting from share transactions | (4,253,580 | ) | 947,113 | |||||
| TOTAL INCREASE (DECREASE) | 61,957,366 | (10,153,656 | ) | |||||
| Net assets: | ||||||||
Beginning of year | 348,226,557 | 358,380,213 | ||||||
End of year | $ | 410,183,923 | $ | 348,226,557 | ||||
| Undistributed net investment income | $ | 553,553 | $ | 203,643 | ||||
| The accompanying notes are an integral part of these financial statements. | 13 |
GOLDMAN SACHS VARIABLE INSURANCE TRUST STRATEGIC GROWTH FUND
Financial Highlights
Selected Data for a Share Outstanding Throughout Each Year
| Income (loss) from investment operations | ||||||||||||||||||||||||||||||||||||||||||||||||
| Year - Share Class | Net asset value, beginning of year | Net investment income (loss)(a) | Net realized and unrealized gain (loss) | Total from investment operations | Distributions from net investment income | Net asset value, end of year | Total return(b) | Net assets, end of year (in 000s) | Ratio of net expenses to average net assets | Ratio of total expenses to average net assets | Ratio of net assets | Portfolio turnover rate(c) | ||||||||||||||||||||||||||||||||||||
FOR THE FISCAL YEARS ENDED DECEMBER 31, | ||||||||||||||||||||||||||||||||||||||||||||||||
2012 - Institutional | $ | 11.64 | $ | 0.10 | (d) | $ | 2.21 | $ | 2.31 | $ | (0.09 | ) | $ | 13.86 | 19.83 | % | $ | 106,119 | 0.80 | % | 0.84 | % | 0.79 | %(d) | 42 | % | ||||||||||||||||||||||
2012 - Service | 11.63 | 0.07 | (d) | 2.21 | 2.28 | (0.06 | ) | 13.85 | 19.57 | 304,065 | 1.05 | 1.09 | 0.56 | (d) | 42 | |||||||||||||||||||||||||||||||||
2011 - Institutional | 12.01 | 0.06 | (0.37 | ) | (0.31 | ) | (0.06 | ) | 11.64 | (2.62 | ) | 102,018 | 0.83 | 0.85 | 0.47 | 35 | ||||||||||||||||||||||||||||||||
2011 - Service | 12.00 | 0.03 | (0.37 | ) | (0.34 | ) | (0.03 | ) | 11.63 | (2.86 | ) | 246,208 | 1.08 | 1.10 | 0.23 | 35 | ||||||||||||||||||||||||||||||||
2010 - Institutional | 10.89 | 0.05 | 1.12 | 1.17 | (0.05 | ) | 12.01 | 10.74 | 120,027 | 0.86 | 0.86 | 0.49 | 38 | |||||||||||||||||||||||||||||||||||
2010 - Service | 10.88 | 0.03 | 1.11 | 1.14 | (0.02 | ) | 12.00 | 10.50 | 238,353 | 1.11 | 1.11 | 0.24 | 38 | |||||||||||||||||||||||||||||||||||
2009 - Institutional | 7.40 | 0.03 | 3.50 | 3.53 | (0.04 | )(e) | 10.89 | 47.75 | 125,258 | 0.85 | 0.85 | 0.35 | 64 | |||||||||||||||||||||||||||||||||||
2009 - Service | 7.39 | 0.01 | 3.50 | 3.51 | (0.02 | )(e) | 10.88 | 47.50 | 219,909 | 1.10 | 1.10 | 0.10 | 64 | |||||||||||||||||||||||||||||||||||
2008 - Institutional | 12.73 | 0.02 | (5.34 | ) | (5.32 | ) | (0.01 | ) | 7.40 | (41.67 | ) | 95,218 | 0.81 | 0.81 | 0.20 | 44 | ||||||||||||||||||||||||||||||||
2008 - Service | 12.73 | (0.01 | ) | (5.33 | ) | (5.34 | ) | — | 7.39 | (41.86 | ) | 167,930 | 1.06 | 1.06 | (0.05 | ) | 44 | |||||||||||||||||||||||||||||||
| (a) | Calculated based on the average shares outstanding methodology. |
| (b) | Assumes investment at the net asset value at the beginning of the year, reinvestment of all distributions, and a complete redemption of the investment at the net asset value at the end of the year. |
| (c) | The Fund’s portfolio turnover rate is calculated in accordance with regulatory requirements, without regard to transactions involving short term investments and certain derivatives. If such transactions were included, the Fund’s portfolio turnover rate may be higher. |
| (d) | Reflects income recognized from non-recurring special dividends which amounted to $0.04 per share and 0.27% of average net assets. |
| (e) | Includes a return of capital amounting to less than $0.005 per share. |
| The accompanying notes are an integral part of these financial statements. | 14 |
GOLDMAN SACHS VARIABLE INSURANCE TRUST STRATEGIC GROWTH FUND
Notes to Financial Statements
December 31, 2012
1. ORGANIZATION
Goldman Sachs Variable Insurance Trust (the “Trust” or “VIT”) is a Delaware statutory trust registered under the Investment Company Act of 1940, as amended (the “Act”), as an open-end management investment company. The Trust includes the Goldman Sachs Strategic Growth Fund (the “Fund”). The Fund is a diversified portfolio under the Act offering two classes of shares — Institutional Shares and Service Shares. Shares of the Trust are offered to separate accounts of participating life insurance companies for the purpose of funding variable annuity contracts and variable life insurance policies.
Goldman Sachs Asset Management, L.P. (“GSAM”), an affiliate of Goldman, Sachs & Co. (“Goldman Sachs”), serves as investment adviser to the Fund pursuant to a management agreement (the “Agreement”) with the Trust.
2. SIGNIFICANT ACCOUNTING POLICIES
The financial statements have been prepared in accordance with accounting principles generally accepted in the United States of America (“GAAP”) and require management to make estimates and assumptions that may affect the reported amounts and disclosures. Actual results may differ from those estimates and assumptions.
A. Investment Valuation — The Fund’s valuation policy is to value investments at fair value.
B. Investment Income and Investments — Investment income includes interest income and dividend income, net of any foreign withholding taxes, less any amounts reclaimable. Interest income is accrued daily and adjusted for amortization of premiums and accretion of discounts. Dividend income is recognized on ex-dividend date or, for certain foreign securities, as soon as such information is obtained subsequent to the ex-dividend date. Investment transactions are reflected on trade date. Realized gains and losses are calculated using identified cost. Investment transactions are recorded on the following business day for daily net asset value (“NAV”) calculations. Any foreign capital gains tax is accrued daily based upon net unrealized gains, and is payable upon sale of such investments.
C. Class Allocations and Expenses — Investment income, realized and unrealized gain (loss), and non-class specific expenses of the Fund are allocated daily based upon the proportion of net assets of each class. Class specific expenses, where applicable, are borne by the respective share classes and include Distribution and Service and Transfer Agent fees. Non-class specific expenses directly incurred by a Fund are charged to that Fund, while such expenses incurred by the Trust are allocated across the respective Funds on a straight-line and/or pro-rata basis depending upon the nature of the expenses.
D. Federal Taxes and Distributions to Shareholders — It is the Fund’s policy to comply with the requirements of the Internal Revenue Code of 1986, as amended (the “Code”), applicable to regulated investment companies (mutual funds) and to distribute each year substantially all of its investment company taxable income and capital gains to its shareholders. Accordingly, the Fund is not required to make any provisions for the payment of federal income tax. Distributions to shareholders are recorded on the ex-dividend date. Income and capital gains distributions, if any, are declared and paid annually.
15
GOLDMAN SACHS VARIABLE INSURANCE TRUST STRATEGIC GROWTH FUND
Notes to Financial Statements (continued)
December 31, 2012
2. SIGNIFICANT ACCOUNTING POLICIES (continued)
Net capital losses are carried forward to future fiscal years and may be used to the extent allowed by the Code to offset any future capital gains. Utilization of capital loss carryforwards will reduce the requirement of future capital gains distributions.
Under the Regulated Investment Company Modernization Act of 2010, the Fund is permitted to carry forward capital losses incurred in taxable years beginning after December 22, 2010 for an unlimited period. However, any losses incurred during those future taxable years will be required to be utilized prior to the losses incurred in pre-enactment taxable years. As a result of this ordering rule, pre-enactment capital loss carryforwards may be more likely to expire unused. Additionally, post-enactment capital losses that are carried forward will retain their character as either short-term or long term capital losses rather than being considered all short-term as under previous law.
The characterization of distributions to shareholders for financial reporting purposes is determined in accordance with federal income tax rules, which may differ from GAAP. The source of the Fund’s distributions may be shown in the accompanying financial statements as either from net investment income, net realized gain or capital. Certain components of the Fund’s net assets on the Statement of Assets and Liabilities reflect permanent GAAP/tax differences based on the appropriate tax character.
E. Commission Recapture — GSAM, on behalf of the Fund, may direct portfolio trades, subject to seeking best execution, to various brokers who have agreed to rebate a portion of the commissions generated. Such rebates are made directly to the Fund as cash payments and are included in net realized gain (loss) from investments on the Statement of Operations.
3. INVESTMENTS AND FAIR VALUE MEASUREMENTS
The fair value of a financial instrument is the amount that would be received to sell an asset or paid to transfer a liability in an orderly transaction between market participants at the measurement date (i.e., the exit price). GAAP establishes a fair value hierarchy that prioritizes the inputs to valuation techniques used to measure fair value. The hierarchy gives the highest priority to unadjusted quoted prices in active markets for identical assets or liabilities (Level 1 measurements) and the lowest priority to unobservable inputs (Level 3 measurements). The levels used for classifying investments are not necessarily an indication of the risk associated with investing in these investments. The three levels of the fair value hierarchy are described below:
Level 1 — Unadjusted quoted prices in active markets that are accessible at the measurement date for identical, unrestricted assets or liabilities;
Level 2 — Quoted prices in markets that are not active or financial instruments for which significant inputs are observable (including, but not limited to, quoted prices for similar investments, interest rates, foreign exchange rates, volatility and credit spreads), either directly or indirectly;
Level 3 — Prices or valuations that require significant unobservable inputs (including GSAM’s assumptions in determining fair value measurement).
16
GOLDMAN SACHS VARIABLE INSURANCE TRUST STRATEGIC GROWTH FUND
3. INVESTMENTS AND FAIR VALUE MEASUREMENTS (continued)
The Trustees have adopted Valuation Procedures that govern the valuation of the portfolio investments held by the Fund, including investments for which market quotations are not readily available. The Trustees have delegated to GSAM day-to-day responsibility for implementing and maintaining internal controls and procedures related to the valuation of the Fund’s portfolio investment. To assess the continuing appropriateness of pricing sources and methodologies, GSAM regularly performs price verification procedures and issues challenges as necessary to third party pricing vendors or brokers, and any differences are reviewed in accordance with the Valuation Procedures.
A. Level 1 and Level 2 Fair Value Investments — The valuation techniques and significant inputs used in determining the fair values for investments classified as Level 1 and Level 2 are as follows:
Equity Securities — Equity securities and investment companies traded on a U.S. securities exchange or the NASDAQ system, or those located on certain foreign exchanges, including but not limited to the Americas, are valued daily at their last sale price or official closing price on the principal exchange or system on which they are traded. If no sale occurs, equity securities and exchange traded investment companies are valued at the last bid price for long positions and at the last ask price for short positions. Investments in investment companies (other than those that are exchange traded) are valued at the NAV on the valuation date. To the extent these investments are actively traded, they are classified as Level 1 of the fair value hierarchy.
Unlisted equity securities for which market quotations are available are valued at the last sale price on the valuation date, or if no sale occurs, at the last bid price. Securities traded on certain foreign securities exchanges are valued daily at fair value determined by an independent fair value service (if available) under valuation procedures approved by the trustees and consistent with applicable regulatory guidance. The independent fair value service takes into account multiple factors including, but not limited to, movements in the securities markets, certain depositary receipts, futures contracts and foreign currency exchange rates that have occurred subsequent to the close of the foreign securities exchange. Investments applying these valuation adjustments are classified as Level 2 of the fair value hierarchy.
Debt Securities — Debt securities for which market quotations are readily available are valued daily on the basis of quotations supplied by dealers or an independent pricing service approved by the trustees. The pricing services may use valuation models or matrix pricing, which consider: (i) yield or price with respect to bonds that are considered comparable in characteristics such as rating, interest rate and maturity date or (ii) quotations from securities dealers to determine current value. Short-term debt obligations that mature in sixty days or less and that do not exhibit signs of credit deterioration are valued at amortized cost, which approximates fair value. With the exception of treasury securities, which are generally classified as Level 1, these investments are generally classified as Level 2 of the fair value hierarchy.
B. Level 3 Fair Value Investments — The valuation techniques and significant inputs used in determining the fair values for investments classified as Level 3 are as follows:
To the extent that the aforementioned significant inputs are unobservable, or if quotations are not readily available, or if GSAM believes that such quotations do not accurately reflect fair value, the fair value of the Fund’s investments may be determined under
17
GOLDMAN SACHS VARIABLE INSURANCE TRUST STRATEGIC GROWTH FUND
Notes to Financial Statements (continued)
December 31, 2012
3. INVESTMENTS AND FAIR VALUE MEASUREMENTS (continued)
valuation procedures approved by the trustees. GSAM, consistent with its procedures and applicable regulatory guidance, may make an adjustment to the most recent valuation prices of either domestic or foreign securities in light of significant events to reflect what it believes to be the fair value of the securities at the time of determining a Fund’s NAV. Significant events which could affect a large number of securities in a particular market may include, but are not limited to: significant fluctuations in U.S. or foreign markets; market dislocations; market disruptions; or unscheduled market closings. Significant events which could also affect a single issuer may include, but are not limited to: corporate actions such as reorganizations, mergers and buy-outs; ratings downgrades; and bankruptcies.
C. Fair Value Hierarchy — The following is a summary of the Fund’s investments classified in the fair value hierarchy as of December 31, 2012:
| Investment Type | Level 1 | Level 2 | Level 3 | |||||||||
| Assets | ||||||||||||
| Common Stock and/or Other Equity Investments | $ | 405,432,660 | $ | — | $ | — | ||||||
For further information regarding security characteristics, see the Schedule of Investments.
4. AGREEMENTS AND AFFILIATED TRANSACTIONS
A. Management Agreement — Under the Agreement, GSAM manages the Fund, subject to the general supervision of the trustees.
As compensation for the services rendered pursuant to the Agreement, the assumption of the expenses related thereto and administration of the Fund’s business affairs, including providing facilities, GSAM is entitled to a management fee, accrued daily and paid monthly, equal to an annual percentage rate of the Fund’s average daily net assets.
For the fiscal year ended December 31, 2012, contractual and effective net management fees with GSAM were at the following rates:
| Contractual Management Fee Rate | ||||||||||||||||||||||||||
| First $1 billion | Next $1 billion | Next $3 billion | Next $3 billion | Over $8 billion | Effective Rate | Effective Net Management Fee Rate | ||||||||||||||||||||
| 0.75% | 0.68 | % | 0.65 | % | 0.64 | % | 0.63 | % | 0.75 | % | 0.71 | %* | ||||||||||||||
| * | GSAM agreed to waive a portion of its management fee in order to achieve the effective net management rate shown above through at least April 27, 2013. Prior to such date GSAM may not terminate the arrangement without the approval of the trustees. For the fiscal year ended December 31, 2012, GSAM waived approximately $156,500 of its management fee. |
18
GOLDMAN SACHS VARIABLE INSURANCE TRUST STRATEGIC GROWTH FUND
4. AGREEMENTS AND AFFILIATED TRANSACTIONS (continued)
B. Distribution and Service Plan — The Trust, on behalf of the Service Shares of the Fund, has adopted a Distribution and Service Plan (the “Plan”). Under the Plan, Goldman Sachs, which serves as distributor (the “Distributor”), is entitled to a fee accrued daily and paid monthly, for distribution services, which may then be paid by Goldman Sachs to authorized dealers, equal to, on an annual basis, 0.25% of the Fund’s average daily net assets attributable to Service Shares.
C. Transfer Agency Agreement — Goldman Sachs also serves as the transfer agent of the Fund for a fee pursuant to Transfer Agency Agreement. The fees charged for such transfer agency services are accrued daily and paid monthly at an annual rate of 0.02% of the average daily net assets of Institutional and Service Shares.
D. Other Expense Agreements and Affiliated Transactions — GSAM has agreed to limit certain “Other Expense” of the Fund (excluding management fees, distribution and service fees, acquired fund fees and expenses, transfer agent fees and expenses, taxes, interest, brokerage fees, litigation, indemnification, shareholder meeting and other extraordinary expenses) to the extent such expenses exceed, on an annual basis, a percentage rate of the average daily net assets of the Fund. Such Other Expense reimbursements, if any, are accrued daily and paid monthly. In addition, the Fund is not obligated to reimburse GSAM for prior fiscal year expense reimbursements, if any. The Other Expense limitation as an annual percentage rate of average daily net assets for the Fund is 0.114%. These Other Expense reimbursements will remain in place through at least April 27, 2013, and prior to such date GSAM may not terminate the arrangement without the approval of the trustees. For the fiscal year ended December 31, 2012, GSAM did not make any reimbursements to the Fund. In addition, the Fund has entered into certain offset arrangements with the custodian and the transfer agent, which may result in a reduction of the Fund’s expenses and are received irrespective of the application of the “Other Expense” limitation described above. For the fiscal year ended December 31, 2012, custody fee credits were approximately $3,500.
As of December 31, 2012, the amounts owed to affiliates of the Fund were approximately $244,600, $63,700, and $6,900 for management, distribution and service, and transfer agent fees, respectively.
E. Line of Credit Facility — As of December 31, 2012, the Fund participated in a $630,000,000 committed, unsecured revolving line of credit facility (the “facility”) together with other funds of the Trust and registered investment companies having management agreements with GSAM or its affiliates (“Other Borrowers”). Pursuant to the terms of the facility, the Fund and Other Borrowers could increase the credit amount by an additional $340,000,000, for a total of up to $970,000,000. This facility is to be used solely for temporary or emergency purposes, which may include the funding of redemptions. The interest rate on borrowings is based on the federal funds rate. The facility also requires a fee to be paid by the Fund based on the amount of the commitment that has not been utilized. For the fiscal year ended December 31, 2012, the Fund did not have any borrowings under the facility. Prior to May 8, 2012, the amount available through the facility was $580,000,000.
19
GOLDMAN SACHS VARIABLE INSURANCE TRUST STRATEGIC GROWTH FUND
Notes to Financial Statements (continued)
December 31, 2012
5. PORTFOLIO SECURITIES TRANSACTIONS
The cost of purchases and proceeds from sales and maturities of long-term securities for the fiscal year ended December 31, 2012, were $164,545,409 and $168,590,198, respectively.
6. TAX INFORMATION
The tax character of distributions paid during the fiscal years ended December 31, 2011 and December 31, 2012 was as follows:
| 2011 | 2012 | |||||||
| Distributions paid from ordinary income | $ | 1,045,477 | $ | 2,085,293 | ||||
As of December 31, 2012, the components of accumulated earnings (losses) on a tax-basis were as follows:
| Undistributed ordinary income — net | $ | 553,553 | ||
| Capital loss carryforwards:(1) | ||||
Expiring 2016 | (10,256,176 | ) | ||
Expiring 2017 | (43,614,413 | ) | ||
| Total capital loss carryforwards | $ | (53,870,589 | ) | |
| Timing differences (Post October Loss Deferrals) | (1,048,023 | ) | ||
| Unrealized gains — net | 91,928,323 | |||
| Total accumulated gains — net | $ | 37,563,264 |
| (1) | Expiration occurs on December 31 of the year indicated. The Fund had capital loss carryforwards of $13,219,787 that were utilized in the current fiscal year. |
20
GOLDMAN SACHS VARIABLE INSURANCE TRUST STRATEGIC GROWTH FUND
6. TAX INFORMATION (continued)
As of December 31, 2012, the Fund’s aggregate security unrealized gains and losses based on cost for U.S. federal income tax purposes were as follows:
| Tax cost | $ | 313,504,337 | ||
| Gross unrealized gain | 101,347,743 | |||
| Gross unrealized loss | (9,419,420 | ) | ||
| Net unrealized security gain | $ | 91,928,323 |
The difference between GAAP-basis and tax-basis unrealized gains (losses) is attributable primarily to wash sales.
GSAM has reviewed the Fund’s tax positions for all open tax years (the current and prior three years, as applicable) and has concluded that no provision for income tax is required in the Fund’s financial statements. Such open tax years remain subject to examination and adjustment by tax authorities.
7. OTHER RISKS
The Fund’s risks include, but are not limited to, the following:
Shareholder Concentration Risk — Certain participating insurance companies, accounts, or Goldman Sachs affiliates may from time to time own (beneficially or of record) or control a significant percentage of the Fund’s shares. Redemptions by these entities of their holdings in the Fund may impact the Fund’s liquidity and NAV. These redemptions may also force the Fund to sell securities.
Liquidity Risk — The Fund may make investments that are illiquid or that may become less liquid in response to market developments or adverse investor perceptions. Illiquid investments may be more difficult to value. Liquidity risk may also refer to the risk that a Fund will not be able to pay redemption proceeds within the allowable time period because of unusual market conditions, an unusually high volume of redemption requests, or other reasons. To meet redemption requests, the Fund may be forced to sell investments at an unfavorable time and/or under unfavorable conditions.
21
GOLDMAN SACHS VARIABLE INSURANCE TRUST STRATEGIC GROWTH FUND
Notes to Financial Statements (continued)
December 31, 2012
7. OTHER RISKS (continued)
Market and Credit Risks — In the normal course of business, the Fund trades financial instruments and enters into financial transactions where risk of potential loss exists due to changes in the market (market risk). Additionally, the Fund may also be exposed to credit risk in the event that an issuer fails to perform or that an institution or entity with which the Fund has unsettled or open transactions defaults.
8. INDEMNIFICATIONS
Under the Trust’s organizational documents, its trustees, officers, employees and agents are indemnified, to the extent permitted by the Act, against certain liabilities that may arise out of performance of their duties to the Fund. Additionally, in the course of business, the Fund enters into contracts that contain a variety of indemnification clauses. The Fund’s maximum exposure under these arrangements is unknown, as this would involve future claims that may be made against the Fund that have not yet occurred. However, GSAM believes the risk of loss under these arrangements to be remote.
9. OTHER MATTERS
New Accounting Pronouncement — In December 2011, the Financial Accounting Standards Board issued an Accounting Standards Update (“ASU”) to enhance disclosures about financial instruments and derivative instruments that are subject to offsetting (“netting”) on the Statement of Assets and Liabilities. This information will enable users of the Fund’s financial statements to evaluate the effect or potential effect of netting arrangements on the Fund’s financial position. The ASU is effective for financial statements with fiscal years beginning on or after January 1, 2013, and interim periods within those fiscal years. At this time, GSAM is evaluating the implications of these changes on the financial statements.
10. SUBSEQUENT EVENTS
Subsequent events after the Statement of Assets and Liabilities date have been evaluated through the date the financial statements were issued. GSAM has concluded that there is no impact requiring adjustment or disclosure in the financial statements.
22
GOLDMAN SACHS VARIABLE INSURANCE TRUST STRATEGIC GROWTH FUND
11. SUMMARY OF SHARE TRANSACTIONS
Share activity is as follows:
| For the Fiscal Year Ended December 31, 2012 | For the Fiscal Year Ended December 31, 2011 | |||||||||||||||
| Shares | Dollars | Shares | Dollars | |||||||||||||
| Institutional Shares | ||||||||||||||||
| Shares sold | 423,916 | $ | 5,609,432 | 538,621 | $ | 6,419,175 | ||||||||||
| Reinvestment of distributions | 52,249 | 723,126 | 41,918 | 485,834 | ||||||||||||
| Shares redeemed | (1,585,202 | ) | (21,069,391 | ) | (1,809,316 | ) | (21,631,128 | ) | ||||||||
| (1,109,037 | ) | (14,736,833 | ) | (1,228,777 | ) | (14,726,119 | ) | |||||||||
| Service Shares | ||||||||||||||||
| Shares sold | 3,030,601 | 40,173,789 | 3,737,423 | 44,640,044 | ||||||||||||
| Reinvestment of distributions | 98,565 | 1,362,167 | 48,328 | 559,643 | ||||||||||||
| Shares redeemed | (2,341,598 | ) | (31,052,703 | ) | (2,477,738 | ) | (29,526,455 | ) | ||||||||
| 787,568 | 10,483,253 | 1,308,013 | 15,673,232 | |||||||||||||
| NET INCREASE (DECREASE) | (321,469 | ) | $ | (4,253,580 | ) | 79,236 | $ | 947,113 | ||||||||
23
Report of Independent Registered Public Accounting Firm
To the Board of Trustees and Shareholders of
Goldman Sachs Variable Insurance Trust — Goldman Sachs Strategic Growth Fund:
In our opinion, the accompanying statement of assets and liabilities, including the schedule of investments, and the related statements of operations and of changes in net assets and the financial highlights present fairly, in all material respects, the financial position of Goldman Sachs Strategic Growth Fund (the “Fund”) at December 31, 2012 and the results of its operations, the changes in its net assets and the financial highlights for each of the periods indicated, in conformity with accounting principles generally accepted in the United States of America. These financial statements and financial highlights (hereafter referred to as “financial statements”) are the responsibility of the Fund’s management. Our responsibility is to express an opinion on these financial statements based on our audit. We conducted our audit of these financial statements in accordance with the standards of the Public Company Accounting Oversight Board (United States). Those standards require that we plan and perform the audit to obtain reasonable assurance about whether the financial statements are free of material misstatement. An audit includes examining, on a test basis, evidence supporting the amounts and disclosures in the financial statements, assessing the accounting principles used and significant estimates made by management, and evaluating the overall financial statement presentation. We believe that our audit, which included confirmation of securities at December 31, 2012 by correspondence with the custodian, brokers, and the application of alternative auditing procedures where securities purchased confirmations had not been received, provides a reasonable basis for our opinion.
PricewaterhouseCoopers LLP
Boston, Massachusetts
February 14, 2013
24
GOLDMAN SACHS VARIABLE INSURANCE TRUST STRATEGIC GROWTH FUND
| Fund Expenses — Six Month Period Ended December 31, 2012 (Unaudited) |
As a shareholder of Institutional or Service Shares of the Fund, you incur ongoing costs, including management fees, distribution and service (12b-1) fees (with respect to Service Shares) and other Fund expenses. This example is intended to help you understand your ongoing costs (in dollars) of investing in the Institutional Shares and Service Shares of the Fund and to compare these costs with the ongoing costs of investing in other mutual funds.
The example is based on an investment of $1,000 invested at the beginning of the period and held for the entire period from July 1, 2012 through December 31, 2012.
Actual Expenses — The first line under each share class in the table below provides information about actual account values and actual expenses. You may use the information in this line, together with the amount you invested, to estimate the expenses that you paid over the period. Simply divide your account value by $1,000 (for example, an $8,600 account value divided by $1,000=8.6), then multiply the result by the number in the first line under the heading entitled “Expenses Paid” to estimate the expenses you paid on your account during this period.
Hypothetical Example for Comparison Purposes — The second line under each share class in the table below provides information about hypothetical account values and hypothetical expenses based on the Fund's actual net expense ratio and an assumed rate of return of 5% per year before expenses, which is not the Fund's actual return. The hypothetical account values and expenses may not be used to estimate the actual ending account balance or expenses you paid for the period. You may use this information to compare the ongoing costs of investing in the Funds and other funds. To do so, compare this 5% hypothetical example with the 5% hypothetical examples that appear in the shareholder reports of the other funds.
Please note that the expenses shown in the table are meant to highlight your ongoing costs only. As a shareholder of the Fund, you do not incur any transaction costs, such as sales charges, redemption fees or exchange fees, but shareholders of other funds may incur such costs. The second line of the table is useful in comparing ongoing costs only, and will not help you determine the relative total costs of owning different funds whose shareholders may incur transaction costs.
| Share Class | Beginning Account Value 7/01/12 | Ending Account Value 12/31/12 | Expenses Paid for the 6 Months Ended 12/31/12* | |||||||||
| Institutional | ||||||||||||
| Actual | $ | 1,000 | $ | 1,075.90 | $ | 4.23 | ||||||
| Hypothetical 5% return | 1,000 | 1,021.06 | + | 4.12 | ||||||||
| Service | ||||||||||||
| Actual | 1,000 | 1,075.20 | 5.53 | |||||||||
| Hypothetical 5% return | 1,000 | 1,019.81 | + | 5.38 | ||||||||
| * | Expenses are calculated using the Fund’s annualized net expense ratio for each class, which represents the ongoing expenses as a percentage of net assets for the six months ended December 31, 2012. Expenses are calculated by multiplying the annualized net expense ratio by the average account value for the period; then multiplying the result by the number of days in the most recent fiscal half year; and then dividing that result by the number of days in the fiscal year. The annualized net expense ratios for the period were 0.81% and 1.06% for the Institutional and Service Shares, respectively. |
| + | Hypothetical expenses are based on the Fund’s actual annualized net expense ratios and an assumed rate of return of 5% per year before expenses. |
25
GOLDMAN SACHS VARIABLE INSURANCE TRUST STRATEGIC GROWTH FUND
Trustees and Officers (Unaudited)
Independent Trustees
| Name, Address and Age1 | Position(s) Held with the Trust | Term of Office and | Principal Occupation(s) During Past 5 Years | Number of Portfolios in Fund Complex Overseen by Trustee3 | Other Directorships Held by Trustee4 | |||||||
Ashok N. Bakhru Age: 70 | Chairman of the Board of Trustees | Since 1996 (Trustee since 1991) | Mr. Bakhru is retired. He is President, ABN Associates (1994-1996 and 1998-Present); Director, Apollo Investment Corporation (a business development company) (2008-Present); Member of Cornell University Council (1992-2004 and 2006-Present); and was formerly Trustee, Scholarship America (1998-2005); Trustee, Institute for Higher Education Policy (2003-2008); Director, Private Equity Investors — III and IV (1998-2007), and Equity-Linked Investors II (April 2002-2007).
Chairman of the Board of Trustees — Goldman Sachs Mutual Fund Complex. | 111 | Apollo Investment Corporation (a business development company) | |||||||
Donald C. Burke Age: 52 | Trustee | Since 2010 | Mr. Burke is retired. He is Director, Avista Corp. (2011-Present); and was formerly a Director, BlackRock Luxembourg and Cayman Funds (2006-2010); President and Chief Executive Officer, BlackRock U.S. Funds (2007-2009); Managing Director, BlackRock, Inc. (2006-2009); Managing Director, Merrill Lynch Investment Managers, L.P. (“MLIM”) (2006); First Vice President, MLIM (1997-2005); Chief Financial Officer and Treasurer, MLIM U.S. Funds (1999-2006).
Trustee — Goldman Sachs Mutual Fund Complex. | 110 | Avista Corp. (an energy company) | |||||||
John P. Coblentz, Jr. Age: 71 | Trustee | Since 2003 | Mr. Coblentz is retired. Formerly, he was Partner, Deloitte & Touche LLP (1975-2003); Director, Emerging Markets Group, Ltd. (2004-2006); and Director, Elderhostel, Inc. (2006-2012).
Trustee — Goldman Sachs Mutual Fund Complex. | 111 | None | |||||||
Diana M. Daniels Age: 63 | Trustee | Since 2007 | Ms. Daniels is retired. Formerly, she was Vice President, General Counsel and Secretary, The Washington Post Company (1991-2006). Ms. Daniels is a Vice Chairman of the Board of Trustees, Cornell University (2009-Present); Member, Advisory Board, Psychology Without Borders (international humanitarian aid organization) (2007-Present), and former Member of the Legal Advisory Board, New York Stock Exchange (2003-2006) and of the Corporate Advisory Board, Standish Mellon Management Advisors (2006-2007).
Trustee — Goldman Sachs Mutual Fund Complex. | 110 | None | |||||||
Joseph P. LoRusso Age: 55 | Trustee | Since 2010 | Mr. LoRusso is retired. Formerly, he was President, Fidelity Investments Institutional Services Co. (“FIIS”) (2002-2008); Director, FIIS (2002-2008); Director, Fidelity Investments Institutional Operations Company (2003-2007); Executive Officer, Fidelity Distributors Corporation (2007-2008).
Trustee — Goldman Sachs Mutual Fund Complex. | 110 | None | |||||||
Jessica Palmer Age: 63 | Trustee | Since 2007 | Ms. Palmer is retired. She is Director, Emerson Center for the Arts and Culture (2011-Present); and was formerly a Consultant, Citigroup Human Resources Department (2007-2008); Managing Director, Citigroup Corporate and Investment Banking (previously, Salomon Smith Barney/Salomon Brothers) (1984-2006). Ms. Palmer was a Member of the Board of Trustees of Indian Mountain School (private elementary and secondary school) (2004-2009).
Trustee — Goldman Sachs Mutual Fund Complex. | 110 | None | |||||||
Richard P. Strubel Age: 73 | Trustee | Since 1987 | Mr. Strubel is retired. Formerly, he was Director, Cardean Learning Group (provider of educational services via the internet) (2003-2008); Trustee, Emeritus, The University of Chicago (1987-Present).
Trustee — Goldman Sachs Mutual Fund Complex. | 111 | The Northern Trust Mutual Fund Complex (64 Portfolios) (Chairman of the Board of Trustees); Gildan Activewear Inc. (a clothing marketing and manufacturing company). | |||||||
26
GOLDMAN SACHS VARIABLE INSURANCE TRUST STRATEGIC GROWTH FUND
Trustees and Officers (Unaudited) (continued)
Interested Trustees
| Name, Address and Age1 | Position(s) Held with the Trust | Term of Office and | Principal Occupation(s) During Past 5 Years | Number of Portfolios in Fund Complex Overseen by Trustee3 | Other Directorships Held by Trustee4 | |||||||
James A. McNamara* Age: 50 | President and Trustee | Since 2007 | Managing Director, Goldman Sachs (December 1998-Present); Director of Institutional Fund Sales, GSAM (April 1998-December 2000); and Senior Vice President and Manager, Dreyfus Institutional Service Corporation (January 1993- April 1998).
President — Goldman Sachs Mutual Fund Complex (November 2007-Present); Senior Vice President — Goldman Sachs Mutual Fund Complex (May 2007-November 2007); and Vice President — Goldman Sachs Mutual Fund Complex (2001-2007).
Trustee — Goldman Sachs Mutual Fund Complex (since November 2007 and December 2002-May 2004). | 111 | None | |||||||
Alan A. Shuch* Age: 63 | Trustee | Since 1990 | Advisory Director — GSAM (May 1999-Present); Consultant to GSAM (December 1994-May 1999); and Limited Partner, Goldman Sachs (December 1994-May 1999).
Trustee — Goldman Sachs Mutual Fund Complex. | 110 | None | |||||||
| * | These persons are considered to be “Interested Trustees” because they hold positions with Goldman Sachs and own securities issued by The Goldman Sachs Group, Inc. Each Interested Trustee holds comparable positions with certain other companies of which Goldman Sachs, GSAM or an affiliate thereof is the investment adviser, administrator and/or distributor. |
| 1 | Each Trustee may be contacted by writing to the Trustee, c/o Goldman Sachs, 200 West Street, New York, New York, 10282, Attn: Caroline Kraus. Information is provided as of December 31, 2012. |
| 2 | Each Trustee holds office for an indefinite term until the earliest of: (a) the election of his or her successor; (b) the date the Trustee resigns or is removed by the Board of Trustees or shareholders, in accordance with the Trust’s Declaration of Trust; (c) the conclusion of the first Board meeting held subsequent to the day the Trustee attains the age of 74 years (in accordance with the current resolutions of the Board of Trustees, which may be changed by the Trustees without shareholder vote); or (d) the termination of the Trust. |
| 3 | The Goldman Sachs Mutual Fund Complex consists of the Trust, Goldman Sachs Trust II, Goldman Sachs Municipal Opportunity Fund, Goldman Sachs Credit Strategies Fund, and Goldman Sachs Trust. As of December 31, 2012, the Trust consisted of 12 portfolios. Goldman Sachs Trust II consisted of 1 portfolio (which did not offer shares to the public); Goldman Sachs Municipal Opportunity Fund did not offer shares to the public; and Goldman Sachs Trust consisted of 96 portfolios (80 of which offered shares to the public). |
| 4 | This column includes only directorships of companies required to report to the SEC under the Securities Exchange Act of 1934 (i.e., “public companies”) or other investment companies registered under the Act. |
Additional information about the Trustees is available in the Fund’s Statement of Additional Information, which can be obtained from Goldman Sachs free of charge by calling this toll-free number (in the United States of America): 1-800-292-4726.
27
GOLDMAN SACHS VARIABLE INSURANCE TRUST STRATEGIC GROWTH FUND
Trustees and Officers (Unaudited) (continued)
Officers of the Trust*
| Name, Address and Age | Position(s) Held With the Trust | Term of Office and | Principal Occupation(s) During Past 5 Years | |||
James A. McNamara New York, NY 10282 | President and Trustee | Since 2007 | Managing Director, Goldman Sachs (December 1998-Present); Director of Institutional Fund Sales, GSAM (April 1998-December 2000); and Senior Vice President and Manager, Dreyfus Institutional Service Corporation (January 1993-April 1998). President — Goldman Sachs Mutual Fund Complex (November 2007-Present); Senior Vice President — Goldman Sachs Mutual Fund Complex (May 2007-November 2007); and Vice President — Goldman Sachs Mutual Fund Complex (2001-2007). Trustee — Goldman Sachs Mutual Fund Complex (November 2007-Present and December 2002-May 2004). | |||
George F. Travers 30 Hudson Street Jersey City, NJ 07302 | Senior Vice President and Principal Financial Officer | Since 2009 | Managing Director, Goldman Sachs (2007-Present); Managing Director, UBS Ag (2005-2007); and Partner, Deloitte & Touche LLP (1990-2005, partner from 2000-2005). Senior Vice President and Principal Financial Officer — Goldman Sachs Mutual Fund Complex. | |||
Caroline Kraus 200 West Street New York, NY 10282 | Secretary | Since 2012 | Vice President, Goldman Sachs (August 2006-Present); Associate General Counsel, Goldman Sachs (2012-Present); Assistant General Counsel, Goldman Sachs (August 2006-December 2011) and Associate, Weil, Gotshal & Manges-LLP (2002-2006). Secretary — Goldman Sachs Mutual Fund Complex (August 2012-Present) and Assistant Secretary — Goldman Sachs Mutual Fund Complex (June 2012-August 2012). | |||
Scott M. McHugh New York, NY 10282 | Treasurer and Senior Vice President | Since 2009 | Vice President, Goldman Sachs (February 2007-Present); Assistant Treasurer of certain mutual funds administered by DWS Scudder (2005-2007); and Director (2005-2007), Vice President (2000-2005) and Assistant Vice President (1998-2000), Deutsche Asset Management or its predecessor (1998-2007). Treasurer — Goldman Sachs Mutual Fund Complex (October 2009-Present); Senior Vice President — Goldman Sachs Mutual Fund Complex (November 2009-Present); and Assistant Treasurer — Goldman Sachs Mutual Fund Complex (May 2007-October 2009). | |||
| 1 | Officers hold office at the pleasure of the Board of Trustees or until their successors are duly elected and qualified. Each officer holds comparable positions with certain other companies of which Goldman Sachs, GSAM or an affiliate thereof is the investment adviser, administrator and/or distributor. Information is provided as of December 31, 2012. |
| * | Represents a partial list of officers of the Trust. Additional information about all the officers is available in the Fund’s Statement of Additional Information, which can be obtained from Goldman Sachs free of charge by calling this toll-free number (in the United States): 1-800-292-4726. |
Goldman Sachs Variable Insurance Trust — Tax Information (Unaudited)
For the year ended December 31, 2012, 100% of the dividends paid from net investment company taxable income by the Strategic Growth Fund qualify for the dividends received deduction available to corporations.
28
| TRUSTEES | OFFICERS | |
| Ashok N. Bakhru, Chairman | James A. McNamara, President | |
| Donald C. Burke | George F. Travers, Principal Financial Officer | |
| John P. Coblentz, Jr. | Caroline L. Kraus, Secretary | |
| Diana M. Daniels | Scott M. McHugh, Treasurer | |
| Joseph P. LoRusso | ||
| James A. McNamara | ||
| Jessica Palmer | ||
| Alan A. Shuch | ||
| Richard P. Strubel |
GOLDMAN, SACHS & CO.
Distributor and Transfer Agent
GOLDMAN SACHS ASSET MANAGEMENT, L.P.
Investment Adviser
200 West Street, New York
New York 10282
Visit our website at www.goldmansachsfunds.com/vit to obtain the most recent month-end returns.
The reports concerning the Fund included in this shareholder report may contain certain forward-looking statements about the factors that may affect the performance of the Fund in the future. These statements are based on Fund management’s predictions and expectations concerning certain future events and their expected impact on the Fund, such as performance of the economy as a whole and of specific industry sectors, changes in the levels of interest rates, the impact of developing world events, and other factors that may influence the future performance of the Fund. Management believes these forward-looking statements to be reasonable, although they are inherently uncertain and difficult to predict. Actual events may cause adjustments in portfolio management strategies from those currently expected to be employed.
A description of the policies and procedures that the Fund uses to determine how to vote proxies relating to portfolio securities and information regarding how the Fund voted proxies relating to portfolio securities for the 12-month period ended June 30 is available (i) without charge, upon request by calling 1-800-621-2550; and (ii) on the Securities and Exchange Commission (“SEC”) website at http://www.sec.gov.
The Fund files its complete schedule of portfolio holdings with the SEC for the first and third quarters of each fiscal year on Form N-Q. The Fund’s Form N-Q is available on the SEC’s website at http://www.sec.gov within 60 days after the Fund’s first and third fiscal quarters. The Fund’s Forms N-Q may be reviewed and copied at the SEC’s Public Reference Room in Washington, D.C. and information on the operation of the Public Reference Room may also be obtained by calling 1-800-SEC-0330. Forms N-Q may be obtained upon request and without charge by calling 1-800-621-2550.
Holdings and allocations shown are as of December 31, 2012 and may not be representative of future investments. Fund holdings should not be relied on in making investment decisions and should not be construed as research or investment advice regarding particular securities.
The Global Industry Classification Standard (“GICS”) was developed by and is the exclusive property and a service mark of Morgan Stanley Capital International Inc. (“MSCI”) and Standard & Poor’s, a division of The McGraw-Hill Companies, Inc. (“S&P”) and is licensed for use by Goldman Sachs. Neither MSCI, S&P nor any other party involved in making or compiling the GICS or any GICS classifications makes any express or implied warranties or representations with respect to such standard or classification (or the results to be obtained by the use thereof), and all such parties hereby expressly disclaim all warranties of originality, accuracy, completeness, merchantability or fitness for a particular purpose with respect to any of such standard or classification. Without limiting any of the foregoing, in no event shall MSCI, S&P, any of their affiliates or any third party involved in making or compiling the GICS or any GICS classifications have any liability for any direct, indirect, special, punitive, consequential or any other damages (including lost profits) even if notified of the possibility of such damages.
The portfolio risk management process includes an effort to monitor and manage risk, but does not imply low risk.
Shares of the Goldman Sachs VIT Funds are offered to separate accounts of participating life insurance companies for the purpose of funding variable annuity contracts and variable life insurance policies. Shares of the Fund are not offered directly to the general public. The variable annuity contracts and variable life insurance policies are described in the separate prospectuses issued by participating insurance companies. You should refer to those prospectuses for information about surrender charges, mortality and expense risk fees and other charges that may be assessed by participating insurance companies under the variable annuity contracts or variable life insurance policies. Such fees or charges, if any, may affect the return you may realize with respect to your investments. Ask your representative for more complete information. Please consider a fund’s objectives, risks and charges and expenses, and read the prospectus carefully before investing. The prospectus contains this and other information about the Fund.
This material is not authorized for distribution to prospective investors unless preceded or accompanied by a current Prospectus or summary prospectus, if applicable. Investors should consider a Fund’s objective, risks, and charges and expenses, and read the summary prospectus, if available, and/or the Prospectus carefully before investing or sending money. The summary prospectus, if available, and the Prospectus contain this and other information about a Fund and may be obtained from your Authorized Institution or from Goldman, Sachs & Co. by calling 1-800-621-2550.
Toll Free (in U.S.): 800-292-4726
This report is prepared for the general information of contract owners and is not an offer of shares of the Goldman Sachs Variable Insurance Trust: Goldman Sachs Strategic Growth Fund.
©2013 Goldman Sachs. All rights reserved.
VITGRWAR13/92377.MF.MED.TMPL/2/2013
Goldman
Sachs Variable Insurance Trust
Goldman Sachs
Strategic International Equity Fund
Annual Report
December 31, 2012

GOLDMAN SACHS VARIABLE INSURANCE TRUST STRATEGIC INTERNATIONAL EQUITY FUND
Principal Investment Strategies and Risks
This is not a complete list of risks that may affect the Fund. For additional information concerning the risks applicable to the Fund, please see the Fund’s Prospectus.
Shares of the Goldman Sachs Variable Insurance Trust — Goldman Sachs Strategic International Equity Fund are offered to separate accounts of participating life insurance companies for the purpose of funding variable annuity contracts and variable life insurance policies. Shares of the Fund are not offered directly to the general public. The variable annuity contracts and variable life insurance policies are described in the separate prospectuses issued by participating insurance companies. You should refer to those prospectuses for information about surrender charges, mortality and expense risk fees and other charges that may be assessed by participating insurance companies under the variable annuity contracts or variable life insurance policies. Such fees or charges, if any, may affect the return you realize with respect to your investments. Ask your representative for more complete information. Please consider the Fund’s objective, risks and charges and expenses, and read the Prospectus carefully before investing. The Prospectus contains this and other information about the Fund.
The Goldman Sachs Strategic International Equity Fund invests primarily in a diversified portfolio of equity investments in companies that are organized outside the United States or whose securities are principally traded outside the United States. The Fund’s equity investments are subject to market risk, which means that the value of the securities in which it invests may go up or down in response to the prospects of individual companies, particular sectors and/or general economic conditions. Foreign and emerging market securities may be more volatile and less liquid than investments in U.S. securities and will be subject to the risks of currency fluctuations and adverse economic or political developments.
1
GOLDMAN SACHS VARIABLE INSURANCE TRUST STRATEGIC INTERNATIONAL EQUITY FUND
INVESTMENT OBJECTIVE
The Fund seeks long-term growth of capital.
Portfolio Management Discussion and Analysis
Below, the Goldman Sachs International Equity Portfolio Management Team discusses the Goldman Sachs Variable Insurance Trust — Goldman Sachs Strategic International Equity Fund’s (the “Fund”) performance and positioning for the 12-month period ended December 31, 2012 (the “Reporting Period”).
How did the Fund perform during the Reporting Period?
During the Reporting Period, the Fund’s Institutional and Service Shares generated average annual total returns of 21.17% and 20.82%, respectively. These returns compare to the 17.27% average annual total return of the Fund’s benchmark, the MSCI Europe, Australasia, Far East (EAFE) Index* (net, unhedged) (the “MSCI EAFE Index”), during the same time period.
What economic and market factors most influenced the international equity markets as a whole during the Reporting Period?
International equities, as measured by the MSCI EAFE Index, gained 17.27% in U.S. dollar terms during the Reporting Period, with broad participation from country markets and sectors. Europe’s ongoing sovereign debt issues, the state of the global economy and strong central bank actions heavily influenced international equity markets during the Reporting Period.
Strong performance during the first quarter of 2012 reflected optimism on the U.S. economic recovery and on Europe’s prospects for resolving the sovereign debt crisis. In addition, several major central banks continued policies or took new actions to ease monetary policy. The U.S. Federal Reserve (the “Fed”) committed to low interest rates until at least late-2014; the European Central Bank (“ECB”) provided liquidity through its longer-term refinancing operation (“LTRO”), which offset widespread downgrades of sovereign debt by Standard & Poor’s; and the Bank of Japan surprised markets with monetary policy easing in the form of increased asset purchases.
In the second quarter of 2012, however, equity markets erased earlier gains in reaction to worrisome headlines in Europe and weaker than expected economic data out of the U.S., China and several faster growing regions. Spain’s banking system required a bailout; a Greek exit from the European Monetary Union (“EMU”) looked possible again; and Spanish and Italian bond yields hovered near unsustainable levels. In Japan, despite further easing from the Bank of Japan, the yen rose and pressured Japanese equities.
After steep declines in May 2012, international equities began a seven-month rally into the end of 2012, spurred by strong central bank actions. European equity markets cheered ECB president Mario Draghi’s commitment to the euro and the ECB’s pledge to buy unlimited amounts of short-term government bonds. Still, manufacturing and services data released during the third calendar quarter suggested Europe still faced economic challenges. Despite the Bank of Japan’s extension and increase of its asset purchase program, Japanese equities significantly underperformed the MSCI EAFE Index during the third quarter of 2012 following disappointing Gross Domestic Product (“GDP”) growth for the previous quarter and an increase in the trade deficit. An escalating territory dispute with China and domestic political uncertainty further unsettled the Japanese equity market. Adding to the global monetary easing, the U.S. Fed announced in September another round of quantitative easing, dubbed QE3, with no expiration date but with the explicit goal of reducing unemployment. The Fed also extended its policy of near-zero interest rates until at least mid-2015.
After a strong third quarter, equity markets paused in October 2012 ahead of a tight U.S. presidential election race and a pending leadership change in China. Both events took place in November and offered few surprises or changes but relieved the uncertainty that dominated investor sentiment. A number of positive developments around the world also boosted investor sentiment and sparked a rally into the end of 2012. Approval for Spain’s plan to restructure its banks and an agreement among finance ministers to reschedule some of Greece’s debt and release aid to the country lifted European equity markets late in the year. The Japanese equity market rose sharply into the end of the year on hopes the newly elected prime minister there would focus on weakening the yen and establishing an inflation target. Indeed, the yen weakened notably against the U.S. dollar late in the year, which drove strong returns
| * | The unmanaged MSCI EAFE Index (unhedged) is a market-capitalization-weighted composite of securities in 21 developed markets. The Index figures do not reflect any deduction for fees, expenses or taxes. It is not possible to invest directly in an unmanaged index. |
2
GOLDMAN SACHS VARIABLE INSURANCE TRUST STRATEGIC INTERNATIONAL EQUITY FUND
in the local Japanese equity market, as it was perceived as good for Japan’s export-oriented economy. Lastly, improving economic data from China and the U.S. late in the year improved sentiment on the global economy and lifted equity markets broadly.
For the Reporting Period as a whole, all regions and country equity markets within the MSCI EAFE Index gained ground, with the exception of Israel, which posted negative returns. The Asia ex-Japan region performed best, as growth prospects there improved through the year. From a sector perspective, financials performed best within the MSCI EAFE Index, with its exceptionally strong performance largely driven by significant monetary easing throughout the year. The energy sector significantly underperformed the MSCI EAFE Index during the Reporting Period, as oil prices remained relatively constant, balancing continued unrest in several oil-producing countries with potential supply increases from U.S. shale production and a modest outlook for global economic growth.
What key factors were responsible for the Fund’s performance during the Reporting Period?
The Fund’s outperformance of the MSCI EAFE Index during the Reporting Period can be primarily attributed to individual stock selection.
What were some of the Fund’s best-performing individual stocks?
The greatest contributors to Fund performance relative to the MSCI EAFE Index during the Reporting Period were French bank Societe Generale, German pharmaceutical company Bayer and Japanese real estate company Mitsubishi Estate.
Societe Generale performed particularly well during the Reporting Period as it proved to be more resilient than investors originally expected. The bank continued to improve its capital position and reduce its balance sheet.
The Fund’s investment in Bayer was a top contributor to portfolio returns and drove performance in the health care sector. After announcing strong results in July 2012, Bayer increased its guidance numbers, which contributed to an increase in its stock price. We also saw positive news in its pipeline, as it was reported that Stivarga, Bayer’s new cancer drug, had been approved by the FDA, and Eylea, Bayer’s new injection drug, had received positive recommendations.
Mitsubishi Estate performed well, as office fundamentals in Japan improved. There was a market expectation that vacancy rates might have peaked. Indeed, Tokyo’s office vacancy rate in October 2012 was 8.74% as compared to 8.90% in September 2012, making it four consecutive months of declines from the 9.43% office vacancy rate in June 2012. Anticipation of rent increases in the near future further boosted optimism regarding this real estate company.
Which stocks detracted significantly from the Fund’s performance during the Reporting Period?
The biggest detractors from Fund performance relative to the MSCI EAFE Index during the Reporting Period were Japanese electronic equipment manufacturer Mitsubishi Electric, U.K. oil and gas exploration and production company BG Group and Japanese personal care products manufacturer Unicharm.
Shares of Mitsubishi Electric were weak during the Reporting Period on the back of an announcement that the company overcharged on defense and aerospace projects ordered by Japan’s Defense Ministry, which the company confirmed to be true. We eliminated the Fund’s position in Mitsubishi Electric by the end of the Reporting Period.
Shares of BG Group fell substantially during the Reporting Period and most especially in October 2012 following a profit warning and the announcement that the company’s production growth rate would be flat in 2013. Our investment thesis for BG Group was that we believed it has the best organic growth potential amongst the global oil majors, mainly driven by developments in Brazil and Australia. The company attributed the slide in its production outlook to a series of delays on projects in the North Sea, Egypt, the U.S. and Brazil. While we were disappointed by this news, it is important to recognize that production expectations for 2014 and beyond remained intact. We think the market overreacted to the company’s news, and so we held the position at the end of the Reporting Period and continued to monitor the situation.
Unicharm’s stock lagged the MSCI EAFE Index due to concerns about its decline in sales after political tensions between China and Japan rose. Unicharm has meaningful sales exposure in China. The stock also lagged due to the company’s perceived defensive nature during the fourth calendar quarter when the international equity markets rallied, favoring more economically-sensitive stocks.
Which equity market sectors most significantly affected Fund performance?
Effective security selection within the telecommunication services, consumer discretionary and financials sectors contributed positively to the Fund’s performance relative to the MSCI EAFE Index during the Reporting Period. The Fund’s underweighted positions in the comparatively weak telecommunication services and consumer discretionary sectors relative to the MSCI EAFE Index also added value.
3
GOLDMAN SACHS VARIABLE INSURANCE TRUST STRATEGIC INTERNATIONAL EQUITY FUND
Security selection in the utilities and consumer staples sectors detracted most from the Fund’s relative results during the Reporting Period. The Fund’s overweighted allocation to the lagging energy sector also weighed negatively on performance as did its underweighted allocation to the stronger financials sector.
Which countries or regions most affected the Fund’s performance during the Reporting Period?
Typically, the Fund’s individual stock holdings will significantly influence the Fund’s performance within a particular country or region relative to the MSCI EAFE Index. This effect may be even more pronounced in countries that represent only a modest proportion of the MSCI EAFE Index.
That said, the Fund’s stock selection in Japan, the U.K. and Italy contributed most positively to the Fund’s returns relative to the MSCI EAFE Index. The countries that detracted most from the Fund’s performance during the Reporting Period were Germany, Hong Kong and the Czech Republic, where positioning overall hurt.
How did the Fund use derivatives and similar instruments during the Reporting Period?
During the Reporting Period, we did not use derivatives to hedge positions or as part of an active management strategy, but we used index futures, on an opportunistic basis, to ensure the portfolio remained almost fully exposed to equities following cash inflows or stock sales.
Did the Fund make any significant purchases or sales during the Reporting Period?
During the Reporting Period, we established Fund positions in Toyota Motor, Shire and Vinci, as we believe each is a quality company with an attractive valuation.
We established a Fund position in Japanese automobile manufacturer Toyota Motor. We expected the company’s earnings to recover sharply with its rising utilization rate following a period when it had experienced production damage due to supply chain disruption from the earthquake in Japan and the flood in Thailand.
There were three key reasons why we initiated a Fund position in Shire, one of the world’s leading specialty biopharmaceutical companies. First was growth prospects of the company’s ADHD (attention deficit hyperactivity disorder) franchise. Approximately 40% of the company’s sales come from products that treat the ADHD specialist condition. The ADHD market is growing at approximately 11% annually, and we believe Shire should be well positioned to gain market share, especially in Europe where there is currently little competition in this market. The second reason was Shire’s sustainable enzyme replacement therapy business. Enzyme replacement therapy is a medical treatment replacing an enzyme in patients in whom that particular enzyme is deficient or absent. Shire has four drugs in this space, which amount to approximately 30% of the company’s sales. The attractive aspect of this business area is that it is an orphan drug market characterized by long intellectual property (“IP”) periods and strong pricing, and thus we expect this to help drive Shire’s profitability. (An orphan drug is a pharmaceutical agent that has been developed specifically to treat a rare medical condition, the condition itself being referred to as an orphan disease. The assignment of orphan status to a disease and to any drugs developed to treat it is a matter of public policy in many countries. In the case of health care companies, a long IP period means that long patents on one or more products exist.) Third, we believed that Shire was attractively valued at the time of our purchase, and the market was not fully appreciating the growth prospects of the company.
Vinci is a concessions and construction company based in France. Despite the historically stable nature of Vinci’s construction and infrastructure business, the stock had been sold off heavily on the back of French political uncertainty and broader European concerns. We believed the election of French Prime Minister Francois Hollande would benefit the company, as he indicated he may increase investment in infrastructure. We also considered Vinci’s valuation attractive at the time of purchase.
We exited the Fund’s positions in BASF, Zurich Insurance Group and UBS during the Reporting Period.
We sold the Fund’s position in German-based chemical company BASF in order to take profits, as the stock had performed well since it bottomed in October 2011. We reallocated the sales proceeds into one of the world’s leading suppliers of standard and specialty fertilizers, K&S, a name we believe to have greater potential upside.
We eliminated the Fund’s position in Zurich Insurance Group, as we had greater conviction in an Asian-based insurer, AIA Group, which we believe is in a more attractive market with greater growth potential.
After news of a restructuring, shares of Swiss diversified banking institution UBS performed well, and we eliminated the Fund’s position to take profits.
4
GOLDMAN SACHS VARIABLE INSURANCE TRUST STRATEGIC INTERNATIONAL EQUITY FUND
Were there any notable changes in the Fund’s weightings during the Reporting Period?
In constructing the Fund’s portfolio, we focus on picking stocks rather than on making regional, country, sector or industry bets. We seek to outpace the benchmark index by overweighting stocks that we expect to outperform and underweighting those that we think may lag. Consequently, changes in its sector or country weights are generally the direct result of individual stock selection or of stock appreciation or depreciation. That said, there were no notable changes in the Fund’s sector or country weightings during the Reporting Period.
How was the Fund positioned relative to its benchmark index at the end of the Reporting Period?
At the end of December 2012, the Fund had greater weightings than the MSCI EAFE Index in the consumer discretionary, health care, industrials and energy sectors. The Fund had underweighted allocations to the materials, financials, telecommunication services and utilities sectors and was rather neutrally weighted to the MSCI EAFE Index in the information technology and consumer staples sectors at the end of the Reporting Period.
From a country perspective, the Fund had greater positions in the U.K., France, China, Finland, Russia and South Korea relative to the MSCI EAFE Index at the end of December 2012. The Fund had less exposure to Australia, Germany and Hong Kong than the MSCI EAFE Index at the end of the Reporting Period. On the same date, the Fund had rather neutral exposures to the remaining components of the MSCI EAFE Index.
As always, we remained focused on individual stock selection, with sector and country positioning being a secondary, but closely monitored, effect.
What is the Fund’s tactical view and strategy for the months ahead?
We live in a world in transition. While most advanced economies continue to face significant fiscal challenges, low growth prospects and high unemployment, many growth and emerging markets are enjoying vibrant and expanding economies. Yet even China, the largest growth market, is itself evolving, from infrastructure-driven growth to a higher quality, more balanced economy. We expect this global economic transition will create many investment opportunities as it unfolds. In the near term, we estimate we will see below-trend global GDP growth of 3.6% for 2013.1
That said, we believe there are companies in all regions of the world that can grow faster than the global GDP average and stocks that will return more than the broader market averages. Our stock selection philosophy and process reflect two main themes. First, we seek to invest in the highest portion of the value chain. We favor business models that can win in a variety of market conditions, have high barriers to entry and/or less risk. An important part of our stock selection process also considers these top companies in light of potential alternatives in other industries, sectors and regions.
Second, we are looking to gain exposure to secular growth, any way we can get it. We like companies with secular growth because we believe they can better control their own destinies, regardless of where we are in the business or economic cycle. Many qualities of a good business offer secular growth opportunities — a specialized niche, a strong brand, new technology or potential for market penetration, market share gains or new end-markets. These advantages often translate to premium valuations or near-term earnings. However, we are willing to pay for this growth potential when we judge it to be sustainable and when it is coupled with high returns on capital, particularly in light of modest global GDP growth and corporate earnings outlooks. In this transitioning world, we believe companies with secular growth will be better able to retain margins, which, in our view, are peaking for many other firms. We believe companies that can better protect profits will be rewarded.
Not surprisingly, companies with secular growth are often benefiting from broader secular growth trends that cut across almost all industries and regions of the world. Two of the biggest themes currently expressed in the Fund are the expansion of the growth markets’ middle class and the growing demand for mobile data. Indeed, the growth markets consumer may be one of the biggest themes of the decade. An additional three billion people are expected to enter the middle and high income classes by 2050, as large and relatively young populations expand workforces and have more discretionary income.2 We also believe many companies across the information technology, telecommunications and media sectors will continue to benefit from the long-term growth of mobile data.
Going forward, we believe equities are likely to look attractive versus other asset classes, as we expect interest rates to remain low in light of modest expectations for global economic growth. In addition, we think companies may take advantage of low financing rates and put high levels of cash to work via mergers and acquisitions, further supporting valuations. Overall, we believe that we have positioned the Fund with many higher quality stocks. We believe their better growth profiles and business models can drive
5
GOLDMAN SACHS VARIABLE INSURANCE TRUST STRATEGIC INTERNATIONAL EQUITY FUND
returns in a market without a strong macro kick. As always, we continue to focus on building the Fund’s quality portfolio through intense bottom-up research and believe such a disciplined strategy will help us position the Fund effectively in these still uncertain times.
| 1 | Source: Office of the Chairman, GSAM, The Outlook for 2013 and 2014, November 2012. |
| 2 | Source: Goldman Sachs Global ECS (Economics, Commodities and Strategy) Research, February 2011. Change in the number of people with incomes above $6,000 in 2007 PPP. Middle income class: $6,000 — $30,000. High income: over $30,000. |
6
FUND BASICS
Strategic International Equity Fund
as of December 31, 2012
STANDARDIZED TOTAL RETURNS1
| For the period ended 12/31/12 | One Year | Five Years | Ten Years | Since Inception | Inception Date | |||||||||||||
| Institutional | 21.17 | % | -4.59 | % | 6.17 | % | 3.14 | % | 1/12/98 | |||||||||
| Service | 20.82 | -4.81 | N/A | -0.36 | 1/09/06 | |||||||||||||
| 1 | The Standardized Total Returns are average annual total returns as of the most recent calendar quarter-end. They assume reinvestment of all distributions at net asset value (“NAV”). Because Institutional Shares and Service Shares do not involve a sales charge, such a charge is not applied to their Standardized Total Returns. |
Total return figures in the above chart represent past performance and do not indicate future results, which will vary. The investment return and principal value of an investment will fluctuate and, therefore, an investor’s shares, when redeemed, may be worth more or less than their original cost. Current performance may be lower or higher than the total return figures in the above chart. Please visit www.goldmansachsfunds.com/vit to obtain the most recent month-end returns.
Performance reflects fee waivers and/or expense limitations in effect. In their absence, performance would be reduced.
EXPENSE RATIOS2
| Net Expense Ratio (Current) | Gross Expense Ratio (Before Waivers) | |||||||||
| Institutional | 1.00 | % | 1.07 | % | ||||||
| Service | 1.25 | 1.32 | ||||||||
| 2 | The expense ratios of the Fund, both current (net of applicable fee waivers and/or expense limitations) and before waivers (gross of applicable fee waivers and/or expense limitations), are as set forth above according to the most recent publicly available Prospectus for the Fund and may differ from the expense ratios disclosed in the Financial Highlights in this report. The Fund’s waivers and/or expense limitations will remain in place through at least April 27, 2013, and prior to such date the investment adviser may not terminate the arrangements without the approval of the Fund’s Board of Trustees. If these arrangements are discontinued in the future, the expense ratios may change without shareholder approval. |
Portfolio Composition
TOP TEN HOLDINGS AS OF 12/31/123
| Holding | % of Net Assets | Line of Business | Country | |||||
| Novartis AG (Registered) | 4.5% | Pharmaceuticals, Biotechnology & Life Sciences | Switzerland | |||||
| HSBC Holdings PLC | 4.3 | Banks | United Kingdom | |||||
| Rio Tinto PLC | 3.5 | Materials | United Kingdom | |||||
| BP PLC | 2.7 | Energy | United Kingdom | |||||
| Telefonaktiebolaget LM Ericsson Class B | 2.6 | Technology Hardware & Equipment | Sweden | |||||
| Westpac Banking Corp. | 2.2 | Banks | Australia | |||||
| Bayer AG (Registered) | 2.2 | Pharmaceuticals, Biotechnology & Life Sciences | Germany | |||||
| Vodafone Group PLC | 2.2 | Telecommunication Services | United Kingdom | |||||
| Sumitomo Mitsui Financial Group Inc. | 2.2 | Banks | Japan | |||||
| Vinci SA | 2.1 | Capital Goods | France | |||||
| 3 | The top 10 holdings may not be representative of the Fund’s future investments. |
7
FUND BASICS
FUND vs. BENCHMARK SECTOR ALLOCATIONS4
As of December 31, 2012
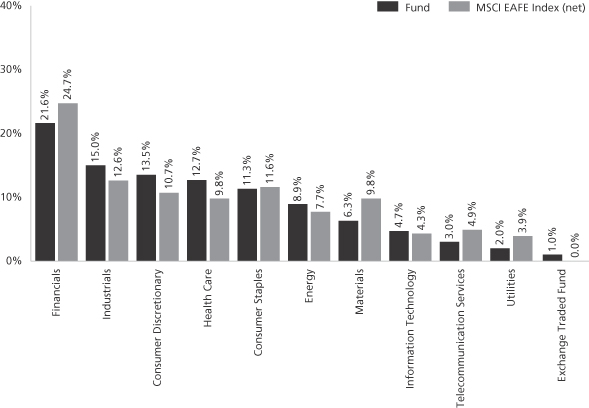
| 4 | The Fund is actively managed and, as such, its composition may differ over time. Consequently, the Fund’s overall sector allocations may differ from percentages contained in the graph above. The graph categorizes investments using Global Industry Classification Standard (“GICS”), however, the sector classifications used by the portfolio management team may differ from GICS. Underlying sector allocations of exchange traded funds (“ETFs”) held by the Fund are not reflected in the graph above. The percentage shown for each investment category reflects the value of investments in that category as a percentage of market value. The graph depicts the Fund’s investments but may not represent the Fund’s market exposure due to the exclusion of certain derivatives, if any, as listed in the Additional Investment Information section of the Schedule of Investments. |
8
GOLDMAN SACHS VARIABLE INSURANCE TRUST STRATEGIC INTERNATIONAL EQUITY FUND
Performance Summary
December 31, 2012
The following graph shows the value, as of December 31, 2012, of a $10,000 investment made on January 1, 2003 in the Institutional Shares at NAV. For comparative purposes, the performance of the Fund’s benchmark, the MSCI EAFE Index (unhedged, net, with dividends reinvested), is shown. This performance data represents past performance and should not be considered indicative of future performance, which will fluctuate with changes in market conditions. These performance fluctuations will cause an investor’s shares, when redeemed, to be worth more or less than their original cost. Performance reflects Fund level expenses but does not reflect fees and expenses associated with any variable annuity contract or variable life insurance policy that uses the Fund as an investment option for any contract or policy. Had performance reflected all of those fees and expenses, performance would have been reduced. Performance also would have been reduced had expense limitations not been in effect. Performance of Service Shares will vary from Institutional Shares due to differences in class specific fees. In addition to the investment adviser’s decisions regarding issuer/industry/country investment selection and allocation, other factors may affect Fund performance. These factors include, but are not limited to, Fund operating fees and expenses, portfolio turnover, and subscription and redemption cash flows affecting the Fund.
Strategic International Equity Fund’s 10 Year Performance
Performance of a $10,000 investment, with distributions reinvested, from January 1, 2003 through December 31, 2012.
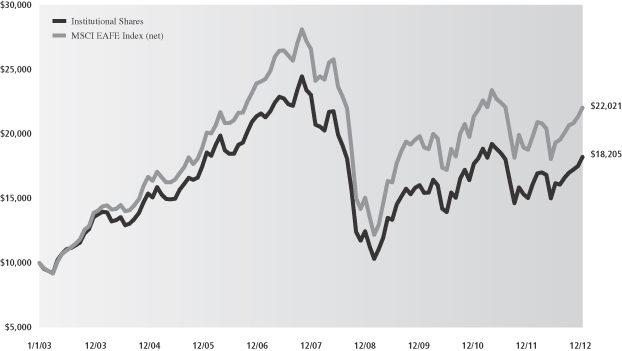
| Average Annual Total Return through December 31, 2012 | One Year | Five Years | Ten Years | Since Inception | ||||
Institutional (Commenced January 12, 1998) | 21.17% | -4.59% | 6.17% | 3.14% | ||||
Service (Commenced January 9, 2006) | 20.82% | -4.81% | N/A | -0.36% |
9
GOLDMAN SACHS VARIABLE INSURANCE TRUST STRATEGIC INTERNATIONAL EQUITY FUND
Schedule of Investments
December 31, 2012
| Shares | Description | Value | ||||||
| Common Stocks – 97.3% | ||||||||
| Australia – 3.6% | |||||||
| 709,373 | Aurizon Holdings Ltd. (Transportation) | $ | 2,789,529 | |||||
| 158,200 | Westpac Banking Corp. (Banks) | 4,334,648 | ||||||
|
| |||||||
| 7,124,177 | ||||||||
|
| |||||||
| Belgium – 1.7% | |||||||
| 37,740 | Anheuser-Busch InBev NV (Food, Beverage & Tobacco) | 3,286,571 | ||||||
|
| |||||||
| China – 0.8% | |||||||
| 2,734,000 | China Citic Bank Corp. Ltd. Class H (Banks) | 1,656,860 | ||||||
|
| |||||||
| Finland – 2.8% | |||||||
| 121,983 | Fortum Oyj (Utilities) | 2,283,634 | ||||||
| 78,225 | Nokian Renkaat Oyj (Automobiles & Components) | 3,133,466 | ||||||
|
| |||||||
| 5,417,100 | ||||||||
|
| |||||||
| France – 13.2% | |||||||
| 15,636 | Air Liquide SA (Materials) | 1,975,416 | ||||||
| 13,380 | Air Liquide SA-Prime De Fidelite (Materials)* | 1,690,398 | ||||||
| 88,211 | AXA SA (Insurance) | 1,583,897 | ||||||
| 58,590 | BNP Paribas SA (Banks) | 3,335,529 | ||||||
| 68,228 | Compagnie Generale de Geophysique-Veritas (Energy)* | 2,073,198 | ||||||
| 82,292 | JCDecaux SA (Media) | 1,964,224 | ||||||
| 14,439 | LVMH Moet Hennessy Louis Vuitton SA (Consumer Durables & Apparel) | 2,664,820 | ||||||
| 61,928 | Safran SA (Capital Goods) | 2,681,912 | ||||||
| 73,281 | Total SA (Energy) | 3,813,022 | ||||||
| 84,535 | Vinci SA (Capital Goods) | 4,070,116 | ||||||
|
| |||||||
| 25,852,532 | ||||||||
|
| |||||||
| Germany – 5.2% | |||||||
| 44,800 | Bayer AG (Registered) (Pharmaceuticals, Biotechnology & Life Sciences) | 4,272,207 | ||||||
| 29,188 | Bayerische Motoren Werke AG (Automobiles & Components) | 2,840,312 | ||||||
| 38,460 | Beiersdorf AG (Household & Personal Products) | 3,149,130 | ||||||
|
| |||||||
| 10,261,649 | ||||||||
|
| |||||||
| Hong Kong – 2.9% | |||||||
| 741,795 | AIA Group Ltd. (Insurance) | 2,942,208 | ||||||
| 706,000 | Belle International Holdings Ltd. (Retailing) | 1,561,372 | ||||||
| 386,000 | China Mengniu Dairy Co. Ltd. (Food, Beverage & Tobacco) | 1,103,329 | ||||||
|
| |||||||
| 5,606,909 | ||||||||
|
| |||||||
| India – 0.9% | |||||||
| 47,981 | Hero Motocorp Ltd. (Automobiles & Components) | 1,679,146 | ||||||
|
| |||||||
| Common Stocks – (continued) | ||||||||
| Ireland – 2.9% | |||||||
| 40,754 | Kerry Group PLC Class A (Food, Beverage & Tobacco) | $ | 2,152,663 | |||||
| 117,952 | Shire PLC (Pharmaceuticals, Biotechnology & Life Sciences) | 3,628,336 | ||||||
|
| |||||||
| 5,780,999 | ||||||||
|
| |||||||
| Japan – 19.8% | |||||||
| 55,600 | Astellas Pharma, Inc. (Pharmaceuticals, Biotechnology & Life Sciences) | 2,499,865 | ||||||
| 12,300 | FANUC Corp. (Capital Goods) | 2,288,410 | ||||||
| 101,400 | Hitachi High-Technologies Corp. (Technology Hardware & Equipment) | 2,098,337 | ||||||
| 368,000 | Isuzu Motors Ltd. (Automobiles & Components) | 2,196,012 | ||||||
| 50,600 | Jafco Co. Ltd. (Diversified Financials) | 1,497,820 | ||||||
| 93,500 | Komatsu Ltd. (Capital Goods) | 2,399,247 | ||||||
| 258,000 | Kubota Corp. (Capital Goods) | 2,966,328 | ||||||
| 132,200 | LIXIL Group Corp. (Capital Goods) | 2,948,791 | ||||||
| 162,000 | Mitsubishi Estate Co. Ltd. (Real Estate) | 3,878,394 | ||||||
| 106,500 | Seven & I Holdings Co. Ltd. (Food & Staples Retailing) | 3,002,317 | ||||||
| 116,100 | Sumitomo Mitsui Financial Group, Inc. (Banks) | 4,219,285 | ||||||
| 336,000 | Tokyo Gas Co. Ltd. (Utilities) | 1,535,203 | ||||||
| 86,200 | Toyota Motor Corp. (Automobiles & Components) | 4,025,208 | ||||||
| 62,400 | Unicharm Corp. (Household & Personal Products) | 3,242,590 | ||||||
|
| |||||||
| 38,797,807 | ||||||||
|
| |||||||
| Netherlands – 2.5% | |||||||
| 293 | Royal Dutch Shell PLC Class A (Energy) | 10,170 | ||||||
| 28,397 | Royal Dutch Shell PLC Class B (Energy) | 1,013,101 | ||||||
| 102,914 | Unilever NV CVA (Food, Beverage & Tobacco) | 3,937,859 | ||||||
|
| |||||||
| 4,961,130 | ||||||||
|
| |||||||
| Russia – 1.8% | |||||||
| 30,566 | OAO Lukoil ADR (Energy) | 2,052,229 | ||||||
| 122,482 | Sberbank of Russia ADR (Banks)(a) | 1,535,568 | ||||||
|
| |||||||
| 3,587,797 | ||||||||
|
| |||||||
| South Africa – 0.8% | |||||||
| 419,575 | Nampak Ltd. (Materials) | 1,581,454 | ||||||
|
| |||||||
| 10 | The accompanying notes are an integral part of these financial statements. |
GOLDMAN SACHS VARIABLE INSURANCE TRUST STRATEGIC INTERNATIONAL EQUITY FUND
| Shares | Description | Value | ||||||
| Common Stocks – (continued) | ||||||||
| South Korea – 1.7% | |||||||
| 29,170 | Kia Motors Corp. (Automobiles & Components) | $ | 1,551,074 | |||||
| 1,248 | Samsung Electronics Co. Ltd. (Semiconductors & Semiconductor Equipment) | 1,793,126 | ||||||
|
| |||||||
| 3,344,200 | ||||||||
|
| |||||||
| Sweden – 3.8% |
| ||||||
| 104,860 | Scania AB Class B (Capital Goods) | 2,180,185 | ||||||
| 514,245 | Telefonaktiebolaget LM Ericsson Class B (Technology Hardware & Equipment) | 5,194,517 | ||||||
|
| |||||||
| 7,374,702 | ||||||||
|
| |||||||
| Switzerland – 8.6% | |||||||
| 100,684 | Credit Suisse Group AG (Registered) (Diversified Financials)* | 2,457,331 | ||||||
| 138,282 | Novartis AG (Registered) (Pharmaceuticals, Biotechnology & Life Sciences) | 8,735,728 | ||||||
| 13,237 | Roche Holding AG (Pharmaceuticals, Biotechnology & Life Sciences) | 2,676,272 | ||||||
| 9,878 | Sulzer AG (Registered) (Capital Goods) | 1,563,383 | ||||||
| 31,464 | Wolseley PLC (Capital Goods) | 1,504,569 | ||||||
|
| |||||||
| 16,937,283 | ||||||||
|
| |||||||
| United Kingdom – 24.3% | |||||||
| 283,231 | Abcam PLC (Pharmaceuticals, Biotechnology & Life Sciences) | 1,772,514 | ||||||
| 179,398 | BG Group PLC (Energy) | 2,992,325 | ||||||
| 764,986 | BP PLC (Energy)(a) | 5,318,882 | ||||||
| 138,642 | Burberry Group PLC (Consumer Durables & Apparel) | 2,786,909 | ||||||
| 510,000 | Direct Line Insurance Group PLC (Insurance)* | 1,792,808 | ||||||
| 788,888 | HSBC Holdings PLC (Banks) | 8,359,667 | ||||||
| 53,459 | Imperial Tobacco Group PLC (Food, Beverage & Tobacco) | 2,072,690 | ||||||
| 164,750 | Inmarsat PLC (Telecommunication Services) | 1,588,027 | ||||||
| 421,376 | Melrose Industries PLC (Capital Goods) | 1,547,811 | ||||||
| 170,180 | Reed Elsevier PLC (Media) | 1,796,701 | ||||||
| 118,734 | Rio Tinto PLC (Materials) | 6,925,239 | ||||||
| 516,554 | Royal Bank of Scotland Group PLC (Banks)* | 2,760,947 | ||||||
| 53,716 | Schroders PLC (Diversified Financials) | 1,492,475 | ||||||
|
| |||||||
| Common Stocks – (continued) | ||||||||
| United Kingdom – (continued) | |||||||
| 55,895 | Spirax-Sarco Engineering PLC (Capital Goods) | $ | 2,092,906 | |||||
| 1,691,247 | Vodafone Group PLC (Telecommunication Services) | 4,257,318 | ||||||
|
| |||||||
| 47,557,219 | ||||||||
|
| |||||||
| TOTAL COMMON STOCKS | ||||||||
| (Cost $174,810,414) | $ | 190,807,535 | ||||||
|
| |||||||
| Preferred Stock – 0.5% | ||||||||
| Germany – 0.5% | |||||||
| 11,130 | Sartorius AG Preference Shares (Health Care Equipment & Services) | $ | 988,355 | |||||
| (Cost $970,343) | ||||||||
|
| |||||||
| Exchange Traded Fund – 1.0% | ||||||||
| Japan – 1.0% | |||||||
| 206,417 | iShares MSCI Japan Index Fund | $ | 2,012,566 | |||||
| (Cost $1,938,214) | ||||||||
|
| |||||||
| TOTAL INVESTMENTS – 98.8% | ||||||||
| (Cost $177,718,971) | $ | 193,808,456 | ||||||
|
| |||||||
| OTHER ASSETS IN EXCESS OF | 2,313,268 | ||||||
|
| |||||||
| NET ASSETS – 100.0% | $ | 196,121,724 | ||||||
|
| |||||||
| The percentage shown for each investment category reflects the value of investments in that category as a percentage of net assets. |
| * | Non-income producing security. | |
| (a) | All or a portion of security is segregated as collateral for initial margin requirements on futures transactions. |
| Investment Abbreviations: | ||||
| ADR | — | American Depositary Receipt | ||
| CVA | — | Dutch Certification | ||
| The accompanying notes are an integral part of these financial statements. | 11 |
GOLDMAN SACHS VARIABLE INSURANCE TRUST STRATEGIC INTERNATIONAL EQUITY FUND
Schedule of Investments (continued)
December 31, 2012
ADDITIONAL INVESTMENT INFORMATION
FUTURES CONTRACTS — At December 31, 2012, the Fund had the following futures contracts:
| Type | Number of Contracts Long (Short) | Expiration Date | Current Value | Unrealized Gain (Loss) | ||||||||||
| EURO STOXX 50 Index | 47 | March 2013 | $ | 1,622,285 | $ | (19,319 | ) | |||||||
| 12 | The accompanying notes are an integral part of these financial statements. |
GOLDMAN SACHS VARIABLE INSURANCE TRUST STRATEGIC INTERNATIONAL EQUITY FUND
Statement of Assets and Liabilities
December 31, 2012
| Assets: | ||||
Investments, at value (cost $177,718,971) | $ | 193,808,456 | ||
Cash | 2,282,485 | |||
Foreign currencies, at value (cost $83,303) | 83,436 | |||
Receivables: | ||||
Foreign tax reclaims | 168,867 | |||
Dividends | 163,375 | |||
Fund shares sold | 17,898 | |||
| Total assets | 196,524,517 | |||
| Liabilities: | ||||
Payables: | — | |||
Amounts owed to affiliates | 172,719 | |||
Fund shares redeemed | 147,367 | |||
Futures variation margin | 14 | |||
Accrued expenses | 82,693 | |||
| Total liabilities | 402,793 | |||
| Net Assets: | ||||
Paid-in capital | 306,145,473 | |||
Undistributed net investment income | 254,039 | |||
Accumulated net realized loss | (126,352,986 | ) | ||
Net unrealized gain | 16,075,198 | |||
| NET ASSETS | $ | 196,121,724 | ||
Net Assets: | ||||
Institutional | $ | 56,872,203 | ||
Service | 139,249,521 | |||
Total Net Assets | $ | 196,121,724 | ||
Shares of beneficial interest outstanding $0.001 par value (unlimited shares authorized): | ||||
Institutional | 6,647,219 | |||
Service | 16,248,657 | |||
Net asset value, offering and redemption price per share: | ||||
Institutional | $8.56 | |||
Service | 8.57 | |||
| The accompanying notes are an integral part of these financial statements. | 13 |
GOLDMAN SACHS VARIABLE INSURANCE TRUST STRATEGIC INTERNATIONAL EQUITY FUND
Statement of Operations
For the Fiscal Year Ended December 31, 2012
| Investment income: | ||||
Dividends (net of foreign taxes withheld of $369,479) | $ | 5,763,506 | ||
Interest | 1,386 | |||
| Total investment income | 5,764,892 | |||
| Expenses: | ||||
Management fees | 1,619,663 | |||
Distribution and Service fees — Service Class | 334,442 | |||
Custody and accounting fees | 125,779 | |||
Professional fees | 81,903 | |||
Printing and mailing costs | 80,055 | |||
Transfer Agent fees(a) | 38,106 | |||
Trustee fees | 15,223 | |||
Other | 10,892 | |||
| Total expenses | 2,306,063 | |||
Less — expense reductions | (120,149 | ) | ||
| Net expenses | 2,185,914 | |||
| NET INVESTMENT INCOME | 3,578,978 | |||
| Realized and unrealized gain: | ||||
Net realized gain from: | ||||
Investments | 5,803,580 | |||
Futures contracts | 829,662 | |||
Foreign currency transactions | 34,221 | |||
Net change in unrealized gain on: | ||||
Investments | 26,189,648 | |||
Futures contracts | 48,846 | |||
Foreign currency translation | 24,480 | |||
| Net realized and unrealized gain | 32,930,437 | |||
| NET INCREASE IN NET ASSETS RESULTING FROM OPERATIONS | $ | 36,509,415 | ||
(a) Institutional and Service Shares had Transfer Agent fees of $11,353 and $26,753, respectively.
| 14 | The accompanying notes are an integral part of these financial statements. |
GOLDMAN SACHS VARIABLE INSURANCE TRUST STRATEGIC INTERNATIONAL EQUITY FUND
Statements of Changes in Net Assets
For the Fiscal Year Ended | For the Fiscal Year Ended | |||||||
| From operations: | ||||||||
Net investment income | $ | 3,578,978 | $ | 6,208,000 | ||||
Net realized gain | 6,667,463 | 3,254,333 | ||||||
Net change in unrealized gain (loss) | 26,262,974 | (41,731,642 | ) | |||||
| Net increase (decrease) in net assets resulting from operations | 36,509,415 | (32,269,309 | ) | |||||
| Distributions to shareholders: | ||||||||
From net investment income | ||||||||
Institutional Shares | (1,162,337 | ) | (2,178,755 | ) | ||||
Service Shares | (2,511,176 | ) | (4,515,597 | ) | ||||
| Total distributions to shareholders | (3,673,513 | ) | (6,694,352 | ) | ||||
| From share transactions: | ||||||||
Proceeds from sales of shares | 6,049,759 | 8,234,940 | ||||||
Reinvestment of distributions | 3,673,513 | 6,694,352 | ||||||
Cost of shares redeemed | (28,382,757 | ) | (30,792,473 | ) | ||||
| Net decrease in net assets resulting from share transactions | (18,659,485 | ) | (15,863,181 | ) | ||||
| TOTAL INCREASE (DECREASE) | 14,176,417 | (54,826,842 | ) | |||||
| Net assets: | ||||||||
Beginning of year | 181,945,307 | 236,772,149 | ||||||
End of year | $ | 196,121,724 | $ | 181,945,307 | ||||
| Undistributed net investment income | $ | 254,039 | $ | 90,361 | ||||
| The accompanying notes are an integral part of these financial statements. | 15 |
GOLDMAN SACHS VARIABLE INSURANCE TRUST STRATEGIC INTERNATIONAL EQUITY FUND
Financial Highlights
Selected Data for a Share Outstanding Throughout Each Year
| Income (loss) from investment operations | Distributions to shareholders | |||||||||||||||||||||||||||||||||||||||||||||||||||||||
| Year - Share Class | Net asset value, beginning of year | Net investment income(a) | Net realized and unrealized | Total from investment operations | From net investment income | From net realized | Total distributions | Net asset value, end of year | Total return(b) | Net assets, (in 000s) | Ratio of net expenses to average net assets | Ratio of total expenses to average net assets | Ratio of to average net assets | Portfolio turnover rate(c) | ||||||||||||||||||||||||||||||||||||||||||
FOR THE FISCAL YEARS ENDED DECEMBER 31, | ||||||||||||||||||||||||||||||||||||||||||||||||||||||||
2012 - Institutional | $ | 7.20 | $ | 0.16 | $ | 1.38 | $ | 1.54 | $ | (0.18 | ) | $ | — | $ | (0.18 | ) | $ | 8.56 | 21.17 | % | $ | 56,872 | 0.97 | % | 1.03 | % | 2.06 | % | 110 | % | ||||||||||||||||||||||||||
2012 - Service | 7.22 | 0.14 | 1.37 | 1.51 | (0.16 | ) | — | (0.16 | ) | 8.57 | 20.82 | 139,250 | 1.22 | 1.28 | 1.80 | 110 | ||||||||||||||||||||||||||||||||||||||||
2011 - Institutional | 8.82 | 0.26 | (d) | (1.59 | ) | (1.33 | ) | (0.29 | ) | — | (0.29 | ) | 7.20 | (15.05 | ) | 55,954 | 0.99 | 1.04 | 3.03 | (d) | 143 | |||||||||||||||||||||||||||||||||||
2011 - Service | 8.83 | 0.24 | (d) | (1.58 | ) | (1.34 | ) | (0.27 | ) | — | (0.27 | ) | 7.22 | (15.16 | ) | 125,991 | 1.24 | 1.29 | 2.80 | (d) | 143 | |||||||||||||||||||||||||||||||||||
2010 - Institutional | 8.11 | 0.11 | 0.73 | 0.84 | (0.13 | ) | — | (0.13 | ) | 8.82 | 10.36 | 77,558 | 1.02 | 1.05 | 1.38 | 112 | ||||||||||||||||||||||||||||||||||||||||
2010 - Service | 8.12 | 0.09 | 0.73 | 0.82 | (0.11 | ) | — | (0.11 | ) | 8.83 | 10.09 | 159,214 | 1.27 | 1.30 | 1.13 | 112 | ||||||||||||||||||||||||||||||||||||||||
2009 - Institutional | 6.41 | 0.13 | 1.71 | 1.84 | (0.14 | ) | — | (0.14 | ) | 8.11 | 28.69 | 82,015 | 1.07 | 1.07 | 1.80 | 118 | ||||||||||||||||||||||||||||||||||||||||
2009 - Service | 6.42 | 0.11 | 1.71 | 1.82 | (0.12 | ) | — | (0.12 | ) | 8.12 | 28.37 | 157,359 | 1.32 | 1.32 | 1.51 | 118 | ||||||||||||||||||||||||||||||||||||||||
2008 - Institutional | 13.76 | 0.32 | (e) | (6.69 | ) | (6.37 | ) | (0.33 | ) | (0.65 | ) | (0.98 | ) | 6.41 | (45.87 | ) | 74,149 | 1.12 | 1.12 | 2.95 | (e) | 165 | ||||||||||||||||||||||||||||||||||
2008 - Service | 13.76 | 0.28 | (e) | (6.67 | ) | (6.39 | ) | (0.30 | ) | (0.65 | ) | (0.95 | ) | 6.42 | (46.00 | ) | 113,836 | 1.37 | 1.37 | 2.64 | (e) | 165 | ||||||||||||||||||||||||||||||||||
| (a) | Calculated based on the average shares outstanding methodology. |
| (b) | Assumes investment at the net asset value at the beginning of the year, reinvestment of all distributions, and a complete redemption of the investment at the net asset value at the end of the year. |
| (c) | The Fund's portfolio turnover rate is calculated in accordance with regulatory requirements, without regard to transactions involving short term investments and certain derivatives. If such transactions were included, the Fund's portfolio turnover rate may be higher. |
| (d) | Reflects income recognized from a corporate action which amounted to $0.11 per share and 1.33% of average net assets. |
| (e) | Reflects income recognized from non-recurring special dividends which amounted to $0.12 per share and 1.12% of average net assets. |
| The accompanying notes are an integral part of these financial statements. | 16 |
GOLDMAN SACHS VARIABLE INSURANCE TRUST STRATEGIC INTERNATIONAL EQUITY FUND
Notes to Financial Statements
December 31, 2012
1. ORGANIZATION
Goldman Sachs Variable Insurance Trust (the “Trust” or “VIT”) is a Delaware statutory trust registered under the Investment Company Act of 1940, as amended (the “Act”), as an open-end management investment company. The Trust includes the Goldman Sachs Strategic International Equity Fund (the “Fund”). The Fund is a diversified portfolio under the Act offering two classes of shares — Institutional Shares and Service Shares. Shares of the Trust are offered to separate accounts of participating life insurance companies for the purpose of funding variable annuity contracts and variable life insurance policies.
Goldman Sachs Asset Management International (“GSAMI”), an affiliate of Goldman, Sachs & Co. (“Goldman Sachs”), serves as investment adviser to the Fund pursuant to a management agreement (the “Agreement”) with the Trust.
2. SIGNIFICANT ACCOUNTING POLICIES
The financial statements have been prepared in accordance with accounting principles generally accepted in the United States of America (“GAAP”) and require management to make estimates and assumptions that may affect the reported amounts and disclosures. Actual results may differ from those estimates and assumptions.
A. Investment Valuation — The Fund’s valuation policy is to value investments at fair value.
B. Investment Income and Investments — Investment income includes interest income and dividend income, net of any foreign withholding taxes, less any amounts reclaimable. Interest income is accrued daily and adjusted for amortization of premiums and accretion of discounts. Dividend income is recognized on ex-dividend date or, for certain foreign securities, as soon as such information is obtained subsequent to the ex-dividend date. Investment transactions are reflected on trade date. Realized gains and losses are calculated using identified cost. Investment transactions are recorded on the following business day for daily net asset value (“NAV”) calculations. Any foreign capital gains tax is accrued daily based upon net unrealized gains, and is payable upon sale of such investments.
For derivative contracts, realized gains and losses are recorded upon settlement of the contract. Upfront payments on swaps are recognized over the contract’s term/event as realized gains or losses, with the exception of forward starting interest rate swaps whose realized gains or losses are recognized from the effective start date. For securities with paydown provisions, principal payments received are treated as a proportionate reduction to the cost basis of the securities and excess amounts are recorded as gains. For treasury inflation protected securities (“TIPS”), adjustments to principal due to inflation/deflation are reflected as increases/decreases to interest income with a corresponding adjustment to cost.
17
GOLDMAN SACHS VARIABLE INSURANCE TRUST STRATEGIC INTERNATIONAL EQUITY FUND
Notes to Financial Statements (continued)
December 31, 2012
2. SIGNIFICANT ACCOUNTING POLICIES (continued)
C. Class Allocations and Expenses — Investment income, realized and unrealized gain (loss), and non-class specific expenses of the Fund are allocated daily based upon the proportion of net assets of each class. Class specific expenses, where applicable, are borne by the respective share classes and include Distribution and Service and Transfer Agent fees. Non-class specific expenses directly incurred by a Fund are charged to that Fund, while such expenses incurred by the Trust are allocated across the respective Funds on a straight-line and/or pro-rata basis depending upon the nature of the expenses.
D. Federal Taxes and Distributions to Shareholders — It is the Fund’s policy to comply with the requirements of the Internal Revenue Code of 1986, as amended (the “Code”), applicable to regulated investment companies (mutual funds) and to distribute each year substantially all of its investment company taxable income and capital gains to its shareholders. Accordingly, the Fund is not required to make any provisions for the payment of federal income tax. Distributions to shareholders are recorded on the ex-dividend date. Income and capital gains distributions, if any, are declared and paid annually.
Net capital losses are carried forward to future fiscal years and may be used to the extent allowed by the Code to offset any future capital gains. Utilization of capital loss carryforwards will reduce the requirement of future capital gains distributions.
Under the Regulated Investment Company Modernization Act of 2010, the Fund is permitted to carryforward capital losses incurred in taxable years beginning after December 22, 2010 for an unlimited period. However, any losses incurred during those future taxable years will be required to be utilized prior to the losses incurred in pre-enactment taxable years. As a result of this ordering rule, pre-enactment capital loss carryforwards may be more likely to expire unused. Additionally, post-enactment capital losses that are carried forward will retain their character as either short-term or long term capital losses rather than being considered all short-term as under previous law.
The characterization of distributions to shareholders for financial reporting purposes is determined in accordance with federal income tax rules, which may differ from GAAP. The source of the Fund’s distributions may be shown in the accompanying financial statements as either from net investment income, net realized gain or capital. Certain components of the Fund’s net assets on the Statement of Assets and Liabilities reflect permanent GAAP/tax differences based on the appropriate tax character.
E. Foreign Currency Translation — The accounting records and reporting currency of the Fund are maintained in United States (“U.S.”) dollars. Assets and liabilities denominated in foreign currencies are translated into U.S. dollars using the current exchange rates at the close of each business day. The effect of changes in foreign currency exchange rates on investments is included within net realized and unrealized gain (loss) on investments. Changes in the value of other assets and liabilities as a result of fluctuations in foreign exchange rates are included in the Statement of Operations within net change in unrealized gain (loss) on foreign currency transactions. Transactions denominated in foreign currencies are translated into U.S. dollars on the date the transaction occurred, the effects of which are included within net realized gain (loss) on foreign currency transactions.
18
GOLDMAN SACHS VARIABLE INSURANCE TRUST STRATEGIC INTERNATIONAL EQUITY FUND
3. INVESTMENTS AND FAIR VALUE MEASUREMENTS
The fair value of a financial instrument is the amount that would be received to sell an asset or paid to transfer a liability in an orderly transaction between market participants at the measurement date (i.e., the exit price). GAAP establishes a fair value hierarchy that prioritizes the inputs to valuation techniques used to measure fair value. The hierarchy gives the highest priority to unadjusted quoted prices in active markets for identical assets or liabilities (Level 1 measurements) and the lowest priority to unobservable inputs (Level 3 measurements). The levels used for classifying investments are not necessarily an indication of the risk associated with investing in these investments. The three levels of the fair value hierarchy are described below:
Level 1 — Unadjusted quoted prices in active markets that are accessible at the measurement date for identical, unrestricted assets or liabilities;
Level 2 — Quoted prices in markets that are not active or financial instruments for which significant inputs are observable (including, but not limited to, quoted prices for similar investments, interest rates, foreign exchange rates, volatility and credit spreads), either directly or indirectly;
Level 3 — Prices or valuations that require significant unobservable inputs (including GSAMI’s assumptions in determining fair value measurement).
The Trustees have adopted Valuation Procedures that govern the valuation of the portfolio investments held by the Fund, including investments for which market quotations are not readily available. The Trustees have delegated to GSAMI day-to-day responsibility for implementing and maintaining internal controls and procedures related to the valuation of the Fund’s portfolio investment. To assess the continuing appropriateness of pricing sources and methodologies, GSAMI regularly performs price verification procedures and issues challenges as necessary to third party pricing vendors or brokers, and any differences are reviewed in accordance with the Valuation Procedures.
A. Level 1 and Level 2 Fair Value Investments — The valuation techniques and significant inputs used in determining the fair values for investments classified as Level 1 and Level 2 are as follows:
Equity Securities — Equity securities and investment companies traded on a U.S. securities exchange or the NASDAQ system, or those located on certain foreign exchanges, including but not limited to the Americas, are valued daily at their last sale price or official closing price on the principal exchange or system on which they are traded. If no sale occurs, equity securities and exchange traded investment companies are valued at the last bid price for long positions and at the last ask price for short positions. Investments in investment companies (other than those that are exchange traded) are valued at the NAV on the valuation date. To the extent these investments are actively traded, they are classified as Level 1 of the fair value hierarchy.
19
GOLDMAN SACHS VARIABLE INSURANCE TRUST STRATEGIC INTERNATIONAL EQUITY FUND
Notes to Financial Statements (continued)
December 31, 2012
3. INVESTMENTS AND FAIR VALUE MEASUREMENTS (continued)
Unlisted equity securities for which market quotations are available are valued at the last sale price on the valuation date, or if no sale occurs, at the last bid price. Securities traded on certain foreign securities exchanges are valued daily at fair value determined by an independent fair value service (if available) under valuation procedures approved by the trustees and consistent with applicable regulatory guidance. The independent fair value service takes into account multiple factors including, but not limited to, movements in the securities markets, certain depositary receipts, futures contracts and foreign currency exchange rates that have occurred subsequent to the close of the foreign securities exchange. Investments applying these valuation adjustments are classified as Level 2 of the fair value hierarchy.
Debt Securities — Debt securities for which market quotations are readily available are valued daily on the basis of quotations supplied by dealers or an independent pricing service approved by the trustees. The pricing services may use valuation models or matrix pricing, which consider: (i) yield or price with respect to bonds that are considered comparable in characteristics such as rating, interest rate and maturity date or (ii) quotations from securities dealers to determine current value. Short-term debt obligations that mature in sixty days or less and that do not exhibit signs of credit deterioration are valued at amortized cost, which approximates fair value. With the exception of treasury securities, which are generally classified as Level 1, these investments are generally classified as Level 2 of the fair value hierarchy.
Derivative contracts — A derivative is an instrument whose value is derived from underlying assets, indices, reference rates or a combination of these factors.
Exchange-traded derivatives, including futures contracts, typically fall within Level 1 of the fair value hierarchy. Over-the-counter (“OTC”) derivatives are valued using market transactions and other market evidence, including market-based inputs to models, calibration to market-clearing transactions, broker or dealer quotations, or other alternative pricing sources. Where models are used, the selection of a particular model to value an OTC derivative depends upon the contractual terms of, and specific risks inherent in, the instrument, as well as the availability of pricing information in the market. Valuation models require a variety of inputs, including contractual terms, market prices, yield curves, credit curves, measures of volatility, voluntary and involuntary prepayment rates, loss severity rates and correlations of such inputs. For OTC derivatives that trade in liquid markets, model inputs can generally be verified and model selection does not involve significant management judgment. OTC derivatives are classified within Level 2 of the fair value hierarchy when significant inputs are corroborated by market evidence.
i. Futures Contracts — Futures contracts are contracts to buy or sell a standardized quantity of a specified commodity or security and are valued based on exchanged settlement prices or independent market quotes. Futures contracts are valued at the last settlement price, or in the absence of a sale, the last bid price for long positions and at the last ask price for short positions, at the end of each day on the board of trade or exchange upon which they are traded. Upon entering into a futures contract, the Fund deposits cash or securities in an account on behalf of the broker in an amount sufficient to meet the initial margin requirement. Subsequent payments are made or received by the Fund equal to the daily change in the contract value and are recorded as variation margin receivable or payable with a corresponding offset to unrealized gains or losses.
20
GOLDMAN SACHS VARIABLE INSURANCE TRUST STRATEGIC INTERNATIONAL EQUITY FUND
3. INVESTMENTS AND FAIR VALUE MEASUREMENTS (continued)
B. Level 3 Fair Value Investments — The valuation techniques and significant inputs used in determining the fair values for investments classified as Level 3 are as follows:
To the extent that the aforementioned significant inputs are unobservable, or if quotations are not readily available, or if GSAMI believes that such quotations do not accurately reflect fair value, the fair value of the Fund’s investments may be determined under valuation procedures approved by the trustees. GSAMI, consistent with its procedures and applicable regulatory guidance, may make an adjustment to the most recent valuation prices of either domestic or foreign securities in light of significant events to reflect what it believes to be the fair value of the securities at the time of determining a Fund’s NAV. Significant events which could affect a large number of securities in a particular market may include, but are not limited to: significant fluctuations in U.S. or foreign markets; market dislocations; market disruptions; or unscheduled market closings. Significant events which could also affect a single issuer may include, but are not limited to: corporate actions such as reorganizations, mergers and buy-outs; ratings downgrades; and bankruptcies.
C. Fair Value Hierarchy — The following is a summary of the Fund’s investments and derivatives classified in the fair value hierarchy as of December 31, 2012:
| Investment Type | Level 1 | Level 2 | Level 3 | |||||||||
| Assets | ||||||||||||
| Common Stock and/or Other Equity Investments | ||||||||||||
North and South America | $ | — | $ | — | $ | — | ||||||
Other | 2,012,566 | 191,795,890 | (a) | — | ||||||||
| Derivative Type | ||||||||||||
| Liabilities(b) | ||||||||||||
| Futures Contracts | $ | (19,319 | ) | $ | — | $ | — | |||||
| (a) | To adjust for the time difference between local market close and the calculation of net asset value, the Fund utilizes fair value model prices for international equities provided by an independent fair value service resulting in a Level 2 classification. |
| (b) | Amount shown represents unrealized loss at fiscal year end. |
For further information regarding security characteristics, see the Schedule of Investments.
21
GOLDMAN SACHS VARIABLE INSURANCE TRUST STRATEGIC INTERNATIONAL EQUITY FUND
Notes to Financial Statements (continued)
December 31, 2012
4. INVESTMENTS IN DERIVATIVES
The following tables set forth, by certain risk types, the gross value of derivative contracts as of December 31, 2012. These instruments were used to meet the Fund’s investment objectives and to obtain and/or manage exposure related to the risks below. The value in the table below excludes the effects of cash collateral received or posted pursuant to these derivative contracts, and therefore are not representative of the Fund’s net exposure.
| Risk | Statement of Assets and Liabilities | Liabilities(a) | ||||
| Equity | Unrealized loss on futures variation margin | (19,319 | ) | |||
| (a) | Includes unrealized gain (loss) on futures contracts described in the Additional Investment Information section of the Schedule of Investments. Only current day’s variation margin is reported within the Statement of Assets and Liabilities. |
The following table sets forth, by certain risk types, the Fund’s gains (losses) related to these derivatives and their indicative volumes for the fiscal year ended December 31, 2012. These gains (losses) should be considered in the context that these derivative contracts may have been executed to economically hedge certain investments, and accordingly, certain gains (losses) on such derivative contracts may offset certain (losses) gains attributable to investments. These gains (losses) are included in “Net realized gain (loss)” or “Net change in unrealized gain (loss)” on the Statement of Operations:
| Risk | Statement of Operations | Net Realized Gain (Loss) | Net Change in Unrealized Gain (Loss) | Average Number of Contracts(a) | ||||||||||
| Equity | Net realized gain (loss) from futures contracts/Net change in unrealized gain (loss) on futures contracts | $ | 829,662 | $ | 48,846 | 41 | ||||||||
| (a) | Average number of contracts is based on the average of month end balances for the fiscal year ended December 31, 2012. |
5. AGREEMENTS AND AFFILIATED TRANSACTIONS
A. Management Agreement — Under the Agreement, GSAMI manages the Fund, subject to the general supervision of the trustees.
As compensation for the services rendered pursuant to the Agreement, the assumption of the expenses related thereto and administration of the Fund’s business affairs, including providing facilities, GSAMI is entitled to a management fee, accrued daily and paid monthly, equal to an annual percentage rate of the Fund’s average daily net assets.
For the fiscal year ended December 31, 2012, contractual and effective net management fees with GSAMI were at the following rates:
| Contractual Management Fee Rate | ||||||||||||||||||||||||||
| First $1 billion | Next $1 billion | Next $3 billion | Next $3 billion | Over $8 billion | Effective Rate | Effective Net Management Fee Rate | ||||||||||||||||||||
| 0.85% | 0.77 | % | 0.73 | % | 0.72 | % | 0.71 | % | 0.85 | % | 0.81 | %* | ||||||||||||||
| * | GSAMI agreed to waive a portion of its management fee in order to achieve the effective net management rate shown above through at least April 27, 2013. Prior to such date GSAMI may not terminate the arrangement without the approval of the trustees. For the fiscal year ended December 31, 2012, GSAMI waived approximately $76,200 of its management fee. |
22
GOLDMAN SACHS VARIABLE INSURANCE TRUST STRATEGIC INTERNATIONAL EQUITY FUND
5. AGREEMENTS AND AFFILIATED TRANSACTIONS (continued)
B. Distribution and Service Plan — The Trust, on behalf of the Service Shares of the Fund, has adopted a Distribution and Service Plan (the “Plan”). Under the Plan, Goldman Sachs, which serves as distributor (the “Distributor”), is entitled to a fee accrued daily and paid monthly for distribution services, which may then be paid by Goldman Sachs to authorized dealers, equal to, on an annual basis, 0.25% of the Fund’s average daily net assets attributable to Service Shares.
C. Transfer Agency Agreement — Goldman Sachs also serves as the transfer agent of the Fund for a fee pursuant to a Transfer Agency Agreement. The fees charged for such transfer agency services are accrued daily and paid monthly at an annual rate of 0.02% of the average daily net assets of Institutional and Service Shares.
D. Other Expense Agreements and Affiliated Transactions — GSAMI has agreed to limit certain “Other Expense” of the Fund (excluding management fees, distribution and service fees, acquired fund fees and expenses, transfer agent fees and expenses, taxes, interest, brokerage fees, litigation, indemnification, shareholder meeting and other extraordinary expenses) to the extent such expenses exceed, on an annual basis, a percentage rate of the average daily net assets of the Fund. Such Other Expense reimbursements, if any, are accrued daily and paid monthly. In addition, the Fund is not obligated to reimburse GSAMI for prior fiscal year expense reimbursements, if any. The Other Expense limitation as an annual percentage rate of average daily net assets for the Fund is 0.144%. These Other Expense reimbursements will remain in place through at least April 27, 2013, and prior to such date GSAMI may not terminate the arrangement without the approval of the trustees. For the fiscal year ended December 31, 2012, GSAMI reimbursed approximately $39,400 to the Fund. In addition, the Fund has entered into certain offset arrangements with the custodian and the transfer agent, which may result in a reduction of the Fund’s expenses and are received irrespective of the application of the “Other Expense” limitation described above. For the fiscal year ended December 31, 2012, custody fee credits were approximately $4,500.
As of December 31, 2012, the amounts owed to affiliates of the Fund were approximately $140,200, $29,200, and $3,300 for management, distribution and service, and transfer agent fees, respectively.
E. Line of Credit Facility — As of December 31, 2012, the Fund participated in a $630,000,000 committed, unsecured revolving line of credit facility (the “facility”) together with other funds of the Trust and registered investment companies having management agreements with GSAMI or its affiliates (“Other Borrowers”). Pursuant to the terms of the facility, the Fund and Other Borrowers could increase the credit amount by an additional $340,000,000, for a total of up to $970,000,000. This facility is to be used solely for temporary or emergency purposes, which may include the funding of redemptions. The interest rate on borrowings is based on the federal funds rate. The facility also requires a fee to be paid by the Fund based on the amount of the commitment that has not been utilized. For the fiscal year ended December 31, 2012, the Fund did not have any borrowings under the facility. Prior to May 8, 2012, the amount available through the facility was $580,000,000.
F. Other Transactions with Affiliates — For the fiscal year ended December 31, 2012, Goldman Sachs earned approximately $4,000 in brokerage commissions from portfolio transactions, including futures transactions executed with Goldman Sachs as the Futures Commission Merchant, on behalf of the Fund.
6. PORTFOLIO SECURITIES TRANSACTIONS
The cost of purchases and proceeds from sales and maturities of long-term securities for the fiscal year ended December 31, 2012, were $204,314,466 and $220,651,355, respectively.
23
GOLDMAN SACHS VARIABLE INSURANCE TRUST STRATEGIC INTERNATIONAL EQUITY FUND
Notes to Financial Statements (continued)
December 31, 2012
7. TAX INFORMATION
The tax character of distributions paid during the fiscal years ended December 31, 2011 and December 31, 2012 was as follows:
| 2011 | 2012 | |||||||
| Distributions paid from ordinary income | $ | 6,694,352 | $ | 3,673,513 | ||||
As of December 31, 2012, the components of accumulated earnings (losses) on a tax-basis were as follows:
| Undistributed ordinary income — net | $ | 489,609 | ||
| Capital loss carryforwards:(1) | ||||
Expiring 2016 | (57,900,490 | ) | ||
Expiring 2017 | (63,558,058 | ) | ||
Perpetual Long-term | (1,610,541 | ) | ||
Perpetual Short-term | (2,192,681 | ) | ||
| Total capital loss carryforwards | $ | (125,261,770 | ) | |
| Unrealized gains — net | 14,748,412 | |||
| Total accumulated losses — net | $ | (110,023,749 | ) |
| (1) | Expiration occurs on December 31 of the year indicated. |
As of December 31, 2012, the Fund’s aggregate security unrealized gains and losses based on cost for U.S. federal income tax purposes were as follows:
| Tax cost | $ | 179,045,757 | ||
| Gross unrealized gain | 20,096,621 | |||
| Gross unrealized loss | (5,333,922 | ) | ||
| Net unrealized security gain | $ | 14,762,699 | ||
| Net unrealized loss on other investments | (14,287 | ) | ||
| Net unrealized gain | $ | 14,748,412 |
24
GOLDMAN SACHS VARIABLE INSURANCE TRUST STRATEGIC INTERNATIONAL EQUITY FUND
7. TAX INFORMATION (continued)
The difference between GAAP-basis and tax-basis unrealized gains (losses) is attributable primarily to wash sales and differences in the tax treatment of passive foreign investment company investments.
In order to present certain components of the Fund’s capital accounts on a tax-basis, the Fund has reclassified $258,213 to undistributed net investment income from accumulated net realized gain (loss). These reclassifications have no impact on the net asset value of the Fund and result primarily from differences in the tax treatment of foreign currency transactions and passive foreign investment company investments.
GSAMI has reviewed the Fund’s tax positions for all open tax years (the current and prior three years, as applicable) and has concluded that no provision for income tax is required in the Fund’s financial statements. Such open tax years remain subject to examination and adjustment by tax authorities.
8. OTHER RISKS
The Fund’s risks include, but are not limited to, the following:
Foreign Custody Risk — A Fund that invests in foreign securities may hold such securities and foreign currency with foreign banks, agents, and securities depositories appointed by the Fund’s custodian (each a “Foreign Custodian”). In some countries, Foreign Custodians may be subject to little or no regulatory oversight or independent evaluation of their operations. Further, the laws of certain countries may place limitations on a Fund’s ability to recover its assets if a Foreign Custodian enters into bankruptcy. Investments in emerging markets may be subject to greater custody risks than investments in more developed markets. Custody services in emerging market countries are often undeveloped and may be less regulated than in more developed countries, and thus may not afford the same level of investor protection as would apply in developed countries.
Shareholder Concentration Risk — Certain participating insurance companies, accounts, or Goldman Sachs affiliates may from time to time own (beneficially or of record) or control a significant percentage of the Fund’s shares. Redemptions by these entities of their holdings in the Fund may impact the Fund’s liquidity and NAV. These redemptions may also force the Fund to sell securities.
25
GOLDMAN SACHS VARIABLE INSURANCE TRUST STRATEGIC INTERNATIONAL EQUITY FUND
Notes to Financial Statements (continued)
December 31, 2012
8. OTHER RISKS (continued)
Liquidity Risk —The Fund may make investments that are illiquid or that may become less liquid in response to market developments or adverse investor perceptions. Illiquid investments may be more difficult to value. Liquidity risk may also refer to the risk that a Fund will not be able to pay redemption proceeds within the allowable time period because of unusual market conditions, an unusually high volume of redemption requests, or other reasons. To meet redemption requests, the Fund may be forced to sell investments at an unfavorable time and/or under unfavorable conditions.
Market and Credit Risks — In the normal course of business, the Fund trades financial instruments and enters into financial transactions where risk of potential loss exists due to changes in the market (market risk). Additionally, the Fund may also be exposed to credit risk in the event that an issuer fails to perform or that an institution or entity with which the Fund has unsettled or open transactions defaults.
Investing in foreign markets may involve special risks and considerations not typically associated with investing in the U.S. These risks include revaluation of currencies, high rates of inflation, repatriation restrictions on income and capital, and adverse political and economic developments. Moreover, securities issued in these markets may be less liquid, be subject to government ownership controls, have delayed settlements and their prices may be more volatile than those of comparable securities in the U.S.
9. INDEMNIFICATIONS
Under the Trust’s organizational documents, its trustees, officers, employees and agents are indemnified, to the extent permitted by the Act, against certain liabilities that may arise out of performance of their duties to the Fund. Additionally, in the course of business, the Fund enters into contracts that contain a variety of indemnification clauses. The Fund’s maximum exposure under these arrangements is unknown, as this would involve future claims that may be made against the Fund that have not yet occurred. However, GSAMI believes the risk of loss under these arrangements to be remote.
10. OTHER MATTERS
New Accounting Pronouncement — In December 2011, the Financial Accounting Standards Board issued an Accounting Standards Update (“ASU”) to enhance disclosures about financial instruments and derivative instruments that are subject to offsetting (“netting”) on the Statement of Assets and Liabilities. This information will enable users of the Fund’s financial statements to evaluate the effect or potential effect of netting arrangements on the Fund’s financial position. The ASU is effective for financial statements with fiscal years beginning on or after January 1, 2013, and interim periods within those fiscal years. At this time, GSAM is evaluating the implications of these changes on the financial statements.
11. SUBSEQUENT EVENTS
Subsequent events after the Statement of Assets and Liabilities date have been evaluated through the date the financial statements were issued. GSAMI has concluded that there is no impact requiring adjustment or disclosure in the financial statements.
26
GOLDMAN SACHS VARIABLE INSURANCE TRUST STRATEGIC INTERNATIONAL EQUITY FUND
12. SUMMARY OF SHARE TRANSACTIONS
Share activity is as follows:
| For the Fiscal Year Ended December 31, 2012 | For the Fiscal Year Ended December 31, 2011 | |||||||||||||||
| Shares | Dollars | Shares | Dollars | |||||||||||||
| Institutional Shares | ||||||||||||||||
| Shares sold | 73,062 | $ | 567,927 | 125,795 | $ | 1,027,362 | ||||||||||
| Reinvestment of distributions | 137,392 | 1,162,337 | 305,576 | 2,178,755 | ||||||||||||
| Shares redeemed | (1,330,769 | ) | (10,618,859 | ) | (1,456,936 | ) | (12,601,962 | ) | ||||||||
| (1,120,315 | ) | (8,888,595 | ) | (1,025,565 | ) | (9,395,845 | ) | |||||||||
| Service Shares | ||||||||||||||||
| Shares sold | 701,586 | 5,481,832 | 906,394 | 7,207,578 | ||||||||||||
| Reinvestment of distributions | 296,479 | 2,511,176 | 632,436 | 4,515,597 | ||||||||||||
| Shares redeemed | (2,209,838 | ) | (17,763,898 | ) | (2,107,462 | ) | (18,190,511 | ) | ||||||||
| (1,211,773 | ) | (9,770,890 | ) | (568,632 | ) | (6,467,336 | ) | |||||||||
| NET DECREASE | (2,332,088 | ) | $ | (18,659,485 | ) | (1,594,197 | ) | $ | (15,863,181 | ) | ||||||
27
Report of Independent Registered Public Accounting Firm
To the Board of Trustees and Shareholders of
Goldman Sachs Variable Insurance Trust — Goldman Sachs Strategic International Equity Fund:
In our opinion, the accompanying statement of assets and liabilities, including the schedule of investments, and the related statements of operations and of changes in net assets and the financial highlights present fairly, in all material respects, the financial position of Goldman Sachs Strategic International Equity Fund (the “Fund”) at December 31, 2012, the results of its operations, the changes in its net assets and the financial highlights for each of the periods indicated, in conformity with accounting principles generally accepted in the United States of America. These financial statements and financial highlights (hereafter referred to as “financial statements”) are the responsibility of the Fund’s management. Our responsibility is to express an opinion on these financial statements based on our audit. We conducted our audit of these financial statements in accordance with the standards of the Public Company Accounting Oversight Board (United States). Those standards require that we plan and perform the audit to obtain reasonable assurance about whether the financial statements are free of material misstatement. An audit includes examining, on a test basis, evidence supporting the amounts and disclosures in the financial statements, assessing the accounting principles used and significant estimates made by management, and evaluating the overall financial statement presentation. We believe that our audit, which included confirmation of securities at December 31, 2012 by correspondence with the custodian and brokers, provide a reasonable basis for our opinion.
PricewaterhouseCoopers LLP
Boston, Massachusetts
February 14, 2013
28
GOLDMAN SACHS VARIABLE INSURANCE TRUST STRATEGIC INTERNATIONAL EQUITY FUND
| Fund Expenses — Six Month Period Ended December 31, 2012 (Unaudited) |
As a shareholder of Institutional or Service Shares of the Fund, you incur ongoing costs, including management fees, distribution and service (12b-1) fees (with respect to Service Shares) and other Fund expenses. This example is intended to help you understand your ongoing costs (in dollars) of investing in the Institutional Shares and Service Shares of the Fund and to compare these costs with the ongoing costs of investing in other mutual funds.
The example is based on an investment of $1,000 invested at the beginning of the period and held for the entire period from July 1, 2012 through December 31, 2012.
Actual Expenses — The first line under each share class in the table below provides information about actual account values and actual expenses. You may use the information in this line, together with the amount you invested, to estimate the expenses that you paid over the period. Simply divide your account value by $1,000 (for example, an $8,600 account value divided by $1,000=8.6), then multiply the result by the number in the first line under the heading entitled “Expenses Paid” to estimate the expenses you paid on your account during this period.
Hypothetical Example for Comparison Purposes — The second line under each share class in the table below provides information about hypothetical account values and hypothetical expenses based on the Fund's actual net expense ratio and an assumed rate of return of 5% per year before expenses, which is not the Fund's actual return. The hypothetical account values and expenses may not be used to estimate the actual ending account balance or expenses you paid for the period. You may use this information to compare the ongoing costs of investing in the Funds and other funds. To do so, compare this 5% hypothetical example with the 5% hypothetical examples that appear in the shareholder reports of the other funds.
Please note that the expenses shown in the table are meant to highlight your ongoing costs only. As a shareholder of the Fund you do not incur any transaction costs, such as sales charges, redemption fees, or exchange fees, but shareholders of other funds may incur such costs. The second line of the table is useful in comparing ongoing costs only, and will not help you determine the relative total costs of owning different funds whose shareholders may incur transaction costs.
| Share Class | Beginning Account Value 7/01/12 | Ending Account Value 12/31/12 | Expenses Paid for the 6 Months Ended 12/31/12* | |||||||||
| Institutional | ||||||||||||
| Actual | $ | 1,000 | $ | 1,126.30 | $ | 5.18 | ||||||
| Hypothetical 5% return | 1,000 | 1,020.26 | + | 4.93 | ||||||||
| Service | ||||||||||||
| Actual | 1,000 | 1,126.20 | 6.52 | |||||||||
| Hypothetical 5% return | 1,000 | 1,019.00 | + | 6.19 | ||||||||
| * | Expenses are calculated using the Fund’s annualized net expense ratio for each class, which represents the ongoing expenses as a percentage of net assets for the six months ended December 31, 2012. Expenses are calculated by multiplying the annualized net expense ratio by the average account value for the period; then multiplying the result by the number of days in the most recent fiscal half year; and then dividing that result by the number of days in the fiscal year. The annualized net expense ratios for the period were 0.97% and 1.22% for Institutional and Service Shares, respectively. |
| + | Hypothetical expenses are based on the Fund’s actual annualized net expense ratios and an assumed rate of return of 5% per year before expenses. |
29
GOLDMAN SACHS VARIABLE INSURANCE TRUST STRATEGIC INTERNATIONAL EQUITY FUND
Trustees and Officers (Unaudited)
Independent Trustees
| Name, Address and Age1 | Position(s) Held with the Trust | Term of Office and Length of Time Served2 | Principal Occupation(s) During Past 5 Years | Number of Portfolios in Fund Complex Overseen by Trustee3 | Other Directorships Held by Trustee4 | |||||||
Ashok N. Bakhru Age: 70 | Chairman of the Board of Trustees | Since 1996 (Trustee since 1991) | Mr. Bakhru is retired. He is President, ABN Associates (1994-1996 and 1998-Present); Director, Apollo Investment Corporation (a business development company) (2008-Present); Member of Cornell University Council (1992-2004 and 2006-Present); and was formerly Trustee, Scholarship America (1998-2005); Trustee, Institute for Higher Education Policy (2003-2008); Director, Private Equity Investors — III and IV (1998-2007), and Equity-Linked Investors II (April 2002-2007).
Chairman of the Board of Trustees — Goldman Sachs Mutual Fund Complex. | 111 | Apollo Investment Corporation (a business development company) | |||||||
Donald C. Burke Age: 52 | Trustee | Since 2010 | Mr. Burke is retired. He is Director, Avista Corp. (2011-Present); and was formerly a Director, BlackRock Luxembourg and Cayman Funds (2006-2010); President and Chief Executive Officer, BlackRock U.S. Funds (2007-2009); Managing Director, BlackRock, Inc. (2006-2009); Managing Director, Merrill Lynch Investment Managers, L.P. (“MLIM”) (2006); First Vice President, MLIM (1997-2005); Chief Financial Officer and Treasurer, MLIM U.S. Funds (1999-2006).
Trustee — Goldman Sachs Mutual Fund Complex. | 110 | Avista Corp. (an energy company) | |||||||
John P. Coblentz, Jr. Age: 71 | Trustee | Since 2003 | Mr. Coblentz is retired. Formerly, he was Partner, Deloitte & Touche LLP (1975-2003); Director, Emerging Markets Group, Ltd. (2004-2006); and Director, Elderhostel, Inc. (2006-2012).
Trustee — Goldman Sachs Mutual Fund Complex. | 111 | None | |||||||
Diana M. Daniels Age: 63 | Trustee | Since 2007 | Ms. Daniels is retired. Formerly, she was Vice President, General Counsel and Secretary, The Washington Post Company (1991-2006). Ms. Daniels is a Vice Chairman of the Board of Trustees, Cornell University (2009-Present); Member, Advisory Board, Psychology Without Borders (international humanitarian aid organization) (2007-Present), and former Member of the Legal Advisory Board, New York Stock Exchange (2003-2006) and of the Corporate Advisory Board, Standish Mellon Management Advisors (2006-2007).
Trustee — Goldman Sachs Mutual Fund Complex. | 110 | None | |||||||
Joseph P. LoRusso Age: 55 | Trustee | Since 2010 | Mr. LoRusso is retired. Formerly, he was President, Fidelity Investments Institutional Services Co. (“FIIS”) (2002-2008); Director, FIIS (2002-2008); Director, Fidelity Investments Institutional Operations Company (2003-2007); Executive Officer, Fidelity Distributors Corporation (2007-2008).
Trustee — Goldman Sachs Mutual Fund Complex. | 110 | None | |||||||
Jessica Palmer Age: 63 | Trustee | Since 2007 | Ms. Palmer is retired. She is Director, Emerson Center for the Arts and Culture (2011-Present); and was formerly a Consultant, Citigroup Human Resources Department (2007-2008); Managing Director, Citigroup Corporate and Investment Banking (previously, Salomon Smith Barney/Salomon Brothers) (1984-2006). Ms. Palmer was a Member of the Board of Trustees of Indian Mountain School (private elementary and secondary school) (2004-2009).
Trustee — Goldman Sachs Mutual Fund Complex. | 110 | None | |||||||
Richard P. Strubel Age: 73 | Trustee | Since 1987 | Mr. Strubel is retired. Formerly, he was Director, Cardean Learning Group (provider of educational services via the internet) (2003-2008); Trustee, Emeritus, The University of Chicago (1987-Present).
Trustee — Goldman Sachs Mutual Fund Complex. | 111 | The Northern Trust Mutual Fund Complex (64 Portfolios) (Chairman of the Board of Trustees); Gildan Activewear Inc. (a clothing marketing and manufacturing company). | |||||||
30
GOLDMAN SACHS VARIABLE INSURANCE TRUST STRATEGIC INTERNATIONAL EQUITY FUND
Trustees and Officers (Unaudited) (continued)
Interested Trustees
Name, | Position(s) Held with the Trust | Term of Office and Length of Time Served2 | Principal Occupation(s) During Past 5 Years | Number of Portfolios in Fund Complex Overseen by Trustee3 | Other Directorships Held by Trustee4 | |||||||
James A. McNamara* Age: 50 | President and Trustee | Since 2007 | Managing Director, Goldman Sachs (December 1998-Present); Director of Institutional Fund Sales, GSAM (April 1998-December 2000); and Senior Vice President and Manager, Dreyfus Institutional Service Corporation (January 1993- April 1998).
President — Goldman Sachs Mutual Fund Complex (November 2007-Present); Senior Vice President — Goldman Sachs Mutual Fund Complex (May 2007-November 2007); and Vice President — Goldman Sachs Mutual Fund Complex (2001-2007).
Trustee — Goldman Sachs Mutual Fund Complex (since November 2007 and December 2002-May 2004). | 111 | None | |||||||
Alan A. Shuch* Age: 63 | Trustee | Since 1990 | Advisory Director — GSAM (May 1999-Present); Consultant to GSAM (December 1994-May 1999); and Limited Partner, Goldman Sachs (December 1994-May 1999).
Trustee — Goldman Sachs Mutual Fund Complex. | 110 | None | |||||||
| * | These persons are considered to be “Interested Trustees” because they hold positions with Goldman Sachs and own securities issued by The Goldman Sachs Group, Inc. Each Interested Trustee holds comparable positions with certain other companies of which Goldman Sachs, GSAM or an affiliate thereof is the investment adviser, administrator and/or distributor. |
| 1 | Each Trustee may be contacted by writing to the Trustee, c/o Goldman Sachs, 200 West Street, New York, New York, 10282, Attn: Caroline Kraus. Information is provided as of December 31, 2012. |
| 2 | Each Trustee holds office for an indefinite term until the earliest of: (a) the election of his or her successor; (b) the date the Trustee resigns or is removed by the Board of Trustees or shareholders, in accordance with the Trust’s Declaration of Trust; (c) the conclusion of the first Board meeting held subsequent to the day the Trustee attains the age of 74 years (in accordance with the current resolutions of the Board of Trustees, which may be changed by the Trustees without shareholder vote); or (d) the termination of the Trust. |
| 3 | The Goldman Sachs Mutual Fund Complex consists of the Trust, Goldman Sachs Trust II, Goldman Sachs Municipal Opportunity Fund, Goldman Sachs Credit Strategies Fund, and Goldman Sachs Trust. As of December 31, 2012, the Trust consisted of 12 portfolios. Goldman Sachs Trust II consisted of 1 portfolio (which did not offer shares to the public); Goldman Sachs Municipal Opportunity Fund did not offer shares to the public; and Goldman Sachs Trust consisted of 96 portfolios (80 of which offered shares to the public). |
| 4 | This column includes only directorships of companies required to report to the Securities and Exchange Commission under the Securities Exchange Act of 1934 (i.e., “public companies”) or other investment companies registered under the Act. |
Additional information about the Trustees is available in the Fund’s Statement of Additional Information, which can be obtained from Goldman Sachs free of charge by calling this toll-free number (in the United States of America): 1-800-292-4726.
31
GOLDMAN SACHS VARIABLE INSURANCE TRUST STRATEGIC INTERNATIONAL EQUITY FUND
Trustees and Officers (Unaudited) (continued)
Officers of the Trust*
| Name, Address and Age | Position(s) Held With the Trust | Term of Office and Length of Time Served1 | Principal Occupation(s) During Past 5 Years | |||
| James A. McNamara 200 West Street New York, NY 10282 Age: 50 | President and Trustee | Since 2007 | Managing Director, Goldman Sachs (December 1998-Present); Director of Institutional Fund Sales, GSAM (April 1998-December 2000); and Senior Vice President and Manager, Dreyfus Institutional Service Corporation (January 1993-April 1998). President — Goldman Sachs Mutual Fund Complex (November 2007-Present); Senior Vice President — Goldman Sachs Mutual Fund Complex (May 2007-November 2007); and Vice President — Goldman Sachs Mutual Fund Complex (2001-2007). Trustee — Goldman Sachs Mutual Fund Complex (November 2007-Present and December 2002-May 2004). | |||
| George F. Travers 30 Hudson Street Jersey City, NJ 07302 | Senior Vice President and Principal Financial Officer | Since 2009 | Managing Director, Goldman Sachs (2007-Present); Managing Director, UBS Ag (2005-2007); and Partner, Deloitte & Touche LLP (1990-2005, partner from 2000-2005). Senior Vice President and Principal Financial Officer — Goldman Sachs Mutual Fund Complex. | |||
| Caroline Kraus 200 West Street New York, NY 10282 | Secretary | Since 2012 | Vice President, Goldman Sachs (August 2006-Present); Associate General Counsel, Goldman Sachs (2012-Present); Assistant General Counsel, Goldman Sachs (August 2006-December 2011) and Associate, Weil, Gotshal & Manges-LLP (2002-2006). Secretary — Goldman Sachs Mutual Fund Complex (August 2012-Present) and Assistant Secretary — Goldman Sachs Mutual Fund Complex (June 2012-August 2012). | |||
| Scott M. McHugh 200 West Street New York, NY 10282 | Treasurer and Senior Vice President | Since 2009 | Vice President, Goldman Sachs (February 2007-Present); Assistant Treasurer of certain mutual funds administered by DWS Scudder (2005-2007); and Director (2005-2007), Vice President (2000-2005) and Assistant Vice President (1998-2000), Deutsche Asset Management or its predecessor (1998-2007). Treasurer — Goldman Sachs Mutual Fund Complex (October 2009-Present); Senior Vice President — Goldman Sachs Mutual Fund Complex (November 2009-Present); and Assistant Treasurer — Goldman Sachs Mutual Fund Complex (May 2007-October 2009). | |||
| 1 | Officers hold office at the pleasure of the Board of Trustees or until their successors are duly elected and qualified. Each officer holds comparable positions with certain other companies of which Goldman Sachs, GSAM or an affiliate thereof is the investment adviser, administrator and/or distributor. Information is provided as of December 31, 2012. |
| * | Represents a partial list of officers of the Trust. Additional information about all the officers is available in the Fund’s Statement of Additional Information, which can be obtained from Goldman Sachs free of charge by calling this toll-free number (in the United States): 1-800-292-4726. |
Goldman Sachs Variable Insurance Trust — Tax Information (Unaudited)
For the 2012 tax year, the Strategic International Equity Fund has elected to pass through a credit for taxes paid to foreign jurisdictions. The total amount of income received by the Strategic International Equity Fund from sources within foreign countries and possessions of the United States was $0.1667 per share, all of which is attributable to qualified passive income. The percentage of net investment income dividends paid by the Fund during the year ended December 31, 2012 from foreign sources was 96.64%. The total amount of foreign taxes paid by the Fund was $0.0161 per share.
32
| TRUSTEES | OFFICERS | |
| Ashok N. Bakhru, Chairman | James A. McNamara, President | |
| Donald C. Burke | George F. Travers, Principal Financial Officer | |
| John P. Coblentz, Jr. | Caroline L. Kraus, Secretary | |
| Diana M. Daniels | Scott M. McHugh, Treasurer | |
| Joseph P. LoRusso | ||
| James A. McNamara | ||
| Jessica Palmer | ||
| Alan A. Shuch | ||
| Richard P. Strubel |
GOLDMAN, SACHS & CO.
Distributor and Transfer Agent
GOLDMAN SACHS ASSET MANAGEMENT, L.P.
Investment Adviser
200 West Street, New York, New York 10282
GOLDMAN SACHS ASSET MANAGEMENT INTERNATIONAL
Investment Adviser
Christchurch Court, 10-15 Newgate Street London, EC1A 7HD, England, United Kingdom
Visit our website at www.goldmansachsfunds.com/vit to obtain the most recent month-end returns.
The reports concerning the Fund included in this shareholder report may contain certain forward-looking statements about the factors that may affect the performance of the Fund in the future. These statements are based on Fund management’s predictions and expectations concerning certain future events and their expected impact on the Fund, such as performance of the economy as a whole and of specific industry sectors, changes in the levels of interest rates, the impact of developing world events, and other factors that may influence the future performance of the Fund. Management believes these forward-looking statements to be reasonable, although they are inherently uncertain and difficult to predict. Actual events may cause adjustments in portfolio management strategies from those currently expected to be employed.
A description of the policies and procedures that the Fund uses to determine how to vote proxies relating to portfolio securities and information regarding how the Fund voted proxies relating to portfolio securities during the most recent 12-month period ended December 31 is available (i) without charge, upon request by calling 1-800-621-2550; and (ii) on the Securities and Exchange Commission (“SEC”) website at http://www.sec.gov.
The Fund files its complete schedule of portfolio holdings with the SEC for the first and third quarters of each fiscal year on Form N-Q. The Fund’s Form N-Q is available on the SEC’s website at http://www.sec.gov within 60 days after the Fund’s first and third fiscal quarters. The Fund’s Forms N-Q may be reviewed and copied at the SEC’s Public Reference Room in Washington, D.C. and information on the operation of the Public Reference Room may also be obtained by calling 1-800-SEC-0330. Forms N-Q may be obtained upon request and without charge by calling 1-800-621-2550.
Economic and market forecasts presented herein reflect our judgment as of the date of this presentation and are subject to change without notice. These forecasts do not take into account the specific investment objectives, restrictions, tax and financial situation or other needs of any specific client. Actual data will vary and may not be reflected here. These forecasts are subject to high levels of uncertainty that may affect actual performance. Accordingly, these forecasts should be viewed as merely representative of a broad range of possible outcomes. These forecasts are estimated, based on assumptions, and are subject to significant revision and may change materially as economic and market conditions change. Goldman Sachs has no obligation to provide updates or changes to these forecasts. Case studies and examples are for illustrative purposes only.
Holdings and allocations shown are as of December 31, 2012 and may not be representative of future investments. Fund holdings should not be relied on in making investment decisions and should not be construed as research or investment advice regarding particular securities.
The Global Industry Classification Standard (“GICS”) was developed by and is the exclusive property and a service mark of Morgan Stanley Capital International Inc. (“MSCI”) and Standard & Poor’s, a division of The McGraw-Hill Companies, Inc. (“S&P”) and is licensed for use by Goldman Sachs. Neither MSCI, S&P nor any other party involved in making or compiling the GICS or any GICS classifications makes any express or implied warranties or representations with respect to such standard or classification (or the results to be obtained by the use thereof), and all such parties hereby expressly disclaim all warranties of originality, accuracy, completeness, merchantability or fitness for a particular purpose with respect to any of such standard or classification. Without limiting any of the foregoing, in no event shall MSCI, S&P, any of their affiliates or any third party involved in making or compiling the GICS or any GICS classifications have any liability for any direct, indirect, special, punitive, consequential or any other damages (including lost profits) even if notified of the possibility of such damages.
The portfolio risk management process includes an effort to monitor and manage risk, but does not imply low risk.
Shares of the Goldman Sachs VIT Funds are offered to separate accounts of participating life insurance companies for the purpose of funding variable annuity contracts and variable life insurance policies. Shares of the Fund are not offered directly to the general public. The variable annuity contracts and variable life insurance policies are described in the separate prospectuses issued by participating insurance companies. You should refer to those prospectuses for information about surrender charges, mortality and expense risk fees and other charges that may be assessed by participating insurance companies under the variable annuity contracts or variable life insurance policies. Such fees or charges, if any, may affect the return you may realize with respect to your investments. Ask your representative for more complete information. Please consider a fund’s objectives, risks and charges and expenses, and read the prospectus carefully before investing. The prospectus contains this and other information about the Fund.
This material is not authorized for distribution to prospective investors unless preceded or accompanied by a current Prospectus or summary prospectus, if applicable. Investors should consider a Fund’s objective, risks, and charges and expenses, and read the summary prospectus, if available, and/or the Prospectus carefully before investing or sending money. The summary prospectus, if available, and the Prospectus contain this and other information about a Fund and may be obtained from your Authorized Institution or from Goldman, Sachs & Co. by calling 1-800-621-2550.
Toll Free (in U.S.): 800-292-4726
This report is prepared for the general information of contract owners and is not an offer of shares of the Goldman Sachs Variable Insurance Trust: Goldman Sachs Strategic International Equity Fund.
© 2013 Goldman Sachs. All rights reserved.
VITINTLAR13/92381.MF.MED.TMPL/2/2013
Goldman
Sachs Variable Insurance Trust
Goldman Sachs
Structured Small Cap Equity Fund
Annual Report
December 31, 2012

GOLDMAN SACHS VARIABLE INSURANCE TRUST STRUCTURED SMALL CAP EQUITY FUND
Principal Investment Strategies and Risks
This is not a complete list of risks that may affect the Fund. For additional information concerning the risks applicable to the Fund, please see the Fund’s Prospectus.
Shares of the Goldman Sachs Variable Insurance Trust — Goldman Sachs Structured Small Cap Equity Fund are offered to separate accounts of participating life insurance companies for the purpose of funding variable annuity contracts and variable life insurance policies. Shares of the Fund are not offered directly to the general public. The variable annuity contracts and variable life insurance policies are described in the separate prospectuses issued by participating insurance companies. You should refer to those prospectuses for information about surrender charges, mortality and expense risk fees and other charges that may be assessed by participating insurance companies under the variable annuity contracts or variable life insurance policies. Such fees or charges, if any, may affect the return you realize with respect to your investments. Ask your representative for more complete information. Please consider the Fund’s objective, risks and charges and expenses, and read the Prospectus carefully before investing. The Prospectus contains this and other information about the Fund.
The Goldman Sachs Structured Small Cap Equity Fund invests primarily in a broadly diversified portfolio of equity investments in small-capitalization U.S. issuers, including foreign issuers traded in the United States. The Fund’s equity investments will be subject to market risk, which means that the value of the securities in which it invests may go up or down in response to the prospects of individual companies, particular sectors and/or general economic conditions. The securities of small- and mid-capitalization companies involve greater risks than those associated with larger, more established companies and may be subject to more abrupt or erratic price movements. The Investment Adviser’s use of quantitative models to execute investment strategy may fail to produce the intended result. Different investment styles (e.g., “quantitative”) tend to shift in and out of favor, and at times the Fund may underperform other funds that invest in similar asset classes. The Fund may have a high rate of portfolio turnover, which involves correspondingly greater expenses which must be borne by the Fund, and is also likely to result in short-term capital gains taxable to shareholders.
1
GOLDMAN SACHS VARIABLE INSURANCE TRUST STRUCTURED SMALL CAP EQUITY FUND
INVESTMENT OBJECTIVE
The Fund seeks long-term growth of capital.
Portfolio Management Discussion and Analysis
Below, the Goldman Sachs Quantitative Investment Strategies Team discusses the Goldman Sachs Variable Insurance Trust — Goldman Sachs Structured Small Cap Equity Fund’s (the “Fund”) performance and positioning for the 12-month period ended December 31, 2012 (the “Reporting Period”).
How did the Fund perform during the Reporting Period?
During the Reporting Period, the Fund’s Institutional and Service Shares generated average annual total returns of 12.79% and 12.47%, respectively. These returns compare to the 16.30% average annual total return of the Fund’s benchmark, the Russell 2000® Index* (with dividends reinvested) (the “Russell Index”) during the same time period.
What economic and market factors most influenced the equity markets as a whole during the annual period?
Representing the U.S. equity market, the S&P® 500 Index gained 15.96% during the Reporting Period to mark the fourth straight year of gains. The year 2012 started with the strongest first quarter since 1998 for the S&P® 500 Index. Also during the first quarter of 2012, the Dow Jones Industrial Average closed above 13,000 for the first time since May 2008, and the NASDAQ reached a new 11-year high. U.S. equities rose largely on evidence that the labor and manufacturing markets were improving. In addition, the Federal Reserve (the “Fed”) reaffirmed its commitment to low interest rates until at least late-2014.
U.S. equity markets slid, however, during the second quarter of 2012, when first quarter Gross Domestic Product (“GDP”) was revised down from 2.2% to 1.9% and employment reports suggested deterioration in the labor market. Spain’s banking system bailout and increasing concerns over Europe’s financial crisis weighed on global equity markets, including the U.S. equity market, as well. At the same time, disappointing economic reports from faster growing regions of the world renewed fears of a global economic slowdown.
During the summer of 2012, U.S. equity markets rallied back on more strong statements from central banks. In September, the Fed announced another round of quantitative easing, dubbed QE3, this time with no expiration date but with the explicit goal of reducing unemployment. The Fed also extended its policy of near-zero interest rates until at least mid-2015. In Europe, the European Central Bank (“ECB”) president Mario Draghi voiced strong support for the euro and the European Monetary Union, which was well received by financial markets in the U.S. Continued improvements in home prices and the Fed’s commitment to buy mortgage-backed securities increased hopes of a recovery in the housing market, which helped offset the downward pressures of lackluster economic growth and a stalled labor market.
There were increasing signs of economic recovery seen early in the fourth quarter of 2012. The U.S. reported better than expected third quarter GDP growth of 2%, the 13th consecutive quarter of economic expansion, and the unemployment rate dropped to 7.8%, the lowest rate seen since January 2009. U.S. manufacturing activity increased, and the housing market showed further signs of improvement, as construction of new homes hit a four-year high. Despite this positive data, the U.S. equity market pulled back in October on some cautious corporate earnings guidance. Also pressuring the U.S. equity market were the worst storm in decades battering the East Coast and polls showing the U.S. presidential race tightening to a dead heat.
The U.S. equity market crept higher in November 2012, as election day preserved the status quo in the White House and Congress, even as the “fiscal cliff” drew nearer. Housing starts and measures of employment improved, and manufacturing and non-manufacturing surveys showed expansion in the economy. In December 2012, further clarification from the Fed, tying its low interest rate policy to the condition that unemployment drop to 6.5% or lower, helped to offset increasing worries about the then-looming fiscal cliff of tax increases and spending cuts.
During the Reporting Period as a whole, the Russell 2000® Index, representing the U.S. small-cap equity market, rose 16.30%. Nine of the ten sectors in the Russell 2000® Index were up, with the materials and consumer discretionary sectors gaining the most. The top-weighted financials sector was the largest positive contributor (weight times performance) to Russell 2000® Index returns.
| * | The Russell 2000 Index is an unmanaged index of common stock prices that measures the performance of the 2000 smallest companies in the Russell 3000 Index. The Index figures do not reflect any deduction for fees, expenses or taxes. It is not possible to invest directly in an unmanaged index. |
2
GOLDMAN SACHS VARIABLE INSURANCE TRUST STRUCTURED SMALL CAP EQUITY FUND
The one sector in the Russell 2000® Index that generated a negative return during the Reporting Period was energy. The energy sector was comparatively weak, as oil prices remained relatively stable, balancing continued unrest in several oil-producing regions with potential supply increases from U.S. shale production and a modest outlook for global economic growth.
All segments of the U.S. equity market advanced during the Reporting Period, with mid-cap stocks, as measured by the Russell Midcap® Index, gaining most, followed by large-cap stocks and then small-cap stocks, as measured by the Russell 1000® Index and the Russell 2000® Index, respectively, which performed similarly to each other. Large-cap stocks were least successful relative to small-cap stocks in the materials sector. From a style perspective, value-oriented stocks solidly outpaced growth-oriented stocks across the capitalization spectrum. (All as measured by the Russell Investments indices.)
What key factors were responsible for the Fund’s performance during the Reporting Period?
Although our quantitative model and five of its six investment themes enhanced relative returns, the Fund underperformed the S&P 500 Index during the Reporting Period, largely because of its industry exposures and control factors. Our stock selection added to relative performance during the Reporting Period.
What impact did the Fund’s investment themes have on performance during the Reporting Period?
As expected, and in keeping with our investment approach, our quantitative model and its six investment themes — Valuation, Profitability, Quality, Management, Momentum and Sentiment — had the greatest impact on relative performance. We use these themes to take a long-term view of market patterns and look for inefficiencies, selecting stocks for the Fund and overweighting or underweighting the ones chosen by the model. Over time and by design, the performance of any one of the model’s investment themes tends to have a low correlation with the model’s other themes, demonstrating the diversification benefit of the Fund’s theme-driven quantitative model. The variance in performance supports our research indicating that the diversification provided by the Fund’s different investment themes is a significant investment advantage over the long term, even though the Fund may experience underperformance in the short term. Of course, diversification does not protect an investor from market risk nor does it ensure a profit.
During the Reporting Period, five of our six investment themes — Momentum, Valuation, Sentiment, Quality and Profitability — contributed positively to the Fund’s relative performance. The Momentum theme seeks to predict drifts in stock prices caused by delayed investor reaction to company-specific information and information about related companies. Valuation attempts to capture potential mispricings of securities, typically by comparing a measure of the company’s intrinsic value to its market value. The Sentiment theme reflects selected investment views and decisions of individuals and financial intermediaries. Quality evaluates whether the company’s earnings are coming from more persistent, cash-based sources, as opposed to accruals. The Profitability theme assesses whether a company is earning more than its cost of capital.
The Fund’s Management theme detracted. The Management theme assesses the characteristics, policies and strategic decisions of company management.
How did the Fund’s sector and industry allocations affect relative performance?
In constructing the Fund’s portfolio, we focus on picking stocks rather than making industry or sector bets. Consequently, the Fund is similar to its benchmark, the Russell Index, in terms of its sector allocation and style. We manage the Fund’s industry and sector exposure by including industry factors in our risk model and by explicitly penalizing industry and sector deviations from the benchmark index in optimization. Sector weights or changes in weights generally do not have a meaningful impact on relative performance.
That said, despite the positive results from our investment themes, the contribution of the Fund’s industry exposures dragged down relative performance during the Reporting Period. Though its industry weightings were no larger or smaller than normal, the Fund was hurt most by its relative positioning in building and construction products, computers and peripherals, semiconductors and semiconductor equipment, biotechnology, and transportation.
Did stock selection help or hurt Fund performance during the Reporting Period?
We seek to outpace the Russell Index by overweighting stocks that we expect to outperform and underweighting those that we think may lag. We also build positions based on our thematic views. For example, the Fund aims to hold a basket of stocks with more favorable Momentum characteristics than the benchmark index. During the Reporting Period, stock selection overall contributed positively to the Fund’s relative performance.
Effective stock selection in the energy, industrials and materials sectors made the biggest positive contribution to the Fund’s results relative to its benchmark index. Partially offsetting these contributors was stock selection in the information technology, consumer discretionary and health care sectors, which detracted most from the Fund’s results relative to the Russell Index.
3
GOLDMAN SACHS VARIABLE INSURANCE TRUST STRUCTURED SMALL CAP EQUITY FUND
Which individual stock positions contributed the most to the Fund’s relative returns during the Reporting Period?
The Fund benefited most from overweight positions in oil refiner Western Refining, regional department store Stage Stores and diversified machinery manufacturer NACCO Industries. We chose to overweight Western Refining because of our positive views on Quality and Profitability. The Fund was overweight Stage Stores and NACCO Industries due to our positive views on Profitability and Valuation.
Which individual positions detracted from the Fund’s results during the Reporting Period?
Detracting most from the Fund’s results relative to its benchmark index were overweight positions in mattress and pillow manufacturer Tempur-Pedic International, nutritional supplement company Herbalife and sporting goods retailer Zumiez. The Fund was overweight Tempur-Pedic International due to our positive views on Momentum and Profitability. Our positive views on Profitability led us to overweight Herbalife. We chose to overweight Zumiez because of our positive views on Management.
How did the Fund use derivatives during the Reporting Period?
During the Reporting Period, we did not use derivatives as part of an active management strategy to add value to the Fund’s results. However, we used equity index futures contracts, on an opportunistic basis, to equitize the Fund’s excess cash holdings. In other words, we put the Fund’s excess cash holdings to work by using them as collateral for the purchase of stock futures.
Did you make any enhancements to your quantitative models during the Reporting Period?
We continuously look for ways to improve our investment process. During the first quarter of 2012, we implemented an enhancement to our U.S. stock selection process with the introduction of a short-term model. Our alpha model forecasts returns using three- to 12-month horizons through which we create our long-term investment decisions. In addition to that, the short-term model now determines entry and exit points for trade execution. We believe this enhancement will further add value to our process.
During the second quarter of 2012, we implemented an enhancement to our stock selection process globally, incorporating several measures to the signals within our Valuation theme. These include cash flow signals, book value signals, dividend and buyback signals, forecasted and realized earnings signals and structural valuation signals. The signal weights are customized based on the stock’s industry, sector and geographic location. We believe these additional signals will help capture the intrinsic value of a company more effectively and further add value to our process.
During the fourth quarter of 2012, we implemented an enhancement to our stock selection process across several geographic regions, incorporating several measures to the signals within our Quality theme. These include measures of capital investment, funding source, earnings quality, competitive positioning and financial solvency. We believe these signals effectively capture both the investment quality attributable to management decisions as well as the quality attributable to firm economics. Additionally, we extended our Momentum theme in continental Europe, the U.K. and Japan using enhanced cross-company linkages. In continental Europe and the U.K., we link economically-related companies, which may or may not belong to the same industry. In Japan, we leverage the unique corporate infrastructure of the region, called Keiretsu, where cross share holding is common, to create a cross-company linkage signal. We believe these signals help identify momentum trends earlier in their history.
What was the Fund’s sector positioning relative to its benchmark index at the end of the Reporting Period?
As of December 31, 2012, the Fund was overweight the health care, consumer discretionary and consumer staples sectors relative to the Russell Index. The Fund was underweight energy and information technology and was rather neutrally weighted in telecommunication services, utilities, industrials, materials and financials compared to the benchmark index on the same date.
What is your strategy going forward for the Fund?
Looking ahead, we continue to believe that less expensive stocks should outpace more expensive stocks, and stocks with good momentum are likely to outperform those with poor momentum. We intend to maintain our focus on seeking companies about which fundamental research analysts are becoming more positive as well as profitable companies with sustainable earnings and a track record of using their capital to enhance shareholder value. As such, we anticipate remaining fully invested with long-term performance likely to be the result of stock selection rather than sector or capitalization allocations.
We stand behind our investment philosophy that sound economic investment principles, coupled with a disciplined quantitative approach, can provide strong, uncorrelated returns over the long term. Our research agenda is robust, and we continue to enhance our existing models, add new proprietary forecasting signals and improve our trading execution as we seek to provide the most value to our shareholders.
4
FUND BASICS
Structured Small Cap Equity Fund
as of December 31, 2012
STANDARDIZED TOTAL RETURNS1
| For the period ended 12/31/12 | One Year | Five Years | Ten Years | Since Inception | Inception Date | |||||||||||||
| Institutional | 12.79 | % | 4.48 | % | 7.71 | % | 4.86 | % | 2/13/98 | |||||||||
| Service | 12.47 | 4.19 | N/A | 2.75 | 8/31/07 | |||||||||||||
| 1 | The Standardized Total Returns are average annual total returns as of the most recent calendar quarter-end. They assume reinvestment of all distributions at net asset value (“NAV”). Because Institutional Shares and Service Shares do not involve a sales charge, such a charge is not applied to their Standardized Total Returns. |
Total return figures in the above chart represent past performance and do not indicate future results, which will vary. The investment return and principal value of an investment will fluctuate and, therefore, an investor’s shares, when redeemed, may be worth more or less than their original cost. Current performance may be lower or higher than the total return figures in the above chart. Please visit www.goldmansachsfunds.com/vit to obtain the most recent month-end returns. Performance reflects fee waivers and/or expense limitations in effect. In their absence, performance would be reduced.
EXPENSE RATIOS2
| Net Expense Ratio (Current) | Gross Expense Ratio (Before Waivers) | |||||||
| Institutional | 0.81 | % | 0.99 | % | ||||
| Service | 1.06 | 1.24 | ||||||
| 2 | The expense ratios of the Fund, both current (net of applicable fee waivers and/or expense limitations) and before waivers (gross of applicable fee waivers and/or expense limitations) are as set forth above according to the most recent publicly available Prospectus for the Fund and may differ from the expense ratios disclosed in the Financial Highlights in this report. The Fund’s waivers and/or expense limitations will remain in place through at least April 27, 2013, and prior to such date the investment adviser may not terminate the arrangements without the approval of the Fund’s Board of Trustees. If these arrangements are discontinued in the future, the expense ratios may change without shareholder approval. |
TOP 10 HOLDINGS AS OF 12/31/123
| Holding | % of Total Net Assets | Line of Business | ||||
| Aspen Technology, Inc. | 1.5 | % | Software & Services | |||
| Pharmacyclics, Inc. | 1.4 | Pharmaceuticals, Biotechnology & Life Sciences | ||||
| Southwest Gas Corp. | 1.4 | Utilities | ||||
| Lumber Liquidators Holdings, Inc. | 1.4 | Retailing | ||||
| Greenhill & Co., Inc. | 1.3 | Diversified Financials | ||||
| Papa John’s International, Inc. | 1.3 | Consumer Services | ||||
| Rayonier, Inc. (REIT) | 1.2 | Real Estate | ||||
| Stage Stores, Inc. | 1.2 | Retailing | ||||
| Lancaster Colony Corp. | 1.2 | Food, Beverage & Tobacco | ||||
| International Bancshares Corp. | 1.1 | Banks | ||||
| 3 | The top 10 holdings may not be representative of the Fund’s future investments. |
5
FUND BASICS
Structured Small Cap Equity Fund (continued)
as of December 31, 2012
FUND VS. BENCHMARK SECTOR ALLOCATIONS4
As of December 31, 2012
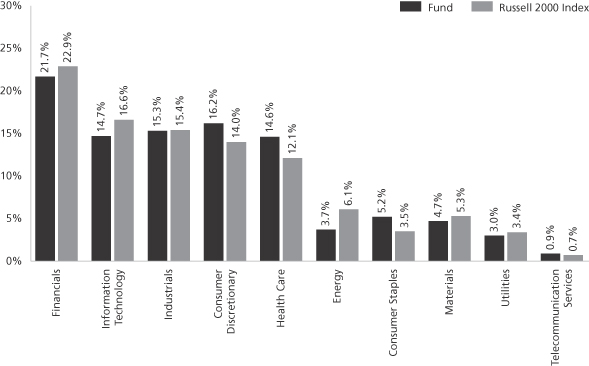
| 4 | The Fund is actively managed and, as such, its composition may differ over time. Consequently, the Fund’s overall sector allocations may differ from percentages contained in the graph above. The graph categorizes investments using Global Industry Classification Standard (“GICS”), however, the sector classifications used by the portfolio management team may differ from GICS. The percentage shown for each investment category reflects the value of investments in that category as a percentage of market value (excluding investments in the securities lending reinvestment vehicle, if any). Investments in the securities lending reinvestment vehicle represented 6.5% of the Fund’s net assets at December 31, 2012. The graph depicts the Fund’s investments but may not represent the Fund’s market exposure due to the exclusion of certain derivatives, if any, as listed in the Additional Investment Information section of the Schedule of Investments. |
6
GOLDMAN SACHS VARIABLE INSURANCE TRUST STRUCTURED SMALL CAP EQUITY FUND
Performance Summary
December 31, 2012
The following graph shows the value, as of December 31, 2012, of a $10,000 investment made on January 1, 2003 in Institutional Shares at NAV. For comparative purposes, the performance of the Fund’s benchmark, the Russell 2000 Index (with dividends reinvested), is shown. This performance data represents past performance and should not be considered indicative of future performance, which will fluctuate with changes in market conditions. These performance fluctuations will cause an investor’s shares, when redeemed, to be worth more or less than their original cost. Performance reflects Fund level expenses but does not reflect fees and expenses associated with any variable annuity contract or variable life insurance policy that uses the Fund as an investment option for any contract or policy. Had performance reflected all of those fees and expenses, performance would have been reduced. Performance also would have been reduced had expense limitations not been in effect. Performance of Service Shares will vary from Institutional Shares due to differences in class specific fees. In addition to the investment adviser’s decisions regarding issuer/industry investment selection and allocation, other factors may affect Fund performance. These factors include, but are not limited to, Fund operating fees and expenses, portfolio turnover, and subscription and redemption cash flows affecting the Fund.
Structured Small Cap Equity Fund’s 10 Year Performance
Performance of a $10,000 investment, with distributions reinvested, from January 1, 2003 through December 31, 2012.
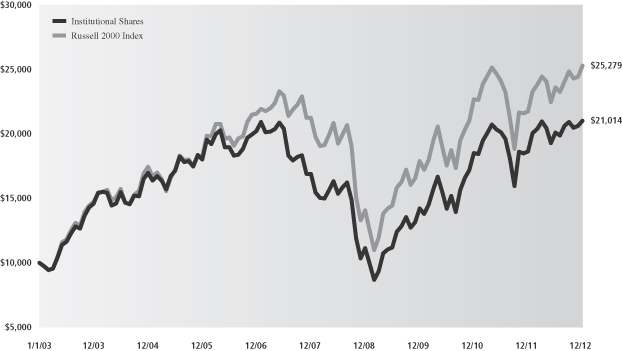
| Average Annual Total Return through December 31, 2012 | One Year | Five Years | Ten Years | Since Inception | ||||
Institutional (Commenced February 13, 1998) | 12.79% | 4.48% | 7.71% | 4.86% | ||||
Service (Commenced August 31, 2007) | 12.47% | 4.19% | N/A | 2.75% |
7
GOLDMAN SACHS VARIABLE INSURANCE TRUST STRUCTURED SMALL CAP EQUITY FUND
Schedule of Investments
December 31, 2012
| Shares | Description | Value | ||||||
| Common Stocks – 96.8% | ||||||||
| Automobiles & Components – 0.8% | |||||||
| 3,368 | Cooper Tire & Rubber Co. | $ | 85,412 | |||||
| 1,536 | Lear Corp. | 71,946 | ||||||
| 5,736 | Modine Manufacturing Co.* | 46,634 | ||||||
| 17,769 | Stoneridge, Inc.* | 90,977 | ||||||
| 17,077 | Superior Industries International, Inc. | 348,371 | ||||||
| 1,333 | Tenneco, Inc.* | 46,802 | ||||||
| 5,012 | The Goodyear Tire & Rubber Co.* | 69,216 | ||||||
| 2,440 | Visteon Corp.* | 131,321 | ||||||
|
| |||||||
| 890,679 | ||||||||
|
| |||||||
| Banks – 6.3% |
| ||||||
| 3,894 | 1st Source Corp. | 86,018 | ||||||
| 28,381 | Astoria Financial Corp. | 265,646 | ||||||
| 4,682 | BancorpSouth, Inc. | 68,076 | ||||||
| 1,527 | Bank of Hawaii Corp. | 67,264 | ||||||
| 2,797 | BankUnited, Inc. | 68,359 | ||||||
| 78,464 | CVB Financial Corp.(a) | 816,026 | ||||||
| 3,954 | East West Bancorp, Inc. | 84,971 | ||||||
| 24,110 | First Bancorp | 309,090 | ||||||
| 6,132 | First Bancorp, Inc. | 100,994 | ||||||
| 11,406 | First Financial Bancorp | 166,756 | ||||||
| 12,553 | First Interstate Bancsystem, Inc. | 193,693 | ||||||
| 22,559 | First Niagara Financial Group, Inc. | 178,893 | ||||||
| 21,209 | FirstMerit Corp. | 300,956 | ||||||
| 14,822 | FNB Corp. | 157,410 | ||||||
| 13,520 | Fulton Financial Corp. | 129,927 | ||||||
| 14,075 | Great Southern Bancorp, Inc. | 358,209 | ||||||
| 1,046 | Iberiabank Corp. | 51,380 | ||||||
| 64,629 | International Bancshares Corp. | 1,166,553 | ||||||
| 10,337 | Investors Bancorp, Inc. | 183,792 | ||||||
| 3,893 | Northfield Bancorp, Inc. | 59,368 | ||||||
| 5,475 | Ocwen Financial Corp.* | 189,380 | ||||||
| 3,260 | Oritani Financial Corp. | 49,943 | ||||||
| 3,950 | PacWest Bancorp | 97,881 | ||||||
| 24,749 | PrivateBancorp, Inc. | 379,155 | ||||||
| 11,699 | Renasant Corp. | 223,919 | ||||||
| 1,689 | Republic Bancorp, Inc. Class A | 35,689 | ||||||
| 2,511 | State Bank Financial Corp. | 39,875 | ||||||
| 766 | SVB Financial Group* | 42,873 | ||||||
| 3,407 | Texas Capital Bancshares, Inc.* | 152,702 | ||||||
| 3,779 | Umpqua Holdings Corp. | 44,554 | ||||||
| 5,251 | United Bankshares, Inc. | 127,704 | ||||||
| 39,010 | Wilshire Bancorp, Inc.* | 228,989 | ||||||
| 5,082 | Wintrust Financial Corp. | 186,509 | ||||||
|
| |||||||
| 6,612,554 | ||||||||
|
| |||||||
| Capital Goods – 8.7% |
| ||||||
| 1,857 | Alamo Group, Inc. | 60,612 | ||||||
| 3,990 | Albany International Corp. Class A | 90,493 | ||||||
| 3,352 | American Science & Engineering, Inc. | 218,584 | ||||||
| 6,857 | American Woodmark Corp.* | 190,762 | ||||||
| 8,625 | Astec Industries, Inc. | 287,471 | ||||||
| 7,674 | Beacon Roofing Supply, Inc.* | 255,391 | ||||||
| 10,882 | Brady Corp. Class A | 363,459 | ||||||
| 487 | Cascade Corp. | 31,314 | ||||||
|
| |||||||
| Shares | Description | Value | ||||||
| Common Stocks – (continued) | ||||||||
| Capital Goods – (continued) |
| ||||||
| 5,717 | Cubic Corp. | $ | 274,244 | |||||
| 9,498 | Ducommun, Inc.* | 153,583 | ||||||
| 8,338 | Encore Wire Corp. | 252,725 | ||||||
| 3,825 | FreightCar America, Inc. | 85,756 | ||||||
| 20,384 | H&E Equipment Services, Inc. | 307,187 | ||||||
| 6,534 | Hexcel Corp.* | 176,157 | ||||||
| 13,057 | Hyster-Yale Materials Handling, Inc. | 637,182 | ||||||
| 14,762 | Kadant, Inc.* | 391,341 | ||||||
| 43,981 | LSI Industries, Inc. | 308,307 | ||||||
| 8,267 | Lydall, Inc.* | 118,549 | ||||||
| 17,917 | Miller Industries, Inc. | 273,234 | ||||||
| 16,555 | Mueller Industries, Inc. | 828,247 | ||||||
| 7,951 | Navistar International Corp.*(b) | 173,093 | ||||||
| 5,149 | Orbital Sciences Corp.* | 70,902 | ||||||
| 1,859 | Oshkosh Corp.* | 55,119 | ||||||
| 3,707 | Sauer-Danfoss, Inc. | 197,843 | ||||||
| 85 | Seaboard Corp. | 215,040 | ||||||
| 4,492 | Taser International, Inc.* | 40,158 | ||||||
| 28,599 | Tecumseh Products Co. Class A* | 132,127 | ||||||
| 4,028 | Tennant Co. | 177,031 | ||||||
| 11,388 | The Manitowoc Co., Inc. | 178,564 | ||||||
| 13,174 | The Toro Co. | 566,218 | ||||||
| 11,919 | Trex Co., Inc.* | 443,744 | ||||||
| 15,484 | Universal Forest Products, Inc. | 589,011 | ||||||
| 11,061 | Vicor Corp.* | 59,951 | ||||||
| 13,546 | Watsco, Inc. | 1,014,595 | ||||||
|
| |||||||
| 9,217,994 | ||||||||
|
| |||||||
| Commercial & Professional Services – 4.0% |
| ||||||
| 6,196 | ABM Industries, Inc. | 123,610 | ||||||
| 19,317 | CDI Corp. | 330,900 | ||||||
| 3,172 | Consolidated Graphics, Inc.* | 110,766 | ||||||
| 8,969 | Healthcare Services Group, Inc. | 208,350 | ||||||
| 8,302 | Heidrick & Struggles International, Inc. | 126,689 | ||||||
| 23,393 | HNI Corp. | 703,194 | ||||||
| 9,501 | Insperity, Inc. | 309,353 | ||||||
| 48,423 | Kelly Services, Inc. Class A | 762,178 | ||||||
| 30,916 | Kforce, Inc. | 443,026 | ||||||
| 25,263 | Kimball International, Inc. Class B | 293,304 | ||||||
| 1,660 | Manpower, Inc. | 70,450 | ||||||
| 4,055 | Mine Safety Appliances Co. | 173,189 | ||||||
| 11,926 | Steelcase, Inc. Class A | 151,937 | ||||||
| 12,564 | United Stationers, Inc. | 389,358 | ||||||
|
| |||||||
| 4,196,304 | ||||||||
|
| |||||||
| Consumer Durables & Apparel – 3.5% |
| ||||||
| 2,047 | Arctic Cat, Inc.* | 68,349 | ||||||
| 4,349 | Beazer Homes USA, Inc.*(b) | 73,455 | ||||||
| 18,013 | Blyth, Inc.(b) | 280,102 | ||||||
| 5,598 | Crocs, Inc.* | 80,555 | ||||||
| 2,729 | CSS Industries, Inc. | 59,738 | ||||||
| 4,181 | Ethan Allen Interiors, Inc. | 107,493 | ||||||
| 86,666 | Hovnanian Enterprises, Inc. Class A*(b) | 606,662 | ||||||
| 4,431 | iRobot Corp.* | 83,037 | ||||||
| 6,360 | Meritage Homes Corp.* | 237,546 | ||||||
|
| |||||||
| 8 | The accompanying notes are an integral part of these financial statements. |
GOLDMAN SACHS VARIABLE INSURANCE TRUST STRUCTURED SMALL CAP EQUITY FUND
| Shares | Description | Value | ||||||
| Common Stocks – (continued) | ||||||||
| Consumer Durables & Apparel – (continued) |
| ||||||
| 10,087 | Movado Group, Inc. | $ | 309,469 | |||||
| 8,408 | NACCO Industries, Inc. Class A | 510,282 | ||||||
| 11,287 | Oxford Industries, Inc. | 523,265 | ||||||
| 19,424 | Perry Ellis International, Inc. | 386,538 | ||||||
| 4,612 | PulteGroup, Inc.* | 83,754 | ||||||
| 22,307 | Smith & Wesson Holding Corp.*(b) | 188,271 | ||||||
| 977 | The Warnaco Group, Inc.* | 69,924 | ||||||
|
| |||||||
| 3,668,440 | ||||||||
|
| |||||||
| Consumer Services – 3.4% |
| ||||||
| 9,497 | Ascent Capital Group, Inc. Class A* | 588,244 | ||||||
| 2,512 | Biglari Holdings, Inc.* | 979,730 | ||||||
| 10,702 | Domino’s Pizza, Inc. | 466,072 | ||||||
| 24,302 | Papa John’s International, Inc.* | 1,335,152 | ||||||
| 3,688 | Weight Watchers International, Inc.(b) | 193,104 | ||||||
|
| |||||||
| 3,562,302 | ||||||||
|
| |||||||
| Diversified Financials – 5.3% |
| ||||||
| 12,402 | Apollo Investment Corp. | 103,681 | ||||||
| 27,432 | BlackRock Kelso Capital Corp. | 275,966 | ||||||
| 21,795 | Cash America International, Inc. | 864,608 | ||||||
| 1,257 | CBOE Holdings, Inc. | 37,031 | ||||||
| 3,446 | Cohen & Steers, Inc. | 105,000 | ||||||
| 2,997 | DFC Global Corp.* | 55,474 | ||||||
| 677 | Diamond Hill Investment Group, Inc. | 45,941 | ||||||
| 3,168 | Duff & Phelps Corp. Class A | 49,484 | ||||||
| 1,742 | Epoch Holding Corp. | 48,602 | ||||||
| 2,184 | Financial Engines, Inc.* | 60,606 | ||||||
| 7,909 | GAMCO Investors, Inc. Class A | 419,731 | ||||||
| 17,521 | Gladstone Capital Corp. | 142,971 | ||||||
| 27,175 | Greenhill & Co., Inc. | 1,412,828 | ||||||
| 2,430 | Horizon Technology Finance Corp. | 36,183 | ||||||
| 3,490 | Jefferies Group, Inc. | 64,809 | ||||||
| 17,698 | KBW, Inc. | 270,779 | ||||||
| 37,002 | NGP Capital Resources Co. | 267,154 | ||||||
| 9,095 | PHH Corp.* | 206,911 | ||||||
| 5,555 | Prospect Capital Corp. | 60,383 | ||||||
| 5,589 | Safeguard Scientifics, Inc.* | 82,438 | ||||||
| 2,599 | SEI Investments Co. | 60,661 | ||||||
| 34,107 | TICC Capital Corp. | 345,163 | ||||||
| 7,605 | World Acceptance Corp.*(b) | 567,029 | ||||||
|
| |||||||
| 5,583,433 | ||||||||
|
| |||||||
| Energy – 3.6% |
| ||||||
| 51,862 | Alon USA Energy, Inc. | 938,184 | ||||||
| 3,425 | Contango Oil & Gas Co. | 145,083 | ||||||
| 3,969 | Crosstex Energy, Inc. | 56,915 | ||||||
| 14,693 | Delek US Holdings, Inc. | 372,027 | ||||||
| 30,891 | Parker Drilling Co.* | 142,099 | ||||||
| 11,691 | SemGroup Corp. Class A* | 456,884 | ||||||
| 34,655 | W&T Offshore, Inc. | 555,520 | ||||||
| 40,607 | Western Refining, Inc. | 1,144,711 | ||||||
|
| |||||||
| 3,811,423 | ||||||||
|
| |||||||
| Shares | Description | Value | ||||||
| Common Stocks – (continued) | ||||||||
| Food & Staples Retailing – 0.6% |
| ||||||
| 11,447 | Susser Holdings Corp.* | $ | 394,807 | |||||
| 17,872 | The Pantry, Inc.* | 216,787 | ||||||
|
| |||||||
| 611,594 | ||||||||
|
| |||||||
| Food, Beverage & Tobacco – 2.8% |
| ||||||
| 42,484 | Alliance One International, Inc.* | 154,642 | ||||||
| 4,240 | Dole Food Co., Inc.* | 48,633 | ||||||
| 3,635 | Fresh Del Monte Produce, Inc. | 95,782 | ||||||
| 5,928 | J&J Snack Foods Corp. | 379,036 | ||||||
| 18,348 | Lancaster Colony Corp. | 1,269,498 | ||||||
| 32,278 | National Beverage Corp. | 470,936 | ||||||
| 25,022 | Pilgrim’s Pride Corp.* | 181,410 | ||||||
| 6,387 | Post Holdings, Inc.* | 218,755 | ||||||
| 1,988 | Sanderson Farms, Inc. | 94,529 | ||||||
|
| |||||||
| 2,913,221 | ||||||||
|
| |||||||
| Health Care Equipment & Services – 4.5% |
| ||||||
| 4,547 | ABIOMED, Inc.*(b) | 61,203 | ||||||
| 13,491 | Accuray, Inc.* | 86,747 | ||||||
| 16,014 | Align Technology, Inc.* | 444,388 | ||||||
| 37,734 | Amedisys, Inc.* | 425,262 | ||||||
| 10,455 | AMN Healthcare Services, Inc.* | 120,755 | ||||||
| 16,234 | Assisted Living Concepts, Inc. Class A | 158,282 | ||||||
| 7,321 | Bio-Reference Labs, Inc.*(b) | 210,039 | ||||||
| 5,805 | BioScrip, Inc.* | 62,520 | ||||||
| 1,140 | Coventry Health Care, Inc. | 51,106 | ||||||
| 3,216 | Cyberonics, Inc.* | 168,936 | ||||||
| 3,835 | Cynosure, Inc. Class A* | 92,462 | ||||||
| 1,256 | Haemonetics Corp.* | 51,295 | ||||||
| 15,153 | Hill-Rom Holdings, Inc. | 431,861 | ||||||
| 2,492 | IDEXX Laboratories, Inc.* | 231,258 | ||||||
| 15,721 | Invacare Corp. | 256,252 | ||||||
| 31,683 | Kindred Healthcare, Inc.* | 342,810 | ||||||
| 1,587 | Masimo Corp. | 33,343 | ||||||
| 2,448 | Molina Healthcare, Inc.* | 66,243 | ||||||
| 36,745 | PharMerica Corp.* | 523,249 | ||||||
| 5,855 | Select Medical Holdings Corp. | 55,213 | ||||||
| 1,985 | Sirona Dental Systems, Inc.* | 127,953 | ||||||
| 28,604 | Skilled Healthcare Group, Inc. Class A* | 182,207 | ||||||
| 6,421 | Sunrise Senior Living, Inc.* | 92,334 | ||||||
| 29,158 | Universal American Corp. | 250,467 | ||||||
| 12,622 | Vascular Solutions, Inc.* | 199,428 | ||||||
| 835 | WellCare Health Plans, Inc.* | 40,656 | ||||||
|
| |||||||
| 4,766,269 | ||||||||
|
| |||||||
| Household & Personal Products – 1.7% |
| ||||||
| 58,085 | Central Garden and Pet Co. Class A* | 606,988 | ||||||
| 24,895 | Herbalife Ltd.(b) | 820,041 | ||||||
| 3,504 | Medifast, Inc.* | 92,471 | ||||||
| 7,863 | USANA Health Sciences, Inc.*(b) | 258,929 | ||||||
|
| |||||||
| 1,778,429 | ||||||||
|
| |||||||
| Insurance – 1.9% |
| ||||||
| 17,219 | Amtrust Financial Services, Inc. | 494,013 | ||||||
| 48,299 | First American Financial Corp. | 1,163,523 | ||||||
| 4,129 | Global Indemnity PLC* | 91,375 | ||||||
|
| |||||||
| The accompanying notes are an integral part of these financial statements. | 9 |
GOLDMAN SACHS VARIABLE INSURANCE TRUST STRUCTURED SMALL CAP EQUITY FUND
Schedule of Investments (continued)
December 31, 2012
| Shares | Description | Value | ||||||
| Common Stocks – (continued) | ||||||||
| Insurance – (continued) |
| ||||||
| 17,309 | Maiden Holdings Ltd. | $ | 159,069 | |||||
| 4,763 | Stewart Information Services Corp. | 123,838 | ||||||
|
| |||||||
| 2,031,818 | ||||||||
|
| |||||||
| Materials – 4.6% |
| ||||||
| 16,958 | A. Schulman, Inc. | 490,595 | ||||||
| 8,786 | Buckeye Technologies, Inc. | 252,246 | ||||||
| 1,217 | Eagle Materials, Inc. | 71,194 | ||||||
| 7,263 | Georgia Gulf Corp.(b) | 299,817 | ||||||
| 34,028 | Golden Star Resources Ltd.*(b) | 62,612 | ||||||
| 22,940 | Headwaters, Inc.* | 196,366 | ||||||
| 3,319 | Huntsman Corp. | 52,772 | ||||||
| 1,526 | Koppers Holdings, Inc. | 58,217 | ||||||
| 25,297 | Kraton Performance Polymers, Inc.* | 607,887 | ||||||
| 2,177 | Kronos Worldwide, Inc. | 42,451 | ||||||
| 49,661 | Louisiana-Pacific Corp.* | 959,451 | ||||||
| 14,155 | Materion Corp. | 364,916 | ||||||
| 1,719 | OM Group, Inc.* | 38,162 | ||||||
| 7,043 | Resolute Forest Products* | 93,249 | ||||||
| 2,355 | Schnitzer Steel Industries, Inc. Class A | 71,427 | ||||||
| 48,974 | Senomyx, Inc.* | 82,276 | ||||||
| 20,667 | Spartech Corp.* | 187,450 | ||||||
| 15,940 | Stepan Co. | 885,308 | ||||||
|
| |||||||
| 4,816,396 | ||||||||
|
| |||||||
| Media – 0.9% |
| ||||||
| 7,802 | AMC Networks, Inc. Class A* | 386,199 | ||||||
| 2,201 | Arbitron, Inc. | 102,743 | ||||||
| 2,974 | Cablevision Systems Corp. Class A | 44,431 | ||||||
| 8,061 | Entercom Communications Corp. Class A* | 56,266 | ||||||
| 7,679 | Harte-Hanks, Inc. | 45,306 | ||||||
| 59,889 | Journal Communications, Inc. Class A* | 323,999 | ||||||
|
| |||||||
| 958,944 | ||||||||
|
| |||||||
| Pharmaceuticals, Biotechnology & Life Sciences – 9.6% |
| ||||||
| 34,356 | Acorda Therapeutics, Inc.* | 854,090 | ||||||
| 6,191 | Aegerion Pharmaceuticals, Inc.*(b) | 157,190 | ||||||
| 19,323 | Affymax, Inc.* | 367,137 | ||||||
| 76,681 | Affymetrix, Inc.* | 243,079 | ||||||
| 5,492 | Arena Pharmaceuticals, Inc.*(b) | 49,538 | ||||||
| 4,749 | Auxilium Pharmaceuticals, Inc.* | 87,999 | ||||||
| 18,148 | AVEO Pharmaceuticals, Inc.*(b) | 146,091 | ||||||
| 18,135 | Bruker Corp.* | 276,921 | ||||||
| 14,995 | Cambrex Corp.* | 170,643 | ||||||
| 6,874 | Celsion Corp.* | 56,298 | ||||||
| 1,476 | Cepheid, Inc.* | 49,904 | ||||||
| 28,358 | Curis, Inc.* | 97,268 | ||||||
| 24,872 | Emergent Biosolutions, Inc.* | 398,947 | ||||||
| 20,533 | �� | Genomic Health, Inc.* | 559,730 | |||||
| 2,223 | Infinity Pharmaceuticals, Inc.* | 77,805 | ||||||
| 3,373 | Jazz Pharmaceuticals PLC* | 179,444 | ||||||
|
| |||||||
| Shares | Description | Value | ||||||
| Common Stocks – (continued) | ||||||||
| Pharmaceuticals, Biotechnology & Life Sciences – (continued) |
| ||||||
| 2,526 | Ligand Pharmaceuticals, Inc. Class B* | $ | 52,389 | |||||
| 6,289 | Luminex Corp.* | 105,404 | ||||||
| 2,987 | Mettler-Toledo International, Inc.* | 577,387 | ||||||
| 37,989 | Momenta Pharmaceuticals, Inc.* | 447,510 | ||||||
| 2,107 | Myriad Genetics, Inc.* | 57,416 | ||||||
| 4,066 | PAREXEL International Corp.* | 120,313 | ||||||
| 142,607 | PDL BioPharma, Inc.(b) | 1,005,379 | ||||||
| 25,475 | Pharmacyclics, Inc.* | 1,475,003 | ||||||
| 55,984 | Progenics Pharmaceuticals, Inc.* | 166,832 | ||||||
| 28,951 | Questcor Pharmaceuticals, Inc.(b) | 773,571 | ||||||
| 30,693 | Santarus, Inc.* | 337,009 | ||||||
| 48,417 | Sciclone Pharmaceuticals, Inc.* | 208,677 | ||||||
| 18,574 | Spectrum Pharmaceuticals, Inc.(b) | 207,843 | ||||||
| 4,025 | Synageva BioPharma Corp.* | 186,317 | ||||||
| 4,544 | United Therapeutics Corp.* | 242,740 | ||||||
| 36,541 | Warner Chilcott PLC Class A | 439,954 | ||||||
|
| |||||||
| 10,175,828 | ||||||||
|
| |||||||
| Real Estate – 7.5% |
| ||||||
| 22,228 | AG Mortgage Investment Trust, Inc. (REIT) | 521,913 | ||||||
| 10,812 | Agree Realty Corp. (REIT) | 289,654 | ||||||
| 1 | Altisource Asset Management Corp.* | 57 | ||||||
| 11,847 | Altisource Portfolio Solutions SA* | 1,026,602 | ||||||
| 3,809 | Altisource Residential Corp. Class B* | 60,335 | ||||||
| 7,604 | CubeSmart (REIT) | 110,790 | ||||||
| 3,849 | DiamondRock Hospitality Co. (REIT) | 34,641 | ||||||
| 10,858 | Extra Space Storage, Inc. (REIT) | 395,123 | ||||||
| 38,869 | Franklin Street Properties Corp. (REIT) | 478,477 | ||||||
| 16,513 | Getty Realty Corp. (REIT) | 298,225 | ||||||
| 4,025 | Invesco Mortgage Capital, Inc. (REIT) | 79,333 | ||||||
| 1,224 | Jones Lang LaSalle, Inc. | 102,743 | ||||||
| 15,723 | LTC Properties, Inc. (REIT) | 553,292 | ||||||
| 9,808 | National Health Investors, Inc. (REIT) | 554,446 | ||||||
| 22,862 | Potlatch Corp. (REIT) | 895,962 | ||||||
| 25,439 | Rayonier, Inc. (REIT) | 1,318,503 | ||||||
| 18,722 | Starwood Property Trust, Inc. (REIT) | 429,857 | ||||||
| 2,051 | The St. Joe Co.* | 47,337 | ||||||
| 3,365 | Urstadt Biddle Properties, Inc. Class A (REIT) | 66,223 | ||||||
| 25,137 | Zillow, Inc. Class A*(b) | 697,552 | ||||||
|
| |||||||
| 7,961,065 | ||||||||
|
| |||||||
| Retailing – 7.1% |
| ||||||
| 2,508 | Asbury Automotive Group, Inc.* | 80,331 | ||||||
| 7,333 | Core-Mark Holding Co., Inc. | 347,218 | ||||||
| 3,287 | Destination Maternity Corp. | 70,868 | ||||||
|
| |||||||
| 10 | The accompanying notes are an integral part of these financial statements. |
GOLDMAN SACHS VARIABLE INSURANCE TRUST STRUCTURED SMALL CAP EQUITY FUND
| Shares | Description | Value | ||||||
| Common Stocks – (continued) | ||||||||
| Retailing – (continued) |
| ||||||
| 16,803 | Francesca’s Holdings Corp.*(b) | $ | 436,206 | |||||
| 16,132 | Fred’s, Inc. Class A | 214,717 | ||||||
| 12,275 | Group 1 Automotive, Inc. | 760,927 | ||||||
| 1,027 | Hibbett Sports, Inc.* | 54,123 | ||||||
| 20,320 | Hot Topic, Inc. | 196,088 | ||||||
| 27,573 | Lumber Liquidators Holdings, Inc.*(b) | 1,456,682 | ||||||
| 3,594 | OfficeMax, Inc. | 35,077 | ||||||
| 31,302 | Select Comfort Corp.* | 819,173 | ||||||
| 18,363 | Shoe Carnival, Inc. | 376,258 | ||||||
| 52,746 | Stage Stores, Inc. | 1,307,046 | ||||||
| 9,173 | The Buckle, Inc. | 409,483 | ||||||
| 11,369 | The Finish Line, Inc. Class A | 215,215 | ||||||
| 2,573 | Vitamin Shoppe, Inc.* | 147,587 | ||||||
| 16,653 | Zale Corp.* | 68,444 | ||||||
| 26,159 | Zumiez, Inc.*(b) | 507,746 | ||||||
|
| |||||||
| 7,503,189 | ||||||||
|
| |||||||
| Semiconductors & Semiconductor Equipment – 0.9% |
| ||||||
| 11,539 | Cypress Semiconductor Corp.* | 125,083 | ||||||
| 7,015 | DSP Group, Inc.* | 40,406 | ||||||
| 28,994 | Micrel, Inc. | 275,443 | ||||||
| 19,607 | Photronics, Inc.* | 116,858 | ||||||
| 53,382 | PLX Technology, Inc.* | 193,777 | ||||||
| 9,655 | RF Micro Devices, Inc.* | 43,254 | ||||||
| 5,570 | Skyworks Solutions, Inc.* | 113,071 | ||||||
|
| |||||||
| 907,892 | ||||||||
|
| |||||||
| Software & Services – 9.2% |
| ||||||
| 40,564 | Accelrys, Inc.* | 367,104 | ||||||
| 1,413 | ACI Worldwide, Inc.* | 61,734 | ||||||
| 2,690 | AOL, Inc.* | 79,651 | ||||||
| 56,022 | Aspen Technology, Inc.* | 1,548,448 | ||||||
| 34,163 | Blackbaud, Inc. | 779,941 | ||||||
| 91,755 | Ciber, Inc.* | 306,462 | ||||||
| 11,209 | CSG Systems International, Inc.* | 203,780 | ||||||
| 10,625 | Global Cash Access Holdings, Inc.* | 83,300 | ||||||
| 2,164 | Imperva, Inc.* | 68,231 | ||||||
| 22,102 | Lender Processing Services, Inc. | 544,151 | ||||||
| 121,557 | Lionbridge Technologies, Inc.* | 488,659 | ||||||
| 14,371 | LivePerson, Inc.* | 188,835 | ||||||
| 18,583 | LogMeIn, Inc.* | 416,445 | ||||||
| 18,579 | Manhattan Associates, Inc.* | 1,121,057 | ||||||
| 1,877 | Mantech International Corp. Class A | 48,689 | ||||||
| 55,638 | Marchex, Inc. Class B | 228,672 | ||||||
| 10,091 | MicroStrategy, Inc. Class A* | 942,298 | ||||||
| 6,725 | Monotype Imaging Holdings, Inc. | 107,466 | ||||||
| 23,950 | Pegasystems, Inc. | 543,186 | ||||||
| 16,973 | PROS Holdings, Inc.* | 310,436 | ||||||
| 7,722 | QAD, Inc. Class A | 111,197 | ||||||
| 24,977 | RealNetworks, Inc.* | 188,826 | ||||||
| 5,402 | RealPage, Inc.* | 116,521 | ||||||
| 8,410 | Responsys, Inc.* | 50,124 | ||||||
| 15,437 | Saba Software, Inc.* | 134,919 | ||||||
| 8,794 | TeleTech Holdings, Inc.* | 156,533 | ||||||
|
| |||||||
| Shares | Description | Value | ||||||
| Common Stocks – (continued) | ||||||||
| Software and Services – (continued) |
| ||||||
| 2,173 | Travelzoo, Inc.* | $ | 41,265 | |||||
| 5,185 | Ultimate Software Group, Inc.* | 489,516 | ||||||
|
| |||||||
| 9,727,446 | ||||||||
|
| |||||||
| Technology Hardware & Equipment – 4.2% |
| ||||||
| 16,911 | Agilysys, Inc.* | 141,545 | ||||||
| 4,610 | Avnet, Inc.* | 141,112 | ||||||
| 48,416 | Ciena Corp.* | 760,131 | ||||||
| 32,273 | Emulex Corp.* | 235,593 | ||||||
| 41,270 | Extreme Networks* | 150,223 | ||||||
| 40,663 | Finisar Corp.* | 662,807 | ||||||
| 38,302 | Imation Corp.* | 178,870 | ||||||
| 19,606 | Insight Enterprises, Inc.* | 340,556 | ||||||
| 16,409 | Jabil Circuit, Inc. | 316,530 | ||||||
| 16,318 | Methode Electronics, Inc. | 163,669 | ||||||
| 9,132 | National Instruments Corp. | 235,697 | ||||||
| 1,408 | Plantronics, Inc. | 51,913 | ||||||
| 21,861 | Polycom, Inc.* | 228,666 | ||||||
| 165,434 | Quantum Corp.* | 205,138 | ||||||
| 21,771 | Radisys Corp.* | 64,878 | ||||||
| 2,411 | Riverbed Technology, Inc.* | 47,543 | ||||||
| 45,837 | ShoreTel, Inc.* | 194,349 | ||||||
| 30,589 | Symmetricom, Inc.* | 176,498 | ||||||
| 21,728 | Tellabs, Inc. | 49,540 | ||||||
| 7,770 | Xyratex Ltd. | 65,346 | ||||||
|
| |||||||
| 4,410,604 | ||||||||
|
| |||||||
| Telecommunication Services – 0.9% |
| ||||||
| 25,148 | Cbeyond, Inc.* | 227,338 | ||||||
| 10,998 | magicJack VocalTec Ltd.*(b) | 200,274 | ||||||
| 45,005 | USA Mobility, Inc. | 525,658 | ||||||
|
| |||||||
| 953,270 | ||||||||
|
| |||||||
| Transportation – 2.0% |
| ||||||
| 15,982 | Celadon Group, Inc. | 288,795 | ||||||
| 3,542 | Genesee & Wyoming, Inc. Class A* | 269,475 | ||||||
| 93,345 | Pacer International, Inc.* | 364,046 | ||||||
| 7,676 | Saia, Inc.* | 177,469 | ||||||
| 17,803 | SkyWest, Inc. | 221,825 | ||||||
| 53,204 | U.S. Airways Group, Inc.* | 718,254 | ||||||
| 7,243 | Universal Truckload Services, Inc. | 132,185 | ||||||
|
| |||||||
| 2,172,049 | ||||||||
|
| |||||||
| Utilities – 2.8% |
| ||||||
| 3,079 | Aqua America, Inc. | 78,268 | ||||||
| 887 | CH Energy Group, Inc. | 57,850 | ||||||
| 12,011 | Dynegy, Inc.* | 229,771 | ||||||
| 3,495 | El Paso Electric Co. | 111,526 | ||||||
| 14,319 | Genie Energy Ltd. Class B | 101,665 | ||||||
| 4,972 | Northwest Natural Gas Co. | 219,762 | ||||||
| 3,598 | NorthWestern Corp. | 124,959 | ||||||
| 4,644 | Piedmont Natural Gas Co., Inc.(b) | 145,404 | ||||||
| 2,379 | Pinnacle West Capital Corp. | 121,281 | ||||||
| 3,149 | Questar Corp. | 62,224 | ||||||
| 34,427 | Southwest Gas Corp. | 1,460,049 | ||||||
| 940 | The Laclede Group, Inc. | 36,293 | ||||||
|
| |||||||
| The accompanying notes are an integral part of these financial statements. | 11 |
GOLDMAN SACHS VARIABLE INSURANCE TRUST STRUCTURED SMALL CAP EQUITY FUND
Schedule of Investments (continued)
December 31, 2012
| Shares | Description | Value | ||||||
| Common Stocks – (continued) | ||||||||
| Utilities – (continued) |
| ||||||
| 5,280 | UGI Corp. | $ | 172,709 | |||||
| 2,044 | WGL Holdings, Inc. | 80,104 | ||||||
|
| |||||||
| 3,001,865 | ||||||||
|
| |||||||
| | TOTAL INVESTMENTS BEFORE SECURITIES LENDING REINVESTMENT VEHICLE | | ||||||
| (Cost $89,931,003) | $ | 102,233,008 | ||||||
|
| |||||||
| Shares | Rate | Value | ||||||
| Securities Lending Reinvestment Vehicle(c)(d) – 6.5% | ||||||||
Goldman Sachs Financial Square Money Market Fund — |
| |||||||
| 6,912,300 | 0.132 | % | $ | 6,912,300 | ||||
| (Cost $6,912,300) | ||||||||
| ||||||||
| TOTAL INVESTMENTS – 103.3% | ||||||||
| (Cost $96,843,303) | $ | 109,145,308 | ||||||
| ||||||||
LIABILITIES IN EXCESS OF OTHER ASSETS – (3.3)% |
| (3,510,288 | ) | |||||
| ||||||||
| NET ASSETS – 100.0% | $ | 105,635,020 | ||||||
| ||||||||
| The percentage shown for each investment category reflects the value of investments in that category as a percentage of net assets. | ||
| * | Non-income producing security. | |
| (a) | All or a portion of security is segregated as collateral for initial margin requirements on futures transactions. | |
| (b) | All or a portion of security is on loan. | |
| (c) | Variable rate security. Interest rate disclosed is that which is in effect at December 31, 2012. | |
| (d) | Represents an affiliated issuer. | |
| Investment Abbreviation: | ||
| REIT | —Real Estate Investment Trust | |
ADDITIONAL INVESTMENT INFORMATION
FUTURES CONTRACTS — At December 31, 2012, the Fund had the following futures contracts:
| Type | Number of Contracts Long (Short) | Expiration Date | Current Value | Unrealized Gain (Loss) | ||||||||||
| Russell 2000 Mini Index | 30 | March 2013 | $ | 2,539,800 | $ | 40,649 | ||||||||
| 12 | The accompanying notes are an integral part of these financial statements. |
GOLDMAN SACHS VARIABLE INSURANCE TRUST STRUCTURED SMALL CAP EQUITY FUND
Statement of Assets and Liabilities
December 31, 2012
| Assets: | ||||
Investments in unaffiliated issuers, at value (cost $89,931,003)(a) | $ | 102,233,008 | ||
Investments in affiliated securities lending reinvestment vehicle, at value which equals cost | 6,912,300 | |||
Cash | 3,069,508 | |||
Receivables: | ||||
Investments sold | 2,525,816 | |||
Dividends | 79,253 | |||
Fund shares sold | 77,421 | |||
Futures variation margin | 65,700 | |||
Securities lending income | 21,526 | |||
Reimbursement from investment adviser | 1,785 | |||
| Total assets | 114,986,317 | |||
| Liabilities: | ||||
Payables: | ||||
Payable upon return of securities loaned | 6,912,300 | |||
Investments purchased | 2,264,727 | |||
Amounts owed to affiliates | 68,277 | |||
Fund shares redeemed | 42,214 | |||
Accrued expenses | 63,779 | |||
| Total liabilities | 9,351,297 | |||
| Net Assets: | ||||
Paid-in capital | 101,764,371 | |||
Undistributed net investment income | 905,623 | |||
Accumulated net realized loss | (9,377,628 | ) | ||
Net unrealized gain | 12,342,654 | |||
| NET ASSETS | $ | 105,635,020 | ||
Net Assets: | ||||
Institutional | $ | 82,961,157 | ||
Service | 22,673,863 | |||
Total Net Assets | $ | 105,635,020 | ||
Shares of beneficial interest outstanding $0.001 par value (unlimited shares authorized): | ||||
Institutional | 6,529,307 | |||
Service | 1,791,900 | |||
Net asset value, offering and redemption price per share: | ||||
Institutional | $12.71 | |||
Service | 12.65 | |||
(a) Includes loaned securities having a market value of $6,917,326.
13
GOLDMAN SACHS VARIABLE INSURANCE TRUST STRUCTURED SMALL CAP EQUITY FUND
Statement of Operations
For the Fiscal Year Ended December 31, 2012
| Investment income: | ||||
Dividends | $ | 2,504,527 | ||
Securities lending income — affiliated issuer | 140,738 | |||
| Total investment income | 2,645,265 | |||
| Expenses: | ||||
Management fees | 838,056 | |||
Professional fees | 73,423 | |||
Printing and mailing costs | 65,374 | |||
Custody and accounting fees | 63,632 | |||
Distribution and Service fees — Service Class | 57,887 | |||
Transfer Agent fees(a) | 22,346 | |||
Trustee fees | 15,001 | |||
Other | 6,524 | |||
| Total expenses | 1,142,243 | |||
Less — expense reductions | (177,447 | ) | ||
| Net expenses | 964,796 | |||
| NET INVESTMENT INCOME | 1,680,469 | |||
| Realized and unrealized gain (loss): | ||||
Net realized gain from: | ||||
Investments (includes payment by affiliate relating to certain investment transactions of $334,715) | 18,613,993 | |||
Futures contracts | 349,052 | |||
Net change in unrealized gain (loss) on: | ||||
Investments | (7,229,599 | ) | ||
Futures contracts | 12,547 | |||
| Net realized and unrealized gain | 11,745,993 | |||
| NET INCREASE IN NET ASSETS RESULTING FROM OPERATIONS | $ | 13,426,462 | ||
(a) Institutional and Service Shares had Transfer Agent fees of $17,716 and $4,630, respectively.
| 14 | The accompanying notes are an integral part of these financial statements. |
GOLDMAN SACHS VARIABLE INSURANCE TRUST STRUCTURED SMALL CAP EQUITY FUND
Statements of Changes in Net Assets
| For the Fiscal Year Ended December 31, 2012 | For the Fiscal Year Ended December 31, 2011 | |||||||
| From operations: | ||||||||
Net investment income | $ | 1,680,469 | $ | 611,317 | ||||
Net realized gain (includes payment by affiliate relating to certain investment transactions) | 18,963,045 | 13,546,696 | ||||||
Net change in unrealized loss | (7,217,052 | ) | (13,399,715 | ) | ||||
| Net increase in net assets resulting from operations | 13,426,462 | 758,298 | ||||||
| Distributions to shareholders: | ||||||||
From net investment income | ||||||||
Institutional Shares | (973,309 | ) | (744,918 | ) | ||||
Service Shares | (210,796 | ) | (133,842 | ) | ||||
| Total distributions to shareholders | (1,184,105 | ) | (878,760 | ) | ||||
From share transactions: | ||||||||
Proceeds from sales of shares | 8,018,264 | 14,135,180 | ||||||
Reinvestment of distributions | 1,184,105 | 878,760 | ||||||
Cost of shares redeemed | (26,738,222 | ) | (38,039,237 | ) | ||||
| Net decrease in net assets resulting from share transactions | (17,535,853 | ) | (23,025,297 | ) | ||||
| TOTAL DECREASE | (5,293,496 | ) | (23,145,759 | ) | ||||
| Net assets: | ||||||||
Beginning of year | 110,928,516 | 134,074,275 | ||||||
End of year | $ | 105,635,020 | $ | 110,928,516 | ||||
| Undistributed net investment income | $ | 905,623 | $ | 443,217 | ||||
| The accompanying notes are an integral part of these financial statements. | 15 |
GOLDMAN SACHS VARIABLE INSURANCE TRUST STRUCTURED SMALL CAP EQUITY FUND
Financial Highlights
Selected Data for a Share Outstanding Throughout Each Year
| Income (loss) from investment operations | Distributions to shareholders | |||||||||||||||||||||||||||||||||||||||||||||||||||||||
| Year - Share Class | Net asset value, beginning of year | Net investment income | Net realized and unrealized gain (loss) | Total from investment operations | From net investment income | From net realized gains | Total distributions | Net asset value, end of year | Total return(a) | Net assets, (in 000s) | Ratio of net expenses to average net assets | Ratio of total expenses to average net assets | Ratio of net investment income to average net assets | Portfolio turnover rate(b) | ||||||||||||||||||||||||||||||||||||||||||
FOR THE FISCAL YEARS ENDED DECEMBER 31, | ||||||||||||||||||||||||||||||||||||||||||||||||||||||||
2012 - Institutional | $ | 11.40 | $ | 0.19 | (c)(d) | $ | 1.27 | (e) | $ | 1.46 | $ | (0.15 | ) | $ | — | $ | (0.15 | ) | $ | 12.71 | 12.79 | %(e) | $ | 82,961 | 0.81 | % | 0.97 | % | 1.55 | %(d) | 95 | % | ||||||||||||||||||||||||
2012 - Service | 11.35 | 0.17 | (c)(d) | 1.25 | (e) | 1.42 | (0.12 | ) | — | (0.12 | ) | 12.65 | 12.47 | (e) | 22,674 | 1.06 | 1.22 | 1.34 | (d) | 95 | ||||||||||||||||||||||||||||||||||||
2011 - Institutional | 11.42 | 0.06 | (c)(f) | 0.02 | (g) | 0.08 | (0.10 | ) | — | (0.10 | ) | 11.40 | 0.67 | 87,956 | 0.83 | 0.99 | 0.55 | (f) | 33 | |||||||||||||||||||||||||||||||||||||
2011– Service | 11.37 | 0.03 | (c)(f) | 0.02 | (g) | 0.05 | (0.07 | ) | — | (0.07 | ) | 11.35 | 0.41 | 22,973 | 1.08 | 1.24 | 0.30 | (f) | 33 | |||||||||||||||||||||||||||||||||||||
2010 - Institutional | 8.82 | 0.08 | (c)(h) | 2.58 | 2.66 | (0.06 | ) | — | (0.06 | ) | 11.42 | 30.12 | 106,646 | 0.85 | 0.97 | 0.82 | (h) | 63 | ||||||||||||||||||||||||||||||||||||||
2010 - Service | 8.78 | 0.06 | (c)(h) | 2.56 | 2.62 | (0.03 | ) | — | (0.03 | ) | 11.37 | 29.86 | 27,428 | 1.10 | 1.22 | 0.58 | (h) | 63 | ||||||||||||||||||||||||||||||||||||||
2009 - Institutional | 6.98 | 0.08 | (c)(i) | 1.85 | 1.93 | (0.09 | ) | — | (0.09 | ) | 8.82 | 27.67 | 95,334 | 0.86 | 1.02 | 1.03 | (i) | 212 | ||||||||||||||||||||||||||||||||||||||
2009 - Service | 6.96 | 0.07 | (c)(i) | 1.83 | 1.90 | (0.08 | ) | — | (0.08 | ) | 8.78 | 27.26 | 23,291 | 1.11 | 1.27 | 0.83 | (i) | 212 | ||||||||||||||||||||||||||||||||||||||
2008 - Institutional | 10.71 | 0.09 | (j) | (3.74 | ) | (3.65 | ) | (0.06 | ) | (0.02 | ) | (0.08 | ) | 6.98 | (33.95 | ) | 86,253 | 0.86 | 1.06 | 0.85 | (j) | 189 | ||||||||||||||||||||||||||||||||||
2008 - Service | 10.71 | 0.06 | (j) | (3.73 | ) | (3.67 | ) | (0.06 | ) | (0.02 | ) | (0.08 | ) | 6.96 | (34.16 | ) | 6,464 | 1.11 | 1.31 | 1.92 | (j) | 189 | ||||||||||||||||||||||||||||||||||
| (a) | Assumes investment at the net asset value at the beginning of the year, reinvestment of all distributions, and a complete redemption of the investment at the net asset value at the end of the year. |
| (b) | The Fund’s portfolio turnover rate is calculated in accordance with regulatory requirements, without regard to transactions involving short term investments and certain derivatives. If such transactions were included, the Fund’s portfolio turnover rate may be higher. |
| (c) | Calculated based on the average shares outstanding methodology. |
| (d) | Reflects income recognized from non-recurring special dividends which amounted to $0.08 per share and 0.62% of average net assets. |
| (e) | Reflects payment from affiliate relating to certain investment transactions which amounted to $0.04 per share. Excluding such payment, the total return would have been 12.44% and 12.12%, respectively. |
| (f) | Reflects income recognized from non-recurring special dividends which amounted to $0.02 per share and 0.21% of average net assets. |
| (g) | Reflects an increase of $0.02 due to payments received for class action settlements received this year. |
| (h) | Reflects income recognized from non-recurring special dividends which amounted to $0.04 per share and 0.43% of average net assets. |
| (i) | Reflects income recognized from non-recurring special dividends which amounted to $0.03 per share and 0.43% of average net assets. |
| (j) | Reflects income recognized from non-recurring special dividends which amounted to $0.01 per share and 0.14% of average net assets. |
| The accompanying notes are an integral part of these financial statements. | 16 |
GOLDMAN SACHS VARIABLE INSURANCE TRUST STRUCTURED SMALL CAP EQUITY FUND
Notes to Financial Statements
December 31, 2012
1. ORGANIZATION
Goldman Sachs Variable Insurance Trust (the “Trust” or “VIT”) is a Delaware statutory trust registered under the Investment Company Act of 1940, as amended (the “Act”), as an open-end management investment company. The Trust includes the Goldman Sachs Structured Small Cap Equity Fund (the “Fund”). The Fund is a diversified portfolio under the Act offering two classes of shares — Institutional Shares and Service Shares. Shares of the Trust are offered to separate accounts of participating life insurance companies for the purpose of funding variable annuity contracts and variable life insurance policies.
Goldman Sachs Asset Management, L.P. (“GSAM”), an affiliate of Goldman, Sachs & Co. (“Goldman Sachs”), serves as investment adviser to the Fund pursuant to a management agreement (the “Agreement”) with the Trust.
2. SIGNIFICANT ACCOUNTING POLICIES
The financial statements have been prepared in accordance with accounting principles generally accepted in the United States of America (“GAAP”) and require management to make estimates and assumptions that may affect the reported amounts and disclosures. Actual results may differ from those estimates and assumptions.
A. Investment Valuation — The Fund’s valuation policy is to value investments at fair value.
B. Investment Income and Investments — Investment income includes interest income and dividend income, net of any foreign withholding taxes, less any amounts reclaimable. Interest income is accrued daily and adjusted for amortization of premiums and accretion of discounts. Dividend income is recognized on ex-dividend date or, for certain foreign securities, as soon as such information is obtained subsequent to the ex-dividend date. Investment transactions are reflected on trade date. Realized gains and losses are calculated using identified cost. Investment transactions are recorded on the following business day for daily net asset value (“NAV”) calculations. Any foreign capital gains tax is accrued daily based upon net unrealized gains, and is payable upon sale of such investments. Distributions received from the Fund’s investments in United States (“U.S.”) real estate investment trusts (“REITs”) may be characterized as ordinary income, net capital gain or a return of capital. A return of capital is recorded by the Fund as a reduction to the cost basis of the REIT.
For derivative contracts, realized gains and losses are recorded upon settlement of the contract.
C. Class Allocations and Expenses — Investment income, realized and unrealized gain (loss), and non-class specific expenses of the Fund are allocated daily based upon the proportion of net assets of each class. Class specific expenses, where applicable, are borne by the respective share classes and include Distribution and Service and Transfer Agent fees. Non-class specific expenses directly incurred by a Fund are charged to that Fund, while such expenses incurred by the Trust are allocated across the respective Funds on a straight-line and/or pro-rata basis depending upon the nature of the expenses.
D. Federal Taxes and Distributions to Shareholders — It is the Fund’s policy to comply with the requirements of the Internal Revenue Code of 1986, as amended (the “Code”), applicable to regulated investment companies (mutual funds) and to distribute each year substantially all of its investment company taxable income and capital gains to its shareholders. Accordingly, the Fund is not required to make any provisions for the payment of federal income tax. Distributions to shareholders are recorded on the ex-dividend date. Income and capital gains distributions, if any, are declared and paid annually.
Net capital losses are carried forward to future fiscal years and may be used to the extent allowed by the Code to offset any future capital gains. Utilization of capital loss carryforwards will reduce the requirement of future capital gains distributions.
Under the Regulated Investment Company Modernization Act of 2010, the Fund is permitted to carry forward capital losses incurred in taxable years beginning after December 22, 2010 for an unlimited period. However, any losses incurred during those future taxable years will be required to be utilized prior to the losses incurred in pre-enactment taxable years. As a result of this ordering rule, pre-enactment capital loss carryforwards may be more likely to expire unused. Additionally, post-enactment capital losses that are carried forward will retain their character as either short-term or long term capital losses rather than being considered all short-term as under previous law.
The characterization of distributions to shareholders for financial reporting purposes is determined in accordance with federal income tax rules, which may differ from GAAP. The source of the Fund’s distributions may be shown in the accompanying financial statements as either from net investment income, net realized gain or capital. Certain components of the Fund’s net assets on the Statement of Assets and Liabilities reflect permanent GAAP/tax differences based on the appropriate tax character.
3. INVESTMENTS AND FAIR VALUE MEASUREMENTS
The fair value of a financial instrument is the amount that would be received to sell an asset or paid to transfer a liability in an orderly transaction between market participants at the measurement date (i.e., the exit price). GAAP establishes a fair value
17
GOLDMAN SACHS VARIABLE INSURANCE TRUST STRUCTURED SMALL CAP EQUITY FUND
Notes to Financial Statements (continued)
December 31, 2012
3. INVESTMENTS AND FAIR VALUE MEASUREMENTS (continued)
hierarchy that prioritizes the inputs to valuation techniques used to measure fair value. The hierarchy gives the highest priority to unadjusted quoted prices in active markets for identical assets or liabilities (Level 1 measurements) and the lowest priority to unobservable inputs (Level 3 measurements). The levels used for classifying investments are not necessarily an indication of the risk associated with investing in these investments. The three levels of the fair value hierarchy are described below:
Level 1 — Unadjusted quoted prices in active markets that are accessible at the measurement date for identical, unrestricted assets or liabilities;
Level 2 — Quoted prices in markets that are not active or financial instruments for which significant inputs are observable (including, but not limited to, quoted prices for similar investments, interest rates, foreign exchange rates, volatility and credit spreads), either directly or indirectly;
Level 3 — Prices or valuations that require significant unobservable inputs (including GSAM’s assumptions in determining fair value measurement).
The Trustees have adopted Valuation Procedures that govern the valuation of the portfolio investments held by the Fund, including investments for which market quotations are not readily available. The Trustees have delegated to GSAM day-to-day responsibility for implementing and maintaining internal controls and procedures related to the valuation of the Fund’s portfolio investment. To assess the continuing appropriateness of pricing sources and methodologies, GSAM regularly performs price verification procedures and issues challenges as necessary to third party pricing vendors or brokers, and any differences are reviewed in accordance with the Valuation Procedures.
A. Level 1 and Level 2 Fair Value Investments — The valuation techniques and significant inputs used in determining the fair values for investments classified as Level 1 and Level 2 are as follows:
Equity Securities — Equity securities and investment companies traded on a U.S. securities exchange or the NASDAQ system, or those located on certain foreign exchanges, including but not limited to the Americas, are valued daily at their last sale price or official closing price on the principal exchange or system on which they are traded. If no sale occurs, equity securities and exchange traded investment companies are valued at the last bid price for long positions and at the last ask price for short positions. Investments in investment companies (other than those that are exchange traded) are valued at the NAV on the valuation date. To the extent these investments are actively traded, they are classified as Level 1 of the fair value hierarchy.
Unlisted equity securities for which market quotations are available are valued at the last sale price on the valuation date, or if no sale occurs, at the last bid price. Securities traded on certain foreign securities exchanges are valued daily at fair value determined by an independent fair value service (if available) under valuation procedures approved by the trustees and consistent with applicable regulatory guidance. The independent fair value service takes into account multiple factors including, but not limited to, movements in the securities markets, certain depositary receipts, futures contracts and foreign currency exchange rates that have occurred subsequent to the close of the foreign securities exchange. Investments applying these valuation adjustments are classified as Level 2 of the fair value hierarchy.
Debt Securities — Debt securities for which market quotations are readily available are valued daily on the basis of quotations supplied by dealers or an independent pricing service approved by the trustees. The pricing services may use valuation models or matrix pricing, which consider: (i) yield or price with respect to bonds that are considered comparable in characteristics such as rating, interest rate and maturity date or (ii) quotations from securities dealers to determine current value. Short-term debt obligations that mature in sixty days or less and that do not exhibit signs of credit deterioration are valued at amortized cost, which approximates fair value. With the exception of treasury securities, which are generally classified as Level 1, these investments are generally classified as Level 2 of the fair value hierarchy.
Derivative contracts — A derivative is an instrument whose value is derived from underlying assets, indices, reference rates or a combination of these factors.
Exchange-traded derivatives, including futures contracts, typically fall within Level 1 of the fair value hierarchy. Over-the-counter (“OTC”) derivatives are valued using market transactions and other market evidence, including market-based inputs to models, calibration to market-clearing transactions, broker or dealer quotations, or other alternative pricing sources. Where models are used, the selection of a particular model to value an OTC derivative depends upon the contractual terms of, and specific risks inherent in, the instrument, as well as the availability of pricing information in the market. Valuation models require a variety of inputs, including contractual terms, market prices, yield curves, credit curves, measures of volatility, voluntary and involuntary prepayment rates, loss severity rates and correlations of such inputs. For OTC derivatives that trade in liquid markets, model inputs
18
GOLDMAN SACHS VARIABLE INSURANCE TRUST STRUCTURED SMALL CAP EQUITY FUND
3. INVESTMENTS AND FAIR VALUE MEASUREMENTS (continued)
can generally be verified and model selection does not involve significant management judgment. OTC derivatives are classified within Level 2 of the fair value hierarchy when significant inputs are corroborated by market evidence.
i. Futures Contracts — Futures contracts are contracts to buy or sell a standardized quantity of a specified commodity or security and are valued based on exchanged settlement prices or independent market quotes. Futures contracts are valued at the last settlement price, or in the absence of a sale, the last bid price for long positions and at the last ask price for short positions, at the end of each day on the board of trade or exchange upon which they are traded. Upon entering into a futures contract, the Fund deposits cash or securities in an account on behalf of the broker in an amount sufficient to meet the initial margin requirement. Subsequent payments are made or received by the Fund equal to the daily change in the contract value and are recorded as variation margin receivable or payable with a corresponding offset to unrealized gains or losses.
B. Level 3 Fair Value Investments — The valuation techniques and significant inputs used in determining the fair values for investments classified as Level 3 are as follows:
To the extent that the aforementioned significant inputs are unobservable, or if quotations are not readily available, or if GSAM believes that such quotations do not accurately reflect fair value, the fair value of the Fund’s investments may be determined under valuation procedures approved by the trustees. GSAM, consistent with its procedures and applicable regulatory guidance, may make an adjustment to the most recent valuation prices of either domestic or foreign securities in light of significant events to reflect what it believes to be the fair value of the securities at the time of determining a Fund’s NAV. Significant events which could affect a large number of securities in a particular market may include, but are not limited to: significant fluctuations in U.S. or foreign markets; market dislocations; market disruptions; or unscheduled market closings. Significant events which could also affect a single issuer may include, but are not limited to corporate actions such as reorganizations, mergers and buy-outs; ratings downgrades; and bankruptcies.
C. Fair Value Hierarchy — The following is a summary of the Fund’s investments and derivatives classified in the fair value hierarchy as of December 31, 2012:
| Investment Type | Level 1 | Level 2 | Level 3 | |||||||||
| Assets | ||||||||||||
| Common Stock and/or Other Equity Investments | $ | 102,233,008 | $ | — | $ | — | ||||||
| Securities Lending Reinvestment Vehicle | 6,912,300 | — | — | |||||||||
| Total | $ | 109,145,308 | $ | — | $ | — | ||||||
| Derivatives Type | ||||||||||||
| Assets | ||||||||||||
| Futures Contracts(a) | $ | 40,649 | $ | — | $ | — | ||||||
| (a) | Amount shown represents unrealized gain (loss) at fiscal year end. |
For further information regarding security characteristics, see the Schedule of Investments.
4. INVESTMENTS IN DERIVATIVES
The following table sets forth, by certain risk types, the gross value of derivative contracts as of December 31, 2012. These instruments were used to meet the Fund’s investment objectives and to obtain and/or manage exposure related to the risks below. The value in the table below excludes the effects of cash collateral received or posted pursuant to these derivative contracts, and therefore is not representative of the Fund’s net exposure.
| Risk | Statement of Assets and Liabilities | Assets(a) | ||||
| Equity | Unrealized gain on futures variation margin | $ | 40,649 | |||
| (a) | Includes unrealized gain (loss) on futures contracts described in the Additional Investment Information section of the Schedule of Investments. Only current day’s variation margin is reported within the Statement of Assets and Liabilities. |
19
GOLDMAN SACHS VARIABLE INSURANCE TRUST STRUCTURED SMALL CAP EQUITY FUND
Notes to Financial Statements (continued)
December 31, 2012
4. INVESTMENTS IN DERIVATIVES (continued)
The following table sets forth, by certain risk types, the Fund’s gains (losses) related to these derivatives and their indicative volumes for the fiscal year ended December 31, 2012. These gains (losses) should be considered in the context that these derivative contracts may have been executed to economically hedge certain investments, and accordingly, certain gains (losses) on such derivative contracts may offset certain (losses) gains attributable to investments. These gains (losses) are included in “Net realized gain (loss)” or “Net change in unrealized gain (loss)” on the Statement of Operations:
| Risk | Statement of Operations | Net Realized | Net Change in Unrealized Gain (Loss) | Average Number of Contracts(a) | ||||||||||
| Equity | Net realized gain (loss) from futures contracts/Net change in unrealized gain (loss) on futures contracts | $ | 349,052 | $ | 12,547 | 31 | ||||||||
| (a) | Average number of contracts is based on the average of month end balances for the fiscal year ended December 31, 2012. |
5. AGREEMENTS AND AFFILIATED TRANSACTIONS
A. Management Agreement — Under the Agreement, GSAM manages the Fund, subject to the general supervision of the trustees.
As compensation for the services rendered pursuant to the Agreement, the assumption of the expenses related thereto and administration of the Fund’s business affairs, including providing facilities, GSAM is entitled to a management fee, accrued daily and paid monthly, equal to an annual percentage rate of the Fund’s average daily net assets.
For the fiscal year ended December 31, 2012, contractual and effective net management fees with GSAM were at the following rates:
| Contractual Management Fee Rate | ||||||||||||||||||||||
| First $2 billion | Next $3 billion | Next $3 billion | Over $8 billion | Effective Rate | Effective Net Management Fee Rate | |||||||||||||||||
| 0.75% | 0.68 | % | 0.65 | % | 0.64 | % | 0.75 | % | 0.70 | %* | ||||||||||||
| * | GSAM agreed to waive a portion of its management fee in order to achieve the effective net management rate shown above through at least April 27, 2013. Prior to such date GSAM may not terminate the arrangement without the approval of the trustees. For the fiscal year ended December 31, 2012, GSAM waived approximately $55,900 of its management fee. |
B. Distribution and Service Plan — The Trust, on behalf of the Service Shares of the Fund, has adopted a Distribution and Service Plan (the “Plan”). Under the Plan, Goldman Sachs, which serves as distributor (the “Distributor”), is entitled to a fee accrued daily and paid monthly, for distribution services, which may then be paid by Goldman Sachs to authorized dealers, equal to, on an annual basis, 0.25% of the Fund’s average daily net assets attributable to Service Shares.
C. Transfer Agency Agreement — Goldman Sachs also serves as the transfer agent of the Fund for a fee pursuant to a Transfer Agency Agreement. The fees charged for such transfer agency services are accrued daily and paid monthly at an annual rate of 0.02% of the average daily net assets of Institutional and Service Shares.
D. Other Expense Agreements and Affiliated Transactions — GSAM has agreed to limit certain “Other Expense” of the Fund (excluding management fees, distribution and service fees, acquired fund fees and expenses, transfer agent fees and expenses, taxes, interest, brokerage fees, litigation, indemnification, shareholder meeting and other extraordinary expenses) to the extent such expenses exceed, on an annual basis, a percentage rate of the average daily net assets of the Fund. Such Other Expense reimbursements, if any, are accrued daily and paid monthly. In addition, the Fund is not obligated to reimburse GSAM for prior fiscal year expense reimbursements, if any. The Other Expense limitation as an annual percentage rate of average daily net assets for the Fund is 0.094%. These Other Expense reimbursements will remain in place through at least April 27, 2013, and prior to such date GSAM may not terminate the arrangement without the approval of the trustees. For the fiscal year ended, December 31, 2012, GSAM reimbursed approximately $118,900 to the Fund. In addition, the Fund has entered into certain offset arrangements with the custodian and the transfer agent, which may result in a reduction of the Fund’s expenses and are received irrespective of the application of the “Other Expense” limitation described above. For the fiscal year ended December 31, 2012, custody fee credits were approximately $2,600.
20
GOLDMAN SACHS VARIABLE INSURANCE TRUST STRUCTURED SMALL CAP EQUITY FUND
5. AGREEMENTS AND AFFILIATED TRANSACTIONS (continued)
As of December 31, 2012, the amounts owed to affiliates of the Fund were approximately $61,800, $4,700, and $1,800 for management, distribution and service, and transfer agent fees, respectively.
E. Line of Credit Facility — As of December 31, 2012, the Fund participated in a $630,000,000 committed, unsecured revolving line of credit facility (the “facility”) together with other funds of the Trust and registered investment companies having management agreements with GSAM or its affiliates (“Other Borrowers”). Pursuant to the terms of the facility, the Fund and Other Borrowers could increase the credit amount by an additional $340,000,000, for a total of up to $970,000,000. This facility is to be used solely for temporary or emergency purposes, which may include the funding of redemptions. The interest rate on borrowings is based on the federal funds rate. The facility also requires a fee to be paid by the Fund based on the amount of the commitment that has not been utilized. For the fiscal year ended December 31, 2012, the Fund did not have any borrowings under the facility. Prior to May 8, 2012, the amount available through the facility was $580,000,000.
F. Other Transactions with Affiliates — For the fiscal year ended December 31, 2012, Goldman Sachs earned approximately $600 in brokerage commissions from portfolio transactions, including futures transactions executed with Goldman Sachs as the Futures Commission Merchant, on behalf of the Fund.
On October 1, 2012, GSAM reimbursed the Fund in the amount of $334,715 to rectify a data issue in its portfolio management decision making process.
6. PORTFOLIO SECURITIES TRANSACTIONS
The cost of purchases and proceeds from sales and maturities of long-term securities for the fiscal year ended December 31, 2012, were $103,671,774 and $120,499,946, respectively.
7. SECURITIES LENDING
Pursuant to exemptive relief granted by the Securities and Exchange Commission (“SEC”) and the terms and conditions contained therein, the Fund may lend its securities through a securities lending agent, Goldman Sachs Agency Lending (“GSAL”), a wholly-owned subsidiary of Goldman Sachs, to certain qualified borrowers including Goldman Sachs and affiliates. In accordance with the Fund’s securities lending procedures, the Fund receives cash collateral at least equal to the market value of the securities on loan. The market value of the loaned securities is determined at the close of business of the Fund, at their last sale price or official closing price on the principal exchange or system on which they are traded, and any additional required collateral is delivered to the Fund on the next business day. As with other extensions of credit, the Fund may experience a delay in the recovery of its securities or incur a loss should the borrower of the securities breach its agreement with the Fund or become insolvent at a time when the collateral is insufficient to cover the cost of repurchasing securities on loan.
The Fund invests the cash collateral received in connection with securities lending Goldman Sachs transactions in the Goldman Sachs Financial Square Money Market Fund (“Money Market Fund”), a series of the Goldman Sachs Trust, a Delaware statutory trust. The Money Market Fund, deemed an affiliate of the Trust, is registered under the Act as an open end investment company, is subject to Rule 2a-7 under the Act and is managed by GSAM, for which GSAM may receive an investment advisory fee of up to 0.205% on an annualized basis of the average daily net assets of the Money Market Fund.
Both the Fund and GSAL received compensation relating to the lending of the Fund’s securities. The amount earned by the Fund for the fiscal year ended December 31, 2012 is reported under Investment Income on the Statement of Operations. A portion of this amount, $48,541, represents compensation earned by the Fund from lending its securities to Goldman Sachs. For the fiscal year ended December 31, 2012, GSAL earned $15,706 in fees as securities lending agent.
The following table provides information about the Fund’s investment in the Money Market Fund for the fiscal year ended December 31, 2012 (in thousands):
Number of Shares Held Beginning of Year | Shares Bought | Shares Sold | Number of Shares Held | Value at End of Year | ||||||||||||||
| 2,056 | 45,266 | (40,410 | ) | 6,912 | $ | 6,912 | ||||||||||||
21
GOLDMAN SACHS VARIABLE INSURANCE TRUST STRUCTURED SMALL CAP EQUITY FUND
Notes to Financial Statements (continued)
December 31, 2012
8. TAX INFORMATION
The tax character of distributions paid during the fiscal years ended December 31, 2011 and December 31, 2012 was as follows:
| 2011 | 2012 | |||||||
| Distributions paid from ordinary income | $ | 878,760 | $ | 1,184,105 | ||||
As of December 31, 2012, the components of accumulated earnings (losses) on a tax-basis were as follows:
| Undistributed ordinary income — net | $ | 777,841 | ||
| Capital loss carryforwards:(1) | ||||
Expiring 2017 | (7,962,084 | ) | ||
| Timing differences (Post October Loss Deferrals and other timing differences relating to REITs and other investments) | (1,006,470 | ) | ||
| Unrealized gains — net | 12,061,362 | |||
| Total accumulated gains — net | $ | 3,870,649 |
| (1) | Expiration occurs on December 31 of the year indicated. The Fund utilized $19,912,906 of capital losses in the current fiscal year. |
As of December 31, 2012, the Fund’s aggregate security unrealized gains and losses based on cost for U.S. federal income tax purposes were as follows:
| Tax cost | $ | 97,083,946 | ||
| Gross unrealized gain | 19,383,687 | |||
| Gross unrealized loss | (7,322,325 | ) | ||
| Net unrealized security gain | $ | 12,061,362 |
The difference between GAAP-basis and tax-basis unrealized gains (losses) is attributable primarily to wash sales, net mark to market gains (losses) on regulated futures contracts, and differences in the tax treatment of underlying fund investments.
In order to present certain components of the Fund’s capital accounts on a tax-basis, the Fund has reclassified $33,958 from undistributed net investment income to accumulated net realized gain(loss). These reclassifications have no impact on the net asset value of the Fund and result primarily from differences in the tax treatment of partnership investments, underlying fund investments, passive foreign investment company investments and real estate investment trust investments.
GSAM has reviewed the Fund’s tax positions for all open tax years (the current and prior three years, as applicable) and has concluded that no provision for income tax is required in the Fund’s financial statements. Such open tax years remain subject to examination and adjustment by tax authorities.
9. OTHER RISKS
The Fund’s risks include, but are not limited to, the following:
Shareholder Concentration Risk — Certain participating insurance companies, accounts, or Goldman Sachs affiliates may from time to time own (beneficially or of record) or control a significant percentage of the Fund’s shares. Redemptions by these entities of their holdings in the Fund may impact the Fund’s liquidity and NAV. These redemptions may also force the Fund to sell securities.
Liquidity Risk — The Fund may make investments that are illiquid or that may become less liquid in response to market developments or adverse investor perceptions. Illiquid investments may be more difficult to value. Liquidity risk may also refer to the risk that a Fund will not be able to pay redemption proceeds within the allowable time period because of unusual market conditions, an unusually high volume of redemption requests, or other reasons. To meet redemption requests, the Fund may be forced to sell investments at an unfavorable time and/or under unfavorable conditions.
22
GOLDMAN SACHS VARIABLE INSURANCE TRUST STRUCTURED SMALL CAP EQUITY FUND
9. OTHER RISKS (continued)
Market and Credit Risks — In the normal course of business, the Fund trades financial instruments and enters into financial transactions where risk of potential loss exists due to changes in the market (market risk). Additionally, the Fund may also be exposed to credit risk in the event that an issuer fails to perform or that an institution or entity with which the Fund has unsettled or open transactions defaults.
10. INDEMNIFICATIONS
Under the Trust’s organizational documents, its trustees, officers, employees and agents are indemnified, to the extent permitted by the Act, against certain liabilities that may arise out of performance of their duties to the Fund. Additionally, in the course of business, the Fund enters into contracts that contain a variety of indemnification clauses. The Fund’s maximum exposure under these arrangements is unknown, as this would involve future claims that may be made against the Fund that have not yet occurred. However, GSAM believes the risk of loss under these arrangements to be remote.
11. OTHER MATTERS
New Accounting Pronouncement — In December 2011, the Financial Accounting Standards Board issued an Accounting Standards Update (“ASU”) to enhance disclosures about financial instruments and derivative instruments that are subject to offsetting (“netting”) on the Statement of Assets and Liabilities. This information will enable users of the Fund’s financial statements to evaluate the effect or potential effect of netting arrangements on the Fund’s financial position. The ASU is effective for financial statements with fiscal years beginning on or after January 1, 2013, and interim periods within those fiscal years. At this time, GSAM is evaluating the implications of these changes on the financial statements.
12. SUBSEQUENT EVENTS
Subsequent events after the Statement of Assets and Liabilities date have been evaluated through the date the financial statements were issued. GSAM has concluded that there is no impact requiring adjustment or disclosure in the financial statements.
13. SUMMARY OF SHARE TRANSACTIONS
Share activity is as follows:
| For the Fiscal Year Ended December 31, 2012 | For the Fiscal Year Ended December 31, 2011 | |||||||||||||||
| Shares | Dollars | Shares | Dollars | |||||||||||||
| Institutional Shares | ||||||||||||||||
| Shares sold | 620,226 | $ | 7,785,373 | 1,149,991 | $ | 13,642,505 | ||||||||||
| Reinvestment of distributions | 77,554 | 973,309 | 65,458 | 744,918 | ||||||||||||
| Shares redeemed | (1,884,899 | ) | (23,416,189 | ) | (2,834,786 | ) | (32,782,326 | ) | ||||||||
| (1,187,119 | ) | (14,657,507 | ) | (1,619,337 | ) | (18,394,903 | ) | |||||||||
| Service Shares | ||||||||||||||||
| Shares sold | 18,946 | 232,891 | 45,603 | 492,675 | ||||||||||||
| Reinvestment of distributions | 16,864 | 210,796 | 11,803 | 133,842 | ||||||||||||
| Shares redeemed | (267,680 | ) | (3,322,033 | ) | (445,139 | ) | (5,256,911 | ) | ||||||||
| (231,870 | ) | (2,878,346 | ) | (387,733 | ) | (4,630,394 | ) | |||||||||
| NET DECREASE | (1,418,989 | ) | $ | (17,535,853 | ) | (2,007,070 | ) | $ | (23,025,297 | ) | ||||||
23
Report of Independent Registered Public Accounting Firm
To the Board of Trustees and Shareholders of
Goldman Sachs Variable Insurance Trust — Goldman Sachs Structured Small Cap Equity Fund:
In our opinion, the accompanying statement of assets and liabilities, including the schedule of investments, and the related statements of operations and of changes in net assets and the financial highlights present fairly, in all material respects, the financial position of Goldman Sachs Structured Small Cap Equity Fund (the “Fund”) at December 31, 2012 and the results of its operations, the changes in its net assets and the financial highlights for each of the periods indicated, in conformity with accounting principles generally accepted in the United States of America. These financial statements and financial highlights (hereafter referred to as “financial statements”) are the responsibility of the Fund’s management. Our responsibility is to express an opinion on these financial statements based on our audit. We conducted our audit of these financial statements in accordance with the standards of the Public Company Accounting Oversight Board (United States). Those standards require that we plan and perform the audit to obtain reasonable assurance about whether the financial statements are free of material misstatement. An audit includes examining, on a test basis, evidence supporting the amounts and disclosures in the financial statements, assessing the accounting principles used and significant estimates made by management, and evaluating the overall financial statement presentation. We believe that our audit, which included confirmation of securities at December 31, 2012 by correspondence with the custodian, transfer agent, brokers and the application of alternative auditing procedures where securities purchased confirmations had not been received, provides a reasonable basis for our opinion.
PricewaterhouseCoopers LLP
Boston, Massachusetts
February 14, 2013
24
GOLDMAN SACHS VARIABLE INSURANCE TRUST STRUCTURED SMALL CAP EQUITY FUND
| Fund Expenses — Six Month Period Ended December 31, 2012 (Unaudited) |
As a shareholder of Institutional or Service Shares of the Fund, you incur ongoing costs, including management fees, distribution and service (12b-1) fees (with respect to Service Shares) and other Fund expenses. This example is intended to help you understand your ongoing costs (in dollars) of investing in the Institutional Shares and Service Shares of the Fund and to compare these costs with the ongoing costs of investing in other mutual funds.
The example is based on an investment of $1,000 invested at the beginning of the period and held for the entire period from July 1, 2012 through December 31, 2012.
Actual Expenses — The first line under each share class in the table below provides information about actual account values and actual expenses. You may use the information in this line, together with the amount you invested, to estimate the expenses that you paid over the period. Simply divide your account value by $1,000 (for example, an $8,600 account value divided by $1,000=8.6), then multiply the result by the number in the first line under the heading entitled “Expenses Paid” to estimate the expenses you paid on your account during this period.
Hypothetical Example for Comparison Purposes — The second line under each share class in the table below provides information about hypothetical account values and hypothetical expenses based on the Fund's actual net expense ratio and an assumed rate of return of 5% per year before expenses, which is not the Fund's actual return. The hypothetical account values and expenses may not be used to estimate the actual ending account balance or expenses you paid for the period. You may use this information to compare the ongoing costs of investing in the Funds and other funds. To do so, compare this 5% hypothetical example with the 5% hypothetical examples that appear in the shareholder reports of the other funds.
Please note that the expenses shown in the table are meant to highlight your ongoing costs only. As a shareholder of the Fund you do not incur any transaction costs, such as sales charges, redemption fees, or exchange fees, but shareholders of other funds may incur such costs. The second line of the table is useful in comparing ongoing costs only, and will not help you determine the relative total costs of owning different funds whose shareholders may incur transaction costs.
| Share Class | Beginning Account Value 7/01/12 | Ending Account Value 12/31/12 | Expenses Paid for the 6 Months Ended 12/31/12* | |||||||||
| Institutional | ||||||||||||
| Actual | $ | 1,000 | $ | 1,046.60 | $ | 4.17 | ||||||
| Hypothetical 5% return | 1,000 | 1,021.06 | + | 4.12 | ||||||||
| Service | ||||||||||||
| Actual | 1,000 | 1,045.00 | 5.45 | |||||||||
| Hypothetical 5% return | 1,000 | 1,019.81 | + | 5.38 | ||||||||
| * | Expenses are calculated using the Fund’s annualized net expense ratio for each class, which represents the ongoing expenses as a percentage of net assets for the six months ended December 31, 2012. Expenses are calculated by multiplying the annualized net expense ratio by the average account value for the period; then multiplying the result by the number of days in the most recent fiscal half year; and then dividing that result by the number of days in the fiscal year. The annualized net expense ratios for the period were 0.81% and 1.06% for Institutional and Service Shares, respectively. |
| + | Hypothetical expenses are based on the Fund’s actual annualized net expense ratios and an assumed rate of return of 5% per year before expenses. |
25
GOLDMAN SACHS VARIABLE INSURANCE TRUST STRUCTURED SMALL CAP EQUITY FUND
Trustees and Officers (Unaudited)
Independent Trustees
Name, | Position(s) Held with the Trust | Term of Office and | Principal Occupation(s) During Past 5 Years | Number of Portfolios in Fund Complex Overseen by Trustee3 | Other Directorships Held by Trustee4 | |||||||
Ashok N. Bakhru Age: 70 | Chairman of the Board of Trustees | Since 1996 (Trustee since 1991) | Mr. Bakhru is retired. He is President, ABN Associates (1994-1996 and 1998-Present); Director, Apollo Investment Corporation (a business development company) (2008-Present); Member of Cornell University Council (1992-2004 and 2006-Present); and was formerly Trustee, Scholarship America (1998-2005); Trustee, Institute for Higher Education Policy (2003-2008); Director, Private Equity Investors — III and IV (1998-2007), and Equity-Linked Investors II (April 2002-2007).
Chairman of the Board of Trustees — Goldman Sachs Mutual Fund Complex. | 111 | Apollo Investment Corporation (a business development company) | |||||||
Donald C. Burke Age: 52 | Trustee | Since 2010 | Mr. Burke is retired. He is Director, Avista Corp. (2011-Present); and was formerly a Director, BlackRock Luxembourg and Cayman Funds (2006-2010); President and Chief Executive Officer, BlackRock U.S. Funds (2007-2009); Managing Director, BlackRock, Inc. (2006-2009); Managing Director, Merrill Lynch Investment Managers, L.P. (“MLIM”) (2006); First Vice President, MLIM (1997-2005); Chief Financial Officer and Treasurer, MLIM U.S. Funds (1999-2006).
Trustee — Goldman Sachs Mutual Fund Complex. | 110 | Avista Corp. (an energy company) | |||||||
John P. Coblentz, Jr. Age: 71 | Trustee | Since 2003 | Mr. Coblentz is retired. Formerly, he was Partner, Deloitte & Touche LLP (1975-2003); Director, Emerging Markets Group, Ltd. (2004-2006); and Director, Elderhostel, Inc. (2006-2012).
Trustee — Goldman Sachs Mutual Fund Complex. | 111 | None | |||||||
Diana M. Daniels Age: 63 | Trustee | Since 2007 | Ms. Daniels is retired. Formerly, she was Vice President, General Counsel and Secretary, The Washington Post Company (1991-2006). Ms. Daniels is a Vice Chairman of the Board of Trustees, Cornell University (2009-Present); Member, Advisory Board, Psychology Without Borders (international humanitarian aid organization) (2007-Present), and former Member of the Legal Advisory Board, New York Stock Exchange (2003-2006) and of the Corporate Advisory Board, Standish Mellon Management Advisors (2006-2007).
Trustee — Goldman Sachs Mutual Fund Complex. | 110 | None | |||||||
Joseph P. LoRusso Age: 55 | Trustee | Since 2010 | Mr. LoRusso is retired. Formerly, he was President, Fidelity Investments Institutional Services Co. (“FIIS”) (2002-2008); Director, FIIS (2002-2008); Director, Fidelity Investments Institutional Operations Company (2003-2007); Executive Officer, Fidelity Distributors Corporation (2007-2008).
Trustee — Goldman Sachs Mutual Fund Complex. | 110 | None | |||||||
Jessica Palmer Age: 63 | Trustee | Since 2007 | Ms. Palmer is retired. She is Director, Emerson Center for the Arts and Culture (2011-Present); and was formerly a Consultant, Citigroup Human Resources Department (2007-2008); Managing Director, Citigroup Corporate and Investment Banking (previously, Salomon Smith Barney/Salomon Brothers) (1984-2006). Ms. Palmer was a Member of the Board of Trustees of Indian Mountain School (private elementary and secondary school) (2004-2009).
Trustee — Goldman Sachs Mutual Fund Complex. | 110 | None | |||||||
Richard P. Strubel Age: 73 | Trustee | Since 1987 | Mr. Strubel is retired. Formerly, he was Director, Cardean Learning Group (provider of educational services via the internet) (2003-2008); Trustee, Emeritus, The University of Chicago (1987-Present).
Trustee — Goldman Sachs Mutual Fund Complex. | 111 | The Northern Trust Mutual Fund Complex (64 Portfolios) (Chairman of the Board of Trustees); Gildan Activewear Inc. (a clothing marketing and manufacturing company). | |||||||
26
GOLDMAN SACHS VARIABLE INSURANCE TRUST STRUCTURED SMALL CAP EQUITY FUND
Trustees and Officers (Unaudited) (continued)
Interested Trustees
Name, | Position(s) Held with the Trust | Term of Office and | Principal Occupation(s) During Past 5 Years | Number of Portfolios in Fund Complex Overseen by Trustee3 | Other Directorships Held by Trustee4 | |||||||
James A. McNamara* Age: 50 | President and Trustee | Since 2007 | Managing Director, Goldman Sachs (December 1998-Present); Director of Institutional Fund Sales, GSAM (April 1998-December 2000); and Senior Vice President and Manager, Dreyfus Institutional Service Corporation (January 1993- April 1998).
President — Goldman Sachs Mutual Fund Complex (November 2007-Present); Senior Vice President — Goldman Sachs Mutual Fund Complex (May 2007-November 2007); and Vice President — Goldman Sachs Mutual Fund Complex (2001-2007).
Trustee — Goldman Sachs Mutual Fund Complex (since November 2007 and December 2002-May 2004). | 111 | None | |||||||
Alan A. Shuch* Age: 63 | Trustee | Since 1990 | Advisory Director — GSAM (May 1999-Present); Consultant to GSAM (December 1994-May 1999); and Limited Partner, Goldman Sachs (December 1994-May 1999).
Trustee — Goldman Sachs Mutual Fund Complex. | 110 | None | |||||||
| * | These persons are considered to be “Interested Trustees” because they hold positions with Goldman Sachs and own securities issued by The Goldman Sachs Group, Inc. Each Interested Trustee holds comparable positions with certain other companies of which Goldman Sachs, GSAM or an affiliate thereof is the investment adviser, administrator and/or distributor. |
| 1 | Each Trustee may be contacted by writing to the Trustee, c/o Goldman Sachs, 200 West Street, New York, New York, 10282, Attn: Caroline Kraus. Information is provided as of December 31, 2012. |
| 2 | Each Trustee holds office for an indefinite term until the earliest of: (a) the election of his or her successor; (b) the date the Trustee resigns or is removed by the Board of Trustees or shareholders, in accordance with the Trust’s Declaration of Trust; (c) the conclusion of the first Board meeting held subsequent to the day the Trustee attains the age of 74 years (in accordance with the current resolutions of the Board of Trustees, which may be changed by the Trustees without shareholder vote); or (d) the termination of the Trust. |
| 3 | The Goldman Sachs Mutual Fund Complex consists of the Trust, Goldman Sachs Trust II, Goldman Sachs Municipal Opportunity Fund, Goldman Sachs Credit Strategies Fund, and Goldman Sachs Trust. As of December 31, 2012, the Trust consisted of 12 portfolios. Goldman Sachs Trust II consisted of 1 portfolio (which did not offer shares to the public); Goldman Sachs Municipal Opportunity Fund did not offer shares to the public; and Goldman Sachs Trust consisted of 96 portfolios (80 of which offered shares to the public). |
| 4 | This column includes only directorships of companies required to report to the Securities and Exchange Commission under the Securities Exchange Act of 1934 (i.e., “public companies”) or other investment companies registered under the Act. |
Additional information about the Trustees is available in the Fund’s Statement of Additional Information, which can be obtained from Goldman Sachs free of charge by calling this toll-free number (in the United States of America): 1-800-292-4726.
27
GOLDMAN SACHS VARIABLE INSURANCE TRUST STRUCTURED SMALL CAP EQUITY FUND
Trustees and Officers (Unaudited) (continued)
Officers of the Trust*
Name, Address and Age | Position(s) Held With the Trust | Term of Office and | Principal Occupation(s) During Past 5 Years | |||
| James A. McNamara 200 West Street New York, NY 10282 | President and Trustee | Since 2007 | Managing Director, Goldman Sachs (December 1998-Present); Director of Institutional Fund Sales, GSAM (April 1998-December 2000); and Senior Vice President and Manager, Dreyfus Institutional Service Corporation (January 1993-April 1998). President — Goldman Sachs Mutual Fund Complex (November 2007-Present); Senior Vice President — Goldman Sachs Mutual Fund Complex (May 2007-November 2007); and Vice President — Goldman Sachs Mutual Fund Complex (2001-2007). Trustee — Goldman Sachs Mutual Fund Complex (November 2007-Present and December 2002-May 2004). | |||
| George F. Travers 30 Hudson Street Jersey City, NJ 07302 | Senior Vice President and Principal Financial Officer | Since 2009 | Managing Director, Goldman Sachs (2007-Present); Managing Director, UBS Ag (2005-2007); and Partner, Deloitte & Touche LLP (1990-2005, partner from 2000-2005). Senior Vice President and Principal Financial Officer — Goldman Sachs Mutual Fund Complex. | |||
| Caroline Kraus 200 West Street New York, NY 10282 | Secretary | Since 2012 | Vice President, Goldman Sachs (August 2006-Present); Associate General Counsel, Goldman Sachs (2012-Present); Assistant General Counsel, Goldman Sachs (August 2006-December 2011) and Associate, Weil, Gotshal & Manges-LLP (2002-2006). Secretary — Goldman Sachs Mutual Fund Complex (August 2012-Present) and Assistant Secretary — Goldman Sachs Mutual Fund Complex (June 2012-August 2012). | |||
| Scott M. McHugh 200 West Street New York, NY 10282 | Treasurer and Senior Vice President | Since 2009 | Vice President, Goldman Sachs (February 2007-Present); Assistant Treasurer of certain mutual funds administered by DWS Scudder (2005-2007); and Director (2005-2007), Vice President (2000-2005) and Assistant Vice President (1998-2000), Deutsche Asset Management or its predecessor (1998-2007). Treasurer — Goldman Sachs Mutual Fund Complex (October 2009-Present); Senior Vice President — Goldman Sachs Mutual Fund Complex (November 2009-Present); and Assistant Treasurer — Goldman Sachs Mutual Fund Complex (May 2007-October 2009). | |||
| 1 | Officers hold office at the pleasure of the Board of Trustees or until their successors are duly elected and qualified. Each officer holds comparable positions with certain other companies of which Goldman Sachs, GSAM or an affiliate thereof is the investment adviser, administrator and/or distributor. Information is provided as of December 31, 2012. |
| * | Represents a partial list of officers of the Trust. Additional information about all the officers is available in the Fund’s Statement of Additional Information, which can be obtained from Goldman Sachs free of charge by calling this toll-free number (in the United States): 1-800-292-4726. |
Goldman Sachs Variable Insurance Trust — Tax Information (Unaudited)
For the year ended December 31, 2012, 100% of the dividends paid from net investment company taxable income by the Structured Small Cap Equity Fund qualify for the dividends received deduction available to corporations.
28
| TRUSTEES | OFFICERS | |
| Ashok N. Bakhru, Chairman | James A. McNamara, President | |
| Donald C. Burke | George F. Travers, Principal Financial Officer | |
| John P. Coblentz, Jr. | Caroline L. Kraus, Secretary | |
| Diana M. Daniels | Scott M. McHugh, Treasurer | |
| Joseph P. LoRusso | ||
| James A. McNamara | ||
| Jessica Palmer | ||
| Alan A. Shuch | ||
| Richard P. Strubel |
GOLDMAN, SACHS & CO.
Distributor and Transfer Agent
GOLDMAN SACHS ASSET MANAGEMENT, L.P.
Investment Adviser
200 West Street, New York
New York 10282
Visit our website at www.goldmansachsfunds.com/vit to obtain the most recent month-end returns.
The reports concerning the Fund included in this shareholder report may contain certain forward-looking statements about the factors that may affect the performance of the Fund in the future. These statements are based on Fund management’s predictions and expectations concerning certain future events and their expected impact on the Fund, such as performance of the economy as a whole and of specific industry sectors, changes in the levels of interest rates, the impact of developing world events, and other factors that may influence the future performance of the Fund. Management believes these forward-looking statements to be reasonable, although they are inherently uncertain and difficult to predict. Actual events may cause adjustments in portfolio management strategies from those currently expected to be employed.
A description of the policies and procedures that the Fund uses to determine how to vote proxies relating to portfolio securities and information regarding how the Fund voted proxies relating to portfolio securities for the 12-month period ended June 30 is available (i) without charge, upon request by calling 1-800-621-2550; and (ii) on the Securities and Exchange Commission (“SEC”) website at http://www.sec.gov.
The Fund files its complete schedule of portfolio holdings with the SEC for the first and third quarters of each fiscal year on Form N-Q. The Fund’s Form N-Q is available on the SEC’s website at http://www.sec.gov within 60 days after the Fund’s first and third fiscal quarters. The Fund’s Forms N-Q may be reviewed and copied at the SEC’s Public Reference Room in Washington, D.C. and information on the operation of the Public Reference Room may also be obtained by calling 1-800-SEC-0330. Forms N-Q may be obtained upon request and without charge by calling 1-800-621-2550.
Holdings and allocations shown are as of December 31, 2012 and may not be representative of future investments. Fund holdings should not be relied on in making investment decisions and should not be construed as research or investment advice regarding particular securities.
The Global Industry Classification Standard (“GICS”) was developed by and is the exclusive property and a service mark of Morgan Stanley Capital International Inc. (“MSCI”) and Standard & Poor’s, a division of The McGraw-Hill Companies, Inc. (“S&P”) and is licensed for use by Goldman Sachs. Neither MSCI, S&P nor any other party involved in making or compiling the GICS or any GICS classifications makes any express or implied warranties or representations with respect to such standard or classification (or the results to be obtained by the use thereof), and all such parties hereby expressly disclaim all warranties of originality, accuracy, completeness, merchantability or fitness for a particular purpose with respect to any of such standard or classification. Without limiting any of the foregoing, in no event shall MSCI, S&P, any of their affiliates or any third party involved in making or compiling the GICS or any GICS classifications have any liability for any direct, indirect, special, punitive, consequential or any other damages (including lost profits) even if notified of the possibility of such damages.
The portfolio risk management process includes an effort to monitor and manage risk, but does not imply low risk.
Shares of the Goldman Sachs VIT Funds are offered to separate accounts of participating life insurance companies for the purpose of funding variable annuity contracts and variable life insurance policies. Shares of the Fund are not offered directly to the general public. The variable annuity contracts and variable life insurance policies are described in the separate prospectuses issued by participating insurance companies. You should refer to those prospectuses for information about surrender charges, mortality and expense risk fees and other charges that may be assessed by participating insurance companies under the variable annuity contracts or variable life insurance policies. Such fees or charges, if any, may affect the return you may realize with respect to your investments. Ask your representative for more complete information. Please consider a fund’s objectives, risks and charges and expenses, and read the prospectus carefully before investing. The prospectus contains this and other information about the Fund.
This material is not authorized for distribution to prospective investors unless preceded or accompanied by a current Prospectus or summary prospectus, if applicable. Investors should consider a Fund’s objective, risks, and charges and expenses, and read the summary prospectus, if available, and/or the Prospectus carefully before investing or sending money. The summary prospectus, if available, and the Prospectus contain this and other information about a Fund and may be obtained from your Authorized Institution or from Goldman, Sachs & Co. by calling 1-800-621-2550.
Toll Free (in U.S.): 800-292-4726
This report is prepared for the general information of contract owners and is not an offer of shares of the Goldman Sachs Variable Insurance Trust: Goldman Sachs Structured Small Cap Equity Fund.
© 2013 Goldman Sachs. All rights reserved.
VITSTRSCAR13/92375.MF.MED.TMPL/2/2013
Goldman
Sachs Variable Insurance Trust
Goldman Sachs
Structured U.S. Equity Fund
Annual Report
December 31, 2012

GOLDMAN SACHS VARIABLE INSURANCE TRUST STRUCTURED U.S EQUITY FUND
Principal Investment Strategies and Risks
This is not a complete list of risks that may affect the Fund. For additional information concerning the risks applicable to the Fund, please see the Fund’s Prospectus.
Shares of the Goldman Sachs Variable Insurance Trust — Goldman Sachs Structured U.S. Equity Fund are offered to separate accounts of participating life insurance companies for the purpose of funding variable annuity contracts and variable life insurance policies. Shares of the Fund are not offered directly to the general public. The variable annuity contracts and variable life insurance policies are described in the separate prospectuses issued by participating insurance companies. You should refer to those prospectuses for information about surrender charges, mortality and expense risk fees and other charges that may be assessed by participating insurance companies under the variable annuity contracts or variable life insurance policies. Such fees or charges, if any, may affect the return you realize with respect to your investments. Ask your representative for more complete information. Please consider the Fund’s objective, risks and charges and expenses, and read the Prospectus carefully before investing. The Prospectus contains this and other information about the Fund.
The Goldman Sachs Structured U.S. Equity Fund invests primarily in a diversified portfolio of equity investments in U.S. issuers, including foreign issuers traded in the United States. The Fund’s equity investments will be subject to market risk, which means that the value of the securities in which it invests may go up or down in response to the prospects of individual companies, particular sectors and/or general economic conditions. The Investment Adviser’s use of quantitative models to execute investment strategy may fail to produce the intended result. Different investment styles (e.g., “quantitative”) tend to shift in and out of favor, and at times the Fund may underperform other funds that invest in similar asset classes. The Fund may have a high rate of portfolio turnover, which involves correspondingly greater expenses which must be borne by the Fund, and is also likely to result in short-term capital gains taxable to shareholders.
1
GOLDMAN SACHS VARIABLE INSURANCE TRUST STRUCTURED U.S. EQUITY FUND
INVESTMENT OBJECTIVE
The Fund seeks long-term growth of capital and dividend income.
Portfolio Management Discussion and Analysis
Below, the Goldman Sachs Quantitative Investment Strategies Team discusses the Goldman Sachs Variable Insurance Trust — Goldman Sachs Structured U.S. Equity Fund’s (the “Fund”) performance and positioning for the 12-month period ended December 31, 2012 (the “Reporting Period”).
How did the Fund perform during the Reporting Period?
During the Reporting Period, the Fund’s Institutional and Service Shares generated average annual total returns of 14.42% and 14.10%, respectively. These returns compare to the 15.96% average annual total return of the Fund’s benchmark, the Standard & Poor’s® 500 Index* (with dividends reinvested) (the “S&P 500 Index”) during the same time period.
What economic and market factors most influenced the equity markets as a whole during the Reporting Period?
Representing the U.S. equity market, the S&P® 500 Index gained 15.96% during the Reporting Period to mark the fourth straight year of gains. The year 2012 started with the strongest first quarter since 1998 for the S&P® 500 Index. Also during the first quarter of 2012, the Dow Jones Industrial Average closed above 13,000 for the first time since May 2008, and the NASDAQ reached a new 11-year high. U.S. equities rose largely on evidence that the labor and manufacturing markets were improving. In addition, the Fed reaffirmed its commitment to low interest rates until at least late-2014.
U.S. equity markets slid, however, during the second quarter of 2012, when first quarter Gross Domestic Product (“GDP”) was revised down from 2.2% to 1.9% and employment reports suggested deterioration in the labor market. Spain’s banking system bailout and increasing concerns over Europe’s financial crisis weighed on global equity markets, including the U.S. equity market, as well. At the same time, disappointing economic reports from faster growing regions of the world renewed fears of a global economic slowdown.
During the summer of 2012, U.S. equity markets rallied back on more strong statements from central banks. In September, the Fed announced another round of quantitative easing, dubbed QE3, this time with no expiration date but with the explicit goal of reducing unemployment. The Fed also extended its policy of near-zero interest rates until at least mid 2015. In Europe, the European Central Bank (“ECB”) president Mario Draghi voiced strong support for the euro and the European Monetary Union, which was well received by financial markets in the U.S. Continued improvements in home prices and the Fed’s commitment to buy mortgage-backed securities increased hopes of a recovery in the housing market, which helped offset the downward pressures of lackluster economic growth and a stalled labor market.
There were increasing signs of economic recovery seen early in the fourth quarter of 2012. The U.S. reported better than expected third quarter GDP growth of 2%, the 13th consecutive quarter of economic expansion, and the unemployment rate dropped to 7.8%, the lowest rate seen since January 2009. U.S. manufacturing activity increased, and the housing market showed further signs of improvement, as construction of new homes hit a four-year high. Despite this positive data, the U.S. equity market pulled back in October on some cautious corporate earnings guidance. Also pressuring the U.S. equity market were the worst storm in decades battering the East Coast and polls showing the U.S. presidential race tightening to a dead heat.
The U.S. equity market crept higher in November 2012, as election day preserved the status quo in the White House and Congress, even as the “fiscal cliff” drew nearer. Housing starts and measures of employment improved, and manufacturing and non-manufacturing surveys showed expansion in the economy. In December 2012, further clarification from the Fed, tying its low interest rate policy to the condition that unemployment drop to 6.5% or lower, helped to offset increasing worries about the then-looming fiscal cliff of tax increases and spending cuts.
For the Reporting Period as a whole, all ten sectors within the S&P® 500 Index posted gains. The consistent and persistent commitment to accommodative monetary policy from the U.S. Fed and other central banks drove market-leading returns in the
| * | The S&P 500 Index is the Standard & Poor’s 500 Composite Stock Prices Index of 500 stocks, an unmanaged index of common stock prices. The Index figures do not reflect any deduction for fees, expenses or taxes. It is not possible to invest directly in an unmanaged index. |
2
GOLDMAN SACHS VARIABLE INSURANCE TRUST STRUCTURED U.S. EQUITY FUND
financials sector. The heavily weighted financials sector was also the largest positive contributor (weight times performance) to S&P® 500 Index returns. On optimism about the economy and improved consumer confidence, the consumer discretionary sector also performed well. Conversely, the energy sector posted positive returns but was comparatively weak during the Reporting Period, as oil prices remained relatively stable, balancing continued unrest in several oil-producing regions with potential supply increases from U.S. shale production and a modest outlook for global economic growth.
All segments of the U.S. equity market advanced during the Reporting Period, with mid-cap stocks, as measured by the Russell Midcap® Index, gaining most, followed by large-cap stocks and then small-cap stocks, as measured by the Russell 1000® Index and the Russell 2000® Index, respectively, which performed similarly to each other. Large-cap stocks were least successful relative to small-cap stocks in the materials sector. From a style perspective, value-oriented stocks solidly outpaced growth-oriented stocks across the capitalization spectrum. In the large-cap segment of the U.S. equity market, growth-oriented stocks underperformed value-oriented stocks primarily in the financials sector. (All as measured by the Russell Investments indices.)
What key factors were responsible for the Fund’s performance during the Reporting Period?
Although our quantitative model and four of its six investment themes enhanced relative returns, the Fund underperformed the S&P 500 Index during the Reporting Period, largely because of its industry exposures and control factors. Our stock selection added to relative performance during the Reporting Period.
What impact did the Fund’s investment themes have on performance during the Reporting Period?
As expected, and in keeping with our investment approach, our quantitative model and its six investment themes (Valuation, Profitability, Quality, Management, Momentum and Sentiment) had the greatest impact on relative performance. We use these themes to take a long-term view of market patterns and look for inefficiencies, selecting stocks for the Fund and overweighting or underweighting the ones chosen by the model. Over time and by design, the performance of any one of the model’s investment themes tends to have a low correlation with the model’s other themes, demonstrating the diversification benefit of the Fund’s theme-driven quantitative model. The variance in performance supports our research indicating that the diversification provided by the Fund’s different investment themes is a significant investment advantage over the long term, even though the Fund may experience underperformance in the short term. Of course, diversification does not protect an investor from market risk nor does it ensure a profit.
During the Reporting Period, four of our six investment themes contributed positively to the Fund’s relative performance. The Momentum theme contributed most positively to the Fund’s relative performance during the Reporting Period, followed by Profitability, Valuation and Sentiment. The Momentum theme seeks to predict drifts in stock prices caused by delayed investor reaction to company-specific information and information about related companies. The Profitability theme assesses whether a company is earning more than its cost of capital. The Valuation theme attempts to capture potential mispricings of securities, typically by comparing a measure of the company’s intrinsic value to its market value. The Sentiment theme reflects selected investment views and decisions of individuals and financial intermediaries.
The Fund’s Management and Quality themes detracted. The Management theme assesses the characteristics, policies and strategic decisions of company managements. The Quality theme evaluates whether the company’s earnings are coming from more persistent, cash-based sources, as opposed to accruals.
How did the Fund’s sector and industry allocations affect relative performance?
In constructing the Fund’s portfolio, we focus on picking stocks rather than making industry or sector bets. Consequently, the Fund is similar to its benchmark, the S&P 500 Index, in terms of its industry and sector allocation and style. We manage the Fund’s industry and sector exposure by including industry factors in our risk model and by explicitly penalizing industry and sector deviations from the benchmark index in optimization. Sector weights or changes in sector weights generally do not have a meaningful impact on relative performance.
That said, despite the positive results from our investment themes, the contribution of the Fund’s industry exposures dragged down relative performance during the Reporting Period. Though its industry weightings were no larger or smaller than normal, the Fund was hurt most by its relative positioning in computers and peripherals, diversified financial services, food products, machinery, and communications equipment.
Did stock selection help or hurt Fund performance during the Reporting Period?
We seek to outpace the S&P 500 Index by overweighting stocks that we expect to outperform and underweighting those that we think may lag. We also build positions based on our thematic views. For example, the Fund aims to hold a basket of stocks with
3
GOLDMAN SACHS VARIABLE INSURANCE TRUST STRUCTURED U.S. EQUITY FUND
more favorable Momentum characteristics than the benchmark index. During the Reporting Period, stock selection overall contributed positively to the Fund’s relative performance.
Effective stock selection in the energy, materials and telecommunication services sectors made the biggest positive contribution to the Fund’s results relative to its benchmark index. Partially offsetting these contributors was stock selection in the consumer staples, financials and consumer discretionary sectors, which detracted most from the Fund’s results relative to the S&P 500 Index.
Which individual stock positions contributed the most to the Fund’s relative returns during the Reporting Period?
The Fund benefited most from overweight positions in biopharmaceutical company Gilead Sciences, integrated oil company Marathon Petroleum and diversified chemicals company LyondellBasell Industries. We chose to overweight Gilead Sciences due to our positive views on Profitability and Valuation. The overweight in Marathon Petroleum was the result of our positive views on Momentum and Profitability. The Fund was overweight LyondellBasell Industries given our positive views on Profitability and Quality.
Which individual positions detracted from the Fund’s results during the Reporting Period?
Detracting most from the Fund’s results relative to its benchmark index were overweight positions in nutritional supplement company Herbalife and mattress and pillow manufacturer Tempur-Pedic International and an underweight position in diversified banking institution Bank of America. The Fund had an overweight position in Herbalife due to our positive views on Profitability and Quality. The Fund was overweight Tempur-Pedic International because of our positive views on Momentum and Profitability. The Fund’s underweight in Bank of America was the result of our negative views on Sentiment and Profitability.
How did the Fund use derivatives during the Reporting Period?
During the Reporting Period, we did not use derivatives as part of an active management strategy to add value to the Fund’s results. However, we used equity index futures contracts, on an opportunistic basis, to equitize the Fund’s excess cash holdings. In other words, we put the Fund’s excess cash holdings to work by using them as collateral for the purchase of stock futures.
Did you make any enhancements to your quantitative models during the Reporting Period?
We continuously look for ways to improve our investment process. During the first quarter of 2012, we implemented an enhancement to our U.S. stock selection process with the introduction of a short-term model. Our alpha model forecasts returns using three- to 12-month horizons through which we create our long-term investment decisions. In addition to that, the short-term model now determines entry and exit points for trade execution. We believe this enhancement will further add value to our process.
During the second quarter of 2012, we implemented an enhancement to our stock selection process globally, incorporating several measures to the signals within our Valuation theme. These include cash flow signals, book value signals, dividend and buyback signals, forecasted and realized earnings signals and structural valuation signals. The signal weights are customized based on the stock’s industry, sector and geographic location. We believe these additional signals will help capture the intrinsic value of a company more effectively and further add value to our process.
During the fourth quarter of 2012, we implemented an enhancement to our stock selection process across several geographic regions, incorporating several measures to the signals within our Quality theme. These include measures of capital investment, funding source, earnings quality, competitive positioning and financial solvency. We believe these signals effectively capture both the investment quality attributable to management decisions as well as the quality attributable to firm economics. Additionally, we extended our Momentum theme in continental Europe, the U.K. and Japan using enhanced cross-company linkages. In continental Europe and the U.K., we link economically-related companies, which may or may not belong to the same industry. In Japan, we leverage the unique corporate infrastructure of the region, called Keiretsu, where cross share holding is common, to create a cross-company linkage signal. We believe these signals help identify momentum trends earlier in their history.
What was the Fund’s sector positioning relative to its benchmark index at the end of the Reporting Period?
As of December 31, 2012, the Fund was overweight the health care and energy sectors relative to the S&P 500 Index. The Fund was underweight consumer staples, industrials and telecommunication services and was rather neutrally weighted in consumer discretionary, information technology, financials, materials and utilities compared to the benchmark index on the same date.
What is your strategy going forward for the Fund?
Looking ahead, we continue to believe that less expensive stocks should outpace more expensive stocks, and stocks with good momentum are likely to outperform those with poor momentum. We intend to maintain our focus on seeking companies about
4
GOLDMAN SACHS VARIABLE INSURANCE TRUST STRUCTURED U.S. EQUITY FUND
which fundamental research analysts are becoming more positive as well as profitable companies with sustainable earnings and a track record of using their capital to enhance shareholder value. As such, we anticipate remaining fully invested with long-term performance likely to be the result of stock selection rather than sector or capitalization allocations.
We stand behind our investment philosophy that sound economic investment principles, coupled with a disciplined quantitative approach, can provide strong, uncorrelated returns over the long term. Our research agenda is robust, and we continue to enhance our existing models, add new proprietary forecasting signals and improve our trading execution as we seek to provide the most value to our shareholders.
5
FUND BASICS
Structured U.S. Equity Fund
as of December 31, 2012
STANDARDIZED TOTAL RETURNS1
| For the period ended 12/31/12 | One Year | Five Years | Ten Years | Since Inception | Inception Date | |||||||||||||
| Institutional | 14.42 | % | 0.51 | % | 6.08 | % | 3.21 | % | 02/13/98 | |||||||||
| Service | 14.10 | 0.30 | N/A | 1.26 | 01/09/06 | |||||||||||||
| 1 | The Standardized Total Returns are average annual total returns as of the most recent calendar quarter-end. They assume reinvestment of all distributions at net asset value (“NAV”). Because Institutional Shares and Service Shares do not involve a sales charge, such a charge is not applied to their Standardized Total Returns. |
Total return figures in the above chart represent past performance and do not indicate future results, which will vary. The investment return and principal value of an investment will fluctuate and, therefore, an investor’s shares, when redeemed, may be worth more or less than their original cost. Current performance may be lower or higher than the total return figures in the above chart. Please visit www.goldmansachsfunds.com/vit to obtain the most recent month-end returns. Performance reflects fee waivers and/or expense limitations in effect. In their absence, performance would be reduced.
EXPENSE RATIOS2
| Net Expense Ratio (Current) | Gross Expense Ratio (Before Waivers) | |||||||
| Institutional | 0.64 | % | 0.70 | % | ||||
| Service | 0.85 | 0.95 | ||||||
| 2 | The expense ratios of the Fund, both current (net of applicable fee waivers and/or expense limitations) and before waivers (gross of applicable fee waivers and/or expense limitations) are as set forth above according to the most recent publicly available Prospectus for the Fund and may differ from the expense ratios disclosed in the Financial Highlights in this report. The Fund’s waivers and/or expense limitations will remain in place through at least April 27, 2013, and prior to such date the investment adviser may not terminate the arrangements without the approval of the Fund’s Board of Trustees. If these arrangements are discontinued in the future, the expense ratios may change without shareholder approval. |
TOP TEN HOLDINGS AS OF 12/31/123
| Holding | % of Net Assets | Line of Business | ||||
| Apple, Inc. | 4.0% | Technology Hardware & Equipment | ||||
| Exxon Mobil Corp. | 3.9 | Energy | ||||
| JPMorgan Chase & Co. | 2.6 | Diversified Financials | ||||
| Pfizer, Inc. | 2.4 | Pharmaceuticals, Biotechnology & Life Sciences | ||||
| Microsoft Corp. | 2.2 | Software & Services | ||||
| Johnson & Johnson | 2.0 | Pharmaceuticals, Biotechnology & Life Sciences | ||||
| Berkshire Hathaway, Inc. Class B | 1.9 | Insurance | ||||
| Merck & Co., Inc. | 1.8 | Pharmaceuticals, Biotechnology & Life Sciences | ||||
| Occidental Petroleum Corp. | 1.7 | Energy | ||||
| News Corp. Class A | 1.7 | Media | ||||
| 3 | The top 10 holdings may not be representative of the Fund’s future investments. |
6
FUND BASICS
FUND vs. BENCHMARK SECTOR ALLOCATIONS4
As of December 31, 2012
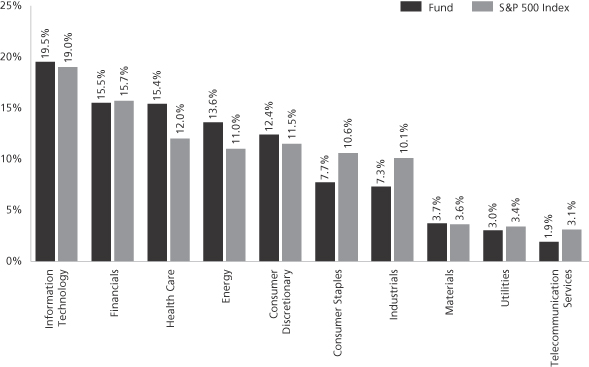
| 4 | The Fund is actively managed and, as such, its composition may differ over time. Consequently, the Fund’s overall sector allocations may differ from percentages contained in the graph above. The graph categorizes investments using Global Industry Classification Standard (“GICS”), however, the sector classifications used by the portfolio management team may differ from GICS. The percentage shown for each investment category reflects the value of investments in that category as a percentage of market value (excluding investments in the securities lending reinvestment vehicle, if any). Investments in the securities lending reinvestment vehicle represented 1.1% of the Fund’s net assets at December 31, 2012. The graph depicts the Fund’s investments but may not represent the Fund’s market exposure due to the exclusion of certain derivatives, if any, as listed in the Additional Investment Information section of the Schedule of Investments. |
7
GOLDMAN SACHS VARIABLE INSURANCE TRUST STRUCTURED U.S. EQUITY FUND
Performance Summary
December 31, 2012
The following graph shows the value, as of December 31, 2012, of a $10,000 investment made on January 1, 2003 in the Institutional Shares at NAV. For comparative purposes, the performance of the Fund’s benchmark, the S&P 500 Index (with dividends reinvested), is shown. This performance data represents past performance and should not be considered indicative of future performance, which will fluctuate with changes in market conditions. These performance fluctuations will cause an investor’s shares, when redeemed, to be worth more or less than their original cost. Performance reflects Fund level expenses but does not reflect fees and expenses associated with any variable annuity contract or variable life insurance policy that uses the Fund as an investment option for any contract or policy. Had performance reflected all of those fees and expenses, performance would have been reduced. Performance also would have been reduced had expense limitations not been in effect. Performance of Service Shares will vary from Institutional Shares due to differences in class specific fees. In addition to the investment adviser’s decisions regarding issuer/industry investment selection and allocation, other factors may affect Fund performance. These factors include, but are not limited to, Fund operating fees and expenses, portfolio turnover, and subscription and redemption cash flows affecting the Fund.
Structured U.S. Equity Fund’s 10 Year Performance
Performance of a $10,000 investment, with distributions reinvested, from January 1, 2003 through December 31, 2012.
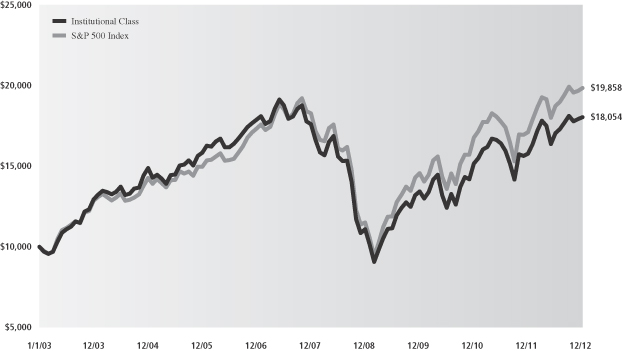
| Average Annual Total Return through December 31, 2012 | One Year | Five Years | Ten Years | Since Inception | ||||||
Institutional (Commenced February 13, 1998) | 14.42% | 0.51% | 6.08% | 3.21% | ||||||
Service (Commenced January 9, 2006) | 14.10% | 0.30% | N/A | 1.26% | ||||||
| ||||||||||
8
GOLDMAN SACHS VARIABLE INSURANCE TRUST STRUCTURED U.S. EQUITY FUND
Schedule of Investments
December 31, 2012
| Shares | Description | Value | ||||||
| Common Stocks – 97.8% | ||||||||
| Automobiles & Components – 0.2% |
| ||||||
| 24,841 | General Motors Co* | $ | 716,166 | |||||
|
| |||||||
| Banks – 2.3% | |||||||
| 8,176 | M&T Bank Corp. | 805,091 | ||||||
| 94,122 | PNC Financial Services Group, Inc. | 5,488,254 | ||||||
| 58,596 | Wells Fargo & Co. | 2,002,811 | ||||||
|
| |||||||
| 8,296,156 | ||||||||
|
| |||||||
| Capital Goods – 5.2% |
| ||||||
| 18,196 | Emerson Electric Co. | 963,660 | ||||||
| 4,223 | Fluor Corp. | 248,059 | ||||||
| 285,762 | General Electric Co. | 5,998,144 | ||||||
| 6,948 | Harsco Corp. | 163,278 | ||||||
| 44,387 | Honeywell International, Inc. | 2,817,243 | ||||||
| 5,532 | Huntington Ingalls Industries, Inc. | 239,757 | ||||||
| 10,384 | MSC Industrial Direct Co., Inc. Class A | 782,746 | ||||||
| 30,129 | Navistar International Corp.*(a) | 655,908 | ||||||
| 4,919 | Oshkosh Corp.* | 145,848 | ||||||
| 34,799 | Raytheon Co. | 2,003,031 | ||||||
| 2,469 | Regal-Beloit Corp. | 173,990 | ||||||
| 27,479 | The Boeing Co. | 2,070,818 | ||||||
| 48,374 | The Toro Co. | 2,079,115 | ||||||
| 9,074 | WABCO Holdings, Inc.* | 591,534 | ||||||
|
| |||||||
| 18,933,131 | ||||||||
|
| |||||||
| Commercial & Professional Services – 0.9% | |||||||
| 4,405 | Avery Dennison Corp. | 153,823 | ||||||
| 37,599 | The ADT Corp. | 1,747,978 | ||||||
| 49,042 | Tyco International Ltd. | 1,434,478 | ||||||
|
| |||||||
| 3,336,279 | ||||||||
|
| |||||||
| Consumer Durables & Apparel – 0.1% |
| ||||||
| 575 | NVR, Inc.* | 529,000 | ||||||
|
| |||||||
| Consumer Services – 4.4% |
| ||||||
| 130,821 | Carnival Corp. | 4,810,288 | ||||||
| 75,363 | Marriott International, Inc. Class A | 2,808,779 | ||||||
| 3,162 | McDonald’s Corp. | 278,920 | ||||||
| 23,072 | Starbucks Corp. | 1,237,121 | ||||||
| 44,962 | Wyndham Worldwide Corp. | 2,392,428 | ||||||
| 33,060 | Wynn Resorts Ltd. | 3,718,919 | ||||||
| 13,097 | Yum! Brands, Inc. | 869,641 | ||||||
|
| |||||||
| 16,116,096 | ||||||||
|
| |||||||
| Diversified Financials – 6.4% |
| ||||||
| 3,683 | Ameriprise Financial, Inc. | 230,666 | ||||||
| 25,925 | BlackRock, Inc. | 5,358,957 | ||||||
| 213,613 | JPMorgan Chase & Co. | 9,392,564 | ||||||
| 13,464 | Leucadia National Corp. | 320,309 | ||||||
| 26,554 | Moody’s Corp. | 1,336,197 | ||||||
| 102,668 | Morgan Stanley | 1,963,012 | ||||||
| 74,841 | SEI Investments Co. | 1,746,789 | ||||||
| 59,546 | State Street Corp. | 2,799,257 | ||||||
|
| |||||||
| 23,147,751 | ||||||||
|
| |||||||
| Common Stocks – (continued) | ||||||||
| Energy – 13.3% |
| ||||||
| 45,761 | Chevron Corp. | $ | 4,948,595 | |||||
| 99,448 | ConocoPhillips | 5,766,989 | ||||||
| 163,043 | Exxon Mobil Corp. | 14,111,372 | ||||||
| 66,107 | Hess Corp. | 3,501,027 | ||||||
| 82,278 | Marathon Petroleum Corp. | 5,183,514 | ||||||
| 32,373 | McDermott International, Inc.* | 356,750 | ||||||
| 72,076 | Murphy Oil Corp. | 4,292,126 | ||||||
| 81,299 | Occidental Petroleum Corp. | 6,228,316 | ||||||
| 14,513 | Phillips 66 | 770,640 | ||||||
| 44,636 | Tesoro Corp. | 1,966,216 | ||||||
| 17,197 | Ultra Petroleum Corp.*(a) | 311,782 | ||||||
| 26,811 | Valero Energy Corp. | 914,791 | ||||||
|
| |||||||
| 48,352,118 | ||||||||
|
| |||||||
| Food & Staples Retailing – 1.6% |
| ||||||
| 109,091 | CVS Caremark Corp. | 5,274,550 | ||||||
| 13,078 | Walgreen Co. | 484,017 | ||||||
|
| |||||||
| 5,758,567 | ||||||||
|
| |||||||
| Food, Beverage & Tobacco – 3.7% |
| ||||||
| 185,360 | Archer-Daniels-Midland Co. | 5,077,011 | ||||||
| 6,847 | Dean Foods Co.* | 113,044 | ||||||
| 2,205 | Ingredion, Inc. | 142,068 | ||||||
| 16,123 | Lorillard, Inc. | 1,881,071 | ||||||
| 52,727 | Philip Morris International, Inc. | 4,410,086 | ||||||
| 32,245 | Reynolds American, Inc. | 1,335,910 | ||||||
| 27,933 | Tyson Foods, Inc. Class A | 541,900 | ||||||
|
| |||||||
| 13,501,090 | ||||||||
|
| |||||||
| Health Care Equipment & Services – 0.8% |
| ||||||
| 11,155 | Abbott Laboratories | 730,652 | ||||||
| 50,156 | Cardinal Health, Inc. | 2,065,424 | ||||||
|
| |||||||
| 2,796,076 | ||||||||
|
| |||||||
| Household & Personal Products – 2.2% |
| ||||||
| 6,076 | Colgate-Palmolive Co. | 635,185 | ||||||
| 96,784 | Herbalife Ltd.(a) | 3,188,065 | ||||||
| 9,834 | Kimberly-Clark Corp. | 830,285 | ||||||
| 12,050 | Nu Skin Enterprises, Inc. Class A | 446,452 | ||||||
| 42,719 | The Procter & Gamble Co. | 2,900,193 | ||||||
|
| |||||||
| 8,000,180 | ||||||||
|
| |||||||
| Insurance – 3.9% |
| ||||||
| 18,170 | Assurant, Inc. | 630,499 | ||||||
| 77,764 | Berkshire Hathaway, Inc. Class B* | 6,975,431 | ||||||
| 29,745 | MetLife, Inc. | 979,800 | ||||||
| 101,230 | Prudential Financial, Inc. | 5,398,596 | ||||||
|
| |||||||
| 13,984,326 | ||||||||
|
| |||||||
| Materials – 3.7% |
| ||||||
| 10,319 | Allegheny Technologies, Inc. | 313,285 | ||||||
| 23,049 | CF Industries Holdings, Inc. | 4,682,635 | ||||||
| 11,067 | Cliffs Natural Resources, Inc.(a) | 426,744 | ||||||
| 9,355 | Commercial Metals Co. | 139,015 | ||||||
| 27,277 | Freeport-McMoRan Copper & Gold, Inc. | 932,873 | ||||||
|
| |||||||
| The accompanying notes are an integral part of these financial statements. | 9 |
GOLDMAN SACHS VARIABLE INSURANCE TRUST STRUCTURED U.S. EQUITY FUND
Schedule of Investments (continued)
December 31, 2012
| Shares | Description | Value | ||||||
| Common Stocks – (continued) | ||||||||
| Materials – (continued) |
| ||||||
| 94,343 | LyondellBasell Industries NV Class A | $ | 5,386,042 | |||||
| 6,809 | Newmont Mining Corp. | 316,210 | ||||||
| 26,279 | Nucor Corp. | 1,134,727 | ||||||
|
| |||||||
| 13,331,531 | ||||||||
|
| |||||||
| Media – 5.1% |
| ||||||
| 128,573 | Cablevision Systems Corp. Class A | 1,920,881 | ||||||
| 80,388 | CBS Corp. Class B | 3,058,763 | ||||||
| 8,740 | Comcast Corp. Class A | 314,203 | ||||||
| 37,810 | DIRECTV* | 1,896,550 | ||||||
| 98,464 | DISH Network Corp. Class A | 3,584,089 | ||||||
| 240,251 | News Corp. Class A | 6,136,010 | ||||||
| 28,093 | Viacom, Inc. Class B | 1,481,625 | ||||||
|
| |||||||
| 18,392,121 | ||||||||
|
| |||||||
| Pharmaceuticals, Biotechnology & Life Sciences – 14.3% |
| ||||||
| 9,110 | Alexion Pharmaceuticals, Inc.* | 854,609 | ||||||
| 38,496 | Amgen, Inc. | 3,322,975 | ||||||
| 23,398 | Biogen Idec, Inc.* | 3,431,785 | ||||||
| 185,618 | Bristol-Myers Squibb Co. | 6,049,291 | ||||||
| 69,156 | Celgene Corp.* | 5,443,960 | ||||||
| 51,054 | Eli Lilly & Co. | 2,517,983 | ||||||
| 24,320 | Gilead Sciences, Inc.* | 1,786,304 | ||||||
| 40,608 | Hospira, Inc.* | 1,268,594 | ||||||
| 104,869 | Johnson & Johnson | 7,351,317 | ||||||
| 158,572 | Merck & Co., Inc. | 6,491,938 | ||||||
| 6,763 | Mylan, Inc.* | 185,847 | ||||||
| 32,315 | Myriad Genetics, Inc.* | 880,584 | ||||||
| 341,076 | Pfizer, Inc. | 8,554,186 | ||||||
| 19,925 | United Therapeutics Corp.* | 1,064,393 | ||||||
| 28,367 | Vertex Pharmaceuticals, Inc.* | 1,189,712 | ||||||
| 89,804 | Warner Chilcott PLC Class A | 1,081,240 | ||||||
| 3,035 | Watson Pharmaceuticals, Inc.* | 261,010 | ||||||
|
| |||||||
| 51,735,728 | ||||||||
|
| |||||||
| Real Estate Investment Trust – 2.7% |
| ||||||
| 65,069 | American Tower Corp. | 5,027,881 | ||||||
| 89,677 | Rayonier, Inc. | 4,647,959 | ||||||
|
| |||||||
| 9,675,840 | ||||||||
|
| |||||||
| Retailing – 2.2% |
| ||||||
| 16,541 | AutoNation, Inc.* | 656,678 | ||||||
| 72,177 | Liberty Interactive Corp. Class A* | 1,420,443 | ||||||
| 8,834 | Priceline.com, Inc.* | 5,487,681 | ||||||
| 13,096 | Urban Outfitters, Inc.* | 515,458 | ||||||
|
| |||||||
| 8,080,260 | ||||||||
|
| |||||||
| Semiconductors & Semiconductor Equipment – 1.0% |
| ||||||
| 46,835 | Broadcom Corp. Class A* | 1,555,391 | ||||||
| 35,549 | Cypress Semiconductor Corp.* | 385,351 | ||||||
| 57,132 | Intel Corp. | 1,178,633 | ||||||
| 11,208 | Lam Research Corp.* | 404,945 | ||||||
|
| |||||||
| 3,524,320 | ||||||||
|
| |||||||
| Common Stocks – (continued) | ||||||||
| Software & Services – 10.8% |
| ||||||
| 47,949 | Accenture PLC Class A | $ | 3,188,609 | |||||
| 168,445 | Activision Blizzard, Inc. | 1,788,886 | ||||||
| 38,797 | AOL, Inc.* | 1,148,779 | ||||||
| 8,320 | CA, Inc. | 182,874 | ||||||
| 28,584 | Computer Sciences Corp. | 1,144,789 | ||||||
| 33,113 | eBay, Inc.* | 1,689,425 | ||||||
| 7,098 | Google, Inc. Class A* | 5,035,108 | ||||||
| 22,254 | International Business Machines Corp. | 4,262,754 | ||||||
| 33,827 | Lender Processing Services, Inc. | 832,821 | ||||||
| 12,303 | Mastercard, Inc. Class A | 6,044,218 | ||||||
| 299,791 | Microsoft Corp. | 8,013,413 | ||||||
| 101,971 | Oracle Corp. | 3,397,674 | ||||||
| 28,543 | TIBCO Software, Inc.* | 628,231 | ||||||
| 26,320 | VeriSign, Inc.* | 1,021,742 | ||||||
| 39,149 | Yahoo!, Inc.* | 779,065 | ||||||
|
| |||||||
| 39,158,388 | ||||||||
|
| |||||||
| Technology Hardware & Equipment – 7.3% |
| ||||||
| 27,048 | Apple, Inc. | 14,417,396 | ||||||
| 12,955 | Avnet, Inc.* | 396,553 | ||||||
| 272,412 | Corning, Inc. | 3,437,839 | ||||||
| 6,742 | EchoStar Corp. Class A* | 230,711 | ||||||
| 13,175 | Molex, Inc. | 360,073 | ||||||
| 73,417 | QUALCOMM, Inc. | 4,553,322 | ||||||
| 16,591 | Seagate Technology PLC | 505,694 | ||||||
| 59,433 | Western Digital Corp. | 2,525,308 | ||||||
|
| |||||||
| 26,426,896 | ||||||||
|
| |||||||
| Telecommunication Services – 1.8% |
| ||||||
| 157,208 | AT&T, Inc.(b) | 5,299,482 | ||||||
| 31,989 | Verizon Communications, Inc. | 1,384,164 | ||||||
|
| |||||||
| 6,683,646 | ||||||||
|
| |||||||
| Transportation – 1.0% |
| ||||||
| 37,583 | CSX Corp. | 741,513 | ||||||
| 57,623 | Hertz Global Holdings, Inc.* | 937,526 | ||||||
| 6,172 | Norfolk Southern Corp. | 381,676 | ||||||
| 12,366 | Union Pacific Corp. | 1,554,654 | ||||||
|
| |||||||
| 3,615,369 | ||||||||
|
| |||||||
| Utilities – 2.9% |
| ||||||
| 17,328 | Ameren Corp. | 532,316 | ||||||
| 32,210 | Consolidated Edison, Inc. | 1,788,943 | ||||||
| 21,005 | Entergy Corp. | 1,339,069 | ||||||
| 43,644 | Integrys Energy Group, Inc. | 2,279,090 | ||||||
| 26,062 | Pinnacle West Capital Corp. | 1,328,641 | ||||||
| 76,604 | The Southern Co. | 3,279,417 | ||||||
|
| |||||||
| 10,547,476 | ||||||||
|
| |||||||
| | TOTAL INVESTMENTS BEFORE SECURITIES LENDING REINVESTMENT VEHICLE | | ||||||
| (Cost $316,162,452) | $ | 354,638,511 | ||||||
|
| |||||||
| 10 | The accompanying notes are an integral part of these financial statements. |
GOLDMAN SACHS VARIABLE INSURANCE TRUST STRUCTURED U.S. EQUITY FUND
| Shares | Rate | Value | ||||||
| Securities Lending Reinvestment Vehicle(c)(d) – 1.1% | ||||||||
| Goldman Sachs Financial Square Money Market Fund — | | ||||||
| 3,848,500 | 0.132% | $ | 3,848,500 | |||||
| (Cost $3,848,500) | ||||||||
|
| |||||||
| TOTAL INVESTMENTS – 98.9% | ||||||||
| (Cost $320,010,952) | $ | 358,487,011 | ||||||
|
| |||||||
| OTHER ASSETS IN EXCESS OF | 4,163,925 | ||||||
|
| |||||||
| NET ASSETS – 100.0% | $ | 362,650,936 | ||||||
|
| |||||||
The percentage shown for each investment category reflects the value of investments in that category as a percentage of net assets. | ||
| * | Non-income producing security. | |
| (a) | All or a portion of security is on loan. | |
| (b) | All or a portion of security is segregated as collateral for initial margin requirements on futures transactions. | |
| (c) | Variable rate security. Interest rate disclosed is that which is in effect at December 31, 2012. | |
| (d) | Represents an affiliated issuer. | |
ADDITIONAL INVESTMENT INFORMATION
FUTURES CONTRACTS — At December 31, 2012, the Fund had the following futures contracts:
| Type | Number of Contracts Long (Short) | Expiration Date | Current Value | Unrealized Gain (Loss) | ||||||||||
| S&P 500 E-mini Index | 91 | March 2013 | $ | 6,461,455 | $ | (34,739 | ) | |||||||
| The accompanying notes are an integral part of these financial statements. | 11 |
GOLDMAN SACHS VARIABLE INSURANCE TRUST STRUCTURED U.S. EQUITY FUND
Statement of Assets and Liabilities
December 31, 2012
Assets: | ||||
Investments in unaffiliated issuers, at value (cost $316,162,452)(a) | $ | 354,638,511 | ||
Investments in affiliated securities lending reinvestment vehicle, at value which equals cost | 3,848,500 | |||
Cash | 7,852,671 | |||
Receivables: | ||||
Fund shares sold | 856,758 | |||
Dividends | 297,204 | |||
Futures variation margin | 164,255 | |||
Reimbursement from investment adviser | 20,351 | |||
Investments sold | 3,910 | |||
Securities lending income | 1,960 | |||
| Total assets | 367,684,120 | |||
| Liabilities: | ||||
Payables: | ||||
Payable upon return of securities loaned | 3,848,500 | |||
Fund shares redeemed | 289,508 | |||
Amounts owed to affiliates | 214,241 | |||
Accrued expenses and other liabilities | 680,935 | |||
| Total liabilities | 5,033,184 | |||
| Net Assets: | ||||
Paid-in capital | 478,614,869 | |||
Undistributed net investment income | 543,243 | |||
Accumulated net realized loss | (154,948,496 | ) | ||
Net unrealized gain | 38,441,320 | |||
| NET ASSETS | $ | 362,650,936 | ||
Net Assets: | ||||
Institutional | $ | 262,758,841 | ||
Service | 99,892,095 | |||
Total Net Assets | $ | 362,650,936 | ||
Shares of beneficial interest outstanding $0.001 par value (unlimited shares authorized): | ||||
Institutional | 21,650,830 | |||
Service | 8,215,158 | |||
Net asset value, offering and redemption price per share: | ||||
Institutional | $ 12.14 | |||
Service | 12.16 | |||
(a) Includes loaned securities having a market value of $4,122,749.
| 12 | The accompanying notes are an integral part of these financial statements. |
GOLDMAN SACHS VARIABLE INSURANCE TRUST STRUCTURED U.S. EQUITY FUND
Statement of Operations
For the Fiscal Year Ended December 31, 2012
| Investment income: | ||||
Dividends (net of foreign taxes withheld of $50,969) | $ | 8,854,773 | ||
Securities lending income — affiliated issuer | 33,816 | |||
| Total investment income | 8,888,589 | |||
| Expenses: | ||||
Management fees | 2,343,277 | |||
Distribution and Service fees — Service Class | 256,777 | |||
Printing and mailing costs | 134,928 | |||
Transfer Agent fees(a) | 75,583 | |||
Professional fees | 73,203 | |||
Custody and accounting fees | 59,965 | |||
Trustee fees | 15,671 | |||
Other | 11,529 | |||
| Total expenses | 2,970,933 | |||
Less — expense reductions | (330,253 | ) | ||
| Net expenses | 2,640,680 | |||
| NET INVESTMENT INCOME | 6,247,909 | |||
| Realized and unrealized gain (loss): | ||||
Net realized gain from: | ||||
Investments (includes payment by affiliate relating to certain investment transactions of $253,295) | 55,797,968 | |||
Futures contracts | 1,271,578 | |||
Net change in unrealized loss on: | ||||
Investments | (12,053,661 | ) | ||
Futures contracts | (209,538 | ) | ||
| Net realized and unrealized gain | 44,806,347 | |||
| NET INCREASE IN NET ASSETS RESULTING FROM OPERATIONS | $ | 51,054,256 | ||
(a) Institutional and Service Shares had Transfer Agent fees of $55,043 and $20,540, respectively.
| The accompanying notes are an integral part of these financial statements. | 13 |
GOLDMAN SACHS VARIABLE INSURANCE TRUST STRUCTURED U.S. EQUITY FUND
Statements of Changes in Net Assets
For the Fiscal Year Ended | For the Fiscal Year Ended | |||||||
| From operations: | ||||||||
Net investment income | $ | 6,247,909 | $ | 6,659,716 | ||||
Net realized gain (includes payment by affiliate relating to certain investment transactions) | 57,069,546 | 31,578,074 | ||||||
Net change in unrealized loss | (12,263,199 | ) | (21,078,210 | ) | ||||
| Net increase in net assets resulting from operations | 51,054,256 | 17,159,580 | ||||||
| Distributions to shareholders: | ||||||||
From net investment income | ||||||||
Institutional Shares | (4,750,506 | ) | (4,875,179 | ) | ||||
Service Shares | (1,549,712 | ) | (1,550,818 | ) | ||||
| Total distributions to shareholders | (6,300,218 | ) | (6,425,997 | ) | ||||
| From share transactions: | ||||||||
Proceeds from sales of shares | 6,578,493 | 5,654,201 | ||||||
Reinvestment of distributions | 6,300,218 | 6,425,997 | ||||||
Cost of shares redeemed | (68,247,499 | ) | (80,667,735 | ) | ||||
| Net decrease in net assets resulting from share transactions | (55,368,788 | ) | (68,587,537 | ) | ||||
| TOTAL DECREASE | (10,614,750 | ) | (57,853,954 | ) | ||||
| Net assets: | ||||||||
Beginning of year | 373,265,686 | 431,119,640 | ||||||
End of year | $ | 362,650,936 | $ | 373,265,686 | ||||
| Undistributed net investment income | $ | 543,243 | $ | 643,207 | ||||
| 14 | The accompanying notes are an integral part of these financial statements. |
GOLDMAN SACHS VARIABLE INSURANCE TRUST STRUCTURED U.S. EQUITY FUND
Financial Highlights
Selected Data for a Share Outstanding Throughout Each Year
| Income (loss) from investment operations | Distributions to shareholders | |||||||||||||||||||||||||||||||||||||||||||||||||||||||
| Year - Share Class | Net asset value, beginning of year | Net investment income(a) | Net realized and unrealized gain (loss) | Total from investment operations | From net investment income | From net realized gains | Total distributions | Net asset value, end of year | Total return(b) | Net assets, end of year (in 000s) | Ratio of net expenses to average net assets | Ratio of total expenses to average net assets | Ratio of net investment income to average net assets | Portfolio turnover rate(c) | ||||||||||||||||||||||||||||||||||||||||||
FOR THE FISCAL YEARS ENDED DECEMBER 31, | ||||||||||||||||||||||||||||||||||||||||||||||||||||||||
2012 - Institutional | $ | 10.80 | $ | 0.20 | $ | 1.36 | (d) | $ | 1.56 | $ | (0.22 | ) | $ | — | $ | (0.22 | ) | $ | 12.14 | 14.42 | %(d) | $ | 262,759 | 0.64 | % | 0.72 | % | 1.71 | % | 134 | % | |||||||||||||||||||||||||
2012 - Service | 10.82 | 0.18 | 1.35 | (d) | 1.53 | (0.19 | ) | — | (0.19 | ) | 12.16 | 14.10 | (d) | 99,892 | 0.85 | 0.97 | 1.51 | 134 | ||||||||||||||||||||||||||||||||||||||
2011 - Institutional | 10.57 | 0.18 | (e) | 0.25 | 0.43 | (0.20 | ) | — | (0.20 | ) | 10.80 | 4.05 | 273,555 | 0.64 | 0.70 | 1.69 | (e) | 51 | ||||||||||||||||||||||||||||||||||||||
2011 - Service | 10.58 | 0.16 | (e) | 0.25 | 0.41 | (0.17 | ) | — | (0.17 | ) | 10.82 | 3.90 | 99,711 | 0.85 | 0.95 | 1.48 | (e) | 51 | ||||||||||||||||||||||||||||||||||||||
2010 - Institutional | 9.50 | 0.14 | 1.08 | 1.22 | (0.15 | ) | — | (0.15 | ) | 10.57 | 12.84 | 319,948 | 0.64 | 0.70 | 1.45 | 38 | ||||||||||||||||||||||||||||||||||||||||
2010 - Service | 9.51 | 0.12 | 1.08 | 1.20 | (0.13 | ) | — | (0.13 | ) | 10.58 | 12.60 | 111,171 | 0.85 | 0.95 | 1.25 | 38 | ||||||||||||||||||||||||||||||||||||||||
2009 - Institutional | 7.99 | 0.15 | 1.54 | 1.69 | (0.18 | ) | — | (0.18 | ) | 9.50 | 21.15 | 340,536 | 0.68 | 0.72 | 1.75 | 136 | ||||||||||||||||||||||||||||||||||||||||
2009 - Service | 8.00 | 0.13 | 1.54 | 1.67 | (0.16 | ) | — | (0.16 | ) | 9.51 | 20.89 | 112,530 | 0.89 | 0.97 | 1.53 | 136 | ||||||||||||||||||||||||||||||||||||||||
2008 - Institutional | 13.16 | 0.17 | (5.06 | ) | (4.89 | ) | (0.18 | ) | (0.10 | ) | (0.28 | ) | 7.99 | (36.92 | ) | 344,144 | 0.71 | 0.72 | 1.53 | 110 | ||||||||||||||||||||||||||||||||||||
2008 - Service | 13.16 | 0.14 | (5.04 | ) | (4.90 | ) | (0.16 | ) | (0.10 | ) | (0.26 | ) | 8.00 | (37.05 | ) | 106,586 | 0.92 | 0.97 | 1.34 | 110 | ||||||||||||||||||||||||||||||||||||
| (a) | Calculated based on the average shares outstanding methodology. |
| (b) | Assumes investment at the net asset value at the beginning of the year, reinvestment of all distributions, and a complete redemption of the investment at the net asset value at the end of the year. |
| (c) | The Fund’s portfolio turnover rate is calculated in accordance with regulatory requirements, without regard to transactions involving short term investments and certain derivatives. If such transactions were included, the Fund’s portfolio turnover rate may be higher. |
| (d) | Reflects payment from affiliate relating to certain investment transactions which amounted to $0.01 per share. Excluding such payment, the total return would have been 14.32% and 14.01%, respectively. |
| (e) | Reflects income recognized from non-recurring special dividends which amounted to $0.02 per share and 0.17% of average net assets. |
| The accompanying notes are an integral part of these financial statements. | 15 |
GOLDMAN SACHS VARIABLE INSURANCE TRUST STRUCTURED U.S. EQUITY FUND
Notes to Financial Statements
December 31, 2012
1. ORGANIZATION
Goldman Sachs Variable Insurance Trust (the “Trust” or “VIT”) is a Delaware statutory trust registered under the Investment Company Act of 1940, as amended (the “Act”), as an open-end management investment company. The Trust includes the Goldman Sachs Structured U.S. Equity Fund (the “Fund”). The Fund is a diversified portfolio under the Act offering two classes of shares — Institutional Shares and Service Shares. Shares of the Trust are offered to separate accounts of participating life insurance companies for the purpose of funding variable annuity contracts and variable life insurance policies.
Goldman Sachs Asset Management, L.P. (“GSAM”), an affiliate of Goldman, Sachs & Co. (“Goldman Sachs”), serves as investment adviser to the Fund pursuant to a management agreement (the “Agreement”) with the Trust.
2. SIGNIFICANT ACCOUNTING POLICIES
The financial statements have been prepared in accordance with accounting principles generally accepted in the United States of America (“GAAP”) and require management to make estimates and assumptions that may affect the reported amounts and disclosures. Actual results may differ from those estimates and assumptions.
A. Investment Valuation — The Fund’s valuation policy is to value investments at fair value.
B. Investment Income and Investments — Investment income includes interest income and dividend income, net of any foreign withholding taxes, less any amounts reclaimable. Interest income is accrued daily and adjusted for amortization of premiums and accretion of discounts. Dividend income is recognized on ex-dividend date or, for certain foreign securities, as soon as such information is obtained subsequent to the ex-dividend date. Investment transactions are reflected on trade date. Realized gains and losses are calculated using identified cost. Investment transactions are recorded on the following business day for daily net asset value (“NAV”) calculations. Any foreign capital gains tax is accrued daily based upon net unrealized gains, and is payable upon sale of such investments. Distributions received from the Fund’s investments in United States (“U.S.”) real estate investment trusts (“REITs”) may be characterized as ordinary income, net capital gain or a return of capital. A return of capital is recorded by the Fund as a reduction to the cost basis of the REIT.
For derivative contracts, realized gains and losses are recorded upon settlement of the contract. Upfront payments on swaps are recognized over the contract’s term/event as realized gains or losses, with the exception of forward starting interest rate swaps whose realized gains or losses are recognized from the effective start date. For securities with paydown provisions, principal payments received are treated as a proportionate reduction to the cost basis of the securities and excess amounts are recorded as gains. For treasury inflation protected securities (“TIPS”), adjustments to principal due to inflation/deflation are reflected as increases/decreases to interest income with a corresponding adjustment to cost.
16
GOLDMAN SACHS VARIABLE INSURANCE TRUST STRUCTURED U.S. EQUITY FUND
2. SIGNIFICANT ACCOUNTING POLICIES (continued)
C. Class Allocations and Expenses — Investment income, realized and unrealized gain (loss), and non-class specific expenses of the Fund are allocated daily based upon the proportion of net assets of each class. Class specific expenses, where applicable, are borne by the respective share classes and include Distribution and Service and Transfer Agent fees. Non-class specific expenses directly incurred by a Fund are charged to that Fund, while such expenses incurred by the Trust are allocated across the respective Funds on a straight-line and/or pro-rata basis depending upon the nature of the expenses.
D. Federal Taxes and Distributions to Shareholders — It is the Fund’s policy to comply with the requirements of the Internal Revenue Code of 1986, as amended (the “Code”), applicable to regulated investment companies (mutual funds) and to distribute each year substantially all of its investment company taxable income and capital gains to its shareholders. Accordingly, the Fund is not required to make any provisions for the payment of federal income tax. Distributions to shareholders are recorded on the ex-dividend date. Income and capital gains distributions, if any, are declared and paid annually.
Net capital losses are carried forward to future fiscal years and may be used to the extent allowed by the Code to offset any future capital gains. Utilization of capital loss carryforwards will reduce the requirement of future capital gains distributions.
Under the Regulated Investment Company Modernization Act of 2010, the Fund is permitted to carry forward capital losses incurred in taxable years beginning after December 22, 2010 for an unlimited period. However, any losses incurred during those future taxable years will be required to be utilized prior to the losses incurred in pre-enactment taxable years. As a result of this ordering rule, pre-enactment capital loss carryforwards may be more likely to expire unused. Additionally, post-enactment capital losses that are carried forward will retain their character as either short-term or long term capital losses rather than being considered all short-term as under previous law.
The characterization of distributions to shareholders for financial reporting purposes is determined in accordance with federal income tax rules, which may differ from GAAP. The source of the Fund’s distributions may be shown in the accompanying financial statements as either from net investment income, net realized gain or capital. Certain components of the Fund’s net assets on the Statement of Assets and Liabilities reflect permanent GAAP/tax differences based on the appropriate tax character.
3. INVESTMENTS AND FAIR VALUE MEASUREMENTS
The fair value of a financial instrument is the amount that would be received to sell an asset or paid to transfer a liability in an orderly transaction between market participants at the measurement date (i.e., the exit price). GAAP establishes a fair value hierarchy that prioritizes the inputs to valuation techniques used to measure fair value. The hierarchy gives the highest priority to unadjusted quoted prices in active markets for identical assets or liabilities (Level 1 measurements) and the lowest priority to
17
GOLDMAN SACHS VARIABLE INSURANCE TRUST STRUCTURED U.S. EQUITY FUND
Notes to Financial Statements (continued)
December 31, 2012
3. INVESTMENTS AND FAIR VALUE MEASUREMENTS (continued)
unobservable inputs (Level 3 measurements). The levels used for classifying investments are not necessarily an indication of the risk associated with investing in these investments. The three levels of the fair value hierarchy are described below:
Level 1 — Unadjusted quoted prices in active markets that are accessible at the measurement date for identical, unrestricted assets or liabilities;
Level 2 — Quoted prices in markets that are not active or financial instruments for which significant inputs are observable (including, but not limited to, quoted prices for similar investments, interest rates, foreign exchange rates, volatility and credit spreads), either directly or indirectly;
Level 3 — Prices or valuations that require significant unobservable inputs (including GSAM’s assumptions in determining fair value measurement).
The Trustees have adopted Valuation Procedures that govern the valuation of the portfolio investments held by the Fund, including investments for which market quotations are not readily available. The Trustees have delegated to GSAM day-to-day responsibility for implementing and maintaining internal controls and procedures related to the valuation of the Fund’s portfolio investment. To assess the continuing appropriateness of pricing sources and methodologies, GSAM regularly performs price verification procedures and issues challenges as necessary to third party pricing vendors or brokers, and any differences are reviewed in accordance with the Valuation Procedures.
A. Level 1 and Level 2 Fair Value Investments — The valuation techniques and significant inputs used in determining the fair values for investments classified as Level 1 and Level 2 are as follows:
Equity Securities — Equity securities and investment companies traded on a U.S. securities exchange or the NASDAQ system, or those located on certain foreign exchanges, including but not limited to the Americas, are valued daily at their last sale price or official closing price on the principal exchange or system on which they are traded. If no sale occurs, equity securities and exchange traded investment companies are valued at the last bid price for long positions and at the last ask price for short positions. Investments in investment companies (other than those that are exchange traded) are valued at the NAV on the valuation date. To the extent these investments are actively traded, they are classified as Level 1 of the fair value hierarchy.
Unlisted equity securities for which market quotations are available are valued at the last sale price on the valuation date, or if no sale occurs, at the last bid price. Securities traded on certain foreign securities exchanges are valued daily at fair value determined by an independent fair value service (if available) under valuation procedures approved by the trustees and consistent with applicable regulatory guidance. The independent fair value service takes into account multiple factors including, but not limited to, movements in the securities markets, certain depositary receipts, futures contracts and foreign currency exchange rates that have occurred subsequent to the close of the foreign securities exchange. Investments applying these valuation adjustments are classified as Level 2 of the fair value hierarchy.
18
GOLDMAN SACHS VARIABLE INSURANCE TRUST STRUCTURED U.S. EQUITY FUND
3. INVESTMENTS AND FAIR VALUE MEASUREMENTS (continued)
Debt Securities — Debt securities for which market quotations are readily available are valued daily on the basis of quotations supplied by dealers or an independent pricing service approved by the trustees. The pricing services may use valuation models or matrix pricing, which consider: (i) yield or price with respect to bonds that are considered comparable in characteristics such as rating, interest rate and maturity date or (ii) quotations from securities dealers to determine current value. Short-term debt obligations that mature in sixty days or less and that do not exhibit signs of credit deterioration are valued at amortized cost, which approximates fair value. With the exception of treasury securities, which are generally classified as Level 1, these investments are generally classified as Level 2 of the fair value hierarchy.
Derivative contracts — A derivative is an instrument whose value is derived from underlying assets, indices, reference rates or a combination of these factors.
Exchange-traded derivatives, including futures contracts, typically fall within Level 1 of the fair value hierarchy. Over-the-counter (“OTC”) derivatives are valued using market transactions and other market evidence, including market-based inputs to models, calibration to market-clearing transactions, broker or dealer quotations, or other alternative pricing sources. Where models are used, the selection of a particular model to value an OTC derivative depends upon the contractual terms of, and specific risks inherent in, the instrument, as well as the availability of pricing information in the market. Valuation models require a variety of inputs, including contractual terms, market prices, yield curves, credit curves, measures of volatility, voluntary and involuntary prepayment rates, loss severity rates and correlations of such inputs. For OTC derivatives that trade in liquid markets, model inputs can generally be verified and model selection does not involve significant management judgment. OTC derivatives are classified within Level 2 of the fair value hierarchy when significant inputs are corroborated by market evidence.
i. Futures Contracts — Futures contracts are contracts to buy or sell a standardized quantity of a specified commodity or security and are valued based on exchanged settlement prices or independent market quotes. Futures contracts are valued at the last settlement price, or in the absence of a sale, the last bid price for long positions and at the last ask price for short positions, at the end of each day on the board of trade or exchange upon which they are traded. Upon entering into a futures contract, the Fund deposits cash or securities in an account on behalf of the broker in an amount sufficient to meet the initial margin requirement. Subsequent payments are made or received by the Fund equal to the daily change in the contract value and are recorded as variation margin receivable or payable with a corresponding offset to unrealized gains or losses.
19
GOLDMAN SACHS VARIABLE INSURANCE TRUST STRUCTURED U.S. EQUITY FUND
Notes to Financial Statements (continued)
December 31, 2012
3. INVESTMENTS AND FAIR VALUE MEASUREMENTS (continued)
B. Level 3 Fair Value Investments — The valuation techniques and significant inputs used in determining the fair values for investments classified as Level 3 are as follows:
To the extent that the aforementioned significant inputs are unobservable, or if quotations are not readily available, or if GSAM believes that such quotations do not accurately reflect fair value, the fair value of the Fund’s investments may be determined under valuation procedures approved by the trustees. GSAM, consistent with its procedures and applicable regulatory guidance, may make an adjustment to the most recent valuation prices of either domestic or foreign securities in light of significant events to reflect what it believes to be the fair value of the securities at the time of determining a Fund’s NAV. Significant events which could affect a large number of securities in a particular market may include, but are not limited to: significant fluctuations in U.S. or foreign markets; market dislocations; market disruptions; or unscheduled market closings. Significant events which could also affect a single issuer may include, but are not limited to corporate actions such as reorganizations, mergers and buy-outs; ratings downgrades; and bankruptcies.
C. Fair Value Hierarchy — The following is a summary of the Fund’s investments and derivatives classified in the fair value hierarchy as of December 31, 2012:
| Investment Type | Level 1 | Level 2 | Level 3 | |||||||||
| Assets | ||||||||||||
| Common Stock and/or Other Equity Investments | $ | 354,638,511 | $ | — | $ | — | ||||||
| Securities Lending Reinvestment Vehicle | 3,848,500 | — | — | |||||||||
| Total | $ | 358,487,011 | $ | — | $ | — | ||||||
| Derivatives Type | ||||||||||||
| Liabilities(a) | ||||||||||||
| Futures Contracts | $ | (34,739 | ) | $ | — | $ | — | |||||
| (a) | Amount shown represents unrealized gain (loss) at fiscal year end. |
For further information regarding security characteristics, see the Schedule of Investments.
20
GOLDMAN SACHS VARIABLE INSURANCE TRUST STRUCTURED U.S. EQUITY FUND
4. INVESTMENTS IN DERIVATIVES
The following table sets forth, by certain risk types, the gross value of derivative contracts as of December 31, 2012. These instruments were used to meet the Fund’s investment objectives and to obtain and/or manage exposure related to the risks below. The values in the tables below exclude the effects of cash collateral received or posted pursuant to these derivative contracts, and therefore are not representative of the Fund’s net exposure.
| Risk | Statement of Assets and Liabilities | Liabilities(a) | ||||
| Equity | Unrealized loss on futures variation margin | $ | (34,739 | ) | ||
| (a) | Includes unrealized gain (loss) on futures contracts described in the Additional Investment Information section of the Schedule of Investments. Only current day’s variation margin is reported within the Statement of Assets and Liabilities. |
The following table sets forth, by certain risk types, the Fund’s gains (losses) related to these derivatives and their indicative volumes for the fiscal year ended December 31, 2012. These gains (losses) should be considered in the context that these derivative contracts may have been executed to economically hedge certain investments, and accordingly, certain gains (losses) on such derivative contracts may offset certain (losses) gains attributable to investments. These gains (losses) are included in “Net realized gain (loss)” or “Net change in unrealized gain (loss)” on the Statement of Operations:
| Risk | Statement of Operations | Net Realized | Net Change in Unrealized | Average Number of Contracts(a) | ||||||||||
| Equity | Net realized gain (loss) from futures contracts/Net change in unrealized gain (loss) on futures contracts | $ | 1,271,578 | $ | (209,538 | ) | 101 | |||||||
| (a) | Average number of contracts is based on the average of month end balances for the at fiscal year ended December 31, 2012. |
5. AGREEMENTS AND AFFILIATED TRANSACTIONS
A. Management Agreement — Under the Agreement, GSAM manages the Fund, subject to the general supervision of the trustees.
As compensation for the services rendered pursuant to the Agreement, the assumption of the expenses related thereto and administration of the Fund’s business affairs, including providing facilities, GSAM is entitled to a management fee, accrued daily and paid monthly, equal to an annual percentage rate of the Fund’s average daily net assets.
21
GOLDMAN SACHS VARIABLE INSURANCE TRUST STRUCTURED U.S. EQUITY FUND
Notes to Financial Statements (continued)
December 31, 2012
5. AGREEMENTS AND AFFILIATED TRANSACTIONS (continued)
For the fiscal year ended December 31, 2012, contractual management fees with GSAM were at the following rates:
| Contractual Management Fee Rate | ||||||||||||||||||||||
First $1 billion | Next $1 billion | Next $3 billion | Next $3 billion | Over $8 billion | Effective Rate | |||||||||||||||||
| 0.62% | 0.59 | % | 0.56 | % | 0.55 | % | 0.54 | % | 0.62 | % | ||||||||||||
B. Distribution and Service Plan — The Trust, on behalf of the Service Shares of the Fund, has adopted a Distribution and Service Plan (the “Plan”). Under the Plan, Goldman Sachs, which serves as distributor (the “Distributor”), is entitled to a fee accrued daily and paid monthly for distribution services, which may then be paid by Goldman Sachs to authorized dealers, equal to, on an annual basis, 0.25% of the Fund’s average daily net assets attributable to Service Shares. Goldman Sachs has agreed to waive distribution and service fees so as not to exceed an annual rate of 0.21% of the Fund’s average daily net assets attributable to Service Shares. The distribution and service fee waiver will remain in place through at least April 27, 2013, and prior to such date Goldman Sachs may not terminate the arrangement without the approval of the trustees. For the fiscal year ended December 31, 2012, Goldman Sachs waived approximately $41,000 in distribution and service fees for the Fund’s Services Shares.
C. Transfer Agency Agreement — Goldman Sachs also serves as the transfer agent of the Fund for a fee pursuant to a Transfer Agency Agreement. The fees charged for such transfer agency services are accrued daily and paid monthly at an annual rate of 0.02% of the average daily net assets of Institutional and Service Shares.
D. Other Expense Agreements and Affiliated Transactions — GSAM has agreed to limit certain “Other Expense” of the Fund (excluding management fees, distribution and service fees, acquired fund fees and expenses, transfer agent fees and expenses, taxes, interest, brokerage fees, litigation, indemnification, shareholder meeting and other extraordinary expenses) to the extent such expenses exceed, on an annual basis, a percentage rate of the average daily net assets of the Fund. Such Other Expense reimbursements, if any, are accrued daily and paid monthly. In addition, the Fund is not obligated to reimburse GSAM for prior fiscal year expense reimbursements, if any. The Other Expense limitation as an annual percentage rate of average daily net assets for the Fund is 0.004%. These Other Expense reimbursements will remain in place through at least April 27, 2013, and prior to such date GSAM may not terminate the arrangement without the approval of the trustees. For the fiscal year ended December 31, 2012, GSAM reimbursed approximately $280,300 to the Fund. In addition, the Fund has entered into certain offset arrangements with the custodian and transfer agent, which may result in a reduction of the Fund’s expenses and are received irrespective of the application of the “Other Expense” limitation described above. For the fiscal year ended December 31, 2012, custody fee credits were approximately $9,000.
22
GOLDMAN SACHS VARIABLE INSURANCE TRUST STRUCTURED U.S. EQUITY FUND
5. AGREEMENTS AND AFFILIATED TRANSACTIONS (continued)
As of December 31, 2012, the amounts owed to affiliates of the Fund were approximately $190,300, $17,800, and $6,100 for management, distribution and service, and transfer agent fees, respectively.
E. Line of Credit Facility — As of December 31, 2012, the Fund participated in a $630,000,000 committed, unsecured revolving line of credit facility (the “facility”) together with other funds of the Trust and registered investment companies having management agreements with GSAM or its affiliates (“Other Borrowers”). Pursuant to the terms of the facility, the Fund and Other Borrowers could increase the credit amount by an additional $340,000,000, for a total of up to $970,000,000. This facility is to be used solely for temporary or emergency purposes, which may include the funding of redemptions. The interest rate on borrowings is based on the federal funds rate. The facility also requires a fee to be paid by the Fund based on the amount of the commitment that has not been utilized. For the fiscal year ended December 31, 2012, the Fund did not have any borrowings under the facility. Prior to May 8, 2012, the amount available through the facility was $580,000,000.
F. Other Transactions with Affiliates — For the fiscal year ended December 31, 2012, Goldman Sachs earned approximately $1,700, in brokerage commissions from portfolio transactions, including futures transactions executed with Goldman Sachs as the Futures Commission Merchant, on behalf of the Fund.
On October 1, 2012, GSAM reimbursed the Fund in the amount of $253,295 to rectify a data issue in its portfolio management decision making process.
6. PORTFOLIO SECURITIES TRANSACTIONS
The cost of purchases and proceeds from sales and maturities of long-term securities for the fiscal year ended December 31, 2012, were $493,579,954 and $547,162,085, respectively.
7. SECURITIES LENDING
Pursuant to exemptive relief granted by the Securities and Exchange Commission (“SEC”) and the terms and conditions contained therein, the Fund, may lend its securities through a securities lending agent, Goldman Sachs Agency Lending (“GSAL”), a wholly-owned subsidiary of Goldman Sachs, to certain qualified borrowers including Goldman Sachs and affiliates. In accordance with the Fund’s securities lending procedures, the Fund receives cash collateral at least equal to the market value of the securities on loan. The market value of the loaned securities is determined at the close of business of the Fund at their last sale price or official closing price on the principal exchange or system on which they are traded, and any additional required collateral is delivered to the Fund
23
GOLDMAN SACHS VARIABLE INSURANCE TRUST STRUCTURED U.S. EQUITY FUND
Notes to Financial Statements (continued)
December 31, 2012
7. SECURITIES LENDING (continued)
on the next business day. As with other extensions of credit, the Fund may experience delay in the recovery of its securities or incur a loss should the borrower of the securities breach its agreement with the Fund or become insolvent at a time when the collateral is insufficient to cover the cost of repurchasing securities on loan.
The Fund invests the cash collateral received in connection with securities lending transactions in the Goldman Sachs Financial Square Money Market Fund (“Money Market Fund”), a series of the Goldman Sachs Trust, a Delaware statutory trust. The Money Market Fund, deemed an affiliate of the Trust, is registered under the Act as an open end investment company, is subject to Rule 2a-7 under the Act and is managed by GSAM, for which GSAM may receive an investment advisory fee of up to 0.205% on an annualized basis of the average daily net assets of the Money Market Fund.
Both the Fund and GSAL received compensation relating to the lending of the Fund’s securities. The amount earned by the Fund for the fiscal year ended December 31, 2012, is reported under Investment Income on the Statement of Operations. A portion of this amount, $18,786, represents compensation earned by the Fund from lending its securities to Goldman Sachs. For the fiscal year ended December 31, 2012, GSAL earned $3,772 in fees as securities lending agent.
The following table provides information about the Fund’s investment in the Money Market Fund for the fiscal year ended December 31, 2012 (in thousands):
Number of Shares Held Beginning of Year | Shares Bought | Shares Sold | Number of Shares Held | Value at End of Year | ||||||||||||||
| 1,106 | 35,110 | (32,367 | ) | 3,849 | $ | 3,849 | ||||||||||||
8. TAX INFORMATION
The tax character of distributions paid during the fiscal years ended December 31, 2011 and December 31, 2012 was as follows:
| 2011 | 2012 | |||||||
| Distributions paid from ordinary income | $ | 6,425,997 | $ | 6,300,218 | ||||
24
GOLDMAN SACHS VARIABLE INSURANCE TRUST STRUCTURED U.S. EQUITY FUND
8. TAX INFORMATION (continued)
As of December 31, 2012, the components of accumulated earnings (losses) on a tax-basis were as follows:
| Undistributed ordinary income — net | $ | 543,243 | ||
| Capital loss carryforwards:(1) | ||||
Expiring 2016 | (14,576,277 | ) | ||
Expiring 2017 | (139,998,215 | ) | ||
| Total capital loss carryforwards | $ | (154,574,492 | ) | |
| Unrealized gains — net | 38,067,316 | |||
| Total accumulated losses — net | $ | (115,963,933 | ) |
| (1) | Expiration occurs on December 31 of the year indicated. The Fund utilized $53,753,636 of capital losses in the current fiscal year. |
As of December 31, 2012, the Fund’s aggregate security unrealized gains and losses based on cost for U.S. federal income tax purposes were as follows:
| Tax cost | $ | 320,419,695 | ||
| Gross unrealized gain | 43,490,498 | |||
| Gross unrealized loss | (5,423,182 | ) | ||
| Net unrealized security gain | $ | 38,067,316 |
The difference between GAAP-basis and tax-basis unrealized gains (losses) is attributable primarily to wash sales and net mark to market gains (losses) on regulated futures contracts.
In order to present certain components of the Fund’s capital accounts on a tax-basis, the Fund has reclassified $47,655 from undistributed net investment income to accumulated net realized gain (loss). These reclassifications have no impact on the net asset value of the Fund and result from differences in the tax treatment of underlying fund investments.
GSAM has reviewed the Fund’s tax positions for all open tax years (the current and prior three years, as applicable) and has concluded that no provision for income tax is required in the Fund’s financial statements. Such open tax years remain subject to examination and adjustment by tax authorities.
25
GOLDMAN SACHS VARIABLE INSURANCE TRUST STRUCTURED U.S. EQUITY FUND
Notes to Financial Statements (continued)
December 31, 2012
9. OTHER RISKS
The Fund’s risks include, but are not limited to, the following:
Shareholder Concentration Risk — Certain participating insurance companies, accounts, or Goldman Sachs affiliates may from time to time own (beneficially or of record) or control a significant percentage of the Fund’s shares. Redemptions by these entities of their holdings in the Fund may impact the Fund’s liquidity and NAV. These redemptions may also force the Fund to sell securities.
Liquidity Risk — The Fund may make investments that are illiquid or that may become less liquid in response to market developments or adverse investor perceptions. Illiquid investments may be more difficult to value. Liquidity risk may also refer to the risk that a Fund will not be able to pay redemption proceeds within the allowable time period because of unusual market conditions, an unusually high volume of redemption requests, or other reasons. To meet redemption requests, the Fund may be forced to sell investments at an unfavorable time and/or under unfavorable conditions.
Market and Credit Risks — In the normal course of business, the Fund trades financial instruments and enters into financial transactions where risk of potential loss exists due to changes in the market (market risk). Additionally, the Fund may also be exposed to credit risk in the event that an issuer fails to perform or that an institution or entity with which the Fund has unsettled or open transactions defaults.
10. INDEMNIFICATIONS
Under the Trust’s organizational documents, its trustees, officers, employees and agents are indemnified, to the extent permitted by the Act, against certain liabilities that may arise out of performance of their duties to the Fund. Additionally, in the course of business, the Fund enters into contracts that contain a variety of indemnification clauses. The Fund’s maximum exposure under these arrangements is unknown, as this would involve future claims that may be made against the Fund that have not yet occurred. However, GSAM believes the risk of loss under these arrangements to be remote.
11. OTHER MATTERS
New Accounting Pronouncement — In December 2011, the Financial Accounting Standards Board issued an Accounting Standards Update (“ASU”) to enhance disclosures about financial instruments and derivative instruments that are subject to offsetting (“netting”) on the Statement of Assets and Liabilities. This information will enable users of the Fund’s financial statements to
26
GOLDMAN SACHS VARIABLE INSURANCE TRUST STRUCTURED U.S. EQUITY FUND
11. OTHER MATTERS (continued)
evaluate the effect or potential effect of netting arrangements on the Fund’s financial position. The ASU is effective for financial statements with fiscal years beginning on or after January 1, 2013, and interim periods within those fiscal years. At this time, GSAM is evaluating the implications of these changes on the financial statements.
12. SUBSEQUENT EVENTS
Subsequent events after the Statement of Assets and Liabilities date have been evaluated through the date the financial statements were issued. GSAM has concluded that there is no impact requiring adjustment or disclosure in the financial statements.
13. SUMMARY OF SHARE TRANSACTIONS
Share activity is as follows:
| For the Fiscal Year Ended December 31, 2012 | For the Fiscal Year Ended December 31, 2011 | |||||||||||||||
| Shares | Dollars | Shares | Dollars | |||||||||||||
| Institutional Shares | ||||||||||||||||
| Shares sold | 323,842 | $ | 3,824,620 | 353,442 | $ | 3,800,085 | ||||||||||
| Reinvestment of distributions | 389,067 | 4,750,506 | 456,905 | 4,875,179 | ||||||||||||
| Shares redeemed | (4,386,993 | ) | (52,057,770 | ) | (5,760,949 | ) | (63,115,601 | ) | ||||||||
| (3,674,084 | ) | (43,482,644 | ) | (4,950,602 | ) | (54,440,337 | ) | |||||||||
| Service Shares | ||||||||||||||||
| Shares sold | 233,357 | 2,753,873 | 171,780 | 1,854,116 | ||||||||||||
| Reinvestment of distributions | 126,714 | 1,549,712 | 145,207 | 1,550,818 | ||||||||||||
| Shares redeemed | (1,362,510 | ) | (16,189,729 | ) | (1,606,493 | ) | (17,552,134 | ) | ||||||||
| (1,002,439 | ) | (11,886,144 | ) | (1,289,506 | ) | (14,147,200 | ) | |||||||||
| NET DECREASE | (4,676,523 | ) | $ | (55,368,788 | ) | (6,240,108 | ) | $ | (68,587,537 | ) | ||||||
27
Report of Independent Registered Public Accounting Firm
To the Board of Trustees and Shareholders of
Goldman Sachs Variable Insurance Trust — Goldman Sachs Structured U.S. Equity Fund:
In our opinion, the accompanying statement of assets and liabilities, including the schedule of investments, and the related statements of operations and of changes in net assets and the financial highlights present fairly, in all material respects, the financial position of Goldman Sachs Structured U.S. Equity Fund (the “Fund”) at December 31, 2012, the results of its operations, the changes in its net assets and the financial highlights for each of the periods indicated, in conformity with accounting principles generally accepted in the United States of America. These financial statements and financial highlights (hereafter referred to as “financial statements”) are the responsibility of the Fund’s management. Our responsibility is to express an opinion on these financial statements based on our audit. We conducted our audit of these financial statements in accordance with the standards of the Public Company Accounting Oversight Board (United States). Those standards require that we plan and perform the audit to obtain reasonable assurance about whether the financial statements are free of material misstatement. An audit includes examining, on a test basis, evidence supporting the amounts and disclosures in the financial statements, assessing the accounting principles used and significant estimates made by management, and evaluating the overall financial statement presentation. We believe that our audit, which included confirmation of securities at December 31, 2012 by correspondence with the custodian, transfer agent and brokers, provides a reasonable basis for our opinion.
PricewaterhouseCoopers LLP
Boston, Massachusetts
February 14, 2013
28
GOLDMAN SACHS VARIABLE INSURANCE TRUST STRUCTURED U.S. EQUITY FUND
| Fund Expenses — Six Month Period Ended December 31, 2012 (Unaudited) |
As a shareholder of Institutional or Service Shares of the Fund, you incur ongoing costs, including management fees, distribution and service (12b-1) fees (with respect to Service Shares) and other Fund expenses. This example is intended to help you understand your ongoing costs (in dollars) of investing in the Institutional Shares and Service Shares of the Fund and to compare these costs with the ongoing costs of investing in other mutual funds.
The example is based on an investment of $1,000 invested at the beginning of the period and held for the entire period from July 1, 2012 through December 31, 2012.
Actual Expenses — The first line under each share class in the table below provides information about actual account values and actual expenses. You may use the information in this line, together with the amount you invested, to estimate the expenses that you paid over the period. Simply divide your account value by $1,000 (for example, an $8,600 account value divided by $1,000=8.6), then multiply the result by the number in the first line under the heading entitled “Expenses Paid” to estimate the expenses you paid on your account during this period.
Hypothetical Example for Comparison Purposes — The second line under each share class in the table below provides information about hypothetical account values and hypothetical expenses based on the Fund’s actual net expense ratio and an assumed rate of return of 5% per year before expenses, which is not the Fund’s actual return. The hypothetical account values and expenses may not be used to estimate the actual ending account balance or expenses you paid for the period. You may use this information to compare the ongoing costs of investing in the Fund and other funds. To do so, compare this 5% hypothetical example with the 5% hypothetical examples that appear in the shareholder reports of the other funds.
Please note that the expenses shown in the table are meant to highlight your ongoing costs only. As a shareholder of the Fund you do not incur any transaction costs, such as sales charges, redemption fees, or exchange fees, but shareholders of other funds may incur such costs. The second line of the table is useful in comparing ongoing costs only, and will not help you determine the relative total costs of owning different funds whose shareholders may incur transaction costs.
| Share Class | Beginning Account Value 7/01/12 | Ending Account Value 12/31/12 | Expenses Paid for the 6 Months Ended 12/31/12* | |||||||||
| Institutional | ||||||||||||
| Actual | $ | 1,000 | $ | 1,058.30 | $ | 3.31 | ||||||
| Hypothetical 5% return | 1,000 | 1,021.92 | + | 3.25 | ||||||||
| Service | ||||||||||||
| Actual | 1,000 | 1,057.40 | 4.40 | |||||||||
| Hypothetical 5% return | 1,000 | 1,020.86 | + | 4.32 | ||||||||
| * | Expenses are calculated using the Fund’s annualized net expense ratio for each class, which represents the ongoing expenses as a percentage of net assets for the six months ended December 31, 2012. Expenses are calculated by multiplying the annualized net expense ratio by the average account value for the period; then multiplying the result by the number of days in the most recent fiscal half year; and then dividing that result by the number of days in the fiscal year. The annualized net expense ratios for the period were 0.64% and 0.85% for Institutional and Service Shares, respectively. |
| + | Hypothetical expenses are based on the Fund’s actual annualized net expense ratios and an assumed rate of return of 5% per year before expenses. |
29
GOLDMAN SACHS VARIABLE INSURANCE TRUST STRUCTURED U.S. EQUITY FUND
Trustees and Officers (Unaudited)
Independent Trustees
| Name, Address and Age1 | Position(s) Held with the Trust | Term of Office and | Principal Occupation(s) During Past 5 Years | Number of Portfolios in Fund Complex Overseen by Trustee3 | Other Directorships Held by Trustee4 | |||||||
Ashok N. Bakhru Age: 70 | Chairman of the Board of Trustees | Since 1996 (Trustee since 1991) | Mr. Bakhru is retired. He is President, ABN Associates (1994-1996 and 1998-Present); Director, Apollo Investment Corporation (a business development company) (2008-Present); Member of Cornell University Council (1992-2004 and 2006-Present); and was formerly Trustee, Scholarship America (1998-2005); Trustee, Institute for Higher Education Policy (2003-2008); Director, Private Equity Investors — III and IV (1998-2007), and Equity-Linked Investors II (April 2002-2007). Chairman of the Board of Trustees — Goldman Sachs Mutual Fund Complex. | 111 | Apollo Investment Corporation (a business development company) | |||||||
Donald C. Burke Age: 52 | Trustee | Since 2010 | Mr. Burke is retired. He is Director, Avista Corp. (2011-Present); and was formerly a Director, BlackRock Luxembourg and Cayman Funds (2006-2010); President and Chief Executive Officer, BlackRock U.S. Funds (2007-2009); Managing Director, BlackRock, Inc. (2006-2009); Managing Director, Merrill Lynch Investment Managers, L.P. (“MLIM”) (2006); First Vice President, MLIM (1997-2005); Chief Financial Officer and Treasurer, MLIM U.S. Funds (1999-2006). Trustee — Goldman Sachs Mutual Fund Complex. | 110 | Avista Corp. (an energy company) | |||||||
John P. Coblentz, Jr. Age: 71 | Trustee | Since 2003 | Mr. Coblentz is retired. Formerly, he was Partner, Deloitte & Touche LLP (1975-2003); Director, Emerging Markets Group, Ltd. (2004-2006); and Director, Elderhostel, Inc. (2006-2012). Trustee — Goldman Sachs Mutual Fund Complex. | 111 | None | |||||||
Diana M. Daniels Age: 63 | Trustee | Since 2007 | Ms. Daniels is retired. Formerly, she was Vice President, General Counsel and Secretary, The Washington Post Company (1991-2006). Ms. Daniels is a Vice Chairman of the Board of Trustees, Cornell University (2009-Present); Member, Advisory Board, Psychology Without Borders (international humanitarian aid organization) (2007-Present), and former Member of the Legal Advisory Board, New York Stock Exchange (2003-2006) and of the Corporate Advisory Board, Standish Mellon Management Advisors (2006-2007). Trustee — Goldman Sachs Mutual Fund Complex. | 110 | None | |||||||
Joseph P. LoRusso Age: 55 | Trustee | Since 2010 | Mr. LoRusso is retired. Formerly, he was President, Fidelity Investments Institutional Services Co. (“FIIS”) (2002-2008); Director, FIIS (2002-2008); Director, Fidelity Investments Institutional Operations Company (2003-2007); Executive Officer, Fidelity Distributors Corporation (2007-2008). Trustee — Goldman Sachs Mutual Fund Complex. | 110 | None | |||||||
Jessica Palmer Age: 63 | Trustee | Since 2007 | Ms. Palmer is retired. She is Director, Emerson Center for the Arts and Culture (2011-Present); and was formerly a Consultant, Citigroup Human Resources Department (2007-2008); Managing Director, Citigroup Corporate and Investment Banking (previously, Salomon Smith Barney/Salomon Brothers) (1984-2006). Ms. Palmer was a Member of the Board of Trustees of Indian Mountain School (private elementary and secondary school) (2004-2009). Trustee — Goldman Sachs Mutual Fund Complex. | 110 | None | |||||||
Richard P. Strubel Age: 73 | Trustee | Since 1987 | Mr. Strubel is retired. Formerly, he was Director, Cardean Learning Group (provider of educational services via the internet) (2003-2008); Trustee, Emeritus, The University of Chicago (1987-Present). Trustee — Goldman Sachs Mutual Fund Complex. | 111 | The Northern Trust Mutual Fund Complex (64 Portfolios) (Chairman of the Board of Trustees); Gildan Activewear Inc. (a clothing marketing and manufacturing company). | |||||||
30
GOLDMAN SACHS VARIABLE INSURANCE TRUST STRUCTURED U.S. EQUITY FUND
Trustees and Officers (Unaudited) (continued)
Interested Trustees
| Name, Address and Age1 | Position(s) Held with the Trust | Term of Office and | Principal Occupation(s) During Past 5 Years | Number of Portfolios in | Other Directorships Held by Trustee4 | |||||
James A. McNamara* Age: 50 | President and Trustee | Since 2007 | Managing Director, Goldman Sachs (December 1998-Present); Director of Institutional Fund Sales, GSAM (April 1998-December 2000); and Senior Vice President and Manager, Dreyfus Institutional Service Corporation (January 1993- April 1998). President — Goldman Sachs Mutual Fund Complex (November 2007-Present); Senior Vice President — Goldman Sachs Mutual Fund Complex (May 2007-November 2007); and Vice President — Goldman Sachs Mutual Fund Complex (2001-2007). Trustee — Goldman Sachs Mutual Fund Complex (since November 2007 and December 2002-May 2004). | 111 | None | |||||
Alan A. Shuch* Age: 63 | Trustee | Since 1990 | Advisory Director — GSAM (May 1999-Present); Consultant to GSAM (December 1994-May 1999); and Limited Partner, Goldman Sachs (December 1994-May 1999). Trustee — Goldman Sachs Mutual Fund Complex. | 110 | None | |||||
| * | These persons are considered to be “Interested Trustees” because they hold positions with Goldman Sachs and own securities issued by The Goldman Sachs Group, Inc. Each Interested Trustee holds comparable positions with certain other companies of which Goldman Sachs, GSAM or an affiliate thereof is the investment adviser, administrator and/or distributor. |
| 1 | Each Trustee may be contacted by writing to the Trustee, c/o Goldman Sachs, 200 West Street, New York, New York, 10282, Attn: Caroline Kraus. Information is provided as of December 31, 2012. |
| 2 | Each Trustee holds office for an indefinite term until the earliest of: (a) the election of his or her successor; (b) the date the Trustee resigns or is removed by the Board of Trustees or shareholders, in accordance with the Trust’s Declaration of Trust; (c) the conclusion of the first Board meeting held subsequent to the day the Trustee attains the age of 74 years (in accordance with the current resolutions of the Board of Trustees, which may be changed by the Trustees without shareholder vote); or (d) the termination of the Trust. |
| 3 | The Goldman Sachs Mutual Fund Complex consists of the Trust, Goldman Sachs Trust II, Goldman Sachs Municipal Opportunity Fund, Goldman Sachs Credit Strategies Fund, and Goldman Sachs Trust. As of December 31, 2012, the Trust consisted of 12 portfolios. Goldman Sachs Trust II consisted of 1 portfolio (which did not offer shares to the public); Goldman Sachs Municipal Opportunity Fund did not offer shares to the public; and Goldman Sachs Trust consisted of 96 portfolios (80 of which offered shares to the public). |
| 4 | This column includes only directorships of companies required to report to the Securities and Exchange Commission under the Securities Exchange Act of 1934 (i.e., “public companies”) or other investment companies registered under the Act. |
Additional information about the Trustees is available in the Fund’s Statement of Additional Information, which can be obtained from Goldman Sachs free of charge by calling this toll-free number (in the United States of America): 1-800-292-4726.
31
GOLDMAN SACHS VARIABLE INSURANCE TRUST STRUCTURED U.S. EQUITY FUND
Trustees and Officers (Unaudited) (continued)
Officers of the Trust*
| Name, Address and Age | Position(s) Held With the Trust | Term of Office and | Principal Occupation(s) During Past 5 Years | |||
James A. McNamara 200 West Street New York, NY 10282 Age: 50 | President and Trustee | Since 2007 | Managing Director, Goldman Sachs (December 1998-Present); Director of Institutional Fund Sales, GSAM (April 1998-December 2000); and Senior Vice President and Manager, Dreyfus Institutional Service Corporation (January 1993-April 1998). President — Goldman Sachs Mutual Fund Complex (November 2007-Present); Senior Vice President — Goldman Sachs Mutual Fund Complex (May 2007-November 2007); and Vice President — Goldman Sachs Mutual Fund Complex (2001-2007). Trustee — Goldman Sachs Mutual Fund Complex (November 2007-Present and December 2002-May 2004). | |||
George F. Travers 30 Hudson Street Jersey City, NJ 07302 Age: 44 | Senior Vice President and Principal Financial Officer | Since 2009 | Managing Director, Goldman Sachs (2007-Present); Managing Director, UBS Ag (2005-2007); and Partner, Deloitte & Touche LLP (1990-2005, partner from 2000-2005). Senior Vice President and Principal Financial Officer — Goldman Sachs Mutual Fund Complex. | |||
Caroline Kraus 200 West Street New York, NY 10282 Age: 35 | Secretary | Since 2012 | Vice President, Goldman Sachs (August 2006-Present); Associate General Counsel, Goldman Sachs (2012-Present); Assistant General Counsel, Goldman Sachs (August 2006-December 2011) and Associate, Weil, Gotshal & Manges-LLP (2002-2006). Secretary — Goldman Sachs Mutual Fund Complex (August 2012-Present) and Assistant Secretary — Goldman Sachs Mutual Fund Complex (June 2012-August 2012). | |||
Scott M. McHugh 200 West Street New York, NY 10282 Age: 41 | Treasurer and Senior Vice President | Since 2009 | Vice President, Goldman Sachs (February 2007-Present); Assistant Treasurer of certain mutual funds administered by DWS Scudder (2005-2007); and Director (2005-2007), Vice President (2000-2005) and Assistant Vice President (1998-2000), Deutsche Asset Management or its predecessor (1998-2007). Treasurer — Goldman Sachs Mutual Fund Complex (October 2009-Present); Senior Vice President — Goldman Sachs Mutual Fund Complex (November 2009-Present); and Assistant Treasurer — Goldman Sachs Mutual Fund Complex (May 2007-October 2009). | |||
| 1 | Officers hold office at the pleasure of the Board of Trustees or until their successors are duly elected and qualified. Each officer holds comparable positions with certain other companies of which Goldman Sachs, GSAM or an affiliate thereof is the investment adviser, administrator and/or distributor. Information is provided as of December 31, 2012. |
| * | Represents a partial list of officers of the Trust. Additional information about all the officers is available in the Fund’s Statement of Additional Information, which can be obtained from Goldman Sachs free of charge by calling this toll-free number (in the United States): 1-800-292-4726. |
Goldman Sachs Variable Insurance Trust — Tax Information (Unaudited)
For the year ended December 31, 2012, 100% of the dividends paid from net investment company taxable income by the Structured U.S. Equity Fund qualify for the dividends received deduction available to corporations.
32
| TRUSTEES | OFFICERS | |
| Ashok N. Bakhru, Chairman | James A. McNamara, President | |
| Donald C. Burke | George F. Travers, Principal Financial Officer | |
| John P. Coblentz, Jr. | Caroline L. Kraus, Secretary | |
| Diana M. Daniels | Scott M. McHugh, Treasurer | |
| Joseph P. LoRusso | ||
| James A. McNamara | ||
| Jessica Palmer | ||
| Alan A. Shuch | ||
| Richard P. Strubel |
GOLDMAN, SACHS & CO.
Distributor and Transfer Agent
GOLDMAN SACHS ASSET MANAGEMENT, L.P.
Investment Adviser
200 West Street, New York, New York 10282
Visit our website at www.goldmansachsfunds.com/vit to obtain the most recent month-end returns.
The reports concerning the Fund included in this shareholder report may contain certain forward-looking statements about the factors that may affect the performance of the Fund in the future. These statements are based on Fund management’s predictions and expectations concerning certain future events and their expected impact on the Fund, such as performance of the economy as a whole and of specific industry sectors, changes in the levels of interest rates, the impact of developing world events, and other factors that may influence the future performance of the Fund. Management believes these forward-looking statements to be reasonable, although they are inherently uncertain and difficult to predict. Actual events may cause adjustments in portfolio management strategies from those currently expected to be employed.
A description of the policies and procedures that the Fund uses to determine how to vote proxies relating to portfolio securities and information regarding how the Fund voted proxies relating to portfolio securities for the 12-month period ended December 31 is available (i) without charge, upon request by calling 1-800-621-2550; and (ii) on the Securities and Exchange Commission (“SEC”) website at http://www.sec.gov.
The Fund files its complete schedule of portfolio holdings with the SEC for the first and third quarters of each fiscal year on Form N-Q. The Fund’s Form N-Q is available on the SEC’s website at http://www.sec.gov within 60 days after the Fund’s first and third fiscal quarters. The Fund’s Forms N-Q may be reviewed and copied at the SEC’s Public Reference Room in Washington, D.C. and information on the operation of the Public Reference Room may also be obtained by calling 1-800-SEC-0330. Forms N-Q may be obtained upon request and without charge by calling 1-800-621-2550.
Holdings and allocations shown are as of December 31, 2012 and may not be representative of future investments. Fund holdings should not be relied on in making investment decisions and should not be construed as research or investment advice regarding particular securities.
The Global Industry Classification Standard (“GICS”) was developed by and is the exclusive property and a service mark of Morgan Stanley Capital International Inc. (“MSCI”) and Standard & Poor’s, a division of The McGraw-Hill Companies, Inc. (“S&P”) and is licensed for use by Goldman Sachs. Neither MSCI, S&P nor any other party involved in making or compiling the GICS or any GICS classifications makes any express or implied warranties or representations with respect to such standard or classification (or the results to be obtained by the use thereof), and all such parties hereby expressly disclaim all warranties of originality, accuracy, completeness, merchantability or fitness for a particular purpose with respect to any of such standard or classification. Without limiting any of the foregoing, in no event shall MSCI, S&P, any of their affiliates or any third party involved in making or compiling the GICS or any GICS classifications have any liability for any direct, indirect, special, punitive, consequential or any other damages (including lost profits) even if notified of the possibility of such damages.
The portfolio risk management process includes an effort to monitor and manage risk, but does not imply low risk.
Shares of the Goldman Sachs VIT Funds are offered to separate accounts of participating life insurance companies for the purpose of funding variable annuity contracts and variable life insurance policies. Shares of the Fund are not offered directly to the general public. The variable annuity contracts and variable life insurance policies are described in the separate prospectuses issued by participating insurance companies. You should refer to those prospectuses for information about surrender charges, mortality and expense risk fees and other charges that may be assessed by participating insurance companies under the variable annuity contracts or variable life insurance policies. Such fees or charges, if any, may affect the return you may realize with respect to your investments. Ask your representative for more complete information. Please consider a fund’s objectives, risks and charges and expenses, and read the prospectus carefully before investing. The prospectus contains this and other information about the Fund.
This material is not authorized for distribution to prospective investors unless preceded or accompanied by a current Prospectus or summary prospectus, if applicable. Investors should consider a Fund’s objective, risks, and charges and expenses, and read the summary prospectus, if available, and/or the Prospectus carefully before investing or sending money. The summary prospectus, if available, and the Prospectus contain this and other information about a Fund and may be obtained from your Authorized Institution or from Goldman, Sachs & Co. by calling 1-800-621-2550.
Toll Free (in U.S.): 800-292-4726
This report is prepared for the general information of contract owners and is not an offer of shares of the Goldman Sachs Variable Insurance Trust: Goldman Sachs Structured U.S. Equity Fund.
© 2013 Goldman Sachs. All rights reserved.
VITUSAR13/92374.MF.MED.TMPL/2/2013
| ITEM 2. | CODE OF ETHICS. |
| (a) | As of the end of the period covered by this report, the registrant has adopted a code of ethics that applies to the registrant’s principal executive officer, principal financial officer, principal accounting officer or controller, or persons performing similar functions, regardless of whether these individuals are employed by the registrant or a third party (the “Code of Ethics”). |
| (b) | During the period covered by this report, no amendments were made to the provisions of the Code of Ethics. |
| (c) | During the period covered by this report, the registrant did not grant any waivers, including an implicit waiver, from any provision of the Code of Ethics. |
| (d) | A copy of the Code of Ethics is available as provided in Item 12(a)(1) of this report. |
| ITEM 3. | AUDIT COMMITTEE FINANCIAL EXPERT. |
| The registrant’s board of trustees has determined that the registrant has at least one “audit committee financial expert” (as defined in Item 3 of Form N-CSR) serving on its audit committee. John P. Coblentz, Jr. is the “audit committee financial expert” and is “independent” (as each term is defined in Item 3 of Form N-CSR). |
| ITEM 4. | PRINCIPAL ACCOUNTANT FEES AND SERVICES. |
Item 4 — Principal Accountant Fees and Services for the Goldman Sachs Variable Insurance Trust (“GSVIT”):
Table 1 – Items 4(a) - 4(d)
| 2012 | 2011 | Description of Services Rendered | ||||||||
Audit Fees: | ||||||||||
• PricewaterhouseCoopers (“PwC”) | $ | 367,702 | $ | 597,101 | Financial statement audits. | |||||
Audit-Related Fees | ||||||||||
PwC | $ | — | $ | — | Other attest services. | |||||
Tax Fees | ||||||||||
PwC | $ | 82,875 | $ | 80,518 | Tax compliance services provided in connection with the preparation and review of the Registrant’s tax returns. | |||||
Items 4(b)(c) & (d) Table 2. Non-Audit Services to the GSVIT’s * that were pre-approved by the GSVIT’s Audit Committee pursuant to Rule 2-01(c)(7)(ii) of Regulation S-X
| 2012 | 2011 | Description of Services Rendered | ||||||||
Audit-Related Fees | ||||||||||
PwC | $ | 1,848,422 | $ | 852,000 | Internal control review performed in accordance with Statement on Standards for Attestation Engagements No. 16. These fees are borne by the Funds’ adviser. | |||||
| * | These include the advisor (excluding sub-advisors) and any entity controlling, controlled by or under common control with the advisor that provides ongoing services to the registrant (hereinafter referred to as “service affiliates”). |
Item 4(e)(1) — Audit Committee Pre Approval Policies and Procedures
Pre-Approval of Audit and Non-Audit Services Provided to the Funds of the Goldman Sachs Variable Insurance Trust. The Audit and Non-Audit Services Pre-Approval Policy (the “Policy”) adopted by the Audit Committee of GSVIT sets forth the procedures and the conditions pursuant to which services performed by an independent auditor for GSVIT may be pre-approved. Services may be pre-approved specifically by the Audit Committee as a whole or, in certain circumstances, by the Audit Committee Chairman or the person designated as the Audit Committee Financial Expert. In addition, subject to specified cost limitations, certain services may be pre-approved under the provisions of the Policy. The Policy provides that the Audit Committee will consider whether the services provided by an independent auditor are consistent with the Securities and Exchange Commission’s rules on auditor independence. The Policy provides for periodic review and pre-approval by the Audit Committee of the services that may be provided by the independent auditor.
De Minimis Waiver. The pre-approval requirements of the Policy may be waived with respect to the provision of non-audit services that are permissible for an independent auditor to perform, provided (1) the aggregate amount of all such services provided constitutes no more than five percent of the total amount of revenues subject to pre-approval that was paid to the independent auditors during the fiscal year in which the services are provided; (2) such services were not recognized by GSVIT at the time of the engagement to be non-audit services; and (3) such services are promptly brought to the attention of the Audit Committee and approved prior to the completion of the audit by the Audit Committee or by one or more members of the Audit Committee to whom authority to grant such approvals has been delegated by the Audit Committee, pursuant to the pre-approval provisions of the Policy.
Pre-Approval of Non-Audit Services Provided to GSVIT’s Investment Advisers. The Policy provides that, in addition to requiring pre-approval of audit and non-audit services provided to GSVIT, the Audit Committee will pre-approve those non-audit services provided to GSVIT’s investment advisers (and entities controlling, controlled by or under common control with the investment advisers that provide ongoing services to GSVIT) where the engagement relates directly to the operations or financial reporting of GSVIT.
Item 4(e)(2) — 0% of the audit-related fees, tax fees and other fees listed in Table 1 were approved by GSVIT’s Audit Committee pursuant to the “de minimis” exception of Rule 2-01(c)(7)(i)(C) of Regulation S-X. In addition, 0% of the non-audit services to the GSVIT’s service affiliates listed in Table 2 were approved by GSVIT’s Audit Committee pursuant to the “de minimis” exception of Rule 2-01(c)(7)(i)(C) of Regulation S-X.
Item 4(f) — Not applicable.
Items 4(g) Aggregate Non-Audit Fees Disclosure
The aggregate non-audit fees billed to GSVIT for the twelve months ended December 31, 2012 and December 31, 2011 by PwC were approximately $82,875 and $80,518, respectively.
The aggregate non-audit fees billed to GSVIT’s adviser and service affiliates for non-audit services for the twelve months ended December 31, 2011 and December 31, 2010 by PwC were approximately $11.6 million and $10.3 million, respectively. The figures for these entities are not yet available for the twelve months ended December 31, 2012.
Items 4(h) — GSVIT’s Audit Committee has considered whether the provision of non-audit services to GSVIT’s investment advisor and service affiliates that did not require pre-approval pursuant to paragraph (c)(7)(ii) of Rule 2-01 of Regulation S-X is compatible with maintaining the auditor’s independence.
| ITEM 5. | AUDIT COMMITTEE OF LISTED REGISTRANTS. |
Not applicable.
| ITEM 6. | SCHEDULE OF INVESTMENTS |
Schedule of Investments is included as part of the Reports to Shareholders filed under Item 1.
| ITEM 7. | DISCLOSURE OF PROXY VOTING POLICIES AND PROCEDURES FOR CLOSED-END MANAGEMENT INVESTMENT COMPANIES. |
Not applicable.
| ITEM 8. | PORTFOLIO MANAGERS OF CLOSED-END MANAGEMENT INVESTMENT COMPANIES |
Not applicable.
| ITEM 9. | PURCHASES OF EQUITY SECURITIES BY CLOSED-END MANAGEMENT INVESTMENT COMPANY AND AFFILIATED PURCHASERS |
Not applicable.
| ITEM 10. | SUBMISSION OF MATTERS TO A VOTE OF SECURITY HOLDERS. |
There have been no material changes to the procedures by which shareholders may recommend nominees to the registrant’s board of trustees.
| ITEM 11. | CONTROLS AND PROCEDURES. |
| (a) | The registrant’s principal executive and principal financial officers or persons performing similar functions have concluded that the registrant’s disclosure controls and procedures (as defined in Rule 30a-3(c) under the Investment Company Act of 1940, as amended (the “1940 Act”)) are effective as of a date within 90 days of the filing date of this report that includes the disclosure required by this paragraph, based on the evaluation of these controls and procedures required by Rule 30a-3(b) under the 1940 Act and 15d-15(b) under the Securities Exchange Act of 1934, as amended. |
| (b) | There were no changes in the registrant’s internal control over financial reporting (as defined in Rule 30a-3(d) under the 1940 Act) that occurred during the registrant’s second fiscal quarter of the period covered by this report that has materially affected, or is reasonably likely to materially affect the registrant’s internal control over financial reporting. |
| ITEM 12. | EXHIBITS. |
| (a)(1) | Goldman Sachs Variable Insurance Trust’s Code of Ethics for Principal Executive and Senior Financial Officers filed herewith | |||
| (a)(2) | Exhibit 99.CERT | Certifications pursuant to Section 302 of the Sarbanes-Oxley Act of 2002 filed herewith | ||
| Exhibit 99.906CERT | Certifications pursuant to Section 906 of the Sarbanes-Oxley Act of 2002 filed herewith | |||
SIGNATURES
Pursuant to the requirements of the Securities Exchange Act of 1934 and the Investment Company Act of 1940, the registrant has duly caused this report to be signed on its behalf by the undersigned, thereunto duly authorized.
Goldman Sachs Variable Insurance Trust
/s/ James A. McNamara | ||
By: James A. McNamara | ||
Chief Executive Officer of | ||
Goldman Sachs Variable Insurance Trust | ||
Date: February 21, 2013 | ||
Pursuant to the requirements of the Securities Exchange Act of 1934 and the Investment Company Act of 1940, the report has been signed below by the following persons on behalf of the registrant and in the capacities and on the dates indicated.
/s/ James A. McNamara | ||
By: James A. McNamara | ||
Chief Executive Officer of | ||
Goldman Sachs Variable Insurance Trust | ||
Date: February 21, 2013 | ||
/s/ George F. Travers | ||
By: George F. Travers | ||
Chief Financial Officer of | ||
Goldman Sachs Variable Insurance Trust | ||
Date: February 25, 2013 | ||