UNITED STATES
SECURITIES AND EXCHANGE COMMISSION
Washington, D.C. 20549
FORM N-CSR
CERTIFIED SHAREHOLDER REPORT OF REGISTERED
MANAGEMENT INVESTMENT COMPANIES
Investment Company Act file number 811-08361
Goldman Sachs Variable Insurance Trust
(Exact name of registrant as specified in charter)
71 South Wacker Drive, Chicago, Illinois 60606-6303
(Address of principal executive offices) (Zip code)
Caroline Kraus
Goldman, Sachs & Co.
200 West Street
New York, NY 10282
Copies to:
Geoffrey R.T. Kenyon, Esq.
Dechert LLP
One International Place, 40th Floor
100 Oliver Street
Boston, MA 02110
(Name and address of agents for service)
Registrant’s telephone number, including area code: (312) 655-4400
Date of fiscal year end: December 31
Date of reporting period: December 31, 2014
Explanatory Note
This amended and restated Annual Report (originally filed with the SEC on Form N-CSR on February 27, 2015) revises information with respect to the aggregate non-audit fees under Item 4(g).
| ITEM 1. | REPORTS TO STOCKHOLDERS. |
| | The Annual Reports to Stockholders are filed herewith. |
Goldman
Sachs Variable Insurance Trust
Goldman Sachs
Global Markets
Navigator Fund
Annual Report
December 31, 2014

GOLDMAN SACHS VARIABLE INSURANCE TRUST GLOBAL MARKETS NAVIGATOR FUND
Principal Investment Strategies and Risks
This is not a complete list of the risks that may affect the Fund. For additional information concerning the risks applicable to the Fund, please see the Fund’s Prospectuses.
Shares of the Goldman Sachs Variable Insurance Trust — Goldman Sachs Global Markets Navigator Fund are offered to separate accounts of participating life insurance companies for the purpose of funding variable annuity contracts and variable life insurance policies. Shares of the Fund are not offered directly to the general public. The variable annuity contracts and variable life insurance policies are described in the separate prospectuses issued by participating insurance companies. You should refer to those prospectuses for information about surrender charges, mortality and expense risk fees and other charges that may be assessed by participating insurance companies under the variable annuity contracts or variable life insurance policies. Such fees or charges, if any, may affect the return you realize with respect to your investments. Ask your representative for more complete information. Please consider the Fund’s objective, risks and charges and expenses, and read the Prospectus carefully before investing. The Prospectus contains this and other information about the Fund.
The Goldman Sachs Global Markets Navigator Fund seeks to achieve investment results that approximate the performance of the Goldman Sachs Global Markets Navigator Index™ (the “Index”). The Index is comprised of, and allocates exposure to, a set of underlying indices representing various global asset classes including, but not limited to, global equity, fixed income and commodity assets. The Index is constructed using a proprietary methodology developed by the index provider, and is rebalanced at least monthly. The Fund’s performance may not match, and may vary substantially from, that of the Index. There can be no assurance that the methodology used by the index provider in constructing the Index will correctly forecast certain risks or make effective tactical decisions, and the Fund’s attempt to track this Index may cause it to underperform general securities markets and/or other asset classes. Derivative instruments (including swaps) may involve a high degree of financial risk. These risks include the risk that a small movement in the price of the underlying security or benchmark may result in a disproportionately large movement, unfavorable or favorable, in the price of the derivative instrument; risk of default by a counterparty; and liquidity risk. The Fund’s use of derivatives may result in leverage, which can make the Fund more volatile. Over-the-counter transactions are subject to less government regulation and supervision. The Fund’s equity investments are subject to market risk, which means that the value of its investments may go up or down in response to the prospects of individual companies, particular sectors and/or general economic conditions. The Fund’s fixed income investments are subject to the risks associated with debt securities generally, including credit, liquidity and interest rate risk. The Fund is also subject to the risk that the issuers of sovereign debt or the government authorities that control the payment of debt may be unable or unwilling to repay principal or interest when due. High yield, lower rated investments involve greater price volatility and present greater risks than higher rated fixed income securities. The value of the Fund’s treasury inflation protected securities (TIPS) generally fluctuates in response to inflationary concerns, and as inflationary concerns decrease, TIPS become less valuable. Any guarantee on U.S. government securities applies only to the underlying securities of the Fund if held to maturity and not to the value of the Fund’s shares. The Fund is subject to the risk that exposure to the commodities markets may subject the Fund to greater volatility than investments in traditional securities. Foreign and emerging markets investments may be more volatile and less liquid than investments in U.S. securities and are subject to the risks of currency fluctuations and adverse economic or political developments. At times, the Fund may be unable to sell certain of its portfolio securities without a substantial drop in price, if at all. The Fund’s investments in other investment companies (including ETFs) subject it to additional expenses. Because the Fund may concentrate its investments in an industry (only in the event that an industry represents 20% or more of
1
GOLDMAN SACHS VARIABLE INSURANCE TRUST GLOBAL MARKETS NAVIGATOR FUND
the Fund’s index), the Fund may be subject to greater risk of loss as a result of adverse economic, business or other developments affecting that industry. The Fund is “non-diversified” and may invest more of its assets in fewer issuers than “diversified” funds. Accordingly, the Fund may be more susceptible to adverse developments affecting any single issuer held in its portfolio and to greater losses resulting from these developments.
The “GS Global Markets Navigator Index” is a trademark or service mark of Goldman, Sachs & Co. and has been licensed for use by the Investment Adviser in connection with the Fund. As the licensor of this trademark or service mark, Goldman, Sachs & Co. does not make any representation regarding the advisability of investing in the Fund.
2
GOLDMAN SACHS VARIABLE INSURANCE TRUST GLOBAL MARKETS NAVIGATOR FUND
INVESTMENT OBJECTIVE
The Fund seeks to achieve investment results that approximate the performance of the GS Global Markets Navigator Index.
Portfolio Management Discussion and Analysis
Below, the Goldman Sachs Quantitative Investment Strategies Team discusses the Goldman Sachs Variable Insurance Trust — Goldman Sachs Global Markets Navigator Fund’s (the “Fund”) performance and positioning for the one-year period ended December 31, 2014 (the “Reporting Period”).
How did the Fund perform during the Reporting Period?
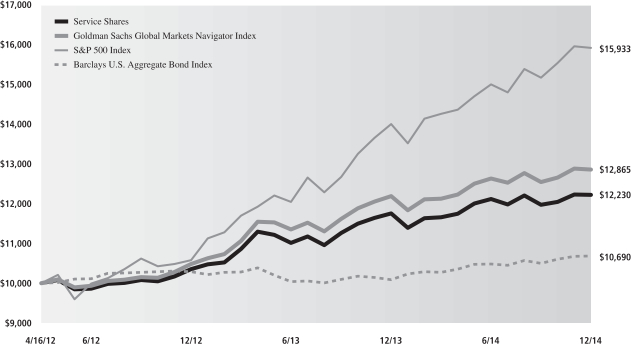
During the Reporting Period, the Fund’s Institutional and Service Shares generated average annual total returns of 4.23% and 3.95%, respectively. These returns compare to the 5.46% average annual total return of the Fund’s benchmark, the GS Global Markets Navigator Index (the “Index”), during the same time period. A blended index comprised 60% of the Standard & Poor’s 500® Index1 (the “S&P 500® Index”) (with dividends reinvested) and 40% of the Barclays U.S. Aggregate Bond Index2 (with dividends reinvested) generated an average annual total return of 10.75% during the same time period. The S&P 500® Index and the Barclays U.S. Aggregate Bond Index generated average annual total returns of 13.69% and 5.97%, respectively, during the same time period.
Importantly, during the Reporting Period, the Fund’s overall annualized volatility was 7.79%, less than the S&P 500® Index’s annualized volatility of 11.18% during the same time period.
What economic and market factors most influenced the Fund during the Reporting Period?
Diverging global economies, U.S. dollar appreciation, strong merger and acquisition activity, weakening oil prices and declining interest rates were major themes affecting the global equities and fixed income markets throughout 2014.
In the U.S., the economic recovery accelerated through the Reporting Period, particularly compared to other major developed markets, which helped fuel U.S. corporate earnings growth and strong U.S. equity returns. Furthermore, the decline in U.S. unemployment to 5.8% and lower energy prices gave new hope to the potential for a broader consumer recovery. In Europe and Japan, however, Gross Domestic Product (“GDP”) growth disappointed. Many observers anticipated further monetary policy easing from these regions’ respective central banks and concerns arose about the potential for deflation in Europe.
Meanwhile, longer-term interest rates trended down during the Reporting Period, with global spread (or non-government bond) sectors generating positive returns. Although the first half of the Reporting Period was marked by a strong rally, spread sectors gave back some of their gains during the second half as global economic and monetary policies diverged.
Falling commodities and energy prices dampened risk sentiment in the second half of 2014. The international Brent crude oil price tumbled from a high of $115 per barrel in June 2014 to approximately $57 per barrel at the end of December 2014. In addition, the U.S. dollar appreciated against most major currencies during the Reporting Period, notably reducing returns of non-U.S. equities expressed in U.S. dollars. The U.S. dollar’s strength was a direct reflection of divergence in developed market economies that played out through the calendar year.
What key factors were responsible for the Fund’s performance during the Reporting Period?
The Fund seeks to achieve its objective by investing in financial instruments that provide exposure to the various underlying global equity and fixed income indices that comprise the GS Global Markets Navigator Index. By dynamically allocating across global asset classes, using a momentum-based methodology, the Fund seeks to manage risk and enhance long-term returns in changing market environments.
| 1 | The S&P 500® Index is the Standard & Poor’s 500 Composite Stock Price Index of 500 stocks, an unmanaged index of common stock prices. The Index figures do not reflect any deduction for fees, expenses or taxes. It is not possible to invest directly in an unmanaged index. |
| 2 | The Barclays U.S. Aggregate Bond Index represents an unmanaged diversified portfolio of fixed income securities, including U.S. Treasuries, investment grade corporate bonds, and mortgage-backed and asset-backed securities. The Index figures do not reflect any deduction for fees, expenses or taxes. It is not possible to invest directly in an unmanaged index. |
3
GOLDMAN SACHS VARIABLE INSURANCE TRUST GLOBAL MARKETS NAVIGATOR FUND
Momentum investing seeks growth of capital by gaining exposure to asset classes that have exhibited trends in price performance over selected time periods. In managing the Fund, we use a methodology that evaluates historical three-, six- and nine-month returns, volatilities and correlations across a range of nine global asset classes. Represented by indices, these asset classes include, within the equities category, U.S. large-cap, U.S. small-cap, Europe, Japan, emerging markets and U.K. stocks. Within the fixed income category, the Fund may allocate assets to U.S., European and Japanese fixed income securities. The analysis of these asset classes drives the aggregate allocations of the Fund over time. We believe market price momentum — either positive or negative — has significant predictive power.
During the Reporting Period, the Fund was hurt by its exposure to emerging markets equities. Emerging markets equities performed strongly during the second quarter of 2014, and as a result, we started to increase the Fund’s allocation to the asset class in May 2014. Strong performance continued into the third calendar quarter, but beginning in September 2014 and through the fourth calendar quarter, emerging markets equities fell sharply in tandem with a drop in commodities prices and a selloff in emerging market currencies. The Fund was also hampered during the Reporting Period overall by its allocation to European and U.K. equities.
On the positive side, the Fund benefited from its exposure to U.S. equities. More specifically, the Fund’s allocation to U.S. large-cap stocks contributed most positively to returns, as U.S. large-cap stocks outpaced most other equity markets during the Reporting Period. The Fund’s modest allocation to Japanese equities also added marginally to returns, as a weakening yen helped exports amid Japan’s disappointing economic growth. In addition, the Fund’s allocation to fixed income enhanced performance during the Reporting Period. In particular, the Fund benefited from its allocation to German government bonds. Substantial exposure to U.S. Treasury securities toward the end of the Reporting Period also boosted returns, as yields continued to retreat in the face of ongoing global economic uncertainty.
How did volatility affect the Fund during the Reporting Period?
As part of our investment approach, we seek to mitigate the Fund’s volatility. As mentioned earlier, for the Reporting Period overall, the Fund’s actual volatility (annualized, using daily returns) was 7.79% versus the S&P 500® Index’s annualized volatility of 11.18%. Throughout the Reporting Period, the Fund’s 90-day realized volatility did not exceed our 10% volatility control.
How was the Fund positioned during the Reporting Period?
During the Reporting Period, we tactically managed the Fund’s allocations across equity and fixed income markets based on the momentum and volatility of these asset classes. The Fund held an average allocation to equities of 72% of its total net assets during the Reporting Period. The Fund had an average allocation to fixed income of 27% of its total net assets and to cash of 1% of its total net assets during the Reporting Period.
At the beginning of the Reporting Period, the Fund’s total assets were allocated 79% to equities, 11% to fixed income and 10% to cash. In the first quarter of 2014, as a result of equity market volatility, we steadily increased the Fund’s exposure to fixed income and reduced its allocation to equities, eliminating its allocation to cash during February 2014, so that by the end of the first calendar quarter, the Fund had almost equal exposure to fixed income and equities. Within equities, the Fund had exposure to U.S. and European stocks and held neutral positions in Japanese and emerging markets equities.
During the second quarter of 2014, as sentiment improved in the global equity markets, we started decreasing the Fund’s allocation to fixed income and increasing its allocation to equities. In particular, we eliminated the Fund’s exposure to U.S. Treasury securities and added allocations to emerging markets equities and U.K. stocks. We also increased the Fund’s allocations to U.S. large-cap stocks and European equities, given their persistently strong returns and relatively benign volatility.
We made no significant changes to the Fund’s positioning during the third quarter of 2014. In the fourth calendar quarter, following the poor performance of global equities during September 2014, we reduced the Fund’s overall allocation to equities. In November 2014, we added a significant allocation to U.S. Treasury securities in seeking to reduce the Fund’s volatility. At the same time, we reduced the Fund’s allocation to European stocks and emerging markets equities. The Fund maintained neutral positions in U.S. small-cap stocks and U.K. equities. In December 2014, as positive trends within global equities reemerged, we reduced the Fund’s allocation to fixed income and increased the Fund’s exposure to global stocks. We also re-introduced allocations to U.S. small-cap stocks and European equities, while significantly reducing the Fund’s exposure to U.S. Treasuries.
4
GOLDMAN SACHS VARIABLE INSURANCE TRUST GLOBAL MARKETS NAVIGATOR FUND
How did the Fund use derivatives and similar instruments during the Reporting Period?
During the Reporting Period, the Fund used exchange-traded index futures contracts to gain exposure to U.S. small-cap equities and non-U.S. developed market equities, including those in Europe and Japan, as well as to gain exposure to U.S. and non-U.S. fixed income.
What is the Fund’s tactical asset allocation view and strategy for the months ahead?
At the end of the Reporting Period, we marginally decreased the Fund’s exposure to equities by increasing its exposure to fixed income. Within equities, we maintained the Fund’s large allocation to U.S. equities because of what we perceive to be continued strong momentum in the U.S. equity market. In addition, we slightly tapered the Fund’s allocation to Japanese stocks, adopted a neutral position in emerging markets equities, and maintained a small allocation to European stocks. Within fixed income, at the end of the Reporting Period, we slightly increased the Fund’s allocation to German government bonds and maintained its small allocation to U.S. Treasury securities. Overall, at the end of the Reporting Period, the Fund’s total assets were allocated 73% to equities, 27% to fixed income and 0% to cash.
Going forward, we seek exposure to price momentum from among nine underlying asset classes, while seeking to dynamically manage the volatility, or risk, of the overall portfolio. When volatility increases, our goal is to preserve capital by moving the Fund into less volatile assets such as fixed income. When we believe the financial markets have become more stable, we expect to allocate a greater portion of the Fund’s assets to equities. There is no guarantee the Fund’s dynamic management strategy will cause the Fund to achieve its investment objective.
5
FUND BASICS
Global Markets Navigator Fund
as of December 31, 2014
STANDARDIZED TOTAL RETURNS1
| | | | | | | | | | |
| For the year ended 12/31/14 | | One Year | | | Since Inception | | | Inception Date |
| Institutional | | | 4.23 | % | | | 6.18 | % | | 10/16/13 |
| Service | | | 3.95 | | | | 7.76 | | | 4/16/12 |
| 1 | Standardized Total Returns are average annual total returns as of the most recent calendar quarter-end. They assume reinvestment of all distributions at net asset value. Because Institutional Shares and Service Shares do not involve a sales charge, such a charge is not applied to their Standardized Total Returns. |
Total return figures in the above chart represent past performance and do not indicate future results, which will vary. The investment return and principal value of an investment will fluctuate and, therefore, an investor’s shares, when redeemed, may be worth more or less than their original cost. Current performance may be lower or higher than the total return figures in the above chart. Please visit www.GSAMFUNDS.com to obtain the most recent month-end returns. Performance reflects fee waivers and/or expense limitations in effect during the periods shown. In their absence, performance would be reduced.
EXPENSE RATIOS2
| | | | | | | | |
| | | Net Expense Ratio (Current) | | | Gross Expense Ratio (Before Waivers) | |
| Institutional | | | 0.86 | % | | | 1.14 | % |
| Service | | | 1.09 | | | | 1.56 | |
| 2 | The expense ratios of the Fund, both current (net of any fee waivers or expense limitations) and before waivers (gross of any fee waivers or expense limitations) are as set forth above. Pursuant to a contractual arrangement, the Fund’s waivers and/or expense limitations will remain in place through at least April 30, 2015 and prior to such date the Investment Adviser may not terminate the arrangements without the approval of the Fund’s Board of Trustees. If these arrangements are discontinued in the future, the expense ratios may change without shareholder approval. |
6
FUND BASICS
FUND COMPOSITION3
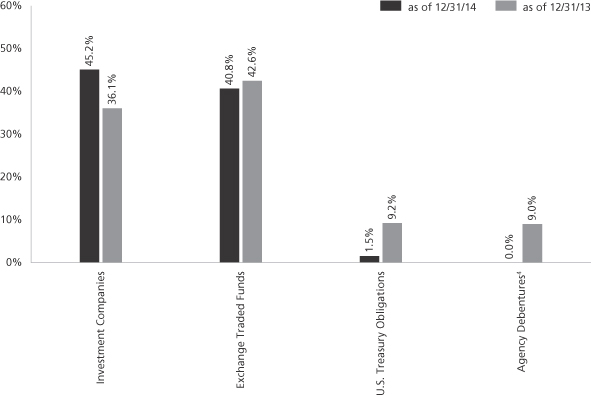
| 3 | The percentage shown for each investment category reflects the value of investments in that category as a percentage of net assets (excluding investments in the securities lending reinvestment vehicle, if any). Investment in the securities lending reinvestment vehicle represents 4.5% of the net assets at December 31, 2014. Figures in the graph may not sum to 100% due to the exclusion of other assets and liabilities. Underlying sector allocations of exchange traded funds held by the Fund are not reflected in the graph above. Consequently, the Fund’s overall sector allocations may differ from the percentages contained in the graph above. The graph depicts the Fund’s investments but may not represent the Fund’s market exposure due to the exclusion of certain derivatives, if any, as listed in the Additional Investment Information section of the Schedule of Investments. |
| 4 | “Agency Debentures” include agency securities offered by companies such as Federal Home Loan Bank and Federal Home Loan Mortgage Corporation, which operate under a government charter. While they are required to report to a government regulator, their assets are not explicitly guaranteed by the government and they otherwise operate like any other publicly traded company. |
7
GOLDMAN SACHS VARIABLE INSURANCE TRUST GLOBAL MARKETS NAVIGATOR FUND
Performance Summary
December 31, 2014
The following graph shows the value, as of December 31, 2014, of a $10,000 investment made on April 16, 2012 (commencement of the Fund’s operations) in Service Shares at NAV. For comparative purposes, the performance of the Fund’s benchmarks, Goldman Sachs Global Markets Navigator Index, S&P 500 Index (with distributions reinvested) and the Barclays U.S. Aggregate Bond Index, is shown. This performance data represents past performance and should not be considered indicative of future performance, which will fluctuate with changes in market conditions. These performance fluctuations will cause an investor’s shares, when redeemed, to be worth more or less than their original cost. Performance reflects Fund level expenses but does not reflect fees and expenses associated with any variable annuity contract or variable life insurance policy that uses the Fund as an investment option for any contract or policy. Had performance reflected all of those fees and expenses, performance would have been reduced. Performance reflects applicable fee waivers and/or expense limitations in effect during the periods shown, and in their absence, performance would be reduced. Performance of Institutional Shares will vary from Service Shares due to differences in class specific fees. In addition to the Investment Adviser’s decisions regarding issuer/industry investment selection and allocation, other factors may affect Fund performance. These factors include, but are not limited to, Fund operating fees and expenses, portfolio turnover, and subscription and redemption cash flows affecting the Fund.
Global Markets Navigator Fund’s Lifetime Performance
Performance of a $10,000 investment, with distributions reinvested, from April 16, 2012 through December 31, 2014.
| | | | |
| Average Annual Total Return through December 31, 2014 | | One Year | | Since Inception |
Institutional (Commenced October 16, 2013) | | 4.23% | | 6.18% |
Service (Commenced April 16, 2012) | | 3.95% | | 7.76% |
8
GOLDMAN SACHS VARIABLE INSURANCE TRUST GLOBAL MARKETS NAVIGATOR FUND
Schedule of Investments
December 31, 2014
| | | | | | | | |
Shares | | | Description | | Value | |
| | Exchange Traded Funds – 40.8% | |
| | 193,646 | | | iShares Core S&P 500 ETF | | $ | 40,065,357 | |
| | 329,231 | | | iShares MSCI Emerging Markets ETF | | | 12,935,486 | |
| | 133,697 | | | iShares Russell 2000 ETF(a) | | | 15,999,520 | |
| | 3,290 | | | SPDR S&P 500 ETF Trust | | | 676,095 | |
| | 212,590 | | | Vanguard S&P 500 ETF | | | 40,062,586 | |
| | |
| | TOTAL EXCHANGE TRADED FUNDS | |
| | (Cost $103,508,981) | | $ | 109,739,044 | |
| | |
| | | | | | | | | | | | |
Principal Amount | | | Interest Rate | | Maturity
Date | | | Value | |
| | U.S. Treasury Obligation – 1.5% | |
| United States Treasury Note | |
| $ | 3,828,000 | | | 2.750% | | | 11/15/23 | | | $ | 4,027,324 | |
| | (Cost $3,980,511) | | | | | |
| | |
| | | | | | |
| Shares | | Distribution
Rate | | Value | |
| Investment Company(b)(c) – 45.2% | |
Goldman Sachs Financial Square Government Fund — FST Shares | |
| 121,367,084 | | 0.006% | | $ | 121,367,084 | |
| (Cost $121,367,084) | | | | |
| |
| TOTAL INVESTMENTS BEFORE SECURITIES LENDING REINVESTMENT VEHICLE | |
| (Cost $228,856,576) | | $ | 235,133,452 | |
| |
| Securities Lending Reinvestment Vehicle(b)(c) – 4.5% | |
Goldman Sachs Financial Square Money Market Fund — FST Shares | |
| 11,955,850 | | 0.060% | | $ | 11,955,850 | |
| (Cost $11,955,850) | | | | |
| |
| TOTAL INVESTMENTS – 92.0% | |
| (Cost $240,812,426) | | $ | 247,089,302 | |
| |
OTHER ASSETS IN EXCESS OF LIABILITIES – 8.0% | | | 21,369,701 | |
| |
| NET ASSETS – 100.0% | | $ | 268,459,003 | |
| |
| | |
| The percentage shown for each investment category reflects the value of investments in that category as a percentage of net assets. |
| (a) | | All or a portion of security is on loan. |
| (b) | | Represents an affiliated issuer. |
| (c) | | Variable rate security. Interest rate or distribution rate disclosed is that which is in effect at December 31, 2014. |
| | |
| Investment Abbreviation: |
| SPDR | | —Standard and Poor’s Depositary Receipts |
ADDITIONAL INVESTMENT INFORMATION
FUTURES CONTRACTS — At December 31, 2014, the Fund had the following futures contracts:
| | | | | | | | | | | | |
| Type | | Number of
Contracts
Long (Short) | | Expiration
Date | | Current Value | | | Unrealized
Gain (Loss) | |
| EURO STOXX 50 Index | | 184 | | March 2015 | | $ | 6,975,599 | | | $ | 183,499 | |
| Euro-Bund | | 325 | | March 2015 | | | 61,298,410 | | | | 1,040,650 | |
TSE TOPIX Index | | 682 | | March 2015 | | | 80,139,840 | | | | (2,602,142 | ) |
| TOTAL | | | | | | | | | | $ | (1,377,993 | ) |
| | |
| The accompanying notes are an integral part of these financial statements. | | 9 |
GOLDMAN SACHS VARIABLE INSURANCE TRUST GLOBAL MARKETS NAVIGATOR FUND
Statement of Assets and Liabilities
December 31, 2014
| | | | |
| | | | |
| Assets: | | | |
Investments in unaffiliated issuers, at value (cost $107,489,492)(a) | | $ | 113,766,368 | |
Investments in affiliated issuer, at value (cost $121,367,084) | | | 121,367,084 | |
Investments in affiliated securities lending reinvestment vehicle, at value which equals cost | | | 11,955,850 | |
Cash | | | 30,234,898 | |
Receivables: | | | | |
Collateral on certain derivative contracts | | | 4,398,930 | |
Reimbursement from investment adviser | | | 61,387 | |
Fund shares sold | | | 35,896 | |
Dividends and interest | | | 14,111 | |
Securities lending income | | | 2,452 | |
Other assets | | | 4,270 | |
| Total assets | | | 281,841,246 | |
| | | | |
| | | | |
| Liabilities: | | | |
Payables: | | | | |
Payable upon return of securities loaned | | | 11,955,850 | |
Investments purchased | | | 852,853 | |
Fund shares redeemed | | | 254,002 | |
Management fees | | | 160,943 | |
Distribution and Service fees and Transfer Agent fees | | | 58,614 | |
Variation margin on certain derivative contracts | | | 17,033 | |
Accrued expenses | | | 82,948 | |
| Total liabilities | | | 13,382,243 | |
| | | | |
| | | | |
| Net Assets: | | | |
Paid-in capital | | | 256,974,945 | |
Undistributed net investment income | | | 311,386 | |
Accumulated net realized gain | | | 6,218,514 | |
Net unrealized gain | | | 4,954,158 | |
| NET ASSETS | | $ | 268,459,003 | |
Net Assets: | | | | |
Institutional | | $ | 738,981 | |
Service | | | 267,720,022 | |
Total Net Assets | | $ | 268,459,003 | |
Shares of beneficial interest outstanding $0.001 par value (unlimited shares authorized): | | | | |
Institutional | | | 62,528 | |
Service | | | 22,658,324 | |
Net asset value, offering and redemption price per share: | | | | |
Institutional | | | $11.82 | |
Service | | | 11.82 | |
(a) Includes loaned securities having a market value of $11,650,988.
| | |
| 10 | | The accompanying notes are an integral part of these financial statements. |
GOLDMAN SACHS VARIABLE INSURANCE TRUST GLOBAL MARKETS NAVIGATOR FUND
Statement of Operations
For the Fiscal Year Ended December 31, 2014
| | | | |
| | | | |
| Investment income: | | | |
Dividends — unaffiliated issuers | | $ | 1,697,478 | |
Interest | | | 250,308 | |
Securities lending income — affiliated issuer | | | 20,820 | |
Dividends — affiliated issuers | | | 3,273 | |
| Total investment income | | | 1,971,879 | |
| | | | |
| | | | |
| Expenses: | | | |
Management fees | | | 1,461,767 | |
Distribution and Service fees — Service Class | | | 462,091 | |
Professional fees | | | 168,384 | |
Printing and mailing costs | | | 72,290 | |
Custody, accounting and administrative services | | | 52,707 | |
Transfer Agent fees(a) | | | 37,003 | |
Trustee fees | | | 23,549 | |
Other | | | 16,926 | |
| Total expenses | | | 2,294,717 | |
Less — expense reductions | | | (391,127 | ) |
| Net expenses | | | 1,903,590 | |
| NET INVESTMENT INCOME | | | 68,289 | |
| | | | |
| | | | |
| Realized and unrealized gain (loss): | | | |
Net realized gain from: | | | | |
Investments | | | 561,040 | |
Futures contracts | | | 8,109,537 | |
Foreign currency transactions | | | 15,163 | |
Net change in unrealized gain (loss) on: | | | | |
Investments | | | 1,667,749 | |
Futures contracts | | | (2,847,662 | ) |
Foreign currency translation | | | 50,213 | |
| Net realized and unrealized gain | | | 7,556,040 | |
| NET INCREASE IN NET ASSETS RESULTING FROM OPERATIONS | | $ | 7,624,329 | |
(a) Institutional and Service Shares had Transfer Agent fees of $39 and $36,964, respectively.
| | |
| The accompanying notes are an integral part of these financial statements. | | 11 |
GOLDMAN SACHS VARIABLE INSURANCE TRUST GLOBAL MARKETS NAVIGATOR FUND
Statements of Changes in Net Assets
| | | | | | | | |
| | | For the Fiscal Year Ended
December 31, 2014 | | | For the Fiscal Year Ended
December 31, 2013 | |
| | | | | | | | |
| From operations: | | | | | | |
Net investment income (loss) | | $ | 68,289 | | | $ | (141,146 | ) |
Net realized gain | | | 8,685,740 | | | | 2,956,011 | |
Net change in unrealized gain (loss) | | | (1,129,700 | ) | | | 5,738,586 | |
| Net increase in net assets resulting from operations | | | 7,624,329 | | | | 8,553,451 | |
| | | | | | | | |
| | | | | | | | |
| Distributions to shareholders: | | | | | | |
From net investment income | | | | | | | | |
Institutional Shares(a) | | | (1,539 | ) | | | (45 | ) |
Service Shares | | | (95,487 | ) | | | (57,983 | ) |
From net realized gains | | | | | | | | |
Institutional Shares(a) | | | (5,716 | ) | | | (623 | ) |
Service Shares | | | (2,127,353 | ) | | | (3,170,038 | ) |
| Total distributions to shareholders | | | (2,230,095 | ) | | | (3,228,689 | ) |
| | | | | | | | |
| | | | | | | | |
| From share transactions: | | | | | | |
Proceeds from sales of shares | | | 143,896,829 | | | | 110,493,138 | |
Reinvestment of distributions | | | 2,230,095 | | | | 3,228,689 | |
Cost of shares redeemed | | | (19,203,651 | ) | | | (8,894,669 | ) |
| Net increase in net assets resulting from share transactions | | | 126,923,273 | | | | 104,827,158 | |
| TOTAL INCREASE | | | 132,317,507 | | | | 110,151,920 | |
| | | | | | | | |
| | | | | | | | |
| Net assets: | | | | | | |
| | |
Beginning of year | | | 136,141,496 | | | | 25,989,576 | |
End of year | | $ | 268,459,003 | | | $ | 136,141,496 | |
| Undistributed net investment income | | $ | 311,386 | | | $ | 96,073 | |
(a) Institutional Shares commenced operations on October 16, 2013.
| | |
| 12 | | The accompanying notes are an integral part of these financial statements. |
GOLDMAN SACHS VARIABLE INSURANCE TRUST GLOBAL MARKETS NAVIGATOR FUND
Financial Highlights
Selected Data for a Share Outstanding Throughout Each Period
| | | | | | | | | | | | | | | | | | | | | | | | | | | | | | | | | | | | | | | | | | | | | | | | | | | | | | | | |
| | | | | | Income (loss) from
investment operations | | | Distributions to shareholders | | | | | | | | | | | | | | | | | | | | | | |
| Year - Share Class | | Net asset
value, beginning
of period | | | Net investment
income
(loss)(a) | | | Net
realized
and
unrealized
gain | | | Total from
investment
operations | | | From net
investment
income | | | From
net
realized
gains | | | Total
distributions | | | Net asset
value,
end of
period | | | Total
return(b) | | | Net assets,
end of
period
(in 000s) | | | Ratio of
net expenses
to average
net assets | | | Ratio of
total
expenses
to average
net assets | | | Ratio of
net investment
income (loss)
to average net assets | | | Portfolio
turnover
rate(c) | |
FOR THE FISCAL YEARS ENDED DECEMBER 31, | |
2014 - Institutional | | $ | 11.46 | | | $ | 0.08 | | | $ | 0.41 | | | $ | 0.49 | | | $ | (0.03 | ) | | $ | (0.10 | ) | | $ | (0.13 | ) | | $ | 11.82 | | | | 4.23 | % | | $ | 739 | | | | 0.77 | % | | | 1.01 | % | | | 0.68 | % | | | 304 | % |
2014 - Service | | | 11.47 | | | | — | (d) | | | 0.45 | | | | 0.45 | | | | — | (d) | | | (0.10 | ) | | | (0.10 | ) | | | 11.82 | | | | 3.95 | | | | 267,720 | | | | 1.03 | | | | 1.24 | | | | 0.04 | | | | 304 | |
2013 - Institutional (Commenced October 16, 2013) | | | 11.41 | | | | 0.01 | | | | 0.34 | | | | 0.35 | | | | (0.02 | ) | | | (0.28 | ) | | | (0.30 | ) | | | 11.46 | | | | 3.17 | | | | 26 | | | | 0.81 | (e) | | | 1.09 | (e) | | | 0.33 | (e) | | | 195 | |
2013 - Service | | | 10.36 | | | | (0.02 | ) | | | 1.42 | | | | 1.40 | | | | (0.01 | ) | | | (0.28 | ) | | | (0.29 | ) | | | 11.47 | | | | 13.57 | | | | 136,116 | | | | 1.04 | | | | 1.51 | | | | (0.21 | ) | | | 195 | |
| | | | | | | | | | | | | | | | | | | | | | | | | | | | | | | | | | | | | | | | | | | | | | | | | | | | | | | | |
FOR THE PERIOD ENDED DECEMBER 31, | |
2012 - Service (Commenced April 16, 2012) | | | 10.00 | | | | 0.02 | | | | 0.35 | | | | 0.37 | | | | — | | | | (0.01 | ) | | | (0.01 | ) | | | 10.36 | | | | 3.74 | | | | 25,990 | | | | 1.04 | (e) | | | 4.21 | (e) | | | 0.27 | (e) | | | 300 | |
| (a) | Calculated based on the average shares outstanding methodology. |
| (b) | Assumes investment at the net asset value at the beginning of the period, reinvestment of all distributions, and a complete redemption of the investment at the net asset value at the end of the period. Total returns for periods less than one full year are not annualized. |
| (c) | The Fund’s portfolio turnover rate is calculated in accordance with regulatory requirements, without regard to transactions involving short term investments and certain derivatives. If such transactions were included, the Fund’s portfolio turnover rate may be higher. |
| (d) | Amount is less than $0.005 per share. |
| | | | |
| The accompanying notes are an integral part of these financial statements. | | 13 | | |
GOLDMAN SACHS VARIABLE INSURANCE TRUST GLOBAL MARKETS NAVIGATOR FUND
Notes to Financial Statements
December 31, 2014
1. ORGANIZATION
Goldman Sachs Variable Insurance Trust (the “Trust” or “VIT”) is a Delaware statutory trust registered under the Investment Company Act of 1940, as amended (the “Act”), as an open-end management investment company. The Trust includes the Goldman Sachs Global Markets Navigator Fund (the “Fund”). The Fund is a non-diversified portfolio under the Act offering two classes of shares — Institutional and Service Shares. Shares of the Trust are offered to separate accounts of participating life insurance companies for the purpose of funding variable annuity contracts and variable life insurance policies.
Goldman Sachs Asset Management, L.P. (“GSAM”), an affiliate of Goldman, Sachs & Co. (“Goldman Sachs”), serves as investment adviser to the Fund pursuant to a management agreement (the “Agreement”) with the Trust.
2. SIGNIFICANT ACCOUNTING POLICIES
The financial statements have been prepared in accordance with accounting principles generally accepted in the United States of America (“GAAP”) and require management to make estimates and assumptions that may affect the reported amounts and disclosures. Actual results may differ from those estimates and assumptions.
A. Investment Valuation — The Fund’s valuation policy is to value investments at fair value.
B. Investment Income and Investments — Investment income includes interest income and dividend income, net of any foreign withholding taxes, less any amounts reclaimable. Interest income is accrued daily and adjusted for amortization of premiums and accretion of discounts. Dividend income is recognized on ex-dividend date or, for certain foreign securities, as soon as such information is obtained subsequent to the ex-dividend date. Investment transactions are reflected on trade date. Realized gains and losses are calculated using identified cost. Investment transactions are recorded on the following business day for daily net asset value (“NAV”) calculations. Any foreign capital gains tax is accrued daily based upon net unrealized gains, and is payable upon sale of such investments.
For derivative contracts, realized gains and losses are recorded upon settlement of the contract.
C. Class Allocations and Expenses — Investment income, realized and unrealized gain (loss), and non-class specific expenses of the Fund are allocated daily based upon the proportion of net assets of each class. Class specific expenses, where applicable, are borne by the respective share classes and include Distribution and Service and Transfer Agent fees. Non-class specific expenses directly incurred by a Fund are charged to that Fund, while such expenses incurred by the Trust are allocated across the respective Funds on a straight-line and/or pro-rata basis depending upon the nature of the expenses.
D. Federal Taxes and Distributions to Shareholders — It is the Fund’s policy to comply with the requirements of the Internal Revenue Code of 1986, as amended (the “Code”), applicable to regulated investment companies (mutual funds) and to distribute each year substantially all of its investment company taxable income and capital gains to its shareholders. Accordingly, the Fund is not required to make any provisions for the payment of federal income tax. Distributions to shareholders are recorded on the ex-dividend date. Income and capital gains distributions, if any, are declared and paid annually.
Net capital losses are carried forward to future fiscal years and may be used to the extent allowed by the Code to offset any future capital gains. Losses that are carried forward will retain their character as either short-term or long-term capital losses. Utilization of capital loss carryforwards will reduce the requirement of future capital gains distributions.
The characterization of distributions to shareholders for financial reporting purposes is determined in accordance with federal income tax rules, which may differ from GAAP. The source of the Fund’s distributions may be shown in the accompanying financial statements as either from net investment income, net realized gain or capital. Certain components of the Fund’s net assets on the Statement of Assets and Liabilities reflect permanent GAAP/tax differences based on the appropriate tax character.
E. Foreign Currency Translation — The accounting records and reporting currency of the Fund are maintained in United States (“U.S.”) dollars. Assets and liabilities denominated in foreign currencies are translated into U.S. dollars using the current exchange rates at the close of each business day. The effect of changes in foreign currency exchange rates on investments is included within net realized and unrealized gain (loss) on investments. Changes in the value of other assets and liabilities as a result of fluctuations
14
GOLDMAN SACHS VARIABLE INSURANCE TRUST GLOBAL MARKETS NAVIGATOR FUND
2. SIGNIFICANT ACCOUNTING POLICIES (continued)
in foreign exchange rates are included in the Statement of Operations within net change in unrealized gain (loss) on foreign currency transactions. Transactions denominated in foreign currencies are translated into U.S. dollars on the date the transaction occurred, the effects of which are included within net realized gain (loss) on foreign currency transactions.
3. INVESTMENTS AND FAIR VALUE MEASUREMENTS
The fair value of a financial instrument is the amount that would be received to sell an asset or paid to transfer a liability in an orderly transaction between market participants at the measurement date (i.e., the exit price). GAAP establishes a fair value hierarchy that prioritizes the inputs to valuation techniques used to measure fair value. The hierarchy gives the highest priority to unadjusted quoted prices in active markets for identical assets or liabilities (Level 1 measurements) and the lowest priority to unobservable inputs (Level 3 measurements). The levels used for classifying investments are not necessarily an indication of the risk associated with investing in these investments. The three levels of the fair value hierarchy are described below:
Level 1 — Unadjusted quoted prices in active markets that are accessible at the measurement date for identical, unrestricted assets or liabilities;
Level 2 — Quoted prices in markets that are not active or financial instruments for which significant inputs are observable (including, but not limited to, quoted prices for similar investments, interest rates, foreign exchange rates, volatility and credit spreads), either directly or indirectly;
Level 3 — Prices or valuations that require significant unobservable inputs (including GSAM’s assumptions in determining fair value measurement).
The Trustees have adopted Valuation Procedures that govern the valuation of the portfolio investments held by the Fund, including investments for which market quotations are not readily available. The Trustees have delegated to GSAM day-to-day responsibility for implementing and maintaining internal controls and procedures related to the valuation of the Fund’s portfolio investments. To assess the continuing appropriateness of pricing sources and methodologies, GSAM regularly performs price verification procedures and issues challenges as necessary to third party pricing vendors or brokers, and any differences are reviewed in accordance with the Valuation Procedures.
A. Level 1 and Level 2 Fair Value Investments — The valuation techniques and significant inputs used in determining the fair values for investments classified as Level 1 and Level 2 are as follows:
Equity Securities — Equity securities and investment companies traded on a U.S. securities exchange or the NASDAQ system, or those located on certain foreign exchanges, including but not limited to the Americas, are valued daily at their last sale price or official closing price on the principal exchange or system on which they are traded. If no sale occurs, equity securities and exchange traded investment companies are valued at the last bid price for long positions and at the last ask price for short positions. Investments in investment companies (other than those that are exchange traded) are valued at the NAV on the valuation date. To the extent these investments are actively traded, they are classified as Level 1 of the fair value hierarchy, otherwise they are generally classified as Level 2.
Unlisted equity securities for which market quotations are available are valued at the last sale price on the valuation date, or if no sale occurs, at the last bid price. Securities traded on certain foreign securities exchanges are valued daily at fair value determined by an independent fair value service (if available) under Valuation Procedures approved by the Trustees and consistent with applicable regulatory guidance. The independent fair value service takes into account multiple factors including, but not limited to, movements in the securities markets, certain depositary receipts, futures contracts and foreign currency exchange rates that have occurred subsequent to the close of the foreign securities exchange. These investments are generally classified as Level 2 of the fair value hierarchy.
Investments in Money Market Funds — Investments in the Goldman Sachs Financial Square Government Fund are valued at the NAV of the Institutional Share class on the day of valuation. Because the Fund invests in other mutual funds that fluctuate in
15
GOLDMAN SACHS VARIABLE INSURANCE TRUST GLOBAL MARKETS NAVIGATOR FUND
Notes to Financial Statements (continued)
December 31, 2014
3. INVESTMENTS AND FAIR VALUE MEASUREMENTS (continued)
value, the Fund’s shares will correspondingly fluctuate in value. These investments are generally classified as Level 1 of the fair value hierarchy.
The Goldman Sachs Financial Square Government Fund may invest in debt securities which are valued daily on the basis of quotations supplied by dealers if market quotations are readily available, or an independent pricing service approved by the Trustees. The pricing services may use valuation models or matrix pricing, which consider: (i) yield or price with respect to bonds that are considered comparable in characteristics such as rating, interest rate and maturity date or (ii) quotations from securities dealers to determine current value. Short-term debt obligations that mature in sixty days or less and that do not exhibit signs of credit deterioration are valued at amortized cost, which approximates fair value. With the exception of treasury securities, which are generally classified as Level 1, these investments are generally classified as Level 2 of the fair value hierarchy.
Debt Securities — Debt securities for which market quotations are readily available are valued daily on the basis of quotations supplied by dealers or an independent pricing service approved by the Trustees. The pricing services may use valuation models or matrix pricing, which consider: (i) yield or price with respect to bonds that are considered comparable in characteristics such as rating, interest rate and maturity date or (ii) quotations from securities dealers to determine current value. Short-term debt obligations that mature in sixty days or less and that do not exhibit signs of credit deterioration are valued at amortized cost, which approximates fair value. With the exception of treasury securities of G8 countries (not held in any money market funds), which are generally classified as Level 1, these investments are generally classified as Level 2 of the fair value hierarchy.
Derivative Contracts — A derivative is an instrument whose value is derived from underlying assets, indices, reference rates or a combination of these factors. The Fund enters into derivative transactions to hedge against changes in interest rates, securities prices, and/or currency exchange rates, to increase total return, or to gain access to certain markets or attain exposure to other underliers.
Exchange-traded derivatives, including futures contracts, typically fall within Level 1 of the fair value hierarchy. Over-the-counter (“OTC”) and centrally cleared derivatives are valued using market transactions and other market evidence, including market-based inputs to models, calibration to market-clearing transactions, broker or dealer quotations, or other alternative pricing sources. Where models are used, the selection of a particular model to value OTC and centrally cleared derivatives depends upon the contractual terms of, and specific risks inherent in, the instrument, as well as the availability of pricing information in the market. Valuation models require a variety of inputs, including contractual terms, market prices, yield curves, credit curves, measures of volatility, voluntary and involuntary prepayment rates, loss severity rates and correlations of such inputs. For OTC and centrally cleared derivatives that trade in liquid markets, model inputs can generally be verified and model selection does not involve significant management judgment. OTC and centrally cleared derivatives are classified within Level 2 of the fair value hierarchy when significant inputs are corroborated by market evidence.
i. Futures Contracts — Futures contracts are contracts to buy or sell a standardized quantity of a specified commodity or security and are valued based on exchanged settlement prices or independent market quotes. Futures contracts are valued at the last settlement price, or in the absence of a sale, the last bid price for long positions and at the last ask price for short positions, at the end of each day on the board of trade or exchange upon which they are traded. Upon entering into a futures contract, the Fund deposits cash or securities in an account on behalf of the broker in an amount sufficient to meet the initial margin requirement. Subsequent payments are made or received by the Fund equal to the daily change in the contract value and are recorded as variation margin receivable or payable with a corresponding offset to unrealized gains or losses.
B. Level 3 Fair Value Investments — To the extent that the aforementioned significant inputs are unobservable, or if quotations are not readily available, or if GSAM believes that such quotations do not accurately reflect fair value, the fair value of the Fund’s investments may be determined under Valuation Procedures approved by the Trustees. GSAM, consistent with its procedures and applicable regulatory guidance, may make an adjustment to the most recent valuation prices of either domestic or foreign securities in light of significant events to reflect what it believes to be the fair value of the securities at the time of determining a Fund’s NAV. Significant events which could affect a large number of securities in a particular market may include, but are not limited to: significant fluctuations in U.S. or foreign markets; market dislocations; market disruptions; or unscheduled market closings.
16
GOLDMAN SACHS VARIABLE INSURANCE TRUST GLOBAL MARKETS NAVIGATOR FUND
3. INVESTMENTS AND FAIR VALUE MEASUREMENTS (continued)
Significant events which could also affect a single issuer may include, but are not limited to: corporate actions such as reorganizations, mergers and buy-outs; ratings downgrades; and bankruptcies.
C. Fair Value Hierarchy — The following is a summary of the Fund’s investments and derivatives classified in the fair value hierarchy as of December 31, 2014:
| | | | | | | | | | | | |
| Investment Type | | Level 1 | | | Level 2 | | | Level 3 | |
| Assets | | | | | | | | | | | | |
| Fixed Income | | | | | | | | | | | | |
U.S. Treasury Obligation and/or Other U.S. Government Agencies | | $ | 4,027,324 | | | $ | — | | | $ | — | |
| Exchange Traded Funds | | | 109,739,044 | | | | — | | | | — | |
| Investment Company | | | 121,367,084 | | | | — | | | | — | |
| Securities Lending Reinvestment Vehicle | | | 11,955,850 | | | | — | | | | — | |
| Total | | $ | 247,089,302 | | | $ | — | | | $ | — | |
| | | |
| Derivative Type | | | | | | | | | |
| Assets(a) | | | | | | | | | | | | |
| Futures Contracts | | $ | 1,224,149 | | | $ | — | | | $ | — | |
| Liabilities(a) | | | | | | | | | | | | |
| Futures Contracts | | $ | (2,602,142 | ) | | $ | — | | | $ | — | |
| (a) | Amount shown represents unrealized gain (loss) at period end. |
For further information regarding security characteristics, see the Schedule of Investments.
4. INVESTMENTS IN DERIVATIVES
The following table sets forth, by certain risk types, the gross value of derivative contracts as of December 31, 2014. These instruments were used to meet the Fund’s investment objectives and to obtain and/or manage exposure related to the risks below. The values in the table below exclude the effects of cash collateral received or posted pursuant to these derivative contracts, and therefore are not representative of the Fund’s net exposure.
| | | | | | | | | | | | |
| Risk | | Statement of Assets and Liabilities | | Assets(a) | | | Statement of Assets and Liabilities | | Liabilities(a) | |
| Equity | | Variation margin on certain derivative contracts | | $ | 183,499 | | | Variation margin on certain derivative contracts | | $ | (2,602,142 | ) |
| Interest Rate | | Variation margin on certain derivative contracts | | | 1,040,650 | | | — | | | — | |
| Total | | | | $ | 1,224,149 | | | | | $ | (2,602,142 | ) |
| (a) | Includes unrealized gain (loss) on futures contracts described in the Additional Investment Information section of the Schedule of Investments. Only current day’s variation margin is reported within the Statement of Assets and Liabilities. |
The following table sets forth, by certain risk types, the Fund’s gains (losses) related to these derivatives and their indicative volumes for the fiscal year ended December 31, 2014. These gains (losses) should be considered in the context that these derivative contracts may have been executed to create investment opportunities and/or economically hedge certain investments, and
17
GOLDMAN SACHS VARIABLE INSURANCE TRUST GLOBAL MARKETS NAVIGATOR FUND
Notes to Financial Statements (continued)
December 31, 2014
4. INVESTMENTS IN DERIVATIVES (continued)
accordingly, certain gains (losses) on such derivative contracts may offset certain (losses) gains attributable to investments. These gains (losses) are included in “Net realized gain (loss)” or “Net change in unrealized gain (loss)” on the Statement of Operations:
| | | | | | | | | | | | | | |
| Risk | | Statement of Operations | | Net Realized
Gain (Loss) | | | Net Change in
Unrealized
Gain (Loss) | | | Average
Number of
Contracts(a) | |
Equity | | Net realized gain (loss) from futures contracts/Net change in unrealized gain (loss) on futures contracts | | $ | 5,034,670 | | | $ | (4,152,112 | ) | | | 893 | |
Interest Rate | | Net realized gain (loss) from futures contracts/Net change in unrealized gain (loss) on futures contracts | | | 3,074,867 | | | | 1,304,450 | | | | 177 | |
| Total | | | | $ | 8,109,537 | | | $ | (2,847,662 | ) | | | 1,070 | |
| (a) | Average number of contracts is based on the average of month end balances for the fiscal year ended December 31, 2014. |
5. AGREEMENTS AND AFFILIATED TRANSACTIONS
A. Management Agreement — Under the Agreement, GSAM manages the Fund, subject to the general supervision of the Trustees.
As compensation for the services rendered pursuant to the Agreement, the assumption of the expenses related thereto and administration of the Fund’s business affairs, including providing facilities, GSAM is entitled to a management fee, accrued daily and paid monthly, equal to an annual percentage rate of the Fund’s average daily net assets.
For the fiscal year ended December 31, 2014, contractual and effective net management fees with GSAM were at the following rates:
| | | | | | | | | | | | | | | | | | | | | | | | | | |
| Contractual Management Fee Rate | | | | |
First
$1 billion | | | Next
$1 billion | | | Next
$3 billion | | | Next
$3 billion | | | Over
$8 billion | | | Effective
Rate | | | Effective Net
Management
Fee Rate | |
| | 0.79% | | | | 0.71 | % | | | 0.68 | % | | | 0.66 | % | | | 0.65 | % | | | 0.79 | % | | | 0.75 | %* |
| * | GSAM has agreed to waive a portion of its management fee payable by the Fund in an amount equal to any management fees it earns as an investment adviser to any of the affiliated funds in which the Fund invests. The management fee waiver will remain in effect through at least April 30, 2015, and prior to such date GSAM may not terminate the arrangement without approval of the Trustees. The Effective Net Management Rate above is calculated based on the management rate before and after the waiver had been adjusted, if applicable. For the fiscal year ended December 31, 2014, GSAM waived $70,298 of its management fee |
B. Distribution and Service Plan — The Trust, on behalf of the Service Shares of the Fund, has adopted a Distribution and Service Plan (the “Plan”). Under the Plan, Goldman Sachs, which serves as distributor (the “Distributor”), is entitled to a fee accrued daily and paid monthly, for distribution services and personal and account maintenance services, which may then be paid by Goldman Sachs to authorized dealers, equal to, on an annual basis, 0.25% of the Fund’s average daily net assets attributable to Service Shares.
C. Transfer Agency Agreement — Goldman Sachs also serves as the transfer agent of the Fund for a fee pursuant to a Transfer Agency Agreement. The fees charged for such transfer agency services are accrued daily and paid monthly at an annual rate of 0.02% of the average daily net assets of Institutional and Service Shares.
D. Other Expense Agreements and Affiliated Transactions — GSAM has agreed to limit certain “Other Expenses” of the Fund (excluding transfer agency fees and expenses, taxes, interest, brokerage fees, shareholder meetings, litigation, indemnification, and extraordinary expenses) to the extent such expenses exceed, on an annual basis, a percentage rate of the average daily net assets of the Fund. Such Other Expense reimbursements, if any, are accrued daily and paid monthly. In addition, the Fund is not obligated to reimburse GSAM for prior fiscal year expense reimbursements, if any. The Other Expense limitation as
18
GOLDMAN SACHS VARIABLE INSURANCE TRUST GLOBAL MARKETS NAVIGATOR FUND
5. AGREEMENTS AND AFFILIATED TRANSACTIONS (continued)
an annual percentage rate of average daily net assets for the Fund is 0.004%. The Other Expense limitation will remain in place through at least April 30, 2015, and prior to such date GSAM may not terminate the arrangement without the approval of the Trustees. The Fund bears its respective share of costs related to proxy and shareholder meetings, and GSAM has agreed to reimburse the Fund to the extent such expenses exceed a specified percentage of the Fund’s net assets. For the fiscal year ended December 31, 2014, GSAM reimbursed $320,162 to the Fund. In addition, the Fund has entered into certain offset arrangements with the custodian and the transfer agent, which may result in a reduction of the Fund’s expenses and are received irrespective of the application of the “Other Expense” limitation described above. For the fiscal year ended December 31, 2014, custody fee credits were $667.
E. Line of Credit Facility — As of December 31, 2014, the Fund participated in a $1,080,000,000 committed, unsecured revolving line of credit facility (the “facility”) together with other funds of the Trust and registered investment companies having management agreements with GSAM or its affiliates (“Other Borrowers”). Pursuant to the terms of the facility, the Fund and Other Borrowers could increase the credit amount by an additional $120,000,000, for a total of up to $1,200,000,000. This facility is to be used solely for temporary or emergency purposes, which may include the funding of redemptions. The interest rate on borrowings is based on the federal funds rate. The facility also requires a fee to be paid by the Fund based on the amount of the commitment that has not been utilized. For the fiscal year ended December 31, 2014, the Fund did not have any borrowings under the facility.
F. Other Transactions with Affiliates — For the fiscal year ended December 31, 2014, Goldman Sachs earned $19 in brokerage commissions from portfolio transactions.
The following table provides information about the investment in shares of a fund of which the Fund is an affiliate for the fiscal year ended December 31, 2014:
| | | | | | | | | | | | | | | | | | | | | | | | |
| Name of Affiliated Fund | | Number of
Shares Held
Beginning of
Year | | | Shares Bought | | | Shares Sold | | | Number of
Shares Held
End of Year | | | Value at End of Year | | | Dividend
Income | |
| Goldman Sachs Financial Square Government Fund | | | 49,080,417 | | | | 378,847,117 | | | | (306,560,450 | ) | | | 121,367,084 | | | $ | 121,367,084 | | | $ | 3,273 | |
6. PORTFOLIO SECURITIES TRANSACTIONS
The cost of purchases and proceeds from sales and maturities of long-term securities for the fiscal year ended December 31, 2014, were as follows:
| | | | | | | | | | | | | | |
Purchases of
U.S. Government and
Agency Obligations | | | Purchases (Excluding
U.S. Government and
Agency Obligations | | | Sales and
Maturities of
U.S. Government and
Agency Obligations | | | Sales and
Maturities (Excluding
U.S. Government and
Agency Obligations | |
| | $123,448,254 | | | $ | 199,071,167 | | | $ | 120,488,856 | | | $ | 148,455,686 | |
7. SECURITIES LENDING
Pursuant to exemptive relief granted by the Securities and Exchange Commission (“SEC”) and the terms and conditions contained therein, the Fund may lend its securities through a securities lending agent, Goldman Sachs Agency Lending (“GSAL”), a wholly-owned subsidiary of Goldman Sachs, to certain qualified borrowers including Goldman Sachs and affiliates. In accordance with the Fund’s securities lending procedures, the Fund receives cash collateral at least equal to the market value of the securities on loan. The market value of the loaned securities is determined at the close of business of the Fund at their last sale price or official closing price on the principal exchange or system on which they are traded, and any additional required collateral is delivered to the Fund
19
GOLDMAN SACHS VARIABLE INSURANCE TRUST GLOBAL MARKETS NAVIGATOR FUND
Notes to Financial Statements (continued)
December 31, 2014
7. SECURITIES LENDING (continued)
on the next business day. As with other extensions of credit, the Fund may experience delay in the recovery of its securities or incur a loss should the borrower of the securities breach its agreement with the Fund or become insolvent at a time when the collateral is insufficient to cover the cost of repurchasing securities on loan. Dividend income received from securities on loan may not be subject to withholding taxes and therefore withholding taxes paid may differ from the amounts listed in the Statement of Operations.
The Fund invests the cash collateral received in connection with securities lending transactions in the Goldman Sachs Financial Square Money Market Fund (“Money Market Fund”), an affiliated series of the Trust. The Money Market Fund is registered under the Act as an open end investment company, is subject to Rule 2a-7 under the Act, and is managed by GSAM, for which GSAM may receive an investment advisory fee of up to 0.205% on an annualized basis of the average daily net assets of the Money Market Fund.
In the event of a default by a borrower with respect to any loan, GSAL will exercise any and all remedies provided under the applicable borrower agreement to make the Fund whole. These remedies include purchasing replacement securities by applying the collateral held from the defaulting broker against the purchase cost of the replacement securities. If, despite such efforts by GSAL to exercise these remedies, the Fund sustains losses as a result of a borrower’s default, GSAL indemnifies the Fund by purchasing replacement securities at its expense, or paying the Fund an amount equal to the market value of the replacement securities, subject to an exclusion for any shortfalls resulting from a loss of value in the cash collateral pool due to reinvestment risk and a requirement that the Fund agrees to assign rights to the collateral to GSAL for purpose of using the collateral to cover purchase of replacement securities as more fully described in the Securities Lending Agency Agreement. The Fund’s loaned securities were all subject to enforceable Securities Lending Agreements and the value of the collateral is equal to the value of the cash received. The value of loaned securities and cash collateral at period end are disclosed in the Fund’s Statement of Assets and Liabilities.
Both the Fund and GSAL received compensation relating to the lending of the Fund’s securities. The amount earned by the Fund for the fiscal year ended December 31, 2014, is reported under Investment Income on the Statement of Operations. For the fiscal year ended December 31, 2014, GSAL earned $2,311 in fees as securities lending agent.
The following table provides information about the Fund’s investment in the Money Market Fund for the fiscal year ended December 31, 2014:
| | | | | | | | | | | | | | | | | | |
Number of Shares Held Beginning of Year | | | Shares Bought | | | Shares Sold | | | Number of Shares Held
End of Year | | | Value at End of Year | |
| | 14,049,375 | | | | 70,033,525 | | | | (72,127,050 | ) | | | 11,955,850 | | | $ | 11,955,850 | |
8. TAX INFORMATION
The tax character of distributions paid during the fiscal years ended December 31, 2013 and December 31, 2014 was as follows:
| | | | | | | | |
| | | 2013 | | | 2014 | |
| Distributions paid from: | | | | | | | | |
Ordinary income | | $ | 2,594,805 | | | $ | 1,035,132 | |
Net long-term capital gains | | | 633,884 | | | | 1,194,963 | |
| Total taxable distributions | | $ | 3,228,689 | | | $ | 2,230,095 | |
20
GOLDMAN SACHS VARIABLE INSURANCE TRUST GLOBAL MARKETS NAVIGATOR FUND
8. TAX INFORMATION (continued)
As of December 31, 2014, the components of accumulated earnings (losses) on a tax-basis were as follows:
| | | | |
| Undistributed ordinary income — net | | $ | 6,728,201 | |
| Undistributed long-term capital gains | | | 1,273,993 | |
Total undistributed earnings | | $ | 8,002,194 | |
| Unrealized gains — net | | | 3,481,864 | |
| Total accumulated gains — net | | $ | 11,484,058 | |
As of December 31, 2014, the Fund’s aggregate security unrealized gains and losses based on cost for U.S. federal income tax purposes were as follows:
| | | | |
| Tax cost | | $ | 241,060,571 | |
| Gross unrealized gain | | | 7,039,706 | |
| Gross unrealized loss | | | (1,010,975 | ) |
| Net unrealized security gain | | $ | 6,028,731 | |
| Net unrealized loss on other investments | | | (2,546,867 | ) |
| Net unrealized gain | | $ | 3,481,864 | |
The difference between GAAP-basis and tax-basis unrealized gains (losses) is attributable primarily to wash sales and net mark to market gains (losses) on regulated futures contracts.
In order to present certain components of the Fund’s capital accounts on a tax-basis, the Fund has reclassified $1,360 of paid-in capital and $242,690 of accumulated net realized gain to undistributed net investment income. These reclassifications have no impact on the net asset value of the Fund and result primarily from certain non-deductible expenses and differences in the tax treatment of foreign currency transactions.
GSAM has reviewed the Fund’s tax positions for all open tax years (the current and prior three years, as applicable) and has concluded that no provision for income tax is required in the Fund’s financial statements. Such open tax years remain subject to examination and adjustment by tax authorities.
9. OTHER RISKS
The Fund’s risks include, but are not limited to, the following:
Industry Concentration Risk — The Fund will not invest more than 25% of the value of its total assets in the securities of one or more issuers conducting their principal business activities in the same industry, except that, to the extent that an industry represents 20% or more of the Fund’s index at the time of investment, the Fund may invest up to 35% of its assets in that industry. Concentrating Fund investments in issuers conducting business in the same industry will subject the Fund to a greater risk of loss as a result of adverse economic, business or other developments affecting that industry than if its investments were not so concentrated.
21
GOLDMAN SACHS VARIABLE INSURANCE TRUST GLOBAL MARKETS NAVIGATOR FUND
Notes to Financial Statements (continued)
December 31, 2014
9. OTHER RISKS (continued)
Investments in Other Investment Companies — As a shareholder of another investment company, including an exchange traded fund (“ETF”), a Fund will directly bear its proportionate share of any net management fees and other expenses paid by such other investment companies, in addition to the fees and expenses regularly borne by the Fund. ETFs are subject to risks that do not apply to conventional mutual funds, including but not limited to the following: (i) the market price of the ETF’s shares may trade at a premium or a discount to their NAV; and (ii) and active trading market for an ETF’s shares may not develop or be maintained.
Large Shareholder Transaction Risk — The Fund may experience adverse effects when certain large shareholders, such as other funds, participating insurance companies, accounts and Goldman Sachs affiliates, purchase or redeem large amounts of shares of the Fund. Such large shareholder redemptions may cause the Fund to sell portfolio securities at times when it would not otherwise do so, which may negatively impact the Fund’s NAV and liquidity. Similarly, large Fund share purchases may adversely affect the Fund’s performance to the extent that the Fund is delayed in investing new cash and is required to maintain a larger cash position than it ordinarily would. These transactions may also increase transaction costs. In addition, a large redemption could result in the Fund’s current expenses being allocated over a smaller asset base, leading to an increase in the Fund’s expense ratio.
Liquidity Risk — The Fund may make investments that are illiquid or that may become less liquid in response to market developments or adverse investor perceptions. Illiquid investments may be more difficult to value. Liquidity risk may also refer to the risk that a Fund will not be able to pay redemption proceeds within the allowable time period because of unusual market conditions, an unusually high volume of redemption requests, or other reasons. To meet redemption requests, a Fund may be forced to sell investments at an unfavorable time and/or under unfavorable conditions.
Market and Credit Risks — In the normal course of business, the Fund trades financial instruments and enters into financial transactions where risk of potential loss exists due to changes in the market (market risk). Additionally, the Fund may also be exposed to credit risk in the event that an issuer or guarantor fails to perform or that an institution or entity with which the Fund has unsettled or open transactions defaults.
Investing in foreign markets may involve special risks and considerations not typically associated with investing in the U.S. Foreign securities may be subject to risk of loss because of more or less foreign government regulation, less public information and less economic, political and social stability in the countries in which the Fund invests. Loss may also result from the imposition of exchange controls, confiscations and other government restrictions by the United States or other governments, or from problems in registration, settlement or custody. Foreign risk also involves the risk of negative foreign currency rate fluctuations, which may cause the value of securities denominated in such foreign currency (or other instruments through which the Fund has exposure to foreign currencies) to decline in value. Currency exchange rates may fluctuate significantly over short periods of time. To the extent that the Fund also invests in securities of issuers located in emerging markets, these risks may be more pronounced.
Non-Diversification Risk — The Fund is non-diversified, meaning that it is permitted to invest a larger percentage of its assets in fewer issuers than diversified mutual funds. Thus, the Fund may be more susceptible to adverse developments affecting any single issuer held in its portfolio, and may be more susceptible to greater losses because of these developments.
10. INDEMNIFICATIONS
Under the Trust’s organizational documents, its Trustees, officers, employees and agents are indemnified, to the extent permitted by the Act and state law, against certain liabilities that may arise out of performance of their duties to the Fund. Additionally, in the course of business, the Fund enters into contracts that contain a variety of indemnification clauses. The Fund’s maximum exposure under these arrangements is unknown, as this would involve future claims that may be made against the Fund that have not yet occurred. However, GSAM believes the risk of loss under these arrangements to be remote.
22
GOLDMAN SACHS VARIABLE INSURANCE TRUST GLOBAL MARKETS NAVIGATOR FUND
11. SUBSEQUENT EVENTS
Subsequent events after the Statement of Assets and Liabilities date have been evaluated through the date the financial statements were issued. GSAM has concluded that there is no impact requiring adjustment or disclosure in the financial statements.
12. SUMMARY OF SHARE TRANSACTIONS
Share activity is as follows:
| | | | | | | | | | | | | | | | |
| | | For the Fiscal Year Ended
December 31, 2014 | | | For the Fiscal Year Ended
December 31, 2013 | |
| | | Shares | | | Dollars | | | Shares | | | Dollars | |
| Institutional Shares(a) | | | | | | | | | | | | | | | | |
| Shares sold | | | 60,147 | | | $ | 707,704 | | | | 2,192 | | | $ | 25,006 | |
| Reinvestment of distributions | | | 629 | | | | 7,255 | | | | 59 | | | | 668 | |
| Shares redeemed | | | (499 | ) | | | (5,908 | ) | | | — | | | | — | |
| | | | 60,277 | | | | 709,051 | | | | 2,251 | | | | 25,674 | |
| Service Shares | | | | | | | | | | | | | | | | |
| Shares sold | | | 12,257,059 | | | | 143,189,125 | | | | 9,863,268 | | | | 110,468,132 | |
| Reinvestment of distributions | | | 192,620 | | | | 2,222,840 | | | | 287,191 | | | | 3,228,021 | |
| Shares redeemed | | | (1,657,505 | ) | | | (19,197,743 | ) | | | (793,971 | ) | | | (8,894,669 | ) |
| | | | 10,792,174 | | | | 126,214,222 | | | | 9,356,488 | | | | 104,801,484 | |
| NET INCREASE | | | 10,852,451 | | | $ | 126,923,273 | | | | 9,358,739 | | | $ | 104,827,158 | |
| (a) | Institutional Shares commenced operations on October 16, 2013. |
23
Report of Independent Registered Public Accounting Firm
To the Board of Trustees and Shareholders of
Goldman Sachs Variable Insurance Trust — Goldman Sachs Global Markets Navigator Fund:
In our opinion, the accompanying statement of assets and liabilities, including the schedule of investments, and the related statements of operations and of changes in net assets and the financial highlights present fairly, in all material respects, the financial position of Goldman Sachs Global Markets Navigator Fund (the “Fund”), a fund of Goldman Sachs Variable Insurance Trust, at December 31, 2014, the results of its operations, the changes in its net assets and the financial highlights for the periods indicated, in conformity with accounting principles generally accepted in the United States of America. These financial statements and financial highlights (hereafter referred to as “financial statements”) are the responsibility of the Fund’s management. Our responsibility is to express an opinion on these financial statements based on our audits. We conducted our audits of these financial statements in accordance with the standards of the Public Company Accounting Oversight Board (United States). Those standards require that we plan and perform the audit to obtain reasonable assurance about whether the financial statements are free of material misstatement. An audit includes examining, on a test basis, evidence supporting the amounts and disclosures in the financial statements, assessing the accounting principles used and significant estimates made by management, and evaluating the overall financial statement presentation. We believe that our audits, which included confirmation of securities at December 31, 2014 by correspondence with the custodian, transfer agent, brokers and the application of alternative auditing procedures where securities purchased confirmations had not been received, provide a reasonable basis for our opinion.
PricewaterhouseCoopers LLP
Boston, Massachusetts
February 19, 2015
24
GOLDMAN SACHS VARIABLE INSURANCE TRUST GLOBAL MARKETS NAVIGATOR FUND
|
| Fund Expenses — Six Month Period Ended December 31, 2014 (Unaudited) |
As a shareholder of Institutional or Service Shares of the Fund, you incur ongoing costs, including management fees, distribution and service (12b-1) fees (with respect to Service Shares) and other Fund expenses. This example is intended to help you understand your ongoing costs (in dollars) of investing in the Institutional Shares and Service Shares of the Fund and to compare these costs with the ongoing costs of investing in other mutual funds.
The example is based on an investment of $1,000 invested at the beginning of the period and held for the entire period from July 1, 2014 through December 31, 2014.
Actual Expenses — The first line under each share class in the table below provides information about actual account values and actual expenses. You may use the information in this line, together with the amount you invested, to estimate the expenses that you paid over the period. Simply divide your account value by $1,000 (for example, an $8,600 account value divided by $1,000=8.6), then multiply the result by the number in the first line under the heading entitled “Expenses Paid” to estimate the expenses you paid on your account during this period.
Hypothetical Example for Comparison Purposes — The second line under each share class in the table below provides information about hypothetical account values and hypothetical expenses based on the Fund's actual net expense ratio and an assumed rate of return of 5% per year before expenses, which is not the Fund's actual return. The hypothetical account values and expenses may not be used to estimate the actual ending account balance or expenses you paid for the period. You may use this information to compare the ongoing costs of investing in the Fund and other funds. To do so, compare this 5% hypothetical example with the 5% hypothetical examples that appear in the shareholder reports of the other funds.
Please note that the expenses shown in the table are meant to highlight your ongoing costs only. As a shareholder of the Fund, you do not incur any transaction costs, such as sales charges, redemption fees, or exchange fees, but shareholders of other funds may incur such costs. The second line of the table is useful in comparing ongoing costs only, and will not help you determine the relative total costs of owning different funds whose shareholders may incur transaction costs.
| | | | | | | | | | | | |
| Share Class | | Beginning
Account Value
7/01/14 | | | Ending Account Value
12/31/14 | | | Expenses Paid for the 6 Months Ended 12/31/14* | |
| Institutional | | | | | | | | | | | | |
| Actual | | $ | 1,000 | | | $ | 1,009.70 | | | $ | 3.95 | |
| Hypothetical 5% return | | | 1,000 | | | | 1,021.27 | + | | | 3.97 | |
| Service | | | | | | | | | | | | |
| Actual | | | 1,000 | | | | 1,008.70 | | | | 5.21 | |
| Hypothetical 5% return | | | 1,000 | | | | 1,020.01 | + | | | 5.24 | |
| | * | Expenses are calculated using the Fund’s annualized net expense ratio for each class, which represents the ongoing expenses as a percentage of net assets for the six months ended December 31, 2014. Expenses are calculated by multiplying the annualized net expense ratio by the average account value for the period; then multiplying the result by the number of days in the most recent fiscal half year; and then dividing that result by the number of days in the fiscal year. The annualized net expense ratios for the period were 0.78% and 1.03% for the Institutional and Service Shares, respectively. | |
| | + | Hypothetical expenses are based on the Fund’s actual annualized net expense ratios and an assumed rate of return of 5% per year before expenses. | |
25
GOLDMAN SACHS VARIABLE INSURANCE TRUST GLOBAL MARKETS NAVIGATOR FUND
Trustees and Officers (Unaudited)
Independent Trustees
| | | | | | | | | | | | |
| | | | | |
Name,
Address and Age1 | | Position(s) Held
with the Trust | | Term of Office and
Length of
Time Served2 | | Principal Occupation(s) During Past 5 Years | | Number of
Portfolios in
Fund Complex
Overseen by
Trustee3 | | | Other Directorships Held by Trustee4 |
Ashok N. Bakhru Age: 72 | | Chairman of the Board of Trustees | | Since 1996 (Trustee since 1991) | | Mr. Bakhru is retired. He was formerly Director, Apollo Investment Corporation (a business development company) (2008-2013); President, ABN Associates (a management and financial consulting firm) (1994-1996 and 1998-2012); Trustee, Scholarship America (1998-2005); Trustee, Institute for Higher Education Policy (2003-2008); Director, Private Equity Investors — III and IV (1998-2007), and Equity-Linked Investors II (April 2002-2007). Chairman of the Board of Trustees — Goldman Sachs Fund Complex. | | | 128 | | | None |
John P. Coblentz, Jr. Age: 73 | | Trustee | | Since 2003 | | Mr. Coblentz is retired. Formerly, he was Partner, Deloitte & Touche LLP (1975-2003); Director, Emerging Markets Group, Ltd. (2004-2006); and Director, Elderhostel, Inc. (2006-2012). Trustee — Goldman Sachs Fund Complex. | | | 128 | | | None |
Diana M. Daniels Age: 65 | | Trustee | | Since 2007 | | Ms. Daniels is retired. Formerly, she was Vice President, General Counsel and Secretary, The Washington Post Company (1991-2006). Ms. Daniels serves as a Presidential Councillor of Cornell University (2013-Present); Member, Advisory Board, Psychology Without Borders (international humanitarian aid organization) (2007-Present), and former Member of the Legal Advisory Board, New York Stock Exchange (2003-2006) and of the Corporate Advisory Board, Standish Mellon Management Advisors (2006-2007). Trustee — Goldman Sachs Fund Complex. | | | 108 | | | None |
Joseph P. LoRusso Age: 57 | | Trustee | | Since 2010 | | Mr. LoRusso is retired. Formerly, he was President, Fidelity Investments Institutional Services Co. (“FIIS”) (2002-2008); Director, FIIS (2002-2008); Director, Fidelity Investments Institutional Operations Company (2003-2007); Executive Officer, Fidelity Distributors Corporation (2007-2008). Trustee — Goldman Sachs Fund Complex. | | | 108 | | | None |
Herbert J. Markley Age: 64 | | Trustee | | Since 2013 | | Mr. Markley is retired. Formerly, he was Executive Vice President, Deere & Company (an agricultural and construction equipment manufacturer) (2007-2009), and President, Agricultural Division, Deere & Company (2001-2007). Trustee — Goldman Sachs Fund Complex. | | | 108 | | | None |
Jessica Palmer Age: 65 | | Trustee | | Since 2007 | | Ms. Palmer is retired. She is Director, Emerson Center for the Arts and Culture (2011-Present); and was formerly a Consultant, Citigroup Human Resources Department (2007-2008); Managing Director, Citigroup Corporate and Investment Banking (previously, Salomon Smith Barney/Salomon Brothers) (1984-2006). Ms. Palmer was a Member of the Board of Trustees of Indian Mountain School (private elementary and secondary school) (2004-2009). Trustee — Goldman Sachs Fund Complex. | | | 108 | | | None |
Richard P. Strubel Age: 75 | | Trustee | | Since 1987 | | Mr. Strubel is retired. Formerly, he was Director, Cardean Learning Group (provider of educational services via the internet) (2003-2008); and Director, Gildan Activewear Inc. (a clothing marketing and manufacturing company) (2000-2014). He serves as Trustee, Emeritus, The University of Chicago (1987-Present). Trustee — Goldman Sachs Fund Complex. | | | 128 | | | The Northern Trust Mutual Fund Complex (56 Portfolios) (Chairman of the Board of Trustees) |
| | | | | | | | | | | | |
26
GOLDMAN SACHS VARIABLE INSURANCE TRUST GLOBAL MARKETS NAVIGATOR FUND
Trustees and Officers (Unaudited) (continued)
Independent Trustees (continued)
| | | | | | | | | | | | |
| | | | | |
Name,
Address and Age1 | | Position(s) Held
with the Trust | | Term of Office and
Length of
Time Served2 | | Principal Occupation(s) During Past 5 Years | | Number of
Portfolios in
Fund Complex
Overseen by
Trustee3 | | | Other Directorships Held by Trustee4 |
Roy W. Templin Age: 54 | | Trustee | | Since 2013 | | Mr. Templin is retired. He is Chairman of the Board of Directors, Con-Way Incorporated (2012-Present); and was formerly Executive Vice President and Chief Financial Officer, Whirlpool Corporation (an appliance manufacturer and marketer) (2004-2012). Trustee — Goldman Sachs Fund Complex. | | | 108 | | | Con-Way Incorporated (a transportation, supply-chain management and logistics services company) |
| | | | | | | | | | | | |
Interested Trustees*
| | | | | | | | | | | | |
| | | | | |
Name,
Address and Age1 | | Position(s) Held
with the Trust | | Term of Office and
Length of
Time Served2 | | Principal Occupation(s) During Past 5 Years | | Number of
Portfolios in
Fund Complex
Overseen by
Trustee3 | | | Other Directorships Held by Trustee4 |
James A. McNamara Age: 52 | | President and Trustee | | Since 2007 | | Managing Director, Goldman Sachs (December 1998-Present); Director of Institutional Fund Sales, GSAM (April 1998-December 2000); and Senior Vice President and Manager, Dreyfus Institutional Service Corporation (January 1993- April 1998). President — Goldman Sachs Fund Complex (November 2007-Present); Senior Vice President — Goldman Sachs Fund Complex (May 2007-November 2007); and Vice President — Goldman Sachs Fund Complex (2001-2007). Trustee — Goldman Sachs Fund Complex (November 2007-Present and December 2002-May 2004). | | | 127 | | | None |
Alan A. Shuch Age: 65 | | Trustee | | Since 1990 | | Advisory Director — GSAM (May 1999-Present); Consultant to GSAM (December 1994-May 1999); and Limited Partner, Goldman Sachs (December 1994-May 1999). Trustee — Goldman Sachs Fund Complex. | | | 108 | | | None |
| | | | | | | | | | | | |
| * | These persons are considered to be “Interested Trustees” because they hold positions with Goldman Sachs and own securities issued by The Goldman Sachs Group, Inc. Each Interested Trustee holds comparable positions with certain other companies of which Goldman Sachs, GSAM or an affiliate thereof is the investment adviser, administrator and/or distributor. |
| 1 | Each Trustee may be contacted by writing to the Trustee, c/o Goldman Sachs, 200 West Street, New York, New York, 10282, Attn: Caroline Kraus. Information is provided as of December 31, 2014. |
| 2 | Each Trustee holds office for an indefinite term until the earliest of: (a) the election of his or her successor; (b) the date the Trustee resigns or is removed by the Board of Trustees or shareholders, in accordance with the Trust’s Declaration of Trust; (c) December 31st of the year in which the Trustee turns 74 years of age, subject to waiver by a majority of the Trustees (in accordance with the current resolutions of the Board of Trustees, which may be changed by the Trustees without shareholder vote); or (d) the termination of the Trust. By resolution of the Board of Trustees determining that an extension of service would be beneficial to the Trust, the retirement age has been extended with respect to Richard P. Strubel. |
| 3 | The Goldman Sachs Fund Complex consists of the Trust and Goldman Sachs Trust (“GST”). As of December 31, 2014, the Trust consisted of 14 portfolios and GST consisted of 94 portfolios (88 of which offered shares to the public). The Goldman Sachs Fund Complex also includes, with respect to Messrs. Bakhru, Coblentz and Strubel, Goldman Sachs Trust II (“GSTII”), Goldman Sachs BDC, Inc. (“GSBDC”), Goldman Sachs MLP Income Opportunities Fund (“GSMLP”), Goldman Sachs MLP and Energy Renaissance Fund (“GSMER”) and Goldman Sachs ETF Trust (“GSETF”), and with respect to Mr. McNamara, GSTII, GSMLP, GSMER and GSETF. GSTII consisted of 6 portfolios (one of which offered shares to the public). GSBDC, GSMLP and GSMER each consisted of one portfolio. GSETF consisted of 11 portfolios (none of which offered shares to the public). As of December 31, 2014, GSBDC had not offered shares to the public. |
| 4 | This column includes only directorships of companies required to report to the Securities and Exchange Commission under the Securities Exchange Act of 1934 (i.e., “public companies”) or other investment companies registered under the Act. |
Additional information about the Trustees is available in the Fund’s Statement of Additional Information, which can be obtained from Goldman Sachs free of charge by calling this toll-free number (in the United States of America): 1-800-292-4726.
27
GOLDMAN SACHS VARIABLE INSURANCE TRUST GLOBAL MARKETS NAVIGATOR FUND
Trustees and Officers (Unaudited) (continued)
Officers of the Trust*
| | | | | | |
| | | |
Name, Address and Age1 | | Position(s) Held With the Trust | | Term of
Office and
Length of
Time Served2 | | Principal Occupation(s) During Past 5 Years |
James A. McNamara
200 West Street New York, NY 10282 Age: 52 | | President and Trustee | | Since 2007 | | Managing Director, Goldman Sachs (December 1998-Present); Director of Institutional Fund Sales, GSAM (April 1998-December 2000); and Senior Vice President and Manager, Dreyfus Institutional Service Corporation (January 1993-April 1998). President — Goldman Sachs Fund Complex (November 2007-Present); Senior Vice President — Goldman Sachs Fund Complex (May 2007-November 2007); and Vice President — Goldman Sachs Fund Complex (2001-2007). Trustee — Goldman Sachs Fund Complex (November 2007-Present and December 2002-May 2004). |
Caroline L. Kraus
200 West Street New York, NY 10282 Age: 37 | | Secretary | | Since 2012 | | Vice President, Goldman Sachs (August 2006-Present); Associate General Counsel, Goldman Sachs (2012-Present); Assistant General Counsel, Goldman Sachs (August 2006-December 2011) and Associate, Weil, Gotshal & Manges, LLP (2002-2006). Secretary — Goldman Sachs Fund Complex (August 2012-Present) and Assistant Secretary — Goldman Sachs Fund Complex (June 2012-August 2012). |
Scott M. McHugh
200 West Street New York, NY 10282 Age: 43 | | Principal Financial
Officer, Senior Vice
President and
Treasurer | | Since 2009
(Principal
Financial
Officer since
2013) | | Vice President, Goldman Sachs (February 2007-Present); Assistant Treasurer of certain mutual funds administered by DWS Scudder (2005-2007); and Director (2005-2007), Vice President (2000-2005) and Assistant Vice President (1998-2000), Deutsche Asset Management or its predecessor (1998-2007). Principal Financial Officer — Goldman Sachs Fund Complex (November 2013-Present); Treasurer — Goldman Sachs Fund Complex (October 2009-Present); Senior Vice President — Goldman Sachs Fund Complex (November 2009-Present); and Assistant Treasurer — Goldman Sachs Fund Complex (May 2007-October 2009). |
| | | | | | |
| * | Represents a partial list of officers of the Trust. Additional information about all the officers is available in the Fund’s Statement of Additional Information, which can be obtained from Goldman Sachs free of charge by calling this toll-free number (in the United States): 1-800-292-4726. |
| 1 | Information is provided as of December 31, 2014. |
| 2 | Officers hold office at the pleasure of the Board of Trustees or until their successors are duly elected and qualified. Each officer holds comparable positions with certain other companies of which Goldman Sachs, GSAM or an affiliate thereof is the investment adviser, administrator and/or distributor. |
Goldman Sachs Variable Insurance Trust — Tax Information (Unaudited)
For the year ended December 31, 2014, 13.89% of the dividends paid from net investment company taxable income by the Global Markets Navigator Fund qualify for the dividends received deduction available to corporations.
Pursuant to Section 852 of the Internal Revenue Code, the Global Markets Navigator Fund designates $1,194,963, or, if different, the maximum amount allowable, as capital gain dividends paid during the year ended December 31, 2014.
28
| | |
| TRUSTEES | | OFFICERS |
| Ashok N. Bakhru, Chairman | | James A. McNamara, President |
| John P. Coblentz, Jr. | | Scott M. McHugh, Principal Financial Officer |
| Diana M. Daniels | | and Treasurer |
| Joseph P. LoRusso | | Caroline L. Kraus, Secretary |
| Herbert J. Markley | | |
| James A. McNamara | | |
| Jessica Palmer | | |
| Alan A. Shuch | | |
| Richard P. Strubel | | |
| Roy W. Templin | | |
GOLDMAN, SACHS & CO.
Distributor and Transfer Agent
GOLDMAN SACHS ASSET MANAGEMENT, L.P.
Investment Adviser
200 West Street, New York
New York 10282
Visit our web site at www.GSAMFUNDS.com to obtain the most recent month-end returns.
The reports concerning the Fund included in this shareholder report may contain certain forward-looking statements about the factors that may affect the performance of the Fund in the future. These statements are based on Fund management’s predictions and expectations concerning certain future events and their expected impact on the Fund, such as performance of the economy as a whole and of specific industry sectors, changes in the levels of interest rates, the impact of developing world events, and other factors that may influence the future performance of the Fund. Management believes these forward-looking statements to be reasonable, although they are inherently uncertain and difficult to predict. Actual events may cause adjustments in portfolio management strategies from those currently expected to be employed.
A description of the policies and procedures that the Fund uses to determine how to vote proxies relating to portfolio securities and information regarding how the Fund voted proxies relating to portfolio securities for the 12-month period ended June 30 is available (i) without charge, upon request by calling 1-800-621-2550; and (ii) on the Securities and Exchange Commission (“SEC”) web site at http://www.sec.gov.
The Fund files its complete schedule of portfolio holdings with the SEC for the first and third quarters of each fiscal year on Form N-Q. The Fund’s Form N-Qs are available on the SEC’s web site at http://www.sec.gov within 60 days after the Fund’s first and third fiscal quarters. The Fund’s Form N-Qs may be reviewed and copied at the SEC’s Public Reference Room in Washington, D.C. and information on the operation of the Public Reference Room may also be obtained by calling 1-800-SEC-0330. Form N-Qs may be obtained upon request and without charge by calling 1-800-621-2550.
The website links provided are for your convenience only and are not an endorsement or recommendation by GSAM of any of these websites or the products or services offered. GSAM is not responsible for the accuracy and validity of the content of these websites.
Fund holdings and allocations shown are as of December 31, 2014 and may not be representative of future investments. Fund holdings should not be relied on in making investment decisions and should not be construed as research or investment advice regarding particular securities. Current and future holdings are subject to risk.
The portfolio risk management process includes an effort to monitor and manage risk, but does not imply low risk.
Shares of the Goldman Sachs VIT Funds are offered to separate accounts of participating life insurance companies for the purpose of funding variable annuity contracts and variable life insurance policies. Shares of the Fund are not offered directly to the general public. The variable annuity contracts and variable life insurance policies are described in the separate prospectuses issued by participating insurance companies. You should refer to those prospectuses for information about surrender charges, mortality and expense risk fees and other charges that may be assessed by participating insurance companies under the variable annuity contracts or variable life insurance policies. Such fees or charges, if any, may affect the return you may realize with respect to your investments. Ask your representative for more complete information. Please consider a fund’s objectives, risks and charges and expenses, and read the prospectus carefully before investing. The prospectus contains this and other information about the Fund.
This material is not authorized for distribution to prospective investors unless preceded or accompanied by a current Prospectus or summary prospectus, if applicable. Investors should consider a Fund’s objective, risks, and charges and expenses, and read the summary prospectus, if available, and/or the Prospectus carefully before investing or sending money. The summary prospectus, if available, and the Prospectus contain this and other information about a Fund and may be obtained from your Authorized Institution or from Goldman, Sachs & Co. by calling 1-800-621-2550.
This report is prepared for the general information of contract owners and is not an offer of shares of the Goldman Sachs Variable Insurance Trust: Goldman Sachs Global Markets Navigator Fund.
© 2015 Goldman Sachs. All rights reserved.
VITNAVAR-15/153850.MF.MED.TMPL/2/2015
Goldman
Sachs Variable Insurance Trust
Goldman Sachs
Large Cap Value Fund
Annual Report
December 31, 2014
GOLDMAN SACHS VARIABLE INSURANCE TRUST LARGE CAP VALUE FUND
Principal Investment Strategies and Risks
This is not a complete list of risks that may affect the Fund. For additional information concerning the risks applicable to the Fund, please see the Fund’s Prospectuses.
Shares of the Goldman Sachs Variable Insurance Trust — Goldman Sachs Large Cap Value Fund are offered to separate accounts of participating life insurance companies for the purpose of funding variable annuity contracts and variable life insurance policies. Shares of the Fund are not offered directly to the general public. The variable annuity contracts and variable life insurance policies are described in the separate prospectuses issued by participating insurance companies. You should refer to those prospectuses for information about surrender charges, mortality and expense risk fees and other charges that may be assessed by participating insurance companies under the variable annuity contracts or variable life insurance policies. Such fees or charges, if any, may affect the return you realize with respect to your investments. Ask your representative for more complete information. Please consider the Fund’s objective, risks and charges and expenses, and read the Prospectus carefully before investing. The Prospectus contains this and other information about the Fund.
The Goldman Sachs Large Cap Value Fund invests primarily in large-capitalization U.S. equity investments. The Fund’s equity investments are subject to market risk, which means that the value of the securities in which it invests may go up or down in response to the prospects of individual companies, particular sectors and/or general economic conditions. Different investment styles (e.g., “value”) tend to shift in and out of favor, and at times the Fund may underperform other funds that invest in similar asset classes.
1
GOLDMAN SACHS VARIABLE INSURANCE TRUST LARGE CAP VALUE FUND
INVESTMENT OBJECTIVE
The Fund seeks long-term capital appreciation.
Portfolio Management Discussion and Analysis
Below, the Goldman Sachs Value Investment Team discusses the Goldman Sachs Variable Insurance Trust — Goldman Sachs Large Cap Value Fund’s (the “Fund”) performance and positioning for the 12-month period ended December 31, 2014 (the “Reporting Period”).
How did the Fund perform during the Reporting Period?
During the Reporting Period, the Fund’s Institutional and Service Shares generated average annual total returns of 12.94% and 12.61%, respectively. These returns compare to the 13.45% average annual total return of the Fund’s benchmark, the Russell 1000® Value Index (with dividends reinvested) (the “Russell Index”) during the same time period.
What economic and market factors most influenced the equity markets as a whole during the Reporting Period?
Representing the U.S. equity market, the S&P 500® Index gave back 0.25% in December 2014, but finished the fourth calendar quarter up 4.93% and gained 13.69% during the Reporting Period as a whole, as it posted its third consecutive year of broad double-digit gains.
Diverging global economies, strong merger and acquisition activity, weakening oil prices and declining U.S. interest rates were major themes affecting U.S. equities throughout 2014. The U.S. economic recovery accelerated through the Reporting Period, particularly compared to other major developed markets, which helped fuel U.S. corporate earnings growth and strong U.S. equity returns. Furthermore, the decline in unemployment to 5.8% and lower energy prices gave new hope to the potential for a broader consumer recovery. U.S. equity market volatility picked up during the second half of 2014 from exceptionally low levels mid-year, but the S&P 500® Index had no more than three consecutive down days during 2014, a feat not seen since 1928.
For the Reporting Period overall, nine of the ten sectors within the S&P 500® Index were up. Merger and acquisition activity rose to its highest annual level since 2007 largely due to transactions within the information technology and health care sectors, which handily outperformed the broader market. The top-weighted information technology sector was also the largest positive contributor (weight times performance) to S&P 500® Index returns. Given the unexpected decline in U.S. interest rates, real estate investment trusts (“REITs”) and the utilities sector also outperformed the broader market during the Reporting Period. Conversely, the energy sector underperformed most during 2014, as concerns over rising U.S. supply and weakening global demand triggered a collapse in U.S. and global crude oil prices. Telecommunication services also performed poorly during the year as aggressive competition, including price wars aimed at luring customers, and market saturation put growth pressures on the sector, especially on the wireless side.
All segments of the U.S. equity market advanced during the Reporting Period, with large-cap and mid-cap stocks, as measured by the Russell 1000® Index and the Russell Midcap® Index, respectively, gaining most and almost exactly in line with each other. Following at some distance were small-cap stocks, as measured by the Russell 2000® Index. Large-cap stocks were most successful relative to small-caps in the information technology sector. From a style perspective, value-oriented stocks outpaced growth-oriented stocks in the large-cap and mid-cap segments of the U.S. equity market, but growth-oriented stocks outperformed value-oriented stocks in the small-cap segment of the U.S. equity market. (All as measured by the Russell Investments indices.)
What key factors were responsible for the Fund’s performance during the Reporting Period?
Overall, the Fund produced solid absolute double-digit gains, but modestly underperformed the Russell Index on a relative basis. Stock selection had the greatest effect on the Fund’s performance relative to the Russell Index during the Reporting Period.
Which equity market sectors most significantly affected Fund performance?
Detracting from the Fund’s relative results most was stock selection in the financials, consumer discretionary, industrials and information technology sectors. Having an underweighted allocation to utilities, which outpaced the Russell Index during the Reporting Period, also hurt. Only partially offsetting these detractors was stock selection in the health care and consumer staples sectors, which contributed positively. Having an underweighted allocation to telecommunication services, which lagged the Russell Index during the Reporting Period, also added value.
2
GOLDMAN SACHS VARIABLE INSURANCE TRUST LARGE CAP VALUE FUND
Which stocks detracted significantly from the Fund’s performance during the Reporting Period?
Detracting most from the Fund’s results relative to its benchmark index were positions in oil and natural gas exploration and production companies Southwestern Energy and Apache and diversified industrials and financials conglomerate General Electric.
Southwestern Energy saw its shares decline primarily as a reflection of persistent weakness in natural gas prices. In the last months of 2014, Southwestern Energy closed its previously announced acquisition of Marcellus and Utica shale assets from Chesapeake Energy and announced a $1 billion share buyback program. At the end of the Reporting Period, we continued to believe that Southwestern Energy has an underappreciated resource base, specifically in the Marcellus and Fayetteville shales. We also believe its newly acquired assets further enhance the company’s position and growth opportunities. Additionally, we remained positive on the company’s operational leverage to higher natural gas prices and encouraged by its management team’s commitment to disciplined growth, cost reductions and shareholder returns.
Apache was also a top detractor from the Fund’s performance during the Reporting Period, as its shares were adversely impacted by weakness in oil prices. In addition, following strong returns, some investors took profits in the stock. At the end of July 2014, Apache reported positive second quarter results, and its management separately announced its intent to exit the company’s Wheatstone and Kitimat liquid natural gas projects, which have high capital expenditure requirements, as well as plans to divest certain international assets, which have produced lower returns. During the fourth quarter of 2014, Apache announced the sale of $1.4 billion of non-core assets. The company also confirmed its 2015 production outlook with lower expected capital expenditures, demonstrating, in our view, capital discipline and the ability to grow with a flexible budget. Indeed, we view these recent developments favorably, as they could accelerate Apache’s repositioning to a North American onshore exploration and production company with the potential for higher returns on investment and a more predictable growth profile. Overall, at the end of the Reporting Period, we viewed Apache’s shares as attractively valued given what we consider to be the company’s balance sheet strength, improving free cash flow generation and potential for increased shareholder distributions.
Following an exceptionally strong year for the stock in 2013, shares of General Electric pulled back in early 2014, primarily on concerns about slower global Gross Domestic Product (“GDP”) growth and its impact on the industrials sector. Its shares received a lift in April 2014 after the company reported earnings per share above consensus estimates. In June 2014, General Electric reached a deal to acquire Alstom, a French electricity and rail transport firm. General Electric also announced the sale of its consumer finance business, which we believe should allow it to focus more on its higher margin businesses. We viewed both of these transactions positively. At the end of the Reporting Period, we continued to believe General Electric is likely to benefit from its restructuring efforts, which could expand its margins. The company also increased its share repurchase authorization to $35 billion through 2015. Both measures, in our view, could lead to earnings per share gains during the coming years. We believe many of General Electric’s businesses are well positioned as market leaders with exposure to growth areas, such as commercial aerospace and energy efficiency. We further believe the company’s financial flexibility should provide it with the ability to make targeted acquisitions to strengthen its industrial division and raise its dividend annually.
What were some of the Fund’s best-performing individual stocks?
Relative to the Russell Index, the Fund benefited most from positions in Kroger, Keurig Green Mountain and Covidien.
Supermarket and convenience store operator Kroger, a new purchase for the Fund during the Reporting Period, saw its shares rise during the first quarter of 2014 as the firm completed its merger with Harris Teeter Supermarkets and reported positive fourth quarter 2013 results driven primarily by strong execution. Same store sales were better than expected in a rather challenging consumer environment. The grocery store chain subsequently reported positive first quarter 2014 results and raised its full year 2014 guidance beyond consensus expectations, which helped to drive its shares higher. Strong quarterly earnings driven by solid execution helped the company maintain its positive momentum throughout the year. In our view, Kroger has consistently been able to gain market share driven by a focus on low prices, high convenience and healthy choices. At the end of the Reporting Period, its margins appeared to have stabilized and we believe they may begin to expand following many years of investment that Kroger made in an effort to improve its competitive positioning. We also believe the company’s acquisition of Harris Teeter Supermarkets could provide synergies and boost its earnings per share over the next two to three years. Further industry consolidation could be beneficial for the company due to its strong market share and stable cash flows.
Specialty coffee and coffeemaker company Keurig Green Mountain was a top contributor to the Fund’s performance during the Reporting Period. Its shares rose following the announcement that Coca-Cola purchased a 10% stake in the company and entered into a 10-year agreement to develop Coke brand products for the Keurig Cold beverage system. The company also benefited from exposure to the Starbucks, Dunkin, Folgers and Costco brands. Further, shareholders approved the company’s official name change to Keurig Green Mountain from Green Mountain Coffee Roasters, recognizing the value that Keurig has brought to the overall
3
GOLDMAN SACHS VARIABLE INSURANCE TRUST LARGE CAP VALUE FUND
franchise and creating a powerful corporate identity. Following the stock’s strong performance, we sold the Fund’s position in Keurig Green Mountain during the Reporting Period, taking profits.
Shares of Covidien rose sharply after Medtronic, a fellow medical device manufacturer, agreed to acquire the company for approximately a 29% premium through a combination of stock and cash in a deal valued at approximately $43 billion. We believe the acquisition, expected to close some time in early 2015, can potentially provide Medtronic with improved revenue growth, earnings per share accretion from approximately $850 million in cost synergies, improved free cash flow flexibility and increasing return on invested capital. Covidien’s shares continued to rise through the year with the help of strong quarterly earnings. At the end of the Reporting Period, and in advance of its purchase by Medtronic, we expected Covidien to benefit from an increase in overall health care spending along with and a ramp in medical device utilization as reimbursement and regulatory uncertainties subside. In addition, we believe the company stands to benefit from a spin out of its pharmaceutical business, which could allow its management to better focus on its core medical device business. In our view, Covidien also has an opportunity to expand its margins by continuing to streamline its business, grow revenues and potentially exercise targeted mergers and acquisitions.
How did the Fund use derivatives and similar instruments during the Reporting Period?
During the Reporting Period, we did not use derivatives as part of an active management strategy.
Did the Fund make any significant purchases or sales during the Reporting Period?
We initiated a Fund position in Medtronic, a medical device company that manufactures and sells cardiac, vascular and restorative therapy related products. As mentioned earlier, we believe its acquisition of Covidien, which was proposed during 2014, has the potential to provide Medtronic with strengthened revenue growth, earnings accretion driven by substantial cost synergies, improved free cash flow flexibility and higher returns on invested capital. In addition, we believe the potential combined entity’s increasingly diversified business could benefit from the growth of overall health care spending along with an expansion in medical device utilization as reimbursement and regulatory uncertainties subside.
We established a Fund position in networking equipment manufacturer Cisco Systems during the Reporting Period. We believe Cisco Systems has a significant competitive advantage due to its existing client base. In our view, this client base has the potential to allow more time for the company to adapt to technology changes and to have success in its product cycles, one of which is currently happening in its switching business. We also believe the company’s response to the threat of software defined networking, an alternative way to manage networks, has been effective. We are also encouraged by the company’s healthy balance sheet and believe it could lead to acquisitions of more datacenter software companies going forward.
In addition to those sales already mentioned, we sold the Fund’s position in Citigroup during the Reporting Period. Our confidence was tested by Citigroup’s results and execution in non-U.S. markets, where it has an outsized exposure relative to its peers. While we still have a favorable long-term view of the company, its shares had performed well, and we believed the market was fully appreciating the company for the time being. We therefore exited the position in favor of companies that we believed to have greater upside potential.
We exited the Fund’s position in Apple. Similar to the case with Citigroup, we maintain a favorable long-term view of the company, but its shares had performed well, which led us to believe the market was fully appreciating the company. We therefore decided to pursue what we considered to be other attractive opportunities within the information technology sector.
Were there any notable changes in the Fund’s weightings during the Reporting Period?
In constructing the Fund’s portfolio, we focus on picking stocks rather than on making industry or sector bets. We seek to outpace the benchmark index by overweighting stocks that we expect to outperform and underweighting those that we think may lag. Consequently, changes in its sector weights are generally the direct result of individual stock selection or of stock appreciation or depreciation. That said, during the Reporting Period, the Fund’s exposure to consumer discretionary and telecommunication services increased compared to the Russell Index. The Fund’s allocations compared to the benchmark index in health care, industrials, information technology and materials decreased.
How was the Fund positioned relative to its benchmark index at the end of the Reporting Period?
At the end of December 2014, the Fund had overweighted positions relative to the Russell Index in the consumer discretionary and information technology sectors. On the same date, the Fund had underweighted positions compared to the Russell Index in utilities, financials, materials, energy and industrials and was rather neutrally weighted to the Russell Index in consumer staples, health care and telecommunication services.
4
GOLDMAN SACHS VARIABLE INSURANCE TRUST LARGE CAP VALUE FUND
Were there any changes to the Fund’s portfolio management team during the Reporting Period?
Michael Ho, a Vice President and sector portfolio manager on the Goldman Sachs U.S. Value Equity Team, left the firm. Mike had sector portfolio management responsibilities in the consumer staples and materials sectors in our Large and Mid Cap Value strategies and in half of industrials in our Mid Cap Value strategy. Charles “Brook” Dane assumed research and portfolio management responsibilities for the consumer staples sector in the Large Cap Value strategies. Brook has 22 years of experience, joined the Value Team in 2010 and currently has portfolio management responsibility for the technology sector within the Large Cap Value strategies. Eric Fogarty assumed research and portfolio management responsibilities for the consumer staples sector in the Mid Cap Value strategy. Eric joined the US Value Equity Team as an analyst in 2007, was promoted to portfolio manager in 2012 and has 20 years of industry experience. Currently, Eric has portfolio management responsibility for the utilities sector across our Value strategies. As part of our ongoing commitment to identifying investment talent, we are initiating a search for an experienced Portfolio Manager with expertise in the materials sector for both the Large and Mid Cap Value strategies. In the interim, Andy Braun, Co-CIO of the Value Team, will provide oversight for this sector. Andy has had prior investing experience in the materials sector throughout his career and will be supported by dedicated research analysts. David Deuchler assumed research and portfolio management responsibilities for the entire industrials sector in the Mid Cap Value strategy. David served as a research analyst on the Value Team from 2000-2005 and spent seven years in the hedge fund industry before rejoining in June 2013. Currently, David has portfolio management responsibility for Mid, Small/Mid and Small Cap health care as well as half of industrials in Mid Cap Value. The US Value Equity strategies continue to be led by Co-CIOs Sean Gallagher and Andy Braun. The team consists of 14 portfolio managers, averaging 20 years of experience, and is supported by more than 10 research analysts.
What is the Fund’s tactical view and strategy for the months ahead?
At the end of the Reporting Period, we believed U.S. equities had further upside should the U.S. economy accelerate. We believe real earnings growth may well serve as a fundamental driver of performance going forward. We believe U.S. corporate fundamentals are strong, evidenced by both healthy balance sheets and earnings resilience, and should provide companies with a number of options to increase shareholder value. While we acknowledge the potential for headwinds remains, such as geopolitical risks, we ultimately remain constructive on the direction of U.S. equity markets. We believe the U.S. has the best macroeconomic outlook of the developed economies, and we are optimistic on the strengthening U.S. housing and employment markets as well as on the potential for a continued recovery in consumer spending. Consumption, which accounts for approximately 70% of U.S. GDP, could benefit from the combination of low energy prices and a strong U.S. dollar. Furthermore, with strong GDP growth momentum from 2014, we believe an acceleration in earnings growth could continue in the U.S., as the country is less exposed to weaker segments of the global economy given its lower reliance on exports.
Looking forward, we believe that should the U.S. economy continue to improve, companies may reinvest for future growth by increasing capital expenditures, research and development, hiring, and merger and acquisition activity rather than keeping excess cash on balance sheets. From a valuation perspective, we believe U.S. equities remained, at the end of the Reporting Period, fairly valued considering the positive macro environment and inexpensive relative to fixed income. We believe a forward-looking analysis is critical in this investing environment, and we believe stock selection will be increasingly important as companies differentiate themselves on earnings growth and valuation.
Regardless of market direction, our fundamental, bottom-up stock selection continues to drive our process, rather than headlines or sentiment. We maintain high conviction in the companies the Fund owns and believe they have the potential to outperform relative to the broader market regardless of economic growth conditions. We continue to focus on undervalued companies that we believe have comparatively greater control of their own destiny, such as innovators with differentiated products, companies with low cost structures or companies that have been investing in their own businesses and may be poised to gain market share. We maintain our discipline in identifying companies with what we believe to be strong or improving balance sheets, led by quality management teams and trading at discounted valuations. We remain focused on the long-term performance of the Fund.
5
GOLDMAN SACHS VARIABLE INSURANCE TRUST LARGE CAP VALUE FUND
Index Definitions
The Russell Midcap® Index measures the performance of the mid-cap segment of the U.S. equity universe. The Russell Midcap Index® is a subset of the Russell 1000® Index. It includes approximately 800 of the smallest securities based on a combination of their market cap and current index membership. The Russell Midcap Index represents approximately 31% of the total market capitalization of the Russell 1000 companies. The Russell Midcap® Index is constructed to provide a comprehensive and unbiased barometer for the mid-cap segment. The Index is completely reconstituted annually to ensure larger stocks do not distort the performance and characteristics of the true mid-cap opportunity set.
The Russell 1000® Index measures the performance of the large-cap segment of the U.S. equity universe. It is a subset of the Russell 3000® Index and includes approximately 1000 of the largest securities based on a combination of their market cap and current index membership. The Russell 1000 represents approximately 92% of the U.S. market. The Russell 1000® Index is constructed to provide a comprehensive and unbiased barometer for the large-cap segment and is completely reconstituted annually to ensure new and growing equities are reflected.
The Russell 2000® Index measures the performance of the small-cap segment of the U.S. equity universe. The Russell 2000® Index is a subset of the Russell 3000® Index representing approximately 10% of the total market capitalization of that index. It includes approximately 2000 of the smallest securities based on a combination of their market cap and current index membership. The Russell 2000 is constructed to provide a comprehensive and unbiased small-cap barometer and is completely reconstituted annually to ensure larger stocks do not distort the performance and characteristics of the true small-cap opportunity set.
The S&P 500® Index is the Standard & Poor’s 500 Composite Index of 500 stocks, an unmanaged index of common stock prices.
All index figures do not reflect any deduction for fees, expenses or taxes. It is not possible to invest directly in an unmanaged index.
6
FUND BASICS
Large Cap Value Fund
as of December 31, 2014
STANDARDIZED TOTAL RETURNS1
| | | | | | | | | | | | | | | | | | |
| For the period ended 12/31/14 | | One Year | | | Five Years | | | Ten Years | | | Since Inception | | | Inception Date |
| Institutional | | | 12.94 | % | | | 13.12 | % | | | 6.38 | % | | | 5.12 | % | | 1/12/98 |
| Service | | | 12.61 | | | | 12.83 | | | | N/A | | | | 4.19 | | | 7/24/07 |
| 1 | The Standardized Total Returns are average annual total returns as of the most recent calendar quarter-end. They assume reinvestment of all distributions at net asset value (“NAV”). Because Institutional Shares and Service Shares do not involve a sales charge, such a charge is not applied to their Standardized Total Returns. |
Total return figures in the above chart represent past performance and do not indicate future results, which will vary. The investment return and principal value of an investment will fluctuate and, therefore, an investor’s shares, when redeemed, may be worth more or less than their original cost. Current performance may be lower or higher than the total return figures in the above chart. Please visit www.GSAMFUNDS.com to obtain the most recent month-end returns. Performance reflects fee waivers and/or expense limitations in effect during the periods shown. In their absence, performance would be reduced.
EXPENSE RATIOS2
| | | | | | | | |
| | | Net Expense Ratio (Current) | | | Gross Expense Ratio (Before Waivers) | |
| Institutional | | | 0.75 | % | | | 0.79 | % |
| Service | | | 0.99 | | | | 1.03 | |
| 2 | The expense ratios of the Fund, both current (net of any fee waivers or expense limitations) and before waivers (gross of any fee waivers or expense limitations) are as set forth above. Pursuant to a contractual arrangement, the Fund’s waivers and/or expense limitations will remain in place through at least April 30, 2015 and prior to such date the Investment Adviser may not terminate the arrangements without the approval of the Fund’s Board of Trustees. If these arrangements are discontinued in the future, the expense ratios may change without shareholder approval. |
TOP TEN HOLDINGS AS OF 12/31/143
| | | | | | |
| Holding | | % of Net Assets | | | Line of Business |
| General Electric Co. | | | 5.0% | | | Capital Goods |
| Exxon Mobil Corp. | | | 4.2 | | | Energy |
| Pfizer, Inc. | | | 4.1 | | | Pharmaceuticals, Biotechnology & Life Sciences |
| JPMorgan Chase & Co. | | | 3.9 | | | Banks |
| Bank of America Corp. | | | 3.8 | | | Banks |
| American International Group, Inc. | | | 3.0 | | | Insurance |
| Prudential Financial, Inc. | | | 2.9 | | | Insurance |
| EMC Corp. | | | 2.6 | | | Technology Hardware & Equipment |
| The Gap, Inc. | | | 2.5 | | | Retailing |
| Medtronic, Inc. | | | 2.4 | | | Health Care Equipment & Services |
| 3 | The top 10 holdings may not be representative of the Fund’s future investments. |
7
FUND BASICS
FUND vs. BENCHMARK SECTOR ALLOCATIONS4
As of December 31, 2014
| 4 | The Fund is actively managed and, as such, its composition may differ over time. Consequently, the Fund’s overall sector allocations may differ from percentages contained in the graph above. The graph categorizes investments using Global Industry Classification Standard (“GICS”), however, the sector classifications used by the portfolio management team may differ from GICS. The percentage shown for each investment category reflects the value of investments in that category as a percentage of market value. The graph depicts the Fund’s investments but may not represent the Fund’s market exposure due to the exclusion of certain derivatives, if any, as listed in the Additional Investment Information section of the Schedule of Investments. |
8
GOLDMAN SACHS VARIABLE INSURANCE TRUST LARGE CAP VALUE FUND
Performance Summary
December 31, 2014
The following graph shows the value, as of December 31, 2014, of a $10,000 investment made on January 1, 2005 in the Institutional Shares at NAV. For comparative purposes, the performance of the Fund’s benchmark, the Russell 1000 Value Index (with distributions reinvested), is shown. This performance data represents past performance and should not be considered indicative of future performance, which will fluctuate with changes in market conditions. These performance fluctuations will cause an investor’s shares, when redeemed, to be worth more or less than their original cost. Performance reflects Fund level expenses but does not reflect fees and expenses associated with any variable annuity contract or variable life insurance policy that uses the Fund as an investment option for any contract or policy. Had performance reflected all of those fees and expenses, performance would have been reduced. Performance reflects applicable fee waivers and/or expense limitations in effect during the periods shown, and in their absence, performance would be reduced. Performance of Service Shares will vary from Institutional Shares due to differences in class specific fees. In addition to the Investment Adviser’s decisions regarding issuer/industry investment selection and allocation, other factors may affect Fund performance. These factors include, but are not limited to, Fund operating fees and expenses, portfolio turnover, and subscription and redemption cash flows affecting the Fund.
Large Cap Value Fund’s 10 Year Performance
Performance of a $10,000 investment, with distributions reinvested, from January 1, 2005 through December 31, 2014.
| | | | | | | | |
| Average Annual Total Return through December 31, 2014 | | One Year | | Five Years | | Ten Years | | Since Inception |
Institutional (Commenced January 12, 1998) | | 12.94% | | 13.12% | | 6.38% | | 5.12% |
Service (Commenced July 24, 2007) | | 12.61% | | 12.83% | | N/A | | 4.19% |
9
GOLDMAN SACHS VARIABLE INSURANCE TRUST LARGE CAP VALUE FUND
Schedule of Investments
December 31, 2014
| | | | | | | | |
| Shares | | | Description | | Value | |
| | Common Stocks – 99.2% | |
| Automobiles & Components – 1.5% | |
| | 442,935 | | | General Motors Co. | | $ | 15,462,861 | |
| | |
| Banks – 11.0% | |
| | 2,146,063 | | | Bank of America Corp. | | | 38,393,067 | |
| | 515,953 | | | Fifth Third Bancorp | | | 10,512,543 | |
| | 628,042 | | | JPMorgan Chase & Co. | | | 39,302,868 | |
| | 240,798 | | | SunTrust Banks, Inc. | | | 10,089,436 | |
| | 241,984 | | | Wells Fargo & Co. | | | 13,265,563 | |
| | | | | | | | |
| | | | | | | 111,563,477 | |
| | |
| Capital Goods – 6.8% | |
| | 2,025,501 | | | General Electric Co. | | | 51,184,410 | |
| | 138,736 | | | The Boeing Co. | | | 18,032,906 | |
| | | | | | | | |
| | | | | | | 69,217,316 | |
| | |
| Commercial & Professional Services – 0.8% | |
| | 152,478 | | | Waste Management, Inc. | | | 7,825,171 | |
| | |
| Consumer Services – 1.9% | |
| | 466,151 | | | MGM Resorts International* | | | 9,966,308 | |
| | 120,220 | | | Starwood Hotels & Resorts Worldwide, Inc. | | | 9,746,236 | |
| | | | | | | | |
| | | | | | | 19,712,544 | |
| | |
| Diversified Financials – 6.7% | |
| | 70,548 | | | Affiliated Managers Group, Inc.* | | | 14,973,108 | |
| | 86,193 | | | Ameriprise Financial, Inc. | | | 11,399,024 | |
| | 153,099 | | | Capital One Financial Corp. | | | 12,638,322 | |
| | 229,562 | | | Franklin Resources, Inc. | | | 12,710,848 | |
| | 141,015 | | | Morgan Stanley | | | 5,471,382 | |
| | 522,529 | | | Navient Corp. | | | 11,291,852 | |
| | | | | | | | |
| | | | | | | 68,484,536 | |
| | |
| Energy – 9.9% | |
| | 241,868 | | | Apache Corp. | | | 15,157,867 | |
| | 372,471 | | | Devon Energy Corp. | | | 22,798,950 | |
| | 464,507 | | | Exxon Mobil Corp. | | | 42,943,672 | |
| | 727,009 | | | Southwestern Energy Co.* | | | 19,840,076 | |
| | | | | | | | |
| | | | | | | 100,740,565 | |
| | |
| Food & Staples Retailing – 1.7% | |
| | 142,027 | | | The Kroger Co. | | | 9,119,554 | |
| | 168,700 | | | Whole Foods Market, Inc. | | | 8,505,854 | |
| | | | | | | | |
| | | | | | | 17,625,408 | |
| | |
| Food, Beverage & Tobacco – 4.8% | |
| | 60,076 | | | Anheuser-Busch InBev NV ADR | | | 6,747,736 | |
| | 382,278 | | | ConAgra Foods, Inc. | | | 13,869,046 | |
| | 446,051 | | | Mondelez International, Inc. Class A | | | 16,202,803 | |
| | 292,577 | | | Tyson Foods, Inc. Class A | | | 11,729,412 | |
| | | | | | | | |
| | | | | | | 48,548,997 | |
| | |
| Health Care Equipment & Services – 5.0% | |
| | 10,537 | | | Covidien PLC | | | 1,077,724 | |
| | 132,736 | | | Express Scripts Holding Co.* | | | 11,238,757 | |
| | |
| | Common Stocks – (continued) | |
| Health Care Equipment & Services – (continued) | |
| | 332,823 | | | Medtronic, Inc. | | $ | 24,029,821 | |
| | 148,324 | | | UnitedHealth Group, Inc. | | | 14,994,073 | |
| | | | | | | | |
| | | | | | | 51,340,375 | |
| | |
| Household & Personal Products – 1.1% | |
| | 124,452 | | | The Procter & Gamble Co. | | | 11,336,333 | |
| | |
| Insurance – 9.2% | |
| | 253,288 | | | Aflac, Inc. | | | 15,473,364 | |
| | 544,691 | | | American International Group, Inc. | | | 30,508,143 | |
| | 573,622 | | | Genworth Financial, Inc. Class A* | | | 4,875,787 | |
| | 322,364 | | | Prudential Financial, Inc. | | | 29,161,047 | |
| | 321,919 | | | The Hartford Financial Services Group, Inc. | | | 13,420,803 | |
| | | | | | | | |
| | | | | | | 93,439,144 | |
| | |
| Materials – 0.9% | |
| | 123,108 | | | Eastman Chemical Co. | | | 9,338,973 | |
| | |
| Media – 5.0% | |
| | 371,535 | | | CBS Corp. Class B | | | 20,560,747 | |
| | 277,382 | | | Liberty Global PLC Series C* | | | 13,400,324 | |
| | 230,112 | | | Viacom, Inc. Class B | | | 17,315,928 | |
| | | | | | | | |
| | | | | | | 51,276,999 | |
| | |
| Pharmaceuticals, Biotechnology & Life Sciences – 8.2% | |
| | 207,009 | | | Bristol-Myers Squibb Co. | | | 12,219,741 | |
| | 75,817 | | | Eli Lilly & Co. | | | 5,230,615 | |
| | 194,621 | | | Merck & Co., Inc. | | | 11,052,527 | |
| | 235,058 | | | Mylan, Inc.* | | | 13,250,219 | |
| | 1,355,469 | | | Pfizer, Inc. | | | 42,222,859 | |
| | | | | | | | |
| | | | | | | 83,975,961 | |
| | |
| Real Estate Investment Trust – 0.8% | |
| | 52,075 | | | AvalonBay Communities, Inc. | | | 8,508,534 | |
| | |
| Retailing – 5.6% | |
| | 87,815 | | | Expedia, Inc. | | | 7,495,889 | |
| | 296,100 | | | Staples, Inc. | | | 5,365,332 | |
| | 617,029 | | | The Gap, Inc. | | | 25,983,091 | |
| | 154,430 | | | The TJX Companies, Inc. | | | 10,590,809 | |
| | 228,832 | | | Urban Outfitters, Inc.* | | | 8,038,868 | |
| | | | | | | | |
| | | | | | | 57,473,989 | |
| | |
| Semiconductors & Semiconductor Equipment – 1.1% | |
| | 345,124 | | | Maxim Integrated Products, Inc. | | | 10,999,102 | |
| | |
| Software & Services – 5.5% | |
| | 136,584 | | | eBay, Inc.* | | | 7,665,094 | |
| | 32,069 | | | Google, Inc. Class A* | | | 17,017,735 | |
| | 372,945 | | | Microsoft Corp. | | | 17,323,295 | |
| | 111,201 | | | SAP SE ADR | | | 7,745,150 | |
| | 193,405 | | | Vantiv, Inc. Class C* | | | 6,560,298 | |
| | | | | | | | |
| | | | | | | 56,311,572 | |
| | |
| | |
| 10 | | The accompanying notes are an integral part of these financial statements. |
GOLDMAN SACHS VARIABLE INSURANCE TRUST LARGE CAP VALUE FUND
| | | | | | | | |
| Shares | | | Description | | Value | |
| | Common Stocks – (continued) | |
| Technology Hardware & Equipment – 4.8% | |
| | 803,124 | | | Cisco Systems, Inc. | | $ | 22,338,894 | |
| | 882,479 | | | EMC Corp. | | | 26,244,925 | |
| | | | | | | | |
| | | | | | | 48,583,819 | |
| | |
| Telecommunication Services – 2.1% | |
| | 446,611 | | | Verizon Communications, Inc. | | | 20,892,463 | |
| | |
| Transportation – 1.2% | |
| | 474,405 | | | Hertz Global Holdings, Inc.* | | | 11,831,661 | |
| | |
| Utilities – 3.6% | |
| | 367,644 | | | FirstEnergy Corp. | | | 14,334,439 | |
| | 72,966 | | | NextEra Energy, Inc. | | | 7,755,556 | |
| | 275,124 | | | PG&E Corp. | | | 14,647,602 | |
| | | | | | | | |
| | | | | | | 36,737,597 | |
| | |
| | TOTAL INVESTMENTS – 99.2% | | | | |
| | (Cost $809,090,041) | | $ | 1,011,227,397 | |
| | |
| OTHER ASSETS IN EXCESS OF
LIABILITIES – 0.8% | | | 8,056,622 | |
| | |
| | NET ASSETS – 100.0% | | $ | 1,019,284,019 | |
| | |
| | |
| The percentage shown for each investment category reflects the value of investments in that category as a percentage of net assets. |
| * | | Non-income producing security. |
| | |
| Investment Abbreviation: |
| ADR | | —American Depositary Receipt |
| | |
| The accompanying notes are an integral part of these financial statements. | | 11 |
GOLDMAN SACHS VARIABLE INSURANCE TRUST LARGE CAP VALUE FUND
Statement of Assets and Liabilities
December 31, 2014
| | | | |
| | | | |
| Assets: | | | |
Investments, at value (cost $809,090,041) | | $ | 1,011,227,397 | |
Cash | | | 5,091,939 | |
Receivables: | | | | |
Investments sold | | | 11,351,336 | |
Dividends | | | 1,603,264 | |
Fund shares sold | | | 245,623 | |
Reimbursement from investment adviser | | | 32,372 | |
Other assets | | | 34,269 | |
| Total assets | | | 1,029,586,200 | |
| |
| | | | |
| Liabilities: | | | |
Payables: | | | | |
Fund shares redeemed | | | 9,450,993 | |
Management fees | | | 627,427 | |
Distribution and Service fees and Transfer Agent fees | | | 165,500 | |
Accrued expenses | | | 58,261 | |
| Total liabilities | | | 10,302,181 | |
| |
| | | | |
| Net Assets: | | | |
Paid-in capital | | | 805,301,788 | |
Undistributed net investment income | | | 1,589,589 | |
Accumulated net realized gain | | | 10,255,286 | |
Net unrealized gain | | | 202,137,356 | |
| NET ASSETS | | $ | 1,019,284,019 | |
Net Assets: | | | | |
Institutional | | $ | 326,542,630 | |
Service | | | 692,741,389 | |
Total Net Assets | | $ | 1,019,284,019 | |
Shares of beneficial interest outstanding $0.001 par value (unlimited shares authorized): | | | | |
Institutional | | | 28,677,583 | |
Service | | | 60,879,642 | |
Net asset value, offering and redemption price per share: | | | | |
Institutional | | | $11.39 | |
Service | | | 11.38 | |
| | |
| 12 | | The accompanying notes are an integral part of these financial statements. |
GOLDMAN SACHS VARIABLE INSURANCE TRUST LARGE CAP VALUE FUND
Statement of Operations
For the Fiscal Year Ended December 31, 2014
| | | | |
| | | | |
| Investment income: | |
| |
Dividends | | $ | 21,961,522 | |
| |
| | | | |
| Expenses: | | | |
Management fees | | | 8,339,180 | |
Distribution and Service fees — Service Class | | | 1,917,129 | |
Transfer Agent fees(a) | | | 224,697 | |
Printing and mailing costs | | | 99,962 | |
Custody, accounting and administrative services | | | 82,586 | |
Professional fees | | | 74,694 | |
Trustee fees | | | 26,130 | |
Other | | | 122,382 | |
| Total expenses | | | 10,886,760 | |
Less — expense reductions | | | (567,558 | ) |
| Net expenses | | | 10,319,202 | |
| NET INVESTMENT INCOME | | | 11,642,320 | |
| |
| | | | |
| Realized and unrealized gain (loss): | | | |
Net realized gain from investments (including commissions recaptured of $100,102) | | | 183,715,963 | |
Net change in unrealized loss on investments | | | (61,717,949 | ) |
| Net realized and unrealized gain | | | 121,998,014 | |
| NET INCREASE IN NET ASSETS RESULTING FROM OPERATIONS | | $ | 133,640,334 | |
(a) Institutional and Service Shares had Transfer Agent fees of $71,339 and $153,358, respectively.
| | |
| The accompanying notes are an integral part of these financial statements. | | 13 |
GOLDMAN SACHS VARIABLE INSURANCE TRUST LARGE CAP VALUE FUND
Statements of Changes in Net Assets
| | | | | | | | |
| | | For the
Fiscal Year Ended
December 31, 2014 | | | For the
Fiscal Year Ended
December 31, 2013 | |
| | | | | | | | |
| From operations: | |
Net investment income | | $ | 11,642,320 | | | $ | 11,427,742 | |
Net realized gain | | | 183,715,963 | | | | 142,897,821 | |
Net change in unrealized gain (loss) | | | (61,717,949 | ) | | | 173,069,369 | |
| Net increase in net assets resulting from operations | | | 133,640,334 | | | | 327,394,932 | |
| |
| | | | | | | | |
| Distributions to shareholders: | | | | | | |
From net investment income | | | | | | | | |
Institutional Shares | | | (4,510,586 | ) | | | (4,254,465 | ) |
Service Shares | | | (7,646,742 | ) | | | (7,134,156 | ) |
From net realized gains | | | | | | | | |
Institutional Shares | | | (59,582,661 | ) | | | (40,647,036 | ) |
Service Shares | | | (126,376,649 | ) | | | (86,993,768 | ) |
| Total distributions to shareholders | | | (198,116,638 | ) | | | (139,029,425 | ) |
| |
| | | | | | | | |
| From share transactions: | | | | | | |
Proceeds from sales of shares | | | 66,617,776 | | | | 69,381,064 | |
Reinvestment of distributions | | | 198,116,638 | | | | 139,029,425 | |
Cost of shares redeemed | | | (343,768,316 | ) | | | (320,236,241 | ) |
| Net decrease in net assets resulting from share transactions | | | (79,033,902 | ) | | | (111,825,752 | ) |
| TOTAL INCREASE (DECREASE) | | | (143,510,206 | ) | | | 76,539,755 | |
| |
| | | | | | | | |
| Net assets: | | | | | | |
| | |
Beginning of year | | | 1,162,794,225 | | | | 1,086,254,470 | |
End of year | | $ | 1,019,284,019 | | | $ | 1,162,794,225 | |
| Undistributed net investment income | | $ | 1,589,589 | | | $ | 2,104,597 | |
| | |
| 14 | | The accompanying notes are an integral part of these financial statements. |
GOLDMAN SACHS VARIABLE INSURANCE TRUST LARGE CAP VALUE FUND
Financial Highlights
Selected Data for a Share Outstanding Throughout Each Year
| | | | | | | | | | | | | | | | | | | | | | | | | | | | | | | | | | | | | | | | | | | | | | | | | | | | | | | | |
| | | | | | Income (loss) from
investment operations | | | Distributions to shareholders | | | | | | | | | | | | | | | | | | | | | | |
| Year - Share Class | | Net asset
value,
beginning
of year | | | Net
investment
income(a) | | | Net
realized
and
unrealized
gain (loss) | | | Total from
investment
operations | | | From net
investment
income | | | From
net
realized
gains | | | Total
distributions | | | Net asset
value,
end of
year | | | Total
return(b) | | | Net assets,
end of
year
(in 000s) | | | Ratio of
net expenses
to average
net assets | | | Ratio of
total
expenses
to average
net assets | | | Ratio of
net investment
income
to average
net assets | | | Portfolio
turnover
rate(c) | |
FOR THE FISCAL YEARS ENDED DECEMBER 31, | |
2014 - Institutional | | $ | 12.59 | | | $ | 0.16 | | | $ | 1.38 | | | $ | 1.54 | | | $ | (0.19 | ) | | $ | (2.55 | ) | | $ | (2.74 | ) | | $ | 11.39 | | | | 12.94 | % | | $ | 326,543 | | | | 0.75 | % | | | 0.80 | % | | | 1.21 | % | | | 72 | % |
2014 - Service | | | 12.58 | | | | 0.13 | | | | 1.37 | | | | 1.50 | | | | (0.15 | ) | | | (2.55 | ) | | | (2.70 | ) | | | 11.38 | | | | 12.61 | | | | 692,741 | | | | 1.00 | | | | 1.05 | | | | 0.96 | | | | 72 | |
2013 - Institutional | | | 10.76 | | | | 0.14 | | | | 3.39 | | | | 3.53 | | | | (0.16 | ) | | | (1.54 | ) | | | (1.70 | ) | | | 12.59 | | | | 33.23 | | | | 370,241 | | | | 0.75 | | | | 0.79 | | | | 1.15 | | | | 86 | |
2013 - Service | | | 10.75 | | | | 0.11 | | | | 3.39 | | | | 3.50 | | | | (0.13 | ) | | | (1.54 | ) | | | (1.67 | ) | | | 12.58 | | | | 32.93 | | | | 792,553 | | | | 1.00 | | | | 1.04 | | | | 0.91 | | | | 86 | |
2012 - Institutional | | | 9.39 | | | | 0.15 | | | | 1.64 | | | | 1.79 | | | | (0.15 | ) | | | (0.27 | ) | | | (0.42 | ) | | | 10.76 | | | | 19.07 | | | | 351,677 | | | | 0.77 | | | | 0.78 | | | | 1.40 | | | | 120 | |
2012 - Service | | | 9.38 | | | | 0.12 | | | | 1.64 | | | | 1.76 | | | | (0.12 | ) | | | (0.27 | ) | | | (0.39 | ) | | | 10.75 | | | | 18.77 | | | | 734,577 | | | | 1.02 | | | | 1.03 | | | | 1.15 | | | | 120 | |
2011 - Institutional | | | 10.24 | | | | 0.14 | (d) | | | (0.86 | ) | | | (0.72 | ) | | | (0.13 | ) | | | — | | | | (0.13 | ) | | | 9.39 | | | | (7.05 | ) | | | 421,560 | | | | 0.78 | | | | 0.79 | | | | 1.39 | (d) | | | 91 | |
2011 - Service | | | 10.23 | | | | 0.12 | (d) | | | (0.87 | ) | | | (0.75 | ) | | | (0.10 | ) | | | — | | | | (0.10 | ) | | | 9.38 | | | | (7.27 | ) | | | 857,659 | | | | 1.03 | | | | 1.04 | | | | 1.23 | (d) | | | 91 | |
2010 - Institutional | | | 9.28 | | | | 0.10 | | | | 0.94 | | | | 1.04 | | | | (0.08 | ) | | | — | | | | (0.08 | ) | | | 10.24 | | | | 11.20 | | | | 507,146 | | | | 0.80 | | | | 0.80 | | | | 1.02 | | | | 95 | |
2010 - Service | | | 9.28 | | | | 0.07 | | | | 0.94 | | | | 1.01 | | | �� | (0.06 | ) | | | — | | | | (0.06 | ) | | | 10.23 | | | | 10.89 | | | | 672,239 | | | | 1.05 | | | | 1.05 | | | | 0.78 | | | | 95 | |
| (a) | Calculated based on the average shares outstanding methodology. |
| (b) | Assumes investment at the net asset value at the beginning of the year, reinvestment of all distributions, and a complete redemption of the investment at the net asset value at the end of the year. |
| (c) | The Fund’s portfolio turnover rate is calculated in accordance with regulatory requirements, without regard to transactions involving short term investments and certain derivatives. If such transactions were included, the Fund’s portfolio turnover rate may be higher. |
| (d) | Reflects income recognized from special dividends which amounted to $0.02 per share and 0.19% of average net assets. |
| | | | |
| The accompanying notes are an integral part of these financial statements. | | 15 | | |
GOLDMAN SACHS VARIABLE INSURANCE TRUST LARGE CAP VALUE FUND
Notes to Financial Statements
December 31, 2014
1. ORGANIZATION
Goldman Sachs Variable Insurance Trust (the “Trust” or “VIT”) is a Delaware statutory trust registered under the Investment Company Act of 1940, as amended (the “Act”), as an open-end management investment company. The Trust includes the Goldman Sachs Large Cap Value Fund (the “Fund”). The Fund is a diversified portfolio under the Act offering two classes of shares — Institutional and Service Shares. Shares of the Trust are offered to separate accounts of participating life insurance companies for the purpose of funding variable annuity contracts and variable life insurance policies.
Goldman Sachs Asset Management, L.P. (“GSAM”), an affiliate of Goldman, Sachs & Co. (“Goldman Sachs”), serves as investment adviser to the Fund pursuant to a management agreement (the “Agreement”) with the Trust.
2. SIGNIFICANT ACCOUNTING POLICIES
The financial statements have been prepared in accordance with accounting principles generally accepted in the United States of America (“GAAP”) and require management to make estimates and assumptions that may affect the reported amounts and disclosures. Actual results may differ from those estimates and assumptions.
A. Investment Valuation — The Fund’s valuation policy is to value investments at fair value.
B. Investment Income and Investments — Investment income includes interest income and dividend income, net of any foreign withholding taxes, less any amounts reclaimable. Interest income is accrued daily and adjusted for amortization of premiums and accretion of discounts. Dividend income is recognized on ex-dividend date or, for certain foreign securities, as soon as such information is obtained subsequent to the ex-dividend date. Investment transactions are reflected on trade date. Realized gains and losses are calculated using identified cost. Investment transactions are recorded on the following business day for daily net asset value (“NAV”) calculations. Any foreign capital gains tax is accrued daily based upon net unrealized gains, and is payable upon sale of such investments. Distributions received from the Fund’s investments in United States (“U.S.”) real estate investment trusts (“REITs”) may be characterized as ordinary income, net capital gain or a return of capital. A return of capital is recorded by the Fund as a reduction to the cost basis of the REIT.
C. Class Allocations and Expenses — Investment income, realized and unrealized gain (loss), and non-class specific expenses of the Fund are allocated daily based upon the proportion of net assets of each class. Class specific expenses, where applicable, are borne by the respective share classes and include Distribution and Service and Transfer Agent fees. Non-class specific expenses directly incurred by a Fund are charged to that Fund, while such expenses incurred by the Trust are allocated across the respective Funds on a straight-line and/or pro-rata basis depending upon the nature of the expenses.
D. Federal Taxes and Distributions to Shareholders — It is the Fund’s policy to comply with the requirements of the Internal Revenue Code of 1986, as amended (the “Code”), applicable to regulated investment companies (mutual funds) and to distribute each year substantially all of its investment company taxable income and capital gains to its shareholders. Accordingly, the Fund is not required to make any provisions for the payment of federal income tax. Distributions to shareholders are recorded on the ex-dividend date. Income and capital gains distributions, if any, are declared and paid annually.
16
GOLDMAN SACHS VARIABLE INSURANCE TRUST LARGE CAP VALUE FUND
2. SIGNIFICANT ACCOUNTING POLICIES (continued)
Net capital losses are carried forward to future fiscal years and may be used to the extent allowed by the Code to offset any future capital gains. Losses that are carried forward will retain their character as either short-term or long-term capital losses. Utilization of capital loss carryforwards will reduce the requirement of future capital gains distributions.
The characterization of distributions to shareholders for financial reporting purposes is determined in accordance with federal income tax rules, which may differ from GAAP. The source of the Fund’s distributions may be shown in the accompanying financial statements as either from net investment income, net realized gain or capital. Certain components of the Fund’s net assets on the Statement of Assets and Liabilities reflect permanent GAAP/tax differences based on the appropriate tax character.
E. Commission Recapture — GSAM, on behalf of certain Funds, may direct portfolio trades, subject to seeking best execution, to various brokers who have agreed to rebate a portion of the commissions generated. Such rebates are made directly to a Fund as cash payments and are included in net realized gain (loss) from investments on the Statement of Operations.
3. INVESTMENTS AND FAIR VALUE MEASUREMENTS
The fair value of a financial instrument is the amount that would be received to sell an asset or paid to transfer a liability in an orderly transaction between market participants at the measurement date (i.e., the exit price). GAAP establishes a fair value hierarchy that prioritizes the inputs to valuation techniques used to measure fair value. The hierarchy gives the highest priority to unadjusted quoted prices in active markets for identical assets or liabilities (Level 1 measurements) and the lowest priority to unobservable inputs (Level 3 measurements). The levels used for classifying investments are not necessarily an indication of the risk associated with investing in these investments. The three levels of the fair value hierarchy are described below:
Level 1 — Unadjusted quoted prices in active markets that are accessible at the measurement date for identical, unrestricted assets or liabilities;
Level 2 — Quoted prices in markets that are not active or financial instruments for which significant inputs are observable (including, but not limited to, quoted prices for similar investments, interest rates, foreign exchange rates, volatility and credit spreads), either directly or indirectly;
Level 3 — Prices or valuations that require significant unobservable inputs (including GSAM’s assumptions in determining fair value measurement).
The Trustees have adopted Valuation Procedures that govern the valuation of the portfolio investments held by the Fund, including investments for which market quotations are not readily available. The Trustees have delegated to GSAM day-to-day responsibility for implementing and maintaining internal controls and procedures related to the valuation of the Fund’s portfolio investments. To assess the continuing appropriateness of pricing sources and methodologies, GSAM regularly performs price verification procedures and issues challenges as necessary to third party pricing vendors or brokers, and any differences are reviewed in accordance with the Valuation Procedures.
17
GOLDMAN SACHS VARIABLE INSURANCE TRUST LARGE CAP VALUE FUND
Notes to Financial Statements (continued)
December 31, 2014
3. INVESTMENTS AND FAIR VALUE MEASUREMENTS (continued)
A. Level 1 and Level 2 Fair Value Investments — The valuation techniques and significant inputs used in determining the fair values for investments classified as Level 1 and Level 2 are as follows:
Equity Securities — Equity securities and investment companies traded on a U.S. securities exchange or the NASDAQ system, or those located on certain foreign exchanges, including but not limited to the Americas, are valued daily at their last sale price or official closing price on the principal exchange or system on which they are traded. If no sale occurs, equity securities and exchange traded investment companies are valued at the last bid price for long positions and at the last ask price for short positions. Investments in investment companies (other than those that are exchange traded) are valued at the NAV on the valuation date. To the extent these investments are actively traded, they are classified as Level 1 of the fair value hierarchy, otherwise they are generally classified as Level 2.
Unlisted equity securities for which market quotations are available are valued at the last sale price on the valuation date, or if no sale occurs, at the last bid price. Securities traded on certain foreign securities exchanges are valued daily at fair value determined by an independent fair value service (if available) under Valuation Procedures approved by the Trustees and consistent with applicable regulatory guidance. The independent fair value service takes into account multiple factors including, but not limited to, movements in the securities markets, certain depositary receipts, futures contracts and foreign currency exchange rates that have occurred subsequent to the close of the foreign securities exchange. These investments are generally classified as Level 2 of the fair value hierarchy.
B. Level 3 Fair Value Investments — To the extent that the aforementioned significant inputs are unobservable, or if quotations are not readily available, or if GSAM believes that such quotations do not accurately reflect fair value, the fair value of the Fund’s investments may be determined under Valuation Procedures approved by the Trustees. GSAM, consistent with its procedures and applicable regulatory guidance, may make an adjustment to the most recent valuation prices of either domestic or foreign securities in light of significant events to reflect what it believes to be the fair value of the securities at the time of determining a Fund’s NAV. Significant events which could affect a large number of securities in a particular market may include, but are not limited to: significant fluctuations in U.S. or foreign markets; market dislocations; market disruptions; or unscheduled market closings. Significant events which could also affect a single issuer may include, but are not limited to: corporate actions such as reorganizations, mergers and buy-outs; ratings downgrades; and bankruptcies.
C. Fair Value Hierarchy — The following is a summary of the Fund’s investments classified in the fair value hierarchy as of December 31, 2014:
| | | | | | | | | | | | |
| Investment Type | | Level 1 | | | Level 2 | | | Level 3 | |
| Assets | | | | | | | | | | | | |
| Common Stock and/or Other Equity Investments(a) | | | | | | | | | | | | |
North America | | $ | 1,011,227,397 | | | $ | — | | | $ | — | |
| (a) | Amounts are disclosed by continent to highlight the impact of time zone differences between local market close and the calculation of net asset value. Security valuations are based on the principal exchange or system on which they are traded, which may differ from country of domicile. |
For further information regarding security characteristics, see the Schedule of Investments.
18
GOLDMAN SACHS VARIABLE INSURANCE TRUST LARGE CAP VALUE FUND
4. AGREEMENTS AND AFFILIATED TRANSACTIONS
A. Management Agreement — Under the Agreement, GSAM manages the Fund, subject to the general supervision of the Trustees.
As compensation for the services rendered pursuant to the Agreement, the assumption of the expenses related thereto and administration of the Fund’s business affairs, including providing facilities, GSAM is entitled to a management fee, accrued daily and paid monthly, equal to an annual percentage rate of the Fund’s average daily net assets.
For the fiscal year ended December 31, 2014, contractual and effective net management fees with GSAM were at the following rates:
| | | | | | | | | | | | | | | | | | | | | | | | | | |
| Contractual Management Fee Rate | | | | |
First
$1 billion | | | Next
$1 billion | | | Next
$3 billion | | | Next
$3 billion | | | Over
$8 billion | | | Effective
Rate | | | Effective Net
Management Fee Rate | |
| | 0.75% | | | | 0.68 | % | | | 0.65 | % | | | 0.64 | % | | | 0.63 | % | | | 0.74 | % | | | 0.72 | %* |
| * | GSAM has agreed to waive a portion of its management fee in order to achieve a net management fee rate, as defined in the Fund’s most recent prospectuses. This waiver will be effective through at least April 30, 2015, and prior to such date GSAM may not terminate the arrangement without approval of the Trustees. The Effective Net Management Rate above is calculated based on the management rate before and after the waiver had been adjusted, if applicable. For the fiscal year ended December 31, 2014, GSAM waived $299,509 of its management fee. |
B. Distribution and Service Plan — The Trust, on behalf of the Service Shares of the Fund, has adopted a Distribution and Service Plan (the “Plan”). Under the Plan, Goldman Sachs, which serves as distributor (the “Distributor”), is entitled to a fee accrued daily and paid monthly, for distribution services and personal and account maintenance services, which may then be paid by Goldman Sachs to authorized dealers, equal to, on an annual basis, 0.25% of the Fund’s average daily net assets attributable to Service Shares.
C. Transfer Agency Agreement — Goldman Sachs also serves as the transfer agent of the Fund for a fee pursuant to a Transfer Agency Agreement. The fees charged for such transfer agency services are accrued daily and paid monthly at an annual rate of 0.02% of the average daily net assets of Institutional and Service Shares.
D. Other Expense Agreements and Affiliated Transactions — GSAM has agreed to limit certain “Other Expenses” of the Fund (excluding transfer agency fees and expenses, taxes, interest, brokerage fees, shareholder meeting, litigation, indemnification, and extraordinary expenses) to the extent such expenses exceed, on an annual basis, a percentage rate of the average daily net assets of the Fund. Such Other Expense reimbursements, if any, are accrued daily and paid monthly. In addition, the Fund is not obligated to reimburse GSAM for prior fiscal year expense reimbursements, if any. The Other Expense limitation as an annual percentage rate of average daily net assets for the Fund is 0.004%. The Other Expense limitation will remain in place through at least April 30, 2015, and prior to such date GSAM may not terminate the arrangement without the approval of the Trustees. The Fund bears its respective share of costs related to proxy and shareholder meetings, and GSAM has agreed to reimburse the Fund to the extent such expenses exceed a specified percentage of the Fund’s net assets. For the fiscal year ended December 31, 2014, GSAM reimbursed $257,411 to the Fund. In addition, the Fund has entered into certain offset arrangements with the custodian and the transfer agent, which may result in a reduction of the Fund’s expenses and are received irrespective of the application of the “Other Expense” limitation described above. For the fiscal year ended December 31, 2014, custody fee credits were $10,638.
19
GOLDMAN SACHS VARIABLE INSURANCE TRUST LARGE CAP VALUE FUND
Notes to Financial Statements (continued)
December 31, 2014
4. AGREEMENTS AND AFFILIATED TRANSACTIONS (continued)
E. Line of Credit Facility — As of December 31, 2014, the Fund participated in a $1,080,000,000 committed, unsecured revolving line of credit facility (the “facility”) together with other funds of the Trust and registered investment companies having management agreements with GSAM or its affiliates (“Other Borrowers”). Pursuant to the terms of the facility, the Fund and Other Borrowers could increase the credit amount by an additional $120,000,000, for a total of up to $1,200,000,000. This facility is to be used solely for temporary or emergency purposes, which may include the funding of redemptions. The interest rate on borrowings is based on the federal funds rate. The facility also requires a fee to be paid by the Fund based on the amount of the commitment that has not been utilized. For the fiscal year ended December 31, 2014, the Fund did not have any borrowings under the facility.
F. Other Transactions with Affiliates — For the fiscal year ended December 31, 2014, Goldman Sachs earned $1,062 in brokerage commissions from portfolio transactions.
5. PORTFOLIO SECURITIES TRANSACTIONS
The cost of purchases and proceeds from sales and maturities of long-term securities for the fiscal year ended December 31, 2014, were $797,367,822 and $1,057,383,058, respectively.
6. TAX INFORMATION
The tax character of distributions paid during the fiscal years ended December 31, 2013 and December 31, 2014 was as follows:
| | | | | | | | |
| | | 2013 | | | 2014 | |
| Distributions paid from: | | | | | | | | |
Ordinary income | | $ | 92,526,435 | | | $ | 78,350,802 | |
Net long-term capital gains | | | 46,502,990 | | | | 119,765,836 | |
| Total taxable distributions | | $ | 139,029,425 | | | $ | 198,116,638 | |
As of December 31, 2014, the components of accumulated earnings (losses) on a tax-basis were as follows:
| | | | |
| Undistributed ordinary income — net | | $ | 9,968,835 | |
| Undistributed long-term capital gains | | | 9,753,220 | |
| Total undistributed earnings | | $ | 19,722,055 | |
| Unrealized gains — net | | | 194,260,176 | |
| Total accumulated gains — net | | $ | 213,982,231 | |
As of December 31, 2014, the Fund’s aggregate security unrealized gains and losses based on cost for U.S. federal income tax purposes were as follows:
| | | | |
| Tax cost | | $ | 816,967,221 | |
| Gross unrealized gain | | | 215,591,820 | |
| Gross unrealized loss | | | (21,331,644 | ) |
| Net unrealized security gain | | $ | 194,260,176 | |
20
GOLDMAN SACHS VARIABLE INSURANCE TRUST LARGE CAP VALUE FUND
6. TAX INFORMATION (continued)
The difference between GAAP-basis and tax-basis unrealized gains (losses) is attributable primarily to wash sales.
GSAM has reviewed the Fund’s tax positions for all open tax years (the current and prior three years, as applicable) and has concluded that no provision for income tax is required in the Fund’s financial statements. Such open tax years remain subject to examination and adjustment by tax authorities.
7. OTHER RISKS
The Fund’s risks include, but are not limited to, the following:
Large Shareholder Transaction Risk — The Fund may experience adverse effects when certain large shareholders, such as other funds, participating insurance companies, accounts and Goldman Sachs affiliates, purchase or redeem large amounts of shares of the Fund. Such large shareholder redemptions may cause the Fund to sell portfolio securities at times when it would not otherwise do so, which may negatively impact the Fund’s NAV and liquidity. Similarly, large Fund share purchases may adversely affect the Fund’s performance to the extent that the Fund is delayed in investing new cash and is required to maintain a larger cash position than it ordinarily would. These transactions may also increase transaction costs. In addition, a large redemption could result in the Fund’s current expenses being allocated over a smaller asset base, leading to an increase in the Fund’s expense ratio.
Liquidity Risk — The Fund may make investments that are illiquid or that may become less liquid in response to market developments or adverse investor perceptions. Illiquid investments may be more difficult to value. Liquidity risk may also refer to the risk that a Fund will not be able to pay redemption proceeds within the allowable time period because of unusual market conditions, an unusually high volume of redemption requests, or other reasons. To meet redemption requests, a Fund may be forced to sell investments at an unfavorable time and/or under unfavorable conditions.
Market and Credit Risks — In the normal course of business, the Fund trades financial instruments and enters into financial transactions where risk of potential loss exists due to changes in the market (market risk). Additionally, the Fund may also be exposed to credit risk in the event that an issuer or guarantor fails to perform or that an institution or entity with which the Fund has unsettled or open transactions defaults.
8. INDEMNIFICATIONS
Under the Trust’s organizational documents, its Trustees, officers, employees and agents are indemnified, to the extent permitted by the Act and state law, against certain liabilities that may arise out of performance of their duties to the Fund. Additionally, in the course of business, the Fund enters into contracts that contain a variety of indemnification clauses. The Fund’s maximum exposure under these arrangements is unknown, as this would involve future claims that may be made against the Fund that have not yet occurred. However, GSAM believes the risk of loss under these arrangements to be remote.
21
GOLDMAN SACHS VARIABLE INSURANCE TRUST LARGE CAP VALUE FUND
Notes to Financial Statements (continued)
December 31, 2014
9. SUBSEQUENT EVENTS
Subsequent events after the Statement of Assets and Liabilities date have been evaluated through the date the financial statements were issued. GSAM has concluded that there is no impact requiring adjustment or disclosure in the financial statements.
10. SUMMARY OF SHARE TRANSACTIONS
Share activity is as follows:
| | | | | | | | | | | | | | | | |
| | | For the Fiscal Year Ended
December 31, 2014 | | | For the Fiscal Year Ended
December 31, 2013 | |
| | | Shares | | | Dollars | | | Shares | | | Dollars | |
| Institutional Shares | | | | | | | | | | | | | | | | |
| Shares sold | | | 1,950,877 | | | $ | 26,237,463 | | | | 1,750,598 | | | $ | 21,814,523 | |
| Reinvestment of distributions | | | 5,795,050 | | | | 64,093,247 | | | | 3,659,454 | | | | 44,901,501 | |
| Shares redeemed | | | (8,477,782 | ) | | | (113,015,181 | ) | | | (8,698,000 | ) | | | (108,878,229 | ) |
| | | | (731,855 | ) | | | (22,684,471 | ) | | | (3,287,948 | ) | | | (42,162,205 | ) |
| Service Shares | | | | | | | | | | | | | | | | |
| Shares sold | | | 3,043,560 | | | | 40,380,313 | | | | 3,795,885 | | | | 47,566,541 | |
| Reinvestment of distributions | | | 12,117,847 | | | | 134,023,391 | | | | 7,677,645 | | | | 94,127,924 | |
| Shares redeemed | | | (17,295,149 | ) | | | (230,753,135 | ) | | | (16,816,932 | ) | | | (211,358,012 | ) |
| | | | (2,133,742 | ) | | | (56,349,431 | ) | | | (5,343,402 | ) | | | (69,663,547 | ) |
| NET DECREASE | | | (2,865,597 | ) | | $ | (79,033,902 | ) | | | (8,631,350 | ) | | $ | (111,825,752 | ) |
22
Report of Independent Registered Public Accounting Firm
To the Board of Trustees and Shareholders of
Goldman Sachs Variable Insurance Trust — Goldman Sachs Large Cap Value Fund:
In our opinion, the accompanying statement of assets and liabilities, including the schedule of investments, and the related statements of operations and of changes in net assets and the financial highlights present fairly, in all material respects, the financial position of Goldman Sachs Large Cap Value Fund (the “Fund”), a Fund of Goldman Sachs Variable Insurance Trust, at December 31, 2014, the results of its operations, the changes in its net assets and the financial highlights for each of the periods indicated, in conformity with accounting principles generally accepted in the United States of America. These financial statements and financial highlights (hereafter referred to as “financial statements”) are the responsibility of the Fund’s management. Our responsibility is to express an opinion on these financial statements based on our audits. We conducted our audits of these financial statements in accordance with the standards of the Public Company Accounting Oversight Board (United States). Those standards require that we plan and perform the audit to obtain reasonable assurance about whether the financial statements are free of material misstatement. An audit includes examining, on a test basis, evidence supporting the amounts and disclosures in the financial statements, assessing the accounting principles used and significant estimates made by management, and evaluating the overall financial statement presentation. We believe that our audits, which included confirmation of securities at December 31, 2014 by correspondence with the custodian and the application of alternative auditing procedures where securities purchased had not been received, provide a reasonable basis for our opinion.
PricewaterhouseCoopers LLP
Boston, Massachusetts
February 19, 2015
23
GOLDMAN SACHS VARIABLE INSURANCE TRUST LARGE CAP VALUE FUND
| | |
| Fund Expenses — Six Month Period Ended December 31, 2014 (Unaudited) | | |
As a shareholder of Institutional or Service Shares of the Fund, you incur ongoing costs, including management fees, distribution and service (12b-1) fees (with respect to Service Shares) and other Fund expenses. This example is intended to help you understand your ongoing costs (in dollars) of investing in the Institutional Shares and Service Shares of the Fund and to compare these costs with the ongoing costs of investing in other mutual funds.
The example is based on an investment of $1,000 invested at the beginning of the period and held for the entire period from July 1, 2014 through December 31, 2014.
Actual Expenses — The first line under each share class in the table below provides information about actual account values and actual expenses. You may use the information in this line, together with the amount you invested, to estimate the expenses that you paid over the period. Simply divide your account value by $1,000 (for example, an $8,600 account value divided by $1,000=8.6), then multiply the result by the number in the first line under the heading entitled “Expenses Paid” to estimate the expenses you paid on your account during this period.
Hypothetical Example for Comparison Purposes — The second line under each share class in the table below provides information about hypothetical account values and hypothetical expenses based on the Fund's actual net expense ratio and an assumed rate of return of 5% per year before expenses, which is not the Fund's actual return. The hypothetical account values and expenses may not be used to estimate the actual ending account balance or expenses you paid for the period. You may use this information to compare the ongoing costs of investing in the Fund and other funds. To do so, compare this 5% hypothetical example with the 5% hypothetical examples that appear in the shareholder reports of the other funds.
Please note that the expenses shown in the table are meant to highlight your ongoing costs only. As a shareholder of the Fund, you do not incur any transaction costs, such as sales charges, redemption fees, or exchange fees, but shareholders of other funds may incur such costs. The second line of the table is useful in comparing ongoing costs only, and will not help you determine the relative total costs of owning different funds whose shareholders may incur transaction costs.
| | | | | | | | | | | | |
| Share Class | | Beginning
Account Value
7/01/14 | | | Ending
Account Value
12/31/14 | | | Expenses Paid
for the
6 Months
Ended
12/31/14* | |
| Institutional | | | | | | | | | | | | |
| Actual | | $ | 1,000 | | | $ | 1,036.30 | | | $ | 3.85 | |
| Hypothetical 5% return | | | 1,000 | | | | 1,021.42 | + | | | 3.82 | |
| Service | | | | | | | | | | | | |
| Actual | | | 1,000 | | | | 1,034.80 | | | | 5.13 | |
| Hypothetical 5% return | | | 1,000 | | | | 1,020.16 | + | | | 5.09 | |
| | * | Expenses are calculated using the Fund’s annualized net expense ratio for each class, which represents the ongoing expenses as a percentage of net assets for the six months ended December 31, 2014. Expenses are calculated by multiplying the annualized net expense ratio by the average account value for the period; then multiplying the result by the number of days in the most recent fiscal half year; and then dividing that result by the number of days in the fiscal year. The annualized net expense ratios for the period were 0.75% and 1.00% for the Institutional and Service Shares, respectively. | |
| | + | Hypothetical expenses are based on the Fund’s actual annualized net expense ratios and an assumed rate of return of 5% per year before expenses. | |
24
GOLDMAN SACHS VARIABLE INSURANCE TRUST LARGE CAP VALUE FUND
Trustees and Officers (Unaudited)
Independent Trustees
| | | | | | | | | | | | |
| | | | | |
Name,
Address and Age1 | | Position(s) Held
with the Trust | | Term of Office and
Length of
Time Served2 | | Principal Occupation(s) During Past 5 Years | | Number of
Portfolios in
Fund Complex
Overseen by
Trustee3 | | | Other Directorships Held by Trustee4 |
Ashok N. Bakhru Age: 72 | | Chairman of the Board of Trustees | | Since 1996 (Trustee since 1991) | | Mr. Bakhru is retired. He was formerly Director, Apollo Investment Corporation (a business development company) (2008-2013); President, ABN Associates (a management and financial consulting firm) (1994-1996 and 1998-2012); Trustee, Scholarship America (1998-2005); Trustee, Institute for Higher Education Policy (2003-2008); Director, Private Equity Investors — III and IV (1998-2007), and Equity-Linked Investors II (April 2002-2007). Chairman of the Board of Trustees — Goldman Sachs Fund Complex. | | | 128 | | | None |
John P. Coblentz, Jr. Age: 73 | | Trustee | | Since 2003 | | Mr. Coblentz is retired. Formerly, he was Partner, Deloitte & Touche LLP (1975-2003); Director, Emerging Markets Group, Ltd. (2004-2006); and Director, Elderhostel, Inc. (2006-2012). Trustee — Goldman Sachs Fund Complex. | | | 128 | | | None |
Diana M. Daniels Age: 65 | | Trustee | | Since 2007 | | Ms. Daniels is retired. Formerly, she was Vice President, General Counsel and Secretary, The Washington Post Company (1991-2006). Ms. Daniels serves as a Presidential Councillor of Cornell University (2013-Present); Member, Advisory Board, Psychology Without Borders (international humanitarian aid organization) (2007-Present), and former Member of the Legal Advisory Board, New York Stock Exchange (2003-2006) and of the Corporate Advisory Board, Standish Mellon Management Advisors (2006-2007). Trustee — Goldman Sachs Fund Complex. | | | 108 | | | None |
Joseph P. LoRusso Age: 57 | | Trustee | | Since 2010 | | Mr. LoRusso is retired. Formerly, he was President, Fidelity Investments Institutional Services Co. (“FIIS”) (2002-2008); Director, FIIS (2002-2008); Director, Fidelity Investments Institutional Operations Company (2003-2007); Executive Officer, Fidelity Distributors Corporation (2007-2008). Trustee — Goldman Sachs Fund Complex. | | | 108 | | | None |
Herbert J. Markley Age: 64 | | Trustee | | Since 2013 | | Mr. Markley is retired. Formerly, he was Executive Vice President, Deere & Company (an agricultural and construction equipment manufacturer) (2007-2009), and President, Agricultural Division, Deere & Company (2001-2007). Trustee — Goldman Sachs Fund Complex. | | | 108 | | | None |
Jessica Palmer Age: 65 | | Trustee | | Since 2007 | | Ms. Palmer is retired. She is Director, Emerson Center for the Arts and Culture (2011-Present); and was formerly a Consultant, Citigroup Human Resources Department (2007-2008); Managing Director, Citigroup Corporate and Investment Banking (previously, Salomon Smith Barney/Salomon Brothers) (1984-2006). Ms. Palmer was a Member of the Board of Trustees of Indian Mountain School (private elementary and secondary school) (2004-2009). Trustee — Goldman Sachs Fund Complex. | | | 108 | | | None |
Richard P. Strubel Age: 75 | | Trustee | | Since 1987 | | Mr. Strubel is retired. Formerly, he was Director, Cardean Learning Group (provider of educational services via the internet) (2003-2008); and Director, Gildan Activewear Inc. (a clothing marketing and manufacturing company) (2000-2014). He serves as Trustee, Emeritus, The University of Chicago (1987-Present). Trustee — Goldman Sachs Fund Complex. | | | 128 | | | The Northern Trust Mutual Fund Complex (56 Portfolios) (Chairman of the Board of Trustees) |
| | | | | | | | | | | | |
25
GOLDMAN SACHS VARIABLE INSURANCE TRUST LARGE CAP VALUE FUND
Trustees and Officers (Unaudited) (continued)
Independent Trustees (continued)
| | | | | | | | | | | | |
| | | | | |
Name,
Address and Age1 | | Position(s) Held
with the Trust | | Term of Office and
Length of
Time Served2 | | Principal Occupation(s) During Past 5 Years | | Number of
Portfolios in
Fund Complex
Overseen by
Trustee3 | | | Other Directorships Held by Trustee4 |
Roy W. Templin Age: 54 | | Trustee | | Since 2013 | | Mr. Templin is retired. He is Chairman of the Board of Directors, Con-Way Incorporated (2012-Present); and was formerly Executive Vice President and Chief Financial Officer, Whirlpool Corporation (an appliance manufacturer and marketer) (2004-2012). Trustee — Goldman Sachs Fund Complex. | | | 108 | | | Con-Way Incorporated (a transportation, supply-chain management and logistics services company) |
| | | | | | | | | | | | |
Interested Trustees*
| | | | | | | | | | | | |
| | | | | |
Name,
Address and Age1 | | Position(s) Held
with the Trust | | Term of Office and
Length of
Time Served2 | | Principal Occupation(s) During Past 5 Years | | Number of
Portfolios in
Fund Complex
Overseen by
Trustee3 | | | Other Directorships Held by Trustee4 |
James A. McNamara Age: 52 | | President and Trustee | | Since 2007 | | Managing Director, Goldman Sachs (December 1998-Present); Director of Institutional Fund Sales, GSAM (April 1998-December 2000); and Senior Vice President and Manager, Dreyfus Institutional Service Corporation (January 1993- April 1998). President — Goldman Sachs Fund Complex (November 2007-Present); Senior Vice President — Goldman Sachs Fund Complex (May 2007-November 2007); and Vice President — Goldman Sachs Fund Complex (2001-2007). Trustee — Goldman Sachs Fund Complex (November 2007-Present and December 2002-May 2004). | | | 127 | | | None |
Alan A. Shuch Age: 65 | | Trustee | | Since 1990 | | Advisory Director — GSAM (May 1999-Present); Consultant to GSAM (December 1994-May 1999); and Limited Partner, Goldman Sachs (December 1994-May 1999). Trustee — Goldman Sachs Fund Complex. | | | 108 | | | None |
| | | | | | | | | | | | |
| * | These persons are considered to be “Interested Trustees” because they hold positions with Goldman Sachs and own securities issued by The Goldman Sachs Group, Inc. Each Interested Trustee holds comparable positions with certain other companies of which Goldman Sachs, GSAM or an affiliate thereof is the investment adviser, administrator and/or distributor. |
| 1 | Each Trustee may be contacted by writing to the Trustee, c/o Goldman Sachs, 200 West Street, New York, New York, 10282, Attn: Caroline Kraus. Information is provided as of December 31, 2014. |
| 2 | Each Trustee holds office for an indefinite term until the earliest of: (a) the election of his or her successor; (b) the date the Trustee resigns or is removed by the Board of Trustees or shareholders, in accordance with the Trust’s Declaration of Trust; (c) December 31st of the year in which the Trustee turns 74 years of age, subject to waiver by a majority of the Trustees (in accordance with the current resolutions of the Board of Trustees, which may be changed by the Trustees without shareholder vote); or (d) the termination of the Trust. By resolution of the Board of Trustees determining that an extension of service would be beneficial to the Trust, the retirement age has been extended with respect to Richard P. Strubel. |
| 3 | The Goldman Sachs Fund Complex consists of the Trust and Goldman Sachs Trust (“GST”). As of December 31, 2014, the Trust consisted of 14 portfolios and GST consisted of 94 portfolios (88 of which offered shares to the public). The Goldman Sachs Fund Complex also includes, with respect to Messrs. Bakhru, Coblentz and Strubel, Goldman Sachs Trust II (“GSTII”), Goldman Sachs BDC, Inc. (“GSBDC”), Goldman Sachs MLP Income Opportunities Fund (“GSMLP”), Goldman Sachs MLP and Energy Renaissance Fund (“GSMER”) and Goldman Sachs ETF Trust (“GSETF”) and with respect to Mr. McNamara, GSTII, GSMLP, GSMER and GSETF. GSTII consisted of 6 portfolios (one of which offered shares to the public). GSBDC, GSMLP and GSMER each consisted of one portfolio. GSETF consisted of 11 portfolios (none of which offered shares to the public). As of December 31, 2014, GSBDC had not offered shares to the public. |
| 4 | This column includes only directorships of companies required to report to the Securities and Exchange Commission under the Securities Exchange Act of 1934 (i.e., “public companies”) or other investment companies registered under the Act. |
Additional information about the Trustees is available in the Fund’s Statement of Additional Information, which can be obtained from Goldman Sachs free of charge by calling this toll-free number (in the United States of America): 1-800-292-4726.
26
GOLDMAN SACHS VARIABLE INSURANCE TRUST LARGE CAP VALUE FUND
Trustees and Officers (Unaudited) (continued)
Officers of the Trust*
| | | | | | |
| | | |
Name, Address and Age1 | | Position(s) Held With the Trust | | Term of
Office and
Length of
Time Served2 | | Principal Occupation(s) During Past 5 Years |
James A. McNamara
200 West Street New York, NY 10282 Age: 52 | | President and Trustee | | Since 2007 | | Managing Director, Goldman Sachs (December 1998-Present); Director of Institutional Fund Sales, GSAM (April 1998-December 2000); and Senior Vice President and Manager, Dreyfus Institutional Service Corporation (January 1993-April 1998). President — Goldman Sachs Fund Complex (November 2007-Present); Senior Vice President — Goldman Sachs Fund Complex (May 2007-November 2007); and Vice President — Goldman Sachs Fund Complex (2001-2007). Trustee — Goldman Sachs Fund Complex (November 2007-Present and December 2002-May 2004). |
Caroline L. Kraus
200 West Street New York, NY 10282 Age: 37 | | Secretary | | Since 2012 | | Vice President, Goldman Sachs (August 2006-Present); Associate General Counsel, Goldman Sachs (2012-Present); Assistant General Counsel, Goldman Sachs (August 2006-December 2011) and Associate, Weil, Gotshal & Manges, LLP (2002-2006). Secretary — Goldman Sachs Fund Complex (August 2012-Present) and Assistant Secretary — Goldman Sachs Fund Complex (June 2012-August 2012). |
Scott M. McHugh
200 West Street New York, NY 10282 Age: 43 | | Principal Financial
Officer, Senior Vice
President and
Treasurer | | Since 2009
(Principal
Financial
Officer since
2013) | | Vice President, Goldman Sachs (February 2007-Present); Assistant Treasurer of certain mutual funds administered by DWS Scudder (2005-2007); and Director (2005-2007), Vice President (2000-2005) and Assistant Vice President (1998-2000), Deutsche Asset Management or its predecessor (1998-2007). Principal Financial Officer — Goldman Sachs Fund Complex (November 2013-Present); Treasurer — Goldman Sachs Fund Complex (October 2009-Present); Senior Vice President — Goldman Sachs Fund Complex (November 2009-Present); and Assistant Treasurer — Goldman Sachs Fund Complex (May 2007-October 2009). |
| | | | | | |
| * | Represents a partial list of officers of the Trust. Additional information about all the officers is available in the Fund’s Statement of Additional Information, which can be obtained from Goldman Sachs free of charge by calling this toll-free number (in the United States): 1-800-292-4726. |
| 1 | Information is provided as of December 31, 2014. |
| 2 | Officers hold office at the pleasure of the Board of Trustees or until their successors are duly elected and qualified. Each officer holds comparable positions with certain other companies of which Goldman Sachs, GSAM or an affiliate thereof is the investment adviser, administrator and/or distributor. |
27
GOLDMAN SACHS VARIABLE INSURANCE TRUST LARGE CAP VALUE FUND
Goldman Sachs Variable Insurance Trust — Tax Information (Unaudited)
For the year ended December 31, 2014, 25.19% of the dividends paid from net investment company taxable income by the Large Cap Value Fund qualify for the dividends received deduction available to corporations.
Pursuant to Section 852 of the Internal Revenue Code, the Large Cap Value Fund designates $119,765,836 or, if different, the maximum amount allowable, as capital gain dividends paid during the fiscal year ended December 31, 2014.
28
| | |
| TRUSTEES | | OFFICERS |
| Ashok N. Bakhru, Chairman | | James A. McNamara, President |
| John P. Coblentz, Jr. | | Scott M. McHugh, Principal Financial Officer |
| Diana M. Daniels | | and Treasurer |
| Joseph P. LoRusso | | Caroline L. Kraus, Secretary |
| Herbert J. Markley | | |
| James A. McNamara | | |
| Jessica Palmer | | |
| Alan A. Shuch | | |
| Richard P. Strubel | | |
| Roy W. Templin | | |
GOLDMAN, SACHS & CO.
Distributor and Transfer Agent
GOLDMAN SACHS ASSET MANAGEMENT, L.P.
Investment Adviser
200 West Street, New York
New York 10282
Visit our web site at www.GSAMFUNDS.com to obtain the most recent month-end returns.
The reports concerning the Fund included in this shareholder report may contain certain forward-looking statements about the factors that may affect the performance of the Fund in the future. These statements are based on Fund management’s predictions and expectations concerning certain future events and their expected impact on the Fund, such as performance of the economy as a whole and of specific industry sectors, changes in the levels of interest rates, the impact of developing world events, and other factors that may influence the future performance of the Fund. Management believes these forward-looking statements to be reasonable, although they are inherently uncertain and difficult to predict. Actual events may cause adjustments in portfolio management strategies from those currently expected to be employed.
A description of the policies and procedures that the Fund uses to determine how to vote proxies relating to portfolio securities and information regarding how the Fund voted proxies relating to portfolio securities for the 12-month period ended June 30 is available (i) without charge, upon request by calling 1-800-621-2550; and (ii) on the Securities and Exchange Commission (“SEC”) web site at http://www.sec.gov.
The Fund files its complete schedule of portfolio holdings with the SEC for the first and third quarters of each fiscal year on Form N-Q. The Fund’s Form N-Qs are available on the SEC’s web site at http://www.sec.gov within 60 days after the Fund’s first and third fiscal quarters. The Fund’s Form N-Qs may be reviewed and copied at the SEC’s Public Reference Room in Washington, D.C. and information on the operation of the Public Reference Room may also be obtained by calling 1-800-SEC-0330. Form N-Qs may be obtained upon request and without charge by calling 1-800-621-2550.
The website links provided are for your convenience only and are not an endorsement or recommendation by GSAM of any of these websites or the products or services offered. GSAM is not responsible for the accuracy and validity of the content of these websites.
Fund holdings and allocations shown are as of December 31, 2014 and may not be representative of future investments. Fund holdings should not be relied on in making investment decisions and should not be construed as research or investment advice regarding particular securities. Current and future holdings are subject to risk.
The Global Industry Classification Standard (“GICS”) was developed by and is the exclusive property and a service mark of Morgan Stanley Capital International Inc. (“MSCI”) and Standard & Poor’s, a division of The McGraw-Hill Companies, Inc. (“S&P”) and is licensed for use by Goldman Sachs. Neither MSCI, S&P nor any other party involved in making or compiling the GICS or any GICS classifications makes any express or implied warranties or representations with respect to such standard or classification (or the results to be obtained by the use thereof), and all such parties hereby expressly disclaim all warranties of originality, accuracy, completeness, merchantability or fitness for a particular purpose with respect to any of such standard or classification. Without limiting any of the foregoing, in no event shall MSCI, S&P, any of their affiliates or any third party involved in making or compiling the GICS or any GICS classifications have any liability for any direct, indirect, special, punitive, consequential or any other damages (including lost profits) even if notified of the possibility of such damages.
The portfolio risk management process includes an effort to monitor and manage risk, but does not imply low risk.
Shares of the Goldman Sachs VIT Funds are offered to separate accounts of participating life insurance companies for the purpose of funding variable annuity contracts and variable life insurance policies. Shares of the Fund are not offered directly to the general public. The variable annuity contracts and variable life insurance policies are described in the separate prospectuses issued by participating insurance companies. You should refer to those prospectuses for information about surrender charges, mortality and expense risk fees and other charges that may be assessed by participating insurance companies under the variable annuity contracts or variable life insurance policies. Such fees or charges, if any, may affect the return you may realize with respect to your investments. Ask your representative for more complete information. Please consider a fund’s objectives, risks and charges and expenses, and read the prospectus carefully before investing. The prospectus contains this and other information about the Fund.
This material is not authorized for distribution to prospective investors unless preceded or accompanied by a current Prospectus or summary prospectus, if applicable. Investors should consider a Fund’s objective, risks, and charges and expenses, and read the summary prospectus, if available, and/or the Prospectus carefully before investing or sending money. The summary prospectus, if available, and the Prospectus contain this and other information about a Fund and may be obtained from your Authorized Institution or from Goldman, Sachs & Co. by calling 1-800-621-2550.
This report is prepared for the general information of contract owners and is not an offer of shares of the Goldman Sachs Variable Insurance Trust: Goldman Sachs Large Cap Value Fund.
© 2015 Goldman Sachs. All rights reserved.
VITLCVAR-15/154001.MF.MED.TMPL/2/2015
Goldman
Sachs Variable Insurance Trust
Goldman Sachs
Mid Cap Value Fund
Annual Report
December 31, 2014
GOLDMAN SACHS VARIABLE INSURANCE TRUST MID CAP VALUE FUND
Principal Investment Strategies and Risks
This is not a complete list of risks that may affect the Fund. For additional information concerning the risks applicable to the Fund, please see the Fund’s Prospectuses.
Shares of the Goldman Sachs Variable Insurance Trust — Goldman Sachs Mid Cap Value Fund are offered to separate accounts of participating life insurance companies for the purpose of funding variable annuity contracts and variable life insurance policies. Shares of the Fund are not offered directly to the general public. The variable annuity contracts and variable life insurance policies are described in the separate prospectuses issued by participating insurance companies. You should refer to those prospectuses for information about surrender charges, mortality and expense risk fees and other charges that may be assessed by participating insurance companies under the variable annuity contracts or variable life insurance policies. Such fees or charges, if any, may affect the return you realize with respect to your investments. Ask your representative for more complete information. Please consider the Fund’s objective, risks and charges and expenses, and read the Prospectus carefully before investing. The Prospectus contains this and other information about the Fund.
The Goldman Sachs Mid Cap Value Fund invests primarily in mid-capitalization U.S. equity investments. The Fund’s equity investments are subject to market risk, which means that the value of the securities in which it invests may go up or down in response to the prospects of individual companies, particular sectors and/or general economic conditions. The securities of mid- and small-capitalization companies involve greater risks than those associated with larger, more established companies and may be subject to more abrupt or erratic price movements. Different investment styles (e.g., “value”) tend to shift in and out of favor, and at times the Fund may underperform other funds that invest in similar asset classes.
1
GOLDMAN SACHS VARIABLE INSURANCE TRUST MID CAP VALUE FUND
INVESTMENT OBJECTIVE
The Fund seeks long-term capital appreciation.
Portfolio Management Discussion and Analysis
Below, the Goldman Sachs Value Investment Team discusses the Goldman Sachs Variable Insurance Trust — Goldman Sachs Mid Cap Value Fund’s (the “Fund”) performance and positioning for the 12-month period ended December 31, 2014 (the “Reporting Period”).
How did the Fund perform during the Reporting Period?
During the Reporting Period, the Fund’s Institutional and Service Shares generated average annual total returns of 13.57% and 13.29%, respectively. These returns compare to the 14.75% average annual total return of the Fund’s benchmark, the Russell Midcap® Value Index (with dividends reinvested) (the “Russell Index”), during the same time period.
What economic and market factors most influenced the equity markets as a whole during the Reporting Period?
Representing the U.S. equity market, the S&P 500® Index gave back 0.25% in December 2014, but finished the fourth calendar quarter up 4.93% and gained 13.69% during the Reporting Period as a whole, as it posted its third consecutive year of broad double-digit gains.
Diverging global economies, strong merger and acquisition activity, weakening oil prices and declining U.S. interest rates were major themes affecting U.S. equities throughout 2014. The U.S. economic recovery accelerated through the Reporting Period, particularly compared to other major developed markets, which helped fuel U.S. corporate earnings growth and strong U.S. equity returns. Furthermore, the decline in unemployment to 5.8% and lower energy prices gave new hope to the potential for a broader consumer recovery. U.S. equity market volatility picked up during the second half of 2014 from exceptionally low levels mid-year, but the S&P 500® Index had no more than three consecutive down days during 2014, a feat not seen since 1928.
For the Reporting Period overall, nine of the ten sectors within the S&P 500® Index were up. Merger and acquisition activity rose to its highest annual level since 2007 largely due to transactions within the information technology and health care sectors, which handily outperformed the broader market. The top-weighted information technology sector was also the largest positive contributor (weight times performance) to S&P 500® Index returns. Given the unexpected decline in U.S. interest rates, real estate investment trusts (“REITs”) and the utilities sector also outperformed the broader market during the Reporting Period. Conversely, the energy sector underperformed most during 2014, as concerns over rising U.S. supply and weakening global demand triggered a collapse in U.S. and global crude oil prices. Telecommunication services also performed poorly during the year as aggressive competition, including price wars aimed at luring customers, and market saturation put growth pressures on the sector, especially on the wireless side.
All segments of the U.S. equity market advanced during the Reporting Period, with large-cap and mid-cap stocks, as measured by the Russell 1000® Index and the Russell Midcap® Index, respectively, gaining most and almost exactly in line with each other. Following at some distance were small-cap stocks, as measured by the Russell 2000® Index. Large-cap stocks were most successful relative to small-caps in the information technology sector. From a style perspective, value-oriented stocks outpaced growth-oriented stocks in the large-cap and mid-cap segments of the U.S. equity market, but growth-oriented stocks outperformed value-oriented stocks in the small-cap segment of the U.S. equity market. (All as measured by the Russell Investments indices.)
What key factors were responsible for the Fund’s performance during the Reporting Period?
Overall, the Fund produced solid absolute double-digit gains, but underperformed the Russell Index on a relative basis. Sector allocation and stock selection impacted the Fund’s performance relative to the Russell Index during the Reporting Period.
Which equity market sectors most significantly affected Fund performance?
Detracting from the Fund’s relative results most was stock selection in the utilities, industrials and financials sectors, where company-specific issues weighed on certain holdings. Having an overweighted allocation in consumer discretionary hurt as well. Such detractors were only partially offset by effective stock selection in the consumer staples, materials and information technology sectors, which helped the Fund’s performance relative to the Russell Index. Having an overweighted allocation to consumer staples and an underweighted exposure to materials also boosted the Fund’s relative results.
2
GOLDMAN SACHS VARIABLE INSURANCE TRUST MID CAP VALUE FUND
Which stocks detracted significantly from the Fund’s performance during the Reporting Period?
Detracting from the Fund’s results relative to its benchmark index were positions in Southwestern Energy, Triumph Group and QEP Resources.
Southwestern Energy, an oil and natural gas exploration and production company, saw its shares decline primarily as a reflection of persistent weakness in natural gas prices. In the last months of 2014, Southwestern Energy closed its previously announced acquisition of Marcellus and Utica shale assets from Chesapeake Energy and announced a $1 billion share buyback program. At the end of the Reporting Period, we continued to believe that Southwestern Energy has an underappreciated resource base, specifically in the Marcellus and Fayetteville shales. We also believe its newly acquired assets further enhance the company’s position and growth opportunities. Additionally, we remained positive on the company’s operational leverage to higher natural gas prices and encouraged by its management team’s commitment to disciplined growth, cost reductions and shareholder returns.
Triumph Group designs, manufactures and services products for the aerospace industry. Its shares were under pressure throughout the year due to execution challenges on its 747-8 program, a lackluster growth environment, and timing of anticipated margin improvements. Despite its underperformance in 2014, we anticipate an improvement in demand for Triumph Group’s products in 2015 and remain positive regarding its management’s ability to meet expectations. At the end of the Reporting Period, we also remained confident in its management’s ability to achieve significant synergies from the acquisitions the company completed in 2014, which we believe may drive long-term shareholder value.
QEP Resources, an oil and natural gas exploration and production company, beat consensus earnings estimates, but its shares declined as a result of weaker energy prices, especially in the latter months of the Reporting Period. We initiated a position in QEP Resources during the Reporting Period given our positive outlook on its management’s decision to sell the remaining part of its midstream business in 2014. We believed the cash received from the company’s sale of its midstream business would improve its balance sheet and enable it to fund profitable exploration and production initiatives. While we continue to have a positive long-term outlook on QEP Resources, we exited the position by the end of the Reporting Period in an effort to reduce the portfolio’s exposure to oil, and we reallocated the proceeds into a higher conviction name.
What were some of the Fund’s best-performing individual stocks?
The Fund benefited most relative to the Russell Index from positions in Keurig Green Mountain, Kroger and UnitedContinental Holdings.
Specialty coffee and coffeemaker company Keurig Green Mountain was the top contributor to the Fund’s performance during the Reporting Period. Its shares rose following the announcement that Coca-Cola purchased a 10% stake in the company and entered into a 10-year agreement to develop Coke brand products for the Keurig Cold beverage system. The company also benefited from exposure to the Starbucks, Dunkin, Folgers and Costco brands. Further, shareholders approved the company’s official name change to Keurig Green Mountain from Green Mountain Coffee Roasters, recognizing the value that Keurig has brought to the overall franchise and creating a powerful corporate identity. Following the stock’s strong performance, we sold the Fund’s position in Keurig Green Mountain during the Reporting Period, taking profits.
Supermarket and convenience store operator Kroger, a new purchase for the Fund during the Reporting Period, saw its shares rise during the first quarter of 2014 as the firm completed its merger with Harris Teeter Supermarkets and reported positive fourth quarter 2013 results driven primarily by strong execution. Same store sales were better than expected in a rather challenging consumer environment. The grocery store chain subsequently reported positive first quarter 2014 results and raised its full year 2014 guidance beyond consensus expectations, which helped to drive its shares higher. Strong quarterly earnings driven by solid execution helped the company maintain its positive momentum throughout the year. In our view, Kroger has consistently been able to gain market share driven by a focus on low prices, high convenience and healthy choices. At the end of the Reporting Period, its margins appear to have stabilized and we believe may begin to expand following many years of investment that Kroger made in an effort to improve its competitive positioning. We also believe the company’s acquisition of Harris Teeter Supermarkets could provide synergies and boost its earnings per share over the next two to three years. Further industry consolidation could be beneficial for the company due to its strong market share and stable cash flows.
Shares of airline parent company UnitedContinental Holdings rose following the announcement of better than expected third quarter earnings. The company was able to record its highest quarterly profit in its history, highlighting the continued success of its cost-cutting initiatives. The company’s strong performance was supported on the cost side by lower jet fuel costs as oil prices declined. At the end of the Reporting Period, we believed UnitedContinental Holdings would likely continue to benefit from an improving economy with accelerating demand for air travel. We believe that this, combined with flat to modest cost growth, may
3
GOLDMAN SACHS VARIABLE INSURANCE TRUST MID CAP VALUE FUND
well result in earnings growth and free cash flow generation. In our view, the company has a strong management team committed to returning capital to shareholders.
How did the Fund use derivatives and similar instruments during the Reporting Period?
During the Reporting Period, we did not use derivatives as part of an active management strategy.
Did the Fund make any significant purchases or sales during the Reporting Period?
In addition to the purchases mentioned earlier, we initiated a Fund position in Cigna, a global health maintenance organization (“HMO”). In our view, shares of Cigna were trading at a discount to many of its peers at the time of purchase. However, we anticipated this gap may narrow because the business appeared to be performing well after facing challenges at the end of 2013. We also became more bullish on the company’s Medicare Advantage opportunity, which we believe could potentially boost earnings per share going forward. In our view, the potential for capital deployment in the form of share repurchases, dividends and/or acquisition activity could also be a positive catalyst for the stock.
We established a Fund position in international specialty retailer Gap. We believe its shares were attractively valued at the time of purchase and have room to increase in value over the long term for a number of reasons. First, we are positive on Gap’s long-term growth potential given its large international expansion opportunity. Over the next three years, the company plans to open 1,000 company-owned and franchised stores, which should, in our view, fuel healthy square footage and sales growth. Second, we believe Gap has a strong e-commerce platform that has a long runway for growth, which should incrementally benefit margins as market share grows. Third, we believe supply chain initiatives the company is currently implementing are largely underappreciated by the market and could potentially yield meaningful margin improvement over the next few years. Lastly, we believe Gap is a high quality business led by a strong management team committed to increasing shareholder value. Over the last five years, Gap has returned more than $8 billion to shareholders through a combination of share repurchases and dividends.
In addition to sales already mentioned, we exited the Fund’s position in health care benefits provider Aetna following strong 2013 and early 2014 performance. We exited the position because we saw a better risk/reward in owning Cigna.
We sold the Fund’s position in Agilent Technologies, which provides core bio-analytical and electronic measurement solutions to the communications, electronics, life sciences and chemical analysis industries. While we were optimistic about the company’s health care business, we exited the position due to its exposure to energy end-markets, which we felt may lead to increased downside risk potential.
Were there any notable changes in the Fund’s weightings during the Reporting Period?
In constructing the Fund’s portfolio, we focus on picking stocks rather than on making industry or sector bets. We seek to outpace the benchmark index by overweighting stocks that we expect to outperform and underweighting those that we think may lag. Consequently, changes in its sector weights are generally the direct result of individual stock selection or of stock appreciation or depreciation. That said, during the Reporting Period, the Fund’s exposure to consumer staples increased compared to the Russell Index. The Fund’s position in cash also increased during the Reporting Period. The Fund’s allocations compared to the benchmark index in financials, health care and industrials decreased.
How was the Fund positioned relative to its benchmark index at the end of the Reporting Period?
At the end of December 2014, the Fund had overweighted positions relative to the Russell Index in the consumer discretionary, consumer staples and information technology sectors. On the same date, the Fund had underweighted positions compared to the Russell Index in financials, utilities and materials and was rather neutrally weighted to the Russell Index in energy, health care and industrials. The Fund had no exposure to telecommunication services at the end of the Reporting Period.
Were there any changes to the Fund’s portfolio management team during the Reporting Period?
Michael Ho, a Vice President and sector portfolio manager on the Goldman Sachs U.S. Value Equity Team, left the firm. Mike had sector portfolio management responsibilities in the consumer staples and materials sectors in our Large and Mid Cap Value strategies and in half of industrials in our Mid Cap Value strategy. Charles “Brook” Dane assumed research and portfolio management responsibilities for the consumer staples sector in the Large Cap Value strategies. Brook has 22 years of experience, joined the Value Team in 2010, and currently has portfolio management responsibility for the technology sector within the Large Cap Value strategies. Eric Fogarty assumed research and portfolio management responsibilities for the consumer staples sector in the Mid Cap Value strategy. Eric joined the U.S. Value Equity Team as an analyst in 2007, was promoted to portfolio manager in 2012 and has 20 years of industry experience. Currently, Eric has portfolio management responsibility for the utilities sector across
4
GOLDMAN SACHS VARIABLE INSURANCE TRUST MID CAP VALUE FUND
our Value strategies. As part of our ongoing commitment to identifying investment talent, we are initiating a search for an experienced Portfolio Manager with expertise in the materials sector for both the Large and Mid Cap Value strategies. In the interim, Andy Braun, Co-CIO of the Value Team, will provide oversight for this sector. Andy has had prior investing experience in the materials sector throughout his career and will be supported by dedicated research analysts. David Deuchler assumed research and portfolio management responsibilities for the entire industrials sector in the Mid Cap Value strategy. David served as a research analyst on the Value Team from 2000-2005 and spent seven years in the hedge fund industry before rejoining in June 2013. Currently, David has portfolio management responsibility for Mid, Small/Mid and Small Cap health care as well as half of industrials in Mid Cap Value. The U.S. Value Equity strategies continue to be led by Co-CIOs Sean Gallagher and Andy Braun. The team consists of 14 portfolio managers, averaging 20 years of experience, and is supported by more than 10 research analysts.
What is the Fund’s tactical view and strategy for the months ahead?
At the end of the Reporting Period, we believed U.S. equities had further upside should the U.S. economy accelerate. We believe real earnings growth may well serve as a fundamental driver of performance going forward. We believe U.S. corporate fundamentals are strong, evidenced by both healthy balance sheets and earnings resilience, and should provide companies with a number of options to increase shareholder value. While we acknowledge the potential for headwinds remains, such as geopolitical risks, we ultimately remain constructive on the direction of U.S. equity markets. We believe the U.S. has the best macroeconomic outlook of the developed economies, and we are optimistic on the strengthening U.S. housing and employment markets as well as on the potential for a continued recovery in consumer spending. Consumption, which accounts for approximately 70% of U.S. Gross Domestic Product (“GDP”), could benefit from the combination of low energy prices and a strong U.S. dollar. Furthermore, with strong GDP growth momentum from 2014, we believe an acceleration in earnings growth could continue in the U.S., as the country is less exposed to weaker segments of the global economy given its lower reliance on exports.
Looking forward, we believe that should the U.S. economy continue to improve, companies may reinvest for future growth by increasing capital expenditures, research and development, hiring, and merger and acquisition activity rather than keeping excess cash on balance sheets. From a valuation perspective, we believe U.S. equities remained, at the end of the Reporting Period, fairly valued considering the positive macro environment and inexpensive relative to fixed income. We believe a forward-looking analysis is critical in this investing environment, and we believe stock selection will be increasingly important as companies differentiate themselves on earnings growth and valuation.
Regardless of market direction, our fundamental, bottom-up stock selection continues to drive our process, rather than headlines or sentiment. We maintain high conviction in the companies the Fund owns and believe they have the potential to outperform relative to the broader market regardless of economic growth conditions. We continue to focus on undervalued companies that we believe have comparatively greater control of their own destiny, such as innovators with differentiated products, companies with low cost structures or companies that have been investing in their own businesses and may be poised to gain market share. We maintain our discipline in identifying companies with what we believe to be strong or improving balance sheets, led by quality management teams and trading at discounted valuations. We remain focused on the long-term performance of the Fund.
5
GOLDMAN SACHS VARIABLE INSURANCE TRUST MID CAP VALUE FUND
Index Definitions
The Russell Midcap® Index measures the performance of the mid-cap segment of the U.S. equity universe. The Russell Midcap® Index is a subset of the Russell 1000® Index. The Russell Midcap® Index includes approximately 800 of the smallest securities based on a combination of their market cap and current index membership. The Russell Midcap® Index represents approximately 31% of the total market capitalization of the Russell 1000® Index companies. The Russell Midcap® Index is constructed to provide a comprehensive and unbiased barometer for the mid-cap segment. The Russell Midcap® Index is completely reconstituted annually to ensure larger stocks do not distort the performance and characteristics of the true mid-cap opportunity set.
The Russell 1000® Index measures the performance of the large-cap segment of the U.S. equity universe. The Russell 1000® Index is a subset of the Russell 3000® Index and includes approximately 1000 of the largest securities based on a combination of their market cap and current index membership. The Russell 1000® Index represents approximately 92% of the U.S. market. The Russell 1000® Index is constructed to provide a comprehensive and unbiased barometer for the large-cap segment and is completely reconstituted annually to ensure new and growing equities are reflected.
The Russell 2000® Index measures the performance of the small-cap segment of the U.S. equity universe. The Russell 2000® Index is a subset of the Russell 3000® Index representing approximately 10% of the total market capitalization of that index. The Russell 2000® Index includes approximately 2000 of the smallest securities based on a combination of their market cap and current index membership. The Russell 2000® Index is constructed to provide a comprehensive and unbiased small-cap barometer and is completely reconstituted annually to ensure larger stocks do not distort the performance and characteristics of the true small-cap opportunity set.
The S&P 500® Index is the Standard & Poor’s 500 Composite Index of 500 stocks, an unmanaged index of common stock prices.
All index figures do not reflect any deduction for fees, expenses or taxes. It is not possible to invest directly in an unmanaged index.
6
FUND BASICS
Mid Cap Value Fund
as of December 31, 2014
STANDARDIZED TOTAL RETURNS1
| | | | | | | | | | | | | | | | | | |
| For the period ended 12/31/14 | | One Year | | | Five Years | | | Ten Years | | | Since Inception | | | Inception Date |
| Institutional | | | 13.57 | % | | | 15.90 | % | | | 9.02 | % | | | 9.57 | % | | 5/01/98 |
| Service | | | 13.29 | | | | 15.62 | | | | N/A | | | | 8.07 | | | 1/09/06 |
| 1 | The Standardized Total Returns are average annual total returns as of the most recent calendar quarter-end. They assume reinvestment of all distributions at net asset value. Because Institutional Shares and Service Shares do not involve a sales charge, such a charge is not applied to their Standardized Total Returns. |
Total return figures in the above chart represent past performance and do not indicate future results, which will vary. The investment return and principal value of an investment will fluctuate and, therefore, an investor’s shares, when redeemed, may be worth more or less than their original cost. Current performance may be lower or higher than the total return figures in the above chart. Please visit www.GSAMFUNDS.com to obtain the most recent month-end returns. Performance reflects fee waivers and/or expense limitations in effect during the periods shown. In their absence, performance would be reduced.
EXPENSE RATIOS2
| | | | | | | | |
| | | Net Expense Ratio (Current) | | | Gross Expense Ratio (Before Waivers) | |
| Institutional | | | 0.83 | % | | | 0.87 | % |
| Service | | | 1.08 | | | | 1.12 | |
| 2 | The expense ratios of the Fund, both current (net of any fee waivers or expense limitations) and before waivers (gross of any fee waivers or expense limitations) are as set forth above. Pursuant to a contractual arrangement, the Fund’s waivers and/or expense limitations will remain in place through at least April 30, 2015 and prior to such date the Investment Adviser may not terminate the arrangements without the approval of the Fund’s Board of Trustees. If these arrangements are discontinued in the future, the expense ratios may change without shareholder approval. |
TOP TEN HOLDINGS AS OF 12/31/143
| | | | | | |
| Holding | | % of Net Assets | | | Line of Business |
| FirstEnergy Corp. | | | 2.1% | | | Utilities |
| Sempra Energy | | | 2.0 | | | Utilities |
| The Gap, Inc. | | | 1.9 | | | Retailing |
| Lincoln National Corp. | | | 1.9 | | | Insurance |
| Cigna Corp. | | | 1.8 | | | Health Care Equipment & Services |
| Principal Financial Group, Inc. | | | 1.6 | | | Insurance |
| Brixmor Property Group, Inc. | | | 1.5 | | | Real Estate Investment Trust |
| Fifth Third Bancorp | | | 1.5 | | | Banks |
| Navient Corp. | | | 1.5 | | | Diversified Financials |
| ConAgra Foods, Inc. | | | 1.5 | | | Food, Beverage & Tobacco |
| 3 | The top 10 holdings may not be representative of the Fund’s future investments. |
7
FUND BASICS
FUND vs. BENCHMARK SECTOR ALLOCATIONS4
As of December 31, 2014
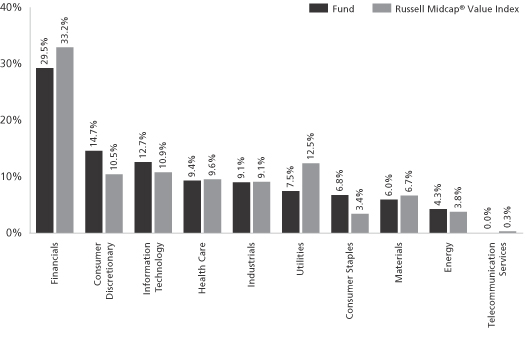
| 4 | The Fund is actively managed and, as such, its composition may differ over time. Consequently, the Fund’s overall sector allocations may differ from percentages contained in the graph above. The graph categorizes investments using Global Industry Classification Standard (“GICS”), however, the sector classifications used by the portfolio management team may differ from GICS. The percentage shown for each investment category reflects the value of investments in that category as a percentage of market value. The graph depicts the Fund’s investments but may not represent the Fund’s market exposure due to the exclusion of certain derivatives, if any, as listed in the Additional Investment Information section of the Schedule of Investments. |
8
GOLDMAN SACHS VARIABLE INSURANCE TRUST MID CAP VALUE FUND
Performance Summary
December 31, 2014
The following graph shows the value, as of December 31, 2014, of a $10,000 investment made on January 1, 2005 in the Institutional Shares at NAV. For comparative purposes, the performance of the Fund’s benchmark, the Russell Midcap Value Index (with distributions reinvested), is shown. This performance data represents past performance and should not be considered indicative of future performance, which will fluctuate with changes in market conditions. These performance fluctuations will cause an investor’s shares, when redeemed, to be worth more or less than their original cost. Performance reflects Fund level expenses but does not reflect fees and expenses associated with any variable annuity contract or variable life insurance policy that uses the Fund as an investment option for any contract or policy. Had performance reflected all of those fees and expenses, performance would have been reduced. Performance reflects applicable fee waivers and/or expense limitations in effect during the periods shown, and in their absence, performance would be reduced. Performance of Service Shares will vary from Institutional Shares due to differences in class specific fees. In addition to the Investment Adviser’s decisions regarding issuer/industry investment selection and allocation, other factors may affect Fund performance. These factors include, but are not limited to, Fund operating fees and expenses, portfolio turnover, and subscription and redemption cash flows affecting the Fund.
Mid Cap Value Fund’s 10 Year Performance
Performance of a $10,000 investment, with distributions reinvested, from January 1, 2005 through December 31, 2014.
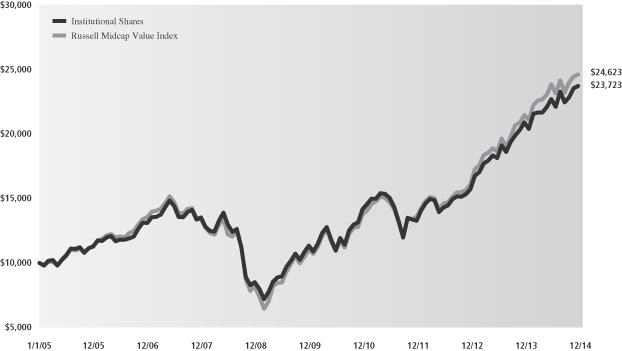
| | | | | | | | |
| Average Annual Total Return through December 31, 2014 | | One Year | | Five Years | | Ten Years | | Since Inception |
Institutional (Commenced May 1, 1998) | | 13.57% | | 15.90% | | 9.02% | | 9.57% |
Service (Commenced January 9, 2006) | | 13.29% | | 15.62% | | N/A | | 8.07% |
9
GOLDMAN SACHS VARIABLE INSURANCE TRUST MID CAP VALUE FUND
Schedule of Investments
December 31, 2014
| | | | | | | | |
| Shares | | | Description | | Value | |
| | Common Stocks – 96.4% | |
| Banks – 5.6% | |
| | 789,298 | | | Fifth Third Bancorp | | $ | 16,081,946 | |
| | 1,473,913 | | | Huntington Bancshares, Inc. | | | 15,505,565 | |
| | 90,582 | | | M&T Bank Corp. | | | 11,378,911 | |
| | 79,131 | | | Signature Bank* | | | 9,967,341 | |
| | 235,781 | | | Zions Bancorporation | | | 6,722,116 | |
| | | | | | | | |
| | | | | | | 59,655,879 | |
| | |
| Capital Goods – 6.0% | |
| | 113,555 | | | Alliant Techsystems, Inc. | | | 13,200,769 | |
| | 160,878 | | | Armstrong World Industries, Inc.* | | | 8,224,083 | |
| | 231,168 | | | Fortune Brands Home & Security, Inc. | | | 10,464,975 | |
| | 268,448 | | | Terex Corp. | | | 7,484,330 | |
| | 274,590 | | | Textron, Inc. | | | 11,562,985 | |
| | 186,853 | | | Triumph Group, Inc. | | | 12,560,259 | |
| | | | | | | | |
| | | | | | | 63,497,401 | |
| | |
| Commercial & Professional Services – 0.4% | |
| | 31,811 | | | The Dun & Bradstreet Corp. | | | 3,847,859 | |
| | |
| Consumer Durables & Apparel – 3.3% | |
| | 64,935 | | | Fossil Group, Inc.* | | | 7,190,902 | |
| | 70,019 | | | Mohawk Industries, Inc.* | | | 10,878,152 | |
| | 53,192 | | | PVH Corp. | | | 6,817,618 | |
| | 294,019 | | | Toll Brothers, Inc.* | | | 10,076,031 | |
| | | | | | | | |
| | | | | | | 34,962,703 | |
| | |
| Consumer Services – 2.3% | |
| | 540,462 | | | MGM Resorts International* | | | 11,555,077 | |
| | 161,997 | | | Starwood Hotels & Resorts Worldwide, Inc. | | | 13,133,097 | |
| | | | | | | | |
| | | | | | | 24,688,174 | |
| | |
| Diversified Financials – 6.9% | |
| | 360,364 | | | Invesco Ltd. | | | 14,241,585 | |
| | 728,456 | | | Navient Corp. | | | 15,741,934 | |
| | 208,648 | | | Raymond James Financial, Inc. | | | 11,953,444 | |
| | 1,210,110 | | | SLM Corp. | | | 12,331,021 | |
| | 185,241 | | | The NASDAQ OMX Group, Inc. | | | 8,884,159 | |
| | 227,927 | | | Voya Financial, Inc. | | | 9,659,546 | |
| | | | | | | | |
| | | | | | | 72,811,689 | |
| | |
| Energy – 4.2% | |
| | 550,258 | | | Chesapeake Energy Corp. | | | 10,768,549 | |
| | 52,069 | | | Cimarex Energy Co. | | | 5,519,314 | |
| | 13,937 | | | Energen Corp. | | | 888,623 | |
| | 64,272 | | | Oil States International, Inc.* | | | 3,142,901 | |
| | 512,686 | | | Southwestern Energy Co.* | | | 13,991,201 | |
| | 129,166 | | | Tesoro Corp. | | | 9,603,492 | |
| | | | | | | | |
| | | | | | | 43,914,080 | |
| | |
| Food & Staples Retailing – 1.8% | |
| | 133,193 | | | The Kroger Co. | | | 8,552,323 | |
| | 198,481 | | | Whole Foods Market, Inc. | | | 10,007,412 | |
| | | | | | | | |
| | | | | | | 18,559,735 | |
| | |
| | Common Stocks – (continued) | |
| Food, Beverage & Tobacco – 3.7% | |
| | 433,305 | | | ConAgra Foods, Inc. | | $ | 15,720,306 | |
| | 108,679 | | | Molson Coors Brewing Co. Class B | | | 8,098,759 | |
| | 380,046 | | | Tyson Foods, Inc. Class A | | | 15,236,044 | |
| | | | | | | | |
| | | | | | | 39,055,109 | |
| | |
| Health Care Equipment & Services – 6.7% | |
| | 440,200 | | | Allscripts Healthcare Solutions, Inc.* | | | 5,621,354 | |
| | 159,116 | | | Cardinal Health, Inc. | | | 12,845,435 | |
| | 179,425 | | | Cigna Corp. | | | 18,464,627 | |
| | 145,877 | | | Envision Healthcare Holdings, Inc.* | | | 5,060,473 | |
| | 131,028 | | | Laboratory Corp. of America Holdings* | | | 14,137,921 | |
| | 126,095 | | | Zimmer Holdings, Inc. | | | 14,301,695 | |
| | | | | | | | |
| | | | | | | 70,431,505 | |
| | |
| Household & Personal Products – 1.1% | |
| | 93,829 | | | Energizer Holdings, Inc. | | | 12,062,656 | |
| | |
| Insurance – 8.7% | |
| | 199,789 | | | Arthur J. Gallagher & Co. | | | 9,406,066 | |
| | 72,536 | | | Everest Re Group Ltd. | | | 12,352,881 | |
| | 359,484 | | | Genworth Financial, Inc. Class A* | | | 3,055,614 | |
| | 352,765 | | | Lincoln National Corp. | | | 20,343,958 | |
| | 330,652 | | | Principal Financial Group, Inc. | | | 17,174,065 | |
| | 205,979 | | | Unum Group | | | 7,184,547 | |
| | 198,178 | | | Validus Holdings Ltd. | | | 8,236,278 | |
| | 399,477 | | | XL Group PLC | | | 13,730,024 | |
| | | | | | | | |
| | | | | | | 91,483,433 | |
| | |
| Materials – 5.8% | |
| | 257,475 | | | Axalta Coating Systems Ltd.* | | | 6,699,499 | |
| | 153,227 | | | Carpenter Technology Corp. | | | 7,546,430 | |
| | 134,351 | | | Celanese Corp. Series A | | | 8,055,686 | |
| | 36,545 | | | CF Industries Holdings, Inc. | | | 9,959,974 | |
| | 135,710 | | | Packaging Corp. of America | | | 10,592,166 | |
| | 77,922 | | | Reliance Steel & Aluminum Co. | | | 4,774,281 | |
| | 96,899 | | | The Valspar Corp. | | | 8,379,826 | |
| | 130,877 | | | TimkenSteel Corp. | | | 4,846,375 | |
| | | | | | | | |
| | | | | | | 60,854,237 | |
| | |
| Media – 3.0% | |
| | 174,670 | | | AMC Networks, Inc. Class A* | | | 11,138,706 | |
| | 24,506 | | | Liberty Broadband Corp. Series A* | | | 1,227,506 | |
| | 52,334 | | | Liberty Broadband Corp. Series C* | | | 2,607,280 | |
| | 100,674 | | | Liberty Media Corp. Series A* | | | 3,550,772 | |
| | 262,811 | | | Liberty Media Corp. Series C Series C* | | | 9,206,269 | |
| | 59,046 | | | Scripps Networks Interactive, Inc. Class A | | | 4,444,392 | |
| | | | | | | | |
| | | | | | | 32,174,925 | |
| | |
| | |
| 10 | | The accompanying notes are an integral part of these financial statements. |
GOLDMAN SACHS VARIABLE INSURANCE TRUST MID CAP VALUE FUND
| | | | | | | | |
| Shares | | | Description | | Value | |
| | Common Stocks – (continued) | |
| Pharmaceuticals, Biotechnology & Life Sciences – 2.4% | |
| | 213,331 | | | Endo International PLC* | | $ | 15,385,432 | |
| | 172,104 | | | Mylan, Inc.* | | | 9,701,502 | |
| | | | | | | | |
| | | | | | | 25,086,934 | |
| | |
| Real Estate Investment Trust – 7.1% | |
| | 87,788 | | | AvalonBay Communities, Inc. | | | 14,343,681 | |
| | 654,940 | | | Brixmor Property Group, Inc. | | | 16,268,710 | |
| | 682,927 | | | DDR Corp. | | | 12,538,540 | |
| | 328,846 | | | RLJ Lodging Trust | | | 11,026,206 | |
| | 581,698 | | | Starwood Property Trust, Inc. | | | 13,518,662 | |
| | 98,805 | | | Taubman Centers, Inc. | | | 7,550,678 | |
| | | | | | | | |
| | | | | | | 75,246,477 | |
| | |
| Retailing – 5.5% | |
| | 71,479 | | | Expedia, Inc. | | | 6,101,447 | |
| | 122,723 | | | GNC Holdings, Inc. Class A | | | 5,763,072 | |
| | 271,921 | | | Liberty Interactive Corp. Series A* | | | 7,999,916 | |
| | 567,000 | | | Staples, Inc. | | | 10,274,040 | |
| | 483,239 | | | The Gap, Inc. | | | 20,349,194 | |
| | 201,299 | | | Urban Outfitters, Inc.* | | | 7,071,634 | |
| | | | | | | | |
| | | | | | | 57,559,303 | |
| | |
| Semiconductors & Semiconductor Equipment – 4.5% | |
| | 262,308 | | | Altera Corp. | | | 9,689,658 | |
| | 126,096 | | | Analog Devices, Inc. | | | 7,000,850 | |
| | 958,107 | | | Atmel Corp.* | | | 8,043,308 | |
| | 167,159 | | | Broadcom Corp. Class A | | | 7,242,999 | |
| | 491,495 | | | Maxim Integrated Products, Inc. | | | 15,663,946 | |
| | | | | | | | |
| | | | | | | 47,640,761 | |
| | |
| Software & Services – 5.0% | |
| | 128,983 | | | AOL, Inc.* | | | 5,955,145 | |
| | 98,358 | | | Check Point Software Technologies Ltd.* | | | 7,727,988 | |
| | 118,091 | | | Citrix Systems, Inc.* | | | 7,534,206 | |
| | 167,554 | | | Informatica Corp.* | | | 6,389,672 | |
| | 325,330 | | | Pandora Media, Inc.* | | | 5,800,634 | |
| | 86,974 | | | Red Hat, Inc.* | | | 6,013,382 | |
| | 962,803 | | | Xerox Corp. | | | 13,344,450 | |
| | | | | | | | |
| | | | | | | 52,765,477 | |
| | |
| Technology Hardware & Equipment – 2.7% | |
| | 793,770 | | | Brocade Communications Systems, Inc. | | | 9,398,237 | |
| | 384,727 | | | Juniper Networks, Inc. | | | 8,587,106 | |
| | 93,645 | | | Keysight Technologies, Inc.* | | | 3,162,392 | |
| | 179,604 | | | NetApp, Inc. | | | 7,444,586 | |
| | | | | | | | |
| | | | | | | 28,592,321 | |
| | |
| Transportation – 2.5% | |
| | 507,545 | | | Hertz Global Holdings, Inc.* | | | 12,658,172 | |
| | 72,486 | | | Kansas City Southern | | | 8,845,467 | |
| | 66,786 | | | United Continental Holdings, Inc.* | | | 4,467,315 | |
| | | | | | | | |
| | | | | | | 25,970,954 | |
| | |
| | Common Stocks – (continued) | |
| Utilities – 7.2% | |
| | 566,043 | | | FirstEnergy Corp. | | $ | 22,070,016 | |
| | 354,325 | | | NRG Energy, Inc. | | | 9,549,059 | |
| | 285,313 | | | PG&E Corp. | | | 15,190,064 | |
| | 135,860 | | | SCANA Corp. | | | 8,205,944 | |
| | 188,672 | | | Sempra Energy | | | 21,010,514 | |
| | | | | | | | |
| | | | | | | 76,025,597 | |
| | |
| | TOTAL COMMON STOCKS | |
| | (Cost $903,918,786) | | $ | 1,016,887,209 | |
| | |
| | | | | | | | | | | | |
| Units | | | Description | | Expiration
Month | | | Value | |
| | Right – 0.0% | |
| Media – 0.0% | |
| | 15,367 | | | Liberty Broadband
Corp.* | | | 01/15 | | | $ | 145,987 | |
| | (Cost $0) | |
| | |
| | TOTAL INVESTMENTS – 96.4% | |
| | (Cost $903,918,786) | | | $ | 1,017,033,196 | |
| | |
| OTHER ASSETS IN EXCESS OF
LIABILITIES – 3.6% |
| | | 37,535,349 | |
| | |
| | NET ASSETS – 100.0% | | | $ | 1,054,568,545 | |
| | |
| | |
| The percentage shown for each investment category reflects the value of investments in that category as a percentage of net assets. |
| * | | Non-income producing security. |
| | |
| The accompanying notes are an integral part of these financial statements. | | 11 |
GOLDMAN SACHS VARIABLE INSURANCE TRUST MID CAP VALUE FUND
Statement of Assets and Liabilities
December 31, 2014
| | | | |
| | | | |
| Assets: | |
Investments, at value (cost $903,918,786) | | $ | 1,017,033,196 | |
Cash | | | 40,976,654 | |
Receivables: | | | | |
Dividends | | | 1,475,527 | |
Investments sold | | | 1,087,907 | |
Fund shares sold | | | 134,153 | |
Reimbursement from investment adviser | | | 2,721 | |
Other assets | | | 29,514 | |
| Total assets | | | 1,060,739,672 | |
| | | | |
| | | | |
| Liabilities: | |
Payables: | | | | |
Investments purchased | | | 3,620,767 | |
Fund shares redeemed | | | 1,687,111 | |
Management fees | | | 685,825 | |
Distribution and Service fees and Transfer Agent fees | | | 93,788 | |
Accrued expenses | | | 83,636 | |
| Total liabilities | | | 6,171,127 | |
| | | | |
| | | | |
| Net Assets: | |
Paid-in capital | | | 925,203,399 | |
Undistributed net investment income | | | 493,790 | |
Accumulated net realized gain | | | 15,756,946 | |
Net unrealized gain | | | 113,114,410 | |
| NET ASSETS | | $ | 1,054,568,545 | |
Net Assets: | | | | |
Institutional | | $ | 692,068,020 | |
Service | | | 362,500,525 | |
Total Net Assets | | $ | 1,054,568,545 | |
Shares of beneficial interest outstanding $0.001 par value (unlimited shares authorized): | | | | |
Institutional | | | 39,694,457 | |
Service | | | 20,772,117 | |
Net asset value, offering and redemption price per share: | | | | |
Institutional | | | $17.43 | |
Service | | | 17.45 | |
| | |
| 12 | | The accompanying notes are an integral part of these financial statements. |
GOLDMAN SACHS VARIABLE INSURANCE TRUST MID CAP VALUE FUND
Statement of Operations
For the Fiscal Year Ended December 31, 2014
| | | | |
| | | | |
| Investment income: | |
| |
Dividends | | $ | 14,919,192 | |
| | | | |
| | | | |
| Expenses: | |
Management fees | | | 8,188,369 | |
Distribution and Service fees — Service Class | | | 836,821 | |
Transfer Agent fees(a) | | | 204,692 | |
Printing and mailing costs | | | 152,815 | |
Custody, accounting and administrative services | | | 99,344 | |
Professional fees | | | 79,491 | |
Trustee fees | | | 20,839 | |
Other | | | 117,091 | |
| Total expenses | | | 9,699,462 | |
Less — expense reductions | | | (320,748 | ) |
| Net expenses | | | 9,378,714 | |
| NET INVESTMENT INCOME | | | 5,540,478 | |
| | | | |
| | | | |
| Realized and unrealized gain (loss): | |
Net realized gain from investments (including commissions recaptured of $102,620) | | | 159,883,299 | |
| |
Net change in unrealized loss on investments | | | (37,866,794 | ) |
| Net realized and unrealized gain | | | 122,016,505 | |
| NET INCREASE IN NET ASSETS RESULTING FROM OPERATIONS | | $ | 127,556,983 | |
(a) Institutional and Service Shares had Transfer Agent fees of $137,752 and $66,940, respectively.
| | |
| The accompanying notes are an integral part of these financial statements. | | 13 |
GOLDMAN SACHS VARIABLE INSURANCE TRUST MID CAP VALUE FUND
Statements of Changes in Net Assets
| | | | | | | | |
| | | For the Fiscal Year Ended
December 31, 2014 | | | For the Fiscal Year Ended
December 31, 2013 | |
| | | | | | | | |
| From operations: | | | | | | |
Net investment income | | $ | 5,540,478 | | | $ | 6,344,409 | |
Net realized gain | | | 159,883,299 | | | | 201,894,207 | |
Net change in unrealized gain (loss) | | | (37,866,794 | ) | | | 53,796,177 | |
| Net increase in net assets resulting from operations | | | 127,556,983 | | | | 262,034,793 | |
| | | | | | | | |
| | | | | | | | |
| Distributions to shareholders: | | | | | | |
From net investment income | | | | | | | | |
Institutional Shares | | | (6,789,219 | ) | | | (5,487,800 | ) |
Service Shares | | | (2,691,480 | ) | | | (1,803,944 | ) |
From net realized gains | | | | | | | | |
Institutional Shares | | | (113,060,264 | ) | | | (52,951,066 | ) |
Service Shares | | | (58,697,537 | ) | | | (24,095,985 | ) |
| Total distributions to shareholders | | | (181,238,500 | ) | | | (84,338,795 | ) |
| | | | | | | | |
| | | | | | | | |
| From share transactions: | | | | | | |
Proceeds from sales of shares | | | 97,834,874 | | | | 80,023,723 | |
Reinvestment of distributions | | | 181,238,500 | | | | 84,338,795 | |
Cost of shares redeemed | | | (186,178,999 | ) | | | (150,238,862 | ) |
| Net increase in net assets resulting from share transactions | | | 92,894,375 | | | | 14,123,656 | |
| TOTAL INCREASE | | | 39,212,858 | | | | 191,819,654 | |
| | | | | | | | |
| | | | | | | | |
| Net assets: | | | | | | |
| | |
Beginning of year | | | 1,015,355,687 | | | | 823,536,033 | |
End of year | | $ | 1,054,568,545 | | | $ | 1,015,355,687 | |
| Undistributed net investment income | | $ | 493,790 | | | $ | 3,004,778 | |
| | |
| 14 | | The accompanying notes are an integral part of these financial statements. |
GOLDMAN SACHS VARIABLE INSURANCE TRUST MID CAP VALUE FUND
Financial Highlights
Selected Data for a Share Outstanding Throughout Each Year
| | | | | | | | | | | | | | | | | | | | | | | | | | | | | | | | | | | | | | | | | | | | | | | | | | | | | | | | |
| | | | | | Income (loss) from
investment operations | | | Distributions to shareholders | | | | | | | | | | | | | | | | | | | | | | |
| Year - Share Class | | Net asset
value,
beginning
of year | | | Net
investment
income(a) | | | Net
realized
and
unrealized
gain (loss) | | | Total from
investment
operations | | | From net
investment
income | | | From
net
realized
gains | | | Total
distributions | | | Net asset
value,
end of
year | | | Total
return(b) | | | Net assets,
end of
year
(in 000s) | | | Ratio of
net expenses
to average
net assets | | | Ratio of
total
expenses
to average
net assets | | | Ratio of
net
investment
income to
average
net assets | | | Portfolio
turnover
rate(c) | |
FOR THE FISCAL YEARS ENDED DECEMBER 31, | |
2014 - Institutional | | $ | 18.64 | | | $ | 0.12 | | | $ | 2.31 | | | $ | 2.43 | | | $ | (0.21 | ) | | $ | (3.43 | ) | | $ | (3.64 | ) | | $ | 17.43 | | | | 13.57 | % | | $ | 692,068 | | | | 0.83 | % | | | 0.87 | % | | | 0.62 | % | | | 88 | % |
2014 - Service | | | 18.66 | | | | 0.07 | | | | 2.31 | | | | 2.38 | | | | (0.16 | ) | | | (3.43 | ) | | | (3.59 | ) | | | 17.45 | | | | 13.29 | | | | 362,501 | | | | 1.08 | | | | 1.12 | | | | 0.38 | | | | 88 | |
2013 - Institutional | | | 15.33 | | | | 0.13 | | | | 4.88 | | | | 5.01 | | | | (0.16 | ) | | | (1.54 | ) | | | (1.70 | ) | | | 18.64 | | | | 32.89 | | | | 695,832 | | | | 0.83 | | | | 0.86 | | | | 0.74 | | | | 108 | |
2013 - Service | | | 15.35 | | | | 0.09 | | | | 4.88 | | | | 4.97 | | | | (0.12 | ) | | | (1.54 | ) | | | (1.66 | ) | | | 18.66 | | | | 32.56 | | | | 319,524 | | | | 1.08 | | | | 1.11 | | | | 0.51 | | | | 108 | |
2012 - Institutional | | | 13.09 | | | | 0.18 | (d) | | | 2.24 | | | | 2.42 | | | | (0.18 | ) | | | — | | | | (0.18 | ) | | | 15.33 | | | | 18.41 | | | | 601,620 | | | | 0.84 | | | | 0.87 | | | | 1.24 | (d) | | | 79 | |
2012 - Service | | | 13.11 | | | | 0.15 | (d) | | | 2.23 | | | | 2.38 | | | | (0.14 | ) | | | — | | | | (0.14 | ) | | | 15.35 | | | | 18.13 | | | | 221,917 | | | | 1.09 | | | | 1.12 | | | | 1.05 | (d) | | | 79 | |
2011 - Institutional | | | 14.10 | | | | 0.11 | | | | (1.01 | ) | | | (0.90 | ) | | | (0.11 | ) | | | — | | | | (0.11 | ) | | | 13.09 | | | | (6.38 | ) | | | 604,797 | | | | 0.85 | | | | 0.86 | | | | 0.81 | | | | 75 | |
2011 - Service | | | 14.12 | | | | 0.08 | | | | (1.01 | ) | | | (0.93 | ) | | | (0.08 | ) | | | — | | | | (0.08 | ) | | | 13.11 | | | | (6.59 | ) | | | 159,638 | | | | 1.10 | | | | 1.11 | | | | 0.61 | | | | 75 | |
2010 - Institutional | | | 11.35 | | | | 0.08 | | | | 2.76 | | | | 2.84 | | | | (0.09 | ) | | | — | | | | (0.09 | ) | | | 14.10 | | | | 25.00 | | | | 769,552 | | | | 0.87 | | | | 0.87 | | | | 0.65 | | | | 88 | |
2010 - Service | | | 11.37 | | | | 0.05 | | | | 2.76 | | | | 2.81 | | | | (0.06 | ) | | | — | | | | (0.06 | ) | | | 14.12 | | | | 24.69 | | | | 146,632 | | | | 1.12 | | | | 1.12 | | | | 0.44 | | | | 88 | |
| (a) | Calculated based on the average shares outstanding methodology. |
| (b) | Assumes investment at the net asset value at the beginning of the year, reinvestment of all distributions, and a complete redemption of the investment at the net asset value at the end of the year. |
| (c) | The Fund's portfolio turnover rate is calculated in accordance with regulatory requirements, without regard to transactions involving short term investments and certain derivatives. If such transactions were included, the Fund's portfolio turnover rate may be higher. |
| (d) | Reflects income recognized from special dividends which amounted to $0.04 per share and 0.31% of average net assets. |
| | | | |
| The accompanying notes are an integral part of these financial statements. | | 15 | | |
GOLDMAN SACHS VARIABLE INSURANCE TRUST MID CAP VALUE FUND
Notes to Financial Statements
December 31, 2014
1. ORGANIZATION
Goldman Sachs Variable Insurance Trust (the “Trust” or “VIT”) is a Delaware statutory trust registered under the Investment Company Act of 1940, as amended (the “Act”), as an open-end management investment company. The Trust includes the Goldman Sachs Mid Cap Value Fund (the “Fund”). The Fund is a diversified portfolio under the Act offering two classes of shares — Institutional and Service Shares. Shares of the Trust are offered to separate accounts of participating life insurance companies for the purpose of funding variable annuity contracts and variable life insurance policies.
Goldman Sachs Asset Management, L.P. (“GSAM”), an affiliate of Goldman, Sachs & Co. (“Goldman Sachs”), serves as investment adviser to the Fund pursuant to a management agreement (the “Agreement”) with the Trust.
2. SIGNIFICANT ACCOUNTING POLICIES
The financial statements have been prepared in accordance with accounting principles generally accepted in the United States of America (“GAAP”) and require management to make estimates and assumptions that may affect the reported amounts and disclosures. Actual results may differ from those estimates and assumptions.
A. Investment Valuation — The Fund’s valuation policy is to value investments at fair value.
B. Investment Income and Investments — Investment income includes interest income and dividend income, net of any foreign withholding taxes, less any amounts reclaimable. Interest income is accrued daily and adjusted for amortization of premiums and accretion of discounts. Dividend income is recognized on ex-dividend date or, for certain foreign securities, as soon as such information is obtained subsequent to the ex-dividend date. Investment transactions are reflected on trade date. Realized gains and losses are calculated using identified cost. Investment transactions are recorded on the following business day for daily net asset value (“NAV”) calculations. Any foreign capital gains tax is accrued daily based upon net unrealized gains, and is payable upon sale of such investments. Distributions received from the Fund’s investments in United States (“U.S.”) real estate investment trusts (“REITs”) may be characterized as ordinary income, net capital gain or a return of capital. A return of capital is recorded by the Fund as a reduction to the cost basis of the REIT.
C. Class Allocations and Expenses — Investment income, realized and unrealized gain (loss), and non-class specific expenses of the Fund are allocated daily based upon the proportion of net assets of each class. Class specific expenses, where applicable, are borne by the respective share classes and include Distribution and Service and Transfer Agent fees. Non-class specific expenses directly incurred by a Fund are charged to that Fund, while such expenses incurred by the Trust are allocated across the respective Funds on a straight-line and/or pro-rata basis depending upon the nature of the expenses.
D. Federal Taxes and Distributions to Shareholders — It is the Fund’s policy to comply with the requirements of the Internal Revenue Code of 1986, as amended (the “Code”), applicable to regulated investment companies (mutual funds) and to distribute each year substantially all of its investment company taxable income and capital gains to its shareholders. Accordingly, the Fund is not required to make any provisions for the payment of federal income tax. Distributions to shareholders are recorded on the ex-dividend date. Income and capital gains distributions, if any, are declared and paid annually.
Net capital losses are carried forward to future fiscal years and may be used to the extent allowed by the Code to offset any future capital gains. Losses that are carried forward will retain their character as either short-term or long-term capital losses. Utilization of capital loss carryforwards will reduce the requirement of future capital gains distributions.
The characterization of distributions to shareholders for financial reporting purposes is determined in accordance with federal income tax rules, which may differ from GAAP. The source of the Fund’s distributions may be shown in the accompanying financial statements as either from net investment income, net realized gain or capital. Certain components of the Fund’s net assets on the Statement of Assets and Liabilities reflect permanent GAAP/tax differences based on the appropriate tax character.
16
GOLDMAN SACHS VARIABLE INSURANCE TRUST MID CAP VALUE FUND
2. SIGNIFICANT ACCOUNTING POLICIES (continued)
E. Commission Recapture — GSAM, on behalf of certain Funds, may direct portfolio trades, subject to seeking best execution, to various brokers who have agreed to rebate a portion of the commissions generated. Such rebates are made directly to a Fund as cash payments and are included in net realized gain (loss) from investments on the Statement of Operations.
3. INVESTMENTS AND FAIR VALUE MEASUREMENTS
The fair value of a financial instrument is the amount that would be received to sell an asset or paid to transfer a liability in an orderly transaction between market participants at the measurement date (i.e., the exit price). GAAP establishes a fair value hierarchy that prioritizes the inputs to valuation techniques used to measure fair value. The hierarchy gives the highest priority to unadjusted quoted prices in active markets for identical assets or liabilities (Level 1 measurements) and the lowest priority to unobservable inputs (Level 3 measurements). The levels used for classifying investments are not necessarily an indication of the risk associated with investing in these investments. The three levels of the fair value hierarchy are described below:
Level 1 — Unadjusted quoted prices in active markets that are accessible at the measurement date for identical, unrestricted assets or liabilities;
Level 2 — Quoted prices in markets that are not active or financial instruments for which significant inputs are observable (including, but not limited to, quoted prices for similar investments, interest rates, foreign exchange rates, volatility and credit spreads), either directly or indirectly;
Level 3 — Prices or valuations that require significant unobservable inputs (including GSAM’s assumptions in determining fair value measurement).
The Trustees have adopted Valuation Procedures that govern the valuation of the portfolio investments held by the Fund, including investments for which market quotations are not readily available. The Trustees have delegated to GSAM day-to-day responsibility for implementing and maintaining internal controls and procedures related to the valuation of the Fund’s portfolio investments. To assess the continuing appropriateness of pricing sources and methodologies, GSAM regularly performs price verification procedures and issues challenges as necessary to third party pricing vendors or brokers, and any differences are reviewed in accordance with the Valuation Procedures.
A. Level 1 and Level 2 Fair Value Investments — The valuation techniques and significant inputs used in determining the fair values for investments classified as Level 1 and Level 2 are as follows:
Equity Securities — Equity securities and investment companies traded on a U.S. securities exchange or the NASDAQ system, or those located on certain foreign exchanges, including but not limited to the Americas, are valued daily at their last sale price or official closing price on the principal exchange or system on which they are traded. If no sale occurs, equity securities and exchange traded investment companies are valued at the last bid price for long positions and at the last ask price for short positions. Investments in investment companies (other than those that are exchange traded) are valued at the NAV on the valuation date. To the extent these investments are actively traded, they are classified as Level 1 of the fair value hierarchy, otherwise they are generally classified as Level 2.
Unlisted equity securities for which market quotations are available are valued at the last sale price on the valuation date, or if no sale occurs, at the last bid price. Securities traded on certain foreign securities exchanges are valued daily at fair value determined by an independent fair value service (if available) under Valuation Procedures approved by the Trustees and consistent with applicable regulatory guidance. The independent fair value service takes into account multiple factors including, but not limited to, movements in the securities markets, certain depositary receipts, futures contracts and foreign currency exchange rates that have occurred subsequent to the close of the foreign securities exchange. These investments are generally classified as Level 2 of the fair value hierarchy.
17
GOLDMAN SACHS VARIABLE INSURANCE TRUST MID CAP VALUE FUND
Notes to Financial Statements (continued)
December 31, 2014
3. INVESTMENTS AND FAIR VALUE MEASUREMENTS (continued)
B. Level 3 Fair Value Investments — To the extent that the aforementioned significant inputs are unobservable, or if quotations are not readily available, or if GSAM believes that such quotations do not accurately reflect fair value, the fair value of the Fund’s investments may be determined under Valuation Procedures approved by the Trustees. GSAM, consistent with its procedures and applicable regulatory guidance, may make an adjustment to the most recent valuation prices of either domestic or foreign securities in light of significant events to reflect what it believes to be the fair value of the securities at the time of determining a Fund’s NAV. Significant events which could affect a large number of securities in a particular market may include, but are not limited to: significant fluctuations in U.S. or foreign markets; market dislocations; market disruptions; or unscheduled market closings. Significant events which could also affect a single issuer may include, but are not limited to: corporate actions such as reorganizations, mergers and buy-outs; ratings downgrades; and bankruptcies.
C. Fair Value Hierarchy — The following is a summary of the Fund’s investments classified in the fair value hierarchy as of December 31, 2014:
| | | | | | | | | | | | |
| Investment Type | | Level 1 | | | Level 2 | | | Level 3 | |
| Assets | | | | | | | | | | | | |
| Common Stock and/or Other Equity Investments(a) | | | | | | | | | | | | |
North America | | $ | 1,016,887,209 | | | $ | 145,987 | | | $ | — | |
| (a) | Amounts are disclosed by continent to highlight the impact of time zone differences between local market close and the calculation of net asset value. Security valuations are based on the principal exchange or system on which they are traded, which may differ from country of domicile. |
For further information regarding security characteristics, see the Schedule of Investments.
4. AGREEMENTS AND AFFILIATED TRANSACTIONS
A. Management Agreement — Under the Agreement, GSAM manages the Fund, subject to the general supervision of the Trustees.
As compensation for the services rendered pursuant to the Agreement, the assumption of the expenses related thereto and administration of the Fund’s business affairs, including providing facilities, GSAM is entitled to a management fee, accrued daily and paid monthly, equal to an annual percentage rate of the Fund’s average daily net assets.
For the fiscal year ended December 31, 2014, contractual and effective net management fees with GSAM were at the following rates:
| | | | | | | | | | | | | | | | | | | | | | |
| Contractual Management Fee Rate | | | | |
First
$2 billion | | | Next
$3 billion | | | Next
$3 billion | | | Over
$8 billion | | | Effective
Rate | | | Effective Net
Management
Fee Rate | |
| | 0.80% | | | | 0.72 | % | | | 0.68 | % | | | 0.67 | % | | | 0.80 | % | | | 0.77 | %* |
| * | GSAM has agreed to waive a portion of its management fee in order to achieve a net management fee rate, as defined in the Fund’s most recent prospectus. This waiver will be effective through at least April 30, 2015 and prior to such date GSAM may not terminate the arrangement without approval of the Trustees. The Effective Net Management Rate above is calculated based on the management rate before and after the waiver had been adjusted, if applicable. For the fiscal year ended December 31, 2014, GSAM waived $307,058 of its management fee. |
B. Distribution and Service Plan — The Trust, on behalf of the Service Shares of the Fund, has adopted a Distribution and Service Plan (the “Plan”). Under the Plan, Goldman Sachs, which serves as distributor (the “Distributor”), is entitled to a fee accrued daily and paid monthly, for distribution services and personal and account maintenance services, which may then be paid by Goldman Sachs to authorized dealers, equal to, on an annual basis, 0.25% of the Fund’s average daily net assets attributable to Service Shares.
18
GOLDMAN SACHS VARIABLE INSURANCE TRUST MID CAP VALUE FUND
4. AGREEMENTS AND AFFILIATED TRANSACTIONS (continued)
C. Transfer Agency Agreement — Goldman Sachs also serves as the transfer agent of the Fund for a fee pursuant to a Transfer Agency Agreement. The fees charged for such transfer agency services are accrued daily and paid monthly at an annual rate of 0.02% of the average daily net assets of Institutional and Service Shares.
D. Other Expense Agreements and Affiliated Transactions — GSAM has agreed to limit certain “Other Expenses” of the Fund (excluding transfer agency fees and expenses, taxes, interest, brokerage fees, shareholder meetings, litigation, indemnification, and extraordinary expenses) to the extent such expenses exceed, on an annual basis, a percentage rate of the average daily net assets of the Fund. Such Other Expense reimbursements, if any, are accrued daily and paid monthly. In addition, the Fund is not obligated to reimburse GSAM for prior fiscal year expense reimbursements, if any. The Other Expense limitation as an annual percentage rate of average daily net assets for the Fund is 0.054%. The Other Expense limitation will remain in place through at least April 30, 2015, and prior to such date GSAM may not terminate the arrangement without the approval of the Trustees. The Fund bears its respective share of costs related to proxy and shareholder meetings, and GSAM has agreed to reimburse the Fund to the extent such expenses exceed a specified percentage of the Fund’s net assets. For the fiscal year ended December 31, 2014, GSAM did not reimburse the Fund. In addition, the Fund has entered into certain offset arrangements with the custodian and the transfer agent, which may result in a reduction of the Fund’s expenses and are received irrespective of the application of the “Other Expense” limitation described above. For the fiscal year ended December 31, 2014, custody fee credits were $13,690.
E. Line of Credit Facility — As of December 31, 2014, the Fund participated in a $1,080,000,000 committed, unsecured revolving line of credit facility (the “facility”) together with other funds of the Trust and registered investment companies having management agreements with GSAM or its affiliates (“Other Borrowers”). Pursuant to the terms of the facility, the Fund and Other Borrowers could increase the credit amount by an additional $120,000,000, for a total of up to $1,200,000,000. This facility is to be used solely for temporary or emergency purposes, which may include the funding of redemptions. The interest rate on borrowings is based on the federal funds rate. The facility also requires a fee to be paid by the Fund based on the amount of the commitment that has not been utilized. For the fiscal year ended December 31, 2014, the Fund did not have any borrowings under the facility.
F. Other Transactions with Affiliates — For the fiscal year ended December 31, 2014, Goldman Sachs earned $61,036 in brokerage commissions from portfolio transactions.
5. PORTFOLIO SECURITIES TRANSACTIONS
The cost of purchases and proceeds from sales and maturities of long-term securities for the fiscal year ended December 31, 2014, were $891,614,136 and $1,004,081,968, respectively.
19
GOLDMAN SACHS VARIABLE INSURANCE TRUST MID CAP VALUE FUND
Notes to Financial Statements (continued)
December 31, 2014
6. TAX INFORMATION
The tax character of distributions paid during the fiscal years ended December 31, 2013 and December 31, 2014 was as follows:
| | | | | | | | |
| | | 2013 | | | 2014 | |
| Distributions paid from: | | | | | | | | |
Ordinary income | | $ | 7,291,744 | | | $ | 65,381,467 | |
Net long-term capital gains | | | 77,047,051 | | | | 115,857,033 | |
| Total taxable distributions | | $ | 84,338,795 | | | $ | 181,238,500 | |
As of December 31, 2014, the components of accumulated earnings (losses) on a tax-basis were as follows:
| | | | |
| Undistributed ordinary income — net | | $ | 1,096,277 | |
| Undistributed long-term capital gains | | | 15,385,470 | |
| Total undistributed earnings | | $ | 16,481,747 | |
| Timing differences (Relating to REIT Adjustments) | | | 423,895 | |
| Unrealized gains — net | | | 112,459,504 | |
| Total accumulated gains — net | | $ | 129,365,146 | |
As of December 31, 2014, the Fund’s aggregate security unrealized gains and losses based on cost for U.S. federal income tax purposes were as follows:
| | | | |
| Tax cost | | $ | 904,573,692 | |
| Gross unrealized gain | | | 128,805,984 | |
| Gross unrealized loss | | | (16,346,480 | ) |
| Net unrealized security gain | | $ | 112,459,504 | |
The difference between GAAP-basis and tax-basis unrealized gains (losses) is attributable primarily to wash sales and differences in the tax treatment of real estate investment trust investments.
In order to present certain components of the Fund’s capital accounts on a tax-basis, the Fund has reclassified $1,429,233 from accumulated net realized gain (loss) to undistributed net investment income. This reclassification has no impact on the net asset value of the Fund and result primarily from dividend redesignations, and differences in the tax treatment of real estate investment trust investments and partnership investments.
GSAM has reviewed the Fund’s tax positions for all open tax years (the current and prior three years, as applicable) and has concluded that no provision for income tax is required in the Fund’s financial statements. Such open tax years remain subject to examination and adjustment by tax authorities.
20
GOLDMAN SACHS VARIABLE INSURANCE TRUST MID CAP VALUE FUND
7. OTHER RISKS
The Fund’s risks include, but are not limited to, the following:
Large Shareholder Transaction Risk — The Fund may experience adverse effects when certain large shareholders, such as other funds, participating insurance companies, accounts and Goldman Sachs affiliates, purchase or redeem large amounts of shares of the Fund. Such large shareholder redemptions may cause the Fund to sell portfolio securities at times when it would not otherwise do so, which may negatively impact the Fund’s NAV and liquidity. Similarly, large Fund share purchases may adversely affect the Fund’s performance to the extent that the Fund is delayed in investing new cash and is required to maintain a larger cash position than it ordinarily would. These transactions may also increase transaction costs. In addition, a large redemption could result in the Fund’s current expenses being allocated over a smaller asset base, leading to an increase in the Fund’s expense ratio.
Liquidity Risk — The Fund may make investments that are illiquid or that may become less liquid in response to market developments or adverse investor perceptions. Illiquid investments may be more difficult to value. Liquidity risk may also refer to the risk that a Fund will not be able to pay redemption proceeds within the allowable time period because of unusual market conditions, an unusually high volume of redemption requests, or other reasons. To meet redemption requests, a Fund may be forced to sell investments at an unfavorable time and/or under unfavorable conditions.
Market and Credit Risks — In the normal course of business, the Fund trades financial instruments and enters into financial transactions where risk of potential loss exists due to changes in the market (market risk). Additionally, the Fund may also be exposed to credit risk in the event that an issuer or guarantor fails to perform or that an institution or entity with which the Fund has unsettled or open transactions defaults.
8. INDEMNIFICATIONS
Under the Trust’s organizational documents, its Trustees, officers, employees and agents are indemnified, to the extent permitted by the Act and state law, against certain liabilities that may arise out of performance of their duties to the Fund. Additionally, in the course of business, the Fund enters into contracts that contain a variety of indemnification clauses. The Fund’s maximum exposure under these arrangements is unknown, as this would involve future claims that may be made against the Fund that have not yet occurred. However, GSAM believes the risk of loss under these arrangements to be remote.
9. SUBSEQUENT EVENTS
Subsequent events after the Statement of Assets and Liabilities date have been evaluated through the date the financial statements were issued. GSAM has concluded that there is no impact requiring adjustment or disclosure in the financial statements.
21
GOLDMAN SACHS VARIABLE INSURANCE TRUST MID CAP VALUE FUND
Notes to Financial Statements (continued)
December 31, 2014
10. SUMMARY OF SHARE TRANSACTIONS
Share activity is as follows:
| | | | | | | | | | | | | | | | |
| | | For the Fiscal Year Ended
December 31, 2014 | | | For the Fiscal Year Ended
December 31, 2013 | |
| | | Shares | | | Dollars | | | Shares | | | Dollars | |
| Institutional Shares | | | | | | | | | | | | | | | | |
| Shares sold | | | 1,715,321 | | | $ | 33,575,125 | | | | 1,696,217 | | | $ | 30,350,446 | |
| Reinvestment of distributions | | | 7,070,766 | | | | 119,849,483 | | | | 3,203,885 | | | | 58,438,866 | |
| Shares redeemed | | | (6,423,243 | ) | | | (125,120,050 | ) | | | (6,801,262 | ) | | | (121,893,304 | ) |
| | | | 2,362,844 | | | | 28,304,558 | | | | (1,901,160 | ) | | | (33,103,992 | ) |
| Service Shares | | | | | | | | | | | | | | | | |
| Shares sold | | | 3,196,021 | | | | 64,259,749 | | | | 2,816,457 | | | | 49,673,277 | |
| Reinvestment of distributions | | | 3,617,502 | | | | 61,389,017 | | | | 1,418,397 | | | | 25,899,929 | |
| Shares redeemed | | | (3,169,219 | ) | | | (61,058,949 | ) | | | (1,563,657 | ) | | | (28,345,558 | ) |
| | | | 3,644,304 | | | | 64,589,817 | | | | 2,671,197 | | | | 47,227,648 | |
| NET INCREASE | | | 6,007,148 | | | $ | 92,894,375 | | | | 770,037 | | | $ | 14,123,656 | |
22
Report of Independent Registered Public Accounting Firm
To the Board of Trustees and Shareholders of
Goldman Sachs Variable Insurance Trust — Goldman Sachs Mid Cap Value Fund:
In our opinion, the accompanying statement of assets and liabilities, including the schedule of investments, and the related statements of operations and of changes in net assets and the financial highlights present fairly, in all material respects, the financial position of Goldman Sachs Mid Cap Value Fund (the “Fund”), a Fund of Goldman Sachs Variable Insurance Trust, at December 31, 2014 and the results of its operations, the changes in its net assets and the financial highlights for each of the periods indicated, in conformity with accounting principles generally accepted in the United States of America. These financial statements and financial highlights (hereafter referred to as “financial statements”) are the responsibility of the Fund’s management. Our responsibility is to express an opinion on these financial statements based on our audits. We conducted our audits of these financial statements in accordance with the standards of the Public Company Accounting Oversight Board (United States). Those standards require that we plan and perform the audit to obtain reasonable assurance about whether the financial statements are free of material misstatement. An audit includes examining, on a test basis, evidence supporting the amounts and disclosures in the financial statements, assessing the accounting principles used and significant estimates made by management, and evaluating the overall financial statement presentation. We believe that our audits, which included confirmation of securities at December 31, 2014 by correspondence with the custodian, brokers, and the application of alternative auditing procedures where securities purchased had not been received, provide a reasonable basis for our opinion.
PricewaterhouseCoopers LLP
Boston, Massachusetts
February 19, 2015
23
GOLDMAN SACHS VARIABLE INSURANCE TRUST MID CAP VALUE FUND
|
| Fund Expenses — Six Month Period Ended December 31, 2014 (Unaudited) |
As a shareholder of Institutional or Service Shares of the Fund, you incur ongoing costs, including management fees, distribution and service (12b-1) fees (with respect to Service Shares) and other Fund expenses. This example is intended to help you understand your ongoing costs (in dollars) of investing in the Institutional Shares and Service Shares of the Fund and to compare these costs with the ongoing costs of investing in other mutual funds.
The example is based on an investment of $1,000 invested at the beginning of the period and held for the entire period from July 1, 2014 through December 31, 2014.
Actual Expenses — The first line under each share class in the table below provides information about actual account values and actual expenses. You may use the information in this line, together with the amount you invested, to estimate the expenses that you paid over the period. Simply divide your account value by $1,000 (for example, an $8,600 account value divided by $1,000=8.6), then multiply the result by the number in the first line under the heading entitled “Expenses Paid” to estimate the expenses you paid on your account during this period.
Hypothetical Example for Comparison Purposes — The second line under each share class in the table below provides information about hypothetical account values and hypothetical expenses based on the Fund's actual net expense ratio and an assumed rate of return of 5% per year before expenses, which is not the Fund's actual return. The hypothetical account values and expenses may not be used to estimate the actual ending account balance or expenses you paid for the period. You may use this information to compare the ongoing costs of investing in the Fund and other funds. To do so, compare this 5% hypothetical example with the 5% hypothetical examples that appear in the shareholder reports of the other funds.
Please note that the expenses shown in the table are meant to highlight your ongoing costs only. As a shareholder of the Fund you do not incur any transaction costs, such as sales charges, redemption fees, or exchange fees, but shareholders of other funds may incur such costs. The second line of the table is useful in comparing ongoing costs only, and will not help you determine the relative total costs of owning different funds whose shareholders may incur transaction costs.
| | | | | | | | | | | | |
| Share Class | | Beginning
Account Value
7/01/14 | | | Ending Account Value
12/31/14 | | | Expenses Paid for the 6 Months Ended 12/31/14* | |
| Institutional | | | | | | | | | | | | |
| Actual | | $ | 1,000 | | | $ | 1,044.90 | | | $ | 4.28 | |
| Hypothetical 5% return | | | 1,000 | | | | 1,021.02 | + | | | 4.23 | |
| Service | | | | | | | | | | | | |
| Actual | | | 1,000 | | | | 1,043.90 | | | | 5.56 | |
| Hypothetical 5% return | | | 1,000 | | | | 1,019.76 | + | | | 5.50 | |
| | * | Expenses are calculated using the Fund’s annualized net expense ratio for each class, which represents the ongoing expenses as a percentage of net assets for the six months ended December 31, 2014. Expenses are calculated by multiplying the annualized net expense ratio by the average account value for the period; then multiplying the result by the number of days in the most recent fiscal half year; and then dividing that result by the number of days in the fiscal year. The annualized net expense ratios for the period were 0.83% and 1.08% for Institutional and Service Shares, respectively. | |
| | + | Hypothetical expenses are based on the Fund’s actual annualized net expense ratios and an assumed rate of return of 5% per year before expenses. | |
24
GOLDMAN SACHS VARIABLE INSURANCE TRUST MID CAP VALUE FUND
Trustees and Officers (Unaudited)
Independent Trustees
| | | | | | | | | | | | |
| | | | | |
Name,
Address and Age1 | | Position(s) Held
with the Trust | | Term of Office and
Length of
Time Served2 | | Principal Occupation(s) During Past 5 Years | | Number of
Portfolios in
Fund Complex
Overseen by
Trustee3 | | | Other Directorships Held by Trustee4 |
Ashok N. Bakhru Age: 72 | | Chairman of the Board of Trustees | | Since 1996 (Trustee since 1991) | | Mr. Bakhru is retired. He was formerly Director, Apollo Investment Corporation (a business development company) (2008-2013); President, ABN Associates (a management and financial consulting firm) (1994-1996 and 1998-2012); Trustee, Scholarship America (1998-2005); Trustee, Institute for Higher Education Policy (2003-2008); Director, Private Equity Investors — III and IV (1998-2007), and Equity-Linked Investors II (April 2002-2007). Chairman of the Board of Trustees — Goldman Sachs Fund Complex. | | | 128 | | | None |
John P. Coblentz, Jr. Age: 73 | | Trustee | | Since 2003 | | Mr. Coblentz is retired. Formerly, he was Partner, Deloitte & Touche LLP (1975-2003); Director, Emerging Markets Group, Ltd. (2004-2006); and Director, Elderhostel, Inc. (2006-2012). Trustee — Goldman Sachs Fund Complex. | | | 128 | | | None |
Diana M. Daniels Age: 65 | | Trustee | | Since 2007 | | Ms. Daniels is retired. Formerly, she was Vice President, General Counsel and Secretary, The Washington Post Company (1991-2006). Ms. Daniels serves as a Presidential Councillor of Cornell University (2013-Present); Member, Advisory Board, Psychology Without Borders (international humanitarian aid organization) (2007-Present), and former Member of the Legal Advisory Board, New York Stock Exchange (2003-2006) and of the Corporate Advisory Board, Standish Mellon Management Advisors (2006-2007). Trustee — Goldman Sachs Fund Complex. | | | 108 | | | None |
Joseph P. LoRusso Age: 57 | | Trustee | | Since 2010 | | Mr. LoRusso is retired. Formerly, he was President, Fidelity Investments Institutional Services Co. (“FIIS”) (2002-2008); Director, FIIS (2002-2008); Director, Fidelity Investments Institutional Operations Company (2003-2007); Executive Officer, Fidelity Distributors Corporation (2007-2008). Trustee — Goldman Sachs Fund Complex. | | | 108 | | | None |
Herbert J. Markley Age: 64 | | Trustee | | Since 2013 | | Mr. Markley is retired. Formerly, he was Executive Vice President, Deere & Company (an agricultural and construction equipment manufacturer) (2007-2009), and President, Agricultural Division, Deere & Company (2001-2007). Trustee — Goldman Sachs Fund Complex. | | | 108 | | | None |
Jessica Palmer Age: 65 | | Trustee | | Since 2007 | | Ms. Palmer is retired. She is Director, Emerson Center for the Arts and Culture (2011-Present); and was formerly a Consultant, Citigroup Human Resources Department (2007-2008); Managing Director, Citigroup Corporate and Investment Banking (previously, Salomon Smith Barney/Salomon Brothers) (1984-2006). Ms. Palmer was a Member of the Board of Trustees of Indian Mountain School (private elementary and secondary school) (2004-2009). Trustee — Goldman Sachs Fund Complex. | | | 108 | | | None |
Richard P. Strubel Age: 75 | | Trustee | | Since 1987 | | Mr. Strubel is retired. Formerly, he was Director, Cardean Learning Group (provider of educational services via the internet) (2003-2008); and Director, Gildan Activewear Inc. (a clothing marketing and manufacturing company) (2000-2014). He serves as Trustee, Emeritus, The University of Chicago (1987-Present). Trustee — Goldman Sachs Fund Complex. | | | 128 | | | The Northern Trust Mutual Fund Complex (56 Portfolios) (Chairman of the Board of Trustees) |
| | | | | | | | | | | | |
25
GOLDMAN SACHS VARIABLE INSURANCE TRUST MID CAP VALUE FUND
Trustees and Officers (Unaudited) (continued)
Independent Trustees (continued)
| | | | | | | | | | | | |
| | | | | |
Name,
Address and Age1 | | Position(s) Held
with the Trust | | Term of Office and
Length of
Time Served2 | | Principal Occupation(s) During Past 5 Years | | Number of
Portfolios in
Fund Complex
Overseen by
Trustee3 | | | Other Directorships Held by Trustee4 |
Roy W. Templin Age: 54 | | Trustee | | Since 2013 | | Mr. Templin is retired. He is Chairman of the Board of Directors, Con-Way Incorporated (2012-Present); and was formerly Executive Vice President and Chief Financial Officer, Whirlpool Corporation (an appliance manufacturer and marketer) (2004-2012). Trustee — Goldman Sachs Fund Complex. | | | 108 | | | Con-Way Incorporated (a transportation, supply-chain management and logistics services company) |
| | | | | | | | | | | | |
Interested Trustees*
| | | | | | | | | | | | |
| | | | | |
Name,
Address and Age1 | | Position(s) Held
with the Trust | | Term of Office and
Length of
Time Served2 | | Principal Occupation(s) During Past 5 Years | | Number of
Portfolios in
Fund Complex
Overseen by
Trustee3 | | | Other Directorships Held by Trustee4 |
James A. McNamara Age: 52 | | President and Trustee | | Since 2007 | | Managing Director, Goldman Sachs (December 1998-Present); Director of Institutional Fund Sales, GSAM (April 1998-December 2000); and Senior Vice President and Manager, Dreyfus Institutional Service Corporation (January 1993- April 1998). President — Goldman Sachs Fund Complex (November 2007-Present); Senior Vice President — Goldman Sachs Fund Complex (May 2007-November 2007); and Vice President — Goldman Sachs Fund Complex (2001-2007). Trustee — Goldman Sachs Fund Complex (November 2007-Present and December 2002-May 2004). | | | 127 | | | None |
Alan A. Shuch Age: 65 | | Trustee | | Since 1990 | | Advisory Director — GSAM (May 1999-Present); Consultant to GSAM (December 1994-May 1999); and Limited Partner, Goldman Sachs (December 1994-May 1999). Trustee — Goldman Sachs Fund Complex. | | | 108 | | | None |
| | | | | | | | | | | | |
| * | These persons are considered to be “Interested Trustees” because they hold positions with Goldman Sachs and own securities issued by The Goldman Sachs Group, Inc. Each Interested Trustee holds comparable positions with certain other companies of which Goldman Sachs, GSAM or an affiliate thereof is the investment adviser, administrator and/or distributor. |
| 1 | Each Trustee may be contacted by writing to the Trustee, c/o Goldman Sachs, 200 West Street, New York, New York, 10282, Attn: Caroline Kraus. Information is provided as of December 31, 2014. |
| 2 | Each Trustee holds office for an indefinite term until the earliest of: (a) the election of his or her successor; (b) the date the Trustee resigns or is removed by the Board of Trustees or shareholders, in accordance with the Trust’s Declaration of Trust; (c) December 31st of the year in which the Trustee turns 74 years of age, subject to waiver by a majority of the Trustees (in accordance with the current resolutions of the Board of Trustees, which may be changed by the Trustees without shareholder vote); or (d) the termination of the Trust. By resolution of the Board of Trustees determining that an extension of service would be beneficial to the Trust, the retirement age has been extended with respect to Richard P. Strubel. |
| 3 | The Goldman Sachs Fund Complex consists of the Trust and Goldman Sachs Trust (“GST”). As of December 31, 2014, the Trust consisted of 14 portfolios and GST consisted of 94 portfolios (88 of which offered shares to the public). The Goldman Sachs Fund Complex also includes, with respect to Messrs. Bakhru, Coblentz and Strubel, Goldman Sachs Trust II (“GSTII”), Goldman Sachs BDC, Inc. (“GSBDC”), Goldman Sachs MLP Income Opportunities Fund (“GSMLP”), Goldman Sachs MLP and Energy Renaissance Fund (“GSMER”) and Goldman Sachs ETF Trust (“GSETF”), and with respect to Mr. McNamara, GSTII, GSMLP, GSMER and GSETF. GSTII consisted of 6 portfolios (one of which offered shares to the public). GSBDC, GSMLP and GSMER each consisted of one portfolio. GSETF consisted of 11 portfolios (none of which offered shares to the public). As of December 31, 2014, GSBDC had not offered shares to the public. |
| 4 | This column includes only directorships of companies required to report to the Securities and Exchange Commission under the Securities Exchange Act of 1934 (i.e., “public companies”) or other investment companies registered under the Act. |
Additional information about the Trustees is available in the Fund’s Statement of Additional Information, which can be obtained from Goldman Sachs free of charge by calling this toll-free number (in the United States of America): 1-800-292-4726.
26
GOLDMAN SACHS VARIABLE INSURANCE TRUST MID CAP VALUE FUND
Trustees and Officers (Unaudited) (continued)
Officers of the Trust*
| | | | | | |
| | | |
Name, Address and Age1 | | Position(s) Held With the Trust | | Term of
Office and
Length of
Time Served2 | | Principal Occupation(s) During Past 5 Years |
James A. McNamara
200 West Street New York, NY 10282 Age: 52 | | President and Trustee | | Since 2007 | | Managing Director, Goldman Sachs (December 1998-Present); Director of Institutional Fund Sales, GSAM (April 1998-December 2000); and Senior Vice President and Manager, Dreyfus Institutional Service Corporation (January 1993-April 1998). President — Goldman Sachs Fund Complex (November 2007-Present); Senior Vice President — Goldman Sachs Fund Complex (May 2007-November 2007); and Vice President — Goldman Sachs Fund Complex (2001-2007). Trustee — Goldman Sachs Fund Complex (November 2007-Present and December 2002-May 2004). |
Caroline L. Kraus
200 West Street New York, NY 10282 Age: 37 | | Secretary | | Since 2012 | | Vice President, Goldman Sachs (August 2006-Present); Associate General Counsel, Goldman Sachs (2012-Present); Assistant General Counsel, Goldman Sachs (August 2006-December 2011) and Associate, Weil, Gotshal & Manges, LLP (2002-2006). Secretary — Goldman Sachs Fund Complex (August 2012-Present) and Assistant Secretary — Goldman Sachs Fund Complex (June 2012-August 2012). |
Scott M. McHugh
200 West Street New York, NY 10282 Age: 43 | | Principal Financial
Officer, Senior Vice
President and
Treasurer | | Since 2009
(Principal
Financial
Officer since
2013) | | Vice President, Goldman Sachs (February 2007-Present); Assistant Treasurer of certain mutual funds administered by DWS Scudder (2005-2007); and Director (2005-2007), Vice President (2000-2005) and Assistant Vice President (1998-2000), Deutsche Asset Management or its predecessor (1998-2007). Principal Financial Officer — Goldman Sachs Fund Complex (November 2013-Present); Treasurer — Goldman Sachs Fund Complex (October 2009-Present); Senior Vice President — Goldman Sachs Fund Complex (November 2009-Present); and Assistant Treasurer — Goldman Sachs Fund Complex (May 2007-October 2009). |
| | | | | | |
| * | Represents a partial list of officers of the Trust. Additional information about all the officers is available in the Fund’s Statement of Additional Information, which can be obtained from Goldman Sachs free of charge by calling this toll-free number (in the United States): 1-800-292-4726. |
| 1 | Information is provided as of December 31, 2014. |
| 2 | Officers hold office at the pleasure of the Board of Trustees or until their successors are duly elected and qualified. Each officer holds comparable positions with certain other companies of which Goldman Sachs, GSAM or an affiliate thereof is the investment adviser, administrator and/or distributor. |
27
GOLDMAN SACHS VARIABLE INSURANCE TRUST MID CAP VALUE FUND
Goldman Sachs Variable Insurance Trust — Tax Information (Unaudited)
For the year ended December 31, 2014, 20.05% of the dividends paid from net investment company taxable income by the Mid Cap Value Fund qualify for the dividends received deduction available to corporations.
Pursuant to Section 852 of the Internal Revenue Code, the Mid Cap Value Fund designates $115,857,033 or, if different, the maximum amount allowable, as capital gain dividends paid during the fiscal year ended December 31, 2014.
28
| | |
| TRUSTEES | | OFFICERS |
| Ashok N. Bakhru, Chairman | | James A. McNamara, President |
| John P. Coblentz, Jr. | | Scott M. McHugh, Principal Financial Officer |
| Diana M. Daniels | | and Treasurer |
| Joseph P. LoRusso | | Caroline L. Kraus, Secretary |
| Herbert J. Markley | | |
| James A. McNamara | | |
| Jessica Palmer | | |
| Alan A. Shuch | | |
| Richard P. Strubel | | |
| Roy W. Templin | | |
GOLDMAN, SACHS & CO.
Distributor and Transfer Agent
GOLDMAN SACHS ASSET MANAGEMENT, L.P.
Investment Adviser
200 West Street, New York
New York 10282
Visit our web site at www.GSAMFUNDS.com to obtain the most recent month-end returns.
The reports concerning the Fund included in this shareholder report may contain certain forward-looking statements about the factors that may affect the performance of the Fund in the future. These statements are based on Fund management’s predictions and expectations concerning certain future events and their expected impact on the Fund, such as performance of the economy as a whole and of specific industry sectors, changes in the levels of interest rates, the impact of developing world events, and other factors that may influence the future performance of the Fund. Management believes these forward-looking statements to be reasonable, although they are inherently uncertain and difficult to predict. Actual events may cause adjustments in portfolio management strategies from those currently expected to be employed.
A description of the policies and procedures that the Fund uses to determine how to vote proxies relating to portfolio securities and information regarding how the Fund voted proxies relating to portfolio securities for the 12-month period ended December 31 is available (i) without charge, upon request by calling 1-800-621-2550; and (ii) on the Securities and Exchange Commission (“SEC”) web site at http://www.sec.gov.
The Fund files its complete schedule of portfolio holdings with the SEC for the first and third quarters of each fiscal year on Form N-Q. The Fund’s Form N-Qs are available on the SEC’s web site at http://www.sec.gov within 60 days after the Fund’s first and third fiscal quarters. The Fund’s Form N-Qs may be reviewed and copied at the SEC’s Public Reference Room in Washington, D.C. and information on the operation of the Public Reference Room may also be obtained by calling 1-800-SEC-0330. Form N-Qs may be obtained upon request and without charge by calling 1-800-621-2550.
The website links provided are for your convenience only and are not an endorsement or recommendation by GSAM of any of these websites or the products or services offered. GSAM is not responsible for the accuracy and validity of the content of these websites.
Fund holdings and allocations shown are as of December 31, 2014 and may not be representative of future investments. Fund holdings should not be relied on in making investment decisions and should not be construed as research or investment advice regarding particular securities. Current and future holdings are subject to risk.
The Global Industry Classification Standard (“GICS”) was developed by and is the exclusive property and a service mark of Morgan Stanley Capital international Inc. (“MSCI”) and Standard & Poor’s, a division of The McGraw-Hill Companies, Inc. (“S&P”) and is licensed for use by Goldman Sachs. Neither MSCI, S&P nor any other party involved in making or compiling the GICS or any GICS classifications makes any express or implied warranties or representations with respect to such standard or classification (or the results to be obtained by the use thereof), and all such parties hereby expressly disclaim all warranties of originality, accuracy, completeness, merchantability or fitness for a particular purpose with respect to any of such standard or classification. Without limiting any of the foregoing, in no event shall MSCI, S&P, any of their affiliates or any third party involved in making or compiling the GICS or any GICS classifications have any liability for any direct, indirect, special, punitive, consequential or any other damages (including lost profits) even if notified of the possibility of such damages.
The portfolio risk management process includes an effort to monitor and manage risk, but does not imply low risk.
Shares of the Goldman Sachs VIT Funds are offered to separate accounts of participating life insurance companies for the purpose of funding variable annuity contracts and variable life insurance policies. Shares of the Fund are not offered directly to the general public. The variable annuity contracts and variable life insurance policies are described in the separate prospectuses issued by participating insurance companies. You should refer to those prospectuses for information about surrender charges, mortality and expense risk fees and other charges that may be assessed by participating insurance companies under the variable annuity contracts or variable life insurance policies. Such fees or charges, if any, may affect the return you may realize with respect to your investments. Ask your representative for more complete information. Please consider a fund’s objectives, risks and charges and expenses, and read the prospectus carefully before investing. The prospectus contains this and other information about the Fund.
This material is not authorized for distribution to prospective investors unless preceded or accompanied by a current Prospectus or summary prospectus, if applicable. Investors should consider a Fund’s objective, risks, and charges and expenses, and read the summary prospectus, if available, and/or the Prospectus carefully before investing or sending money. The summary prospectus, if available, and the Prospectus contain this and other information about a Fund and may be obtained from your Authorized Institution or from Goldman, Sachs & Co. by calling 1-800-621-2550.
This report is prepared for the general information of contract owners and is not an offer of shares of the Goldman Sachs Variable Insurance Trust: Goldman Sachs Mid Cap Value Fund.
© 2015 Goldman Sachs. All rights reserved.
VITMCVAR-15/153902.MF.MED.TMPL/2/2015
Goldman
Sachs Variable Insurance Trust
Goldman Sachs
Money Market Fund
Annual Report
December 31, 2014
GOLDMAN SACHS VARIABLE INSURANCE TRUST MONEY MARKET FUND
Principal Investment Strategies and Risks
This is not a complete list of risks that may affect the Fund. For additional information concerning the risks applicable to the Fund, please see the Fund’s Prospectuses.
Shares of the Goldman Sachs Variable Insurance Trust — Goldman Sachs Money Market Fund are offered to separate accounts of participating life insurance companies for the purpose of funding variable annuity contracts and variable life insurance policies. Shares of the Fund are not offered directly to the general public. The variable annuity contracts and variable life insurance policies are described in the separate prospectuses issued by participating insurance companies. You should refer to those prospectuses for information about surrender charges, mortality and expense risk fees and other charges that may be assessed by participating insurance companies under the variable annuity contracts or variable life insurance policies. Such fees or charges, if any, may affect the return you realize with respect to your investments. Ask your representative for more complete information. Please consider the Fund’s objective, risks and charges and expenses, and read the Prospectus carefully before investing. The Prospectus contains this and other information about the Fund.
The Goldman Sachs Money Market Fund seeks to maximize current income to the extent consistent with the preservation of capital and the maintenance of liquidity by investing exclusively in high quality money market instruments. The Fund pursues its investment objective by investing in U.S. Government Securities (as defined in the Fund’s prospectus), obligations of U.S. banks, commercial paper and other short-term obligations of U.S. companies, states, municipalities and other entities and repurchase agreements. The Fund may also invest in U.S. dollar-denominated obligations of foreign banks, foreign companies and foreign governments.
An investment in the Fund is neither insured nor guaranteed by the Federal Deposit Insurance Corporation or any other government agency. Although the Fund seeks to preserve the value of an investment at $1.00 per share, it is possible to lose money by investing in the Fund.
1
GOLDMAN SACHS VARIABLE INSURANCE TRUST MONEY MARKET FUND
INVESTMENT OBJECTIVE
The Fund seeks to maximize current income to the extent consistent with the preservation of capital and the maintenance of liquidity by investing exclusively in high quality money market instruments.
Portfolio Management Discussion and Analysis
Below, the Goldman Sachs Money Market Portfolio Management Team discusses the Goldman Sachs Variable Insurance Trust — Goldman Sachs Money Market Fund’s (the “Fund”) performance and positioning for the 12-month period ended December 31, 2014 (the “Reporting Period”).
What were the Fund’s yields as of December 31, 2014?
The Fund’s Institutional Shares’ standardized 7-day current yield was 0.04% and its standardized 7-day effective yield was also 0.04% as of December 31, 2014. The Fund’s one-month simple average yield was 0.03% as of December 31, 2014. The Fund’s 7-day distribution yield as of December 31, 2014 was 0.04%.
The Fund’s Service Shares’ standardized 7-day current yield was 0.01% and its standardized 7-day effective yield was also 0.01% as of December 31, 2014. The Fund’s one-month simple average yield was 0.01% as of December 31, 2014. The Fund’s 7-day distribution yield as of December 31, 2014 was 0.01%.
The yields represent past performance. Past performance does not guarantee future results. Current performance may be lower or higher than the performance quoted above.
Yields will fluctuate as market conditions change. The yield quotations more closely reflect the current earnings of the Fund than total return quotations.
What economic and market factors most influenced the money markets as a whole during the Reporting Period?
The Reporting Period was one wherein money market yields remained low throughout, as the Federal Reserve (the “Fed”) kept its target rate near zero and continued its forward guidance for continued low rates in conjunction with the tapering of its asset purchases and then the ending of its quantitative easing program as scheduled in October 2014.
Longer-dated U.S. Treasury yields declined during the first quarter of 2014 overall, as economic data weakened primarily as a result of inclement winter weather. That said, U.S. Treasury yields did rise toward the end of the first calendar quarter when, following the Fed’s March meeting, the Fed’s rates projections showed a slightly more aggressive path for policy tightening, and the language regarding the 6.5% unemployment threshold as a condition for raising interest rates was dropped. With respect to tapering asset purchases, the Fed maintained its pace of reduction that began in January 2014, bringing the monthly level down by $10 billion per month. The Fed’s March 2014 press conference provided a notable moment when, in response to a question on the timeline between the end of quantitative easing and an increase in the federal funds rate, Fed Chair Yellen’s response was “something on the order of six months.” Given the pace of asset purchases, this implied a rate hike sometime in mid-2015. While this was consistent with market pricing prior to the meeting, Eurodollar futures, fed funds futures and short- to intermediate-term U.S. Treasuries all sold off sharply in response to the “six months” comment.
Also in March 2014, first quarter 2014 nonfarm payroll and unemployment reports showed an improved labor market relative to reports earlier in the calendar year. The U.S. added 192,000 new jobs, as the participation rate rose from 63.0% to 63.2%, while the headline unemployment rate held steady at 6.7%. This improvement in the labor market at the end of the first quarter of 2014 provided some indication that weather played a role in the weaker economic data seen in January and February 2014. Market reaction was somewhat surprising, as the U.S. Treasury market rallied following the labor market reports, while equity markets moved lower.
During the second quarter of 2014, payroll and unemployment reports continued to show improved labor market conditions. April 2014 nonfarm payrolls were well ahead of consensus at 288,000 versus an expected 218,000. Nonfarm payrolls came in at 217,000 in May 2014, close to consensus, and then beat consensus again for June 2014 with 288,000 versus an expected 215,000. Such numbers placed the three-month average of nonfarm payrolls at 272,000, as the previous months were adjusted up to 304,000 and 224,000, respectively, in June 2014. The headline unemployment rate declined, reaching 6.1% by the end of the second calendar
2
GOLDMAN SACHS VARIABLE INSURANCE TRUST MONEY MARKET FUND
quarter. This was particularly positive, as the decline was not driven by falling participation but rather by a strong showing in the household survey.
While payrolls were mostly positive, Gross Domestic Product (“GDP”) for the first calendar quarter was revised down significantly in June 2014. This first quarter GDP revision — to -2.9% compared to -1.8% expected — was largely driven by weaker health care spending, exports and inventories. The weaker than expected health care spending — largely driven by how the U.S. Commerce Department has accounted for the Affordable Care Act — led the Goldman Sachs economics team to reduce its second quarter 2014 GDP tracking estimate from +4.0% to +3.5%.
The European Central Bank (“ECB”) cut its interest rates by 10 basis points in June 2014, resulting in a negative deposit rate. (A basis point is 1/100th of a percentage point.) The ECB also announced a set of unconventional measures, including targeted long-term refinancing operations (“TLTROs”) and the ending of the Securities Market Program (“SMP”) sterilization. (TLTROs are a two-step plan, with a first phase linked to the outstanding amount of bank loans to the non-financial private sector and a second phase linked to the flow of net lending. The SMP was a bond-buying plan of the ECB’s designed to address tensions in certain market segments that hampered its monetary policy transmission mechanism. The SMP aims to influence prices in the entire euro area via its interest rates.) Communications from Bank of England (“BoE”) Governor Mark Carney suggested the possibility of an earlier rate hike than markets had projected, explaining that raising rates earlier would allow for a more gradual increase. Following the statements, markets shifted to price the first rate hike around late 2014.
The Global Manufacturing Purchasing Managers’ Index (“PMI”) rose to a four-month high of 52.7 in June 2014 compared to 52.1 in May 2014, with the U.S. and the U.K. experiencing some of the largest manufacturing output growth. The PMI had signaled expanding global manufacturing activity for 19 consecutive months at the end of June 2014.
U.S. economic data continued to strengthen somewhat during the third calendar quarter, especially within the labor market, where unemployment declined to 5.9%, though this was partially driven by a drop in labor force participation. Approximately 248,000 jobs were added in September 2014, and the previous two months were revised upward by 69,000. The U.S. Treasury yield curve flattened during the third quarter of 2014. Five-year U.S. Treasury yields rose by 13 basis points, while 10-year U.S. Treasury yields fell by four basis points during the third calendar quarter. Much of the focus late in the third quarter of 2014 was on the Fed’s meeting and minutes. The Fed’s minutes were viewed by the market as leaning dovish, as they made considerable mention of the potential impact of weaker global economic growth, a strengthening U.S. dollar and a softening U.S. housing market.
While employment continued to improve and jobless claims were better than expected, average hourly earnings remained flat, and manufacturing data and consumer confidence came in below expectations in September 2014. Weaker global economic data and continued political tensions also continued to weigh on investor risk sentiment. As a result of persistently low inflation and weaker economic data, the ECB implemented further easing measures in the form of rate cuts, TLTROs and asset purchase programs.
U.S. economic data continued to show strength during the fourth quarter of 2014. Non-farm payrolls increased by 252,000 in December 2014, which followed an unexpectedly strong 353,000 increase in November 2014. The unemployment rate fell to 5.6%, though this was partially due to a decrease in labor force participation.
The Fed’s statement following its December 2014 meeting was slightly more dovish than expected, with the “considerable time” forward guidance language kept in and with the Fed judging that it can be “patient” before normalizing, or raising, rates. The press conference following the meeting leaned a bit more on the hawkish side. Fed Chair Yellen indicated at the press conference that the guidance suggested rate hikes would not occur for “at least a couple of meetings.” At the end of the Reporting Period, the consensus was that a late-April or June 2015 hike is possible based on Yellen’s comments. The subsequent minutes noted that the Fed could hike rates with inflation at current levels, while oil and U.S. dollar moves were seen as pushing inflation “temporarily lower.” The Fed highlighted global concerns and reiterated that the timing of the first hike would be data dependent.
The Global Composite PMI declined slightly to 52.3 in December 2014 from 53.1 the previous month. The Global Composite PMI has fallen each month since hitting a three-year high in July 2014. U.S. output slowed toward the end of the year 2014 but remained solid.
There were also several money market fund reforms by the Securities & Exchange Commission (“SEC”) during the Reporting Period. As part of a global push to safeguard money market funds, on July 23, 2014, the SEC approved changes to the rules governing U.S. money market funds under the Investment Company Act of 1940. Three of the five SEC Commissioners approved the amendments, which were initially proposed in July 2013. On August 14, 2014, these amendments were posted to the Federal Register. Though the changes are significant, it is important to note that implementation is not required for some time, so there is no immediate impact on money market funds.
3
GOLDMAN SACHS VARIABLE INSURANCE TRUST MONEY MARKET FUND
The new rules represent a substantial change for the industry, and they vary based on the type of fund and investor. For purposes of the amendments, money market funds are divided into three categories: 1) government funds, which are now required to invest at least 99.5% of total assets (previously 80%) in cash, U.S. government securities (as defined in Section 2(a)(16) of the 1940 Act) and/or repurchase agreements “collateralized fully” by cash or U.S. government securities; 2) institutional prime funds, which invest primarily in credit instruments; and 3) municipal/tax-exempt funds, which invest in municipal and tax-exempt securities. In addition, the rules provide a distinction between retail and institutional money market funds. To be considered a retail fund, the fund must maintain policies and procedures reasonably designed to limit all beneficial owners of the fund to natural persons. The new requirements include:
| • | | Floating net asset value (“NAV”) — Only institutional prime and institutional municipal/tax-exempt funds will be required to move to a floating NAV. Funds subject to this requirement will need to round daily NAVs to the fourth decimal point (e.g., $1.0000), rather than the current practice whereby NAVs are fixed at $1.00 per share. |
| • | | Liquidity fees and redemption gates — Under the new rules, all money market funds (except for government money market funds, for which liquidity fees and gates are optional) may impose fees or temporarily suspend redemptions if the fund’s level of weekly liquid assets falls below a certain threshold: |
| | ¡ | | If a fund’s weekly liquid assets fall below 30%, the board would be allowed to impose a liquidity fee of up to 2% on all redemptions and/or suspend investor redemptions for up to 10 business days during any 90-day period. |
| | ¡ | | If a fund’s weekly liquid assets fall below 10%, the board is required to impose a 1% liquidity fee unless the board determines to impose a different fee or no fee. |
| | ¡ | | A fund is not under any circumstances obliged to impose a liquidity fee or redemption gate. |
| • | | In addition, all money market funds are subject to new diversification and enhanced stress-testing requirements, along with further disclosure and reporting requirements. |
In order to provide market participants adequate time to prepare for these changes, the compliance date for the amendments relating to floating NAV and liquidity fees and redemption gates is October 14, 2016, while shorter compliance periods apply to the other money market funds reforms. The changes will have little impact on Goldman Sachs Asset Management’s general investment strategy with respect to money market funds, which is a conservative risk-managed approach to provide liquidity solutions that fit clients’ needs, no matter what the market environment or constraints.
What key factors were responsible for the Fund’s performance during the Reporting Period?
The Fund’s yields remained low during the Reporting Period due primarily to the market factors discussed above. With the targeted federal funds rate near zero throughout the Reporting Period and with the Fed maintaining its forward guidance for continued low rates in conjunction with its tapering and then ending of its asset purchases, money market yields remained anchored near the same level with little difference between maturities. Further, the money market yield curve, or spectrum of maturities, was extremely flat during most of the Reporting Period, only steepening a bit toward the end of the Reporting Period as longer-term rates rose slightly. The Fund remained highly liquid throughout.
During the first quarter of 2014, the dominant secular themes of reserve creation and a scarcity of high quality assets were the key drivers of money market rates, as the front, or short-term, end of the yield curve was well bid, or actively invested. The Fund maintained a shorter weighted average maturity in anticipation of temporary increases in front-end rates, with the expectation to opportunistically extend in the near term. General collateral repurchase agreement (“repo”) rates and U.S. Treasury bill yields remained at very low levels throughout the quarter, beginning in low-single digits and eventually rising into the mid-single digits toward the end of the first calendar quarter, pinned close to the level of the Fed’s repo facility.
The U.S. Treasury bill curve remained quite flat during the second quarter of 2014, offering very little value for extending maturities. The U.S. Treasury, agency and general collateral repo curves were pricing in little chance of a meaningful change in overnight rates nor offering much term premium. (Term Premium is defined as the amount by which the yield-to-maturity of a longer-term security exceeds that of a shorter-term security. The amount of a term premium depends on the interest rates of the individual securities.) As a result, we kept the Fund’s weighted average maturity short. General collateral repo rates remained pinned near the level of the Fed facility for much of the quarter, only rising above the facility level toward the end of May 2014 and beginning of June 2014, causing usage of the Fed facility to decline during that time.
During the third quarter of 2014, the U.S. Treasury and agency security curves remained flat out to nine to 10 months, but offered some premium beyond that. General collateral repo levels remained pinned near the level of the Fed’s repo facility for much of the third calendar quarter, as the seasonal period of bill pay-downs exacerbated the supply/demand imbalance in the short-term end of the curve. General collateral repo did begin to trade through the Fed’s reverse repurchase program (“RRP”) rate of 0.05% toward
4
GOLDMAN SACHS VARIABLE INSURANCE TRUST MONEY MARKET FUND
the end of the third quarter of 2014 after the Fed announced a daily cap on the RRP facility usage of $300 billion, meaning some counterparties may not get a full allocation if usage rises above the cap. (The Fed’s RRP is a program wherein the Fed lends out collateral from its balance sheet against cash from the Federal Home Loan Banks and large money market funds. Depending on demand, this facility provided up to $300 billion in additional liquidity to the market on a daily basis during much of the Reporting Period and was instrumental in providing a floor to rates, especially at critical periods like month- and quarter-ends.)
The U.S. Treasury and agency security curves remained flat out to 9 to 10 months, but offered some premium beyond that during the fourth quarter of 2014 just as it had in the prior quarter. General collateral repo became less expensive throughout the fourth calendar quarter, and rates stayed elevated above the Fed’s RRP facility, as we entered a period of increased supply and additional bill issuance. The Fed also began testing different rates in the RRP facility, decreasing the offering rate to three basis points and rising it to seven basis points and 10 basis points for two week spans. Average usage during the fourth quarter of 2014 in the overnight RRP facility was $123 billion. The RRP facility was extended for another year until January 2016, and more testing could be expected before the “lift off” of short-term interest rates, as the Fed is terming its anticipated first rate hike. The New York Fed also utilized term RRP operations during December 2014. These operations were held each Monday from December 8, 2014 through December 29, 2014 (four in total) with all operations maturing January 5, 2015. This additional term operation resulted in a reduction in the overnight RRP facility takedown, or usage.
We felt comfortable that the Fund was appropriately positioned given the interest rate environment during the Reporting Period. While conditions throughout the Reporting Period did not provide bountiful opportunities to pick up yield, as the interest rate yield curve was flat through most of the Reporting Period, it should be noted that regardless of interest rate conditions, we manage the Fund consistently. Our investment approach has always been tri-fold — to seek preservation of capital, daily liquidity and maximization of potential yield. We manage interest and credit risk daily. Whether interest rates are historically low, high or in-between, we intend to continue to use our actively managed approach to provide the best possible return within the framework of the Fund’s guidelines and objectives.
How did you manage the Fund’s weighted average maturity during the Reporting Period?
On December 31, 2013, the Fund’s weighted average maturity was 52 days. During the first quarter of 2014, we maintained the Fund’s weighted average maturity in a 45 to 55 day range. During the second and third quarters of 2014, we maintained the Fund’s weighted average maturity in a 35 to 50 day range. During the fourth quarter of 2014, we maintained the Fund’s weighted average maturity in a 45 to 55 day range. Throughout the Reporting Period, we made adjustments in line with our outlook on interest rates, Fed policy and the shape of the yield curve over the near term. The Fund’s weighted average maturity on December 31, 2014 was 46 days. The weighted average maturity of a money market fund is a measure of its price sensitivity to changes in interest rates. Also known as effective maturity, weighted average maturity measures the weighted average of the maturity date of bonds held by the Fund taking into consideration any available maturity shortening features.
How did you manage the Fund’s weighted average life during the Reporting Period?
The weighted average life of the Fund was 84 days as of December 31, 2014. The weighted average life of a money market fund is a measure of a money market fund’s price sensitivity to changes in liquidity and/or credit risk.
Under amendments to SEC Rule 2a-7 that became effective in May 2010, the maximum allowable weighted average life of a money market fund is 120 days. While one of the goals of the SEC’s money market fund rule is to reinforce conservative investment practices across the money market fund industry, our security selection process has long emphasized conservative investment choices.
How was the Fund invested during the Reporting Period?
The Fund had investments in commercial paper, asset-backed commercial paper, U.S. Treasury securities, government agency securities, repurchase agreements, government guaranteed paper, variable rate demand notes, municipal debt and certificates of deposit during the Reporting Period. We focused on securities across the maturity spectrum, from overnight repurchase agreements to securities with one-year maturities. We preferred secured positions to unsecured positions.
With yields bound near zero, there was not a lot of dispersion in performance among securities available for purchase. Throughout, though, we stayed true to our investment discipline, favoring liquidity and high quality credits over added yield. The primary focal points for our team are consistently managing interest rate risk and credit risk. We were able to navigate interest rate risk by adjusting the Fund’s weighted average maturity longer or shorter as market conditions shifted and to mitigate potential credit risk by buying high quality, creditworthy names, strategies which added to the Fund’s performance during the Reporting Period.
5
GOLDMAN SACHS VARIABLE INSURANCE TRUST MONEY MARKET FUND
Did you make any changes in the Fund’s portfolio during the Reporting Period?
We did not make any significant changes in the Fund’s portfolio during the Reporting Period. As indicated earlier, we made adjustments to the Fund’s weighted average maturity based on then-current market conditions, our near-term view, and anticipated and actual Fed monetary policy statements. Also, the Fund’s allocations to commercial paper and corporate obligations, Yankee certificates of deposit and eurodollar certificates of deposit decreased from the beginning to the end of the Reporting Period, while its exposure to repurchase agreements and fixed rate municipal debt obligations increased.
What is the Fund’s tactical view and strategy for the months ahead?
We do not believe the Fed will begin raising short-term interest rates until mid-2015. Given our view, we expect to keep the Fund conservatively positioned as we continue to focus on preservation and daily liquidity. We do not believe there is value in sacrificing liquidity in exchange for opportunities that only modestly increase yield potential. We will continue to use our actively managed approach to seek the best possible return within the framework of the Fund’s investment guidelines and objectives. In addition, we will continue to manage interest, liquidity and credit risk daily.
We will, of course, continue to closely monitor economic data, Fed policy, and any shifts in the money market yield curve, as we strive to strategically navigate the interest rate environment.
6
FUND BASICS
FUND COMPOSITION†
Security Type
(Percentage of Net Assets)
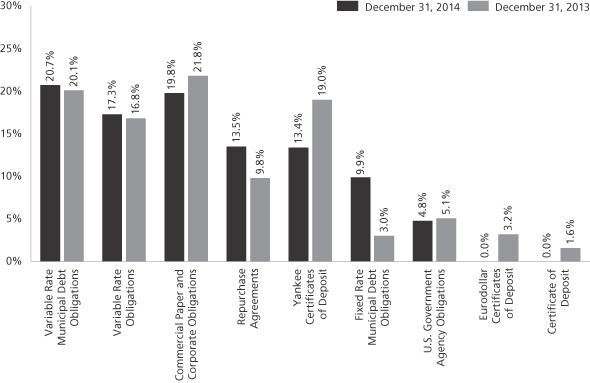
| † | The Fund is actively managed and, as such, its portfolio composition may differ over time. The percentage shown for each investment category reflects the value (based on amortized cost) of investments in that category as a percentage of net assets. Figures in the above chart may not sum to 100% due to the exclusion of other assets and liabilities. |
7
GOLDMAN SACHS VARIABLE INSURANCE TRUST MONEY MARKET FUND
Schedule of Investments
December 31, 2014
| | | | | | | | | | | | | | |
Principal
Amount | | | Interest
Rate | | | Maturity
Date | | | Amortized
Cost | |
| | Commercial Paper and Corporate Obligations – 19.8% | |
| Bank of Tokyo-Mitsubishi UFJ Ltd. (The) | |
| $ | 8,000,000 | | | | 3.850 | %(b) | | | 01/22/15 | | | $ | 8,014,946 | |
| Bedford Row Funding Corp. | |
| | 3,000,000 | | | | 0.311 | | | | 08/25/15 | | | | 2,993,903 | |
| Dexia Credit Local New York Branch | |
| | 5,000,000 | | | | 0.306 | | | | 05/20/15 | | | | 4,994,112 | |
| Electricite de France | |
| | 1,000,000 | | | | 0.553 | | | | 01/02/15 | | | | 999,985 | |
| | 1,000,000 | | | | 0.553 | | | | 01/06/15 | | | | 999,924 | |
| | 3,000,000 | | | | 0.756 | | | | 01/15/16 | | | | 2,976,312 | |
| Gotham Funding Corp. | |
| | 5,000,000 | | | | 0.180 | | | | 02/02/15 | | | | 4,999,200 | |
| Jupiter Securitization Co. LLC | |
| | 1,000,000 | | | | 0.271 | | | | 04/13/15 | | | | 999,235 | |
| | 3,000,000 | | | | 0.271 | | | | 07/30/15 | | | | 2,995,275 | |
| Kaiser Foundation Hospitals | |
| | 2,155,000 | | | | 0.170 | | | | 01/12/15 | | | | 2,154,888 | |
| | 2,000,000 | | | | 0.250 | | | | 04/03/15 | | | | 1,998,722 | |
| LMA Americas LLC | |
| | 7,000,000 | | | | 0.180 | | | | 01/12/15 | | | | 6,999,615 | |
| Matchpoint Master Trust | |
| | 9,400,000 | | | | 0.210 | | | | 02/02/15 | | | | 9,398,245 | |
| NRW Bank | |
| | 5,000,000 | | | | 0.145 | | | | 01/07/15 | | | | 4,999,879 | |
| Standard Chartered Bank | |
| | 5,000,000 | | | | 0.250 | | | | 02/10/15 | | | | 4,998,611 | |
| | |
| TOTAL COMMERCIAL PAPER AND
CORPORATE OBLIGATIONS |
| | $ | 60,522,852 | |
| | |
| | | | | | | | | | | | | | |
| | Fixed Rate Municipal Debt Obligations – 9.9% | |
| Baptist Memorial Health Care, Tennessee | |
| $ | 2,000,000 | | | | 0.180 | % | | | 01/20/15 | | | $ | 2,000,000 | |
| City of Newport News, Virginia GO Taxable Series 2012 B | |
| | 3,385,000 | | | | 0.789 | | | | 07/15/15 | | | | 3,392,941 | |
| DeKalb County, Georgia Development Authority for Emory
University Project Series 1994-B |
|
| | 3,355,000 | | | | 0.170 | | | | 02/18/15 | | | | 3,354,780 | |
| Municipal Electric Authority of Georgia RB Taxable
Series 2011 A |
|
| | 1,180,000 | | | | 2.352 | | | | 01/01/15 | | | | 1,180,000 | |
| National Australia Bank Ltd. | |
| | 990,000 | | | | 1.600 | | | | 08/07/15 | | | | 997,071 | |
| New York City, New York Transitional Finance Authority
RB Future Tax Secured Series 2010 Subseries F-3 |
|
| | 2,095,000 | | | | 3.070 | | | | 02/01/15 | | | | 2,099,862 | |
| Rutgers State University of New Jersey Series 2014 C
(Wachovia Bank, LIQ) |
|
| | 3,000,000 | | | | 0.180 | | | | 03/05/15 | | | | 3,000,000 | |
| South Carolina Association of Governmental Organizations
Taxable COPS Series 2014 B (South Carolina State Department
of Education) |
|
| | 3,000,000 | | | | 0.750 | | | | 03/02/15 | | | | 3,002,082 | |
| | |
| | Fixed Rate Municipal Debt Obligations – (continued) | |
| South Carolina State Public Service Authority Series 2014 DD
(Barclays Bank PLC, LOC) |
|
| $ | 1,500,000 | | | | 0.200 | % | | | 01/05/15 | | | $ | 1,500,000 | |
| State of California GO Various Purpose Series 2009-3 | |
| | 3,775,000 | | | | 5.450 | | | | 04/01/15 | | | | 3,821,161 | |
| State of Illinois RB for Build Illinois Taxable Series 2012 | |
| | 1,775,000 | | | | 1.064 | | | | 06/15/15 | | | | 1,780,056 | |
| The Regents of The University of California RB Taxable
Series 2013 AJ |
|
| | 300,000 | | | | 0.528 | | | | 05/15/15 | | | | 300,174 | |
| University of North Texas Series 2004 A (University of North
Texas, LIQ) |
|
| | 3,000,000 | | | | 0.230 | | | | 01/05/15 | | | | 3,000,000 | |
| University of Utah Series 2014-13-B | |
| | 1,000,000 | | | | 0.150 | | | | 01/09/15 | | | | 1,000,000 | |
| | |
| TOTAL FIXED RATE MUNICIPAL
DEBT OBLIGATIONS |
| | $ | 30,428,127 | |
| | |
| | | | | | | | | | | | | | |
| | U.S. Government Agency Obligations – 4.8% | |
| Federal Home Loan Bank | |
| $ | 5,000,000 | | | | 0.210 | % | | | 08/17/15 | | | $ | 5,000,000 | |
| | 300,000 | | | | 0.250 | | | | 10/05/15 | | | | 300,000 | |
| | 3,000,000 | | | | 0.263 | | | | 10/09/15 | | | | 3,000,000 | |
| Overseas Private Investment Corp. (USA) | |
| | 6,500,000 | | | | 0.110 | (a) | | | 01/07/15 | | | | 6,500,000 | |
| | |
| TOTAL U.S. GOVERNMENT AGENCY
OBLIGATIONS |
| | $ | 14,800,000 | |
| | |
| | | | | | | | | | | | | | |
| | Variable Rate Municipal Debt Obligations(a) – 20.7% | |
| ABAG California Finance Authority for Non-profit Corporations
VRDN RB for Bachenheimer Building Project Series 2002-A-T
(FNMA, LIQ) |
|
| $ | 865,000 | | | | 0.110 | % | | | 01/07/15 | | | $ | 865,000 | |
| ABAG California Finance Authority for Non-profit Corporations
VRDN RB for Berkeleyen Project Series 2003-A-T
(FNMA, LIQ) |
|
| | 700,000 | | | | 0.110 | | | | 01/07/15 | | | | 700,000 | |
| ABAG California Finance Authority for Non-profit Corporations
VRDN RB for Darling Florist Building Project Series 2002-A-T
(FNMA, LIQ) |
|
| | 140,000 | | | | 0.110 | | | | 01/07/15 | | | | 140,000 | |
| ABAG California Finance Authority for Non-profit Corporations
VRDN RB for GAIA Building Project Series 2000-A-T
(FNMA, LIQ) |
|
| | 100,000 | | | | 0.110 | | | | 01/07/15 | | | | 100,000 | |
| BlackRock Municipal Income Trust VRDN RB Putters
Series 2012-T0008 (JPMorgan Chase Bank N.A., LIQ) |
|
| | 1,000,000 | | | | 0.160 | (b) | | | 01/02/15 | | | | 1,000,000 | |
| BlackRock MuniVest Fund VRDN RB Putters Series 2012-T0005
(JPMorgan Chase Bank N.A., LIQ) |
|
| | 950,000 | | | | 0.160 | (b) | | | 01/02/15 | | | | 950,000 | |
| | |
| | |
| 8 | | The accompanying notes are an integral part of these financial statements. |
GOLDMAN SACHS VARIABLE INSURANCE TRUST MONEY MARKET FUND
| | | | | | | | | | | | | | |
Principal
Amount | | | Interest
Rate | | | Maturity
Date | | | Amortized
Cost | |
| | Variable Rate Municipal Debt Obligations(a) – (continued) | |
| Collier County, Florida Housing Finance Authority MF Hsg
VRDN RB for Brittany Bay Housing Series 2001-B
(FNMA, LIQ) |
|
| $ | 670,000 | | | | 0.110 | % | | | 01/07/15 | | | $ | 670,000 | |
| DeKalb County, Georgia Development Authority VRDN RB for
Emory University Series 1995-B (GO of University) |
|
| | 3,400,000 | | | | 0.100 | | | | 01/07/15 | | | | 3,400,000 | |
| Kentucky State Housing Corp. VRDN RB for Overlook Terrace
Series 2008-B (FNMA, LIQ) |
|
| | 690,000 | | | | 0.110 | | | | 01/07/15 | | | | 690,000 | |
| Los Angeles, California Community College District GO VRDN
for Build America Boards P-Floats Series 2010-TN-027
(Bank of America N.A., LIQ) |
|
| | 10,250,000 | | | | 0.420 | (b) | | | 01/07/15 | | | | 10,250,000 | |
| Massachusetts State Housing Finance Agency VRDN RB
Series 2009-B (Bank of NY Mellon, LOC) |
|
| | 6,104,000 | | | | 0.110 | | | | 01/07/15 | | | | 6,104,000 | |
| New York City, New York GO VRDN Series 2007 Subseries D-4
(BMO Harris Bank N.A., SPA) |
|
| | 250,000 | | | | 0.050 | | | | 01/07/15 | | | | 250,000 | |
| New York State Housing Finance Agency VRDN RB for 100
Maiden Lane Series 2004-B RMKT (FNMA, LIQ) |
|
| | 1,000,000 | | | | 0.190 | | | | 01/07/15 | | | | 1,000,000 | |
| New York State Housing Finance Agency VRDN RB for West
20th Street Series 2000-B RMKT (FNMA, LIQ) |
|
| | 300,000 | | | | 0.090 | | | | 01/07/15 | | | | 300,000 | |
| Nuveen Municipal Market Opportunity Fund, Inc. VRDP
Series 2010-1 (Deutsche Bank A.G., LIQ) |
|
| | 1,500,000 | | | | 0.160 | (b) | | | 01/07/15 | | | | 1,500,000 | |
| Nuveen Municipal Opportunity Fund, Inc. VRDP Series 2010
(Citibank N.A., LIQ) |
|
| | 1,000,000 | | | | 0.130 | (b) | | | 01/07/15 | | | | 1,000,000 | |
| Nuveen Premier Municipal Income Fund, Inc. VRDP Series 2011-
1-1277 (Barclays Bank PLC, LIQ) |
|
| | 1,000,000 | | | | 0.130 | (b) | | | 01/07/15 | | | | 1,000,000 | |
| Oglethorpe, Georgia Power Corp. VRDN RB Putters Series 2012-
SGT05 (NATL-RE FGIC) (Societe Generale, LIQ) |
|
| | 13,200,000 | | | | 0.130 | (b) | | | 01/02/15 | | | | 13,200,000 | |
| Port Authority of New York & New Jersey VRDN RB SPEARS
Series 2013-DB-1201 (GO of Authority)
(Deutsche Bank A.G., LIQ) |
|
| | 200,000 | | | | 0.090 | (b) | | | 01/07/15 | | | | 200,000 | |
| Port of Corpus Christi Authority of Nueces County, Texas VRDN
RB for Flint Hills Resources LP Project Series 2007 (GTY
AGMT-Flint Hills Resources LLC) |
|
| | 2,000,000 | | | | 0.090 | | | | 01/07/15 | | | | 2,000,000 | |
| Puttable Floating Option VRDN RB P-Floats
Series 2013-TNP-1006 (Multi-State)
(Bank of America N.A., LIQ) |
|
| | 10,855,000 | | | | 0.450 | (b) | | | 01/02/15 | | | | 10,855,000 | |
| Regional Transportation Authority, Illinois VRDN RB Putters
Series 2014-T0021 (JPMorgan Chase & Co., LIQ) |
|
| | 1,390,000 | | | | 0.110 | (b) | | | 01/02/15 | | | | 1,390,000 | |
| | |
| | Variable Rate Municipal Debt Obligations(a) – (continued) | |
| State of California GO VRDN SPEARS Series 2014-DBE-1342
(GTY AGMT—Deutsche Bank A.G.)
(Deutsche Bank A.G., LIQ) |
|
| $ | 500,000 | | | | 0.130 | %(b) | | | 01/07/15 | | | $ | 500,000 | |
| Tampa, Florida Revenue for Allegany Health Systems—St.
Mary’s VRDN RB P-Floats Series 2014-TNP-1011 (Bank of
America N.A., LIQ) |
|
| | 5,400,000 | | | | 0.450 | (b) | | | 01/02/15 | | | | 5,400,000 | |
| | |
| TOTAL VARIABLE RATE MUNICIPAL
DEBT OBLIGATIONS |
| | $ | 63,464,000 | |
| | |
| | | | | | | | | | | | | | |
| | Variable Rate Obligations(a) – 17.3% | |
| Australia & New Zealand Banking Group Ltd. | |
| $ | 5,000,000 | | | | 0.398 | %(b) | | | 10/16/15 | | | $ | 5,000,000 | |
| Bank of Montreal, Chicago | |
| | 5,000,000 | | | | 0.221 | | | | 04/13/15 | | | | 5,000,000 | |
| Bank of Nova Scotia (The) | |
| | 5,000,000 | | | | 0.363 | | | | 01/22/16 | | | | 5,000,000 | |
| BNZ International Funding Ltd. | |
| | 1,650,000 | | | | 0.281 | (b) | | | 10/15/15 | | | | 1,650,000 | |
| Commonwealth Bank of Australia | |
| | 3,000,000 | | | | 0.238 | (b) | | | 01/02/15 | | | | 3,000,000 | |
| Credit Suisse Securities (USA) LLC | |
| | 5,000,000 | | | | 0.257 | | | | 05/01/15 | | | | 5,000,000 | |
| JPMorgan Chase Bank NA | |
| | 4,000,000 | | | | 0.355 | | | | 01/07/16 | | | | 4,000,000 | |
| JPMorgan Securities LLC | |
| | 4,000,000 | | | | 0.352 | | | | 11/19/15 | | | | 4,000,000 | |
| Kells Funding LLC | |
| | 5,000,000 | | | | 0.242 | (b) | | | 05/15/15 | | | | 5,000,000 | |
| Providence Health & Services Obligated Group | |
| | 3,165,000 | | | | 0.885 | | | | 10/01/15 | | | | 3,172,233 | |
| Providence Health & Services Obligated Group
(U.S. Bank N.A., SBPA) |
|
| | 800,000 | | | | 0.110 | | | | 01/07/15 | | | | 800,000 | |
| Svenska Handelsbanken AB | |
| | 5,000,000 | | | | 0.431 | | | | 01/04/16 | | | | 5,000,000 | |
| Wells Fargo Bank N.A. | |
| | 2,500,000 | | | | 0.367 | | | | 01/20/16 | | | | 2,500,000 | |
| Westpac Banking Corp. | |
| | 4,000,000 | | | | 0.434 | (b) | | | 12/31/15 | | | | 4,000,000 | |
| | |
| TOTAL VARIABLE RATE
OBLIGATIONS |
| | $ | 53,122,233 | |
| | |
| | | | | | | | | | | | | | |
| | Yankee Certificates of Deposit – 13.4% | |
| Banco Del Estado De Chile, New York | |
| $ | 8,000,000 | | | | 0.210 | % | | | 03/02/15 | | | $ | 8,000,000 | |
| Cooperatieve Centrale Raiffeisen-Boerenleenbank BA | |
| | 3,000,000 | | | | 0.350 | | | | 01/09/15 | | | | 3,000,000 | |
| | 5,000,000 | | | | 0.395 | | | | 09/11/15 | | | | 5,000,000 | |
| | |
| | |
| The accompanying notes are an integral part of these financial statements. | | 9 |
GOLDMAN SACHS VARIABLE INSURANCE TRUST MONEY MARKET FUND
Schedule of Investments (continued)
December 31, 2014
| | | | | | | | | | | | | | |
Principal
Amount | | | Interest
Rate | | | Maturity
Date | | | Amortized
Cost | |
| | Yankee Certificates of Deposit – (continued) | |
| DZ Bank AG | |
| $ | 5,000,000 | | | | 0.310 | % | | | 02/13/15 | | | $ | 5,000,000 | |
| Norinchukin Bank | |
| | 5,000,000 | | | | 0.230 | | | | 01/16/15 | | | | 5,000,000 | |
| Sumitomo Mitsui Banking Corp. | |
| | 5,000,000 | | | | 0.230 | | | | 03/10/15 | | | | 5,000,000 | |
| Sumitomo Mitsui Trust Bank Ltd. | |
| | 10,000,000 | | | | 0.220 | | | | 02/23/15 | | | | 10,000,000 | |
| | |
| TOTAL YANKEE CERTIFICATES OF
DEPOSIT |
| | $ | 41,000,000 | |
| | |
| TOTAL INVESTMENTS BEFORE
REPURCHASE AGREEMENTS |
| | $ | 263,337,212 | |
| | |
| | | | | | | | | | | | | | |
| | Repurchase Agreements(c) – 13.5% | |
| BNP Paribas Securities Corp. | |
| $ | 3,000,000 | | | | 0.200 | % | | | 01/02/15 | | | $ | 3,000,000 | |
| Maturity Value: $3,000,033 | |
| Collateralized by various auction rate preferred securities, 5.500%
to 6.900%, perpetual maturity, various equity securities and
Exchange-Traded Funds. The aggregate market value of the
collateral, including accrued interest, was $3,240,002. |
|
| | 5,000,000 | | | | 0.450 | | | | 01/02/15 | | | | 5,000,000 | |
| Maturity Value: $5,000,125 | |
| Collateralized by various asset backed obligations, 0.270% to
7.184%, due 10/30/25 to 08/25/47 and a corporate security
issuer, 6.625%, due 10/01/22. The aggregate market value of
the collateral, including accrued interest, was $6,187,489. |
|
| | |
| ING Financial Markets LLC | |
| | 5,000,000 | | | | 0.150 | | | | 01/02/15 | | | | 5,000,000 | |
| Maturity Value: $5,000,042 | |
| Collateralized by Federal Home Loan Mortgage Corp., 3.500%,
due 10/01/42. The market value of the collateral, including
accrued interest, was $5,103,857. |
|
| | |
| Joint Repurchase Agreement Account III | |
| | 28,500,000 | | | | 0.088 | | | | 01/02/15 | | | | 28,500,000 | |
| Maturity Value: $28,500,139 | |
| | |
| | TOTAL REPURCHASE AGREEMENTS | | | $ | 41,500,000 | |
| | |
| | TOTAL INVESTMENTS – 99.4% | | | $ | 304,837,212 | |
| | |
| OTHER ASSETS IN EXCESS OF
LIABILITIES – 0.6% |
| | | 1,929,710 | |
| | |
| | NET ASSETS – 100.0% | | | $ | 306,766,922 | |
| | |
| | |
| The percentage shown for each investment category reflects the value of investments in that category as a percentage of net assets. |
| (a) | | Variable or floating rate security. Interest rate disclosed is that which is in effect at December 31, 2014. |
| (b) | | Security not registered under the Securities Act of 1933, as amended. Such securities have been determined to be liquid by the Investment Adviser. At December 31, 2014, these securities amounted to $73,909,946 or approximately 24.1% of net assets. |
| (c) | | Unless noted, all repurchase agreements were entered into on December 31, 2014. Additional information on Joint Repurchase Agreement Account III appears on page 11. |
|
| Interest rates represent either the stated coupon rate, annualized yield on date of purchase for discounted securities, or, for floating rate securities, the current reset rate, which is based upon current interest rate indices. |
|
| Maturity dates represent either the final legal maturity date on the security, the demand date for puttable securities, or the prerefunded date for those types of securities. |
| | |
| Investment Abbreviations: |
| COPS | | — Certificates of Participation |
| FGIC | | — Insured by Financial Guaranty Insurance Co. |
| FNMA | | — Insured by Federal National Mortgage Association |
| GO | | — General Obligation |
| GTY AGMT | | — Guaranty Agreement |
| LIQ | | — Liquidity Agreement |
| LOC | | — Letter of Credit |
| LP | | — Limited Partnership |
| MF Hsg | | — Multi-Family Housing |
| NATL-RE | | — National Reinsurance Corp. |
| RB | | — Revenue Bond |
| RMKT | | — Remarketed |
| SBPA | | — Standby Bond Purchase Agreement |
| SPA | | — Stand-by Purchase Agreement |
| SPEARS | | — Short Puttable Exempt Adjustable Receipts |
| VRDN | | — Variable Rate Demand Notes |
| VRDP | | — Variable Rate Demand Preferred Shares |
| | |
| 10 | | The accompanying notes are an integral part of these financial statements. |
GOLDMAN SACHS VARIABLE INSURANCE TRUST MONEY MARKET FUND
ADDITIONAL INVESTMENT INFORMATION
JOINT REPURCHASE AGREEMENT ACCOUNT III — At December 31, 2014, the Fund had undivided interests in the Joint Repurchase Agreement Account III, with a maturity date of January 2, 2015, as follows:
| | | | | | | | | | | | | |
| Principal Amount | | Maturity Value | | Collateral Value |
| | | $28,500,000 | | | | $ | 28,500,139 | | | | $ | 29,260,234 | |
REPURCHASE AGREEMENTS — At December 31, 2014, the Principal Amounts of the Fund’s interest in the Joint Repurchase Agreement Account III were as follows:
| | | | | | | | |
| Counterparty | | Interest Rate | | | Principal Amount | |
ABN Amro Bank N.V. | | | 0.110 | % | | $ | 5,071,174 | |
Credit Agricole Corporate and Investment Bank | | | 0.080 | | | | 8,215,302 | |
TD Securities USA, LLC | | | 0.090 | | | | 7,606,762 | |
Wells Fargo Securities, LLC | | | 0.080 | | | | 7,606,762 | |
| TOTAL | | | | | | $ | 28,500,000 | |
At December 31, 2014, the Joint Repurchase Agreement Account III was fully collateralized by:
| | | | | | |
| Issuer | | Interest Rates | | | Maturity Dates |
| Federal Farm Credit Bank | | | 4.875 | % | | 01/17/17 |
| Federal Home Loan Bank | | | 0.375 | | | 06/10/16 |
| Federal Home Loan Mortgage Corp. | | | 0.000 to 4.500 | | | 11/28/16 to 01/01/45 |
| Federal National Mortgage Association | | | 2.500 to 5.500 | | | 08/01/20 to 01/01/45 |
| Government National Mortgage Association | | | 2.000 to 6.000 | | | 07/15/23 to 12/20/44 |
| Tennessee Valley Authority | | | 0.000 | | | 06/15/26 to 03/15/39 |
| U.S. Treasury Inflation-Indexed Note | | | 0.125 | | | 04/15/16 |
| U.S. Treasury Note | | | 0.875 | | | 01/31/17 |
| | |
| The accompanying notes are an integral part of these financial statements. | | 11 |
GOLDMAN SACHS VARIABLE INSURANCE TRUST MONEY MARKET FUND
Statement of Assets and Liabilities
December 31, 2014
| | | | |
| | | | |
| Assets: | | | |
Investments based on amortized cost | | $ | 263,337,212 | |
Repurchase agreements based on amortized cost | | | 41,500,000 | |
Cash | | | 1,545,513 | |
Receivables: | | | | |
Fund shares sold | | | 731,871 | |
Interest | | | 359,480 | |
Reimbursement from investment adviser | | | 17,651 | |
Other assets | | | 6,182 | |
| Total assets | | | 307,497,909 | |
| | | | |
| | | | |
| Liabilities: | | | |
Payables: | | | | |
Fund shares redeemed | | | 605,272 | |
Management fees | | | 53,295 | |
Distribution and Service fees and Transfer Agent fees | | | 11,530 | |
Accrued expenses | | | 60,890 | |
| Total liabilities | | | 730,987 | |
| | | | |
| | | | |
| Net Assets: | | | |
Paid-in capital | | | 306,765,118 | |
Accumulated net realized gain (loss) from investments | | | 1,804 | |
| NET ASSETS | | $ | 306,766,922 | |
Net asset value, offering and redemption price per share | | | $1.00 | |
Net Assets: | | | | |
Institutional Shares | | $ | 772,881 | |
Service Shares | | | 305,994,041 | |
Total Net Assets | | $ | 306,766,922 | |
Shares of beneficial interest outstanding $0.001 par value (unlimited shares authorized): | | | | |
Institutional Shares | | | 772,877 | |
Service Shares | | | 305,992,222 | |
| | |
| 12 | | The accompanying notes are an integral part of these financial statements. |
GOLDMAN SACHS VARIABLE INSURANCE TRUST MONEY MARKET FUND
Statement of Operations
For the Fiscal Year Ended December 31, 2014
| | | | |
| | | | |
| Investment income: | | | |
Interest | | $ | 763,211 | |
| | | | |
| | | | |
| Expenses: | | | |
Distribution and Service fees — Service Shares | | | 796,880 | |
Management fees | | | 653,679 | |
Professional fees | | | 123,044 | |
Transfer Agent fees(a) | | | 63,773 | |
Printing and mailing costs | | | 44,439 | |
Custody, accounting and administrative services | | | 30,576 | |
Trustee fees | | | 21,993 | |
Other | | | 36,230 | |
| Total expenses | | | 1,770,614 | |
Less — expense reductions | | | (1,017,709 | ) |
| Net expenses | | | 752,905 | |
| NET INVESTMENT INCOME | | | 10,306 | |
| NET REALIZED GAIN FROM INVESTMENT TRANSACTIONS | | | 10,720 | |
| NET INCREASE IN NET ASSETS RESULTING FROM OPERATIONS | | $ | 21,026 | |
(a) Institutional and Service Shares had Transfer Agent fees of $22 and $63,751, respectively.
| | |
| The accompanying notes are an integral part of these financial statements. | | 13 |
GOLDMAN SACHS VARIABLE INSURANCE TRUST MONEY MARKET FUND
Statements of Changes in Net Assets
| | | | | | | | |
| | | For the Fiscal Year Ended December 31, 2014 | | | For the Fiscal Year Ended December 31, 2013 | |
| | | | | | | | |
| From operations: | | | |
Net investment income | | $ | 10,306 | | | $ | 10,884 | |
Net realized gain from investment transactions | | | 10,720 | | | | 10,065 | |
| Net increase in net assets resulting from operations | | | 21,026 | | | | 20,949 | |
| | | | | | | | |
| | | | | | | | |
| Distributions to shareholders: | | | | | | |
From net investment income: | | | | | | | | |
Institutional Shares | | | (29 | ) | | | (2 | ) |
Service Shares | | | (10,277 | ) | | | (10,882 | ) |
From net realized gains: | | | | | | | | |
Institutional Shares | | | (1 | ) | | | — | |
Service Shares | | | (9,168 | ) | | | (9,812 | ) |
| Total distributions to shareholders | | | (19,475 | ) | | | (20,696 | ) |
| | | | | | | | |
| | | | | | | | |
| From share transactions (at $1.00 per share): | | | | | | |
Proceeds from sales of shares | | | 160,663,051 | | | | 123,203,209 | |
Reinvestment of distributions | | | 19,475 | | | | 20,696 | |
Cost of shares redeemed | | | (170,346,403 | ) | | | (164,340,353 | ) |
| Net decrease in net assets resulting from share transactions | | | (9,663,877 | ) | | | (41,116,448 | ) |
| TOTAL DECREASE | | | (9,662,326 | ) | | | (41,116,195 | ) |
| | | | | | | | |
| | | | | | | | |
| Net assets: | | | | | | |
| | |
Beginning of year | | | 316,429,248 | | | | 357,545,443 | |
End of year | | $ | 306,766,922 | | | $ | 316,429,248 | |
| | |
| 14 | | The accompanying notes are an integral part of these financial statements. |
GOLDMAN SACHS VARIABLE INSURANCE TRUST MONEY MARKET FUND
Financial Highlights
Selected Data for a Share Outstanding Throughout Each Period
| | | | | | | | | | | | | | | | | | | | | | | | | | | | | | | | | | | | |
| Year - Share Class | | Net asset
value,
beginning
of period | | | Net
investment
income(a) | | | Distributions
from net
investment
income(b) | | | Net
asset
value,
end of
period | | | Total
return(c) | | | Net assets,
end of
period (in 000's) | | | Ratio of
net expenses
to average
net assets | | | Ratio of
total
expenses
to average
net assets | | | Ratio of
net investment
income to average net
assets | |
FOR THE FISCAL YEAR ENDED DECEMBER 31, | |
2014 - Institutional | | $ | 1.00 | | | $ | — | (d) | | $ | — | (d) | | $ | 1.00 | | | | 0.01 | % | | $ | 773 | | | | 0.23 | % | | | 0.31 | % | | | 0.03 | % |
2014 - Service | | | 1.00 | | | | — | (d) | | | — | (d) | | | 1.00 | | | | 0.01 | | | | 305,994 | | | | 0.24 | | | | 0.56 | | | | — | (e) |
2013 - Institutional(f) | | | 1.00 | | | | — | (d) | | | — | (d) | | | 1.00 | | | | 0.01 | | | | 25 | | | | 0.24 | (g) | | | 0.36 | (g) | | | 0.04 | %(g) |
2013 - Service | | | 1.00 | | | | — | (d) | | | — | (d) | | | 1.00 | | | | 0.01 | | | | 316,404 | | | | 0.28 | | | | 0.55 | | | | — | (e) |
| | | | | | | | | | | | | | | | | | | | | | | | | | | | | | | | | | | | |
FOR THE FISCAL YEARS ENDED DECEMBER 31, | |
2012 - Service | | | 1.00 | | | | — | (d) | | | — | (d) | | | 1.00 | | | | 0.01 | | | | 357,545 | | | | 0.35 | | | | 0.53 | | | | — | (e) |
2011 - Service | | | 1.00 | | | | — | (d) | | | — | (d) | | | 1.00 | | | | 0.01 | | | | 144,173 | | | | 0.30 | | | | 0.66 | | | | 0.01 | |
2010 - Service | | | 1.00 | | | | — | (d) | | | — | (d) | | | 1.00 | | | | 0.01 | | | | 123,365 | | | | 0.33 | | | | 0.68 | | | | — | (e) |
| (a) | Calculated based on the average shares outstanding methodology. |
| (b) | Distributions may not coincide with the current year net investment income or net realized gains as distributions may be paid from current or prior year earnings. |
| (c) | Assumes reinvestment of all distributions. |
| (d) | Amount is less than $0.0005 per share. |
| (e) | Amount is less than 0.005% of average net assets. |
| (f) | Commenced operations on October 16, 2013. |
| | | | |
| The accompanying notes are an integral part of these financial statements. | | 15 | | |
GOLDMAN SACHS VARIABLE INSURANCE TRUST MONEY MARKET FUND
Notes to Financial Statements
December 31, 2014
1. ORGANIZATION
Goldman Sachs Variable Insurance Trust (the “Trust” or “VIT”) is a Delaware statutory trust registered under the Investment Company Act of 1940, as amended (the “Act”), as an open-end management investment company. The Trust includes the Goldman Sachs Money Market Fund (the “Fund”). The Fund is a diversified portfolio under the Act offering two classes of shares — Institutional and Service Shares. Shares of the Trust are offered to separate accounts of participating life insurance companies for the purpose of funding variable annuity contracts and variable life insurance policies.
Goldman Sachs Asset Management, L.P. (“GSAM”), an affiliate of Goldman, Sachs & Co. (“Goldman Sachs”), serves as investment adviser to the Fund pursuant to a management agreement (the “Agreement”) with the Trust.
2. SIGNIFICANT ACCOUNTING POLICIES
The financial statements have been prepared in accordance with accounting principles generally accepted in the United States of America (“GAAP”) and require management to make estimates and assumptions that may affect the reported amounts and disclosures. Actual results may differ from those estimates and assumptions.
A. Investment Valuation — The investment valuation policy of the Fund is to use the amortized-cost method permitted by Rule 2a-7 under the Act, which approximates market value, for valuing portfolio securities. Under this method, all investments purchased at a discount or premium are valued by accreting or amortizing the difference between the original purchase price and maturity value of the issue, as an adjustment to interest income. Under procedures and tolerances approved by the Trustees, GSAM evaluates the difference between the Fund’s net asset value per share (“NAV”) based upon the amortized cost of the Fund’s securities and the NAV based upon available market quotations (or permitted substitutes) at least once a week.
B. Investment Income and Investments — Interest income is accrued daily and adjusted for amortization of premiums and accretion of discounts. Investment transactions are reflected on trade date. Realized gains and losses are calculated using identified cost.
C. Class Allocations and Expenses — Investment income, realized and unrealized gain (loss), and non-class specific expenses of the Fund are allocated daily based upon the proportion of net assets of each class. Class specific expenses, where applicable, are borne by the respective share classes and include Distribution and Service and Transfer Agent fees. Non-class specific expenses directly incurred by the Fund are charged to the Fund, while such expenses incurred by the Trust are allocated across the respective Funds on a straight-line and/or pro-rata basis depending upon the nature of the expenses.
16
GOLDMAN SACHS VARIABLE INSURANCE TRUST MONEY MARKET FUND
2. SIGNIFICANT ACCOUNTING POLICIES (continued)
D. Federal Taxes and Distributions to Shareholders — It is the Fund’s policy to comply with the requirements of the Internal Revenue Code of 1986, as amended (the “Code”), applicable to regulated investment companies (mutual funds) and to distribute each year substantially all of its investment company taxable and tax-exempt income and capital gains to its shareholders. Accordingly, the Fund is not required to make any provisions for the payment of federal income tax. Distributions to shareholders are declared and recorded daily and paid monthly by the Fund and may include short-term capital gains. Long-term capital gain distributions, if any, are declared and paid annually.
Under the Regulated Investment Company Modernization Act of 2010, the Fund is permitted to carry forward capital losses incurred in taxable years beginning after December 22, 2010 for an unlimited period. However, any losses incurred during those future taxable years will be required to be utilized prior to the losses incurred in pre-enactment taxable years. As a result of this ordering rule, pre-enactment capital loss carryforwards may be more likely to expire unused. Additionally, post-enactment capital losses that are carried forward will retain their character as either short-term or long-term capital losses rather than being considered all short-term as under previous law.
The characterization of distributions to shareholders for financial reporting purposes is determined in accordance with federal income tax rules, which may differ from GAAP. The source of the Fund’s distributions may be shown in the accompanying financial statements as either from net investment income, net realized gain or capital. Certain components of the Fund’s net assets on the Statement of Assets and Liabilities reflect permanent GAAP/tax differences based on the appropriate tax character.
The tax character of distributions paid during the fiscal years ended December 31, 2014 and December 31, 2013, were as follows:
| | | | | | | | |
| | | 2014 | | | 2013 | |
| Distributions paid from: | | | | | | | | |
| Ordinary income | | $ | 19,223 | | | $ | 20,696 | |
| Net long-term capital gains | | | 252 | | | | — | |
| Total taxable distributions | | $ | 19,475 | | | $ | 20,696 | |
As of December 31, 2014, the components of accumulated earnings on a tax basis were as follows:
| | | | |
| Undistributed long-term capital gains | | $ | 1,804 | |
17
GOLDMAN SACHS VARIABLE INSURANCE TRUST MONEY MARKET FUND
Notes to Financial Statements (continued)
December 31, 2014
2. SIGNIFICANT ACCOUNTING POLICIES (continued)
The amortized cost for the Fund stated in the accompanying Statement of Assets and Liabilities also represents aggregate cost for U.S. federal income tax purposes.
GSAM has reviewed the Fund’s tax positions for all open tax years (the current and prior three years, as applicable) and has concluded that no provision for income tax is required in the Fund’s financial statements. Such open tax years remain subject to examination and adjustment by tax authorities.
E. Repurchase Agreements — Repurchase agreements involve the purchase of securities subject to the seller’s agreement to repurchase the securities at a mutually agreed upon date and price, under the terms of a Master Repurchase Agreement (“MRA”). During the term of a repurchase agreement, the value of the underlying securities held as collateral on behalf of the Fund, including accrued interest, is required to exceed the value of the repurchase agreement, including accrued interest. The gross value of repurchase agreements is included in the Statements of Assets and Liabilities for financial reporting purposes. The underlying securities for all repurchase agreements are held at the Fund’s custodian or designated sub-custodians under tri-party repurchase agreements.
An MRA governs transactions between a Fund and select counterparties. An MRA contains provisions for, among other things, initiation, income payments, events of default and maintenance of securities for repurchase agreements. An MRA also permits offsetting with collateral to create one single net payment in the event of default or similar events, including the bankruptcy or insolvency of a counterparty.
If the seller defaults, a Fund could suffer a loss to the extent that the proceeds from the sale of the underlying securities and other collateral held by the Fund are less than the repurchase price and the Fund’s costs associated with delay and enforcement of the repurchase agreement. In addition, in the event of default or insolvency of the seller, a court could determine that a Fund’s interest in the collateral is not enforceable, resulting in additional losses to the Fund.
Pursuant to exemptive relief granted by the Securities and Exchange Commission (“SEC”) and terms and conditions contained therein, the Fund, together with other funds of the Trust and registered investment companies having management agreements with GSAM or its affiliates, may transfer uninvested cash into joint accounts, the daily aggregate balance of which is invested in one or more repurchase agreements. Under these joint accounts, the Fund maintains pro-rata credit exposure to the underlying repurchase agreements’ counterparties. With the exception of certain transaction fees, the Fund is not subject to any expenses in relation to these investments.
18
GOLDMAN SACHS VARIABLE INSURANCE TRUST MONEY MARKET FUND
3. INVESTMENTS AND FAIR VALUE MEASUREMENTS
The fair value of a financial instrument is the amount that would be received to sell an asset or paid to transfer a liability in an orderly transaction between market participants at the measurement date (i.e., the exit price). GAAP establishes a fair value hierarchy that prioritizes the inputs to valuation techniques used to measure fair value. The hierarchy gives the highest priority to unadjusted quoted prices in active markets for identical assets or liabilities (Level 1 measurements) and the lowest priority to unobservable inputs (Level 3 measurements). The levels used for classifying investments are not necessarily an indication of the risk associated with investing in these investments. The three levels of the fair value hierarchy are described below:
Level 1 — Unadjusted quoted prices in active markets that are accessible at the measurement date for identical, unrestricted assets or liabilities;
Level 2 — Quoted prices in markets that are not active or financial instruments for which significant inputs are observable (including, but not limited to, quoted prices for similar investments, interest rates, foreign exchange rates, volatility and credit spreads), either directly or indirectly;
Level 3 — Prices or valuations that require significant unobservable inputs (including GSAM’s assumptions in determining fair value measurement).
The Trustees have adopted Amortized Cost Rule 2a-7 Procedures (“Procedures”) that govern the valuation of the portfolio investments held by the Fund. The Trustees have delegated to GSAM day-to-day responsibility for implementing and maintaining internal controls and procedures related to the valuation (including both amortized cost and market-based methods of valuation) of the Fund’s portfolio investments. To assess the continuing appropriateness of pricing sources and methodologies related to the market-based method of valuation, GSAM regularly performs price verification procedures and issues challenges as necessary to third party pricing vendors or brokers, and any differences are reviewed in accordance with the Procedures.
As of December 31, 2014, all investments are classified as Level 2. Please refer to the Schedule of Investments for further detail.
4. AGREEMENTS AND AFFILIATED TRANSACTIONS
A. Management Agreement — Under the Agreement, GSAM manages the Fund, subject to the general supervision of the Trustees.
As compensation for the services rendered pursuant to the Agreement, the assumption of the expenses related thereto and administration of the Fund’s business affairs, including providing facilities, GSAM is entitled to a management fee, accrued daily and paid monthly, equal to an annual percentage rate of the Fund’s average daily net assets.
B. Distribution and Service Plan — The Trust, on behalf of the Service Shares of the Fund, has adopted a Distribution and Service Plan (the “Plan”). Under the Plan, Goldman Sachs, which serves as distributor, is entitled to a fee, accrued daily and paid monthly for distribution services, which may then be paid by Goldman Sachs to authorized dealers. This fee is equal to an annual percentage rate of the average daily net assets.
19
GOLDMAN SACHS VARIABLE INSURANCE TRUST MONEY MARKET FUND
Notes to Financial Statements (continued)
December 31, 2014
4. AGREEMENTS AND AFFILIATED TRANSACTIONS (continued)
C. Transfer Agency Agreement — Goldman Sachs also serves as the transfer agent of the Fund for a fee pursuant to a Transfer Agency Agreement. The fee charged for such transfer agency services is accrued daily and paid monthly and is equal to an annual percentage rate of the Fund’s average daily net assets.
D. Other Expense Agreements — GSAM has agreed to limit certain “Other Expense” of the Fund (excluding transfer agent fees and expenses, taxes, interest, brokerage fees, shareholder meetings, litigation, indemnification and extraordinary expenses) to the extent that such expenses exceed, on an annual basis, 0.004% of the average daily net assets of the Fund. Such Other Expense reimbursements, if any, are accrued daily and paid monthly. In addition, the Fund is not obligated to reimburse GSAM for prior fiscal year expense reimbursements, if any. This Other Expense limitation will remain in place through at least April 30, 2015 and prior to such date GSAM may not terminate the arrangement without the approval of the Trustees. The Fund bears its respective share of costs related to proxy and shareholder meetings, and GSAM has agreed to reimburse the Fund to the extent such expenses exceed a specified percentage of the Fund’s net assets. For the fiscal year ended December 31, 2014, GSAM reimbursed $224,567 to the Fund. In addition, the Fund has entered into certain offset arrangements with the custodian and the transfer agent, which resulted in a reduction of $58 of the Fund’s expenses and are received irrespective of the application of the “Other Expense” limitation described above.
E. Contractual and Net Fund Expenses — During the fiscal year ended December 31, 2014, Goldman Sachs, as distributor and transfer agent, voluntarily agreed to waive a portion of distribution and service plan fees and transfer agent fees attributable to the Fund. These waivers may be modified or terminated at any time at the option of Goldman Sachs. The following table outlines such fees (net of waivers) and Other Expenses (net of reimbursements and custodian and transfer agent fee credit reductions) in order to determine the Fund’s net annualized expenses for the fiscal period. The Fund is not obligated to reimburse Goldman Sachs for prior fiscal year fee waivers, if any.
| | | | | | | | | | | | | | | | |
| | | Institutional Shares | | | Service Shares | |
| Fee/Expense Type | | Contractual rate,
if any | | | Ratio of net expenses to
average net assets for the fiscal year ended December 31, 2014 | | | Contractual rate,
if any | | | Ratio of net expenses to
average net assets for the fiscal year ended
December 31, 2014 | |
| Management Fee | | | 0.21 | %(a) | | | 0.21 | % | | | 0.21 | %(a) | | | 0.21 | % |
| Distribution and Service Fees | | | N/A | | | | N/A | | | | 0.25 | | | | 0.01 | |
| Transfer Agent Fees | | | 0.02 | | | | 0.01 | | | | 0.02 | | | | 0.01 | |
| Other Expenses | | | — | | | | 0.01 | | | | — | | | | 0.01 | |
| Net Expenses | | | | | | | 0.23 | % | | | | | | | 0.24 | % |
| (a) | Unrounded contractual rate is 0.205%. |
| N/A | - Fees not applicable to respective share class. |
For the fiscal year ended December 31, 2014, Goldman Sachs waived $5,469, $768,162 and $19,453 in management, distribution and service fees, and transfer agent fees, respectively.
For the fiscal year ended December 31, 2014, the amounts owed to affiliates of the Fund were $53,295, $6,331, and $5,199 for management, distribution and service fees, and transfer agent fees, respectively.
20
GOLDMAN SACHS VARIABLE INSURANCE TRUST MONEY MARKET FUND
4. AGREEMENTS AND AFFILIATED TRANSACTIONS (continued)
F. Other Transactions with Affiliates — The Fund may purchase securities from, or sell securities to, an affiliated fund provided the affiliation is solely due to having a common investment adviser, common officers, or common trustees. For the fiscal year ended December 31, 2014, the purchase and sale transactions for the Funds with affiliated funds in compliance with Rule 17a-7 under the Act were $500,134 and $1,945,085, respectively.
G. Line of Credit Facility — As of December 31, 2014, the Fund participated in a $1,080,000,000 committed, unsecured revolving line of credit facility (the “facility”) together with other funds of the Trust and registered investment companies having management agreements with GSAM or its affiliates (“Other Borrowers”). Pursuant to the terms of the facility, the Fund and Other Borrowers could increase the credit amount by an additional $120,000,000, for a total of up to $1,200,000,000. This facility is to be used solely for temporary or emergency purposes which may include the funding of redemptions. The interest rate on borrowings is based on the federal funds rate. The facility also requires a fee to be paid by the Fund based on the amount of the commitment that has not been utilized. For the fiscal year ended December 31, 2014, the Fund did not have any borrowings under the facility.
5. OTHER RISKS
The Fund’s risks include, but are not limited to, the following:
Large Shareholder Transactions Risk — The Fund may experience adverse effects when certain large shareholders, such as other funds, participating insurance companies, accounts and Goldman Sachs affiliates, purchase or redeem large amounts of shares of the Fund. Such large shareholder redemptions may cause the Fund to sell portfolio securities at times when it would not otherwise do so, which may negatively impact the Fund’s NAV and liquidity. Similarly, large Fund share purchases may adversely affect the Fund’s performance to the extent that the Fund is delayed in investing new cash and is required to maintain a larger cash position than it ordinarily would. These transactions may also increase transaction costs. In addition, a large redemption could result in the Fund’s current expenses being allocated over a smaller asset base, leading to an increase in the Fund’s expense ratio.
Interest Rate Risk — When interest rates increase, the Fund’s yield will tend to be lower than prevailing market rates, and the market value of its securities or instruments may also be adversely affected. A low interest rate environment poses additional risks to the Fund, because low yields on the Fund’s portfolio holdings may have an adverse impact on the Fund’s ability to provide a positive yield to its shareholders, pay expenses out of Fund assets, or, at times, maintain a stable $1.00 share price.
Market and Credit Risks — In the normal course of business, the Fund trades financial instruments and enters into financial transactions where risk of potential loss exists due to changes in the market (market risk). Additionally, the Fund may also be exposed to credit risk in the event that an issuer or guarantor fails to perform or that an institution or entity with which the Fund has unsettled or open transactions defaults.
6. INDEMNIFICATIONS
Under the Trust’s organizational documents, its Trustees, officers, employees and agents are indemnified, to the extent permitted by the Act and state law, against certain liabilities that may arise out of performance of their duties to the Fund. Additionally, in the course of business, the Fund enters into contracts that contain a variety of indemnification clauses. The Fund’s maximum exposure under these arrangements is unknown, as this would involve future claims that may be made against the Fund that have not yet occurred. However, GSAM believes the risk of loss under these arrangements to be remote.
21
GOLDMAN SACHS VARIABLE INSURANCE TRUST MONEY MARKET FUND
Notes to Financial Statements (continued)
December 31, 2014
7. SUBSEQUENT EVENTS
Subsequent events after the Statement of Assets and Liabilities date have been evaluated through the date the financial statements were issued. GSAM has concluded that there is no impact requiring adjustment or disclosure in the financial statements.
8. SUMMARY OF SHARE TRANSACTIONS
Share activity is as follows:
| | | | | | | | |
| | | For the Fiscal Year Ended
December 31, 2014 | | | For the Fiscal Year Ended
December 31, 2013 | |
| Institutional Shares | | | | | | | | |
| Shares sold | | | 1,028,618 | | | | 25,004 | |
| Reinvestment of distributions | | | 30 | | | | 2 | |
| Shares redeemed | | | (280,777 | ) | | | — | |
| | | | 747,871 | | | | 25,006 | |
| Service Shares | | | | | | | | |
| Shares sold | | | 159,634,433 | | | | 123,178,205 | |
| Reinvestment of distributions | | | 19,445 | | | | 20,694 | |
| Shares redeemed | | | (170,065,626 | ) | | | (164,340,353 | ) |
| | | | (10,411,748 | ) | | | (41,141,454 | ) |
| NET DECREASE IN SHARES | | | (9,663,877 | ) | | | (41,116,448 | ) |
22
Report of Independent Registered Public Accounting Firm
To the Board of Trustees and Shareholders of
Goldman Sachs Variable Insurance Trust — Goldman Sachs Money Market Fund:
In our opinion, the accompanying statement of assets and liabilities, including the schedule of investments, and the related statements of operations and of changes in net assets and the financial highlights present fairly, in all material respects, the financial position of Goldman Sachs Money Market Fund (the “Fund”), a Fund of Goldman Sachs Variable Insurance Trust at December 31, 2014, the results of its operations for the year then ended, the changes in its net assets and the financial highlights for the periods indicated, in conformity with accounting principles generally accepted in the United States of America. These financial statements and financial highlights (hereafter referred to as “financial statements”) are the responsibility of the Fund’s management. Our responsibility is to express an opinion on these financial statements based on our audits. We conducted our audits of these financial statements in accordance with the standards of the Public Company Accounting Oversight Board (United States). Those standards require that we plan and perform the audits to obtain reasonable assurance about whether the financial statements are free of material misstatement. An audit includes examining, on a test basis, evidence supporting the amounts and disclosures in the financial statements, assessing the accounting principles used and significant estimates made by management, and evaluating the overall financial statement presentation. We believe that our audits, which included confirmation of securities at December 31, 2014 by correspondence with the custodian, brokers, and the application of alternative auditing procedures where securities purchased confirmations have not been received, provides a reasonable basis for our opinion.
PricewaterhouseCoopers LLP
Boston, Massachusetts
February 19, 2015
23
GOLDMAN SACHS VARIABLE INSURANCE TRUST MONEY MARKET FUND
| | |
| Fund Expenses — Six Month Period Ended December 31, 2014 (Unaudited) | | |
As a shareholder of the Institutional Shares and Service Shares of the Fund, you incur ongoing costs, including management fees; distribution and service (12b-1) fees (with respect to Service Shares); and other Fund expenses. This Example is intended to help you understand your ongoing costs (in dollars) of investing in the Fund and to compare these costs with the ongoing costs of investing in other mutual funds.
The example is based on an investment of $1,000 invested at the beginning of the period and held for the entire period from July 1, 2014 (or commencement of operations date) through December 31, 2014.
Actual Expenses — The first line in the table below provides information about actual account values and actual expenses. You may use the information in this line, together with the amount you invested, to estimate the expenses that you paid over the period. Simply divide your account value by $1,000 (for example, an $8,600 account value divided by $1,000=8.6), then multiply the result by the number in the first line under the heading entitled “Expenses Paid” to estimate the expenses you paid on your account during this period.
Hypothetical Example for Comparison Purposes — The second line in the table below provides information about hypothetical account values and hypothetical expenses based on the Fund’s actual net expense ratio and an assumed rate of return of 5% per year before expenses, which is not the Fund’s actual return. The hypothetical account values and expenses may not be used to estimate the actual ending account balance or expenses you paid for the period. You may use this information to compare the ongoing costs of investing in the Fund and other funds. To do so, compare this 5% hypothetical example with the 5% hypothetical examples that appear in the shareholder reports of the other funds.
Please note that the expenses shown in the table are meant to highlight your ongoing costs only and do not reflect any transactional costs, such as sales charges, redemption fees, or exchange fees. Therefore, the second line of the table is useful in comparing ongoing costs only, and will not help you determine the relative total costs of owning different funds. In addition, if these transactional costs were included, your costs would have been higher.
| | | | | | | | | | | | |
| Share Class | | Beginning
Account Value
7/1/14 | | | Ending
Account Value
12/31/14 | | | Expenses Paid
for the
6 months
Ended
12/31/14* | |
| Institutional Shares | | | | | | | | | | | | |
| Actual | | $ | 1,000.00 | | | $ | 1,000.10 | | | $ | 1.15 | |
| Hypothetical 5% return | | | 1,000.00 | | | | 1,024.06 | + | | | 1.16 | |
| Service Shares | | | | | | | | | | | | |
| Actual | | | 1,000.00 | | | | 1,000.03 | | | | 1.17 | |
| Hypothetical 5% return | | | 1,000.00 | | | | 1,024.04 | + | | | 1.18 | |
| | * | Expenses are calculated using the Fund’s annualized net expense ratio for each class, which represents the ongoing expenses as a percentage of net assets for the six months ended December 31, 2014. Expenses are calculated by multiplying the annualized net expense ratio by the average account value for the period; then multiplying the result by the number of days in the most recent fiscal half year (or, since inception, if shorter); and then dividing that result by the number of days in the period. The annualized net expense ratios for the period were 0.23% and 0.23% for the Institutional Shares and Service Shares, respectively. | |
| | + | Hypothetical expenses are based on the Fund’s actual annualized net expense ratio and an assumed rate of return of 5% per year before expenses. | |
24
GOLDMAN SACHS VARIABLE INSURANCE TRUST MONEY MARKET FUND
Trustees and Officers (Unaudited)
Independent Trustees
| | | | | | | | | | | | |
| | | | | |
Name,
Address and Age1 | | Position(s) Held with the Trust | | Term of Office and
Length of
Time Served2 | | Principal Occupation(s) During Past 5 Years | | Number of
Portfolios in
Fund Complex
Overseen by
Trustee3 | | | Other Directorships Held by Trustee4 |
Ashok N. Bakhru Age: 72 | | Chairman of the Board of Trustees | | Since 1996 (Trustee since 1991) | | Mr. Bakhru is retired. He was formerly Director, Apollo Investment Corporation (a business development company) (2008-2013); President, ABN Associates (a management and financial consulting firm) (1994-1996 and 1998-2012); Trustee, Scholarship America (1998-2005); Trustee, Institute for Higher Education Policy (2003-2008); Director, Private Equity Investors — III and IV (1998-2007), and Equity-Linked Investors II (April 2002-2007). Chairman of the Board of Trustees — Goldman Sachs Fund Complex. | | | 128 | | | None |
John P. Coblentz, Jr. Age: 73 | | Trustee | | Since 2003 | | Mr. Coblentz is retired. Formerly, he was Partner, Deloitte & Touche LLP (1975-2003); Director, Emerging Markets Group, Ltd. (2004-2006); and Director, Elderhostel, Inc. (2006-2012). Trustee — Goldman Sachs Fund Complex. | | | 128 | | | None |
Diana M. Daniels Age: 65 | | Trustee | | Since 2007 | | Ms. Daniels is retired. Formerly, she was Vice President, General Counsel and Secretary, The Washington Post Company (1991-2006). Ms. Daniels serves as a Presidential Councillor of Cornell University (2013-Present); Member, Advisory Board, Psychology Without Borders (international humanitarian aid organization) (2007-Present), and former Member of the Legal Advisory Board, New York Stock Exchange (2003-2006) and of the Corporate Advisory Board, Standish Mellon Management Advisors (2006-2007). Trustee — Goldman Sachs Fund Complex. | | | 108 | | | None |
Joseph P. LoRusso Age: 57 | | Trustee | | Since 2010 | | Mr. LoRusso is retired. Formerly, he was President, Fidelity Investments Institutional Services Co. (“FIIS”) (2002-2008); Director, FIIS (2002-2008); Director, Fidelity Investments Institutional Operations Company (2003-2007); Executive Officer, Fidelity Distributors Corporation (2007-2008). Trustee — Goldman Sachs Fund Complex. | | | 108 | | | None |
Herbert J. Markley Age: 64 | | Trustee | | Since 2013 | | Mr. Markley is retired. Formerly, he was Executive Vice President, Deere & Company (an agricultural and construction equipment manufacturer) (2007-2009), and President, Agricultural Division, Deere & Company (2001-2007). Trustee — Goldman Sachs Fund Complex. | | | 108 | | | None |
Jessica Palmer Age: 65 | | Trustee | | Since 2007 | | Ms. Palmer is retired. She is Director, Emerson Center for the Arts and Culture (2011-Present); and was formerly a Consultant, Citigroup Human Resources Department (2007-2008); Managing Director, Citigroup Corporate and Investment Banking (previously, Salomon Smith Barney/Salomon Brothers) (1984-2006). Ms. Palmer was a Member of the Board of Trustees of Indian Mountain School (private elementary and secondary school) (2004-2009). Trustee — Goldman Sachs Fund Complex. | | | 108 | | | None |
| | | | | | | | | | | | |
25
GOLDMAN SACHS VARIABLE INSURANCE TRUST MONEY MARKET FUND
Trustees and Officers (Unaudited) (continued)
Independent Trustees (continued)
| | | | | | | | | | | | |
| | | | | |
Name,
Address and Age1 | | Position(s) Held with the Trust | | Term of Office and
Length of
Time Served2 | | Principal Occupation(s) During Past 5 Years | | Number of
Portfolios in
Fund Complex
Overseen by
Trustee3 | | | Other Directorships Held by Trustee4 |
Richard P. Strubel Age: 75 | | Trustee | | Since 1987 | | Mr. Strubel is retired. Formerly, he was Director, Cardean Learning Group (provider of educational services via the internet) (2003-2008); and Director, Gildan Activewear Inc. (a clothing marketing and manufacturing company) (2000-2014). He serves as Trustee, Emeritus, The University of Chicago (1987-Present). Trustee — Goldman Sachs Fund Complex. | | | 128 | | | The Northern Trust Mutual Fund Complex (56 Portfolios) (Chairman of the Board of Trustees) |
Roy W. Templin Age: 54 | | Trustee | | Since 2013 | | Mr. Templin is retired. He is Chairman of the Board of Directors, Con-Way Incorporated (2012-Present); and was formerly Executive Vice President and Chief Financial Officer, Whirlpool Corporation (an appliance manufacturer and marketer) (2004-2012). Trustee — Goldman Sachs Fund Complex. | | | 108 | | | Con-Way Incorporated (a transportation, supply-chain management and logistics services company) |
| | | | | | | | | | | | |
Interested Trustees*
| | | | | | | | | | | | |
| | | | | |
Name,
Address and Age1 | | Position(s) Held with the Trust | | Term of Office and
Length of
Time Served2 | | Principal Occupation(s) During Past 5 Years | | Number of
Portfolios in
Fund Complex
Overseen by
Trustee3 | | | Other Directorships Held by Trustee4 |
James A. McNamara Age: 52 | | President and Trustee | | Since 2007 | | Managing Director, Goldman Sachs (December 1998-Present); Director of Institutional Fund Sales, GSAM (April 1998-December 2000); and Senior Vice President and Manager, Dreyfus Institutional Service Corporation (January 1993- April 1998). President — Goldman Sachs Fund Complex (November 2007-Present); Senior Vice President — Goldman Sachs Fund Complex (May 2007-November 2007); and Vice President — Goldman Sachs Fund Complex (2001-2007). Trustee — Goldman Sachs Fund Complex (November 2007-Present and December 2002-May 2004). | | | 127 | | | None |
Alan A. Shuch Age: 65 | | Trustee | | Since 1990 | | Advisory Director — GSAM (May 1999-Present); Consultant to GSAM (December 1994-May 1999); and Limited Partner, Goldman Sachs (December 1994-May 1999). Trustee — Goldman Sachs Fund Complex. | | | 108 | | | None |
| | | | | | | | | | | | |
| * | These persons are considered to be “Interested Trustees” because they hold positions with Goldman Sachs and own securities issued by The Goldman Sachs Group, Inc. Each Interested Trustee holds comparable positions with certain other companies of which Goldman Sachs, GSAM or an affiliate thereof is the investment adviser, administrator and/or distributor. |
| 1 | Each Trustee may be contacted by writing to the Trustee, c/o Goldman Sachs, 200 West Street, New York, New York, 10282, Attn: Caroline Kraus. Information is provided as of December 31, 2014. |
| 2 | Each Trustee holds office for an indefinite term until the earliest of: (a) the election of his or her successor; (b) the date the Trustee resigns or is removed by the Board of Trustees or shareholders, in accordance with the Trust’s Declaration of Trust; (c) December 31st of the year in which the Trustee turns 74 years of age, subject to waiver by a majority of the Trustees (in accordance with the current resolutions of the Board of Trustees, which may be changed by the Trustees without shareholder vote); or (d) the termination of the Trust. By resolution of the Board of Trustees determining that an extension of service would be beneficial to the Trust, the retirement age has been extended for one year with respect to Richard P. Strubel. |
| 3 | The Goldman Sachs Fund Complex consists of the Trust and Goldman Sachs Trust (“GST”). As of December 31, 2014, the Trust consisted of 14 portfolios and GST consisted of 94 portfolios (88 of which offered shares to the public). The Goldman Sachs Fund Complex also includes, with respect to Messrs. Bakhru, Coblentz and Strubel, Goldman Sachs Trust II (“GSTII”), Goldman Sachs BDC, Inc. (“GSBDC”), Goldman Sachs MLP Income Opportunities Fund (“GSMLP”), Goldman Sachs MLP and Energy Renaissance Fund (“GSMER”) and Goldman Sachs ETF Trust (“GSETF”), and with respect to Mr. McNamara, GSTII, GSMLP, GSMER, and GSETF. GSTII consisted of 6 portfolios (one of which offered shares to the public). GSBDC, GSMLP and GSMER each consisted of one portfolio. GSETF consisted of 11 portfolios (none of which offered shares to the public). As of December 31, 2014, GSBDC had not offered shares to the public. |
| 4 | This column includes only directorships of companies required to report to the Securities and Exchange Commission under the Securities Exchange Act of 1934 (i.e., “public companies”) or other investment companies registered under the Act. |
Additional information about the Trustees is available in the Fund’s Statement of Additional Information, which can be obtained from Goldman Sachs free of charge by calling this toll-free number (in the United States of America): 1-800-292-4726.
26
GOLDMAN SACHS VARIABLE INSURANCE TRUST MONEY MARKET FUND
Trustees and Officers (Unaudited) (continued)
Officers of the Trust*
| | | | | | |
| | | |
Name, Address and Age | | Position(s) Held With the Trust | | Term of
Office and
Length of
Time Served1 | | Principal Occupation(s) During Past 5 Years |
James A. McNamara
200 West Street New York, NY 10282 Age: 52 | | President and
Trustee | | Since 2007 | | Managing Director, Goldman Sachs (December 1998-Present); Director of Institutional Fund Sales, GSAM (April 1998-December 2000); and Senior Vice President and Manager, Dreyfus Institutional Service Corporation (January 1993-April 1998). President — Goldman Sachs Fund Complex (November 2007-Present); Senior Vice President — Goldman Sachs Fund Complex (May 2007-November 2007); and Vice President — Goldman Sachs Fund Complex (2001-2007). Trustee — Goldman Sachs Fund Complex (November 2007-Present and December 2002-May 2004). |
Caroline L. Kraus
200 West Street New York, NY 10282 Age: 37 | | Secretary | | Since 2012 | | Vice President, Goldman Sachs (August 2006-Present); Associate General Counsel, Goldman Sachs (2012-Present); Assistant General Counsel, Goldman Sachs (August 2006-December 2011) and Associate, Weil, Gotshal & Manges-LLP (2002-2006). Secretary — Goldman Sachs Fund Complex (August 2012-Present) and Assistant Secretary — Goldman Sachs Fund Complex (June 2012-August 2012). |
Scott M. McHugh
200 West Street New York, NY 10282 Age: 43 | | Principal
Financial
Officer and
Treasurer | | Since 2009
(Principal
Financial
Officer
since
2013) | | Vice President, Goldman Sachs (February 2007-Present); Assistant Treasurer of certain mutual funds administered by DWS Scudder (2005-2007); and Director (2005-2007), Vice President (2000-2005) and Assistant Vice President (1998-2000), Deutsche Asset Management or its predecessor (1998-2007). Principal Financial Officer — Goldman Sachs Fund Complex (November 2013-Present); Treasurer — Goldman Sachs Fund Complex (October 2009-Present); Senior Vice President — Goldman Sachs Fund Complex (November 2009-Present); and Assistant Treasurer — Goldman Sachs Fund Complex (May 2007-October 2009). |
| | | | | | |
| * | Represents a partial list of officers of the Trust. Additional information about all the officers is available in the Portfolio’s Statement of Additional Information, which can be obtained from Goldman Sachs free of charge by calling this toll-free number (in the United States): 1-800-292-4726. |
| 1 | Information is provided as of December 31, 2014. |
| 2 | Officers hold office at the pleasure of the Board of Trustees or until their successors are duly elected and qualified. Each officer holds comparable positions with certain other companies of which Goldman Sachs, GSAM or an affiliate thereof is the investment adviser, administrator and/or distributor. |
27
GOLDMAN SACHS VARIABLE INSURANCE TRUST MONEY MARKET FUND
Goldman Sachs Variable Insurance Trust — Tax Information (Unaudited)
Pursuant to Section 852 of the Internal Revenue Code, the Money Market Fund designates $252, or, if different, the maximum amount allowable, as capital gain dividends paid during the fiscal year ended December 31, 2014.
28
| | |
| TRUSTEES | | OFFICERS |
| Ashok N. Bakhru, Chairman | | James A. McNamara, President |
John P. Coblentz, Jr.
Diana M. Daniels | | Scott M. McHugh, Principal Financial Officer and Treasurer |
| Joseph P. LoRusso | | Caroline L. Kraus, Secretary |
| Herbert J. Markley | | |
| James A. McNamara | | |
| Jessica Palmer | | |
| Alan A. Shuch | | |
| Richard P. Strubel | | |
| Roy W. Templin | | |
GOLDMAN, SACHS & CO.
Distributor and Transfer Agent
GOLDMAN SACHS ASSET MANAGEMENT, L.P.
Investment Adviser
200 West Street, New York
New York 10282
Visit our Web site at www.GSAMFUNDS.com to obtain the most recent month-end returns.
The reports concerning the Fund included in this shareholder report may contain certain forward-looking statements about the factors that may affect the performance of the Fund in the future. These statements are based on Fund management’s predictions and expectations concerning certain future events and their expected impact on the Fund, such as performance of the economy as a whole and of specific industry sectors, changes in the levels of interest rates, the impact of developing world events, and other factors that may influence the future performance of the Fund. Management believes these forward-looking statements to be reasonable, although they are inherently uncertain and difficult to predict. Actual events may cause adjustments in portfolio management strategies from those currently expected to be employed.
A description of the policies and procedures that the Fund uses to determine how to vote proxies relating to portfolio securities and information regarding how the Fund voted proxies relating to portfolio securities during the most recent 12-month period ended June 30 is available (i) without charge, upon request by calling 1-800-621-2550; and (ii) on the Securities and Exchange Commission (“SEC”) Web site at http://www.sec.gov.
The Fund files its complete schedule of portfolio holdings with the SEC for the first and third quarters of each fiscal year on Form N-Q. The Fund’s Form N-Qs are available on the SEC’s web site at http://www.sec.gov within 60 days after the Fund’s first and third fiscal quarters. The Fund’s Form N-Qs may be reviewed and copied at the SEC’s Public Reference Room in Washington, D.C. and information on the operation of the Public Reference Room may also be obtained by calling 1-800-SEC-0330. Form N-Qs may be obtained upon request and without charge by calling 1-800-621-2550.
The web site links provided are for your convenience only and are not an endorsement or recommendation by GSAM of any of these web sites or the products or services offered. GSAM is not responsible for the accuracy and validity of the content of these web sites.
Fund holdings and allocations shown are as of December 31, 2014 and may not be representative of future investments. Fund holdings should not be relied on in making investment decisions and should not be construed as research or investment advice regarding particular securities. Current and future holdings are subject to risk.
References to indices, benchmarks or other measures of relative market performance over a specified period of time are provided for your information only and do not imply that the portfolio will achieve similar results. The index composition may not reflect the manner in which a portfolio is constructed. While an adviser seeks to design a portfolio which reflects appropriate risk and return features, portfolio characteristics may deviate from those of the benchmark.
The portfolio risk management process includes an effort to monitor and manage risk, but does not imply low risk.
Shares of the Goldman Sachs VIT Funds are offered to separate accounts of participating life insurance companies for the purpose of funding variable annuity contracts and variable life insurance policies. Shares of the Fund are not offered directly to the general public. The variable annuity contracts and variable life insurance policies are described in the separate prospectuses issued by participating insurance companies. You should refer to those prospectuses for information about surrender charges, mortality and expense risk fees and other charges that may be assessed by participating insurance companies under the variable annuity contracts or variable life insurance policies. Such fees or charges, if any, may affect the return you may realize with respect to your investments. Ask your representative for more complete information. Please consider a fund’s objectives, risks and charges and expenses, and read the prospectus carefully before investing. The prospectus contains this and other information about the Fund.
This material is not authorized for distribution to prospective investors unless preceded or accompanied by a current Prospectus or summary prospectus, if applicable. Investors should consider a Fund’s objective, risks, and charges and expenses, and read the summary prospectus, if available, and/or the Prospectus carefully before investing or sending money. The summary prospectus, if available, and the Prospectus contain this and other information about a Fund and may be obtained from your authorized dealer or from Goldman, Sachs & Co. by calling 1-800-621-2550.
This report is prepared for the general information of contract owners and is not an offer of shares of the Goldman Sachs Variable Insurance Trust: Goldman Sachs Money Market Fund.
© 2015 Goldman Sachs. All rights reserved.
VITMMAR-15/153898.MF.MED.TMPL/2/2015
Goldman
Sachs Variable Insurance Trust
Goldman Sachs
Multi-Strategy
Alternatives Portfolio
Annual Report
December 31, 2014
GOLDMAN SACHS VARIABLE INSURANCE TRUST MULTI-STRATEGY ALTERNATIVES PORTFOLIO
Principal Investment Strategies and Risks
This is not a complete list of risks that may affect the Portfolio. For additional information concerning the risks applicable to the Portfolio, please see the Portfolio’s Prospectuses.
Shares of the Goldman Sachs Variable Insurance Trust — Goldman Sachs Multi-Strategy Alternatives Portfolio are offered to separate accounts of participating life insurance companies for the purpose of funding variable annuity contracts and variable life insurance policies. Shares of the Portfolio are not offered directly to the general public. The variable annuity contracts and variable life insurance policies are described in the separate prospectuses issued by participating insurance companies. You should refer to those prospectuses for information about surrender charges, mortality and expense risk fees and other charges that may be assessed by participating insurance companies under the variable annuity contracts or variable life insurance policies. Such fees or charges, if any, may affect the return you realize with respect to your investments. Ask your representative for more complete information. Please consider the Portfolio’s objective, risks and charges and expenses, and read the Prospectus carefully before investing. The Prospectus contains this and other information about the Portfolio.
The Multi-Strategy Alternatives Portfolio invests primarily in affiliated variable insurance funds and mutual funds (“underlying funds”) that provide exposure to liquid alternatives strategies and real assets. The Portfolio may also invest directly in other securities, including exchange-traded funds (“ETFs”). The Portfolio is intended for investors seeking long-term growth of capital. Through its investments in the underlying funds and ETFs, the Portfolio indirectly invest in equity securities, fixed income and/or floating rate securities, mortgage-backed and asset-backed securities, currencies, and restricted securities. In addition, the Portfolio and certain underlying funds may invest in derivatives including futures contracts, swaps, options, forward contracts and other instruments.
The Portfolio is subject to the risk factors of the underlying funds in direct proportion to its investments in those underlying funds, and the ability of the Portfolio to meet its investment objective is directly related to the ability of the underlying funds to meet their investment objectives, as well as the allocation among those underlying funds by the Investment Adviser. An underlying fund is subject to the risks associated with its investments, including (as applicable) those associated with equity (including master limited partnerships, real estate investment trusts and mid- and small-cap securities), fixed income (including non-investment grade securities, loans, mortgage-backed and asset-backed securities), foreign and emerging countries, commodity and derivative investments generally. From time to time, the underlying funds in which the Portfolio invests, and the size of the investments in the underlying funds, is expected to change. Because the Portfolio is subject to the underlying fund expenses as well as its own expenses, the cost of investing in the Portfolio may be higher than investing in a mutual fund that only invests directly in stocks and bonds.
The investment program of the Portfolio is speculative, entails substantial risks and includes investment in underlying funds that utilize alternative investment techniques not employed by traditional mutual funds. The Portfolio should not be relied upon as a complete investment program. The Portfolio’s investment techniques (if they do not perform as designed) may increase the volatility of performance and the risk of investment loss, including the loss of the entire amount that is invested, and there can be no assurance that the investment objective of the Portfolio will be achieved.
1
GOLDMAN SACHS VARIABLE INSURANCE TRUST MULTI-STRATEGY ALTERNATIVES PORTFOLIO
INVESTMENT OBJECTIVE
The Portfolio seeks long-term growth of capital.
Portfolio Management Discussion and Analysis
Below, the Goldman Sachs Global Portfolio Solutions Team discusses the Goldman Sachs Variable Insurance Trust — Goldman Sachs Multi-Strategy Alternatives Portfolio’s (the “Portfolio”) performance and positioning for the period since its inception on April 25, 2014 through December 31, 2014 (the “Reporting Period”).
How did the Portfolio perform during the Reporting Period?
During the Reporting Period, the Portfolio’s Advisor, Institutional and Service Shares generated cumulative total returns of –0.97%, –0.67% and –0.85%, respectively. These returns compare to the 0.17% cumulative total return of the Portfolio’s benchmark, the BofA Merrill Lynch U.S. Dollar Three-Month LIBOR Constant Maturity Index (the “LIBOR Index”), during the same period.
We note that the Portfolio’s benchmark being the LIBOR Index is a means of emphasizing that the Portfolio has an unconstrained strategy. That said, this Portfolio employs a benchmark agnostic strategy and thus comparisons to a benchmark index are not particularly relevant.
What economic and market factors most influenced the Portfolio during the Reporting Period?
The Portfolio’s performance during the Reporting Period was driven by four main themes — a divergence in economic and monetary policy, a sell-off in the energy sector, an increase in market volatility and an underperformance of emerging markets.
Divergence in economic growth and central bank monetary policy between the U.S. and other developed markets emerged during the Reporting Period. In the U.S., the Federal Reserve (the “Fed”) ended its quantitative easing asset purchases on schedule at the end of October 2014. This action stood in contrast to Europe, which saw its central bank embark on its own version of increased monetary stimulus. At the same time, slowing global economic growth and lower inflation expectations weighed on U.S. long-term interest rates, which trended down, supporting fixed income assets. In addition, the U.S. dollar appreciated significantly relative to other currencies.
Crude oil prices fell sharply to multi-year lows during the Reporting Period, due largely to over-supply and weak global demand. The oil price drop heightened market volatility and led to the underperformance of energy-related securities, particularly in the high yield corporate bond market where credit spreads widened. (Spreads are yield differentials between bonds of comparable maturity.) Volatility also increased within other asset classes, including commodities, emerging markets equities and emerging markets debt, with the latter two underperforming their developed markets counterparts. Within the emerging markets, commodity exporting countries, such as Russia, were hurt most.
In this environment, riskier fixed income asset classes and “bond substitutes” generally outperformed, fueled by a continued search for yield by investors. This benefited real estate securities, especially U.S. real estate securities.
What key factors were responsible for the Portfolio’s performance during the Reporting Period?
During the Reporting Period, the Portfolio underperformed in both absolute terms and relative to the LIBOR Index. These results were due primarily to the Portfolio’s strategic asset allocation to energy commodities, which detracted significantly from returns. On the positive side, the Portfolio benefited from strategic allocations to fixed income corporate bonds, equities and interest rate duration. (Duration is a measure of the Portfolio’s sensitivity to changes in interest rates.) Strategic allocations to U.S. real estate securities, international real estate securities and global infrastructure securities also added to results. In addition, the Portfolio benefited from its strategic allocation to certain liquid alternative strategies, including momentum and trend-following strategies in managed futures and within the equity markets.
Tactical asset allocation overall added to the Portfolio’s returns, led by a short-term tactical allocation to small-cap U.S. equities that was subsequently shifted to large-cap U.S. equities. On the other hand, a short-term tactical underweight in U.S. real estate securities detracted as interest rates fell.
After accounting for their market exposures, overall investments in underlying funds detracted from the Portfolio’s results.
2
GOLDMAN SACHS VARIABLE INSURANCE TRUST MULTI-STRATEGY ALTERNATIVES PORTFOLIO
How was the Portfolio positioned at the beginning of the Reporting Period?
At the beginning of the Reporting Period, the Portfolio was positioned, in terms of its total net assets, with 76% in liquid alternative strategies, 17% in real assets and 3.1% cash. The strategic asset allocation of the Portfolio reflects a risk-based allocation approach to increase diversification across the Portfolio. The Portfolio had 3.9% of its total net assets invested in tactical exposures.
How did you tactically manage the Portfolio’s allocations during the Reporting Period?
During the Reporting Period, we adopted a tactical allocation to U.S. small-cap stocks, accomplished by reducing the Portfolio’s position in emerging markets debt. Subsequently, we shifted this tactical tilt from U.S. small-cap stocks to U.S. large-cap stocks because of our view of performance trends of small-cap stocks versus large-cap stocks. In addition, we shifted the Portfolio’s tactical allocation in U.S. real estate securities to international real estate securities, based on our tactical view favoring short duration positioning. We later reversed this tactical tilt because of our favorable view on the U.S. dollar.
In addition, during the Reporting Period, the Portfolio eliminated the Goldman Sachs Managed Futures Strategy Fund from its lineup of underlying Funds due to its underperformance. The proceeds were re-allocated across the Portfolio, primarily to the Goldman Sachs VIT Global Markets Navigator Fund and the Goldman Sachs Absolute Return Tracker Fund.
How was the Portfolio positioned at the end of the Reporting Period?
At the end of the Reporting Period, the Portfolio was positioned, in terms of its total net assets, with 73.7% in liquid alternative strategies, 14.8% in real assets and 6.2% cash. The Portfolio had 3.7% of its total net assets invested in tactical exposures.
How did the Portfolio use derivatives and similar instruments during the Reporting Period?
During the Reporting Period, the Portfolio did not use derivatives and similar instruments within its investment process. However, some of the underlying funds used derivatives during the Reporting Period to apply their active investment views with greater versatility and to potentially afford greater risk management precision. As market conditions warranted during the Reporting Period, some of these underlying funds engaged in forward foreign currency exchange contracts, financial futures contracts, options, swap contracts and structured securities to attempt to enhance portfolio return and for hedging purposes.
Were there any changes to the Portfolio’s management team during the Reporting Period?
During the Reporting Period, Neil Nuttall joined the Global Portfolio Solutions Team as a co-chief investment officer. He also serves as co-chair of the Global Portfolio Solutions investment committee and oversees investment processes for the Team. In addition, Michael Johnson became the head of Commodities portfolio management and Tom Teles became the head of the Duration strategy, replacing Steve Lucas who previously managed both responsibilities.
What is the Portfolio’s tactical view and strategy for the months ahead?
For most of the Reporting Period, our asset allocation views were underpinned by developed market growth in an environment of plentiful liquidity and low macroeconomic volatility. Broadly speaking, the Portfolio was overweight riskier asset classes and underweight U.S. government bonds. However, as we transition from this naturally low-volatility regime to potentially more uncertain macroeconomic and geopolitical conditions, we anticipate greater dispersion in asset class performance. Specifically, after the strong performance of U.S. equities during the past few years, we anticipate that equity returns are likely to be more muted in the near term, making way for other sources of return to play more significant roles. In our view, such an environment may reward a more selective and less broad brush approach to portfolio positioning across asset classes, sectors and securities.
Relative to our macroeconomic views, we expect to get better clarity in the months ahead on the U.S. labor market and its potential impact on the U.S. inflation outlook, the U.S. housing market outlook and the Chinese housing slowdown. The impact of liquidity measures implemented by the European Central Bank and Bank of Japan and the withdrawal of liquidity by the Bank of England and the Fed are additional factors that may impact the markets going forward.
At the end of the Reporting Period, we continued to have a favorable view of riskier asset classes because we expect them to be supported by broad growth, divergent central bank actions and low energy prices. We believe the drop in oil prices is likely to benefit net importers — including many of the world’s largest economies — and raise real incomes, contributing to a virtuous cycle of consumer spending, corporate spending and ultimately, higher wages. This could generate upside surprises in Europe, where growth expectations are low.
3
GOLDMAN SACHS VARIABLE INSURANCE TRUST MULTI-STRATEGY ALTERNATIVES PORTFOLIO
We continue to favor developed market assets and have a neutral view on emerging growth markets. The Portfolio remains positioned for a strengthening U.S. recovery and decreased inflationary pressures, as energy prices have fallen and European growth remains weak. In the U.S., at the end of the Reporting Period, we favored pro-cyclical sectors. Within the Eurozone, the Portfolio is positioned in core economies, such as Germany.
In terms of fixed income, we are focusing on what we view as quality within the Portfolio’s high yield corporate bond investments. Although the default environment remains supportive for corporate bonds, we observe that as interest rates rise and the business cycle matures, investors may reduce their search for yield. If investors do so rapidly, we believe such a shift could increase volatility but present potential tactical buying opportunities for quality assets. In addition, at the end of the Reporting Period, the Portfolio maintained a short duration position because we believe the current rate environment offers investors insufficient compensation for taking on risk related to Fed monetary policy and inflation.
4
GOLDMAN SACHS VARIABLE INSURANCE TRUST MULTI-STRATEGY ALTERNATIVES PORTFOLIO
Index Definitions
The Bank of America Merrill Lynch U.S. Dollar Three-Month LIBOR Constant Maturity Index tracks the performance of a synthetic asset paying Libor to a stated maturity. The Index is based on the assumed purchase at par of a synthetic instrument having exactly its stated maturity and with a coupon equal to that day’s fixing rate. That issue is assumed to be sold the following business day (priced at a yield equal to the current day fixing rate) and rolled into a new instrument.
All index figures do not reflect any deduction for fees, expenses or taxes. It is not possible to invest directly in an unmanaged index.
5
FUND BASICS
Multi-Strategy Alternatives Portfolio
as of December 31, 2014
STANDARDIZED TOTAL RETURNS1
| | | | | | |
| For the period ended 12/31/14 | | Since Inception | | | Inception Date |
| Institutional | | | (0.67 | )% | | 4/25/14 |
| Service | | | (0.85 | ) | | 4/25/14 |
| Advisor | | | (0.97 | ) | | 4/25/14 |
| 1 | The Standardized Total Returns are average annual total returns or cumulative total returns (only if the performance period is one year or less) as of the most recent calendar quarter-end. They assume reinvestment of all distributions at net asset value. Because Institutional, Service and Advisor Shares do not involve a sales charge, such a charge is not applied to their Standardized Total Returns. |
Total return figures in the above chart represent past performance and do not indicate future results, which will vary. The investment return and principal value of an investment will fluctuate and, therefore, an investor’s shares, when redeemed, may be worth more or less than their original cost. Current performance may be lower or higher than the total return figures in the above chart. Please visit www.GSAMFUNDS.com to obtain the most recent month-end returns. Performance reflects fee waivers and/or expense limitations in effect during the periods shown. In their absence, performance would be reduced.
EXPENSE RATIOS2
| | | | | | | | |
| | | Net Expense Ratio (Current) | | | Gross Expense Ratio (Before Waivers) | |
| Institutional | | | 1.09 | % | | | 2.41 | % |
| Service | | | 1.34 | | | | 2.66 | |
| Advisor | | | 1.49 | | | | 2.81 | |
| 2 | The expense ratios of the Portfolio, both current (net of any fee waivers or expense limitations) and before waivers (gross of any fee waivers or expense limitations) are as set forth above. Pursuant to a contractual arrangement, the Portfolio’s waivers and/or expense limitations will remain in place through at least April 30, 2015 and prior to such date the Investment Adviser may not terminate the arrangements without the approval of the Portfolio’s Board of Trustees. If these arrangements are discontinued in the future, the expense ratios may change without shareholder approval. |
6
FUND BASICS
OVERALL UNDERLYING FUND AND ETF WEIGHTINGS3
Percentage of Net Assets
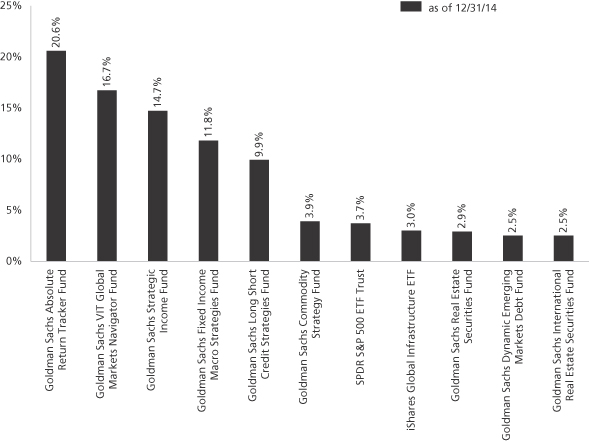
| 3 | The Portfolio is actively managed and, as such, its composition may differ over time. The percentage shown for each underlying fund and ETF reflects the value of that underlying fund or ETF as a percentage of net assets of the Portfolio. Figures in the graph above may not sum to 100% due to rounding and/or exclusion of other assets and liabilities. The above graph depicts the Portfolio’s investments but may not represent the Portfolio’s market exposure due to the exclusion of certain derivatives, if any, as listed in the Additional Investment Information section of the Schedule of Investments. |
7
GOLDMAN SACHS VARIABLE INSURANCE TRUST MULTI-STRATEGY ALTERNATIVES PORTFOLIO
Performance Summary
December 31, 2014
The following graph shows the value, as of December 31, 2014, of a $10,000 investment made on April 25, 2014 (commencement of the Portfolio’s operations) in Advisor Shares at NAV. For comparative purposes, the performance of the Portfolio’s benchmark, the Bank of America Merrill Lynch U.S. Dollar LIBOR Three-Month Constant Maturity Index (the “LIBOR Index”), is shown. This performance data represents past performance and should not be considered indicative of future performance, which will fluctuate with changes in market conditions. These performance fluctuations will cause an investor’s shares, when redeemed, to be worth more or less than their original cost. Performance reflects Portfolio level expenses but does not reflect fees and expenses associated with any variable annuity contract or variable life insurance policy that uses the Portfolio as an investment option for any contract or policy. Had performance reflected all of those fees and expenses, performance would have been reduced. Performance reflects applicable fee waivers and/or expense limitations in effect during the periods shown, and in their absence, performance would be reduced. Performance of Institutional and Service Shares will vary from Advisor Shares due to differences in class specific fees. In addition to the Investment Adviser’s decisions regarding issuer/industry investment selection and allocation, other factors may affect Portfolio performance. These factors include, but are not limited to, Portfolio operating fees and expenses, portfolio turnover, and subscription and redemption cash flows affecting the Portfolio.
Multi-Strategy Alternatives Portfolio’s Lifetime Performance
Performance of a $10,000 investment, with distributions reinvested, from April 25, 2014 through December 31, 2014.
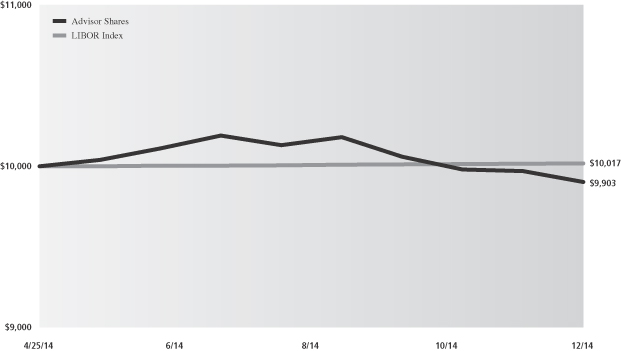
| | |
| Cumulative Total Return through December 31, 2014 | | Since Inception |
Institutional (Commenced April 25, 2014) | | -0.67% |
Service (Commenced April 25, 2014) | | -0.85% |
Advisor (Commenced April 25, 2014) | | -0.97% |
8
GOLDMAN SACHS VARIABLE INSURANCE TRUST MULTI-STRATEGY ALTERNATIVES PORTFOLIO
Schedule of Investments
December 31, 2014
| | | | | | | | |
| Shares | | | Description | | Value | |
| | Underlying Funds (Institutional Shares)(a) – 85.5% | |
| Equity – 22.1% | |
| | 60,254 | | | Goldman Sachs VIT Global Markets Navigator Fund | | $ | 712,199 | |
| | 6,119 | | | Goldman Sachs Real Estate Securities Fund | | | 123,491 | |
| | 17,180 | | | Goldman Sachs International Real Estate Securities Fund | | | 106,346 | |
| | | | | | | | |
| | | | | | | 942,036 | |
| | |
| Fixed Income – 63.4% | |
| | 95,299 | | | Goldman Sachs Absolute Return Tracker Fund | | | 878,658 | |
| | 60,739 | | | Goldman Sachs Strategic Income Fund | | | 624,400 | |
| | 53,722 | | | Goldman Sachs Fixed Income Macro Strategies Fund | | | 500,686 | |
| | 43,439 | | | Goldman Sachs Long Short Credit Strategies Fund | | | 421,356 | |
| | 42,498 | | | Goldman Sachs Commodity Strategy Fund | | | 167,016 | |
| | 12,126 | | | Goldman Sachs Dynamic Emerging Markets Debt Fund | | | 107,559 | |
| | | | | | | | |
| | | | | | | 2,699,675 | |
| | |
| TOTAL UNDERLYING FUNDS
(INSTITUTIONAL SHARES) – 85.5% |
|
| | (Cost $3,757,240) | | $ | 3,641,711 | |
| | |
| | | | | | | | |
| | Exchange Traded Funds – 6.7% | |
| | 3,024 | | | iShares Global Infrastructure ETF | | $ | 127,461 | |
| | 770 | | | SPDR S&P 500 ETF Trust | | | 158,235 | |
| | |
| | TOTAL EXCHANGE TRADED FUNDS | |
| | (Cost $281,030) | | $ | 285,696 | |
| | |
| | TOTAL INVESTMENTS – 92.2% | |
| | (Cost $4,038,270) | | $ | 3,927,407 | |
| | |
| OTHER ASSETS IN EXCESS OF
LIABILITIES – 7.8% | | | 330,732 | |
| | |
| | NET ASSETS – 100.0% | | $ | 4,258,139 | |
| | |
| | |
| The percentage shown for each investment category reflects the value of investments in that category as a percentage of net assets. |
| (a) | | Represents Affiliated Funds. |
| | |
| Investment Abbreviation: |
| SPDR | | —Standard and Poor’s Depositary Receipts |
| | |
| The accompanying notes are an integral part of these financial statements. | | 9 |
GOLDMAN SACHS VARIABLE INSURANCE TRUST MULTI-STRATEGY ALTERNATIVES PORTFOLIO
Statement of Assets and Liabilities
December 31, 2014
| | | | |
| | | | |
| Assets: | | | |
Investments in Affiliated Underlying Funds, at value (cost $3,757,240) | | $ | 3,641,711 | |
Investments, at value (cost $281,030) | | | 285,696 | |
Cash | | | 261,979 | |
Receivables: | | | | |
Reimbursement from investment adviser | | | 129,093 | |
Dividends | | | 874 | |
Deferred offering costs | | | 95,023 | |
| Total assets | | | 4,414,376 | |
| | | | |
| | | | |
| Liabilities: | | | |
Payables: | | | | |
Printing and mailing costs | | | 41,070 | |
Portfolio shares redeemed | | | 33,995 | |
Professional fees | | | 50,111 | |
Organization costs | | | 12,000 | |
Distribution and Service fees and Transfer Agent fees | | | 1,265 | |
Accrued expenses | | | 17,796 | |
| Total liabilities | | | 156,237 | |
| | | | |
| | | | |
| Net Assets: | | | |
Paid-in capital | | | 4,361,031 | |
Undistributed net investment income | | | 45 | |
Accumulated net realized gain | | | 7,926 | |
Net unrealized loss | | | (110,863 | ) |
| NET ASSETS | | $ | 4,258,139 | |
Net Assets: | | | | |
Institutional | | $ | 1,002,564 | |
Service | | | 9,916 | |
Advisor | | | 3,245,659 | |
Total Net Assets | | $ | 4,258,139 | |
Shares outstanding $0.001 par value (unlimited shares authorized): | | | | |
Institutional | | | 102,192 | |
Service | | | 1,010 | |
Advisor | | | 331,392 | |
Net asset value, offering and redemption price per share: | | | | |
Institutional | | | $9.81 | |
Service | | | 9.81 | |
Advisor | | | 9.79 | |
| | |
| 10 | | The accompanying notes are an integral part of these financial statements. |
GOLDMAN SACHS VARIABLE INSURANCE TRUST MULTI-STRATEGY ALTERNATIVES PORTFOLIO
Statement of Operations
For the Period Ended December 31, 2014(a)
| | | | |
| | | | |
| Investment income: | | | |
Dividends from Affiliated Underlying Funds | | $ | 27,927 | |
Dividends from Unaffiliated Funds | | | 3,611 | |
| Total investment income | | | 31,538 | |
| | | | |
| | | | |
| Expenses: | | | |
Amortization of offering costs | | | 140,724 | |
Professional fees | | | 79,651 | |
Printing and mailing costs | | | 48,049 | |
Trustee fees | | | 19,802 | |
Custody, accounting and administrative services | | | 15,350 | |
Organization costs | | | 12,000 | |
Distribution and Service fees(b) | | | 3,713 | |
Management fees | | | 2,417 | |
Transfer Agent fees(b) | | | 324 | |
Other | | | 9,683 | |
| Total expenses | | | 331,713 | |
Less — expense reductions | | | (324,478 | ) |
| Net expenses | | | 7,235 | |
| NET INVESTMENT INCOME | | | 24,303 | |
| | | | |
| | | | |
| Realized and unrealized gain (loss): | | | |
Net realized gain (loss) from: | | | | |
Investments in Affiliated Underlying Funds | | | (8,084 | ) |
Investments | | | 737 | |
Capital gain distributions from Affiliated Underlying Funds | | | 39,579 | |
Net change in unrealized gain (loss) on: | | | | |
Investments in Affiliated Underlying Funds | | | (115,529 | ) |
Investments | | | 4,666 | |
| Net realized and unrealized loss | | | (78,631 | ) |
| NET DECREASE IN NET ASSETS RESULTING FROM OPERATIONS | | $ | (54,328 | ) |
(a) Commenced operations on April 25, 2014.
(b) Class specific Distribution and Service, and Transfer Agent fees were as follows:
| | | | | | | | | | | | | | | | | | | | |
| | | Distribution and Service Fees | | | Transfer Agent Fees | |
Portfolio | | Service | | | Advisor | | | Institutional | | | Service | | | Advisor | |
Multi-Strategy Alternatives Portfolio | | $ | 17 | | | $ | 3,696 | | | $ | 136 | | | $ | 3 | | | $ | 185 | |
| | |
| The accompanying notes are an integral part of these financial statements. | | 11 |
GOLDMAN SACHS VARIABLE INSURANCE TRUST MULTI-STRATEGY ALTERNATIVES PORTFOLIO
Statement of Changes in Net Assets
| | | | |
| | | For the Period Ended
December 31, 2014(a) | |
| | | | |
| From operations: | | | |
Net investment income | | $ | 24,303 | |
Net realized gain | | | 32,232 | |
Net change in unrealized loss | | | (110,863 | ) |
| Net decrease in net assets resulting from operations | | | (54,328 | ) |
| | | | |
| | | | |
| Distributions to shareholders: | | | |
From net investment income | | | | |
Institutional Shares | | | (12,295 | ) |
Service Shares | | | (103 | ) |
Advisor Shares | | | (36,975 | ) |
From net realized gains | | | | |
Institutional Shares | | | (181 | ) |
Service Shares | | | (2 | ) |
Advisor Shares | | | (570 | ) |
| Total distributions to shareholders | | | (50,126 | ) |
| | | | |
| | | | |
| From share transactions: | | | |
Proceeds from sales of shares | | | 4,570,440 | |
Reinvestment of distributions | | | 50,126 | |
Cost of shares redeemed | | | (257,973 | ) |
| Net increase in net assets resulting from share transactions | | | 4,362,593 | |
| TOTAL INCREASE | | | 4,258,139 | |
| | | | |
| | | | |
| Net assets: | | | |
| |
Beginning of period | | | — | |
End of period | | $ | 4,258,139 | |
| Undistributed net investment income | | $ | 45 | |
(a) Commenced operations on April 25, 2014.
| | |
| 12 | | The accompanying notes are an integral part of these financial statements. |
GOLDMAN SACHS VARIABLE INSURANCE TRUST MULTI-STRATEGY ALTERNATIVES PORTFOLIO
Financial Highlights
Selected Data for a Share Outstanding Throughout Each Period
| | | | | | | | | | | | | | | | | | | | | | | | | | | | | | | | | | | | | | | | | | | | | | | | | | | | | | | | |
| | | | | | Income (loss) from
investment operations | | | Distributions to shareholders | | | | | | | | | | | | | | | | | | | | | | |
| Year - Share Class | | Net asset
value,
beginning
of period | | | Net
investment
income(a)(b) | | | Net
realized
and
unrealized
loss | | | Total from
investment
operations | | | From net
investment
income | | | From
net
realized
gains | | | Total
distributions | | | Net asset
value,
end of
period | | | Total
return(c) | | | Net assets,
end of
period
(in 000s) | | | Ratio of
net expenses
to average
net assets(d) | | | Ratio of
total
expenses
to average
net assets(d) | | | Ratio of
net investment
income to
average net
assets(b) | | | Portfolio
turnover
rate(e) | |
FOR THE PERIOD ENDED DECEMBER 31, | |
2014 - Institutional (Commenced
April 25, 2014) | | $ | 10.00 | | | $ | 0.09 | | | $ | (0.16 | ) | | $ | (0.07 | ) | | $ | (0.12 | ) | | $ | — | (f) | | $ | (0.12 | ) | | $ | 9.81 | | | | (0.67 | )% | | $ | 1,003 | | | | 0.22 | %(g) | | | 24.63 | %(g) | | | 1.30 | %(g) | | | 25 | % |
2014 - Service (Commenced
April 25, 2014) | | | 10.00 | | | | 0.07 | | | | (0.16 | ) | | | (0.09 | ) | | | (0.10 | ) | | | — | (f) | | | (0.10 | ) | | | 9.81 | | | | (0.85 | ) | | | 10 | | | | 0.49 | (g) | | | 25.05 | (g) | | | 1.02 | (g) | | | 25 | |
2014 - Advisor (Commenced
April 25, 2014) | | | 10.00 | | | | 0.11 | | | | (0.21 | ) | | | (0.10 | ) | | | (0.11 | ) | | | — | (f) | | | (0.11 | ) | | | 9.79 | | | | (0.97 | ) | | | 3,246 | | | | 0.62 | (g) | | | 16.16 | (g) | | | 1.66 | (g) | | | 25 | |
| (a) | Calculated based on the average shares outstanding methodology. |
| (b) | Recognition of net investment income by the Portfolio is affected by the timing of declaration of dividends by the Underlying Funds in which the Portfolio invests. |
| (c) | Assumes investment at the net asset value at the beginning of the period, reinvestment of all distributions, and a complete redemption of the investment at the net asset value at the end of the period. Total returns for periods less than one full year are not annualized. |
| (d) | Expense ratios exclude the expenses of the Underlying Funds in which the Portfolio invests. |
| (e) | The portfolio turnover rate is calculated in accordance with regulatory requirements, without regard to transactions involving short term investments and certain derivatives. If such transactions were included, the portfolio turnover rate may be higher. |
| (f) | Amount is less than $0.005 per share. |
| | | | |
| The accompanying notes are an integral part of these financial statements. | | 13 | | |
GOLDMAN SACHS VARIABLE INSURANCE TRUST MULTI-STRATEGY ALTERNATIVES PORTFOLIO
Notes to Financial Statements
December 31, 2014
1. ORGANIZATION
Goldman Sachs Variable Insurance Trust (the “Trust” or “VIT”) is a Delaware statutory trust registered under the Investment Company Act of 1940, as amended (the “Act”), as an open-end management investment company. The Trust includes the Goldman Sachs Multi-Strategy Alternatives Portfolio (the “Portfolio”). The Portfolio is a diversified portfolio under the Act offering three classes of shares — Institutional, Service and Advisor Shares. Shares of the Trust are offered to separate accounts of participating life insurance companies for the purpose of funding variable annuity contracts and variable life insurance policies. The Portfolio commenced operations on April 25, 2014.
Goldman Sachs Asset Management, L.P. (“GSAM”), an affiliate of Goldman, Sachs & Co. (“Goldman Sachs”), serves as investment adviser to the Portfolio pursuant to a management agreement (the “Agreement”) with the Trust.
The Portfolio is expected to invest primarily in a combination of domestic and international equity and fixed income underlying funds which are registered under the Act, for which GSAM or Goldman Sachs Asset Management International (“GSAMI”), also an affiliate of Goldman Sachs, act as investment advisers (“Underlying Funds”). Additionally, this Portfolio may invest a portion of its assets directly in other securities and instruments, including unaffiliated exchange-traded funds (“Unaffiliated Funds”).
2. SIGNIFICANT ACCOUNTING POLICIES
The financial statements have been prepared in accordance with accounting principles generally accepted in the United States of America (“GAAP”) and require management to make estimates and assumptions that may affect the reported amounts and disclosures. Actual results may differ from those estimates and assumptions.
A. Investment Valuation — The Portfolio’s valuation policy, as well as the Underlying Funds’ is to value investments at fair value.
B. Investment Income and Investments — Investment income includes interest income and dividend income, net of any foreign withholding taxes, less any amounts reclaimable. Interest income is accrued daily and adjusted for amortization of premiums and accretion of discounts. Dividend income is recognized on ex-dividend date or, for certain foreign securities, as soon as such information is obtained subsequent to the ex-dividend date. Capital gain distributions received from Underlying Funds are recognized on ex-dividend date. Investment transactions are reflected on trade date. Realized gains and losses are calculated using identified cost. Investment transactions are recorded on the following business day for daily net asset value (“NAV”) calculations. Any foreign capital gains tax is accrued daily based upon net unrealized gains, and is payable upon sale of such investments.
C. Class Allocations and Expenses — Investment income, realized and unrealized gain (loss), and non-class specific expenses of each Portfolio are allocated daily based upon the proportion of net assets of each class. Class specific expenses, where applicable, are borne by the respective share classes and include Distribution and Service and Transfer Agent fees. Non-class specific expenses directly incurred by a Portfolio are charged to that Portfolio, while such expenses incurred by the Trust are allocated across the respective Funds on a straight-line and/or pro-rata basis depending upon the nature of the expenses.
Expenses included in the accompanying financial statements reflect the expenses of the Portfolio and do not include any expenses associated with the Underlying Funds. Because the Underlying Funds have varied expense and fee levels and the Portfolio may own different proportions of the Underlying Funds at different times, the amount of fees and expenses incurred indirectly by the Portfolio will vary.
14
GOLDMAN SACHS VARIABLE INSURANCE TRUST MULTI-STRATEGY ALTERNATIVES PORTFOLIO
2. SIGNIFICANT ACCOUNTING POLICIES (continued)
D. Offering and Organization Costs — Offering costs paid in connection with the offering of shares of the Portfolio are being amortized on a straight-line basis over 12 months from the date of commencement of operations. Organization costs paid in connection with the organization of the Portfolio were expensed on the first day of operations.
E. Federal Taxes and Distributions to Shareholders — It is the Portfolio’s policy to comply with the requirements of the Internal Revenue Code of 1986, as amended (the “Code”), applicable to regulated investment companies (mutual funds) and to distribute each year substantially all of its investment company taxable income and capital gains to its shareholders. Accordingly, the Portfolio is not required to make any provisions for the payment of federal income tax. Distributions to shareholders are recorded on the ex-dividend date. Income and capital gains distributions, if any, are declared and paid annually.
Net capital losses are carried forward to future fiscal years and may be used to the extent allowed by the Code to offset any future capital gains. Losses that are carried forward will retain their character as either short-term or long-term capital losses. Utilization of capital loss carryforwards will reduce the requirement of future capital gains distributions.
The characterization of distributions to shareholders for financial reporting purposes is determined in accordance with federal income tax rules, which may differ from GAAP. The source of the Portfolio’s distributions may be shown in the accompanying financial statements as either from net investment income, net realized gain or capital. Certain components of the Portfolio’s net assets on the Statement of Assets and Liabilities reflect permanent GAAP/tax differences based on the appropriate tax character.
3. INVESTMENTS AND FAIR VALUE MEASUREMENTS
The fair value of a financial instrument is the amount that would be received to sell an asset or paid to transfer a liability in an orderly transaction between market participants at the measurement date (i.e., the exit price). GAAP establishes a fair value hierarchy that prioritizes the inputs to valuation techniques used to measure fair value. The hierarchy gives the highest priority to unadjusted quoted prices in active markets for identical assets or liabilities (Level 1 measurements) and the lowest priority to unobservable inputs (Level 3 measurements). The levels used for classifying investments are not necessarily an indication of the risk associated with investing in these investments. The three levels of the fair value hierarchy are described below:
Level 1 — Unadjusted quoted prices in active markets that are accessible at the measurement date for identical, unrestricted assets or liabilities;
Level 2 — Quoted prices in markets that are not active or financial instruments for which significant inputs are observable (including, but not limited to, quoted prices for similar investments, interest rates, foreign exchange rates, volatility and credit spreads), either directly or indirectly;
Level 3 — Prices or valuations that require significant unobservable inputs (including GSAM’s assumptions in determining fair value measurement).
The Trustees have adopted Valuation Procedures that govern the valuation of the portfolio investments held by the Portfolio, including investments for which market quotations are not readily available. The Trustees have delegated to GSAM day-to-day responsibility for implementing and maintaining internal controls and procedures related to the valuation of the Portfolio’s portfolio investments. To assess the continuing appropriateness of pricing sources and methodologies, GSAM regularly performs price verification procedures and issues challenges as necessary to third party pricing vendors or brokers, and any differences are reviewed in accordance with the Valuation Procedures.
15
GOLDMAN SACHS VARIABLE INSURANCE TRUST MULTI-STRATEGY ALTERNATIVES PORTFOLIO
Notes to Financial Statements (continued)
December 31, 2014
3. INVESTMENTS AND FAIR VALUE MEASUREMENTS (continued)
A. Level 1 and Level 2 Fair Value Investments — The valuation techniques and significant inputs used in determining the fair values for investments classified as Level 1 and Level 2 are as follows:
Underlying Funds — Investments in the Affiliated Underlying Funds are valued at the NAV per share of the Institutional Share class of each Underlying Fund on the day of valuation. Because the Portfolio invests primarily in other mutual funds that fluctuate in value, the Portfolio’s shares will correspondingly fluctuate in value. These investments are generally classified as Level 1 of the fair value hierarchy. In addition, the Portfolio invests in Unaffiliated Exchange Traded Funds.
The Underlying Funds may invest in debt securities which, if market quotations are readily available, are valued daily on the basis of quotations supplied by dealers or an independent pricing service approved by the Trustees. The pricing services may use valuation models or matrix pricing, which consider: (i) yield or price with respect to bonds that are considered comparable in characteristics such as rating, interest rate and maturity date or (ii) quotations from securities dealers to determine current value. Short-term debt obligations that mature in sixty days or less and that do not exhibit signs of credit deterioration are valued at amortized cost, which approximates fair value. With the exception of treasury securities of G8 countries (not held in money market funds), which are generally classified as Level 1, these investments are generally classified as Level 2 of the fair value hierarchy.
The Underlying Funds may invest in equity securities and investment companies. Investments in equity securities and investment companies traded on a United States (“U.S.”) securities exchange or the NASDAQ system, or those located on certain foreign exchanges, including but not limited to the Americas, are valued daily at their last sale price or official closing price on the principal exchange or system on which they are traded. If no sale occurs, equity securities and exchange traded investment companies are valued at the last bid price for long positions and at the last ask price for short positions. Investments in investment companies (other than those that are exchange traded) are valued at the NAV on the valuation date. To the extent these investments are actively traded, they are classified as Level 1 of the fair value hierarchy, otherwise they are generally classified as Level 2.
Unlisted equity securities for which market quotations are available are valued at the last sale price on the valuation date, or if no sale occurs, at the last bid price. Securities traded on certain foreign securities exchanges are valued daily at fair value determined by an independent fair value service (if available) under Valuation Procedures approved by the Trustees and consistent with applicable regulatory guidance. The independent fair value service takes into account multiple factors including, but not limited to, movements in the securities markets, certain depositary receipts, futures contracts and foreign currency exchange rates that have occurred subsequent to the close of the foreign securities exchange. These investments are generally classified as Level 2 of the fair value hierarchy.
B. Level 3 Fair Value Investments — To the extent that the aforementioned significant inputs are unobservable, or if quotations are not readily available, or if GSAM believes that such quotations do not accurately reflect fair value, the fair value of the Portfolio’s investments may be determined under Valuation Procedures approved by the Trustees. GSAM, consistent with its procedures and applicable regulatory guidance, may make an adjustment to the most recent valuation prices of either domestic or foreign securities in light of significant events to reflect what it believes to be the fair value of the securities at the time of determining a Portfolio’s NAV. Significant events which could affect a large number of securities in a particular market may include, but are not limited to: significant fluctuations in U.S. or foreign markets; market dislocations; market disruptions; or unscheduled market closings. Significant events, which could also affect a single issuer may include, but are not limited to: corporate actions such as reorganizations, mergers and buy-outs; ratings downgrades; and bankruptcies.
16
GOLDMAN SACHS VARIABLE INSURANCE TRUST MULTI-STRATEGY ALTERNATIVES PORTFOLIO
3. INVESTMENTS AND FAIR VALUE MEASUREMENTS (continued)
C. Fair Value Hierarchy — The following is a summary of the Portfolio’s investments classified in the fair value hierarchy as of December 31, 2014:
| | | | | | | | | | | | |
| Investment Type | | Level 1 | | | Level 2 | | | Level 3 | |
| Assets | | | | | | | | | | | | |
| Equity Underlying Funds | | $ | 942,036 | | | $ | — | | | $ | — | |
| Fixed Income Underlying Funds | | | 2,699,675 | | | | — | | | | — | |
| Exchange Traded Funds | | | 285,696 | | | | — | | | | — | |
| Total | | $ | 3,927,407 | | | $ | — | | | $ | — | |
4. AGREEMENTS AND AFFILIATED TRANSACTIONS
A. Management Agreement — Under the Agreement, GSAM manages the Portfolio, subject to the general supervision of the Trustees.
As compensation for the services rendered pursuant to the Agreement, the assumption of the expenses related thereto and administration of the Portfolio’s business affairs, including providing facilities, GSAM is entitled to a management fee, accrued daily and paid monthly, equal to an annual percentage rate of 0.15% of the Portfolio’s average daily net assets. GSAM has agreed to waive all of its management fee. The management fee wavier will remain in effect through at least April 30, 2015, and prior to such date, GSAM may not terminate the arrangement without the approval of the Board of Trustees. For the period ended December 31, 2014, GSAM waived $2,417 of its management fee.
B. Distribution and Service Plans — The Trust, on behalf of the Portfolio, has adopted Distribution and Service Plans (the “Plans”). Under the Plans, Goldman Sachs, which serves as distributor (“The Distributor”), is entitled to a fee accrued daily and paid monthly for distribution services and personal and account maintenance services, which may then be paid by Goldman Sachs to authorized dealers, equal to, on an annual basis, 0.25% and 0.40% of the Portfolio’s average daily net assets attributable to Service and Advisor Shares, respectively.
C. Transfer Agency Agreement — Goldman Sachs also serves as the transfer agent of the Portfolio for a fee pursuant to a Transfer Agency Agreement. The fees charged for such transfer agency services are accrued daily and paid monthly at an annual rate of 0.02% of the average daily net assets for Institutional, Service and Advisor Shares.
D. Other Expense Agreements and Affiliated Transactions — GSAM has agreed to limit certain “Other Expenses” of the Portfolio (excluding transfer agency fees and expenses, taxes, interest, brokerage fees, shareholder meetings, litigation, indemnification and extraordinary expenses) to the extent such expenses exceed, on an annual basis, a percentage rate of the average daily net assets of the Portfolio. Such Other Expense reimbursements, if any, are accrued daily and paid monthly. In addition, the Portfolio is not obligated to reimburse GSAM for prior fiscal year expense reimbursements, if any. The Other Expense limitation as an annual percentage rate of average daily net assets for the Portfolio is 0.204%. The Other Expense limitation will remain in place through at least April 30, 2015, and prior to such date GSAM may not terminate the arrangement without the approval of the Trustees. For the period ended December 31, 2014, GSAM reimbursed $321,971 to the Portfolio. The Portfolio bears its respective share of costs related to proxy and shareholder meetings, and GSAM has agreed to reimburse the Portfolio to
17
GOLDMAN SACHS VARIABLE INSURANCE TRUST MULTI-STRATEGY ALTERNATIVES PORTFOLIO
Notes to Financial Statements (continued)
December 31, 2014
4. AGREEMENTS AND AFFILIATED TRANSACTIONS (continued)
the extent such expenses exceed a specified percentage of the Portfolio’s net assets. In addition, the Portfolio has entered into certain offset arrangements with the custodian and the transfer agent, which may result in a reduction of the Portfolio’s expenses and are received irrespective of the application of the “Other Expense” limitation described above. For the period ended December 31, 2014, custody fee credits were $90.
E. Other Transactions with Affiliates — For the period ended December 31, 2014, Goldman Sachs did not earn any brokerage commissions from portfolio transactions, on behalf of the Portfolio.
The Portfolio invests primarily in the Institutional Shares of the Underlying Funds. These Underlying Funds are considered to be affiliated with the Portfolio. The tables below show the transactions in and earnings from investments in these affiliated Funds for the period ended December 31, 2014:
| | | | | | | | | | | | | | | | | | | | | | | | | | | | | | | | |
| Underlying Funds | | Market
Value
04/25/2014(1) | | | Purchases at Cost(2) | | | Proceeds
from Sales | | | Net
Realized
Gain
(Loss) | | | Change in
Unrealized
Appreciation
(Depreciation) | | | Market
Value
12/31/2014 | | | Dividend
Income | | | Capital Gain
Distributions | |
Goldman Sachs Absolute Return Tracker Fund | | $ | — | | | $ | 907,756 | | | $ | (44,139 | ) | | $ | 30,494 | | | $ | (15,453 | ) | | $ | 878,658 | | | $ | 3,796 | | | $ | 30,565 | |
Goldman Sachs Commodity Strategy Fund | | | — | | | | 227,201 | | | | (11,462 | ) | | | (327 | ) | | | (48,396 | ) | | | 167,016 | | | | 101 | | | | — | |
Goldman Sachs Dynamic Emerging Markets
Debt Fund | | | — | | | | 113,587 | | | | — | | | | — | | | | (6,028 | ) | | | 107,559 | | | | 1,589 | | | | — | |
Goldman Sachs Fixed Income Macro Strategies Fund | | | — | | | | 522,475 | | | | (5,201 | ) | | | (37 | ) | | | (16,551 | ) | | | 500,686 | | | | 578 | | | | — | |
Goldman Sachs International Real Estate
Securities Fund | | | — | | | | 124,800 | | | | (15,551 | ) | | | (34 | ) | | | (2,869 | ) | | | 106,346 | | | | 3,196 | | | | — | |
Goldman Sachs Long Short Credit Strategies Fund | | | — | | | | 452,000 | | | | (9,677 | ) | | | 3,489 | | | | (24,456 | ) | | | 421,356 | | | | 7,200 | | | | 3,514 | |
Goldman Sachs Managed Futures Strategy Fund | | | — | | | | 398,122 | | | | (390,622 | ) | | | (7,500 | ) | | | — | | | | — | | | | — | | | | — | |
Goldman Sachs Real Estate Securities Fund | | | — | | | | 113,161 | | | | — | | | | — | | | | 10,330 | | | | 123,491 | | | | 574 | | | | — | |
Goldman Sachs Strategic Income Fund | | | — | | | | 650,437 | | | | (10,531 | ) | | | (55 | ) | | | (15,451 | ) | | | 624,400 | | | | 9,412 | | | | — | |
Goldman Sachs VIT Global Markets Navigator Fund | | | — | | | | 714,798 | | | | (11,409 | ) | | | 5,465 | | | | 3,345 | | | | 712,199 | | | | 1,481 | | | | 5,500 | |
| Total | | $ | — | | | $ | 4,224,337 | | | $ | (498,592 | ) | | $ | 31,495 | | | $ | (115,529 | ) | | $ | 3,641,711 | | | $ | 27,927 | | | $ | 39,579 | |
| (1) | Commenced operations on April 25, 2014. |
| (2) | Includes reinvestment of distributions. |
As of December 31, 2014, the Goldman Sachs Group, Inc. was the beneficial owner of approximately 97.1% and 100% of the Institutional and Service Class Shares, respectively, of the Portfolio.
18
GOLDMAN SACHS VARIABLE INSURANCE TRUST MULTI-STRATEGY ALTERNATIVES PORTFOLIO
5. PORTFOLIO SECURITIES TRANSACTIONS
The cost of purchases and proceeds from sales and maturities of long-term securities for the period ended December 31, 2014, were $4,561,663 and $516,046, respectively.
6. TAX INFORMATION
The tax character of distributions paid during the period ended December 31, 2014 was as follows:
| | | | |
| | | 2014 | |
| Distributions paid from ordinary income | | $ | 50,126 | |
As of December 31, 2014, the components of accumulated earnings (losses) on a tax-basis were as follows:
| | | | |
| Undistributed ordinary income — net | | $ | 66 | |
| Undistributed long-term capital gains | | | 16,026 | |
| Total undistributed earnings | | $ | 16,092 | |
| Timing differences (Post October Loss Deferral) | | | (7,524 | ) |
| Unrealized losses — net | | | (111,460 | ) |
| Total accumulated losses — net | | $ | (102,892 | ) |
As of December 31, 2014, the Portfolio’s aggregate security unrealized gains and losses based on cost for U.S. federal income tax purposes were as follows:
| | | | |
| Tax cost | | $ | 4,038,867 | |
| Gross unrealized gain | | | 19,777 | |
| Gross unrealized loss | | | (131,237 | ) |
| Net unrealized security gain | | $ | (111,460 | ) |
The difference between GAAP-basis and tax-basis unrealized gains (losses) is attributable primarily to wash sales.
In order to present certain components of the Portfolio’s capital accounts on a tax-basis, the Portfolio has reclassified $1,562 of paid-in capital and $23,553 of accumulated net realized gain into undistributed net investment income. These reclassifications have no impact on the net asset value of the Portfolio and results primarily from certain non-deductible expenses and underlying fund investments.
GSAM has reviewed the Portfolio’s tax positions for all open tax years (the current and prior three years, as applicable) and has concluded that no provision for income tax is required in the Portfolio’s financial statements. Such open tax years remain subject to examination and adjustment by tax authorities.
19
GOLDMAN SACHS VARIABLE INSURANCE TRUST MULTI-STRATEGY ALTERNATIVES PORTFOLIO
Notes to Financial Statements (continued)
December 31, 2014
7. OTHER RISKS
The Portfolio’s risks include, but are not limited to, the following:
Investments in the Underlying Funds — The investments of a Portfolio are concentrated in the Underlying Funds, and the Portfolio’s investment performance is directly related to the investment performance of the Underlying Funds it holds. The Portfolio is subject to the risk factors associated with the investments of the Underlying Funds in direct proportion to the amount of assets allocated to each. To the extent that the Portfolio has a relative concentration of its portfolio in a single Underlying Fund, the Portfolio may be more susceptible to adverse developments affecting that Underlying Fund, and may be more susceptible to losses because of these developments.
Large Shareholder Transactions Risk — The Portfolio or an Underlying Fund may experience adverse effects when certain large shareholders, such as other funds, participating insurance companies, institutional investors (including those trading by use of non-discretionary mathematical formulas), financial intermediaries (who may make investment decisions on behalf of underlying clients and/or include an Underlying Fund in their investment model), individuals, accounts and Goldman Sachs affiliates, purchase or redeem large amounts of shares of the Portfolio or an Underlying Fund. Such large shareholder redemptions may cause the Portfolio or an Underlying Fund to sell portfolio securities at times when it would not otherwise do so, which may negatively impact the Portfolio’s or an Underlying Fund’s NAV and liquidity. Similarly, large Portfolio or Underlying Fund share purchases may adversely affect the Portfolio’s or an Underlying Fund’s performance to the extent that the Portfolio or the Underlying Fund is delayed in investing new cash and is required to maintain a larger cash position than it ordinarily would. These transactions may also increase transaction costs. In addition, a large redemption could result in the Portfolio’s or an Underlying Fund’s current expenses being allocated over a smaller asset base, leading to an increase in the Portfolio’s or an Underlying Fund’s expense ratio.
Liquidity Risk — The Underlying Funds may make investments that are illiquid or that may become less liquid in response to market developments or adverse investor perceptions. Illiquid investments may be more difficult to value. Liquidity risk may also refer to the risk that a Portfolio will not be able to pay redemption proceeds within the allowable time period because of unusual market conditions, an unusually high volume of redemption requests, or other reasons. To meet redemption requests, a Portfolio may be forced to sell investments at an unfavorable time and/or under unfavorable conditions. Liquidity risk may be the result of, among other things, the reduced number and capacity of traditional market participants to make a market in fixed income securities or the lack of an active market. The potential for liquidity risk may be magnified by a rising interest rate environment or other circumstances where investor redemptions from fixed income mutual funds may be higher than normal, potentially causing increased supply in the market due to selling activity.
Market and Credit Risks — In the normal course of business, the Portfolio and the Underlying Funds trade financial instruments and enter into financial transactions where risk of potential loss exists due to changes in the market (market risk). Additionally, the Portfolio and the Underlying Funds may also be exposed to credit risk in the event that an issuer or guarantor fails to perform or that an institution or entity with which the Portfolio and the Underlying Funds have unsettled or open transactions defaults.
Investing in foreign markets may involve special risks and considerations not typically associated with investing in the U.S. Foreign securities may be subject to risk of loss because of more or less foreign government regulation, less public information and less economic, political and social stability in the countries in which the Portfolio and the Underlying Funds invest. Loss may also result from the imposition of exchange controls, confiscations and other government restrictions by the United States or other governments, or from problems in registration, settlement or custody. Foreign risk also involves the risk of negative foreign currency rate fluctuations, which may cause the value of securities denominated in such foreign currency (or other instruments through which the Portfolio and Underlying Funds have exposure to foreign currencies) to decline in value. Currency exchange rates may fluctuate significantly over short periods of time. To the extent that the Portfolio and Underlying Funds also invest in securities of issuers located in emerging markets, these risks may be more pronounced.
20
GOLDMAN SACHS VARIABLE INSURANCE TRUST MULTI-STRATEGY ALTERNATIVES PORTFOLIO
8. INDEMNIFICATIONS
Under the Trust’s organizational documents, its Trustees, officers, employees and agents are indemnified, to the extent permitted by the Act and state law, against certain liabilities that may arise out of performance of their duties to the Portfolio. Additionally, in the course of business, the Portfolio enters into contracts that contain a variety of indemnification clauses. The Portfolio’s maximum exposure under these arrangements is unknown, as this would involve future claims that may be made against the Portfolio that have not yet occurred. However, GSAM believes the risk of loss under these arrangements to be remote.
9. SUBSEQUENT EVENTS
Subsequent events after the Statement of Assets and Liabilities date have been evaluated through the date the financial statements were issued. GSAM has concluded that there is no impact requiring adjustment or disclosure in the financial statements.
21
GOLDMAN SACHS VARIABLE INSURANCE TRUST MULTI-STRATEGY ALTERNATIVES PORTFOLIO
Notes to Financial Statements (continued)
December 31, 2014
10. SUMMARY OF SHARE TRANSACTIONS
Share activity is as follows:
| | | | | | | | |
| | | For the Period Ended
December 31, 2014(a) | |
| | | Shares | | | Dollars | |
| Institutional Shares | | | | | | | | |
| Shares sold | | | 100,984 | | | $ | 1,010,213 | |
| Reinvestment of distributions | | | 1,268 | | | | 12,476 | |
| Shares redeemed | | | (60 | ) | | | (586 | ) |
| | | | 102,192 | | | | 1,022,103 | |
| Service Shares | | | | | | | | |
| Shares sold | | | 999 | | | | 10,000 | |
| Reinvestment of distributions | | | 11 | | | | 105 | |
| Shares redeemed | | | — | | | | — | |
| | | | 1,010 | | | | 10,105 | |
| Advisor Shares | | | | | | | | |
| Shares sold | | | 353,261 | | | | 3,550,227 | |
| Reinvestment of distributions | | | 3,823 | | | | 37,545 | |
| Shares redeemed | | | (25,692 | ) | | | (257,387 | ) |
| | | | 331,392 | | | | 3,330,385 | |
| NET INCREASE | | | 434,594 | | | $ | 4,362,593 | |
| (a) | Commenced operations on April 25, 2014. |
22
Report of Independent Registered Public Accounting Firm
To the Board of Trustees and Shareholders of
Goldman Sachs Variable Insurance Trust — Goldman Sachs Multi-Strategy Alternatives Portfolio:
In our opinion, the accompanying statement of assets and liabilities, including the schedule of investments, and the related statements of operations and of changes in net assets and the financial highlights present fairly, in all material respects, the financial position of Goldman Sachs Multi-Strategy Alternatives Portfolio (the “Portfolio”), a fund of Goldman Sachs Variable Insurance Trust, at December 31, 2014, the results of its operations, the changes in its net assets and the financial highlights for the periods indicated, in conformity with accounting principles generally accepted in the United States of America. These financial statements and financial highlights (hereafter referred to as “financial statements”) are the responsibility of the Fund’s management. Our responsibility is to express an opinion on these financial statements based on our audit. We conducted our audit of these financial statements in accordance with the standards of the Public Company Accounting Oversight Board (United States). Those standards require that we plan and perform the audit to obtain reasonable assurance about whether the financial statements are free of material misstatement. An audit includes examining, on a test basis, evidence supporting the amounts and disclosures in the financial statements, assessing the accounting principles used and significant estimates made by management, and evaluating the overall financial statement presentation. We believe that our audit, which included confirmation of securities at December 31, 2014 by correspondence with the custodian, transfer agent and the application of alternative auditing procedures where securities purchased confirmations had not been received, provides a reasonable basis for our opinion.
PricewaterhouseCoopers LLP
Boston, Massachusetts
February 19, 2015
23
GOLDMAN SACHS VARIABLE INSURANCE TRUST MULTI-STRATEGY ALTERNATIVES PORTFOLIO
|
| Portfolio Expenses — Six Month Period Ended December 31, 2014 (Unaudited) |
As a shareholder of Institutional, Service or Advisor Shares of the Portfolio, you incur ongoing costs, including management fees, distribution and service (12b-1) fees (with respect to Service and Advisor Shares) and other Portfolio expenses. This example is intended to help you understand your ongoing costs (in dollars) of investing in the Institutional Shares, Service Shares and Advisor Shares of the Portfolio and to compare these costs with the ongoing costs of investing in other mutual funds.
The example is based on an investment of $1,000 invested at the beginning of the period and held for the entire period from July 1, 2014 through December 31, 2014.
Actual Expenses — The first line under each share class in the table below provides information about actual account values and actual expenses. You may use the information in this line, together with the amount you invested, to estimate the expenses that you paid over the period. Simply divide your account value by $1,000 (for example, an $8,600 account value divided by $1,000=8.6), then multiply the result by the number in the first line under the heading entitled “Expenses Paid” to estimate the expenses you paid on your account during this period.
Hypothetical Example for Comparison Purposes — The second line under each share class in the table below provides information about hypothetical account values and hypothetical expenses based on the Portfolio's actual net expense ratio and an assumed rate of return of 5% per year before expenses, which is not the Portfolio's actual return. The hypothetical account values and expenses may not be used to estimate the actual ending account balance or expenses you paid for the period. You may use this information to compare the ongoing costs of investing in the Portfolio and other funds. To do so, compare this 5% hypothetical example with the 5% hypothetical examples that appear in the shareholder reports of the other funds.
Please note that the expenses shown in the table are meant to highlight your ongoing costs only. As a shareholder of the Portfolio you do not incur any transaction costs, such as sales charges, redemption fees, or exchange fees, but shareholders of other funds may incur such costs. The second line of the table is useful in comparing ongoing costs only, and will not help you determine the relative total costs of owning different funds whose shareholders may incur transaction costs.
| | | | | | | | | | | | |
| Share Class | | Beginning
Account Value
7/01/14 | | | Ending Account Value
12/31/14 | | | Expenses Paid for the 6 Months Ended 12/31/14* | |
| Institutional | | | | | | | | | | | | |
| Actual | | $ | 1,000 | | | $ | 973.80 | | | $ | 1.09 | |
| Hypothetical 5% return | | | 1,000 | | | | 1,024.10 | + | | | 1.12 | |
| Service | | | | | | | | | | | | |
| Actual | | | 1,000 | | | | 972.00 | | | | 2.44 | |
| Hypothetical 5% return | | | 1,000 | | | | 1,022.74 | + | | | 2.50 | |
| Advisor | | | | | | | | | | | | |
| Actual | | | 1,000 | | | | 971.80 | | | | 3.08 | |
| Hypothetical 5% return | | | 1,000 | | | | 1,022.08 | + | | | 3.16 | |
| | * | Expenses are calculated using the Portfolio’s annualized net expense ratio for each class, which represents the ongoing expenses as a percentage of net assets for the six months ended December 31, 2014. Expenses are calculated by multiplying the annualized net expense ratio by the average account value for the period; then multiplying the result by the number of days in the most recent fiscal half year; and then dividing that result by the number of days in the fiscal year. The annualized net expense ratios for the period were 0.22%, 0.49% and 0.62% for Institutional, Service and Advisor Shares, respectively. | |
| | + | Hypothetical expenses are based on the Portfolio’s actual annualized net expense ratios and an assumed rate of return of 5% per year before expenses. | |
24
GOLDMAN SACHS VARIABLE INSURANCE TRUST MULTI-STRATEGY ALTERNATIVES PORTFOLIO
Trustees and Officers (Unaudited)
Independent Trustees
| | | | | | | | | | | | |
| | | | | |
Name,
Address and Age1 | | Position(s) Held
with the Trust | | Term of Office and
Length of
Time Served2 | | Principal Occupation(s) During Past 5 Years | | Number of
Portfolios in
Fund Complex
Overseen by
Trustee3 | | | Other Directorships Held by Trustee4 |
Ashok N. Bakhru Age: 72 | | Chairman of the Board of Trustees | | Since 1996 (Trustee since 1991) | | Mr. Bakhru is retired. He was formerly Director, Apollo Investment Corporation (a business development company) (2008-2013); President, ABN Associates (a management and financial consulting firm) (1994-1996 and 1998-2012); Trustee, Scholarship America (1998-2005); Trustee, Institute for Higher Education Policy (2003-2008); Director, Private Equity Investors — III and IV (1998-2007), and Equity-Linked Investors II (April 2002-2007). Chairman of the Board of Trustees — Goldman Sachs Fund Complex. | | | 128 | | | None |
John P. Coblentz, Jr. Age: 73 | | Trustee | | Since 2003 | | Mr. Coblentz is retired. Formerly, he was Partner, Deloitte & Touche LLP (1975-2003); Director, Emerging Markets Group, Ltd. (2004-2006); and Director, Elderhostel, Inc. (2006-2012). Trustee — Goldman Sachs Fund Complex. | | | 128 | | | None |
Diana M. Daniels Age: 65 | | Trustee | | Since 2007 | | Ms. Daniels is retired. Formerly, she was Vice President, General Counsel and Secretary, The Washington Post Company (1991-2006). Ms. Daniels serves as a Presidential Councillor of Cornell University (2013-Present); Member, Advisory Board, Psychology Without Borders (international humanitarian aid organization) (2007-Present), and former Member of the Legal Advisory Board, New York Stock Exchange (2003-2006) and of the Corporate Advisory Board, Standish Mellon Management Advisors (2006-2007). Trustee — Goldman Sachs Fund Complex. | | | 108 | | | None |
Joseph P. LoRusso Age: 57 | | Trustee | | Since 2010 | | Mr. LoRusso is retired. Formerly, he was President, Fidelity Investments Institutional Services Co. (“FIIS”) (2002-2008); Director, FIIS (2002-2008); Director, Fidelity Investments Institutional Operations Company (2003-2007); Executive Officer, Fidelity Distributors Corporation (2007-2008). Trustee — Goldman Sachs Fund Complex. | | | 108 | | | None |
Herbert J. Markley Age: 64 | | Trustee | | Since 2013 | | Mr. Markley is retired. Formerly, he was Executive Vice President, Deere & Company (an agricultural and construction equipment manufacturer) (2007-2009), and President, Agricultural Division, Deere & Company (2001-2007). Trustee — Goldman Sachs Fund Complex. | | | 108 | | | None |
Jessica Palmer Age: 65 | | Trustee | | Since 2007 | | Ms. Palmer is retired. She is Director, Emerson Center for the Arts and Culture (2011-Present); and was formerly a Consultant, Citigroup Human Resources Department (2007-2008); Managing Director, Citigroup Corporate and Investment Banking (previously, Salomon Smith Barney/Salomon Brothers) (1984-2006). Ms. Palmer was a Member of the Board of Trustees of Indian Mountain School (private elementary and secondary school) (2004-2009). Trustee — Goldman Sachs Fund Complex. | | | 108 | | | None |
Richard P. Strubel Age: 75 | | Trustee | | Since 1987 | | Mr. Strubel is retired. Formerly, he was Director, Cardean Learning Group (provider of educational services via the internet) (2003-2008); and Director, Gildan Activewear Inc. (a clothing marketing and manufacturing company) (2000-2014). He serves as Trustee, Emeritus, The University of Chicago (1987-Present). Trustee — Goldman Sachs Fund Complex. | | | 128 | | | The Northern Trust Mutual Fund Complex (56 Portfolios) (Chairman of the Board of Trustees) |
| | | | | | | | | | | | |
25
GOLDMAN SACHS VARIABLE INSURANCE TRUST MULTI-STRATEGY ALTERNATIVES PORTFOLIO
Trustees and Officers (Unaudited) (continued)
Independent Trustees (continued)
| | | | | | | | | | | | |
| | | | | |
Name,
Address and Age1 | | Position(s) Held
with the Trust | | Term of Office and
Length of
Time Served2 | | Principal Occupation(s) During Past 5 Years | | Number of
Portfolios in
Fund Complex
Overseen by
Trustee3 | | | Other Directorships Held by Trustee4 |
Roy W. Templin Age: 54 | | Trustee | | Since 2013 | | Mr. Templin is retired. He is Chairman of the Board of Directors, Con-Way Incorporated (2012-Present); and was formerly Executive Vice President and Chief Financial Officer, Whirlpool Corporation (an appliance manufacturer and marketer) (2004-2012). Trustee — Goldman Sachs Fund Complex. | | | 108 | | | Con-Way Incorporated (a transportation, supply-chain management and logistics services company) |
| | | | | | | | | | | | |
Interested Trustees*
| | | | | | | | | | | | |
| | | | | |
Name,
Address and Age1 | | Position(s) Held
with the Trust | | Term of Office and
Length of
Time Served2 | | Principal Occupation(s) During Past 5 Years | | Number of
Portfolios in
Fund Complex
Overseen by
Trustee3 | | | Other Directorships Held by Trustee4 |
James A. McNamara Age: 52 | | President and Trustee | | Since 2007 | | Managing Director, Goldman Sachs (December 1998-Present); Director of Institutional Fund Sales, GSAM (April 1998-December 2000); and Senior Vice President and Manager, Dreyfus Institutional Service Corporation (January 1993- April 1998). President — Goldman Sachs Fund Complex (November 2007-Present); Senior Vice President — Goldman Sachs Fund Complex (May 2007-November 2007); and Vice President — Goldman Sachs Fund Complex (2001-2007). Trustee — Goldman Sachs Fund Complex (November 2007-Present and December 2002-May 2004). | | | 127 | | | None |
Alan A. Shuch Age: 65 | | Trustee | | Since 1990 | | Advisory Director — GSAM (May 1999-Present); Consultant to GSAM (December 1994-May 1999); and Limited Partner, Goldman Sachs (December 1994-May 1999). Trustee — Goldman Sachs Fund Complex. | | | 108 | | | None |
| | | | | | | | | | | | |
| * | These persons are considered to be “Interested Trustees” because they hold positions with Goldman Sachs and own securities issued by The Goldman Sachs Group, Inc. Each Interested Trustee holds comparable positions with certain other companies of which Goldman Sachs, GSAM or an affiliate thereof is the investment adviser, administrator and/or distributor. |
| 1 | Each Trustee may be contacted by writing to the Trustee, c/o Goldman Sachs, 200 West Street, New York, New York, 10282, Attn: Caroline Kraus. Information is provided as of December 31, 2014. |
| 2 | Each Trustee holds office for an indefinite term until the earliest of: (a) the election of his or her successor; (b) the date the Trustee resigns or is removed by the Board of Trustees or shareholders, in accordance with the Trust’s Declaration of Trust; (c) December 31st of the year in which the Trustee turns 74 years of age, subject to waiver by a majority of the Trustees (in accordance with the current resolutions of the Board of Trustees, which may be changed by the Trustees without shareholder vote); or (d) the termination of the Trust. By resolution of the Board of Trustees determining that an extension of service would be beneficial to the Trust, the retirement age has been extended with respect to Richard P. Strubel. |
| 3 | The Goldman Sachs Fund Complex consists of the Trust and Goldman Sachs Trust (“GST”). As of December 31, 2014, the Trust consisted of 14 portfolios and GST consisted of 94 portfolios (88 of which offered shares to the public). The Goldman Sachs Fund Complex also includes, with respect to Messrs. Bakhru, Coblentz and Strubel, Goldman Sachs Trust II (“GSTII”), Goldman Sachs BDC, Inc. (“GSBDC”), Goldman Sachs MLP Income Opportunities Fund (“GSMLP”), Goldman Sachs MLP and Energy Renaissance Fund (“GSMER”) and Goldman Sachs ETF Trust (“GSETF”), and with respect to Mr. McNamara, GSTII, GSMLP, GSMER and GSETF. GSTII consisted of 6 portfolios (one of which offered shares to the public). GSBDC, GSMLP and GSMER each consisted of one portfolio. GSETF consisted of 11 portfolios (none of which offered shares to the public). As of December 31, 2014, GSBDC had not offered shares to the public. |
| 4 | This column includes only directorships of companies required to report to the Securities and Exchange Commission under the Securities Exchange Act of 1934 (i.e., “public companies”) or other investment companies registered under the Act. |
Additional information about the Trustees is available in the Portfolio’s Statement of Additional Information, which can be obtained from Goldman Sachs free of charge by calling this toll-free number (in the United States of America): 1-800-292-4726.
26
GOLDMAN SACHS VARIABLE INSURANCE TRUST MULTI-STRATEGY ALTERNATIVES PORTFOLIO
Trustees and Officers (Unaudited) (continued)
Officers of the Trust*
| | | | | | |
| | | |
Name, Address and Age1 | | Position(s) Held With the Trust | | Term of
Office and
Length of
Time Served2 | | Principal Occupation(s) During Past 5 Years |
James A. McNamara
200 West Street New York, NY 10282 Age: 52 | | President and Trustee | | Since 2007 | | Managing Director, Goldman Sachs (December 1998-Present); Director of Institutional Fund Sales, GSAM (April 1998-December 2000); and Senior Vice President and Manager, Dreyfus Institutional Service Corporation (January 1993-April 1998). President — Goldman Sachs Fund Complex (November 2007-Present); Senior Vice President — Goldman Sachs Fund Complex (May 2007-November 2007); and Vice President — Goldman Sachs Fund Complex (2001-2007). Trustee — Goldman Sachs Fund Complex (November 2007-Present and December 2002-May 2004). |
Caroline L. Kraus
200 West Street New York, NY 10282 Age: 37 | | Secretary | | Since 2012 | | Vice President, Goldman Sachs (August 2006-Present); Associate General Counsel, Goldman Sachs (2012-Present); Assistant General Counsel, Goldman Sachs (August 2006-December 2011) and Associate, Weil, Gotshal & Manges, LLP (2002-2006). Secretary — Goldman Sachs Fund Complex (August 2012-Present) and Assistant Secretary — Goldman Sachs Fund Complex (June 2012-August 2012). |
Scott M. McHugh
200 West Street New York, NY 10282 Age: 43 | | Principal Financial
Officer, Senior Vice
President and
Treasurer | | Since 2009
(Principal
Financial
Officer since
2013) | | Vice President, Goldman Sachs (February 2007-Present); Assistant Treasurer of certain mutual funds administered by DWS Scudder (2005-2007); and Director (2005-2007), Vice President (2000-2005) and Assistant Vice President (1998-2000), Deutsche Asset Management or its predecessor (1998-2007). Principal Financial Officer — Goldman Sachs Fund Complex (November 2013-Present); Treasurer — Goldman Sachs Fund Complex (October 2009-Present); Senior Vice President — Goldman Sachs Fund Complex (November 2009-Present); and Assistant Treasurer — Goldman Sachs Fund Complex (May 2007-October 2009). |
| | | | | | |
| * | Represents a partial list of officers of the Trust. Additional information about all the officers is available in the Portfolio’s Statement of Additional Information, which can be obtained from Goldman Sachs free of charge by calling this toll-free number (in the United States): 1-800-292-4726. |
| 1 | Information is provided as of December 31, 2014. |
| 2 | Officers hold office at the pleasure of the Board of Trustees or until their successors are duly elected and qualified. Each officer holds comparable positions with certain other companies of which Goldman Sachs, GSAM or an affiliate thereof is the investment adviser, administrator and/or distributor. |
27
GOLDMAN SACHS VARIABLE INSURANCE TRUST MULTI-STRATEGY ALTERNATIVES PORTFOLIO
Goldman Sachs Variable Insurance Trust — Tax Information (Unaudited)
For the year ended December 31, 2014, 6.64% of the dividends paid from net investment company taxable income by the Multi-Strategy Alternatives Portfolio qualify for the dividends received deduction available to corporations.
28
| | |
| TRUSTEES | | OFFICERS |
| Ashok N. Bakhru, Chairman | | James A. McNamara, President |
| John P. Coblentz, Jr. | | Scott M. McHugh, Principal Financial Officer |
| Diana M. Daniels | | and Treasurer |
| Joseph P. LoRusso | | Caroline L. Kraus, Secretary |
| Herbert J. Markley | | |
| James A. McNamara | | |
| Jessica Palmer | | |
| Alan A. Shuch | | |
| Richard P. Strubel | | |
| Roy W. Templin | | |
GOLDMAN, SACHS & CO.
Distributor and Transfer Agent
GOLDMAN SACHS ASSET MANAGEMENT, L.P.
Investment Adviser
200 West Street, New York
New York 10282
Visit our web site at www.GSAMFUNDS.com to obtain the most recent month-end returns.
The reports concerning the Portfolio included in this shareholder report may contain certain forward-looking statements about the factors that may affect the performance of the Portfolio in the future. These statements are based on Portfolio management’s predictions and expectations concerning certain future events and their expected impact on the Portfolio, such as performance of the economy as a whole and of specific industry sectors, changes in the levels of interest rates, the impact of developing world events, and other factors that may influence the future performance of the Portfolio. Management believes these forward-looking statements to be reasonable, although they are inherently uncertain and difficult to predict. Actual events may cause adjustments in portfolio management strategies from those currently expected to be employed.
A description of the policies and procedures that the Portfolio uses to determine how to vote proxies relating to portfolio securities and information regarding how the Portfolio voted proxies relating to portfolio securities for the 12-month period ended June 30 is available (i) without charge, upon request by calling 1-800-621-2550; and (ii) on the Securities and Exchange Commission (“SEC”) web site at http://www.sec.gov.
The Portfolio files its complete schedule of portfolio holdings with the SEC for the first and third quarters of each fiscal year on Form N-Q. The Portfolio’s Form N-Qs are available on the SEC’s web site at http://www.sec.gov within 60 days after the Portfolio’s first and third fiscal quarters. The Portfolio’s Form N-Qs may be reviewed and copied at the SEC’s Public Reference Room in Washington, D.C. and information on the operation of the Public Reference Room may also be obtained by calling 1-800-SEC-0330. Form N-Qs may be obtained upon request and without charge by calling 1-800-621-2550.
The website links provided are for your convenience only and are not an endorsement or recommendation by GSAM of any of these websites or the products or services offered. GSAM is not responsible for the accuracy and validity of the content of these websites.
Fund holdings and allocations shown are as of December 31, 2014 and may not be representative of future investments. Portfolio holdings should not be relied on in making investment decisions and should not be construed as research or investment advice regarding particular securities. Current and future holdings are subject to risk.
References to indices, benchmarks or other measures of relative market performance over a specified period of time are provided for your information only and do not imply that the portfolio will achieve similar results. The index composition may not reflect the manner in which a portfolio is constructed. While an adviser seeks to design a portfolio which reflects appropriate risk and return features, portfolio characteristics may deviate from those of the benchmark.
The Global Industry Classification Standard (“GICS”) was developed by and is the exclusive property and a service mark of Morgan Stanley Capital International Inc. (“MSCI”) and Standard & Poor’s, a division of The McGraw-Hill Companies, Inc. (“S&P”) and is licensed for use by Goldman Sachs. Neither MSCI, S&P nor any other party involved in making or compiling the GICS or any GICS classifications makes any express or implied warranties or representations with respect to such standard or classification (or the results to be obtained by the use thereof), and all such parties hereby expressly disclaim all warranties of originality, accuracy, completeness, merchantability or fitness for a particular purpose with respect to any of such standard or classification. Without limiting any of the foregoing, in no event shall MSCI, S&P, any of their affiliates or any third party involved in making or compiling the GICS or any GICS classifications have any liability for any direct, indirect, special, punitive, consequential or any other damages (including lost profits) even if notified of the possibility of such damages.
The portfolio risk management process includes an effort to monitor and manage risk, but does not imply low risk.
Diversification does not protect an investor from market risk and does not ensure a profit.
Shares of the Goldman Sachs VIT Funds are offered to separate accounts of participating life insurance companies for the purpose of funding variable annuity contracts and variable life insurance policies. Shares of the Portfolio are not offered directly to the general public. The variable annuity contracts and variable life insurance policies are described in the separate prospectuses issued by participating insurance companies. You should refer to those prospectuses for information about surrender charges, mortality and expense risk fees and other charges that may be assessed by participating insurance companies under the variable annuity contracts or variable life insurance policies. Such fees or charges, if any, may affect the return you may realize with respect to your investments. Ask your representative for more complete information. Please consider a fund’s objectives, risks and charges and expenses, and read the prospectus carefully before investing. The prospectus contains this and other information about the Portfolio.
This material is not authorized for distribution to prospective investors unless preceded or accompanied by a current Prospectus or summary prospectus, if applicable. Investors should consider a Fund’s objective, risks, and charges and expenses, and read the summary prospectus, if available, and/or the Prospectus carefully before investing or sending money. The summary prospectus, if available, and the Prospectus contain this and other information about a Fund and may be obtained from your Authorized Institution or from Goldman, Sachs & Co. by calling 1-800-621-2550.
This report is prepared for the general information of contract owners and is not an offer of shares of the Goldman Sachs Variable Insurance Trust: Goldman Sachs Multi-Strategy Alternatives Portfolio.
© 2015 Goldman Sachs. All rights reserved.
VITMSAAR-15/153901.MF.MED.TMPL/2/2015
Goldman
Sachs Variable Insurance Trust
Goldman Sachs Core Fixed Income Fund
Goldman Sachs Equity Index Fund
Goldman Sachs Growth Opportunities Fund
Goldman Sachs High Quality Floating Rate Fund
Annual Report
December 31, 2014
GOLDMAN SACHS VARIABLE INSURANCE TRUST FUNDS
Principal Investment Strategies and Risks
This is not a complete list of the risks that may affect the Funds. For additional information concerning the risks applicable to the Funds, please see the Funds’ Prospectuses.
Shares of the Goldman Sachs Variable Insurance Trust Funds are offered to separate accounts of participating life insurance companies for the purpose of funding variable annuity contracts and variable life insurance policies. Shares of the Funds are not offered directly to the general public. The variable annuity contracts and variable life insurance policies are described in the separate prospectuses issued by participating insurance companies. You should refer to those prospectuses for information about surrender charges, mortality and expense risk fees and other charges that may be assessed by participating insurance companies under the variable annuity contracts or variable life insurance policies. Such fees or charges, if any, may affect the return you realize with respect to your investments. Ask your representative for more complete information. Please consider a Fund’s objective, risks and charges and expenses, and read the Prospectus carefully before investing. The Prospectus contains this and other information about a Fund.
The Goldman Sachs Core Fixed Income Fund invests primarily in fixed income securities, including U.S. government securities, corporate debt securities, privately issued mortgage-backed securities and asset-backed securities. The Fund’s investments in fixed income securities are subject to the risks associated with debt securities generally, including credit, liquidity and interest rate risk. Any guarantee on U.S. government securities applies only to the underlying securities of the Fund if held to maturity and not to the value of the Fund’s shares. Investments in mortgage-backed securities are also subject to prepayment risk (i.e., the risk that in a declining interest rate environment, issuers may pay principal more quickly than expected, causing the Fund to reinvest proceeds at lower prevailing interest rates). Foreign and emerging markets investments may be more volatile and less liquid than investments in U.S. securities and are subject to the risks of currency fluctuations and adverse economic and political developments. Derivative instruments may involve a high degree of financial risk. These risks include the risk that a small movement in the price of the underlying security or benchmark may result in a disproportionately large movement, unfavorable or favorable, in the price of the derivative instrument; risks of default by a counterparty; and liquidity risk (i.e., the risk that an investment may not be able to be sold without a substantial drop in price, if at all).
The Goldman Sachs Equity Index Fund attempts to replicate the aggregate price and yield performance of a benchmark index (i.e., the Standard & Poor’s 500 Index) that measures the investment returns of large capitalization stocks. The Fund’s equity investments are subject to market risk, which means that the value of the securities in which it invests may go up or down in response to the prospects of individual companies, particular sectors and/or general economic conditions. The Fund is not actively managed, and therefore the Fund will not typically dispose of a security until the security is removed from the index. Performance may vary substantially from the performance of the benchmark it tracks as a result of share purchases and redemptions, transaction costs, expenses and other factors.
The Goldman Sachs Growth Opportunities Fund invests primarily in U.S. equity investments with a primary focus on mid-capitalization companies. The Fund’s equity investments are subject to market risk, which means that the value of the securities in which it invests may go up or down in response to the prospects of individual companies, particular sectors and/or general economic conditions. The securities of mid-capitalization companies involve greater risks than those associated with larger, more established companies and may be subject to more abrupt or erratic price movements. Different investment styles (e.g., “growth”) tend to shift in and out of favor, and at times the Fund may underperform other funds that invest in similar asset classes.
1
GOLDMAN SACHS VARIABLE INSURANCE TRUST FUNDS
The Goldman Sachs High Quality Floating Rate Fund invests primarily in high quality floating rate or variable rate obligations, and the Fund considers “high quality” obligations to be (i) those rated AAA or Aaa by a nationally recognized statistical rating organization at the time of purchase (or, if unrated, determined by the Investment Adviser to be of comparable quality), and (ii) U.S. government securities, including mortgage-backed securities, and repurchase agreements collateralized by U.S. government securities. The Fund’s investments in fixed income securities are subject to the risks associated with debt securities generally, including credit, liquidity and interest rate risk. Any guarantee on U.S. government securities applies only to the underlying securities of the Fund if held to maturity and not to the value of the Fund’s shares. Investments in mortgage-backed securities are also subject to prepayment risk (i.e., the risk that in a declining interest rate environment, issuers may pay principal more quickly than expected, causing the Fund to reinvest proceeds at lower prevailing interest rates). Foreign investments may be more volatile and less liquid than investments in U.S. securities and are subject to the risks of adverse economic or political developments. Derivative instruments may involve a high degree of financial risk. These risks include the risk that a small movement in the price of the underlying security or benchmark may result in a disproportionately large movement, unfavorable or favorable, in the price of the derivative instrument; the risk of default by a counterparty; and liquidity risk. At times, the Fund may be unable to sell certain of its illiquid investments without a substantial drop in price, if at all.
2
MARKET REVIEW
Goldman Sachs Variable Insurance Trust Funds
Market Review
For the year ended December 31, 2014 (the “Reporting Period”), both U.S. equities and fixed income generated positive returns.
Equity Markets
Diverging global economies, strong merger and acquisition activity, weakening oil prices and declining U.S. interest rates were major themes affecting U.S. equities throughout 2014. The U.S. economic recovery accelerated through the Reporting Period, particularly compared to other major developed markets, which helped fuel U.S. corporate earnings growth and strong U.S. equity returns. Furthermore, the decline in unemployment to 5.8% and lower energy prices gave new hope to the potential for a broader consumer recovery. U.S. equity market volatility picked up during the second half of 2014 from exceptionally low levels mid-year, but the S&P 500® Index, representing the U.S. stock market, had no more than three consecutive down days during 2014, a feat not seen since 1928.
For the Reporting Period overall, the S&P 500® Index gained 13.69%, as it posted its third consecutive year of broad double-digit gains. Nine of the ten sectors within the S&P 500® Index were up. Merger and acquisition activity rose to its highest annual level since 2007 largely due to transactions within the information technology and health care sectors, which handily outperformed the broader market. The top-weighted information technology sector was also the largest positive contributor (weight times performance) to S&P 500® Index returns. Given the unexpected decline in U.S. interest rates, real estate investment trusts (“REITs”) and the utilities sector also outperformed the broader market during the Reporting Period. Conversely, the energy sector underperformed most during 2014, as concerns over rising U.S. supply and weakening global demand triggered a collapse in U.S. and global crude oil prices. Telecommunication services also performed poorly during the year as aggressive competition, including price wars aimed at luring customers, and market saturation put growth pressures on the sector, especially on the wireless side.
All segments of the U.S. equity market advanced during the Reporting Period, with large-cap and mid-cap stocks, as measured by the Russell 1000® Index and the Russell Midcap® Index, respectively, gaining most and almost exactly in line with each other. Following at some distance were small-cap stocks, as measured by the Russell 2000® Index. Large-cap stocks were most successful relative to small-caps in the information technology sector. From a style perspective, value-oriented stocks outpaced growth-oriented stocks in the large-cap and mid-cap segments of the U.S. equity market, but growth-oriented stocks outperformed value-oriented stocks in the small-cap segment of the U.S. equity market. (All as measured by the Russell Investments indices.)
Fixed Income Markets
In January 2014, when the Reporting Period began, spread, or non-U.S. Treasury, sectors performed well, as intermediate-term and longer-term yields fell on concerns about growth in the emerging markets and the condition of China’s banking system as well as on unusually cold weather and disappointing economic data in the U.S. As expected, the Federal Reserve (the “Fed”) reduced its quantitative easing asset purchases each month beginning in January 2014 and suggested a more hawkish stance in March 2014, dropping the threshold of 6.5% unemployment as a condition for raising interest rates. In the Eurozone, the European Central Bank (“ECB”) restated its accommodative bias, dwelling less on recent positive economic data and more on potential downside risks to growth and inflation. Russia’s military presence in Ukraine and tensions over Crimea’s possible secession weighed heavily on that region’s markets. Although the global manufacturing Purchasing Managers Index (“PMI”) dipped, it remained in solidly expansionary territory — led by continued strong activity in the U.S. and U.K. — with the notable exception of China, where production contracted by the sharpest degree since November 2011. In March 2014, after Fed Chair Yellen suggested interest rates could start to increase six months after the Fed’s asset purchase program ends, intermediate-term and longer-term yields edged up.
During the second calendar quarter, intermediate-term and longer-term yields resumed their decline, and spread sectors rallied. The U.S. announced first quarter 2014 Gross Domestic Product (“GDP”) growth contracted 2.9%, but second calendar quarter economic data releases, such as auto sales, jobless claims and manufacturing activity, suggested a rebound was underway. This supported the view of some market participants that the first calendar quarter contraction might have been due to inclement winter weather and that economic growth could accelerate in the second quarter of 2014. In the Eurozone, during June 2014, the European Central Bank (“ECB”) cut interest rates by 10 basis points, moving the deposit rate into negative territory for the first time in history. (A
3
MARKET REVIEW
basis point is 1/100th of a percentage point.) The ECB also announced it would be implementing additional liquidity measures targeted at stimulating lending.
After a strong start, spread sectors generally declined during the third calendar quarter, as geopolitical tensions surrounding Russia and the Middle East weighed on risk sentiment. Global economic divergence was also a major theme. U.S. data remained generally strong, suggesting an above-trend pace of growth, leading the Fed to shift up its forecasts for the future path of interest rates. Meanwhile, the ECB implemented further easing measures in the form of rate cuts, targeted long-term refinancing operations and asset purchase programs, as a result of persistently low inflation and weaker economic data.
Spread sector weakness persisted into the fourth quarter of 2014 as falling oil prices heightened market volatility and sparked a flight to quality. At the same time, the theme of economic divergence continued. In the U.S., economic conditions improved, leading the Fed to end its quantitative easing asset purchase program, as planned, in October 2014. Meanwhile, soft economic data in the Eurozone and Japan resulted in further monetary easing by their central banks.
For the Reporting Period overall, sovereign emerging markets debt generated the strongest positive returns within the broad fixed income market. High yield securities also outperformed U.S. Treasuries, followed at some distance by investment grade corporate bonds and commercial mortgage-backed securities. In addition, agency securities, mortgage-backed securities and asset-backed securities outperformed U.S. Treasuries. The U.S. Treasury yield curve, or spectrum of maturities, flattened during the Reporting Period, as intermediate-term and longer-term yields declined and shorter-term maturities edged up. The yield on the bellwether 10-year U.S. Treasury fell approximately 86 basis points during the Reporting Period to 2.17%.
Looking Ahead
Equity Markets
We believe many of the trends that drove equities higher in 2014 — a slowly improving global economy, increased growth spending and rising corporate earnings — may well continue to influence equity returns in 2015. In addition, diverging central bank policies, U.S. dollar strength and a dramatic drop in commodity prices, notably oil, appear to be shaping up as macro themes that may also drive equities in the coming year. We believe that equity returns will once again look attractive when compared to the low expected returns for bonds, cash and commodities.
Indeed, in our view, improving global economic growth, led by the U.S., may be a tailwind for equities and support further earnings growth, which we expect to be the main driver of higher prices. While there is a case for possible multiple expansion, we are not counting on re-rating to drive stocks higher. (Re-rating is when the market changes its view of a company sufficiently to make calculation ratios, such as its price/earnings ratio, substantially higher or lower.) We believe “animal spirits” (or the human emotion that drives consumer confidence) will continue to drive the bull market, supported by healthy merger and acquisition activity and capital expenditure expansion. Companies in the information technology and health care sectors may still benefit from these trends, but stock prices have already risen in these sectors, which may limit upside potential and compel us to look to other areas of the market, such as financials.
U.S. shale oil production has increased to the point where a dip in global demand has sent oil prices sharply lower. While energy stocks were hard hit during 2014, we are beginning to look for opportunities to invest, given what we view as a wide range of individual company prospects. Similarly, we are actively considering which other industries and economies may benefit from lower oil prices and which ones might be negatively impacted.
For much of 2014, there were a number of factors hindering global consumption, despite our bullish long-term view on the consumer. At the end of the Reporting Period, however, we saw lower oil prices as a possible, if not probable, catalyst to spur consumption. A consumer comeback in the U.S. is particularly meaningful to U.S. GDP and could therefore have global implications because of the size of the U.S. economy. Yet, at the end of the Reporting Period, the U.S. stock market appeared to already reflect some of this positive scenario, while European stock markets appeared to reflect dire sentiment on Europe. We believe European corporate earnings could benefit from improving U.S. consumption and therein may lie the investment opportunity. In addition, both the euro and yen depreciated meaningfully against the U.S. dollar in 2014, and we expect these
4
MARKET REVIEW
currencies to remain relatively weak, which should, we believe, benefit exports in both countries and contribute to corporate earnings growth.
As always, we maintain our focus on seeking companies that we believe will generate long-term growth in today’s ever-changing market conditions.
Fixed Income Markets
At the end of the Reporting Period, we expected the evolving theme of global economic divergence to reach a pivotal point in 2015, as markets react to contrasting economic growth and monetary policy drivers. In our view, U.S. economic growth will likely accelerate in 2015, which we believe could, in turn, trigger the first interest rate hike since the financial crisis. We believe robust economic growth and labor market indicators may well persuade the Fed to look through any short-term softness in inflation. A rate hike is likely in June 2015, in our opinion, though it may be delayed until September 2015. In contrast, we believe the central banks of the next-largest economies are likely to remain firmly in easing mode as a result of continued economic weakness. That said, we believe a modest pickup in economic growth is likely in the Eurozone and Japan, despite persistent disinflationary pressures. In China, we believe monetary and fiscal stimulus should keep economic growth close to 7%.
Lower oil prices are, in our view, a tailwind for global economic growth. Many of the largest economies are net importers, and we think the savings they gain should more than offset the negative impact on oil exporters. The drop in oil prices has also pushed down global inflation, though we believe the impact is likely to be temporary.
At the end of the Reporting Period, we believed riskier fixed income asset classes were still supported by low inflation, strong U.S. economic growth, and monetary stimulus outside the U.S. We continue to monitor how the drop in oil prices may affect high yield securities, but at the end of the Reporting Period, we saw some attractive opportunities resulting from the decline in certain asset classes, particularly within currencies and the emerging markets.
5
GOLDMAN SACHS VARIABLE INSURANCE TRUST CORE FIXED INCOME FUND
INVESTMENT OBJECTIVE
The Fund seeks a total return consisting of capital appreciation and income that exceeds the total return of the Barclays U.S. Aggregate Bond Index.
Portfolio Management Discussion and Analysis
Below, the Goldman Sachs Fixed Income Portfolio Management Team discusses the Goldman Sachs Variable Insurance Trust — Goldman Sachs Core Fixed Income Fund’s (the “Fund”) performance and positioning for the one-year period ended December 31, 2014 (the “Reporting Period”).
How did the Fund perform during the Reporting Period?
During the Reporting Period, the Fund’s Institutional and Service Shares generated average annual total returns of 5.68% and 5.61%, respectively. These returns compare to the 5.97% average annual total return of the Fund’s benchmark, the Barclays U.S. Aggregate Bond Index (the “Barclays Index”), during the same time period.
What key factors were responsible for the Fund’s performance during the Reporting Period?
During the Reporting Period, the Fund’s tactical duration and U.S. yield curve positioning detracted from relative performance. Duration is a measure of the Fund’s sensitivity to changes in interest rates. Yield curve indicates a spectrum of maturities.
On the positive side, the Fund benefited from its top-down cross-sector strategy. Our cross-sector strategy is one in which we invest Fund assets across a variety of fixed income sectors, including some that may not be included in the Barclays Index. In addition, our bottom-up individual issue selection within the corporate, securitized and government agency sectors bolstered returns.
Which fixed income market sectors most affected Fund performance during the Reporting Period?
During the Reporting Period, the Fund benefited from its overweight relative to the Barclays Index in corporate bonds, as corporate credit spreads (or the difference in yield between corporate bonds and U.S. Treasury securities of comparable maturity) tightened during the first, second and third quarters of 2014 on supportive credit fundamentals and low levels of volatility. The Fund gave back some of these gains as corporate spreads widened somewhat near the end of 2014. In addition, the Fund benefited during the
Reporting Period from an underweight in longer maturity U.S. corporate bonds. Issue selection within the corporate bond sector, especially issue selection of financial investment grade corporate bonds, added to relative returns.
In terms of its allocation to the securitized sector, the Fund benefited from an overweight in non-agency mortgage-backed securities. Non-agency mortgage-backed securities performed well during the first half of the Reporting Period on the appreciation of home values and improving borrower credit performance. In addition, issue selection among agency mortgage-backed securities and non-agency mortgage-backed securities contributed positively. Within the government agency sector, issue selection of agency and government debt enhanced relative returns. Among currencies, the Fund benefited from underweight positions in the Australian dollar, Swedish krona and Swiss franc.
Detracting was the Fund’s underweight exposure to agency mortgage-backed securities, as mortgage spreads tightened amid favorable market technicals. Holdings of Treasury Inflation Protected Securities (“TIPS”) also detracted, as inflation remained muted during the Reporting Period. In addition, issue selection of Russian and Turkish emerging markets debt dampened performance, as Eastern Europe and the Middle East struggled with geopolitical tensions during the Reporting Period.
Did the Fund’s duration and yield curve positioning strategy help or hurt its results during the Reporting Period?
Tactical management of the Fund’s duration and yield curve positioning detracted from relative returns during the Reporting Period. The Fund held a short duration position relative to the Barclays Index, which hurt performance as interest rates declined during the Reporting Period.
How did the Fund use derivatives and similar instruments during the Reporting Period?
As market conditions warranted during the Reporting Period, currency transactions were carried out using primarily over-the-counter (“OTC”) forward foreign exchange contracts as well as purchased OTC options. Currency transactions were used as we sought both to enhance returns and to hedge the Fund’s portfolio against currency exchange rate fluctuations. Treasury futures were
6
GOLDMAN SACHS VARIABLE INSURANCE TRUST CORE FIXED INCOME FUND
employed as warranted to facilitate specific duration, yield curve and country strategies. Swaptions (or options on interest rate swap contracts) were employed to express an outright term structure view and manage volatility (term structure, most often depicted as a yield curve, refers to the term structure of interest rates, which is the relationship between the yield to maturity and the time to maturity for pure discount bonds). Credit default swaps were utilized to manage exposure to fluctuations in credit spreads (or the differential in yields between Treasury securities and non-Treasury securities that are identical in all respects except for quality rating). Interest rate swaps were utilized to manage exposure to fluctuations in interest rates. Overall, we employ derivatives and similar instruments for the efficient management of the Fund’s portfolio. Derivatives and similar instruments allow us to manage interest rate, credit and currency risks more effectively by allowing us both to hedge and to apply active investment views with greater versatility and to afford greater risk management precision than we would otherwise be able to implement.
Were there any notable changes in the Fund’s weightings during the Reporting Period?
During the Reporting Period, we maintained the Fund’s short duration position relative to the Barclays Index because we expected interest rates to rise as the Fed reduced monetary policy support and as U.S. economic growth improved. In the latter part of the Reporting Period, we increased the Fund’s overweight compared to the Barclays Index in corporate credit, with a bias toward lower-rated securities, amid favorable valuations and fundamentals. We maintained the Fund’s exposure to agency multi-family mortgage-backed securities and its underweight in mortgage pass-through securities. (Pass-through mortgages consist of a pool of residential mortgage loans, where homeowners’ monthly payments of principal, interest and prepayments pass from the original bank through a government agency or investment bank to investors.) Given strong fundamentals in the U.S. housing market and the positive outlook for the U.S. economy, we maintained the Fund’s overweight in non-agency mortgage-backed securities throughout the Reporting Period. In the first half of the Reporting Period, we added a small overweight in emerging markets debt because we believed global market volatility and lower oil prices had created attractive opportunities. We shifted the Fund to a neutral position in emerging markets debt in the second half of the Reporting Period. During the Reporting Period, we eliminated the Fund’s position in municipal bonds, which are not represented in the Barclays Index.
Were there any changes to the Fund’s portfolio management team during the Reporting Period?
There were no changes to the Fund’s portfolio management team during the Reporting Period.
How was the Fund positioned relative to the Barclays Index at the end of the Reporting Period?
At the end of the Reporting Period, the Fund was underweight U.S. government securities and overweight quasi-government bonds relative to the Barclays Index on a market-value weighted basis. It was overweight agency mortgage-backed securities, within which it held a small overweight in agency multi-family securities. In addition, the Fund was overweight investment grade corporate bonds, non-agency mortgage-backed securities, agency commercial mortgage obligations, commercial mortgage-backed securities, asset-backed securities and covered bonds at the end of the Reporting Period. (Covered bonds are securities created from either mortgage loans or public sector loans.) The Fund was also underweight mortgage pass-through securities and was relatively neutral in emerging markets debt. The Fund had no exposure to high yield bonds and municipal bonds, neither of which are represented in the Barclays Index, at the end of the Reporting Period.
7
FUND BASICS
Core Fixed Income Fund
as of December 31, 2014
STANDARDIZED TOTAL RETURNS1
| | | | | | | | | | | | | | |
| For the period ended 12/31/14 | | One Year | | | Five Years | | | Since Inception | | | Inception Date |
| Institutional | | | 5.68 | % | | | N/A | | | | 2.03 | % | | 4/30/13 |
| Service | | | 5.61 | | | | 4.97 | % | | | 4.50 | | | 1/09/06 |
| 1 | The Standardized Total Returns are average annual total returns as of the most recent calendar quarter-end. They assume reinvestment of all distributions at net asset value (“NAV”). Because Institutional and Service Shares do not involve a sales charge, such a charge is not applied to their Standardized Total Returns. |
Total return figures in the above chart represent past performance and do not indicate future results, which will vary. The investment return and principal value of an investment will fluctuate and, therefore, an investor’s shares, when redeemed, may be worth more or less than their original cost. Current performance may be lower or higher than the total return figures in the above chart. Please visit www.GSAMFUNDS.com to obtain the most recent month-end returns. Performance reflects fee waivers and/or expense limitations in effect during the periods shown. In their absence, performance would be reduced.
EXPENSE RATIOS2
| | | | | | | | |
| | | Net Expense Ratio (Current) | | | Gross Expense Ratio (Before Waivers) | |
| Institutional | | | 0.43 | % | | | 0.65 | % |
| Service | | | 0.68 | | | | 0.90 | |
| 2 | The expense ratios of the Fund, both current (net of any fee waivers or expense limitations) and before waivers (gross of any fee waivers or expense limitations) are as set forth above. Pursuant to a contractual arrangement, the Fund’s waivers and/or expense limitations will remain in place through at least April 30, 2015 and prior to such date the Investment Adviser may not terminate the arrangements without the approval of the Fund’s Board of Trustees. If these arrangements are discontinued in the future, the expense ratios may change without shareholder approval. |
8
FUND BASICS
FUND COMPOSITION3
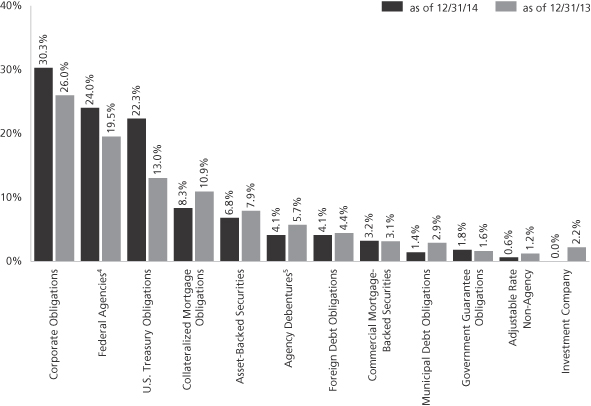
| 3 | The percentage shown for each investment category reflects the value of investments in that category as a percentage of net assets. Figures in the graph may not sum to 100% due to the exclusion of other assets and liabilities. The graph depicts the Fund’s investments but may not represent the Fund’s market exposure due to the exclusion of certain derivatives, if any, as listed in the Additional Investment Information section of the Schedule of Investments. |
| 4 | “Federal Agencies” are mortgage-backed securities guaranteed by the Government National Mortgage Association (“GNMA”), the Federal National Mortgage Association (“FNMA”) and the Federal Home Loan Mortgage Corp. (“FHLMC”). GNMA instruments are backed by the full faith and credit of the United States Government. |
| 5 | “Agency Debentures” include agency securities offered by companies such as FNMA and FHLMC, which operate under a government charter. While they are required to report to a government regulator, their assets are not explicitly guaranteed by the government and they otherwise operate like any other publicly traded company. |
9
GOLDMAN SACHS VARIABLE INSURANCE TRUST CORE FIXED INCOME FUND
Performance Summary
December 31, 2014
The following graph shows the value, as of December 31, 2014, of a $10,000 investment made on January 9, 2006 (commencement of operations) in the Service Class Shares. For comparative purposes, the performance of the Fund’s benchmark, the Barclays U.S. Aggregate Bond Index, is shown. This performance data represents past performance and should not be considered indicative of future performance, which will fluctuate with changes in market conditions. These performance fluctuations will cause an investor’s shares, when redeemed, to be worth more or less than their original cost. Performance reflects Fund level expenses, but does not reflect fees and expenses associated with any variable annuity contract or variable life insurance policy that uses the Fund as an investment option for any contract or policy. Had performance reflected all of those fees and expenses, performance would have been reduced. Performance reflects applicable fee waivers and/or expense limitations in effect during the periods shown, and in their absence, performance would be reduced. Performance of Institutional Shares will vary from Service Shares due to differences in class specific fees. In addition to the Investment Adviser’s decisions regarding issuer/industry/country investment selection and allocation, other factors may affect Fund performance. These factors include, but are not limited to, Fund operating fees and expenses, portfolio turnover, and subscription and redemption cash flows affecting the Fund.
Core Fixed Income Fund’s Lifetime Performance
Performance of a $10,000 investment, with distributions reinvested, from January 9, 2006 through December 31, 2014.
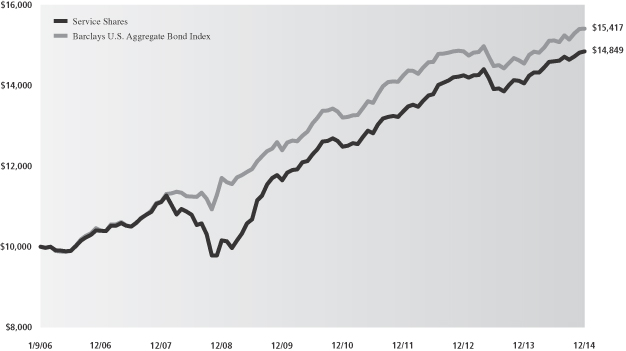
| | | | | | |
| Average Annual Total Return through December 31, 2014 | | One Year | | Five Years | | Since Inception |
Institutional (Commenced April 30, 2013) | | 5.68% | | N/A | | 2.03% |
Service (Commenced January 9, 2006) | | 5.61% | | 4.97% | | 4.50% |
10
GOLDMAN SACHS VARIABLE INSURANCE TRUST EQUITY INDEX FUND
INVESTMENT OBJECTIVE
The Fund seeks to achieve investment results that correspond to the aggregate price and yield performance of a benchmark index that measures the investment returns of large capitalization stocks.
Portfolio Management Discussion and Analysis
Below, SSgA Funds Management, Inc. (“SSgA”), the Fund’s Subadvisor, discusses the Goldman Sachs Variable Insurance Trust — Goldman Sachs Equity Index Fund’s (the “Fund”) performance and positioning for the one-year period ended December 31, 2014 (the “Reporting Period”).
How did the Fund perform during the Reporting Period?
During the Reporting Period, the Fund’s Service Shares generated an average annual total return of 13.22%. This return compares to the 13.69% average annual total return of the Fund’s benchmark, the Standard & Poor’s 500® Index (with dividends reinvested) (the “S&P 500® Index”), during the same time period.
During the Reporting Period, which sectors and which industries in the S&P 500® Index were the strongest contributors to the Fund’s performance?
Nine of the 10 sectors in the S&P 500® Index advanced during the Reporting Period. In terms of total return, the sectors that made the strongest positive contributions to the S&P 500® Index and to the Fund were utilities, health care and information technology. The largest sector by weighting in the S&P 500® Index at the end of the Reporting Period was information technology at a weighting of 19.66%. The industries with the strongest performance in terms of total return were airlines; technology hardware storage and peripherals; semiconductors and equipment; biotechnology; and road and rail.
On the basis of impact (which takes both total returns and weightings into account), the sectors that made the strongest positive contributions to the S&P 500® Index and to the Fund were information technology, health care and financials. The industries with the strongest performance on the basis of impact were technology hardware storage and peripherals; pharmaceuticals; biotechnology; software; and banks.
Which sectors and industries in the S&P 500® Index were the weakest contributors to the Fund’s performance?
In terms of total return, during the Reporting Period, the weakest performing sectors were energy, telecommunication services and materials. The weakest performing industries in terms of total return were leisure products; construction and engineering; energy equipment and services; metals and mining; and Internet and catalog retail.
On the basis of impact, the weakest performing sectors were energy, telecommunication services and materials. The weakest performing industries on the basis of impact were oil, gas and consumable fuels; Internet and catalog retail; energy equipment and supplies; metals and mining; and electrical equipment.
Which individual stocks were the top performers, and which were the greatest detractors?
On the basis of impact, the stocks that made the strongest positive contribution were Apple, Microsoft, Berkshire Hathaway, Intel and Wells Fargo. The weakest performers were Amazon, Exxon Mobil, IBM, General Electric and Chevron.
How did the Fund use derivatives and similar instruments during the Reporting Period?
During the Reporting Period, we did not use derivatives as part of an active management strategy to add value to the Fund’s results. However, we used equity index futures to equitize the Fund’s cash holdings. In other words, we put the Fund’s cash holdings to work by using them as collateral for the purchase of equity index futures. We also used these equity index futures to provide liquidity for daily cash flow requirements.
Were there any changes to the Fund’s portfolio management team during the Reporting Period?
By design, all investment decisions for the Fund are performed within a co-lead or team structure. During the Reporting Period, Melissa Kapitulik took over the portfolio management responsibilities for the Fund from Kristin Carcio, who has assumed a new role within SSgA. In addition, Michael Feehily has been added as one of the Fund’s lead portfolio managers.
11
GOLDMAN SACHS VARIABLE INSURANCE TRUST EQUITY INDEX FUND
What changes were made to the makeup of the S&P 500® Index during the Reporting Period?
Twelve stocks were removed from the S&P 500® Index during the Reporting Period. They were Cliffs Natural Resources, SLM, Beam, LSI, International Game Technology, Forest Laboratories, United States Steel, Rowan Companies, Peabody Energy, Graham Holdings, Jabil Circuit and Bemis.
There were 14 additions to the S&P 500® Index during the Reporting Period. They were Essex Property Trust, Google, Under Armour, Navient, Avago Technologies, Cimarex Energy, Affiliated Managers Group, Martin Marietta Materials, Discovery Communications, Mallinckrodt, United Health Services, United Rentals, Level 3 Communications and Royal Caribbean Cruises.
The source of the data included in the above Portfolio Management Discussion and Analysis with respect to Goldman Sachs Equity Index Fund is FactSet as of 12/31/14
Characteristics presented are calculated using the month end market value of holdings, except for beta and standard deviation, if shown, which use month end return values. Averages reflect the market weight of securities in the portfolio. Market data, prices, and dividend estimates for characteristics calculations provided by FactSet Research Systems, Inc. All other portfolio data provided by SSgA. Characteristics are as of the date indicated, are subject to change, and should not be relied upon as current thereafter.
Past performance is not a guarantee of future results, which may vary.
Index returns are unmanaged and do not reflect the deduction of any fees or expenses. Index returns reflect all items of income, gain and loss and the reinvestment of dividends and other income.
SSgA may have or may seek investment management or other business relationships with companies discussed in this material or affiliates of those companies, such as their officers, directors and pension plans.
The views expressed in the above Portfolio Management Discussion and Analysis with respect to Goldman Sachs Equity Index Fund are the views of SSgA’s Global Equity Beta Solutions Team through the period ended December 31, 2014 and are subject to change based on market and other conditions. The information provided does not constitute investment advice and it should not be relied on as such. All material has been obtained from sources believed to be reliable, but its accuracy is not guaranteed. This material contains certain statements that may be deemed forward-looking statements. Please note that any such statements are not guarantees of any future performance and actual results or developments may differ materially from those projected.
12
FUND BASICS
Equity Index Fund
as of December 31, 2014
STANDARDIZED TOTAL RETURNS1
| | | | | | | | | | | | | | |
| For the period ended 12/31/14 | | One Year | | | Five Years | | | Since Inception | | | Inception Date |
| Service | | | 13.22 | % | | | 15.05 | % | | | 7.32 | % | | 1/09/06 |
| 1 | The Standardized Total Returns are average annual total returns as of the most recent calendar quarter-end. They assume reinvestment of all distributions at net asset value (“NAV”). Because Service Shares do not involve a sales charge, such a charge is not applied to their Standardized Total Returns. |
Total return figures in the above chart represent past performance and do not indicate future results, which will vary. The investment return and principal value of an investment will fluctuate and, therefore, an investor’s shares, when redeemed, may be worth more or less than their original cost. Current performance may be lower or higher than the total return figures in the above chart. Please visit www.GSAMFUNDS.com to obtain the most recent month-end returns. Performance reflects fee waivers and/or expense limitations in effect during the periods shown. In their absence, performance would be reduced.
EXPENSE RATIOS2
| | | | | | | | |
| | | Net Expense Ratio (Current) | | | Gross Expense Ratio (Before Waivers) | |
| Service | | | 0.49 | % | | | 0.74 | % |
| 2 | The expense ratios of the Fund, both current (net of any fee waivers or expense limitations) and before waivers (gross of any fee waivers or expense limitations) are as set forth above. Pursuant to a contractual arrangement, the Fund’s waivers and/or expense limitations will remain in place through at least April 30, 2015 and prior to such date the Investment Adviser may not terminate the arrangements without the approval of the Fund’s Board of Trustees. If these arrangements are discontinued in the future, the expense ratios may change without shareholder approval. |
TOP TEN HOLDINGS AS OF 12/31/143
| | | | | | |
| Holding | | % of Net Assets | | | Line of Business |
| Apple, Inc. | | | 3.5% | | | Technology Hardware & Equipment |
| Exxon Mobil Corp. | | | 2.1 | | | Energy |
| Microsoft Corp. | | | 2.1 | | | Software & Services |
| Johnson & Johnson | | | 1.6 | | | Pharmaceuticals, Biotechnology & Life Sciences |
| Berkshire Hathaway, Inc. Class B | | | 1.5 | | | Diversified Financials |
| Wells Fargo & Co. | | | 1.4 | | | Banks |
| General Electric Co. | | | 1.4 | | | Capital Goods |
| The Procter & Gamble Co. | | | 1.3 | | | Household & Personal Products |
| JPMorgan Chase & Co. | | | 1.3 | | | Banks |
| Chevron Corp. | | | 1.2 | | | Energy |
| 3 | The top 10 holdings may not be representative of the Fund’s future investments. |
13
FUND BASICS
FUND VS. BENCHMARK SECTOR ALLOCATIONS4
As of December 31, 2014
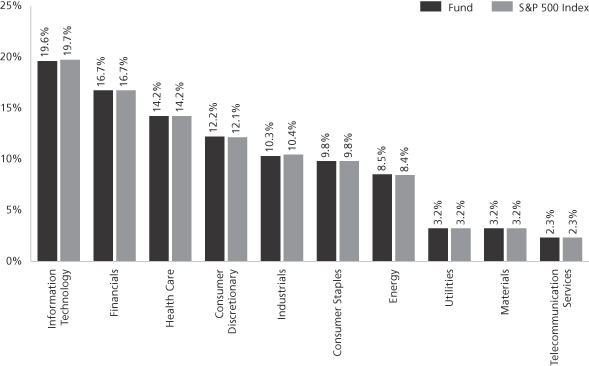
| 4 | The Fund is actively managed and, as such, its composition may differ over time. Consequently, the Fund’s overall sector allocations may differ from percentages contained in the graph above. The graph categorizes investments using Global Industry Classification Standard (“GICS”), however, the sector classifications used by the portfolio management team may differ from GICS. The percentage shown for each investment category reflects the value of investments in that category as a percentage of market value. The graph depicts the Fund’s investments but may not represent the Fund’s market exposure due to the exclusion of certain derivatives, if any, as listed in the Additional Investment Information section of the Schedule of Investments. |
14
GOLDMAN SACHS VARIABLE INSURANCE TRUST EQUITY INDEX FUND
Performance Summary
December 31, 2014
The following graph shows the value, as of December 31, 2014, of a $10,000 investment made in the Fund on January 9, 2006 (commencement of operations). For comparative purposes, the performance of the Fund’s benchmark, the S&P 500 Index (with distributions reinvested), is shown. This performance data represents past performance and should not be considered indicative of future performance, which will fluctuate with changes in market conditions. These performance fluctuations will cause an investor’s shares, when redeemed, to be worth more or less than their original cost. Performance reflects Fund level expenses, but does not reflect fees and expenses associated with any variable annuity contract or variable life insurance policy that uses the Fund as an investment option for any contract or policy. Had performance reflected all of those fees and expenses, performance would have been reduced. Performance reflects applicable fee waivers and/or expense limitations in effect during the periods shown, and in their absence, performance would be reduced. In addition to the Investment Adviser’s decisions regarding issuer/industry investment selection and allocation, other factors may affect Fund performance. These factors include, but are not limited to, Fund operating fees and expenses, portfolio turnover, and subscription and redemption cash flows affecting the Fund.
Equity Index Fund’s Lifetime Performance
Performance of a $10,000 investment, with distributions reinvested, from January 9, 2006 through December 31, 2014.
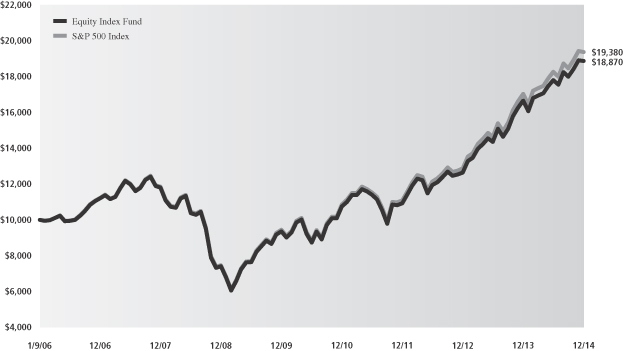
| | | | | | |
| Average Annual Total Return through December 31, 2014 | | One Year | | Five Years | | Since Inception |
Equity Index Fund (Commenced January 9, 2006) | | 13.22% | | 15.05% | | 7.32% |
15
GOLDMAN SACHS VARIABLE INSURANCE TRUST GROWTH OPPORTUNITIES FUND
INVESTMENT OBJECTIVE
The Fund seeks long-term growth of capital.
Portfolio Management Discussion and Analysis
Below, the Goldman Sachs Growth Investment Team discusses the Goldman Sachs Variable Insurance Trust — Goldman Sachs Growth Opportunities Fund’s (the “Fund”) performance and positioning for the one-year period ended December 31, 2014 (the “Reporting Period”).
How did the Fund perform during the Reporting Period?
During the Reporting Period, the Fund’s Institutional and Service Shares generated average annual total returns of 11.32% and 11.10%, respectively. These returns compare to the 11.90% average annual total return of the Fund’s benchmark, the Russell Midcap® Growth Index (with dividends reinvested) (the “Russell Index”), during the same time period.
What key factors were responsible for the Fund’s performance during the Reporting Period?
While the Fund posted solid double-digit absolute gains, it modestly underperformed the Russell Index largely because of stock selection.
Which equity market sectors contributed to Fund performance?
Our bottom-up approach focuses on security selection, and as a result, we do not make active sector-level investment decisions. That said, on a sector level, stock selection in the energy, industrials and consumer discretionary sectors detracted from the Fund’s relative returns. Investments in the information technology, telecommunication services and consumer staples sectors contributed positively to Fund performance.
Which individual stocks detracted from the Fund’s performance during the Reporting Period?
Detracting most from the Fund’s relative returns were positions in Weatherford, a multinational oilfield services company; Dril-Quip, an offshore drilling and production equipment manufacturer; and Kennametal, a supplier of metal cutting tools and industrial materials used in manufacturing processes.
The largest detractor from the Fund’s relative returns during the Reporting Period was Weatherford International, which declined sharply in connection with the sell-off in oil prices. We believe the company has a solid core business and is well positioned to increase its market share for the foreseeable future. In our view, Weatherford International is well positioned to drive improved profitability and free cash flow generation through its restructuring process. At the end of the Reporting Period, we believed its shares were attractively valued and that its stock multiple would re-rate as the company begins to execute on its turnaround initiatives. (Re-rating is when the market changes its view of a company sufficiently to make calculation ratios, such as its price/earnings ratio, substantially higher or lower.)
Another notable detractor from relative performance was Dril-Quip. Its shares fell on concerns about lower oil prices and how the decline might hurt the company’s profitability. In our view, the markets are undervaluing Dril-Quip’s strong fundamentals and its ability to generate meaningful cash flow. The company’s third quarter 2014 earnings were well above consensus estimates, which we believe supports our view. At the end of the Reporting Period, we continued to believe Dril-Quip has a profitable core business with strong market share that is sustainable over the long-term.
Kennametal also detracted from the Fund’s relative results. The company reported quarterly earnings below consensus estimates throughout the Reporting Period. Kennametal’s stock price was also hurt by macroeconomic headwinds and management changes, which weighed on the company’s growth outlook. At the end of the Reporting Period, we continued to have a favorable outlook on Kennametal’s long-term growth prospects, as we believe it is a high quality franchise with dominant market share in an industry with pricing power and high barriers to entry. The company also has a history of making strategic acquisitions that have been accretive to earnings growth, and we believe this trend may continue.
Which individual stocks added to the Fund’s relative performance during the Reporting Period?
The Fund benefited most relative to the Russell Index from its positions in Keurig Green Mountain, a leader in specialty coffee and coffeemakers; Tim Horton, a Canadian multinational fast casual restaurant; and CareFusion, a medical technology company.
16
GOLDMAN SACHS VARIABLE INSURANCE TRUST GROWTH OPPORTUNITIES FUND
Keurig Green Mountain was the top contributor to the Fund’s relative performance during the Reporting Period. Its shares rose following the announcement that Coca-Cola purchased a 10% stake in the company and entered into a 10-year agreement to develop Coke brand products for the Keurig Cold beverage system. The company also benefited from exposure to the Starbucks, Dunkin, Folgers and Costco brands. Further, shareholders approved the company’s official name change to Keurig Green Mountain from Green Mountain Coffee Roasters, recognizing the value that Keurig has brought to the overall franchise and creating a powerful corporate identity. Overall, we believe Keurig Green Mountain remains well-positioned with a solid long term growth profile, competitive margins, improving returns on invested capital and a strategically focused management team.
A position in Tim Horton also added to relative results during the Reporting Period. Its shares surged on the announcement that Burger King intended to acquire the company at a 30% premium. Although the merger surprised us, we believe it makes strategic sense and validates our investment thesis that Tim Horton is an attractive growth story and an undervalued company.
CareFusion was another top contributor to relative performance during the Reporting Period. The stock climbed on news that Becton Dickinson planned to acquire CareFusion at more than a 25% premium to its closing price on the day before the announcement. In our view, the merger makes strategic sense and validates our investment thesis that CareFusion is an attractive growth story and an undervalued company. After the acquisition announcement and the positive reaction of investors, we took advantage of share price appreciation to exit the Fund’s position in the stock.
Did the Fund make any significant purchases or sales during the Reporting Period?
Among the purchases initiated during the Reporting Period, we established a Fund position in Kansas City Southern, a transportation holding company with domestic and international rail operations in North America. We believe the company is a high quality growth business with a favorable market structure, high barriers to entry and strong underlying fundamentals. We are positive on Kansas City Southern’s long-term growth trajectory and believe it is further reinforced by the significant track and locomotive investments the company has made over the past 15 years. Furthermore, Kansas City Southern has significant exposure to cross-border trade with Mexico, which has been growing volumes rapidly. The company also has the potential for significant margin improvement as it improves efficiency. In our view, Kansas City Southern is a compelling growth company, which was trading, at the time of purchase, at an attractive valuation.
We established a Fund position in Pioneer Natural Resources during the Reporting Period. In our view, shares of the independent oil and gas company weakened on a negative outlook for the energy sector. That said, we do not expect lower oil prices to hurt Pioneer Natural Resource’s cash flow growth permanently. We also believe the fundamentals of the business are strong and are further supported by the company’s strong management team and recent infrastructure investments. During the Reporting Period, we took advantage of the sell-off in the stock to buy what we consider to be a high quality franchise with significant growth potential at an attractive valuation.
During the Reporting Period, we exited the Fund’s position in C.R. Bard, a medical device company that manufactures products for vascular, urology, oncology and surgical specialties. Although we continue to have a favorable long-term view of the company, its stock performed well toward the end of the Reporting Period, and we believed the company was fairly valued by the market. We therefore decided to sell the position and add to higher conviction names that we believe offer more attractive risk/reward opportunities.
We also eliminated the Fund’s position in Xilinx, a leading programmable logic devices company on share price appreciation. During the Reporting Period, the company’s shares were volatile, as China’s wireless network build-out moved more slowly than expected and wireline capital spending was impacted by regulatory uncertainty. Near the end of the Reporting Period, the stock rallied strongly from its lows, and we used the opportunity to exit the Fund’s position in favor of another semiconductor name that we considered to have more upside potential.
Were there any notable changes in the Fund’s weightings during the Reporting Period?
During the Reporting Period, we reduced the Fund’s overweighted positions relative to the Russell Index in the telecommunication services, financials and health care sectors. We increased its overweighted position in the consumer staples sector, and we increased its underweighted position in the information technology sector. Compared to the Russell Index, we reduced the Fund’s underweighted position in industrials but maintained an underweight in the sector. We shifted the Fund from underweights in the consumer discretionary, materials and utilities sectors to neutral positions relative to the Russell Index during the Reporting Period.
How did the Fund use derivatives and similar instruments during the Reporting Period?
The Fund did not use derivatives or similar instruments within its investment process during the Reporting Period.
17
GOLDMAN SACHS VARIABLE INSURANCE TRUST GROWTH OPPORTUNITIES FUND
Were there any changes to the Fund’s portfolio management team during the Reporting Period?
During the Reporting Period, Jeffrey Rabinowitz, a co-lead portfolio manager, left the firm. By design, all investment decisions for the Fund are performed within a co-lead or team structure, with multiple subject matter experts. This strategic decision making has been the cornerstone of our approach and ensures continuity in the Fund. During the Reporting Period, Ashley Woodruff became a co-lead portfolio manager for the Fund, alongside Steve Barry and Craig Glassner.
How was the Fund positioned relative to the Russell Index at the end of the Reporting Period?
As mentioned, the Fund’s sector positioning relative to the Russell Index is the result of our stock selection, as we take a pure bottom-up, research-intensive approach to investing. From that perspective, then, at the end of the Reporting Period, the Fund’s portfolio was broadly diversified with overweighted positions compared to the Russell Index in the telecommunication services, consumer staples, financials and health care sectors. The Fund had smaller weightings than the Russell Index in the information technology, industrials and energy sectors at the end of the Reporting Period. It was relatively neutral compared to the Russell Index at the end of the Reporting Period in the consumer discretionary, materials and utilities sectors.
18
FUND BASICS
Growth Opportunities Fund
as of December 31, 2014
STANDARDIZED TOTAL RETURNS1
| | | | | | | | | | | | | | |
| For the period ended 12/31/14 | | One Year | | | Five Years | | | Since Inception | | | Inception Date |
| Institutional | | | 11.32 | % | | | N/A | | | | 18.72 | % | | 4/30/13 |
| Service | | | 11.10 | | | | 14.98 | % | | | 9.75 | | | 1/09/06 |
| 1 | The Standardized Total Returns are average annual total returns as of the most recent calendar quarter-end. They assume reinvestment of all distributions at net asset value (“NAV”). Because Institutional and Service Shares do not involve a sales charge, such a charge is not applied to their Standardized Total Returns. |
Total return figures in the above chart represent past performance and do not indicate future results, which will vary. The investment return and principal value of an investment will fluctuate and, therefore, an investor’s shares, when redeemed, may be worth more or less than their original cost. Current performance may be lower or higher than the total return figures in the above chart. Please visit www.GSAMFUNDS.com to obtain the most recent month-end returns. Performance reflects fee waivers and/or expense limitations in effect during the periods shown. In their absence, performance would be reduced.
EXPENSE RATIOS2
| | | | | | | | |
| | | Net Expense Ratio (Current) | | | Gross Expense Ratio (Before Waivers) | |
| Institutional | | | 1.00 | % | | | 1.14 | % |
| Service | | | 1.16 | | | | 1.39 | |
| 2 | The expense ratios of the Fund, both current (net of any fee waivers or expense limitations) and before waivers (gross of any fee waivers or expense limitations) are as set forth above. Pursuant to a contractual arrangement, the Fund’s waivers and/or expense limitations will remain in place through at least April 30, 2015 and prior to such date the Investment Adviser may not terminate the arrangements without the approval of the Fund’s Board of Trustees. If these arrangements are discontinued in the future, the expense ratios may change without shareholder approval. |
TOP TEN HOLDINGS AS OF 12/31/143
| | | | | | |
| Holding | | % of Net Assets | | | Line of Business |
| W.W. Grainger, Inc. | | | 2.5% | | | Capital Goods |
| Intercontinental Exchange, Inc. | | | 2.5 | | | Diversified Financials |
| Mylan, Inc. | | | 2.5 | | | Pharmaceuticals, Biotechnology & Life Sciences |
| Whole Foods Market, Inc. | | | 2.4 | | | Food & Staples Retailing |
| CBRE Group, Inc. Class A | | | 2.2 | | | Real Estate |
| Equinix, Inc. | | | 2.1 | | | Software & Services |
| Kate Spade & Co. | | | 2.1 | | | Consumer Durables & Apparel |
| First Republic Bank | | | 2.0 | | | Banks |
| PVH Corp. | | | 2.0 | | | Consumer Durables & Apparel |
| SBA Communications Corp. Class A | | | 2.0 | | | Telecommunication Services |
| 3 | The top 10 holdings may not be representative of the Fund’s future investments. |
19
FUND BASICS
FUND vs. BENCHMARK SECTOR ALLOCATIONS4
As of December 31, 2014
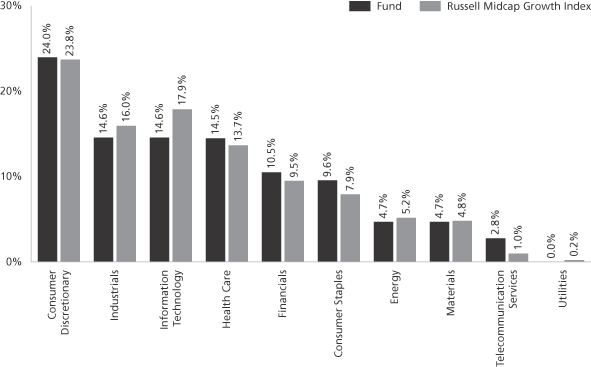
| 4 | The Fund is actively managed and, as such, its composition may differ over time. Consequently, the Fund’s overall sector allocations may differ from percentages contained in the graph above. The graph categorizes investments using Global Industry Classification Standard (“GICS”), however, the sector classifications used by the portfolio management team may differ from GICS. The percentage shown for each investment category reflects the value of investments in that category as a percentage of market value. The graph depicts the Fund’s investments but may not represent the Fund’s market exposure due to the exclusion of certain derivatives, if any, as listed in the Additional Investment Information section of the Schedule of Investments. |
20
GOLDMAN SACHS VARIABLE INSURANCE TRUST GROWTH OPPORTUNITIES FUND
Performance Summary
December 31, 2014
The following graph shows the value, as of December 31, 2014, of a $10,000 investment made on January 9, 2006 (commencement of operations) in the Service Class Shares. For comparative purposes, the performance of the Fund’s benchmark, the Russell Midcap Growth Index (with distributions reinvested), is shown. This performance data represents past performance and should not be considered indicative of future performance which will fluctuate with changes in market conditions. These performance fluctuations will cause an investor’s shares, when redeemed, to be worth more or less than their original cost. Performance reflects Fund level expenses, but does not reflect fees and expenses associated with any variable annuity contract or variable life insurance policy that uses the Fund as an investment option for any contract or policy. Had performance reflected all of those fees and expenses, performance would have been reduced. Performance reflects applicable fee waivers and/or expense limitations in effect during the periods shown, and in their absence, performance would be reduced. Performance of Institutional Shares will vary from Service Shares due to differences in class specific fees. In addition to the Investment Adviser’s decisions regarding issuer/industry investment selection and allocation, other factors may affect Fund performance. These factors include, but are not limited to, Fund operating fees and expenses, portfolio turnover, and subscription and redemption cash flows affecting the Fund.
Growth Opportunities Fund’s Lifetime Performance
Performance of a $10,000 investment, with distributions reinvested, from January 9, 2006 through December 31, 2014.
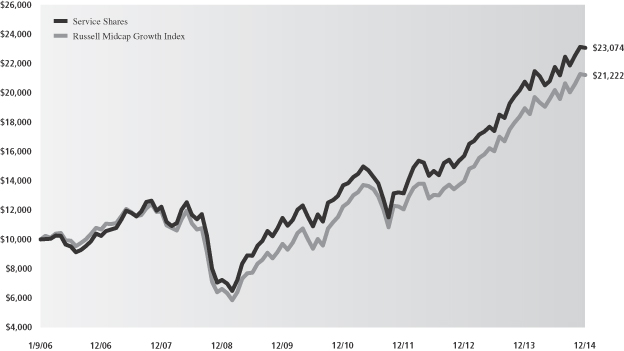
| | | | | | |
| Average Annual Total Return through December 31, 2014 | | One Year | | Five Years | | Since Inception |
Institutional (Commenced April 30, 2013) | | 11.32% | | N/A | | 18.72% |
Service (Commenced January 9, 2006) | | 11.10% | | 14.98% | | 9.75% |
21
GOLDMAN SACHS VARIABLE INSURANCE TRUST HIGH QUALITY FLOATING RATE FUND
INVESTMENT OBJECTIVE
The Fund seeks to provide a high level of current income, consistent with low volatility of principal.
Portfolio Management Discussion and Analysis
Below, the Goldman Sachs Fixed Income Portfolio Management Team discusses the Goldman Sachs High Quality Floating Rate Fund’s (the “Fund”) performance and positioning for the one-year period ended December 31, 2014 (the “Reporting Period”).
How did the Fund perform during the Reporting Period?
During the Reporting Period, the Fund’s Institutional and Service Shares generated average annual total returns of 0.17% and -0.09%, respectively, while the Fund’s Advisor Shares generated a cumulative return of –0.10% since their October 15th, 2014 inception date. These returns compare to the 0.03% average annual total return of the Fund’s benchmark, the BofA Merrill Lynch Three-Month U.S. Treasury Bill Index (the “BofA Index”).
We note that the Fund’s benchmark being the BofA Index is a means of emphasizing that the Fund has an unconstrained strategy. That said, this Fund employs a benchmark agnostic strategy and thus comparisons to a benchmark index are not particularly relevant.
What key factors had the greatest impact on the Fund’s performance during the Reporting Period?
During the Reporting Period, our top-down cross-sector strategy contributed positively to performance. In our cross-sector strategy, we invest Fund assets based on a discipline of valuing each fixed income sector in the context of all investment opportunities within the Fund’s universe. In addition, our issue selection within the government sector added to returns.
Individual issue selection within the securitized sector detracted from performance. The Fund’s duration positioning also dampened results. Duration is a measure of the Fund’s sensitivity to changes in interest rates.
Which fixed income market sectors helped or hurt Fund performance during the Reporting Period?
Within our cross-sector strategy, the Fund’s allocation to mortgage-backed securities added to performance, as mortgage-backed securities spreads tightened on muted housing activity and weak supply. (Spreads are yield differentials between bonds of comparable maturity.) In addition, the Fund benefited from its allocation to asset-backed securities (“ABS”). An allocation to corporate bonds also added to returns, though the Fund gave back some of its gains toward the end of the Reporting Period when investment grade corporate bond spreads widened despite continued strength in corporate fundamentals.
The Fund was hampered by individual issue selection within the securitized sector. More specifically, it was hurt by issue selection among mortgage-backed securities, particularly floating rate collateralized mortgage obligations (“CMOs”). This performance was slightly offset by effective individual issue selection of U.S. government securities.
Did the Fund’s duration and yield curve positioning strategy help or hurt its results during the Reporting Period?
Tactical management of the Fund’s duration and yield curve positioning detracted overall from relative returns during the Reporting Period. More specifically, as yields fell during the Reporting Period, the Fund was hampered by its short duration position relative to the BofA Index in the five-year and seven-year segments of the U.S. Treasury yield curve. Yield curve is a spectrum of maturities.
Were there any notable changes in the Fund’s weightings during the Reporting Period?
During the Reporting Period, we reduced the Fund’s short duration position relative to the BofA Index but maintained a short duration position because we believed interest rates could increase as the U.S. economy strengthened. In addition, we decreased the Fund’s exposure to residential mortgage-backed securities and government securities, and we increased its exposure to ABS and commercial mortgage-backed securities (“CMBS”).
How did the Fund use derivatives and similar instruments during the Reporting Period?
As market conditions warranted, the Fund used U.S. Treasury futures and Eurodollar futures to manage the duration and term structure of the Fund. (Term structure, most often depicted as a yield curve, refers to the term structure of interest rates, which is the relationship between the yield to maturity and the time to maturity for pure discount bonds. Eurodollar futures are contracts that are
22
GOLDMAN SACHS VARIABLE INSURANCE TRUST HIGH QUALITY FLOATING RATE FUND
linked to time deposits denominated in U.S. dollars at banks outside the U.S.) The Fund also employed credit default swaps to implement specific credit-related investment strategies.
Were there any changes to the Fund’s portfolio management team during the Reporting Period?
During the Reporting Period, Steve Lucas, head of the Fund’s duration strategy, left the firm. By design, all investment decisions for the Fund are performed within a co-lead or team structure, with multiple subject matter experts. This strategic decision making has been the cornerstone of our approach and ensures continuity in the Fund. Tom Teles, who leads the securitized and government swaps teams and is co-head of the cross-sector team, became head of the Fund’s duration strategy.
How was the Fund positioned relative to the BofA Index at the end of the Reporting Period?
At the end of the Reporting Period, the Fund had no exposure to U.S. government securities, which represent 100% of the BofA Index. It had positions in ABS, agency adjustable-rate mortgages, agency CMOs, mortgage pass-through securities, non-U.S. residential mortgage-backed securities, CMBS and covered bonds, none of which are represented in the BofA Index. Pass-through mortgages consist of a pool of residential mortgage loans, where homeowners’ monthly payments of principal, interest and prepayments pass from the original bank through a government agency or investment bank to investors. Covered bonds are securities created from either mortgage loans or public sector loans.
23
FUND BASICS
High Quality Floating Rate Fund
as of December 31, 2014
STANDARDIZED TOTAL RETURNS1
| | | | | | | | | | | | | | |
| For the period ended 12/31/14 | | One Year | | | Five Years | | | Since Inception | | | Inception Date |
| Institutional | | | 0.17 | % | | | N/A | | | | 0.40 | % | | 4/30/13 |
| Service | | | (0.09 | ) | | | 2.90 | % | | | 3.91 | | | 1/09/06 |
| Advisor (Commenced October 15, 2014) | | | N/A | | | | N/A | | | | (0.10 | )* | | 10/15/14 |
| 1 | The Standardized Total Returns are average annual total returns as of the most recent calendar quarter-end, unless otherwise noted. They assume reinvestment of all distributions at net asset value (“NAV”). Because Institutional and Service Shares do not involve a sales charge, such a charge is not applied to their Standardized Total Returns. |
| * | Represents cumulative total returns. |
Total return figures in the above chart represent past performance and do not indicate future results, which will vary. The investment return and principal value of an investment will fluctuate and, therefore, an investor’s shares, when redeemed, may be worth more or less than their original cost. Current performance may be lower or higher than the total return figures in the above chart. Please visit www.GSAMFUNDS.com to obtain the most recent month-end returns. Performance reflects fee waivers and/or expense limitations in effect during the periods shown. In their absence, performance would be reduced.
EXPENSE RATIOS2
| | | | | | | | |
| | | Net Expense Ratio (Current) | | | Gross Expense Ratio (Before Waivers) | |
| Institutional | | | 0.41 | % | | | 0.86 | % |
| Service | | | 0.66 | | | | 1.11 | |
| Advisor | | | 0.80 | | | | 1.11 | |
| 2 | The expense ratios of the Fund, both current (net of any fee waivers or expense limitations) and before waivers (gross of any fee waivers or expense limitations) are as set forth above. Pursuant to a contractual arrangement, the Fund’s waivers and/or expense limitations will remain in place through at least April 30, 2015 and prior to such date the Investment Adviser may not terminate the arrangements without the approval of the Fund’s Board of Trustees. If these arrangements are discontinued in the future, the expense ratios may change without shareholder approval. |
24
FUND BASICS
FUND COMPOSITION3
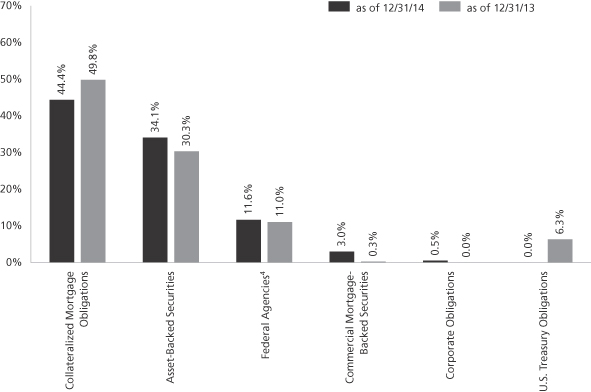
| 3 | The percentage shown for each investment category reflects the value of investments in that category as a percentage of net assets. Figures in the above graph may not sum to 100% due to the exclusion of other assets and liabilities. The graph depicts the Fund’s investments but may not represent the Fund’s market exposure due to the exclusion of certain derivatives, if any, as listed in the Additional Investment Information section of the Schedule of Investments. |
| 4 | “Federal Agencies” are mortgage-backed securities guaranteed by the Government National Mortgage Association (“GNMA”), the Federal National Mortgage Association (“FNMA”) and the Federal Home Loan Mortgage Corp. (“FHLMC”). GNMA instruments are backed by the full faith and credit of the United States Government. |
25
GOLDMAN SACHS VARIABLE INSURANCE TRUST HIGH QUALITY FLOATING RATE FUND
Performance Summary
December 31, 2014
The following graph shows the value, as of December 31, 2014, of a $10,000 investment made on January 9, 2006 (commencement of operations) in the Service Class Shares. For comparative purposes, the performance of the Fund’s benchmark, the BofA ML Three Month U.S. Treasury Bill Index, is shown. This performance data represents past performance and should not be considered indicative of future performance, which will fluctuate with changes in market conditions. These performance fluctuations will cause an investor’s shares, when redeemed, to be worth more or less than their original cost. Performance reflects Fund level expenses, but does not reflect fees and expenses associated with any variable annuity contract or variable life insurance policy that uses the Fund as an investment option for any contract or policy. Had performance reflected all of those fees and expenses, performance would have been reduced. Performance reflects applicable fee waivers and/or expense limitations in effect during the periods shown, and in their absence, performance would be reduced. Performance of Institutional Shares will vary from Service Shares due to differences in class specific fees. In addition to the Investment Adviser’s decisions regarding issuer/industry investment selection and allocation, other factors may affect Fund performance. These factors include, but are not limited to, Fund operating fees and expenses, portfolio turnover, and subscription and redemption cash flows affecting the Fund.
High Quality Floating Rate Fund’s Lifetime Performance
Performance of a $10,000 investment, with distributions reinvested, from January 9, 2006 through December 31, 2014.
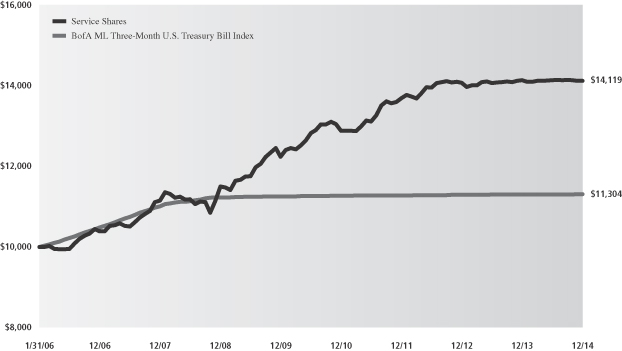
| | | | | | |
| Average Annual Total Return through December 31, 2014 | | One Year | | Five Years | | Since Inception |
Institutional (Commenced April 30, 2013) | | 0.17% | | N/A | | 0.40% |
Service (Commenced January 9, 2006) | | -0.09% | | 2.90% | | 3.91% |
Advisor (Commenced October 15, 2014) | | N/A | | N/A | | -0.10%* |
| * | Represents cumulative total returns. |
26
GOLDMAN SACHS VARIABLE INSURANCE TRUST FUNDS
Index Definitions
The Russell Midcap® Index measures the performance of the mid-cap segment of the U.S. equity universe. The Russell Midcap® Index is a subset of the Russell 1000® Index. The Russell Midcap® Index includes approximately 800 of the smallest securities based on a combination of their market cap and current index membership. The Russell Midcap® Index represents approximately 31% of the total market capitalization of the Russell 1000® Index companies. The Russell Midcap® Index is constructed to provide a comprehensive and unbiased barometer for the mid-cap segment. The Russell Midcap® Index is completely reconstituted annually to ensure larger stocks do not distort the performance and characteristics of the true mid-cap opportunity set.
The Russell 1000® Index measures the performance of the large-cap segment of the U.S. equity universe. The Russell 1000® Index is a subset of the Russell 3000® Index and includes approximately 1000 of the largest securities based on a combination of their market cap and current index membership. The Russell 1000® Index represents approximately 92% of the U.S. market. The Russell 1000® Index is constructed to provide a comprehensive and unbiased barometer for the large-cap segment and is completely reconstituted annually to ensure new and growing equities are reflected.
The Russell 2000® Index measures the performance of the small-cap segment of the U.S. equity universe. The Russell 2000® Index is a subset of the Russell 3000® Index representing approximately 10% of the total market capitalization of that index. The Russell 2000® Index includes approximately 2000 of the smallest securities based on a combination of their market cap and current index membership. The Russell 2000® Index is constructed to provide a comprehensive and unbiased small-cap barometer and is completely reconstituted annually to ensure larger stocks do not distort the performance and characteristics of the true small-cap opportunity set.
The S&P 500® Index is the Standard & Poor’s 500 Composite Index of 500 stocks, an unmanaged index of common stock prices.
The MSCI EAFE® Index (Europe, Australasia, Far East) is a free float-adjusted market capitalization index that is designed to measure the equity market performance of developed markets, excluding the US & Canada. The MSCI EAFE® Index consists of the following 21 developed market country indexes: Australia, Austria, Belgium, Denmark, Finland, France, Germany, Hong Kong, Ireland, Israel, Italy, Japan, the Netherlands, New Zealand, Norway, Portugal, Singapore, Spain, Sweden, Switzerland, and the United Kingdom.
All index figures do not reflect any deduction for fees, expenses or taxes. It is not possible to invest directly in an unmanaged index.
27
GOLDMAN SACHS VARIABLE INSURANCE TRUST CORE FIXED INCOME FUND
Schedule of Investments
December 31, 2014
| | | | | | | | | | | | | | |
Principal
Amount | | | Interest
Rate | | | Maturity
Date | | | Value | |
| | Corporate Obligations – 30.3% | |
| Automobiles & Components – 0.5% | |
| Ford Motor Credit Co. LLC | | | | | |
| $ | 475,000 | | | | 5.875 | % | | | 08/02/21 | | | $ | 549,340 | |
| | |
| Banks – 8.3% | |
| American Express Co.(b) | | | | | |
| | 125,000 | | | | 3.625 | | | | 12/05/24 | | | | 126,563 | |
| | 250,000 | | | | 6.800 | (a) | | | 09/01/66 | | | | 262,187 | |
| Bank of America Corp. | | | | | |
| | 100,000 | | | | 5.625 | | | | 07/01/20 | | | | 113,838 | |
| | 225,000 | | | | 4.125 | | | | 01/22/24 | | | | 236,299 | |
| | 275,000 | | | | 4.000 | | | | 04/01/24 | | | | 286,351 | |
| Barclays Bank PLC | | | | | |
| | 275,000 | | | | 2.500 | | | | 02/20/19 | | | | 278,176 | |
| CBA Capital Trust II(a)(b)(c) | | | | | |
| | 375,000 | | | | 6.024 | | | | 03/29/49 | | | | 390,015 | |
| Citigroup, Inc. | | | | | |
| | 150,000 | | | | 3.375 | | | | 03/01/23 | | | | 150,754 | |
| CoBank ACB Series H(a)(b) | | | | | |
| | 1,984 | | | | 6.200 | | | | 12/31/49 | | | | 198,400 | |
| Compass Bank(b) | | | | | |
| | 375,000 | | | | 2.750 | | | | 09/29/19 | | | | 374,561 | |
| Credit Suisse New York | | | | | |
| | 325,000 | | | | 2.300 | | | | 05/28/19 | | | | 324,239 | |
| ING Bank NV(a)(b) | | | | | |
| | 325,000 | | | | 4.125 | | | | 11/21/23 | | | | 330,224 | |
| Intesa Sanpaolo SpA | | | | | |
| | 350,000 | | | | 2.375 | | | | 01/13/17 | | | | 352,893 | |
| | 350,000 | | | | 3.875 | | | | 01/16/18 | | | | 364,213 | |
| JPMorgan Chase & Co. | | | | | |
| | 450,000 | | | | 4.400 | | | | 07/22/20 | | | | 486,672 | |
| Lloyds Bank PLC | | | | | |
| | 175,000 | | | | 2.300 | | | | 11/27/18 | | | | 175,937 | |
| Macquarie Bank Ltd.(c) | | | | | |
| | 25,000 | | | | 2.600 | | | | 06/24/19 | | | | 25,209 | |
| | 200,000 | | | | 6.625 | | | | 04/07/21 | | | | 230,881 | |
| Mizuho Corporate Bank Ltd.(c) | | | | | |
| | 200,000 | | | | 2.550 | | | | 03/17/17 | | | | 203,909 | |
| Morgan Stanley | | | | | |
| | 800,000 | | | | 3.700 | | | | 10/23/24 | | | | 810,246 | |
| Morgan Stanley Series F | | | | | |
| | 100,000 | | | | 3.875 | | | | 04/29/24 | | | | 102,607 | |
| PNC Preferred Funding Trust II(a)(b)(c) | | | | | |
| | 400,000 | | | | 1.463 | | | | 03/29/49 | | | | 376,000 | |
| Regions Bank | | | | | |
| | 250,000 | | | | 7.500 | | | | 05/15/18 | | | | 289,681 | |
| Regions Financial Corp. | | | | | |
| | 325,000 | | | | 5.750 | | | | 06/15/15 | | | | 331,750 | |
| Resona Bank Ltd.(a)(b)(c) | | | | | |
| | 650,000 | | | | 5.850 | | | | 09/29/49 | | | | 678,437 | |
| Royal Bank of Scotland Group PLC | | | | | |
| | 250,000 | | | | 2.550 | | | | 09/18/15 | | | | 252,503 | |
| | 100,000 | | | | 9.500 | (a)(b) | | | 03/16/22 | | | | 114,000 | |
| | |
| | Corporate Obligations – (continued) | |
| Banks – (continued) | |
| Santander Holdings USA, Inc. | | | | | |
| $ | 75,000 | | | | 3.000 | %(b) | | | 09/24/15 | | | $ | 75,899 | |
| | 165,000 | | | | 4.625 | | | | 04/19/16 | | | | 171,593 | |
| Santander UK PLC(c) | | | | | |
| | 250,000 | | | | 5.000 | | | | 11/07/23 | | | | 264,049 | |
| Wells Fargo & Co. Series S(a)(b) | | | | | |
| | 450,000 | | | | 5.900 | | | | 12/29/49 | | | | 453,375 | |
| | | | | | | | | | | | | | |
| | | | | | | | | | | | | 8,831,461 | |
| | |
| Diversified Financials – 0.4% | | | | | |
| GE Capital Trust I(a)(b) | | | | | |
| | 150,000 | | | | 6.375 | | | | 11/15/67 | | | | 160,500 | |
| General Motors Financial Co., Inc. | | | | | |
| | 125,000 | | | | 3.250 | | | | 05/15/18 | | | | 125,313 | |
| | 175,000 | | | | 3.500 | | | | 07/10/19 | | | | 178,281 | |
| | | | | | | | | | | | | | |
| | | | | | | | | | | | | 464,094 | |
| | |
| Diversified Manufacturing – 0.2% | | | | | |
| Xylem, Inc. | | | | | |
| | 250,000 | | | | 3.550 | | | | 09/20/16 | | | | 258,975 | |
| | |
| | Electric – 0.9% | | | | | | | | | | | | | |
| Florida Power & Light Co.(b) | | | | | |
| | 193,000 | | | | 4.125 | | | | 02/01/42 | | | | 208,281 | |
| Progress Energy, Inc. | | | | | |
| | 350,000 | | | | 7.000 | | | | 10/30/31 | | | | 468,571 | |
| Puget Sound Energy, Inc. Series A(a)(b) | | | | | |
| | 100,000 | | | | 6.974 | | | | 06/01/67 | | | | 103,000 | |
| Southern California Edison Co.(b) | | | | | |
| | 175,000 | | | | 4.050 | | | | 03/15/42 | | | | 181,196 | |
| | | | | | | | | | | | | | |
| | | | | | | | | | | | | 961,048 | |
| | |
| Energy – 2.4% | | | | | |
| Anadarko Petroleum Corp. | | | | | |
| | 125,000 | | | | 6.450 | | | | 09/15/36 | | | | 149,824 | |
| ConocoPhillips Co.(b) | | | | | |
| | 100,000 | | | | 3.350 | | | | 11/15/24 | | | | 100,624 | |
| | 100,000 | | | | 4.150 | | | | 11/15/34 | | | | 102,731 | |
| Dolphin Energy Ltd.(c) | | | | | |
| | 137,136 | | | | 5.888 | | | | 06/15/19 | | | | 149,630 | |
| | 200,000 | | | | 5.500 | | | | 12/15/21 | | | | 224,520 | |
| Kinder Morgan, Inc.(b) | | | | | |
| | 175,000 | | | | 3.050 | | | | 12/01/19 | | | | 173,425 | |
| | 125,000 | | | | 5.000 | (c) | | | 02/15/21 | | | | 130,102 | |
| Nexen Energy ULC | | | | | |
| | 90,000 | | | | 6.400 | | | | 05/15/37 | | | | 111,684 | |
| Petrobras Global Finance BV | | | | | |
| | 280,000 | | | | 4.875 | | | | 03/17/20 | | | | 259,168 | |
| | 10,000 | | | | 6.250 | | | | 03/17/24 | | | | 9,483 | |
| Petroleos Mexicanos | | | | | |
| | 380,000 | | | | 4.875 | | | | 01/18/24 | | | | 396,150 | |
| | 150,000 | | | | 6.625 | | | | 06/15/35 | | | | 172,875 | |
| PTTEP Canada International Finance Ltd.(c) | | | | | |
| | 240,000 | | | | 5.692 | | | | 04/05/21 | | | | 268,986 | |
| | |
| | |
| 28 | | The accompanying notes are an integral part of these financial statements. |
GOLDMAN SACHS VARIABLE INSURANCE TRUST CORE FIXED INCOME FUND
| | | | | | | | | | | | | | |
Principal
Amount | | | Interest
Rate | | | Maturity
Date | | | Value | |
| | Corporate Obligations – (continued) | |
| Energy – (continued) | | | | | |
| Transocean, Inc. | | | | | |
| $ | 125,000 | | | | 6.500 | % | | | 11/15/20 | | | $ | 117,812 | |
| Weatherford International Ltd. | | | | | |
| | 175,000 | | | | 9.625 | | | | 03/01/19 | | | | 207,450 | |
| | | | | | | | | | | | | | |
| | | | | | | | | | | | | 2,574,464 | |
| | |
| Food & Beverage – 0.8% | |
| Mondelez International, Inc. | |
| | 139,000 | | | | 6.500 | | | | 02/09/40 | | | | 185,559 | |
| Pernod-Ricard SA(c) | |
| | 375,000 | | | | 4.450 | | | | 01/15/22 | | | | 401,201 | |
| Suntory Holdings Ltd.(c) | |
| | 275,000 | | | | 2.550 | | | | 09/29/19 | | | | 275,530 | |
| | | | | | | | | | | | | | |
| | | | | | | | | | | | | 862,290 | |
| | |
| Food & Staples Retailing – 1.0% | |
| CVS Health Corp.(b) | |
| | 125,000 | | | | 4.125 | | | | 05/15/21 | | | | 134,450 | |
| | 200,000 | | | | 3.375 | | | | 08/12/24 | | | | 201,620 | |
| Sysco Corp.(b) | |
| | 175,000 | | | | 2.350 | | | | 10/02/19 | | | | 175,879 | |
| Walgreens Boots Alliance, Inc. | |
| | 175,000 | | | | 1.800 | | | | 09/15/17 | | | | 175,099 | |
| | 325,000 | | | | 3.300 | (b) | | | 11/18/21 | | | | 327,428 | |
| | | | | | | | | | | | | | |
| | | | | | | | | | | | | 1,014,476 | |
| | |
| Health Care Equipment & Services – 0.4% | |
| Becton Dickinson and Co. | |
| | 200,000 | | | | 2.675 | | | | 12/15/19 | | | | 202,124 | |
| Medtronic, Inc.(c) | |
| | 75,000 | | | | 2.500 | | | | 03/15/20 | | | | 75,417 | |
| | 150,000 | | | | 3.150 | | | | 03/15/22 | | | | 152,175 | |
| | | | | | | | | | | | | | |
| | | | | | | | | | | | | 429,716 | |
| | |
| Healthcare – 0.1% | |
| DENTSPLY International, Inc. | |
| | 125,000 | | | | 2.750 | | | | 08/15/16 | | | | 127,195 | |
| | |
| Insurance – 0.2% | |
| Teachers Insurance & Annuity Association of America(c) | |
| | 180,000 | | | | 4.900 | | | | 09/15/44 | | | | 200,583 | |
| | |
| Life Insurance – 0.8% | |
| American International Group, Inc.(b) | |
| | 75,000 | | | | 4.500 | | | | 07/16/44 | | | | 78,539 | |
| Genworth Financial, Inc. | |
| | 75,000 | | | | 8.625 | | | | 12/15/16 | | | | 80,641 | |
| Nippon Life Insurance Co.(a)(b)(c) | |
| | 375,000 | | | | 5.100 | | | | 10/16/44 | | | | 391,875 | |
| The Northwestern Mutual Life Insurance Co.(c) | |
| | 200,000 | | | | 6.063 | | | | 03/30/40 | | | | 258,524 | |
| | | | | | | | | | | | | | |
| | | | | | | | | | | | | 809,579 | |
| | |
| Materials – 0.5% | |
| Eastman Chemical Co.(b) | |
| | 225,000 | | | | 3.800 | | | | 03/15/25 | | | | 227,358 | |
| | |
| | Corporate Obligations – (continued) | |
| Materials – (continued) | |
| Ecolab, Inc. | |
| $ | 100,000 | | | | 5.500 | % | | | 12/08/41 | | | $ | 118,554 | |
| Monsanto Co.(b) | |
| | 200,000 | | | | 4.400 | | | | 07/15/44 | | | | 205,086 | |
| | | | | | | | | | | | | | |
| | | | | | | | | | | | | 550,998 | |
| | |
| Media – 2.1% | |
| 21st Century Fox America, Inc. | |
| | 275,000 | | | | 3.000 | | | | 09/15/22 | | | | 272,676 | |
| | 75,000 | | | | 3.700 | (b)(c) | | | 09/15/24 | | | | 77,272 | |
| DIRECTV Holdings LLC | |
| | 650,000 | | | | 3.800 | | | | 03/15/22 | | | | 660,066 | |
| | 225,000 | | | | 4.450 | (b) | | | 04/01/24 | | | | 235,640 | |
| | 300,000 | | | | 3.950 | (b) | | | 01/15/25 | | | | 304,529 | |
| Time Warner Cable, Inc. | |
| | 375,000 | | | | 7.300 | | | | 07/01/38 | | | | 519,741 | |
| | 150,000 | | | | 5.500 | (b) | | | 09/01/41 | | | | 171,742 | |
| | | | | | | | | | | | | | |
| | | | | | | | | | | | | 2,241,666 | |
| | |
| Metals and Mining(c) – 0.8% | |
| Glencore Finance Canada Ltd. | |
| | 500,000 | | | | 2.700 | | | | 10/25/17 | | | | 505,853 | |
| Glencore Funding LLC | |
| | 125,000 | | | | 1.700 | | | | 05/27/16 | | | | 125,199 | |
| | 175,000 | | | | 2.500 | | | | 01/15/19 | | | | 172,318 | |
| | | | | | | | | | | | | | |
| | | | | | | | | | | | | 803,370 | |
| | |
| Noncaptive-Financial – 0.5% | |
| International Lease Finance Corp. | |
| | 375,000 | | | | 5.750 | | | | 05/15/16 | | | | 389,062 | |
| | 150,000 | | | | 7.125 | (c) | | | 09/01/18 | | | | 168,000 | |
| | | | | | | | | | | | | | |
| | | | | | | | | | | | | 557,062 | |
| | |
| Pharmaceuticals, Biotechnology & Life Sciences – 0.9% | |
| Actavis Funding SCS(b) | |
| | 150,000 | | | | 4.850 | | | | 06/15/44 | | | | 151,913 | |
| Bayer US Finance LLC(c) | |
| | 400,000 | | | | 3.000 | | | | 10/08/21 | | | | 403,252 | |
| Forest Laboratories, Inc.(c) | |
| | 325,000 | | | | 4.375 | | | | 02/01/19 | | | | 342,875 | |
| | 100,000 | | | | 5.000 | (b) | | | 12/15/21 | | | | 107,750 | |
| | | | | | | | | | | | | | |
| | | | | | | | | | | | | 1,005,790 | |
| | |
| Pipelines – 1.2% | |
| Enterprise Products Operating LLC Series A(a)(b) | |
| | 450,000 | | | | 8.375 | | | | 08/01/66 | | | | 483,187 | |
| Tennessee Gas Pipeline Co. LLC | |
| | 200,000 | | | | 8.375 | | | | 06/15/32 | | | | 262,801 | |
| TransCanada Pipelines Ltd.(a)(b) | |
| | 325,000 | | | | 6.350 | | | | 05/15/67 | | | | 313,625 | |
| Williams Partners LP(b) | |
| | 250,000 | | | | 3.900 | | | | 01/15/25 | | | | 238,495 | |
| | | | | | | | | | | | | | |
| | | | | | | | | | | | | 1,298,108 | |
| | |
| | |
| The accompanying notes are an integral part of these financial statements. | | 29 |
GOLDMAN SACHS VARIABLE INSURANCE TRUST CORE FIXED INCOME FUND
Schedule of Investments (continued)
December 31, 2014
| | | | | | | | | | | | | | |
Principal
Amount | | | Interest
Rate | | | Maturity
Date | | | Value | |
| | Corporate Obligations – (continued) | |
| Real Estate Development – 0.2% | |
| MDC Holdings, Inc.(b) | |
| $ | 150,000 | | | | 5.500 | % | | | 01/15/24 | | | $ | 145,704 | |
| | 125,000 | | | | 6.000 | | | | 01/15/43 | | | | 103,880 | |
| | | | | | | | | | | | | | |
| | | | | | | | | | | | | 249,584 | |
| | |
| Real Estate Investment Trusts – 3.2% | |
| American Campus Communities Operating Partnership LP(b) | |
| | 275,000 | | | | 4.125 | | | | 07/01/24 | | | | 278,257 | |
| Camden Property Trust | |
| | 325,000 | | | | 5.700 | | | | 05/15/17 | | | | 354,083 | |
| CBL & Associates LP(b) | |
| | 175,000 | | | | 5.250 | | | | 12/01/23 | | | | 187,131 | |
| DDR Corp. | |
| | 375,000 | | | | 7.500 | | | | 04/01/17 | | | | 421,050 | |
| | 225,000 | | | | 7.875 | | | | 09/01/20 | | | | 278,663 | |
| HCP, Inc. | |
| | 275,000 | | | | 6.000 | | | | 01/30/17 | | | | 299,486 | |
| | 125,000 | | | | 2.625 | (b) | | | 02/01/20 | | | | 123,350 | |
| Health Care REIT, Inc. | |
| | 375,000 | | | | 2.250 | | | | 03/15/18 | | | | 377,822 | |
| Healthcare Realty Trust, Inc. | |
| | 350,000 | | | | 5.750 | | | | 01/15/21 | | | | 391,960 | |
| Healthcare Trust of America Holdings LP(b) | |
| | 100,000 | | | | 3.375 | | | | 07/15/21 | | | | 100,226 | |
| Kilroy Realty LP | |
| | 275,000 | | | | 5.000 | | | | 11/03/15 | | | | 283,304 | |
| | 150,000 | | | | 3.800 | (b) | | | 01/15/23 | | | | 151,825 | |
| Senior Housing Properties Trust(b) | |
| | 125,000 | | | | 3.250 | | | | 05/01/19 | | | | 125,777 | |
| | | | | | | | | | | | | | |
| | | | | | | | | | | | | 3,372,934 | |
| | |
| Retailing – 0.2% | |
| Amazon.com, Inc.(b) | |
| | 250,000 | | | | 3.300 | | | | 12/05/21 | | | | 254,629 | |
| | |
| Technology – 0.6% | |
| Amphenol Corp.(b) | |
| | 125,000 | | | | 3.125 | | | | 09/15/21 | | | | 126,113 | |
| Hewlett-Packard Co. | |
| | 250,000 | | | | 3.000 | | | | 09/15/16 | | | | 256,382 | |
| | 150,000 | | | | 2.600 | | | | 09/15/17 | | | | 152,637 | |
| | 150,000 | | | | 2.750 | | | | 01/14/19 | | | | 150,822 | |
| | | | | | | | | | | | | | |
| | | | | | | | | | | | | 685,954 | |
| | |
| Tobacco – 0.4% | |
| Imperial Tobacco Finance PLC(c) | |
| | 400,000 | | | | 2.050 | | | | 02/11/18 | | | | 397,759 | |
| | |
| Transportation(c) – 0.8% | |
| ERAC USA Finance LLC | |
| | 350,000 | | | | 2.350 | | | | 10/15/19 | | | | 347,392 | |
| Penske Truck Leasing Co. LP / PTL Finance Corp. | |
| | 225,000 | | | | 2.500 | | | | 03/15/16 | | | | 228,120 | |
| | 125,000 | | | | 4.875 | | | | 07/11/22 | | | | 134,950 | |
| | 125,000 | | | | 4.250 | | | | 01/17/23 | | | | 129,880 | |
| | | | | | | | | | | | | | |
| | | | | | | | | | | | | 840,342 | |
| | |
| | Corporate Obligations – (continued) | |
| Wireless Telecommunications – 0.1% | |
| American Tower Corp. | |
| $ | 125,000 | | | | 4.700 | % | | | 03/15/22 | | | $ | 131,021 | |
| | |
| Wirelines Telecommunications – 2.8% | |
| Telefonica Emisiones SAU | |
| | 175,000 | | | | 3.192 | | | | 04/27/18 | | | | 179,928 | |
| | 100,000 | | | | 5.462 | | | | 02/16/21 | | | | 112,346 | |
| Verizon Communications, Inc. | |
| | 607,000 | | | | 2.625 | (c) | | | 02/21/20 | | | | 604,646 | |
| | 850,000 | | | | 4.500 | | | | 09/15/20 | | | | 923,061 | |
| | 1,050,000 | | | | 5.150 | | | | 09/15/23 | | | | 1,160,413 | |
| | | | | | | | | | | | | | |
| | | | | | | | | | | | | 2,980,394 | |
| | |
| | TOTAL CORPORATE OBLIGATIONS | |
| | (Cost $31,530,002) | | | $ | 32,452,832 | |
| | |
| | | | | | | | | | | | | | |
| | Mortgage-Backed Obligations – 36.1% | |
| Adjustable Rate Non-Agency(a)(b) – 0.7% | |
| Countrywide Alternative Loan Trust Series 2005-38, Class A1 | |
| $ | 193,013 | | | | 1.613 | % | | | 09/25/35 | | | $ | 175,655 | |
| Lehman XS Trust Series 2005-7N, Class 1A1A | |
| | 275,946 | | | | 0.439 | | | | 12/25/35 | | | | 242,625 | |
| Master Adjustable Rate Mortgages Trust Series 2006-OA2,
Class 4A1A |
|
| | 356,492 | | | | 0.963 | | | | 12/25/46 | | | | 286,100 | |
| | | | | | | | | | | | | | |
| | | | | | | | | | | | | 704,380 | |
| | |
| Collateralized Mortgage Obligations – 8.1% | |
| Agency Multi-Family – 4.7% | |
| FHLMC Multifamily Structured Pass-Through Certificates
Series K031, Class A2(a) |
|
| | 300,000 | | | | 3.300 | | | | 04/25/23 | | | | 315,238 | |
| FHLMC Multifamily Structured Pass-Through Certificates
Series K714, Class A2(a) |
|
| | 300,000 | | | | 3.034 | | | | 10/25/20 | | | | 313,474 | |
| FNMA | |
| | 370,058 | | | | 2.800 | | | | 03/01/18 | | | | 383,311 | |
| | 1,043,914 | | | | 3.740 | | | | 05/01/18 | | | | 1,113,263 | |
| | 320,000 | | | | 3.840 | | | | 05/01/18 | | | | 342,559 | |
| | 800,000 | | | | 4.506 | | | | 06/01/19 | | | | 868,037 | |
| | 186,523 | | | | 3.416 | | | | 10/01/20 | | | | 197,590 | |
| | 178,262 | | | | 3.615 | | | | 12/01/20 | | | | 191,058 | |
| | 931,074 | | | | 3.763 | | | | 12/01/20 | | | | 1,004,937 | |
| FNMA ACES Series 2012-M8, Class A2 | |
| | 100,000 | | | | 2.349 | | | | 05/25/22 | | | | 99,086 | |
| FNMA ACES Series 2012-M8, Class ASQ2 | |
| | 100,000 | | | | 1.520 | | | | 12/25/19 | | | | 100,003 | |
| GNMA | |
| | 138,617 | | | | 3.950 | | | | 07/15/25 | | | | 147,122 | |
| | | | | | | | | | | | | | |
| | | | | | | | | | | | | 5,075,678 | |
| | |
| | |
| 30 | | The accompanying notes are an integral part of these financial statements. |
GOLDMAN SACHS VARIABLE INSURANCE TRUST CORE FIXED INCOME FUND
| | | | | | | | | | | | | | |
Principal
Amount | | | Interest
Rate | | | Maturity
Date | | | Value | |
| | Mortgage-Backed Obligations – (continued) | |
| Covered Bond(c) – 1.4% | |
| Northern Rock Asset Management PLC | |
| $ | 900,000 | | | | 5.625 | % | | | 06/22/17 | | | $ | 988,981 | |
| Sparebank 1 Boligkreditt AS | |
| | 500,000 | | | | 2.625 | | | | 05/27/16 | | | | 511,745 | |
| | | | | | | | | | | | | | |
| | | | | | | | | | | | | 1,500,726 | |
| | |
| Regular Floater(a) – 1.5% | |
| Aire Valley Mortgages PLC Series 2004-1X, Class 3A2 | |
| EUR | 374,665 | | | | 0.499 | | | | 09/20/66 | | | | 441,056 | |
| Aire Valley Mortgages PLC Series 2006-1A, Class 1A(c) | |
| $ | 78,558 | | | | 0.467 | | | | 09/20/66 | | | | 75,669 | |
| Aire Valley Mortgages PLC Series 2006-1X, Class 2A1 | |
| EUR | 211,486 | | | | 0.379 | | | | 09/20/66 | | | | 247,432 | |
| Eurosail PRIME-UK 2007-A PLC Series 2007-PR1X, Class A1(b) | |
| GBP | 83,011 | | | | 0.960 | | | | 09/13/45 | | | | 123,398 | |
| FNMA Connecticut Avenue Securities Series 2014-C03,
Class 1M1 |
|
| $ | 53,937 | | | | 1.370 | | | | 07/25/24 | | | | 53,345 | |
| Granite Master Issuer PLC Series 2003-3, Class 3A | |
| GBP | 26,924 | | | | 0.938 | | | | 01/20/44 | | | | 41,838 | |
| Leek Finance Number Eighteen PLC Series 18X, Class A2B(b) | |
| $ | 189,708 | | | | 0.507 | | | | 09/21/38 | | | | 195,888 | |
| Leek Finance Number Eighteen PLC Series 18X, Class A2C(b) | |
| EUR | 47,427 | | | | 0.339 | | | | 09/21/38 | | | | 59,409 | |
| Leek Finance Number Seventeen PLC Series 17X, Class A2C(b) | |
| | 31,349 | | | | 0.359 | | | | 12/21/37 | | | | 39,762 | |
| Quadrivio Finance SRL Series 2011-1, Class A1 | |
| | 154,178 | | | | 0.585 | | | | 07/25/60 | | | | 186,202 | |
| Thrones 2013-1 PLC Series 2013-1, Class A(b) | |
| GBP | 82,609 | | | | 2.060 | | | | 07/20/44 | | | | 129,693 | |
| | | | | | | | | | | | | | |
| | | | | | | | | | | | | 1,593,692 | |
| | |
| Sequential Fixed Rate – 0.5% | |
| FNMA REMIC Series 2012-111, Class B | |
| $ | 44,899 | | | | 7.000 | | | | 10/25/42 | | | | 51,222 | |
| FNMA REMIC Series 2012-153, Class B | |
| | 103,229 | | | | 7.000 | | | | 07/25/42 | | | | 118,594 | |
| National Credit Union Administration Guaranteed Notes
Series A4 |
|
| | 300,000 | | | | 3.000 | | | | 06/12/19 | | | | 314,864 | |
| | | | | | | | | | | | | | |
| | | | | | | | | | | | | 484,680 | |
| | |
| TOTAL COLLATERALIZED MORTGAGE
OBLIGATIONS |
| | $ | 8,654,776 | |
| | |
| Commercial Mortgage-Backed Securities – 3.3% | |
| Sequential Fixed Rate – 3.3% | |
| Banc of America Commercial Mortgage Trust Series 2007-4,
Class A1A |
|
| | 317,812 | | | | 5.774 | | | | 02/10/51 | | | | 346,608 | |
| FREMF Mortgage Trust Series 2014-K40, Class C(c) | |
| | 100,000 | | | | 4.072 | | | | 09/25/25 | | | | 98,158 | |
| FREMF Mortgage Trust Series 2014-K41, Class B | |
| | 100,000 | | | | 3.830 | | | | 11/25/47 | | | | 95,218 | |
| | |
| | Mortgage-Backed Obligations – (continued) | |
| Sequential Fixed Rate – (continued) | |
| GS Mortgage Securities Trust Series 2007-GG10, Class A1A(d) | |
| $ | 604,281 | | | | 5.796 | % | | | 08/10/45 | | | $ | 656,648 | |
| GS Mortgage Securities Trust Series 2007-GG10, Class A4(d) | |
| | 270,849 | | | | 5.796 | | | | 08/10/45 | | | | 293,786 | |
| JP Morgan Chase Commercial Mortgage Securities Trust
Series 2006-CB15, Class A1A |
|
| | 461,346 | | | | 5.811 | | | | 06/12/43 | | | | 485,014 | |
| JP Morgan Chase Commercial Mortgage Securities Trust
Series 2007-CB19, Class A1A(d) |
|
| | 263,933 | | | | 5.698 | | | | 02/12/49 | | | | 285,347 | |
| Morgan Stanley Bank of America Merrill Lynch Trust
Series 2012-C6, Class A4 |
|
| | 800,000 | | | | 2.858 | | | | 11/15/45 | | | | 800,794 | |
| Wachovia Bank Commercial Mortgage Trust Series 2007-C34,
Class A1A(b) |
|
| | 495,357 | | | | 5.608 | | | | 05/15/46 | | | | 528,178 | |
| | |
| TOTAL COMMERCIAL
MORTGAGE-BACKED SECURITIES |
| | $ | 3,589,751 | |
| | |
| Federal Agencies – 24.0% | |
| Adjustable Rate FHLMC(a) – 1.1% | |
| $ | 1,079,654 | | | | 2.375 | % | | | 09/01/35 | | | $ | 1,157,248 | |
| | |
| Adjustable Rate FNMA(a) – 1.3% | |
| | 315,470 | | | | 1.847 | | | | 05/01/33 | | | | 332,078 | |
| | 532,387 | | | | 2.333 | | | | 05/01/35 | | | | 566,137 | |
| | 481,351 | | | | 2.590 | | | | 09/01/35 | | | | 515,945 | |
| | | | | | | | | | | | | | |
| | | | | | | | | | | | | 1,414,160 | |
| | |
| FHLMC – 1.0% | |
| | 1,870 | | | | 7.500 | | | | 06/01/15 | | | | 1,880 | |
| | 109,721 | | | | 5.500 | | | | 02/01/18 | | | | 116,050 | |
| | 11,466 | | | | 5.500 | | | | 04/01/18 | | | | 12,127 | |
| | 4,635 | | | | 4.500 | | | | 09/01/18 | | | | 4,870 | |
| | 18,842 | | | | 5.500 | | | | 09/01/18 | | | | 19,928 | |
| | 781 | | | | 9.500 | | | | 08/01/19 | | | | 789 | |
| | 34 | | | | 9.500 | | | | 08/01/20 | | | | 37 | |
| | 65,360 | | | | 6.500 | | | | 10/01/20 | | | | 70,993 | |
| | 14,485 | | | | 4.500 | | | | 07/01/24 | | | | 15,595 | |
| | 71,603 | | | | 4.500 | | | | 11/01/24 | | | | 77,195 | |
| | 13,811 | | | | 4.500 | | | | 12/01/24 | | | | 14,869 | |
| | 15,930 | | | | 6.000 | | | | 03/01/29 | | | | 18,006 | |
| | 170 | | | | 6.000 | | | | 04/01/29 | | | | 192 | |
| | 17,887 | | | | 7.500 | | | | 12/01/29 | | | | 20,891 | |
| | 162,555 | | | | 7.000 | | | | 05/01/32 | | | | 189,552 | |
| | 325 | | | | 6.000 | | | | 08/01/32 | | | | 373 | |
| | 97,521 | | | | 7.000 | | | | 12/01/32 | | | | 113,799 | |
| | 6,943 | | | | 5.000 | | | | 10/01/33 | | | | 7,685 | |
| | 9,709 | | | | 5.000 | | | | 07/01/35 | | | | 10,741 | |
| | 13,062 | | | | 5.000 | | | | 12/01/35 | | | | 14,463 | |
| | 101,702 | | | | 5.500 | | | | 01/01/37 | | | | 113,419 | |
| | 3,536 | | | | 5.000 | | | | 03/01/38 | | | | 3,895 | |
| | |
| | |
| The accompanying notes are an integral part of these financial statements. | | 31 |
GOLDMAN SACHS VARIABLE INSURANCE TRUST CORE FIXED INCOME FUND
Schedule of Investments (continued)
December 31, 2014
| | | | | | | | | | | | | | |
Principal
Amount | | | Interest
Rate | | | Maturity
Date | | | Value | |
| | Mortgage-Backed Obligations – (continued) | |
| FHLMC – (continued) | |
| $ | 194,728 | | | | 7.000 | % | | | 02/01/39 | | | $ | 223,419 | |
| | 7,733 | | | | 5.000 | | | | 06/01/41 | | | | 8,560 | |
| | | | | | | | | | | | | | |
| | | | | | | | | | | | | 1,059,328 | |
| | |
| FNMA – 19.8% | |
| | 4,203 | | | | 6.000 | | | | 04/01/16 | | | | 4,289 | |
| | 9,191 | | | | 6.500 | | | | 05/01/16 | | | | 9,429 | |
| | 16,355 | | | | 6.500 | | | | 09/01/16 | | | | 16,897 | |
| | 22,615 | | | | 6.500 | | | | 11/01/16 | | | | 23,421 | |
| | 3,145 | | | | 7.500 | | | | 04/01/17 | | | | 3,231 | |
| | 113,040 | | | | 5.500 | | | | 02/01/18 | | | | 119,356 | |
| | 128,402 | | | | 5.000 | | | | 05/01/18 | | | | 135,131 | |
| | 11,348 | | | | 6.500 | | | | 08/01/18 | | | | 12,172 | |
| | 66,509 | | | | 7.000 | | | | 08/01/18 | | | | 70,697 | |
| | 371,962 | | | | 4.380 | | | | 06/01/21 | | | | 413,904 | |
| | 1,545 | | | | 5.000 | | | | 06/01/23 | | | | 1,652 | |
| | 51,925 | | | | 5.000 | | | | 08/01/23 | | | | 57,350 | |
| | 156,482 | | | | 5.500 | | | | 09/01/23 | | | | 170,679 | |
| | 41,297 | | | | 5.500 | | | | 10/01/23 | | | | 45,065 | |
| | 3,517 | | | | 6.000 | | | | 12/01/23 | | | | 3,982 | |
| | 11,394 | | | | 4.500 | | | | 07/01/24 | | | | 12,277 | |
| | 170,804 | | | | 4.500 | | | | 11/01/24 | | | | 184,348 | |
| | 72,138 | | | | 4.500 | | | | 12/01/24 | | | | 77,867 | |
| | 73 | | | | 7.000 | | | | 07/01/25 | | | | 84 | |
| | 327 | | | | 7.000 | | | | 11/01/25 | | | | 351 | |
| | 19,197 | | | | 9.000 | | | | 11/01/25 | | | | 22,866 | |
| | 61,374 | | | | 7.000 | | | | 08/01/26 | | | | 69,987 | |
| | 722 | | | | 7.000 | | | | 08/01/27 | | | | 841 | |
| | 6,847 | | | | 7.000 | | | | 09/01/27 | | | | 7,616 | |
| | 15,876 | | | | 6.000 | | | | 12/01/27 | | | | 17,980 | |
| | 197 | | | | 7.000 | | | | 01/01/28 | | | | 227 | |
| | 3,497 | | | | 6.000 | | | | 01/01/29 | | | | 3,961 | |
| | 111,104 | | | | 6.000 | | | | 02/01/29 | | | | 127,419 | |
| | 100,281 | | | | 6.000 | | | | 06/01/29 | | | | 114,995 | |
| | 35,215 | | | | 8.000 | | | | 10/01/29 | | | | 41,031 | |
| | 9,178 | | | | 7.000 | | | | 12/01/29 | | | | 10,805 | |
| | 47,791 | | | | 5.000 | | | | 01/01/30 | | | | 52,948 | |
| | 1,399 | | | | 8.500 | | | | 04/01/30 | | | | 1,718 | |
| | 2,606 | | | | 8.000 | | | | 05/01/30 | | | | 3,004 | |
| | 317 | | | | 8.500 | | | | 06/01/30 | | | | 358 | |
| | 10,088 | | | | 7.000 | | | | 05/01/32 | | | | 11,963 | |
| | 76,749 | | | | 7.000 | | | | 06/01/32 | | | | 91,579 | |
| | 99,850 | | | | 7.000 | | | | 08/01/32 | | | | 116,601 | |
| | 25,068 | | | | 8.000 | | | | 08/01/32 | | | | 31,095 | |
| | 4,813 | | | | 5.000 | | | | 08/01/33 | | | | 5,325 | |
| | 363,297 | | | | 5.000 | | | | 09/01/33 | | | | 403,101 | |
| | 4,498 | | | | 5.500 | | | | 09/01/33 | | | | 5,066 | |
| | 911,646 | | | | 5.000 | | | | 12/01/33 | | | | 1,011,529 | |
| | 1,874 | | | | 5.500 | | | | 02/01/34 | | | | 2,118 | |
| | 283 | | | | 5.500 | | | | 04/01/34 | | | | 321 | |
| | 10,700 | | | | 5.500 | | | | 12/01/34 | | | | 12,093 | |
| | 44,478 | | | | 5.000 | | | | 04/01/35 | | | | 49,457 | |
| | 82,109 | | | | 6.000 | | | | 04/01/35 | | | | 94,182 | |
| | 4,399 | | | | 6.000 | | | | 05/01/35 | | | | 4,993 | |
| | |
| | Mortgage-Backed Obligations – (continued) | |
| FNMA – (continued) | |
| $ | 2,116 | | | | 5.500 | % | | | 09/01/35 | | | $ | 2,394 | |
| | 173,456 | | | | 6.000 | | | | 10/01/35 | | | | 196,889 | |
| | 428,525 | | | | 6.000 | | | | 09/01/36 | | | | 486,415 | |
| | 142 | | | | 5.500 | | | | 02/01/37 | | | | 160 | |
| | 297,697 | | | | 6.000 | | | | 03/01/37 | | | | 337,227 | |
| | 208 | | | | 5.500 | | | | 04/01/37 | | | | 235 | |
| | 200 | | | | 5.500 | | | | 05/01/37 | | | | 225 | |
| | 294,652 | | | | 5.500 | | | | 08/01/37 | | | | 330,388 | |
| | 257,263 | | | | 6.000 | | | | 09/01/37 | | | | 291,344 | |
| | 194,191 | | | | 6.000 | | | | 02/01/38 | | | | 219,111 | |
| | 368 | | | | 5.500 | | | | 03/01/38 | | | | 414 | |
| | 319,626 | | | | 6.000 | | | | 03/01/38 | | | | 360,528 | |
| | 230 | | | | 5.500 | | | | 06/01/38 | | | | 259 | |
| | 332 | | | | 5.500 | | | | 07/01/38 | | | | 374 | |
| | 303,969 | | | | 6.000 | | | | 07/01/38 | | | | 344,253 | |
| | 386 | | | | 5.500 | | | | 08/01/38 | | | | 435 | |
| | 310 | | | | 5.500 | | | | 09/01/38 | | | | 348 | |
| | 4,411 | | | | 5.500 | | | | 10/01/38 | | | | 4,967 | |
| | 132 | | | | 5.500 | | | | 12/01/38 | | | | 148 | |
| | 180,005 | | | | 5.000 | | | | 01/01/39 | | | | 200,607 | |
| | 131,161 | | | | 7.000 | | | | 03/01/39 | | | | 150,663 | |
| | 466,089 | | | | 6.000 | | | | 05/01/39 | | | | 527,700 | |
| | 27,103 | | | | 4.500 | | | | 08/01/39 | | | | 29,792 | |
| | 252,917 | | | | 5.500 | | | | 12/01/39 | | | | 284,640 | |
| | 185,928 | | | | 6.000 | | | | 10/01/40 | | | | 210,559 | |
| | 414,587 | | | | 6.000 | | | | 05/01/41 | | | | 469,509 | |
| | 992,425 | | | | 4.500 | | | | 07/01/41 | | | | 1,078,398 | |
| | 207,084 | | | | 3.000 | | | | 08/01/42 | | | | 210,730 | |
| | 183,193 | | | | 3.000 | | | | 09/01/42 | | | | 186,549 | |
| | 62,711 | | | | 3.000 | | | | 11/01/42 | | | | 63,784 | |
| | 988,196 | | | | 3.000 | | | | 12/01/42 | | | | 1,004,856 | |
| | 789,824 | | | | 3.000 | | | | 01/01/43 | | | | 803,481 | |
| | 308,927 | | | | 3.000 | | | | 02/01/43 | | | | 314,266 | |
| | 347,603 | | | | 3.000 | | | | 03/01/43 | | | | 353,754 | |
| | 421,486 | | | | 3.000 | | | | 04/01/43 | | | | 428,944 | |
| | 295,745 | | | | 3.000 | | | | 05/01/43 | | | | 300,978 | |
| | 6,000,000 | | | | 3.500 | | | | TBA-30yr | (e) | | | 6,246,875 | |
| | 2,000,000 | | | | 4.000 | | | | TBA-30yr | (e) | | | 2,129,844 | |
| | | | | | | | | | | | | | |
| | | | | | | | | | | | | 21,249,404 | |
| | |
| GNMA – 0.8% | |
| | 3,541 | | | | 7.000 | | | | 10/15/25 | | | | 3,710 | |
| | 10,815 | | | | 7.000 | | | | 11/15/25 | | | | 11,863 | |
| | 1,537 | | | | 7.000 | | | | 02/15/26 | | | | 1,601 | |
| | 7,459 | | | | 7.000 | | | | 04/15/26 | | | | 8,475 | |
| | 3,685 | | | | 7.000 | | | | 03/15/27 | | | | 4,292 | |
| | 68,082 | | | | 7.000 | | | | 11/15/27 | | | | 78,664 | |
| | 3,179 | | | | 7.000 | | | | 01/15/28 | | | | 3,688 | |
| | 26,924 | | | | 7.000 | | | | 02/15/28 | | | | 30,043 | |
| | 6,571 | | | | 7.000 | | | | 03/15/28 | | | | 7,485 | |
| | 1,156 | | | | 7.000 | | | | 04/15/28 | | | | 1,351 | |
| | 392 | | | | 7.000 | | | | 05/15/28 | | | | 453 | |
| | 5,760 | | | | 7.000 | | | | 06/15/28 | | | | 6,702 | |
| | 12,296 | | | | 7.000 | | | | 07/15/28 | | | | 14,278 | |
| | |
| | |
| 32 | | The accompanying notes are an integral part of these financial statements. |
GOLDMAN SACHS VARIABLE INSURANCE TRUST CORE FIXED INCOME FUND
| | | | | | | | | | | | | | |
Principal
Amount | | | Interest
Rate | | | Maturity
Date | | | Value | |
| | Mortgage-Backed Obligations – (continued) | |
| GNMA – (continued) | |
| $ | 15,237 | | | | 7.000 | % | | | 09/15/28 | | | $ | 17,837 | |
| | 2,571 | | | | 7.000 | | | | 11/15/28 | | | | 3,007 | |
| | 3,917 | | | | 7.500 | | | | 11/15/30 | | | | 3,964 | |
| | 253,127 | | | | 6.000 | | | | 08/20/34 | | | | 290,226 | |
| | 329,032 | | | | 5.000 | | | | 06/15/40 | | | | 367,917 | |
| | | | | | | | | | | | | | |
| | | | | | | | | | | | | 855,556 | |
| | |
| | TOTAL FEDERAL AGENCIES | | | $ | 25,735,696 | |
| | |
| | TOTAL MORTGAGE-BACKED OBLIGATIONS | |
| | (Cost $37,768,792) | | | $ | 38,684,603 | |
| | |
| | | | | | | | | | | | | | |
| | Agency Debentures – 4.1% | |
| FHLB | |
| $ | 400,000 | | | | 1.875 | % | | | 03/13/20 | | | $ | 399,589 | |
| | 600,000 | | | | 3.000 | | | | 09/10/21 | | | | 629,675 | |
| | 600,000 | | | | 2.125 | | | | 06/09/23 | | | | 582,014 | |
| | 300,000 | | | | 3.250 | | | | 06/09/23 | | | | 317,200 | |
| | 100,000 | | | | 3.375 | | | | 12/08/23 | | | | 106,672 | |
| FHLMC | |
| | 600,000 | | | | 2.375 | | | | 01/13/22 | | | | 608,659 | |
| FNMA | |
| | 400,000 | | | | 6.250 | | | | 05/15/29 | | | | 561,645 | |
| Tennessee Valley Authority | |
| | 500,000 | | | | 3.875 | | | | 02/15/21 | | | | 551,007 | |
| | 500,000 | | | | 5.375 | | | | 04/01/56 | | | | 656,758 | |
| | |
| | TOTAL AGENCY DEBENTURES | |
| | (Cost $4,193,703) | | | $ | 4,413,219 | |
| | |
| | | | | | | | | | | | | | |
| | Asset-Backed Securities – 6.8% | |
| Collateralized Loan Obligations(a) – 5.5% | |
| Aberdeen Loan Funding Ltd. Series 2008-1A, Class A(c) | |
| $ | 720,009 | | | | 0.882 | % | | | 11/01/18 | | | $ | 714,879 | |
| Acis CLO Ltd. Series 2013-1A(c) | |
| | 1,500,000 | | | | 1.458 | | | | 04/18/24 | | | | 1,440,150 | |
| Acis CLO Ltd. Series 2013-2A(c) | |
| | 950,000 | | | | 1.146 | | | | 10/14/22 | | | | 927,770 | |
| Acis CLO Ltd. Series 2013-2A, Class A(c) | |
| | 150,000 | | | | 0.730 | | | | 10/14/22 | | | | 146,865 | |
| Black Diamond CLO Ltd. Series 2006-1A, Class AD(c) | |
| | 231,648 | | | | 0.483 | | | | 04/29/19 | | | | 227,381 | |
| Ocean Trails CLO I Series 2006-1X, Class A1 | |
| | 1,175,882 | | | | 0.480 | | | | 10/12/20 | | | | 1,169,172 | |
| OFSI Fund V Ltd. Series 2013-5A(c) | |
| | 950,000 | | | | 1.554 | | | | 04/17/25 | | | | 924,160 | |
| Red River CLO Ltd. Series 1A, Class A(c) | |
| | 305,656 | | | | 0.502 | | | | 07/27/18 | | | | 304,114 | |
| | | | | | | | | | | | | | |
| | | | | | | | | | | | | 5,854,491 | |
| | |
| | Asset-Backed Securities – (continued) | |
| Home Equity(a) – 1.0% | |
| GMAC Mortgage Corp. Loan Trust Series 2007-HE3,
Class 1A1(b) |
|
| $ | 73,715 | | | | 7.000 | % | | | 09/25/37 | | | $ | 73,790 | |
| GMAC Mortgage Corp. Loan Trust Series 2007-HE3,
Class 2A1(b) |
|
| | 117,531 | | | | 6.781 | | | | 09/25/37 | | | | 118,535 | |
| Sound Point CLO VI Ltd. Series 2014-2A(c) | |
| | 900,000 | | | | 1.453 | | | | 10/20/26 | | | | 881,820 | |
| | | | | | | | | | | | | | |
| | | | | | | | | | | | | 1,074,145 | |
| | |
| Student Loans – 0.3% | |
| Access Group, Inc. Series 2005-2, Class A3(a)(b) | |
| | 371,192 | | | | 0.413 | | | | 11/22/24 | | | | 368,710 | |
| | |
| | TOTAL ASSET-BACKED SECURITIES | |
| | (Cost $7,261,375) | | | $ | 7,297,346 | |
| | |
| | | | | | | | | | | | | | |
| | Foreign Debt Obligations – 4.1% | |
| Sovereign – 2.9% | |
| Brazilian Government International Bond | |
| $ | 340,000 | | | | 4.250 | % | | | 01/07/25 | | | $ | 340,000 | |
| Italy Buoni Poliennali Del Tesoro | |
| EUR | 120,000 | | | | 1.150 | | | | 05/15/17 | | | | 146,962 | |
| | 90,000 | | | | 4.500 | | | | 02/01/18 | | | | 121,483 | |
| | 155,074 | | | | 2.350 | | | | 09/15/19 | | | | 202,565 | |
| Mexico Government International Bond | |
| $ | 160,000 | | | | 4.750 | | | | 03/08/44 | | | | 167,600 | |
| | 10,000 | | | | 5.750 | | | | 10/12/10 | | | | 10,750 | |
| Russia Government Bond—Eurobond | |
| | 52,400 | | | | 7.500 | | | | 03/31/30 | | | | 54,391 | |
| Spain Government Bond | |
| EUR | 70,000 | | | | 2.100 | | | | 04/30/17 | | | | 87,827 | |
| | 90,000 | | | | 0.500 | | | | 10/31/17 | | | | 108,655 | |
| | 170,000 | | | | 4.500 | | | | 01/31/18 | | | | 229,871 | |
| Spain Government Inflation Linked Bond(c) | |
| | 90,176 | | | | 0.550 | | | | 11/30/19 | | | | 109,924 | |
| United Kingdom Treasury Gilt | |
| GBP | 1,000,000 | | | | 2.750 | | | | 01/22/15 | | | | 1,560,467 | |
| | | | | | | | | | | | | | |
| | | | | | | | | | | | | 3,140,495 | |
| | |
| Supranational – 1.2% | |
| Inter-American Development Bank | |
| $ | 200,000 | | | | 1.000 | | | | 02/27/18 | | | | 194,115 | |
| International Finance Corp. | |
| | 1,100,000 | | | | 0.875 | | | | 06/15/18 | | | | 1,081,140 | |
| | | | | | | | | | | | | | |
| | | | | | | | | | | | | 1,275,255 | |
| | |
| | TOTAL FOREIGN DEBT OBLIGATIONS | |
| | (Cost $4,526,615) | | | $ | 4,415,750 | |
| | |
| | | | | | | | | | | | | | |
| | |
| The accompanying notes are an integral part of these financial statements. | | 33 |
GOLDMAN SACHS VARIABLE INSURANCE TRUST CORE FIXED INCOME FUND
Schedule of Investments (continued)
December 31, 2014
| | | | | | | | | | | | | | |
Principal
Amount | | | Interest
Rate | | | Maturity
Date | | | Value | |
| | Municipal Debt Obligations – 1.4% | |
| California – 0.3% | |
| California State Various Purpose GO Bonds Series 2010 | |
| $ | 140,000 | | | | 7.950 | % | | | 03/01/36 | | | $ | 173,072 | |
| | 105,000 | | | | 7.625 | | | | 03/01/40 | | | | 161,175 | |
| | | | | | | | | | | | | | |
| | | | | | | | | | | | | 334,247 | |
| | |
| Illinois – 0.3% | |
| Illinois State GO Bonds for Build America Bonds Series 2010-5 | |
| | 250,000 | | | | 7.350 | | | | 07/01/35 | | | | 294,063 | |
| | |
| New York – 0.5% | |
| Rensselaer Polytechnic Institute Taxable Bonds Series 2010 | |
| | 475,000 | | | | 5.600 | | | | 09/01/20 | | | | 542,069 | |
| | |
| Ohio – 0.3% | |
| American Municipal Power, Inc. RB Build America Bond
Series 2010 E RMKT |
|
| | 250,000 | | | | 6.270 | | | | 02/15/50 | | | | 320,000 | |
| | |
| | TOTAL MUNICIPAL DEBT OBLIGATIONS | |
| | (Cost $1,224,958) | | | $ | 1,490,379 | |
| | |
| | | | | | | | | | | | | | |
| | Government Guarantee Obligations – 1.8% | |
| Hashemite Kingdom of Jordan Government AID Bond(f) | |
| $ | 700,000 | | | | 2.503 | % | | | 10/30/20 | | | $ | 717,200 | |
| Israel Government AID Bond(f) | |
| | 400,000 | | | | 5.500 | | | | 09/18/23 | | | | 494,971 | |
| | 200,000 | | | | 5.500 | | | | 12/04/23 | | | | 247,965 | |
| | 100,000 | | | | 5.500 | | | | 04/26/24 | | | | 124,520 | |
| Kommunalbanken AS(c)(g) | |
| | 300,000 | | | | 1.000 | | | | 09/26/17 | | | | 298,572 | |
| | |
| | TOTAL GOVERNMENT GUARANTEE OBLIGATIONS | |
| | (Cost $1,877,716) | | | $ | 1,883,228 | |
| | |
| | | | | | | | | | | | | | |
| | U.S. Treasury Obligations – 22.3% | |
| United States Treasury Bonds | |
| $ | 100,000 | | | | 2.750 | % | | | 11/15/42 | | | $ | 99,969 | |
| | 4,300,000 | | | | 3.625 | (h) | | | 08/15/43 | | | | 5,060,240 | |
| | 1,450,000 | | | | 3.750 | | | | 11/15/43 | | | | 1,744,017 | |
| | 700,000 | | | | 3.625 | | | | 02/15/44 | | | | 824,250 | |
| | 1,300,000 | | | | 3.375 | | | | 05/15/44 | | | | 1,464,476 | |
| | 600,000 | | | | 3.000 | | | | 11/15/44 | | | | 630,516 | |
| United States Treasury Inflation-Protected Securities | |
| | 629,418 | | | | 0.125 | | | | 01/15/22 | | | | 613,582 | |
| | 722,482 | | | | 0.625 | | | | 01/15/24 | | | | 727,221 | |
| | 276,470 | | | | 2.500 | | | | 01/15/29 | | | | 344,075 | |
| | 305,631 | | | | 1.375 | | | | 02/15/44 | | | | 347,417 | |
| United States Treasury Notes | |
| | 2,900,000 | | | | 0.375 | | | | 01/31/16 | | | | 2,902,117 | |
| | 1,800,000 | | | | 1.500 | | | | 01/31/19 | | | | 1,800,702 | |
| | 500,000 | | | | 1.625 | | | | 04/30/19 | | | | 501,660 | |
| | 1,800,000 | | | | 1.750 | | | | 09/30/19 | | | | 1,809,702 | |
| | 1,500,000 | | | | 1.625 | | | | 12/31/19 | | | | 1,497,780 | |
| | |
| | U.S. Treasury Obligations – (continued) | |
| United States Treasury Notes (continued) | |
| $ | 1,000,000 | | | | 2.000 | % | | | 10/31/21 | | | $ | 1,002,300 | |
| | 1,100,000 | | | | 2.125 | | | | 12/31/21 | | | | 1,110,692 | |
| United States Treasury Principal-Only STRIPS(i) | |
| | 1,900,000 | | | | 0.000 | | | | 11/15/27 | | | | 1,398,210 | |
| | |
| | TOTAL U.S. TREASURY OBLIGATIONS | |
| | (Cost $22,365,398) | | | $ | 23,878,926 | |
| | |
| | TOTAL INVESTMENTS – 106.9% | |
| | (Cost $110,748,559) | | | $ | 114,516,283 | |
| | |
| LIABILITIES IN EXCESS OF OTHER
ASSETS – (6.9)% |
| | | (7,427,149 | ) |
| | |
| | NET ASSETS – 100.0% | | | $ | 107,089,134 | |
| | |
| | |
| The percentage shown for each investment category reflects the value of investments in that category as a percentage of net assets. |
| (a) | | Variable rate security. Interest rate or distribution rate disclosed is that which is in effect at December 31, 2014. |
| (b) | | Securities with “Call” features. Maturity dates disclosed are the final maturity dates. |
| (c) | | Exempt from registration under Rule 144A of the Securities Act of 1933. Under procedures approved by the Board of Trustees, such securities have been determined to be liquid by the Investment Adviser and may be resold, normally to qualified institutional buyers in transactions exempt from registration. Total market value of Rule 144A securities amounts to $16,092,497, which represents approximately 15.0% of net assets as of December 31, 2014. |
| (d) | | Interest is based on the weighted net interest rate of the collateral. |
| (e) | | TBA (To Be Announced) Securities are purchased/sold on a forward commitment basis with an approximate principal amount and no defined maturity date. The actual principal and maturity date will be determined upon settlement when the specific mortgage pools are assigned. Total market value of TBA securities (excluding forward sales contracts, if any) amounts to $8,376,719 which represents approximately 7.8% of net assets as of December 31, 2014. |
| (f) | | Guaranteed by the United States Government. Total market value of these securities amounts to 1,584,656, which represents 1.5% of net assets as of December 31, 2014. |
| (g) | | Guaranteed by a foreign government under maturity. Total market value of these securities amounts to 298,572, which represents 0.3% of net assets as of December 31, 2014. |
| (h) | | All or a portion of security is segregated as collateral for initial margin requirements on futures transactions. |
| (i) | | Issued with a zero coupon. Income is recognized through the accretion of discount. |
| | |
| 34 | | The accompanying notes are an integral part of these financial statements. |
GOLDMAN SACHS VARIABLE INSURANCE TRUST CORE FIXED INCOME FUND
Security ratings disclosed, if any, are issued by either Standard & Poor’s, Moody’s Investor Service or Fitch and are unaudited. A brief description of the ratings is available in the Fund’s Statement of Additional Information.
| | |
| Investment Abbreviations: |
| BA | | —Banker Acceptance Rate |
| BBR | | —Bank Bill Reference Rate |
| EURIBOR | | —Euro Interbank Offered Rate |
| FHLB | | —Federal Home Loan Bank |
| FHLMC | | —Federal Home Loan Mortgage Corp. |
| FNMA | | —Federal National Mortgage Association |
| GNMA | | —Government National Mortgage Association |
| GO | | —General Obligation |
| LIBOR | | —London Interbank Offered Rate |
| RB | | —Revenue Bond |
| REMIC | | —Real Estate Mortgage Investment Conduit |
| RMKT | | —Remarketed |
| STRIPS | | —Separate Trading of Registered Interest and Principal of Securities |
| UK | | —United Kingdom |
|
| Currency Abbreviations: |
| AUD | | —Australian Dollar |
| CAD | | —Canadian Dollar |
| CHF | | —Swiss Franc |
| EUR | | —Euro |
| GBP | | —British Pound |
| JPY | | —Japanese Yen |
| NOK | | —Norwegian Krone |
| NZD | | —New Zealand Dollar |
| SEK | | —Swedish Krona |
| USD | | —United States Dollar |
| | |
| The accompanying notes are an integral part of these financial statements. | | 35 |
GOLDMAN SACHS VARIABLE INSURANCE TRUST CORE FIXED INCOME FUND
Schedule of Investments (continued)
December 31, 2014
ADDITIONAL INVESTMENT INFORMATION
FORWARD FOREIGN CURRENCY EXCHANGE CONTRACTS — At December 31, 2014, the Fund had the following forward foreign currency exchange contracts:
FORWARD FOREIGN CURRENCY EXCHANGE CONTRACTS WITH UNREALIZED GAIN
| | | | | | | | | | | | |
| Counterparty | | Contracts to
Buy/Sell | | Settlement
Date | | Current
Value | | | Unrealized
Gain | |
| Bank of America, N.A. | | JPY/USD | | 03/18/15 | | $ | 63,731 | | | $ | 731 | |
| | NZD/USD | | 03/18/15 | | | 125,095 | | | | 29 | |
| | USD/AUD | | 03/18/15 | | | 244,455 | | | | 5,586 | |
| | USD/CHF | | 03/18/15 | | | 311,034 | | | | 3,966 | |
| | USD/EUR | | 03/18/15 | | | 61,753 | | | | 1,440 | |
| | USD/JPY | | 03/18/15 | | | 250,950 | | | | 2,050 | |
| Barclays Bank PLC | | CAD/USD | | 03/18/15 | | | 252,255 | | | | 255 | |
| | GBP/EUR | | 03/18/15 | | | 251,089 | | | | 2,865 | |
| | JPY/USD | | 03/18/15 | | | 63,410 | | | | 410 | |
| | NOK/EUR | | 03/18/15 | | | 64,165 | | | | 3,622 | |
| | USD/AUD | | 03/18/15 | | | 229,882 | | | | 11,820 | |
| | USD/CAD | | 03/18/15 | | | 433,525 | | | | 8,475 | |
| | USD/JPY | | 03/18/15 | | | 125,055 | | | | 945 | |
| BNP Paribas SA | | EUR/NOK | | 03/18/15 | | | 122,296 | | | | 3,859 | |
| | GBP/EUR | | 03/18/15 | | | 501,434 | | | | 6,195 | |
| | JPY/USD | | 03/18/15 | | | 126,021 | | | | 21 | |
| | NOK/EUR | | 03/18/15 | | | 256,857 | | | | 12,265 | |
| | NZD/USD | | 03/18/15 | | | 250,965 | | | | 1,393 | |
| | USD/AUD | | 03/18/15 | | | 249,328 | | | | 1,912 | |
| | USD/CAD | | 03/18/15 | | | 247,546 | | | | 5,454 | |
| | USD/CHF | | 03/18/15 | | | 845,814 | | | | 21,870 | |
| | USD/EUR | | 03/18/15 | | | 61,754 | | | | 1,510 | |
| | USD/JPY | | 03/18/15 | | | 248,302 | | | | 3,698 | |
| Citibank, N.A. | | AUD/USD | | 03/18/15 | | | 125,070 | | | | 222 | |
| | USD/CAD | | 03/18/15 | | | 309,910 | | | | 5,090 | |
| | USD/CHF | | 03/18/15 | | | 406,204 | | | | 6,934 | |
| | USD/GBP | | 01/09/15 | | | 2,156,317 | | | | 12,177 | |
| | USD/JPY | | 03/18/15 | | | 247,667 | | | | 4,333 | |
| JPMorgan Chase Bank, N.A. | | CAD/CHF | | 03/18/15 | | | 74,435 | | | | 706 | |
| | EUR/NOK | | 03/18/15 | | | 123,507 | | | | 4,411 | |
| | NOK/EUR | | 03/18/15 | | | 61,892 | | | | 138 | |
| | USD/CAD | | 03/18/15 | | | 74,435 | | | | 1,414 | |
| | USD/CHF | | 03/18/15 | | | 415,464 | | | | 8,074 | |
| | USD/EUR | | 01/28/15 | | | 1,615,606 | | | | 33,993 | |
| | USD/EUR | | 03/18/15 | | | 370,520 | | | | 7,823 | |
| | USD/JPY | | 03/18/15 | | | 62,347 | | | | 653 | |
| | USD/NZD | | 03/18/15 | | | 193,902 | | | | 1,614 | |
| Morgan Stanley Co., Inc. | | USD/EUR | | 03/18/15 | | | 61,753 | | | | 1,985 | |
| State Street Bank | | JPY/EUR | | 03/18/15 | | | 254,682 | | | | 6,457 | |
| | USD/CAD | | 03/18/15 | | | 248,381 | | | | 4,619 | |
| | |
| 36 | | The accompanying notes are an integral part of these financial statements. |
GOLDMAN SACHS VARIABLE INSURANCE TRUST CORE FIXED INCOME FUND
ADDITIONAL INVESTMENT INFORMATION (continued)
FORWARD FOREIGN CURRENCY EXCHANGE CONTRACTS WITH UNREALIZED GAIN (continued)
| | | | | | | | | | | | |
| Counterparty | | Contracts to
Buy/Sell | | Settlement
Date | | Current
Value | | | Unrealized
Gain | |
| State Street Bank (continued) | | USD/CHF | | 03/18/15 | | | 317,791 | | | | 8,837 | |
| | USD/JPY | | 03/18/15 | | | 250,083 | | | | 1,917 | |
| | USD/NZD | | 03/18/15 | | | 184,668 | | | | 739 | |
| UBS AG | | USD/SEK | | 02/12/15 | | | 71,717 | | | | 1,598 | |
| Westpac Banking Corp. | | NZD/USD | | 03/18/15 | | | 125,482 | | | | 232 | |
| | USD/AUD | | 03/18/15 | | | 365,464 | | | | 14,611 | |
| | | USD/EUR | | 01/28/15 | | | 47,189 | | | | 1,621 | |
| TOTAL | | | | | | | | | | $ | 230,569 | |
FORWARD FOREIGN CURRENCY EXCHANGE CONTRACTS WITH UNREALIZED LOSS
| | | | | | | | | | | | |
| Counterparty | | Contracts to
Buy/Sell | | Settlement
Date | | Current
Value | | | Unrealized
Loss | |
| Bank of America, N.A. | | EUR/USD | | 03/18/15 | | $ | 122,902 | | | $ | (3,579 | ) |
| | NZD/USD | | 03/18/15 | | | 123,933 | | | | (1,165 | ) |
| | USD/NZD | | 03/18/15 | | | 561,147 | | | | (7,969 | ) |
| Barclays Bank PLC | | AUD/USD | | 03/18/15 | | | 123,446 | | | | (1,662 | ) |
| | CAD/USD | | 03/18/15 | | | 372,856 | | | | (6,144 | ) |
| | CHF/USD | | 03/18/15 | | | 249,164 | | | | (1,836 | ) |
| | EUR/GBP | | 03/18/15 | | | 248,441 | | | | (1,525 | ) |
| | EUR/USD | | 03/18/15 | | | 206,290 | | | | (4,218 | ) |
| | JPY/USD | | 03/18/15 | | | 186,699 | | | | (2,301 | ) |
| BNP Paribas SA | | EUR/JPY | | 03/18/15 | | | 185,260 | | | | (4,106 | ) |
| | EUR/NOK | | 03/18/15 | | | 124,718 | | | | (745 | ) |
| | EUR/USD | | 03/18/15 | | | 820,249 | | | | (12,425 | ) |
| | JPY/USD | | 03/18/15 | | | 373,854 | | | | (5,146 | ) |
| Citibank, N.A. | | AUD/USD | | 03/18/15 | | | 229,882 | | | | (11,961 | ) |
| | CAD/USD | | 03/18/15 | | | 335,329 | | | | (10,470 | ) |
| | EUR/NOK | | 03/18/15 | | | 61,753 | | | | (1,115 | ) |
| | EUR/USD | | 03/18/15 | | | 308,767 | | | | (7,244 | ) |
| | JPY/USD | | 03/18/15 | | | 62,413 | | | | (587 | ) |
| | NOK/EUR | | 03/18/15 | | | 60,584 | | | | (1,169 | ) |
| JPMorgan Chase Bank, N.A. | | EUR/NOK | | 03/18/15 | | | 60,543 | | | | (2,267 | ) |
| | EUR/USD | | 03/18/15 | | | 61,754 | | | | (1,129 | ) |
| | GBP/USD | | 01/09/15 | | | 109,903 | | | | (636 | ) |
| | JPY/USD | | 03/18/15 | | | 62,657 | | | | (343 | ) |
| | NOK/USD | | 03/18/15 | | | 100,620 | | | | (9,631 | ) |
| | USD/GBP | | 03/18/15 | | | 252,347 | | | | (864 | ) |
| | |
| The accompanying notes are an integral part of these financial statements. | | 37 |
GOLDMAN SACHS VARIABLE INSURANCE TRUST CORE FIXED INCOME FUND
Schedule of Investments (continued)
December 31, 2014
ADDITIONAL INVESTMENT INFORMATION (continued)
FORWARD FOREIGN CURRENCY EXCHANGE CONTRACTS WITH UNREALIZED LOSS (continued)
| | | | | | | | | | | | |
| Counterparty | | Contracts to
Buy/Sell | | Settlement
Date | | Current
Value | | | Unrealized
Loss | |
| Morgan Stanley Co., Inc. | | JPY/USD | | 03/18/15 | | | 124,203 | | | | (1,797 | ) |
| State Street Bank | | GBP/USD | | 03/18/15 | | | 255,913 | | | | (1,295 | ) |
| Westpac Banking Corp. | | CAD/USD | | 03/18/15 | | | 336,917 | | | | (10,862 | ) |
| | NZD/USD | | 03/18/15 | | | 125,482 | | | | (132 | ) |
| | | USD/NZD | | 03/18/15 | | | 305,534 | | | | (2,042 | ) |
| TOTAL | | | | | | | | | | $ | (116,365 | ) |
FORWARD SALES CONTRACTS — At December 31, 2014, the Fund had the following forward sales contracts:
| | | | | | | | | | | | | | | | | | | | |
| Description | | Interest
Rate | | | Maturity
Date(e) | | | Settlement
Date | | | Principal
Amount | | | Value | |
| FNMA (Proceeds Receivable: $2,002,500) | | | 3.000 | % | | | TBA-30yr | | | | 01/01/45 | | | | (2,000,000 | ) | | $ | (2,024,219 | ) |
FUTURES CONTRACTS — At December 31, 2014, the Fund had the following futures contracts:
| | | | | | | | | | | | |
| Type | | Number of
Contracts
Long (Short) | | Expiration Date | | Current Value | | | Unrealized
Gain (Loss) | |
| 90 Day Eurodollar | | 24 | | June 2015 | | $ | 5,973,900 | | | $ | 1,372 | |
| 90 Day Eurodollar | | 12 | | September 2015 | | | 2,980,500 | | | | 1,449 | |
| 90 Day Eurodollar | | 1 | | December 2015 | | | 247,713 | | | | 468 | |
| Euro-BTP Italian Government Bonds | | 6 | | March 2015 | | | 984,497 | | | | 12,517 | |
| Euro-Bund | | (5) | | March 2015 | | | (943,052 | ) | | | (12,448 | ) |
| Euro-OAT | | (2) | | March 2015 | | | (356,287 | ) | | | (5,415 | ) |
| U.S. Long Bond | | 12 | | March 2015 | | | 1,734,750 | | | | 27,541 | |
| U.S. Ultra Long Treasury Bonds | | (38) | | March 2015 | | | (6,277,125 | ) | | | (236,744 | ) |
| 2 Year U.S. Treasury Notes | | 58 | | March 2015 | | | 12,678,438 | | | | (18,140 | ) |
| 5 Year U.S. Treasury Notes | | 38 | | March 2015 | | | 4,519,328 | | | | 3,053 | |
| 10 Year Canadian Government Bonds | | 2 | | March 2015 | | | 238,458 | | | | 4,561 | |
| 10 Year Japanese Government Bonds | | (2) | | March 2015 | | | (2,467,691 | ) | | | (12,691 | ) |
10 Year U.S. Treasury Notes | | (85) | | March 2015 | | | (10,777,734 | ) | | | 13,336 | |
| TOTAL | | | | | | | | | | $ | (221,141 | ) |
| | |
| 38 | | The accompanying notes are an integral part of these financial statements. |
GOLDMAN SACHS VARIABLE INSURANCE TRUST CORE FIXED INCOME FUND
ADDITIONAL INVESTMENT INFORMATION (continued)
SWAP CONTRACTS — At December 31, 2014, the Fund had the following swap contracts:
CENTRALLY CLEARED INTEREST RATE SWAP CONTRACTS
| | | | | | | | | | | | | | | | | | | | |
| | | | | | | | | Rates Exchanged | | Market Value | |
Notional
Amount
(000’s) | | | Termination
Date | | | Payments
Received | | Payments
Made | | Upfront
Payments Made
(Received) | | | Unrealized
Gain (Loss) | |
| AUD | | | 180 | | | | 12/17/19 | | | 6 Month BBR | | 3.750% | | $ | (1,955 | ) | | $ | (5,562 | ) |
| NZD | | | 380 | | | | 12/17/19 | | | 4.500% | | 3 Month BBR | | | (923 | ) | | | 8,140 | |
| $ | | | 2,000 | (a) | | | 03/18/20 | | | 3 Month LIBOR | | 2.250 | | | (44,182 | ) | | | 7,820 | |
| AUD | | | 760 | (a) | | | 09/17/24 | | | 4.500 | | 6 Month BBR | | | 4,366 | | | | 17,299 | |
| GBP | | | 410 | (a) | | | 09/17/24 | | | 6 Month LIBOR | | 3.250 | | | (8,956 | ) | | | (20,261 | ) |
| EUR | | | 600 | (a) | | | 12/18/24 | | | EURIBOR | | 2.000 | | | 863 | | | | (26,567 | ) |
| GBP | | | 500 | (a) | | | 12/18/24 | | | 3.250 | | 6 Month LIBOR | | | 4,279 | | | | 30,518 | |
| AUD | | | 380 | (a) | | | 03/18/25 | | | 3.500 | | 6 Month BBR | | | 3,413 | | | | 5,662 | |
| CAD | | | 220 | (a) | | | 03/18/25 | | | 2.500 | | 3 Month BA | | | 726 | | | | 2,496 | |
| EUR | | | 200 | (a) | | | 03/18/25 | | | EURIBOR | | 1.500 | | | (11,181 | ) | | | (4,416 | ) |
| GBP | | | 530 | (a) | | | 03/18/25 | | | 6 Month LIBOR | | 3.000 | | | (65,373 | ) | | | (21,564 | ) |
| $ | | | 470 | (a) | | | 03/18/25 | | | 3.000 | | 3 Month LIBOR | | | 20,926 | | | | 6,953 | |
| GBP | | | 230 | (a) | | | 03/18/45 | | | 6 Month LIBOR | | 3.250 | | | (61,829 | ) | | | (21,114 | ) |
| JPY | | | 29,000 | (a) | | | 03/18/45 | | | 1.500 | | 6 Month LIBOR | | | (623 | ) | | | 10,477 | |
$ | | | 190 | (a) | | | 03/18/45 | | | 3.500 | | 3 Month LIBOR | | | 29,544 | | | | 1,587 | |
| TOTAL | | | | | | | | | | | | | | $ | (130,905 | ) | | $ | (8,532 | ) |
| (a) | Represents forward starting interest rate swaps whose effective dates of commencement of accruals and cash flows occur subsequent to December 31, 2014. |
| | |
| The accompanying notes are an integral part of these financial statements. | | 39 |
GOLDMAN SACHS VARIABLE INSURANCE TRUST EQUITY INDEX FUND
Schedule of Investments
December 31, 2014
| | | | | | | | |
Shares | | | Description | | Value | |
| | Common Stocks – 99.3% | |
| Automobiles & Components – 1.0% | |
| | 2,372 | | | BorgWarner, Inc. | | $ | 130,341 | |
| | 3,118 | | | Delphi Automotive PLC | | | 226,741 | |
| | 39,795 | | | Ford Motor Co. | | | 616,823 | |
| | 13,945 | | | General Motors Co. | | | 486,820 | |
| | 2,259 | | | Harley-Davidson, Inc. | | | 148,891 | |
| | 6,951 | | | Johnson Controls, Inc. | | | 336,011 | |
| | 2,723 | | | The Goodyear Tire & Rubber Co. | | | 77,796 | |
| | | | | | | | |
| | | | | | | 2,023,423 | |
| | |
| Banks – 6.1% | |
| | 108,402 | | | Bank of America Corp. | | | 1,939,312 | |
| | 7,476 | | | BB&T Corp. | | | 290,742 | |
| | 31,248 | | | Citigroup, Inc. | | | 1,690,829 | |
| | 1,834 | | | Comerica, Inc. | | | 85,905 | |
| | 8,737 | | | Fifth Third Bancorp | | | 178,016 | |
| | 5,171 | | | Hudson City Bancorp, Inc. | | | 52,331 | |
| | 8,408 | | | Huntington Bancshares, Inc. | | | 88,452 | |
| | 38,608 | | | JPMorgan Chase & Co. | | | 2,416,089 | |
| | 9,250 | | | KeyCorp | | | 128,575 | |
| | 1,390 | | | M&T Bank Corp. | | | 174,612 | |
| | 3,438 | | | People’s United Financial, Inc. | | | 52,189 | |
| | 14,538 | | | Regions Financial Corp. | | | 153,521 | |
| | 5,325 | | | SunTrust Banks, Inc. | | | 223,117 | |
| | 5,474 | | | The PNC Financial Services Group, Inc. | | | 499,393 | |
| | 18,540 | | | U.S. Bancorp | | | 833,373 | |
| | 48,762 | | | Wells Fargo & Co. | | | 2,673,133 | |
| | 2,089 | | | Zions Bancorporation | | | 59,557 | |
| | | | | | | | |
| | | | | | | 11,539,146 | |
| | |
| Capital Goods – 7.5% | |
| | 6,609 | | | 3M Co. | | | 1,085,991 | |
| | 1,011 | | | Allegion PLC | | | 56,070 | |
| | 2,582 | | | AMETEK, Inc. | | | 135,891 | |
| | 6,284 | | | Caterpillar, Inc. | | | 575,175 | |
| | 1,764 | | | Cummins, Inc. | | | 254,316 | |
| | 6,288 | | | Danaher Corp. | | | 538,945 | |
| | 3,747 | | | Deere & Co. | | | 331,497 | |
| | 1,715 | | | Dover Corp. | | | 123,000 | |
| | 4,969 | | | Eaton Corp. PLC | | | 337,693 | |
| | 7,232 | | | Emerson Electric Co. | | | 446,431 | |
| | 2,806 | | | Fastenal Co. | | | 133,453 | |
| | 1,405 | | | Flowserve Corp. | | | 84,061 | |
| | 1,679 | | | Fluor Corp. | | | 101,798 | |
| | 3,235 | | | General Dynamics Corp. | | | 445,201 | |
| | 103,977 | | | General Electric Co. | | | 2,627,499 | |
| | 8,050 | | | Honeywell International, Inc. | | | 804,356 | |
| | 3,689 | | | Illinois Tool Works, Inc. | | | 349,348 | |
| | 2,708 | | | Ingersoll-Rand PLC | | | 171,660 | |
| | 1,438 | | | Jacobs Engineering Group, Inc.* | | | 64,264 | |
| | 996 | | | Joy Global, Inc. | | | 46,334 | |
| | 883 | | | L-3 Communications Holdings, Inc. | | | 111,444 | |
| | 2,797 | | | Lockheed Martin Corp. | | | 538,618 | |
| | 3,792 | | | Masco Corp. | | | 95,558 | |
| | |
| | Common Stocks – (continued) | |
| Capital Goods – (continued) | |
| | 2,047 | | | Northrop Grumman Corp. | | $ | 301,707 | |
| | 3,716 | | | PACCAR, Inc. | | | 252,725 | |
| | 1,110 | | | Pall Corp. | | | 112,343 | |
| | 1,562 | | | Parker-Hannifin Corp. | | | 201,420 | |
| | 1,889 | | | Pentair PLC | | | 125,467 | |
| | 1,476 | | | Precision Castparts Corp. | | | 355,539 | |
| | 2,198 | | | Quanta Services, Inc.* | | | 62,401 | |
| | 3,228 | | | Raytheon Co. | | | 349,173 | |
| | 1,417 | | | Rockwell Automation, Inc. | | | 157,570 | |
| | 1,404 | | | Rockwell Collins, Inc. | | | 118,610 | |
| | 1,037 | | | Roper Industries, Inc. | | | 162,135 | |
| | 604 | | | Snap-on, Inc. | | | 82,591 | |
| | 1,620 | | | Stanley Black & Decker, Inc. | | | 155,650 | |
| | 2,883 | | | Textron, Inc. | | | 121,403 | |
| | 6,834 | | | The Boeing Co. | | | 888,283 | |
| | 1,000 | | | United Rentals, Inc.* | | | 102,010 | |
| | 8,804 | | | United Technologies Corp. | | | 1,012,460 | |
| | 632 | | | W.W. Grainger, Inc. | | | 161,091 | |
| | 1,869 | | | Xylem, Inc. | | | 71,153 | |
| | | | | | | | |
| | | | | | | 14,252,334 | |
| | |
| Commercial & Professional Services – 0.6% | |
| | 1,032 | | | Cintas Corp. | | | 80,950 | |
| | 1,243 | | | Equifax, Inc. | | | 100,521 | |
| | 3,149 | | | Nielsen NV | | | 140,855 | |
| | 1,965 | | | Pitney Bowes, Inc. | | | 47,887 | |
| | 2,623 | | | Republic Services, Inc. | | | 105,576 | |
| | 1,395 | | | Robert Half International, Inc. | | | 81,440 | |
| | 812 | | | Stericycle, Inc.* | | | 106,437 | |
| | 1,895 | | | The ADT Corp. | | | 68,656 | |
| | 389 | | | The Dun & Bradstreet Corp. | | | 47,054 | |
| | 4,290 | | | Tyco International PLC | | | 188,159 | |
| | 4,422 | | | Waste Management, Inc. | | | 226,937 | |
| | | | | | | | |
| | | | | | | 1,194,472 | |
| | |
| Consumer Durables & Apparel – 1.4% | |
| | 2,810 | | | Coach, Inc. | | | 105,543 | |
| | 3,216 | | | D.R. Horton, Inc. | | | 81,333 | |
| | 439 | | | Fossil Group, Inc.* | | | 48,615 | |
| | 1,234 | | | Garmin Ltd. | | | 65,192 | |
| | 722 | | | Harman International Industries, Inc. | | | 77,045 | |
| | 1,159 | | | Hasbro, Inc. | | | 63,733 | |
| | 1,467 | | | Leggett & Platt, Inc. | | | 62,509 | |
| | 1,923 | | | Lennar Corp. Class A | | | 86,170 | |
| | 3,472 | | | Mattel, Inc. | | | 107,441 | |
| | 2,155 | | | Michael Kors Holdings Ltd.* | | | 161,840 | |
| | 654 | | | Mohawk Industries, Inc.* | | | 101,605 | |
| | 2,833 | | | Newell Rubbermaid, Inc. | | | 107,909 | |
| | 7,262 | | | NIKE, Inc. Class B | | | 698,241 | |
| | 3,406 | | | PulteGroup, Inc. | | | 73,093 | |
| | 841 | | | PVH Corp. | | | 107,791 | |
| | 642 | | | Ralph Lauren Corp. | | | 118,873 | |
| | 1,761 | | | Under Armour, Inc. Class A* | | | 119,572 | |
| | |
| | |
| 40 | | The accompanying notes are an integral part of these financial statements. |
GOLDMAN SACHS VARIABLE INSURANCE TRUST EQUITY INDEX FUND
��
| | | | | | | | |
Shares | | | Description | | Value | |
| | Common Stocks – (continued) | |
| Consumer Durables & Apparel – (continued) | |
| | 3,542 | | | VF Corp. | | $ | 265,296 | |
| | 805 | | | Whirlpool Corp. | | | 155,961 | |
| | | | | | | | |
| | | | | | | 2,607,762 | |
| | |
| Consumer Services – 1.7% | |
| | 4,658 | | | Carnival Corp. | | | 211,147 | |
| | 321 | | | Chipotle Mexican Grill, Inc.* | | | 219,728 | |
| | 1,349 | | | Darden Restaurants, Inc. | | | 79,092 | |
| | 2,865 | | | H&R Block, Inc. | | | 96,493 | |
| | 2,228 | | | Marriott International, Inc. Class A | | | 173,851 | |
| | 10,106 | | | McDonald’s Corp. | | | 946,932 | |
| | 1,700 | | | Royal Caribbean Cruises Ltd. | | | 140,131 | |
| | 7,721 | | | Starbucks Corp. | | | 633,508 | |
| | 1,838 | | | Starwood Hotels & Resorts Worldwide, Inc. | | | 149,007 | |
| | 1,297 | | | Wyndham Worldwide Corp. | | | 111,231 | |
| | 851 | | | Wynn Resorts Ltd. | | | 126,595 | |
| | 4,523 | | | Yum! Brands, Inc. | | | 329,500 | |
| | | | | | | | |
| | | | | | | 3,217,215 | |
| | |
| Diversified Financials – 5.3% | |
| | 567 | | | Affiliated Managers Group, Inc.* | | | 120,340 | |
| | 9,171 | | | American Express Co. | | | 853,270 | |
| | 1,920 | | | Ameriprise Financial, Inc. | | | 253,920 | |
| | 18,837 | | | Berkshire Hathaway, Inc. Class B* | | | 2,828,376 | |
| | 1,311 | | | BlackRock, Inc. | | | 468,761 | |
| | 5,787 | | | Capital One Financial Corp. | | | 477,717 | |
| | 3,272 | | | CME Group, Inc. | | | 290,063 | |
| | 4,646 | | | Discover Financial Services | | | 304,266 | |
| | 3,134 | | | E*TRADE Financial Corp.* | | | 76,015 | |
| | 4,003 | | | Franklin Resources, Inc. | | | 221,646 | |
| | 1,152 | | | Intercontinental Exchange, Inc. | | | 252,622 | |
| | 4,495 | | | Invesco Ltd. | | | 177,642 | |
| | 1,043 | | | Legg Mason, Inc. | | | 55,665 | |
| | 3,210 | | | Leucadia National Corp. | | | 71,968 | |
| | 2,816 | | | McGraw Hill Financial, Inc. | | | 250,568 | |
| | 1,918 | | | Moody’s Corp. | | | 183,764 | |
| | 15,714 | | | Morgan Stanley | | | 609,703 | |
| | 4,077 | | | Navient Corp. | | | 88,104 | |
| | 2,344 | | | Northern Trust Corp. | | | 157,986 | |
| | 4,326 | | | State Street Corp. | | | 339,591 | |
| | 2,649 | | | T. Rowe Price Group, Inc. | | | 227,443 | |
| | 11,690 | | | The Bank of New York Mellon Corp. | | | 474,263 | |
| | 11,990 | | | The Charles Schwab Corp. | | | 361,978 | |
| | 4,174 | | | The Goldman Sachs Group, Inc.(a) | | | 809,046 | |
| | 1,204 | | | The NASDAQ OMX Group, Inc. | | | 57,744 | |
| | | | | | | | |
| | | | | | | 10,012,461 | |
| | |
| Energy – 8.4% | |
| | 5,280 | | | Anadarko Petroleum Corp. | | | 435,600 | |
| | 3,897 | | | Apache Corp. | | | 244,225 | |
| | 4,528 | | | Baker Hughes, Inc. | | | 253,885 | |
| | 4,417 | | | Cabot Oil & Gas Corp. | | | 130,787 | |
| | 2,121 | | | Cameron International Corp.* | | | 105,944 | |
| | |
| | Common Stocks – (continued) | |
| Energy – (continued) | |
| | 5,492 | | | Chesapeake Energy Corp. | | $ | 107,478 | |
| | 19,577 | | | Chevron Corp. | | | 2,196,148 | |
| | 935 | | | Cimarex Energy Co. | | | 99,110 | |
| | 12,649 | | | ConocoPhillips | | | 873,540 | |
| | 2,339 | | | CONSOL Energy, Inc. | | | 79,082 | |
| | 3,836 | | | Denbury Resources, Inc. | | | 31,187 | |
| | 4,009 | | | Devon Energy Corp. | | | 245,391 | |
| | 746 | | | Diamond Offshore Drilling, Inc. | | | 27,386 | |
| | 2,513 | | | Ensco PLC Class A | | | 75,264 | |
| | 5,643 | | | EOG Resources, Inc. | | | 519,551 | |
| | 1,612 | | | EQT Corp. | | | 122,028 | |
| | 43,755 | | | Exxon Mobil Corp. | | | 4,045,150 | |
| | 2,437 | | | FMC Technologies, Inc.* | | | 114,149 | |
| | 8,874 | | | Halliburton Co. | | | 349,014 | |
| | 1,076 | | | Helmerich & Payne, Inc. | | | 72,544 | |
| | 2,625 | | | Hess Corp. | | | 193,777 | |
| | 17,653 | | | Kinder Morgan, Inc. | | | 746,898 | |
| | 7,004 | | | Marathon Oil Corp. | | | 198,143 | |
| | 2,866 | | | Marathon Petroleum Corp. | | | 258,685 | |
| | 1,708 | | | Murphy Oil Corp. | | | 86,288 | |
| | 2,846 | | | Nabors Industries Ltd. | | | 36,941 | |
| | 4,499 | | | National Oilwell Varco, Inc. | | | 294,819 | |
| | 1,404 | | | Newfield Exploration Co.* | | | 38,076 | |
| | 2,712 | | | Noble Corp. PLC | | | 44,938 | |
| | 3,762 | | | Noble Energy, Inc. | | | 178,432 | |
| | 7,983 | | | Occidental Petroleum Corp. | | | 643,510 | |
| | 2,183 | | | ONEOK, Inc. | | | 108,692 | |
| | 5,773 | | | Phillips 66 | | | 413,924 | |
| | 1,502 | | | Pioneer Natural Resources Co. | | | 223,573 | |
| | 1,816 | | | QEP Resources, Inc. | | | 36,720 | |
| | 1,777 | | | Range Resources Corp. | | | 94,981 | |
| | 13,350 | | | Schlumberger Ltd. | | | 1,140,224 | |
| | 3,671 | | | Southwestern Energy Co.* | | | 100,182 | |
| | 6,978 | | | Spectra Energy Corp. | | | 253,301 | |
| | 1,267 | | | Tesoro Corp. | | | 94,201 | |
| | 7,006 | | | The Williams Companies, Inc. | | | 314,850 | |
| | 3,483 | | | Transocean Ltd. | | | 63,843 | |
| | 5,332 | | | Valero Energy Corp. | | | 263,934 | |
| | | | | | | | |
| | | | | | | 15,956,395 | |
| | |
| Food & Staples Retailing – 2.5% | |
| | 4,548 | | | Costco Wholesale Corp. | | | 644,679 | |
| | 11,824 | | | CVS Health Corp. | | | 1,138,769 | |
| | 2,304 | | | Safeway, Inc. | | | 80,917 | |
| | 6,086 | | | Sysco Corp. | | | 241,553 | |
| | 5,050 | | | The Kroger Co. | | | 324,261 | |
| | 9,031 | | | Walgreens Boots Alliance, Inc. | | | 688,162 | |
| | 16,341 | | | Wal-Mart Stores, Inc. | | | 1,403,365 | |
| | 3,722 | | | Whole Foods Market, Inc. | | | 187,663 | |
| | | | | | | | |
| | | | | | | 4,709,369 | |
| | |
| Food, Beverage & Tobacco – 5.2% | |
| | 20,421 | | | Altria Group, Inc. | | | 1,006,143 | |
| | 6,603 | | | Archer-Daniels-Midland Co. | | | 343,356 | |
| | |
| | |
| The accompanying notes are an integral part of these financial statements. | | 41 |
GOLDMAN SACHS VARIABLE INSURANCE TRUST EQUITY INDEX FUND
Schedule of Investments (continued)
December 31, 2014
| | | | | | | | |
Shares | | | Description | | Value | |
| | Common Stocks – (continued) | |
| Food, Beverage & Tobacco – (continued) | |
| | 1,588 | | | Brown-Forman Corp. Class B | | $ | 139,490 | |
| | 1,875 | | | Campbell Soup Co. | | | 82,500 | |
| | 2,314 | | | Coca-Cola Enterprises, Inc. | | | 102,325 | |
| | 4,407 | | | ConAgra Foods, Inc. | | | 159,886 | |
| | 1,730 | | | Constellation Brands, Inc. Class A* | | | 169,834 | |
| | 1,985 | | | Dr. Pepper Snapple Group, Inc. | | | 142,285 | |
| | 6,253 | | | General Mills, Inc. | | | 333,472 | |
| | 1,364 | | | Hormel Foods Corp. | | | 71,064 | |
| | 2,667 | | | Kellogg Co. | | | 174,528 | |
| | 1,257 | | | Keurig Green Mountain, Inc. | | | 166,421 | |
| | 6,044 | | | Kraft Foods Group, Inc. | | | 378,717 | |
| | 3,738 | | | Lorillard, Inc. | | | 235,270 | |
| | 1,324 | | | McCormick & Co., Inc. | | | 98,373 | |
| | 2,093 | | | Mead Johnson Nutrition Co. | | | 210,430 | |
| | 1,654 | | | Molson Coors Brewing Co. Class B | | | 123,256 | |
| | 17,442 | | | Mondelez International, Inc. Class A | | | 633,581 | |
| | 1,480 | | | Monster Beverage Corp.* | | | 160,358 | |
| | 15,496 | | | PepsiCo, Inc. | | | 1,465,302 | |
| | 16,031 | | | Philip Morris International, Inc. | | | 1,305,725 | |
| | 3,213 | | | Reynolds American, Inc. | | | 206,500 | |
| | 40,684 | | | The Coca-Cola Co. | | | 1,717,678 | |
| | 1,567 | | | The Hershey Co. | | | 162,858 | |
| | 1,090 | | | The J.M. Smucker Co. | | | 110,068 | |
| | 3,019 | | | Tyson Foods, Inc. Class A | | | 121,032 | |
| | | | | | | | |
| | | | | | | 9,820,452 | |
| | |
| Health Care Equipment & Services – 4.6% | |
| | 15,531 | | | Abbott Laboratories | | | 699,206 | |
| | 3,604 | | | Aetna, Inc. | | | 320,143 | |
| | 2,112 | | | AmerisourceBergen Corp. | | | 190,418 | |
| | 2,749 | | | Anthem, Inc. | | | 345,467 | |
| | 5,631 | | | Baxter International, Inc. | | | 412,696 | |
| | 1,998 | | | Becton, Dickinson and Co. | | | 278,042 | |
| | 13,853 | | | Boston Scientific Corp.* | | | 183,552 | |
| | 776 | | | C. R. Bard, Inc. | | | 129,297 | |
| | 3,441 | | | Cardinal Health, Inc. | | | 277,792 | |
| | 2,108 | | | CareFusion Corp.* | | | 125,089 | |
| | 3,127 | | | Cerner Corp.* | | | 202,192 | |
| | 2,682 | | | Cigna Corp. | | | 276,005 | |
| | 4,680 | | | Covidien PLC | | | 478,670 | |
| | 1,780 | | | DaVita HealthCare Partners, Inc.* | | | 134,817 | |
| | 1,506 | | | DENTSPLY International, Inc. | | | 80,225 | |
| | 1,038 | | | Edwards Lifesciences Corp.* | | | 132,220 | |
| | 7,612 | | | Express Scripts Holding Co.* | | | 644,508 | |
| | 1,604 | | | Humana, Inc. | | | 230,382 | |
| | 371 | | | Intuitive Surgical, Inc.* | | | 196,237 | |
| | 868 | | | Laboratory Corp. of America Holdings* | | | 93,657 | |
| | 2,401 | | | McKesson Corp. | | | 498,400 | |
| | 10,119 | | | Medtronic, Inc. | | | 730,592 | |
| | 908 | | | Patterson Companies, Inc. | | | 43,675 | |
| | 1,529 | | | Quest Diagnostics, Inc. | | | 102,535 | |
| | 2,985 | | | St. Jude Medical, Inc. | | | 194,114 | |
| | 3,057 | | | Stryker Corp. | | | 288,367 | |
| | |
| | Common Stocks – (continued) | |
| Health Care Equipment & Services – (continued) | |
| | 1,062 | | | Tenet Healthcare Corp.* | | $ | 53,811 | |
| | 9,896 | | | UnitedHealth Group, Inc. | | | 1,000,387 | |
| | 939 | | | Universal Health Services, Inc. Class B | | | 104,473 | |
| | 996 | | | Varian Medical Systems, Inc.* | | | 86,164 | |
| | 1,777 | | | Zimmer Holdings, Inc. | | | 201,547 | |
| | | | | | | | |
| | | | | | | 8,734,680 | |
| | |
| Household & Personal Products – 2.1% | |
| | 4,817 | | | Avon Products, Inc. | | | 45,232 | |
| | 8,907 | | | Colgate-Palmolive Co. | | | 616,275 | |
| | 3,829 | | | Kimberly-Clark Corp. | | | 442,403 | |
| | 1,345 | | | The Clorox Co. | | | 140,162 | |
| | 2,366 | | | The Estee Lauder Companies, Inc. Class A | | | 180,289 | |
| | 27,923 | | | The Procter & Gamble Co. | | | 2,543,506 | |
| | | | | | | | |
| | | | | | | 3,967,867 | |
| | |
| Insurance – 2.8% | |
| | 3,434 | | | ACE Ltd. | | | 394,498 | |
| | 4,707 | | | Aflac, Inc. | | | 287,551 | |
| | 14,543 | | | American International Group, Inc. | | | 814,553 | |
| | 2,925 | | | Aon PLC | | | 277,378 | |
| | 710 | | | Assurant, Inc. | | | 48,585 | |
| | 1,516 | | | Cincinnati Financial Corp. | | | 78,574 | |
| | 5,397 | | | Genworth Financial, Inc. Class A* | | | 45,874 | |
| | 2,690 | | | Lincoln National Corp. | | | 155,132 | |
| | 3,159 | | | Loews Corp. | | | 132,741 | |
| | 5,639 | | | Marsh & McLennan Companies, Inc. | | | 322,776 | |
| | 11,685 | | | MetLife, Inc. | | | 632,042 | |
| | 2,854 | | | Principal Financial Group, Inc. | | | 148,237 | |
| | 4,705 | | | Prudential Financial, Inc. | | | 425,614 | |
| | 4,312 | | | The Allstate Corp. | | | 302,918 | |
| | 2,404 | | | The Chubb Corp. | | | 248,742 | |
| | 4,417 | | | The Hartford Financial Services Group, Inc. | | | 184,145 | |
| | 5,544 | | | The Progressive Corp. | | | 149,632 | |
| | 3,400 | | | The Travelers Companies, Inc. | | | 359,890 | |
| | 1,321 | | | Torchmark Corp. | | | 71,559 | |
| | 2,620 | | | Unum Group | | | 91,386 | |
| | 2,637 | | | XL Group PLC | | | 90,634 | |
| | | | | | | | |
| | | | | | | 5,262,461 | |
| | |
| Materials – 3.1% | |
| | 1,997 | | | Air Products & Chemicals, Inc. | | | 288,027 | |
| | 631 | | | Airgas, Inc. | | | 72,679 | |
| | 12,283 | | | Alcoa, Inc. | | | 193,949 | |
| | 1,171 | | | Allegheny Technologies, Inc. | | | 40,716 | |
| | 925 | | | Avery Dennison Corp. | | | 47,989 | |
| | 1,429 | | | Ball Corp. | | | 97,415 | |
| | 516 | | | CF Industries Holdings, Inc. | | | 140,631 | |
| | 9,396 | | | E.I. du Pont de Nemours & Co. | | | 694,740 | |
| | 1,528 | | | Eastman Chemical Co. | | | 115,914 | |
| | 2,745 | | | Ecolab, Inc. | | | 286,907 | |
| | |
| | |
| 42 | | The accompanying notes are an integral part of these financial statements. |
GOLDMAN SACHS VARIABLE INSURANCE TRUST EQUITY INDEX FUND
| | | | | | | | |
Shares | | | Description | | Value | |
| | Common Stocks – (continued) | |
| Materials – (continued) | |
| | 1,388 | | | FMC Corp. | | $ | 79,158 | |
| | 10,795 | | | Freeport-McMoRan, Inc. | | | 252,171 | |
| | 823 | | | International Flavors & Fragrances, Inc. | | | 83,419 | |
| | 4,356 | | | International Paper Co. | | | 233,395 | |
| | 4,334 | | | LyondellBasell Industries NV Class A | | | 344,076 | |
| | 666 | | | Martin Marietta Materials, Inc. | | | 73,473 | |
| | 1,777 | | | MeadWestvaco Corp. | | | 78,881 | |
| | 4,996 | | | Monsanto Co. | | | 596,872 | |
| | 5,334 | | | Newmont Mining Corp. | | | 100,813 | |
| | 3,339 | | | Nucor Corp. | | | 163,778 | |
| | 1,826 | | | Owens-Illinois, Inc.* | | | 49,284 | |
| | 1,407 | | | PPG Industries, Inc. | | | 325,228 | |
| | 3,022 | | | Praxair, Inc. | | | 391,530 | |
| | 2,008 | | | Sealed Air Corp. | | | 85,199 | |
| | 1,244 | | | Sigma-Aldrich Corp. | | | 170,764 | |
| | 11,462 | | | The Dow Chemical Co. | | | 522,782 | |
| | 3,303 | | | The Mosaic Co. | | | 150,782 | |
| | 833 | | | The Sherwin-Williams Co. | | | 219,112 | |
| | 1,366 | | | Vulcan Materials Co. | | | 89,787 | |
| | | | | | | | |
| | | | | | | 5,989,471 | |
| | |
| Media – 3.5% | |
| | 2,316 | | | Cablevision Systems Corp. Class A | | | 47,802 | |
| | 4,879 | | | CBS Corp. Class B | | | 270,004 | |
| | 26,591 | | | Comcast Corp. Class A | | | 1,542,544 | |
| | 5,152 | | | DIRECTV* | | | 446,678 | |
| | 1,590 | | | Discovery Communications, Inc. Class A* | | | 54,775 | |
| | 2,890 | | | Discovery Communications, Inc. Class C* | | | 97,451 | |
| | 2,271 | | | Gannett Co., Inc. | | | 72,513 | |
| | 5,189 | | | News Corp. Class A* | | | 81,415 | |
| | 2,591 | | | Omnicom Group, Inc. | | | 200,725 | |
| | 1,012 | | | Scripps Networks Interactive, Inc. Class A | | | 76,173 | |
| | 4,476 | | | The Interpublic Group of Companies, Inc. | | | 92,967 | |
| | 16,146 | | | The Walt Disney Co. | | | 1,520,792 | |
| | 2,885 | | | Time Warner Cable, Inc. | | | 438,693 | |
| | 8,637 | | | Time Warner, Inc. | | | 737,773 | |
| | 19,253 | | | Twenty-First Century Fox, Inc. Class A | | | 739,411 | |
| | 3,783 | | | Viacom, Inc. Class B | | | 284,671 | |
| | | | | | | | |
| | | | | | | 6,704,387 | |
| | |
| Pharmaceuticals, Biotechnology & Life Sciences – 9.5% | |
| | 16,391 | | | AbbVie, Inc. | | | 1,072,627 | |
| | 2,730 | | | Actavis PLC* | | | 702,729 | |
| | 3,527 | | | Agilent Technologies, Inc. | | | 144,395 | |
| | 2,047 | | | Alexion Pharmaceuticals, Inc.* | | | 378,756 | |
| | 3,084 | | | Allergan, Inc. | | | 655,628 | |
| | 7,834 | | | Amgen, Inc. | | | 1,247,878 | |
| | 2,430 | | | Biogen Idec, Inc.* | | | 824,864 | |
| | |
| | Common Stocks – (continued) | |
| Pharmaceuticals, Biotechnology & Life Sciences – (continued) | |
| | 17,069 | | | Bristol-Myers Squibb Co. | | $ | 1,007,583 | |
| | 8,230 | | | Celgene Corp.* | | | 920,608 | |
| | 10,191 | | | Eli Lilly & Co. | | | 703,077 | |
| | 15,580 | | | Gilead Sciences, Inc.* | | | 1,468,571 | |
| | 1,753 | | | Hospira, Inc.* | | | 107,371 | |
| | 28,916 | | | Johnson & Johnson | | | 3,023,746 | |
| | 1,200 | | | Mallinckrodt PLC* | | | 118,836 | |
| | 29,429 | | | Merck & Co., Inc. | | | 1,671,273 | |
| | 3,928 | | | Mylan, Inc.* | | | 221,421 | |
| | 1,238 | | | PerkinElmer, Inc. | | | 54,138 | |
| | 1,383 | | | Perrigo Co. PLC | | | 231,182 | |
| | 65,059 | | | Pfizer, Inc. | | | 2,026,588 | |
| | 756 | | | Regeneron Pharmaceuticals, Inc.* | | | 310,149 | |
| | 4,115 | | | Thermo Fisher Scientific, Inc. | | | 515,568 | |
| | 2,492 | | | Vertex Pharmaceuticals, Inc.* | | | 296,050 | |
| | 887 | | | Waters Corp.* | | | 99,983 | |
| | 5,269 | | | Zoetis, Inc. | | | 226,725 | |
| | | | | | | | |
| | | | | | | 18,029,746 | |
| | |
| Real Estate – 2.4% | |
| | 4,101 | | | American Tower Corp. (REIT) | | | 405,384 | |
| | 1,564 | | | Apartment Investment & Management Co. Class A (REIT) | | | 58,103 | |
| | 1,349 | | | AvalonBay Communities, Inc. (REIT) | | | 220,413 | |
| | 1,585 | | | Boston Properties, Inc. (REIT) | | | 203,974 | |
| | 2,891 | | | CBRE Group, Inc. Class A* | | | 99,017 | |
| | 3,473 | | | Crown Castle International Corp. (REIT) | | | 273,325 | |
| | 3,761 | | | Equity Residential (REIT) | | | 270,190 | |
| | 664 | | | Essex Property Trust, Inc. (REIT) | | | 137,182 | |
| | 6,503 | | | General Growth Properties, Inc. (REIT) | | | 182,929 | |
| | 4,767 | | | HCP, Inc. (REIT) | | | 209,891 | |
| | 3,397 | | | Health Care REIT, Inc. (REIT) | | | 257,051 | |
| | 7,864 | | | Host Hotels & Resorts, Inc. (REIT) | | | 186,927 | |
| | 1,891 | | | Iron Mountain, Inc. (REIT) | | | 73,106 | |
| | 4,214 | | | Kimco Realty Corp. (REIT) | | | 105,940 | |
| | 1,784 | | | Plum Creek Timber Co., Inc. (REIT) | | | 76,337 | |
| | 5,118 | | | Prologis, Inc. (REIT) | | | 220,228 | |
| | 1,503 | | | Public Storage (REIT) | | | 277,830 | |
| | 3,193 | | | Simon Property Group, Inc. (REIT) | | | 581,477 | |
| | 1,424 | | | The Macerich Co. (REIT) | | | 118,776 | |
| | 3,033 | | | Ventas, Inc. (REIT) | | | 217,466 | |
| | 1,833 | | | Vornado Realty Trust (REIT) | | | 215,763 | |
| | 5,216 | | | Weyerhaeuser Co. (REIT) | | | 187,202 | |
| | | | | | | | |
| | | | | | | 4,578,511 | |
| | |
| Retailing – 4.4% | |
| | 3,920 | | | Amazon.com, Inc.* | | | 1,216,572 | |
| | 799 | | | AutoNation, Inc.* | | | 48,268 | |
| | 327 | | | AutoZone, Inc.* | | | 202,449 | |
| | 1,917 | | | Bed Bath & Beyond, Inc.* | | | 146,018 | |
| | 2,996 | | | Best Buy Co., Inc. | | | 116,784 | |
| | 2,243 | | | CarMax, Inc.* | | | 149,339 | |
| | 3,155 | | | Dollar General Corp.* | | | 223,059 | |
| | |
| | |
| The accompanying notes are an integral part of these financial statements. | | 43 |
GOLDMAN SACHS VARIABLE INSURANCE TRUST EQUITY INDEX FUND
Schedule of Investments (continued)
December 31, 2014
| | | | | | | | |
Shares | | | Description | | Value | |
| | Common Stocks – (continued) | |
| Retailing – (continued) | |
| | 2,097 | | | Dollar Tree, Inc.* | | $ | 147,587 | |
| | 1,060 | | | Expedia, Inc. | | | 90,482 | |
| | 981 | | | Family Dollar Stores, Inc. | | | 77,705 | |
| | 1,119 | | | GameStop Corp. Class A | | | 37,822 | |
| | 1,612 | | | Genuine Parts Co. | | | 171,791 | |
| | 2,136 | | | Kohl’s Corp. | | | 130,381 | |
| | 2,558 | | | L Brands, Inc. | | | 221,395 | |
| | 10,018 | | | Lowe’s Companies, Inc. | | | 689,238 | |
| | 3,598 | | | Macy’s, Inc. | | | 236,569 | |
| | 623 | | | Netflix, Inc.* | | | 212,823 | |
| | 1,441 | | | Nordstrom, Inc. | | | 114,401 | |
| | 1,034 | | | O’Reilly Automotive, Inc.* | | | 199,169 | |
| | 988 | | | PetSmart, Inc. | | | 80,319 | |
| | 2,161 | | | Ross Stores, Inc. | | | 203,696 | |
| | 6,712 | | | Staples, Inc. | | | 121,621 | |
| | 6,592 | | | Target Corp. | | | 500,399 | |
| | 2,844 | | | The Gap, Inc. | | | 119,761 | |
| | 13,629 | | | The Home Depot, Inc. | | | 1,430,636 | |
| | 545 | | | The Priceline Group, Inc.* | | | 621,414 | |
| | 7,178 | | | The TJX Companies, Inc. | | | 492,267 | |
| | 1,107 | | | Tiffany & Co. | | | 118,294 | |
| | 1,413 | | | Tractor Supply Co. | | | 111,373 | |
| | 1,141 | | | TripAdvisor, Inc.* | | | 85,187 | |
| | 1,108 | | | Urban Outfitters, Inc.* | | | 38,924 | |
| | | | | | | | |
| | | | | | | 8,355,743 | |
| | |
| Semiconductors & Semiconductor Equipment – 2.4% | |
| | 3,155 | | | Altera Corp. | | | 116,546 | |
| | 3,167 | | | Analog Devices, Inc. | | | 175,832 | |
| | 12,680 | | | Applied Materials, Inc. | | | 315,986 | |
| | 2,628 | | | Avago Technologies Ltd. | | | 264,350 | |
| | 5,594 | | | Broadcom Corp. Class A | | | 242,388 | |
| | 780 | | | First Solar, Inc.* | | | 34,784 | |
| | 49,918 | | | Intel Corp. | | | 1,811,524 | |
| | 1,738 | | | KLA-Tencor Corp. | | | 122,216 | |
| | 1,673 | | | Lam Research Corp. | | | 132,736 | |
| | 2,472 | | | Linear Technology Corp. | | | 112,723 | |
| | 2,078 | | | Microchip Technology, Inc. | | | 93,739 | |
| | 11,170 | | | Micron Technology, Inc.* | | | 391,062 | |
| | 5,489 | | | NVIDIA Corp. | | | 110,054 | |
| | 10,870 | | | Texas Instruments, Inc. | | | 581,165 | |
| | 2,818 | | | Xilinx, Inc. | | | 121,991 | |
| | | | | | | | |
| | | | | | | 4,627,096 | |
| | |
| Software & Services – 10.3% | |
| | 6,483 | | | Accenture PLC Class A | | | 578,997 | |
| | 4,841 | | | Adobe Systems, Inc.* | | | 351,941 | |
| | 1,893 | | | Akamai Technologies, Inc.* | | | 119,183 | |
| | 657 | | | Alliance Data Systems Corp.* | | | 187,935 | |
| | 2,345 | | | Autodesk, Inc.* | | | 140,841 | |
| | 4,948 | | | Automatic Data Processing, Inc. | | | 412,515 | |
| | 3,267 | | | CA, Inc. | | | 99,480 | |
| | 1,709 | | | Citrix Systems, Inc.* | | | 109,034 | |
| | |
| | Common Stocks – (continued) | |
| Software & Services – (continued) | |
| | 6,316 | | | Cognizant Technology Solutions Corp. Class A* | | $ | 332,600 | |
| | 1,507 | | | Computer Sciences Corp. | | | 95,016 | |
| | 11,718 | | | eBay, Inc.* | | | 657,614 | |
| | 3,249 | | | Electronic Arts, Inc.* | | | 152,752 | |
| | 21,673 | | | Facebook, Inc. Class A* | | | 1,690,927 | |
| | 2,994 | | | Fidelity National Information Services, Inc. | | | 186,227 | |
| | 2,544 | | | Fiserv, Inc.* | | | 180,548 | |
| | 2,928 | | | Google, Inc. Class A* | | | 1,553,772 | |
| | 2,927 | | | Google, Inc. Class C* | | | 1,540,773 | |
| | 9,495 | | | International Business Machines Corp. | | | 1,523,378 | |
| | 2,948 | | | Intuit, Inc. | | | 271,776 | |
| | 10,129 | | | Mastercard, Inc. Class A | | | 872,715 | |
| | 85,173 | | | Microsoft Corp. | | | 3,956,286 | |
| | 33,507 | | | Oracle Corp. | | | 1,506,810 | |
| | 3,381 | | | Paychex, Inc. | | | 156,101 | |
| | 1,964 | | | Red Hat, Inc.* | | | 135,791 | |
| | 5,981 | | | salesforce.com inc* | | | 354,733 | |
| | 7,024 | | | Symantec Corp. | | | 180,201 | |
| | 1,580 | | | Teradata Corp.* | | | 69,014 | |
| | 5,245 | | | The Western Union Co. | | | 93,938 | |
| | 1,806 | | | Total System Services, Inc. | | | 61,332 | |
| | 1,155 | | | VeriSign, Inc.* | | | 65,835 | |
| | 5,040 | | | Visa, Inc. Class A | | | 1,321,488 | |
| | 10,893 | | | Xerox Corp. | | | 150,977 | |
| | 9,111 | | | Yahoo!, Inc.* | | | 460,196 | |
| | | | | | | | |
| | | | | | | 19,570,726 | |
| | |
| Technology Hardware & Equipment – 6.8% | |
| | 3,236 | | | Amphenol Corp. Class A | | | 174,129 | |
| | 60,619 | | | Apple, Inc. | | | 6,691,125 | |
| | 52,541 | | | Cisco Systems, Inc. | | | 1,461,428 | |
| | 13,131 | | | Corning, Inc. | | | 301,094 | |
| | 21,077 | | | EMC Corp. | | | 626,830 | |
| | 736 | | | F5 Networks, Inc.* | | | 96,022 | |
| | 1,526 | | | FLIR Systems, Inc. | | | 49,305 | |
| | 1,069 | | | Harris Corp. | | | 76,776 | |
| | 19,378 | | | Hewlett-Packard Co. | | | 777,639 | |
| | 3,989 | | | Juniper Networks, Inc. | | | 89,034 | |
| | 2,148 | | | Motorola Solutions, Inc. | | | 144,088 | |
| | 3,329 | | | NetApp, Inc. | | | 137,987 | |
| | 17,241 | | | QUALCOMM, Inc. | | | 1,281,524 | |
| | 2,247 | | | SanDisk Corp. | | | 220,161 | |
| | 3,377 | | | Seagate Technology PLC | | | 224,570 | |
| | 4,266 | | | TE Connectivity Ltd. | | | 269,825 | |
| | 2,230 | | | Western Digital Corp. | | | 246,861 | |
| | | | | | | | |
| | | | | | | 12,868,398 | |
| | |
| Telecommunication Services – 2.3% | |
| | 53,455 | | | AT&T, Inc. | | | 1,795,553 | |
| | 5,978 | | | CenturyLink, Inc. | | | 236,609 | |
| | 10,443 | | | Frontier Communications Corp. | | | 69,655 | |
| | 2,900 | | | Level 3 Communications, Inc.* | | | 143,202 | |
| | |
| | |
| 44 | | The accompanying notes are an integral part of these financial statements. |
GOLDMAN SACHS VARIABLE INSURANCE TRUST EQUITY INDEX FUND
| | | | | | | | |
Shares | | | Description | | Value | |
| | Common Stocks – (continued) | |
| Telecommunication Services – (continued) | |
| | 42,935 | | | Verizon Communications, Inc. | | $ | 2,008,499 | |
| | 6,282 | | | Windstream Holdings, Inc. | | | 51,764 | |
| | | | | | | | |
| | | | | | | 4,305,282 | |
| | |
| Transportation – 2.2% | |
| | 1,522 | | | C.H. Robinson Worldwide, Inc. | | | 113,983 | |
| | 10,385 | | | CSX Corp. | | | 376,248 | |
| | 8,722 | | | Delta Air Lines, Inc. | | | 429,035 | |
| | 2,085 | | | Expeditors International of Washington, Inc. | | | 93,012 | |
| | 2,707 | | | FedEx Corp. | | | 470,098 | |
| | 1,156 | | | Kansas City Southern | | | 141,067 | |
| | 3,202 | | | Norfolk Southern Corp. | | | 350,971 | |
| | 527 | | | Ryder System, Inc. | | | 48,932 | |
| | 7,118 | | | Southwest Airlines Co. | | | 301,234 | |
| | 9,171 | | | Union Pacific Corp. | | | 1,092,541 | |
| | 7,237 | | | United Parcel Service, Inc. Class B | | | 804,537 | |
| | | | | | | | |
| | | | | | | 4,221,658 | |
| | |
| Utilities – 3.2% | |
| | 7,046 | | | AES Corp. | | | 97,023 | |
| | 1,304 | | | AGL Resources, Inc. | | | 71,081 | |
| | 2,546 | | | Ameren Corp. | | | 117,447 | |
| | 5,103 | | | American Electric Power Co., Inc. | | | 309,854 | |
| | 4,431 | | | CenterPoint Energy, Inc. | | | 103,818 | |
| | 2,929 | | | CMS Energy Corp. | | | 101,783 | |
| | 3,043 | | | Consolidated Edison, Inc. | | | 200,868 | |
| | 5,977 | | | Dominion Resources, Inc. | | | 459,631 | |
| | 1,843 | | | DTE Energy Co. | | | 159,180 | |
| | 7,323 | | | Duke Energy Corp. | | | 611,763 | |
| | 3,335 | | | Edison International | | | 218,376 | |
| | 1,871 | | | Entergy Corp. | | | 163,675 | |
| | 8,969 | | | Exelon Corp. | | | 332,571 | |
| | 4,390 | | | FirstEnergy Corp. | | | 171,166 | |
| | 870 | | | Integrys Energy Group, Inc. | | | 67,730 | |
| | 4,485 | | | NextEra Energy, Inc. | | | 476,711 | |
| | 3,276 | | | NiSource, Inc. | | | 138,968 | |
| | 3,301 | | | Northeast Utilities | | | 176,670 | |
| | 3,457 | | | NRG Energy, Inc. | | | 93,166 | |
| | 2,730 | | | Pepco Holdings, Inc. | | | 73,519 | |
| | 4,814 | | | PG&E Corp. | | | 256,297 | |
| | 1,110 | | | Pinnacle West Capital Corp. | | | 75,824 | |
| | |
| | Common Stocks – (continued) | |
| Utilities – (continued) | |
| | 6,932 | | | PPL Corp. | | $ | 251,840 | |
| | 5,166 | | | Public Service Enterprise Group, Inc. | | | 213,924 | |
| | 1,446 | | | SCANA Corp. | | | 87,338 | |
| | 2,423 | | | Sempra Energy | | | 269,825 | |
| | 2,312 | | | TECO Energy, Inc. | | | 47,373 | |
| | 9,190 | | | The Southern Co. | | | 451,321 | |
| | 2,336 | | | Wisconsin Energy Corp. | | | 123,201 | |
| | 5,277 | | | Xcel Energy, Inc. | | | 189,550 | |
| | | | | | | | |
| | | | | | | 6,111,493 | |
| | |
| | TOTAL COMMON STOCKS | |
| | (Cost $91,128,154) | | $ | 188,660,548 | |
| | |
| | | | | | | | | | | | | | |
Principal
Amount | | | Interest
Rate | | | Maturity
Date | | | Value | |
| | U.S. Treasury Obligation(b)(c) – 0.0% | |
| United States Treasury Bill | |
| $ | 100,000 | | | | 0.000 | % | | | 01/29/15 | | | $ | 99,999 | |
| | (Cost $100,000) | | | | | |
| | |
| | TOTAL INVESTMENTS – 99.3% | |
| | (Cost $91,228,154) | | | $ | 188,760,547 | |
| | |
| OTHER ASSETS IN EXCESS OF
LIABILITIES – 0.7% |
| | | 1,248,385 | |
| | |
| | NET ASSETS – 100.0% | | | $ | 190,008,932 | |
| | |
| | |
| The percentage shown for each investment category reflects the value of investments in that category as a percentage of net assets. |
| * | | Non-income producing security. |
| (a) | | Represents an affiliated issuer. |
| (b) | | All or a portion of security is segregated as collateral for initial margin requirements on futures transactions. |
| (c) | | Issued with a zero coupon. Income is recognized through the accretion of discount. |
| | |
| Investment Abbreviation: |
| REIT | | —Real Estate Investment Trust |
ADDITIONAL INVESTMENT INFORMATION
FUTURES CONTRACTS — At December 31, 2014, the Fund had the following futures contracts:
| | | | | | | | | | | | | | |
| Type | | Number of
Contracts
Long (Short) | | | Expiration
Date | | Current
Value | | | Unrealized
Gain (Loss) | |
| S&P 500 E-mini Index | | | 13 | | | March 2015 | | $ | 1,334,060 | | | $ | 40,336 | |
| | |
| The accompanying notes are an integral part of these financial statements. | | 45 |
GOLDMAN SACHS VARIABLE INSURANCE TRUST GROWTH OPPORTUNITIES FUND
Schedule of Investments
December 31, 2014
| | | | | | | | |
| Shares | | | Description | | Value | |
| | Common Stocks – 99.2% | |
| Automobiles & Components – 2.3% | |
| | 53,429 | | | BorgWarner, Inc. | | $ | 2,935,924 | |
| | 7,712 | | | Tesla Motors, Inc.* | | | 1,715,226 | |
| | | | | | | | |
| | | | | | | 4,651,150 | |
| | |
| Banks – 3.1% | |
| | 79,265 | | | First Republic Bank | | | 4,131,292 | |
| | 237,204 | | | MGIC Investment Corp.* | | | 2,210,741 | |
| | | | | | | | |
| | | | | | | 6,342,033 | |
| | |
| Capital Goods – 11.9% | |
| | 57,913 | | | AMETEK, Inc. | | | 3,047,961 | |
| | 38,031 | | | Flowserve Corp. | | | 2,275,395 | |
| | 60,695 | | | Generac Holdings, Inc.* | | | 2,838,098 | |
| | 44,776 | | | Graco, Inc. | | | 3,590,140 | |
| | 24,461 | | | Hubbell, Inc. Class B | | | 2,613,169 | |
| | 41,756 | | | Quanta Services, Inc.* | | | 1,185,453 | |
| | 63,600 | | | Sensata Technologies Holding NV* | | | 3,333,276 | |
| | 19,832 | | | W.W. Grainger, Inc. | | | 5,054,978 | |
| | | | | | | | |
| | | | | | | 23,938,470 | |
| | |
| Commercial & Professional Services – 0.7% | |
| | 32,651 | | | Waste Connections, Inc. | | | 1,436,318 | |
| | |
| Consumer Durables & Apparel – 7.8% | |
| | 131,655 | | | Kate Spade & Co.* | | | 4,214,277 | |
| | 31,120 | | | PVH Corp. | | | 3,988,650 | |
| | 50,953 | | | Toll Brothers, Inc.* | | | 1,746,159 | |
| | 34,955 | | | Under Armour, Inc. Class A* | | | 2,373,444 | |
| | 46,644 | | | VF Corp. | | | 3,493,636 | |
| | | | | | | | |
| | | | | | | 15,816,166 | |
| | |
| Consumer Services – 2.7% | |
| | 2,974 | | | Chipotle Mexican Grill, Inc.* | | | 2,035,733 | |
| | 19,638 | | | Panera Bread Co. Class A* | | | 3,432,722 | |
| | | | | | | | |
| | | | | | | 5,468,455 | |
| | |
| Diversified Financials – 5.1% | |
| | 23,033 | | | Intercontinental Exchange, Inc. | | | 5,050,906 | |
| | 156,224 | | | Navient Corp. | | | 3,376,001 | |
| | 175,196 | | | SLM Corp. | | | 1,785,247 | |
| | | | | | | | |
| | | | | | | 10,212,154 | |
| | |
| Energy – 4.7% | |
| | 5,387 | | | Concho Resources, Inc.* | | | 537,353 | |
| | 28,676 | | | Dril-Quip, Inc.* | | | 2,200,309 | |
| | 24,710 | | | Pioneer Natural Resources Co. | | | 3,678,084 | |
| | 192,295 | | | Weatherford International PLC* | | | 2,201,778 | |
| | 25,043 | | | Whiting Petroleum Corp.* | | | 826,419 | |
| | | | | | | | |
| | | | | | | 9,443,943 | |
| | |
| Food & Staples Retailing – 2.4% | |
| | 97,213 | | | Whole Foods Market, Inc. | | | 4,901,479 | |
| | |
| Food, Beverage & Tobacco – 7.1% | |
| | 56,366 | | | Coca-Cola Enterprises, Inc. | | | 2,492,505 | |
| | 23,500 | | | Keurig Green Mountain, Inc. | | | 3,111,282 | |
| | |
| | Common Stocks – (continued) | |
| Food, Beverage & Tobacco – (continued) | |
| | 47,543 | | | McCormick & Co., Inc. | | $ | 3,532,445 | |
| | 40,446 | | | The Hain Celestial Group, Inc.* | | | 2,357,597 | |
| | 31,971 | | | TreeHouse Foods, Inc.* | | | 2,734,480 | |
| | | | | | | | |
| | | | | | | 14,228,309 | |
| | |
| Health Care Equipment & Services – 5.6% | |
| | 35,492 | | | Cerner Corp.* | | | 2,294,913 | |
| | 19,208 | | | Henry Schein, Inc.* | | | 2,615,169 | |
| | 112,435 | | | HMS Holdings Corp.* | | | 2,376,876 | |
| | 4,799 | | | Intuitive Surgical, Inc.* | | | 2,538,383 | |
| | 12,869 | | | Teleflex, Inc. | | | 1,477,619 | |
| | | | | | | | |
| | | | | | | 11,302,960 | |
| | |
| Materials – 4.7% | |
| | 25,404 | | | Airgas, Inc. | | | 2,926,033 | |
| | 28,114 | | | International Flavors & Fragrances, Inc. | | | 2,849,635 | |
| | 13,905 | | | The Sherwin-Williams Co. | | | 3,657,571 | |
| | | | | | | | |
| | | | | | | 9,433,239 | |
| | |
| Media – 1.6% | |
| | 47,264 | | | Discovery Communications, Inc. Class A* | | | 1,628,245 | |
| | 47,264 | | | Discovery Communications, Inc. Class C* | | | 1,593,742 | |
| | | | | | | | |
| | | | | | | 3,221,987 | |
| | |
| Pharmaceuticals, Biotechnology & Life Sciences – 8.7% | |
| | 41,754 | | | Agilent Technologies, Inc. | | | 1,709,409 | |
| | 22,181 | | | Alkermes PLC* | | | 1,298,919 | |
| | 51,263 | | | Cepheid, Inc.* | | | 2,775,379 | |
| | 14,230 | | | Medivation, Inc.* | | | 1,417,450 | |
| | 9,013 | | | Mettler-Toledo International, Inc.* | | | 2,726,072 | |
| | 88,405 | | | Mylan, Inc.* | | | 4,983,390 | |
| | 22,038 | | | Vertex Pharmaceuticals, Inc.* | | | 2,618,115 | |
| | | | | | | | |
| | | | | | | 17,528,734 | |
| | |
| Real Estate – 2.2% | |
| | 128,829 | | | CBRE Group, Inc. Class A* | | | 4,412,393 | |
| | |
| Retailing – 9.4% | |
| | 18,473 | | | Dollar General Corp.* | | | 1,306,041 | |
| | 74,101 | | | Five Below, Inc.* | | | 3,025,544 | |
| | 30,681 | | | L Brands, Inc. | | | 2,655,441 | |
| | 105,189 | | | LKQ Corp.* | | | 2,957,915 | |
| | 5,913 | | | Netflix, Inc.* | | | 2,019,940 | |
| | 20,319 | | | Restoration Hardware Holdings, Inc.* | | | 1,950,827 | |
| | 21,011 | | | TripAdvisor, Inc.* | | | 1,568,681 | |
| | 26,917 | | | Ulta Salon, Cosmetics & Fragrance, Inc.* | | | 3,441,069 | |
| | | | | | | | |
| | | | | | | 18,925,458 | |
| | |
| Semiconductors & Semiconductor Equipment – 0.5% | |
| | 22,983 | | | Broadcom Corp. Class A | | | 995,853 | |
| | |
| | |
| 46 | | The accompanying notes are an integral part of these financial statements. |
GOLDMAN SACHS VARIABLE INSURANCE TRUST GROWTH OPPORTUNITIES FUND
| | | | | | | | |
| Shares | | | Description | | Value | |
| | Common Stocks – (continued) | |
| Software & Services – 11.9% | |
| | 18,847 | | | Equinix, Inc. | | $ | 4,273,180 | |
| | 33,439 | | | Fidelity National Information Services, Inc. | | | 2,079,906 | |
| | 23,157 | | | FleetCor Technologies, Inc.* | | | 3,443,677 | |
| | 46,106 | | | Guidewire Software, Inc.* | | | 2,334,347 | |
| | 20,096 | | | LendingClub Corp.* | | | 508,429 | |
| | 16,837 | | | LinkedIn Corp. Class A* | | | 3,867,627 | |
| | 53,591 | | | Pandora Media, Inc.* | | | 955,528 | |
| | 39,134 | | | Red Hat, Inc.* | | | 2,705,725 | |
| | 40,745 | | | ServiceNow, Inc.* | | | 2,764,548 | |
| | 28,485 | | | Twitter, Inc.* | | | 1,021,757 | |
| | | | | | | | |
| | | | | | | 23,954,724 | |
| | |
| Technology Hardware & Equipment – 2.1% | |
| | 61,175 | | | Amphenol Corp. Class A | | | 3,291,827 | |
| | 28,676 | | | Keysight Technologies, Inc.* | | | 968,388 | |
| | | | | | | | |
| | | | | | | 4,260,215 | |
| | |
| Telecommunication Services – 2.8% | |
| | 33,869 | | | Level 3 Communications, Inc.* | | | 1,672,451 | |
| | 35,873 | | | SBA Communications Corp. Class A* | | | 3,973,294 | |
| | | | | | | | |
| | | | | | | 5,645,745 | |
| | |
| Transportation – 1.9% | |
| | 31,746 | | | Kansas City Southern | | | 3,873,964 | |
| | |
| | TOTAL INVESTMENTS – 99.2% | |
| | (Cost $152,139,637) | | $ | 199,993,749 | |
| | |
| OTHER ASSETS IN EXCESS OF
LIABILITIES – 0.8% | | | 1,559,019 | |
| | |
| | NET ASSETS – 100.0% | | $ | 201,552,768 | |
| | |
| | |
| The percentage shown for each investment category reflects the value of investments in that category as a percentage of net assets. |
| * | | Non-income producing security. |
| | |
| The accompanying notes are an integral part of these financial statements. | | 47 |
GOLDMAN SACHS VARIABLE INSURANCE TRUST HIGH QUALITY FLOATING RATE FUND
Schedule of Investments
December 31, 2014
| | | | | | | | | | | | | | |
Principal
Amount | | | Interest
Rate | | | Maturity
Date | | | Value | |
| | Corporate Obligations(a) – 0.5% | |
| Banks – 0.5% | |
| Bank of Montreal | |
| $ | 200,000 | | | | 2.850 | % | | | 06/09/15 | | | $ | 202,001 | |
| Canadian Imperial Bank of Commerce | |
| | 100,000 | | | | 2.600 | | | | 07/02/15 | | | | 101,020 | |
| The Bank of Nova Scotia | |
| | 100,000 | | | | 1.650 | | | | 10/29/15 | | | | 100,868 | |
| | |
| | TOTAL CORPORATE OBLIGATIONS | |
| | (Cost $404,390) | | | $ | 403,889 | |
| | |
| | | | | | | | | | | | | | |
| | Mortgage-Backed Obligations – 59.0% | |
| Collateralized Mortgage Obligations – 44.4% | |
| Agency Multi-Family(b) – 9.6% | |
| FHLMC Multifamily Structured Pass-Through Certificates
Series KF02, Class A1 |
|
| $ | 1,739,081 | | | | 0.550 | % | | | 07/25/20 | | | $ | 1,742,689 | |
| FHLMC Multifamily Structured Pass-Through Certificates
Series KF03, Class A |
|
| | 671,760 | | | | 0.510 | | | | 01/25/21 | | | | 671,404 | |
| FHLMC Multifamily Structured Pass-Through Certificates
Series KS02, Class A |
|
| | 1,489,117 | | | | 0.536 | | | | 08/25/23 | | | | 1,489,117 | |
| FNMA | |
| | 185,029 | | | | 2.800 | | | | 03/01/18 | | | | 191,655 | |
| | 474,506 | | | | 3.740 | | | | 05/01/18 | | | | 506,029 | |
| | 110,000 | | | | 3.840 | | | | 05/01/18 | | | | 117,755 | |
| | 400,000 | | | | 4.506 | | | | 06/01/19 | | | | 434,018 | |
| | 93,261 | | | | 3.416 | | | | 10/01/20 | | | | 98,795 | |
| | 89,131 | | | | 3.615 | | | | 12/01/20 | | | | 95,529 | |
| | 372,430 | | | | 3.763 | | | | 12/01/20 | | | | 401,975 | |
| | 185,981 | | | | 4.380 | | | | 06/01/21 | | | | 206,952 | |
| FNMA ACES Series 2013-M11, Class FA | |
| | 837,680 | | | | 0.500 | | | | 01/25/18 | | | | 838,719 | |
| FNMA ACES Series 2014-M5, Class FA | |
| | 336,055 | | | | 0.507 | | | | 01/25/17 | | | | 336,231 | |
| GNMA | |
| | 69,308 | | | | 3.950 | | | | 07/15/25 | | | | 73,561 | |
| | | | | | | | | | | | | | |
| | | | | | | | | | | | | 7,204,429 | |
| | |
| Regular Floater(b) – 34.8% | |
| Aire Valley Mortgages PLC Series 2006-1A, Class 1A(a) | |
| | 1,833,016 | | | | 0.467 | | | | 09/20/66 | | | | 1,765,595 | |
| FHLMC REMIC Series 3208, Class FD(c) | |
| | 425,385 | | | | 0.561 | | | | 08/15/36 | | | | 427,285 | |
| FHLMC REMIC Series 3208, Class FG(c) | |
| | 1,712,960 | | | | 0.561 | | | | 08/15/36 | | | | 1,720,611 | |
| FHLMC REMIC Series 3307, Class FT | |
| | 2,585,784 | | | | 0.401 | | | | 07/15/34 | | | | 2,597,061 | |
| FHLMC REMIC Series 3311, Class KF | |
| | 3,891,893 | | | | 0.501 | | | | 05/15/37 | | | | 3,904,664 | |
| FHLMC REMIC Series 3371, Class FA(c) | |
| | 1,074,044 | | | | 0.761 | | | | 09/15/37 | | | | 1,087,345 | |
| | |
| | Mortgage-Backed Obligations – (continued) | |
| Regular Floater(b) – (continued) | |
| FHLMC REMIC Series 4174, Class FB | |
| $ | 1,744,144 | | | | 0.461 | % | | | 05/15/39 | | | $ | 1,743,822 | |
| FNMA REMIC Series 2006-82, Class F | |
| | 1,196,409 | | | | 0.740 | | | | 09/25/36 | | | | 1,209,392 | |
| FNMA REMIC Series 2006-96, Class FA | |
| | 1,311,010 | | | | 0.470 | | | | 10/25/36 | | | | 1,316,730 | |
| FNMA REMIC Series 2007-85, Class FC | |
| | 1,014,826 | | | | 0.710 | | | | 09/25/37 | | | | 1,026,838 | |
| FNMA REMIC Series 2008-8, Class FB | |
| | 1,408,083 | | | | 0.990 | | | | 02/25/38 | | | | 1,425,057 | |
| FNMA REMIC Series 2012-35, Class QF | |
| | 2,362,229 | | | | 0.570 | | | | 04/25/42 | | | | 2,378,003 | |
| GNMA Series 2005-48, Class AF | |
| | 1,252,709 | | | | 0.365 | | | | 06/20/35 | | | | 1,251,569 | |
| Granite Master Issuer PLC Series 2006-3, Class A4 | |
| | 193,675 | | | | 0.245 | | | | 12/20/54 | | | | 192,011 | |
| Granite Master Issuer PLC Series 2007-1, Class 2A1 | |
| | 915,552 | | | | 0.305 | | | | 12/20/54 | | | | 908,302 | |
| Leek Finance Number Eighteen PLC Series 18X, Class A2B(c) | |
| | 142,281 | | | | 0.507 | | | | 09/21/38 | | | | 146,916 | |
| Leek Finance Number Seventeen PLC Series 17A, Class A2B(a)(c) | |
| | 62,698 | | | | 0.527 | | | | 12/21/37 | | | | 65,645 | |
| National Credit Union Administration Guaranteed Notes Trust
Series 2011-R1, Class 1A(c) |
|
| | 2,873,071 | | | | 0.605 | | | | 01/08/20 | �� | | | 2,888,670 | |
| | | | | | | | | | | | | | |
| | | | | | | | | | | | | 26,055,516 | |
| | |
| TOTAL COLLATERALIZED
MORTGAGE OBLIGATIONS |
| | $ | 33,259,945 | |
| | |
| Commercial Mortgage-Backed Securities – 3.0% | |
| Regular Floater(a)(b) – 2.7% | |
| Commercial Mortgage Pass-Through Certificates
Series 2014-KYO, Class A |
|
| $ | 900,000 | | | | 1.059 | % | | | 06/11/27 | | | $ | 898,524 | |
| JP Morgan Chase Commercial Mortgage Securities Trust
Series 2014-FBLU, Class A |
|
| | 1,100,000 | | | | 1.111 | | | | 12/15/28 | | | | 1,100,159 | |
| | | | | | | | | | | | | | |
| | | | | | | | | | | | | 1,998,683 | |
| | |
| Sequential Fixed Rate – 0.3% | |
| Banc of America Commercial Mortgage Trust Series 2006-3,
Class A4(c) |
|
| | 186,663 | | | | 5.889 | | | | 07/10/44 | | | | 195,963 | |
| | |
| TOTAL COMMERCIAL MORTGAGE-
BACKED SECURITIES |
| | $ | 2,194,646 | |
| | |
| Federal Agencies(b) – 11.6% | |
| Adjustable Rate FHLMC – 6.1% | |
| $ | 379,359 | | | | 2.252 | % | | | 05/01/35 | | | $ | 403,959 | |
| | 269,913 | | | | 2.375 | | | | 09/01/35 | | | | 289,312 | |
| | 744,563 | | | | 2.485 | | | | 12/01/36 | | | | 794,045 | |
| | 1,041,248 | | | | 2.800 | | | | 04/01/37 | | | | 1,116,082 | |
| | |
| | |
| 48 | | The accompanying notes are an integral part of these financial statements. |
GOLDMAN SACHS VARIABLE INSURANCE TRUST HIGH QUALITY FLOATING RATE FUND
| | | | | | | | | | | | | | |
Principal
Amount | | | Interest
Rate | | | Maturity
Date | | | Value | |
| | Mortgage-Backed Obligations – (continued) | |
| Adjustable Rate FHLMC – (continued) | |
| $ | 792,709 | | | | 2.405 | % | | | 01/01/38 | | | $ | 849,681 | |
| | 1,044,697 | | | | 2.406 | | | | 01/01/38 | | | | 1,136,242 | |
| | | | | | | | | | | | | | |
| | | | | | | | | | | | | 4,589,321 | |
| | |
| Adjustable Rate FNMA – 4.8% | |
| | 105,157 | | | | 1.847 | | | | 05/01/33 | | | | 110,692 | |
| | 266,194 | | | | 2.333 | | | | 05/01/35 | | | | 283,069 | |
| | 697,536 | | | | 2.554 | | | | 06/01/35 | | | | 739,170 | |
| | 945,970 | | | | 2.115 | | | | 11/01/35 | | | | 1,008,111 | |
| | 147,436 | | | | 2.388 | | | | 12/01/35 | | | | 156,953 | |
| | 556,776 | | | | 2.493 | | | | 03/01/37 | | | | 596,791 | |
| | 668,759 | | | | 2.292 | | | | 12/01/37 | | | | 716,580 | |
| | | | | | | | | | | | | | |
| | | | | | | | | | | | | 3,611,366 | |
| | |
| Adjustable Rate GNMA – 0.7% | |
| | 491,876 | | | | 1.625 | | | | 04/20/33 | | | | 508,723 | |
| | |
| | TOTAL FEDERAL AGENCIES | | | $ | 8,709,410 | |
| | |
| | TOTAL MORTGAGE-BACKED OBLIGATIONS | |
| | (Cost $43,911,428) | | | $ | 44,164,001 | |
| | |
| | | | | | | | | | | | | | |
| | Asset-Backed Securities – 34.1% | |
| Auto(b) – 1.7% | |
| Ally Master Owner Trust Series 2013-1, Class A1 | |
| $ | 1,250,000 | | | | 0.611 | % | | | 02/15/18 | | | $ | 1,250,702 | |
| | |
| Collateralized Loan Obligations(b) – 9.1% | |
| Acis CLO Ltd. Series 2013-2A, Class A(a) | |
| | 925,000 | | | | 0.730 | | | | 10/14/22 | | | | 905,665 | |
| Black Diamond CLO Ltd. Series 2006-1A, Class AD(a) | |
| | 416,967 | | | | 0.483 | | | | 04/29/19 | | | | 409,286 | |
| Brentwood CLO Corp. Series 2006-1A, Class A1A(a) | |
| | 1,037,418 | | | | 0.502 | | | | 02/01/22 | | | | 1,024,872 | |
| Brentwood CLO Corp. Series 2006-1A, Class A1B(a) | |
| | 407,557 | | | | 0.502 | | | | 02/01/22 | | | | 403,070 | |
| KKR Financial CLO Ltd. Series 2007-1A, Class A(a) | |
| | 1,237,642 | | | | 0.582 | | | | 05/15/21 | | | | 1,229,391 | |
| OZLM Funding III Ltd. Series 2013-3A, Class A1(a) | |
| | 500,000 | | | | 1.562 | | | | 01/22/25 | | | | 494,363 | |
| Westbrook CLO Ltd. Series 2006-1X, Class A1 | |
| | 468,560 | | | | 0.487 | | | | 12/20/20 | | | | 465,831 | |
| Westchester CLO Ltd. Series 2007-1X, Class A1A | |
| | 1,930,504 | | | | 0.457 | | | | 08/01/22 | | | | 1,903,662 | |
| | | | | | | | | | | | | | |
| | | | | | | | | | | | | 6,836,140 | |
| | |
| Credit Card(b) – 1.3% | |
| Bank of America Credit Card Trust Series 2014-A1, Class A | |
| | 1,000,000 | | | | 0.541 | | | | 06/15/21 | | | | 997,984 | |
| | |
| Home Equity(a) – 2.5% | |
| HLSS Servicer Advance Receivables Trust Series 2013-T5,
Class AT5 |
|
| | 650,000 | | | | 1.979 | | | | 08/15/46 | | | | 653,943 | |
| | |
| | Asset-Backed Securities – (continued) | |
| Home Equity(a) – (continued) | |
| HLSS Servicer Advance Receivables Trust Series 2014-T1,
Class AT1 |
|
| $ | 1,250,000 | | | | 1.244 | % | | | 01/17/45 | | | $ | 1,250,806 | |
| | | | | | | | | | | | | | |
| | | | | | | | | | | | | 1,904,749 | |
| | |
| Student Loans(b) – 19.5% | |
| Academic Loan Funding Trust Series 2013-1A, Class A(a)(c) | |
| | 842,979 | | | | 0.969 | | | | 12/26/44 | | | | 840,577 | |
| Access to Loans for Learning Student Loan Corp. Series 2013-I,
Class A |
|
| | 681,546 | | | | 0.969 | | | | 02/25/41 | | | | 682,059 | |
| Brazos Higher Education Authority Series 2005-2, Class A10(c) | |
| | 808,517 | | | | 0.375 | | | | 12/26/19 | | | | 805,914 | |
| Education Loan Asset-Backed Trust I Series 2013-1, Class A1(a) | |
| | 592,137 | | | | 0.969 | | | | 06/25/26 | | | | 595,071 | |
| Educational Funding of the South, Inc. Series 2011-1, Class A2(c) | |
| | 989,414 | | | | 0.884 | | | | 04/25/35 | | | | 991,587 | |
| Educational Services of America, Inc. Series 2010-1, Class A1(a)(c) | |
| | 1,792,936 | | | | 1.084 | | | | 07/25/23 | | | | 1,803,904 | |
| Educational Services of America, Inc. Series 2014-1, Class A(a)(c) | |
| | 521,643 | | | | 0.870 | | | | 02/25/39 | | | | 520,404 | |
| EFS Volunteer No. 3 LLC Series 2012-1, Class A2(a) | |
| | 1,750,000 | | | | 1.156 | | | | 02/25/25 | | | | 1,766,703 | |
| GCO Education Loan Funding Trust Series 2006-1, Class A8L | |
| | 714,532 | | | | 0.363 | | | | 05/25/25 | | | | 696,801 | |
| Montana Higher Education Student Assistance Corp.
Series 2012-1, Class A2 |
|
| | 1,201,082 | | | | 1.165 | | | | 05/20/30 | | | | 1,214,336 | |
| Nelnet Student Loan Trust Series 2008-3, Class A4(c) | |
| | 1,200,000 | | | | 1.883 | | | | 11/25/24 | | | | 1,240,929 | |
| Panhandle-Plains Higher Education Authority, Inc. Series 2011-1,
Class A2 |
|
| | 986,241 | | | | 1.185 | | | | 07/01/24 | | | | 993,622 | |
| SLM Student Loan Trust Series 2003-12, Class A5(a) | |
| | 291,165 | | | | 0.521 | | | | 09/15/22 | | | | 290,724 | |
| SLM Student Loan Trust Series 2005-9, Class A6 | |
| | 650,000 | | | | 0.784 | | | | 10/26/26 | | | | 652,259 | |
| SLM Student Loan Trust Series 2008-5, Class A4(c) | |
| | 300,000 | | | | 1.934 | | | | 07/25/23 | | | | 313,168 | |
| SLM Student Loan Trust Series 2011-2, Class A1 | |
| | 988,419 | | | | 0.770 | | | | 11/25/27 | | | | 991,123 | |
| SLM Student Loan Trust Series 2012-2, Class A(c) | |
| | 190,531 | | | | 0.870 | | | | 01/25/29 | | | | 191,099 | |
| | | | | | | | | | | | | | |
| | | | | | | | | | | | | 14,590,280 | |
| | |
| | TOTAL ASSET-BACKED SECURITIES | | | | | |
| | (Cost $25,541,873) | | | $ | 25,579,855 | |
| | |
| | TOTAL INVESTMENTS – 93.6% | | | | | |
| | (Cost $69,857,691) | | | $ | 70,147,745 | |
| | |
| OTHER ASSETS IN EXCESS OF
LIABILITIES – 6.4% |
| | | 4,778,951 | |
| | |
| | NET ASSETS – 100.0% | | | $ | 74,926,696 | |
| | |
| | |
| The accompanying notes are an integral part of these financial statements. | | 49 |
GOLDMAN SACHS VARIABLE INSURANCE TRUST HIGH QUALITY FLOATING RATE FUND
Schedule of Investments (continued)
December 31, 2014
| | |
| The percentage shown for each investment category reflects the value of investments in that category as a percentage of net assets. |
| (a) | | Exempt from registration under Rule 144A of the Securities Act of 1933. Under procedures approved by the Board of Trustees, such securities have been determined to be liquid by the Investment Adviser and may be resold, normally to qualified institutional buyers in transactions exempt from registration. Total market value of Rule 144A securities amounts to $16,422,591, which represents approximately 21.9% of net assets as of December 31, 2014. |
| (b) | | Variable rate security. Interest rate or distribution rate disclosed is that which is in effect at December 31, 2014. |
| (c) | | Securities with “Call” features. Maturity dates disclosed are the final maturity dates. |
| | |
| Investment Abbreviations: |
| FHLMC | | —Federal Home Loan Mortgage Corp. |
| FNMA | | —Federal National Mortgage Association |
| GNMA | | —Government National Mortgage Association |
| REMIC | | —Real Estate Mortgage Investment Conduit |
| | |
| 50 | | The accompanying notes are an integral part of these financial statements. |
GOLDMAN SACHS VARIABLE INSURANCE TRUST HIGH QUALITY FLOATING RATE FUND
ADDITIONAL INVESTMENT INFORMATION
FUTURES CONTRACTS — At December 31, 2014, the Fund had the following futures contracts:
| | | | | | | | | | | | |
| Type | | Number of
Contracts
Long (Short) | | Expiration
Date | | Current
Value | | | Unrealized
Gain (Loss) | |
| U.S. Long Bond | | (20) | | March 2015 | | $ | (2,891,250 | ) | | $ | (53,217 | ) |
| U.S. Ultra Long Treasury Bonds | | 6 | | March 2015 | | | 991,125 | | | | 39,519 | |
| 2 Year U.S. Treasury Notes | | 10 | | March 2015 | | | 2,185,938 | | | | (2,859 | ) |
| 5 Year U.S. Treasury Notes | | (29) | | March 2015 | | | (3,448,961 | ) | | | 6,732 | |
10 Year U.S. Treasury Notes | | 7 | | March 2015 | | | 887,578 | | | | 6,352 | |
| TOTAL | | | | | | | | | | $ | (3,473) | |
| | |
| The accompanying notes are an integral part of these financial statements. | | 51 |
GOLDMAN SACHS VARIABLE INSURANCE TRUST FUNDS
Statements of Assets and Liabilities
December 31, 2014
| | | | | | | | | | | | | | | | |
| | | Core Fixed
Income Fund | | | Equity Index
Fund | | | Growth
Opportunities
Fund | | | High Quality
Floating Rate
Fund | |
| | | | | | | | | | | | | | | | |
| Assets: | | | | | | | | | | | | |
Investments in unaffiliated issuers, at value (cost $110,748,559, $90,750,222, $152,139,637 and $69,857,691) | | $ | 114,516,283 | | | $ | 187,951,501 | | | $ | 199,993,749 | | | $ | 70,147,745 | |
Investments in affiliated issuers, at value (cost $477,932 for the Equity Index Fund) | | | — | | | | 809,046 | | | | — | | | | — | |
Cash | | | 44,172 | | | | 383,412 | | | | 2,269,425 | | | | 5,088,060 | |
Foreign currencies, at value (cost $66,056 for the Core Fixed Income Fund) | | | 66,145 | | | | — | | | | — | | | | — | |
Receivables: | | | | | | | | | | | | | | | | |
Investments sold on an extended-settlement basis | | | 15,708,040 | | | | — | | | | — | | | | 20,120 | |
Investments sold | | | — | | | | 711,629 | | | | 19,421 | | | | — | |
Interest and dividends | | | 727,886 | | | | 253,669 | | | | 54,926 | | | | 64,587 | |
Reimbursement from investment adviser | | | 22,621 | | | | 9,280 | | | | — | | | | 13,031 | |
Collateral on certain derivative contracts(a) | | | 76,528 | | | | — | | | | — | | | | 346,000 | |
Unrealized gain on forward foreign currency exchange contracts | | | 230,569 | | | | — | | | | — | | | | — | |
Fund shares sold | | | 87,498 | | | | 83,696 | | | | 729 | | | | 278 | |
Other assets | | | 3,946 | | | | 5,968 | | | | 6,204 | | | | 2,653 | |
| Total assets | | | 131,483,688 | | | | 190,208,201 | | | | 202,344,454 | | | | 75,682,474 | |
| | | | | | | | | | | | | | | | |
| | | | | | | | | | | | | | | | |
| Liabilities: | | | | | | | | | | | | |
Payables: | | | | | | | | | | | | | | | | |
Investments purchased on an extended-settlement basis | | | 22,024,023 | | | | — | | | | — | | | | — | |
Investments purchased | | | — | | | | — | | | | 396,548 | | | | — | |
Forward sale contracts, at value (proceeds receivable, $2,002,500 for the Core Fixed Income Fund) | | | 2,024,219 | | | | — | | | | — | | | | — | |
Unrealized loss on forward foreign currency exchange contracts | | | 116,365 | | | | — | | | | — | | | | — | |
Fund shares redeemed | | | 49,368 | | | | 14,846 | | | | 89,558 | | | | 630,003 | |
Management fees | | | 36,523 | | | | 34,031 | | | | 198,535 | | | | 19,989 | |
Distribution and Service fees and Transfer Agent fees | | | 24,647 | | | | 43,755 | | | | 30,639 | | | | 17,414 | |
Variation margin on certain derivative contracts | | | 23,703 | | | | 21,712 | | | | — | | | | 6,092 | |
Accrued expenses | | | 95,706 | | | | 84,925 | | | | 76,406 | | | | 82,280 | |
| Total liabilities | | | 24,394,554 | | | | 199,269 | | | | 791,686 | | | | 755,778 | |
| | | | | | | | | | | | | | | | |
| | | | | | | | | | | | | | | | |
| Net Assets: | | | | | | | | | | | | |
Paid-in capital | | | 109,694,102 | | | | 102,094,765 | | | | 152,414,478 | | | | 75,265,347 | |
Undistributed (distributions in excess of) net investment income (loss) | | | 174,914 | | | | 251,773 | | | | (1 | ) | | | 69,758 | |
Accumulated net realized gain (loss) | | | (6,407,335 | ) | | | (9,910,335 | ) | | | 1,284,179 | | | | (694,990 | ) |
Net unrealized gain | | | 3,627,453 | | | | 97,572,729 | | | | 47,854,112 | | | | 286,581 | |
| NET ASSETS | | $ | 107,089,134 | | | $ | 190,008,932 | | | $ | 201,552,768 | | | $ | 74,926,696 | |
Net Assets: | | | | | | | | | | | | | | | | |
Institutional | | $ | 25,874 | | | $ | — | | | $ | 33,338 | | | $ | 25,176 | |
Service | | | 107,063,260 | | | | 190,008,932 | | | | 201,519,430 | | | | 74,891,528 | |
Advisor(b) | | | — | | | | — | | | | — | | | | 9,992 | |
Total Net Assets | | $ | 107,089,134 | | | $ | 190,008,932 | | | $ | 201,552,768 | | | $ | 74,926,696 | |
Shares of beneficial interest outstanding $0.001 par value (unlimited shares authorized): | | | | | | | | | | | | | | | | |
Institutional | | | 2,406 | | | | — | | | | 4,317 | | | | 2,399 | |
Service | | | 9,954,628 | | | | 12,745,449 | | | | 26,189,969 | | | | 7,153,217 | |
Advisor(b) | | | — | | | | — | | | | — | | | | 952 | |
Net asset value, offering and redemption price per share: | | | | | | | | | | | | | | | | |
Institutional | | $ | 10.75 | | | | — | | | $ | 7.72 | | | $ | 10.49 | |
Service | | | 10.76 | | | | 14.91 | | | | 7.69 | | | | 10.47 | |
Advisor(b) | | | — | | | | — | | | | — | | | | 10.49 | |
| (a) | Segregated for initial margin of $76,528 on swap transactions for Core Fixed Income Fund and $346,000 on future transactions for High Quality Floating Rate Fund, respectively. |
(b) Commenced operations on October 15, 2014.
| | |
| 52 | | The accompanying notes are an integral part of these financial statements. |
GOLDMAN SACHS VARIABLE INSURANCE TRUST FUNDS
Statements of Operations
For the Fiscal Year Ended December 31, 2014
| | | | | | | | | | | | | | | | |
| | | Core Fixed
Income Fund | | | Equity Index
Fund | | | Growth
Opportunities
Fund | | | High Quality
Floating Rate
Fund | |
| | | | | | | | | | | | | | | | |
| Investment income: | | | | | | | | | | | | |
Interest | | $ | 3,079,541 | | | $ | 18 | | | $ | — | | | $ | 705,528 | |
Dividends — unaffiliated issuer (net of foreign taxes withheld of $0, $432, $8,419 and $0) | | | — | | | | 3,867,138 | | | | 1,528,524 | | | | — | |
Dividends — affiliated issuers | | | — | | | | 10,220 | | | | — | | | | — | |
| Total investment income | | | 3,079,541 | | | | 3,877,376 | | | | 1,528,524 | | | | 705,528 | |
| | | | | | | | | | | | | | | | |
| | | | | | | | | | | | | | | | |
| Expenses: | | | | | | | | | | | | |
Management fees | | | 448,546 | | | | 568,963 | | | | 1,981,321 | | | | 310,063 | |
Distribution and Service fees(a) | | | 280,277 | | | | 474,133 | | | | 495,251 | | | | 193,729 | |
Professional fees | | | 99,610 | | | | 84,766 | | | | 76,571 | | | | 112,725 | |
Custody, accounting and administrative services | | | 81,384 | | | | 56,600 | | | | 52,484 | | | | 39,865 | |
Printing and mailing costs | | | 39,578 | | | | 53,196 | | | | 54,546 | | | | 22,933 | |
Trustee fees | | | 23,065 | | | | 23,851 | | | | 23,863 | | | | 22,998 | |
Transfer Agent fees(a) | | | 22,424 | | | | 37,928 | | | | 39,624 | | | | 15,501 | |
Other | | | 26,455 | | | | 45,527 | | | | 37,598 | | | | 23,057 | |
| Total expenses | | | 1,021,339 | | | | 1,344,964 | | | | 2,761,258 | | | | 740,871 | |
Less — expense reductions | | | (256,003 | ) | | | (407,441 | ) | | | (450,420 | ) | | | (226,552 | ) |
| Net expenses | | | 765,336 | | | | 937,523 | | | | 2,310,838 | | | | 514,319 | |
| NET INVESTMENT INCOME (LOSS) | | | 2,314,205 | | | | 2,939,853 | | | | (782,314 | ) | | | 191,209 | |
| | | | | | | | | | | | | | | | |
| | | | | | | | | | | | | | | | |
| Realized and unrealized gain (loss): | | | | | | | | | | | | |
Net realized gain (loss) from: | | | | | | | | | | | | | | | | |
Investments — unaffiliated issuers (including commissions recaptured of $10,629 for the Growth Opportunities Fund) | | | 1,026,697 | | | | 8,668,459 | | | | 35,749,537 | | | | 46,002 | |
Investments — affiliated issuer | | | — | | | | 21,025 | | | | — | | | | — | |
Futures contracts | | | (544,898 | ) | | | 176,042 | | | | — | | | | (412,695 | ) |
Swap contracts | | | (26,225 | ) | | | — | | | | — | | | | — | |
Forward foreign currency exchange contracts | | | 563,198 | | | | — | | | | — | | | | — | |
Foreign currency transactions | | | (94,651 | ) | | | — | | | | — | | | | — | |
Net change in unrealized gain (loss) on: | | | | | | | | | | | | | | | | |
Investments — unaffiliated issuers | | | 2,991,572 | | | | 11,602,152 | | | | (13,891,246 | ) | | | 340,623 | |
Investments — affiliated issuers | | | — | | | | 46,801 | | | | — | | | | — | |
Futures contracts | | | (216,870 | ) | | | (14,108 | ) | | | — | | | | (223,688 | ) |
Swap contracts | | | (8,532 | ) | | | — | | | | — | | | | — | |
Forward foreign currency exchange contracts | | | 84,064 | | | | — | | | | — | | | | — | |
Foreign currency translation | | | (4,477 | ) | | | — | | | | — | | | | — | |
| Net realized and unrealized gain (loss) | | | 3,769,878 | | | | 20,500,371 | | | | 21,858,291 | | | | (249,758 | ) |
| NET INCREASE IN NET ASSETS RESULTING FROM OPERATIONS | | $ | 6,084,083 | | | $ | 23,440,224 | | | $ | 21,075,977 | | | $ | (58,549 | ) |
(a) Class specific Distribution and Service, and Transfer Agent fees were as follows:
| | | | | | | | | | | | | | | | | | | | |
| | | Distribution and
Services Fees | | | Transfer Agent Fees | |
Fund | | Service | | | Advisor | | | Institutional | | | Service | | | Advisor | |
| Core Fixed Income | | $ | 280,277 | | | $ | N/A | | | $ | 4 | | | $ | 22,420 | | | $ | N/A | |
| Equity Index | | | 474,133 | | | | N/A | | | | N/A | | | | 37,928 | | | | N/A | |
| Growth Opportunities | | | 495,251 | | | | N/A | | | | 7 | | | | 39,617 | | | | N/A | |
| High Quality Floating Rate | | | 193,721 | | | | 8 | (b) | | | 4 | | | | 15,496 | | | | 1 | (b) |
(b) Commenced operations on October 15, 2014.
| | |
| The accompanying notes are an integral part of these financial statements. | | 53 |
GOLDMAN SACHS VARIABLE INSURANCE TRUST FUNDS
Statements of Changes in Net Assets
| | | | | | | | | | | | | | | | |
| | | Core Fixed Income Fund | | | Equity Index Fund | |
| | | For the
Fiscal Year Ended
December 31, 2014 | | | For the
Fiscal Year Ended
December 31, 2013 | | | For the
Fiscal Year Ended
December 31, 2014 | | | For the
Fiscal Year Ended
December 31, 2013 | |
| | | | | | | | | | | | | | | | |
| From operations: | | | | | | | | | | | | |
Net investment income (loss) | | $ | 2,314,205 | | | $ | 2,363,216 | | | $ | 2,939,853 | | | $ | 2,931,988 | |
Net realized gain (loss) | | | 924,121 | | | | (348,336 | ) | | | 8,865,526 | | | | 368,727 | |
Net change in unrealized gain (loss) | | | 2,845,757 | | | | (3,727,022 | ) | | | 11,634,845 | | | | 46,620,411 | |
| Net increase (decrease) in net assets resulting from operations | | | 6,084,083 | | | | (1,712,142 | ) | | | 23,440,224 | | | | 49,921,126 | |
| | | | | | | | | | | | | | | | |
| | | | | | | | | | | | | | | | |
| Distributions to shareholders: | | | | | | | | | | | | |
From net investment income | | | | | | | | | | | | | | | | |
Institutional Shares | | | (758 | ) | | | (453 | )(b) | | | — | | | | — | |
Service Shares | | | (3,005,705 | ) | | | (3,066,413 | ) | | | (3,027,833 | ) | | | (2,941,172 | ) |
From net realized gains | | | | | | | | | | | | | | | | |
Institutional Shares | | | — | | | | — | (b) | | | — | | | | — | |
Service Shares | | | — | | | | — | | | | (3,936,430 | ) | | | — | |
From capital | | | | | | | | | | | | | | | | |
Institutional Shares | | | — | | | | — | (b) | | | — | | | | — | |
Service Shares | | | — | | | | — | | | | — | | | | — | |
| Total distributions to shareholders | | | (3,006,463 | ) | | | (3,066,866 | ) | | | (6,964,263 | ) | | | (2,941,172 | ) |
| | | | | | | | | | | | | | | | |
| | | | | | | | | | | | | | | | |
| From share transactions: | | | | | | | | | | | | |
Proceeds from sales of shares | | | 4,700,540 | | | | 5,351,449 | | | | 2,039,103 | | | | 3,333,154 | |
Reinvestment of distributions | | | 3,006,463 | | | | 3,066,866 | | | | 6,964,263 | | | | 2,941,172 | |
Cost of shares redeemed | | | (20,249,586 | ) | | | (22,521,179 | ) | | | (29,369,734 | ) | | | (27,165,802 | ) |
| Net increase (decrease) in net assets resulting from share transactions | | | (12,542,583 | ) | | | (14,102,864 | ) | | | (20,366,368 | ) | | | (20,891,476 | ) |
| TOTAL INCREASE (DECREASE) | | | (9,464,963 | ) | | | (18,881,872 | ) | | | (3,890,407 | ) | | | 26,088,478 | |
| | | | | | | | | | | | | | | | |
| | | | | | | | | | | | | | | | |
| Net assets: | | | | | | | | | | | | |
| | | | |
Beginning of year | | | 116,554,097 | | | | 135,435,969 | | | | 193,899,339 | | | | 167,810,861 | |
End of year | | $ | 107,089,134 | | | $ | 116,554,097 | | | $ | 190,008,932 | | | $ | 193,899,339 | |
| Undistributed (distributions in excess of) net investment income (loss) | | $ | 174,914 | | | $ | 162,288 | | | $ | 251,773 | | | $ | 342,045 | |
(a) The Advisor Shares commenced operations on October 15, 2014.
(b) Commenced operations on April 30, 2013.
| | |
| 54 | | The accompanying notes are an integral part of these financial statements. |
GOLDMAN SACHS VARIABLE INSURANCE TRUST FUNDS
| | | | | | | | | | | | | | | | | | | | | | |
| | | Growth Opportunities Fund | | | | | High Quality Floating Rate Fund | |
| | | For the
Fiscal Year Ended
December 31, 2014 | | | | | For the
Fiscal Year Ended
December 31, 2013 | | | | | For the
Fiscal Year Ended
December 31, 2014(a) | | | | | For the
Fiscal Year Ended
December 31, 2013 | |
| | | | | | | | | | | | | | | | | | | | | | |
| | | | | | | | | | | | | | |
| | $ | (782,314 | ) | | | | $ | (894,350 | ) | | | | $ | 191,209 | | | | | $ | 56,435 | |
| | | 35,749,537 | | | | | | 17,405,818 | | | | | | (366,693 | ) | | | | | 927,052 | |
| | | | (13,891,246 | ) | | | | | 35,965,761 | | | | | | 116,935 | | | | | | (667,213 | ) |
| | |
|
21,075,977 |
| | | | | 52,477,229 | | | | | | (58,549 | ) | | | | | 316,274 | |
| | | | | | | | | | | | | | | | | | | | | | |
| | | | | | | | | | | | | | | | | | | | | | |
| | | | | | | | | | | | | | |
| | | | | | | | | | | | | | | | | | | | | | |
| | | — | | | | | | — | (b) | | | | | (90 | ) | | | | | (103 | )(b) |
| | | — | | | | | | — | | | | | | (229,445 | ) | | | | | (348,230 | ) |
| | | | | | | | | | | | | | | | | | | | | | |
| | | (6,255 | ) | | | | | (1,862 | )(b) | | | | | — | | | | | | (129 | )(b) |
| | | (38,065,653 | ) | | | | | (12,613,777 | ) | | | | | — | | | | | | (400,357 | ) |
| | | | | | | | | | | | | | | | | | | | | | |
| | | — | | | | | | — | (b) | | | | | — | | | | | | (13 | )(b) |
| | | | — | | | | | | — | | | | | | — | | | | | | (38,172 | ) |
| | | | (38,071,908 | ) | | | | | (12,615,639 | ) | | | | | (229,535 | ) | | | | | (787,004 | ) |
| | | | | | | | | | | | | | | | | | | | | | |
| | | | | | | | | | | | | | | | | | | | | | |
| | | | | | | | | | | | | | |
| | | 10,066,903 | | | | | | 6,060,135 | | | | | | 9,127,538 | | | | | | 21,557,292 | |
| | | 38,071,908 | | | | | | 12,615,639 | | | | | | 229,535 | | | | | | 787,004 | |
| | | | (31,492,267 | ) | | | | | (28,504,978 | ) | | | | | (12,308,954 | ) | | | | | (12,600,399 | ) |
| | |
|
16,646,544 |
| | | | | (9,829,204 | ) | | | | | (2,951,881 | ) | | | | | 9,743,897 | |
| | | | (349,387 | ) | | | | | 30,032,386 | | | | | | (3,239,965 | ) | | | | | 9,273,167 | |
| | | | | | | | | | | | | | | | | | | | | | |
| | | | | | | | | | | | | | | | | | | | | | |
| | | | | | | | | | | | | | |
| | | | | | | |
| | | | 201,902,155 | | | | | | 171,869,769 | | | | | | 78,166,661 | | | | | | 68,893,494 | |
| | | $ | 201,552,768 | | | | | $ | 201,902,155 | | | | | $ | 74,926,696 | | | | | $ | 78,166,661 | |
| | |
$ |
(1 |
) | | | | $ | 1,041 | | | | | $ | 69,758 | | | | | $ | 1 | |
| | |
| The accompanying notes are an integral part of these financial statements. | | 55 |
GOLDMAN SACHS VARIABLE INSURANCE TRUST CORE FIXED INCOME FUND
Financial Highlights
Selected Data for a Share Outstanding Throughout Each Year
| | | | | | | | | | | | | | | | | | | | | | | | | | | | | | | | | | | | | | | | | | | | | | | | |
| | | | | | Income (loss) from
investment operations | | | | | | | | | | | | | | | | | | | | | | | | | |
| | | Net asset
value,
beginning
of year | | | Net
investment
income(a) | | | Net
realized
and
unrealized
gain (loss) | | | Total from
investment
operations | | | Distributions
to shareholders
from net
investment
income | | | Net asset
value,
end of
year | | | Total
return(b) | | | Net assets,
end of
year
(in 000s) | | | Ratio of
net expenses
to average
net assets | | | Ratio of
total
expenses
to average
net assets | | | Ratio of
net investment
income
to average
net assets | | | Portfolio
turnover
rate(c) | |
FOR THE FISCAL YEARS ENDED DECEMBER 31, | |
2014 - Institutional | | $ | 10.48 | | | $ | 0.25 | | | $ | 0.34 | | | $ | 0.59 | | | $ | (0.32 | ) | | $ | 10.75 | | | | 5.68 | % | | $ | 26 | | | | 0.44 | % | | | 0.65 | % | | | 2.31 | % | | | 353 | % |
2014 - Service | | | 10.47 | | | | 0.22 | | | | 0.36 | | | | 0.58 | | | | (0.29 | ) | | | 10.76 | | | | 5.61 | | | | 107,063 | | | | 0.68 | | | | 0.91 | | | | 2.06 | | | | 353 | |
2013 - Institutional (Commenced April 30, 2013) | | | 10.91 | | | | 0.15 | | | | (0.38 | ) | | | (0.23 | ) | | | (0.20 | ) | | | 10.48 | | | | (2.13 | ) | | | 24 | | | | 0.43 | (d) | | | 0.69 | (d) | | | 2.10 | (d) | | | 557 | |
2013 - Service | | | 10.88 | | | | 0.20 | | | | (0.35 | ) | | | (0.15 | ) | | | (0.26 | ) | | | 10.47 | | | | (1.35 | ) | | | 116,530 | | | | 0.67 | | | | 0.89 | | | | 1.88 | | | | 557 | |
2012 | | | 10.43 | | | | 0.17 | | | | 0.52 | | | | 0.69 | | | | (0.24 | ) | | | 10.88 | | | | 6.70 | | | | 135,436 | | | | 0.67 | | | | 0.83 | | | | 1.57 | | | | 727 | |
2011 | | | 10.00 | | | | 0.23 | | | | 0.46 | | | | 0.69 | | | | (0.26 | ) | | | 10.43 | | | | 6.96 | | | | 148,114 | | | | 0.67 | | | | 0.83 | | | | 2.22 | | | | 644 | |
2010 | | | 9.62 | | | | 0.28 | | | | 0.41 | | | | 0.69 | | | | (0.31 | ) | | | 10.00 | | | | 7.18 | | | | 170,720 | | | | 0.67 | | | | 0.81 | | | | 2.80 | | | | 399 | |
| (a) | Calculated based on the average shares outstanding methodology. |
| (b) | Assumes investment at the net asset value at the beginning of the year, reinvestment of all distributions, and a complete redemption of the investment at the net asset value at the end of the year. Total returns for periods less than one full year are not annualized. |
| (c) | The Fund's portfolio turnover rate is calculated in accordance with regulatory requirements, without regard to transactions involving short term investments and certain derivatives. If such transactions were included, the Fund's portfolio turnover rate may be higher. |
| | | | |
| The accompanying notes are an integral part of these financial statements. | | 56 | | |
GOLDMAN SACHS VARIABLE INSURANCE TRUST EQUITY INDEX FUND
Financial Highlights
Selected Data for a Share Outstanding Throughout Each Year
| | | | | | | | | | | | | | | | | | | | | | | | | | | | | | | | | | | | | | | | | | | | | | | | | | | | | | | | |
| | | | | | Income from investment operations | | | Distributions to shareholders | | | | | | | | | | | | | | | | | | | | | | |
| | | Net asset
value,
beginning
of year | | | Net
investment
income(a) | | | Net
realized
and
unrealized
gain | | | Total from
investment
operations | | | From net
investment
income | | | From
net
realized
gains | | | Total
distributions | | | Net asset
value,
end of
year | | | Total
return(b) | | | Net assets,
end of
year
(in 000s) | | | Ratio of
net expenses
to average
net assets | | | Ratio of
total
expenses
to average
net assets | | | Ratio of
net investment
income
to average
net assets | | | Portfolio
turnover
rate(c) | |
FOR THE FISCAL YEARS ENDED DECEMBER 31, | |
2014 | | $ | 13.68 | | | $ | 0.22 | | | $ | 1.58 | | | $ | 1.80 | | | $ | (0.25 | ) | | $ | (0.32 | ) | | $ | (0.57 | ) | | $ | 14.91 | | | | 13.22 | % | | $ | 190,009 | | | | 0.49 | % | | | 0.71 | % | | | 1.55 | % | | | 2 | % |
2013 | | | 10.54 | | | | 0.20 | | | | 3.15 | | | | 3.35 | | | | (0.21 | ) | | | — | | | | (0.21 | ) | | | 13.68 | | | | 31.83 | | | | 193,899 | | | | 0.49 | | | | 0.73 | | | | 1.61 | | | | 3 | |
2012 | | | 9.29 | | | | 0.19 | | | | 1.26 | | | | 1.45 | | | | (0.20 | ) | | | — | | | | (0.20 | ) | | | 10.54 | | | | 15.50 | | | | 167,811 | | | | 0.48 | | | | 0.72 | | | | 1.82 | | | | 3 | |
2011 | | | 9.29 | | | | 0.15 | | | | 0.01 | | | | 0.16 | | | | (0.16 | ) | | | — | | | | (0.16 | ) | | | 9.29 | | | | 1.75 | | | | 169,711 | | | | 0.48 | | | | 0.70 | | | | 1.59 | | | | 3 | |
2010 | | | 8.22 | | | | 0.13 | | | | 1.08 | | | | 1.21 | | | | (0.14 | ) | | | — | | | | (0.14 | ) | | | 9.29 | | | | 14.92 | | | | 193,874 | | | | 0.51 | | | | 0.71 | | | | 1.52 | | | | 4 | |
| (a) | Calculated based on the average shares outstanding methodology. |
| (b) | Assumes investment at the net asset value at the beginning of the year, reinvestment of all distributions, and a complete redemption of the investment at the net asset value at the end of the year. |
| (c) | The Fund's portfolio turnover rate is calculated in accordance with regulatory requirements, without regard to transactions involving short term investments and certain derivatives. If such transactions were included, the Fund's portfolio turnover rate may be higher. |
| | | | |
| The accompanying notes are an integral part of these financial statements. | | 57 | | |
GOLDMAN SACHS VARIABLE INSURANCE TRUST GROWTH OPPORTUNITIES FUND
Financial Highlights
Selected Data for a Share Outstanding Throughout Each Year
| | | | | | | | | | | | | | | | | | | | | | | | | | | | | | | | | | | | | | | | | | | | | | | | |
| | | | | | Income (loss) from
investment operations | | | | | | | | | | | | | | | | | | | | | | | | | |
| | | Net asset
value,
beginning
of year | | | Net
investment
loss(a) | | | Net
realized
and
unrealized
gain (loss) | | | Total from
investment
operations | | | Distributions
to shareholders
from net
realized
gains | | | Net asset
value,
end of
year | | | Total
return(b) | | | Net assets,
end of
year
(in 000s) | | | Ratio of
net expenses
to average
net assets | | | Ratio of
total
expenses
to average
net assets | | | Ratio of
net investment
loss
to average
net assets | | | Portfolio
turnover
rate(c) | |
FOR THE FISCAL YEARS ENDED DECEMBER 31, | |
2014 - Institutional | | $ | 8.59 | | | $ | (0.02 | ) | | $ | 0.94 | | | $ | 0.92 | | | $ | (1.79 | ) | | $ | 7.72 | | | | 11.32 | % | | $ | 33 | | | | 1.01 | % | | | 1.15 | % | | | (0.24 | )% | | | 62 | % |
2014 - Service | | | 8.58 | | | | (0.03 | ) | | | 0.93 | | | | 0.90 | | | | (1.79 | ) | | | 7.69 | | | | 11.10 | | | | 201,519 | | | | 1.17 | | | | 1.39 | | | | (0.39 | ) | | | 62 | |
2013 - Institutional (Commenced April 30, 2013) | | | 7.66 | | | | (0.02 | ) | | | 1.52 | | | | 1.50 | | | | (0.57 | ) | | | 8.59 | | | | 19.73 | | | | 30 | | | | 1.00 | (d) | | | 1.16 | (d) | | | (0.27 | )(d) | | | 42 | |
2013 - Service | | | 6.93 | | | | (0.04 | ) | | | 2.26 | | | | 2.22 | | | | (0.57 | ) | | | 8.58 | | | | 32.20 | | | | 201,872 | | | | 1.16 | | | | 1.39 | | | | (0.47 | ) | | | 42 | |
2012 - Service | | | 6.34 | | | | (0.02 | )(e) | | | 1.25 | | | | 1.23 | | | | (0.64 | ) | | | 6.93 | | | | 19.37 | | | | 171,870 | | | | 1.15 | | | | 1.39 | | | | (0.26 | )(e) | | | 46 | |
2011 - Service | | | 6.72 | | | | (0.03 | ) | | | (0.24 | ) | | | (0.27 | ) | | | (0.11 | ) | | | 6.34 | | | | (3.97 | ) | | | 159,324 | | | | 1.17 | | | | 1.41 | | | | (0.46 | ) | | | 53 | |
2010 - Service | | | 5.63 | | | | (0.03 | ) | | | 1.12 | | | | 1.09 | | | | — | | | | 6.72 | | | | 19.36 | | | | 145,904 | | | | 1.18 | | | | 1.43 | | | | (0.56 | ) | | | 57 | |
| (a) | Calculated based on the average shares outstanding methodology. |
| (b) | Assumes investment at the net asset value at the beginning of the year, reinvestment of all distributions, and a complete redemption of the investment at the net asset value at the end of the year. Total returns for periods less than one full year are not annualized. |
| (c) | The Fund's portfolio turnover rate is calculated in accordance with regulatory requirements, without regard to transactions involving short term investments and certain derivatives. If such transactions were included, the Fund's portfolio turnover rate may be higher. |
| (e) | Reflects income recognized from special dividends which amounted to $0.01 per share and 0.18% of average net assets. |
| | | | |
| The accompanying notes are an integral part of these financial statements. | | 58 | | |
GOLDMAN SACHS VARIABLE INSURANCE TRUST HIGH QUALITY FLOATING RATE FUND
Financial Highlights
Selected Data for a Share Outstanding Throughout Each Year
| | | | | | | | | | | | | | | | | | | | | | | | | | | | | | | | | | | | | | | | | | | | | | | | | | | | | | | | |
| | | | | | Income (loss) from
investment operations | | | Distributions to shareholders | | | | | | | | | | | | | | | | | | | | | | |
| | | Net asset
value,
beginning
of year | | | Net
investment
income(a) | | | Net
realized
and
unrealized
gain (loss) | | | Total from
investment
operations | | | From net
investment
income | | | From
net
realized
gains | | | Total
distributions | | | Net asset
value,
end of
year | | | Total
return(b) | | | Net assets,
end of
year
(in 000s) | | | Ratio of
net expenses
to average
net assets | | | Ratio of
total
expenses
to average
net assets | | | Ratio of
net investment
income
to average
net assets | | | Portfolio
turnover
rate(c) | |
FOR THE FISCAL YEARS ENDED DECEMBER 31, | |
2014 - Institutional | | $ | 10.51 | | | $ | 0.05 | | | $ | (0.03 | ) | | $ | 0.02 | | | $ | (0.04 | ) | | $ | — | | | $ | (0.04 | ) | | $ | 10.49 | | | | 0.17 | % | | $ | 25 | | | | 0.40 | % | | | 0.70 | % | | | 0.51 | % | | | 17 | % |
2014 - Service | | | 10.51 | | | | 0.03 | | | | (0.04 | ) | | | (0.01 | ) | | | (0.03 | ) | | | — | | | | (0.03 | ) | | | 10.47 | | | | (0.09 | ) | | | 74,892 | | | | 0.66 | | | | 0.96 | | | | 0.25 | | | | 17 | |
2014 - Advisor (Commenced
October 15, 2014) | | | 10.51 | | | | — | (d) | | | (0.02 | ) | | | (0.02 | ) | | | — | | | | — | | | | — | | | | 10.49 | | | | (0.10 | )* | | | 10 | | | | 0.77 | (e) | | | 1.13 | (e) | | | 0.15 | (e) | | | 17 | |
2013 - Institutional (Commenced
April 30, 2013) | | | 10.56 | | | | 0.02 | | | | 0.03 | | | | 0.05 | | | | (0.04 | ) | | | (0.06 | ) | | | (0.10 | )(f) | | | 10.51 | | | | 0.50 | | | | 25 | | | | 0.40 | (e) | | | 0.86 | (e) | | | 0.25 | (e) | | | 467 | |
2013 - Service | | | 10.58 | | | | 0.01 | | | | 0.03 | | | | 0.04 | | | | (0.05 | ) | | | (0.06 | ) | | | (0.11 | )(f) | | | 10.51 | | | | 0.40 | | | | 78,142 | | | | 0.70 | | | | 1.10 | | | | 0.08 | | | | 467 | |
2012 - Service | | | 10.70 | | | | 0.04 | | | | 0.25 | | | | 0.29 | | | | (0.08 | ) | | | (0.33 | ) | | | (0.41 | ) | | | 10.58 | | | | 2.78 | | | | 68,893 | | | | 0.79 | | | | 1.06 | | | | 0.36 | | | | 1045 | |
2011 - Service | | | 10.56 | | | | 0.09 | | | | 0.57 | | | | 0.66 | | | | (0.10 | ) | | | (0.42 | ) | | | (0.52 | ) | | | 10.70 | | | | 6.35 | | | | 67,327 | | | | 0.81 | | | | 1.13 | | | | 0.81 | | | | 960 | |
2010 - Service | | | 10.29 | | | | 0.17 | | | | 0.37 | | | | 0.54 | | | | (0.19 | ) | | | (0.08 | ) | | | (0.27 | ) | | | 10.56 | | | | 5.19 | | | | 72,311 | | | | 0.81 | | | | 1.08 | | | | 1.56 | | | | 614 | |
| (a) | Calculated based on the average shares outstanding methodology. |
| (b) | Assumes investment at the net asset value at the beginning of the year, reinvestment of all distributions, and a complete redemption of the investment at the net asset value at the end of the year. Total returns for periods less than one full year are not annualized. |
| (c) | The Fund's portfolio turnover rate is calculated in accordance with regulatory requirements, without regard to transactions involving short term investments and certain derivatives. If such transactions were included, the Fund's portfolio turnover rate may be higher. |
| (d) | Amount is less than $0.005 per share. |
| (f) | Included a distribution from capital of less than $0.01 per share. |
| * | Represents cumulative total returns. |
| | | | |
| The accompanying notes are an integral part of these financial statements. | | 59 | | |
GOLDMAN SACHS VARIABLE INSURANCE TRUST FUNDS
Notes to Financial Statements
December 31, 2014
1. ORGANIZATION
Goldman Sachs Variable Insurance Trust (the “Trust” or “VIT”) is a Delaware statutory trust registered under the Investment Company Act of 1940, as amended (the “Act”), as an open-end management investment company. The following table lists those series of the Trust that are included in this report (collectively, the “Funds” or individually a “Fund”), along with their corresponding share classes and respective diversification status under the Act:
| | | | |
| Fund | | Share Classes Offered | | Diversified/ Non-diversified |
High Quality Floating Rate | | Institutional, Service and Advisor | | Diversified |
Core Fixed Income and Growth Opportunities | | Institutional and Service | | Diversified |
Equity Index | | Service | | Diversified |
Goldman Sachs Asset Management, L.P. (“GSAM”), an affiliate of Goldman, Sachs & Co. (“Goldman Sachs”), serves as investment adviser to the Funds pursuant to management agreements (the “Agreements”) with the Trust.
2. SIGNIFICANT ACCOUNTING POLICIES
The financial statements have been prepared in accordance with accounting principles generally accepted in the United States of America (“GAAP”) and require management to make estimates and assumptions that may affect the reported amounts and disclosures. Actual results may differ from those estimates and assumptions.
A. Investment Valuation — The Funds’ valuation policy is to value investments at fair value.
B. Investment Income and Investments — Investment income includes interest income and dividend income, net of any foreign withholding taxes, less any amounts reclaimable. Interest income is accrued daily and adjusted for amortization of premiums and accretion of discounts. Dividend income is recognized on ex-dividend date or, for certain foreign securities, as soon as such information is obtained subsequent to the ex-dividend date. Investment transactions are reflected on trade date. Realized gains and losses are calculated using identified cost. Investment transactions are recorded on the following business day for daily net asset value (“NAV”) calculations. Any foreign capital gains tax is accrued daily based upon net unrealized gains, and is payable upon sale of such investments. Distributions received from the Funds’ investments in United States (“U.S.”) real estate investment trusts (“REITs”) may be characterized as ordinary income, net capital gain or a return of capital. A return of capital is recorded by the Funds as a reduction to the cost basis of the REIT.
For derivative contracts, realized gains and losses are recorded upon settlement of the contract. Upfront payments are made or received upon entering into a swap agreement and are reflected in the Statement of Assets and Liabilities. Upfront payments are recognized over the contract’s term/event as realized gains or losses, with the exception of forward starting interest rate swaps whose realized gains or losses are recognized from the effective start date. For securities with paydown provisions, principal payments received are treated as a proportionate reduction to the cost basis of the securities, and excess or shortfall amounts are recorded as income. For treasury inflation protected securities (“TIPS”), adjustments to principal due to inflation/deflation are reflected as increases/decreases to interest income with a corresponding adjustment to cost.
C. Class Allocations and Expenses — Investment income, realized and unrealized gain (loss), and non-class specific expenses of each Fund are allocated daily based upon the proportion of net assets of each class. Class specific expenses, where applicable, are borne by the respective share classes and include Distribution and Service and Transfer Agent fees. Non-class specific expenses directly incurred by a Fund are charged to that Fund, while such expenses incurred by the Trust are allocated across the respective Funds on a straight-line and/or pro-rata basis depending upon the nature of the expenses.
D. Federal Taxes and Distributions to Shareholders — It is each Fund’s policy to comply with the requirements of the Internal Revenue Code of 1986, as amended (the “Code”), applicable to regulated investment companies (mutual funds) and to
60
GOLDMAN SACHS VARIABLE INSURANCE TRUST FUNDS
2. SIGNIFICANT ACCOUNTING POLICIES (continued)
distribute each year substantially all of its investment company taxable income and capital gains to its shareholders. Accordingly, the Funds are not required to make any provisions for the payment of federal income tax. Distributions to shareholders are recorded on the ex-dividend date. Income and capital gains distributions, if any, are declared and paid according to the following schedule:
| | | | |
| Fund | | Income Distributions Declared/Paid | | Capital Gains Distributions
Declared/Paid |
Core Fixed Income and High Quality Floating Rate | | Quarterly | | Annually |
Equity Index and Growth Opportunities | | Annually | | Annually |
Net capital losses are carried forward to future fiscal years and may be used to the extent allowed by the Code to offset any future capital gains. Utilization of capital loss carryforwards will reduce the requirement of future capital gains distributions.
Under the Regulated Investment Company Modernization Act of 2010, the Funds are permitted to carry forward capital losses incurred in taxable years beginning after December 22, 2010 for an unlimited period. However, any losses incurred during those future taxable years will be required to be utilized prior to the losses incurred in pre-enactment taxable years. As a result of this ordering rule, pre-enactment capital loss carryforwards may be more likely to expire unused. Additionally, post-enactment capital losses that are carried forward will retain their character as either short-term or long-term capital losses rather than being considered all short-term as under previous law.
The characterization of distributions to shareholders for financial reporting purposes is determined in accordance with federal income tax rules, which may differ from GAAP. The source of each Fund’s distributions may be shown in the accompanying financial statements as either from net investment income, net realized gain or capital. Certain components of the Funds’ net assets on the Statements of Assets and Liabilities reflect permanent GAAP/tax differences based on the appropriate tax character.
E. Foreign Currency Translation — The accounting records and reporting currency of the Funds are maintained in U.S. dollars. Assets and liabilities denominated in foreign currencies are translated into U.S. dollars using the current exchange rates at the close of each business day. The effect of changes in foreign currency exchange rates on investments is included within net realized and unrealized gain (loss) on investments. Changes in the value of other assets and liabilities as a result of fluctuations in foreign exchange rates are included in the Statements of Operations within net change in unrealized gain (loss) on foreign currency transactions. Transactions denominated in foreign currencies are translated into U.S. dollars on the date the transaction occurred, the effects of which are included within net realized gain (loss) on foreign currency transactions.
F. Commission Recapture — GSAM, on behalf of certain Funds, may direct portfolio trades, subject to seeking best execution, to various brokers who have agreed to rebate a portion of the commissions generated. Such rebates are made directly to a Fund as cash payments and are included in net realized gain (loss) from investments on the Statements of Operations.
3. INVESTMENTS AND FAIR VALUE MEASUREMENTS
The fair value of a financial instrument is the amount that would be received to sell an asset or paid to transfer a liability in an orderly transaction between market participants at the measurement date (i.e., the exit price). GAAP establishes a fair value hierarchy that prioritizes the inputs to valuation techniques used to measure fair value. The hierarchy gives the highest priority to unadjusted quoted prices in active markets for identical assets or liabilities (Level 1 measurements) and the lowest priority to unobservable inputs (Level 3 measurements). The levels used for classifying investments are not necessarily an indication of the risk associated with investing in these investments. The three levels of the fair value hierarchy are described below:
Level 1 — Unadjusted quoted prices in active markets that are accessible at the measurement date for identical, unrestricted assets or liabilities;
61
GOLDMAN SACHS VARIABLE INSURANCE TRUST FUNDS
Notes to Financial Statements (continued)
December 31, 2014
3. INVESTMENTS AND FAIR VALUE MEASUREMENTS (continued)
Level 2 — Quoted prices in markets that are not active or financial instruments for which significant inputs are observable (including, but not limited to, quoted prices for similar investments, interest rates, foreign exchange rates, volatility and credit spreads), either directly or indirectly;
Level 3 — Prices or valuations that require significant unobservable inputs (including GSAM’s assumptions in determining fair value measurement).
The Trustees have adopted Valuation Procedures that govern the valuation of the portfolio investments held by the Funds, including investments for which market quotations are not readily available. The Trustees have delegated to GSAM day-to-day responsibility for implementing and maintaining internal controls and procedures related to the valuation of the Funds’ portfolio investments. To assess the continuing appropriateness of pricing sources and methodologies, GSAM regularly performs price verification procedures and issues challenges as necessary to third party pricing vendors or brokers, and any differences are reviewed in accordance with the Valuation Procedures.
A. Level 1 and Level 2 Fair Value Investments — The valuation techniques and significant inputs used in determining the fair values for investments classified as Level 1 and Level 2 are as follows:
Equity Securities — Equity securities and investment companies traded on a U.S. securities exchange or the NASDAQ system, or those located on certain foreign exchanges, including but not limited to the Americas, are valued daily at their last sale price or official closing price on the principal exchange or system on which they are traded. If no sale occurs, equity securities and exchange traded investment companies are valued at the last bid price for long positions and at the last ask price for short positions. Investments in investment companies (other than those that are exchange traded) are valued at the NAV on the valuation date. To the extent these investments are actively traded, they are classified as Level 1 of the fair value hierarchy, otherwise they are generally classified as Level 2.
Unlisted equity securities for which market quotations are available are valued at the last sale price on the valuation date, or if no sale occurs, at the last bid price. Securities traded on certain foreign securities exchanges are valued daily at fair value determined by an independent fair value service (if available) under Valuation Procedures approved by the Trustees and consistent with applicable regulatory guidance. The independent fair value service takes into account multiple factors including, but not limited to, movements in the securities markets, certain depositary receipts, futures contracts and foreign currency exchange rates that have occurred subsequent to the close of the foreign securities exchange. These investments are generally classified as Level 2 of the fair value hierarchy.
Debt Securities — Debt securities for which market quotations are readily available are valued daily on the basis of quotations supplied by dealers or an independent pricing service approved by the Trustees. The pricing services may use valuation models or matrix pricing, which consider: (i) yield or price with respect to bonds that are considered comparable in characteristics such as rating, interest rate and maturity date or (ii) quotations from securities dealers to determine current value. Short-term debt obligations that mature in sixty days or less and that do not exhibit signs of credit deterioration are valued at amortized cost, which approximates fair value. With the exception of treasury securities of G8 countries (not held in money market funds), which are generally classified as Level 1, these investments are generally classified as Level 2 of the fair value hierarchy.
i. Mortgage-Backed and Asset-Backed Securities — Mortgage-backed securities represent direct or indirect participations in, or are collateralized by and payable from, mortgage loans secured by residential and/or commercial real estate property. Asset-backed securities include securities whose principal and interest payments are collateralized by pools of other assets or receivables. The value of certain mortgage-backed and asset-backed securities (including adjustable rate mortgage loans) may be particularly sensitive to changes in prevailing interest rates. The value of these securities may also fluctuate in response to the market’s perception of the creditworthiness of the issuers.
Asset-backed securities may present credit risks that are not presented by mortgage-backed securities because they generally do not have the benefit of a security interest in collateral that is comparable to mortgage assets. Some asset-backed securities may only have a subordinated claim on collateral.
62
GOLDMAN SACHS VARIABLE INSURANCE TRUST FUNDS
3. INVESTMENTS AND FAIR VALUE MEASUREMENTS (continued)
Stripped mortgage-backed securities are usually structured with two different classes: one that receives substantially all interest payments (interest-only, or “IO” and/or high coupon rate with relatively low principal amount, or “IOette”), and the other that receives substantially all principal payments (principal-only, or “PO”) from a pool of mortgage loans. Little to no principal will be received at the maturity of an IO; as a result, periodic adjustments are recorded to reduce the cost of the security until maturity. These adjustments are included in interest income
ii. Mortgage Dollar Rolls — Mortgage dollar rolls are transactions whereby a Fund sells mortgage-backed-securities and simultaneously contracts with the same counterparty to repurchase similar securities on a specified future date. During the settlement period, a Fund will not be entitled to accrue interest and receive principal payments on the securities sold.
iii. Treasury Inflation Protected Securities — TIPS are treasury securities in which the principal amount is adjusted daily to keep pace with inflation, as measured by the U.S. Consumer Pricing Index for Urban Consumers. The repayment of the original bond principal upon maturity is guaranteed by the full faith and credit of the U.S. Government.
iv. Structured Notes — The values of structured notes are based on the price movements of a reference security or index. Upon termination, a Fund will receive a payment from the issuer based on the value of the referenced instrument (notional amount multiplied by price of the referenced instrument) and record a realized gain or loss.
v. When-Issued Securities and Forward Commitments — When-issued securities, including TBA (“To Be Announced”) securities, are securities that are authorized but not yet issued in the market and purchased in order to secure what is considered to be an advantageous price or yield to a Fund. A forward commitment involves entering into a contract to purchase or sell securities, typically on an extended settlement basis, for a fixed price at a future date. The purchase of securities on a when-issued or forward commitment basis involves a risk of loss if the value of the security to be purchased declines before the settlement date. Conversely, the sale of securities on a forward commitment basis involves the risk that the value of the securities sold may increase before the settlement date. Although a Fund will generally purchase securities on a when-issued or forward commitment basis with the intention of acquiring the securities for its portfolio, the Fund may dispose of when-issued securities or forward commitments prior to settlement which may result in a realized gain or loss.
Derivative Contracts — A derivative is an instrument whose value is derived from underlying assets, indices, reference rates or a combination of these factors. The Funds enter into derivative transactions to hedge against changes in interest rates, securities prices, and/or currency exchange rates, to increase total return, or to gain access to certain markets or attain exposure to other underliers.
Exchange-traded derivatives, including futures contracts, typically fall within Level 1 of the fair value hierarchy. Over-the-counter (“OTC”) and centrally cleared derivatives are valued using market transactions and other market evidence, including market-based inputs to models, calibration to market-clearing transactions, broker or dealer quotations, or other alternative pricing sources. Where models are used, the selection of a particular model to value OTC and centrally cleared derivative depends upon the contractual terms of, and specific risks inherent in, the instrument, as well as the availability of pricing information in the market. Valuation models require a variety of inputs, including contractual terms, market prices, yield curves, credit curves, measures of volatility, voluntary and involuntary prepayment rates, loss severity rates and correlations of such inputs. For OTC and centrally cleared derivatives that trade in liquid markets, model inputs can generally be verified and model selection does not involve significant management judgment. OTC and centrally cleared derivatives are classified within Level 2 of the fair value hierarchy when significant inputs are corroborated by market evidence.
i. Forward Contracts — A forward contract is a contract between two parties to buy or sell an asset at a specified price on a future date. A forward contract settlement can occur on a cash or delivery basis. Forward contracts are marked-to-market daily using independent vendor prices, and the change in value, if any, is recorded as an unrealized gain or loss.
A forward foreign currency contract is a forward contract in which a Fund agrees to receive or deliver a fixed quantity of one currency for another, at a pre-determined price at a future date. All forward foreign currency exchange contracts are
63
GOLDMAN SACHS VARIABLE INSURANCE TRUST FUNDS
Notes to Financial Statements (continued)
December 31, 2014
3. INVESTMENTS AND FAIR VALUE MEASUREMENTS (continued)
marked-to-market daily at the applicable forward rate. Non-deliverable forward foreign currency exchange contracts are settled with the counterparty in cash without the delivery of foreign currency.
ii. Futures Contracts — Futures contracts are contracts to buy or sell a standardized quantity of a specified commodity or security and are valued based on exchanged settlement prices or independent market quotes. Futures contracts are valued at the last settlement price, or in the absence of a sale, the last bid price for long positions and at the last ask price for short positions, at the end of each day on the board of trade or exchange upon which they are traded. Upon entering into a futures contract, a Fund deposits cash or securities in an account on behalf of the broker in an amount sufficient to meet the initial margin requirement. Subsequent payments are made or received by a Fund equal to the daily change in the contract value and are recorded as variation margin receivable or payable with a corresponding offset to unrealized gains or losses.
iii. Swap Contracts — Bilateral swap contracts are agreements in which a Fund and a counterparty agree to exchange periodic payments on a specified notional amount or make a net payment upon termination. Bilateral swap transactions are privately negotiated in the OTC market and payments are settled through direct payments between a Fund and the counterparty. By contrast, certain swap transactions are subject to mandatory central clearing. These swaps are executed through a derivatives clearing member (“DCM”), acting in an agency capacity, and submitted to a central counterparty (“CCP”)(“centrally cleared swaps”), in which case all payments are settled with the CCP through the DCM. Swaps are marked-to-market daily using pricing vendor quotations, counterparty or clearinghouse prices or model prices, and the change in value, if any, is recorded as an unrealized gain or loss. Upon entering into a swap contract, a Fund is required to satisfy an initial margin requirement by delivering cash or securities to the counterparty (or in some cases, segregated in a triparty account on behalf of the counterparty), which can be adjusted by any mark-to-market gains or losses pursuant to bilateral or centrally cleared arrangements. For centrally cleared swaps the daily change in valuation, if any, is recorded as a receivable or payable for variation margin.
An interest rate swap is an agreement that obligates two parties to exchange a series of cash flows at specified intervals, based upon or calculated by reference to changes in interest rates on a specified notional principal amount. The payment flows are usually netted against each other, with the difference being paid by one party to the other.
B. Level 3 Fair Value Investments — To the extent that the aforementioned significant inputs are unobservable, or if quotations are not readily available, or if GSAM believes that such quotations do not accurately reflect fair value, the fair value of the Funds’ investments may be determined under Valuation Procedures approved by the Trustees. GSAM, consistent with its procedures and applicable regulatory guidance, may make an adjustment to the most recent valuation prices of either domestic or foreign securities in light of significant events to reflect what it believes to be the fair value of the securities at the time of determining a Fund’s NAV. Significant events which could affect a large number of securities in a particular market may include, but are not limited to: significant fluctuations in U.S. or foreign markets; market dislocations; market disruptions; or unscheduled market closings. Significant events which could also affect a single issuer may include, but are not limited to: corporate actions such as reorganizations, mergers and buy-outs; ratings downgrades; and bankruptcies.
64
GOLDMAN SACHS VARIABLE INSURANCE TRUST FUNDS
3. INVESTMENTS AND FAIR VALUE MEASUREMENTS (continued)
C. Fair Value Hierarchy — The following is a summary of the Funds’ investments and derivatives classified in the fair value hierarchy as of December 31, 2014:
| | | | | | | | | | | | |
CORE FIXED INCOME | | | | | | | | | |
| Investment Type | | Level 1 | | | Level 2 | | | Level 3 | |
| Assets | | | | | | | | | | | | |
| Fixed Income | | | | | | | | | | | | |
Corporate Obligations | | $ | — | | | $ | 32,452,832 | | | $ | — | |
Mortgage-Backed Obligations | | | — | | | | 38,684,603 | | | | — | |
U.S. Treasury Obligations and/or Other U.S. Government Agencies | | | 23,878,926 | | | | 4,413,219 | | | | — | |
Asset-Backed Securities | | | — | | | | 7,297,346 | | | | — | |
Foreign Debt Obligations | | | 2,031,477 | | | | 2,384,273 | | | | — | |
Municipal Debt Obligations | | | — | | | | 1,490,379 | | | | — | |
Government Guarantee Obligations | | | — | | | | 1,883,228 | | | | — | |
| Total | | $ | 25,910,403 | | | $ | 88,605,880 | | | $ | — | |
| Liabilities | | | | | | | | | | | | |
| Fixed Income | | | | | | | | | | | | |
Mortgage-Backed Obligations — Forward Sales Contracts | | $ | — | | | $ | (2,024,219 | ) | | $ | — | |
| | | |
| Derivative Type | | | | | | | | | |
| Assets(a) | | | | | | | | | | | | |
| Futures Contracts | | $ | 64,297 | | | $ | — | | | $ | — | |
| Forward Foreign Currency Exchange Contracts | | | — | | | | 230,569 | | | | — | |
| Interest Rate Swap Contracts | | | — | | | | 90,952 | | | | — | |
| Total | | $ | 64,297 | | | $ | 321,521 | | | $ | — | |
| Liabilities(a) | | | | | | | | | | | | |
| Futures Contracts | | $ | (285,438 | ) | | $ | — | | | $ | — | |
| Forward Foreign Currency Exchange Contracts | | | — | | | | (116,365 | ) | | | — | |
| Interest Rate Swap Contracts | | | — | | | | (99,484 | ) | | | — | |
| Total | | $ | (285,438 | ) | | $ | (215,849 | ) | | $ | — | |
EQUITY INDEX | | | | | | | | | |
| Investment Type | | Level 1 | | | Level 2 | | | Level 3 | |
| Assets | | | | | | | | | | | | |
| Common Stock and/or Other Equity Investments(b) | | | | | | | | | | | | |
| North America | | $ | 188,660,548 | | | $ | — | | | $ | — | |
| U.S. Treasury Obligations and/or Other U.S. Government Agencies | | | 99,999 | | | | — | | | | — | |
| Total | | $ | 188,760,547 | | | $ | — | | | $ | — | |
| | | |
| Derivative Type | | | | | | | | | |
| Assets(a) | | | | | | | | | | | | |
| Futures Contracts | | $ | 40,336 | | | $ | — | | | $ | — | |
65
GOLDMAN SACHS VARIABLE INSURANCE TRUST FUNDS
Notes to Financial Statements (continued)
December 31, 2014
3. INVESTMENTS AND FAIR VALUE MEASUREMENTS (continued)
| | | | | | | | | | | | |
GROWTH OPPORTUNITIES | | | | | | | | | |
| Investment Type | | Level 1 | | | Level 2 | | | Level 3 | |
| Assets | | | | | | | | | | | | |
| Common Stock and/or Other Equity Investments(b) | | | | | | | | | | | | |
| North America | | $ | 199,993,749 | | | $ | — | | | $ | — | |
HIGH QUALITY FLOATING RATE | | | | | | | | | |
| Investment Type | | Level 1 | | | Level 2 | | | Level 3 | |
| Assets | | | | | | | | | | | | |
| Fixed Income | | | | | | | | | | | | |
Corporate Obligations | | $ | — | | | $ | 403,889 | | | $ | — | |
Mortgage-Backed Obligations | | | — | | | | 44,164,001 | | | | — | |
Asset-Backed Securities | | | — | | | | 25,579,855 | | | | — | |
| Total | | $ | — | | | $ | 70,147,745 | | | $ | — | |
| | | |
| Derivative Type | | | | | | | | | |
| Assets(a) | | | | | | | | | | | | |
| Futures Contracts | | $ | 52,603 | | | $ | — | | | $ | — | |
| Liabilities(a) | | | | | | | | | | | | |
| Futures Contracts | | $ | (56,076 | ) | | $ | — | | | $ | — | |
| (a) | Amount shown represents unrealized gain (loss) at fiscal year end. |
| (b) | Amounts are disclosed by continent to highlight the impact of time zone differences between local market close and the calculation of net asset value. Security valuations are based on the principal exchange or system on which they are traded, which may differ from country of domicile. The Funds utilize fair value model prices provided by an independent fair value service for international equities, resulting in a Level 2 classification. |
For further information regarding security characteristics, see the Schedules of Investments.
66
GOLDMAN SACHS VARIABLE INSURANCE TRUST FUNDS
4. INVESTMENTS IN DERIVATIVES
The following tables set forth, by certain risk types, the gross value of derivative contracts as of December 31, 2014. These instruments were used to meet the Funds’ investment objectives and to obtain and/or manage exposure related to the risks below. The values in the tables below exclude the effects of cash collateral received or posted pursuant to these derivative contracts, and therefore are not representative of the Funds’ net exposure.
| | | | | | | | | | | | | | |
| Core Fixed Income | | | | | | |
| | | | | |
| Risk | | | | Statements of Assets and Liabilities | | Assets | | | Statements of Assets and Liabilities | | Liabilities | |
| Interest Rate | | | | Variation margin on certain derivative contracts | | | $155,249(a) | | | Variation margin on certain derivative contracts | | $ | (384,922 | )(a) |
| Currency | | | | Receivables for unrealized gain on forward foreign currency exchange contracts | | | 230,569 | | | Payable for unrealized loss on forward foreign currency exchange contracts | | | (116,365 | ) |
| Total | | | | | | $ | 385,818 | | | | | $ | (501,287 | ) |
| | | | | | | | | | | | | | |
| Fund | | Risk | | Statements of Assets and Liabilities | | Assets(a) | | | Statements of Assets and Liabilities | | Liabilities(a) | |
| Equity Index | | Equity | | Variation margin on certain derivative contracts | | | 40,336 | | | — | | $ | — | |
| High Quality Floating Rate | | Interest Rate | | Variation margin on certain derivative contracts | | | 52,603 | | | Variation margin on certain derivative contracts | | | (56,076 | ) |
| (a) | Includes unrealized gain (loss) on futures contracts and swap contracts described in the Additional Investment Information sections of the Schedules of Investments. Only current day’s variation margin is reported within the Statements of Assets and Liabilities. |
The following table sets forth, by certain risk types, the Fund’s gains (losses) related to these derivatives and their indicative volumes for the six months ended June 30, 2014. These gains (losses) should be considered in the context that these derivative contracts may have been executed to create investment opportunities and/or economically hedge certain investments, and accordingly, certain gains (losses) on such derivative contracts may offset certain (losses) gains attributable to investments. These gains (losses) are included in “Net realized gain (loss)” or “Net change in unrealized gain (loss)” on the Statement of Operations:
| | | | | | | | | | | | | | |
| Core Fixed Income | | | | | | | | | |
| Risk | | Statements of Operations | | Net Realized Gain
(Loss) | | | Net Change in
Unrealized Gain
(Loss) | | | Average
Number of
Contracts(a) | |
| Interest Rate | | Net realized gain (loss) from futures contracts and swap contracts/Net change in unrealized gain (loss) on futures contracts and swap contracts | | $ | (571,123 | ) | | $ | (225,402 | ) | | | 349 | |
| Currency | | Net realized gain (loss) from forward foreign currency exchange contracts/Net change in unrealized gain (loss) on forward foreign currency exchange contracts | | | 563,198 | | | | 84,064 | | | | 168 | |
| Total | | | | $ | (7,925 | ) | | $ | (141,338 | ) | | | 517 | |
| (a) | Average number of contracts is based on the average of month end balances for the fiscal year ended December 31, 2014. |
67
GOLDMAN SACHS VARIABLE INSURANCE TRUST FUNDS
Notes to Financial Statements (continued)
December 31, 2014
4. INVESTMENTS IN DERIVATIVES (continued)
The following table represents gains (losses) which are included in “Net realized gain (loss) from future transactions” and “Net change in unrealized gain (loss) on futures” in the Statement of Operations:
| | | | | | | | | | | | | | | | |
| | | | | | | | | | | | |
| Fund | | Risk | | | | Net Realized Gain
(Loss) | | | Net Change in
Unrealized Gain
(Loss) | | | Average
Number of
Contracts(a) | |
| Equity Index | | Equity | | | | $ | 176,042 | | | $ | (14,108 | ) | | | 15 | |
| High Quality Floating Rate | | Interest Rate | | | | | (412,695 | ) | | | (223,688 | ) | | | 164 | |
| (a) | Average number of contracts is based on the average of month end balances for the fiscal year ended December 31, 2014. |
5. AGREEMENTS AND AFFILIATED TRANSACTIONS
A. Management Agreement — Under the Agreement, GSAM manages the Funds, subject to the general supervision of the Trustees.
As compensation for the services rendered pursuant to the Agreement, the assumption of the expenses related thereto and administration of the Funds’ business affairs, including providing facilities, GSAM is entitled to a management fee, accrued daily and paid monthly, equal to an annual percentage rate of each Fund’s average daily net assets.
For the fiscal year ended December 31, 2014, contractual and effective net management fees with GSAM were at the following rates:
| | | | | | | | | | | | | | | | | | | | | | | | | | | | |
| Contractual Management Fee Rate | |
| Fund | | First $1 billion | | | Next $1 billion | | | Next $3 billion | | | Next $3 billion | | | Over $8 billion | | | Effective
Rate | | | Effective Net Management
Fee Rate | |
| Core Fixed Income | | | 0.40 | % | | | 0.36 | % | | | 0.34 | % | | | 0.33 | % | | | 0.32 | % | | | 0.40 | % | | | 0.40 | % |
| Growth Opportunities | | | 1.00 | | | | 1.00 | | | | 0.90 | | | | 0.86 | | | | 0.84 | | | | 1.00 | | | | 0.97 | * |
| High Quality Floating Rate | | | 0.40 | | | | 0.36 | | | | 0.34 | | | | 0.33 | | | | 0.32 | | | | 0.40 | | | | 0.31 | * |
| * | GSAM has agreed to waive a portion of its management fee in order to achieve net effective management fee rates, as defined in the Fund’s most recent prospectus. These waivers will be effective through at least April 30, 2015 and prior to such date GSAM may not terminate the arrangement without approval of the Trustees. The Effective Net Management Rates above are calculated based on management rates before and after the waivers had been adjusted, if applicable. |
The Agreement for the Equity Index Fund provides for a contractual management fee at an annual rate equal to 0.30% of the Fund’s average daily net assets. For the fiscal year ended December 31, 2014, GSAM agreed to waive a portion of its management fee in order to achieve the following effective annual rates which will remain in effect through April 30, 2015 and prior to such date GSAM may not terminate the arrangement without the approval of the Trustees:
| | | | | | |
| Management Rate |
| Fund | | $0-$400 million | | Over $400 million | | Effective Rate |
| Equity Index | | 0.21% | | 0.20% | | 0.21% |
As authorized by the Agreement, GSAM has entered into a Sub-advisory Agreement with SSgA which serves as the sub-adviser to the Equity Index Fund and provides the day-to-day advice regarding the Fund’s portfolio transactions. As compensation for its services, SSgA is entitled to a fee, accrued daily and paid monthly by GSAM, at the following annual rates of the Fund’s
68
GOLDMAN SACHS VARIABLE INSURANCE TRUST FUNDS
5. AGREEMENTS AND AFFILIATED TRANSACTIONS (continued)
average daily net assets: 0.03% on the first $50 million, 0.02% on the next $200 million, 0.01% on the next $750 million and 0.008% over $1 billion. The effective Sub-advisory fee was 0.02% for the fiscal year ended December 31, 2014.
B. Distribution and Service Plans — The Trust, on behalf of each Fund, has adopted Distribution and Service Plans (the “Plans”). Under the Plans, Goldman Sachs, which serves as distributor (the “Distributor”), is entitled to a fee accrued daily and paid monthly, for distribution services and personal and account maintenance services, which may then be paid by Goldman Sachs to authorized dealers, equal to, on an annual basis, 0.25% and 0.40% of the Fund’s average daily net assets attributable to Service and Advisor Shares, respectively. For the fiscal year ended December 31, 2014 for the Growth Opportunities Fund, Goldman Sachs agreed to waive distribution and services fees so as not to exceed an annual rate of 0.16% of average daily net assets of the Fund. This distribution and service fee waiver will remain in place through at least April 30, 2015, and prior to such date Goldman Sachs may not terminate the arrangement without the approval of the Trustees.
C. Transfer Agency Agreement — Goldman Sachs also serves as the transfer agent of the Funds for a fee pursuant to a Transfer Agency Agreement. The fees charged for such transfer agency services are accrued daily and paid monthly at an annual rate of 0.02% of the average daily net assets for Institutional, Service and Advisor Shares.
D. Other Expense Agreements and Affiliated Transactions — GSAM has agreed to limit certain “Other Expenses” of the Funds (excluding transfer agency fees and expenses, taxes, interest, brokerage fees, shareholder meetings, litigation, indemnification and extraordinary expenses) to the extent such expenses exceed, on an annual basis, a percentage rate of the average daily net assets of each Fund. Such Other Expense reimbursements, if any, are accrued daily and paid monthly. In addition, the Funds are not obligated to reimburse GSAM for prior fiscal year expense reimbursements, if any. The Other Expense limitations as an annual percentage rate of average daily net assets for Core Fixed Income, Equity Index, Growth Opportunities and High Quality Floating Rate Funds are 0.004%, 0.004%, 0.004% and 0.074%, respectively. These Other Expense limitations will remain in place through at least April 30, 2015, and prior to such date GSAM may not terminate the arrangements without the approval of the Trustees. The Funds bear their respective share of costs related to proxy and shareholder meetings, and GSAM has agreed to reimburse each Fund to the extent such expenses exceed a specified percentage of the Fund’s net assets. In addition, the Funds have entered into certain offset arrangements with the custodian and the transfer agent, which may result in a reduction of the Funds’ expenses and are received irrespective of the application of the “Other Expense” limitations described above.
For the fiscal year ended December 31, 2014, these expense reductions, including any fee waivers and Other Expense reimbursements, were as follows:
| | | | | | | | | | | | | | | | | | | | | | |
| Fund | | | | Management
Fee Waiver | | | Distribution and
Service Fee
Waiver | | | Custody Fee
Credits | | | Other Expense
Reimbursement | | | Total Expense
Reductions | |
| Core Fixed Income | | | | $ | — | | | $ | — | | | $ | 2,818 | | | $ | 253,185 | | | $ | 256,003 | |
| Equity Index | | | | | 170,692 | | | | — | | | | 794 | | | | 235,955 | | | | 407,441 | |
| Growth Opportunities | | | | | 59,438 | | | | 178,294 | | | | 1,831 | | | | 210,857 | | | | 450,420 | |
| High Quality Floating Rate | | | | | 69,766 | | | | — | | | | 2,063 | | | | 154,723 | | | | 226,552 | |
E. Line of Credit Facility — As of December 31, 2014, the Funds participated in a $1,080,000,000 committed, unsecured revolving line of credit facility (the “facility”) together with other funds of the Trust and registered investment companies having management agreements with GSAM or its affiliates (“Other Borrowers”). Pursuant to the terms of the facility, the Funds and Other Borrowers could increase the credit amount by an additional $120,000,000, for a total of up to $1,200,000,000. This facility is to be used solely for temporary or emergency purposes, which may include the funding of redemptions. The interest rate on borrowings is based on the federal funds rate. The facility also requires a fee to be paid by the Funds based on the amount of the commitment that has not been utilized. For the fiscal year ended December 31, 2014, the Funds did not have any borrowings under the facility.
69
GOLDMAN SACHS VARIABLE INSURANCE TRUST FUNDS
Notes to Financial Statements (continued)
December 31, 2014
5. AGREEMENTS AND AFFILIATED TRANSACTIONS (continued)
F. Other Transactions with Affiliates — For the fiscal year ended December 31, 2014, Goldman Sachs earned $34 and $941 in brokerage commissions from portfolio transactions, including futures transactions executed with Goldman Sachs as the Futures Commission Merchant, on behalf of the Core Fixed Income and Growth Opportunities, respectively.
The following table provides information about the investment in shares of issuers of which a Fund is an affiliate for the fiscal year ended December 31, 2014:
| | | | | | | | | | | | | | | | | | | | | | | | | | | | | | |
| Fund | | | | Market Value 12/31/2013 | | | Purchases at Cost | | | Proceeds from Sales | | | Net Realized Gain (Loss) | | | Change in
Unrealized Appreciation (Depreciation) | | | Market Value
12/31/2014 | | | Dividend
Income | |
| Equity Index | | | | $ | 865,029 | | | $ | — | | | $ | (123,809 | ) | | $ | 21,025 | | | $ | 46,801 | | | $ | 809,046 | | | $ | 10,220 | |
As of December 31, 2014, the Goldman Sachs Group, Inc. was the beneficial owner of approximately 100% the Institutional Class Shares of the Core Fixed Income, Growth Opportunities and High Quality Floating Rate Funds.
6. PORTFOLIO SECURITIES TRANSACTIONS
The cost of purchases and proceeds from sales and maturities of long-term securities for the fiscal year ended December 31, 2014, were as follows:
| | | | | | | | | | | | | | | | | | |
| Fund | | | | Purchases of U.S.
Government and
Agency Obligations | | | Purchases
(Excluding U.S.
Government and
Agency Obligations) | | | Sales and
Maturities of U.S.
Government and
Agency Obligations | | | Sales and
Maturities
(Excluding U.S.
Government and
Agency Obligations) | |
| Core Fixed Income | | | | $ | 396,717,745 | | | | 26,854,838 | | | $ | 385,294,189 | | | | 37,142,801 | |
| Equity Index | | | | | — | | | | 4,617,299 | | | | — | | | | 28,632,354 | |
| Growth Opportunities | | | | | — | | | | 122,782,598 | | | | — | | | | 145,860,342 | |
| High Quality Floating Rate | | | | | 1,159,998 | | | | 11,653,888 | | | | 4,887,017 | | | | 13,516,072 | |
7. TAX INFORMATION
The tax character of distributions paid during the fiscal year ended December 31, 2014 was as follows:
| | | | | | | | | | | | | | | | |
| | | Core Fixed Income | | | Equity Index | | | Growth Opportunities | | | High Quality Floating Rate | |
| Distributions paid from: | | | | | | | | | | | | | | | | |
Ordinary income | | $ | 3,006,463 | | | $ | 3,027,833 | | | $ | 5,164,234 | | | $ | 229,535 | |
Net long-term capital gains | | | — | | | | 3,936,430 | | | | 32,907,674 | | | | — | |
| Total taxable distributions | | $ | 3,006,463 | | | $ | 6,964,263 | | | $ | 38,071,908 | | | $ | 229,535 | |
70
GOLDMAN SACHS VARIABLE INSURANCE TRUST FUNDS
7. TAX INFORMATION (continued)
The tax character of distributions paid during the fiscal year ended December 31, 2013 was as follows:
| | | | | | | | | | | | | | | | |
| | | Core Fixed Income | | | Equity Index | | | Growth Opportunities | | | High Quality Floating Rate | |
| Distributions paid from: | | | | | | | | | | | | | | | | |
| Ordinary income | | $ | 3,066,866 | | | $ | 2,941,172 | | | $ | 2,428,892 | | | $ | 677,458 | |
| Net long-term capital gains | | | — | | | | — | | | | 10,186,747 | | | | 71,361 | |
| Total taxable distributions | | $ | 3,066,866 | | | $ | 2,941,172 | | | $ | 12,615,639 | | | $ | 748,819 | |
| Tax return of capital | | $ | — | | | $ | — | | | $ | — | | | $ | 38,185 | |
As of December 31, 2014, the components of accumulated earnings (losses) on a tax-basis were as follows:
| | | | | | | | | | | | | | | | |
| | | Core Fixed Income | | | Equity Index | | | Growth Opportunities | | | High Quality Floating Rate | |
| Undistributed ordinary income — net | | $ | 289,198 | | | $ | 230,946 | | | $ | 100,371 | | | $ | 69,757 | |
| Undistributed long-term capital gains | | | — | | | | 1,661,672 | | | | 2,740,050 | | | | — | |
| Total undistributed earnings | | $ | 289,198 | | | $ | 1,892,618 | | | $ | 2,840,421 | | | $ | 69,757 | |
| Capital loss carryforwards:(1) | | | | | | | | | | | | | | | | |
Expiring 2017 | | $ | (965,538 | ) | | $ | — | | | $ | — | | | $ | — | |
Expiring 2018 | | | (4,488,774 | ) | | | — | | | | — | | | | — | |
Perpetual short-term | | | | | | | | | | | | | | | (231,681 | ) |
Perpetual long-term | | | | | | | | | | | | | | | (405,174 | ) |
| Total capital loss carryforwards | | $ | (5,454,312 | ) | | $ | — | | | $ | — | | | $ | (636,855 | ) |
Timing differences (Qualified late year loss and straddle loss deferrals and deferred dividend) | | | (1,164,225 | ) | | | 1,801 | | | | (1,022,515 | ) | | | (61,609 | ) |
| Unrealized gains — net | | | 3,724,371 | | | | 86,019,748 | | | | 47,320,384 | | | | 290,056 | |
| Total accumulated earnings (losses) — net | | $ | (2,604,968 | ) | | $ | 87,914,167 | | | $ | 49,138,290 | | | $ | (338,651 | ) |
| (1) | Expiration occurs on December 31 of the year indicated. The Core Fixed Income and Equity Index Funds utilized $1,173,775 and $2,006,527, respectively, of capital losses in the current fiscal year. |
As of December 31, 2014, the Funds’ aggregate security unrealized gains and losses based on cost for U.S. federal income tax purposes were as follows:
| | | | | | | | | | | | | | | | |
| | | Core Fixed Income | | | Equity Index | | | Growth Opportunities | | | High Quality Floating Rate | |
| Tax cost | | $ | 110,750,408 | | | $ | 102,740,799 | | | $ | 152,673,365 | | | $ | 69,857,689 | |
| Gross unrealized gain | | | 4,427,479 | | | | 99,847,550 | | | | 51,176,690 | | | | 435,524 | |
| Gross unrealized loss | | | (661,604 | ) | | | (13,827,802 | ) | | | (3,856,306 | ) | | | (145,468 | ) |
| Net unrealized security gain | | $ | 3,765,875 | | | $ | 86,019,748 | | | $ | 47,320,384 | | | $ | 290,056 | |
71
GOLDMAN SACHS VARIABLE INSURANCE TRUST FUNDS
Notes to Financial Statements (continued)
December 31, 2014
7. TAX INFORMATION (continued)
The difference between GAAP-basis and tax-basis unrealized gains (losses) is attributable primarily to wash sales, net mark to market gains (losses) on regulated futures and foreign currency contracts, differences related to the tax treatment of underlying fund investments and foreign currency transactions, real estate investment trust investments, and securities on loan.
In order to present certain components of the Funds’ capital accounts on a tax-basis, certain reclassifications have been recorded to the Funds’ accounts. These reclassifications have no impact on the net asset value of the Funds and result primarily from net operating losses, and differences in the tax treatment of foreign currency transactions and partnership investments, paydown gains and losses, real estate investment trust investments and underlying fund investments.
| | | | | | | | |
| Fund | | Accumulated
Net Realized
Gain (Loss) | | | Undistributed
Net Investment
Income (Loss) | |
| Core Fixed Income | | $ | (704,884 | ) | | $ | 704,884 | |
| Equity Index | | | 2,292 | | | | (2,292 | ) |
| Growth Opportunities | | | (781,272 | ) | | | 781,272 | |
| High Quality Floating Rate | | | (108,083 | ) | | | 108,083 | |
GSAM has reviewed the Funds’ tax positions for all open tax years (the current and prior three years, as applicable) and has concluded that no provision for income tax is required in the Funds’ financial statements. Such open tax years remain subject to examination and adjustment by tax authorities.
8. OTHER RISKS
The Funds’ risks include, but are not limited to, the following:
Large Shareholder Transaction Risk — The Funds may experience adverse effects when certain large shareholders, such as other funds, participating insurance companies, accounts and Goldman Sachs affiliates, purchase or redeem large amounts of shares of the Funds. Such large shareholder redemptions may cause the Funds to sell portfolio securities at times when they would not otherwise do so, which may negatively impact the Funds’ NAVs and liquidity. Similarly, large Fund share purchases may adversely affect the Funds’ performance to the extent that the Funds are delayed in investing new cash and are required to maintain larger cash positions than they ordinarily would. These transactions may also increase transaction costs. In addition, a large redemption could result in the Funds’ current expenses being allocated over smaller asset bases, leading to increases in the Funds’ expense ratios.
Liquidity Risk — The Funds may make investments that are illiquid or that may become less liquid in response to market developments or adverse investor perceptions. Illiquid investments may be more difficult to value. Liquidity risk may also refer to the risk that a Fund will not be able to pay redemption proceeds within the allowable time period because of unusual market conditions, an unusually high volume of redemption requests, or other reasons. To meet redemption requests, a Fund may be forced to sell investments at an unfavorable time and/or under unfavorable conditions. Liquidity risk may be the result of, among other things, the reduced number and capacity of traditional market participants to make a market in fixed income securities or the lack of an active market. The potential for liquidity risk may be magnified by a rising interest rate environment or other circumstances where investor redemptions from fixed income mutual funds may be higher than normal, potentially causing increased supply in the market due to selling activity.
72
GOLDMAN SACHS VARIABLE INSURANCE TRUST FUNDS
8. OTHER RISKS (continued)
Market and Credit Risks — In the normal course of business, the Funds trade financial instruments and enter into financial transactions where risk of potential loss exists due to changes in the market (market risk). Additionally, the Funds may also be exposed to credit risk in the event that an issuer or guarantor fails to perform or that an institution or entity with which the Funds have unsettled or open transactions defaults.
9. INDEMNIFICATIONS
Under the Trust’s organizational documents, its Trustees, officers, employees and agents are indemnified, to the extent permitted by the Act and state law, against certain liabilities that may arise out of performance of their duties to the Funds. Additionally, in the course of business, the Funds enter into contracts that contain a variety of indemnification clauses. The Funds’ maximum exposure under these arrangements is unknown, as this would involve future claims that may be made against the Funds that have not yet occurred. However, GSAM believes the risk of loss under these arrangements to be remote.
10. SUBSEQUENT EVENTS
Subsequent events after the Statement of Assets and Liabilities date have been evaluated through the date the financial statements were issued. GSAM has concluded that there is no impact requiring adjustment or disclosure in the financial statements.
11. SUMMARY OF SHARE TRANSACTIONS
Share activity is as follows:
| | | | | | | | | | | | | | | | |
| | | Core Fixed Income Fund | |
| | | For the Fiscal Year Ended
December 31, 2014 | | | For the Fiscal Year Ended
December 31, 2013 | |
| | | Shares | | | Dollars | | | Shares | | | Dollars | |
| Institutional Shares(a) | | | | | | | | | | | | | | | | |
| Shares sold | | | — | | | $ | — | | | | 2,292 | | | $ | 25,005 | |
| Reinvestment of distributions | | | 71 | | | | 758 | | | | 43 | | | | 453 | |
| | | | 71 | | | | 758 | | | | 2,335 | | | | 25,458 | |
| Service Shares | | | | | | | | | | | | | | | | |
| Shares sold | | | 438,205 | | | | 4,700,540 | | | | 499,125 | | | | 5,326,444 | |
| Reinvestment of distributions | | | 280,874 | | | | 3,005,705 | | | | 289,474 | | | | 3,066,413 | |
| Shares redeemed | | | (1,889,001 | ) | | | (20,249,586 | ) | | | (2,116,494 | ) | | | (22,521,179 | ) |
| | | | (1,169,922 | ) | | | (12,543,341 | ) | | | (1,327,895 | ) | | | (14,128,322 | ) |
| NET DECREASE | | | (1,169,851 | ) | | $ | (12,542,583 | ) | | | (1,325,560 | ) | | $ | (14,102,864 | ) |
| (a) | Commenced operations on April 30, 2013. |
73
GOLDMAN SACHS VARIABLE INSURANCE TRUST FUNDS
Notes to Financial Statements (continued)
December 31, 2014
11. SUMMARY OF SHARE TRANSACTIONS (continued)
| | | | | | | | | | | | | | | | |
| | | Equity Index Fund | |
| | | For the Fiscal Year Ended
December 31, 2014 | | | For the Fiscal Year Ended
December 31, 2013 | |
| | | Shares | | | Dollars | | | Shares | | | Dollars | |
| Service Shares | | | | | | | | | | | | | | | | |
| Shares sold | | | 142,493 | | | $ | 2,039,103 | | | | 269,672 | | | $ | 3,333,154 | |
| Reinvestment of distributions | | | 477,986 | | | | 6,964,263 | | | | 219,654 | | | | 2,941,172 | |
| Shares redeemed | | | (2,049,644 | ) | | | (29,369,734 | ) | | | (2,232,495 | ) | | | (27,165,802 | ) |
| NET DECREASE | | | (1,429,165 | ) | | $ | (20,366,368 | ) | | | (1,743,169 | ) | | $ | (20,891,476 | ) |
| | | | | | | | | | | | | | | | |
| | | Growth Opportunities Fund | |
| | | For the Fiscal Year Ended
December 31, 2014 | | | For the Fiscal Year Ended
December 31, 2013 | |
| | | Shares | | | Dollars | | | Shares | | | Dollars | |
| Institutional Shares(a) | | | | | | | | | | | | | | | | |
| Shares sold | | | — | | | $ | — | | | | 3,264 | | | $ | 25,008 | |
| Reinvestment of distributions | | | 832 | | | | 6,255 | | | | 221 | | | | 1,862 | |
| | | | 832 | | | | 6,255 | | | | 3,485 | | | | 26,870 | |
| Service Shares | | | | | | | | | | | | | | | | |
| Shares sold | | | 1,141,458 | | | | 10,066,903 | | | | 785,642 | | | | 6,035,127 | |
| Reinvestment of distributions | | | 5,082,196 | | | | 38,065,653 | | | | 1,498,073 | | | | 12,613,777 | |
| Shares redeemed | | | (3,572,070 | ) | | | (31,492,267 | ) | | | (3,560,989 | ) | | | (28,504,978 | ) |
| | | | 2,651,584 | | | | 16,640,289 | | | | (1,277,274 | ) | | | (9,856,074 | ) |
| NET INCREASE (DECREASE) | | | 2,652,416 | | | $ | 16,646,544 | | | | (1,273,789 | ) | | $ | (9,829,204 | ) |
| (a) | Commenced operations on April 30, 2013. |
74
GOLDMAN SACHS VARIABLE INSURANCE TRUST FUNDS
11. SUMMARY OF SHARE TRANSACTIONS (continued)
| | | | | | | | | | | | | | | | |
| | | | | | | | | | | | | | | | |
| | | High Quality Floating Rate Fund | |
| | | For the Fiscal Year Ended
December 31, 2014 | | | For the Fiscal Year Ended
December 31, 2013 | |
| | | Shares | | | Dollars | | | Shares | | | Dollars | |
| Institutional Shares(a) | | | | | | | | | | | | | | | | |
| Shares sold | | | — | | | $ | — | | | | 2,368 | | | $ | 25,001 | |
| Reinvestment of distributions | | | 8 | | | | 90 | | | | 23 | | | | 245 | |
| | | | 8 | | | | 90 | | | | 2,391 | | | | 25,246 | |
| Service Shares | | | | | | | | | | | | | | | | |
| Shares sold | | | 869,494 | | | | 9,117,538 | | | | 2,042,245 | | | | 21,532,291 | |
| Reinvestment of distributions | | | 21,888 | | | | 229,445 | | | | 74,885 | | | | 786,759 | |
| Shares redeemed | | | (1,174,122 | ) | | | (12,308,954 | ) | | | (1,195,532 | ) | | | (12,600,399 | ) |
| | | | (282,740 | ) | | | (2,961,971 | ) | | | 921,598 | | | | 9,718,651 | |
| Advisor shares(b) | | | | | | | | | | | | | | | | |
| Shares sold | | | 952 | | | | 10,000 | | | | – | | | | – | |
| NET INCREASE (DECREASE) | | | (281,780 | ) | | $ | (2,951,881 | ) | | | 923,989 | | | $ | 9,743,897 | |
| (a) | Commenced operations on April 30, 2013. |
| (b) | Commenced operations on October 15, 2014. |
75
Report of Independent Registered Public Accounting Firm
To the Board of Trustees and Shareholders of
Goldman Sachs Variable Insurance Trust:
In our opinion, the accompanying statements of assets and liabilities, including the schedules of investments, and the related statements of operations and of changes in net assets and the financial highlights present fairly, in all material respects, the financial position of Goldman Sachs Core Fixed Income Fund, Goldman Sachs Equity Index Fund, Goldman Sachs Growth Opportunities Fund and Goldman Sachs High Quality Floating Rate Fund (formerly the Goldman Sachs Government Income Fund) (collectively the “Funds”), Funds of Goldman Sachs Variable Insurance Trust, at December 31, 2014, the results of each of their operations, the changes in each of their net assets and the financial highlights for each of the periods indicated in conformity with accounting principles generally accepted in the United States of America. These financial statements and financial highlights (hereafter referred to as “financial statements”) are the responsibility of the Funds’ management. Our responsibility is to express an opinion on these financial statements based on our audits. We conducted our audits of these financial statements in accordance with the standards of the Public Company Accounting Oversight Board (United States). Those standards require that we plan and perform the audit to obtain reasonable assurance about whether the financial statements are free of material misstatement. An audit includes examining, on a test basis, evidence supporting the amounts and disclosures in the financial statements, assessing the accounting principles used and significant estimates made by management, and evaluating the overall financial statement presentation. We believe that our audits, which included confirmation of securities at December 31, 2014, by correspondence with the custodian, transfer agent, brokers, and the application of alternative auditing procedures where securities purchased confirmations had not been received, provide a reasonable basis for our opinion.
PricewaterhouseCoopers LLP
Boston, Massachusetts
February 19, 2015
76
GOLDMAN SACHS VARIABLE INSURANCE TRUST FUNDS
| | |
| Fund Expenses — Six Month Period Ended December 31, 2014 (Unaudited) | | |
As a shareholder of Institutional, Service or Advisor Shares of the Fund, you incur ongoing costs, including management fees, distribution and service (12b-1) fees (with respect to Service and Advisor Shares) and other Fund expenses. This example is intended to help you understand your ongoing costs (in dollars) of investing in the Institutional Shares, Service Shares and Advisor Shares of the Funds and to compare these costs with the ongoing costs of investing in other mutual funds.
The example is based on an investment of $1,000 invested at the beginning of the period and held for the entire period from July 1, 2014 through December 31, 2014.
Actual Expenses — The first line under each share class in the table below provides information about actual account values and actual expenses. You may use the information in this line, together with the amount you invested, to estimate the expenses that you paid over the period. Simply divide your account value by $1,000 (for example, an $8,600 account value divided by $1,000=8.6), then multiply the result by the number in the first line under the heading entitled “Expenses Paid” to estimate the expenses you paid on your account during this period.
Hypothetical Example for Comparison Purposes — The second line under each share class in the table below provides information about hypothetical account values and hypothetical expenses based on the Funds’ actual net expense ratio and an assumed rate of return of 5% per year before expenses, which is not the Funds’ actual return. The hypothetical account values and expenses may not be used to estimate the actual ending account balance or expenses you paid for the period. You may use this information to compare the ongoing costs of investing in the Funds and other funds. To do so, compare this 5% hypothetical example with the 5% hypothetical examples that appear in the shareholder reports of the other funds.
Please note that the expenses shown in the table are meant to highlight your ongoing costs only. As a shareholder of the Fund you do not incur any transaction costs, such as sales charges, redemption fees, or exchange fees, but shareholders of other funds may incur such costs. The second line of the table is useful in comparing ongoing costs only, and will not help you determine the relative total costs of owning different funds whose shareholders may incur transaction costs.
| | | | | | | | | | | | | | | | | | | | | | | | | | | | | | | | | | | | | | | | | | | | | | | | |
| | | Core Fixed Income Fund | | | Equity Index Fund | | | Growth Opportunities Fund | | | High Quality Floating Rate Fund | |
| Share Class | | Beginning
Account
Value
7/01/14 | | | Ending
Account
Value
12/31/14 | | | Expenses
Paid for the
6 Months
Ended
12/31/14* | | | Beginning
Account
Value
7/01/14 | | | Ending
Account
Value
12/31/14 | | | Expenses
Paid for the
6 Months
Ended
12/31/14* | | | Beginning
Account
Value
7/01/14 | | | Ending
Account
Value
12/31/14 | | | Expenses
Paid for the
6 Months
Ended
12/31/14* | | | Beginning
Account
Value
7/01/14 | | | Ending
Account
Value
12/31/14 | | | Expenses
Paid for the
6 Months
Ended
12/31/14* | |
Institutional | | | | | | | | | | | | | | | | | | | | | | | | | | | | | | | | | | | | | | | | | | | | | | | | |
Actual | | $ | 1,000 | | | $ | 1,017.40 | | | $ | 2.39 | | | | N/A | | | | N/A | | | | N/A | | | $ | 1,000 | | | $ | 1,061.30 | | | $ | 5.40 | | | $ | 1,000 | | | $ | 999.80 | | | $ | 1.97 | |
Hypothetical 5% return | | | 1,000 | | | | 1,022.84 | + | | | 2.40 | | | | N/A | | | | N/A | | | | N/A | | | | 1,000 | | | | 1,019.96 | + | | | 5.30 | | | | 1,000 | | | | 1,023.24 | + | | | 1.99 | |
Service | | | | | | | | | | | | | | | | | | | | | | | | | | | | | | | | | | | | | | | | | | | | | | | | |
Actual | | $ | 1,000 | | | $ | 1,016.70 | | | $ | 3.56 | | | $ | 1,000 | | | $ | 1,059.40 | | | $ | 2.44 | | | $ | 1,000 | | | $ | 1,060.30 | | | $ | 6.23 | | | $ | 1,000 | | | $ | 999.10 | | | $ | 3.33 | |
Hypothetical 5% return | | | 1,000 | | | | 1,021.68 | + | | | 3.57 | | | | 1,000 | | | | 1,022.84 | + | | | 2.40 | | | | 1,000 | | | | 1,019.16 | + | | | 6.11 | | | | 1,000 | | | | 1,021.88 | + | | | 3.36 | |
Advisor(a) | | | | | | | | | | | | | | | | | | | | | | | | | | | | | | | | | | | | | | | | | | | | | | | | |
Actual | | | N/A | | | | N/A | | | | N/A | | | | N/A | | | | N/A | | | | N/A | | | | N/A | | | | N/A | | | | N/A | | | $ | 1,000 | | | $ | 1,049.00 | | | $ | 1.66 | |
Hypothetical 5% return | | | N/A | | | | N/A | | | | N/A | | | | N/A | | | | N/A | | | | N/A | | | | N/A | | | | N/A | | | | N/A | | | | 1,000 | | | | 1,021.32 | + | | | 3.92 | |
| | (a) | Commenced operations on October 15, 2014 | |
| | * | Expenses are calculated using each Fund’s annualized net expense ratio for each class, which represents the ongoing expenses as a percentage of net assets for the six months ended December 31, 2014. Expenses are calculated by multiplying the annualized net expense ratio by the average account value for the period; then multiplying the result by the number of days in the most recent fiscal half year; and then dividing that result by the number of days in the fiscal year. The annualized net expense ratios for the period were as follows: | |
| | | | | | | | | | | | |
| Fund | | Institutional | | | Service | | | Advisor | |
| Core Fixed Income | | | 0.47% | | | | 0.70% | | | | N/A | |
| Equity Index | | | N/A | | | | 0.47% | | | | N/A | |
| Growth Opportunities | | | 1.04% | | | | 1.20% | | | | N/A | |
| High Quality Floating Rate | | | 0.39% | | | | 0.66% | | | | 0.77% | |
| | + | Hypothetical expenses are based on each Fund’s actual annualized net expense ratios and an assumed rate of return of 5% per year before expenses. | |
77
GOLDMAN SACHS VARIABLE INSURANCE TRUST FUNDS
Trustees and Officers (Unaudited)
Independent Trustees
| | | | | | | | | | | | |
| | | | | |
Name,
Address and Age1 | | Position(s) Held
with the Trust | | Term of Office and
Length of
Time Served2 | | Principal Occupation(s) During Past 5 Years | | Number of
Portfolios in
Fund Complex
Overseen by
Trustee3 | | | Other Directorships Held by Trustee4 |
Ashok N. Bakhru Age: 72 | | Chairman of the Board of Trustees | | Since 1996 (Trustee since 1991) | | Mr. Bakhru is retired. He was formerly Director, Apollo Investment Corporation (a business development company) (2008-2013); President, ABN Associates (a management and financial consulting firm) (1994-1996 and 1998-2012); Trustee, Scholarship America (1998-2005); Trustee, Institute for Higher Education Policy (2003-2008); Director, Private Equity Investors — III and IV (1998-2007), and Equity-Linked Investors II (April 2002-2007). Chairman of the Board of Trustees — Goldman Sachs Fund Complex. | | | 128 | | | None |
John P. Coblentz, Jr. Age: 73 | | Trustee | | Since 2003 | | Mr. Coblentz is retired. Formerly, he was Partner, Deloitte & Touche LLP (1975-2003); Director, Emerging Markets Group, Ltd. (2004-2006); and Director, Elderhostel, Inc. (2006-2012). Trustee — Goldman Sachs Fund Complex. | | | 128 | | | None |
Diana M. Daniels Age: 65 | | Trustee | | Since 2007 | | Ms. Daniels is retired. Formerly, she was Vice President, General Counsel and Secretary, The Washington Post Company (1991-2006). Ms. Daniels serves as a Presidential Councillor of Cornell University (2013-Present); Member, Advisory Board, Psychology Without Borders (international humanitarian aid organization) (2007-Present), and former Member of the Legal Advisory Board, New York Stock Exchange (2003-2006) and of the Corporate Advisory Board, Standish Mellon Management Advisors (2006-2007). Trustee — Goldman Sachs Fund Complex. | | | 108 | | | None |
Joseph P. LoRusso Age: 57 | | Trustee | | Since 2010 | | Mr. LoRusso is retired. Formerly, he was President, Fidelity Investments Institutional Services Co. (“FIIS”) (2002-2008); Director, FIIS (2002-2008); Director, Fidelity Investments Institutional Operations Company (2003-2007); Executive Officer, Fidelity Distributors Corporation (2007-2008). Trustee — Goldman Sachs Fund Complex. | | | 108 | | | None |
Herbert J. Markley Age: 64 | | Trustee | | Since 2013 | | Mr. Markley is retired. Formerly, he was Executive Vice President, Deere & Company (an agricultural and construction equipment manufacturer) (2007-2009), and President, Agricultural Division, Deere & Company (2001-2007). Trustee — Goldman Sachs Fund Complex. | | | 108 | | | None |
Jessica Palmer Age: 65 | | Trustee | | Since 2007 | | Ms. Palmer is retired. She is Director, Emerson Center for the Arts and Culture (2011-Present); and was formerly a Consultant, Citigroup Human Resources Department (2007-2008); Managing Director, Citigroup Corporate and Investment Banking (previously, Salomon Smith Barney/Salomon Brothers) (1984-2006). Ms. Palmer was a Member of the Board of Trustees of Indian Mountain School (private elementary and secondary school) (2004-2009). Trustee — Goldman Sachs Fund Complex. | | | 108 | | | None |
Richard P. Strubel Age: 75 | | Trustee | | Since 1987 | | Mr. Strubel is retired. Formerly, he was Director, Cardean Learning Group (provider of educational services via the internet) (2003-2008); and Director, Gildan Activewear Inc. (a clothing marketing and manufacturing company) (2000-2014). He serves as Trustee, Emeritus, The University of Chicago (1987-Present). Trustee — Goldman Sachs Fund Complex. | | | 128 | | | The Northern Trust Mutual Fund Complex (56 Portfolios) (Chairman of the Board of Trustees) |
| | | | | | | | | | | | |
78
GOLDMAN SACHS VARIABLE INSURANCE TRUST FUNDS
Trustees and Officers (Unaudited) (continued)
Independent Trustees (continued)
| | | | | | | | | | | | |
| | | | | |
Name,
Address and Age1 | | Position(s) Held
with the Trust | | Term of Office and
Length of
Time Served2 | | Principal Occupation(s) During Past 5 Years | | Number of
Portfolios in
Fund Complex
Overseen by
Trustee3 | | | Other Directorships Held by Trustee4 |
Roy W. Templin Age: 54 | | Trustee | | Since 2013 | | Mr. Templin is retired. He is Chairman of the Board of Directors, Con-Way Incorporated (2012-Present); and was formerly Executive Vice President and Chief Financial Officer, Whirlpool Corporation (an appliance manufacturer and marketer) (2004-2012). Trustee — Goldman Sachs Fund Complex. | | | 108 | | | Con-Way Incorporated (a transportation, supply-chain management and logistics services company) |
| | | | | | | | | | | | |
Interested Trustees*
| | | | | | | | | | | | |
| | | | | |
Name,
Address and Age1 | | Position(s) Held
with the Trust | | Term of Office and
Length of
Time Served2 | | Principal Occupation(s) During Past 5 Years | | Number of
Portfolios in
Fund Complex
Overseen by
Trustee3 | | | Other Directorships Held by Trustee4 |
James A. McNamara Age: 52 | | President and Trustee | | Since 2007 | | Managing Director, Goldman Sachs (December 1998-Present); Director of Institutional Fund Sales, GSAM (April 1998-December 2000); and Senior Vice President and Manager, Dreyfus Institutional Service Corporation (January 1993- April 1998). President — Goldman Sachs Fund Complex (November 2007-Present); Senior Vice President — Goldman Sachs Fund Complex (May 2007-November 2007); and Vice President — Goldman Sachs Fund Complex (2001-2007). Trustee — Goldman Sachs Fund Complex (November 2007-Present and December 2002-May 2004). | | | 127 | | | None |
Alan A. Shuch Age: 65 | | Trustee | | Since 1990 | | Advisory Director — GSAM (May 1999-Present); Consultant to GSAM (December 1994-May 1999); and Limited Partner, Goldman Sachs (December 1994-May 1999). Trustee — Goldman Sachs Fund Complex. | | | 108 | | | None |
| | | | | | | | | | | | |
| * | These persons are considered to be “Interested Trustees” because they hold positions with Goldman Sachs and own securities issued by The Goldman Sachs Group, Inc. Each Interested Trustee holds comparable positions with certain other companies of which Goldman Sachs, GSAM or an affiliate thereof is the investment adviser, administrator and/or distributor. |
| 1 | Each Trustee may be contacted by writing to the Trustee, c/o Goldman Sachs, 200 West Street, New York, New York, 10282, Attn: Caroline Kraus. Information is provided as of December 31, 2014. |
| 2 | Each Trustee holds office for an indefinite term until the earliest of: (a) the election of his or her successor; (b) the date the Trustee resigns or is removed by the Board of Trustees or shareholders, in accordance with the Trust’s Declaration of Trust; (c) December 31st of the year in which the Trustee turns 74 years of age, subject to waiver by a majority of the Trustees (in accordance with the current resolutions of the Board of Trustees, which may be changed by the Trustees without shareholder vote); or (d) the termination of the Trust. By resolution of the Board of Trustees determining that an extension of service would be beneficial to the Trust, the retirement age has been extended with respect to Richard P. Strubel. |
| 3 | The Goldman Sachs Fund Complex consists of the Trust and Goldman Sachs Trust (“GST”). As of December 31, 2014, the Trust consisted of 14 portfolios and GST consisted of 94 portfolios (88 of which offered shares to the public). The Goldman Sachs Fund Complex also includes, with respect to Messrs. Bakhru, Coblentz and Strubel, Goldman Sachs Trust II (“GSTII”), Goldman Sachs BDC, Inc. (“GSBDC”), Goldman Sachs MLP Income Opportunities Fund (“GSMLP”), Goldman Sachs MLP and Energy Renaissance Fund (“GSMER”) and Goldman Sachs ETF Trust (“GSETF”), and with respect to Mr. McNamara, GSTII, GSMLP, GSMER and GSETF. GSTII consisted of 6 portfolios (one of which offered shares to the public). GSBDC, GSMLP and GSMER each consisted of one portfolio. GSETF consisted of 11 portfolios (none of which offered shares to the public). As of December 31, 2014, GSBDC had not offered shares to the public. |
| 4 | This column includes only directorships of companies required to report to the Securities and Exchange Commission under the Securities Exchange Act of 1934 (i.e., “public companies”) or other investment companies registered under the Act. |
Additional information about the Trustees is available in the Fund’s Statement of Additional Information, which can be obtained from Goldman Sachs free of charge by calling this toll-free number (in the United States of America): 1-800-292-4726.
79
GOLDMAN SACHS VARIABLE INSURANCE TRUST FUNDS
Trustees and Officers (Unaudited) (continued)
Officers of the Trust*
| | | | | | |
| | | |
Name, Address and Age1 | | Position(s) Held With the Trust | | Term of
Office and
Length of
Time Served2 | | Principal Occupation(s) During Past 5 Years |
James A. McNamara
200 West Street New York, NY 10282 Age: 52 | | President and Trustee | | Since 2007 | | Managing Director, Goldman Sachs (December 1998-Present); Director of Institutional Fund Sales, GSAM (April 1998-December 2000); and Senior Vice President and Manager, Dreyfus Institutional Service Corporation (January 1993-April 1998). President — Goldman Sachs Fund Complex (November 2007-Present); Senior Vice President — Goldman Sachs Fund Complex (May 2007-November 2007); and Vice President — Goldman Sachs Fund Complex (2001-2007). Trustee — Goldman Sachs Fund Complex (November 2007-Present and December 2002-May 2004). |
Caroline L. Kraus
200 West Street New York, NY 10282 Age: 37 | | Secretary | | Since 2012 | | Vice President, Goldman Sachs (August 2006-Present); Associate General Counsel, Goldman Sachs (2012-Present); Assistant General Counsel, Goldman Sachs (August 2006-December 2011) and Associate, Weil, Gotshal & Manges, LLP (2002-2006). Secretary — Goldman Sachs Fund Complex (August 2012-Present) and Assistant Secretary — Goldman Sachs Fund Complex (June 2012-August 2012). |
Scott M. McHugh
200 West Street New York, NY 10282 Age: 43 | | Principal Financial
Officer, Senior Vice
President and
Treasurer | | Since 2009
(Principal
Financial
Officer since
2013) | | Vice President, Goldman Sachs (February 2007-Present); Assistant Treasurer of certain mutual funds administered by DWS Scudder (2005-2007); and Director (2005-2007), Vice President (2000-2005) and Assistant Vice President (1998-2000), Deutsche Asset Management or its predecessor (1998-2007). Principal Financial Officer — Goldman Sachs Fund Complex (November 2013-Present); Treasurer — Goldman Sachs Fund Complex (October 2009-Present); Senior Vice President — Goldman Sachs Fund Complex (November 2009-Present); and Assistant Treasurer — Goldman Sachs Fund Complex (May 2007-October 2009). |
| | | | | | |
| * | Represents a partial list of officers of the Trust. Additional information about all the officers is available in the Fund’s Statement of Additional Information, which can be obtained from Goldman Sachs free of charge by calling this toll-free number (in the United States): 1-800-292-4726. |
| 1 | Information is provided as of December 31, 2014. |
| 2 | Officers hold office at the pleasure of the Board of Trustees or until their successors are duly elected and qualified. Each officer holds comparable positions with certain other companies of which Goldman Sachs, GSAM or an affiliate thereof is the investment adviser, administrator and/or distributor. |
Goldman Sachs Variable Insurance Trust — Tax Information (Unaudited)
For the year ended December 31, 2014, 100% and 34.91% of the dividends paid, respectively, from net investment company taxable income by the Equity Index and Growth Opportunities Fund qualify for the dividends received deduction available to corporations.
Pursuant to Section 852 of the Internal Revenue Code, the Equity Index and Growth Opportunities Funds designate $3,936,430 and $32,907,674 respectively, or, if different, the maximum amount allowable, as capital gain dividends paid during the year ended December 31, 2014.
80
| | |
| TRUSTEES | | OFFICERS |
| Ashok N. Bakhru, Chairman | | James A. McNamara, President |
| John P. Coblentz, Jr. | | Scott M. McHugh, Principal Financial Officer |
| Diana M. Daniels | | and Treasurer |
| Joseph P. LoRusso | | Caroline L. Kraus, Secretary |
| Herbert J. Markley | | |
| James A. McNamara | | |
| Jessica Palmer | | |
| Alan A. Shuch | | |
| Richard P. Strubel | | |
| Roy W. Templin | | |
GOLDMAN, SACHS & CO.
Distributor and Transfer Agent
GOLDMAN SACHS ASSET MANAGEMENT, L.P.
Investment Adviser
200 West Street, New York, New York 10282
Visit our web site at www.GSAMFUNDS.com to obtain the most recent month-end returns.
The reports concerning the Funds included in this shareholder report may contain certain forward-looking statements about the factors that may affect the performance of the Funds in the future. These statements are based on Fund management’s predictions and expectations concerning certain future events and their expected impact on the Funds, such as performance of the economy as a whole and of specific industry sectors, changes in the levels of interest rates, the impact of developing world events, and other factors that may influence the future performance of the Funds. Management believes these forward-looking statements to be reasonable, although they are inherently uncertain and difficult to predict. Actual events may cause adjustments in portfolio management strategies from those currently expected to be employed.
A description of the policies and procedures that the Funds use to determine how to vote proxies relating to portfolio securities and information regarding how the Funds voted proxies relating to portfolio securities for the 12-month period ended June 30 is available (i) without charge, upon request by calling 1-800-621-2550; and (ii) on the Securities and Exchange Commission (“SEC”) web site at http://www.sec.gov.
The Funds file their complete schedule of portfolio holdings with the SEC for the first and third quarters of each fiscal year on Form N-Q. The Funds’ Form N-Qs are available on the SEC’s web site at http://www.sec.gov within 60 days after the Funds’ first and third fiscal quarters. The Funds’ Form N-Qs may be reviewed and copied at the SEC’s Public Reference Room in Washington, D.C. and information on the operation of the Public Reference Room may also be obtained by calling 1-800-SEC-0330. Form N-Qs may be obtained upon request and without charge by calling 1-800-621-2550.
The website links provided are for your convenience only and are not an endorsement or recommendation by GSAM of any of these websites or the products or services offered. GSAM is not responsible for the accuracy and validity of the content of these websites.
Fund holdings and allocations shown are as of December 31, 2014 and may not be representative of future investments. Fund holdings should not be relied on in making investment decisions and should not be construed as research or investment advice regarding particular securities. Current and future holdings are subject to risk.
The Global Industry Classification Standard (“GICS”) was developed by and is the exclusive property and a service mark of Morgan Stanley Capital International Inc. (“MSCI”) and Standard & Poor’s, a division of The McGraw-Hill Companies, Inc. (“S&P”) and is licensed for use by Goldman Sachs. Neither MSCI, S&P nor any other party involved in making or compiling the GICS or any GICS classifications makes any express or implied warranties or representations with respect to such standard or classification (or the results to be obtained by the use thereof), and all such parties hereby expressly disclaim all warranties of originality, accuracy, completeness, merchantability or fitness for a particular purpose with respect to any of such standard or classification. Without limiting any of the foregoing, in no event shall MSCI, S&P, any of their affiliates or any third party involved in making or compiling the GICS or any GICS classifications have any liability for any direct, indirect, special, punitive, consequential or any other damages (including lost profits) even if notified of the possibility of such damages.
The portfolio risk management process includes an effort to monitor and manage risk, but does not imply low risk.
Shares of the Goldman Sachs VIT Funds are offered to separate accounts of participating life insurance companies for the purpose of funding variable annuity contracts and variable life insurance policies. Shares of the Fund are not offered directly to the general public. The variable annuity contracts and variable life insurance policies are described in the separate prospectuses issued by participating insurance companies. You should refer to those prospectuses for information about surrender charges, mortality and expense risk fees and other charges that may be assessed by participating insurance companies under the variable annuity contracts or variable life insurance policies. Such fees or charges, if any, may affect the return you may realize with respect to your investments. Ask your representative for more complete information. Please consider a fund’s objectives, risks and charges and expenses, and read the prospectus carefully before investing. The prospectus contains this and other information about the Fund.
This material is not authorized for distribution to prospective investors unless preceded or accompanied by a current Prospectus or summary prospectus, if applicable. Investors should consider a Fund’s objective, risks, and charges and expenses, and read the summary prospectus, if available, and/or the Prospectus carefully before investing or sending money. The summary prospectus, if available, and the Prospectus contain this and other information about a Fund and may be obtained from your Authorized Institution or from Goldman, Sachs & Co. by calling 1-800-621-2550.
This report is prepared for the general information of contract owners and is not an offer of shares of the Goldman Sachs Variable Insurance Trust Funds.
© 2015 Goldman Sachs. All rights reserved.
VITMFAR-15/153899.MF.MED.TMPL/2/2015
Goldman
Sachs Variable Insurance Trust
Goldman Sachs
Small Cap Equity Insights Fund*
| * | Effective April 30, 2014, the Goldman Sachs Structured Small Cap Equity Fund was renamed the Goldman Sachs Small Cap Equity Insights Fund. |
Annual Report
December 31, 2014
GOLDMAN SACHS VARIABLE INSURANCE TRUST SMALL CAP EQUITY INSIGHTS FUND
Principal Investment Strategies and Risks
This is not a complete list of risks that may affect the Fund. For additional information concerning the risks applicable to the Fund, please see the Fund’s Prospectuses.
Shares of the Goldman Sachs Variable Insurance Trust — Goldman Sachs Small Cap Equity Insights Fund are offered to separate accounts of participating life insurance companies for the purpose of funding variable annuity contracts and variable life insurance policies. Shares of the Fund are not offered directly to the general public. The variable annuity contracts and variable life insurance policies are described in the separate prospectuses issued by participating insurance companies. You should refer to those prospectuses for information about surrender charges, mortality and expense risk fees and other charges that may be assessed by participating insurance companies under the variable annuity contracts or variable life insurance policies. Such fees or charges, if any, may affect the return you realize with respect to your investments. Ask your representative for more complete information. Please consider the Fund’s objective, risks and charges and expenses, and read the Prospectus carefully before investing. The Prospectus contains this and other information about the Fund.
The Goldman Sachs Small Cap Equity Insights Fund invests primarily in a broadly diversified portfolio of equity investments in small-capitalization U.S. issuers, including foreign issuers traded in the United States. The Fund’s equity investments will be subject to market risk, which means that the value of the securities in which it invests may go up or down in response to the prospects of individual companies, particular sectors and/or general economic conditions. The securities of mid- and small-capitalization companies involve greater risks than those associated with larger, more established companies and may be subject to more abrupt or erratic price movements. The Investment Adviser’s use of quantitative models to execute the Fund’s investment strategy may fail to produce the intended result. Different investment styles (e.g., “quantitative”) tend to shift in and out of favor, and at times the Fund may underperform other funds that invest in similar asset classes. The Fund may have a high rate of portfolio turnover, which involves correspondingly greater expenses which must be borne by the Fund, and is also likely to result in short-term capital gains taxable to shareholders.
1
GOLDMAN SACHS VARIABLE INSURANCE TRUST SMALL CAP EQUITY INSIGHTS FUND
INVESTMENT OBJECTIVE
The Fund seeks long-term growth of capital.
Portfolio Management Discussion and Analysis
Effective April 30, 2014, Goldman Sachs Variable Insurance Trust — Goldman Sachs Structured Small Cap Equity Fund was re-named Goldman Sachs Variable Insurance Trust — Goldman Sachs Small Cap Equity Insights Fund (the “Fund”). Below, the Goldman Sachs Quantitative Investment Strategies Team discusses the Fund’s performance and positioning for the 12-month period ended December 31, 2014 (the “Reporting Period”).
How did the Fund perform during the Reporting Period?
During the Reporting Period, the Fund’s Institutional and Service Shares generated average annual total returns of 6.93% and 6.69%, respectively. These returns compare to the 4.89% average annual total return of the Fund’s benchmark, the Russell 2000® Index (with distributions reinvested) (the “Russell Index”) during the same time period.
What economic and market factors most influenced the equity markets as a whole during the annual period?
Representing the U.S. equity market, the S&P 500® Index gave back 0.25% in December 2014, but finished the fourth calendar quarter up 4.93% and gained 13.69% during the Reporting Period as a whole, as it posted its third consecutive year of broad double-digit gains.
Diverging global economies, strong merger and acquisition activity, weakening oil prices and declining U.S. interest rates were major themes affecting U.S. equities throughout 2014. The U.S. economic recovery accelerated through the Reporting Period, particularly compared to other major developed markets, which helped fuel U.S. corporate earnings growth and strong U.S. equity returns. Furthermore, the decline in unemployment to 5.8% and lower energy prices gave new hope to the potential for a broader consumer recovery. U.S. equity market volatility picked up during the second half of 2014 from exceptionally low levels mid-year, but the S&P 500® Index had no more than three consecutive down days during 2014, a feat not seen since 1928.
For the Reporting Period overall, nine of the ten sectors within the S&P 500® Index were up. Merger and acquisition activity rose to its highest annual level since 2007 largely due to transactions within the information technology and health care sectors, which handily outperformed the broader market. The top-weighted information technology sector was also the largest positive contributor (weight times performance) to S&P 500® Index returns. Given the unexpected decline in U.S. interest rates, real estate investment trusts (“REITs”) and the utilities sector also outperformed the broader market during the Reporting Period. Conversely, the energy sector underperformed most during 2014, as concerns over rising U.S. supply and weakening global demand triggered a collapse in U.S. and global crude oil prices. Telecommunication services also performed poorly during the year as aggressive competition, including price wars aimed at luring customers, and market saturation put growth pressures on the sector, especially on the wireless side. Seven of the ten sectors in the Russell Index, representing the U.S. small-cap equity market, also were up, with the utilities and health care sectors gaining the most. Energy was weakest by a wide margin, generating double-digit negative returns, followed at some distance by materials, which also lost ground, albeit more modestly.
All segments of the U.S. equity market advanced during the Reporting Period, with large-cap and mid-cap stocks, as measured by the Russell 1000® Index and the Russell Midcap® Index, respectively, gaining most and almost exactly in line with each other. Following at some distance were small-cap stocks, as measured by the Russell 2000® Index. Large-cap stocks were most successful relative to small-caps in the information technology sector. From a style perspective, value-oriented stocks outpaced growth-oriented stocks in the large-cap and mid-cap segments of the U.S. equity market, but growth-oriented stocks outperformed value-oriented stocks in the small-cap segment of the U.S. equity market. (All as measured by the Russell Investments indices.)
What key factors were responsible for the Fund’s performance during the Reporting Period?
The Fund outperformed the Russell Index during the Reporting Period. Our stock selection and quantitative model’s investment themes added to relative performance overall.
What impact did the Fund’s investment themes have on performance during the Reporting Period?
As expected, and in keeping with our investment approach, our quantitative model and its six investment themes — Valuation, Profitability, Quality, Management, Momentum and Sentiment — had the greatest impact on relative performance. We use these
2
GOLDMAN SACHS VARIABLE INSURANCE TRUST SMALL CAP EQUITY INSIGHTS FUND
themes to take a long-term view of market patterns and look for inefficiencies, selecting stocks for the Fund and overweighting or underweighting the ones chosen by the model. Over time and by design, the performance of any one of the model’s investment themes tends to have a low correlation with the model’s other themes, demonstrating the diversification benefit of the Fund’s theme-driven quantitative model. The variance in performance supports our research indicating that the diversification provided by the Fund’s different investment themes is a significant investment advantage over the long term, even though the Fund may experience underperformance in the short term. Of course, diversification does not protect an investor from market risk nor does it ensure a profit.
During the Reporting Period, three of our six investment themes contributed positively to the Fund’s relative performance. The Quality theme, which assesses both firm and financial quality, contributed most positively to relative performance, followed by Valuation and Sentiment. Valuation attempts to capture potential mispricings of securities, typically by comparing a measure of the company’s intrinsic value to its market value. The Sentiment theme reflects selected investment views and decisions of individuals and financial intermediaries.
The Fund’s Momentum theme detracted most from the Fund’s relative performance, followed by Profitability. The Momentum theme seeks to predict drifts in stock prices caused by delayed investor reaction to company-specific information and information about related companies. The Profitability theme assesses whether a company is earning more than its cost of capital.
The Management theme had a rather neutral impact on the Fund’s relative performance during the Reporting Period. The Management theme assesses the characteristics, policies and strategic decisions of company management.
How did the Fund’s sector and industry allocations affect relative performance?
In constructing the Fund’s portfolio, we focus on picking stocks rather than making industry or sector bets. Consequently, the Fund is similar to its benchmark, the Russell Index, in terms of its sector allocation and style. We manage the Fund’s industry and sector exposure by including industry factors in our risk model and by explicitly penalizing industry and sector deviations from the benchmark index in optimization. Sector weights or changes in weights generally do not have a meaningful impact on relative performance.
Did stock selection help or hurt Fund performance during the Reporting Period?
We seek to outpace the Russell Index by overweighting stocks that we expect to outperform and underweighting those that we think may lag. We also build positions based on our thematic views. For example, the Fund aims to hold a basket of stocks with more favorable Momentum characteristics than the benchmark index. During the Reporting Period, stock selection overall contributed positively to the Fund’s relative performance.
Security selection in the information technology, financials and consumer staples sectors contributed most positively to the Fund’s relative returns. Stock selection in the energy, health care and utilities sectors dampened the Fund’s results relative to the Russell Index.
Which individual stock positions contributed the most to the Fund’s relative returns during the Reporting Period?
The Fund benefited most from overweight positions in biotechnology company Isis Pharmaceuticals, airline JetBlue Airways and insurance firm AmTrust Financial Services. We chose to overweight Isis Pharmaceuticals because of our positive views on Quality and Sentiment. The Fund was overweight JetBlue Airways and AmTrust Financial Services due to our positive views on Quality and Value.
Which individual positions detracted from the Fund’s results during the Reporting Period?
Detracting most from the Fund’s results relative to its benchmark index were overweight positions in oil and gas exploration and production company Comstock Resources, oil and gas services and equipment provider Basic Energy Services and biopharmaceutical company Aegerion Pharmaceuticals. The Fund was overweight Comstock Resources due to our positive views on Quality and Value. Our positive views on Quality led us to overweight Basic Energy Services. The Fund was overweight Aegerion Pharmaceuticals because of our positive views on Momentum and Quality.
How did the Fund use derivatives during the Reporting Period?
During the Reporting Period, we did not use derivatives as part of an active management strategy to add value to the Fund’s results. However, we used equity index futures contracts, on an opportunistic basis, to equitize the Fund’s excess cash holdings. In other words, we put the Fund’s excess cash holdings to work by using them as collateral for the purchase of stock futures.
3
GOLDMAN SACHS VARIABLE INSURANCE TRUST SMALL CAP EQUITY INSIGHTS FUND
Did you make any enhancements to your quantitative models during the Reporting Period?
We continuously look for ways to improve our investment process. In the first quarter of 2014, we implemented an enhancement to our U.S. investment model within the small-capitalization segment of the market. Based on our research, we have adjusted our model to place more weight on fundamental factors, such as attractive valuations and high quality earnings, compared to the large- and mid-capitalization segments of the market. Our research found that behavioral factors, such as positive sentiment and exposure to global themes and trends, allow us to seek more dynamic returns within more liquid segments of the market, including large-and mid-capitalization stocks. Additionally, we made refinements to our transaction cost model, an important component of our portfolio construction process for all regions.
In the second quarter of 2014, we enhanced our Sentiment theme in the U.S., Europe and emerging markets, and global linkages theme in the U.S. and Europe, utilizing natural language processing to analyze thousands of earnings call transcripts and sell-side analyst reports. We read through the entirety of each company’s latest earnings call transcript, identifying key words and phrases that capture the underlying tone of the management team. This provides a better insight into management’s perception of their company. We also enhanced our ability to identify groups of related companies within our global linkages theme. We read through hundreds of research analyst reports daily to identify groups of companies related to common trending topics in the market.
We made no significant changes to our quantitative models during the third quarter of 2014. In the fourth quarter of 2014, we made a number of enhancements across a variety of themes. We enhanced our sector-specific Valuation theme in all regions by introducing a signal that evaluates the reserves of energy companies. As energy reserves are not capitalized on the balance sheet, reserve-based valuation metrics may provide a more accurate picture of the intrinsic value of an energy company.
We enhanced our Sentiment theme in all regions by introducing a signal that analyzes short selling of stocks in order to gain a more comprehensive understanding of investor conviction of future price declines. We analyze more than 9,000 stocks on a daily basis to identify companies with large, “fresh” short positions, which may indicate negative return expectations.
We enhanced our Momentum theme in developed markets, except for Europe, by evaluating price pressures created through consistent trade imbalances between buyers and sellers. In certain instances, traders may push prices as they engage in end-of-day hedging, inventory management and index trading. Persistent instances of these events can create buying and selling opportunities should stock prices revert to long-term views.
What was the Fund’s sector positioning relative to its benchmark index at the end of the Reporting Period?
As of December 31, 2014, the Fund was overweight the information technology, consumer discretionary, health care and materials sectors relative to the Russell Index. The Fund was underweight utilities, industrials and consumer staples and was rather neutrally weighted in financials, energy and telecommunication services compared to the benchmark index on the same date.
What is your strategy going forward for the Fund?
Looking ahead, we continue to believe that less expensive stocks should outpace more expensive stocks, and stocks with good momentum are likely to outperform those with poor momentum. We intend to maintain our focus on seeking companies about which fundamental research analysts are becoming more positive as well as profitable companies with sustainable earnings and a track record of using their capital to enhance shareholder value. As such, we anticipate remaining fully invested with long-term performance likely to be the result of stock selection rather than sector or capitalization allocations.
We stand behind our investment philosophy that sound economic investment principles, coupled with a disciplined quantitative approach, can provide strong, uncorrelated returns over the long term. Our research agenda is robust, and we continue to enhance our existing models, add new proprietary forecasting signals and improve our trading execution as we seek to provide the most value to our shareholders.
4
GOLDMAN SACHS VARIABLE INSURANCE TRUST SMALL CAP EQUITY INSIGHTS FUND
Index Definitions
The Russell Midcap® Index measures the performance of the mid-cap segment of the U.S. equity universe. The Russell Midcap® Index is a subset of the Russell 1000® Index. It includes approximately 800 of the smallest securities based on a combination of their market cap and current index membership. The Russell Midcap® Index represents approximately 31% of the total market capitalization of the Russell 1000 companies. The Russell Midcap® Index is constructed to provide a comprehensive and unbiased barometer for the mid-cap segment. The Index is completely reconstituted annually to ensure larger stocks do not distort the performance and characteristics of the true mid-cap opportunity set.
The Russell 1000® Index measures the performance of the large-cap segment of the U.S. equity universe. It is a subset of the Russell 3000® Index and includes approximately 1000 of the largest securities based on a combination of their market cap and current index membership. The Russell 1000 represents approximately 92% of the U.S. market. The Russell 1000® Index is constructed to provide a comprehensive and unbiased barometer for the large-cap segment and is completely reconstituted annually to ensure new and growing equities are reflected.
The S&P 500® Index is the Standard & Poor’s 500 Composite Index of 500 stocks, an unmanaged index of common stock prices.
All index figures do not reflect any deduction for fees, expenses or taxes. It is not possible to invest directly in an unmanaged index.
5
FUND BASICS
Small Cap Equity Insights Fund
as of December 31, 2014
STANDARDIZED TOTAL RETURNS1
| | | | | | | | | | | | | | | | | | |
| For the period ended 12/31/14 | | One Year | | | Five Years | | | Ten Years | | | Since Inception | | | Inception Date |
| Institutional | | | 6.93 | % | | | 16.46 | % | | | 6.03 | % | | | 6.59 | % | | 2/13/98 |
| Service | | | 6.69 | | | | 16.20 | | | | N/A | | | | 7.23 | | | 8/31/07 |
| 1 | The Standardized Total Returns are average annual total returns as of the most recent calendar quarter-end. They assume reinvestment of all distributions at net asset value (“NAV”). Because Institutional Shares and Service Shares do not involve a sales charge, such a charge is not applied to their Standardized Total Returns. |
Total return figures in the above chart represent past performance and do not indicate future results, which will vary. The investment return and principal value of an investment will fluctuate and, therefore, an investor’s shares, when redeemed, may be worth more or less than their original cost. Current performance may be lower or higher than the total return figures in the above chart. Please visit www.GSAMFUNDS.com to obtain the most recent month-end returns. Performance reflects fee waivers and/or expense limitations in effect during the periods shown. In their absence, performance would be reduced.
EXPENSE RATIOS2
| | | | | | | | |
| | | Net Expense Ratio (Current) | | | Gross Expense Ratio (Before Waivers) | |
| Institutional | | | 0.82 | % | | | 0.99 | % |
| Service | | | 1.07 | | | | 1.24 | |
| 2 | The expense ratios of the Fund, both current (net of any fee waivers or expense limitations) and before waivers (gross of any fee waivers or expense limitations) are as set forth above. Pursuant to a contractual arrangement, the Fund’s waivers and/or expense limitations will remain in place through at least April 30, 2015 and prior to such date the Investment Adviser may not terminate the arrangements without the approval of the Fund’s Board of Trustees. If these arrangements are discontinued in the future, the expense ratios may change without shareholder approval. |
TOP TEN HOLDINGS AS OF 12/31/143
| | | | | | |
| Holding | | % of Net Assets | | | Line of Business |
| Isis Pharmaceuticals, Inc. | | | 1.0% | | | Pharmaceuticals, Biotechnology & Life Sciences |
| SS&C Technologies Holdings, Inc. | | | 0.9 | | | Software & Services |
| Graphic Packaging Holding Co. | | | 0.9 | | | Materials |
| JetBlue Airways Corp. | | | 0.9 | | | Transportation |
| RLJ Lodging Trust | | | 0.8 | | | Real Estate Investment Trust |
| NPS Pharmaceuticals, Inc. | | | 0.8 | | | Pharmaceuticals, Biotechnology & Life Sciences |
| Sunstone Hotel Investors, Inc. | | | 0.8 | | | Real Estate Investment Trust |
| Pebblebrook Hotel Trust | | | 0.8 | | | Real Estate Investment Trust |
| Sovran Self Storage, Inc. | | | 0.8 | | | Real Estate Investment Trust |
| PrivateBancorp, Inc. | | | 0.8 | | | Banks |
| 3 | The top 10 holdings may not be representative of the Fund’s future investments. |
6
FUND BASICS
FUND VS. BENCHMARK SECTOR ALLOCATIONS4
As of December 31, 2013
| 4 | The Fund is actively managed and, as such, its composition may differ over time. Consequently, the Fund’s overall sector allocations may differ from percentages contained in the graph above. The graph categorizes investments using Global Industry Classification Standard (“GICS”), however, the sector classifications used by the portfolio management team may differ from GICS. Underlying sector allocations of exchange traded funds held by the Fund, if any, are not reflected in the graph above. The percentage shown for each investment category reflects the value of investments in that category as a percentage of total market value (excluding investments in the securities lending reinvestment vehicle, if any). Investments in the securities lending reinvestment vehicle represented 6.1% of the Fund’s net assets at December 31, 2014. The graph depicts the Fund’s investments but may not represent the Fund’s market exposure due to the exclusion of certain derivatives, if any, as listed in the Additional Investment Information section of the Schedule of Investments. |
7
GOLDMAN SACHS VARIABLE INSURANCE TRUST SMALL CAP EQUITY INSIGHTS FUND
Performance Summary
December 31, 2014
The following graph shows the value, as of December 31, 2014, of a $10,000 investment made on January 1, 2005 in Institutional Shares at NAV. For comparative purposes, the performance of the Fund’s benchmark, the Russell 2000 Index (with distributions reinvested), is shown. This performance data represents past performance and should not be considered indicative of future performance, which will fluctuate with changes in market conditions. These performance fluctuations will cause an investor’s shares, when redeemed, to be worth more or less than their original cost. Performance reflects Fund level expenses but does not reflect fees and expenses associated with any variable annuity contract or variable life insurance policy that uses the Fund as an investment option for any contract or policy. Had performance reflected all of those fees and expenses, performance would have been reduced. Performance reflects applicable fee waivers and/or expense limitations in effect during the periods shown, and in their absence, performance would be reduced. Performance of Service Shares will vary from Institutional Shares due to differences in class specific fees. In addition to the Investment Adviser’s decisions regarding issuer/industry investment selection and allocation, other factors may affect Fund performance. These factors include, but are not limited to, Fund operating fees and expenses, portfolio turnover, and subscription and redemption cash flows affecting the Fund.
Small Cap Equity Insights Fund’s 10 Year Performance
Performance of a $10,000 investment, with distributions reinvested, from January 1, 2005 through December 31, 2014.
| | | | | | | | |
| Average Annual Total Return through December 31, 2014 | | One Year | | Five Years | | Ten Years | | Since Inception |
Institutional (Commenced February 13, 1998) | | 6.93% | | 16.46% | | 6.03% | | 6.59% |
Service (Commenced August 31, 2007) | | 6.69% | | 16.20% | | N/A | | 7.23% |
8
GOLDMAN SACHS VARIABLE INSURANCE TRUST SMALL CAP EQUITY INSIGHTS FUND
Schedule of Investments
December 31, 2014
| | | | | | | | |
| Shares | | | Description | | Value | |
| | Common Stocks – 95.4% | |
| Automobiles & Components – 1.5% | |
| | 16,537 | | | Cooper Tire & Rubber Co. | | $ | 573,007 | |
| | 41,103 | | | Modine Manufacturing Co.* | | | 559,001 | |
| | 15,852 | | | Stoneridge, Inc.* | | | 203,857 | |
| | 13,506 | | | Tower International, Inc.* | | | 345,078 | |
| | | | | | | | |
| | | | | | | 1,680,943 | |
| | |
| Banks – 4.1% | |
| | 4,876 | | | 1st Source Corp. | | | 167,296 | |
| | 1,335 | | | Banner Corp. | | | 57,432 | |
| | 1,422 | | | Berkshire Hills Bancorp, Inc. | | | 37,910 | |
| | 42,430 | | | Brookline Bancorp, Inc. | | | 425,573 | |
| | 50,696 | | | CVB Financial Corp. | | | 812,150 | |
| | 6,132 | | | First Bancorp, Inc. | | | 110,928 | |
| | 25,165 | | | First Interstate Bancsystem, Inc. Class A | | | 700,090 | |
| | 1,939 | | | FirstMerit Corp. | | | 36,628 | |
| | 10,472 | | | International Bancshares Corp. | | | 277,927 | |
| | 38,869 | | | OFG Bancorp | | | 647,169 | |
| | 17,229 | | | Old National Bancorp | | | 256,367 | |
| | 3,260 | | | Oritani Financial Corp. | | | 50,204 | |
| | 26,262 | | | PrivateBancorp, Inc. | | | 877,151 | |
| | 10,527 | | | Umpqua Holdings Corp. | | | 179,064 | |
| | | | | | | | |
| | | | | | | 4,635,889 | |
| | |
| Capital Goods – 5.0% | |
| | 21,391 | | | AAR Corp. | | | 594,242 | |
| | 8,679 | | | Aegion Corp.* | | | 161,516 | |
| | 11,479 | | | Aircastle Ltd. | | | 245,306 | |
| | 1,294 | | | American Science & Engineering, Inc. | | | 67,159 | |
| | 5,860 | | | American Woodmark Corp.* | | | 236,978 | |
| | 8,183 | | | Barnes Group, Inc. | | | 302,853 | |
| | 6,629 | | | Ducommun, Inc.* | | | 167,581 | |
| | 14,530 | | | Engility Holdings, Inc.* | | | 621,884 | |
| | 7,391 | | | General Cable Corp. | | | 110,126 | |
| | 11,645 | | | Hillenbrand, Inc. | | | 401,752 | |
| | 8,281 | | | Hyster-Yale Materials Handling, Inc. | | | 606,169 | |
| | 5,240 | | | Kadant, Inc. | | | 223,696 | |
| | 20,835 | | | LSI Industries, Inc. | | | 141,470 | |
| | 9,579 | | | Miller Industries, Inc. | | | 199,147 | |
| | 2,345 | | | Orbital Sciences Corp.* | | | 63,057 | |
| | 16,117 | | | Polypore International, Inc.* | | | 758,305 | |
| | 2,179 | | | Quanex Building Products Corp. | | | 40,922 | |
| | 2,839 | | | Raven Industries, Inc. | | | 70,975 | |
| | 1,957 | | | Teledyne Technologies, Inc.* | | | 201,062 | |
| | 8,090 | | | Universal Forest Products, Inc. | | | 430,388 | |
| | | | | | | | |
| | | | | | | 5,644,588 | |
| | |
| Commercial & Professional Services – 3.4% | |
| | 11,013 | | | CDI Corp. | | | 195,040 | |
| | 12,497 | | | Deluxe Corp. | | | 777,938 | |
| | 8,302 | | | Heidrick & Struggles International, Inc. | | | 191,361 | |
| | 726 | | | Huron Consulting Group, Inc.* | | | 49,651 | |
| | |
| | Common Stocks – (continued) | |
| Commercial & Professional Services – (continued) | |
| | 6,688 | | | Insperity, Inc. | | $ | 226,656 | |
| | 38,104 | | | Kimball International, Inc. Class B | | | 347,509 | |
| | 6,423 | | | Knoll, Inc. | | | 135,975 | |
| | 24,911 | | | Korn/Ferry International* | | | 716,441 | |
| | 3,098 | | | Navigant Consulting, Inc.* | | | 47,616 | |
| | 20,955 | | | Quad/Graphics, Inc. | | | 481,127 | |
| | 27,613 | | | RPX Corp.* | | | 380,507 | |
| | 13,161 | | | TrueBlue, Inc.* | | | 292,832 | |
| | | | | | | | |
| | | | | | | 3,842,653 | |
| | |
| Consumer Durables & Apparel – 3.9% | |
| | 4,597 | | | Callaway Golf Co. | | | 35,397 | |
| | 8,491 | | | Cavco Industries, Inc.* | | | 673,082 | |
| | 2,729 | | | CSS Industries, Inc. | | | 75,429 | |
| | 20,001 | | | Ethan Allen Interiors, Inc. | | | 619,431 | |
| | 12,212 | | | Helen of Troy Ltd.* | | | 794,513 | |
| | 10,617 | | | Iconix Brand Group, Inc.* | | | 358,748 | |
| | 10,136 | | | La-Z-Boy, Inc. | | | 272,050 | |
| | 4,786 | | | Movado Group, Inc. | | | 135,779 | |
| | 11,988 | | | Skechers U.S.A., Inc. Class A* | | | 662,337 | |
| | 5,024 | | | TRI Pointe Homes, Inc.* | | | 76,616 | |
| | 10,078 | | | Universal Electronics, Inc.* | | | 655,372 | |
| | | | | | | | |
| | | | | | | 4,358,754 | |
| | |
| Consumer Services – 5.4% | |
| | 8,824 | | | BJ’s Restaurants, Inc.* | | | 443,053 | |
| | 23,999 | | | Bloomin’ Brands, Inc.* | | | 594,215 | |
| | 19,200 | | | Bridgepoint Education, Inc.* | | | 217,344 | |
| | 3,108 | | | Capella Education Co. | | | 239,192 | |
| | 2,805 | | | Cracker Barrel Old Country Store, Inc. | | | 394,832 | |
| | 1,032 | | | DineEquity, Inc. | | | 106,956 | |
| | 9,757 | | | Jack in the Box, Inc. | | | 780,170 | |
| | 29,727 | | | K12, Inc.* | | | 352,860 | |
| | 11,665 | | | Marriott Vacations Worldwide Corp. | | | 869,509 | |
| | 14,400 | | | Papa John’s International, Inc. | | | 803,520 | |
| | 35,419 | | | Regis Corp.* | | | 593,622 | |
| | 24,284 | | | Sonic Corp. | | | 661,253 | |
| | 546 | | | Strayer Education, Inc.* | | | 40,557 | |
| | | | | | | | |
| | | | | | | 6,097,083 | |
| | |
| Diversified Financials – 3.7% | |
| | 15,794 | | | Arlington Asset Investment Corp. Class A(a) | | | 420,278 | |
| | 26,922 | | | Cash America International, Inc. | | | 608,976 | |
| | 677 | | | Diamond Hill Investment Group, Inc. | | | 93,453 | |
| | 8,656 | | | Enova International, Inc.* | | | 192,683 | |
| | 823 | | | Evercore Partners, Inc. Class A | | | 43,101 | |
| | 51,266 | | | Ezcorp, Inc. Class A* | | | 602,376 | |
| | 7,909 | | | GAMCO Investors, Inc. Class A | | | 703,426 | |
| | 2,905 | | | Green Dot Corp. Class A* | | | 59,523 | |
| | 12,193 | | | Piper Jaffray Companies* | | | 708,291 | |
| | |
| | |
| The accompanying notes are an integral part of these financial statements. | | 9 |
GOLDMAN SACHS VARIABLE INSURANCE TRUST SMALL CAP EQUITY INSIGHTS FUND
Schedule of Investments (continued)
December 31, 2014
| | | | | | | | |
| Shares | | | Description | | Value | |
| | Common Stocks – (continued) | |
| Diversified Financials – (continued) | |
| | 1,982 | | | Springleaf Holdings, Inc.* | | $ | 71,689 | |
| | 8,394 | | | World Acceptance Corp.*(a) | | | 666,903 | |
| | | | | | | | |
| | | | | | | 4,170,699 | |
| | |
| Energy – 3.7% | |
| | 45,494 | | | Alon USA Energy, Inc. | | | 576,409 | |
| | 20,242 | | | Basic Energy Services, Inc.* | | | 141,896 | |
| | 28,201 | | | Comstock Resources, Inc.(a) | | | 192,049 | |
| | 4,468 | | | Contango Oil & Gas Co.* | | | 130,644 | |
| | 23,342 | | | Delek US Holdings, Inc. | | | 636,770 | |
| | 26,723 | | | Dorian LPG Ltd.* | | | 371,183 | |
| | 24,127 | | | Green Plains, Inc. | | | 597,867 | |
| | 22,357 | | | ION Geophysical Corp.* | | | 61,482 | |
| | 43,459 | | | Key Energy Services, Inc.* | | | 72,577 | |
| | 50,549 | | | Pioneer Energy Services Corp.* | | | 280,041 | |
| | 5,780 | | | REX American Resources Corp.* | | | 358,187 | |
| | 15,220 | | | Tesco Corp. | | | 195,120 | |
| | 14,185 | | | Western Refining, Inc. | | | 535,909 | |
| | | | | | | | |
| | | | | | | 4,150,134 | |
| | |
| Food & Staples Retailing – 0.2% | |
| | 3,790 | | | The Pantry, Inc.* | | | 140,457 | |
| | 905 | | | Weis Markets, Inc. | | | 43,277 | |
| | | | | | | | |
| | | | | | | 183,734 | |
| | |
| Food, Beverage & Tobacco – 0.6% | |
| | 14,268 | | | Cal-Maine Foods, Inc.(a) | | | 556,880 | |
| | 916 | | | Lancaster Colony Corp. | | | 85,774 | |
| | | | | | | | |
| | | | | | | 642,654 | |
| | |
| Health Care Equipment & Services – 5.3% | |
| | 10,085 | | | Anika Therapeutics, Inc.* | | | 410,863 | |
| | 440 | | | Atrion Corp. | | | 149,604 | |
| | 15,015 | | | Cantel Medical Corp. | | | 649,549 | |
| | 2,128 | | | Computer Programs & Systems, Inc. | | | 129,276 | |
| | 13,239 | | | Greatbatch, Inc.* | | | 652,683 | |
| | 7,557 | | | ICU Medical, Inc.* | | | 618,918 | |
| | 3,435 | | | Invacare Corp. | | | 57,571 | |
| | 10,565 | | | Magellan Health Services, Inc.* | | | 634,217 | |
| | 5,939 | | | Masimo Corp.* | | | 156,433 | |
| | 2,475 | | | MedAssets, Inc.* | | | 48,906 | |
| | 5,767 | | | Molina Healthcare, Inc.* | | | 308,707 | |
| | 18,154 | | | Natus Medical, Inc.* | | | 654,270 | |
| | 17,967 | | | NuVasive, Inc.* | | | 847,324 | |
| | 2,372 | | | Orthofix International NV* | | | 71,302 | |
| | 22,345 | | | Skilled Healthcare Group, Inc. Class A* | | | 191,497 | |
| | 7,470 | | | Triple-S Management Corp. Class B* | | | 178,608 | |
| | 8,175 | | | Vascular Solutions, Inc.* | | | 222,033 | |
| | | | | | | | |
| | | | | | | 5,981,761 | |
| | |
| | Common Stocks – (continued) | |
| Insurance – 3.0% | |
| | 29,664 | | | American Equity Investment Life Holding Co. | | $ | 865,892 | |
| | 14,006 | | | AmTrust Financial Services, Inc.(a) | | | 787,838 | |
| | 13,405 | | | Argo Group International Holdings Ltd. | | | 743,575 | |
| | 1,442 | | | Global Indemnity PLC* | | | 40,910 | |
| | 4,422 | | | Maiden Holdings Ltd. | | | 56,557 | |
| | 6,955 | | | Selective Insurance Group, Inc. | | | 188,967 | |
| | 32,570 | | | Symetra Financial Corp. | | | 750,739 | |
| | | | | | | | |
| | | | | | | 3,434,478 | |
| | |
| Materials – 5.5% | |
| | 15,476 | | | A. Schulman, Inc. | | | 627,242 | |
| | 8,870 | | | FutureFuel Corp. | | | 115,488 | |
| | 34,300 | | | Globe Specialty Metals, Inc. | | | 590,989 | |
| | 71,971 | | | Graphic Packaging Holding Co.* | | | 980,245 | |
| | 11,373 | | | Innophos Holdings, Inc. | | | 664,752 | |
| | 10,000 | | | Kaiser Aluminum Corp. | | | 714,300 | |
| | 19,473 | | | Materion Corp. | | | 686,034 | |
| | 10,320 | | | OM Group, Inc. | | | 307,536 | |
| | 4,865 | | | P.H. Glatfelter Co. | | | 124,398 | |
| | 20,709 | | | PolyOne Corp. | | | 785,078 | |
| | 25,163 | | | Schnitzer Steel Industries, Inc. Class A | | | 567,677 | |
| | | | | | | | |
| | | | | | | 6,163,739 | |
| | |
| Media – 0.5% | |
| | 8,061 | | | Entercom Communications Corp. Class A* | | | 98,022 | |
| | 7,679 | | | Harte-Hanks, Inc. | | | 59,435 | |
| | 15,213 | | | Time, Inc. | | | 374,392 | |
| | | | | | | | |
| | | | | | | 531,849 | |
| | |
| Pharmaceuticals, Biotechnology & Life Sciences – 10.4% | |
| | 20,409 | | | Acorda Therapeutics, Inc.*(b) | | | 834,116 | |
| | 20,068 | | | Aegerion Pharmaceuticals, Inc.*(a) | | | 420,224 | |
| | 37,633 | | | Affymetrix, Inc.*(a) | | | 371,438 | |
| | 20,542 | | | Arena Pharmaceuticals, Inc.*(a) | | | 71,281 | |
| | 55,760 | | | Dyax Corp.* | | | 783,985 | |
| | 26,849 | | | Emergent Biosolutions, Inc.* | | | 731,098 | |
| | 20,774 | | | Genomic Health, Inc.*(a) | | | 664,145 | |
| | 5,009 | | | ImmunoGen, Inc.* | | | 30,555 | |
| | 26,319 | | | Impax Laboratories, Inc.* | | | 833,786 | |
| | 34,853 | | | Infinity Pharmaceuticals, Inc.* | | | 588,667 | |
| | 18,936 | | | Isis Pharmaceuticals, Inc.*(a) | | | 1,169,109 | |
| | 12,391 | | | Ligand Pharmaceuticals, Inc.* | | | 659,325 | |
| | 26,099 | | | NPS Pharmaceuticals, Inc.* | | | 933,561 | |
| | 8,524 | | | Ophthotech Corp.* | | | 382,472 | |
| | 2,862 | | | Pacira Pharmaceuticals, Inc.* | | | 253,745 | |
| | 13,480 | | | PAREXEL International Corp.* | | | 748,949 | |
| | 17,371 | | | Prestige Brands Holdings, Inc.* | | | 603,121 | |
| | 1,553 | | | Puma Biotechnology, Inc.* | | | 293,936 | |
| | 28,464 | | | Repligen Corp.* | | | 563,587 | |
| | 17,816 | | | Sagent Pharmaceuticals, Inc.* | | | 447,360 | |
| | |
| | |
| 10 | | The accompanying notes are an integral part of these financial statements. |
GOLDMAN SACHS VARIABLE INSURANCE TRUST SMALL CAP EQUITY INSIGHTS FUND
| | | | | | | | |
| Shares | | | Description | | Value | |
| | Common Stocks – (continued) | |
| Pharmaceuticals, Biotechnology & Life Sciences – (continued) | |
| | 25,949 | | | Sciclone Pharmaceuticals, Inc.* | | $ | 227,313 | |
| | 2,119 | | | Ultragenyx Pharmaceutical, Inc.* | | | 92,982 | |
| | | | | | | | |
| | | | | | | 11,704,755 | |
| | |
| Real Estate Investment Trust – 13.1% | |
| | 20,665 | | | American Assets Trust, Inc. | | | 822,674 | |
| | 115,864 | | | Anworth Mortgage Asset Corp. | | | 608,286 | |
| | 15,409 | | | CoreSite Realty Corp. | | | 601,721 | |
| | 36,088 | | | CubeSmart | | | 796,462 | |
| | 24,406 | | | CyrusOne, Inc. | | | 672,385 | |
| | 3,507 | | | DiamondRock Hospitality Co. | | | 52,149 | |
| | 24,961 | | | DuPont Fabros Technology, Inc. | | | 829,704 | |
| | 10,467 | | | Empire State Realty Trust, Inc. | | | 184,010 | |
| | 44,950 | | | FelCor Lodging Trust, Inc. | | | 486,359 | |
| | 34,570 | | | First Industrial Realty Trust, Inc. | | | 710,759 | |
| | 11,279 | | | Getty Realty Corp. | | | 205,391 | |
| | 19,986 | | | LaSalle Hotel Properties | | | 808,833 | |
| | 3,802 | | | Mack-Cali Realty Corp. | | | 72,466 | |
| | 19,636 | | | Pebblebrook Hotel Trust | | | 895,991 | |
| | 33,998 | | | Pennsylvania Real Estate Investment Trust | | | 797,593 | |
| | 9,212 | | | PS Business Parks, Inc. | | | 732,722 | |
| | 27,860 | | | RLJ Lodging Trust | | | 934,146 | |
| | 11,923 | | | Rouse Properties, Inc. | | | 220,814 | |
| | 10,225 | | | Sovran Self Storage, Inc. | | | 891,825 | |
| | 57,907 | | | Strategic Hotels & Resorts, Inc.* | | | 766,110 | |
| | 10,268 | | | Sun Communities, Inc. | | | 620,803 | |
| | 55,387 | | | Sunstone Hotel Investors, Inc. | | | 914,439 | |
| | 15,693 | | | The Geo Group, Inc. | | | 633,369 | |
| | 39,631 | | | Western Asset Mortgage Capital Corp.(a) | | | 582,576 | |
| | | | | | | | |
| | | | | | | 14,841,587 | |
| | |
| Retailing – 3.7% | |
| | 21,720 | | | Brown Shoe Co., Inc. | | | 698,298 | |
| | 9,838 | | | Core-Mark Holding Co., Inc. | | | 609,267 | |
| | 23,299 | | | Haverty Furniture Companies, Inc. | | | 512,811 | |
| | 11,564 | | | hhgregg, Inc.*(a) | | | 87,539 | |
| | 7,655 | | | Lands’ End, Inc.*(a) | | | 413,064 | |
| | 5,657 | | | Mattress Firm Holding Corp.*(a) | | | 328,559 | |
| | 19,925 | | | Pier 1 Imports, Inc. | | | 306,845 | |
| | 28,023 | | | Select Comfort Corp.* | | | 757,462 | |
| | 10,406 | | | The Cato Corp. Class A | | | 438,925 | |
| | | | | | | | |
| | | | | | | 4,152,770 | |
| | |
| Semiconductors & Semiconductor Equipment – 5.0% | |
| | 8,391 | | | Brooks Automation, Inc. | | | 106,985 | |
| | 23,076 | | | Diodes, Inc.* | | | 636,205 | |
| | 45,370 | | | Fairchild Semiconductor International, Inc.* | | | 765,846 | |
| | 40,073 | | | Integrated Device Technology, Inc.* | | | 785,431 | |
| | 5,018 | | | International Rectifier Corp.* | | | 200,218 | |
| | 46,849 | | | Intersil Corp. Class A | | | 677,905 | |
| | |
| | Common Stocks – (continued) | |
| Semiconductors & Semiconductor Equipment – (continued) | |
| | 29,771 | | | Lattice Semiconductor Corp.* | | $ | 205,122 | |
| | 23,921 | | | OmniVision Technologies, Inc.* | | | 621,946 | |
| | 14,228 | | | Silicon Laboratories, Inc.* | | | 677,537 | |
| | 4,625 | | | Spansion, Inc. Class A* | | | 158,268 | |
| | 28,141 | | | TriQuint Semiconductor, Inc.* | | | 775,285 | |
| | | | | | | | |
| | | | | | | 5,610,748 | |
| | |
| Software & Services – 10.7% | |
| | 21,131 | | | Advent Software, Inc. | | | 647,454 | |
| | 220 | | | Alliance Data Systems Corp.* | | | 63,045 | |
| | 21,330 | | | Aspen Technology, Inc.* | | | 746,977 | |
| | 33,344 | | | AVG Technologies NV* | | | 658,211 | |
| | 3,352 | | | Barracuda Networks, Inc.* | | | 120,136 | |
| | 17,992 | | | Blackbaud, Inc. | | | 778,334 | |
| | 5,158 | | | Blucora, Inc.* | | | 71,438 | |
| | 39,913 | | | Ciber, Inc.* | | | 141,691 | |
| | 22,044 | | | Constant Contact, Inc.* | | | 809,015 | |
| | 6,920 | | | Ebix, Inc.(a) | | | 117,571 | |
| | 8,486 | | | Envestnet, Inc.* | | | 417,002 | |
| | 2,411 | | | ExlService Holdings, Inc.* | | | 69,220 | |
| | 15,178 | | | LogMeIn, Inc.* | | | 748,882 | |
| | 21,551 | | | ManTech International Corp. Class A | | | 651,487 | |
| | 19,803 | | | Marchex, Inc. Class B | | | 90,896 | |
| | 303 | | | MicroStrategy, Inc. Class A* | | | 49,207 | |
| | 22,609 | | | Monotype Imaging Holdings, Inc. | | | 651,817 | |
| | 18,047 | | | NetScout Systems, Inc.* | | | 659,437 | |
| | 28,908 | | | Pegasystems, Inc. | | | 600,419 | |
| | 24,158 | | | Progress Software Corp.* | | | 652,749 | |
| | 7,763 | | | QAD, Inc. Class A | | | 175,599 | |
| | 17,084 | | | SS&C Technologies Holdings, Inc. | | | 999,243 | |
| | 19,860 | | | Sykes Enterprises, Inc.* | | | 466,114 | |
| | 14,145 | | | Synchronoss Technologies, Inc.* | | | 592,110 | |
| | 8,629 | | | TeleTech Holdings, Inc.* | | | 204,335 | |
| | 30,219 | | | Web.com Group, Inc.* | | | 573,859 | |
| | 8,283 | | | WebMD Health Corp.*(a) | | | 327,593 | |
| | | | | | | | |
| | | | | | | 12,083,841 | |
| | |
| Technology Hardware & Equipment – 3.5% | |
| | 8,552 | | | Aruba Networks, Inc.* | | | 155,475 | |
| | 29,704 | | | Benchmark Electronics, Inc.* | | | 755,670 | |
| | 8,863 | | | Calix, Inc.* | | | 88,807 | |
| | 49,144 | | | Harmonic, Inc.* | | | 344,499 | |
| | 1,714 | | | Insight Enterprises, Inc.* | | | 44,376 | |
| | 28,578 | | | Kimball Electronics, Inc.* | | | 343,508 | |
| | 2,599 | | | NETGEAR, Inc.* | | | 92,472 | |
| | 9,016 | | | OSI Systems, Inc.* | | | 638,062 | |
| | 53,775 | | | Polycom, Inc.* | | | 725,963 | |
| | 32,633 | | | Sanmina Corp.* | | | 767,855 | |
| | | | | | | | |
| | | | | | | 3,956,687 | |
| | |
| | |
| The accompanying notes are an integral part of these financial statements. | | 11 |
GOLDMAN SACHS VARIABLE INSURANCE TRUST SMALL CAP EQUITY INSIGHTS FUND
Schedule of Investments (continued)
December 31, 2014
| | | | | | | | |
| Shares | | | Description | | Value | |
| | Common Stocks – (continued) | |
| Telecommunication Services – 0.2% | |
| | 8,305 | | | magicJack VocalTec Ltd.* | | $ | 67,437 | |
| | 11,582 | | | Spok Holdings, Inc. | | | 201,063 | |
| | | | | | | | |
| | | | | | | 268,500 | |
| | |
| Transportation – 2.2% | |
| | 677 | | | Allegiant Travel Co. | | | 101,773 | |
| | 16,863 | | | ArcBest Corp. | | | 781,937 | |
| | 61,104 | | | JetBlue Airways Corp.* | | | 969,110 | |
| | 4,399 | | | Saia, Inc.* | | | 243,529 | |
| | 12,444 | | | SkyWest, Inc. | | | 165,256 | |
| | 2,859 | | | Swift Transportation Co.* | | | 81,853 | |
| | 5,890 | | | Werner Enterprises, Inc. | | | 183,474 | |
| | | | | | | | |
| | | | | | | 2,526,932 | |
| | |
| Utilities – 0.8% | |
| | 9,924 | | | Cleco Corp. | | | 541,255 | |
| | 10,695 | | | PNM Resources, Inc. | | | 316,893 | |
| | | | | | | | |
| | | | | | | 858,148 | |
| | |
| TOTAL INVESTMENTS BEFORE SECURITIES LENDING
REINVESTMENT VEHICLE |
|
| | (Cost $95,599,851) | | $ | 107,522,926 | |
| | |
| | | | | | | | |
| Shares | | | Distribution Rate | | Value | |
| | Securities Lending Reinvestment Vehicle(c)(d) – 6.1% | |
| Goldman Sachs Financial Square Money Market Fund —
FST Shares |
|
| | 6,925,868 | | | 0.060% | | $ | 6,925,868 | |
| | (Cost $6,925,868) | |
| | |
| | TOTAL INVESTMENTS – 101.5% | |
| | (Cost $102,525,719) | | $ | 114,448,794 | |
| | |
| LIABILITIES IN EXCESS OF
OTHER ASSETS – (1.5)% | | | (1,662,424 | ) |
| | |
| | NET ASSETS – 100.0% | | $ | 112,786,370 | |
| | |
| | |
| The percentage shown for each investment category reflects the value of investments in that category as a percentage of net assets. |
| * | | Non-income producing security. |
| (a) | | All or a portion of security is on loan. |
| (b) | | All or a portion of security is segregated as collateral for initial margin requirements on futures transactions. |
| (c) | | Variable rate security. Interest rate or distribution rate disclosed is that which is in effect at December 31, 2014. |
| (d) | | Represents an affiliated issuer. |
ADDITIONAL INVESTMENT INFORMATION
FUTURES CONTRACTS — At December 31, 2014, the Fund had the following futures contracts:
| | | | | | | | | | | | | | |
| Type | | Number of
Contracts
Long (Short) | | | Expiration
Date | | Current
Value | | | Unrealized
Gain (Loss) | |
| Russell 2000 Mini Index | | | 35 | | | March 2015 | | $ | 4,202,450 | | | $ | 47,536 | |
| | |
| 12 | | The accompanying notes are an integral part of these financial statements. |
GOLDMAN SACHS VARIABLE INSURANCE TRUST SMALL CAP EQUITY INSIGHTS FUND
Statement of Assets and Liabilities
December 31, 2014
| | | | |
| | | | |
| Assets: | | | |
Investments in unaffiliated issuers, at value (cost $95,599,851)(a) | | $ | 107,522,926 | |
Investments in affiliated securities lending reinvestment vehicle, at value which equals cost | | | 6,925,868 | |
Cash | | | 5,165,263 | |
Receivables: | | | | |
Dividends | | | 178,082 | |
Investments sold | | | 139,120 | |
Reimbursement from investment adviser | | | 34,676 | |
Securities lending income | | | 15,847 | |
Fund shares sold | | | 2,661 | |
Other assets | | | 3,972 | |
| Total assets | | | 119,988,415 | |
| |
| | | | |
| Liabilities: | | | |
Payables: | | | | |
Payable upon return of securities loaned | | | 6,925,868 | |
Fund shares redeemed | | | 73,030 | |
Management fees | | | 65,253 | |
Variation margin on certain derivative contracts | | | 33,941 | |
Distribution and Service fees and Transfer Agent fees | | | 6,869 | |
Accrued expenses | | | 97,084 | |
| Total liabilities | | | 7,202,045 | |
| |
| | | | |
| Net Assets: | | | |
Paid-in capital | | | 98,689,923 | |
Undistributed net investment income | | | 164,576 | |
Accumulated net realized gain | | | 1,961,260 | |
Net unrealized gain | | | 11,970,611 | |
| NET ASSETS | | $ | 112,786,370 | |
Net Assets: | | | | |
Institutional | | $ | 89,042,752 | |
Service | | | 23,743,618 | |
Total Net Assets | | $ | 112,786,370 | |
Shares of beneficial interest outstanding $0.001 par value (unlimited shares authorized): | | | | |
Institutional | | | 6,512,635 | |
Service | | | 1,746,419 | |
Net asset value, offering and redemption price per share: | | | | |
Institutional | | | $13.67 | |
Service | | | 13.60 | |
(a) Includes loaned securities having a market value of $6,712,718.
| | |
| The accompanying notes are an integral part of these financial statements. | | 13 |
GOLDMAN SACHS VARIABLE INSURANCE TRUST SMALL CAP EQUITY INSIGHTS FUND
Statement of Operations
For the Fiscal Year Ended December 31, 2014
| | | | |
| | | | |
| Investment income: | |
Dividends (net of foreign taxes withheld of $649) | | $ | 1,383,805 | |
Securities lending income — affiliated issuer | | | 157,037 | |
| Total investment income | | | 1,540,842 | |
| |
| | | | |
| Expenses: | | | |
Management fees | | | 850,253 | |
Printing and mailing costs | | | 86,624 | |
Professional fees | | | 84,324 | |
Custody, accounting and administrative services | | | 61,757 | |
Distribution and Service fees — Service Class | | | 60,313 | |
Trustee fees | | | 23,410 | |
Transfer Agent fees(a) | | | 22,672 | |
Other | | | 45,489 | |
| Total expenses | | | 1,234,842 | |
Less — expense reductions | | | (237,340 | ) |
| Net expenses | | | 997,502 | |
| NET INVESTMENT INCOME | | | 543,340 | |
| |
| | | | |
| Realized and unrealized gain (loss): | | | |
Net realized gain from: | | | | |
Investments | | | 14,013,678 | |
Futures contracts | | | 135,399 | |
Net change in unrealized gain (loss) on: | | | | |
Investments | | | (7,825,321 | ) |
Futures contracts | | | 33,906 | |
| Net realized and unrealized gain | | | 6,357,662 | |
| NET INCREASE IN NET ASSETS RESULTING FROM OPERATIONS | | $ | 6,901,002 | |
(a) Institutional and Service Shares had Transfer Agent fees of $17,847 and $4,825, respectively.
| | |
| 14 | | The accompanying notes are an integral part of these financial statements. |
GOLDMAN SACHS VARIABLE INSURANCE TRUST SMALL CAP EQUITY INSIGHTS FUND
Statements of Changes in Net Assets
| | | | | | | | |
| | | For the
Fiscal Year Ended
December 31, 2014 | | | For the
Fiscal Year Ended
December 31, 2013 | |
| | | | | | | | |
| From operations: | |
Net investment income | | $ | 543,340 | | | $ | 835,904 | |
Net realized gain | | | 14,149,077 | | | | 26,620,244 | |
Net change in unrealized gain (loss) | | | (7,791,415 | ) | | | 7,419,372 | |
| Net increase in net assets resulting from operations | | | 6,901,002 | | | | 34,875,520 | |
| |
| | | | | | | | |
| Distributions to shareholders: | | | | | | |
From net investment income | | | | | | | | |
Institutional Shares | | | (647,639 | ) | | | (886,878 | ) |
Service Shares | | | (120,277 | ) | | | (173,884 | ) |
From net realized gains | | | | | | | | |
Institutional Shares | | | (12,160,677 | ) | | | (11,194,690 | ) |
Service Shares | | | (3,387,666 | ) | | | (2,979,013 | ) |
| Total distributions to shareholders | | | (16,316,259 | ) | | | (15,234,465 | ) |
| |
| | | | | | | | |
| From share transactions: | | | | | | |
Proceeds from sales of shares | | | 16,974,960 | | | | 15,763,057 | |
Reinvestment of distributions | | | 16,316,259 | | | | 15,234,465 | |
Cost of shares redeemed | | | (35,135,496 | ) | | | (32,227,693 | ) |
| Net decrease in net assets resulting from share transactions | | | (1,844,277 | ) | | | (1,230,171 | ) |
| TOTAL INCREASE (DECREASE) | | | (11,259,534 | ) | | | 18,410,884 | |
| |
| | | | | | | | |
| Net assets: | | | | | | |
| | |
Beginning of year | | | 124,045,904 | | | | 105,635,020 | |
End of year | | $ | 112,786,370 | | | $ | 124,045,904 | |
| Undistributed net investment income | | $ | 164,576 | | | $ | 441,796 | |
| | |
| The accompanying notes are an integral part of these financial statements. | | 15 |
GOLDMAN SACHS VARIABLE INSURANCE TRUST SMALL CAP EQUITY INSIGHTS FUND
Financial Highlights
Selected Data for a Share Outstanding Throughout Each Year
| | | | | | | | | | | | | | | | | | | | | | | | | | | | | | | | | | | | | | | | | | | | | | | | | | | | | | | | |
| | | | | | Income from
investment operations | | | Distributions to shareholders | | | | | | | | | | | | | | | | | | | | | | |
| Year - Share Class | | Net asset value, beginning of year | | | Net investment income(a) | | | Net
realized and
unrealized gain | | | Total from investment operations | | | From net investment income | | | From
net realized gains | | | Total distributions | | | Net asset value, end of year | | | Total return(b) | | | Net assets, end of year (in 000s) | | | Ratio of net expenses to average net assets | | | Ratio of total expenses to average net assets | | | Ratio of net investment income
to average
net assets | | | Portfolio
turnover
rate(c) | |
FOR THE FISCAL YEARS ENDED DECEMBER 31, | |
2014 - Institutional | | $ | 15.07 | | | $ | 0.08 | | | $ | 0.90 | | | $ | 0.98 | | | $ | (0.12 | ) | | $ | (2.26 | ) | | $ | (2.38 | ) | | $ | 13.67 | | | | 6.93 | % | | $ | 89,043 | | | | 0.83 | % | | | 1.04 | % | | | 0.53 | % | | | 119 | % |
2014 - Service | | | 15.00 | | | | 0.04 | | | | 0.90 | | | | 0.94 | | | | (0.08 | ) | | | (2.26 | ) | | | (2.34 | ) | | | 13.60 | | | | 6.69 | | | | 23,744 | | | | 1.08 | | | | 1.29 | | | | 0.28 | | | | 119 | |
2013 - Institutional | | | 12.71 | | | | 0.11 | | | | 4.37 | | | | 4.48 | | | | (0.16 | ) | | | (1.96 | ) | | | (2.12 | ) | | | 15.07 | | | | 35.62 | | | | 98,114 | | | | 0.82 | | | | 0.98 | | | | 0.77 | | | | 152 | |
2013 - Service | | | 12.65 | | | | 0.08 | | | | 4.34 | | | | 4.42 | | | | (0.11 | ) | | | (1.96 | ) | | | (2.07 | ) | | | 15.00 | | | | 35.38 | | | | 25,932 | | | | 1.07 | | | | 1.23 | | | | 0.52 | | | | 152 | |
2012 - Institutional | | | 11.40 | | | | 0.19 | (d) | | | 1.27 | (e) | | | 1.46 | | | | (0.15 | ) | | | — | | | | (0.15 | ) | | | 12.71 | | | | 12.79 | (e) | | | 82,961 | | | | 0.81 | | | | 0.97 | | | | 1.55 | (d) | | | 95 | |
2012 - Service | | | 11.35 | | | | 0.17 | (d) | | | 1.25 | (e) | | | 1.42 | | | | (0.12 | ) | | | — | | | | (0.12 | ) | | | 12.65 | | | | 12.47 | (e) | | | 22,674 | | | | 1.06 | | | | 1.22 | | | | 1.34 | (d) | | | 95 | |
2011 - Institutional | | | 11.42 | | | | 0.06 | (f) | | | 0.02 | (g) | | | 0.08 | | | | (0.10 | ) | | | — | | | | (0.10 | ) | | | 11.40 | | | | 0.67 | | | | 87,956 | | | | 0.83 | | | | 0.99 | | | | 0.55 | (f) | | | 33 | |
2011 - Service | | | 11.37 | | | | 0.03 | (f) | | | 0.02 | (g) | | | 0.05 | | | | (0.07 | ) | | | — | | | | (0.07 | ) | | | 11.35 | | | | 0.41 | | | | 22,973 | | | | 1.08 | | | | 1.24 | | | | 0.30 | (f) | | | 33 | |
2010 - Institutional | | | 8.82 | | | | 0.08 | (h) | | | 2.58 | | | | 2.66 | | | | (0.06 | ) | | �� | — | | | | (0.06 | ) | | | 11.42 | | | | 30.12 | | | | 106,646 | | | | 0.85 | | | | 0.97 | | | | 0.82 | (h) | | | 63 | |
2010 - Service | | | 8.78 | | | | 0.06 | (h) | | | 2.56 | | | | 2.62 | | | | (0.03 | ) | | | — | | | | (0.03 | ) | | | 11.37 | | | | 29.86 | | | | 27,428 | | | | 1.10 | | | | 1.22 | | | | 0.58 | (h) | | | 63 | |
| (a) | Calculated based on the average shares outstanding methodology. |
| (b) | Assumes investment at the net asset value at the beginning of the year, reinvestment of all distributions, and a complete redemption of the investment at the net asset value at the end of the year. |
| (c) | The Fund’s portfolio turnover rate is calculated in accordance with regulatory requirements, without regard to transactions involving short term investments and certain derivatives. If such transactions were included, the Fund’s portfolio turnover rate may be higher. |
| (d) | Reflects income recognized from special dividends which amounted to $0.08 per share and 0.62% of average net assets. |
| (e) | Reflects payment from affiliate relating to certain investment transactions which amounted to $0.08 per share. Excluding such payment, the total return would have been 12.44% and 12.12%, respectively. |
| (f) | Reflects income recognized from special dividends which amounted to $0.02 per share and 0.21% of average net assets. |
| (g) | Reflects an increase of $0.02 due to payments received for class action settlements received this year. |
| (h) | Reflects income recognized from special dividends which amounted to $0.04 per share and 0.43% of average net assets. |
| | | | |
| The accompanying notes are an integral part of these financial statements. | | 16 | | |
GOLDMAN SACHS VARIABLE INSURANCE TRUST SMALL CAP EQUITY INSIGHTS FUND
Notes to Financial Statements
December 31, 2014
1. ORGANIZATION
Goldman Sachs Variable Insurance Trust (the “Trust” or “VIT”) is a Delaware statutory trust registered under the Investment Company Act of 1940, as amended (the “Act”), as an open-end management investment company. The Trust includes the Goldman Sachs Small Cap Equity Insights Fund (the “Fund”) (formerly the Goldman Sachs Structured Small Cap Equity Fund). The Fund is a diversified portfolio under the Act offering two classes of shares — Institutional and Service Shares. Shares of the Trust are offered to separate accounts of participating life insurance companies for the purpose of funding variable annuity contracts and variable life insurance policies.
Goldman Sachs Asset Management, L.P. (“GSAM”), an affiliate of Goldman, Sachs & Co. (“Goldman Sachs”), serves as investment adviser to the Fund pursuant to a management agreement (the “Agreement”) with the Trust.
2. SIGNIFICANT ACCOUNTING POLICIES
The financial statements have been prepared in accordance with accounting principles generally accepted in the United States of America (“GAAP”) and require management to make estimates and assumptions that may affect the reported amounts and disclosures. Actual results may differ from those estimates and assumptions.
A. Investment Valuation — The Fund’s valuation policy is to value investments at fair value.
B. Investment Income and Investments — Investment income includes interest income and dividend income, net of any foreign withholding taxes, less any amounts reclaimable. Interest income is accrued daily and adjusted for amortization of premiums and accretion of discounts. Dividend income is recognized on ex-dividend date or, for certain foreign securities, as soon as such information is obtained subsequent to the ex-dividend date. Investment transactions are reflected on trade date. Realized gains and losses are calculated using identified cost. Investment transactions are recorded on the following business day for daily net asset value (“NAV”) calculations. Any foreign capital gains tax is accrued daily based upon net unrealized gains, and is payable upon sale of such investments. Distributions received from the Fund’s investments in United States (“U.S.”) real estate investment trusts (“REITs”) may be characterized as ordinary income, net capital gain or a return of capital. A return of capital is recorded by the Fund as a reduction to the cost basis of the REIT.
For derivative contracts, realized gains and losses are recorded upon settlement of the contract.
C. Class Allocations and Expenses — Investment income, realized and unrealized gain (loss), and non-class specific expenses of the Fund are allocated daily based upon the proportion of net assets of each class. Class specific expenses, where applicable, are borne by the respective share classes and include Distribution and Service and Transfer Agent fees. Non-class specific expenses directly incurred by a Fund are charged to that Fund, while such expenses incurred by the Trust are allocated across the respective Funds on a straight-line and/or pro-rata basis depending upon the nature of the expenses.
D. Federal Taxes and Distributions to Shareholders — It is the Fund’s policy to comply with the requirements of the Internal Revenue Code of 1986, as amended (the “Code”), applicable to regulated investment companies (mutual funds) and to distribute each year substantially all of its investment company taxable income and capital gains to its shareholders. Accordingly, the Fund is not required to make any provisions for the payment of federal income tax. Distributions to shareholders are recorded on the ex-dividend date. Income and capital gains distributions, if any, are declared and paid annually.
17
GOLDMAN SACHS VARIABLE INSURANCE TRUST SMALL CAP EQUITY INSIGHTS FUND
Notes to Financial Statements (continued)
December 31, 2014
2. SIGNIFICANT ACCOUNTING POLICIES (continued)
Net capital losses are carried forward to future fiscal years and may be used to the extent allowed by the Code to offset any future capital gains. Losses that are carried forward will retain their character as either short-term or long-term capital losses. Utilization of capital loss carryforwards will reduce the requirement of future capital gains distributions.
The characterization of distributions to shareholders for financial reporting purposes is determined in accordance with federal income tax rules, which may differ from GAAP. The source of the Fund’s distributions may be shown in the accompanying financial statements as either from net investment income, net realized gain or capital. Certain components of the Fund’s net assets on the Statement of Assets and Liabilities reflect permanent GAAP/tax differences based on the appropriate tax character.
3. INVESTMENTS AND FAIR VALUE MEASUREMENTS
The fair value of a financial instrument is the amount that would be received to sell an asset or paid to transfer a liability in an orderly transaction between market participants at the measurement date (i.e., the exit price). GAAP establishes a fair value hierarchy that prioritizes the inputs to valuation techniques used to measure fair value. The hierarchy gives the highest priority to unadjusted quoted prices in active markets for identical assets or liabilities (Level 1 measurements) and the lowest priority to unobservable inputs (Level 3 measurements). The levels used for classifying investments are not necessarily an indication of the risk associated with investing in these investments. The three levels of the fair value hierarchy are described below:
Level 1 — Unadjusted quoted prices in active markets that are accessible at the measurement date for identical, unrestricted assets or liabilities;
Level 2 — Quoted prices in markets that are not active or financial instruments for which significant inputs are observable (including, but not limited to, quoted prices for similar investments, interest rates, foreign exchange rates, volatility and credit spreads), either directly or indirectly;
Level 3 — Prices or valuations that require significant unobservable inputs (including GSAM’s assumptions in determining fair value measurement).
The Trustees have adopted Valuation Procedures that govern the valuation of the portfolio investments held by the Fund, including investments for which market quotations are not readily available. The Trustees have delegated to GSAM day-to-day responsibility for implementing and maintaining internal controls and procedures related to the valuation of the Fund’s portfolio investments. To assess the continuing appropriateness of pricing sources and methodologies, GSAM regularly performs price verification procedures and issues challenges as necessary to third party pricing vendors or brokers, and any differences are reviewed in accordance with the Valuation Procedures.
A. Level 1 and Level 2 Fair Value Investments — The valuation techniques and significant inputs used in determining the fair values for investments classified as Level 1 and Level 2 are as follows:
Equity Securities — Equity securities and investment companies traded on a U.S. securities exchange or the NASDAQ system, or those located on certain foreign exchanges, including but not limited to the Americas, are valued daily at their last sale price or official closing price on the principal exchange or system on which they are traded. If no sale occurs, equity securities and exchange traded investment companies are valued at the last bid price for long positions and at the last ask price for short positions. Investments in investment companies (other than those that are exchange traded) are valued at the NAV on the valuation date. To the extent these investments are actively traded, they are classified as Level 1 of the fair value hierarchy, otherwise they are generally classified as Level 2.
18
GOLDMAN SACHS VARIABLE INSURANCE TRUST SMALL CAP EQUITY INSIGHTS FUND
3. INVESTMENTS AND FAIR VALUE MEASUREMENTS (continued)
Unlisted equity securities for which market quotations are available are valued at the last sale price on the valuation date, or if no sale occurs, at the last bid price. Securities traded on certain foreign securities exchanges are valued daily at fair value determined by an independent fair value service (if available) under Valuation Procedures approved by the Trustees and consistent with applicable regulatory guidance. The independent fair value service takes into account multiple factors including, but not limited to, movements in the securities markets, certain depositary receipts, futures contracts and foreign currency exchange rates that have occurred subsequent to the close of the foreign securities exchange. These investments are generally classified as Level 2 of the fair value hierarchy.
Derivative Contracts — A derivative is an instrument whose value is derived from underlying assets, indices, reference rates or a combination of these factors. The Fund enters into derivative transactions to hedge against changes in interest rates, securities prices, and/or currency exchange rates, to increase total return, or to gain access to certain markets or attain exposure to other underliers.
Exchange-traded derivatives, including futures contracts, typically fall within Level 1 of the fair value hierarchy. Over-the-counter (“OTC”) and centrally cleared derivatives are valued using market transactions and other market evidence, including market-based inputs to models, calibration to market-clearing transactions, broker or dealer quotations, or other alternative pricing sources. Where models are used, the selection of a particular model to value an OTC and centrally cleared derivative depends upon the contractual terms of, and specific risks inherent in, the instrument, as well as the availability of pricing information in the market. Valuation models require a variety of inputs, including contractual terms, market prices, yield curves, credit curves, measures of volatility, voluntary and involuntary prepayment rates, loss severity rates and correlations of such inputs. For OTC and centrally cleared derivatives that trade in liquid markets, model inputs can generally be verified and model selection does not involve significant management judgment. OTC and centrally cleared derivatives are classified within Level 2 of the fair value hierarchy when significant inputs are corroborated by market evidence.
i. Futures Contracts — Futures contracts are contracts to buy or sell a standardized quantity of a specified commodity or security and are valued based on exchanged settlement prices or independent market quotes. Futures contracts are valued at the last settlement price, or in the absence of a sale, the last bid price for long positions and at the last ask price for short positions, at the end of each day on the board of trade or exchange upon which they are traded. Upon entering into a futures contract, the Fund deposits cash or securities in an account on behalf of the broker in an amount sufficient to meet the initial margin requirement. Subsequent payments are made or received by the Fund equal to the daily change in the contract value and are recorded as variation margin receivable or payable with a corresponding offset to unrealized gains or losses.
B. Level 3 Fair Value Investments — To the extent that the aforementioned significant inputs are unobservable, or if quotations are not readily available, or if GSAM believes that such quotations do not accurately reflect fair value, the fair value of the Fund’s investments may be determined under Valuation Procedures approved by the Trustees. GSAM, consistent with its procedures and applicable regulatory guidance, may make an adjustment to the most recent valuation prices of either domestic or foreign securities in light of significant events to reflect what it believes to be the fair value of the securities at the time of determining a Fund’s NAV. Significant events which could affect a large number of securities in a particular market may include, but are not limited to: significant fluctuations in U.S. or foreign markets; market dislocations; market disruptions; or unscheduled market closings. Significant events which could also affect a single issuer may include, but are not limited to: corporate actions such as reorganizations, mergers and buy-outs; ratings downgrades; and bankruptcies.
19
GOLDMAN SACHS VARIABLE INSURANCE TRUST SMALL CAP EQUITY INSIGHTS FUND
Notes to Financial Statements (continued)
December 31, 2014
3. INVESTMENTS AND FAIR VALUE MEASUREMENTS (continued)
C. Fair Value Hierarchy — The following is a summary of the Fund’s investments and derivatives classified in the fair value hierarchy as of December 31, 2014:
| | | | | | | | | | | | |
| Investment Type | | Level 1 | | | Level 2 | | | Level 3 | |
| Assets | | | | | | | | | | | | |
| Common Stock and/or Other Equity Investments(a) | | | | | | | | | | | | |
North America | | $ | 107,522,926 | | | $ | — | | | $ | — | |
| Securities Lending Reinvestment Vehicle | | | 6,925,868 | | | | — | | | | — | |
| Total | | $ | 114,448,794 | | | $ | — | | | $ | — | |
| | | |
| Derivative Type | | | | | | | | | |
| Assets(b) | | | | | | | | | | | | |
Futures Contracts | | $ | 47,536 | | | $ | — | | | $ | — | |
| (a) | Amounts are disclosed by continent to highlight the impact of time zone differences between local market close and the calculation of net asset value. Security valuations are based on the principal exchange or system on which they are traded, which may differ from country of domicile. The Fund utilizes fair value model prices provided by an independent fair value service for international equities, resulting in a Level 2 classification. |
| (b) | Amount shown represents unrealized gain (loss) at fiscal year end. |
For further information regarding security characteristics, see the Schedule of Investments.
4. INVESTMENTS IN DERIVATIVES
The following table sets forth, by certain risk types, the gross value of derivative contracts as of December 31, 2014. These instruments were used to meet the Fund’s investment objectives and to obtain and/or manage exposure related to the risks below. The values in the table below exclude the effects of cash collateral received or posted pursuant to these derivative contracts, and therefore are not representative of the Fund’s net exposure.
| | | | | | |
| Risk | | Statement of Assets and Liabilities | | Assets | |
| Equity | | Variation margin on certain derivative contracts | | $ | 47,536 | (a) |
| (a) | Includes unrealized gain (loss) on futures contracts described in the Additional Investment Information section of the Schedule of Investments. Only current day’s variation margin is reported within the Statement of Assets and Liabilities. |
The following table sets forth, by certain risk types, the Fund’s gains (losses) related to these derivatives and their indicative volumes for the fiscal year ended December 31, 2014. These gains (losses) should be considered in the context that these derivative contracts may have been executed to create investment opportunities and/or economically hedge certain investments, and accordingly, certain gains (losses) on such derivative contracts may offset certain (losses) gains attributable to investments. These gains (losses) are included in “Net realized gain (loss)” or “Net change in unrealized gain (loss)” on the Statement of Operations:
| | | | | | | | | | | | | | |
| Risk | | Statement of Operations | | Net
Realized
Gain (Loss) | | | Net Change in
Unrealized
Gain (Loss) | | | Average
Number of
Contracts(a) | |
| Equity | | Net realized gain (loss) from futures contracts/Net change in unrealized gain (loss) on futures contracts | | $ | 135,399 | | | $ | 33,906 | | | | 11 | |
| (a) | Average number of contracts is based on the average of month end balances for the fiscal year ended December 31, 2014. |
20
GOLDMAN SACHS VARIABLE INSURANCE TRUST SMALL CAP EQUITY INSIGHTS FUND
5. AGREEMENTS AND AFFILIATED TRANSACTIONS
A. Management Agreement — Under the Agreement, GSAM manages the Fund, subject to the general supervision of the Trustees.
As compensation for the services rendered pursuant to the Agreement, the assumption of the expenses related thereto and administration of the Fund’s business affairs, including providing facilities, GSAM is entitled to a management fee, accrued daily and paid monthly, equal to an annual percentage rate of the Fund’s average daily net assets.
For the fiscal year ended December 31, 2014, contractual and effective net management fees with GSAM were at the following rates:
| | | | | | | | | | | | | | | | | | | | | | |
| Contractual Management Fee Rate | | | | |
First
$2 billion | | | Next
$3 billion | | | Next
$3 billion | | | Over
$8 billion | | | Effective
Rate | | | Effective Net
Management
Fee Rate | |
| | 0.75% | | | | 0.68 | % | | | 0.65 | % | | | 0.64 | % | | | 0.75 | % | | | 0.70 | %* |
| * | GSAM has agreed to waive a portion of its management fee in order to achieve a net management rate, as defined in the Fund’s most recent prospectus. This waiver will be effective through at least April 30, 2015, and prior to such date GSAM may not terminate the arrangement without approval of the Trustees. The Effective Net Management Rate above is calculated based on management rate before and after the waiver had been adjusted, if applicable. For the fiscal year ended December 31, 2014, GSAM waived $56,685 of its management fee. |
B. Distribution and Service Plan — The Trust, on behalf of the Service Shares of the Fund, has adopted a Distribution and Service Plan (the “Plan”). Under the Plan, Goldman Sachs, which serves as distributor (the “Distributor”), is entitled to a fee accrued daily and paid monthly, for distribution services and personal and account maintenance services, which may then be paid by Goldman Sachs to authorized dealers, equal to, on an annual basis, 0.25% of the Fund’s average daily net assets attributable to Service Shares.
C. Transfer Agency Agreement — Goldman Sachs also serves as the transfer agent of the Fund for a fee pursuant to Transfer Agency Agreement. The fees charged for such transfer agency services are accrued daily and paid monthly at an annual rate of 0.02% of the average daily net assets of Institutional and Service Shares.
D. Other Expense Agreements and Affiliated Transactions — GSAM has agreed to limit certain “Other Expenses” of the Fund (excluding transfer agency fees and expenses, taxes, interest, brokerage fees, shareholder meetings, litigation, indemnification, and extraordinary expenses) to the extent such expenses exceed, on an annual basis, a percentage rate of the average daily net assets of the Fund. Such Other Expense reimbursements, if any, are accrued daily and paid monthly. In addition, the Fund is not obligated to reimburse GSAM for prior fiscal year expense reimbursements, if any. The Other Expense limitation as an annual percentage rate of average daily net assets for the Fund is 0.094%. The Other Expense limitation will remain in place through at least April 30, 2015, and prior to such date GSAM may not terminate the arrangement without the approval of the Trustees. The Fund bears its respective share of costs related to proxy and shareholder meetings, and GSAM has agreed to reimburse the Fund to the extent such expenses exceed a specified percentage of the Fund’s net assets. For the fiscal year ended December 31, 2014, GSAM reimbursed $177,856 to the Fund. In addition, the Fund has entered into certain offset arrangements with the custodian and the transfer agent, which may result in a reduction of the Fund’s expenses and are received irrespective of the application of the “Other Expense” limitation described above. For the fiscal year ended December 31, 2014, custody fee credits were $2,799.
E. Line of Credit Facility — As of December 31, 2014, the Fund participated in a $1,080,000,000 committed, unsecured revolving line of credit facility (the “facility”) together with other funds of the Trust and registered investment companies having management agreements with GSAM or its affiliates (“Other Borrowers”). Pursuant to the terms of the facility, the Fund and Other Borrowers could increase the credit amount by an additional $120,000,000, for a total of up to $1,200,000,000. This facility is to be used solely for temporary or emergency purposes, which may include the funding of redemptions. The interest rate on borrowings is based on the federal funds rate. The facility also requires a fee to be paid by the Fund based on the amount of the commitment that has not been utilized. For the fiscal year ended December 31, 2014, the Fund did not have any borrowings under the facility.
21
GOLDMAN SACHS VARIABLE INSURANCE TRUST SMALL CAP EQUITY INSIGHTS FUND
Notes to Financial Statements (continued)
December 31, 2014
5. AGREEMENTS AND AFFILIATED TRANSACTIONS (continued)
F. Other Transactions with Affiliates — For the fiscal year ended December 31, 2014, Goldman Sachs earned $431 in brokerage commissions from portfolio transactions, including futures transactions executed with Goldman Sachs as the Futures Commission Merchant, on behalf of the Fund.
6. PORTFOLIO SECURITIES TRANSACTIONS
The cost of purchases and proceeds from sales and maturities of long-term securities for the fiscal year ended December 31, 2014, were $131,516,268 and $150,860,960, respectively.
7. SECURITIES LENDING
Pursuant to exemptive relief granted by the Securities and Exchange Commission (“SEC”) and the terms and conditions contained therein, the Fund may lend its securities through a securities lending agent, Goldman Sachs Agency Lending (“GSAL”), a wholly-owned subsidiary of Goldman Sachs, to certain qualified borrowers including Goldman Sachs and affiliates. In accordance with the Fund’s securities lending procedures, the Fund receives cash collateral at least equal to the market value of the securities on loan. The market value of the loaned securities is determined at the close of business of the Fund, at their last sale price or official closing price on the principal exchange or system on which they are traded, and any additional required collateral is delivered to the Fund on the next business day. As with other extensions of credit, the Fund may experience a delay in the recovery of its securities or incur a loss should the borrower of the securities breach its agreement with the Fund or become insolvent at a time when the collateral is insufficient to cover the cost of repurchasing securities on loan. Dividend income received from securities on loan may not be subject to withholding taxes and therefore withholding taxes paid may differ from the amounts listed in the Statement of Operations.
The Fund invests the cash collateral received in connection with securities lending transactions in the Goldman Sachs Financial Square Money Market Fund (“Money Market Fund”), an affiliated series of the Trust. The Money Market Fund is registered under the Act as an open end investment company, is subject to Rule 2a-7 under the Act, and is managed by GSAM, for which GSAM may receive an investment advisory fee of up to 0.205% on an annualized basis of the average daily net assets of the Money Market Fund.
In the event of a default by a borrower with respect to any loan, GSAL will exercise any and all remedies provided under the applicable borrower agreement to make the Fund whole. These remedies include purchasing replacement securities by applying the collateral held from the defaulting broker against the purchase cost of the replacement securities. If, despite such efforts by GSAL to exercise these remedies, the Fund sustains losses as a result of a borrower’s default, GSAL indemnifies the Fund by purchasing replacement securities at its expense, or paying the Fund an amount equal to the market value of the replacement securities, subject to an exclusion for any shortfalls resulting from a loss of value in the cash collateral pool due to reinvestment risk and a requirement that the Fund agrees to assign rights to the collateral to GSAL for purpose of using the collateral to cover purchase of replacement securities as more fully described in the Securities Lending Agency Agreement. The Fund’s loaned securities were all subject to enforceable Securities Lending Agreements and the value of the collateral is equal to the value of the cash received. The value of loaned securities and cash collateral at period end are disclosed in the Fund’s Statement of Assets and Liabilities.
Both the Fund and GSAL received compensation relating to the lending of the Fund’s securities. The amount earned by the Fund for the fiscal year ended December 31, 2014, is reported under Investment Income on the Statement of Operations.
22
GOLDMAN SACHS VARIABLE INSURANCE TRUST SMALL CAP EQUITY INSIGHTS FUND
7. SECURITIES LENDING (continued)
The table below details securities lending activity with affiliates of Goldman Sachs:
| | | | | | | | | | |
| For the fiscal year ended December 31, 2014 | |
Earnings of GSAL Relating to Securities Loaned | | | Amounts Received by the Funds from Lending to Goldman Sachs | | | Amounts Payable to Goldman Sachs Upon Return of Securities Loaned as of December 31, 2014 | |
| | $17,443 | | | $ | 45,773 | | | $ | 3,128,046 | |
The following table provides information about the Fund’s investment in the Money Market Fund for the fiscal year ended December 31, 2014:
| | | | | | | | | | | | | | | | | | |
Number of Shares Held Beginning of Year | | | Shares Bought | | | Shares Sold | | | Number of Shares Held
End of Year | | | Value at End of Year | |
| | 9,795,085 | | | | 64,282,115 | | | | (67,151,332 | ) | | | 6,925,868 | | | $ | 6,925,868 | |
8. TAX INFORMATION
The tax character of distributions paid during the fiscal years ended December 31, 2013 and December 31, 2014 was as follows:
| | | | | | | | |
| | | 2013 | | | 2014 | |
| Distributions paid from: | | | | | | | | |
Ordinary income | | $ | 1,762,746 | | | $ | 6,700,936 | |
Net long-term capital gains | | | 13,471,719 | | | | 9,615,323 | |
| Total taxable distributions | | $ | 15,234,465 | | | $ | 16,316,259 | |
As of December 31, 2014, the components of accumulated earnings (losses) on a tax-basis were as follows:
| | | | |
| Undistributed ordinary income — net | | $ | 1,071,149 | |
| Undistributed long-term capital gains | | | 1,154,374 | |
| Total undistributed earnings | | $ | 2,225,523 | |
| Timing differences (Relating to REIT Adjustments) | | $ | 40,745 | |
| Unrealized gains — net | | $ | 11,830,179 | |
| Total accumulated gains — net | | $ | 14,096,447 | |
As of December 31, 2014, the Fund’s aggregate security unrealized gains and losses based on cost for U.S. federal income tax purposes were as follows:
| | | | |
| Tax cost | | $ | 102,618,615 | |
Gross unrealized gain | | | 17,261,307 | |
Gross unrealized loss | | | (5,431,128 | ) |
| Net unrealized security gain | | $ | 11,830,179 | |
23
GOLDMAN SACHS VARIABLE INSURANCE TRUST SMALL CAP EQUITY INSIGHTS FUND
Notes to Financial Statements (continued)
December 31, 2014
8. TAX INFORMATION (continued)
The difference between GAAP-basis and tax-basis unrealized gains (losses) is attributable primarily to wash sales, net mark to market gains (losses) on regulated futures contracts and differences in the tax treatment of passive foreign investment company investments.
In order to present certain components of the Fund’s capital accounts on a tax-basis, the Fund has reclassified $52,644 from undistributed net investment income to accumulated net realized gain (loss). This reclassification has no impact on the net asset value of the Fund and result primarily from the differences in the tax treatment of real estate investment trust investments and underlying fund investments.
GSAM has reviewed the Fund’s tax positions for all open tax years (the current and prior three years, as applicable) and has concluded that no provision for income tax is required in the Fund’s financial statements. Such open tax years remain subject to examination and adjustment by tax authorities.
9. OTHER RISKS
The Fund’s risks include, but are not limited to, the following:
Large Shareholder Transaction Risk — The Fund may experience adverse effects when certain large shareholders, such as other funds, participating insurance companies, accounts and Goldman Sachs affiliates, purchase or redeem large amounts of shares of the Fund. Such large shareholder redemptions may cause the Fund to sell portfolio securities at times when it would not otherwise do so, which may negatively impact the Fund’s NAV and liquidity. Similarly, large Fund share purchases may adversely affect the Fund’s performance to the extent that the Fund is delayed in investing new cash and is required to maintain a larger cash position than it ordinarily would. These transactions may also increase transaction costs. In addition, a large redemption could result in the Fund’s current expenses being allocated over a smaller asset base, leading to an increase in the Fund’s expense ratio.
Liquidity Risk — The Fund may make investments that are illiquid or that may become less liquid in response to market developments or adverse investor perceptions. Illiquid investments may be more difficult to value. Liquidity risk may also refer to the risk that a Fund will not be able to pay redemption proceeds within the allowable time period because of unusual market conditions, an unusually high volume of redemption requests, or other reasons. To meet redemption requests, a Fund may be forced to sell investments at an unfavorable time and/or under unfavorable conditions.
Market and Credit Risks — In the normal course of business, the Fund trades financial instruments and enters into financial transactions where risk of potential loss exists due to changes in the market (market risk). Additionally, the Fund may also be exposed to credit risk in the event that an issuer or guarantor fails to perform or that an institution or entity with which the Fund has unsettled or open transactions defaults.
24
GOLDMAN SACHS VARIABLE INSURANCE TRUST SMALL CAP EQUITY INSIGHTS FUND
10. INDEMNIFICATIONS
Under the Trust’s organizational documents, its Trustees, officers, employees and agents are indemnified, to the extent permitted by the Act and state law, against certain liabilities that may arise out of performance of their duties to the Fund. Additionally, in the course of business, the Fund enters into contracts that contain a variety of indemnification clauses. The Fund’s maximum exposure under these arrangements is unknown, as this would involve future claims that may be made against the Fund that have not yet occurred. However, GSAM believes the risk of loss under these arrangements to be remote.
11. SUBSEQUENT EVENTS
Subsequent events after the Statement of Assets and Liabilities date have been evaluated through the date the financial statements were issued. GSAM has concluded that there is no impact requiring adjustment or disclosure in the financial statements.
25
GOLDMAN SACHS VARIABLE INSURANCE TRUST SMALL CAP EQUITY INSIGHTS FUND
Notes to Financial Statements (continued)
December 31, 2014
12. SUMMARY OF SHARE TRANSACTIONS
Share activity is as follows:
| | | | | | | | | | | | | | | | |
| | | For the Fiscal Year Ended
December 31, 2014 | | | For the Fiscal Year Ended
December 31, 2013 | |
| | | Shares | | | Dollars | | | Shares | | | Dollars | |
| Institutional Shares | | | | | | | | | | | | | | | | |
| Shares sold | | | 1,123,938 | | | $ | 16,714,665 | | | | 1,027,098 | | | $ | 15,552,232 | |
| Reinvestment of distributions | | | 960,144 | | | | 12,808,316 | | | | 822,995 | | | | 12,081,568 | |
| Shares redeemed | | | (2,080,842 | ) | | | (31,192,672 | ) | | | (1,870,005 | ) | | | (27,808,623 | ) |
| | | | 3,240 | | | | (1,669,691 | ) | | | (19,912 | ) | | | (174,823 | ) |
| Service Shares | | | | | | | | | | | | | | | | |
| Shares sold | | | 16,602 | | | | 260,295 | | | | 14,725 | | | | 210,825 | |
| Reinvestment of distributions | | | 264,351 | | | | 3,507,943 | | | | 215,804 | | | | 3,152,897 | |
| Shares redeemed | | | (263,368 | ) | | | (3,942,824 | ) | | | (293,595 | ) | | | (4,419,070 | ) |
| | | | 17,585 | | | | (174,586 | ) | | | (63,066 | ) | | | (1,055,348 | ) |
| NET DECREASE | | | 20,825 | | | $ | (1,844,277 | ) | | | (82,978 | ) | | $ | (1,230,171 | ) |
26
Report of Independent Registered Public Accounting Firm
To the Board of Trustees and Shareholders of
Goldman Sachs Variable Insurance Trust — Goldman Sachs Small Cap Equity Insights Fund (“formerly known as the Goldman Sachs Structured Small Cap Equity Fund”):
In our opinion, the accompanying statement of assets and liabilities, including the schedule of investments, and the related statements of operations and of changes in net assets and the financial highlights present fairly, in all material respects, the financial position of Goldman Sachs Small Cap Equity Insights Fund (the “Fund”) (“formerly known as the Goldman Sachs Structured Small Cap Equity Fund”), a fund of Goldman Sachs Variable Insurance Trust, at December 31, 2014 and the results of its operations, the changes in its net assets and the financial highlights for each of the periods indicated, in conformity with accounting principles generally accepted in the United States of America. These financial statements and financial highlights (hereafter referred to as “financial statements”) are the responsibility of the Fund’s management. Our responsibility is to express an opinion on these financial statements based on our audits. We conducted our audits of these financial statements in accordance with the standards of the Public Company Accounting Oversight Board (United States). Those standards require that we plan and perform the audit to obtain reasonable assurance about whether the financial statements are free of material misstatement. An audit includes examining, on a test basis, evidence supporting the amounts and disclosures in the financial statements, assessing the accounting principles used and significant estimates made by management, and evaluating the overall financial statement presentation. We believe that our audits, which included confirmation of securities at December 31, 2014 by correspondence with the custodian, transfer agent and brokers, provide a reasonable basis for our opinion.
PricewaterhouseCoopers LLP
Boston, Massachusetts
February 19, 2015
27
GOLDMAN SACHS VARIABLE INSURANCE TRUST SMALL CAP EQUITY INSIGHTS FUND
| | |
| Fund Expenses — Six Month Period Ended December 31, 2014 (Unaudited) | | |
As a shareholder of Institutional or Service Shares of the Fund, you incur ongoing costs, including management fees, distribution and service (12b-1) fees (with respect to Service Shares) and other Fund expenses. This example is intended to help you understand your ongoing costs (in dollars) of investing in the Institutional Shares and Service Shares of the Fund and to compare these costs with the ongoing costs of investing in other mutual funds.
The example is based on an investment of $1,000 invested at the beginning of the period and held for the entire period from July 1, 2014 through December 31, 2014.
Actual Expenses — The first line under each share class in the table below provides information about actual account values and actual expenses. You may use the information in this line, together with the amount you invested, to estimate the expenses that you paid over the period. Simply divide your account value by $1,000 (for example, an $8,600 account value divided by $1,000=8.6), then multiply the result by the number in the first line under the heading entitled “Expenses Paid” to estimate the expenses you paid on your account during this period.
Hypothetical Example for Comparison Purposes — The second line under each share class in the table below provides information about hypothetical account values and hypothetical expenses based on the Fund's actual net expense ratio and an assumed rate of return of 5% per year before expenses, which is not the Fund's actual return. The hypothetical account values and expenses may not be used to estimate the actual ending account balance or expenses you paid for the period. You may use this information to compare the ongoing costs of investing in the Fund and other funds. To do so, compare this 5% hypothetical example with the 5% hypothetical examples that appear in the shareholder reports of the other funds.
Please note that the expenses shown in the table are meant to highlight your ongoing costs only. As a shareholder of the Fund you do not incur any transaction costs, such as sales charges, redemption fees, or exchange fees, but shareholders of other funds may incur such costs. The second line of the table is useful in comparing ongoing costs only, and will not help you determine the relative total costs of owning different funds whose shareholders may incur transaction costs.
| | | | | | | | | | | | |
| Share Class | | Beginning
Account Value
7/01/14 | | | Ending
Account Value
12/31/14 | | | Expenses Paid
for the
6 Months
Ended
12/31/14* | |
| Institutional | | | | | | | | | | | | |
| Actual | | $ | 1,000 | | | $ | 1,029.00 | | | $ | 4.19 | |
| Hypothetical 5% return | | | 1,000 | | | | 1,021.07 | + | | | 4.18 | |
| Service | | | | | | | | | | | | |
| Actual | | | 1,000 | | | | 1,027.80 | | | | 5.47 | |
| Hypothetical 5% return | | | 1,000 | | | | 1,019.81 | + | | | 5.45 | |
| | * | Expenses are calculated using the Fund’s annualized net expense ratio for each class, which represents the ongoing expenses as a percentage of net assets for the six months ended December 31, 2014. Expenses are calculated by multiplying the annualized net expense ratio by the average account value for the period; then multiplying the result by the number of days in the most recent fiscal half year; and then dividing that result by the number of days in the fiscal year. The annualized net expense ratios for the period were 0.82% and 1.07% for the Institutional and Service Shares, respectively. | |
| | + | Hypothetical expenses are based on the Fund’s actual annualized net expense ratios and an assumed rate of return of 5% per year before expenses. | |
28
GOLDMAN SACHS VARIABLE INSURANCE TRUST SMALL CAP EQUITY INSIGHTS FUND
Trustees and Officers (Unaudited)
Independent Trustees
| | | | | | | | | | | | |
| | | | | |
Name,
Address and Age1 | | Position(s) Held
with the Trust | | Term of Office and
Length of
Time Served2 | | Principal Occupation(s) During Past 5 Years | | Number of
Portfolios in
Fund Complex
Overseen by
Trustee3 | | | Other Directorships Held by Trustee4 |
Ashok N. Bakhru Age: 72 | | Chairman of the Board of Trustees | | Since 1996 (Trustee since 1991) | | Mr. Bakhru is retired. He was formerly Director, Apollo Investment Corporation (a business development company) (2008-2013); President, ABN Associates (a management and financial consulting firm) (1994-1996 and 1998-2012); Trustee, Scholarship America (1998-2005); Trustee, Institute for Higher Education Policy (2003-2008); Director, Private Equity Investors — III and IV (1998-2007), and Equity-Linked Investors II (April 2002-2007). Chairman of the Board of Trustees — Goldman Sachs Fund Complex. | | | 128 | | | None |
John P. Coblentz, Jr. Age: 73 | | Trustee | | Since 2003 | | Mr. Coblentz is retired. Formerly, he was Partner, Deloitte & Touche LLP (1975-2003); Director, Emerging Markets Group, Ltd. (2004-2006); and Director, Elderhostel, Inc. (2006-2012). Trustee — Goldman Sachs Fund Complex. | | | 128 | | | None |
Diana M. Daniels Age: 65 | | Trustee | | Since 2007 | | Ms. Daniels is retired. Formerly, she was Vice President, General Counsel and Secretary, The Washington Post Company (1991-2006). Ms. Daniels serves as a Presidential Councillor of Cornell University (2013-Present); Member, Advisory Board, Psychology Without Borders (international humanitarian aid organization) (2007-Present), and former Member of the Legal Advisory Board, New York Stock Exchange (2003-2006) and of the Corporate Advisory Board, Standish Mellon Management Advisors (2006-2007). Trustee — Goldman Sachs Fund Complex. | | | 108 | | | None |
Joseph P. LoRusso Age: 57 | | Trustee | | Since 2010 | | Mr. LoRusso is retired. Formerly, he was President, Fidelity Investments Institutional Services Co. (“FIIS”) (2002-2008); Director, FIIS (2002-2008); Director, Fidelity Investments Institutional Operations Company (2003-2007); Executive Officer, Fidelity Distributors Corporation (2007-2008). Trustee — Goldman Sachs Fund Complex. | | | 108 | | | None |
Herbert J. Markley Age: 64 | | Trustee | | Since 2013 | | Mr. Markley is retired. Formerly, he was Executive Vice President, Deere & Company (an agricultural and construction equipment manufacturer) (2007-2009), and President, Agricultural Division, Deere & Company (2001-2007). Trustee — Goldman Sachs Fund Complex. | | | 108 | | | None |
Jessica Palmer Age: 65 | | Trustee | | Since 2007 | | Ms. Palmer is retired. She is Director, Emerson Center for the Arts and Culture (2011-Present); and was formerly a Consultant, Citigroup Human Resources Department (2007-2008); Managing Director, Citigroup Corporate and Investment Banking (previously, Salomon Smith Barney/Salomon Brothers) (1984-2006). Ms. Palmer was a Member of the Board of Trustees of Indian Mountain School (private elementary and secondary school) (2004-2009). Trustee — Goldman Sachs Fund Complex. | | | 108 | | | None |
Richard P. Strubel Age: 75 | | Trustee | | Since 1987 | | Mr. Strubel is retired. Formerly, he was Director, Cardean Learning Group (provider of educational services via the internet) (2003-2008); and Director, Gildan Activewear Inc. (a clothing marketing and manufacturing company) (2000-2014). He serves as Trustee, Emeritus, The University of Chicago (1987-Present). Trustee — Goldman Sachs Fund Complex. | | | 128 | | | The Northern Trust Mutual Fund Complex (56 Portfolios) (Chairman of the Board of Trustees) |
| | | | | | | | | | | | |
29
GOLDMAN SACHS VARIABLE INSURANCE TRUST SMALL CAP EQUITY INSIGHTS FUND
Trustees and Officers (Unaudited) (continued)
Independent Trustees (continued)
| | | | | | | | | | | | |
| | | | | |
Name,
Address and Age1 | | Position(s) Held
with the Trust | | Term of Office and
Length of
Time Served2 | | Principal Occupation(s) During Past 5 Years | | Number of
Portfolios in
Fund Complex
Overseen by
Trustee3 | | | Other Directorships Held by Trustee4 |
Roy W. Templin Age: 54 | | Trustee | | Since 2013 | | Mr. Templin is retired. He is Chairman of the Board of Directors, Con-Way Incorporated (2012-Present); and was formerly Executive Vice President and Chief Financial Officer, Whirlpool Corporation (an appliance manufacturer and marketer) (2004-2012). Trustee — Goldman Sachs Fund Complex. | | | 108 | | | Con-Way Incorporated (a transportation, supply-chain management and logistics services company) |
| | | | | | | | | | | | |
Interested Trustees*
| | | | | | | | | | | | |
| | | | | |
Name,
Address and Age1 | | Position(s) Held
with the Trust | | Term of Office and
Length of
Time Served2 | | Principal Occupation(s) During Past 5 Years | | Number of
Portfolios in
Fund Complex
Overseen by
Trustee3 | | | Other Directorships Held by Trustee4 |
James A. McNamara Age: 52 | | President and Trustee | | Since 2007 | | Managing Director, Goldman Sachs (December 1998-Present); Director of Institutional Fund Sales, GSAM (April 1998-December 2000); and Senior Vice President and Manager, Dreyfus Institutional Service Corporation (January 1993- April 1998). President — Goldman Sachs Fund Complex (November 2007-Present); Senior Vice President — Goldman Sachs Fund Complex (May 2007-November 2007); and Vice President — Goldman Sachs Fund Complex (2001-2007). Trustee — Goldman Sachs Fund Complex (November 2007-Present and December 2002-May 2004). | | | 127 | | | None |
Alan A. Shuch Age: 65 | | Trustee | | Since 1990 | | Advisory Director — GSAM (May 1999-Present); Consultant to GSAM (December 1994-May 1999); and Limited Partner, Goldman Sachs (December 1994-May 1999). Trustee — Goldman Sachs Fund Complex. | | | 108 | | | None |
| | | | | | | | | | | | |
| * | These persons are considered to be “Interested Trustees” because they hold positions with Goldman Sachs and own securities issued by The Goldman Sachs Group, Inc. Each Interested Trustee holds comparable positions with certain other companies of which Goldman Sachs, GSAM or an affiliate thereof is the investment adviser, administrator and/or distributor. |
| 1 | Each Trustee may be contacted by writing to the Trustee, c/o Goldman Sachs, 200 West Street, New York, New York, 10282, Attn: Caroline Kraus. Information is provided as of December 31, 2014. |
| 2 | Each Trustee holds office for an indefinite term until the earliest of: (a) the election of his or her successor; (b) the date the Trustee resigns or is removed by the Board of Trustees or shareholders, in accordance with the Trust’s Declaration of Trust; (c) December 31st of the year in which the Trustee turns 74 years of age, subject to waiver by a majority of the Trustees (in accordance with the current resolutions of the Board of Trustees, which may be changed by the Trustees without shareholder vote); or (d) the termination of the Trust. By resolution of the Board of Trustees determining that an extension of service would be beneficial to the Trust, the retirement age has been extended with respect to Richard P. Strubel. |
| 3 | The Goldman Sachs Fund Complex consists of the Trust and Goldman Sachs Trust (“GST”). As of December 31, 2014, the Trust consisted of 14 portfolios and GST consisted of 94 portfolios (88 of which offered shares to the public). The Goldman Sachs Fund Complex also includes, with respect to Messrs. Bakhru, Coblentz and Strubel, Goldman Sachs Trust II (“GSTII”), Goldman Sachs BDC, Inc. (“GSBDC”), Goldman Sachs MLP Income Opportunities Fund (“GSMLP”), Goldman Sachs MLP and Energy Renaissance Fund (“GSMER”) and Goldman Sachs ETF Trust (“GSETF”), and with respect to Mr. McNamara, GSTII, GSMLP, GSMER, and GSETF. GSTII consisted of 6 portfolios (one of which offered shares to the public). GSBDC, GSMLP and GSMER each consisted of one portfolio. GSETF consisted of 11 portfolios (none of which offered shares to the public). As of December 31, 2014, GSBDC had not offered shares to the public. |
| 4 | This column includes only directorships of companies required to report to the Securities and Exchange Commission under the Securities Exchange Act of 1934 (i.e., “public companies”) or other investment companies registered under the Act. |
Additional information about the Trustees is available in the Fund’s Statement of Additional Information, which can be obtained from Goldman Sachs free of charge by calling this toll-free number (in the United States of America): 1-800-292-4726.
30
GOLDMAN SACHS VARIABLE INSURANCE TRUST SMALL CAP EQUITY INSIGHTS FUND
Trustees and Officers (Unaudited) (continued)
Officers of the Trust*
| | | | | | |
| | | |
Name, Address and Age1 | | Position(s) Held With the Trust | | Term of
Office and
Length of
Time Served2 | | Principal Occupation(s) During Past 5 Years |
James A. McNamara
200 West Street New York, NY 10282 Age: 52 | | President and Trustee | | Since 2007 | | Managing Director, Goldman Sachs (December 1998-Present); Director of Institutional Fund Sales, GSAM (April 1998-December 2000); and Senior Vice President and Manager, Dreyfus Institutional Service Corporation (January 1993-April 1998). President — Goldman Sachs Fund Complex (November 2007-Present); Senior Vice President — Goldman Sachs Fund Complex (May 2007-November 2007); and Vice President — Goldman Sachs Fund Complex (2001-2007). Trustee — Goldman Sachs Fund Complex (November 2007-Present and December 2002-May 2004). |
Caroline L. Kraus
200 West Street New York, NY 10282 Age: 37 | | Secretary | | Since 2012 | | Vice President, Goldman Sachs (August 2006-Present); Associate General Counsel, Goldman Sachs (2012-Present); Assistant General Counsel, Goldman Sachs (August 2006-December 2011) and Associate, Weil, Gotshal & Manges, LLP (2002-2006). Secretary — Goldman Sachs Fund Complex (August 2012-Present) and Assistant Secretary — Goldman Sachs Fund Complex (June 2012-August 2012). |
Scott M. McHugh
200 West Street New York, NY 10282 Age: 43 | | Principal Financial
Officer, Senior Vice
President and
Treasurer | | Since 2009
(Principal
Financial
Officer since
2013) | | Vice President, Goldman Sachs (February 2007-Present); Assistant Treasurer of certain mutual funds administered by DWS Scudder (2005-2007); and Director (2005-2007), Vice President (2000-2005) and Assistant Vice President (1998-2000), Deutsche Asset Management or its predecessor (1998-2007). Principal Financial Officer — Goldman Sachs Fund Complex (November 2013-Present); Treasurer — Goldman Sachs Fund Complex (October 2009-Present); Senior Vice President — Goldman Sachs Fund Complex (November 2009-Present); and Assistant Treasurer — Goldman Sachs Fund Complex (May 2007-October 2009). |
| | | | | | |
| * | Represents a partial list of officers of the Trust. Additional information about all the officers is available in the Fund’s Statement of Additional Information, which can be obtained from Goldman Sachs free of charge by calling this toll-free number (in the United States): 1-800-292-4726. |
| 1 | Information is provided as of December 31, 2014. |
| 2 | Officers hold office at the pleasure of the Board of Trustees or until their successors are duly elected and qualified. Each officer holds comparable positions with certain other companies of which Goldman Sachs, GSAM or an affiliate thereof is the investment adviser, administrator and/or distributor. |
31
GOLDMAN SACHS VARIABLE INSURANCE TRUST SMALL CAP EQUITY INSIGHTS FUND
Goldman Sachs Variable Insurance Trust — Tax Information (Unaudited)
For the year ended December 31, 2014, 16.20% of the dividends paid from net investment company taxable income by the Small Cap Equity Insights Fund qualify for the dividends received deduction available to corporations.
Pursuant to Section 852 of the Internal Revenue Code, the Small Cap Equity Insights Fund designates $9,615,323 or, if different, the maximum amount allowable, as capital gain dividends paid during the fiscal year ended December 31, 2014.
32
| | |
| TRUSTEES | | OFFICERS |
| Ashok N. Bakhru, Chairman | | James A. McNamara, President |
John P. Coblentz, Jr. Diana M. Daniels | | Scott M. McHugh, Principal Financial Officer and Treasurer |
| Joseph P. LoRusso | | Caroline L. Kraus, Secretary |
| Herbert J. Markley | | |
| James A. McNamara | | |
| Jessica Palmer | | |
| Alan A. Shuch | | |
| Richard P. Strubel | | |
| Roy W. Templin | | |
GOLDMAN, SACHS & CO.
Distributor and Transfer Agent
GOLDMAN SACHS ASSET MANAGEMENT, L.P.
Investment Adviser
200 West Street, New York
New York 10282
Visit our web site at www.GSAMFUNDS.com to obtain the most recent month-end returns.
The reports concerning the Fund included in this shareholder report may contain certain forward-looking statements about the factors that may affect the performance of the Fund in the future. These statements are based on Fund management’s predictions and expectations concerning certain future events and their expected impact on the Fund, such as performance of the economy as a whole and of specific industry sectors, changes in the levels of interest rates, the impact of developing world events, and other factors that may influence the future performance of the Fund. Management believes these forward-looking statements to be reasonable, although they are inherently uncertain and difficult to predict. Actual events may cause adjustments in portfolio management strategies from those currently expected to be employed.
A description of the policies and procedures that the Fund uses to determine how to vote proxies relating to portfolio securities and information regarding how the Fund voted proxies relating to portfolio securities for the 12-month period ended December 31, 2013 is available (i) without charge, upon request by calling 1-800-621-2550; and (ii) on the Securities and Exchange Commission (“SEC”) web site at http://www.sec.gov.
The Fund files its complete schedule of portfolio holdings with the SEC for the first and third quarters of each fiscal year on Form N-Q. The Fund’s Form N-Qs are available on the SEC’s web site at http://www.sec.gov within 60 days after the Fund’s first and third fiscal quarters. The Fund’s Form N-Qs may be reviewed and copied at the SEC’s Public Reference Room in Washington, D.C. and information on the operation of the Public Reference Room may also be obtained by calling 1-800-SEC-0330. Form N-Qs may be obtained upon request and without charge by calling 1-800-621-2550.
The website links provided are for your convenience only and are not an endorsement or recommendation by GSAM of any of these websites or the products or services offered. GSAM is not responsible for the accuracy and validity of the content of these websites.
Fund holdings and allocations shown are as of December 31, 2014 and may not be representative of future investments. Fund holdings should not be relied on in making investment decisions and should not be construed as research or investment advice regarding particular securities. Current and future holdings are subject to risk.
The Global Industry Classification Standard (“GICS”) was developed by and is the exclusive property and a service mark of Morgan Stanley Capital International Inc. (“MSCI”) and Standard & Poor’s, a division of The McGraw-Hill Companies, Inc. (“S&P”) and is licensed for use by Goldman Sachs. Neither MSCI, S&P nor any other party involved in making or compiling the GICS or any GICS classifications makes any express or implied warranties or representations with respect to such standard or classification (or the results to be obtained by the use thereof), and all such parties hereby expressly disclaim all warranties of originality, accuracy, completeness, merchantability or fitness for a particular purpose with respect to any of such standard or classification. Without limiting any of the foregoing, in no event shall MSCI, S&P, any of their affiliates or any third party involved in making or compiling the GICS or any GICS classifications have any liability for any direct, indirect, special, punitive, consequential or any other damages (including lost profits) even if notified of the possibility of such damages.
The portfolio risk management process includes an effort to monitor and manage risk, but does not imply low risk.
Shares of the Goldman Sachs VIT Funds are offered to separate accounts of participating life insurance companies for the purpose of funding variable annuity contracts and variable life insurance policies. Shares of the Fund are not offered directly to the general public. The variable annuity contracts and variable life insurance policies are described in the separate prospectuses issued by participating insurance companies. You should refer to those prospectuses for information about surrender charges, mortality and expense risk fees and other charges that may be assessed by participating insurance companies under the variable annuity contracts or variable life insurance policies. Such fees or charges, if any, may affect the return you may realize with respect to your investments. Ask your representative for more complete information. Please consider a fund’s objectives, risks and charges and expenses, and read the prospectus carefully before investing. The prospectus contains this and other information about the Fund.
This material is not authorized for distribution to prospective investors unless preceded or accompanied by a current Prospectus or summary prospectus, if applicable. Investors should consider a Fund’s objective, risks, and charges and expenses, and read the summary prospectus, if available, and/or the Prospectus carefully before investing or sending money. The summary prospectus, if available, and the Prospectus contain this and other information about a Fund and may be obtained from your Authorized Institution or from Goldman, Sachs & Co. by calling 1-800-621-2550.
This report is prepared for the general information of contract owners and is not an offer of shares of the Goldman Sachs Variable Insurance Trust: Goldman Sachs Small Cap Equity Insights Fund.
© 2015 Goldman Sachs. All rights reserved.
VITSCAR-15/153847.MF.MED.TMPL/2/2015
Goldman
Sachs Variable Insurance Trust
Goldman Sachs
Strategic Growth Fund
Annual Report
December 31, 2014
GOLDMAN SACHS VARIABLE INSURANCE TRUST STRATEGIC GROWTH FUND
Principal Investment Strategies and Risks
This is not a complete list of risks that may affect the Fund. For additional information concerning the risks applicable to the Fund, please see the Fund’s Prospectuses.
Shares of the Goldman Sachs Variable Insurance Trust — Goldman Sachs Strategic Growth Fund are offered to separate accounts of participating life insurance companies for the purpose of funding variable annuity contracts and variable life insurance policies. Shares of the Fund are not offered directly to the general public. The variable annuity contracts and variable life insurance policies are described in the separate prospectuses issued by participating insurance companies. You should refer to those prospectuses for information about surrender charges, mortality and expense risk fees and other charges that may be assessed by participating insurance companies under the variable annuity contracts or variable life insurance policies. Such fees or charges, if any, may affect the return you realize with respect to your investments. Ask your representative for more complete information. Please consider the Fund’s objective, risks and charges and expenses, and read the Prospectus carefully before investing. The Prospectus contains this and other information about the Fund.
The Goldman Sachs Strategic Growth Fund invests primarily in U.S. equity investments. The Fund’s equity investments are subject to market risk, which means that the value of the securities in which it invests may go up or down in response to the prospects of individual companies, particular sectors and/or general economic conditions. Different investment styles (e.g., “growth”) tend to shift in and out of favor, and at times the Fund may underperform other funds that invest in similar asset classes.
1
GOLDMAN SACHS VARIABLE INSURANCE TRUST STRATEGIC GROWTH FUND
INVESTMENT OBJECTIVE
The Fund seeks long-term growth of capital.
Portfolio Management Discussion and Analysis
Below, the Goldman Sachs Growth Portfolio Management Team discusses the Goldman Sachs Variable Insurance Trust — Goldman Sachs Strategic Growth Fund’s (the “Fund”) performance and positioning for the 12-month period ended December 31, 2014 (the “Reporting Period”).
How did the Fund perform during the Reporting Period?
During the Reporting Period, the Fund’s Institutional and Service Shares generated average annual total returns of 13.64% and 13.38%, respectively. These returns compare to the 13.05% average annual total return of the Fund’s benchmark, the Russell 1000® Growth Index (with dividends reinvested) (the “Russell Index”), during the same time period.
What economic and market factors most influenced the equity markets as a whole during the Reporting Period?
Representing the U.S. equity market, the S&P 500® Index fell 0.25% in December 2014, but finished the fourth calendar quarter up 4.93% and gained 13.69% during the Reporting Period as a whole, as it posted its third consecutive year of broad double-digit gains.
Diverging global economies, strong merger and acquisition activity, weakening oil prices and declining U.S. interest rates were major themes affecting U.S. equities throughout 2014. The U.S. economic recovery accelerated through the Reporting Period, particularly compared to other major developed markets, which helped fuel U.S. corporate earnings growth and strong U.S. equity returns. Furthermore, the decline in unemployment to 5.8% and lower energy prices gave new hope to the potential for a broader consumer recovery. U.S. equity market volatility picked up during the second half of 2014 from exceptionally low levels mid-year, but the S&P 500® Index had no more than three consecutive down days during 2014, a feat not seen since 1928.
For the Reporting Period overall, nine of the ten sectors within the S&P 500® Index were up. Merger and acquisition activity rose to its highest annual level since 2007 largely due to transactions within the information technology and health care sectors, which handily outperformed the broader market. The top-weighted information technology sector was also the largest positive contributor (weight times performance) to S&P 500® Index returns. Given the unexpected decline in U.S. interest rates, real estate investment trusts (“REITs”) and the utilities sector also outperformed the broader market during the Reporting Period. Conversely, the energy sector underperformed most during 2014, as concerns over rising U.S. supply and weakening global demand triggered a collapse in U.S. and global crude oil prices. Telecommunication services also performed poorly during the year as aggressive competition, including price wars aimed at luring customers, and market saturation put growth pressures on the sector, especially on the wireless side.
All segments of the U.S. equity market advanced during the Reporting Period, with large-cap and mid-cap stocks, as measured by the Russell 1000® Index and the Russell Midcap® Index, respectively, gaining most and almost exactly in line with each other. Following at some distance were small-cap stocks, as measured by the Russell 2000® Index. Large-cap stocks were most successful relative to small-caps in the information technology sector. From a style perspective, value-oriented stocks outpaced growth-oriented stocks in the large-cap and mid-cap segments of the U.S. equity market, but growth-oriented stocks outperformed value-oriented stocks in the small-cap segment of the U.S. equity market. (All as measured by the Russell Investments indices.)
What key factors were responsible for the Fund’s performance during the Reporting Period?
The Fund’s modest outperformance relative to the Russell Index during the Reporting Period can be attributed primarily to stock selection overall.
Which equity market sectors most significantly affected Fund performance?
Contributing most positively to the Fund’s relative results during the Reporting Period was effective stock selection in the information technology, financials, materials and consumer staples sectors. Partially offsetting such positive contributors was stock selection in the consumer discretionary, industrials and energy sectors, which detracted.
2
GOLDMAN SACHS VARIABLE INSURANCE TRUST STRATEGIC GROWTH FUND
What were some of the Fund’s best-performing individual stocks?
The Fund benefited relative to the Russell Index from positions in specialty coffee and coffeemaker company Keurig Green Mountain, specialty retailer L Brands and pharmaceuticals company Regeneron Pharmaceuticals.
Specialty coffee and coffeemaker company Keurig Green Mountain was the top contributor to the Fund’s performance during the Reporting Period. Its shares rose following the announcement that Coca-Cola purchased a 10% stake in the company and entered into a 10-year agreement to develop Coke brand products for the Keurig Cold beverage system. The company also benefited from exposure to the Starbucks, Dunkin, Folgers and Costco brands. Further, shareholders approved the company’s official name change to Keurig Green Mountain from Green Mountain Coffee Roasters, recognizing the value that Keurig has brought to the overall franchise and creating a powerful corporate identity. Following the stock’s strong performance, we trimmed the Fund’s position in Keurig Green Mountain during the Reporting Period, taking profits.
L Brands was a top contributor to the Fund’s relative performance during the Reporting Period. The company reported strong third quarter 2014 results and raised its fiscal year earnings guidance in November 2014. Strong comparable store sales growth at both Victoria’s Secret and Bath & Body Works, combined with margin expansion, drove L Brands’ upside performance. At the end of the Reporting Period, we believed L Brands was well positioned for long-term growth based upon three key initiatives — Victoria’s Secret U.S. square footage growth, international expansion and operating margin expansion through supply chain improvements that should reduce lead times and allow stores to stay lean and reduce markdowns.
Regeneron Pharmaceuticals was a strong performer during the Reporting Period, with its share price gaining after the company reported in July 2014 that is flagship drug, Eylea, was approved by the Food and Drug Administration (“FDA”) for the treatment of diabetic macular edema. While we believe Eylea should be well received by the market, we viewed this as an opportunity to take profits and consolidate positioning into higher conviction opportunities. We thus exited the Fund’s position in Regeneron Pharmaceuticals.
Which stocks detracted significantly from the Fund’s performance during the Reporting Period?
Detracting from the Fund’s results relative to its benchmark index were positions in energy services company Halliburton, online retailer Amazon and global clothing manufacturer PVH.
The sell-off in oil prices weighed on the energy sector broadly, and shares of Halliburton, a new purchase for the Fund during the Reporting Period, were no exception. While we acknowledge the near-term volatility of oil prices, we continue to believe Halliburton is a high quality company, well positioned to be a strong performer over the long term. During the Reporting Period, Halliburton announced its intention to purchase oilfield services competitor Baker Hughes. This transaction would create the second-largest oilfield services company globally. We believe the deal will be accretive for Halliburton, which is anticipated to primarily benefit from Baker Hughes’ strong technology presence in North America and from an estimated $2 billion in cost synergies by the end of 2017. At the end of the Reporting Period, we believed shares of Halliburton were attractively valued and the company was well positioned to benefit from its leadership position in North America. Additionally, we were positive on Halliburton’s efficiency program in North America, which supports additional margin improvement, in our view.
Amazon, the world’s largest online retailer, was a top detractor from returns during the Reporting Period. Its shares declined following the company’s first quarter earnings release and soft guidance due to increased spending levels. However, we believed its long-term growth story remained on track. Indeed, Amazon’s revenues accelerated in the first quarter of 2014 driven by both international growth and Amazon Web Services (“AWS”). Also, importantly, gross margins were better than expected. At the end of the Reporting Period, we continued to believe Amazon would maintain its dominant market share in the online retail market. We also believed the company has compelling opportunities for revenue growth driven by new category and geographic expansion and strength in AWS. In addition, the company has indicated a potential increase in the annual membership fee for Amazon Prime, which could drive revenue growth and, in our view, further boost confidence in the loyalty of Amazon’s customer base.
PVH detracted from the Fund’s relative returns during the Reporting Period. While no specific data points were released to indicate a reason for the share price decline, we believe its shares were challenged by fears of a slowdown in apparel spending in the U.S. and on concerns around potential weakness in European retail sales. However, at the end of the Reporting Period, we believed PVH remains a high quality growth company that has an attractive opportunity to expand its Tommy Hilfiger and Calvin Klein brands globally. In addition, we believe the company should continue to benefit from its Warnaco (a textile/clothing corporation) acquisition, as, in our view, it optimizes the Calvin Klein brand and realizes greater efficiencies.
3
GOLDMAN SACHS VARIABLE INSURANCE TRUST STRATEGIC GROWTH FUND
How did the Fund use derivatives and similar instruments during the Reporting Period?
During the Reporting Period, we did not use derivatives as part of an active management strategy.
Did the Fund make any significant purchases or sales during the Reporting Period?
Among the purchases initiated during the Reporting Period, we established a Fund position in Comcast, the largest broadcasting and cable company in the world. We believe Comcast should trade at a premium valuation to its cable peers due to its unique content assets, which make it a structurally higher growth company. In addition, we believe the market was underappreciating, at the time of the Fund’s purchase, the positive momentum in the business as NBC, owned by Comcast, has historically surpassed CBS as the number one broadcast network and, during the Reporting Period, reported positive net video gains after years of losing subscribers. Finally, Comcast has agreed to merge with Time Warner Cable in a deal worth more than $45 billion, though the deal had not yet closed at the end of 2014. Should the deal come to fruition, we believe it would create operating efficiencies and economies of scale. It would also add several metropolitan areas to Comcast’s portfolio, such as New York City and Los Angeles. Lastly, in our view, Comcast was trading at the end of the Reporting Period at an attractive valuation for a company with a strong brand and what we consider to be solid long-term growth prospects.
We initiated a Fund position in professional networking website LinkedIn. We believe LinkedIn is one of the fastest growing and most open-ended opportunities in the Internet industry. The company has been a disruptive force in the recruitment industry and has what we view as an unmatched value proposition with limited competition. The company is seeking to expand its addressable market and its user base beyond the white collar professional. LinkedIn also continues to add new and premium services to drive growth and deepen user engagement. Additionally, the company has, we believe, a significant advertising revenue opportunity. We initiated the Fund’s position as the stock pulled back, and even while the stock may not have appeared inexpensive on a number of valuation metrics, we believe its valuation was reasonable relative to its rapid growth rate and versus other rapidly growing technology companies at a similar stage in its life cycle.
During the Reporting Period, we added a Fund position in Mylan, a U.S.-based pharmaceutical company that develops, manufactures and distributes generic and specialty pharmaceuticals globally. We believe Mylan is a high quality franchise that operates in segments of the generics market with high barriers to entry and that its management team is comprised of solid operators. The company has above-average profitability and, in our view, underappreciated growth potential. We expect Mylan to deliver better than expected revenue growth over the next couple of years with continued margin expansion. Ultimately, the catalyst for us initiating the position was that we believe the market is significantly undervaluing the growth potential of Mylan, and we believe consensus estimates are too low. In other words, we believed shares of Mylan presented a compelling risk/reward opportunity at the time of purchase.
In addition to those sales already mentioned, we sold the Fund’s position in leading discount retailer Dollar General during the Reporting Period. Our conviction in the stock was tested by the company’s weakening fundamentals and growth outlook as well as by ongoing uncertainty around its acquisition of Family Dollar. As a result, we decided to sell the position and pursue higher conviction ideas.
We exited the Fund’s position in Schlumberger during the Reporting Period. The stock had performed well, and we decided to sell out of the Fund’s position to help fund other higher conviction opportunities in the energy sector.
We exited the Fund’s position in FedEx during the Reporting Period. While we continue to believe in the strength of FedEx’s business, the stock has historically been a strong performer since we initiated the position and thus we took the opportunity to take profits and reallocate the assets into names with what we considered to have more attractive risk/reward profiles.
Were there any notable changes in the Fund’s weightings during the Reporting Period?
In constructing the Fund’s portfolio, we focus on picking stocks rather than on making industry or sector bets. We seek to outpace the benchmark index by overweighting stocks that we expect to outperform and underweighting those that we think may lag. Consequently, changes in its sector weights are generally the direct result of individual stock selection or of stock appreciation or depreciation. That said, during the Reporting Period, the Fund’s exposure to consumer staples, consumer discretionary and information technology increased compared to the Russell Index. The Fund’s allocations compared to the benchmark index in health care, energy, telecommunication services, materials and industrials decreased.
How was the Fund positioned relative to its benchmark index at the end of the Reporting Period?
At the end of December 2014, the Fund had overweighted positions relative to the Russell Index in the financials, consumer staples and consumer discretionary sectors. On the same date, the Fund had underweighted positions compared to the Russell Index in
4
GOLDMAN SACHS VARIABLE INSURANCE TRUST STRATEGIC GROWTH FUND
industrials, materials and energy and was rather neutrally weighted to the Russell Index in information technology and health care. The Fund had no exposure to the utilities and telecommunication services sectors at the end of the Reporting Period.
What is the Fund’s tactical view and strategy for the months ahead?
We believe many of the trends that drove equities higher in 2014 — a slowly improving global economy, increased growth spending and rising corporate earnings — may well continue to influence equity returns in 2015. In addition, diverging central bank policies, U.S. dollar strength and a dramatic drop in commodity prices, notably oil, appear to be shaping up as macro themes that may also drive equities in the coming year. We believe that equity returns will once again look attractive when compared to the low expected returns for bonds, cash and commodities.
Indeed, in our view, improving global economic growth, led by the U.S., should be a tailwind for equities and support further earnings growth, which we expect to be the main driver of higher prices. While there is a case for possible multiple expansion, we are not counting on re-rating to drive stocks higher. (Re-rating is when the market changes its view of a company sufficiently to make calculation ratios, such as its price/earnings ratio, substantially higher or lower.) We believe “animal spirits” (or the human emotion that drives consumer confidence) will continue to drive the bull market, supported by healthy merger and acquisition activity and capital expenditure expansion. Companies in the information technology and health care sectors may still benefit from these trends, but stock prices have already risen in these sectors, which may limit upside and compel us to look to other areas of the market, such as financials.
U.S. shale oil production has increased to the point where a dip in global demand has sent oil prices sharply lower. While energy stocks were hard hit during 2014, we are beginning to look for opportunities to invest, given what we view as a wide range of individual company prospects. Similarly, we are actively considering which other industries and economies may benefit from lower oil prices and which ones might be negatively impacted.
For much of 2014, there were a number of factors hindering global consumption, despite our bullish long-term view on the consumer. At the end of the Reporting Period, however, we saw lower oil prices as a possible, if not probable, catalyst to spur consumption. A consumer comeback in the U.S. is particularly meaningful to U.S. Gross Domestic Product (“GDP”) and could therefore have global implications because of the size of the U.S. economy. Yet, at the end of the Reporting Period, the U.S. stock market appeared to already reflect some of this positive scenario, while European stock markets appeared to reflect dire sentiment on Europe. We believe European corporate earnings could benefit from improving U.S. consumption and therein may lie the investment opportunity. In addition, both the euro and yen depreciated meaningfully against the U.S. dollar in 2014, and we expect these currencies to remain relatively weak, which should, we believe, benefit exports in both countries and contribute to corporate earnings growth.
As always, we maintain our focus on seeking companies that we believe will generate long-term growth in today’s ever-changing market conditions.
5
GOLDMAN SACHS VARIABLE INSURANCE TRUST STRATEGIC GROWTH FUND
Index Definitions
The Russell Midcap® Index measures the performance of the mid-cap segment of the U.S. equity universe. The Russell Midcap® Index is a subset of the Russell 1000® Index. The Russell Midcap® Index includes approximately 800 of the smallest securities based on a combination of their market cap and current index membership. The Russell Midcap® Index represents approximately 31% of the total market capitalization of the Russell 1000® Index companies. The Russell Midcap® Index is constructed to provide a comprehensive and unbiased barometer for the mid-cap segment. The Russell Midcap® Index is completely reconstituted annually to ensure larger stocks do not distort the performance and characteristics of the true mid-cap opportunity set.
The Russell 1000® Index measures the performance of the large-cap segment of the U.S. equity universe. The Russell 1000® Index is a subset of the Russell 3000® Index and includes approximately 1000 of the largest securities based on a combination of their market cap and current index membership. The Russell 1000® Index represents approximately 92% of the U.S. market. The Russell 1000® Index is constructed to provide a comprehensive and unbiased barometer for the large-cap segment and is completely reconstituted annually to ensure new and growing equities are reflected.
The Russell 2000® Index measures the performance of the small-cap segment of the U.S. equity universe. The Russell 2000® Index is a subset of the Russell 3000® Index representing approximately 10% of the total market capitalization of that index. The Russell 2000® Index includes approximately 2000 of the smallest securities based on a combination of their market cap and current index membership. The Russell 2000® Index is constructed to provide a comprehensive and unbiased small-cap barometer and is completely reconstituted annually to ensure larger stocks do not distort the performance and characteristics of the true small-cap opportunity set.
The S&P 500® Index is the Standard & Poor’s 500 Composite Index of 500 stocks, an unmanaged index of common stock prices.
All index figures do not reflect any deduction for fees, expenses or taxes. It is not possible to invest directly in an unmanaged index.
6
FUND BASICS
Strategic Growth Fund
as of December 31, 2014
STANDARDIZED TOTAL RETURNS1
| | | | | | | | | | | | | | | | | | |
| For the period ended 12/31/14 | | One Year | | | Five Years | | | Ten Years | | | Since Inception | | | Inception Date |
| Institutional | | | 13.64 | % | | | 14.23 | % | | | 7.49 | % | | | 5.36 | % | | 4/30/98 |
| Service | | | 13.38 | | | | 13.95 | | | | N/A | | | | 7.41 | | | 1/09/06 |
| 1 | The Standardized Total Returns are average annual total returns as of the most recent calendar quarter-end. They assume reinvestment of all distributions at net asset value. Because Institutional Shares and Service Shares do not involve a sales charge, such a charge is not applied to their Standardized Total Returns. |
Total return figures in the above chart represent past performance and do not indicate future results, which will vary. The investment return and principal value of an investment will fluctuate and, therefore, an investor’s shares, when redeemed, may be worth more or less than their original cost. Current performance may be lower or higher than the total return figures in the above chart. Please visit www.GSAMFUNDS.com to obtain the most recent month-end returns. Performance reflects fee waivers and/or expense limitations in effect during the periods shown. In their absence, performance would be reduced.
EXPENSE RATIOS2
| | | | | | | | |
| | | Net Expense Ratio (Current) | | | Gross Expense Ratio (Before Waivers) | |
| Institutional | | | 0.81 | % | | | 0.85 | % |
| Service | | | 1.06 | | | | 1.10 | |
| 2 | The expense ratios of the Fund, both current (net of any fee waivers or expense limitations) and before waivers (gross of any fee waivers or expense limitations) are as set forth above. Pursuant to a contractual arrangement, the Fund’s waivers and/or expense limitations will remain in place through at least April 30, 2015 and prior to such date the Investment Adviser may not terminate the arrangements without the approval of the Fund’s Board of Trustees. If these arrangements are discontinued in the future, the expense ratios may change without shareholder approval. |
TOP TEN HOLDINGS AS OF 12/31/143
| | | | | | |
| Holding | | % of Net Assets | | | Line of Business |
| Apple, Inc. | | | 5.7% | | | Technology Hardware & Equipment |
| Costco Wholesale Corp. | | | 2.6 | | | Food & Staples Retailing |
| American Tower Corp. (REIT) | | | 2.4 | | | Real Estate |
| Oracle Corp. | | | 2.3 | | | Software & Services |
| Amazon.com, Inc. | | | 2.2 | | | Retailing |
| Equinix, Inc. | | | 2.1 | | | Software & Services |
| NIKE, Inc. Class B | | | 2.1 | | | Consumer Durables & Apparel |
| QUALCOMM, Inc. | | | 2.1 | | | Technology Hardware & Equipment |
| EMC Corp. | | | 2.0 | | | Technology Hardware & Equipment |
| Honeywell International, Inc. | | | 2.0 | | | Capital Goods |
| 3 | The top 10 holdings may not be representative of the Fund’s future investments. |
7
FUND BASICS
FUND vs. BENCHMARK SECTOR ALLOCATIONS4
As of December 31, 2014
| 4 | The Fund is actively managed and, as such, its composition may differ over time. Consequently, the Fund’s overall sector allocations may differ from percentages contained in the graph above. The graph categorizes investments using Global Industry Classification Standard (“GICS”), however, the sector classifications used by the portfolio management team may differ from GICS. The percentage shown for each investment category reflects the value of investments in that category as a percentage of market value. The graph depicts the Fund’s investments but may not represent the Fund’s market exposure due to the exclusion of certain derivatives, if any, as listed in the Additional Investment Information section of the Schedule of Investments. |
8
GOLDMAN SACHS VARIABLE INSURANCE TRUST STRATEGIC GROWTH FUND
Performance Summary
December 31, 2014
The following graph shows the value, as of December 31, 2014, of a $10,000 investment made on January 1, 2005 in the Institutional Shares at NAV. For comparative purposes, the performance of the Fund’s benchmark, the Russell 1000® Growth Index (with distributions reinvested), is shown. This performance data represents past performance and should not be considered indicative of future performance, which will fluctuate with changes in market conditions. These performance fluctuations will cause an investor’s shares, when redeemed, to be worth more or less than their original cost. Performance reflects Fund level expenses but does not reflect fees and expenses associated with any variable annuity contract or variable life insurance policy that uses the Fund as an investment option for any contract or policy. Had performance reflected all of those fees and expenses, performance would have been reduced. Performance reflects applicable fee waivers and/or expense limitations in effect during the periods shown, and in their absence, performance would be reduced. Performance of Service Shares will vary from Institutional Shares due to differences in class specific fees. In addition to the Investment Adviser’s decisions regarding issuer/industry investment selection and allocation, other factors may affect Fund performance. These factors include, but are not limited to, Fund operating fees and expenses, portfolio turnover, and subscription and redemption cash flows affecting the Fund.
Strategic Growth Fund’s 10 Year Performance
Performance of a $10,000 investment, with distributions reinvested, from January 1, 2005 through December 31, 2014.
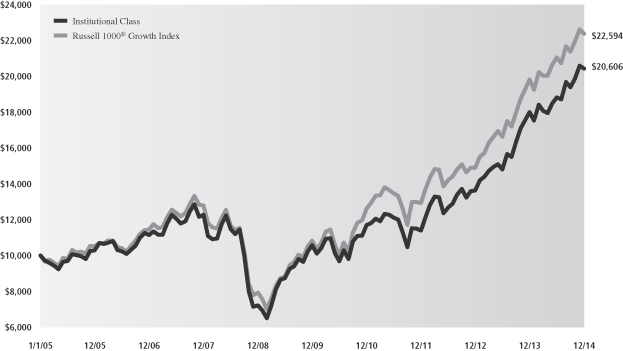
| | | | | | | | |
| Average Annual Total Return through December 31, 2014 | | One Year | | Five Years | | Ten Years | | Since Inception |
Institutional (Commenced April 30, 1998) | | 13.64% | | 14.23% | | 7.49% | | 5.36% |
Service (Commenced January 9, 2006) | | 13.38% | | 13.95% | | N/A | | 7.41% |
9
GOLDMAN SACHS VARIABLE INSURANCE TRUST STRATEGIC GROWTH FUND
Schedule of Investments
December 31, 2014
| | | | | | | | |
Shares | | | Description | | Value | |
| | Common Stocks – 99.5% | |
| Automobiles & Components – 0.7% | |
| | 64,480 | | | BorgWarner, Inc. | | $ | 3,543,176 | |
| | |
| Banks – 1.5% | |
| | 40,590 | | | Citigroup, Inc. | | | 2,196,325 | |
| | 100,324 | | | First Republic Bank | | | 5,228,887 | |
| | | | | | | | |
| | | | | | | 7,425,212 | |
| | |
| Capital Goods – 8.3% | |
| | 21,355 | | | Cummins, Inc. | | | 3,078,751 | |
| | 85,972 | | | Danaher Corp. | | | 7,368,660 | |
| | 103,440 | | | Honeywell International, Inc. | | | 10,335,725 | |
| | 56,811 | | | Ingersoll-Rand PLC | | | 3,601,249 | |
| | 38,050 | | | Precision Castparts Corp. | | | 9,165,484 | |
| | 63,617 | | | Sensata Technologies Holding NV* | | | 3,334,167 | |
| | 23,425 | | | W.W. Grainger, Inc. | | | 5,970,798 | |
| | | | | | | | |
| | | | | | | 42,854,834 | |
| | |
| Consumer Durables & Apparel – 4.2% | |
| | 111,179 | | | NIKE, Inc. Class B | | | 10,689,861 | |
| | 56,117 | | | PVH Corp. | | | 7,192,516 | |
| | 114,342 | | | Toll Brothers, Inc.* | | | 3,918,500 | |
| | | | | | | | |
| | | | | | | 21,800,877 | |
| | |
| Consumer Services – 3.8% | |
| | 77,681 | | | Las Vegas Sands Corp. | | | 4,517,927 | |
| | 82,929 | | | Starbucks Corp. | | | 6,804,324 | |
| | 112,593 | | | Yum! Brands, Inc. | | | 8,202,400 | |
| | | | | | | | |
| | | | | | | 19,524,651 | |
| | |
| Diversified Financials – 2.7% | |
| | 42,362 | | | Intercontinental Exchange, Inc. | | | 9,289,563 | |
| | 209,922 | | | Navient Corp. | | | 4,536,414 | |
| | | | | | | | |
| | | | | | | 13,825,977 | |
| | |
| Energy – 3.5% | |
| | 69,391 | | | Anadarko Petroleum Corp. | | | 5,724,758 | |
| | 58,657 | | | Cameron International Corp.* | | | 2,929,917 | |
| | 151,698 | | | Halliburton Co. | | | 5,966,282 | |
| | 22,955 | | | Pioneer Natural Resources Co. | | | 3,416,852 | |
| | | | | | | | |
| | | | | | | 18,037,809 | |
| | |
| Food & Staples Retailing – 5.6% | |
| | 95,892 | | | Costco Wholesale Corp. | | | 13,592,691 | |
| | 68,212 | | | Walgreens Boots Alliance, Inc. | | | 5,197,754 | |
| | 194,875 | | | Whole Foods Market, Inc. | | | 9,825,598 | |
| | | | | | | | |
| | | | | | | 28,616,043 | |
| | |
| Food, Beverage & Tobacco – 5.7% | |
| | 49,575 | | | Coca-Cola Enterprises, Inc. | | | 2,192,206 | |
| | 18,210 | | | Keurig Green Mountain, Inc. | | | 2,410,913 | |
| | 61,412 | | | McCormick & Co., Inc. | | | 4,562,912 | |
| | 189,677 | | | The Coca-Cola Co. | | | 8,008,163 | |
| | 119,182 | | | The Hain Celestial Group, Inc.* | | | 6,947,119 | |
| | 50,366 | | | The Hershey Co. | | | 5,234,538 | |
| | | | | | | | |
| | | | | | | 29,355,851 | |
| | |
| | Common Stocks – (continued) | |
| Health Care Equipment & Services – 3.9% | |
| | 139,357 | | �� | Abbott Laboratories | | $ | 6,273,852 | |
| | 92,921 | | | Cerner Corp.* | | | 6,008,272 | |
| | 38,385 | | | McKesson Corp. | | | 7,967,958 | |
| | | | | | | | |
| | | | | | | 20,250,082 | |
| | |
| Household & Personal Products – 1.2% | |
| | 87,505 | | | Colgate-Palmolive Co. | | | 6,054,471 | |
| | |
| Materials – 1.9% | |
| | 37,858 | | | Airgas, Inc. | | | 4,360,484 | |
| | 19,769 | | | The Sherwin-Williams Co. | | | 5,200,038 | |
| | | | | | | | |
| | | | | | | 9,560,522 | |
| | |
| Media – 4.5% | |
| | 161,546 | | | Comcast Corp. Class A | | | 9,371,284 | |
| | 76,052 | | | Discovery Communications, Inc. Class A* | | | 2,619,991 | |
| | 76,053 | | | Discovery Communications, Inc. Class C* | | | 2,564,507 | |
| | 222,862 | | | Twenty-First Century Fox, Inc. Class A | | | 8,559,015 | |
| | | | | | | | |
| | | | | | | 23,114,797 | |
| | |
| Pharmaceuticals, Biotechnology & Life Sciences – 10.2% | |
| | 101,236 | | | AbbVie, Inc. | | | 6,624,884 | |
| | 16,797 | | | Actavis PLC* | | | 4,323,716 | |
| | 80,916 | | | Agilent Technologies, Inc. | | | 3,312,701 | |
| | 44,208 | | | Amgen, Inc. | | | 7,041,892 | |
| | 19,480 | | | Biogen Idec, Inc.* | | | 6,612,486 | |
| | 73,057 | | | Celgene Corp.* | | | 8,172,156 | |
| | 49,360 | | | Gilead Sciences, Inc.* | | | 4,652,673 | |
| | 155,819 | | | Mylan, Inc.* | | | 8,783,517 | |
| | 14,953 | | | Shire PLC ADR | | | 3,178,111 | |
| | | | | | | | |
| | | | | | | 52,702,136 | |
| | |
| Real Estate – 4.1% | |
| | 127,257 | | | American Tower Corp. (REIT) | | | 12,579,355 | |
| | 253,173 | | | CBRE Group, Inc. Class A* | | | 8,671,175 | |
| | | | | | | | |
| | | | | | | 21,250,530 | |
| | |
| Retailing – 7.3% | |
| | 37,044 | | | Amazon.com, Inc.* | | | 11,496,605 | |
| | 83,172 | | | L Brands, Inc. | | | 7,198,537 | |
| | 10,423 | | | Netflix, Inc.* | | | 3,560,601 | |
| | 65,270 | | | The Home Depot, Inc. | | | 6,851,392 | |
| | 7,308 | | | The Priceline Group, Inc.* | | | 8,332,655 | |
| | | | | | | | |
| | | | | | | 37,439,790 | |
| | |
| Software & Services – 19.1% | |
| | 32,658 | | | Alibaba Group Holding Ltd. ADR* | | | 3,394,473 | |
| | 105,286 | | | eBay, Inc.* | | | 5,908,650 | |
| | 47,323 | | | Equinix, Inc. | | | 10,729,544 | |
| | 130,060 | | | Facebook, Inc. Class A* | | | 10,147,281 | |
| | 34,506 | | | FleetCor Technologies, Inc.* | | | 5,131,387 | |
| | 17,826 | | | Google, Inc. Class A* | | | 9,459,545 | |
| | |
| | |
| 10 | | The accompanying notes are an integral part of these financial statements. |
GOLDMAN SACHS VARIABLE INSURANCE TRUST STRATEGIC GROWTH FUND
| | | | | | | | |
Shares | | | Description | | Value | |
| | Common Stocks – (continued) | |
| Software & Services – (continued) | |
| | 17,827 | | | Google, Inc. Class C* | | $ | 9,384,133 | |
| | 24,871 | | | International Business Machines Corp. | | | 3,990,303 | |
| | 39,607 | | | LinkedIn Corp. Class A* | | | 9,098,124 | |
| | 158,263 | | | Microsoft Corp. | | | 7,351,316 | |
| | 264,051 | | | Oracle Corp. | | | 11,874,374 | |
| | 83,360 | | | ServiceNow, Inc.* | | | 5,655,976 | |
| | 23,768 | | | Visa, Inc. Class A | | | 6,231,970 | |
| | | | | | | | |
| | | | | | | 98,357,076 | |
| | |
| Technology Hardware & Equipment – 10.0% | |
| | 265,033 | | | Apple, Inc. | | | 29,254,343 | |
| | 349,688 | | | EMC Corp. | | | 10,399,721 | |
| | 40,446 | | | Keysight Technologies, Inc.* | | | 1,365,861 | |
| | 143,455 | | | QUALCOMM, Inc. | | | 10,663,010 | |
| | | | | | | | |
| | | | | | | 51,682,935 | |
| | |
| Transportation – 1.3% | |
| | 54,990 | | | Kansas City Southern | | | 6,710,430 | |
| | |
| | TOTAL INVESTMENTS – 99.5% | | | | |
| | (Cost $406,641,926) | | $ | 512,107,199 | |
| | |
| OTHER ASSETS IN EXCESS OF
LIABILITIES – 0.5% | | | 2,573,866 | |
| | |
| | NET ASSETS – 100.0% | | $ | 514,681,065 | |
| | |
| | |
| The percentage shown for each investment category reflects the value of investments in that category as a percentage of net assets. |
| * | | Non-income producing security. |
| | |
| Investment Abbreviations: |
| ADR | | —American Depositary Receipt |
| REIT | | —Real Estate Investment Trust |
| | |
| The accompanying notes are an integral part of these financial statements. | | 11 |
GOLDMAN SACHS VARIABLE INSURANCE TRUST STRATEGIC GROWTH FUND
Statement of Assets and Liabilities
December 31, 2014
| | | | |
| | | | |
| Assets: | | | |
Investments, at value (cost $406,641,926) | | $ | 512,107,199 | |
Cash | | | 4,475,627 | |
Receivables: | | | | |
Dividends | | | 178,018 | |
Fund shares sold | | | 50,844 | |
Reimbursement from investment adviser | | | 8,591 | |
Other assets | | | 15,125 | |
| Total assets | | | 516,835,404 | |
| | | | |
| | | | |
| Liabilities: | | | |
Payables: | | | | |
Investments purchased | | | 1,117,371 | |
Fund shares redeemed | | | 540,191 | |
Management fees | | | 311,682 | |
Distribution and Service fees and Transfer Agent fees | | | 92,793 | |
Accrued expenses | | | 92,302 | |
| Total liabilities | | | 2,154,339 | |
| | | | |
| | | | |
| Net Assets: | | | |
Paid-in capital | | | 399,912,178 | |
Undistributed net investment income | | | 297,250 | |
Accumulated net realized gain | | | 9,006,364 | |
Net unrealized gain | | | 105,465,273 | |
| NET ASSETS | | $ | 514,681,065 | |
Net Assets: | | | | |
Institutional | | $ | 119,934,176 | |
Service | | | 394,746,889 | |
Total Net Assets | | $ | 514,681,065 | |
Shares of beneficial interest outstanding $0.001 par value (unlimited shares authorized): | | | | |
Institutional | | | 7,422,046 | |
Service | | | 24,478,316 | |
Net asset value, offering and redemption price per share: | | | | |
Institutional | | | $16.16 | |
Service | | | 16.13 | |
| | |
| 12 | | The accompanying notes are an integral part of these financial statements. |
GOLDMAN SACHS VARIABLE INSURANCE TRUST STRATEGIC GROWTH FUND
Statement of Operations
For the Fiscal Year Ended December 31, 2014
| | | | |
| | | | |
| Investment income: | | | |
Dividends (net of foreign taxes withheld of $10,547) | | $ | 5,876,419 | |
| | | | |
| | | | |
| Expenses: | | | |
Management fees | | | 3,801,511 | |
Distribution and Service fees — Service Class | | | 965,712 | |
Transfer Agent fees(a) | | | 101,365 | |
Professional fees | | | 75,723 | |
Printing and mailing costs | | | 69,657 | |
Custody, accounting and administrative services | | | 58,222 | |
Trustee fees | | | 24,176 | |
Other | | | 84,734 | |
| Total expenses | | | 5,181,100 | |
Less — expense reductions | | | (212,399 | ) |
| Net expenses | | | 4,968,701 | |
| NET INVESTMENT INCOME | | | 907,718 | |
| | | | |
| | | | |
| Realized and unrealized gain (loss): | | | |
Net realized gain from investments (including commissions recaptured of $15,917) | | | 81,439,469 | |
Net change in unrealized loss on investments | | | (18,833,285 | ) |
| Net realized and unrealized gain | | | 62,606,184 | |
| NET INCREASE IN NET ASSETS RESULTING FROM OPERATIONS | | $ | 63,513,902 | |
(a) Institutional and Service Shares had Transfer Agent fees of $24,114 and $77,251, respectively.
| | |
| The accompanying notes are an integral part of these financial statements. | | 13 |
GOLDMAN SACHS VARIABLE INSURANCE TRUST STRATEGIC GROWTH FUND
Statements of Changes in Net Assets
| | | | | | | | |
| | | For the
Fiscal Year Ended
December 31, 2014 | | | For the
Fiscal Year Ended
December 31, 2013 | |
| | | | | | | | |
| From operations: | | | | | | |
Net investment income | | $ | 907,718 | | | $ | 745,084 | |
Net realized gain | | | 81,439,469 | | | | 97,831,625 | |
Net change in unrealized gain (loss) | | | (18,833,285 | ) | | | 31,169,880 | |
| Net increase in net assets resulting from operations | | | 63,513,902 | | | | 129,746,589 | |
| | | | | | | | |
| | | | | | | | |
| Distributions to shareholders: | | | | | | |
From net investment income | | | | | | | | |
Institutional Shares | | | (434,364 | ) | | | (449,137 | ) |
Service Shares | | | (456,398 | ) | | | (569,206 | ) |
From net realized gains | | | | | | | | |
Institutional Shares | | | (22,539,042 | ) | | | (4,219,342 | ) |
Service Shares | | | (73,827,385 | ) | | | (13,559,994 | ) |
| Total distributions to shareholders | | | (97,257,189 | ) | | | (18,797,679 | ) |
| | | | | | | | |
| | | | | | | | |
| From share transactions: | | | | | | |
Proceeds from sales of shares | | | 20,904,256 | | | | 32,225,990 | |
Reinvestment of distributions | | | 97,257,189 | | | | 18,797,679 | |
Cost of shares redeemed | | | (83,176,257 | ) | | | (58,717,338 | ) |
| Net increase (decrease) in net assets resulting from share transactions | | | 34,985,188 | | | | (7,693,669 | ) |
| TOTAL INCREASE | | | 1,241,901 | | | | 103,255,241 | |
| | | | | | | | |
| | | | | | | | |
| Net assets: | | | | | | |
| | |
Beginning of year | | | 513,439,164 | | | | 410,183,923 | |
End of year | | $ | 514,681,065 | | | $ | 513,439,164 | |
| Undistributed net investment income | | $ | 297,250 | | | $ | 280,294 | |
| | |
| 14 | | The accompanying notes are an integral part of these financial statements. |
GOLDMAN SACHS VARIABLE INSURANCE TRUST STRATEGIC GROWTH FUND
Financial Highlights
Selected Data for a Share Outstanding Throughout Each Year
| | | | | | | | | | | | | | | | | | | | | | | | | | | | | | | | | | | | | | | | | | | | | | | | | | | | | | | | |
| | | | | | Income (loss) from
investment operations | | | Distributions to shareholders | | | | | | | | | | | | | | | | | | | | | | |
| Year - Share Class | | Net asset
value,
beginning
of year | | | Net
investment
income(a) | | | Net
realized
and
unrealized
gain (loss) | | | Total from
investment
operations | | | From net
investment
income | | | From
net
realized
gains | | | Total
distributions | | | Net asset
value,
end of
year | | | Total
return(b) | | | Net assets,
end of
year
(in 000s) | | | Ratio of
net expenses
to average
net assets | | | Ratio of
total
expenses
to average
net assets | | | Ratio of
net investment
income
to average
net assets | | | Portfolio
turnover
rate(c) | |
FOR THE FISCAL YEARS ENDED DECEMBER 31, | |
2014 - Institutional | | $ | 17.64 | | | $ | 0.07 | | | $ | 2.24 | | | $ | 2.31 | | | $ | (0.07 | ) | | $ | (3.72 | ) | | $ | (3.79 | ) | | $ | 16.16 | | | | 13.64 | % | | $ | 119,934 | | | | 0.79 | % | | | 0.81 | % | | | 0.37 | % | | | 48 | % |
2014 - Service | | | 17.61 | | | | 0.02 | | | | 2.24 | | | | 2.26 | | | | (0.02 | ) | | | (3.72 | ) | | | (3.74 | ) | | | 16.13 | | | | 13.38 | | | | 394,747 | | | | 1.04 | | | | 1.08 | | | | 0.12 | | | | 48 | |
2013 - Institutional | | | 13.86 | | | | 0.06 | | | | 4.42 | | | | 4.48 | | | | (0.07 | ) | | | (0.63 | ) | | | (0.70 | ) | | | 17.64 | | | | 32.42 | | | | 122,220 | | | | 0.80 | | | | 0.84 | | | | 0.35 | | | | 66 | |
2013 - Service | | | 13.85 | | | | 0.02 | | | | 4.40 | | | | 4.42 | | | | (0.03 | ) | | | (0.63 | ) | | | (0.66 | ) | | | 17.61 | | | | 32.00 | | | | 391,219 | | | | 1.05 | | | | 1.09 | | | | 0.10 | | | | 66 | |
2012 - Institutional | | | 11.64 | | | | 0.10 | (d) | | | 2.21 | | | | 2.31 | | | | (0.09 | ) | | | — | | | | (0.09 | ) | | | 13.86 | | | | 19.83 | | | | 106,119 | | | | 0.80 | | | | 0.84 | | | | 0.79 | (d) | | | 42 | |
2012 - Service | | | 11.63 | | | | 0.07 | (d) | | | 2.21 | | | | 2.28 | | | | (0.06 | ) | | | — | | | | (0.06 | ) | | | 13.85 | | | | 19.57 | | | | 304,065 | | | | 1.05 | | | | 1.09 | | | | 0.56 | (d) | | | 42 | |
2011 - Institutional | | | 12.01 | | | | 0.06 | | | | (0.37 | ) | | | (0.31 | ) | | | (0.06 | ) | | | — | | | | (0.06 | ) | | | 11.64 | | | | (2.62 | ) | | | 102,018 | | | | 0.83 | | | | 0.85 | | | | 0.47 | | | | 35 | |
2011 - Service | | | 12.00 | | | | 0.03 | | | | (0.37 | ) | | | (0.34 | ) | | | (0.03 | ) | | | — | | | | (0.03 | ) | | | 11.63 | | | | (2.86 | ) | | | 246,208 | | | | 1.08 | | | | 1.10 | | | | 0.23 | | | | 35 | |
2010 - Institutional | | | 10.89 | | | | 0.05 | | | | 1.12 | | | | 1.17 | | | | (0.05 | ) | | | — | | | | (0.05 | ) | | | 12.01 | | | | 10.74 | | | | 120,027 | | | | 0.86 | | | | 0.86 | | | | 0.49 | | | | 38 | |
2010 - Service | | | 10.88 | | | | 0.03 | | | | 1.11 | | | | 1.14 | | | | (0.02 | ) | | | — | | | | (0.02 | ) | | | 12.00 | | | | 10.50 | | | | 238,353 | | | | 1.11 | | | | 1.11 | | | | 0.24 | | | | 38 | |
| (a) | Calculated based on the average shares outstanding methodology. |
| (b) | Assumes investment at the net asset value at the beginning of the year, reinvestment of all distributions, and a complete redemption of the investment at the net asset value at the end of the year. |
| (c) | The Fund's portfolio turnover rate is calculated in accordance with regulatory requirements, without regard to transactions involving short term investments and certain derivatives. If such transactions were included, the Fund's portfolio turnover rate may be higher. |
| (d) | Reflects income recognized from special dividends which amounted to $0.04 per share and 0.27% of average net assets. |
| | | | |
| The accompanying notes are an integral part of these financial statements. | | 15 | | |
GOLDMAN SACHS VARIABLE INSURANCE TRUST STRATEGIC GROWTH FUND
Notes to Financial Statements
December 31, 2014
1. ORGANIZATION
Goldman Sachs Variable Insurance Trust (the “Trust” or “VIT”) is a Delaware statutory trust registered under the Investment Company Act of 1940, as amended (the “Act”), as an open-end management investment company. The Trust includes the Goldman Sachs Strategic Growth Fund (the “Fund”). The Fund is a diversified portfolio under the Act offering two classes of shares — Institutional and Service Shares. Shares of the Trust are offered to separate accounts of participating life insurance companies for the purpose of funding variable annuity contracts and variable life insurance policies.
Goldman Sachs Asset Management, L.P. (“GSAM”), an affiliate of Goldman, Sachs & Co. (“Goldman Sachs”), serves as investment adviser to the Fund pursuant to a management agreement (the “Agreement”) with the Trust.
2. SIGNIFICANT ACCOUNTING POLICIES
The financial statements have been prepared in accordance with accounting principles generally accepted in the United States of America (“GAAP”) and require management to make estimates and assumptions that may affect the reported amounts and disclosures. Actual results may differ from those estimates and assumptions.
A. Investment Valuation — The Fund’s valuation policy is to value investments at fair value.
B. Investment Income and Investments — Investment income includes interest income and dividend income, net of any foreign withholding taxes, less any amounts reclaimable. Interest income is accrued daily and adjusted for amortization of premiums and accretion of discounts. Dividend income is recognized on ex-dividend date or, for certain foreign securities, as soon as such information is obtained subsequent to the ex-dividend date. Investment transactions are reflected on trade date. Realized gains and losses are calculated using identified cost. Investment transactions are recorded on the following business day for daily net asset value (“NAV”) calculations. Any foreign capital gains tax is accrued daily based upon net unrealized gains, and is payable upon sale of such investments. Distributions received from the Fund’s investments in United States (“U.S.”) real estate investment trusts (“REITs”) may be characterized as ordinary income, net capital gain or a return of capital. A return of capital is recorded by the Fund as a reduction to the cost basis of the REIT.
C. Class Allocations and Expenses — Investment income, realized and unrealized gain (loss), and non-class specific expenses of the Fund are allocated daily based upon the proportion of net assets of each class. Class specific expenses, where applicable, are borne by the respective share classes and include Distribution and Service and Transfer Agent fees. Non-class specific expenses directly incurred by a Fund are charged to that Fund, while such expenses incurred by the Trust are allocated across the respective Funds on a straight-line and/or pro-rata basis depending upon the nature of the expenses.
D. Federal Taxes and Distributions to Shareholders — It is the Fund’s policy to comply with the requirements of the Internal Revenue Code of 1986, as amended (the “Code”), applicable to regulated investment companies (mutual funds) and to distribute each year substantially all of its investment company taxable income and capital gains to its shareholders. Accordingly, the Fund is not required to make any provisions for the payment of federal income tax. Distributions to shareholders are recorded on the ex-dividend date. Income and capital gains distributions, if any, are declared and paid annually.
Net capital losses are carried forward to future fiscal years and may be used to the extent allowed by the Code to offset any future capital gains. Losses that are carried forward will retain their character as either short-term or long-term capital losses. Utilization of capital loss carryforwards will reduce the requirement of future capital gains distributions.
16
GOLDMAN SACHS VARIABLE INSURANCE TRUST STRATEGIC GROWTH FUND
2. SIGNIFICANT ACCOUNTING POLICIES (continued)
The characterization of distributions to shareholders for financial reporting purposes is determined in accordance with federal income tax rules, which may differ from GAAP. The source of the Fund’s distributions may be shown in the accompanying financial statements as either from net investment income, net realized gain or capital. Certain components of the Fund’s net assets on the Statement of Assets and Liabilities reflect permanent GAAP/tax differences based on the appropriate tax character.
E. Commission Recapture — GSAM, on behalf of certain Funds, may direct portfolio trades, subject to seeking best execution, to various brokers who have agreed to rebate a portion of the commissions generated. Such rebates are made directly to a Fund as cash payments and are included in net realized gain (loss) from investments on the Statement of Operations.
3. INVESTMENTS AND FAIR VALUE MEASUREMENTS
The fair value of a financial instrument is the amount that would be received to sell an asset or paid to transfer a liability in an orderly transaction between market participants at the measurement date (i.e., the exit price). GAAP establishes a fair value hierarchy that prioritizes the inputs to valuation techniques used to measure fair value. The hierarchy gives the highest priority to unadjusted quoted prices in active markets for identical assets or liabilities (Level 1 measurements) and the lowest priority to unobservable inputs (Level 3 measurements). The levels used for classifying investments are not necessarily an indication of the risk associated with investing in these investments. The three levels of the fair value hierarchy are described below:
Level 1 — Unadjusted quoted prices in active markets that are accessible at the measurement date for identical, unrestricted assets or liabilities;
Level 2 — Quoted prices in markets that are not active or financial instruments for which significant inputs are observable (including, but not limited to, quoted prices for similar investments, interest rates, foreign exchange rates, volatility and credit spreads), either directly or indirectly;
Level 3 — Prices or valuations that require significant unobservable inputs (including GSAM’s assumptions in determining fair value measurement).
The Trustees have adopted Valuation Procedures that govern the valuation of the portfolio investments held by the Fund, including investments for which market quotations are not readily available. The Trustees have delegated to GSAM day-to-day responsibility for implementing and maintaining internal controls and procedures related to the valuation of the Fund’s portfolio investments. To assess the continuing appropriateness of pricing sources and methodologies, GSAM regularly performs price verification procedures and issues challenges as necessary to third party pricing vendors or brokers, and any differences are reviewed in accordance with the Valuation Procedures.
A. Level 1 and Level 2 Fair Value Investments — The valuation techniques and significant inputs used in determining the fair values for investments classified as Level 1 and Level 2 are as follows:
Equity Securities — Equity securities and investment companies traded on a U.S. securities exchange or the NASDAQ system, or those located on certain foreign exchanges, including but not limited to the Americas, are valued daily at their last sale price or official closing price on the principal exchange or system on which they are traded. If no sale occurs, equity securities and exchange traded investment companies are valued at the last bid price for long positions and at the last ask price for short positions. Investments in investment companies (other than those that are exchange traded) are valued at the NAV on the valuation date. To the extent these investments are actively traded, they are classified as Level 1 of the fair value hierarchy, otherwise they are generally classified as Level 2.
17
GOLDMAN SACHS VARIABLE INSURANCE TRUST STRATEGIC GROWTH FUND
Notes to Financial Statements (continued)
December 31, 2014
3. INVESTMENTS AND FAIR VALUE MEASUREMENTS (continued)
Unlisted equity securities for which market quotations are available are valued at the last sale price on the valuation date, or if no sale occurs, at the last bid price. Securities traded on certain foreign securities exchanges are valued daily at fair value determined by an independent fair value service (if available) under Valuation Procedures approved by the Trustees and consistent with applicable regulatory guidance. The independent fair value service takes into account multiple factors including, but not limited to, movements in the securities markets, certain depositary receipts, futures contracts and foreign currency exchange rates that have occurred subsequent to the close of the foreign securities exchange. These investments are generally classified as Level 2 of the fair value hierarchy.
B. Level 3 Fair Value Investments — To the extent that the aforementioned significant inputs are unobservable, or if quotations are not readily available, or if GSAM believes that such quotations do not accurately reflect fair value, the fair value of the Fund’s investments may be determined under Valuation Procedures approved by the Trustees. GSAM, consistent with its procedures and applicable regulatory guidance, may make an adjustment to the most recent valuation prices of either domestic or foreign securities in light of significant events to reflect what it believes to be the fair value of the securities at the time of determining a Fund’s NAV. Significant events which could affect a large number of securities in a particular market may include, but are not limited to: significant fluctuations in U.S. or foreign markets; market dislocations; market disruptions; or unscheduled market closings. Significant events which could also affect a single issuer may include, but are not limited to: corporate actions such as reorganizations, mergers and buy-outs; ratings downgrades; and bankruptcies.
C. Fair Value Hierarchy — The following is a summary of the Fund’s investments classified in the fair value hierarchy as of December 31, 2014:
| | | | | | | | | | | | |
| Investment Type | | Level 1 | | | Level 2 | | | Level 3 | |
| Assets | | | | | | | | | | | | |
Common Stock and/or Other Equity Investments(a)
North America | | $ | 512,107,199 | | | $ | — | | | $ | — | |
| (a) | Amounts are disclosed by continent to highlight the impact of time zone differences between local market close and the calculation of net asset value. Security valuations are based on the principal exchange or system on which they are traded, which may differ from country of domicile. |
For further information regarding security characteristics, see the Schedule of Investments.
4. AGREEMENTS AND AFFILIATED TRANSACTIONS
A. Management Agreement — Under the Agreement, GSAM manages the Fund, subject to the general supervision of the Trustees.
As compensation for the services rendered pursuant to the Agreement, the assumption of the expenses related thereto and administration of the Fund’s business affairs, including providing facilities, GSAM is entitled to a management fee, accrued daily and paid monthly, equal to an annual percentage rate of the Fund’s average daily net assets.
18
GOLDMAN SACHS VARIABLE INSURANCE TRUST STRATEGIC GROWTH FUND
4. AGREEMENTS AND AFFILIATED TRANSACTIONS (continued)
For the fiscal year ended December 31, 2014, contractual and effective net management fees with GSAM were at the following rates:
| | | | | | | | | | | | | | | | | | | | | | | | | | |
| Contractual Management Fee Rate | | | | |
First
$1 billion | | | Next
$1 billion | | | Next
$3 billion | | | Next
$3 billion | | | Over
$8 billion | | | Effective
Rate | | | Effective Net
Management Fee Rate | |
| | 0.75% | | | | 0.68 | % | | | 0.65 | % | | | 0.64 | % | | | 0.63 | % | | | 0.75 | % | | | 0.71 | %* |
| * | GSAM has agreed to waive a portion of its management fee in order to achieve a net management fee rate, as defined in the Fund’s most recent prospectus. This waiver will be effective through at least April 30, 2015 and prior to such date GSAM may not terminate the arrangement without approval of the Trustees. The Effective Net Management Rate above is calculated based on the management rate before and after the waiver had been adjusted, if applicable. For the fiscal year ended December 31, 2014, GSAM waived $202,750 of its management fee. |
B. Distribution and Service Plan — The Trust, on behalf of the Service Shares of the Fund, has adopted a Distribution and Service Plan (the “Plan”). Under the Plan, Goldman Sachs, which serves as distributor (the “Distributor”), is entitled to a fee accrued daily and paid monthly, for distribution services and personal and account maintenance services, which may then be paid by Goldman Sachs to authorized dealers, equal to, on an annual basis, 0.25% of the Fund’s average daily net assets attributable to Service Shares.
C. Transfer Agency Agreement — Goldman Sachs also serves as the transfer agent of the Fund for a fee pursuant to a Transfer Agency Agreement. The fees charged for such transfer agency services are accrued daily and paid monthly at an annual rate of 0.02% of the average daily net assets of Institutional and Service Shares.
D. Other Expense Agreements and Affiliated Transactions — GSAM has agreed to limit certain “Other Expenses” of the Fund (excluding transfer agency fees and expenses, taxes, interest, brokerage fees, shareholder meetings, litigation, indemnification, and extraordinary expenses) to the extent such expenses exceed, on an annual basis, a percentage rate of the average daily net assets of the Fund. Such Other Expense reimbursements, if any, are accrued daily and paid monthly. In addition, the Fund is not obligated to reimburse GSAM for prior fiscal year expense reimbursements, if any. The Other Expense limitation as an annual percentage rate of average daily net assets for the Fund is 0.114%. The Other Expense limitation will remain in place through at least April 30, 2015, and prior to such date GSAM may not terminate the arrangement without the approval of the Trustees. The Fund bears its respective share of costs related to proxy and shareholder meetings, and GSAM has agreed to reimburse the Fund to the extent such expenses exceed a specified percentage of the Fund’s net assets. For the fiscal year ended December 31, 2014, GSAM reimbursed $6,632 to the Fund. In addition, the Fund has entered into certain offset arrangements with the custodian and the transfer agent, which may result in a reduction of the Fund’s expenses and are received irrespective of the application of the “Other Expenses” limitation described above. For the fiscal year ended December 31, 2014, custody fee credits were $3,017.
19
GOLDMAN SACHS VARIABLE INSURANCE TRUST STRATEGIC GROWTH FUND
Notes to Financial Statements (continued)
December 31, 2014
4. AGREEMENTS AND AFFILIATED TRANSACTIONS (continued)
E. Line of Credit Facility — As of December 31, 2014, the Fund participated in a $1,080,000,000 committed, unsecured revolving line of credit facility (the “facility”) together with other funds of the Trust and registered investment companies having management agreements with GSAM or its affiliates (“Other Borrowers”). Pursuant to the terms of the facility, the Fund and Other Borrowers could increase the credit amount by an additional $120,000,000, for a total of up to $1,200,000,000. This facility is to be used solely for temporary or emergency purposes, which may include the funding of redemptions. The interest rate on borrowings is based on the federal funds rate. The facility also requires a fee to be paid by the Fund based on the amount of the commitment that has not been utilized. For the fiscal year ended December 31, 2014, the Fund did not have any borrowings under the facility.
F. Other Transactions with Affiliates — For the fiscal year ended December 31, 2014, Goldman Sachs earned $951 in brokerage commissions from portfolio transactions.
5. PORTFOLIO SECURITIES TRANSACTIONS
The cost of purchases and proceeds from sales and maturities of long-term securities for the fiscal year ended December 31, 2014, were $244,501,021 and $304,755,568, respectively.
6. TAX INFORMATION
The tax character of distributions paid during the fiscal years ended December 31, 2013 and December 31, 2014 was as follows:
| | | | | | | | |
| | | 2013 | | | 2014 | |
| Distributions paid from: | | | | | | | | |
Ordinary income | | $ | 1,018,343 | | | $ | 15,942,732 | |
Net long-term capital gains | | | 17,779,336 | | | | 81,314,457 | |
| Total taxable distributions | | $ | 18,797,679 | | | $ | 97,257,189 | |
As of December 31, 2014, the components of accumulated earnings (losses) on a tax-basis were as follows:
| | | | |
| Undistributed ordinary income — net | | $ | 297,250 | |
| Undistributed long-term capital gains | | | 9,858,338 | |
| Total undistributed earnings | | $ | 10,155,588 | |
| Timing differences (Post October Loss Deferral) | | | (808,865 | ) |
| Unrealized gains — net | | | 105,422,164 | |
| Total accumulated gains — net | | $ | 114,768,887 | |
As of December 31, 2014, the Fund’s aggregate security unrealized gains and losses based on cost for U.S. federal income tax purposes were as follows:
| | | | |
| Tax cost | | $ | 406,685,035 | |
| Gross unrealized gain | | | 113,589,692 | |
| Gross unrealized loss | | | (8,167,528 | ) |
| Net unrealized security gain | | $ | 105,422,164 | |
20
GOLDMAN SACHS VARIABLE INSURANCE TRUST STRATEGIC GROWTH FUND
6. TAX INFORMATION (continued)
The difference between GAAP-basis and tax-basis unrealized gains (losses) is attributable primarily to wash sales.
GSAM has reviewed the Fund’s tax positions for all open tax years (the current and prior three years, as applicable) and has concluded that no provision for income tax is required in the Fund’s financial statements. Such open tax years remain subject to examination and adjustment by tax authorities.
7. OTHER RISKS
The Fund’s risks include, but are not limited to, the following:
Large Shareholder Transaction Risk — The Fund may experience adverse effects when certain large shareholders, such as other funds, participating insurance companies, accounts and Goldman Sachs affiliates, purchase or redeem large amounts of shares of the Fund. Such large shareholder redemptions may cause the Fund to sell portfolio securities at times when it would not otherwise do so, which may negatively impact the Fund’s NAV and liquidity. Similarly, large Fund share purchases may adversely affect the Fund’s performance to the extent that the Fund is delayed in investing new cash and is required to maintain a larger cash position than it ordinarily would. These transactions may also increase transaction costs. In addition, a large redemption could result in the Fund’s current expenses being allocated over a smaller asset base, leading to an increase in the Fund’s expense ratio.
Liquidity Risk — The Fund may make investments that are illiquid or that may become less liquid in response to market developments or adverse investor perceptions. Illiquid investments may be more difficult to value. Liquidity risk may also refer to the risk that a Fund will not be able to pay redemption proceeds within the allowable time period because of unusual market conditions, an unusually high volume of redemption requests, or other reasons. To meet redemption requests, a Fund may be forced to sell investments at an unfavorable time and/or under unfavorable conditions.
Market and Credit Risks — In the normal course of business, the Fund trades financial instruments and enters into financial transactions where risk of potential loss exists due to changes in the market (market risk). Additionally, the Fund may also be exposed to credit risk in the event that an issuer or guarantor fails to perform or that an institution or entity with which the Fund has unsettled or open transactions defaults.
8. INDEMNIFICATIONS
Under the Trust’s organizational documents, its Trustees, officers, employees and agents are indemnified, to the extent permitted by the Act and state law, against certain liabilities that may arise out of performance of their duties to the Fund. Additionally, in the course of business, the Fund enters into contracts that contain a variety of indemnification clauses. The Fund’s maximum exposure under these arrangements is unknown, as this would involve future claims that may be made against the Fund that have not yet occurred. However, GSAM believes the risk of loss under these arrangements to be remote.
9. SUBSEQUENT EVENTS
Subsequent events after the Statement of Assets and Liabilities date have been evaluated through the date the financial statements were issued. GSAM has concluded that there is no impact requiring adjustment or disclosure in the financial statements.
21
GOLDMAN SACHS VARIABLE INSURANCE TRUST STRATEGIC GROWTH FUND
Notes to Financial Statements (continued)
December 31, 2014
10. SUMMARY OF SHARE TRANSACTIONS
Share activity is as follows:
| | | | | | | | | | | | | | | | |
| | | For the Fiscal Year Ended
December 31, 2014 | | | For the Fiscal Year Ended
December 31, 2013 | |
| | | Shares | | | Dollars | | | Shares | | | Dollars | |
| Institutional Shares | | | | | | | | | | | | | | | | |
| Shares sold | | | 355,839 | | | $ | 6,506,630 | | | | 295,816 | | | $ | 4,655,407 | |
| Reinvestment of distributions | | | 1,456,779 | | | | 22,973,406 | | | | 270,323 | | | | 4,668,479 | |
| Shares redeemed | | | (1,319,775 | ) | | | (24,281,424 | ) | | | (1,290,904 | ) | | | (20,366,601 | ) |
| | | | 492,843 | | | | 5,198,612 | | | | (724,765 | ) | | | (11,042,715 | ) |
| Service Shares | | | | | | | | | | | | | | | | |
| Shares sold | | | 771,692 | | | | 14,397,626 | | | | 1,828,667 | | | | 27,570,583 | |
| Reinvestment of distributions | | | 4,719,427 | | | | 74,283,783 | | | | 819,559 | | | | 14,129,200 | |
| Shares redeemed | | | (3,229,668 | ) | | | (58,894,833 | ) | | | (2,392,516 | ) | | | (38,350,737 | ) |
| | | | 2,261,451 | | | | 29,786,576 | | | | 255,710 | | | | 3,349,046 | |
| NET INCREASE (DECREASE) | | | 2,754,294 | | | $ | 34,985,188 | | | | (469,055 | ) | | $ | (7,693,669 | ) |
22
Report of Independent Registered Public Accounting Firm
To the Board of Trustees and Shareholders of
Goldman Sachs Variable Insurance Trust — Goldman Sachs Strategic Growth Fund:
In our opinion, the accompanying statement of assets and liabilities, including the schedule of investments, and the related statements of operations and of changes in net assets and the financial highlights present fairly, in all material respects, the financial position of Goldman Sachs Strategic Growth Fund (the “Fund”), a fund of Goldman Sachs Variable Insurance Trust, at December 31, 2014 and the results of its operations, the changes in its net assets and the financial highlights for each of the periods indicated, in conformity with accounting principles generally accepted in the United States of America. These financial statements and financial highlights (hereafter referred to as “financial statements”) are the responsibility of the Fund’s management. Our responsibility is to express an opinion on these financial statements based on our audits. We conducted our audits of these financial statements in accordance with the standards of the Public Company Accounting Oversight Board (United States). Those standards require that we plan and perform the audit to obtain reasonable assurance about whether the financial statements are free of material misstatement. An audit includes examining, on a test basis, evidence supporting the amounts and disclosures in the financial statements, assessing the accounting principles used and significant estimates made by management, and evaluating the overall financial statement presentation. We believe that our audits, which included confirmation of securities at December 31, 2014 by correspondence with the custodian, brokers, and the application of alternative auditing procedures where securities purchased had not been received, provide a reasonable basis for our opinion.
PricewaterhouseCoopers LLP
Boston, Massachusetts
February 19, 2015
23
GOLDMAN SACHS VARIABLE INSURANCE TRUST STRATEGIC GROWTH FUND
|
| Fund Expenses — Six Month Period Ended December 31, 2014 (Unaudited) |
As a shareholder of Institutional or Service Shares of the Fund, you incur ongoing costs, including management fees, distribution and service (12b-1) fees (with respect to Service Shares) and other Fund expenses. This example is intended to help you understand your ongoing costs (in dollars) of investing in the Institutional Shares and Service Shares of the Fund and to compare these costs with the ongoing costs of investing in other mutual funds.
The example is based on an investment of $1,000 invested at the beginning of the period and held for the entire period from July 1, 2014 through December 31, 2014.
Actual Expenses — The first line under each share class in the table below provides information about actual account values and actual expenses. You may use the information in this line, together with the amount you invested, to estimate the expenses that you paid over the period. Simply divide your account value by $1,000 (for example, an $8,600 account value divided by $1,000=8.6), then multiply the result by the number in the first line under the heading entitled “Expenses Paid” to estimate the expenses you paid on your account during this period.
Hypothetical Example for Comparison Purposes — The second line under each share class in the table below provides information about hypothetical account values and hypothetical expenses based on the Fund's actual net expense ratio and an assumed rate of return of 5% per year before expenses, which is not the Fund's actual return. The hypothetical account values and expenses may not be used to estimate the actual ending account balance or expenses you paid for the period. You may use this information to compare the ongoing costs of investing in the Fund and other funds. To do so, compare this 5% hypothetical example with the 5% hypothetical examples that appear in the shareholder reports of the other funds.
Please note that the expenses shown in the table are meant to highlight your ongoing costs only. As a shareholder of the Fund you do not incur any transaction costs, such as sales charges, redemption fees, or exchange fees, but shareholders of other funds may incur such costs. The second line of the table is useful in comparing ongoing costs only, and will not help you determine the relative total costs of owning different funds whose shareholders may incur transaction costs.
| | | | | | | | | | | | |
| Share Class | | Beginning
Account Value
7/01/14 | | | Ending
Account Value
12/31/14 | | | Expenses Paid
for the
6 Months
Ended
12/31/14* | |
| Institutional | | | | | | | | | | | | |
| Actual | | $ | 1,000 | | | $ | 1,085.90 | | | $ | 4.15 | |
| Hypothetical 5% return | | | 1,000 | | | | 1,021.22 | + | | | 4.02 | |
| Service | | | | | | | | | | | | |
| Actual | | | 1,000 | | | | 1,085.10 | | | | 5.47 | |
| Hypothetical 5% return | | | 1,000 | | | | 1,019.96 | + | | | 5.30 | |
| | * | Expenses are calculated using the Fund’s annualized net expense ratio for each class, which represents the ongoing expenses as a percentage of net assets for the six months ended December 31, 2014. Expenses are calculated by multiplying the annualized net expense ratio by the average account value for the period; then multiplying the result by the number of days in the most recent fiscal half year; and then dividing that result by the number of days in the fiscal year. The annualized net expense ratios for the period were 0.79% and 1.04% for the Institutional and Service Shares, respectively. | |
| | + | Hypothetical expenses are based on the Fund’s actual annualized net expense ratios and an assumed rate of return of 5% per year before expenses. | |
24
GOLDMAN SACHS VARIABLE INSURANCE TRUST STRATEGIC GROWTH FUND
Trustees and Officers (Unaudited)
Independent Trustees
| | | | | | | | | | | | |
| | | | | |
Name,
Address and Age1 | | Position(s) Held
with the Trust | | Term of Office and
Length of
Time Served2 | | Principal Occupation(s) During Past 5 Years | | Number of
Portfolios in
Fund Complex
Overseen by
Trustee3 | | | Other Directorships Held by Trustee4 |
Ashok N. Bakhru Age: 72 | | Chairman of the Board of Trustees | | Since 1996 (Trustee since 1991) | | Mr. Bakhru is retired. He was formerly Director, Apollo Investment Corporation (a business development company) (2008-2013); President, ABN Associates (a management and financial consulting firm) (1994-1996 and 1998-2012); Trustee, Scholarship America (1998-2005); Trustee, Institute for Higher Education Policy (2003-2008); Director, Private Equity Investors — III and IV (1998-2007), and Equity-Linked Investors II (April 2002-2007). Chairman of the Board of Trustees — Goldman Sachs Fund Complex. | | | 128 | | | None |
John P. Coblentz, Jr. Age: 73 | | Trustee | | Since 2003 | | Mr. Coblentz is retired. Formerly, he was Partner, Deloitte & Touche LLP (1975-2003); Director, Emerging Markets Group, Ltd. (2004-2006); and Director, Elderhostel, Inc. (2006-2012). Trustee — Goldman Sachs Fund Complex. | | | 128 | | | None |
Diana M. Daniels Age: 65 | | Trustee | | Since 2007 | | Ms. Daniels is retired. Formerly, she was Vice President, General Counsel and Secretary, The Washington Post Company (1991-2006). Ms. Daniels serves as a Presidential Councillor of Cornell University (2013-Present); Member, Advisory Board, Psychology Without Borders (international humanitarian aid organization) (2007-Present), and former Member of the Legal Advisory Board, New York Stock Exchange (2003-2006) and of the Corporate Advisory Board, Standish Mellon Management Advisors (2006-2007). Trustee — Goldman Sachs Fund Complex. | | | 108 | | | None |
Joseph P. LoRusso Age: 57 | | Trustee | | Since 2010 | | Mr. LoRusso is retired. Formerly, he was President, Fidelity Investments Institutional Services Co. (“FIIS”) (2002-2008); Director, FIIS (2002-2008); Director, Fidelity Investments Institutional Operations Company (2003-2007); Executive Officer, Fidelity Distributors Corporation (2007-2008). Trustee — Goldman Sachs Fund Complex. | | | 108 | | | None |
Herbert J. Markley Age: 64 | | Trustee | | Since 2013 | | Mr. Markley is retired. Formerly, he was Executive Vice President, Deere & Company (an agricultural and construction equipment manufacturer) (2007-2009), and President, Agricultural Division, Deere & Company (2001-2007). Trustee — Goldman Sachs Fund Complex. | | | 108 | | | None |
Jessica Palmer Age: 65 | | Trustee | | Since 2007 | | Ms. Palmer is retired. She is Director, Emerson Center for the Arts and Culture (2011-Present); and was formerly a Consultant, Citigroup Human Resources Department (2007-2008); Managing Director, Citigroup Corporate and Investment Banking (previously, Salomon Smith Barney/Salomon Brothers) (1984-2006). Ms. Palmer was a Member of the Board of Trustees of Indian Mountain School (private elementary and secondary school) (2004-2009). Trustee — Goldman Sachs Fund Complex. | | | 108 | | | None |
Richard P. Strubel Age: 75 | | Trustee | | Since 1987 | | Mr. Strubel is retired. Formerly, he was Director, Cardean Learning Group (provider of educational services via the internet) (2003-2008); and Director, Gildan Activewear Inc. (a clothing marketing and manufacturing company) (2000-2014). He serves as Trustee, Emeritus, The University of Chicago (1987-Present). Trustee — Goldman Sachs Fund Complex. | | | 128 | | | The Northern Trust Mutual Fund Complex (56 Portfolios) (Chairman of the Board of Trustees) |
| | | | | | | | | | | | |
25
GOLDMAN SACHS VARIABLE INSURANCE TRUST STRATEGIC GROWTH FUND
Trustees and Officers (Unaudited) (continued)
Independent Trustees (continued)
| | | | | | | | | | | | |
| | | | | |
Name,
Address and Age1 | | Position(s) Held
with the Trust | | Term of Office and
Length of
Time Served2 | | Principal Occupation(s) During Past 5 Years | | Number of
Portfolios in
Fund Complex
Overseen by
Trustee3 | | | Other Directorships Held by Trustee4 |
Roy W. Templin Age: 54 | | Trustee | | Since 2013 | | Mr. Templin is retired. He is Chairman of the Board of Directors, Con-Way Incorporated (2012-Present); and was formerly Executive Vice President and Chief Financial Officer, Whirlpool Corporation (an appliance manufacturer and marketer) (2004-2012). Trustee — Goldman Sachs Fund Complex. | | | 108 | | | Con-Way Incorporated (a transportation, supply-chain management and logistics services company) |
| | | | | | | | | | | | |
Interested Trustees*
| | | | | | | | | | | | |
| | | | | |
Name,
Address and Age1 | | Position(s) Held
with the Trust | | Term of Office and
Length of
Time Served2 | | Principal Occupation(s) During Past 5 Years | | Number of
Portfolios in
Fund Complex
Overseen by
Trustee3 | | | Other Directorships Held by Trustee4 |
James A. McNamara Age: 52 | | President and Trustee | | Since 2007 | | Managing Director, Goldman Sachs (December 1998-Present); Director of Institutional Fund Sales, GSAM (April 1998-December 2000); and Senior Vice President and Manager, Dreyfus Institutional Service Corporation (January 1993- April 1998). President — Goldman Sachs Fund Complex (November 2007-Present); Senior Vice President — Goldman Sachs Fund Complex (May 2007-November 2007); and Vice President — Goldman Sachs Fund Complex (2001-2007). Trustee — Goldman Sachs Fund Complex (November 2007-Present and December 2002-May 2004). | | | 127 | | | None |
Alan A. Shuch Age: 65 | | Trustee | | Since 1990 | | Advisory Director — GSAM (May 1999-Present); Consultant to GSAM (December 1994-May 1999); and Limited Partner, Goldman Sachs (December 1994-May 1999). Trustee — Goldman Sachs Fund Complex. | | | 108 | | | None |
| | | | | | | | | | | | |
| * | These persons are considered to be “Interested Trustees” because they hold positions with Goldman Sachs and own securities issued by The Goldman Sachs Group, Inc. Each Interested Trustee holds comparable positions with certain other companies of which Goldman Sachs, GSAM or an affiliate thereof is the investment adviser, administrator and/or distributor. |
| 1 | Each Trustee may be contacted by writing to the Trustee, c/o Goldman Sachs, 200 West Street, New York, New York, 10282, Attn: Caroline Kraus. Information is provided as of December 31, 2014. |
| 2 | Each Trustee holds office for an indefinite term until the earliest of: (a) the election of his or her successor; (b) the date the Trustee resigns or is removed by the Board of Trustees or shareholders, in accordance with the Trust’s Declaration of Trust; (c) December 31st of the year in which the Trustee turns 74 years of age, subject to waiver by a majority of the Trustees (in accordance with the current resolutions of the Board of Trustees, which may be changed by the Trustees without shareholder vote); or (d) the termination of the Trust. By resolution of the Board of Trustees determining that an extension of service would be beneficial to the Trust, the retirement age has been extended with respect to Richard P. Strubel. |
| 3 | The Goldman Sachs Fund Complex consists of the Trust and Goldman Sachs Trust (“GST”). As of December 31, 2014, the Trust consisted of 14 portfolios and GST consisted of 94 portfolios (88 of which offered shares to the public). The Goldman Sachs Fund Complex also includes, with respect to Messrs. Bakhru, Coblentz and Strubel, Goldman Sachs Trust II (“GSTII”), Goldman Sachs BDC, Inc. (“GSBDC”), Goldman Sachs MLP Income Opportunities Fund (“GSMLP”), Goldman Sachs MLP and Energy Renaissance Fund (“GSMER”) and Goldman Sachs ETF Trust (“GSETF”), and with respect to Mr. McNamara, GSTII, GSMLP, GSMER and GSETF. GSTII consisted of 6 portfolios (one of which offered shares to the public). GSBDC, GSMLP and GSMER each consisted of one portfolio. GSETF consisted of 11 portfolios (none of which offered shares to the public). As of December 31, 2014, GSBDC had not offered shares to the public. |
| 4 | This column includes only directorships of companies required to report to the Securities and Exchange Commission under the Securities Exchange Act of 1934 (i.e., “public companies”) or other investment companies registered under the Act. |
Additional information about the Trustees is available in the Fund’s Statement of Additional Information, which can be obtained from Goldman Sachs free of charge by calling this toll-free number (in the United States of America): 1-800-292-4726.
26
GOLDMAN SACHS VARIABLE INSURANCE TRUST STRATEGIC GROWTH FUND
Trustees and Officers (Unaudited) (continued)
Officers of the Trust*
| | | | | | |
| | | |
Name, Address and Age1 | | Position(s) Held With the Trust | | Term of
Office and
Length of
Time Served2 | | Principal Occupation(s) During Past 5 Years |
James A. McNamara
200 West Street New York, NY 10282 Age: 52 | | President and Trustee | | Since 2007 | | Managing Director, Goldman Sachs (December 1998-Present); Director of Institutional Fund Sales, GSAM (April 1998-December 2000); and Senior Vice President and Manager, Dreyfus Institutional Service Corporation (January 1993-April 1998). President — Goldman Sachs Fund Complex (November 2007-Present); Senior Vice President — Goldman Sachs Fund Complex (May 2007-November 2007); and Vice President — Goldman Sachs Fund Complex (2001-2007). Trustee — Goldman Sachs Fund Complex (November 2007-Present and December 2002-May 2004). |
Caroline L. Kraus
200 West Street New York, NY 10282 Age: 37 | | Secretary | | Since 2012 | | Vice President, Goldman Sachs (August 2006-Present); Associate General Counsel, Goldman Sachs (2012-Present); Assistant General Counsel, Goldman Sachs (August 2006-December 2011) and Associate, Weil, Gotshal & Manges, LLP (2002-2006). Secretary — Goldman Sachs Fund Complex (August 2012-Present) and Assistant Secretary — Goldman Sachs Fund Complex (June 2012-August 2012). |
Scott M. McHugh
200 West Street New York, NY 10282 Age: 43 | | Principal Financial
Officer, Senior Vice
President and
Treasurer | | Since 2009
(Principal
Financial
Officer since
2013) | | Vice President, Goldman Sachs (February 2007-Present); Assistant Treasurer of certain mutual funds administered by DWS Scudder (2005-2007); and Director (2005-2007), Vice President (2000-2005) and Assistant Vice President (1998-2000), Deutsche Asset Management or its predecessor (1998-2007). Principal Financial Officer — Goldman Sachs Fund Complex (November 2013-Present); Treasurer — Goldman Sachs Fund Complex (October 2009-Present); Senior Vice President — Goldman Sachs Fund Complex (November 2009-Present); and Assistant Treasurer — Goldman Sachs Fund Complex (May 2007-October 2009). |
| | | | | | |
| * | Represents a partial list of officers of the Trust. Additional information about all the officers is available in the Fund’s Statement of Additional Information, which can be obtained from Goldman Sachs free of charge by calling this toll-free number (in the United States): 1-800-292-4726. |
| 1 | Information is provided as of December 31, 2014. |
| 2 | Officers hold office at the pleasure of the Board of Trustees or until their successors are duly elected and qualified. Each officer holds comparable positions with certain other companies of which Goldman Sachs, GSAM or an affiliate thereof is the investment adviser, administrator and/or distributor. |
27
GOLDMAN SACHS VARIABLE INSURANCE TRUST STRATEGIC GROWTH FUND
Goldman Sachs Variable Insurance Trust — Tax Information (Unaudited)
For the year ended December 31, 2014, 34.93% of the dividends paid from net investment company taxable income by the Strategic Growth Fund qualify for the dividends received deduction available to corporations.
Pursuant to Section 852 of the Internal Revenue Code, the Strategic Growth Fund designates $81,314,457 or, if different, the maximum amount allowable, as capital gain dividends paid during the fiscal year ended December 31, 2014.
28
| | |
| TRUSTEES | | OFFICERS |
| Ashok N. Bakhru, Chairman | | James A. McNamara, President |
| John P. Coblentz, Jr. | | Scott M. McHugh, Principal Financial Officer |
| Diana M. Daniels | | and Treasurer |
| Joseph P. LoRusso | | Caroline L. Kraus, Secretary |
| Herbert J. Markley | | |
| James A. McNamara | | |
| Jessica Palmer | | |
| Alan A. Shuch | | |
| Richard P. Strubel | | |
| Roy W. Templin | | |
GOLDMAN, SACHS & CO.
Distributor and Transfer Agent
GOLDMAN SACHS ASSET MANAGEMENT, L.P.
Investment Adviser
200 West Street, New York
New York 10282
Visit our web site at www.GSAMFUNDS.com/vit to obtain the most recent month-end returns.
The reports concerning the Fund included in this shareholder report may contain certain forward-looking statements about the factors that may affect the performance of the Fund in the future. These statements are based on Fund management’s predictions and expectations concerning certain future events and their expected impact on the Fund, such as performance of the economy as a whole and of specific industry sectors, changes in the levels of interest rates, the impact of developing world events, and other factors that may influence the future performance of the Fund. Management believes these forward-looking statements to be reasonable, although they are inherently uncertain and difficult to predict. Actual events may cause adjustments in portfolio management strategies from those currently expected to be employed.
A description of the policies and procedures that the Fund uses to determine how to vote proxies relating to portfolio securities and information regarding how the Fund voted proxies relating to portfolio securities for the 12-month period ended June 30 is available (i) without charge, upon request by calling 1-800-621-2550; and (ii) on the Securities and Exchange Commission (“SEC”) web site at http://www.sec.gov.
The Fund files its complete schedule of portfolio holdings with the SEC for the first and third quarters of each fiscal year on Form N-Q. The Fund’s Form N-Qs are available on the SEC’s web site at http://www.sec.gov within 60 days after the Fund’s first and third fiscal quarters. The Fund’s Form N-Qs may be reviewed and copied at the SEC’s Public Reference Room in Washington, D.C. and information on the operation of the Public Reference Room may also be obtained by calling 1-800-SEC-0330. Form N-Qs may be obtained upon request and without charge by calling 1-800-621-2550.
The website links provided are for your convenience only and are not an endorsement or recommendation by GSAM of any of these websites or the products or services offered. GSAM is not responsible for the accuracy and validity of the content of these websites.
Fund holdings and allocations shown are as of December 31, 2014 and may not be representative of future investments. Fund holdings should not be relied on in making investment decisions and should not be construed as research or investment advice regarding particular securities. Current and future holdings are subject to risk.
The Global Industry Classification Standard (“GICS”) was developed by and is the exclusive property and a service mark of Morgan Stanley Capital International Inc. (“MSCI”) and Standard & Poor’s, a division of The McGraw-Hill Companies, Inc. (“S&P”) and is licensed for use by Goldman Sachs. Neither MSCI, S&P nor any other party involved in making or compiling the GICS or any GICS classifications makes any express or implied warranties or representations with respect to such standard or classification (or the results to be obtained by the use thereof), and all such parties hereby expressly disclaim all warranties of originality, accuracy, completeness, merchantability or fitness for a particular purpose with respect to any of such standard or classification. Without limiting any of the foregoing, in no event shall MSCI, S&P, any of their affiliates or any third party involved in making or compiling the GICS or any GICS classifications have any liability for any direct, indirect, special, punitive, consequential or any other damages (including lost profits) even if notified of the possibility of such damages.
The portfolio risk management process includes an effort to monitor and manage risk, but does not imply low risk.
Shares of the Goldman Sachs VIT Funds are offered to separate accounts of participating life insurance companies for the purpose of funding variable annuity contracts and variable life insurance policies. Shares of the Fund are not offered directly to the general public. The variable annuity contracts and variable life insurance policies are described in the separate prospectuses issued by participating insurance companies. You should refer to those prospectuses for information about surrender charges, mortality and expense risk fees and other charges that may be assessed by participating insurance companies under the variable annuity contracts or variable life insurance policies. Such fees or charges, if any, may affect the return you may realize with respect to your investments. Ask your representative for more complete information. Please consider a fund’s objectives, risks and charges and expenses, and read the prospectus carefully before investing. The prospectus contains this and other information about the Fund.
This material is not authorized for distribution to prospective investors unless preceded or accompanied by a current Prospectus or summary prospectus, if applicable. Investors should consider a Fund’s objective, risks, and charges and expenses, and read the summary prospectus, if available, and/or the Prospectus carefully before investing or sending money. The summary prospectus, if available, and the Prospectus contain this and other information about a Fund and may be obtained from your Authorized Institution or from Goldman, Sachs & Co. by calling 1-800-621-2550.
This report is prepared for the general information of contract owners and is not an offer of shares of the Goldman Sachs Variable Insurance Trust: Goldman Sachs Strategic Growth Fund.
©2015 Goldman Sachs. All rights reserved.
VITGRWAR-15/153848.MF.MED.TMPL/2/2015
Goldman
Sachs Variable Insurance Trust
Goldman Sachs
Strategic Income Fund
Annual Report
December 31, 2014
GOLDMAN SACHS VARIABLE INSURANCE TRUST STRATEGIC INCOME FUND
Principal Investment Strategies and Risks
This is not a complete list of risks that may affect the Fund. For additional information concerning the risks applicable to the Fund, please see the Fund’s Prospectuses.
Shares of the Goldman Sachs Variable Insurance Trust — Goldman Sachs Strategic Income Fund are offered to separate accounts of participating life insurance companies for the purpose of funding variable annuity contracts and variable life insurance policies. Shares of the Fund are not offered directly to the general public. The variable annuity contracts and variable life insurance policies are described in the separate prospectuses issued by participating insurance companies. You should refer to those prospectuses for information about surrender charges, mortality and expense risk fees and other charges that may be assessed by participating insurance companies under the variable annuity contracts or variable life insurance policies. Such fees or charges, if any, may affect the return you realize with respect to your investments. Ask your representative for more complete information. Please consider the Fund’s objective, risks and charges and expenses, and read the Prospectus carefully before investing. The Prospectus contains this and other information about the Fund.
The Goldman Sachs Strategic Income Fund invests in a broadly diversified portfolio of U.S. and foreign investment grade and non-investment grade fixed income investments including, but not limited to: U.S. government securities, non-U.S. sovereign debt, agency securities, corporate debt securities, agency and non-agency mortgage-backed securities, asset-backed securities, custodial receipts, municipal securities, loan participations and loan assignments and convertible securities. Investments in fixed income securities are subject to the risks associated with debt securities generally, including credit, liquidity and interest rate risk. Investments in mortgage-backed securities are also subject to, among other risks, prepayment risk (i.e., the risk that in a declining interest rate environment, issuers may pay principal more quickly than expected, causing the Fund to reinvest proceeds at lower prevailing interest rates). High yield, lower rated investments involve greater price volatility, are less liquid and present greater risks than higher rated fixed income securities. Foreign and emerging markets investments may be more volatile and less liquid than investments in U.S. securities and are subject to the risks of currency fluctuations and adverse economic or political developments. The Fund is also subject to the risk that the issuers of sovereign debt or the government authorities that control the payment of debt may be unable or unwilling to repay principal or interest when due. The Fund may be more sensitive to adverse economic, business or political developments if it invests a substantial portion of its assets in bonds of similar projects or in particular types of municipal securities. The Fund may invest in loans directly, through loan assignments, or indirectly, by purchasing participations or sub-participations from financial institutions. Indirect purchases may subject the Fund to greater delays, expenses and risks than direct obligations in the case that a borrower fails to pay scheduled principal and interest. Derivative instruments may involve a high degree of financial risk. These risks include the risk that a small movement in the price of the underlying security or benchmark may result in a disproportionately large movement, unfavorable or favorable, in the price of the derivative instrument; risks of default by a counterparty; and liquidity risk. At times, the Fund may be unable to sell certain of its illiquid investments without a substantial drop in price, if at all. The Fund is subject to the risks associated with implementing short positions. Taking short positions involves leverage of the Fund’s assets and presents various other risks. Losses on short positions are potentially unlimited as a loss occurs when the value of an asset with respect to which the Fund has a short position increases.
1
GOLDMAN SACHS VARIABLE INSURANCE TRUST STRATEGIC INCOME FUND
INVESTMENT OBJECTIVE
The Fund seeks a total return comprised of income and capital appreciation.
Portfolio Management Discussion and Analysis
Below, the Goldman Sachs Fixed Income Portfolio Management Team discusses the Goldman Sachs Variable Insurance Trust — Goldman Sachs Strategic Income Fund’s (the “Fund”) performance and positioning for the period since its inception on April 14, 2014 through December 31, 2014 (the “Reporting Period”).
How did the Fund perform during the Reporting Period?
During the Reporting Period, the Fund’s Advisor, Institutional and Service Shares generated cumulative total returns of -0.79%, -0.51% and -0.70%, respectively. These returns compare to the 0.17% cumulative total return of the Fund’s benchmark, the BofA Merrill Lynch U.S. Dollar Three-Month LIBOR Constant Maturity Index (the “LIBOR Index”), during the same period.
We note that the Fund’s benchmark being the LIBOR Index is a means of emphasizing that the Fund has an unconstrained strategy. That said, this Fund employs a benchmark agnostic strategy and thus comparisons to a benchmark index are not particularly relevant.
What economic and market factors most influenced the Fund during the Reporting Period?
When the Reporting Period started in April 2014, spread, or non-U.S. Treasury, sectors performed well, as intermediate-term and longer-term yields fell. The Federal Reserve (the “Fed”) reduced its quantitative easing asset purchases and maintained its hawkish stance, wherein it had dropped the threshold of 6.5% unemployment as a condition for raising interest rates. The U.S. announced first quarter 2014 Gross Domestic Product (“GDP”) growth had contracted by 2.9%, but second calendar quarter economic data releases, such as auto sales, jobless claims and manufacturing activity, suggested a rebound was underway. This supported the view of some market participants that the first calendar quarter contraction might have been due to inclement winter weather and that economic growth could accelerate in the second quarter of 2014. In the Eurozone, during June 2014, the European Central Bank (“ECB”) cut interest rates by 10 basis points, moving the deposit rate into negative territory for the first time in history. (A basis point is 1/100th of a percentage point.) The ECB also announced it would be implementing additional liquidity measures targeted at stimulating lending.
After a strong start, spread sectors generally declined during the third calendar quarter, as geopolitical tensions surrounding Russia and the Middle East weighed on risk sentiment. Global economic divergence was also a major theme. U.S. data remained generally strong, suggesting an above-trend pace of growth, leading the Fed to shift up its forecasts for the future path of interest rates. Meanwhile, the ECB implemented further easing measures in the form of rate cuts, targeted long-term refinancing operations and asset purchase programs, as a result of persistently low inflation and weaker economic data.
Spread sector weakness persisted into the fourth quarter of 2014, as falling oil prices heightened market volatility and sparked a flight to quality. At the same time, the theme of economic divergence continued. In the U.S., economic conditions improved, leading the Fed to end its quantitative easing asset purchase program, as planned, in October 2014. Meanwhile, soft economic data in the Eurozone and Japan resulted in further monetary easing by their central banks.
What key factors were responsible for the Fund’s performance during the Reporting Period?
Our duration strategy detracted most from results during the Reporting Period. Duration is a measure of the Fund’s sensitivity to changes in interest rates. Our government/swaps strategy and our municipal bond strategy also dampened returns.
On the positive side, our currency, country and corporate credit strategies added to performance. Within our currency strategy, the Fund benefited from an overweighted position in the U.S. dollar and an underweight in the Swiss franc, primarily relative to emerging markets currencies, which were volatile toward the end of the Reporting Period on slower global economic growth and increasing divergence in central bank monetary policy. Within our country strategy, an overweight in European peripheral nations, specifically Italy and Spain, versus developed European countries was advantageous as market expectations for easy monetary policy from the ECB encouraged yield hunting activity in the peripheral nations’ markets. Allocation decisions within our corporate credit strategy helped most.
2
GOLDMAN SACHS VARIABLE INSURANCE TRUST STRATEGIC INCOME FUND
What fixed income market sectors most significantly affected Fund performance?
Issue selection within the government/swaps sector detracted from performance, driven mainly by the Fund’s positions in longer-maturity securities. Within the municipal bond sector, the Fund was hampered by its issue selection of Puerto Rican municipal debt.
Conversely, the Fund benefited from an overweighted position in select high yield corporate bonds.
Did the Fund’s duration and yield curve positioning strategy help or hurt its results during the Reporting Period?
The combined effect of the Fund’s tactical duration and yield curve positioning detracted from performance during the Reporting Period. Because we believed accelerating economic growth would pressure interest rates higher, the Fund held a short duration position on the U.S. Treasury yield curve, which hurt results as rates fell during the Reporting Period.
How did the Fund use derivatives and similar instruments during the Reporting Period?
We used derivatives and similar instruments for the efficient management of the Fund. These derivatives and similar instruments allowed us to manage interest rate, credit and currency risks more effectively by allowing us both to hedge and to apply active investment views with greater versatility and to afford greater risk management precision than we would otherwise be able to implement.
During the Reporting Period, we used interest rate and bond exchange traded futures contracts to implement duration and country strategies within the Fund, especially in the U.S., Eurozone and Japanese markets. Currency transactions were carried out using forward foreign exchange contracts. Currency transactions were used as we sought both to enhance returns and to hedge the Fund’s portfolio against currency exchange rate fluctuations. Also, we used credit default swaps to manage exposure to fluctuations in credit spreads (or the differential in yields between Treasury securities and non-Treasury securities that are identical in all respects except for quality rating) and interest rate swaps to manage exposure to fluctuations in interest rates.
Were there any notable changes in the Fund’s weightings during the Reporting Period?
The Fund is a broadly diversified, multi-sector portfolio designed to provide total return opportunities from across the fixed income spectrum, including government, securitized, corporate credit and emerging market fixed income sectors. During the Reporting Period, the Fund’s positioning remained fairly consistent, with the major themes being short duration, an emphasis on growth-sensitive assets and interest rate volatility. That said, we reduced the Fund’s overweight in high yield corporate bonds on strong second calendar quarter performance, subsequently increasing the overweight after high yield corporate bond spreads widened. During the fourth calendar quarter, we meaningfully increased the Fund’s exposure to investment grade corporate bonds and high yield corporate bonds.
How was the Fund positioned at the end of the Reporting Period?
At the end of the Reporting Period, the Fund’s duration was less than one year, as we had reduced short positions, particularly in the U.S., during the last five months of 2014. In terms of sector positioning, the Fund was overweight investment grade corporate bonds and high yield corporate bonds at the end of the Reporting Period. We maintained the Fund’s exposure to other fixed income sectors and at the end of the Reporting Period, the Fund was overweight non-agency mortgage-backed securities and held a relatively neutral position in emerging markets debt.
What is the Fund’s tactical view and strategy for the months ahead?
At the end of the Reporting Period, we expected the evolving theme of global economic divergence to reach a pivotal point in 2015, as markets react to contrasting economic growth and monetary policy drivers. In our view, U.S. economic growth will likely accelerate in 2015, which is, in turn, likely to trigger the first interest rate hike since the financial crisis. We believe robust economic growth and labor market indicators may well persuade the Fed to look through any short-term softness in inflation. A rate hike is likely in June 2015, in our opinion, though it may be delayed until September 2015. In contrast, the central banks of the next-largest economies are likely to remain firmly in easing mode as a result of continued economic weakness. That said, we believe a modest pickup in economic growth is likely in the Eurozone and Japan, despite persistent disinflationary pressures. In China, we believe monetary and fiscal stimulus should keep economic growth close to 7%.
Lower oil prices are, in our view, a tailwind for global economic growth. Many of the largest economies are net importers, and we think the savings they gain should more than offset the negative impact on oil exporters. The drop in oil prices has also pushed down global inflation, though we believe the impact is likely to be temporary.
3
GOLDMAN SACHS VARIABLE INSURANCE TRUST STRATEGIC INCOME FUND
At the end of the Reporting Period, we believed riskier fixed income asset classes were still supported by low inflation, strong U.S. economic growth, and monetary stimulus outside the U.S. We continue to monitor how the drop in oil prices may affect high yield securities, but at the end of the Reporting Period, we saw some attractive opportunities resulting from the decline in certain asset classes, particularly within currencies and the emerging markets.
4
GOLDMAN SACHS VARIABLE INSURANCE TRUST STRATEGIC INCOME FUND
Index Definitions
The BofA Merrill Lynch U.S. Dollar 3-Month LIBOR Constant Maturity Index tracks the performance of a synthetic asset paying Libor to a stated maturity. The Index is based on the assumed purchase at par of a synthetic instrument having exactly its stated maturity and with a coupon equal to that day’s fixing rate. That issue is assumed to be sold the following business day (priced at a yield equal to the current day fixing rate) and rolled into a new instrument.
All index figures do not reflect any deduction for fees, expenses or taxes. It is not possible to invest directly in an unmanaged index.
5
FUND BASICS
Strategic Income Fund
as of December 31, 2014
STANDARDIZED TOTAL RETURNS1
| | | | | | |
| For the period ended 12/31/14 | | Since Inception | | | Inception Date |
| Institutional | | | -0.51 | % | | 4/14/14 |
| Service | | | -0.70 | | | 4/14/14 |
| Advisor | | | -0.79 | | | 4/14/14 |
| 1 | The Standardized Total Returns are average annual total returns or cumulative total returns (only if the performance period is one year or less) as of the most recent calendar quarter-end. They assume reinvestment of all distributions at net asset value. Because Institutional, Service and Advisor Shares do not involve a sales charge, such a charge is not applied to their Standardized Total Returns. |
Total return figures in the above chart represent past performance and do not indicate future results, which will vary. The investment return and principal value of an investment will fluctuate and, therefore, an investor’s shares, when redeemed, may be worth more or less than their original cost. Current performance may be lower or higher than the total return figures in the above chart. Please visit www.GSAMFUNDS.com to obtain the most recent month-end returns. Performance reflects fee waivers and/or expense limitations in effect during the periods shown. In their absence, performance would be reduced.
EXPENSE RATIOS2
| | | | | | | | |
| | | Net Expense Ratio (Current) | | | Gross Expense Ratio (Before Waivers) | |
| Institutional | | | 0.87 | % | | | 1.17 | % |
| Service | | | 1.12 | | | | 1.42 | |
| Advisor | | | 1.27 | | | | 1.57 | |
| 2 | The expense ratios of the Fund, both current (net of any fee waivers or expense limitations) and before waivers (gross of any fee waivers or expense limitations) are as set forth above. Pursuant to a contractual arrangement, the Fund’s waivers and/or expense limitations will remain in place through at least April 30, 2015 and prior to such date the Investment Adviser may not terminate the arrangements without the approval of the Fund’s Board of Trustees. If these arrangements are discontinued in the future, the expense ratios may change without shareholder approval. |
6
FUND BASICS
FUND COMPOSITION3

| 3 | The percentage shown for each investment category reflects the value of investments in that category as a percentage of net assets. Figures in the graph may not sum to 100% due to the exclusion of other assets and liabilities. The graph depicts the Fund’s investments but may not represent the Fund’s market exposure due to the exclusion of certain derivatives, if any, as listed in the Additional Investment Information section of the Schedule of Investments. |
| 4 | “Federal Agencies” are mortgage-backed securities guaranteed by the Government National Mortgage Association (“GNMA”), Federal National Mortgage Association (“FNMA”) or Federal Home Loan Mortgage Corp. (“FHLMC”). GNMA instruments are backed by the full faith and credit of the United States Government. |
7
GOLDMAN SACHS VARIABLE INSURANCE TRUST STRATEGIC INCOME FUND
Performance Summary
December 31, 2014
The following graph shows the value, as of December 31, 2014, of a $10,000 investment made on April 14, 2014 (commencement of the Fund’s operations) in Institutional Shares at NAV. For comparative purposes, the performance of the Fund’s benchmark, the Bank of America Merrill Lynch U.S. Dollar Three-Month LIBOR Constant Maturity Index (the “LIBOR Index”), is shown. This performance data represents past performance and should not be considered indicative of future performance, which will fluctuate with changes in market conditions. These performance fluctuations will cause an investor’s shares, when redeemed, to be worth more or less than their original cost. Performance reflects Fund level expenses but does not reflect fees and expenses associated with any variable annuity contract or variable life insurance policy that uses the Fund as an investment option for any contract or policy. Had performance reflected all of those fees and expenses, performance would have been reduced. Performance reflects applicable fee waivers and/or expense limitations in effect during the periods shown, and in their absence, performance would be reduced. Performance of Service and Advisor Shares will vary from Institutional Shares due to differences in class specific fees. In addition to the Investment Adviser’s decisions regarding issuer/industry investment selection and allocation, other factors may affect Fund performance. These factors include, but are not limited to, Fund operating fees and expenses, portfolio turnover, and subscription and redemption cash flows affecting the Fund.
Strategic Income Fund’s Lifetime Performance
Performance of a $10,000 investment, with distributions reinvested, from April 14, 2014 through December 31, 2014.
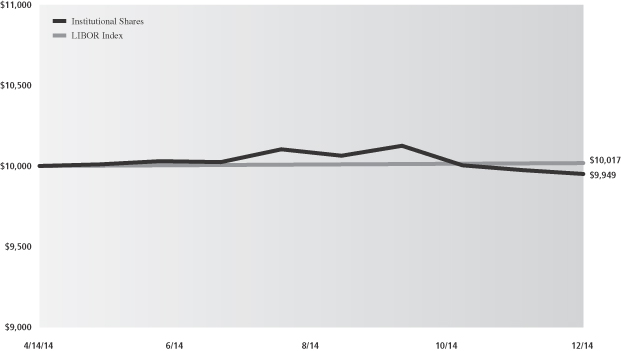
| | |
| Cumulative Total Return through December 31, 2014 | | Since Inception |
Institutional (Commenced April 14, 2014) | | -0.51% |
Service (Commenced April 14, 2014) | | -0.70% |
Advisor (Commenced April 14, 2014) | | -0.79% |
8
GOLDMAN SACHS VARIABLE INSURANCE TRUST STRATEGIC INCOME FUND
Schedule of Investments
December 31, 2014
| | | | | | | | | | | | | | |
Principal Amount | | | Interest Rate | | | Maturity Date | | | Value | |
| | Corporate Obligations – 11.2% | |
| Automobiles & Components – 0.1% | |
| General Motors Co. | |
| $ | 25,000 | | | | 5.200 | % | | | 04/01/45 | | | $ | 26,563 | |
| | |
| Banks(a)(b) – 2.9% | |
| ABN AMRO Bank NV | |
| EUR | 50,000 | | | | 4.310 | | | | 03/29/49 | | | | 61,290 | |
| Bank of America Corp. Series V | |
| $ | 50,000 | | | | 5.125 | | | | 12/29/49 | | | | 48,500 | |
| Bank of America Corp. Series X | |
| | 25,000 | | | | 6.250 | | | | 09/29/49 | | | | 24,750 | |
| Bank of America Corp. Series Z | |
| | 25,000 | | | | 6.500 | | | | 10/29/49 | | | | 25,500 | |
| Bank of Scotland Capital Funding LP | |
| GBP | 50,000 | | | | 6.059 | | | | 03/29/49 | | | | 78,758 | |
| Citigroup Capital XIII | |
| $ | 1,475 | | | | 7.875 | | | | 10/30/40 | | | | 39,206 | |
| Citigroup, Inc. Series M | |
| | 50,000 | | | | 6.300 | | | | 12/29/49 | | | | 49,250 | |
| KBC Groep NV | |
| EUR | 100,000 | | | | 5.625 | | | | 03/29/49 | | | | 118,533 | |
| Morgan Stanley Series I | |
| $ | 1,136 | | | | 6.375 | | | | 12/31/49 | | | | 28,752 | |
| PNC Preferred Funding Trust II (c) | |
| | 100,000 | | | | 1.463 | | | | 03/29/49 | | | | 94,000 | |
| | | | | | | | | | | | | | |
| | | | | | | | | | | | | 568,539 | |
| | |
| Containers & Packaging(b) – 1.5% | |
| Berry Plastics Corp. | |
| | 50,000 | | | | 9.750 | | | | 01/15/21 | | | | 55,875 | |
| Beverage Packaging Holdings Luxembourg II SA(c) | |
| | 25,000 | | | | 5.625 | | | | 12/15/16 | | | | 24,562 | |
| Reynolds Group Issuer, Inc. | |
| | 100,000 | | | | 7.875 | | | | 08/15/19 | | | | 105,500 | |
| | 100,000 | | | | 9.875 | | | | 08/15/19 | | | | 105,500 | |
| | | | | | | | | | | | | | |
| | | | | | | | | | | | | 291,437 | |
| | |
| Energy – 0.8% | |
| Halcon Resources Corp.(b) | |
| | 100,000 | | | | 8.875 | | | | 05/15/21 | | | | 75,250 | |
| Kodiak Oil & Gas Corp.(b) | |
| | 50,000 | | | | 8.125 | | | | 12/01/19 | | | | 51,000 | |
| Petroleos de Venezuela SA | |
| | 20,000 | | | | 6.000 | | | | 05/16/24 | | | | 7,550 | |
| | 30,000 | | | | 6.000 | | | | 11/15/26 | | | | 10,950 | |
| | 20,000 | | | | 5.375 | | | | 04/12/27 | | | | 7,150 | |
| | | | | | | | | | | | | | |
| | | | | | | | | | | | | 151,900 | |
| | |
| Food & Beverage(b) – 0.8% | |
| Bumble Bee Holdings, Inc.(c) | |
| | 46,000 | | | | 9.000 | | | | 12/15/17 | | | | 48,415 | |
| | 50,000 | | | | 9.625 | | | | 03/15/18 | | | | 52,500 | |
| Post Holdings, Inc. | |
| | 50,000 | | | | 7.375 | | | | 02/15/22 | | | | 50,250 | |
| | | | | | | | | | | | | | |
| | | | | | | | | | | | | 151,165 | |
| | |
| | Corporate Obligations – (continued) | |
| Food & Staples Retailing(b) – 0.6% | |
| 1011778 BC ULC(c) | |
| $ | 50,000 | | | | 6.000 | % | | | 04/01/22 | | | $ | 51,250 | |
| BI-LO LLC(c) | |
| | 50,000 | | | | 9.375 | | | | 09/15/18 | | | | 37,625 | |
| Walgreens Boots Alliance, Inc. | |
| | 25,000 | | | | 4.800 | | | | 11/18/44 | | | | 26,440 | |
| | | | | | | | | | | | | | |
| | | | | | | | | | | | | 115,315 | |
| | |
| Media – 1.4% | |
| 21st Century Fox America, Inc.(b)(c) | |
| | 25,000 | | | | 3.700 | | | | 09/15/24 | | | | 25,757 | |
| | 25,000 | | | | 4.750 | | | | 09/15/44 | | | | 27,315 | |
| CCO Holdings LLC(b) | |
| | 50,000 | | | | 7.000 | | | | 01/15/19 | | | | 51,937 | |
| Comcast Corp. | |
| | 25,000 | | | | 4.650 | | | | 07/15/42 | | | | 27,054 | |
| NBCUniversal Media LLC | |
| | 25,000 | | | | 4.450 | | | | 01/15/43 | | | | 26,551 | |
| Univision Communications, Inc.(b)(c) | |
| | 100,000 | | | | 8.500 | | | | 05/15/21 | | | | 106,500 | |
| | | | | | | | | | | | | | |
| | | | | | | | | | | | | 265,114 | |
| | |
| Pipelines – 0.5% | |
| Sabine Pass LNG LP | |
| | 100,000 | | | | 7.500 | | | | 11/30/16 | | | | 104,500 | |
| | |
| Retailing(b) – 0.3% | |
| Amazon.com, Inc. | |
| | 25,000 | | | | 3.800 | | | | 12/05/24 | | | | 25,583 | |
| The Men’s Wearhouse, Inc.(c) | |
| | 25,000 | | | | 7.000 | | | | 07/01/22 | | | | 25,500 | |
| | | | | | | | | | | | | | |
| | | | | | | | | | | | | 51,083 | |
| | |
| Software & Services – 0.6% | |
| First Data Corp.(b)(c) | |
| | 100,000 | | | | 8.875 | | | | 08/15/20 | | | | 107,500 | |
| | |
| Wireless Telecommunications – 0.8% | |
| Intelsat Jackson Holdings SA(b) | |
| | 50,000 | | | | 7.250 | | | | 04/01/19 | | | | 52,125 | |
| Sprint Corp. | |
| | 100,000 | | | | 7.875 | | | | 09/15/23 | | | | 98,750 | |
| | | | | | | | | | | | | | |
| | | | | | | | | | | | | 150,875 | |
| | |
| Wirelines Telecommunications – 0.9% | |
| Level 3 Financing, Inc.(b) | |
| | 60,000 | | | | 8.625 | | | | 07/15/20 | | | | 64,950 | |
| Verizon Communications, Inc. | |
| | 25,000 | | | | 5.150 | | | | 09/15/23 | | | | 27,629 | |
| | 50,000 | | | | 6.550 | | | | 09/15/43 | | | | 63,956 | |
| Verizon Communications, Inc.(c) | |
| | 25,000 | | | | 4.862 | | | | 08/21/46 | | | | 25,760 | |
| | | | | | | | | | | | | | |
| | | | | | | | | | | | | 182,295 | |
| | |
| | TOTAL CORPORATE OBLIGATIONS | |
| | (Cost $2,252,495) | | | $ | 2,166,286 | |
| | |
| | |
| The accompanying notes are an integral part of these financial statements. | | 9 |
GOLDMAN SACHS VARIABLE INSURANCE TRUST STRATEGIC INCOME FUND
Schedule of Investments (continued)
December 31, 2014
| | | | | | | | | | | | | | |
Principal Amount | | | Interest Rate | | | Maturity Date | | | Value | |
| | Mortgage-Backed Obligations – 14.3% | |
| Adjustable Rate Non-Agency(a) – 1.9% | |
| Alternative Loan Trust Series 2005-51, Class 2A1(b) | |
| $ | 74,655 | | | | 0.465 | % | | | 11/20/35 | | | $ | 61,217 | |
| Alternative Loan Trust Series 2006-HY11, Class A1(b) | |
| | 79,724 | | | | 0.290 | | | | 06/25/36 | | | | 66,140 | |
| CHL Mortgage Pass-Through Trust Series 2006-OA5,
Class 1A1(b) |
|
| | 54,343 | | | | 0.370 | | | | 04/25/46 | | | | 44,252 | |
| Deutsche Alt-A Securities Mortgage Loan Trust Series 2007-OA3,
Class A1 |
|
| | 53,351 | | | | 0.309 | | | | 07/25/47 | | | | 45,491 | |
| IndyMac INDA Mortgage Loan Trust Series 2006-AR2,
Class 1A1(b) |
|
| | 65,073 | | | | 2.562 | | | | 09/25/36 | | | | 55,477 | |
| JP Morgan Alternative Loan Trust Series 2006-A5, Class 1A(b) | |
| | 52,996 | | | | 0.330 | | | | 10/25/36 | | | | 42,337 | |
| Lehman XS Trust Series 2005-7N, Class 1A1A(b) | |
| | 57,489 | | | | 0.439 | | | | 12/25/35 | | | | 50,547 | |
| | | | | | | | | | | | | | |
| | | | | | | | | | | | | 365,461 | |
| | |
| Collateralized Mortgage Obligations – 6.6% | |
| Agency Multi-Family(b) – 4.8% | |
| FHLMC Multifamily Structured Pass-Through Certificates
Series K020, Class A2 |
|
| | 400,000 | | | | 2.373 | | | | 05/25/22 | | | | 397,440 | |
| FHLMC Multifamily Structured Pass-Through Certificates
Series K029, Class A2 |
|
| | 500,000 | | | | 3.320 | | | | 02/25/23 | | | | 526,487 | |
| | | | | | | | | | | | | | |
| | | | | | | | | | | | | 923,927 | |
| | |
| Regular Floater(a) – 1.6% | |
| Aire Valley Mortgages PLC Series 2006-1X, Class 2A1 | |
| EUR | 70,495 | | | | 0.379 | | | | 09/20/66 | | | | 82,477 | |
| Alternative Loan Trust Series 2005-36, Class 2A1A(b) | |
| $ | 96,748 | | | | 0.479 | | | | 08/25/35 | | | | 73,122 | |
| Connecticut Avenue Securities Series 2014-C03, Class 1M1(b) | |
| | 17,979 | | | | 1.370 | | | | 07/25/24 | | | | 17,782 | |
| Morgan Stanley Mortgage Loan Trust Series 2006-16AX,
Class 1A(b) |
|
| | 167,567 | | | | 0.340 | | | | 11/25/36 | | | | 70,068 | |
| Paragon Mortgages No. 13 PLC Series 13X, Class A2B(b) | |
| EUR | 57,345 | | | | 0.322 | | | | 01/15/39 | | | | 64,592 | |
| | | | | | | | | | | | | | |
| | | | | | | | | | | | | 308,041 | |
| | |
| Sequential Fixed Rate – 0.2% | |
| Residential Accredit Loans, Inc. Trust Series 2007-QS1,
Class 2A5(b) |
|
| $ | 59,385 | | | | 6.000 | | | | 01/25/37 | | | | 48,887 | |
| | |
| TOTAL COLLATERALIZED MORTGAGE
OBLIGATIONS |
| | $ | 1,280,855 | |
| | |
| | Mortgage-Backed Obligations – (continued) | |
| Federal Agencies – 5.8% | |
| FNMA – 5.8% | |
| $ | 220,035 | | | | 6.000 | % | | | 08/01/36 | | | $ | 249,121 | |
| | 224,490 | | | | 6.000 | | | | 09/01/36 | | | | 254,410 | |
| | 555,475 | | | | 6.000 | | | | 12/01/36 | | | | 629,383 | |
| | | | | | | | | | | | | | |
| | | | | | | | | | | | | 1,132,914 | |
| | |
| | TOTAL FEDERAL AGENCIES | | | $ | 1,132,914 | |
| | |
| | TOTAL MORTGAGE-BACKED OBLIGATIONS | |
| | (Cost $2,772,231) | | | $ | 2,779,230 | |
| | |
| | | | | | | | | | | | | | |
| | Asset-Backed Securities – 12.8% | |
| Collateralized Loan Obligations(a)(c) – 11.2% | |
| Aberdeen Loan Funding Ltd. Series 2008-1A, Class A | |
| $ | 180,002 | | | | 0.882 | % | | | 11/01/18 | | | $ | 178,720 | |
| Acis CLO Ltd. Series 2014-4A, Class ACOM | |
| | 150,000 | | | | 1.713 | | | | 05/01/26 | | | | 146,490 | |
| Anchorage Capital CLO IV Ltd. Series 2014-4A, Class A1A | |
| | 250,000 | | | | 1.732 | | | | 07/28/26 | | | | 247,649 | |
| Hildene CLO II Ltd. Series 2014-2A, Class A | |
| | 250,000 | | | | 1.681 | | | | 07/19/26 | | | | 246,583 | |
| MidOcean Credit CLO Series 2014-3A, Class A | |
| | 250,000 | | | | 1.690 | | | | 07/21/26 | | | | 247,180 | |
| Ocean Trails CLO IV Series 2013-4A, Class A | |
| | 250,000 | | | | 1.533 | | | | 08/13/25 | | | | 246,089 | |
| OFSI Fund V Ltd. Series 2014-7A, Class ACOM | |
| | 100,000 | | | | 1.872 | | | | 10/18/26 | | | | 98,010 | |
| Regatta IV Funding Ltd. Series 2014-1A, Class ACOM | |
| | 250,000 | | | | 1.744 | | | | 07/25/26 | | | | 245,400 | |
| Trinitas CLO II Ltd. Series 2014-2A, Class ACOM | |
| | 250,000 | | | | 1.691 | | | | 07/15/26 | | | | 243,325 | |
| Wasatch Ltd. Series 2006-1A, Class A1B | |
| | 276,673 | | | | 0.473 | | | | 11/14/22 | | | | 268,867 | |
| | | | | | | | | | | | | | |
| | | | | | | | | | | | | 2,168,313 | |
| | |
| Home Equity(b) – 1.6% | |
| Citigroup Mortgage Loan Trust, Inc. Series 2006-WFH1,
Class M3(a) |
|
| | 100,000 | | | | 0.569 | | | | 01/25/36 | | | | 81,996 | |
| Credit-Based Asset Servicing and Securitization LLC
Series 2005-CB8, Class AF2 |
|
| | 15,961 | | | | 4.184 | | | | 12/25/35 | | | | 16,144 | |
| Credit-Based Asset Servicing and Securitization LLC
Series 2005-CB8, Class AF3 |
|
| | 25,000 | | | | 5.749 | | | | 12/25/35 | | | | 23,759 | |
| Lehman XS Trust Series 2007-3, Class 1BA2(a) | |
| | 56,814 | | | | 0.824 | | | | 03/25/37 | | | | 38,316 | |
| Saxon Asset Securities Trust Series 2007-2, Class A2C(a) | |
| | 98,026 | | | | 0.650 | | | | 05/25/47 | | | | 70,680 | |
| | |
| | |
| 10 | | The accompanying notes are an integral part of these financial statements. |
GOLDMAN SACHS VARIABLE INSURANCE TRUST STRATEGIC INCOME FUND
| | | | | | | | | | | | | | |
Principal Amount | | | Interest Rate | | | Maturity Date | | | Value | |
| | Asset-Backed Securities – (continued) | |
| Home Equity(b) – (continued) | |
| Structured Asset Securities Corp. Mortgage Loan Trust 2005-NC2
Series 2005-NC2, Class M4(a) |
|
| $ | 100,000 | | | | 0.640 | % | | | 05/25/35 | | | $ | 81,766 | |
| | | | | | | | | | | | | | |
| | | | | | | | | | | | | 312,661 | |
| | |
| | TOTAL ASSET-BACKED SECURITIES | |
| | (Cost $2,492,096) | | | $ | 2,480,974 | |
| | |
| | | | | | | | | | | | | | |
| | Foreign Debt Obligations – 22.0% | |
| Sovereign – 22.0% | |
| Argentine Republic Government International Bond(d) | |
| $ | 577,000 | | | | 0.000 | % | | | 12/15/35 | | | $ | 42,121 | |
| Brazilian Government International Bond | |
| BRL | 74,000 | | | | 0.000 | (d) | | | 01/01/16 | | | | 24,629 | |
| | 239,000 | | | | 6.000 | | | | 08/15/50 | | | | 219,419 | |
| Bundesrepublik Deutschland | |
| EUR | 210,000 | | | | 2.000 | | | | 08/15/23 | | | | 288,603 | |
| Dominican Republic International Bond(c) | |
| $ | 100,000 | | | | 7.450 | | | | 04/30/44 | | | | 109,500 | |
| Italy Buoni Poliennali Del Tesoro | |
| EUR | 80,000 | | | | 1.150 | | | | 05/15/17 | | | | 97,975 | |
| | 110,000 | | | | 4.500 | | | | 02/01/18 | | | | 148,479 | |
| | 199,381 | | | | 2.350 | | | | 09/15/19 | | | | 260,441 | |
| | 100,000 | | | | 4.750 | | | | 09/01/21 | | | | 147,252 | |
| | 240,000 | | | | 5.500 | | | | 11/01/22 | | | | 373,446 | |
| | 50,000 | | | | 4.500 | | | | 05/01/23 | | | | 73,741 | |
| | 80,000 | | | | 3.750 | | | | 09/01/24 | | | | 112,960 | |
| | 80,000 | | | | 2.500 | | | | 12/01/24 | | | | 102,132 | |
| | 40,000 | | | | 5.000 | | | | 09/01/40 | | | | 63,908 | |
| Mexico Government International Bond(d) | |
| MXN | 1,211,180 | | | | 0.000 | | | | 01/15/15 | | | | 81,916 | |
| | 1,128,910 | | | | 0.000 | | | | 01/29/15 | | | | 76,186 | |
| | 600,720 | | | | 0.000 | | | | 02/05/15 | | | | 40,557 | |
| | 234,590 | | | | 0.000 | | | | 02/19/15 | | | | 15,820 | |
| | 554,310 | | | | 0.000 | | | | 03/05/15 | | | | 37,339 | |
| | 2,493,900 | | | | 0.000 | | | | 03/12/15 | | | | 168,122 | |
| | 2,558,700 | | | | 0.000 | | | | 03/19/15 | | | | 172,180 | |
| | 650,890 | | | | 0.000 | | | | 03/26/15 | | | | 43,835 | |
| | 2,332,480 | | | | 0.000 | | | | 04/01/15 | | | | 156,783 | |
| Mexico Government International Bond Series M 10 | |
| | 1,733,000 | | | | 7.750 | | | | 12/14/17 | | | | 128,449 | |
| Russia Government Bond | |
| $ | 65,500 | | | | 7.500 | | | | 03/31/30 | | | | 67,989 | |
| Spain Government Bond | |
| EUR | 80,000 | | | | 2.100 | | | | 04/30/17 | | | | 100,374 | |
| | 100,000 | | | | 0.500 | | | | 10/31/17 | | | | 120,728 | |
| | 210,000 | | | | 4.500 | | | | 01/31/18 | | | | 283,958 | |
| | 110,000 | | | | 5.900 | | | | 07/30/26 | | | | 187,389 | |
| Spain Government Bond(c) | |
| | 20,000 | | | | 5.400 | | | | 01/31/23 | | | | 31,649 | |
| | 120,000 | | | | 4.400 | | | | 10/31/23 | | | | 179,628 | |
| | 80,000 | | | | 2.750 | | | | 10/31/24 | | | | 106,766 | |
| | |
| | Foreign Debt Obligations – (continued) | |
| Sovereign – (continued) | |
| Spain Government Inflation Linked Bond(c) | |
| EUR | 120,235 | | | | 0.550 | % | | | 11/30/19 | | | $ | 146,565 | |
| Venezuela Government International Bond | |
| $ | 30,000 | | | | 8.250 | | | | 10/13/24 | | | | 13,200 | |
| | 40,000 | | | | 7.650 | | | | 04/21/25 | | | | 17,300 | |
| | 20,000 | | | | 9.250 | | | | 05/07/28 | | | | 8,900 | |
| | 10,000 | | | | 7.000 | | | | 03/31/38 | | | | 4,125 | |
| | | | | | | | | | | | | | |
| | | | | | | | | | | | | 4,254,364 | |
| | |
| | TOTAL FOREIGN DEBT OBLIGATIONS | |
| | (Cost $4,410,693) | | | $ | 4,254,364 | |
| | |
| | | | | | | | | | | | | | |
| | Municipal Debt Obligations – 2.4% | |
| Puerto Rico – 2.4% | |
| Puerto Rico Commonwealth Aqueduct & Sewer Authority RB
Senior Lien Series 2008 A |
|
| $ | 5,000 | | | | 6.000 | % | | | 07/01/44 | | | $ | 3,539 | |
| Puerto Rico Commonwealth Aqueduct & Sewer Authority RB
Senior Lien Series 2012 A |
|
| | 10,000 | | | | 5.750 | | | | 07/01/37 | | | | 7,124 | |
| Puerto Rico Commonwealth Aqueduct & Sewer Authority RB
Senior Lien Series 2012 A |
|
| | 5,000 | | | | 5.000 | | | | 07/01/33 | | | | 3,440 | |
| | 5,000 | | | | 5.125 | | | | 07/01/37 | | | | 3,346 | |
| Puerto Rico Commonwealth GO Bonds Series 2014 A | |
| | 265,000 | | | | 8.000 | | | | 07/01/35 | | | | 230,900 | |
| Puerto Rico Commonwealth GO Refunding for Public
Improvement Series 2008 A |
|
| | 10,000 | | | | 5.500 | | | | 07/01/32 | | | | 7,229 | |
| Puerto Rico Commonwealth GO Refunding for Public
Improvement Series 2009 B |
|
| | 10,000 | | | | 6.000 | | | | 07/01/39 | | | | 7,337 | |
| Puerto Rico Sales Tax Financing Corp. RB First Subseries 2009 A | |
| | 20,000 | | | | 5.500 | | | | 08/01/28 | | | | 15,848 | |
| Puerto Rico Sales Tax Financing Corp. RB First Subseries 2009 A | |
| | 45,000 | | | | 6.000 | | | | 08/01/42 | | | | 33,929 | |
| Puerto Rico Sales Tax Financing Corp. RB First Subseries 2010 A | |
| | 5,000 | | | | 5.500 | | | | 08/01/37 | | | | 3,644 | |
| Puerto Rico Sales Tax Financing Corp. RB First Subseries 2010 A | |
| | 20,000 | | | | 5.375 | | | | 08/01/39 | | | | 14,001 | |
| | 25,000 | | | | 5.500 | | | | 08/01/42 | | | | 17,768 | |
| Puerto Rico Sales Tax Financing Corp. RB First Subseries 2010 C | |
| | 10,000 | | | | 5.375 | | | | 08/01/38 | | | | 7,041 | |
| Puerto Rico Sales Tax Financing Corp. RB First Subseries 2010 C | |
| | 25,000 | | | | 5.250 | | | | 08/01/41 | | | | 17,412 | |
| Puerto Rico Sales Tax Financing Corp. RB First
Subseries 2011 A-1 |
|
| | 120,000 | | | | 5.000 | | | | 08/01/43 | | | | 79,973 | |
| | |
| | |
| The accompanying notes are an integral part of these financial statements. | | 11 |
GOLDMAN SACHS VARIABLE INSURANCE TRUST STRATEGIC INCOME FUND
Schedule of Investments (continued)
December 31, 2014
| | | | | | | | | | | | | | |
Principal Amount | | | Interest Rate | | | Maturity Date | | | Value | |
| | Municipal Debt Obligations – (continued) | |
| Puerto Rico – (continued) | |
| Puerto Rico Sales Tax Financing Corp. RB for Capital
Appreciation First Subseries 2009 A(e) |
|
| $ | 15,000 | | | | 0.000 | % | | | 08/01/32 | | | $ | 11,408 | |
| | | | | | | | | | | | | | |
| | | | | | | | | | | | | 463,939 | |
| | |
| | TOTAL MUNICIPAL DEBT OBLIGATIONS | |
| | (Cost $475,181) | | | $ | 463,939 | |
| | |
| | | | | | | | | | | | | | |
| | Bank Loan Obligations – 4.0% | |
| Aerospace/Defense – 0.1% | |
| Transdigm, Inc. | |
| $ | 24,937 | | | | 3.750 | % | | | 06/04/21 | | | $ | 24,459 | |
| | |
| Building Materials – 0.1% | |
| HD Supply, Inc. | |
| | 24,936 | | | | 4.000 | | | | 06/28/18 | | | | 24,666 | |
| | |
| Consumer Services – 0.4% | |
| Burger King Worldwide, Inc. | |
| | 75,000 | | | | 0.000 | | | | 12/31/15 | | | | 74,678 | |
| | |
| Energy – 0.4% | |
| Magnum Hunter Resources Corp. | |
| | 74,813 | | | | 8.500 | | | | 10/22/19 | | | | 72,942 | |
| | |
| Environmental – 0.3% | |
| ADS Waste Holdings, Inc. | |
| | 49,449 | | | | 3.750 | | | | 10/09/19 | | | | 47,919 | |
| | |
| Food & Beverage – 0.2% | |
| Diamond Foods, Inc. | |
| | 24,937 | | | | 4.250 | | | | 08/20/18 | | | | 24,688 | |
| HJ Heinz Co.(a) | |
| | 21,648 | | | | 3.500 | | | | 06/05/20 | | | | 21,490 | |
| | | | | | | | | | | | | | |
| | | | | | | | | | | | | 46,178 | |
| | |
| Healthcare – 0.7% | |
| Community Health Systems, Inc. | |
| | 49,874 | | | | 4.250 | | | | 01/27/21 | | | | 49,698 | |
| HCA, Inc. | |
| | 49,874 | | | | 3.005 | | | | 05/01/18 | | | | 49,383 | |
| MPH Acquisition Holdings LLC | |
| | 24,038 | | | | 3.750 | | | | 03/31/21 | | | | 23,329 | |
| | | | | | | | | | | | | | |
| | | | | | | | | | | | | 122,410 | |
| | |
| Lodging – 0.2% | |
| Hilton Worldwide LLC | |
| | 48,077 | | | | 3.500 | | | | 10/26/20 | | | | 47,456 | |
| | |
| Media – 0.6% | |
| Checkout Holding Corp. | |
| | 24,937 | | | | 4.500 | | | | 04/09/21 | | | | 23,675 | |
| Clear Channel Communications, Inc. | |
| | 98,444 | | | | 3.819 | | | | 01/29/16 | | | | 97,312 | |
| | | | | | | | | | | | | | |
| | | | | | | | | | | | | 120,987 | |
| | |
| | Bank Loan Obligations – (continued) | |
| Restaurants – 0.1% | |
| Seminole Hard Rock Entertainment, Inc. | |
| $ | 24,937 | | | | 3.500 | % | | | 05/14/20 | | | $ | 24,002 | |
| | |
| Retailing – 0.1% | |
| Burlington Coat Factory Warehouse Corp. | |
| | 24,938 | | | | 4.250 | | | | 08/13/21 | | | | 24,579 | |
| | |
| Software & Services – 0.2% | |
| Bright Horizons Family Solutions, Inc. | |
| | 24,936 | | | | 3.750 | | | | 01/30/20 | | | | 24,516 | |
| Sabre GLBL, Inc. | |
| | 24,936 | | | | 4.000 | | | | 02/19/19 | | | | 24,455 | |
| | | | | | | | | | | | | | |
| | | | | | | | | | | | | 48,971 | |
| | |
| Technology Hardware & Equipment – 0.3% | |
| Avago Technologies Ltd. | |
| | 49,875 | | | | 3.750 | | | | 05/06/21 | | | | 49,646 | |
| | |
| Wireless Telecommunications – 0.3% | |
| Intelsat Jackson Holdings SA | |
| | 50,000 | | | | 3.750 | | | | 06/30/19 | | | | 49,187 | |
| | |
| | TOTAL BANK LOAN OBLIGATIONS | |
| | (Cost $780,674) | | | $ | 778,080 | |
| | |
| | | | | | | | | | | | | | |
| | U.S. Treasury Obligations – 30.4% | |
| United States Treasury Bonds | |
| $ | 100,000 | | | | 3.625 | % | | | 08/15/43 | | | $ | 117,680 | |
| | 300,000 | | | | 3.750 | | | | 11/15/43 | | | | 360,831 | |
| | 200,000 | | | | 3.375 | | | | 05/15/44 | | | | 225,304 | |
| United States Treasury Inflation Indexed Bonds | |
| | 101,329 | | | | 0.125 | | | | 04/15/19 | | | | 100,363 | |
| United States Treasury Inflation-Protected Securities | |
| | 109,561 | | | | 0.500 | | | | 04/15/15 | | | | 108,122 | |
| | 104,903 | | | | 0.125 | | | | 01/15/22 | | | | 102,264 | |
| | 101,877 | | | | 1.375 | | | | 02/15/44 | | | | 115,806 | |
| United States Treasury Notes | |
| | 600,000 | | | | 1.750 | | | | 09/30/19 | | | | 603,234 | |
| | 600,000 | | | | 1.500 | | | | 11/30/19 | | | | 596,112 | |
| | 500,000 | | | | 1.625 | | | | 12/31/19 | | | | 499,260 | |
| | 400,000 | | | | 2.000 | | | | 10/31/21 | | | | 400,920 | |
| | 400,000 | | | | 2.500 | | | | 05/15/24 | | | | 411,780 | |
| | 2,200,000 | | | | 2.375 | | | | 08/15/24 | | | | 2,239,358 | |
| | |
| | TOTAL U.S. TREASURY OBLIGATIONS | |
| | (Cost $5,741,084) | | | $ | 5,881,034 | |
| | |
| | TOTAL INVESTMENTS – 97.1% | |
| | (Cost $18,924,454) | | | $ | 18,803,907 | |
| | |
| OTHER ASSETS IN EXCESS OF
LIABILITIES – 2.9% |
| | | 559,003 | |
| | |
| | NET ASSETS – 100.0% | | | $ | 19,362,910 | |
| | |
| | |
| 12 | | The accompanying notes are an integral part of these financial statements. |
GOLDMAN SACHS VARIABLE INSURANCE TRUST STRATEGIC INCOME FUND
| | |
| The percentage shown for each investment category reflects the value of investments in that category as a percentage of net assets. |
| (a) | | Variable rate security. Interest rate or distribution rate disclosed is that which is in effect at December 31, 2014. |
| (b) | | Securities with “Call” features. Maturity dates disclosed are the final maturity dates. |
| (c) | | Exempt from registration under Rule 144A of the Securities Act of 1933. Under procedures approved by the Board of Trustees, such securities have been determined to be liquid by the Investment Adviser and may be resold, normally to qualified institutional buyers in transactions exempt from registration. Total market value of Rule 144A securities amounts to $3,369,105, which represents approximately 17.4% of net assets as of December 31, 2014. |
| (d) | | Issued with a zero coupon. Income is recognized through the accretion of discount. |
| (e) | | Zero coupon bond until next reset date. |
| | |
| Investment Abbreviations: |
| BA | | —Banker Acceptance Rate |
| BBR | | —Bank Bill Reference Rate |
| CD KSDA | | —Certificates of Deposit by the Korean Securities Dealers Association |
| EURIBOR | | —Euro Interbank Offered Rate |
| FHLMC | | —Federal Home Loan Mortgage Corp. |
| FNMA | | —Federal National Mortgage Association |
| GO | | —General Obligation |
| LIBOR | | —London Interbank Offered Rate |
| RB | | —Revenue Bond |
| WIBOR | | —Warsaw Interbank Offered Rate |
|
| Currency Abbreviations: |
| AUD | | —Australian Dollar |
| BRL | | —Brazilian Real |
| CAD | | —Canadian Dollar |
| CHF | | —Swiss Franc |
| CLP | | —Chilean Peso |
| CNH | | —Chinese Renminbi |
| COP | | —Colombian Peso |
| EUR | | —Euro |
| GBP | | —British Pound |
| HUF | | —Hungarian Forint |
| IDR | | —Indonesian Rupiah |
| INR | | —Indian Rupee |
| JPY | | —Japanese Yen |
| KRW | | —South Korean Won |
| MXN | | —Mexican Peso |
| MYR | | —Malaysian Ringgit |
| NOK | | —Norwegian Krone |
| NZD | | —New Zealand Dollar |
| PHP | | —Philippines peso |
| PLN | | —Polish Zloty |
| RUB | | —Russian Ruble |
| SEK | | —Swedish Krona |
| SGD | | —Singapore Dollar |
| TRY | | —Turkish Lira |
| USD | | —United States Dollar |
| ZAR | | —South African Rand |
| | |
| The accompanying notes are an integral part of these financial statements. | | 13 |
GOLDMAN SACHS VARIABLE INSURANCE TRUST STRATEGIC INCOME FUND
Schedule of Investments (continued)
December 31, 2014
ADDITIONAL INVESTMENT INFORMATION
FORWARD FOREIGN CURRENCY EXCHANGE CONTRACTS — At December 31, 2014, the Fund had the following forward foreign currency exchange contracts:
FORWARD FOREIGN CURRENCY EXCHANGE CONTRACTS WITH UNREALIZED GAIN
| | | | | | | | | | | | |
| Counterparty | | Contracts to
Buy/Sell | | Settlement
Date | | Current
Value | | | Unrealized
Gain | |
| Bank of America, N.A. | | EUR/HUF | | 03/18/15 | | $ | 60,543 | | | $ | 510 | |
| | GBP/USD | | 01/09/15 | | | 108,087 | | | | 263 | |
| | IDR/USD | | 01/20/15 | | | 26,202 | | | | 1,402 | |
| | JPY/USD | | 03/18/15 | | | 31,360 | | | | 360 | |
| | NOK/EUR | | 03/18/15 | | | 30,300 | | | | 28 | |
| | NZD/USD | | 03/18/15 | | | 62,354 | | | | 15 | |
| | USD/AUD | | 03/18/15 | | | 121,821 | | | | 2,784 | |
| | USD/CHF | | 03/18/15 | | | 359,361 | | | | 5,876 | |
| | USD/COP | | 01/09/15 | | | 38,448 | | | | 2,782 | |
| | USD/EUR | | 03/18/15 | | | 216,742 | | | | 6,440 | |
| | USD/JPY | | 03/18/15 | | | 123,987 | | | | 1,013 | |
| | USD/NZD | | 03/18/15 | | | 95,743 | | | | 793 | |
| Barclays Bank PLC | | CAD/USD | | 03/18/15 | | | 63,102 | | | | 102 | |
| | CNH/USD | | 03/18/15 | | | 63,833 | | | | 252 | |
| | EUR/PLN | | 03/18/15 | | | 61,753 | | | | 719 | |
| | GBP/EUR | | 03/18/15 | | | 126,157 | | | | 1,439 | |
| | JPY/USD | | 03/18/15 | | | 31,202 | | | | 202 | |
| | NOK/EUR | | 03/18/15 | | | 32,082 | | | | 1,811 | |
| | USD/AUD | | 03/18/15 | | | 115,591 | | | | 5,943 | |
| | USD/CNH | | 03/18/15 | | | 124,060 | | | | 940 | |
| | USD/EUR | | 03/18/15 | | | 66,199 | | | | 1,845 | |
| | USD/MYR | | 01/09/15 | | | 18,775 | | | | 42 | |
| | USD/SEK | | 02/12/15 | | | 57,689 | | | | 1,460 | |
| | USD/SGD | | 03/18/15 | | | 59,300 | | | | 1,224 | |
| | USD/ZAR | | 03/18/15 | | | 30,462 | | | | 538 | |
| BNP Paribas SA | | EUR/NOK | | 03/18/15 | | | 60,543 | | | | 2,050 | |
| | GBP/EUR | | 03/18/15 | | | 248,877 | | | | 3,074 | |
| | MYR/USD | | 01/20/15 | | | 31,046 | | | | 46 | |
| | USD/CHF | | 03/18/15 | | | 197,017 | | | | 5,363 | |
| | USD/EUR | | 03/18/15 | | | 184,049 | | | | 3,934 | |
| | USD/JPY | | 03/18/15 | | | 154,873 | | | | 2,127 | |
| Citibank, N.A. | | NZD/USD | | 01/08/15 | | | 45,660 | | | | 211 | |
| | USD/BRL | | 01/13/15 | | | 28,224 | | | | 587 | |
| | USD/BRL | | 01/15/15 | | | 31,081 | | | | 427 | |
| | USD/BRL | | 01/23/15 | | | 263,940 | | | | 11,989 | |
| | USD/CAD | | 03/18/15 | | | 153,479 | | | | 2,521 | |
| | USD/CHF | | 03/18/15 | | | 200,622 | | | | 3,424 | |
| | USD/CNH | | 03/18/15 | | | 101,421 | | | | 790 | |
| | USD/EUR | | 01/28/15 | | | 2,563,820 | | | | 53,494 | |
| | USD/GBP | | 01/09/15 | | | 188,620 | | | | 1,118 | |
| | |
| 14 | | The accompanying notes are an integral part of these financial statements. |
GOLDMAN SACHS VARIABLE INSURANCE TRUST STRATEGIC INCOME FUND
ADDITIONAL INVESTMENT INFORMATION (continued)
FORWARD FOREIGN CURRENCY EXCHANGE CONTRACTS WITH UNREALIZED GAIN (continued)
| | | | | | | | | | | | |
| Counterparty | | Contracts to
Buy/Sell | | Settlement
Date | | Current
Value | | | Unrealized
Gain | |
| Citibank, N.A. (continued) | | USD/JPY | | 01/15/15 | | $ | 66,852 | | | $ | 248 | |
| | USD/JPY | | 03/18/15 | | | 184,213 | | | | 3,787 | |
| | USD/MYR | | 01/09/15 | | | 31,161 | | | | 151 | |
| | USD/RUB | | 01/26/15 | | | 25,820 | | | | 3,180 | |
| | ZAR/USD | | 03/18/15 | | | 31,636 | | | | 136 | |
| Deutsche Bank AG | | BRL/USD | | 01/09/15 | | | 32,251 | | | | 1,251 | |
| | CNH/USD | | 03/18/15 | | | 358,860 | | | | 1,240 | |
| | EUR/HUF | | 03/18/15 | | | 36,340 | | | | 332 | |
| | IDR/USD | | 01/20/15 | | | 32,707 | | | | 1,707 | |
| | JPY/USD | | 03/18/15 | | | 63,020 | | | | 20 | |
| | MXN/USD | | 03/18/15 | | | 63,148 | | | | 148 | |
| | NOK/EUR | | 03/18/15 | | | 125,663 | | | | 4,577 | |
| | USD/AUD | | 03/18/15 | | | 153,495 | | | | 1,690 | |
| | USD/CNH | | 03/18/15 | | | 492,778 | | | | 3,380 | |
| | USD/EUR | | 03/18/15 | | | 228,843 | | | | 6,450 | |
| | USD/MXN | | 01/20/15 | | | 536,044 | | | | 12,493 | |
| | USD/MXN | | 03/18/15 | | | 220,341 | | | | 531 | |
| | USD/MYR | | 01/09/15 | | | 93,534 | | | | 1,466 | |
| | USD/SGD | | 03/18/15 | | | 183,232 | | | | 2,058 | |
| | USD/TRY | | 03/18/15 | | | 29,591 | | | | 1,409 | |
| | USD/ZAR | | 03/18/15 | | | 95,461 | | | | 2,253 | |
| Morgan Stanley Co., Inc. | | BRL/USD | | 01/09/15 | | | 31,920 | | | | 920 | |
| | BRL/USD | | 01/15/15 | | | 64,084 | | | | 1,084 | |
| | RUB/USD | | 01/20/15 | | | 100,315 | | | | 5,815 | |
| | USD/BRL | | 01/09/15 | | | 30,474 | | | | 526 | |
| | USD/BRL | | 01/15/15 | | | 31,378 | | | | 122 | |
| | USD/EUR | | 03/18/15 | | | 30,271 | | | | 973 | |
| | USD/RUB | | 01/20/15 | | | 24,568 | | | | 432 | |
| | USD/TRY | | 03/18/15 | | | 121,711 | | | | 3,289 | |
| | ZAR/USD | | 03/18/15 | | | 31,480 | | | | 480 | |
| Royal Bank of Canada | | BRL/USD | | 01/09/15 | | | 65,022 | | | | 2,022 | |
| | BRL/USD | | 01/16/15 | | | 253,508 | | | | 1,508 | |
| | CAD/USD | | 03/18/15 | | | 63,030 | | | | 30 | |
| | USD/BRL | | 01/09/15 | | | 89,770 | | | | 2,793 | |
| | USD/BRL | | 01/12/15 | | | 31,120 | | | | 380 | |
| | USD/CAD | | 03/18/15 | | | 214,733 | | | | 4,267 | |
| | USD/MXN | | 01/29/15 | | | 75,800 | | | | 7,065 | |
| | USD/MYR | | 01/09/15 | | | 26,532 | | | | 124 | |
| Royal Bank of Scotland | | AUD/USD | | 03/18/15 | | | 62,535 | | | | 46 | |
| | USD/AUD | | 03/18/15 | | | 118,573 | | | | 5,332 | |
| | USD/JPY | | 03/18/15 | | | 125,211 | | | | 789 | |
| | USD/MXN | | 01/20/15 | | | 323,127 | | | | 14,649 | |
| | |
| The accompanying notes are an integral part of these financial statements. | | 15 |
GOLDMAN SACHS VARIABLE INSURANCE TRUST STRATEGIC INCOME FUND
Schedule of Investments (continued)
December 31, 2014
ADDITIONAL INVESTMENT INFORMATION (continued)
FORWARD FOREIGN CURRENCY EXCHANGE CONTRACTS WITH UNREALIZED GAIN (continued)
| | | | | | | | | | | | |
| Counterparty | | Contracts to
Buy/Sell | | Settlement
Date | | Current
Value | | | Unrealized
Gain | |
| State Street Bank | | CAD/CHF | | 03/18/15 | | $ | 52,017 | | | $ | 448 | |
| | JPY/EUR | | 03/18/15 | | | 127,962 | | | | 3,244 | |
| | USD/CAD | | 03/18/15 | | | 174,735 | | | | 3,340 | |
| | USD/CHF | | 03/18/15 | | | 157,009 | | | | 4,366 | |
| | USD/CNH | | 03/18/15 | | | 101,961 | | | | 803 | |
| | USD/JPY | | 03/18/15 | | | 125,041 | | | | 959 | |
| | USD/MXN | | 03/18/15 | | | 61,028 | | | | 1,972 | |
| | USD/NZD | | 03/18/15 | | | 91,184 | | | | 365 | |
| UBS AG | | BRL/USD | | 01/16/15 | | | 14,053 | | | | 53 | |
| | BRL/USD | | 01/26/15 | | | 32,606 | | | | 606 | |
| | CNH/USD | | 03/18/15 | | | 64,283 | | | | 283 | |
| | EUR/NOK | | 03/18/15 | | | 60,543 | | | | 1,992 | |
| | NZD/USD | | 03/18/15 | | | 125,482 | | | | 722 | |
| | USD/BRL | | 01/09/15 | | | 59,736 | | | | 1,936 | |
| | USD/BRL | | 01/13/15 | | | 30,521 | | | | 479 | |
| | USD/BRL | | 01/15/15 | | | 61,899 | | | | 1,311 | |
| | USD/BRL | | 01/16/15 | | | 91,539 | | | | 3,010 | |
| | USD/BRL | | 01/23/15 | | | 31,943 | | | | 57 | |
| | USD/CAD | | 03/18/15 | | | 122,340 | | | | 2,660 | |
| | USD/CHF | | 03/18/15 | | | 220,893 | | | | 5,418 | |
| | USD/CNH | | 03/18/15 | | | 214,732 | | | | 1,540 | |
| | USD/COP | | 01/09/15 | | | 54,786 | | | | 1,534 | |
| | USD/PLN | | 03/18/15 | | | 60,814 | | | | 3,251 | |
| | USD/ZAR | | 03/18/15 | | | 30,781 | | | | 219 | |
| | ZAR/USD | | 03/18/15 | | | 31,369 | | | | 369 | |
| Westpac Banking Corp. | | NZD/USD | | 03/18/15 | | | 62,741 | | | | 116 | |
| | USD/AUD | | 03/18/15 | | | 30,049 | | | | 1,033 | |
| | USD/EUR | | 01/28/15 | | | 733,982 | | | | 18,356 | |
| | USD/EUR | | 03/18/15 | | | 372,062 | | | | 6,782 | |
| | | USD/SGD | | 03/18/15 | | | 63,188 | | | | 1,387 | |
| TOTAL | | | | | | | | | | $ | 299,702 | |
FORWARD FOREIGN CURRENCY EXCHANGE CONTRACTS WITH UNREALIZED LOSS
| | | | | | | | | | | | |
| Counterparty | | Contracts to
Buy/Sell | | Settlement
Date | | Current
Value | | | Unrealized
Loss | |
| Bank of America, N.A. | | COP/USD | | 01/09/15 | | $ | 61,364 | | | $ | (1,635 | ) |
| | EUR/USD | | 03/18/15 | | | 121,691 | | | | (3,544 | ) |
| | NZD/USD | | 03/18/15 | | | 61,192 | | | | (575 | ) |
| | USD/IDR | | 01/20/15 | | | 31,784 | | | | (784 | ) |
| | USD/NZD | | 03/18/15 | | | 280,226 | | | | (3,998 | ) |
| | |
| 16 | | The accompanying notes are an integral part of these financial statements. |
GOLDMAN SACHS VARIABLE INSURANCE TRUST STRATEGIC INCOME FUND
ADDITIONAL INVESTMENT INFORMATION (continued)
FORWARD FOREIGN CURRENCY EXCHANGE CONTRACTS WITH UNREALIZED LOSS (continued)
| | | | | | | | | | | | |
| Counterparty | | Contracts to
Buy/Sell | | Settlement
Date | | Current
Value | | | Unrealized
Loss | |
| Barclays Bank PLC | | AUD/USD | | 03/18/15 | | $ | 52,789 | | | $ | (711 | ) |
| | CHF/USD | | 03/18/15 | | | 94,305 | | | | (695 | ) |
| | EUR/GBP | | 03/18/15 | | | 126,320 | | | | (775 | ) |
| | HUF/USD | | 03/18/15 | | | 59,419 | | | | (3,824 | ) |
| | JPY/USD | | 03/18/15 | | | 61,795 | | | | (1,205 | ) |
| | MYR/USD | | 01/20/15 | | | 62,954 | | | | (46 | ) |
| | USD/IDR | | 01/20/15 | | | 25,867 | | | | (867 | ) |
| | USD/PHP | | 01/13/15 | | | 34,066 | | | | (137 | ) |
| BNP Paribas SA | | EUR/JPY | | 03/18/15 | | | 61,753 | | | | (1,335 | ) |
| | EUR/USD | | 03/18/15 | | | 437,930 | | | | (7,772 | ) |
| | HUF/USD | | 03/18/15 | | | 64,056 | | | | (4,057 | ) |
| | JPY/USD | | 03/18/15 | | | 278,482 | | | | (3,518 | ) |
| | NOK/USD | | 03/18/15 | | | 48,113 | | | | (4,604 | ) |
| | USD/GBP | | 03/18/15 | | | 127,731 | | | | (469 | ) |
| Citibank, N.A. | | AUD/USD | | 03/18/15 | | | 115,591 | | | | (6,014 | ) |
| | CAD/USD | | 03/18/15 | | | 177,458 | | | | (5,541 | ) |
| | EUR/NOK | | 03/18/15 | | | 60,543 | | | | (1,544 | ) |
| | EUR/USD | | 01/28/15 | | | 38,730 | | | | (1,340 | ) |
| | EUR/USD | | 03/18/15 | | | 306,346 | | | | (7,176 | ) |
| | INR/USD | | 01/12/15 | | | 34,531 | | | | (552 | ) |
| | JPY/USD | | 03/18/15 | | | 62,413 | | | | (587 | ) |
| | NOK/EUR | | 03/18/15 | | | 29,698 | | | | (573 | ) |
| | TRY/USD | | 03/18/15 | | | 64,875 | | | | (2,813 | ) |
| | USD/IDR | | 01/16/15 | | | 31,375 | | | | (375 | ) |
| Deutsche Bank AG | | CNH/USD | | 03/18/15 | | | 156,874 | | | | (126 | ) |
| | EUR/NOK | | 03/18/15 | | | 31,482 | | | | (86 | ) |
| | EUR/USD | | 03/18/15 | | | 126,303 | | | | (427 | ) |
| | HUF/USD | | 03/18/15 | | | 59,293 | | | | (3,374 | ) |
| | MXN/USD | | 03/18/15 | | | 93,763 | | | | (237 | ) |
| | MYR/USD | | 01/20/15 | | | 30,977 | | | | (23 | ) |
| | PLN/EUR | | 03/18/15 | | | 60,055 | | | | (1,698 | ) |
| | PLN/USD | | 03/18/15 | | | 59,518 | | | | (3,482 | ) |
| | RUB/USD | | 01/26/15 | | | 23,821 | | | | (7,179 | ) |
| | USD/CLP | | 01/09/15 | | | 31,240 | | | | (240 | ) |
| | USD/IDR | | 01/20/15 | | | 32,030 | | | | (1,030 | ) |
| | USD/KRW | | 01/09/15 | | | 31,546 | | | | (546 | ) |
| | USD/KRW | | 01/15/15 | | | 62,532 | | | | (532 | ) |
| | USD/PHP | | 01/12/15 | | | 25,736 | | | | (174 | ) |
| | USD/TRY | | 03/18/15 | | | 63,419 | | | | (1,419 | ) |
| | ZAR/USD | | 03/18/15 | | | 60,945 | | | | (2,829 | ) |
| Merrill Lynch & Co., Inc. | | TRY/USD | | 03/18/15 | | | 82,857 | | | | (3,250 | ) |
| Morgan Stanley Co., Inc. | | INR/USD | | 01/27/15 | | | 61,968 | | | | (1,032 | ) |
| | JPY/USD | | 03/18/15 | | | 62,102 | | | | (898 | ) |
| | |
| The accompanying notes are an integral part of these financial statements. | | 17 |
GOLDMAN SACHS VARIABLE INSURANCE TRUST STRATEGIC INCOME FUND
Schedule of Investments (continued)
December 31, 2014
ADDITIONAL INVESTMENT INFORMATION (continued)
FORWARD FOREIGN CURRENCY EXCHANGE CONTRACTS WITH UNREALIZED LOSS (continued)
| | | | | | | | | | | | |
| Counterparty | | Contracts to
Buy/Sell | | Settlement
Date | | Current
Value | | | Unrealized
Loss | |
Morgan Stanley Co., Inc. (continued) | | TRY/USD | | 03/18/15 | | $ | 61,659 | | | $ | (2,527 | ) |
| | USD/BRL | | 01/16/15 | | | 62,842 | | | | (842 | ) |
| | USD/RUB | | 01/20/15 | | | 37,422 | | | | (1,772 | ) |
| Royal Bank of Canada | | CAD/USD | | 03/18/15 | | | 185,933 | | | | (3,067 | ) |
| | JPY/USD | | 03/18/15 | | | 62,431 | | | | (569 | ) |
| | MXN/USD | | 03/18/15 | | | 58,488 | | | | (3,042 | ) |
| | TRY/USD | | 03/18/15 | | | 58,861 | | | | (2,193 | ) |
| Royal Bank of Scotland | | EUR/USD | | 03/18/15 | | | 30,271 | | | | (819 | ) |
| | INR/USD | | 01/15/15 | | | 116,781 | | | | (2,115 | ) |
| | INR/USD | | 01/27/15 | | | 61,216 | | | | (1,284 | ) |
| | USD/TRY | | 03/18/15 | | | 50,077 | | | | (1,077 | ) |
| State Street Bank | | GBP/USD | | 03/18/15 | | | 125,480 | | | | (635 | ) |
| | JPY/USD | | 01/15/15 | | | 53,332 | | | | (207 | ) |
| | MXN/USD | | 03/18/15 | | | 206,854 | | | | (2,855 | ) |
| UBS AG | | CAD/USD | | 03/18/15 | | | 178,330 | | | | (5,733 | ) |
| | CLP/USD | | 01/09/15 | | | 59,828 | | | | (1,068 | ) |
| | EUR/JPY | | 03/18/15 | | | 30,877 | | | | (703 | ) |
| | EUR/NOK | | 03/18/15 | | | 31,482 | | | | (168 | ) |
| | EUR/USD | | 01/28/15 | | | 75,691 | | | | (1,080 | ) |
| | TRY/USD | | 03/18/15 | | | 60,274 | | | | (2,633 | ) |
| Westpac Banking Corp. | | EUR/USD | | 01/28/15 | | | 36,620 | | | | (1,022 | ) |
| | NZD/USD | | 03/18/15 | | | 52,672 | | | | (56 | ) |
| | SEK/USD | | 02/12/15 | | | 29,721 | | | | (650 | ) |
| | USD/NZD | | 01/08/15 | | | 31,255 | | | | (153 | ) |
| | | USD/NZD | | 03/18/15 | | | 151,646 | | | | (1,015 | ) |
| TOTAL | | | $ | (132,933 | ) |
| | |
| 18 | | The accompanying notes are an integral part of these financial statements. |
GOLDMAN SACHS VARIABLE INSURANCE TRUST STRATEGIC INCOME FUND
ADDITIONAL INVESTMENT INFORMATION (continued)
FUTURES CONTRACTS — At December 31, 2014, the Fund had the following futures contracts:
| | | | | | | | | | | | | | |
| Type | | Number of
Contracts
Long (Short) | | | Expiration Date | | Current Value | | | Unrealized
Gain (Loss) | |
| 90 Day Eurodollar | | | 12 | | | June 2015 | | $ | 2,986,950 | | | $ | 686 | |
| 90 Day Eurodollar | | | 6 | | | September 2015 | | | 1,490,250 | | | | 725 | |
| Euro-OAT Future | | | (3 | ) | | March 2015 | | | (534,431 | ) | | | (8,116 | ) |
| U.S. Long Bond | | | (1 | ) | | March 2015 | | | (144,563 | ) | | | 360 | |
| U.S. Ultra Long Treasury Bonds | | | (4 | ) | | March 2015 | | | (660,750 | ) | | | (16,769 | ) |
| 2 Year U.S. Treasury Notes | | | (8 | ) | | March 2015 | | | (1,748,750 | ) | | | 2,643 | |
| 5 Year U.S. Treasury Notes | | | 7 | | | March 2015 | | | 832,508 | | | | 1,387 | |
10 Year U.S. Treasury Notes | | | (7 | ) | | March 2015 | | | (887,578 | ) | | | 2,377 | |
| TOTAL | | | | | | | | | | | | $ | (16,707 | ) |
SWAP CONTRACTS — At December 31, 2014, the Fund had the following swap contracts:
CENTRALLY CLEARED CREDIT DEFAULT SWAP CONTRACTS
| | | | | | | | | | | | | | | | | | | | | | | | |
| | | | | | | | | | | | | | | Market Value | |
| Referenced Obligation | | Notional
Amount
(000’s) | | | Rates Received
(Paid) | | | Termination
Date | | | Credit
Spread at
December 31,
2014(a) | | | Upfront
Payments
Made (Received) | | | Unrealized
Gain (Loss) | |
| Protection Sold: | | | | | | | | | | | | | | | | | | | | | | | | |
| CDX North America High Yield Index | | | $1,675 | | | | 5.000% | | | | 12/20/19 | | | | 3.557 | % | | $ | 72,970 | | | $ | 33,895 | |
CDX North America Investment Grade Index | | | 3,600 | | | | 1.000 | | | | 12/20/19 | | | | 0.661 | | | | 60,186 | | | | (1,282 | ) |
| TOTAL | | | | | | | | | | | | | | | | | | $ | 133,156 | | | $ | 32,613 | |
| (a) | Credit spread on the Referenced Obligation, together with the period of expiration, are indicators of payment/performance risk. The likelihood of a credit event occurring which would require a fund to make a payment or otherwise be required to perform under the swap contract is generally greater as the credit spread and term of the swap contract increase. |
| | |
| The accompanying notes are an integral part of these financial statements. | | 19 |
GOLDMAN SACHS VARIABLE INSURANCE TRUST STRATEGIC INCOME FUND
Schedule of Investments (continued)
December 31, 2014
ADDITIONAL INVESTMENT INFORMATION (continued)
OVER THE COUNTER CREDIT DEFAULT SWAP CONTRACTS
| | | | | | | | | | | | | | | | | | | | | | | | | | |
| | | | | | | | | | | | | | | | | Market Value | |
| Counterparty | | Referenced Obligation | | Notional
Amount
(000’s) | | | Rates Received
(Paid) | | | Termination
Date | | | Credit
Spread at
December 31,
2014 | | | Upfront
Payments
Made (Received) | | | Unrealized
Gain (Loss) | |
| Protection Purchased: | | | | | | | | | | | | | | | | | | | | | | | | | | |
| Bank of America, N.A. | | People’s Republic of China,
7.500%, 10/28/27 | | $ | 180 | | | | (1.000 | )% | | | 06/20/19 | | | | 0.720 | % | | $ | (1,021 | ) | | $ | (1,270 | ) |
| | | | | 30 | | | | (1.000 | ) | | | 06/20/19 | | | | 0.720 | | | | (178 | ) | | | (204 | ) |
| JPMorgan Chase Bank, N.A. | | People’s Republic of China,
7.500%, 10/28/27 | | | 50 | | | | (1.000 | ) | | | 06/20/19 | | | | 0.720 | | | | (307 | ) | | | (330 | ) |
| | | | | | 1,200 | | | | (1.000 | ) | | | 06/20/19 | | | | 0.720 | | | | (5,064 | ) | | | (10,215 | ) |
| TOTAL | | | | | | | | | | | | | | | | | | | | $ | (6,570 | ) | | $ | (12,019 | ) |
CENTRALLY CLEARED INTEREST RATE SWAP CONTRACTS
| | | | | | | | | | | | | | | | |
| | | | | | Rates Exchanged | | Market Value | |
Notional
Amount
(000’s) | | | Termination
Date | | Payments
Received | | Payments
Made | | Upfront
Payments
Made (Received) | | | Unrealized
Gain (Loss) | |
| $ | 1,600 | (a) | | 08/04/17 | | 3 Month LIBOR | | 2.195% | | $ | (2,502 | ) | | $ | (3,065 | ) |
| GBP | 570 | (a) | | 09/12/17 | | 6 Month LIBOR | | 2.250 | | | 1,260 | | | | (8,349 | ) |
| $ | 300 | (a) | | 03/18/18 | | 3 Month LIBOR | | 1.500 | | | (988 | ) | | | 395 | |
| PLN | 90 | | | 06/17/19 | | 3.048% | | 6 Month WIBOR | | | 471 | | | | 1,156 | |
| | 90 | | | 06/17/19 | | 6 Month WIBOR | | 3.045 | | | — | | | | (1,623 | ) |
| AUD | 550 | | | 12/17/19 | | 6 Month BBR | | 3.750 | | | (7,030 | ) | | | (15,938 | ) |
| NZD | 710 | | | 12/17/19 | | 4.500 | | 3 Month BBR | | | (1,503 | ) | | | 14,988 | |
| EUR | 280 | (a) | | 03/18/20 | | 0.750 | | 6 Month EURIBOR | | | 5,726 | | | | 490 | |
| $ | 3,240 | (a) | | 03/18/20 | | 3 Month LIBOR | | 2.250 | | | (71,485 | ) | | | 12,578 | |
| | 2,200 | (a) | | 08/04/21 | | 3.025 | | 3 Month LIBOR | | | 24,880 | | | | 35,553 | |
| GBP | 570 | (a) | | 09/12/21 | | 2.680 | | 6 Month LIBOR | | | (7,400 | ) | | | 41,274 | |
| EUR | 110 | (a) | | 03/18/22 | | 6 Month EURIBOR | | 1.250 | | | (5,477 | ) | | | (908 | ) |
| JPY | 100,430 | (a) | | 03/18/22 | | 6 Month LIBOR | | 0.500 | | | (7,307 | ) | | | (1,737 | ) |
| $ | 3,600 | (a) | | 03/18/22 | | 3 Month LIBOR | | 2.500 | | | (112,842 | ) | | | 23,769 | |
| AUD | 790 | (a) | | 09/17/24 | | 4.500 | | 6 Month BBR | | | 4,262 | | | | 18,258 | |
| GBP | 490 | (a) | | 09/17/24 | | 6 Month LIBOR | | 3.250 | | | (10,920 | ) | | | (23,997 | ) |
| EUR | 790 | (a) | | 12/18/24 | | 6 Month EURIBOR | | 2.000 | | | 951 | | | | (34,795 | ) |
| GBP | 580 | (a) | | 12/18/24 | | 3.250 | | 6 Month LIBOR | | | 4,970 | | | | 35,393 | |
| AUD | 560 | (a) | | 03/18/25 | | 3.500 | | 6 Month BBR | | | 4,999 | | | | 8,374 | |
| CAD | 1,020 | (a) | | 03/18/25 | | 2.500 | | 3 Month BA | | | 3,365 | | | | 11,574 | |
| EUR | 730 | (a) | | 03/18/25 | | 6 Month EURIBOR | | 1.500 | | | (44,939 | ) | | | (11,990 | ) |
| GBP | 630 | (a) | | 03/18/25 | | 6 Month LIBOR | | 3.000 | | | (78,347 | ) | | | (24,993 | ) |
| $ | 260 | (a) | | 03/18/25 | | 3 Month LIBOR | | 3.000 | | | (16,189 | ) | | | 767 | |
| | 1,200 | (a) | | 08/04/26 | | 3 Month LIBOR | | 3.409 | | | (29,252 | ) | | | (47,667 | ) |
| GBP | 310 | (a) | | 09/12/26 | | 6 Month LIBOR | | 2.980 | | | 4,830 | | | | (42,509 | ) |
| $ | 2,700 | (a) | | 03/18/30 | | 3 Month LIBOR | | 3.250 | | | (261,901 | ) | | | 22,054 | |
| EUR | 20 | (a) | | 03/18/45 | | 6 Month EURIBOR | | 2.250 | | | (4,461 | ) | | | (342 | ) |
| GBP | 330 | (a) | | 03/18/45 | | 6 Month LIBOR | | 3.250 | | | (81,561 | ) | | | (37,443 | ) |
| | |
| 20 | | The accompanying notes are an integral part of these financial statements. |
GOLDMAN SACHS VARIABLE INSURANCE TRUST STRATEGIC INCOME FUND
ADDITIONAL INVESTMENT INFORMATION (continued)
CENTRALLY CLEARED INTEREST RATE SWAP CONTRACTS (continued)
| | | | | | | | | | | | | | | | | | |
| | | | | | | Rates Exchanged | | Market Value | |
Notional
Amount
(000’s) | | | Termination
Date | | | Payments
Received | | Payments
Made | | Upfront
Payments
Made (Received) | | | Unrealized
Gain (Loss) | |
| JPY | 39,650 | (a) | | | 03/18/45 | | | 1.500 | | 6 Month LIBOR | | $ | (420 | ) | | $ | 13,894 | |
| $ | 200 | (a) | | | 03/18/45 | | | 3.500 | | 3 Month LIBOR | | | 31,098 | | | | 1,670 | |
| | TOTAL | | | | | | | | | | | $ | (657,712 | ) | | $ | (13,169 | ) |
| (a) | Represents forward starting interest rate swaps whose effective dates of commencement of accruals and cash flows occur subsequent to December 31, 2014. |
OVER THE COUNTER INTEREST RATE SWAP CONTRACTS
| | | | | | | | | | | | | | |
| | | | | | | | Rates Exchanged | | | |
| | | | | |
| Counterparty | | Notional
Amount
(000’s) | | | Termination
Date | | Payments
Received | | Payments
Made | | Unrealized
Gain (Loss)(b) | |
| Bank of America, N.A. | | KRW | 290,710 | | | 11/04/17 | | 2.060% | | 3 Month CD KSDA | | $ | (292 | ) |
| | | 693,840 | | | 08/06/24 | | 3 Month CD KSDA | | 2.970% | | | (30,275 | ) |
| Deutsche Bank AG | | KRW | 142,230 | | | 10/06/17 | | 2.245 | | 3 Month CD KSDA | | | 494 | |
| | | 209,280 | | | 10/15/17 | | 2.253 | | 3 Month CD KSDA | | | 799 | |
| | | | 173,640 | | | 11/04/17 | | 2.075 | | 3 Month CD KSDA | | | (105 | ) |
| TOTAL | | | | | | | | | | | | $ | (29,379 | ) |
| (b) | Unrealized gain (loss) is equal to the market value of contracts. |
| | |
| The accompanying notes are an integral part of these financial statements. | | 21 |
GOLDMAN SACHS VARIABLE INSURANCE TRUST STRATEGIC INCOME FUND
Statement of Assets and Liabilities
December 31, 2014
| | | | |
| | | | |
| Assets: | | | |
Investments, at value (cost $18,924,454) | | $ | 18,803,907 | |
Cash | | | 70,013 | |
Foreign currencies, at value (cost $89,998 ) | | | 90,350 | |
Receivables: | | | | |
Collateral on certain derivative contracts(a) | | | 518,649 | |
Unrealized gain on forward foreign currency exchange contracts | | | 299,702 | |
Interest | | | 144,082 | |
Investments sold | | | 100,000 | |
Unrealized gain on swap contracts | | | 1,293 | |
Deferred offering costs | | | 41,397 | |
| Total assets | | | 20,069,393 | |
| | | | |
| | | | |
| Liabilities: | | | |
Payables: | | | | |
Investments purchased | | | 345,435 | |
Unrealized loss on forward foreign currency exchange contracts | | | 132,933 | |
Amounts owed to affiliates | | | 44,725 | |
Unrealized loss on swap contracts | | | 42,691 | |
Variation margin on certain derivative contracts | | | 19,728 | |
Management fees | | | 9,764 | |
Upfront payments received on swap contracts | | | 6,570 | |
Distribution and Service fees and Transfer Agent fees | | | 717 | |
Accrued expenses and other liabilities | | | 103,920 | |
| Total liabilities | | | 706,483 | |
| | | | |
| | | | |
| Net Assets: | | | |
Paid-in capital | | | 19,939,522 | |
Undistributed net investment income | | | 62,465 | |
Accumulated net realized loss | | | (642,010 | ) |
Net unrealized gain | | | 2,933 | |
| NET ASSETS | | $ | 19,362,910 | |
Net Assets: | | | | |
Institutional | | $ | 18,179,501 | |
Service | | | 9,930 | |
Advisor | | | 1,173,479 | |
Total Net Assets | | $ | 19,362,910 | |
Shares outstanding $0.001 par value (unlimited shares authorized): | | | | |
Institutional | | | 1,874,039 | |
Service | | | 1,024 | |
Advisor | | | 121,148 | |
Net asset value, offering and redemption price per share: | | | | |
Institutional | | | $9.70 | |
Service | | | 9.70 | |
Advisor | | | 9.69 | |
(a) Segregated for initial margin of $35,504 on futures contracts and $483,145 on swaps transactions.
| | |
| 22 | | The accompanying notes are an integral part of these financial statements. |
GOLDMAN SACHS VARIABLE INSURANCE TRUST STRATEGIC INCOME FUND
Statement of Operations
For the Period Ended December 31, 2014(a)
| | | | |
| | | | |
| Investment income: | |
| |
Interest | | $ | 281,496 | |
| | | | |
| | | | |
| Expenses: | | | |
Offering costs | | | 103,892 | |
Professional fees | | | 98,929 | |
Management fees | | | 80,459 | |
Custody, accounting and administrative services | | | 44,763 | |
Printing and mailing costs | | | 27,021 | |
Trustee fees | | | 14,813 | |
Organization costs | | | 12,000 | |
Transfer Agent fees(b) | | | 2,686 | |
Distribution and Service fees(b) | | | 1,414 | |
Other | | | 6,671 | |
| Total expenses | | | 392,648 | |
Less — expense reductions | | | (275,899 | ) |
| Net expenses | | | 116,749 | |
| NET INVESTMENT INCOME | | | 164,747 | |
| | | | |
| | | | |
| Realized and unrealized gain (loss): | | | |
Net realized gain (loss) from: | | | | |
Investments | | | (19,817 | ) |
Futures contracts | | | (168,734 | ) |
Swap contracts | | | (678,258 | ) |
Forward foreign currency exchange contracts | | | 655,911 | |
Foreign currency transactions | | | (69,687 | ) |
Net change in unrealized gain (loss) on: | | | | |
Investments | | | (120,547 | ) |
Futures contracts | | | (16,707 | ) |
Swap contracts | | | (21,954 | ) |
Forward foreign currency exchange contracts | | | 166,769 | |
Foreign currency translation | | | (4,628 | ) |
| Net realized and unrealized loss | | | (277,652 | ) |
| NET DECREASE IN NET ASSETS RESULTING FROM OPERATIONS | | $ | (112,905 | ) |
(a) Commenced operations on April 14, 2014.
(b) Class specific Distribution and Service and Transfer Agent fees were as follows:
| | | | | | | | | | | | | | | | | | |
| Distribution and Service Fees | | | Transfer Agent Fees | |
Service | | | Advisor | | | Institutional | | | Service | | | Advisor | |
| $ | 18 | | | $ | 1,396 | | | $ | 2,610 | | | $ | 3 | | | $ | 73 | |
| | |
| The accompanying notes are an integral part of these financial statements. | | 23 |
GOLDMAN SACHS VARIABLE INSURANCE TRUST STRATEGIC INCOME FUND
Statement of Changes in Net Assets
| | | | |
| | | For the Period Ended
December 31, 2014(a) | |
| | | | |
| From operations: | |
Net investment income | | $ | 164,747 | |
Net realized loss | | | (280,585 | ) |
Net change in unrealized gain | | | 2,933 | |
| Net decrease in net assets resulting from operations | | | (112,905 | ) |
| | | | |
| | | | |
| Distributions to shareholders: | |
From net investment income: | | | | |
Institutional Shares | | | (454,918 | ) |
Service Shares | | | (229 | ) |
Advisor Shares | | | (23,752 | ) |
| Total distributions to shareholders | | | (478,899 | ) |
| | | | |
| | | | |
| From share transactions: | |
Proceeds from sales of shares | | | 20,054,257 | |
Reinvestment of distributions | | | 478,899 | |
Cost of shares redeemed | | | (578,442 | ) |
| Net increase in net assets resulting from share transactions | | | 19,954,714 | |
| TOTAL INCREASE | | | 19,362,910 | |
| | | | |
| | | | |
| Net assets: | |
| |
Beginning of period | | | — | |
End of period | | $ | 19,362,910 | |
| Undistributed net investment income | | $ | 62,465 | |
(a) Commenced operations on April 14, 2014.
| | |
| 24 | | The accompanying notes are an integral part of these financial statements. |
GOLDMAN SACHS VARIABLE INSURANCE TRUST STRATEGIC INCOME FUND
Financial Highlights
Selected Data for a Share Outstanding Throughout Each Period
| | | | | | | | | | | | | | | | | | | | | | | | | | | | | | | | | | | | | | | | | | | | | | | | |
| | | | | | Income (loss) from
investment operations | | | | | | | | | | | | | | | | | | | |
| Year - Share Class | | Net asset value, beginning of period | | | Net investment income(a) | | | Net realized and
unrealized gain (loss) | | | Total from investment operations | | | Distributions
to shareholders
from net investment income | | | Net asset value, end of period | | | Total return(b) | | | Net assets, end of period (in 000s) | | | Ratio of net expenses to average net assets | | | Ratio of total expenses to average net assets | | | Ratio of net investment income
to average
net assets | | | Portfolio
turnover
rate(c) | |
FOR THE PERIOD ENDED DECEMBER 31, | |
2014 - Institutional (Commenced April 14, 2014) | | $ | 10.00 | | | $ | 0.09 | | | $ | (0.14 | ) | | $ | (0.05 | ) | | $ | (0.25 | ) | | $ | 9.70 | | | | (0.51 | )% | | $ | 18,180 | | | | 0.86 | %(d) | | | 2.77 | %(d) | | | 1.23 | %(d) | | | 157 | % |
2014 - Service (Commenced April 14, 2014) | | | 10.00 | | | | 0.07 | | | | (0.14 | ) | | | (0.07 | ) | | | (0.23 | ) | | | 9.70 | | | | (0.70 | ) | | | 10 | | | | 1.13 | (d) | | | 3.05 | (d) | | | 0.96 | (d) | | | 157 | |
2014 - Advisor (Commenced April 14, 2014) | | | 10.00 | | | | 0.09 | | | | (0.17 | ) | | | (0.08 | ) | | | (0.23 | ) | | | 9.69 | | | | (0.79 | ) | | | 1,173 | | | | 1.26 | (d) | | | 2.64 | (d) | | | 1.30 | (d) | | | 157 | |
| (a) | Calculated based on the average shares outstanding methodology. |
| (b) | Assumes investment at the net asset value at the beginning of the period, reinvestment of all distributions, and a complete redemption of the investment at the net asset value at the end of the period. Total returns for periods less than one full year are not annualized. |
| (c) | The Fund’s portfolio turnover rate is calculated in accordance with regulatory requirements, without regard to transactions involving short term investments and certain derivatives. If such transactions were included, the Fund’s portfolio turnover rate may be higher. |
| | | | |
| The accompanying notes are an integral part of these financial statements. | | 25 | | |
GOLDMAN SACHS VARIABLE INSURANCE TRUST STRATEGIC INCOME FUND
Notes to Financial Statements
December 31, 2014
1. ORGANIZATION
Goldman Sachs Variable Insurance Trust (the “Trust” or “VIT”) is a Delaware statutory trust registered under the Investment Company Act of 1940, as amended (the “Act”), as an open-end management investment company. The Trust includes the Goldman Sachs Strategic Income Fund (the “Fund”). The Fund is a diversified portfolio under the Act offering three classes of shares — Institutional, Service and Advisor Shares. Shares of the Trust are offered to separate accounts of participating life insurance companies for the purpose of funding variable annuity contracts and variable life insurance policies. The Fund commenced operations on April 14, 2014.
Goldman Sachs Asset Management, L.P. (“GSAM”), an affiliate of Goldman, Sachs & Co. (“Goldman Sachs”), serves as investment adviser to the Fund pursuant to a management agreement (the “Agreement”) with the Trust.
2. SIGNIFICANT ACCOUNTING POLICIES
The financial statements have been prepared in accordance with accounting principles generally accepted in the United States of America (“GAAP”) and require management to make estimates and assumptions that may affect the reported amounts and disclosures. Actual results may differ from those estimates and assumptions.
A. Investment Valuation — The Fund’s valuation policy is to value investments at fair value.
B. Investment Income and Investments — Investment income includes interest income and dividend income, net of any foreign withholding taxes, less any amounts reclaimable. Interest income is accrued daily and adjusted for amortization of premiums and accretion of discounts. Dividend income is recognized on ex-dividend date or, for certain foreign securities, as soon as such information is obtained subsequent to the ex-dividend date. Investment transactions are reflected on trade date. Realized gains and losses are calculated using identified cost. Investment transactions are recorded on the following business day for daily net asset value (“NAV”) calculations. Any foreign capital gains tax is accrued daily based upon net unrealized gains, and is payable upon sale of such investments.
For derivative contracts, realized gains and losses are recorded upon settlement of the contract. Upfront payments are made or received upon entering into a swap agreement and are reflected in the Statement of Assets and Liabilities. Upfront payments are recognized over the contract’s term/event as realized gains or losses, with the exception of forward starting interest rate swaps whose realized gains or losses are recognized from the effective start date. For securities with paydown provisions, principal payments received are treated as a proportionate reduction to the cost basis of the securities and excess or shortfall amounts are recorded as income. For treasury inflation protected securities (“TIPS”), adjustments to principal due to inflation/deflation are reflected as increases/decreases to interest income with a corresponding adjustment to cost.
C. Class Allocations and Expenses — Investment income, realized and unrealized gain (loss), and non-class specific expenses of the Fund are allocated daily based upon the proportion of net assets of each class. Class specific expenses, where applicable, are borne by the respective share classes and include Distribution and Service and Transfer Agent fees. Non-class specific expenses directly incurred by a Fund are charged to that Fund, while such expenses incurred by the Trust are allocated across the respective Funds on a straight-line and/or pro-rata basis depending upon the nature of the expenses.
D. Offering and Organization Costs — Offering costs paid in connection with the offering of shares of the Fund are being amortized on a straight-line basis over 12 months from the date of commencement of operations. Organization costs paid in connection with the organization of the Fund were expensed on the first day of operations.
26
GOLDMAN SACHS VARIABLE INSURANCE TRUST STRATEGIC INCOME FUND
2. SIGNIFICANT ACCOUNTING POLICIES (continued)
E. Federal Taxes and Distributions to Shareholders — It is the Fund’s policy to comply with the requirements of the Internal Revenue Code of 1986, as amended (the “Code”), applicable to regulated investment companies (mutual funds) and to distribute each year substantially all of its investment company taxable income and capital gains to its shareholders. Accordingly, the Fund is not required to make any provisions for the payment of federal income tax. Distributions to shareholders are recorded on the ex-dividend date. Income distributions are declared and paid quarterly and capital gains distributions, if any, are declared and paid annually.
Net capital losses are carried forward to future fiscal years and may be used to the extent allowed by the Code to offset any future capital gains. Losses that are carried forward will retain their character as either short-term or long-term capital losses. Utilization of capital loss carryforwards will reduce the requirement of future capital gains distributions.
The characterization of distributions to shareholders for financial reporting purposes is determined in accordance with federal income tax rules, which may differ from GAAP. The source of the Fund’s distributions may be shown in the accompanying financial statements as either from net investment income, net realized gain or capital. Certain components of the Fund’s net assets on the Statement of Assets and Liabilities reflect permanent GAAP/tax differences based on the appropriate tax character.
F. Foreign Currency Translation — The accounting records and reporting currency of the Fund are maintained in U.S. dollars. Assets and liabilities denominated in foreign currencies are translated into United States (“U.S.”) dollars using the current exchange rates at the close of each business day. The effect of changes in foreign currency exchange rates on investments is included within net realized and unrealized gain (loss) on investments. Changes in the value of other assets and liabilities as a result of fluctuations in foreign exchange rates are included in the Statement of Operations within net change in unrealized gain (loss) on foreign currency transactions. Transactions denominated in foreign currencies are translated into U.S. dollars on the date the transaction occurred, the effects of which are included within net realized gain (loss) on foreign currency transactions.
3. INVESTMENTS AND FAIR VALUE MEASUREMENTS
The fair value of a financial instrument is the amount that would be received to sell an asset or paid to transfer a liability in an orderly transaction between market participants at the measurement date (i.e., the exit price). GAAP establishes a fair value hierarchy that prioritizes the inputs to valuation techniques used to measure fair value. The hierarchy gives the highest priority to unadjusted quoted prices in active markets for identical assets or liabilities (Level 1 measurements) and the lowest priority to unobservable inputs (Level 3 measurements). The levels used for classifying investments are not necessarily an indication of the risk associated with investing in these investments. The three levels of the fair value hierarchy are described below:
Level 1 — Unadjusted quoted prices in active markets that are accessible at the measurement date for identical, unrestricted assets or liabilities;
Level 2 — Quoted prices in markets that are not active or financial instruments for which significant inputs are observable (including, but not limited to, quoted prices for similar investments, interest rates, foreign exchange rates, volatility and credit spreads), either directly or indirectly;
Level 3 — Prices or valuations that require significant unobservable inputs (including GSAM’s assumptions in determining fair value measurement).
27
GOLDMAN SACHS VARIABLE INSURANCE TRUST STRATEGIC INCOME FUND
Notes to Financial Statements (continued)
December 31, 2014
3. INVESTMENTS AND FAIR VALUE MEASUREMENTS (continued)
The Trustees have adopted Valuation Procedures that govern the valuation of the portfolio investments held by the Fund, including investments for which market quotations are not readily available. The Trustees have delegated to GSAM day-to-day responsibility for implementing and maintaining internal controls and procedures related to the valuation of the Fund’s portfolio investments. To assess the continuing appropriateness of pricing sources and methodologies, GSAM regularly performs price verification procedures and issues challenges as necessary to third party pricing vendors or brokers, and any differences are reviewed in accordance with the Valuation Procedures.
A. Level 1 and Level 2 Fair Value Investments — The valuation techniques and significant inputs used in determining the fair values for investments classified as Level 1 and Level 2 are as follows:
Debt Securities — Debt securities for which market quotations are readily available are valued daily on the basis of quotations supplied by dealers or an independent pricing service approved by the Trustees. The pricing services may use valuation models or matrix pricing, which consider: (i) yield or price with respect to bonds that are considered comparable in characteristics such as rating, interest rate and maturity date or (ii) quotations from securities dealers to determine current value. Short-term debt obligations that mature in sixty days or less and that do not exhibit signs of credit deterioration are valued at amortized cost, which approximates fair value. With the exception of treasury securities of G8 countries (not held in money market funds), which are generally classified as Level 1, these investments are generally classified as Level 2 of the fair value hierarchy.
i. Mortgage-Backed and Asset-Backed Securities — Mortgage-backed securities represent direct or indirect participations in, or are collateralized by and payable from, mortgage loans secured by residential and/or commercial real estate property. Asset-backed securities include securities whose principal and interest payments are collateralized by pools of other assets or receivables. The value of certain mortgage-backed and asset-backed securities (including adjustable rate mortgage loans) may be particularly sensitive to changes in prevailing interest rates. The value of these securities may also fluctuate in response to the market’s perception of the creditworthiness of the issuers.
Asset-backed securities may present credit risks that are not presented by mortgage-backed securities because they generally do not have the benefit of a security interest in collateral that is comparable to mortgage assets. Some asset-backed securities may only have a subordinated claim on collateral.
Stripped mortgage-backed securities are usually structured with two different classes: one that receives substantially all interest payments (interest-only, or “IO” and/or high coupon rate with relatively low principal amount, or “IOette”), and the other that receives substantially all principal payments (principal-only, or “PO”) from a pool of mortgage loans. Little to no principal will be received at the maturity of an IO; as a result, periodic adjustments are recorded to reduce the cost of the security until maturity. These adjustments are included in interest income.
ii. Treasury Inflation Protected Securities — TIPS are treasury securities in which the principal amount is adjusted daily to keep pace with inflation, as measured by the U.S. Consumer Pricing Index for Urban Consumers. The repayment of the original bond principal upon maturity is guaranteed by the full faith and credit of the U.S. Government.
Derivative Contracts — A derivative is an instrument whose value is derived from underlying assets, indices, reference rates or a combination of these factors. The Fund enters into derivative transactions to hedge against changes in interest rates, securities prices, and/or currency exchange rates, to increase total return, or to gain access to certain markets or attain exposure to other underliers.
28
GOLDMAN SACHS VARIABLE INSURANCE TRUST STRATEGIC INCOME FUND
3. INVESTMENTS AND FAIR VALUE MEASUREMENTS (continued)
Exchange-traded derivatives, including futures contracts, typically fall within Level 1 of the fair value hierarchy. Over-the-counter (“OTC”) and centrally cleared derivatives are valued using market transactions and other market evidence, including market-based inputs to models, calibration to market-clearing transactions, broker or dealer quotations, or other alternative pricing sources. Where models are used, the selection of a particular model to value OTC and centrally cleared derivatives depends upon the contractual terms of, and specific risks inherent in, the instrument, as well as the availability of pricing information in the market. Valuation models require a variety of inputs, including contractual terms, market prices, yield curves, credit curves, measures of volatility, voluntary and involuntary prepayment rates, loss severity rates and correlations of such inputs. For OTC and centrally cleared derivatives that trade in liquid markets, model inputs can generally be verified and model selection does not involve significant management judgment. OTC and centrally cleared derivatives are classified within Level 2 of the fair value hierarchy when significant inputs are corroborated by market evidence.
i. Forward Contracts — A forward contract is a contract between two parties to buy or sell an asset at a specified price on a future date. A forward contract settlement can occur on a cash or delivery basis. Forward contracts are marked-to-market daily using independent vendor prices, and the change in value, if any, is recorded as an unrealized gain or loss.
A forward foreign currency contract is a forward contract in which a Fund agrees to receive or deliver a fixed quantity of one currency for another, at a pre-determined price at a future date. All forward foreign currency exchange contracts are marked-to-market daily at the applicable forward rate. Non-deliverable forward foreign currency exchange contracts are settled with the counterparty in cash without the delivery of foreign currency.
ii. Futures Contracts — Futures contracts are contracts to buy or sell a standardized quantity of a specified commodity or security and are valued based on exchanged settlement prices or independent market quotes. Futures contracts are valued at the last settlement price, or in the absence of a sale, the last bid price for long positions and at the last ask price for short positions, at the end of each day on the board of trade or exchange upon which they are traded. Upon entering into a futures contract, the Fund deposits cash or securities in an account on behalf of the broker in an amount sufficient to meet the initial margin requirement. Subsequent payments are made or received by the Fund equal to the daily change in the contract value and are recorded as variation margin receivable or payable with a corresponding offset to unrealized gains or losses.
iii. Swap Contracts — Bilateral swap contracts are agreements in which a Fund and a counterparty agree to exchange periodic payments on a specified notional amount or make a net payment upon termination. Bilateral swap transactions are privately negotiated in the OTC market and payments are settled through direct payments between a Fund and the counterparty. By contrast, certain swap transactions are subject to mandatory central clearing. These swaps are executed through a derivatives clearing member (“DCM”), acting in an agency capacity, and submitted to a central counterparty (“CCP”) (“centrally cleared swaps”), in which case all payments are settled with the CCP through the DCM. Swaps are marked-to-market daily using pricing vendor quotations, counterparty or clearinghouse prices or model prices, and the change in value, if any, is recorded as an unrealized gain or loss. Upon entering into a swap contract, a Fund is required to satisfy an initial margin requirement by delivering cash or securities to the counterparty (or in some cases, segregated in a triparty account on behalf of the counterparty), which can be adjusted by any mark-to-market gains or losses pursuant to bilateral or centrally cleared arrangements. For centrally cleared swaps the daily change in valuation, if any, is recorded as a receivable or payable for variation margin.
29
GOLDMAN SACHS VARIABLE INSURANCE TRUST STRATEGIC INCOME FUND
Notes to Financial Statements (continued)
December 31, 2014
3. INVESTMENTS AND FAIR VALUE MEASUREMENTS (continued)
An interest rate swap is an agreement that obligates two parties to exchange a series of cash flows at specified intervals, based upon or calculated by reference to changes in interest rates on a specified notional principal amount. The payment flows are usually netted against each other, with the difference being paid by one party to the other.
A credit default swap is an agreement that involves one party (the buyer of protection) making a stream of payments to another party (the seller of protection) in exchange for the right to receive protection on a reference security or obligation, including a group of assets or exposure to the performance of an index. A Fund’s investment in credit default swaps may involve greater risks than if the Fund had invested in the referenced obligation directly. Credit events are contract specific but may include bankruptcy, failure to pay, restructuring and obligation acceleration. If a Fund buys protection through a credit default swap and no credit event occurs, its payments are limited to the periodic payments previously made to the counterparty. Upon the occurrence of a specified credit event, a Fund, as a buyer of credit protection, is entitled to receive an amount equal to the notional amount of the swap and deliver to the seller the defaulted reference obligation in a physically settled trade. A Fund may also receive a net settlement amount in the form of cash or securities equal to the notional amount of the swap reduced by the recovery value of the reference obligation in a cash settled trade.
As a seller of protection, a Fund generally receives a payment stream throughout the term of the swap, provided that there is no credit event. In addition, if a Fund sells protection through a credit default swap, a Fund could suffer a loss because the value of the referenced obligation and the premium payments received may be less than the notional amount of the swap paid to the buyer of protection. Upon the occurrence of a specified credit event, a Fund, as a seller of credit protection, may be required to take possession of the defaulted reference obligation and pay the buyer an amount equal to the notional amount of the swap in a physically settled trade. A Fund may also pay a net settlement amount in the form of cash or securities equal to the notional amount of the swap reduced by the recovery value of the reference obligation in a cash settled trade. Recovery values are at times established through the credit event auction process in which market participants are ensured that a transparent price has been set for the defaulted security or obligation. In addition, a Fund is entitled to a return of any assets, which have been pledged as collateral to the counterparty.
The maximum potential amount of future payments (undiscounted) that a Fund as seller of protection could be required to make under a credit default swap would be an amount equal to the notional amount of the agreement. These potential amounts would be partially offset by any recovery values of the respective referenced obligations or net amounts received from a settlement of a credit default swap for the same reference security or obligation where a Fund bought credit protection.
B. Level 3 Fair Value Investments — To the extent that the aforementioned significant inputs are unobservable, or if quotations are not readily available, or if GSAM believes that such quotations do not accurately reflect fair value, the fair value of the Fund’s investments may be determined under Valuation Procedures approved by the Trustees. GSAM, consistent with its procedures and applicable regulatory guidance, may make an adjustment to the most recent valuation prices of either domestic or foreign securities in light of significant events to reflect what it believes to be the fair value of the securities at the time of determining a Fund’s NAV. Significant events which could affect a large number of securities in a particular market may include, but are not limited to: significant fluctuations in U.S. or foreign markets; market dislocations; market disruptions; or unscheduled market closings. Significant events which could also affect a single issuer may include, but are not limited to: corporate actions such as reorganizations, mergers and buy-outs; ratings downgrades; and bankruptcies.
30
GOLDMAN SACHS VARIABLE INSURANCE TRUST STRATEGIC INCOME FUND
3. INVESTMENTS AND FAIR VALUE MEASUREMENTS (continued)
C. Fair Value Hierarchy — The following is a summary of the Fund’s investments and derivatives classified in the fair value hierarchy as of December 31, 2014:
| | | | | | | | | | | | |
| Investment Type | | Level 1 | | | Level 2 | | | Level 3 | |
| Assets | | | | | | | | | | | | |
| Fixed Income | | | | | | | | | | | | |
Corporate Obligations | | $ | 67,958 | | | $ | 2,098,328 | | | $ | — | |
Mortgage-Backed Obligations | | | — | | | | 2,779,230 | | | | — | |
U.S. Treasury Obligations and/or Other U.S. Government Agencies | | | 5,881,034 | | | | — | | | | — | |
Asset-Backed Securities | | | — | | | | 2,480,974 | | | | — | |
Foreign Debt Obligations | | | 1,165,242 | | | | 3,089,122 | | | | — | |
Municipal Debt Obligations | | | — | | | | 463,939 | | | | — | |
Bank Loan Obligations | | | — | | | | 705,138 | | | | 72,942 | |
| Total | | $ | 7,114,234 | | | $ | 11,616,731 | | | $ | 72,942 | |
| | | |
| Derivative Type | | | | | | | | | |
| Assets(a) | | | | | | | | | | | | |
| Futures Contracts | | $ | 8,178 | | | $ | — | | | $ | — | |
| Forward Foreign Currency Exchange Contracts | | | — | | | | 299,702 | | | | — | |
| Credit Default Swaps | | | — | | | | 33,895 | | | | — | |
| Interest Rate Swaps | | | — | | | | 243,480 | | | | — | |
| Total | | $ | 8,178 | | | $ | 577,077 | | | $ | — | |
| Liabilities(a) | | | | | | | | | | | | |
| Futures Contracts | | $ | (24,885 | ) | | $ | — | | | $ | — | |
| Forward Foreign Currency Exchange Contracts | | | — | | | | (132,933 | ) | | | — | |
| Credit Default Swaps | | | — | | | | (13,301 | ) | | | — | |
| Interest Rate Swaps | | | — | | | | (286,028 | ) | | | — | |
| Total | | $ | (24,885 | ) | | $ | (432,262 | ) | | $ | — | |
| (a) | Amount shown represents unrealized gain (loss) at period end. |
For further information regarding security characteristics, see the Schedule of Investments.
31
GOLDMAN SACHS VARIABLE INSURANCE TRUST STRATEGIC INCOME FUND
Notes to Financial Statements (continued)
December 31, 2014
4. INVESTMENTS IN DERIVATIVES
The following table sets forth, by certain risk types, the gross value of derivative contracts as of December 31, 2014. These instruments were used to meet the Fund’s investment objectives and to obtain and/or manage exposure related to the risks below. The values in the table below exclude the effects of cash collateral received or posted pursuant to these derivative contracts, and therefore are not representative of the Fund’s net exposure.
| | | | | | | | | | | | |
| Risk | | Statement of Assets and Liabilities | | Assets | | | Statement of Assets and Liabilities | | Liabilities | |
| Credit | | Receivable for unrealized gain on swap contracts and variation margin on certain derivative contracts | | | $33,895(a) | | | Payable for unrealized loss on swap contracts and variation margin on certain derivative contracts | | $ | (13,301 | )(a) |
| Currency | | Receivable for unrealized gain on forward foreign currency exchange contracts | | | 299,702 | | | Payable for unrealized loss on forward foreign currency exchange contracts | | | (132,933 | ) |
| Interest Rate | | Receivable for unrealized gain on swap contracts and variation margin on certain derivative contracts | | | 251,658 | (a) | | Payable for unrealized loss on swap contracts and variation margin on certain derivative contracts | | | (310,913 | )(a) |
| Total | | | | $ | 585,255 | | | | | $ | (457,147 | ) |
| (a) | Includes unrealized gain (loss) on futures contracts and centrally cleared swap contracts described in the Additional Investment Information sections of the Schedules of Investments. Only current day’s variation margin is reported within the Statements of Assets and Liabilities. |
The following table sets forth, by certain risk types, the Fund’s gains (losses) related to these derivatives and their indicative volumes for the period ended December 31, 2014. These gains (losses) should be considered in the context that these derivative contracts may have been executed to create investment opportunities and/or economically hedge certain investments, and accordingly, certain gains (losses) on such derivative contracts may offset certain (losses) gains attributable to investments. These gains (losses) are included in “Net realized gain (loss)” or “Net change in unrealized gain (loss)” on the Statement of Operations:
| | | | | | | | | | | | | | |
| Risk | | Statement of Operations | | Net
Realized
Gain (Loss) | | | Net Change in
Unrealized
Gain (Loss) | | | Average
Number of
Contracts(a) | |
| Credit | | Net realized gain (loss) from swap contracts/Net change in unrealized gain (loss) on swap contracts | | $ | (16,141 | ) | | $ | 20,594 | | | | 5 | |
| Currency | | Net realized gain (loss) from forward foreign currency exchange contracts/Net change in unrealized gain (loss) on forward foreign currency exchange contracts | | | 655,911 | | | | 166,769 | | | | 285 | |
| Interest Rate | | Net realized gain (loss) from future contracts and swap contracts/Net change in unrealized gain (loss) on future contracts and swap contracts | | | (830,851 | ) | | | (59,255 | ) | | | 110 | |
| Total | | | | $ | (191,081 | ) | | $ | 128,108 | | | | 400 | |
| (a) | Average number of contracts is based on the average of month end balances for the period ended December 31, 2014. |
32
GOLDMAN SACHS VARIABLE INSURANCE TRUST STRATEGIC INCOME FUND
4. INVESTMENTS IN DERIVATIVES (continued)
In order to better define its contractual rights and to secure rights that will help a Fund mitigate its counterparty risk, a Fund may enter into an International Swaps and Derivatives Association, Inc. Master Agreement (“ISDA Master Agreement”) or similar agreement with its derivatives counterparties. An ISDA Master Agreement is a bilateral agreement between a Fund and a counterparty that governs OTC derivatives, including foreign exchange contracts, and typically contains, among other things, collateral posting terms and netting provisions in the event of a default and/or termination event. The provisions of the ISDA Master Agreement typically permit a single net payment in the event of a default (close-out netting) or similar event, including the bankruptcy or insolvency of the counterparty.
Collateral and margin requirements differ between exchange traded derivatives and OTC derivatives. Margin requirements are established by the broker or clearing house for exchange-traded and centrally cleared derivatives (financial futures contracts, options and centrally cleared swaps) pursuant to governing agreements for those instrument types. Brokers can ask for margin in excess of the minimum in certain circumstances. Collateral terms are contract-specific for OTC derivatives (foreign currency exchange contracts, and certain options and swaps). For derivatives traded under an ISDA Master Agreement, the collateral requirements are typically calculated by netting the marked to market amount for each transaction under such agreement and comparing that amount to the value of any collateral currently pledged by a Fund and the counterparty. Additionally, a Fund may be required to post initial margin to the counterparty, the terms of which would be outlined in the confirmation of the OTC transaction.
For financial reporting purposes, cash collateral that has been pledged to cover obligations of a Fund and cash collateral received from the counterparty, if any, is reported separately on the Statements of Assets and Liabilities as receivables/payables for collateral on certain derivative contracts. Non-cash collateral pledged by a Fund, if any, is noted in the Schedules of Investments. Generally, the amount of collateral due from or to a counterparty must exceed a minimum transfer amount threshold before a transfer is required to be made. To the extent amounts due to a Fund from its counterparties are not fully collateralized, contractually or otherwise, the Fund bears the risk of loss from counterparty nonperformance. A Fund attempts to mitigate counterparty risk by only entering into agreements with counterparties that it believes to be of good standing and by monitoring the financial stability of those counterparties.
Additionally, the netting of assets and liabilities and the offsetting of collateral pledged or received are based on contractual netting/set-off provisions in the ISDA Master Agreement or similar agreements. However, in the event of a default or insolvency of a counterparty, a court could determine that such rights are not enforceable due to the restrictions or prohibitions against the right of set off that may be imposed due to a particular jurisdiction’s bankruptcy or insolvency laws.
33
GOLDMAN SACHS VARIABLE INSURANCE TRUST STRATEGIC INCOME FUND
Notes to Financial Statements (continued)
December 31, 2014
4. INVESTMENTS IN DERIVATIVES (continued)
The following table sets forth the Fund’s net exposure for derivative instruments that are subject to enforceable master netting arrangements or similar agreements as of December 31, 2014:
| | | | | | | | | | | | | | | | | | | | |
| | | Derivative Assets(1) | | | Derivative Liabilities(1) | | | | | | | | | | |
| Counterparty | | Forwards | | | Forwards | | | Net Derivative
Assets (Liabilities) | | | Collateral (Received)
Pledged(1) | | | Net Amount(2) | |
| Bank of America, N.A. | | $ | 22,266 | | | $ | (10,536 | ) | | $ | 11,730 | | | $ | — | | | $ | 11,730 | |
| Barclays Bank PLC | | | 16,517 | | | | (8,260 | ) | | | 8,257 | | | | — | | | | 8,257 | |
| BNP Paribas SA | | | 16,594 | | | | (21,755 | ) | | | (5,161 | ) | | | — | | | | (5,161 | ) |
| Citibank, N.A. | | | 82,063 | | | | (26,515 | ) | | | 55,548 | | | | — | | | | 55,548 | |
| Deutsche Bank AG | | | 41,005 | | | | (23,402 | ) | | | 17,603 | | | | — | | | | 17,603 | |
| Merrill Lynch & Co., Inc. | | | — | | | | (3,250 | ) | | | (3,250 | ) | | | — | | | | (3,250 | ) |
| Morgan Stanley Co., Inc. | | | 13,641 | | | | (7,071 | ) | | | 6,570 | | | | — | | | | 6,570 | |
| Royal Bank of Canada | | | 18,189 | | | | (8,871 | ) | | | 9,318 | | | | — | | | | 9,318 | |
| Royal Bank of Scotland | | | 20,816 | | | | (5,295 | ) | | | 15,521 | | | | — | | | | 15,521 | |
| State Street Bank | | | 15,497 | | | | (3,697 | ) | | | 11,800 | | | | — | | | | 11,800 | |
| UBS AG | | | 25,440 | | | | (11,385 | ) | | | 14,055 | | | | — | | | | 14,055 | |
| Westpac Banking Corp. | | | 27,674 | | | | (2,896 | ) | | | 24,778 | | | | — | | | | 24,778 | |
| Total | | $ | 299,702 | | | $ | (132,933 | ) | | $ | 166,769 | | | $ | — | | | $ | 166,769 | |
| (1) | Gross amounts available for offset but not netted in the Statement of Assets and Liabilities. |
| (2) | Net amount represents the net amount due (to) from counterparty in the event of a default based on the contractual set-off rights under the agreement. |
5. AGREEMENTS AND AFFILIATED TRANSACTIONS
A. Management Agreement — Under the Agreement, GSAM manages the Fund, subject to the general supervision of the Trustees.
As compensation for the services rendered pursuant to the Agreement, the assumption of the expenses related thereto and administration of the Fund’s business affairs, including providing facilities, GSAM is entitled to a management fee, accrued daily and paid monthly, equal to an annual percentage rate of the Fund’s average daily net assets.
For the period ended December 31, 2014, contractual and effective net management fees with GSAM were at the following rates:
| | | | | | | | | | | | | | | | | | | | | | |
| Contractual Management Fee Rate | |
First
$1 billion | | | Next
$1 billion | | | Next
$3 billion | | | Next
$3 billion | | | Over
$8 billion | | | Effective
Rate | |
| | 0.60% | | | | 0.54% | | | | 0.51% | | | | 0.50% | | | | 0.49% | | | | 0.60% | |
34
GOLDMAN SACHS VARIABLE INSURANCE TRUST STRATEGIC INCOME FUND
5. AGREEMENTS AND AFFILIATED TRANSACTIONS (continued)
B. Distribution and Service Plans — The Trust, on behalf of the Fund, has adopted Distribution and Service Plans (the “Plans”). Under the Plans, Goldman Sachs, which serves as distributor (the “Distributor”), is entitled to a fee accrued daily and paid monthly for distribution services and personal and account maintenance services, which may then be paid by Goldman Sachs to authorized dealers, equal to, on an annual basis, 0.25% and 0.40% of the Fund’s average daily net assets attributable to Service and Advisor Shares, respectively.
C. Transfer Agency Agreement — Goldman Sachs also serves as the transfer agent of the Fund for a fee pursuant to a Transfer Agency Agreement. The fees charged for such transfer agency services are accrued daily and paid monthly at an annual rate of 0.02% of the average daily net assets for Institutional, Service and Advisor Shares.
D. Other Expense Agreements and Affiliated Transactions — GSAM has agreed to limit certain “Other Expenses” of the Fund (excluding transfer agency fees and expenses, taxes, interest, brokerage fees, shareholder meeting, litigation, indemnification and extraordinary expenses) to the extent such expenses exceed, on an annual basis, a percentage rate of the average daily net assets of the Fund. Such Other Expense reimbursements, if any, are accrued daily and paid monthly. In addition, the Fund is not obligated to reimburse GSAM for prior fiscal year expense reimbursements, if any. The Other Expense limitation as an annual percentage rate of average daily net assets for the Fund is 0.254%. The Other Expense limitation will remain in place through at least April 30, 2015, and prior to such date GSAM may not terminate the arrangement without the approval of the Trustees. The Fund bears its respective share of costs related to proxy and shareholder meetings, and GSAM has agreed to reimburse the Fund to the extent such expenses exceed a specified percentage of the Fund’s net assets. For the period ended December 31, 2014, GSAM reimbursed $274,033 to the Fund. In addition, the Fund has entered into certain offset arrangements with the custodian and the transfer agent, which may result in a reduction of the Fund’s expenses and are received irrespective of the application of the “Other Expense” limitation described above. For the period ended December 31, 2014, custody fee credits were $1,866.
As of December 31, 2014 the amounts owed to affiliates were $44,725 for over reimbursement of Other Expenses.
E. Other Transactions with Affiliates — For the period ended December 31, 2014, Goldman Sachs did not earn any brokerage commissions from portfolio transactions, on behalf of the Fund.
As of December 31, 2014, the Goldman Sachs Group, Inc. was the beneficial owner of approximately 98% of Institutional Class Shares and 100% of the Service Class Shares.
6. PORTFOLIO SECURITIES TRANSACTIONS
The cost of purchases and proceeds from sales and maturities of long-term securities for the period ended December 31, 2014, were as follows:
| | | | | | | | | | | | | | |
Purchases of U.S. Government and
Agency Obligations | | | Purchases (Excluding U.S. Government and
Agency Obligations | | | Sales and Maturities of
U.S. Government and
Agency Obligations | | | Sales and Maturities (Excluding
U.S. Government and
Agency Obligations | |
| | $25,040,615 | | | $ | 17,611,757 | | | $ | 18,334,988 | | | $ | 6,332,380 | |
35
GOLDMAN SACHS VARIABLE INSURANCE TRUST STRATEGIC INCOME FUND
Notes to Financial Statements (continued)
December 31, 2014
7. TAX INFORMATION
The tax character of distributions paid during the period ended December 31, 2014 was as follows:
| | | | |
| | | 2014 | |
| Distributions paid from ordinary income | | $ | 478,899 | |
As of December 31, 2014, the components of accumulated earnings (losses) on a tax-basis were as follows:
| | | | |
| Undistributed ordinary income — net | | $ | 229,771 | |
| Capital loss carryforwards: | | | | |
Perpetual short-term | | | (72,161 | ) |
Perpetual long-term | | | (82,759 | ) |
| Total capital loss carryforwards | | $ | (154,920 | ) |
| Timing differences (Straddle Deferral/Post October Loss Deferral) | | | (504,736 | ) |
| Unrealized losses — net | | | (146,727 | ) |
| Total accumulated losses — net | | $ | (576,612 | ) |
As of December 31, 2014, the Fund’s aggregate security unrealized gains and losses based on cost for U.S. federal income tax purposes were as follows:
| | | | |
| Tax cost | | $ | 18,934,798 | |
| Gross unrealized gain | | | 212,453 | |
| Gross unrealized loss | | | (343,344 | ) |
| Unrealized security loss | | | (130,891 | ) |
| Net unrealized loss on other investments | | | (15,836 | ) |
| Net unrealized loss | | $ | (146,727 | ) |
The difference between GAAP-basis and tax-basis unrealized gains (losses) is attributable primarily to wash sales, net mark to market gains/(losses) on regulated futures and foreign currency contracts, and differences in the tax treatment of swap transactions and inflation protected securities.
In order to present certain components of the Fund’s capital accounts on a tax-basis, the Fund has reclassified $15,192 of paid-in capital and $361,425 of accumulated investment gain/(loss) into undistributed net investment income. These reclassifications have no impact on the net asset value of the Fund and result primarily from certain non-deductible expenses, differences in the tax treatment of swap transactions, foreign currency transactions and paydown gains and losses.
GSAM has reviewed the Fund’s tax positions for all open tax years (the current year, as applicable), and has concluded that no provision for income tax is required in the Fund’s financial statements. Such open tax years remain subject to examination and adjustment by tax authorities.
36
GOLDMAN SACHS VARIABLE INSURANCE TRUST STRATEGIC INCOME FUND
8. OTHER RISKS
The Fund’s risks include, but are not limited to, the following:
Large Shareholder Transaction Risk — The Fund may experience adverse effects when certain large shareholders, such as other funds, participating insurance companies, accounts and Goldman Sachs affiliates, purchase or redeem large amounts of shares of the Fund. Such large shareholder redemptions may cause the Fund to sell portfolio securities at times when it would not otherwise do so, which may negatively impact the Fund’s NAV and liquidity. Similarly, large Fund share purchases may adversely affect the Fund’s performance to the extent that the Fund is delayed in investing new cash and is required to maintain a larger cash position than it ordinarily would. These transactions may also increase transaction costs. In addition, a large redemption could result in the Fund’s current expenses being allocated over a smaller asset base, leading to an increase in the Fund’s expense ratio.
Liquidity Risk — The Fund may make investments that are illiquid or that may become less liquid in response to market developments or adverse investor perceptions. Illiquid investments may be more difficult to value. Liquidity risk may also refer to the risk that the Fund will not be able to pay redemption proceeds within the allowable time period because of unusual market conditions, an unusually high volume of redemption requests, or other reasons. To meet redemption requests, the Fund may be forced to sell investments at an unfavorable time and/or under unfavorable conditions. Liquidity risk may be the result of, among other things, the reduced number and capacity of traditional market participants to make a market in fixed income securities or the lack of an active market. The potential for liquidity risk may be magnified by a rising interest rate environment or other circumstances where investor redemptions from fixed income mutual funds may be higher than normal, potentially causing increased supply in the market due to selling activity.
Market and Credit Risks — In the normal course of business, the Fund trades financial instruments and enters into financial transactions where risk of potential loss exists due to changes in the market (market risk). Additionally, the Fund may also be exposed to credit risk in the event that an issuer or guarantor fails to perform or that an institution or entity with which the Fund has unsettled or open transactions defaults.
Investing in foreign markets may involve special risks and considerations not typically associated with investing in the U.S. Foreign securities may be subject to risk of loss because of more or less foreign government regulation, less public information and less economic, political and social stability in the countries in which the Fund invests. Loss may also result from the imposition of exchange controls, confiscations and other government restrictions by the United States or other governments, or from problems in registration, settlement or custody. Foreign risk also involves the risk of negative foreign currency rate fluctuations, which may cause the value of securities denominated in such foreign currency (or other instruments through which the Fund has exposure to foreign currencies) to decline in value. Currency exchange rates may fluctuate significantly over short periods of time. To the extent that the Fund also invests in securities of issuers located in emerging markets, these risks may be more pronounced.
9. INDEMNIFICATIONS
Under the Trust’s organizational documents, its Trustees, officers, employees and agents are indemnified, to the extent permitted by the Act and state law, against certain liabilities that may arise out of performance of their duties to the Fund. Additionally, in the course of business, the Fund enters into contracts that contain a variety of indemnification clauses. The Fund’s maximum exposure under these arrangements is unknown, as this would involve future claims that may be made against the Fund that have not yet occurred. However, GSAM believes the risk of loss under these arrangements to be remote.
37
GOLDMAN SACHS VARIABLE INSURANCE TRUST STRATEGIC INCOME FUND
Notes to Financial Statements (continued)
December 31, 2014
10. SUBSEQUENT EVENTS
Subsequent events after the Statement of Assets and Liabilities date have been evaluated through the date the financial statements were issued. GSAM has concluded that there is no impact requiring adjustment or disclosure in the financial statements.
11. SUMMARY OF SHARE TRANSACTIONS
Share activity is as follows:
| | | | | | | | |
| | | For the Period Ended
December 31, 2014(a) | |
| | | Shares | | | Dollars | |
| Institutional Shares | | | | | | | | |
| Shares sold | | | 1,827,210 | | | $ | 18,272,275 | |
| Reinvestment of distributions | | | 46,920 | | | | 454,918 | |
| Shares redeemed | | | (91 | ) | | | (914 | ) |
| | | | 1,874,039 | | | | 18,726,279 | |
| Service Shares | | | | | | | | |
| Shares sold | | | 1,000 | | | | 10,000 | |
| Reinvestment of distributions | | | 24 | | | | 229 | |
| | | | 1,024 | | | | 10,229 | |
| Advisor Shares | | | | | | | | |
| Shares sold | | | 176,940 | | | | 1,771,982 | |
| Reinvestment of distributions | | | 2,459 | | | | 23,752 | |
| Shares redeemed | | | (58,251 | ) | | | (577,528 | ) |
| | | | 121,148 | | | | 1,218,206 | |
| NET INCREASE | | | 1,996,211 | | | $ | 19,954,714 | |
| (a) | Commenced operations on April 14, 2014. |
38
Report of Independent Registered Public Accounting Firm
To the Board of Trustees and Shareholders of
Goldman Sachs Variable Insurance Trust — Goldman Sachs Strategic Income Fund:
In our opinion, the accompanying statement of assets and liabilities, including the schedule of investments, and the related statements of operations and of changes in net assets and the financial highlights present fairly, in all material respects, the financial position of Goldman Sachs Strategic Income Fund (the “Fund”), a fund of Goldman Sachs Variable Insurance Trust, at December 31, 2014, the results of its operations, the changes in its net assets and the financial highlights for the periods indicated, in conformity with accounting principles generally accepted in the United States of America. These financial statements and financial highlights (hereafter referred to as “financial statements”) are the responsibility of the Fund’s management. Our responsibility is to express an opinion on these financial statements based on our audit. We conducted our audit of these financial statements in accordance with the standards of the Public Company Accounting Oversight Board (United States). Those standards require that we plan and perform the audit to obtain reasonable assurance about whether the financial statements are free of material misstatement. An audit includes examining, on a test basis, evidence supporting the amounts and disclosures in the financial statements, assessing the accounting principles used and significant estimates made by management, and evaluating the overall financial statement presentation. We believe that our audit, which included confirmation of securities at December 31, 2014 by correspondence with the custodian, transfer agent, brokers and the application of alternative auditing procedures where securities purchased confirmations had not been received, provides a reasonable basis for our opinion.
PricewaterhouseCoopers LLP
Boston, Massachusetts
February 19, 2015
39
GOLDMAN SACHS VARIABLE INSURANCE TRUST STRATEGIC INCOME FUND
| | | | | | |
| Fund Expenses — Six Month Period Ended December 31, 2014 (Unaudited) | | | | | | |
As a shareholder of Institutional, Service or Advisor Shares of the Fund, you incur ongoing costs, including management fees, distribution and service (12b-1) fees (with respect to Service and Advisor Shares) and other Fund expenses. This example is intended to help you understand your ongoing costs (in dollars) of investing in the Institutional Shares, Service Shares and Advisor Shares of the Fund and to compare these costs with the ongoing costs of investing in other mutual funds.
The example is based on an investment of $1,000 invested at the beginning of the period and held for the entire period from July 1, 2014 through December 31, 2014.
Actual Expenses — The first line under each share class in the table below provides information about actual account values and actual expenses. You may use the information in this line, together with the amount you invested, to estimate the expenses that you paid over the period. Simply divide your account value by $1,000 (for example, an $8,600 account value divided by $1,000=8.6), then multiply the result by the number in the first line under the heading entitled “Expenses Paid” to estimate the expenses you paid on your account during this period.
Hypothetical Example for Comparison Purposes — The second line under each share class in the table below provides information about hypothetical account values and hypothetical expenses based on the Fund’s actual net expense ratio and an assumed rate of return of 5% per year before expenses, which is not the Fund’s actual return. The hypothetical account values and expenses may not be used to estimate the actual ending account balance or expenses you paid for the period. You may use this information to compare the ongoing costs of investing in the Fund and other funds. To do so, compare this 5% hypothetical example with the 5% hypothetical examples that appear in the shareholder reports of the other funds.
Please note that the expenses shown in the table are meant to highlight your ongoing costs only. As a shareholder of the Fund you do not incur any transaction costs, such as sales charges, redemption fees, or exchange fees, but shareholders of other funds may incur such costs. The second line of the table is useful in comparing ongoing costs only, and will not help you determine the relative total costs of owning different funds whose shareholders may incur transaction costs.
| | | | | | | | | | | | |
| Share Class | | Beginning Account Value 7/01/14 | | | Ending Account Value 12/31/14 | | | Expenses Paid for the 6 Months Ended 12/31/14* | |
| Institutional | | | | | | | | | | | | |
| Actual | | $ | 1,000 | | | $ | 992.60 | | | $ | 4.32 | |
| Hypothetical 5% return | | | 1,000 | | | | 1,020.87 | + | | | 4.38 | |
| Service | | | | | | | | | | | | |
| Actual | | | 1,000 | | | | 991.30 | | | | 5.72 | |
| Hypothetical 5% return | | | 1,000 | | | | 1,019.46 | + | | | 5.80 | |
| Advisor | | | | | | | | | | | | |
| Actual | | | 1,000 | | | | 990.80 | | | | 6.32 | |
| Hypothetical 5% return | | | 1,000 | | | | 1,018.85 | + | | | 6.41 | |
| | * | Expenses are calculated using the Fund’s annualized net expense ratio for each class, which represents the ongoing expenses as a percentage of net assets for the six months ended December 31, 2014. Expenses are calculated by multiplying the annualized net expense ratio by the average account value for the period; then multiplying the result by the number of days in the most recent fiscal half year; and then dividing that result by the number of days in the fiscal year. The annualized net expense ratios for the period were 0.86%, 1.14% and 1.26% for the Institutional, Service and Advisor Shares, respectively. | |
| | + | Hypothetical expenses are based on the Fund’s actual annualized net expense ratios and an assumed rate of return of 5% per year before expenses. | |
40
GOLDMAN SACHS VARIABLE INSURANCE TRUST STRATEGIC INCOME FUND
Trustees and Officers (Unaudited)
Independent Trustees
| | | | | | | | | | | | |
| | | | | |
Name,
Address and Age1 | | Position(s) Held
with the Trust | | Term of Office and
Length of
Time Served2 | | Principal Occupation(s) During Past 5 Years | | Number of
Portfolios in
Fund Complex
Overseen by
Trustee3 | | | Other Directorships Held by Trustee4 |
Ashok N. Bakhru Age: 72 | | Chairman of the Board of Trustees | | Since 1996 (Trustee since 1991) | | Mr. Bakhru is retired. He was formerly Director, Apollo Investment Corporation (a business development company) (2008-2013); President, ABN Associates (a management and financial consulting firm) (1994-1996 and 1998-2012); Trustee, Scholarship America (1998-2005); Trustee, Institute for Higher Education Policy (2003-2008); Director, Private Equity Investors — III and IV (1998-2007), and Equity-Linked Investors II (April 2002-2007). Chairman of the Board of Trustees — Goldman Sachs Fund Complex. | | | 128 | | | None |
John P. Coblentz, Jr. Age: 73 | | Trustee | | Since 2003 | | Mr. Coblentz is retired. Formerly, he was Partner, Deloitte & Touche LLP (1975-2003); Director, Emerging Markets Group, Ltd. (2004-2006); and Director, Elderhostel, Inc. (2006-2012). Trustee — Goldman Sachs Fund Complex. | | | 128 | | | None |
Diana M. Daniels Age: 65 | | Trustee | | Since 2007 | | Ms. Daniels is retired. Formerly, she was Vice President, General Counsel and Secretary, The Washington Post Company (1991-2006). Ms. Daniels serves as a Presidential Councillor of Cornell University (2013-Present); Member, Advisory Board, Psychology Without Borders (international humanitarian aid organization) (2007-Present), and former Member of the Legal Advisory Board, New York Stock Exchange (2003-2006) and of the Corporate Advisory Board, Standish Mellon Management Advisors (2006-2007). Trustee — Goldman Sachs Fund Complex. | | | 108 | | | None |
Joseph P. LoRusso Age: 57 | | Trustee | | Since 2010 | | Mr. LoRusso is retired. Formerly, he was President, Fidelity Investments Institutional Services Co. (“FIIS”) (2002-2008); Director, FIIS (2002-2008); Director, Fidelity Investments Institutional Operations Company (2003-2007); Executive Officer, Fidelity Distributors Corporation (2007-2008). Trustee — Goldman Sachs Fund Complex. | | | 108 | | | None |
Herbert J. Markley Age: 64 | | Trustee | | Since 2013 | | Mr. Markley is retired. Formerly, he was Executive Vice President, Deere & Company (an agricultural and construction equipment manufacturer) (2007-2009), and President, Agricultural Division, Deere & Company (2001-2007). Trustee — Goldman Sachs Fund Complex. | | | 108 | | | None |
Jessica Palmer Age: 65 | | Trustee | | Since 2007 | | Ms. Palmer is retired. She is Director, Emerson Center for the Arts and Culture (2011-Present); and was formerly a Consultant, Citigroup Human Resources Department (2007-2008); Managing Director, Citigroup Corporate and Investment Banking (previously, Salomon Smith Barney/Salomon Brothers) (1984-2006). Ms. Palmer was a Member of the Board of Trustees of Indian Mountain School (private elementary and secondary school) (2004-2009). Trustee — Goldman Sachs Fund Complex. | | | 108 | | | None |
Richard P. Strubel Age: 75 | | Trustee | | Since 1987 | | Mr. Strubel is retired. Formerly, he was Director, Cardean Learning Group (provider of educational services via the internet) (2003-2008); and Director, Gildan Activewear Inc. (a clothing marketing and manufacturing company) (2000-2014). He serves as Trustee, Emeritus, The University of Chicago (1987-Present). Trustee — Goldman Sachs Fund Complex. | | | 128 | | | The Northern Trust Mutual Fund Complex (56 Portfolios) (Chairman of the Board of Trustees) |
| | | | | | | | | | | | |
41
GOLDMAN SACHS VARIABLE INSURANCE TRUST STRATEGIC INCOME FUND
Trustees and Officers (Unaudited) (continued)
Independent Trustees (continued)
| | | | | | | | | | | | |
| | | | | |
Name,
Address and Age1 | | Position(s) Held
with the Trust | | Term of Office and
Length of
Time Served2 | | Principal Occupation(s) During Past 5 Years | | Number of
Portfolios in
Fund Complex
Overseen by
Trustee3 | | | Other Directorships Held by Trustee4 |
Roy W. Templin Age: 54 | | Trustee | | Since 2013 | | Mr. Templin is retired. He is Chairman of the Board of Directors, Con-Way Incorporated (2012-Present); and was formerly Executive Vice President and Chief Financial Officer, Whirlpool Corporation (an appliance manufacturer and marketer) (2004-2012). Trustee — Goldman Sachs Fund Complex. | | | 108 | | | Con-Way Incorporated (a transportation, supply-chain management and logistics services company) |
| | | | | | | | | | | | |
Interested Trustees*
| | | | | | | | | | | | |
| | | | | |
Name,
Address and Age1 | | Position(s) Held
with the Trust | | Term of Office and
Length of
Time Served2 | | Principal Occupation(s) During Past 5 Years | | Number of
Portfolios in
Fund Complex
Overseen by
Trustee3 | | | Other Directorships Held by Trustee4 |
James A. McNamara Age: 52 | | President and Trustee | | Since 2007 | | Managing Director, Goldman Sachs (December 1998-Present); Director of Institutional Fund Sales, GSAM (April 1998-December 2000); and Senior Vice President and Manager, Dreyfus Institutional Service Corporation (January 1993- April 1998). President — Goldman Sachs Fund Complex (November 2007-Present); Senior Vice President — Goldman Sachs Fund Complex (May 2007-November 2007); and Vice President — Goldman Sachs Fund Complex (2001-2007). Trustee — Goldman Sachs Fund Complex (November 2007-Present and December 2002-May 2004). | | | 127 | | | None |
Alan A. Shuch Age: 65 | | Trustee | | Since 1990 | | Advisory Director — GSAM (May 1999-Present); Consultant to GSAM (December 1994-May 1999); and Limited Partner, Goldman Sachs (December 1994-May 1999). Trustee — Goldman Sachs Fund Complex. | | | 108 | | | None |
| | | | | | | | | | | | |
| * | These persons are considered to be “Interested Trustees” because they hold positions with Goldman Sachs and own securities issued by The Goldman Sachs Group, Inc. Each Interested Trustee holds comparable positions with certain other companies of which Goldman Sachs, GSAM or an affiliate thereof is the investment adviser, administrator and/or distributor. |
| 1 | Each Trustee may be contacted by writing to the Trustee, c/o Goldman Sachs, 200 West Street, New York, New York, 10282, Attn: Caroline Kraus. Information is provided as of December 31, 2014. |
| 2 | Each Trustee holds office for an indefinite term until the earliest of: (a) the election of his or her successor; (b) the date the Trustee resigns or is removed by the Board of Trustees or shareholders, in accordance with the Trust’s Declaration of Trust; (c) December 31st of the year in which the Trustee turns 74 years of age, subject to waiver by a majority of the Trustees (in accordance with the current resolutions of the Board of Trustees, which may be changed by the Trustees without shareholder vote); or (d) the termination of the Trust. By resolution of the Board of Trustees determining that an extension of service would be beneficial to the Trust, the retirement age has been extended with respect to Richard P. Strubel. |
| 3 | The Goldman Sachs Fund Complex consists of the Trust and Goldman Sachs Trust (“GST”). As of December 31, 2014, the Trust consisted of 14 portfolios and GST consisted of 94 portfolios (88 of which offered shares to the public). The Goldman Sachs Fund Complex also includes, with respect to Messrs. Bakhru, Coblentz and Strubel, Goldman Sachs Trust II (“GSTII”), Goldman Sachs BDC, Inc. (“GSBDC”), Goldman Sachs MLP Income Opportunities Fund (“GSMLP”), Goldman Sachs MLP and Energy Renaissance Fund (“GSMER”) and Goldman Sachs ETF Trust (“GSETF”), and with respect to Mr. McNamara, GSTII, GSMLP, GSMER and GSETF. GSTII consisted of 6 portfolios (one of which offered shares to the public). GSBDC, GSMLP and GSMER each consisted of one portfolio GSETF consisted of 11 portfolios (none of which offered shares to the public). As of December 31, 2014, GSBDC had not offered shares to the public. |
| 4 | This column includes only directorships of companies required to report to the Securities and Exchange Commission under the Securities Exchange Act of 1934 (i.e., “public companies”) or other investment companies registered under the Act. |
Additional information about the Trustees is available in the Fund’s Statement of Additional Information, which can be obtained from Goldman Sachs free of charge by calling this toll-free number (in the United States of America): 1-800-292-4726.
42
GOLDMAN SACHS VARIABLE INSURANCE TRUST STRATEGIC INCOME FUND
Trustees and Officers (Unaudited) (continued)
Officers of the Trust*
| | | | | | |
| | | |
Name, Address and Age1 | | Position(s) Held With the Trust | | Term of
Office and
Length of
Time Served2 | | Principal Occupation(s) During Past 5 Years |
James A. McNamara
200 West Street New York, NY 10282 Age: 52 | | President and Trustee | | Since 2007 | | Managing Director, Goldman Sachs (December 1998-Present); Director of Institutional Fund Sales, GSAM (April 1998-December 2000); and Senior Vice President and Manager, Dreyfus Institutional Service Corporation (January 1993-April 1998). President — Goldman Sachs Fund Complex (November 2007-Present); Senior Vice President — Goldman Sachs Fund Complex (May 2007-November 2007); and Vice President — Goldman Sachs Fund Complex (2001-2007). Trustee — Goldman Sachs Fund Complex (November 2007-Present and December 2002-May 2004). |
Caroline L. Kraus
200 West Street New York, NY 10282 Age: 37 | | Secretary | | Since 2012 | | Vice President, Goldman Sachs (August 2006-Present); Associate General Counsel, Goldman Sachs (2012-Present); Assistant General Counsel, Goldman Sachs (August 2006-December 2011) and Associate, Weil, Gotshal & Manges, LLP (2002-2006). Secretary — Goldman Sachs Fund Complex (August 2012-Present) and Assistant Secretary — Goldman Sachs Fund Complex (June 2012-August 2012). |
Scott M. McHugh
200 West Street New York, NY 10282 Age: 43 | | Principal Financial
Officer, Senior Vice
President and
Treasurer | | Since 2009
(Principal
Financial
Officer since
2013) | | Vice President, Goldman Sachs (February 2007-Present); Assistant Treasurer of certain mutual funds administered by DWS Scudder (2005-2007); and Director (2005-2007), Vice President (2000-2005) and Assistant Vice President (1998-2000), Deutsche Asset Management or its predecessor (1998-2007). Principal Financial Officer — Goldman Sachs Fund Complex (November 2013-Present); Treasurer — Goldman Sachs Fund Complex (October 2009-Present); Senior Vice President — Goldman Sachs Fund Complex (November 2009-Present); and Assistant Treasurer — Goldman Sachs Fund Complex (May 2007-October 2009). |
| | | | | | |
| * | Represents a partial list of officers of the Trust. Additional information about all the officers is available in the Fund’s Statement of Additional Information, which can be obtained from Goldman Sachs free of charge by calling this toll-free number (in the United States): 1-800-292-4726. |
| 1 | Information is provided as of December 31, 2014. |
| 2 | Officers hold office at the pleasure of the Board of Trustees or until their successors are duly elected and qualified. Each officer holds comparable positions with certain other companies of which Goldman Sachs, GSAM or an affiliate thereof is the investment adviser, administrator and/or distributor. |
43
GOLDMAN SACHS VARIABLE INSURANCE TRUST STRATEGIC INCOME FUND
Goldman Sachs Variable Insurance Trust — Tax Information (Unaudited)
For the year ended December 31, 2014, 0.20% of the dividends paid from net investment company taxable income by the Strategic Income Fund qualify for the dividends received deduction available to corporations.
44
| | |
| TRUSTEES | | OFFICERS |
| Ashok N. Bakhru, Chairman | | James A. McNamara, President |
John P. Coblentz, Jr. Diana M. Daniels | | Scott M. McHugh, Principal Financial Officer and Treasurer |
| Joseph P. LoRusso | | Caroline L. Kraus, Secretary |
| Herbert J. Markley | | |
| James A. McNamara | | |
| Jessica Palmer | | |
| Alan A. Shuch | | |
| Richard P. Strubel | | |
| Roy W. Templin | | |
GOLDMAN, SACHS & CO.
Distributor and Transfer Agent
GOLDMAN SACHS ASSET MANAGEMENT, L.P.
Investment Adviser
200 West Street, New York
New York 10282
Visit our web site at www.GSAMFUNDS.com to obtain the most recent month-end returns.
The reports concerning the Fund included in this shareholder report may contain certain forward-looking statements about the factors that may affect the performance of the Fund in the future. These statements are based on Fund management’s predictions and expectations concerning certain future events and their expected impact on the Fund, such as performance of the economy as a whole and of specific industry sectors, changes in the levels of interest rates, the impact of developing world events, and other factors that may influence the future performance of the Fund. Management believes these forward-looking statements to be reasonable, although they are inherently uncertain and difficult to predict. Actual events may cause adjustments in portfolio management strategies from those currently expected to be employed.
A description of the policies and procedures that the Fund uses to determine how to vote proxies relating to portfolio securities and information regarding how the Fund voted proxies relating to portfolio securities for the 12-month period ended June 30 is available (i) without charge, upon request by calling 1-800-621-2550; and (ii) on the Securities and Exchange Commission (“SEC”) web site at http://www.sec.gov.
The Fund files its complete schedule of portfolio holdings with the SEC for the first and third quarters of each fiscal year on Form N-Q. The Fund’s Form N-Qs are available on the SEC’s web site at http://www.sec.gov within 60 days after the Fund’s first and third fiscal quarters. The Fund’s Form N-Qs may be reviewed and copied at the SEC’s Public Reference Room in Washington, D.C. and information on the operation of the Public Reference Room may also be obtained by calling 1-800-SEC-0330. Form N-Qs may be obtained upon request and without charge by calling 1-800-621-2550.
The website links provided are for your convenience only and are not an endorsement or recommendation by GSAM of any of these websites or the products or services offered. GSAM is not responsible for the accuracy and validity of the content of these websites.
Fund holdings and allocations shown are as of December 31, 2014 and may not be representative of future investments. Fund holdings should not be relied on in making investment decisions and should not be construed as research or investment advice regarding particular securities. Current and future holdings are subject to risk.
References to indices, benchmarks or other measures of relative market performance over a specified period of time are provided for your information only and do not imply that the portfolio will achieve similar results. The index composition may not reflect the manner in which a portfolio is constructed. While an adviser seeks to design a portfolio which reflects appropriate risk and return features, portfolio characteristics may deviate from those of the benchmark.
The Global Industry Classification Standard (“GICS”) was developed by and is the exclusive property and a service mark of Morgan Stanley Capital International Inc. (“MSCI”) and Standard & Poor’s, a division of The McGraw-Hill Companies, Inc. (“S&P”) and is licensed for use by Goldman Sachs. Neither MSCI, S&P nor any other party involved in making or compiling the GICS or any GICS classifications makes any express or implied warranties or representations with respect to such standard or classification (or the results to be obtained by the use thereof), and all such parties hereby expressly disclaim all warranties of originality, accuracy, completeness, merchantability or fitness for a particular purpose with respect to any of such standard or classification. Without limiting any of the foregoing, in no event shall MSCI, S&P, any of their affiliates or any third party involved in making or compiling the GICS or any GICS classifications have any liability for any direct, indirect, special, punitive, consequential or any other damages (including lost profits) even if notified of the possibility of such damages.
The portfolio risk management process includes an effort to monitor and manage risk, but does not imply low risk.
Shares of the Goldman Sachs VIT Funds are offered to separate accounts of participating life insurance companies for the purpose of funding variable annuity contracts and variable life insurance policies. Shares of the Fund are not offered directly to the general public. The variable annuity contracts and variable life insurance policies are described in the separate prospectuses issued by participating insurance companies. You should refer to those prospectuses for information about surrender charges, mortality and expense risk fees and other charges that may be assessed by participating insurance companies under the variable annuity contracts or variable life insurance policies. Such fees or charges, if any, may affect the return you may realize with respect to your investments. Ask your representative for more complete information. Please consider a fund’s objectives, risks and charges and expenses, and read the prospectus carefully before investing. The prospectus contains this and other information about the Fund.
This material is not authorized for distribution to prospective investors unless preceded or accompanied by a current Prospectus or summary prospectus, if applicable. Investors should consider a Fund’s objective, risks, and charges and expenses, and read the summary prospectus, if available, and/or the Prospectus carefully before investing or sending money. The summary prospectus, if available, and the Prospectus contain this and other information about a Fund and may be obtained from your Authorized Institution or from Goldman, Sachs & Co. by calling 1-800-621-2550.
This report is prepared for the general information of contract owners and is not an offer of shares of the Goldman Sachs Variable Insurance Trust: Goldman Sachs Strategic Income Fund.
© 2015 Goldman Sachs. All rights reserved.
VITSTIAR-15/153846.MF.MED.TMPL/2/2015
Goldman
Sachs Variable Insurance Trust
Goldman Sachs
Strategic International Equity Fund
Annual Report
December 31, 2014
GOLDMAN SACHS VARIABLE INSURANCE TRUST STRATEGIC INTERNATIONAL EQUITY FUND
Principal Investment Strategies and Risks
This is not a complete list of risks that may affect the Fund. For additional information concerning the risks applicable to the Fund, please see the Fund’s Prospectuses.
Shares of the Goldman Sachs Variable Insurance Trust — Goldman Sachs Strategic International Equity Fund are offered to separate accounts of participating life insurance companies for the purpose of funding variable annuity contracts and variable life insurance policies. Shares of the Fund are not offered directly to the general public. The variable annuity contracts and variable life insurance policies are described in the separate prospectuses issued by participating insurance companies. You should refer to those prospectuses for information about surrender charges, mortality and expense risk fees and other charges that may be assessed by participating insurance companies under the variable annuity contracts or variable life insurance policies. Such fees or charges, if any, may affect the return you realize with respect to your investments. Ask your representative for more complete information. Please consider the Fund’s objective, risks and charges and expenses, and read the Prospectus carefully before investing. The Prospectus contains this and other information about the Fund.
The Goldman Sachs Strategic International Equity Fund invests primarily in a diversified portfolio of equity investments in companies that are organized outside the United States or whose securities are principally traded outside the United States. The Fund’s equity investments are subject to market risk, which means that the value of the securities in which it invests may go up or down in response to the prospects of individual companies, particular sectors and/or general economic conditions. Foreign and emerging markets investments may be more volatile and less liquid than investments in U.S. securities and are subject to the risks of currency fluctuations and adverse economic or political developments.
1
GOLDMAN SACHS VARIABLE INSURANCE TRUST STRATEGIC INTERNATIONAL EQUITY FUND
INVESTMENT OBJECTIVE
The Fund seeks long-term growth of capital.
Portfolio Management Discussion and Analysis
Below, the Goldman Sachs International Equity Portfolio Management Team discusses the Goldman Sachs Variable Insurance Trust — Goldman Sachs Strategic International Equity Fund’s (the “Fund”) performance and positioning for the 12-month period ended December 31, 2014 (the “Reporting Period”).
How did the Fund perform during the Reporting Period?
During the Reporting Period, the Fund’s Institutional and Service Shares generated average annual total returns of -7.54% and -7.70%, respectively. These returns compare to the -4.90% average annual total return of the Fund’s benchmark, the MSCI Europe, Australasia, Far East (EAFE) Index (net, USD, unhedged) (the “MSCI EAFE Index”), during the same time period.
What economic and market factors most influenced the international equity markets as a whole during the Reporting Period?
International equities, as measured by the MSCI EAFE Index, posted a return of -4.90% in U.S. dollar terms for the Reporting Period as a whole.
Diverging economies around the globe, U.S. dollar appreciation, strong merger and acquisition activity and weakening oil prices were major themes affecting international equities throughout 2014. The U.S. dollar appreciated against most major currencies, notably reducing returns of non-U.S. equities expressed in U.S. dollars. The U.S. dollar’s strength was a direct reflection of divergence in developed market economies that played out through the calendar year. Investors increasingly prepared for rising interest rates in the U.S., as its economic recovery accelerated. In Europe and Japan, however, Gross Domestic Product (“GDP”) growth disappointed. International equity markets anticipated further monetary policy easing from these regions’ respective central banks and reflected concern about the potential for deflation in Europe. On the positive side, merger and acquisition activity rose toward its prior 2007 peak and was particularly prominent in the information technology and health care sectors. However, only the health care and utilities sectors of the MSCI EAFE Index gained during the Reporting Period. The energy sector severely declined, as the international Brent crude oil price tumbled from a high of $115 per barrel in June 2014 to approximately $57 per barrel at the end of December 2014. The materials and industrials sectors, also weighed on by commodity prices pressures, were particularly weak as well.
For the Reporting Period overall, Denmark, Belgium, Singapore and Ireland were the best performing equity markets in the MSCI EAFE Index. China was the weakest equity market in the MSCI EAFE Index by a wide margin, followed at some distance by Germany, France and Italy, which also lost substantial ground.
What key factors were responsible for the Fund’s performance during the Reporting Period?
The Fund’s underperformance of the MSCI EAFE Index during the Reporting Period can be primarily attributed to individual stock selection.
Which stocks detracted significantly from the Fund’s performance during the Reporting Period?
The biggest detractors from Fund performance relative to the MSCI EAFE Index during the Reporting Period were German sports apparel, footwear and equipment manufacturer Adidas, U.K. oil and gas exploration and production company Tullow Oil and Russian supermarket retailer Magnit.
Adidas detracted most from the Fund’s results during the Reporting Period, in part due to the significant currency headwind of a weak Russian ruble and Argentine peso, which led to weaker operating margins given Adidas’ exposure to these regions. For similar reason, tensions between Russia and Ukraine caused a sell-off in the company’s stock. However, at the end of the Reporting Period, we believed the company was well positioned to benefit from an increased focus on direct-to-consumer distribution driven by online expansion. We also continued to like the company’s underlying business and were beginning to see, we believe, a change in sales momentum across most geographies.
2
GOLDMAN SACHS VARIABLE INSURANCE TRUST STRATEGIC INTERNATIONAL EQUITY FUND
Tullow Oil detracted from Fund performance during the Reporting Period. Its shares fell due to declining oil prices, which dropped significantly through the second half of 2014. A new purchase for the Fund during the Reporting Period, we sold it by the end of the Reporting Period given what we viewed as a change in its prospects ahead.
Magnit detracted from Fund performance during the Reporting Period as well. Its underperformance relative to the MSCI EAFE Index is linked to the current state of Russia, which is dealing with a combination of geopolitical tensions and the significantly lower price of oil. The situation in Russia has caused inflation to rise, which despite strong sales in 2014, caused Magnit’s stock price to take a hit.
What were some of the Fund’s best-performing individual stocks?
The greatest contributors to Fund performance relative to the MSCI EAFE Index during the Reporting Period were U.K.-based biopharmaceutical company Shire, Sweden-based truck manufacturer Scania and Japanese-based manufacturing company of sanitary napkins and baby products Unicharm.
Shire was the top contributor to the Fund’s results. During the Reporting Period, Shire rejected an acquisition offer from U.S. pharmaceuticals company AbbVie, stating it felt the proposal undervalued the company. Shire has underlined its new target to double its sales by 2020, which is higher than previous market expectations. At the end of the Reporting Period, we believed Shire’s shares offered further upside both on a stand-alone basis if its Chief Executive Officer meets his targets and also as a potential acquisition target. At the same time, we recognized there could be downward pressure if AbbVie does not proceed with another formal offer. We thus decided to take profits and sell the Fund’s position in favor of other high conviction opportunities.
Scania was a top positive contributor to the Fund’s relative results during the Reporting Period. Its shares rose after Volkswagen announced it would make an offer for the remaining outstanding shares of Scania it does not already own. We decided to take profits and sell out of the Fund’s position in favor of other high conviction opportunities.
Unicharm was another top contributor to the Fund’s relative results. Strong momentum of sales and earnings, driven by margin improvement and growth of infant-related business in China, contributed significantly to the company’s returns in 2014.
Which equity market sectors most significantly affected Fund performance?
Security selection in the financials, utilities and energy sectors detracted most from the Fund’s relative results. Effective security selection within the health care, industrials and information technology sectors contributed most positively to the Fund’s performance relative to the MSCI EAFE Index during the Reporting Period.
Which countries or regions most affected the Fund’s performance during the Reporting Period?
Typically, the Fund’s individual stock holdings will significantly influence the Fund’s performance within a particular country or region relative to the MSCI EAFE Index. This effect may be even more pronounced in countries that represent only a modest proportion of the MSCI EAFE Index.
That said, the countries that detracted most from the Fund’s performance during the Reporting Period were the U.K., Russia and Spain, where positioning overall hurt. The Fund’s effective stock selection in France and Sweden and exposure to India contributed most positively to the Fund’s returns relative to the MSCI EAFE Index.
How did the Fund use derivatives and similar instruments during the Reporting Period?
During the Reporting Period, we did not use derivatives to hedge positions or as part of an active management strategy.
Did the Fund make any significant purchases or sales during the Reporting Period?
During the Reporting Period, we established Fund positions in Mitsubishi UFJ Financial Group, Intesa Sanpaolo and Nidec.
We initiated a Fund position in Japanese banking company Mitsubishi UFJ Financial Group because, in our view, the company’s earnings momentum and attractive valuation provided an opportunistic entry point. Furthermore, we believe the company is well positioned to protect its net profit better than its competitors, as it is supported by overseas companies, such as Morgan Stanley and Bank of Ayudhya, that are linked on its balance sheet.
We initiated a Fund position in Intesa SanPaolo, the largest bank in Italy. In our view, the bank is well capitalized with a solid balance sheet, as shown by the European Central Bank’s Asset Quality Review in October 2014. We believe Intesa SanPaolo’s strong balance sheet may allow the bank to grow by gaining market share over weaker domestic players and pay an attractive dividend to shareholders. Together, we believe these factors made a compelling investment proposition.
3
GOLDMAN SACHS VARIABLE INSURANCE TRUST STRATEGIC INTERNATIONAL EQUITY FUND
We established a Fund position in Japanese comprehensive motor manufacturer Nidec. Nidec is the world’s leading manufacturer of small precision motors, mainly used in hard disc drives and optical disk drives. We expect its mid-term earnings growth to be led by its automotive and industrial motor business.
In addition to those sales already mentioned, we exited the Fund’s positions in HSBC, BNP Paribas and BP.
We sold the Fund’s position in U.K.-based diversified bank HSBC Holdings. While we think the business remains solid, regulatory pressures have been a drag on capital. We are also cautious on the increasing regulatory burden banks have been facing. In our view, such a regulatory environment may result in HSBC Holdings having to retain more capital, making it difficult for the bank to demonstrate profitability.
BNP Paribas was a strong contributor to the Fund’s results during the Reporting Period, as it announced profits before tax that were above expectations. However, after the announcement that it was under criminal investigation for violations of U.S. sanctions against Sudan, Cuba and Iran, we withdrew the Fund’s position. BNP Paribas was subsequently fined $9 billion.
We eliminated the Fund’s position in U.K-based energy company BP upon the court ruling that the company had been found guilty of gross negligence with respect to the Gulf of Mexico oil spill in 2010. The gross negligence ruling was unexpected by us and the market, as the vast majority of independent studies conducted in the lead-up to the trial had determined the oil spill was the result of a series of operational mistakes but not gross negligence. The ruling subjects BP to the possibility of a much higher fine under the Clean Water Act and was another indicator of BP not faring well in the litigation process surrounding the Gulf of Mexico spill. With the company consistently losing its legal battles with the claimants’ trust and the forthcoming trials with the Gulf Coast states still looming, we felt the risk of higher fines and penalties had become significantly higher.
Were there any notable changes in the Fund’s weightings during the Reporting Period?
In constructing the Fund’s portfolio, we focus on picking stocks rather than on making regional, country, sector or industry bets. We seek to outpace the benchmark index by overweighting stocks that we expect to outperform and underweighting those that we think may lag. Consequently, changes in its sector or country weights are generally the direct result of individual stock selection or of stock appreciation or depreciation. That said, there were no notable changes in the Fund’s sector or country weightings during the Reporting Period.
How was the Fund positioned relative to its benchmark index at the end of the Reporting Period?
At the end of December 2014, the Fund had greater weightings than the MSCI EAFE Index in the consumer staples and information technology sectors. The Fund had underweighted allocations to the consumer discretionary, financials, utilities and industrials sectors and was rather neutrally weighted to the MSCI EAFE Index in the materials, energy, health care and telecommunication services sectors at the end of the Reporting Period.
From a country perspective, the Fund had greater positions in Belgium, South Korea, Ireland, Sweden, Taiwan and India relative to the MSCI EAFE Index at the end of December 2014. The Fund had less exposure to the U.K., Hong Kong, Australia, Germany and the Netherlands than the MSCI EAFE Index at the end of the Reporting Period. On the same date, the Fund had rather neutral exposures to the remaining components of the MSCI EAFE Index.
As always, we remained focused on individual stock selection, with sector and country positioning being a secondary, but closely monitored, effect.
Were there any changes to the Fund’s portfolio management team during the Reporting Period?
During the Reporting Period, Edward Perkin, managing director and chief investment officer (“CIO”) of International and Emerging Markets Equity and a lead portfolio manager of the Fund, left the firm. Suneil Mahindru, current lead portfolio manager for the firm’s Global Equity Partners strategy, became the CIO of International Equity and was named a lead portfolio manager on the Fund with Alexis Deladerriere.
What is the Fund’s tactical view and strategy for the months ahead?
We believe many of the trends that drove equities higher in 2014 — a slowly improving global economy, increased growth spending and rising corporate earnings — may well continue to influence equity returns in 2015. In addition, diverging central bank policies, U.S. dollar strength and a dramatic drop in commodity prices, notably oil, appear to be shaping up as macro themes that may also drive equities in the coming year. We believe that equity returns will once again look attractive when compared to the low expected returns for bonds, cash and commodities.
4
GOLDMAN SACHS VARIABLE INSURANCE TRUST STRATEGIC INTERNATIONAL EQUITY FUND
Indeed, in our view, improving global economic growth, led by the U.S., may be a tailwind for equities and support further earnings growth, which we expect to be the main driver of higher prices. While there is a case for possible multiple expansion, we are not counting on re-rating to drive stocks higher. (Re-rating is when the market changes its view of a company sufficiently to make calculation ratios, such as its price/earnings ratio, substantially higher or lower.) We believe “animal spirits” (or the human emotion that drives consumer confidence) will continue to drive the bull market, supported by healthy merger and acquisition activity and capital expenditure expansion. Companies in the information technology and health care sectors may still benefit from these trends, but stock prices have already risen in these sectors, which may limit upside potential and compel us to look to other areas of the market, such as financials.
U.S. shale oil production has increased to the point where a dip in global demand has sent oil prices sharply lower. While energy stocks were hard hit during 2014, we are seeking opportunities to invest, given what we view as a wide range of individual company prospects. Similarly, we are actively considering which other industries and economies may benefit from lower oil prices and which ones might be negatively impacted.
For much of 2014, there were a number of factors hindering global consumption, despite our bullish long-term view on the consumer. At the end of the Reporting Period, however, we saw lower oil prices as a possible, if not probable, catalyst to spur consumption. A consumer comeback in the U.S. is particularly meaningful to U.S. GDP and may therefore have global implications because of the size of the U.S. economy. Yet, at the end of the Reporting Period, the U.S. stock market appeared to already reflect some of this positive scenario, while European stock markets appeared to reflect dire sentiment on Europe. We believe European corporate earnings may benefit from improving U.S. consumption and therein may lie the investment opportunity. In addition, both the euro and yen depreciated meaningfully against the U.S. dollar in 2014, and we expect these currencies to remain relatively weak, which should, we believe, benefit exports in both countries and contribute to corporate earnings growth.
As always, we seek companies that we believe will generate long-term growth in today’s ever-changing market conditions.
5
FUND BASICS
Strategic International Equity Fund
as of December 31, 2014
STANDARDIZED TOTAL RETURNS1
| | | | | | | | | | | | | | | | | | |
| For the period ended 12/31/14 | | One Year | | | Five Years | | | Ten Years | | | Since Inception | | | Inception Date |
| Institutional | | | -7.54 | % | | | 5.47 | % | | | 3.12 | % | | | 3.60 | % | | 1/12/98 |
| Service | | | -7.70 | | | | 5.21 | | | | N/A | | | | 1.21 | | | 1/09/06 |
| 1 | The Standardized Total Returns are average annual total returns as of the most recent calendar quarter-end. They assume reinvestment of all distributions at net asset value. Because Institutional Shares and Service Shares do not involve a sales charge, such a charge is not applied to their Standardized Total Returns. |
Total return figures in the above chart represent past performance and do not indicate future results, which will vary. The investment return and principal value of an investment will fluctuate and, therefore, an investor’s shares, when redeemed, may be worth more or less than their original cost. Current performance may be lower or higher than the total return figures in the above chart. Please visit www.GSAMFUNDS.com to obtain the most recent month-end returns.
Performance reflects fee waivers and/or expense limitations in effect during the periods shown. In their absence, performance would be reduced.
EXPENSE RATIOS2
| | | | | | | | | | |
| | | Net Expense Ratio (Current) | | | Gross Expense Ratio (Before Waivers) | | | |
| Institutional | | | 0.97 | % | | | 1.08 | % | | |
| Service | | | 1.22 | | | | 1.33 | | | |
| 2 | The expense ratios of the Fund, both current (net of any fee waivers or expense limitations) and before waivers (gross of any fee waivers or expense limitations) are as set forth above. Pursuant to a contractual arrangement, the Fund’s waivers and/or expense limitations will remain in place through at least April 30, 2015 and prior to such date the Investment Adviser may not terminate the arrangements without the approval of the Fund’s Board of Trustees. If these arrangements are discontinued in the future, the expense ratios may change without shareholder approval. |
TOP TEN HOLDINGS AS OF 12/31/143
| | | | | | | | |
| Holding | | % of Net Assets | | | Line of Business | | Country |
| iShares MSCI Japan Fund | | | 4.8% | | | Exchange Traded Fund | | United States |
| Novartis AG (Registered) | | | 4.4 | | | Pharmaceuticals, Biotechnology & Life Sciences | | Switzerland |
| iShares MSCI EAFE Fund | | | 3.9 | | | Exchange Traded Fund | | United States |
| Vodafone Group PLC | | | 3.0 | | | Telecommunication Services | | United Kingdom |
| Anheuser-Busch InBev NV | | | 2.8 | | | Food, Beverage & Tobacco | | Belgium |
| Mitsubishi UFJ Financial Group, Inc. | | | 2.5 | | | Banks | | Japan |
| Bayer AG (Registered) | | | 2.5 | | | Pharmaceuticals, Biotechnology & Life Sciences | | Germany |
| Computershare Ltd. | | | 2.4 | | | Software & Services | | Australia |
| Novo Nordisk A/S Class B | | | 2.4 | | | Pharmaceuticals, Biotechnology & Life Sciences | | Denmark |
| Total SA | | | 2.3 | | | Energy | | France |
| 3 | The top 10 holdings may not be representative of the Fund’s future investments. |
6
FUND BASICS
FUND vs. BENCHMARK SECTOR ALLOCATIONS4
As of December 31, 2014
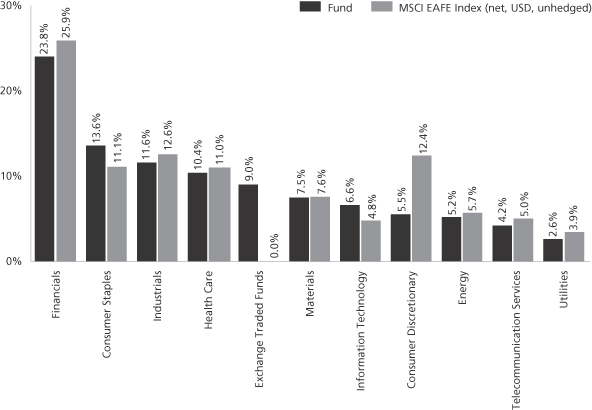
| 4 | The Fund is actively managed and, as such, its composition may differ over time. Consequently, the Fund’s overall sector allocations may differ from percentages contained in the graph above. The graph categorizes investments using Global Industry Classification Standard (“GICS”), however, the sector classifications used by the portfolio management team may differ from GICS. Underlying sector allocations of exchange traded funds held by the Fund, if any, are not reflected in the graph above. The percentage shown for each investment category reflects the value of investments in that category as a percentage of total market value. The graph depicts the Fund’s investments but may not represent the Fund’s market exposure due to the exclusion of certain derivatives, if any, as listed in the Additional Investment Information section of the Schedule of Investments. |
7
GOLDMAN SACHS VARIABLE INSURANCE TRUST STRATEGIC INTERNATIONAL EQUITY FUND
Performance Summary
December 31, 2014
The following graph shows the value, as of December 31, 2014, of a $10,000 investment made on January 1, 2005 in the Institutional Shares at NAV. For comparative purposes, the performance of the Fund’s benchmark, the MSCI EAFE Index (unhedged, net, with distributions reinvested), is shown. This performance data represents past performance and should not be considered indicative of future performance, which will fluctuate with changes in market conditions. These performance fluctuations will cause an investor’s shares, when redeemed, to be worth more or less than their original cost. Performance reflects Fund level expenses but does not reflect fees and expenses associated with any variable annuity contract or variable life insurance policy that uses the Fund as an investment option for any contract or policy. Had performance reflected all of those fees and expenses, performance would have been reduced. Performance reflects applicable fee waivers and/or expense limitations in effect during the periods shown, and in their absence performance would be reduced. Performance of Service Shares will vary from Institutional Shares due to differences in class specific fees. In addition to the Investment Adviser’s decisions regarding issuer/industry/country investment selection and allocation, other factors may affect Fund performance. These factors include, but are not limited to, Fund operating fees and expenses, portfolio turnover, and subscription and redemption cash flows affecting the Fund.
Strategic International Equity Fund’s 10 Year Performance
Performance of a $10,000 investment, with distributions reinvested, from January 1, 2005 through December 31, 2014.
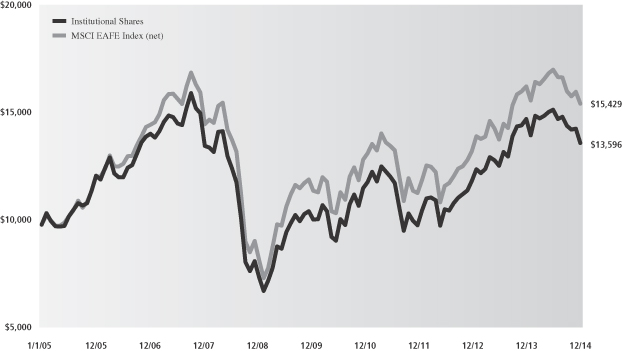
| | | | | | | | |
| Average Annual Total Return through December 31, 2014 | | One Year | | Five Years | | Ten Years | | Since Inception |
Institutional (Commenced January 12, 1998) | | -7.54% | | 5.47% | | 3.12% | | 3.60% |
Service (Commenced January 9, 2006) | | -7.70% | | 5.21% | | N/A | | 1.21% |
8
GOLDMAN SACHS VARIABLE INSURANCE TRUST STRATEGIC INTERNATIONAL EQUITY FUND
Schedule of Investments
December 31, 2014
| | | | | | | | |
Shares | | | Description | | Value | |
| | Common Stocks – 89.2% | |
| Australia – 5.6% | |
| | 702,693 | | | Aurizon Holdings Ltd. (Transportation) | | $ | 2,629,670 | |
| | 111,701 | | | Australia & New Zealand Banking Group Ltd. (Banks) | | | 2,906,456 | |
| | 428,579 | | | Computershare Ltd. (Software & Services) | | | 4,099,638 | |
| | | | | | | | |
| | | | | | | 9,635,764 | |
| | |
| Belgium – 3.9% | |
| | 43,794 | | | Anheuser-Busch InBev NV (Food, Beverage & Tobacco) | | | 4,928,637 | |
| | 13,995 | | | Solvay SA (Materials) | | | 1,893,735 | |
| | | | | | | | |
| | | | | | | 6,822,372 | |
| | |
| China – 0.7% | |
| | 305,000 | | | China Mengniu Dairy Co. Ltd. (Food, Beverage & Tobacco) | | | 1,255,877 | |
| | |
| Denmark – 2.3% | |
| | 96,304 | | | Novo Nordisk A/S Class B (Pharmaceuticals, Biotechnology & Life Sciences) | | | 4,073,638 | |
| | |
| France – 9.3% | |
| | 20,342 | | | Air Liquide SA (Materials) | | | 2,517,113 | |
| | 14,851 | | | Air Liquide SA-Prime De Fidelite (Materials)* | | | 1,837,658 | |
| | 77,188 | | | Klepierre (REIT) | | | 3,314,313 | |
| | 46,993 | | | Safran SA (Capital Goods) | | | 2,899,231 | |
| | 18,397 | | | Sanofi (Pharmaceuticals, Biotechnology & Life Sciences) | | | 1,677,263 | |
| | 76,604 | | | Total SA (Energy) | | | 3,924,578 | |
| | | | | | | | |
| | | | | | | 16,170,156 | |
| | |
| Germany – 7.6% | |
| | 20,113 | | | Adidas AG (Consumer Durables & Apparel) | | | 1,396,758 | |
| | 32,300 | | | Bayer AG (Registered) (Pharmaceuticals, Biotechnology & Life Sciences) | | | 4,402,763 | |
| | 40,206 | | | Beiersdorf AG (Household & Personal Products) | | | 3,264,487 | |
| | 40,159 | | | GEA Group AG (Capital Goods) | | | 1,765,638 | |
| | 24,614 | | | Leoni AG (Automobiles & Components) | | | 1,453,918 | |
| | 12,823 | | | Rocket Internet AG (Software & Services)*(a) | | | 797,391 | |
| | | | | | | | |
| | | | | | | 13,080,955 | |
| | |
| India – 1.2% | |
| | 121,076 | | | Thermax Ltd. (Capital Goods) | | | 2,048,831 | |
| | |
| Ireland – 2.5% | |
| | 4,430,995 | | | Bank of Ireland (Banks)* | | | 1,660,409 | |
| | 37,587 | | | Kerry Group PLC Class A (Food, Beverage & Tobacco) | | | 2,596,742 | |
| | | | | | | | |
| | | | | | | 4,257,151 | |
| | |
| | Common Stocks – (continued) | |
| Italy – 3.0% | |
| | 117,374 | | | Banco Popolare SC (Banks)* | | $ | 1,412,214 | |
| | 1,281,722 | | | Intesa Sanpaolo SpA (Banks) | | | 3,718,151 | |
| | | | | | | | |
| | | | | | | 5,130,365 | |
| | |
| Japan – 15.4% | |
| | 101,100 | | | Credit Saison Co. Ltd. (Diversified Financials) | | | 1,880,097 | |
| | 14,900 | | | Disco Corp. (Semiconductors & Semiconductor Equipment) | | | 1,191,740 | |
| | 94,700 | | | Japan Tobacco, Inc. (Food, Beverage & Tobacco) | | | 2,606,408 | |
| | 31,600 | | | KDDI Corp. (Telecommunication Services) | | | 1,985,240 | |
| | 134,000 | | | Kubota Corp. (Capital Goods) | | | 1,944,980 | |
| | 801,800 | | | Mitsubishi UFJ Financial Group, Inc. (Banks) | | | 4,405,273 | |
| | 57,100 | | | Nidec Corp. (Capital Goods) | | | 3,687,841 | |
| | 50,800 | | | Pola Orbis Holdings, Inc. (Household & Personal Products) | | | 2,030,377 | |
| | 375,000 | | | Sumitomo Osaka Cement Co. Ltd. (Materials) | | | 1,071,019 | |
| | 359,600 | | | Tokyu Fudosan Holdings Corp. (Real Estate) | | | 2,495,016 | |
| | 137,400 | | | Unicharm Corp. (Household & Personal Products) | | | 3,293,354 | |
| | | | | | | | |
| | | | | | | 26,591,345 | |
| | |
| Netherlands – 2.9% | |
| | 378,154 | | | Aegon NV (Insurance) | | | 2,842,195 | |
| | 67,754 | | | Royal Dutch Shell PLC Class A (Energy) | | | 2,261,146 | |
| | | | | | | | |
| | | | | | | 5,103,341 | |
| | |
| Russia – 0.8% | |
| | 8,578 | | | Magnit OJSC (Food & Staples Retailing)* | | | 1,355,753 | |
| | |
| Singapore – 1.3% | |
| | 150,921 | | | DBS Group Holdings Ltd. (Banks) | | | 2,336,457 | |
| | |
| South Korea – 2.3% | |
| | 53,560 | | | Hana Financial Group, Inc. (Banks) | | | 1,551,220 | |
| | 51,918 | | | Kia Motors Corp. (Automobiles & Components)* | | | 2,466,935 | |
| | | | | | | | |
| | | | | | | 4,018,155 | |
| | |
| Spain – 4.4% | |
| | 260,455 | | | Banco Bilbao Vizcaya Argentaria SA (Banks) | | | 2,459,843 | |
| | 425,038 | | | Banco Popular Espanol SA (Banks) | | | 2,118,743 | |
| | 440,974 | | | Iberdrola SA (Utilities) | | | 2,972,493 | |
| | | | | | | | |
| | | | | | | 7,551,079 | |
| | |
| Sweden – 5.1% | |
| | 61,187 | | | Hennes & Mauritz AB Class B (Retailing) | | | 2,542,015 | |
| | |
| | |
| The accompanying notes are an integral part of these financial statements. | | 9 |
GOLDMAN SACHS VARIABLE INSURANCE TRUST STRATEGIC INTERNATIONAL EQUITY FUND
Schedule of Investments (continued)
December 31, 2014
| | | | | | | | |
Shares | | | Description | | Value | |
| | Common Stocks – (continued) | |
| Sweden – (continued) | |
| | 81,339 | | | Svenska Cellulosa AB SCA Class B (Household & Personal Products) | | $ | 1,753,563 | |
| | 231,094 | | | Telefonaktiebolaget LM Ericsson Class B (Technology Hardware & Equipment) | | | 2,798,111 | |
| | 153,458 | | | Volvo AB Class B (Capital Goods) | | | 1,654,813 | |
| | | | | | | | |
| | | | | | | 8,748,502 | |
| | |
| Switzerland – 11.9% | |
| | 68,974 | | | Credit Suisse Group AG (Registered) (Diversified Financials)* | | | 1,732,713 | |
| | 53,305 | | | Julius Baer Group Ltd. (Diversified Financials)* | | | 2,433,800 | |
| | 81,226 | | | Novartis AG (Registered) (Pharmaceuticals, Biotechnology & Life Sciences) | | | 7,533,182 | |
| | 8,945 | | | Syngenta AG (Registered) (Materials) | | | 2,877,228 | |
| | 177,692 | | | UBS Group AG (Diversified Financials)* | | | 3,054,472 | |
| | 52,426 | | | Wolseley PLC (Capital Goods) | | | 2,997,288 | |
| | | | | | | | |
| | | | | | | 20,628,683 | |
| | |
| Taiwan – 1.3% | |
| | 161,000 | | | MediaTek, Inc. (Semiconductors & Semiconductor Equipment) | | | 2,340,526 | |
| | |
| United Kingdom – 7.7% | |
| | 197,517 | | | BG Group PLC (Energy) | | | 2,643,113 | |
| | 194,080 | | | Drax Group PLC (Utilities) | | | 1,389,788 | |
| | 452,292 | | | ITV PLC (Media) | | | 1,508,718 | |
| | 55,912 | | | Rio Tinto PLC (Materials) | | | 2,577,378 | |
| | 1,506,812 | | | Vodafone Group PLC (Telecommunication Services) | | | 5,166,296 | |
| | | | | | | | |
| | | | | | | 13,285,293 | |
| | |
| | TOTAL COMMON STOCKS | |
| | (Cost $157,654,713) | | $ | 154,434,243 | |
| | |
| | | | | | | | |
| | Exchange Traded Funds – 8.8% | |
| United States – 8.8% | |
| | 112,300 | | | iShares MSCI EAFE Fund | | $ | 6,832,332 | |
| | 745,778 | | | iShares MSCI Japan Fund | | | 8,382,545 | |
| | |
| | TOTAL EXCHANGE TRADED FUNDS | |
| | (Cost $15,574,568) | | �� | 15,214,877 | |
| | |
| | | | | | | | | | | | |
| Units | | | Description | | Expiration
Month | | | Value | |
| | Right – 0.0% | |
| Spain – 0.0% | |
| | 260,455 | | | Banco Bilbao Vizcaya Argentaria SA (Banks)* | | | 01/15 | | | $ | 24,898 | |
| | (Cost $0) | |
| | |
| | TOTAL INVESTMENTS – 98.0% | |
| | (Cost $173,229,281) | | | $ | 169,674,018 | |
| | |
| OTHER ASSETS IN EXCESS OF
LIABILITIES – 2.0% |
| | | 3,427,792 | |
| | |
| | NET ASSETS – 100.0% | | | $ | 173,101,810 | |
| | |
| | |
| The percentage shown for each investment category reflects the value of investments in that category as a percentage of net assets. |
| * | | Non-income producing security. |
| (a) | | Exempt from registration under Rule 144A of the Securities Act of 1933. Under procedures approved by the Board of Trustees, such securities have been determined to be liquid by the Investment Adviser and may be resold, normally to qualified institutional buyers in transactions exempt from registration. Total market value of Rule 144A securities amounts to $797,391, which represents approximately 0.5% of net assets as of December 31, 2014. |
| | |
| Investment Abbreviation: |
| REIT | | —Real Estate Investment Trust |
| | |
| 10 | | The accompanying notes are an integral part of these financial statements. |
GOLDMAN SACHS VARIABLE INSURANCE TRUST STRATEGIC INTERNATIONAL EQUITY FUND
Statement of Assets and Liabilities
December 31, 2014
| | | | |
| | | | |
| Assets: | |
Investments, at value (cost $173,229,281) | | | $169,674,018 | |
Cash | | | 3,279,473 | |
Foreign currencies, at value (cost $126,956) | | | 119,347 | |
Receivables: | | | | |
Dividends | | | 289,110 | |
Foreign tax reclaims | | | 217,364 | |
Fund shares sold | | | 1,987 | |
Reimbursement from investment adviser | | | 900 | |
Other assets | | | 6,480 | |
| Total assets | | | 173,588,679 | |
| | | | |
| | | | |
| Liabilities: | |
Payables: | | | | |
Management fees | | | 126,243 | |
Foreign capital gains taxes | | | 117,690 | |
Fund shares redeemed | | | 110,569 | |
Distribution and Service fees and Transfer Agent fees | | | 30,439 | |
Accrued expenses | | | 101,928 | |
| Total liabilities | | | 486,869 | |
| | | | |
| | | | |
| Net Assets: | | | |
Paid-in capital | | | 264,037,460 | |
Undistributed net investment income | | | 496,785 | |
Accumulated net realized loss | | | (87,759,075 | ) |
Net unrealized loss | | | (3,673,360 | ) |
| NET ASSETS | | | $173,101,810 | |
Net Assets: | | | | |
Institutional | | | $46,871,371 | |
Service | | | 126,230,439 | |
Total Net Assets | | | $173,101,810 | |
Shares of beneficial interest outstanding $0.001 par value (unlimited shares authorized): | | | | |
Institutional | | | 5,061,368 | |
Service | | | 13,603,144 | |
Net asset value, offering and redemption price per share: | | | | |
Institutional | | | $9.26 | |
Service | | | 9.28 | |
| | |
| The accompanying notes are an integral part of these financial statements. | | 11 |
GOLDMAN SACHS VARIABLE INSURANCE TRUST STRATEGIC INTERNATIONAL EQUITY FUND
Statement of Operations
For the Fiscal Year Ended December 31, 2014
| | | | |
| | | | |
| Investment income: | | | |
| |
Dividends (net of foreign taxes withheld of $551,215) | | $ | 9,269,055 | |
| | | | |
| | | | |
| Expenses: | | | |
Management fees | | | 1,670,324 | |
Distribution and Service fees — Service Class | | | 356,397 | |
Custody, accounting and administrative services | | | 132,926 | |
Professional fees | | | 83,444 | |
Printing and mailing costs | | | 47,615 | |
Transfer Agent fees(a) | | | 39,298 | |
Trustee fees | | | 23,303 | |
Other | | | 45,718 | |
| Total expenses | | | 2,399,025 | |
Less — expense reductions | | | (103,303 | ) |
| Net expenses | | | 2,295,722 | |
| NET INVESTMENT INCOME | | | 6,973,333 | |
| | | | |
| | | | |
| Realized and unrealized gain (loss): | | | |
Net realized gain (loss) from: | | | | |
Investments | | | 10,940,813 | |
Foreign currency transactions | | | (83,551 | ) |
Net change in unrealized loss on: | | | | |
Investments (including the effects of the net change in the foreign capital gains tax liability of $88,412) | | | (32,387,721 | ) |
Foreign currency translation | | | (42,171 | ) |
| Net realized and unrealized loss | | | (21,572,630 | ) |
| NET DECREASE IN NET ASSETS RESULTING FROM OPERATIONS | | $ | (14,599,297 | ) |
(a) Institutional and Service Shares had Transfer Agent fees of $10,789 and $28,509, respectively.
| | |
| 12 | | The accompanying notes are an integral part of these financial statements. |
GOLDMAN SACHS VARIABLE INSURANCE TRUST STRATEGIC INTERNATIONAL EQUITY FUND
Statements of Changes in Net Assets
| | | | | | | | |
| | | For the
Fiscal Year Ended
December 31, 2014 | | | For the
Fiscal Year Ended
December 31, 2013 | |
| | | | | | | | |
| From operations: | | | | | | |
Net investment income | | $ | 6,973,333 | | | $ | 3,017,499 | |
Net realized gain | | | 10,857,262 | | | | 27,808,337 | |
Net change in unrealized gain (loss) | | | (32,429,892 | ) | | | 12,681,334 | |
| Net increase (decrease) in net assets resulting from operations | | | (14,599,297 | ) | | | 43,507,170 | |
| | | | | | | | |
| | | | | | | | |
| Distributions to shareholders: | | | | | | |
From net investment income | | | | | | | | |
Institutional Shares | | | (1,864,061 | ) | | | (1,024,417 | ) |
Service Shares | | | (4,656,225 | ) | | | (2,275,071 | ) |
| Total distributions to shareholders | | | (6,520,286 | ) | | | (3,299,488 | ) |
| | | | | | | | |
| | | | | | | | |
| From share transactions: | | | | | | |
Proceeds from sales of shares | | | 5,634,642 | | | | 3,694,114 | |
Reinvestment of distributions | | | 6,520,286 | | | | 3,299,488 | |
Cost of shares redeemed | | | (29,633,821 | ) | | | (31,622,722 | ) |
| Net decrease in net assets resulting from share transactions | | | (17,478,893 | ) | | | (24,629,120 | ) |
| TOTAL INCREASE (DECREASE) | | | (38,598,476 | ) | | | 15,578,562 | |
| | | | | | | | |
| | | | | | | | |
| Net assets: | | | | | | |
| | |
Beginning of year | | | 211,700,286 | | | | 196,121,724 | |
End of year | | $ | 173,101,810 | | | $ | 211,700,286 | |
| Undistributed net investment income | | $ | 496,785 | | | $ | 156,567 | |
| | |
| The accompanying notes are an integral part of these financial statements. | | 13 |
GOLDMAN SACHS VARIABLE INSURANCE TRUST STRATEGIC INTERNATIONAL EQUITY FUND
Financial Highlights
Selected Data for a Share Outstanding Throughout Each Year
| | | | | | | | | | | | | | | | | | | | | | | | | | | | | | | | | | | | | | | | | | | | | | | | |
| | | | | | Income (loss) from
investment operations | | | | | | | | | | | | | | | | | | | |
| Year - Share Class | | Net asset value, beginning of year | | | Net investment income(a) | | | Net
realized and
unrealized gain (loss) | | | Total from investment operations | | | Distributions to
shareholders
from net investment income | | | Net asset value, end of year | | | Total return(b) | | | Net assets, end of year (in 000s) | | | Ratio of net expenses to average net assets | | | Ratio of total expenses to average net assets | | | Ratio of net investment income
to average
net assets | | | Portfolio
turnover
rate(c) | |
FOR THE FISCAL YEARS ENDED DECEMBER 31, | |
2014 - Institutional | | $ | 10.43 | | | $ | 0.39 | (d) | | $ | (1.18 | ) | | $ | (0.79 | ) | | $ | (0.38 | ) | | $ | 9.26 | | | | (7.54 | )% | | $ | 46,871 | | | | 0.99 | % | | | 1.04 | % | | | 3.75 | %(d) | | | 74 | % |
2014 - Service | | | 10.44 | | | | 0.36 | (d) | | | (1.17 | ) | | | (0.81 | ) | | | (0.35 | ) | | | 9.28 | | | | (7.70 | ) | | | 126,230 | | | | 1.24 | | | | 1.29 | | | | 3.47 | (d) | | | 74 | |
2013 - Institutional | | | 8.56 | | | | 0.16 | | | | 1.89 | | | | 2.05 | | | | (0.18 | ) | | | 10.43 | | | | 24.20 | | | | 59,187 | | | | 0.98 | | | | 1.05 | | | | 1.67 | | | | 95 | |
2013 - Service | | | 8.57 | | | | 0.13 | | | | 1.90 | | | | 2.03 | | | | (0.16 | ) | | | 10.44 | | | | 23.73 | | | | 152,513 | | | | 1.23 | | | | 1.30 | | | | 1.42 | | | | 95 | |
2012 - Institutional | | | 7.20 | | | | 0.16 | | | | 1.38 | | | | 1.54 | | | | (0.18 | ) | | | 8.56 | | | | 21.17 | | | | 56,872 | | | | 0.97 | | | | 1.03 | | | | 2.06 | | | | 110 | |
2012 - Service | | | 7.22 | | | | 0.14 | | | | 1.37 | | | | 1.51 | | | | (0.16 | ) | | | 8.57 | | | | 20.82 | | | | 139,250 | | | | 1.22 | | | | 1.28 | | | | 1.80 | | | | 110 | |
2011 - Institutional | | | 8.82 | | | | 0.26 | (e) | | | (1.59 | ) | | | (1.33 | ) | | | (0.29 | ) | | | 7.20 | | | | (15.05 | ) | | | 55,954 | | | | 0.99 | | | | 1.04 | | | | 3.03 | (e) | | | 143 | |
2011 - Service | | | 8.83 | | | | 0.24 | (e) | | | (1.58 | ) | | | (1.34 | ) | | | (0.27 | ) | | | 7.22 | | | | (15.16 | ) | | | 125,991 | | | | 1.24 | | | | 1.29 | | | | 2.80 | (e) | | | 143 | |
2010 - Institutional | | | 8.11 | | | | 0.11 | | | | 0.73 | | | | 0.84 | | | | (0.13 | ) | | | 8.82 | | | | 10.36 | | | | 77,558 | | | | 1.02 | | | | 1.05 | | | | 1.38 | | | | 112 | |
2010 - Service | | | 8.12 | | | | 0.09 | | | | 0.73 | | | | 0.82 | | | | (0.11 | ) | | | 8.83 | | | | 10.09 | | | | 159,214 | | | | 1.27 | | | | 1.30 | | | | 1.13 | | | | 112 | |
| (a) | Calculated based on the average shares outstanding methodology. |
| (b) | Assumes investment at the net asset value at the beginning of the year, reinvestment of all distributions, and a complete redemption of the investment at the net asset value at the end of the year. |
| (c) | The Fund’s portfolio turnover rate is calculated in accordance with regulatory requirements, without regard to transactions involving short term investments and certain derivatives. If such transactions were included, the Fund’s portfolio turnover rate may be higher. |
| (d) | Reflects income recognized from a corporate action which amounted to $0.22 per share and 2.10% of average net assets. |
| (e) | Reflects income recognized from a corporate action which amounted to $0.11 per share and 1.33% of average net assets. |
| | | | |
| The accompanying notes are an integral part of these financial statements. | | 14 | | |
GOLDMAN SACHS VARIABLE INSURANCE TRUST STRATEGIC INTERNATIONAL EQUITY FUND
Notes to Financial Statements
December 31, 2014
1. ORGANIZATION
Goldman Sachs Variable Insurance Trust (the “Trust” or “VIT”) is a Delaware statutory trust registered under the Investment Company Act of 1940, as amended (the “Act”), as an open-end management investment company. The Trust includes the Goldman Sachs Strategic International Equity Fund (the “Fund”). The Fund is a diversified portfolio under the Act offering two classes of shares — Institutional and Service Shares. Shares of the Trust are offered to separate accounts of participating life insurance companies for the purpose of funding variable annuity contracts and variable life insurance policies.
Goldman Sachs Asset Management International (“GSAMI”), an affiliate of Goldman, Sachs & Co. (“Goldman Sachs”), serves as investment adviser to the Fund pursuant to a management agreement (the “Agreement”) with the Trust.
2. SIGNIFICANT ACCOUNTING POLICIES
The financial statements have been prepared in accordance with accounting principles generally accepted in the United States of America (“GAAP”) and require management to make estimates and assumptions that may affect the reported amounts and disclosures. Actual results may differ from those estimates and assumptions.
A. Investment Valuation — The Fund’s valuation policy is to value investments at fair value.
B. Investment Income and Investments — Investment income includes interest income and dividend income, net of any foreign withholding taxes, less any amounts reclaimable. Interest income is accrued daily and adjusted for amortization of premiums and accretion of discounts. Dividend income is recognized on ex-dividend date or, for certain foreign securities, as soon as such information is obtained subsequent to the ex-dividend date. Investment transactions are reflected on trade date. Realized gains and losses are calculated using identified cost. Investment transactions are recorded on the following business day for daily net asset value (“NAV”) calculations. Any foreign capital gains tax is accrued daily based upon net unrealized gains, and is payable upon sale of such investments. Distributions received from the Funds’ investments in U.S. real estate investment trusts (“REITs”) may be characterized as ordinary income, net capital gain or a return of capital. A return of capital is recorded by the Funds as a reduction to the cost basis of the REIT.
C. Class Allocations and Expenses — Investment income, realized and unrealized gain (loss), and non-class specific expenses of the Fund are allocated daily based upon the proportion of net assets of each class. Class specific expenses, where applicable, are borne by the respective share classes and include Distribution and Service and Transfer Agent fees. Non-class specific expenses directly incurred by a Fund are charged to that Fund, while such expenses incurred by the Trust are allocated across the respective Funds on a straight-line and/or pro-rata basis depending upon the nature of the expenses.
D. Federal Taxes and Distributions to Shareholders — It is the Fund’s policy to comply with the requirements of the Internal Revenue Code of 1986, as amended (the “Code”), applicable to regulated investment companies (mutual funds) and to distribute each year substantially all of its investment company taxable income and capital gains to its shareholders. Accordingly, the Fund is not required to make any provisions for the payment of federal income tax. Distributions to shareholders are recorded on the ex-dividend date. Income and capital gains distributions, if any, are declared and paid annually.
Net capital losses are carried forward to future fiscal years and may be used to the extent allowed by the Code to offset any future capital gains. Utilization of capital loss carryforwards will reduce the requirement of future capital gains distributions.
15
GOLDMAN SACHS VARIABLE INSURANCE TRUST STRATEGIC INTERNATIONAL EQUITY FUND
Notes to Financial Statements (continued)
December 31, 2014
2. SIGNIFICANT ACCOUNTING POLICIES (continued)
Under the Regulated Investment Company Modernization Act of 2010, the Fund is permitted to carry forward capital losses incurred in taxable years beginning after December 22, 2010 for an unlimited period. However, any losses incurred during those future taxable years will be required to be utilized prior to the losses incurred in pre-enactment taxable years. As a result of this ordering rule, pre-enactment capital loss carryforwards may be more likely to expire unused. Additionally, post-enactment capital losses that are carried forward will retain their character as either short-term or long-term capital losses rather than being considered all short-term as under previous law.
The characterization of distributions to shareholders for financial reporting purposes is determined in accordance with federal income tax rules, which may differ from GAAP. The source of the Fund’s distributions may be shown in the accompanying financial statements as either from net investment income, net realized gain or capital. Certain components of the Fund’s net assets on the Statement of Assets and Liabilities reflect permanent GAAP/tax differences based on the appropriate tax character.
E. Foreign Currency Translation — The accounting records and reporting currency of the Fund are maintained in United States (“U.S.”) dollars. Assets and liabilities denominated in foreign currencies are translated into U.S. dollars using the current exchange rates at the close of each business day. The effect of changes in foreign currency exchange rates on investments is included within net realized and unrealized gain (loss) on investments. Changes in the value of other assets and liabilities as a result of fluctuations in foreign exchange rates are included in the Statement of Operations within net change in unrealized gain (loss) on foreign currency transactions. Transactions denominated in foreign currencies are translated into U.S. dollars on the date the transaction occurred, the effects of which are included within net realized gain (loss) on foreign currency transactions.
3. INVESTMENTS AND FAIR VALUE MEASUREMENTS
The fair value of a financial instrument is the amount that would be received to sell an asset or paid to transfer a liability in an orderly transaction between market participants at the measurement date (i.e., the exit price). GAAP establishes a fair value hierarchy that prioritizes the inputs to valuation techniques used to measure fair value. The hierarchy gives the highest priority to unadjusted quoted prices in active markets for identical assets or liabilities (Level 1 measurements) and the lowest priority to unobservable inputs (Level 3 measurements). The levels used for classifying investments are not necessarily an indication of the risk associated with investing in these investments. The three levels of the fair value hierarchy are described below:
Level 1 — Unadjusted quoted prices in active markets that are accessible at the measurement date for identical, unrestricted assets or liabilities;
Level 2 — Quoted prices in markets that are not active or financial instruments for which significant inputs are observable (including, but not limited to, quoted prices for similar investments, interest rates, foreign exchange rates, volatility and credit spreads), either directly or indirectly;
Level 3 — Prices or valuations that require significant unobservable inputs (including GSAMI’s assumptions in determining fair value measurement).
The Trustees have adopted Valuation Procedures that govern the valuation of the portfolio investments held by the Fund, including investments for which market quotations are not readily available. The Trustees have delegated to GSAMI day-to-day
16
GOLDMAN SACHS VARIABLE INSURANCE TRUST STRATEGIC INTERNATIONAL EQUITY FUND
3. INVESTMENTS AND FAIR VALUE MEASUREMENTS (continued)
responsibility for implementing and maintaining internal controls and procedures related to the valuation of the Fund’s portfolio investments. To assess the continuing appropriateness of pricing sources and methodologies, GSAMI regularly performs price verification procedures and issues challenges as necessary to third party pricing vendors or brokers, and any differences are reviewed in accordance with the Valuation Procedures.
A. Level 1 and Level 2 Fair Value Investments — The valuation techniques and significant inputs used in determining the fair values for investments classified as Level 1 and Level 2 are as follows:
Equity Securities — Equity securities and investment companies traded on a U.S. securities exchange or the NASDAQ system, or those located on certain foreign exchanges, including but not limited to the Americas, are valued daily at their last sale price or official closing price on the principal exchange or system on which they are traded. If no sale occurs, equity securities and exchange traded investment companies are valued at the last bid price for long positions and at the last ask price for short positions. Investments in investment companies (other than those that are exchange traded) are valued at the NAV on the valuation date. To the extent these investments are actively traded, they are classified as Level 1 of the fair value hierarchy, otherwise they are generally classified as Level 2.
Unlisted equity securities for which market quotations are available are valued at the last sale price on the valuation date, or if no sale occurs, at the last bid price. Securities traded on certain foreign securities exchanges are valued daily at fair value determined by an independent fair value service (if available) under Valuation Procedures approved by the Trustees and consistent with applicable regulatory guidance. The independent fair value service takes into account multiple factors including, but not limited to, movements in the securities markets, certain depositary receipts, futures contracts and foreign currency exchange rates that have occurred subsequent to the close of the foreign securities exchange. These investments are generally classified as Level 2 of the fair value hierarchy.
B. Level 3 Fair Value Investments — To the extent that the aforementioned significant inputs are unobservable, or if quotations are not readily available, or if GSAMI believes that such quotations do not accurately reflect fair value, the fair value of the Fund’s investments may be determined under Valuation Procedures approved by the Trustees. GSAMI, consistent with its procedures and applicable regulatory guidance, may make an adjustment to the most recent valuation prices of either domestic or foreign securities in light of significant events to reflect what it believes to be the fair value of the securities at the time of determining a Fund’s NAV. Significant events which could affect a large number of securities in a particular market may include, but are not limited to: significant fluctuations in U.S. or foreign markets; market dislocations; market disruptions; or unscheduled market closings. Significant events which could also affect a single issuer may include, but are not limited to: corporate actions such as reorganizations, mergers and buy-outs; ratings downgrades; and bankruptcies.
17
GOLDMAN SACHS VARIABLE INSURANCE TRUST STRATEGIC INTERNATIONAL EQUITY FUND
Notes to Financial Statements (continued)
December 31, 2014
3. INVESTMENTS AND FAIR VALUE MEASUREMENTS (continued)
C. Fair Value Hierarchy — The following is a summary of the Fund’s investments classified in the fair value hierarchy as of December 31, 2014:
| | | | | | | | | | | | |
| Investment Type | | Level 1 | | | Level 2 | | | Level 3 | |
| Assets | | | | | | | | | | | | |
| Common Stock and/or Other Equity Investments(a) | | | | | | | | | | | | |
Asia | | $ | 8,382,545 | | | $ | 39,946,944 | | | $ | — | |
Australia and Oceania | | | — | | | | 9,635,764 | | | | — | |
Europe | | | — | | | | 104,876,433 | | | | — | |
North America | | | 6,832,332 | | | | — | | | | — | |
| Total | | | 15,214,877 | | | | 154,459,141 | | | | — | |
| (a) | Amounts are disclosed by continent to highlight the impact of time zone differences between local market close and the calculation of net asset value. Security valuations are based on the principal exchange or system on which they are traded, which may differ from country of domicile. The Fund utilizes fair value model prices provided by an independent fair value service for international equities, resulting in a Level 2 classification. |
For further information regarding security characteristics, see the Schedule of Investments.
4. AGREEMENTS AND AFFILIATED TRANSACTIONS
A. Management Agreement — Under the Agreement, GSAMI manages the Fund, subject to the general supervision of the Trustees.
As compensation for the services rendered pursuant to the Agreement, the assumption of the expenses related thereto and administration of the Fund’s business affairs, including providing facilities, GSAMI is entitled to a management fee, accrued daily and paid monthly, equal to an annual percentage rate of the Fund’s average daily net assets.
For the fiscal year ended December 31, 2014, contractual and effective net management fees with GSAMI were at the following rates:
| | | | | | | | | | | | | | | | | | | | | | | | | | |
| Contractual Management Fee Rate | | | | |
First
$1 billion | | | Next
$1 billion | | | Next
$3 billion | | | Next
$3 billion | | | Over
$8 billion | | | Effective
Rate | | | Effective Net
Management
Fee Rate | |
| | 0.85% | | | | 0.77 | % | | | 0.73 | % | | | 0.72 | % | | | 0.71 | % | | | 0.85 | % | | | 0.81 | %* |
| * | GSAMI has agreed to waive a portion of its management fee in order to achieve a net management rate, as defined in the Fund’s most recent prospectuses. This waiver will be effective through April 30, 2015 and prior to such date GSAMI may not terminate the arrangement without approval of the Trustees. The Effective Net Management Rate above is calculated based on management rates before and after the waiver had been adjusted, if applicable. For the fiscal year ended December 31, 2014, GSAMI waived $78,604 of its management fee. |
18
GOLDMAN SACHS VARIABLE INSURANCE TRUST STRATEGIC INTERNATIONAL EQUITY FUND
4. AGREEMENTS AND AFFILIATED TRANSACTIONS (continued)
B. Distribution and Service Plan — The Trust, on behalf of the Service Shares of the Fund, has adopted a Distribution and Service Plan (the “Plan”). Under the Plan, Goldman Sachs, which serves as distributor (the “Distributor”), is entitled to a fee accrued daily and paid monthly, for distribution services and personal and account maintenance services, which may then be paid by Goldman Sachs to authorized dealers, equal to, on an annual basis, 0.25% of the Fund’s average daily net assets attributable to Service Shares.
C. Transfer Agency Agreement — Goldman Sachs also serves as the transfer agent of the Fund for a fee pursuant to a Transfer Agency Agreement. The fees charged for such transfer agency services are accrued daily and paid monthly at an annual rate of 0.02% of the average daily net assets of Institutional and Service Shares.
D. Other Expense Agreements and Affiliated Transactions — GSAMI has agreed to limit certain “Other Expenses” of the Fund (excluding transfer agency fees and expenses, taxes, interest, brokerage fees, shareholder meetings, litigation, indemnification, and extraordinary expenses) to the extent such expenses exceed, on an annual basis, a percentage rate of the average daily net assets of the Fund. Such Other Expense reimbursements, if any, are accrued daily and paid monthly. In addition, the Fund is not obligated to reimburse GSAMI for prior fiscal year expense reimbursements, if any. The Other Expense limitation as an annual percentage rate of average daily net assets for the Fund is 0.104%. Prior to April 30, 2014 the Other Expense limitation for the Fund was 0.144%. The Other Expense limitation will remain in place through at least April 30, 2015, and prior to such date GSAMI may not terminate the arrangement without the approval of the Trustees. The Fund bears its respective share of costs related to proxy and shareholder meetings, and GSAMI has agreed to reimburse the Fund to the extent such expenses exceed a specified percentage of the Fund’s net assets. For the fiscal year ended December 31, 2014, GSAMI reimbursed $23,318 to the Fund. In addition, the Fund has entered into certain offset arrangements with the custodian and the transfer agent, which may result in a reduction of the Fund’s expenses and are received irrespective of the application of the “Other Expense” limitation described above. For the fiscal year ended December 31, 2014, custody fee credits were $1,381.
E. Line of Credit Facility — As of December 31, 2014, the Fund participated in a $1,080,000,000 committed, unsecured revolving line of credit facility (the “facility”) together with other funds of the Trust and registered investment companies having management agreements with GSAM or its affiliates (“Other Borrowers”). Pursuant to the terms of the facility, the Fund and Other Borrowers could increase the credit amount by an additional $120,000,000, for a total of up to $1,200,000,000. This facility is to be used solely for temporary or emergency purposes, which may include the funding of redemptions. The interest rate on borrowings is based on the federal funds rate. The facility also requires a fee to be paid by the Fund based on the amount of the commitment that has not been utilized. For the fiscal year ended December 31, 2014, the Fund did not have any borrowings under the facility.
F. Other Transactions with Affiliates — For the fiscal year ended December 31, 2014, Goldman Sachs did not earn brokerage commissions from portfolio transactions on behalf of the Fund.
5. PORTFOLIO SECURITIES TRANSACTIONS
The cost of purchases and proceeds from sales and maturities of long-term securities for the fiscal year ended December 31, 2014, were $143,024,298 and $162,784,143, respectively.
19
GOLDMAN SACHS VARIABLE INSURANCE TRUST STRATEGIC INTERNATIONAL EQUITY FUND
Notes to Financial Statements (continued)
December 31, 2014
6. TAX INFORMATION
The tax character of distributions paid during the fiscal years ended December 31, 2013 and December 31, 2014 was as follows:
| | | | | | | | |
| | | 2013 | | | 2014 | |
| Distributions paid from ordinary income | | $ | 3,299,488 | | | $ | 6,520,286 | |
As of December 31, 2014, the components of accumulated earnings (losses) on a tax-basis were as follows:
| | | | |
| Undistributed ordinary income — net | | $ | 559,235 | |
| Capital loss carryforwards(1) | | | | |
Expiring 2016 | | | (22,526,379 | ) |
Expiring 2017 | | | (63,558,058 | ) |
| Total capital loss carryforwards | | $ | (86,084,437 | ) |
| Timing differences (Qualified Late Year Loss Deferral/Post October Loss Deferral) | | | (1,445,542 | ) |
| Unrealized losses — net | | | (3,964,906 | ) |
| Total accumulated losses — net | | $ | (90,935,650 | ) |
| (1) | Expiration occurs on December 31 of the year indicated. The Fund utilized $12,077,645 of capital losses in the current fiscal year. |
As of December 31, 2014, the Fund’s aggregate security unrealized gains and losses based on cost for U.S. federal income tax purposes were as follows:
| | | | |
| Tax cost | | $ | 173,520,827 | |
| Gross unrealized gain | | | 13,991,016 | |
| Gross unrealized loss | | | (17,837,825 | ) |
| Unrealized security loss | | | (3,846,809 | ) |
| Net unrealized loss on other investments | | | (118,097 | ) |
| Net unrealized loss | | $ | (3,964,906 | ) |
The difference between GAAP-basis and tax-basis unrealized gains (losses) is attributable primarily to wash sales.
In order to present certain components of the Fund’s capital accounts on a tax-basis, the Fund has reclassified $112,829 from undistributed net investment income to accumulated net realized gain (loss). This reclassification has no impact on the net asset value of the Fund and results primarily from differences in the tax treatment of foreign currency transactions and underlying fund investments.
GSAMI has reviewed the Fund’s tax positions for all open tax years (the current and prior three years, as applicable) and has concluded that no provision for income tax is required in the Fund’s financial statements. Such open tax years remain subject to examination and adjustment by tax authorities.
20
GOLDMAN SACHS VARIABLE INSURANCE TRUST STRATEGIC INTERNATIONAL EQUITY FUND
7. OTHER RISKS
The Fund’s risks include, but are not limited to, the following:
Foreign Custody Risk — A Fund that invests in foreign securities may hold such securities and foreign currency with foreign banks, agents, and securities depositories appointed by the Fund’s custodian (each a “Foreign Custodian”). Some foreign custodians may be recently organized or new to the foreign custody business. In some countries, Foreign Custodians may be subject to little or no regulatory oversight or independent evaluation of their operations. Further, the laws of certain countries may place limitations on a Fund’s ability to recover its assets if a Foreign Custodian enters bankruptcy.
Investments in Other Investment Companies — As a shareholder of another investment company, including an exchange traded fund (“ETF”), a Fund will directly bear its proportionate share of any net management fees and other expenses paid by such other investment companies, in addition to the fees and expenses regularly borne by the Fund. ETFs are subject to risks that do not apply to conventional mutual funds, including but not limited to the following: (i) the market price of the ETF’s shares may trade at a premium or a discount to their NAV; and (ii) an active trading market for an ETF’s shares may not develop or be maintained.
Large Shareholder Transaction Risk — The Fund may experience adverse effects when certain large shareholders, such as other funds, participating insurance companies, accounts and Goldman Sachs affiliates, purchase or redeem large amounts of shares of the Fund. Such large shareholder redemptions may cause the Fund to sell portfolio securities at times when it would not otherwise do so, which may negatively impact the Fund’s NAV and liquidity. Similarly, large Fund share purchases may adversely affect the Fund’s performance to the extent that the Fund is delayed in investing new cash and is required to maintain a larger cash position than it ordinarily would. These transactions may also increase transaction costs. In addition, a large redemption could result in the Fund’s current expenses being allocated over a smaller asset base, leading to an increase in the Fund’s expense ratio.
Liquidity Risk — The Fund may make investments that are illiquid or that may become less liquid in response to market developments or adverse investor perceptions. Illiquid investments may be more difficult to value. Liquidity risk may also refer to the risk that a Fund will not be able to pay redemption proceeds within the allowable time period because of unusual market conditions, an unusually high volume of redemption requests, or other reasons. To meet redemption requests, a Fund may be forced to sell investments at an unfavorable time and/or under unfavorable conditions.
Market and Credit Risks — In the normal course of business, the Fund trades financial instruments and enters into financial transactions where risk of potential loss exists due to changes in the market (market risk). Additionally, the Fund may also be exposed to credit risk in the event that an issuer or guarantor fails to perform or that an institution or entity with which the Fund has unsettled or open transactions defaults.
Investing in foreign markets may involve special risks and considerations not typically associated with investing in the U.S. Foreign securities may be subject to risk of loss because of more or less foreign government regulation, less public information and less economic, political and social stability in the countries in which the Fund invests. Loss may also result from the imposition of exchange controls, confiscations and other government restrictions by the United States or other governments, or from problems in registration, settlement or custody. Foreign risk also involves the risk of negative foreign currency rate fluctuations, which may cause the value of securities denominated in such foreign currency (or other instruments through which the Fund has exposure to foreign currencies) to decline in value. Currency exchange rates may fluctuate significantly over short periods of time. To the extent that the Fund also invests in securities of issuers located in emerging markets, these risks may be more pronounced.
21
GOLDMAN SACHS VARIABLE INSURANCE TRUST STRATEGIC INTERNATIONAL EQUITY FUND
Notes to Financial Statements (continued)
December 31, 2014
8. INDEMNIFICATIONS
Under the Trust’s organizational documents, its Trustees, officers, employees and agents are indemnified, to the extent permitted by the Act and state law, against certain liabilities that may arise out of performance of their duties to the Fund. Additionally, in the course of business, the Fund enters into contracts that contain a variety of indemnification clauses. The Fund’s maximum exposure under these arrangements is unknown, as this would involve future claims that may be made against the Fund that have not yet occurred. However, GSAMI believes the risk of loss under these arrangements to be remote.
9. SUBSEQUENT EVENTS
Subsequent events after the Statement of Assets and Liabilities date have been evaluated through the date the financial statements were issued. GSAMI has concluded that there is no impact requiring adjustment or disclosure in the financial statements.
10. SUMMARY OF SHARE TRANSACTIONS
Share activity is as follows:
| | | | | | | | | | | | | | | | |
| | | For the Fiscal Year Ended
December 31, 2014 | | | For the Fiscal Year Ended
December 31, 2013 | |
| | | Shares | | | Dollars | | | Shares | | | Dollars | |
| Institutional Shares | | | | | | | | | | | | | | | | |
| Shares sold | | | 62,023 | | | $ | 625,818 | | | | 36,484 | | | $ | 345,686 | |
| Reinvestment of distributions | | | 201,957 | | | | 1,864,061 | | | | 101,628 | | | | 1,024,417 | |
| Shares redeemed | | | (878,847 | ) | | | (9,090,883 | ) | | | (1,109,096 | ) | | | (10,490,500 | ) |
| | | | (614,867 | ) | | | (6,601,004 | ) | | | (970,984 | ) | | | (9,120,397 | ) |
| Service Shares | | | | | | | | | | | | | | | | |
| Shares sold | | | 491,901 | | | | 5,008,824 | | | | 355,851 | | | | 3,348,428 | |
| Reinvestment of distributions | | | 503,375 | | | | 4,656,225 | | | | 225,478 | | | | 2,275,071 | |
| Shares redeemed | | | (1,994,697 | ) | | | (20,542,938 | ) | | | (2,227,421 | ) | | | (21,132,222 | ) |
| | | | (999,421 | ) | | | (10,877,889 | ) | | | (1,646,092 | ) | | | (15,508,723 | ) |
| NET DECREASE | | | (1,614,288 | ) | | $ | (17,478,893 | ) | | | (2,617,076 | ) | | $ | (24,629,120 | ) |
22
Report of Independent Registered Public Accounting Firm
To the Board of Trustees and Shareholders of
Goldman Sachs Variable Insurance Trust — Goldman Sachs Strategic International Equity Fund:
In our opinion, the accompanying statement of assets and liabilities, including the schedule of investments, and the related statements of operations and of changes in net assets and the financial highlights present fairly, in all material respects, the financial position of Goldman Sachs Strategic International Equity Fund (the “Fund”), a fund of Goldman Sachs Variable Insurance Trust, at December 31, 2014, the results of its operations, the changes in its net assets and the financial highlights for each of the periods indicated, in conformity with accounting principles generally accepted in the United States of America. These financial statements and financial highlights (hereafter referred to as “financial statements”) are the responsibility of the Fund’s management. Our responsibility is to express an opinion on these financial statements based on our audits. We conducted our audits of these financial statements in accordance with the standards of the Public Company Accounting Oversight Board (United States). Those standards require that we plan and perform the audit to obtain reasonable assurance about whether the financial statements are free of material misstatement. An audit includes examining, on a test basis, evidence supporting the amounts and disclosures in the financial statements, assessing the accounting principles used and significant estimates made by management, and evaluating the overall financial statement presentation. We believe that our audits, which included confirmation of securities at December 31, 2014 by correspondence with the custodian, provide a reasonable basis for our opinion.
PricewaterhouseCoopers LLP
Boston, Massachusetts
February 19, 2015
23
GOLDMAN SACHS VARIABLE INSURANCE TRUST STRATEGIC INTERNATIONAL EQUITY FUND
| | |
| Fund Expenses — Six Month Period Ended December 31, 2014 (Unaudited) | | |
As a shareholder of Institutional or Service Shares of the Fund, you incur ongoing costs, including management fees, distribution and service (12b-1) fees (with respect to Service Shares) and other Fund expenses. This example is intended to help you understand your ongoing costs (in dollars) of investing in the Institutional Shares and Service Shares of the Fund and to compare these costs with the ongoing costs of investing in other mutual funds.
The example is based on an investment of $1,000 invested at the beginning of the period and held for the entire period from July 1, 2014 through December 31, 2014.
Actual Expenses — The first line under each share class in the table below provides information about actual account values and actual expenses. You may use the information in this line, together with the amount you invested, to estimate the expenses that you paid over the period. Simply divide your account value by $1,000 (for example, an $8,600 account value divided by $1,000=8.6), then multiply the result by the number in the first line under the heading entitled “Expenses Paid” to estimate the expenses you paid on your account during this period.
Hypothetical Example for Comparison Purposes — The second line under each share class in the table below provides information about hypothetical account values and hypothetical expenses based on the Fund's actual net expense ratio and an assumed rate of return of 5% per year before expenses, which is not the Fund's actual return. The hypothetical account values and expenses may not be used to estimate the actual ending account balance or expenses you paid for the period. You may use this information to compare the ongoing costs of investing in the Fund and other funds. To do so, compare this 5% hypothetical example with the 5% hypothetical examples that appear in the shareholder reports of the other funds.
Please note that the expenses shown in the table are meant to highlight your ongoing costs only. As a shareholder of the Fund you do not incur any transaction costs, such as sales charges, redemption fees, or exchange fees, but shareholders of other funds may incur such costs. The second line of the table is useful in comparing ongoing costs only, and will not help you determine the relative total costs of owning different funds whose shareholders may incur transaction costs.
| | | | | | | | | | | | |
| Share Class | | Beginning
Account Value
7/01/14 | | | Ending
Account Value
12/31/14 | | | Expenses Paid
for the
6 Months
Ended
12/31/14* | |
| Institutional | | | | | | | | | | | | |
| Actual | | $ | 1,000 | | | $ | 897.90 | | | $ | 4.69 | |
| Hypothetical 5% return | | | 1,000 | | | | 1,020.27 | + | | | 4.99 | |
| Service | | | | | | | | | | | | |
| Actual | | | 1,000 | | | | 896.40 | | | | 5.88 | |
| Hypothetical 5% return | | | 1,000 | | | | 1,019.00 | + | | | 6.26 | |
| | * | Expenses are calculated using the Fund’s annualized net expense ratio for each class, which represents the ongoing expenses as a percentage of net assets for the six months ended December 31, 2014. Expenses are calculated by multiplying the annualized net expense ratio by the average account value for the period; then multiplying the result by the number of days in the most recent fiscal half year; and then dividing that result by the number of days in the fiscal year. The annualized net expense ratios for the period were 0.98% and 1.23% for Institutional and Service Shares, respectively. | |
| | + | Hypothetical expenses are based on the Fund’s actual annualized net expense ratios and an assumed rate of return of 5% per year before expenses. | |
24
GOLDMAN SACHS VARIABLE INSURANCE TRUST STRATEGIC INTERNATIONAL EQUITY FUND
Trustees and Officers (Unaudited)
Independent Trustees
| | | | | | | | | | | | |
| | | | | |
Name,
Address and Age1 | | Position(s) Held
with the Trust | | Term of Office and
Length of
Time Served2 | | Principal Occupation(s) During Past 5 Years | | Number of
Portfolios in
Fund Complex
Overseen by
Trustee3 | | | Other Directorships Held by Trustee4 |
Ashok N. Bakhru Age: 72 | | Chairman of the Board of Trustees | | Since 1996 (Trustee since 1991) | | Mr. Bakhru is retired. He was formerly Director, Apollo Investment Corporation (a business development company) (2008-2013); President, ABN Associates (a management and financial consulting firm) (1994-1996 and 1998-2012); Trustee, Scholarship America (1998-2005); Trustee, Institute for Higher Education Policy (2003-2008); Director, Private Equity Investors — III and IV (1998-2007), and Equity-Linked Investors II (April 2002-2007). Chairman of the Board of Trustees — Goldman Sachs Fund Complex. | | | 128 | | | None |
John P. Coblentz, Jr. Age: 73 | | Trustee | | Since 2003 | | Mr. Coblentz is retired. Formerly, he was Partner, Deloitte & Touche LLP (1975-2003); Director, Emerging Markets Group, Ltd. (2004-2006); and Director, Elderhostel, Inc. (2006-2012). Trustee — Goldman Sachs Fund Complex. | | | 128 | | | None |
Diana M. Daniels Age: 65 | | Trustee | | Since 2007 | | Ms. Daniels is retired. Formerly, she was Vice President, General Counsel and Secretary, The Washington Post Company (1991-2006). Ms. Daniels serves as a Presidential Councillor of Cornell University (2013-Present); Member, Advisory Board, Psychology Without Borders (international humanitarian aid organization) (2007-Present), and former Member of the Legal Advisory Board, New York Stock Exchange (2003-2006) and of the Corporate Advisory Board, Standish Mellon Management Advisors (2006-2007). Trustee — Goldman Sachs Fund Complex. | | | 108 | | | None |
Joseph P. LoRusso Age: 57 | | Trustee | | Since 2010 | | Mr. LoRusso is retired. Formerly, he was President, Fidelity Investments Institutional Services Co. (“FIIS”) (2002-2008); Director, FIIS (2002-2008); Director, Fidelity Investments Institutional Operations Company (2003-2007); Executive Officer, Fidelity Distributors Corporation (2007-2008). Trustee — Goldman Sachs Fund Complex. | | | 108 | | | None |
Herbert J. Markley Age: 64 | | Trustee | | Since 2013 | | Mr. Markley is retired. Formerly, he was Executive Vice President, Deere & Company (an agricultural and construction equipment manufacturer) (2007-2009), and President, Agricultural Division, Deere & Company (2001-2007). Trustee — Goldman Sachs Fund Complex. | | | 108 | | | None |
Jessica Palmer Age: 65 | | Trustee | | Since 2007 | | Ms. Palmer is retired. She is Director, Emerson Center for the Arts and Culture (2011-Present); and was formerly a Consultant, Citigroup Human Resources Department (2007-2008); Managing Director, Citigroup Corporate and Investment Banking (previously, Salomon Smith Barney/Salomon Brothers) (1984-2006). Ms. Palmer was a Member of the Board of Trustees of Indian Mountain School (private elementary and secondary school) (2004-2009). Trustee — Goldman Sachs Fund Complex. | | | 108 | | | None |
Richard P. Strubel Age: 75 | | Trustee | | Since 1987 | | Mr. Strubel is retired. Formerly, he was Director, Cardean Learning Group (provider of educational services via the internet) (2003-2008); and Director, Gildan Activewear Inc. (a clothing marketing and manufacturing company) (2000-2014). He serves as Trustee, Emeritus, The University of Chicago (1987-Present). Trustee — Goldman Sachs Fund Complex. | | | 128 | | | The Northern Trust Mutual Fund Complex (56 Portfolios) (Chairman of the Board of Trustees) |
| | | | | | | | | | | | |
25
GOLDMAN SACHS VARIABLE INSURANCE TRUST STRATEGIC INTERNATIONAL EQUITY FUND
Trustees and Officers (Unaudited) (continued)
Independent Trustees (continued)
| | | | | | | | | | | | |
| | | | | |
Name,
Address and Age1 | | Position(s) Held
with the Trust | | Term of Office and
Length of
Time Served2 | | Principal Occupation(s) During Past 5 Years | | Number of
Portfolios in
Fund Complex
Overseen by
Trustee3 | | | Other Directorships Held by Trustee4 |
Roy W. Templin Age: 54 | | Trustee | | Since 2013 | | Mr. Templin is retired. He is Chairman of the Board of Directors, Con-Way Incorporated (2012-Present); and was formerly Executive Vice President and Chief Financial Officer, Whirlpool Corporation (an appliance manufacturer and marketer) (2004-2012). Trustee — Goldman Sachs Fund Complex. | | | 108 | | | Con-Way Incorporated (a transportation, supply-chain management and logistics services company) |
| | | | | | | | | | | | |
Interested Trustees*
| | | | | | | | | | | | |
| | | | | |
Name,
Address and Age1 | | Position(s) Held
with the Trust | | Term of Office and
Length of
Time Served2 | | Principal Occupation(s) During Past 5 Years | | Number of
Portfolios in
Fund Complex
Overseen by
Trustee3 | | | Other Directorships Held by Trustee4 |
James A. McNamara Age: 52 | | President and Trustee | | Since 2007 | | Managing Director, Goldman Sachs (December 1998-Present); Director of Institutional Fund Sales, GSAM (April 1998-December 2000); and Senior Vice President and Manager, Dreyfus Institutional Service Corporation (January 1993- April 1998). President — Goldman Sachs Fund Complex (November 2007-Present); Senior Vice President — Goldman Sachs Fund Complex (May 2007-November 2007); and Vice President — Goldman Sachs Fund Complex (2001-2007). Trustee — Goldman Sachs Fund Complex (November 2007-Present and December 2002-May 2004). | | | 127 | | | None |
Alan A. Shuch Age: 65 | | Trustee | | Since 1990 | | Advisory Director — GSAM (May 1999-Present); Consultant to GSAM (December 1994-May 1999); and Limited Partner, Goldman Sachs (December 1994-May 1999). Trustee — Goldman Sachs Fund Complex. | | | 108 | | | None |
| | | | | | | | | | | | |
| * | These persons are considered to be “Interested Trustees” because they hold positions with Goldman Sachs and own securities issued by The Goldman Sachs Group, Inc. Each Interested Trustee holds comparable positions with certain other companies of which Goldman Sachs, GSAM or an affiliate thereof is the investment adviser, administrator and/or distributor. |
| 1 | Each Trustee may be contacted by writing to the Trustee, c/o Goldman Sachs, 200 West Street, New York, New York, 10282, Attn: Caroline Kraus. Information is provided as of December 31, 2014. |
| 2 | Each Trustee holds office for an indefinite term until the earliest of: (a) the election of his or her successor; (b) the date the Trustee resigns or is removed by the Board of Trustees or shareholders, in accordance with the Trust’s Declaration of Trust; (c) December 31st of the year in which the Trustee turns 74 years of age, subject to waiver by a majority of the Trustees (in accordance with the current resolutions of the Board of Trustees, which may be changed by the Trustees without shareholder vote); or (d) the termination of the Trust. By resolution of the Board of Trustees determining that an extension of service would be beneficial to the Trust, the retirement age has been extended with respect to Richard P. Strubel. |
| 3 | The Goldman Sachs Fund Complex consists of the Trust and Goldman Sachs Trust (“GST”). As of December 31, 2014, the Trust consisted of 14 portfolios and GST consisted of 94 portfolios (88 of which offered shares to the public). The Goldman Sachs Fund Complex also includes, with respect to Messrs. Bakhru, Coblentz and Strubel, Goldman Sachs Trust II (“GSTII”), Goldman Sachs BDC, Inc. (“GSBDC”), Goldman Sachs MLP Income Opportunities Fund (“GSMLP”), Goldman Sachs MLP and Energy Renaissance Fund (“GSMER”) and Goldman Sachs ETF Trust (“GSETF”), and with respect to Mr. McNamara, GSTII, GSMLP, GSMER and GSETF. GSTII consisted of 6 portfolios (one of which offered shares to the public). GSBDC, GSMLP and GSMER each consisted of one portfolio. GSETF consisted of 11 portfolios (none of which offered shares to the public). As of December 31, 2014, GSBDC had not offered shares to the public. |
| 4 | This column includes only directorships of companies required to report to the Securities and Exchange Commission under the Securities Exchange Act of 1934 (i.e., “public companies”) or other investment companies registered under the Act. |
Additional information about the Trustees is available in the Fund’s Statement of Additional Information, which can be obtained from Goldman Sachs free of charge by calling this toll-free number (in the United States of America): 1-800-292-4726.
26
GOLDMAN SACHS VARIABLE INSURANCE TRUST STRATEGIC INTERNATIONAL EQUITY FUND
Trustees and Officers (Unaudited) (continued)
Officers of the Trust*
| | | | | | |
| | | |
Name, Address and Age1 | | Position(s) Held With the Trust | | Term of
Office and
Length of
Time Served2 | | Principal Occupation(s) During Past 5 Years |
James A. McNamara
200 West Street New York, NY 10282 Age: 52 | | President and Trustee | | Since 2007 | | Managing Director, Goldman Sachs (December 1998-Present); Director of Institutional Fund Sales, GSAM (April 1998-December 2000); and Senior Vice President and Manager, Dreyfus Institutional Service Corporation (January 1993-April 1998). President — Goldman Sachs Fund Complex (November 2007-Present); Senior Vice President — Goldman Sachs Fund Complex (May 2007-November 2007); and Vice President — Goldman Sachs Fund Complex (2001-2007). Trustee — Goldman Sachs Fund Complex (November 2007-Present and December 2002-May 2004). |
Caroline L. Kraus
200 West Street New York, NY 10282 Age: 37 | | Secretary | | Since 2012 | | Vice President, Goldman Sachs (August 2006-Present); Associate General Counsel, Goldman Sachs (2012-Present); Assistant General Counsel, Goldman Sachs (August 2006-December 2011) and Associate, Weil, Gotshal & Manges, LLP (2002-2006). Secretary — Goldman Sachs Fund Complex (August 2012-Present) and Assistant Secretary — Goldman Sachs Fund Complex (June 2012-August 2012). |
Scott M. McHugh
200 West Street New York, NY 10282 Age: 43 | | Principal Financial
Officer, Senior Vice
President and
Treasurer | | Since 2009
(Principal
Financial
Officer since
2013) | | Vice President, Goldman Sachs (February 2007-Present); Assistant Treasurer of certain mutual funds administered by DWS Scudder (2005-2007); and Director (2005-2007), Vice President (2000-2005) and Assistant Vice President (1998-2000), Deutsche Asset Management or its predecessor (1998-2007). Principal Financial Officer — Goldman Sachs Fund Complex (November 2013-Present); Treasurer — Goldman Sachs Fund Complex (October 2009-Present); Senior Vice President — Goldman Sachs Fund Complex (November 2009-Present); and Assistant Treasurer — Goldman Sachs Fund Complex (May 2007-October 2009). |
| | | | | | |
| * | Represents a partial list of officers of the Trust. Additional information about all the officers is available in the Fund’s Statement of Additional Information, which can be obtained from Goldman Sachs free of charge by calling this toll-free number (in the United States): 1-800-292-4726. |
| 1 | Information is provided as of December 31, 2014. |
| 2 | Officers hold office at the pleasure of the Board of Trustees or until their successors are duly elected and qualified. Each officer holds comparable positions with certain other companies of which Goldman Sachs, GSAM or an affiliate thereof is the investment adviser, administrator and/or distributor. |
27
GOLDMAN SACHS VARIABLE INSURANCE TRUST STRATEGIC INTERNATIONAL EQUITY FUND
Goldman Sachs Variable Insurance Trust — Tax Information (Unaudited)
For the 2014 tax year, the Strategic International Equity Fund has elected to pass through a credit for taxes paid to foreign jurisdictions. The total amount of income received by the Strategic International Equity Fund from sources within foreign countries and possessions of the United States was $0.4177 per share, all of which is attributable to qualified passive income. The percentage of net investment income dividends paid by the Fund during the year ended December 31, 2014 from foreign sources was 100%. The total amount of foreign taxes paid by the Fund was $0.0302 per share.
28
| | |
| TRUSTEES | | OFFICERS |
| Ashok N. Bakhru, Chairman | | James A. McNamara, President |
| John P. Coblentz, Jr. | | Scott M. McHugh, Principal Financial Officer |
| Diana M. Daniels | | and Treasurer |
| Joseph P. LoRusso | | Caroline L. Kraus, Secretary |
| Herbert J. Markley | | |
| James A. McNamara | | |
| Jessica Palmer | | |
| Alan A. Shuch | | |
| Richard P. Strubel | | |
| Roy W. Templin | | |
GOLDMAN, SACHS & CO.
Distributor and Transfer Agent
GOLDMAN SACHS ASSET MANAGEMENT, L.P.
Investment Adviser
200 West Street, New York, New York 10282
GOLDMAN SACHS ASSET MANAGEMENT INTERNATIONAL
Investment Adviser
Christchurch Court, 10-15 Newgate Street London, EC1A 7HD, England, United Kingdom
Visit our web site at www.GSAMFUNDS.com to obtain the most recent month-end returns.
The reports concerning the Fund included in this shareholder report may contain certain forward-looking statements about the factors that may affect the performance of the Fund in the future. These statements are based on Fund management’s predictions and expectations concerning certain future events and their expected impact on the Fund, such as performance of the economy as a whole and of specific industry sectors, changes in the levels of interest rates, the impact of developing world events, and other factors that may influence the future performance of the Fund. Management believes these forward-looking statements to be reasonable, although they are inherently uncertain and difficult to predict. Actual events may cause adjustments in portfolio management strategies from those currently expected to be employed.
A description of the policies and procedures that the Fund uses to determine how to vote proxies relating to portfolio securities and information regarding how the Fund voted proxies relating to portfolio securities during the most recent 12-month period ended December 31 is available (i) without charge, upon request by calling 1-800-621-2550; and (ii) on the Securities and Exchange Commission (“SEC”) web site at http://www.sec.gov.
The Fund files its complete schedule of portfolio holdings with the SEC for the first and third quarters of each fiscal year on Form N-Q. The Fund’s Form N-Qs are available on the SEC’s web site at http://www.sec.gov within 60 days after the Fund’s first and third fiscal quarters. The Fund’s Form N-Qs may be reviewed and copied at the SEC’s Public Reference Room in Washington, D.C. and information on the operation of the Public Reference Room may also be obtained by calling 1-800-SEC-0330. Form N-Qs may be obtained upon request and without charge by calling 1-800-621-2550.
The website links provided are for your convenience only and are not an endorsement or recommendation by GSAM of any of these websites or the products or services offered. GSAM is not responsible for the accuracy and validity of the content of these websites.
Economic and market forecasts presented herein reflect our judgment as of the date of this presentation and are subject to change without notice. These forecasts do not take into account the specific investment objectives, restrictions, tax and financial situation or other needs of any specific client. Actual data will vary and may not be reflected here. These forecasts are subject to high levels of uncertainty that may affect actual performance. Accordingly, these forecasts should be viewed as merely representative of a broad range of possible outcomes. These forecasts are estimated, based on assumptions, and are subject to significant revision and may change materially as economic and market conditions change. Goldman Sachs has no obligation to provide updates or changes to these forecasts. Case studies and examples are for illustrative purposes only.
Fund holdings and allocations shown are as of December 31, 2014 and may not be representative of future investments. Fund holdings should not be relied on in making investment decisions and should not be construed as research or investment advice regarding particular securities. Current and future holdings are subject to risk.
References to indices, benchmarks or other measures of relative market performance over a specified period of time are provided for your information only and do not imply that the portfolio will achieve similar results. The index composition may not reflect the manner in which a portfolio is constructed. While an adviser seeks to design a portfolio which reflects appropriate risk and return features, portfolio characteristics may deviate from those of the benchmark.
The Global Industry Classification Standard (“GICS”) was developed by and is the exclusive property and a service mark of Morgan Stanley Capital International Inc. (“MSCI”) and Standard & Poor’s, a division of The McGraw-Hill Companies, Inc. (“S&P”) and is licensed for use by Goldman Sachs. Neither MSCI, S&P nor any other party involved in making or compiling the GICS or any GICS classifications makes any express or implied warranties or representations with respect to such standard or classification (or the results to be obtained by the use thereof), and all such parties hereby expressly disclaim all warranties of originality, accuracy, completeness, merchantability or fitness for a particular purpose with respect to any of such standard or classification. Without limiting any of the foregoing, in no event shall MSCI, S&P, any of their affiliates or any third party involved in making or compiling the GICS or any GICS classifications have any liability for any direct, indirect, special, punitive, consequential or any other damages (including lost profits) even if notified of the possibility of such damages.
The portfolio risk management process includes an effort to monitor and manage risk, but does not imply low risk.
Shares of the Goldman Sachs VIT Funds are offered to separate accounts of participating life insurance companies for the purpose of funding variable annuity contracts and variable life insurance policies. Shares of the Fund are not offered directly to the general public. The variable annuity contracts and variable life insurance policies are described in the separate prospectuses issued by participating insurance companies. You should refer to those prospectuses for information about surrender charges, mortality and expense risk fees and other charges that may be assessed by participating insurance companies under the variable annuity contracts or variable life insurance policies. Such fees or charges, if any, may affect the return you may realize with respect to your investments. Ask your representative for more complete information. Please consider a fund’s objectives, risks and charges and expenses, and read the prospectus carefully before investing. The prospectus contains this and other information about the Fund.
This material is not authorized for distribution to prospective investors unless preceded or accompanied by a current Prospectus or summary prospectus, if applicable. Investors should consider a Fund’s objective, risks, and charges and expenses, and read the summary prospectus, if available, and/or the Prospectus carefully before investing or sending money. The summary prospectus, if available, and the Prospectus contain this and other information about a Fund and may be obtained from your Authorized Institution or from Goldman, Sachs & Co. by calling 1-800-621-2550.
This report is prepared for the general information of contract owners and is not an offer of shares of the Goldman Sachs Variable Insurance Trust: Goldman Sachs Strategic International Equity Fund.
© 2015 Goldman Sachs. All rights reserved.
VITINTLAR-15/153849.MF.MED.TMPL/2/2015
Goldman
Sachs Variable Insurance Trust
Goldman Sachs
U.S. Equity Insights Fund*
* Effective April 30, 2014, the Goldman Sachs Structured U.S. Equity Fund was renamed the Goldman Sachs U.S. Equity Insights Fund
Annual Report
December 31, 2014
GOLDMAN SACHS VARIABLE INSURANCE TRUST U.S. EQUITY INSIGHTS FUND
Principal Investment Strategies and Risks
This is not a complete list of risks that may affect the Fund. For additional information concerning the risks applicable to the Fund, please see the Fund’s Prospectuses.
Shares of the Goldman Sachs Variable Insurance Trust — Goldman Sachs U.S. Equity Insights Fund are offered to separate accounts of participating life insurance companies for the purpose of funding variable annuity contracts and variable life insurance policies. Shares of the Fund are not offered directly to the general public. The variable annuity contracts and variable life insurance policies are described in the separate prospectuses issued by participating insurance companies. You should refer to those prospectuses for information about surrender charges, mortality and expense risk fees and other charges that may be assessed by participating insurance companies under the variable annuity contracts or variable life insurance policies. Such fees or charges, if any, may affect the return you realize with respect to your investments. Ask your representative for more complete information. Please consider the Fund’s objective, risks and charges and expenses, and read the Prospectus carefully before investing. The Prospectus contains this and other information about the Fund.
The Goldman Sachs U.S. Equity Insights Fund invests primarily in a diversified portfolio of equity investments in U.S. issuers, including foreign issuers traded in the United States. The Fund’s equity investments will be subject to market risk, which means that the value of the securities in which it invests may go up or down in response to the prospects of individual companies, particular sectors and/or general economic conditions. The Investment Adviser’s use of quantitative models to execute the Fund’s investment strategy may fail to produce the intended result. Different investment styles (e.g., “quantitative”) tend to shift in and out of favor, and at times the Fund may underperform other funds that invest in similar asset classes. The Fund may have a high rate of portfolio turnover, which involves correspondingly greater expenses which must be borne by the Fund, and is also likely to result in short-term capital gains taxable to shareholders.
1
GOLDMAN SACHS VARIABLE INSURANCE TRUST U.S. EQUITY INSIGHTS FUND
INVESTMENT OBJECTIVE
The Fund seeks long-term growth of capital and dividend income.
Portfolio Management Discussion and Analysis
Effective April 30, 2014, Goldman Sachs Variable Insurance Trust — Goldman Sachs Structured U.S. Equity Fund was re-named Goldman Sachs Variable Insurance Trust — Goldman Sachs U.S. Equity Insights Fund (the “Fund”). Below, the Goldman Sachs Quantitative Investment Strategies Team discusses the Fund’s performance and positioning for the 12-month period ended December 31, 2014 (the “Reporting Period”).
How did the Fund perform during the Reporting Period?
During the Reporting Period, the Fund’s Institutional and Service Shares generated average annual total returns of 16.37% and 16.18%, respectively. These returns compare to the 13.69% average annual total return of the Fund’s benchmark, the Standard & Poor’s 500® Index (with dividends reinvested) (the “S&P 500® Index”) during the same time period.
What economic and market factors most influenced the equity markets as a whole during the Reporting Period?
Representing the U.S. equity market, the S&P 500® Index gave back 0.25% in December 2014, but finished the fourth calendar quarter up 4.93% and gained 13.69% during the Reporting Period as a whole, as it posted its third consecutive year of broad double-digit gains.
Diverging global economies, strong merger and acquisition activity, weakening oil prices and declining U.S. interest rates were major themes affecting U.S. equities throughout 2014. The U.S. economic recovery accelerated through the Reporting Period, particularly compared to other major developed markets, which helped fuel U.S. corporate earnings growth and strong U.S. equity returns. Furthermore, the decline in unemployment to 5.8% and lower energy prices gave new hope to the potential for a broader consumer recovery. U.S. equity market volatility picked up during the second half of 2014 from exceptionally low levels mid-year, but the S&P 500® Index had no more than three consecutive down days during 2014, a feat not seen since 1928.
For the Reporting Period overall, nine of the ten sectors within the S&P 500® Index were up. Merger and acquisition activity rose to its highest annual level since 2007 largely due to transactions within the information technology and health care sectors, which handily outperformed the broader market. The top-weighted information technology sector was also the largest positive contributor (weight times performance) to S&P 500® Index returns. Given the unexpected decline in U.S. interest rates, real estate investment trusts (“REITs”) and the utilities sector also outperformed the broader market during the Reporting Period. Conversely, the energy sector underperformed most during 2014, as concerns over rising U.S. supply and weakening global demand triggered a collapse in U.S. and global crude oil prices. Telecommunication services also performed poorly during the year as aggressive competition, including price wars aimed at luring customers, and market saturation put growth pressures on the sector, especially on the wireless side.
All segments of the U.S. equity market advanced during the Reporting Period, with large-cap and mid-cap stocks, as measured by the Russell 1000® Index and the Russell Midcap® Index, respectively, gaining most and almost exactly in line with each other. Following at some distance were small-cap stocks, as measured by the Russell 2000® Index. Large-cap stocks were most successful relative to small-caps in the information technology sector. From a style perspective, value-oriented stocks outpaced growth-oriented stocks in the large-cap and mid-cap segments of the U.S. equity market, but growth-oriented stocks outperformed value-oriented stocks in the small-cap segment of the U.S. equity market. (All as measured by the Russell Investments indices.)
What key factors were responsible for the Fund’s performance during the Reporting Period?
The Fund outperformed the S&P 500® Index during the Reporting Period. Our stock selection and quantitative model’s investment themes added to relative performance overall.
What impact did the Fund’s investment themes have on performance during the Reporting Period?
As expected, and in keeping with our investment approach, our quantitative model and its six investment themes — Valuation, Profitability, Quality, Management, Momentum and Sentiment — had the greatest impact on relative performance. We use these themes to take a long-term view of market patterns and look for inefficiencies, selecting stocks for the Fund and overweighting or underweighting the ones chosen by the model. Over time and by design, the performance of any one of the model’s investment
2
GOLDMAN SACHS VARIABLE INSURANCE TRUST U.S. EQUITY INSIGHTS FUND
themes tends to have a low correlation with the model’s other themes, demonstrating the diversification benefit of the Fund’s theme-driven quantitative model. The variance in performance supports our research indicating that the diversification provided by the Fund’s different investment themes is a significant investment advantage over the long term, even though the Fund may experience underperformance in the short term. Of course, diversification does not protect an investor from market risk nor does it ensure a profit.
During the Reporting Period, four of our six investment themes contributed positively to the Fund’s relative performance. The Quality theme contributed most positively to the Fund’s relative performance during the Reporting Period, followed by Valuation, Momentum and Sentiment. The Quality theme assesses both firm and financial quality. The Valuation theme attempts to capture potential mispricings of securities, typically by comparing a measure of the company’s intrinsic value to its market value. The Momentum theme seeks to predict drifts in stock prices caused by delayed investor reaction to company-specific information and information about related companies. The Sentiment theme reflects selected investment views and decisions of individuals and financial intermediaries.
The Fund’s Profitability and Management themes detracted. The Profitability theme assesses whether a company is earning more than its cost of capital. The Management theme assesses the characteristics, policies and strategic decisions of a company’s management.
How did the Fund’s sector and industry allocations affect relative performance?
In constructing the Fund’s portfolio, we focus on picking stocks rather than making industry or sector bets. Consequently, the Fund is similar to its benchmark, the S&P 500® Index, in terms of its industry and sector allocation and style. We manage the Fund’s industry and sector exposure by including industry factors in our risk model and by explicitly penalizing industry and sector deviations from the benchmark index in optimization. Sector weights or changes in sector weights generally do not have a meaningful impact on relative performance.
Did stock selection help or hurt Fund performance during the Reporting Period?
We seek to outpace the S&P 500® Index by overweighting stocks that we expect to outperform and underweighting those that we think may lag. We also build positions based on our thematic views. For example, the Fund aims to hold a basket of stocks with more favorable Momentum characteristics than the benchmark index. During the Reporting Period, stock selection overall contributed positively to the Fund’s relative performance.
Effective stock selection in the energy, information technology and consumer staples sectors made the biggest positive contribution to the Fund’s results relative to its benchmark index. Partially offsetting these contributors was stock selection in the health care, telecommunications services and financials sectors, which detracted most from the Fund’s results relative to the S&P 500® Index.
Which individual stock positions contributed the most to the Fund’s relative returns during the Reporting Period?
The Fund benefited most from overweight positions in airlines Southwest Airlines and Delta Air Lines and semiconductor device manufacturer Micron Technology. We chose to overweight Southwest Airlines and Delta Air Lines due to our positive views on Sentiment and Quality. The Fund was overweight Micron Technology given our positive views on Profitability and Sentiment.
Which individual positions detracted from the Fund’s results during the Reporting Period?
Detracting most from the Fund’s results relative to its benchmark index were overweight positions in real estate services provider Realogy Holdings, specialty electronic game and entertainment software retailer GameStop and media entertainment content producer Viacom. The Fund had an overweight position in Realogy Holdings due to our positive views on Sentiment and Momentum. The Fund was overweight GameStop because of our positive views on Valuation and Quality. We chose to overweight Viacom due to our positive views on Sentiment and Profitability.
How did the Fund use derivatives during the Reporting Period?
During the Reporting Period, we did not use derivatives as part of an active management strategy to add value to the Fund’s results. However, we used equity index futures contracts, on an opportunistic basis, to equitize the Fund’s excess cash holdings. In other words, we put the Fund’s excess cash holdings to work by using them as collateral for the purchase of stock futures.
Did you make any enhancements to your quantitative models during the Reporting Period?
We continuously look for ways to improve our investment process. In the first quarter of 2014, we implemented an enhancement to our U.S. investment model within the small-capitalization segment of the market. Based on our research, we have adjusted our
3
GOLDMAN SACHS VARIABLE INSURANCE TRUST U.S. EQUITY INSIGHTS FUND
model to place more weight on fundamental factors, such as attractive valuations and high quality earnings, compared to the large- and mid-capitalization segments of the market. Our research found that behavioral factors, such as positive sentiment and exposure to global themes and trends, allow us to seek more dynamic returns within more liquid segments of the market, including large-and mid-capitalization stocks. Additionally, we made refinements to our transaction cost model, an important component of our portfolio construction process for all regions.
In the second quarter of 2014, we enhanced our Sentiment theme in the U.S., Europe and emerging markets, and global linkages theme in the U.S. and Europe, utilizing natural language processing to analyze thousands of earnings call transcripts and sell-side analyst reports. We read through the entirety of each company’s latest earnings call transcript, identifying key words and phrases that capture the underlying tone of the management team. We believe that this provides a better insight into management’s perception of their company. We also enhanced our ability to identify groups of related companies within our global linkages theme. We read through hundreds of research analyst reports daily to identify groups of companies related to common trending topics in the market.
We made no significant changes to our quantitative models during the third quarter of 2014. In the fourth quarter of 2014, we made a number of enhancements across a variety of themes. We enhanced our sector-specific Valuation theme in all regions by introducing a signal that evaluates the reserves of energy companies. As energy reserves are not capitalized on the balance sheet, reserve-based valuation metrics may provide a more accurate picture of the intrinsic value of an energy company.
We enhanced our Sentiment theme in all regions by introducing a signal that analyzes short selling of stocks in order to gain a more comprehensive understanding of investor conviction of future price declines. We analyze more than 9,000 stocks on a daily basis to identify companies with large, “fresh” short positions, which may indicate negative return expectations.
We enhanced our Momentum theme in developed markets, except for Europe, by evaluating price pressures created through consistent trade imbalances between buyers and sellers. In certain instances, traders may push prices as they engage in end-of-day hedging, inventory management and index trading. Persistent instances of these events can create buying and selling opportunities should stock prices revert to long-term views.
What was the Fund’s sector positioning relative to its benchmark index at the end of the Reporting Period?
As of December 31, 2014, the Fund was overweight the industrials, information technology and health care sectors relative to the S&P 500® Index. The Fund was underweight utilities, financials and telecommunication services and was rather neutrally weighted in consumer discretionary, materials, consumer staples and energy compared to the benchmark index on the same date.
Were there any changes to the Fund’s portfolio management team during the Reporting Period?
During the Reporting Period, three Vice Presidents joined and two Vice Presidents left the firm within our Quantitative Investment Strategies (“QIS”) Equity Alpha team. QIS employs a globally integrated team of more than 90 professionals, with an additional 90-plus professionals dedicated to trading, information technology and development of analytical tools.
What is your strategy going forward for the Fund?
Looking ahead, we continue to believe that less expensive stocks should outpace more expensive stocks, and stocks with good momentum should likely outperform those with poor momentum. We intend to maintain our focus on seeking companies about which fundamental research analysts are becoming more positive as well as profitable companies with sustainable earnings and a track record of using their capital to enhance shareholder value. As such, we anticipate remaining fully invested with long-term performance likely to be the result of stock selection rather than sector or capitalization allocations.
We stand behind our investment philosophy that sound economic investment principles, coupled with a disciplined quantitative approach, can provide strong, uncorrelated returns over the long term. Our research agenda is robust, and we continue to enhance our existing models, add new proprietary forecasting signals and improve our trading execution as we seek to provide the most value to our shareholders.
4
GOLDMAN SACHS VARIABLE INSURANCE TRUST U.S. EQUITY INSIGHTS FUND
Index Definitions
The Russell Midcap® Index measures the performance of the mid-cap segment of the U.S. equity universe. The Russell Midcap Index is a subset of the Russell 1000® Index. The Russell Midcap® Index includes approximately 800 of the smallest securities based on a combination of their market cap and current index membership. The Russell Midcap® Index represents approximately 31% of the total market capitalization of the Russell 1000® Index companies. The Russell Midcap® Index is constructed to provide a comprehensive and unbiased barometer for the mid-cap segment. The Russell Midcap® Index is completely reconstituted annually to ensure larger stocks do not distort the performance and characteristics of the true mid-cap opportunity set.
The Russell 1000® Index measures the performance of the large-cap segment of the U.S. equity universe. The Russell 1000® Index is a subset of the Russell 3000® Index and includes approximately 1000 of the largest securities based on a combination of their market cap and current index membership. The Russell 1000® Index represents approximately 92% of the U.S. market. The Russell 1000® Index is constructed to provide a comprehensive and unbiased barometer for the large-cap segment and is completely reconstituted annually to ensure new and growing equities are reflected.
The Russell 2000® Index measures the performance of the small-cap segment of the U.S. equity universe. The Russell 2000® Index is a subset of the Russell 3000® Index representing approximately 10% of the total market capitalization of that index. The Russell 2000® Index includes approximately 2000 of the smallest securities based on a combination of their market cap and current index membership. The Russell 2000® Index is constructed to provide a comprehensive and unbiased small-cap barometer and is completely reconstituted annually to ensure larger stocks do not distort the performance and characteristics of the true small-cap opportunity set.
All index figures do not reflect any deduction for fees, expenses or taxes. It is not possible to invest directly in an unmanaged index.
5
FUND BASICS
U.S. Equity Insights Fund
as of December 31, 2014
STANDARDIZED TOTAL RETURNS1
| | | | | | | | | | | | | | | | | | |
| For the period ended 12/31/14 | | One Year | | | Five Years | | | Ten Years | | | Since Inception | | | Inception Date |
| Institutional | | | 16.37 | % | | | 16.54 | % | | | 6.85 | % | | | 5.73 | % | | 02/13/98 |
| Service | | | 16.18 | | | | 16.30 | | | | N/A | | | | 6.36 | | | 01/09/06 |
| 1 | The Standardized Total Returns are average annual total returns as of the most recent calendar quarter-end. They assume reinvestment of all distributions at net asset value. Because Institutional and Service Shares do not involve a sales charge, such a charge is not applied to their Standardized Total Returns. |
Total return figures in the above chart represent past performance and do not indicate future results, which will vary. The investment return and principal value of an investment will fluctuate and, therefore, an investor’s shares, when redeemed, may be worth more or less than their original cost. Current performance may be lower or higher than the total return figures in the above chart. Please visit www.GSAMFUNDS.com to obtain the most recent month-end returns. Performance reflects fee waivers and/or expense limitations in effect during the periods shown. In their absence, performance would be reduced.
EXPENSE RATIOS2
| | | | | | | | |
| | | Net Expense Ratio (Current) | | | Gross Expense Ratio (Before Waivers) | |
| Institutional | | | 0.65 | % | | | 0.72 | % |
| Service | | | 0.86 | | | | 0.97 | |
| 2 | The expense ratios of the Fund, both current (net of any fee waivers or expense limitations) and before waivers (gross of any fee waivers or expense limitations) are as set forth above. Pursuant to a contractual arrangement, the Fund’s waivers and/or expense limitations will remain in place through at least April 30, 2015 and prior to such date the Investment Adviser may not terminate the arrangements without the approval of the Fund’s Board of Trustees. If these arrangements are discontinued in the future, the expense ratios may change without shareholder approval. |
TOP TEN HOLDINGS AS OF 12/31/143
| | | | | | |
| Holding | | % of Net Assets | | | Line of Business |
| Apple, Inc. | | | 3.5% | | | Technology Hardware & Equipment |
| Microsoft Corp. | | | 3.0 | | | Software & Services |
| General Electric Co. | | | 2.4 | | | Capital Goods |
| The Procter & Gamble Co. | | | 2.4 | | | Household & Personal Products |
| JPMorgan Chase & Co. | | | 2.3 | | | Banks |
| Johnson & Johnson | | | 2.2 | | | Pharmaceuticals, Biotechnology & Life Sciences |
| Pfizer, Inc. | | | 2.1 | | | Pharmaceuticals, Biotechnology & Life Sciences |
| Oracle Corp. | | | 1.9 | | | Software & Services |
| Merck & Co., Inc. | | | 1.8 | | | Pharmaceuticals, Biotechnology & Life Sciences |
| PepsiCo, Inc. | | | 1.7 | | | Food, Beverages & Tobacco |
| 3 | The top 10 holdings may not be representative of the Fund’s future investments. |
6
FUND BASICS
FUND vs. BENCHMARK SECTOR ALLOCATIONS4
As of December 31, 2014
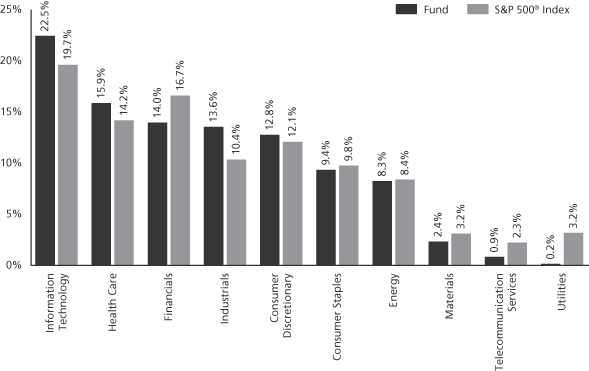
| 4 | The Fund is actively managed and, as such, its composition may differ over time. Consequently, the Fund’s overall sector allocations may differ from percentages contained in the graph above. The graph categorizes investments using Global Industry Classification Standard (“GICS”), however, the sector classifications used by the portfolio management team may differ from GICS. The percentage shown for each investment category reflects the value of investments in that category as a percentage of market value (excluding investments in the securities lending reinvestments vehicle, if any). Investments in the securities lending reinvestment vehicle represented 0.8% of the Fund’s net assets at December 31, 2014. The graph depicts the Fund’s investments but may not represent the Fund’s market exposure due to the exclusion of certain derivatives, if any, as listed in the Additional Investment Information section of the Schedule of Investments. |
7
GOLDMAN SACHS VARIABLE INSURANCE TRUST U.S. EQUITY INSIGHTS FUND
Performance Summary
December 31, 2014
The following graph shows the value, as of December 31, 2014, of a $10,000 investment made on January 1, 2005 in the Institutional Shares at NAV. For comparative purposes, the performance of the Fund’s benchmark, the S&P 500® Index (with distributions reinvested), is shown. This performance data represents past performance and should not be considered indicative of future performance, which will fluctuate with changes in market conditions. These performance fluctuations will cause an investor’s shares, when redeemed, to be worth more or less than their original cost. Performance reflects Fund level expenses but does not reflect fees and expenses associated with any variable annuity contract or variable life insurance policy that uses the Fund as an investment option for any contract or policy. Had performance reflected all of those fees and expenses, performance would have been reduced. Performance reflects applicable fee waivers and/or expense limitations in effect during the periods shown, and in their absence, performance would be reduced. Performance of Service Shares will vary from Institutional Shares due to differences in class specific fees. In addition to the Investment Adviser’s decisions regarding issuer/industry investment selection and allocation, other factors may affect Fund performance. These factors include, but are not limited to, Fund operating fees and expenses, portfolio turnover, and subscription and redemption cash flows affecting the Fund.
U.S. Equity Insights Fund’s 10 Year Performance
Performance of a $10,000 investment, with distributions reinvested, from January 1, 2005 through December 31, 2014.
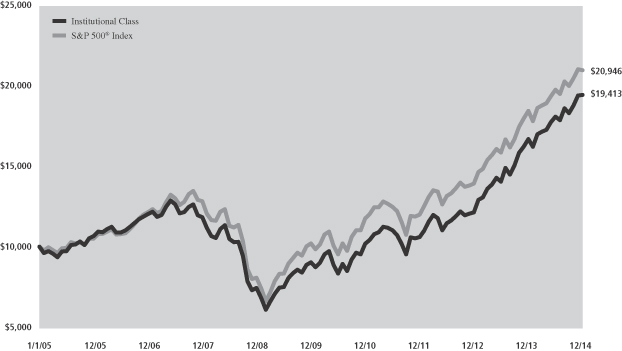
| | | | | | | | |
| Average Annual Total Return through December 31, 2014 | | One Year | | Five Years | | Ten Years | | Since Inception |
Institutional (Commenced February 13, 1998) | | 16.37% | | 16.54% | | 6.85% | | 5.73% |
Service (Commenced January 9, 2006) | | 16.18% | | 16.30% | | N/A | | 6.36% |
8
GOLDMAN SACHS VARIABLE INSURANCE TRUST U.S. EQUITY INSIGHTS FUND
Schedule of Investments
December 31, 2014
| | | | | | | | |
| Shares | | | Description | | Value | |
| | Common Stocks – 98.1% | |
| Automobiles & Components – 0.5% | |
| | 31,311 | | | Harley-Davidson, Inc. | | $ | 2,063,708 | |
| | |
| Banks – 4.3% | |
| | 111,888 | | | BB&T Corp. | | | 4,351,324 | |
| | 165,423 | | | JPMorgan Chase & Co. | | | 10,352,172 | |
| | 64,038 | | | SunTrust Banks, Inc. | | | 2,683,192 | |
| | 34,255 | | | Wells Fargo & Co. | | | 1,877,859 | |
| | | | | | | | |
| | | | | | | 19,264,547 | |
| | |
| Capital Goods – 8.6% | |
| | 44,687 | | | 3M Co. | | | 7,342,968 | |
| | 30,627 | | | Caterpillar, Inc. | | | 2,803,289 | |
| | 31,255 | | | Danaher Corp. | | | 2,678,866 | |
| | 85,442 | | | Emerson Electric Co. | | | 5,274,334 | |
| | 40,227 | | | General Dynamics Corp. | | | 5,536,040 | |
| | 423,799 | | | General Electric Co. | | | 10,709,401 | |
| | 17,717 | | | Lockheed Martin Corp. | | | 3,411,763 | |
| | 3,024 | | | Pentair PLC | | | 200,854 | |
| | 9,619 | | | Rockwell Automation, Inc. | | | 1,069,633 | |
| | | | | | | | |
| | | | | | | 39,027,148 | |
| | |
| Commercial & Professional Services – 0.5% | |
| | 29,712 | | | Cintas Corp. | | | 2,330,609 | |
| | |
| Consumer Durables & Apparel – 1.2% | |
| | 17,029 | | | D.R. Horton, Inc. | | | 430,664 | |
| | 8,598 | | | Mohawk Industries, Inc.* | | | 1,335,785 | |
| | 87,247 | | | Newell Rubbermaid, Inc. | | | 3,323,238 | |
| | 7,074 | | | PulteGroup, Inc. | | | 151,808 | |
| | | | | | | | |
| | | | | | | 5,241,495 | |
| | |
| Consumer Services – 2.0% | |
| | 113,844 | | | Carnival Corp. | | | 5,160,549 | |
| | 9,902 | | | Las Vegas Sands Corp. | | | 575,900 | |
| | 33,966 | | | McDonald’s Corp. | | | 3,182,614 | |
| | | | | | | | |
| | | | | | | 8,919,063 | |
| | |
| Diversified Financials – 5.0% | |
| | 5,653 | | | Affiliated Managers Group, Inc.* | | | 1,199,793 | |
| | 19,356 | | | Ameriprise Financial, Inc. | | | 2,559,831 | |
| | 38,707 | | | Berkshire Hathaway, Inc. Class B* | | | 5,811,856 | |
| | 8,068 | | | Discover Financial Services | | | 528,373 | |
| | 98,281 | | | Morgan Stanley | | | 3,813,303 | |
| | 49,374 | | | The Charles Schwab Corp. | | | 1,490,601 | |
| | 55,852 | | | The NASDAQ OMX Group, Inc. | | | 2,678,662 | |
| | 108,339 | | | Voya Financial, Inc. | | | 4,591,407 | |
| | | | | | | | |
| | | | | | | 22,673,826 | |
| | |
| Energy – 8.2% | |
| | 3,515 | | | Chevron Corp. | | | 394,313 | |
| | 70,062 | | | Exxon Mobil Corp. | | | 6,477,232 | |
| | 23,999 | | | Hess Corp. | | | 1,771,606 | |
| | 63,313 | | | HollyFrontier Corp. | | | 2,372,971 | |
| | 156,722 | | | Kinder Morgan, Inc. | | | 6,630,908 | |
| | 60,950 | | | Marathon Petroleum Corp. | | | 5,501,347 | |
| | 3,994 | | | ONEOK, Inc. | | | 198,861 | |
| | 69,642 | | | Phillips 66 | | | 4,993,331 | |
| | |
| | | | | | | | |
| Shares | | | Description | | Value | |
| | Common Stocks – (continued) | |
| Energy – (continued) | |
| | 28,782 | | | Spectra Energy Corp. | | $ | 1,044,787 | |
| | 28,076 | | | Tesoro Corp. | | | 2,087,451 | |
| | 107,131 | | | Valero Energy Corp. | | | 5,302,984 | |
| | | | | | | | |
| | | | | | | 36,775,791 | |
| | |
| Food & Staples Retailing – 3.8% | |
| | 77,513 | | | CVS Health Corp. | | | 7,465,277 | |
| | 78,430 | | | Walgreens Boots Alliance, Inc. | | | 5,976,366 | |
| | 42,217 | | | Wal-Mart Stores, Inc. | | | 3,625,596 | |
| | | | | | | | |
| | | | | | | 17,067,239 | |
| | |
| Food, Beverage & Tobacco – 1.8% | |
| | 15,860 | | | Mondelez International, Inc.
Class A | | | 576,114 | |
| | 82,273 | | | PepsiCo, Inc. | | | 7,779,735 | |
| | | | | | | | |
| | | | | | | 8,355,849 | |
| | |
| Health Care Equipment & Services – 1.8% | |
| | 24,043 | | | Aetna, Inc. | | | 2,135,740 | |
| | 30,191 | | | Anthem, Inc. | | | 3,794,103 | |
| | 144,944 | | | Boston Scientific Corp.* | | | 1,920,508 | |
| | 1,838 | | | C. R. Bard, Inc. | | | 306,247 | |
| | | | | | | | |
| | | | | | | 8,156,598 | |
| | |
| Household & Personal Products – 3.6% | |
| | 48,898 | | | Kimberly-Clark Corp. | | | 5,649,675 | |
| | 116,523 | | | The Procter & Gamble Co. | | | 10,614,080 | |
| | | | | | | | |
| | | | | | | 16,263,755 | |
| | |
| Insurance – 3.3% | |
| | 56,592 | | | Allied World Assurance Co. Holdings AG | | | 2,145,969 | |
| | 59,956 | | | Aspen Insurance Holdings Ltd. | | | 2,624,274 | |
| | 53,196 | | | Reinsurance Group of America, Inc. | | | 4,661,033 | |
| | 51,596 | | | The Travelers Companies, Inc. | | | 5,461,437 | |
| | | | | | | | |
| | | | | | | 14,892,713 | |
| | |
| Materials – 2.4% | |
| | 8,402 | | | Eastman Chemical Co. | | | 637,376 | |
| | 11,382 | | | Ecolab, Inc. | | | 1,189,647 | |
| | 80,983 | | | International Paper Co. | | | 4,339,069 | |
| | 3,242 | | | Rock-Tenn Co. Class A | | | 197,697 | |
| | 84,833 | | | The Dow Chemical Co. | | | 3,869,233 | |
| | 14,285 | | | United States Steel Corp. | | | 381,981 | |
| | | | | | | | |
| | | | | | | 10,615,003 | |
| | |
| Media – 3.8% | |
| | 132,862 | | | Comcast Corp. Class A(a) | | | 7,689,502 | |
| | 15,055 | | | DIRECTV* | | | 1,305,269 | |
| | 16,842 | | | The Walt Disney Co. | | | 1,586,348 | |
| | 8,600 | | | Time Warner Cable, Inc. | | | 1,307,716 | |
| | 70,491 | | | Viacom, Inc. Class B | | | 5,304,448 | |
| | | | | | | | |
| | | | | | | 17,193,283 | |
| | |
| Pharmaceuticals, Biotechnology & Life Sciences – 13.7% | |
| | 106,296 | | | AbbVie, Inc.(b) | | | 6,956,010 | |
| | 16,972 | | | Amgen, Inc. | | | 2,703,470 | |
| | |
| | |
| The accompanying notes are an integral part of these financial statements. | | 9 |
GOLDMAN SACHS VARIABLE INSURANCE TRUST U.S. EQUITY INSIGHTS FUND
Schedule of Investments (continued)
December 31, 2014
| | | | | | | | |
| Shares | | | Description | | Value | |
| | Common Stocks – (continued) | |
| Pharmaceuticals, Biotechnology & Life Sciences – (continued) | |
| | 15,858 | | | Biogen Idec, Inc.* | | $ | 5,382,998 | |
| | 40,547 | | | Bristol-Myers Squibb Co. | | | 2,393,489 | |
| | 58,032 | | | Celgene Corp.* | | | 6,491,460 | |
| | 50,979 | | | Eli Lilly & Co. | | | 3,517,041 | |
| | 73,571 | | | Gilead Sciences, Inc.* | | | 6,934,802 | |
| | 95,696 | | | Johnson & Johnson | | | 10,006,931 | |
| | 146,435 | | | Merck & Co., Inc. | | | 8,316,044 | |
| | 298,062 | | | Pfizer, Inc. | | | 9,284,631 | |
| | | | | | | | |
| | | | | | | 61,986,876 | |
| | |
| Real Estate – 1.1% | |
| | 41,581 | | | Equity Residential (REIT) | | | 2,987,179 | |
| | 92,600 | | | Host Hotels & Resorts, Inc. (REIT) | | | 2,201,102 | |
| | | | | | | | |
| | | | | | | 5,188,281 | |
| | |
| Retailing – 5.2% | |
| | 9,333 | | | Amazon.com, Inc.* | | | 2,896,497 | |
| | 64,589 | | | Bed Bath & Beyond, Inc.* | | | 4,919,744 | |
| | 10,446 | | | Best Buy Co., Inc. | | | 407,185 | |
| | 44,713 | | | Dollar General Corp.* | | | 3,161,209 | |
| | 42,988 | | | GameStop Corp. Class A(a) | | | 1,452,995 | |
| | 92,858 | | | Lowe’s Companies, Inc. | | | 6,388,630 | |
| | 17,273 | | | PetSmart, Inc. | | | 1,404,209 | |
| | 62,758 | | | The Gap, Inc. | | | 2,642,739 | |
| | | | | | | | |
| | | | | | | 23,273,208 | |
| | |
| Semiconductors & Semiconductor Equipment – 0.8% | |
| | 58,576 | | | Micron Technology, Inc.* | | | 2,050,746 | |
| | 27,326 | | | Texas Instruments, Inc. | | | 1,460,984 | |
| | | | | | | | |
| | | | | | | 3,511,730 | |
| | |
| Software & Services – 11.8% | |
| | 71,786 | | | Adobe Systems, Inc.* | | | 5,218,842 | |
| | 101,698 | | | CA, Inc. | | | 3,096,704 | |
| | 107,130 | | | eBay, Inc.* | | | 6,012,136 | |
| | 14,158 | | | Google, Inc. Class A* | | | 7,513,084 | |
| | 8,426 | | | Google, Inc. Class C* | | | 4,435,446 | |
| | 293,893 | | | Microsoft Corp. | | | 13,651,330 | |
| | 187,288 | | | Oracle Corp. | | | 8,422,341 | |
| | 3,115 | | | salesforce.com inc* | | | 184,751 | |
| | 329,218 | | | Xerox Corp. | | | 4,562,962 | |
| | | | | | | | |
| | | | | | | 53,097,596 | |
| | |
| Technology Hardware & Equipment – 9.5% | |
| | 143,878 | | | Apple, Inc. | | | 15,881,254 | |
| | 247,340 | | | Corning, Inc. | | | 5,671,506 | |
| | 203,166 | | | EMC Corp. | | | 6,042,157 | |
| | 33,009 | | | Flextronics International Ltd.* | | | 369,041 | |
| | 163,763 | | | Hewlett-Packard Co. | | | 6,571,809 | |
| | 77,010 | | | NetApp, Inc. | | | 3,192,064 | |
| | 47,085 | | | Western Digital Corp. | | | 5,212,310 | |
| | | | | | | | |
| | | | | | | 42,940,141 | |
| | |
| | Common Stocks – (continued) | |
| Telecommunication Services – 0.8% | |
| | 78,911 | | | CenturyLink, Inc. | | $ | 3,123,298 | |
| | 14,940 | | | Verizon Communications, Inc. | | | 698,893 | |
| | | | | | | | |
| | | | | | | 3,822,191 | |
| | |
| Transportation – 4.2% | |
| | 78,111 | | | Delta Air Lines, Inc. | | | 3,842,280 | |
| | 31,489 | | | FedEx Corp. | | | 5,468,380 | |
| | 60,096 | | | Southwest Airlines Co. | | | 2,543,263 | |
| | 26,630 | | | Union Pacific Corp. | | | 3,172,432 | |
| | 33,937 | | | United Parcel Service, Inc. Class B | | | 3,772,775 | |
| | | | | | | | |
| | | | | | | 18,799,130 | |
| | |
| Utilities – 0.2% | |
| | 12,726 | | | Edison International | | | 833,298 | |
| | |
| TOTAL INVESTMENTS BEFORE SECURITIES LENDING
REINVESTMENT VEHICLE |
|
| | (Cost $407,054,434) | | $ | 442,293,078 | |
| | |
| | | | | | | | |
| Shares | | Rate | | | Value | |
| Securities Lending Reinvestment Vehicle(c)(d) – 0.8% | |
Goldman Sachs Financial Square Money Market Fund — FST Shares | |
| 3,689,655 | | | 0.060 | % | | $ | 3,689,655 | |
| (Cost $3,689,655) | | | | | |
| |
| TOTAL INVESTMENTS – 98.9% | | | | | |
| (Cost $410,744,089) | | | $ | 445,982,733 | |
| |
OTHER ASSETS IN EXCESS OF LIABILITIES – 1.1% | | | | 5,111,591 | |
| |
| NET ASSETS – 100.0% | | | $ | 451,094,324 | |
| |
| | |
| The percentage shown for each investment category reflects the value of investments in that category as a percentage of net assets. |
| * | | Non-income producing security. |
| (a) | | All or a portion of security is on loan. |
| (b) | | All or a portion of security is segregated as collateral for initial margin requirements on futures transactions. |
| (c) | | Variable rate security. Interest rate or distribution rate disclosed is that which is in effect at December 31, 2014. |
| (d) | | Represents an affiliated issuer. |
| | |
| Investment Abbreviation: |
| REIT | | —Real Estate Investment Trust |
| | |
| 10 | | The accompanying notes are an integral part of these financial statements. |
GOLDMAN SACHS VARIABLE INSURANCE TRUST U.S. EQUITY INSIGHTS FUND
ADDITIONAL INVESTMENT INFORMATION
FUTURES CONTRACTS — At December 31, 2014, the Fund had the following futures contracts:
| | | | | | | | | | | | | | |
| Type | | Number of Contracts Long (Short) | | | Expiration Date | | Current Value | | | Unrealized Gain (Loss) | |
| S&P 500 E-mini Index | | | 41 | | | March 2015 | | $ | 4,207,420 | | | $ | 58,045 | |
| | |
| The accompanying notes are an integral part of these financial statements. | | 11 |
GOLDMAN SACHS VARIABLE INSURANCE TRUST U.S. EQUITY INSIGHTS FUND
Statement of Assets and Liabilities
December 31, 2014
| | | | |
| | | | |
| Assets: | | | |
Investments in unaffiliated issuers, at value (cost $407,054,434)(a) | | $ | 442,293,078 | |
Investments in affiliated securities lending reinvestment vehicle, at value which equals cost | | | 3,689,655 | |
Cash | | | 10,389,215 | |
Receivables: | | | | |
Dividends | | | 516,220 | |
Fund shares sold | | | 86,413 | |
Reimbursement from investment adviser | | | 20,457 | |
Securities lending income | | | 4,007 | |
Other assets | | | 12,869 | |
| Total assets | | | 457,011,914 | |
| | | | |
| | | | |
| Liabilities: | |
Payables: | | | | |
Payable upon return of securities loaned | | | 3,689,655 | |
Fund shares redeemed | | | 1,242,783 | |
Management fees | | | 237,983 | |
Variation margin on certain derivative contracts | | | 49,815 | |
Distribution and Service fees and Transfer Agent fees | | | 32,355 | |
Accrued expenses and other liabilities | | | 664,999 | |
| Total liabilities | | | 5,917,590 | |
| | | | |
| | | | |
| Net Assets: | |
Paid-in capital | | | 403,500,027 | |
Undistributed net investment income | | | 472,171 | |
Accumulated net realized gain | | | 11,825,437 | |
Net unrealized gain | | | 35,296,689 | |
| NET ASSETS | | $ | 451,094,324 | |
Net Assets: | | | | |
Institutional | | $ | 312,369,586 | |
Service | | | 138,724,738 | |
Total Net Assets | | $ | 451,094,324 | |
Shares of beneficial interest outstanding $0.001 par value (unlimited shares authorized): | | | | |
Institutional | | | 17,238,381 | |
Service | | | 7,636,133 | |
Net asset value, offering and redemption price per share: | | | | |
Institutional | | | $18.12 | |
Service | | | 18.17 | |
(a) Includes loaned securities having a market value of $3,567,828.
| | |
| 12 | | The accompanying notes are an integral part of these financial statements. |
GOLDMAN SACHS VARIABLE INSURANCE TRUST U.S. EQUITY INSIGHTS FUND
Statement of Operations
For the Fiscal Year Ended December 31, 2014
| | | | |
| | | | |
| Investment income: | |
Dividends (net of foreign taxes withheld of $411) | | $ | 8,084,772 | |
Securities lending income — affiliated issuer | | | 21,909 | |
| Total investment income | | | 8,106,681 | |
| | | | |
| | | | |
| Expenses: | |
Management fees | | | 2,696,649 | |
Distribution and Service fees — Service Class | | | 326,199 | |
Printing and mailing costs | | | 87,966 | |
Transfer Agent fees(a) | | | 86,982 | |
Professional fees | | | 82,709 | |
Custody, accounting and administrative services | | | 58,096 | |
Trustee fees | | | 24,707 | |
Other | | | 53,431 | |
| Total expenses | | | 3,416,739 | |
Less — expense reductions | | | (314,382 | ) |
| Net expenses | | | 3,102,357 | |
| NET INVESTMENT INCOME | | | 5,004,324 | |
| | | | |
| | | | |
| Realized and unrealized gain (loss): | |
Net realized gain from: | | | | |
Investments | | | 72,180,092 | |
Futures contracts | | | 418,052 | |
Net change in unrealized gain (loss) on: | | | | |
Investments | | | (11,669,785 | ) |
Futures contracts | | | 58,045 | |
| Net realized and unrealized gain | | | 60,986,404 | |
| NET INCREASE IN NET ASSETS RESULTING FROM OPERATIONS | | $ | 65,990,728 | |
(a) Institutional and Service Shares had Transfer Agent fees of $60,888 and $26,094, respectively.
| | |
| The accompanying notes are an integral part of these financial statements. | | 13 |
GOLDMAN SACHS VARIABLE INSURANCE TRUST U.S. EQUITY INSIGHTS FUND
Statements of Changes in Net Assets
| | | | | | | | |
| | | For the Fiscal Year Ended
December 31, 2014 | | | For the Fiscal Year Ended
December 31, 2013 | |
| | | | | | | | |
| From operations: | |
Net investment income | | $ | 5,004,324 | | | $ | 5,219,081 | |
Net realized gain | | | 72,598,144 | | | | 113,173,019 | |
Net change in unrealized gain (loss) | | | (11,611,740 | ) | | | 8,467,109 | |
| Net increase in net assets resulting from operations | | | 65,990,728 | | | | 126,859,209 | |
| | | | | | | | |
| | | | | | | | |
| Distributions to shareholders: | |
From net investment income | | | | | | | | |
Institutional Shares | | | (4,217,304 | ) | | | (3,187,605 | ) |
Service Shares | | | (1,534,479 | ) | | | (1,011,074 | ) |
From net realized gains | | | | | | | | |
Institutional Shares | | | (13,420,480 | ) | | | — | |
Service Shares | | | (5,920,765 | ) | | | — | |
| Total distributions to shareholders | | | (25,093,028 | ) | | | (4,198,679 | ) |
| | | | | | | | |
| | | | | | | | |
| From share transactions: | |
Proceeds from sales of shares | | | 22,870,188 | | | | 12,878,351 | |
Reinvestment of distributions | | | 25,093,028 | | | | 4,198,679 | |
Cost of shares redeemed | | | (71,104,168 | ) | | | (69,050,920 | ) |
| Net decrease in net assets resulting from share transactions | | | (23,140,952 | ) | | | (51,973,890 | ) |
| TOTAL INCREASE | | | 17,756,748 | | | | 70,686,640 | |
| | | | | | | | |
| | | | | | | | |
| Net assets: | |
| | |
Beginning of year | | | 433,337,576 | | | | 362,650,936 | |
End of year | | $ | 451,094,324 | | | $ | 433,337,576 | |
| Undistributed net investment income | | $ | 472,171 | | | $ | 1,221,302 | |
| | |
| 14 | | The accompanying notes are an integral part of these financial statements. |
GOLDMAN SACHS VARIABLE INSURANCE TRUST U.S. EQUITY INSIGHTS FUND
Financial Highlights
|
| Selected Data for a Share Outstanding Throughout Each Year |
|
| | | | | | | | | | | | | | | | | | | | | | | | | | | | | | | | | | | | | | | | | | | | | | | | | | | | | | | | |
| | | | | | Income from
investment operations | | | Distributions to shareholders | | | | | | | | | | | | | | | | | | | | | | |
| Year - Share Class | | Net asset value, beginning of year | | | Net investment income(a) | | | Net realized and unrealized gain | | | Total from investment operations | | | From net investment income | | | From
net realized gains | | | Total distributions | | | Net asset value, end of year | | | Total return(b) | | | Net assets, end of year (in 000s) | | | Ratio of net expenses
to average
net assets | | | Ratio of total expenses to average net assets | | | Ratio of net investment income to average net assets | | | Portfolio
turnover
rate(c) | |
FOR THE FISCAL YEARS ENDED DECEMBER 31, | |
2014 - Institutional | | $ | 16.52 | | | $ | 0.21 | | | $ | 2.47 | | | $ | 2.68 | | | $ | (0.26 | ) | | $ | (0.82 | ) | | $ | (1.08 | ) | | $ | 18.12 | | | | 16.37 | % | | $ | 312,370 | | | | 0.65 | % | | | 0.71 | % | | | 1.21 | % | | | 214 | % |
2014 - Service | | | 16.55 | | | | 0.18 | | | | 2.47 | | | | 2.65 | | | | (0.21 | ) | | | (0.82 | ) | | | (1.03 | ) | | | 18.17 | | | | 16.18 | | | | 138,725 | | | | 0.86 | | | | 0.96 | | | | 1.01 | | | | 214 | |
2013 - Institutional | | | 12.14 | | | | 0.20 | | | | 4.35 | | | | 4.55 | | | | (0.17 | ) | | | — | | | | (0.17 | ) | | | 16.52 | | | | 37.52 | | | | 307,589 | | | | 0.65 | | | | 0.71 | | | | 1.36 | | | | 207 | |
2013 - Service | | | 12.16 | | | | 0.17 | | | | 4.35 | | | | 4.52 | | | | (0.13 | ) | | | — | | | | (0.13 | ) | | | 16.55 | | | | 37.23 | | | | 125,748 | | | | 0.86 | | | | 0.96 | | | | 1.15 | | | | 207 | |
2012 - Institutional | | | 10.80 | | | | 0.20 | | | | 1.36 | (d) | | | 1.56 | | | | (0.22 | ) | | | — | | | | (0.22 | ) | | | 12.14 | | | | 14.42 | (d) | | | 262,759 | | | | 0.64 | | | | 0.72 | | | | 1.71 | | | | 134 | |
2012 - Service | | | 10.82 | | | | 0.18 | | | | 1.35 | (d) | | | 1.53 | | | | (0.19 | ) | | | — | | | | (0.19 | ) | | | 12.16 | | | | 14.10 | (d) | | | 99,892 | | | | 0.85 | | | | 0.97 | | | | 1.51 | | | | 134 | |
2011 - Institutional | | | 10.57 | | | | 0.18 | (e) | | | 0.25 | | | | 0.43 | | | | (0.20 | ) | | | — | | | | (0.20 | ) | | | 10.80 | | | | 4.05 | | | | 273,555 | | | | 0.64 | | | | 0.70 | | | | 1.69 | (e) | | | 51 | |
2011 - Service | | | 10.58 | | | | 0.16 | (e) | | | 0.25 | | | | 0.41 | | | | (0.17 | ) | | | — | | | | (0.17 | ) | | | 10.82 | | | | 3.90 | | | | 99,711 | | | | 0.85 | | | | 0.95 | | | | 1.48 | (e) | | | 51 | |
2010 - Institutional | | | 9.50 | | | | 0.14 | | | | 1.08 | | | | 1.22 | | | | (0.15 | ) | | | — | | | | (0.15 | ) | | | 10.57 | | | | 12.84 | | | | 319,948 | | | | 0.64 | | | | 0.70 | | | | 1.45 | | | | 38 | |
2010 - Service | | | 9.51 | | | | 0.12 | | | | 1.08 | | | | 1.20 | | | | (0.13 | ) | | | — | | | | (0.13 | ) | | | 10.58 | | | | 12.60 | | | | 111,171 | | | | 0.85 | | | | 0.95 | | | | 1.25 | | | | 38 | |
| (a) | Calculated based on the average shares outstanding methodology. |
| (b) | Assumes investment at the net asset value at the beginning of the year, reinvestment of all distributions, and a complete redemption of the investment at the net asset value at the end of the year. |
| (c) | The Fund’s portfolio turnover rate is calculated in accordance with regulatory requirements, without regard to transactions involving short term investments and certain derivatives. If such transactions were included, the Fund’s portfolio turnover rate may be higher. |
| (d) | Reflects payment from affiliate relating to certain investment transactions which amounted to $0.01 per share and 0.07% of average net assets. Excluding such payment, the total return would have been 14.32% and 14.01%. |
| (e) | Reflects income recognized from special dividends which amounted to $0.02 per share and 0.17% of average net assets. |
| | | | |
| The accompanying notes are an integral part of these financial statements. | | 15 | | |
GOLDMAN SACHS VARIABLE INSURANCE TRUST U.S. EQUITY INSIGHTS FUND
Notes to Financial Statements
December 31, 2014
1. ORGANIZATION
Goldman Sachs Variable Insurance Trust (the “Trust” or “VIT”) is a Delaware statutory trust registered under the Investment Company Act of 1940, as amended (the “Act”), as an open-end management investment company. The Trust includes the Goldman Sachs U.S. Equity Insights Fund (the “Fund”)(formerly the Goldman Sachs Structured U.S. Equity Fund). The Fund is a diversified portfolio under the Act offering two classes of shares — Institutional and Service Shares. Shares of the Trust are offered to separate accounts of participating life insurance companies for the purpose of funding variable annuity contracts and variable life insurance policies.
Goldman Sachs Asset Management, L.P. (“GSAM”), an affiliate of Goldman, Sachs & Co. (“Goldman Sachs”), serves as investment adviser to the Fund pursuant to a management agreement (the “Agreement”) with the Trust.
2. SIGNIFICANT ACCOUNTING POLICIES
The financial statements have been prepared in accordance with accounting principles generally accepted in the United States of America (“GAAP”) and require management to make estimates and assumptions that may affect the reported amounts and disclosures. Actual results may differ from those estimates and assumptions.
A. Investment Valuation — The Fund’s valuation policy is to value investments at fair value.
B. Investment Income and Investments — Investment income includes interest income and dividend income, net of any foreign withholding taxes, less any amounts reclaimable. Interest income is accrued daily and adjusted for amortization of premiums and accretion of discounts. Dividend income is recognized on ex-dividend date or, for certain foreign securities, as soon as such information is obtained subsequent to the ex-dividend date. Investment transactions are reflected on trade date. Realized gains and losses are calculated using identified cost. Investment transactions are recorded on the following business day for daily net asset value (“NAV”) calculations. Any foreign capital gains tax is accrued daily based upon net unrealized gains, and is payable upon sale of such investments. Distributions received from the Fund’s investments in United States (“U.S.”) real estate investment trusts (“REITs”) may be characterized as ordinary income, net capital gain or a return of capital. A return of capital is recorded by the Fund as a reduction to the cost basis of the REIT.
For derivative contracts, realized gains and losses are recorded upon settlement of the contract.
C. Class Allocations and Expenses — Investment income, realized and unrealized gain (loss), and non-class specific expenses of the Fund are allocated daily based upon the proportion of net assets of each class. Class specific expenses, where applicable, are borne by the respective share classes and include Distribution and Service and Transfer Agent fees. Non-class specific expenses directly incurred by a Fund are charged to that Fund, while such expenses incurred by the Trust are allocated across the respective Funds on a straight-line and/or pro-rata basis depending upon the nature of the expenses.
D. Federal Taxes and Distributions to Shareholders — It is the Fund’s policy to comply with the requirements of the Internal Revenue Code of 1986, as amended (the “Code”), applicable to regulated investment companies (mutual funds) and to distribute each year substantially all of its investment company taxable income and capital gains to its shareholders. Accordingly, the Fund is not required to make any provisions for the payment of federal income tax. Distributions to shareholders are recorded on the ex-dividend date. Income and capital gains distributions, if any, are declared and paid annually.
16
GOLDMAN SACHS VARIABLE INSURANCE TRUST U.S. EQUITY INSIGHTS FUND
2. SIGNIFICANT ACCOUNTING POLICIES (continued)
Net capital losses are carried forward to future fiscal years and may be used to the extent allowed by the Code to offset any future capital gains. Utilization of capital loss carryforwards will reduce the requirement of future capital gains distributions.
Under the Regulated Investment Company Modernization Act of 2010, the Fund is permitted to carry forward capital losses incurred in taxable years beginning after December 22, 2010 for an unlimited period. However, any losses incurred during those future taxable years will be required to be utilized prior to the losses incurred in pre-enactment taxable years. As a result of this ordering rule, pre-enactment capital loss carryforwards may be more likely to expire unused. Additionally, post-enactment capital losses that are carried forward will retain their character as either short-term or long-term capital losses rather than being considered all short-term as under previous law.
The characterization of distributions to shareholders for financial reporting purposes is determined in accordance with federal income tax rules, which may differ from GAAP. The source of the Fund’s distributions may be shown in the accompanying financial statements as either from net investment income, net realized gain or capital. Certain components of the Fund’s net assets on the Statement of Assets and Liabilities reflect permanent GAAP/tax differences based on the appropriate tax character.
3. INVESTMENTS AND FAIR VALUE MEASUREMENTS
The fair value of a financial instrument is the amount that would be received to sell an asset or paid to transfer a liability in an orderly transaction between market participants at the measurement date (i.e., the exit price). GAAP establishes a fair value hierarchy that prioritizes the inputs to valuation techniques used to measure fair value. The hierarchy gives the highest priority to unadjusted quoted prices in active markets for identical assets or liabilities (Level 1 measurements) and the lowest priority to unobservable inputs (Level 3 measurements). The levels used for classifying investments are not necessarily an indication of the risk associated with investing in these investments. The three levels of the fair value hierarchy are described below:
Level 1 — Unadjusted quoted prices in active markets that are accessible at the measurement date for identical, unrestricted assets or liabilities;
Level 2 — Quoted prices in markets that are not active or financial instruments for which significant inputs are observable (including, but not limited to, quoted prices for similar investments, interest rates, foreign exchange rates, volatility and credit spreads), either directly or indirectly;
Level 3 — Prices or valuations that require significant unobservable inputs (including GSAM’s assumptions in determining fair value measurement).
The Trustees have adopted Valuation Procedures that govern the valuation of the portfolio investments held by the Fund, including investments for which market quotations are not readily available. The Trustees have delegated to GSAM day-to-day responsibility for implementing and maintaining internal controls and procedures related to the valuation of the Fund’s portfolio investments. To assess the continuing appropriateness of pricing sources and methodologies, GSAM regularly performs price verification procedures and issues challenges as necessary to third party pricing vendors or brokers, and any differences are reviewed in accordance with the Valuation Procedures.
17
GOLDMAN SACHS VARIABLE INSURANCE TRUST U.S. EQUITY INSIGHTS FUND
Notes to Financial Statements (continued)
December 31, 2014
3. INVESTMENTS AND FAIR VALUE MEASUREMENTS (continued)
A. Level 1 and Level 2 Fair Value Investments — The valuation techniques and significant inputs used in determining the fair values for investments classified as Level 1 and Level 2 are as follows:
Equity Securities — Equity securities and investment companies traded on a U.S. securities exchange or the NASDAQ system, or those located on certain foreign exchanges, including but not limited to the Americas, are valued daily at their last sale price or official closing price on the principal exchange or system on which they are traded. If no sale occurs, equity securities and exchange traded investment companies are valued at the last bid price for long positions and at the last ask price for short positions. Investments in investment companies (other than those that are exchange traded) are valued at the NAV on the valuation date. To the extent these investments are actively traded, they are classified as Level 1 of the fair value hierarchy, otherwise they are generally classified as Level 2.
Unlisted equity securities for which market quotations are available are valued at the last sale price on the valuation date, or if no sale occurs, at the last bid price. Securities traded on certain foreign securities exchanges are valued daily at fair value determined by an independent fair value service (if available) under Valuation Procedures approved by the Trustees and consistent with applicable regulatory guidance. The independent fair value service takes into account multiple factors including, but not limited to, movements in the securities markets, certain depositary receipts, futures contracts and foreign currency exchange rates that have occurred subsequent to the close of the foreign securities exchange. These investments are generally classified as Level 2 of the fair value hierarchy.
Derivative Contracts — A derivative is an instrument whose value is derived from underlying assets, indices, reference rates or a combination of these factors. The Fund enters into derivative transactions to hedge against changes in interest rates, securities prices, and/or currency exchange rates, to increase total return, or to gain access to certain markets or attain exposure to other underliers.
Exchange-traded derivatives, including futures contracts, typically fall within Level 1 of the fair value hierarchy. Over-the-counter (“OTC”) and centrally cleared derivatives are valued using market transactions and other market evidence, including market-based inputs to models, calibration to market-clearing transactions, broker or dealer quotations, or other alternative pricing sources. Where models are used, the selection of a particular model to value OTC and centrally cleared derivatives depends upon the contractual terms of, and specific risks inherent in, the instrument, as well as the availability of pricing information in the market. Valuation models require a variety of inputs, including contractual terms, market prices, yield curves, credit curves, measures of volatility, voluntary and involuntary prepayment rates, loss severity rates and correlations of such inputs. For OTC and centrally cleared derivatives that trade in liquid markets, model inputs can generally be verified and model selection does not involve significant management judgment. OTC and centrally cleared derivatives are classified within Level 2 of the fair value hierarchy when significant inputs are corroborated by market evidence.
i. Futures Contracts — Futures contracts are contracts to buy or sell a standardized quantity of a specified commodity or security and are valued based on exchanged settlement prices or independent market quotes. Futures contracts are valued at the last settlement price, or in the absence of a sale, the last bid price for long positions and at the last ask price for short positions, at the end of each day on the board of trade or exchange upon which they are traded. Upon entering into a futures contract, the Fund deposits cash or securities in an account on behalf of the broker in an amount sufficient to meet the initial margin requirement. Subsequent payments are made or received by the Fund equal to the daily change in the contract value and are recorded as variation margin receivable or payable with a corresponding offset to unrealized gains or losses.
18
GOLDMAN SACHS VARIABLE INSURANCE TRUST U.S. EQUITY INSIGHTS FUND
3. INVESTMENTS AND FAIR VALUE MEASUREMENTS (continued)
B. Level 3 Fair Value Investments — To the extent that the aforementioned significant inputs are unobservable, or if quotations are not readily available, or if GSAM believes that such quotations do not accurately reflect fair value, the fair value of the Fund’s investments may be determined under Valuation Procedures approved by the Trustees. GSAM, consistent with its procedures and applicable regulatory guidance, may make an adjustment to the most recent valuation prices of either domestic or foreign securities in light of significant events to reflect what it believes to be the fair value of the securities at the time of determining a Fund’s NAV. Significant events which could affect a large number of securities in a particular market may include, but are not limited to: significant fluctuations in U.S. or foreign markets; market dislocations; market disruptions; or unscheduled market closings. Significant events which could also affect a single issuer may include, but are not limited to: corporate actions such as reorganizations, mergers and buy-outs; ratings downgrades; and bankruptcies.
C. Fair Value Hierarchy — The following is a summary of the Fund’s investments and derivatives classified in the fair value hierarchy as of December 31, 2014:
| | | | | | | | | | | | |
| Investment Type | | Level 1 | | | Level 2 | | | Level 3 | |
| Assets | | | | | | | | | | | | |
| Common Stock(a) | | | | | | | | | | | | |
North America | | $ | 442,293,078 | | | $ | — | | | $ | — | |
| Securities Lending Reinvestment Vehicle | | | 3,689,655 | | | | — | | | | — | |
| Total | | $ | 445,982,733 | | | $ | — | | | $ | — | |
| | | |
| Derivative Type | | | | | | | | | |
| Assets(b) | | | | | | | | | | | | |
Futures Contracts | | $ | 58,045 | | | $ | — | | | $ | — | |
| (a) | Amounts are disclosed by continent to highlight the impact of time zone differences between local market close and the calculation of net asset value. Security valuations are based on the principal exchange or system on which they are traded, which may differ from country of domicile. |
| (b) | Amount shown represents unrealized gain (loss) at fiscal year end. |
For further information regarding security characteristics, see the Schedule of Investments.
19
GOLDMAN SACHS VARIABLE INSURANCE TRUST U.S. EQUITY INSIGHTS FUND
Notes to Financial Statements (continued)
December 31, 2014
4. INVESTMENTS IN DERIVATIVES
The following table sets forth, by certain risk types, the gross value of derivative contracts as of December 31, 2014. These instruments were used to meet the Fund’s investment objectives and to obtain and/or manage exposure related to the risks below. The values in the table below exclude the effects of cash collateral received or posted pursuant to these derivative contracts, and therefore are not representative of the Fund’s net exposure.
| | | | | | | | | | | | | | |
| Risk | | | | Statement of Assets and Liabilities | | Assets(a) | | | Statement of Assets and Liabilities | | Liabilities | |
| Equity | | | | Variation margin on certain derivative contracts | | $ | 58,045 | | | — | | $ | — | |
| (a) | Includes unrealized gain (loss) on futures contracts described in the Additional Investment Information section of the Schedule of Investments. Only current day’s variation margin is reported within the Statement of Assets and Liabilities. |
The following table sets forth, by certain risk types, the Fund’s gains (losses) related to these derivatives and their indicative volumes for the fiscal year ended December 31, 2014. These gains (losses) should be considered in the context that these derivative contracts may have been executed to create investment opportunities and /or economically hedge certain investments, and accordingly, certain gains (losses) on such derivative contracts may offset certain (losses) gains attributable to investments. These gains (losses) are included in “Net realized gain (loss)” or “Net change in unrealized gain (loss)” on the Statement of Operations:
| | | | | | | | | | | | | | |
| Risk | | Statement of Operations | | Net
Realized
Gain (Loss) | | | Net Change in
Unrealized
Gain (Loss) | | | Average
Number of
Contracts(a) | |
| Equity | | Net realized gain (loss) from futures contracts/Net change in unrealized gain (loss) on futures contracts | | $ | 418,052 | | | $ | 58,045 | | | | 28 | |
| (a) | Average number of contracts is based on the average of month end balances for the fiscal year ended December 31, 2014. |
20
GOLDMAN SACHS VARIABLE INSURANCE TRUST U.S. EQUITY INSIGHTS FUND
5. AGREEMENTS AND AFFILIATED TRANSACTIONS
A. Management Agreement — Under the Agreement, GSAM manages the Fund, subject to the general supervision of the Trustees.
As compensation for the services rendered pursuant to the Agreement, the assumption of the expenses related thereto and administration of the Fund’s business affairs, including providing facilities, GSAM is entitled to a management fee, accrued daily and paid monthly, equal to an annual percentage rate of the Fund’s average daily net assets.
For the fiscal year ended December 31, 2014, contractual and effective net management fees with GSAM were at the following rates:
| | | | | | | | | | | | | | | | | | | | | | |
| Contractual Management Fee Rate | |
First
$1 billion | | | Next
$1 billion | | | Next
$3 billion | | | Next
$3 billion | | | Over
$8 billion | | | Effective
Rate | |
| | 0.62% | | | | 0.59 | % | | | 0.56 | % | | | 0.55 | % | | | 0.54 | % | | | 0.62 | % |
B. Distribution and Service Plan — The Trust, on behalf of the Service Shares of the Fund, has adopted a Distribution and Service Plan (the “Plan”). Under the Plan, Goldman Sachs, which serves as distributor (the “Distributor”), is entitled to a fee accrued daily and paid monthly for distribution services and personal and account maintenance services, which may then be paid by Goldman Sachs to authorized dealers, equal to, on an annual basis, 0.25% of the Fund’s average daily net assets attributable to Service Shares. Goldman Sachs has agreed to waive distribution and service fees so as not to exceed an annual rate of 0.21% of the Fund’s average daily net assets attributable to Service Shares. The distribution and service fee waiver will remain in place through at least April 30, 2015, and prior to such date Goldman Sachs may not terminate the arrangement without the approval of the Trustees. For the fiscal year ended December 31, 2014, Goldman Sachs waived $52,192 in distribution and service fees for the Fund’s Services Shares.
C. Transfer Agency Agreement — Goldman Sachs also serves as the transfer agent of the Fund for a fee pursuant to the Transfer Agency Agreement. The fees charged for such transfer agency services are accrued daily and paid monthly at an annual rate of 0.02% of the average daily net assets of Institutional and Service Shares.
D. Other Expense Agreements and Affiliated Transactions — GSAM has agreed to limit certain “Other Expenses” of the Fund (excluding transfer agency fees and expenses, taxes, interest, brokerage fees, shareholder meetings, litigation, indemnification, and extraordinary expenses) to the extent such expenses exceed, on an annual basis, a percentage rate of the average daily net assets of the Fund. Such Other Expense reimbursements, if any, are accrued daily and paid monthly. In addition, the Fund is not obligated to reimburse GSAM for prior fiscal year expense reimbursements, if any. The Other Expense limitation as an annual percentage rate of average daily net assets for the Fund is 0.004%. The Other Expense limitation will remain in place through at least April 30, 2015, and prior to such date GSAM may not terminate the arrangement without the approval of the Trustees. The Fund bears its respective share of costs related to proxy and shareholder meetings, and GSAM has agreed to reimburse the Fund to the extent such expenses exceed a specified percentage of the Fund’s net assets. For the fiscal year ended December 31, 2014, GSAM reimbursed $251,056 to the Fund. In addition, the Fund has entered into certain offset arrangements with the custodian and the transfer agent, which may result in a reduction of the Fund’s expenses and are received irrespective of the application of the “Other Expense” limitation described above. For the fiscal year ended December 31, 2014, custody fee credits were $11,134.
21
GOLDMAN SACHS VARIABLE INSURANCE TRUST U.S. EQUITY INSIGHTS FUND
Notes to Financial Statements (continued)
December 31, 2014
5. AGREEMENTS AND AFFILIATED TRANSACTIONS (continued)
E. Line of Credit Facility — As of December 31, 2014, the Fund participated in a $1,080,000,000 committed, unsecured revolving line of credit facility (the “facility”) together with other funds of the Trust and registered investment companies having management agreements with GSAM or its affiliates (“Other Borrowers”). Pursuant to the terms of the facility, the Fund and Other Borrowers could increase the credit amount by an additional $120,000,000, for a total of up to $1,200,000,000. This facility is to be used solely for temporary or emergency purposes, which may include the funding of redemptions. The interest rate on borrowings is based on the federal funds rate. The facility also requires a fee to be paid by the Fund based on the amount of the commitment that has not been utilized. For the fiscal year ended December 31, 2014, the Fund did not have any borrowings under the facility.
F. Other Transactions with Affiliates — For the fiscal year ended December 31, 2014, Goldman Sachs earned $602 in brokerage commissions from portfolio transactions, including futures transactions executed with Goldman Sachs as the Futures Commission Merchant, on behalf of the Fund.
6. PORTFOLIO SECURITIES TRANSACTIONS
The cost of purchases and proceeds from sales and maturities of long-term securities for the fiscal year ended December 31, 2014, were $909,133,748 and $949,721,538, respectively.
7. SECURITIES LENDING
Pursuant to exemptive relief granted by the Securities and Exchange Commission (“SEC”) and the terms and conditions contained therein, the Fund may lend its securities through a securities lending agent, Goldman Sachs Agency Lending (“GSAL”), a wholly-owned subsidiary of Goldman Sachs, to certain qualified borrowers including Goldman Sachs and affiliates. In accordance with the Fund’s securities lending procedures, the Fund receives cash collateral at least equal to the market value of the securities on loan. The market value of the loaned securities is determined at the close of business of the Fund at their last sale price or official closing price on the principal exchange or system on which they are traded, and any additional required collateral is delivered to the Fund on the next business day. As with other extensions of credit, the Fund may experience delay in the recovery of its securities or incur a loss should the borrower of the securities breach its agreement with the Fund or become insolvent at a time when the collateral is insufficient to cover the cost of repurchasing securities on loan. Dividend income received from securities on loan may not be subject to withholding taxes and therefore withholding taxes paid may differ from the amounts listed in the Statement of Operations.
The Fund invests the cash collateral received in connection with securities lending transactions in the Goldman Sachs Financial Square Money Market Fund (“Money Market Fund”), an affiliated series of the Trust. The Money Market Fund is registered under the Act as an open end investment company, is subject to Rule 2a-7 under the Act, and is managed by GSAM, for which GSAM may receive an investment advisory fee of up to 0.205% on an annualized basis of the average daily net assets of the Money Market Fund.
In the event of a default by a borrower with respect to any loan, GSAL will exercise any and all remedies provided under the applicable borrower agreement to make the Fund whole. These remedies include purchasing replacement securities by applying the collateral held from the defaulting broker against the purchase cost of the replacement securities. If, despite such efforts by GSAL to exercise these remedies, the Fund sustains losses as a result of a borrower’s default, GSAL indemnifies the Fund by purchasing replacement securities at its expense, or paying the Fund an amount equal to the market value of the replacement securities, subject to an exclusion for any shortfalls resulting from a loss of value in the cash collateral pool due to reinvestment risk and a requirement that the Fund agrees to assign rights to the collateral to GSAL for purpose of using the collateral to cover purchase of replacement securities as more fully described in the Securities Lending Agency Agreement. The Fund’s loaned securities were all subject to enforceable Securities Lending Agreements and the value of the collateral is equal to the value of the cash received. The value of loaned securities and cash collateral at period end are disclosed in the Fund’s Statement of Assets and Liabilities.
22
GOLDMAN SACHS VARIABLE INSURANCE TRUST U.S. EQUITY INSIGHTS FUND
7. SECURITIES LENDING (continued)
Both the Fund and GSAL received compensation relating to the lending of the Fund’s securities. The amount earned by the Fund for the fiscal year ended December 31, 2014, is reported under Investment Income on the Statement of Operations.
The table below details securities lending activity with affiliates of Goldman Sachs:
| | | | |
| For the fiscal year ended December 31, 2014 |
Earnings of GSAL
Relating to
Securities
Loaned | | Amounts
Received
by the Funds
from Lending to
Goldman Sachs | | Amounts Payable to
Goldman Sachs
Upon Return of
Securities Loaned as of
December 31, 2014 |
| $2,443 | | $6,826 | | $1,419,155 |
The following table provides information about the Fund’s investment in the Money Market Fund for the fiscal year ended December 31, 2014:
| | | | | | | | | | | | | | | | | | |
Number of
Shares Held
Beginning of Year | | Shares Bought | | | Shares Sold | | | Number of
Shares Held
End of Year | | | Value at End
of Year | |
| 2,368,400 | | | 57,079,410 | | | | (55,758,155 | ) | | | 3,689,655 | | | $ | 3,689,655 | |
8. TAX INFORMATION
The tax character of distributions paid during the fiscal years ended December 31, 2013 and December 31, 2014 was as follows:
| | | | | | | | |
| | | 2013 | | | 2014 | |
| Distributions paid from: | | | | | | | | |
| Ordinary income | | $ | 4,198,679 | | | $ | 7,929,353 | |
| Net long-term capital gains | | | — | | | | 17,163,675 | |
| Total taxable distributions | | $ | 4,198,679 | | | $ | 25,093,028 | |
As of December 31, 2014, the components of accumulated earnings (losses) on a tax-basis were as follows(1):
| | | | |
| Undistributed ordinary income — net | | $ | 8,391,324 | |
| Undistributed long-term capital gains | | | 4,137,253 | |
| Total undistributed earnings | | $ | 12,528,577 | |
| Unrealized gains — net | | | 35,065,720 | |
| Total accumulated gains — net | | $ | 47,594,297 | |
| (1) | The Fund utilized $41,407,562 of capital losses in the current fiscal year. |
23
GOLDMAN SACHS VARIABLE INSURANCE TRUST U.S. EQUITY INSIGHTS FUND
Notes to Financial Statements (continued)
December 31, 2014
8. TAX INFORMATION (continued)
As of December 31, 2014, the Fund’s aggregate security unrealized gains and losses based on cost for U.S. federal income tax purposes were as follows:
| | | | |
| Tax cost | | $ | 410,917,013 | |
| Gross unrealized gain | | | 39,194,375 | |
| Gross unrealized loss | | | (4,128,655 | ) |
| Net unrealized security gain | | $ | 35,065,720 | |
The difference between GAAP-basis and tax-basis unrealized gains (losses) is attributable primarily to wash sales, net mark to market gains (losses) on regulated futures contracts and differences in the tax treatment of underlying fund investments.
In order to present certain components of the Fund’s capital accounts on a tax-basis, the Fund has reclassified $1,672 from undistributed net investment income to accumulated net realized gain (loss). This reclassification has no impact on the net asset value of the Fund and results primarily from differences in the tax treatment of underlying fund investments.
GSAM has reviewed the Fund’s tax positions for all open tax years (the current and prior three years, as applicable) and has concluded that no provision for income tax is required in the Fund’s financial statements. Such open tax years remain subject to examination and adjustment by tax authorities.
9. OTHER RISKS
The Fund’s risks include, but are not limited to, the following:
Large Shareholder Transaction Risk — The Fund may experience adverse effects when certain large shareholders, such as other funds, participating insurance companies, accounts and Goldman Sachs affiliates, purchase or redeem large amounts of shares of the Fund. Such large shareholder redemptions may cause the Fund to sell portfolio securities at times when it would not otherwise do so, which may negatively impact the Fund’s NAV and liquidity. Similarly, large Fund share purchases may adversely affect the Fund’s performance to the extent that the Fund is delayed in investing new cash and is required to maintain a larger cash position than it ordinarily would. These transactions may also increase transaction costs. In addition, a large redemption could result in the Fund’s current expenses being allocated over a smaller asset base, leading to an increase in the Fund’s expense ratio.
Liquidity Risk — The Fund may make investments that are illiquid or that may become less liquid in response to market developments or adverse investor perceptions. Illiquid investments may be more difficult to value. Liquidity risk may also refer to the risk that a Fund will not be able to pay redemption proceeds within the allowable time period because of unusual market conditions, an unusually high volume of redemption requests, or other reasons. To meet redemption requests, a Fund may be forced to sell investments at an unfavorable time and/or under unfavorable conditions.
Market and Credit Risks — In the normal course of business, the Fund trades financial instruments and enters into financial transactions where risk of potential loss exists due to changes in the market (market risk). Additionally, the Fund may also be exposed to credit risk in the event that an issuer or guarantor fails to perform or that an institution or entity with which the Fund has unsettled or open transactions defaults.
24
GOLDMAN SACHS VARIABLE INSURANCE TRUST U.S. EQUITY INSIGHTS FUND
10. INDEMNIFICATIONS
Under the Trust’s organizational documents, its Trustees, officers, employees and agents are indemnified, to the extent permitted by the Act and state law, against certain liabilities that may arise out of performance of their duties to the Fund. Additionally, in the course of business, the Fund enters into contracts that contain a variety of indemnification clauses. The Fund’s maximum exposure under these arrangements is unknown, as this would involve future claims that may be made against the Fund that have not yet occurred. However, GSAM believes the risk of loss under these arrangements to be remote.
11. SUBSEQUENT EVENTS
Subsequent events after the Statement of Assets and Liabilities date have been evaluated through the date the financial statements were issued. GSAM has concluded that there is no impact requiring adjustment or disclosure in the financial statements.
25
GOLDMAN SACHS VARIABLE INSURANCE TRUST U.S. EQUITY INSIGHTS FUND
Notes to Financial Statements (continued)
December 31, 2014
12. SUMMARY OF SHARE TRANSACTIONS
Share activity is as follows:
| | | | | | | | | | | | | | | | |
| | | For the Fiscal Year Ended
December 31, 2014 | | | For the Fiscal Year Ended
December 31, 2013 | |
| | | Shares | | | Dollars | | | Shares | | | Dollars | |
| Institutional Shares | | | | | | | | | | | | | | | | |
| Shares sold | | | 437,552 | | | $ | 7,758,962 | | | | 288,409 | | | $ | 4,211,774 | |
| Reinvestment of distributions | | | 995,922 | | | | 17,637,784 | | | | 196,645 | | | | 3,187,605 | |
| Shares redeemed | | | (2,816,880 | ) | | | (49,300,263 | ) | | | (3,514,097 | ) | | | (50,743,649 | ) |
| | | | (1,383,406 | ) | | | (23,903,517 | ) | | | (3,029,043 | ) | | | (43,344,270 | ) |
| Service Shares | | | | | | | | | | | | | | | | |
| Shares sold | | | 867,890 | | | | 15,111,226 | | | | 579,473 | | | | 8,666,577 | |
| Reinvestment of distributions | | | 420,014 | | | | 7,455,244 | | | | 62,258 | | | | 1,011,074 | |
| Shares redeemed | | | (1,248,597 | ) | | | (21,803,905 | ) | | | (1,260,063 | ) | | | (18,307,271 | ) |
| | | | 39,307 | | | | 762,565 | | | | (618,332 | ) | | | (8,629,620 | ) |
| NET DECREASE | | | (1,344,099 | ) | | $ | (23,140,952 | ) | | | (3,647,375 | ) | | $ | (51,973,890 | ) |
26
Report of Independent Registered Public Accounting Firm
To the Board of Trustees and Shareholders of
Goldman Sachs Variable Insurance Trust — Goldman Sachs U.S. Equity Insights Fund (“formerly known as the Goldman Sachs Structured U.S. Equity Fund”):
In our opinion, the accompanying statement of assets and liabilities, including the schedule of investments, and the related statements of operations and of changes in net assets and the financial highlights present fairly, in all material respects, the financial position of Goldman Sachs U.S. Equity Insights Fund (the “Fund”) (“formerly known as the Goldman Sachs Structured U.S. Equity Fund”), a Fund of Goldman Sachs Variable Insurance Trust at December 31, 2014, the results of its operations, the changes in its net assets and the financial highlights for each of the periods indicated, in conformity with accounting principles generally accepted in the United States of America. These financial statements and financial highlights (hereafter referred to as “financial statements”) are the responsibility of the Fund’s management. Our responsibility is to express an opinion on these financial statements based on our audits. We conducted our audits of these financial statements in accordance with the standards of the Public Company Accounting Oversight Board (United States). Those standards require that we plan and perform the audit to obtain reasonable assurance about whether the financial statements are free of material misstatement. An audit includes examining, on a test basis, evidence supporting the amounts and disclosures in the financial statements, assessing the accounting principles used and significant estimates made by management, and evaluating the overall financial statement presentation. We believe that our audits, which included confirmation of securities at December 31, 2014 by correspondence with the custodian, brokers and transfer agent provide a reasonable basis for our opinion.
PricewaterhouseCoopers LLP
Boston, Massachusetts
February 19, 2015
27
GOLDMAN SACHS VARIABLE INSURANCE TRUST U.S. EQUITY INSIGHTS FUND
| | |
| Fund Expenses — Six Month Period Ended December 31, 2014 (Unaudited) | | |
As a shareholder of Institutional or Service Shares of the Fund, you incur ongoing costs, including management fees, distribution and service (12b-1) fees (with respect to Service Shares) and other Fund expenses. This example is intended to help you understand your ongoing costs (in dollars) of investing in the Institutional Shares and Service Shares of the Fund and to compare these costs with the ongoing costs of investing in other mutual funds.
The example is based on an investment of $1,000 invested at the beginning of the period and held for the entire period from July 1, 2014 through December 31, 2014.
Actual Expenses — The first line under each share class in the table below provides information about actual account values and actual expenses. You may use the information in this line, together with the amount you invested, to estimate the expenses that you paid over the period. Simply divide your account value by $1,000 (for example, an $8,600 account value divided by $1,000=8.6), then multiply the result by the number in the first line under the heading entitled “Expenses Paid” to estimate the expenses you paid on your account during this period.
Hypothetical Example for Comparison Purposes — The second line under each share class in the table below provides information about hypothetical account values and hypothetical expenses based on the Fund’s actual net expense ratio and an assumed rate of return of 5% per year before expenses, which is not the Fund’s actual return. The hypothetical account values and expenses may not be used to estimate the actual ending account balance or expenses you paid for the period. You may use this information to compare the ongoing costs of investing in the Fund and other funds. To do so, compare this 5% hypothetical example with the 5% hypothetical examples that appear in the shareholder reports of the other funds.
Please note that the expenses shown in the table are meant to highlight your ongoing costs only. As a shareholder of the Fund you do not incur any transaction costs, such as sales charges, redemption fees, or exchange fees, but shareholders of other funds may incur such costs. The second line of the table is useful in comparing ongoing costs only, and will not help you determine the relative total costs of owning different funds whose shareholders may incur transaction costs.
| | | | | | | | | | | | |
| Share Class | | Beginning Account Value 7/01/14 | | | Ending Account Value 12/31/14 | | | Expenses Paid for the 6 Months Ended 12/31/14* | |
| Institutional | | | | | | | | | | | | |
| Actual | | $ | 1,000 | | | $ | 1,075.10 | | | $ | 3.35 | |
| Hypothetical 5% return | | | 1,000 | | | | 1,021.98 | + | | | 3.26 | |
| Service | | | | | | | | | | | | |
| Actual | | | 1,000 | | | | 1,074.20 | | | | 4.44 | |
| Hypothetical 5% return | | | 1,000 | | | | 1,020.92 | + | | | 4.33 | |
| | * | Expenses are calculated using the Fund’s annualized net expense ratio for each class, which represents the ongoing expenses as a percentage of net assets for the six months ended December 31, 2014. Expenses are calculated by multiplying the annualized net expense ratio by the average account value for the period; then multiplying the result by the number of days in the most recent fiscal half year; and then dividing that result by the number of days in the fiscal year. The annualized net expense ratios for the period were 0.64% and 0.85% for Institutional and Service Shares, respectively. | |
| | + | Hypothetical expenses are based on the Fund’s actual annualized net expense ratios and an assumed rate of return of 5% per year before expenses. | |
28
GOLDMAN SACHS VARIABLE INSURANCE TRUST U.S. EQUITY INSIGHTS FUND
Trustees and Officers (Unaudited)
Independent Trustees
| | | | | | | | | | | | |
| | | | | |
Name,
Address and Age1 | | Position(s) Held
with the Trust | | Term of Office and
Length of
Time Served2 | | Principal Occupation(s) During Past 5 Years | | Number of
Portfolios in
Fund Complex
Overseen by
Trustee3 | | | Other Directorships Held by Trustee4 |
Ashok N. Bakhru Age: 72 | | Chairman of the Board of Trustees | | Since 1996 (Trustee since 1991) | | Mr. Bakhru is retired. He was formerly Director, Apollo Investment Corporation (a business development company) (2008-2013); President, ABN Associates (a management and financial consulting firm) (1994-1996 and 1998-2012); Trustee, Scholarship America (1998-2005); Trustee, Institute for Higher Education Policy (2003-2008); Director, Private Equity Investors — III and IV (1998-2007), and Equity-Linked Investors II (April 2002-2007). Chairman of the Board of Trustees — Goldman Sachs Fund Complex. | | | 128 | | | None |
John P. Coblentz, Jr. Age: 73 | | Trustee | | Since 2003 | | Mr. Coblentz is retired. Formerly, he was Partner, Deloitte & Touche LLP (1975-2003); Director, Emerging Markets Group, Ltd. (2004-2006); and Director, Elderhostel, Inc. (2006-2012). Trustee — Goldman Sachs Fund Complex. | | | 128 | | | None |
Diana M. Daniels Age: 65 | | Trustee | | Since 2007 | | Ms. Daniels is retired. Formerly, she was Vice President, General Counsel and Secretary, The Washington Post Company (1991-2006). Ms. Daniels serves as a Presidential Councillor of Cornell University (2013-Present); Member, Advisory Board, Psychology Without Borders (international humanitarian aid organization) (2007-Present), and former Member of the Legal Advisory Board, New York Stock Exchange (2003-2006) and of the Corporate Advisory Board, Standish Mellon Management Advisors (2006-2007). Trustee — Goldman Sachs Fund Complex. | | | 108 | | | None |
Joseph P. LoRusso Age: 57 | | Trustee | | Since 2010 | | Mr. LoRusso is retired. Formerly, he was President, Fidelity Investments Institutional Services Co. (“FIIS”) (2002-2008); Director, FIIS (2002-2008); Director, Fidelity Investments Institutional Operations Company (2003-2007); Executive Officer, Fidelity Distributors Corporation (2007-2008). Trustee — Goldman Sachs Fund Complex. | | | 108 | | | None |
Herbert J. Markley Age: 64 | | Trustee | | Since 2013 | | Mr. Markley is retired. Formerly, he was Executive Vice President, Deere & Company (an agricultural and construction equipment manufacturer) (2007-2009), and President, Agricultural Division, Deere & Company (2001-2007). Trustee — Goldman Sachs Fund Complex. | | | 108 | | | None |
Jessica Palmer Age: 65 | | Trustee | | Since 2007 | | Ms. Palmer is retired. She is Director, Emerson Center for the Arts and Culture (2011-Present); and was formerly a Consultant, Citigroup Human Resources Department (2007-2008); Managing Director, Citigroup Corporate and Investment Banking (previously, Salomon Smith Barney/Salomon Brothers) (1984-2006). Ms. Palmer was a Member of the Board of Trustees of Indian Mountain School (private elementary and secondary school) (2004-2009). Trustee — Goldman Sachs Fund Complex. | | | 108 | | | None |
Richard P. Strubel Age: 75 | | Trustee | | Since 1987 | | Mr. Strubel is retired. Formerly, he was Director, Cardean Learning Group (provider of educational services via the internet) (2003-2008); and Director, Gildan Activewear Inc. (a clothing marketing and manufacturing company) (2000-2014). He serves as Trustee, Emeritus, The University of Chicago (1987-Present). Trustee — Goldman Sachs Fund Complex. | | | 128 | | | The Northern Trust Mutual Fund Complex (56 Portfolios) (Chairman of the Board of Trustees) |
| | | | | | | | | | | | |
29
GOLDMAN SACHS VARIABLE INSURANCE TRUST U.S. EQUITY INSIGHTS FUND
Trustees and Officers (Unaudited) (continued)
Independent Trustees (continued)
| | | | | | | | | | | | |
| | | | | |
Name,
Address and Age1 | | Position(s) Held
with the Trust | | Term of Office and
Length of
Time Served2 | | Principal Occupation(s) During Past 5 Years | | Number of
Portfolios in
Fund Complex
Overseen by
Trustee3 | | | Other Directorships Held by Trustee4 |
Roy W. Templin Age: 54 | | Trustee | | Since 2013 | | Mr. Templin is retired. He is Chairman of the Board of Directors, Con-Way Incorporated (2012-Present); and was formerly Executive Vice President and Chief Financial Officer, Whirlpool Corporation (an appliance manufacturer and marketer) (2004-2012). Trustee — Goldman Sachs Fund Complex. | | | 108 | | | Con-Way Incorporated (a transportation, supply-chain management and logistics services company) |
| | | | | | | | | | | | |
Interested Trustees*
| | | | | | | | | | | | |
| | | | | |
Name,
Address and Age1 | | Position(s) Held
with the Trust | | Term of Office and
Length of
Time Served2 | | Principal Occupation(s) During Past 5 Years | | Number of
Portfolios in
Fund Complex
Overseen by
Trustee3 | | | Other Directorships Held by Trustee4 |
James A. McNamara Age: 52 | | President and Trustee | | Since 2007 | | Managing Director, Goldman Sachs (December 1998-Present); Director of Institutional Fund Sales, GSAM (April 1998-December 2000); and Senior Vice President and Manager, Dreyfus Institutional Service Corporation (January 1993- April 1998). President — Goldman Sachs Fund Complex (November 2007-Present); Senior Vice President — Goldman Sachs Fund Complex (May 2007-November 2007); and Vice President — Goldman Sachs Fund Complex (2001-2007). Trustee — Goldman Sachs Fund Complex (November 2007-Present and December 2002-May 2004). | | | 127 | | | None |
Alan A. Shuch Age: 65 | | Trustee | | Since 1990 | | Advisory Director — GSAM (May 1999-Present); Consultant to GSAM (December 1994-May 1999); and Limited Partner, Goldman Sachs (December 1994-May 1999). Trustee — Goldman Sachs Fund Complex. | | | 108 | | | None |
| | | | | | | | | | | | |
| * | These persons are considered to be “Interested Trustees” because they hold positions with Goldman Sachs and own securities issued by The Goldman Sachs Group, Inc. Each Interested Trustee holds comparable positions with certain other companies of which Goldman Sachs, GSAM or an affiliate thereof is the investment adviser, administrator and/or distributor. |
| 1 | Each Trustee may be contacted by writing to the Trustee, c/o Goldman Sachs, 200 West Street, New York, New York, 10282, Attn: Caroline Kraus. Information is provided as of December 31, 2014. |
| 2 | Each Trustee holds office for an indefinite term until the earliest of: (a) the election of his or her successor; (b) the date the Trustee resigns or is removed by the Board of Trustees or shareholders, in accordance with the Trust’s Declaration of Trust; (c) December 31st of the year in which the Trustee turns 74 years of age, subject to waiver by a majority of the Trustees (in accordance with the current resolutions of the Board of Trustees, which may be changed by the Trustees without shareholder vote); or (d) the termination of the Trust. By resolution of the Board of Trustees determining that an extension of service would be beneficial to the Trust, the retirement age has been extended with respect to Richard P. Strubel. |
| 3 | The Goldman Sachs Fund Complex consists of the Trust and Goldman Sachs Trust (“GST”). As of December 31, 2014, the Trust consisted of 14 portfolios and GST consisted of 94 portfolios (88 of which offered shares to the public). The Goldman Sachs Fund Complex also includes, with respect to Messrs. Bakhru, Coblentz and Strubel, Goldman Sachs Trust II (“GSTII”), Goldman Sachs BDC, Inc. (“GSBDC”), Goldman Sachs MLP Income Opportunities Fund (“GSMLP”), Goldman Sachs MLP and Energy Renaissance Fund (“GSMER”) and Goldman Sachs ETF Trust (“GSETF”), and with respect to Mr. McNamara, GSTII, GSMLP, GSMER and GSETF. GSTII consisted of 6 portfolios (one of which offered shares to the public). GSBDC, GSMLP and GSMER each consisted of one portfolio. GSETF consisted of 11 portfolios (none of which offered shares to the public). As of December 31, 2014, GSBDC had not offered shares to the public. |
| 4 | This column includes only directorships of companies required to report to the Securities and Exchange Commission under the Securities Exchange Act of 1934 (i.e., “public companies”) or other investment companies registered under the Act. |
Additional information about the Trustees is available in the Fund’s Statement of Additional Information, which can be obtained from Goldman Sachs free of charge by calling this toll-free number (in the United States of America): 1-800-292-4726.
30
GOLDMAN SACHS VARIABLE INSURANCE TRUST U.S. EQUITY INSIGHTS FUND
Trustees and Officers (Unaudited) (continued)
Officers of the Trust*
| | | | | | |
| | | |
Name, Address and Age1 | | Position(s) Held With the Trust | | Term of
Office and
Length of
Time Served2 | | Principal Occupation(s) During Past 5 Years |
James A. McNamara
200 West Street New York, NY 10282 Age: 52 | | President and Trustee | | Since 2007 | | Managing Director, Goldman Sachs (December 1998-Present); Director of Institutional Fund Sales, GSAM (April 1998-December 2000); and Senior Vice President and Manager, Dreyfus Institutional Service Corporation (January 1993-April 1998). President — Goldman Sachs Fund Complex (November 2007-Present); Senior Vice President — Goldman Sachs Fund Complex (May 2007-November 2007); and Vice President — Goldman Sachs Fund Complex (2001-2007). Trustee — Goldman Sachs Fund Complex (November 2007-Present and December 2002-May 2004). |
Caroline L. Kraus
200 West Street New York, NY 10282 Age: 37 | | Secretary | | Since 2012 | | Vice President, Goldman Sachs (August 2006-Present); Associate General Counsel, Goldman Sachs (2012-Present); Assistant General Counsel, Goldman Sachs (August 2006-December 2011) and Associate, Weil, Gotshal & Manges, LLP (2002-2006). Secretary — Goldman Sachs Fund Complex (August 2012-Present) and Assistant Secretary — Goldman Sachs Fund Complex (June 2012-August 2012). |
Scott M. McHugh
200 West Street New York, NY 10282 Age: 43 | | Principal Financial
Officer, Senior Vice
President and
Treasurer | | Since 2009
(Principal
Financial
Officer since
2013) | | Vice President, Goldman Sachs (February 2007-Present); Assistant Treasurer of certain mutual funds administered by DWS Scudder (2005-2007); and Director (2005-2007), Vice President (2000-2005) and Assistant Vice President (1998-2000), Deutsche Asset Management or its predecessor (1998-2007). Principal Financial Officer — Goldman Sachs Fund Complex (November 2013-Present); Treasurer — Goldman Sachs Fund Complex (October 2009-Present); Senior Vice President — Goldman Sachs Fund Complex (November 2009-Present); and Assistant Treasurer — Goldman Sachs Fund Complex (May 2007-October 2009). |
| | | | | | |
| * | Represents a partial list of officers of the Trust. Additional information about all the officers is available in the Fund’s Statement of Additional Information, which can be obtained from Goldman Sachs free of charge by calling this toll-free number (in the United States): 1-800-292-4726. |
| 1 | Information is provided as of December 31, 2014. |
| 2 | Officers hold office at the pleasure of the Board of Trustees or until their successors are duly elected and qualified. Each officer holds comparable positions with certain other companies of which Goldman Sachs, GSAM or an affiliate thereof is the investment adviser, administrator and/or distributor. |
31
GOLDMAN SACHS VARIABLE INSURANCE TRUST U.S. EQUITY INSIGHTS FUND
Goldman Sachs Variable Insurance Trust—Tax Information (Unaudited)
For the year ended December 31, 2014, 55.09% of the dividends paid from net investment company taxable income by the U.S. Equity Insights Fund qualify for the dividends received deduction available to corporations.
Pursuant to Section 852 of the Internal Revenue Code, the U.S. Equity Insights Fund designates $17,163,675, or, if different, the maximum amount allowable, as capital gain dividends paid during the year ended December 31, 2014.
32
| | |
| TRUSTEES | | OFFICERS |
| Ashok N. Bakhru, Chairman | | James A. McNamara, President |
| John P. Coblentz, Jr. | | Scott M. McHugh, Principal Financial Officer
|
| Diana M. Daniels | | and Treasurer |
| Joseph P. LoRusso | | Caroline L. Kraus, Secretary |
| Herbert J. Markley | | |
| James A. McNamara | | |
| Jessica Palmer | | |
| Alan A. Shuch | | |
| Richard P. Strubel | | |
| Roy W. Templin | | |
GOLDMAN, SACHS & CO.
Distributor and Transfer Agent
GOLDMAN SACHS ASSET MANAGEMENT, L.P.
Investment Adviser
200 West Street, New York
New York 10282
Visit our web site at www.GSAMFUNDS.com to obtain the most recent month-end returns.
The reports concerning the Fund included in this shareholder report may contain certain forward-looking statements about the factors that may affect the performance of the Fund in the future. These statements are based on Fund management’s predictions and expectations concerning certain future events and their expected impact on the Fund, such as performance of the economy as a whole and of specific industry sectors, changes in the levels of interest rates, the impact of developing world events, and other factors that may influence the future performance of the Fund. Management believes these forward-looking statements to be reasonable, although they are inherently uncertain and difficult to predict. Actual events may cause adjustments in portfolio management strategies from those currently expected to be employed.
A description of the policies and procedures that the Fund uses to determine how to vote proxies relating to portfolio securities and information regarding how the Fund voted proxies relating to portfolio securities for the 12-month period ended June 30 is available (i) without charge, upon request by calling 1-800-621-2550; and (ii) on the Securities and Exchange Commission (“SEC”) web site at http://www.sec.gov.
The Fund files its complete schedule of portfolio holdings with the SEC for the first and third quarters of each fiscal year on Form N-Q. The Fund’s Form N-Qs are available on the SEC’s web site at http://www.sec.gov within 60 days after the Fund’s first and third fiscal quarters. The Fund’s Form N-Qs may be reviewed and copied at the SEC’s Public Reference Room in Washington, D.C. and information on the operation of the Public Reference Room may also be obtained by calling 1-800-SEC-0330. Form N-Qs may be obtained upon request and without charge by calling 1-800-621-2550.
The website links provided are for your convenience only and are not an endorsement or recommendation by GSAM of any of these websites or the products or services offered. GSAM is not responsible for the accuracy and validity of the content of these websites.
Fund holdings and allocations shown are as of December 31, 2014 and may not be representative of future investments. Fund holdings should not be relied on in making investment decisions and should not be construed as research or investment advice regarding particular securities. Current and future holdings are subject to risk.
References to indices, benchmarks or other measures of relative market performance over a specified period of time are provided for your information only and do not imply that the portfolio will achieve similar results. The index composition may not reflect the manner in which a portfolio is constructed. While an adviser seeks to design a portfolio which reflects appropriate risk and return features, portfolio characteristics may deviate from those of the benchmark.
The Global Industry Classification Standard (“GICS”) was developed by and is the exclusive property and a service mark of Morgan Stanley Capital International Inc. (“MSCI”) and Standard & Poor’s, a division of The McGraw-Hill Companies, Inc. (“S&P”) and is licensed for use by Goldman Sachs. Neither MSCI, S&P nor any other party involved in making or compiling the GICS or any GICS classifications makes any express or implied warranties or representations with respect to such standard or classification (or the results to be obtained by the use thereof), and all such parties hereby expressly disclaim all warranties of originality, accuracy, completeness, merchantability or fitness for a particular purpose with respect to any of such standard or classification. Without limiting any of the foregoing, in no event shall MSCI, S&P, any of their affiliates or any third party involved in making or compiling the GICS or any GICS classifications have any liability for any direct, indirect, special, punitive, consequential or any other damages (including lost profits) even if notified of the possibility of such damages.
The portfolio risk management process includes an effort to monitor and manage risk, but does not imply low risk.
Shares of the Goldman Sachs VIT Funds are offered to separate accounts of participating life insurance companies for the purpose of funding variable annuity contracts and variable life insurance policies. Shares of the Fund are not offered directly to the general public. The variable annuity contracts and variable life insurance policies are described in the separate prospectuses issued by participating insurance companies. You should refer to those prospectuses for information about surrender charges, mortality and expense risk fees and other charges that may be assessed by participating insurance companies under the variable annuity contracts or variable life insurance policies. Such fees or charges, if any, may affect the return you may realize with respect to your investments. Ask your representative for more complete information. Please consider a fund’s objectives, risks and charges and expenses, and read the prospectus carefully before investing. The prospectus contains this and other information about the Fund.
This material is not authorized for distribution to prospective investors unless preceded or accompanied by a current Prospectus or summary prospectus, if applicable. Investors should consider a Fund’s objective, risks, and charges and expenses, and read the summary prospectus, if available, and/or the Prospectus carefully before investing or sending money. The summary prospectus, if available, and the Prospectus contain this and other information about a Fund and may be obtained from your Authorized Institution or from Goldman, Sachs & Co. by calling 1-800-621-2550.
This report is prepared for the general information of contract owners and is not an offer of shares of the Goldman Sachs Variable Insurance Trust: Goldman Sachs U.S. Equity Insights Fund.
© 2015 Goldman Sachs. All rights reserved.
VITUSAR-15/153900.MF.MED.TMPL/2/2015
| | (a) | As of the end of the period covered by this report, the registrant has adopted a code of ethics that applies to the registrant’s principal executive officer, principal financial officer, principal accounting officer or controller, or persons performing similar functions, regardless of whether these individuals are employed by the registrant or a third party (the “Code of Ethics”). |
| | (b) | During the period covered by this report, no amendments were made to the provisions of the Code of Ethics. |
| | (c) | During the period covered by this report, the registrant did not grant any waivers, including an implicit waiver, from any provision of the Code of Ethics. |
| | (d) | A copy of the Code of Ethics is available as provided in Item 12(a)(1) of this report. |
| ITEM 3. | AUDIT COMMITTEE FINANCIAL EXPERT. |
| | The registrant’s board of trustees has determined that the registrant has at least one “audit committee financial expert” (as defined in Item 3 of Form N-CSR) serving on its audit committee. John P. Coblentz, Jr. is the “audit committee financial expert” and is “independent” (as each term is defined in Item 3 of Form N-CSR). |
| ITEM 4. | PRINCIPAL ACCOUNTANT FEES AND SERVICES. |
Item 4 — Principal Accountant Fees and Services for the Goldman Sachs Variable Insurance Trust (“GSVIT”):
Table 1 – Items 4(a) - 4(d)
| | | | | | | | | | |
| | | 2014 | | | 2013 | | | Description of Services Rendered |
Audit Fees: | | | | | | | | | | |
• PricewaterhouseCoopers (“PwC”) | | $ | 397,853 | | | $ | 27,480 | | | Financial statement audits. |
Audit-Related Fees | | | | | | | | | | |
PwC | | $ | — | | | $ | 10,000 | | | Other attest services. |
Tax Fees | | | | | | | | | | |
PwC | | $ | 99,816 | | | $ | 93,870 | | | Tax compliance services provided in connection with the preparation and review of the Registrant’s tax returns. |
Items 4(b)(c) & (d) Table 2. Non-Audit Services to the GSVIT’s * that were pre-approved by the GSVIT’s Audit Committee pursuant to Rule 2-01(c)(7)(ii) of Regulation S-X
| | | | | | | | | | |
| | | 2014 | | | 2013 | | | Description of Services Rendered |
Audit-Related Fees | | | | | | | | | | |
PwC | | $ | 1,486,420 | | | $ | 1,486,420 | | | Internal control review performed in accordance with Statement on Standards for Attestation Engagements No. 16. These fees are borne by the Funds’ adviser. |
| * | These include the advisor (excluding sub-advisors) and any entity controlling, controlled by or under common control with the advisor that provides ongoing services to the registrant (hereinafter referred to as “service affiliates”). |
Item 4(e)(1) — Audit Committee Pre Approval Policies and Procedures
Pre-Approval of Audit and Non-Audit Services Provided to the Funds of the Goldman Sachs Variable Insurance Trust. The Audit and Non-Audit Services Pre-Approval Policy (the “Policy”) adopted by the Audit Committee of GSVIT sets forth the procedures and the conditions pursuant to which services performed by an independent auditor for GSVIT may be pre-approved. Services may be pre-approved specifically by the Audit Committee as a whole or, in certain circumstances, by the Audit Committee Chairman or the person designated as the Audit Committee Financial Expert. In addition, subject to specified cost limitations, certain services may be pre-approved under the provisions of the Policy. The Policy provides that the Audit Committee will consider whether the services provided by an independent auditor are consistent with the Securities and Exchange Commission’s rules on auditor independence. The Policy provides for periodic review and pre-approval by the Audit Committee of the services that may be provided by the independent auditor.
De Minimis Waiver. The pre-approval requirements of the Policy may be waived with respect to the provision of non-audit services that are permissible for an independent auditor to perform, provided (1) the aggregate amount of all such services provided constitutes no more than five percent of the total amount of revenues subject to pre-approval that was paid to the independent auditors during the fiscal year in which the services are provided; (2) such services were not recognized by GSVIT at the time of the engagement to be non-audit services; and (3) such services are promptly brought to the attention of the Audit Committee and approved prior to the completion of the audit by the Audit Committee or by one or more members of the Audit Committee to whom authority to grant such approvals has been delegated by the Audit Committee, pursuant to the pre-approval provisions of the Policy.
Pre-Approval of Non-Audit Services Provided to GSVIT’s Investment Advisers. The Policy provides that, in addition to requiring pre-approval of audit and non-audit services provided to GSVIT, the Audit Committee will pre-approve those non-audit services provided to GSVIT’s investment advisers (and entities controlling, controlled by or under common control with the investment advisers that provide ongoing services to GSVIT) where the engagement relates directly to the operations or financial reporting of GSVIT.
Item 4(e)(2) — 0% of the audit-related fees, tax fees and other fees listed in Table 1 were approved by GSVIT’s Audit Committee pursuant to the “de minimis” exception of Rule 2-01(c)(7)(i)(C) of Regulation S-X. In addition, 0% of the non-audit services to the GSVIT’s service affiliates listed in Table 2 were approved by GSVIT’s Audit Committee pursuant to the “de minimis” exception of Rule 2-01(c)(7)(i)(C) of Regulation S-X.
Item 4(f) — Not applicable.
Items 4(g) Aggregate Non-Audit Fees Disclosure
The aggregate non-audit fees billed to GSVIT for the twelve months ended December 31, 2014 and December 31, 2013 by PwC were approximately $99,816 and $103,840, respectively.
The aggregate non-audit fees billed to GSVIT’s adviser and service affiliates for non-audit services for the twelve months ended December 31, 2013 and December 31, 2012 by PwC were approximately $9.8 million and $10.0 million, respectively. The figures for these entities are not yet available for the twelve months ended December 31, 2014.
Items 4(h) — GSVIT’s Audit Committee has considered whether the provision of non-audit services to GSVIT’s investment advisor and service affiliates that did not require pre-approval pursuant to paragraph (c)(7)(ii) of Rule 2-01 of Regulation S-X is compatible with maintaining the auditor’s independence.
| ITEM 5. | AUDIT COMMITTEE OF LISTED REGISTRANTS. |
Not applicable.
| ITEM 6. | SCHEDULE OF INVESTMENTS |
Schedule of Investments is included as part of the Reports to Shareholders filed under Item 1.
| ITEM 7. | DISCLOSURE OF PROXY VOTING POLICIES AND PROCEDURES FOR CLOSED-END MANAGEMENT INVESTMENT COMPANIES. |
Not applicable.
| ITEM 8. | PORTFOLIO MANAGERS OF CLOSED-END MANAGEMENT INVESTMENT COMPANIES |
Not applicable.
| ITEM 9. | PURCHASES OF EQUITY SECURITIES BY CLOSED-END MANAGEMENT INVESTMENT COMPANY AND AFFILIATED PURCHASERS |
Not applicable.
| ITEM 10. | SUBMISSION OF MATTERS TO A VOTE OF SECURITY HOLDERS. |
There have been no material changes to the procedures by which shareholders may recommend nominees to the registrant’s board of trustees.
| ITEM 11. | CONTROLS AND PROCEDURES. |
| | (a) | The registrant’s principal executive and principal financial officers or persons performing similar functions have concluded that the registrant’s disclosure controls and procedures (as defined in Rule 30a-3(c) under the Investment Company Act of 1940, as amended (the “1940 Act”)) are effective as of a date within 90 days of the filing date of this report that includes the disclosure required by this paragraph, based on the evaluation of these controls and procedures required by Rule 30a-3(b) under the 1940 Act and 15d-15(b) under the Securities Exchange Act of 1934, as amended. |
| | (b) | There were no changes in the registrant’s internal control over financial reporting (as defined in Rule 30a-3(d) under the 1940 Act) that occurred during the registrant’s second fiscal quarter of the period covered by this report that has materially affected, or is reasonably likely to materially affect the registrant’s internal control over financial reporting. |
| | | | |
| (a)(1) | | | | Goldman Sachs Variable Insurance Trust’s Code of Ethics for Principal Executive and Senior Financial Officers filed herewith |
| | |
| (a)(2) | | Exhibit 99.CERT | | Certifications pursuant to Section 302 of the Sarbanes-Oxley Act of 2002 filed herewith |
| | |
| | Exhibit 99.906CERT | | Certifications pursuant to Section 906 of the Sarbanes-Oxley Act of 2002 filed herewith |
SIGNATURES
Pursuant to the requirements of the Securities Exchange Act of 1934 and the Investment Company Act of 1940, the registrant has duly caused this report to be signed on its behalf by the undersigned, thereunto duly authorized.
Goldman Sachs Variable Insurance Trust
| | |
/s/ James A. McNamara |
By: James A. McNamara |
Chief Executive Officer of |
Goldman Sachs Variable Insurance Trust |
|
Date: August 28, 2015 |
Pursuant to the requirements of the Securities Exchange Act of 1934 and the Investment Company Act of 1940, the report has been signed below by the following persons on behalf of the registrant and in the capacities and on the dates indicated.
| | |
/s/ James A. McNamara |
By: James A. McNamara |
Chief Executive Officer of |
Goldman Sachs Variable Insurance Trust |
|
Date: August 28, 2015 |
|
/s/ Scott McHugh |
By: Scott McHugh |
Principal Financial Officer of |
Goldman Sachs Variable Insurance Trust |
|
Date: August 28, 2015 |