UNITED STATES
SECURITIES AND EXCHANGE COMMISSION
Washington, D.C. 20549
FORM N-CSR
CERTIFIED SHAREHOLDER REPORT OF REGISTERED
MANAGEMENT INVESTMENT COMPANIES
Investment Company Act file number 811-08361
Goldman Sachs Variable Insurance Trust
(Exact name of registrant as specified in charter)
71 South Wacker Drive, Chicago, Illinois 60606-6303
(Address of principal executive offices) (Zip code)
Caroline Kraus
Goldman Sachs & Co. LLC
200 West Street
New York, NY 10282
Copies to:
Geoffrey R.T. Kenyon, Esq.
Dechert LLP
One International Place, 40th Floor
100 Oliver Street
Boston, MA 02110-2605
(Name and address of agents for service)
Registrant’s telephone number, including area code: (312) 655-4400
Date of fiscal year end: December 31
Date of reporting period: December 31, 2017
| ITEM 1. | REPORTS TO STOCKHOLDERS. |
| | The Annual Reports to Shareholders are filed herewith. |
Goldman
Sachs Variable Insurance Trust
Goldman Sachs
Global Trends
Allocation Fund
Annual Report
December 31, 2017

GOLDMAN SACHS VARIABLE INSURANCE TRUST GLOBAL TRENDS ALLOCATION FUND
INVESTMENT OBJECTIVE
The Fund seeks total return while seeking to provide volatility management.
Portfolio Management Discussion and Analysis
Below, the Goldman Sachs Quantitative Investment Strategies Team discusses the Goldman Sachs Variable Insurance Trust — Goldman Sachs Global Trends Allocation Fund’s (the “Fund”) performance and positioning for the 12-month period ended December 31, 2017 (the “Reporting Period”).
How did the Fund perform during the Reporting Period?
During the Reporting Period, the Fund’s Institutional and Service Shares generated average annual total returns of 13.36% and 13.11%, respectively. These returns compare to the 14.90% average annual total return of the Fund’s benchmark, the Global Trends Allocation Composite Index (the “Index”), during the same time period. The components of the Fund’s benchmark, the MSCI World Index and the Bloomberg Barclays U.S. Aggregate Bond Index, generated average annual total returns of 23.07% and 3.54%, respectively, during the same time period.
Importantly, during the Reporting Period, the Fund’s overall annualized volatility (which is measured versus the S&P 500® Index) was 3.00%, less than the S&P 500® Index’s annualized volatility of 3.77% during the same time period.
What economic and market factors most influenced the Fund during the Reporting Period?
During the Reporting Period, global equities recorded strong gains, while the broad fixed income market generated modestly positive returns.
When the Reporting Period started in the first quarter of 2017, global equities advanced, driven by the possibility of deregulation, tax reform and infrastructure spending in the U.S. and also in response to stronger economic data. The Federal Reserve (the “Fed”) raised U.S. interest rates in March 2017, but a seemingly cautious stance on the future path of monetary tightening from Fed Chair Janet Yellen and the presence of a dissenter on the Fed committee led to a dovish market reaction and Japanese yen appreciation, despite the Bank of Japan maintaining its policy rate. (Dovish tends to suggest lower interest rates; opposite of hawkish.) Meanwhile, the European Central Bank (“ECB”) kept its monetary policy unchanged at its March 2017 meeting but revised its economic growth and inflation forecasts upwards. Equity markets interpreted the positive economic assessment as hawkish, sparking concerns around the sequencing of the ECB’s policy steps — namely, whether interest rates might rise before quantitative easing ends. During the second quarter of 2017, global equities were buoyed by receding political risk. However, market optimism for pro-growth U.S. fiscal policy was dampened by political developments in Washington, D.C. Strong first quarter 2017 corporate earnings results, with double-digit growth across virtually all major developed market regions, were supportive for global equity markets. In June 2017, the Fed raised U.S. interest rates. During the same month, European markets reacted hawkishly to the ECB President’s optimistic outlook for recovering inflation and cautious reference to tapering of asset purchases. Japanese equities saw a temporary pullback in June 2017, as market sentiment deteriorated and as the Japanese yen strengthened immediately after the Fed interest rate hike, but quickly rebounded. During the third quarter of 2017, U.S. economic activity and labor market data showed rather consistent strength, while inflation reversed five consecutive months of downside surprises. Details about the U.S. tax reform plan extended bullish, or optimistic, market moves and further boosted the U.S. dollar. Meanwhile, the ECB kept its monetary policy unchanged at its September 2017 meeting and revised downward its forecast for headline inflation for the second time in the calendar year. ECB President Draghi maintained a dovish stance and deferred discussion around tapered asset purchases to the ECB’s October 2017 meeting. Risk sentiment amid North Korean missile launches and escalating geopolitical tensions between U.S. and North Korea drove the Japanese yen higher and its equities lower. Japanese equities subsequently rallied in September 2017 on rising U.S. bond yields, a weakening yen and reports that the Prime Minister had dissolved the Japanese Lower House and called a general election to be held in October 2017. Global equities continued to advance in October 2017, supported by encouraging tax reform progress and ongoing strength in both U.S. and global economic activity data. As expected, the ECB kept its interest rates unchanged but announced its plan to reduce monthly asset purchases for nine months from January 2018. In the U.S., the Fed started trimming the size of its balance sheet. In Japan, the ruling coalition won a significant majority in the Japanese election, which reassured markets and signaled a continuation of current macro policies. Japanese equities rallied on election anticipation and following the landslide victory and were further buoyed by strong corporate earnings results and rather stable overseas markets. In December 2017, the Fed delivered the third interest rate hike of the calendar year, as had been widely
1
GOLDMAN SACHS VARIABLE INSURANCE TRUST GLOBAL TRENDS ALLOCATION FUND
expected, and maintained its projections for three additional interest rate hikes in 2018. Outside the U.S., equity market returns were relatively muted during the month, particularly amongst larger companies. The U.K., however, performed better than many other developed markets. Although the U.K. Prime Minister suffered a defeat in the House of Commons over the European Union Withdrawal Bill in December, the U.K. was judged by the European Union to have made sufficient progress on key issues to allow the next phase of Brexit negotiations — including discussions on trade — to begin. (Brexit refers to the U.K.’s efforts to exit the European Union.) Elsewhere, the ECB upgraded its growth forecasts for the Eurozone’s economy, though optimism was tempered by lackluster inflation. The German and French equity markets declined for the month. The Bank of Japan’s (“BoJ”) quarterly Tankan survey of business sentiment showed that confidence improved, boosted by strengthening export activity, and the Japanese equity market eked out a modest gain for December 2017.
In terms of fixed income, when the Reporting Period started, government bond sectors sold off and spread (or non-government bond) sectors generally posted gains. Investors focused on the prospect of pro-growth policies from the U.S. Administration, which helped boost business and consumer sentiment to near record levels, and also on the positive impact of earlier fiscal stimulus in China. Global purchasing managers’ indices (“PMI”) pointed to solid expansion across the largest global economies, the U.S. in particular. In Europe, economic data strengthened and political risk remained contained, as markets weathered the official start of Brexit negotiations. Monetary policy presented few surprises during the first calendar quarter, as the ECB, BoJ and Bank of England (“BoE”) kept their respective monetary policies unchanged. In March 2017, the ECB raised its economic growth and inflation forecast. The same month, Fed policymakers hiked interest rates. The U.S. dollar weakened versus many global currencies during the first calendar quarter. During the second quarter of 2017, spread sectors generally recorded positive returns, though with mixed results relative to government bond sectors. Political developments led to temporary bouts of volatility early in the quarter. However, political risks receded in May 2017 on the centrist candidate’s victory in the French presidential election, which was supportive of French and European peripheral bonds broadly. On the economic front, U.S. core inflation weakened for the third consecutive month in May 2017, casting uncertainty over the pace of Fed monetary tightening. Nonetheless, comments included in minutes from the Fed’s May and June 2017 policy meetings suggested an announcement about how and when the Fed would begin reducing the size of its balance sheet would be made sooner than the markets had previously anticipated. In Europe, economic data continued to surprise to the upside. At its June 2017 policy meeting, the ECB provided an optimistic assessment of the risks to economic growth, but revised downward its medium-term inflation forecasts. The ECB, BoJ and BoE left their respective monetary policies unchanged during the second calendar quarter, while the Fed raised interest rates for the second time in 2017 at its June policy meeting. As the quarter came to an end, a string of comments from global central bankers triggered a hawkish market reaction. Global interest rates rose as the market anticipated a faster than expected pace of monetary policy tightening by the BoE, ECB and Bank of Canada (“BoC”). During the second quarter of 2017, the U.S. dollar weakened versus many global currencies. In the third quarter of 2017, spread sectors broadly advanced, outperforming government bond sectors. The Fed kept its monetary policy unchanged but unveiled its plans for balance sheet normalization. (Balance sheet normalization refers to the steps the Fed takes to reverse quantitative easing and remove the substantial monetary accommodation it has provided to the economy since the financial crisis began in 2007.) This prompted a hawkish market reaction, with the U.S. dollar appreciating and yields on U.S. government bonds rising. However, the U.S. Treasury yield curve only steepened modestly due to geopolitical uncertainty and mixed U.S. economic data, including weak inflation readings. The central banks of other developed countries also set the stage for less accommodative monetary policy. The BoE noted “a majority” of its policymakers were in favor of tightening policy “over the coming months,” while the BoC surprised the markets with two consecutive rate hikes. The market’s expectations for a BoE rate hike in November 2017, along with a constructive tone for Brexit negotiations, drove the British pound higher versus the U.S. dollar. The U.S. dollar also continued to weaken relative to many other global currencies during the third calendar quarter. During the fourth calendar quarter, spread sector performance was broadly positive, supported by ongoing strength in the global macro environment and contained market, macro and political volatility. Passage of U.S. tax legislation and solid corporate earnings were particularly supportive of U.S. corporate credit. In October 2017, the ECB announced it would reduce its monthly asset purchases from €60 billion to €30 billion for nine months beginning in January 2018, mainly by purchasing fewer sovereign government bonds. The ECB also said its policy rates would remain low for “an extended period of time, and well past the horizon of the net asset purchases.” During the same month, the BoE reversed an emergency interest rate cut, made in August 2016 following the Brexit referendum, and signaled that future monetary policy tightening would be limited, gradual and dependent on the economic reaction to the U.K.’s eventual departure from the European Union. In December 2017, the Fed delivered its third short-term interest rate hike of 2017. The Fed’s dot plot, which shows rate projections of the members of the Fed’s Open Market Committee, indicated that three rate increases were on tap for 2018 and potentially two in 2019. The U.S. dollar weakened further versus many global currencies during the fourth quarter of 2017.
2
GOLDMAN SACHS VARIABLE INSURANCE TRUST GLOBAL TRENDS ALLOCATION FUND
What key factors were responsible for the Fund’s performance during the Reporting Period?
The Fund primarily seeks to achieve its investment objective by investing in a global portfolio of equity and fixed income asset classes. Under normal market conditions, the Fund expects to invest at least 40% of its assets in equity investments and at least 20% of its assets in fixed income investments. The percentage of the Fund’s portfolio exposed to any asset class or geographic region will vary from time to time as the weightings of the Fund change, and the Fund may not be invested in each asset class at all times.
As part of the Fund’s investment strategy, the Investment Adviser seeks to manage volatility and limit losses by allocating the Fund’s assets away from risky investments in distressed or volatile market environments. Volatility is a statistical measurement of the magnitude of up and down fluctuations in the value of a financial instrument or index. In distressed or volatile market environments, the Fund may also hold significant amounts of U.S. Treasury, short-term or other fixed income investments, including money market funds and repurchase agreements or cash, and at times may invest up to 100% of its assets in such investments.
During the Reporting Period, the Fund continued dynamically allocating across global asset classes, using a momentum-based methodology, as it sought total return while also seeking to provide volatility management. Momentum investing seeks growth of capital by gaining exposure to asset classes that have exhibited trends in price performance over selected time periods. In managing the Fund, we use a methodology that evaluates historical three-, six- and nine-month returns, volatilities and correlations across a range of nine global asset classes. Represented by indices, these asset classes include, within the equities category, U.S. large-cap and small-cap, European, Asian, emerging markets and U.K. stocks. Within the fixed income category, the Fund may allocate assets to the U.S., Europe and Japan. The analysis of these asset classes drives the aggregate allocations of the Fund over time. We believe market price momentum — either positive or negative — has significant predictive power.
During the Reporting Period, the Fund was hurt by its allocation to U.S. Treasury securities, although this was offset somewhat by its allocation to German government bonds, which contributed positively. The Fund benefited from its allocation to global equities, including U.S. large-cap stocks, emerging markets stocks and Japanese equities. The Fund’s allocations to U.K. and European equities also contributed positively, albeit to a lesser extent.
What was the Fund’s volatility during the Reporting Period?
As part of our investment approach, we seek to mitigate the Fund’s volatility. As mentioned earlier, for the Reporting Period overall, the Fund’s actual volatility (annualized, using daily returns) was 3.00%, less than the S&P 500® Index’s annualized volatility of 3.77%.
How was the Fund positioned during the Reporting Period?
During the Reporting Period, we tactically managed the Fund’s allocations across equity and fixed income markets based on the momentum and volatility of these asset classes. At the beginning of the Reporting Period, the Fund’s total assets were allocated 80% to equities, 20% to fixed income and 0% to cash. (Many of these positions were implemented through the use of exchange-traded index future contracts.) Within the equity category, the Fund had allocations to five of six global equity asset classes. It did not have an allocation to emerging markets equities at the start of the Reporting Period. As for fixed income, the Fund had an emphasis on German government bonds.
At the end of January 2017, we added a small allocation to emerging markets equities, increasing it slightly by the end of May 2017. We increased the Fund’s allocation to U.S. large-cap stocks early in the first quarter and eliminated its allocation to U.S. small-cap stocks. We also reduced the Fund’s allocation to German government bonds and in March 2017, added an allocation to Japanese government bonds.
By the end of the second calendar quarter, we reduced the size of the Fund’s equity allocation and increased the size of its fixed income allocation. Within its equity allocation, the Fund had exposure to U.S. large-cap equities; European, Japanese and U.K. equities; and emerging markets equities. It had no exposure to U.S. small-cap equities. Within fixed income, we added some exposure to U.S. Treasuries, reduced the Fund’s allocation to Japanese government bonds and eliminated the Fund’s allocation to German government bonds. The Fund continued to have a 0% allocation to cash.
In September 2017, we increased the size of the Fund’s equity allocation and reduced the size of its fixed income allocation. Within its equity allocation, we increased the Fund’s exposure to emerging markets equities and U.S. large-cap equities. We added an allocation to U.S. small-cap equities. Also, we reduced the Fund’s exposure to Japanese and European equities, while maintaining its exposure to U.K. equities. Within fixed income, we added an allocation to U.S. Treasuries and Japanese government bonds. We also added exposure to German government bonds.
3
GOLDMAN SACHS VARIABLE INSURANCE TRUST GLOBAL TRENDS ALLOCATION FUND
Near the end of the Reporting Period, within the equity allocation, we increased the Fund’s exposure to Japanese equities and reduced its exposure to European equities. We eliminated the Fund’s allocation to U.S. small-cap stocks. Within fixed income, we increased the Fund’s allocation to Japanese government bonds and eliminated its allocations to U.S. Treasuries and German government bonds.
How did the Fund use derivatives and similar instruments during the Reporting Period?
During the Reporting Period, the Fund employed exchange-traded index futures contracts to gain exposure to U.S. large-cap and small-cap stocks; the European, Japanese and U.K. equity markets; and U.S., Japanese and German government bonds. On an absolute basis, the use of these instruments had a positive impact on the Fund’s performance, as these allocations added to returns.
What is the Fund’s tactical asset allocation view and strategy for the months ahead?
At the end of the Reporting Period, the Fund’s total assets were allocated 80% to equities, 20% to fixed income and 0% to cash (Many of these positions were implemented through the use of exchange-traded index future contracts). Within the equity allocation, we prepared for 2018 by increasing the Fund’s exposure to emerging markets equities, slightly moderating its exposure to European equities. Within the fixed income allocation, the Fund maintained its allocation to Japanese government bonds. It had no exposure to U.S. Treasuries and German government bonds.
Going forward, we intend to position the Fund to provide exposure to price momentum from among nine underlying asset classes, while dynamically managing the volatility, or risk, of the overall portfolio. In general, the Fund seeks to maintain a strategic allocation of 60% of its assets in equity investments and 40% of its assets in fixed income investments. The Fund may deviate from these strategic allocations in order to allocate a greater percentage to asset classes with strong momentum and to reduce its allocation to assets with weak momentum. When volatility increases, our goal is to preserve capital by proportionally increasing the Fund’s cash exposure and reducing its exposure to riskier asset classes. There is no guarantee the Fund’s dynamic management strategy will cause it to achieve its investment objective.
4
GOLDMAN SACHS VARIABLE INSURANCE TRUST GLOBAL TRENDS ALLOCATION FUND
Index Definitions
Global Trends Allocation Composite Index is composed 60% of MSCI World Index and 40% of Bloomberg Barclays U.S. Aggregate Bond Index. It is a composite representation prepared by the Investment Adviser of the performance of the Fund’s asset classes, weighted according to their respective weightings in the Fund’s target range.
MSCI World Index (Net, USD, Unhedged) is a free float-adjusted market capitalization weighted index that is designed to measure the equity market performance of 23 developed markets.
Bloomberg Barclays U.S. Aggregate Bond Index represents an unmanaged diversified portfolio of fixed income securities, including U.S. Treasuries, investment grade corporate bonds, and mortgage-backed and asset-backed securities.
It is not possible to invest directly in an unmanaged index.
S&P 500® Index is an unmanaged index of 500 stocks that is generally representative of the performance of larger companies in the U.S.
5
FUND BASICS
Global Trends Allocation Fund
as of December 31, 2017
STANDARDIZED TOTAL RETURNS1
| | | | | | | | | | | | | | |
| For the year ended 12/31/17 | | One Year | | | Five Years | | | Since Inception | | | Inception Date |
| Institutional | | | 13.36 | % | | | N/A | | | | 4.49 | % | | 10/16/13 |
| Service | | | 13.11 | | | | 5.58 | % | | | 5.54 | | | 4/16/12 |
| 1 | Standardized Total Returns are average annual total returns as of the most recent calendar quarter-end. They assume reinvestment of all distributions at net asset value (“NAV”). Because Institutional Shares and Service Shares do not involve a sales charge, such a charge is not applied to their Standardized Total Returns. |
Total return figures in the above chart represent past performance and do not indicate future results, which will vary. The investment return and principal value of an investment will fluctuate and, therefore, an investor’s shares, when redeemed, may be worth more or less than their original cost. Current performance may be lower or higher than the total return figures in the above chart. Please visit www.GSAMFUNDS.com to obtain the most recent month-end returns. Performance reflects fee waivers and/or expense limitations in effect during the periods shown. In their absence, performance would be reduced.
EXPENSE RATIOS2
| | | | | | | | |
| | | Net Expense Ratio (Current) | | | Gross Expense Ratio (Before Waivers) | |
| Institutional | | | 0.73 | % | | | 1.00 | % |
| Service | | | 0.99 | | | | 1.24 | |
| 2 | The expense ratios of the Fund, both current (net of any fee waivers and/or expense limitations) and before waivers (gross of any fee waivers and/or expense limitations) are as set forth above according to the most recent publicly available Prospectuses for the Fund and may differ from the expense ratios disclosed in the Financial Highlights in this report. Pursuant to a contractual arrangement, the Fund’s fee waivers and/or expense limitations will remain in place through at least April 28, 2018, and prior to such date, the Investment Adviser may not terminate the arrangements without the approval of the Fund’s Board of Trustees. If these arrangements are discontinued in the future, the expense ratios may change without shareholder approval. |
6
FUND BASICS
FUND COMPOSITION3
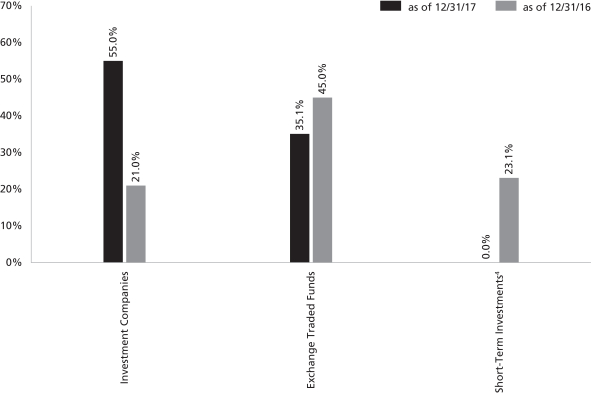
| 3 | The percentage shown for each investment category reflects the value of investments in that category as a percentage of net assets (excluding investments in the securities lending reinvestment vehicle if any). Figures in the above graph may not sum to 100% due to the exclusion of other assets and liabilities. The underlying composition of exchange traded funds and investment companies held by the Fund are not reflected in the graph above. Consequently, the Fund’s overall composition may differ from the percentages contained in the graph above. The graph depicts the Fund’s investments but may not represent the Fund’s market exposure due to the exclusion of certain derivatives, if any, as listed in the Additional Investment Information section of the Schedule of Investments. |
| 4 | Short-Term Investments include investments in U.S. Government Agency Securities. U.S. Government Agency Securities include agency securities offered by companies such as Federal Home Loan Bank, Federal Home Loan Mortgage Corporation and Federal National Mortgage Association, which operate under a government charter. While they are required to report to a government regulator, their assets are not explicitly guaranteed by the government and they otherwise operate like any other publicly traded company. |
7
GOLDMAN SACHS VARIABLE INSURANCE TRUST GLOBAL TRENDS ALLOCATION FUND
Performance Summary
December 31, 2017
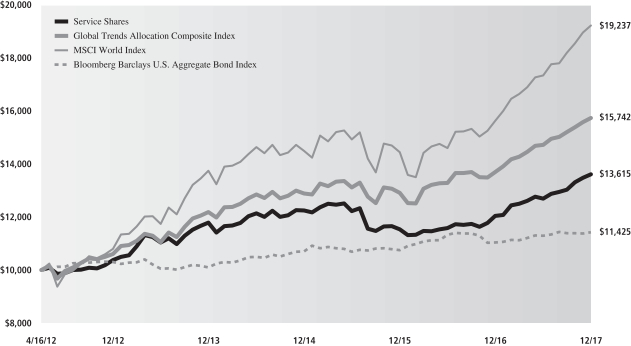
The following graph shows the value, as of December 31, 2017, of a $10,000 investment made on April 16, 2012 (commencement of the Fund’s operations) in Service Shares at NAV. For comparative purposes, the performance of the Fund’s benchmark, the Global Trends Allocation Composite Index, (comprised of the Morgan Stanley Capital International (MSCI) World Index (60%) and the Bloomberg Barclays U.S. Aggregate Bond Index (40%)) is shown. This performance data represents past performance and should not be considered indicative of future performance, which will fluctuate with changes in market conditions. These performance fluctuations may cause an investor’s shares, when redeemed, to be worth more or less than their original cost. Performance reflects Fund level expenses but does not reflect fees and expenses associated with any variable annuity contract or variable life insurance policy that uses the Fund as an investment option for any contract or policy. Had performance reflected all of those fees and expenses, performance would have been reduced. Performance reflects applicable fee waivers and/or expense limitations in effect during the periods shown, and in their absence, performance would be reduced. Performance of Institutional Shares will vary from Service Shares due to differences in class specific fees. In addition to the Investment Adviser’s decisions regarding issuer/industry investment selection and allocation, other factors may affect Fund performance. These factors include, but are not limited to, Fund operating fees and expenses, portfolio turnover, and subscription and redemption cash flows affecting the Fund.
Global Trends Allocation Fund’s Lifetime Performance
Performance of a $10,000 investment, with distributions reinvested, from April 16, 2012 through December 31, 2017.
| | | | | | |
| Average Annual Total Return through December 31, 2017 | | One Year | | Five Years | | Since Inception |
Institutional (Commenced October 16, 2013) | | 13.36% | | N/A | | 4.49% |
Service (Commenced April 16, 2012) | | 13.11 | | 5.58% | | 5.54 |
8
GOLDMAN SACHS VARIABLE INSURANCE TRUST GLOBAL TRENDS ALLOCATION FUND
Schedule of Investments
December 31, 2017
| | | | | | | | |
Shares | | | Description | | Value | |
| | Exchange Traded Funds – 35.1% | |
| | 196,944 | | | iShares Core S&P 500 Fund | | $ | 52,948,394 | |
| | 868,574 | | | iShares MSCI Emerging Markets Fund | | | 40,927,207 | |
| | 199,162 | | | Vanguard S&P 500 Fund | | | 48,852,447 | |
| | |
| | TOTAL EXCHANGE TRADED FUNDS | | | | |
| | (Cost $114,614,170) | | $ | 142,728,048 | |
| | |
| | | | | | | | |
| Shares | | Distribution Rate | | | Value | |
| Investment Companies(a) – 55.0% | |
Goldman Sachs Financial Square Government Fund — Institutional Shares | |
| 122,370,204 | | | 1.228 | % | | $ | 122,370,204 | |
Goldman Sachs Financial Square Treasury Obligations Fund — Institutional Shares | |
| 50,802,535 | | | 1.242 | | | | 50,802,535 | |
Goldman Sachs Financial Square Treasury Solutions Fund —
Institutional Shares | |
| 50,802,535 | | | 1.163 | | | | 50,802,535 | |
| |
| TOTAL INVESTMENT COMPANIES | |
| (Cost $223,975,274) | | | $ | 223,975,274 | |
| |
| TOTAL INVESTMENTS – 90.1% | |
| (Cost $338,589,444) | | | $ | 366,703,322 | |
| |
OTHER ASSETS IN EXCESS OF LIABILITIES – 9.9% | | | | 40,193,710 | |
| |
| NET ASSETS – 100.0% | | | $ | 406,897,032 | |
| |
| | |
| The percentage shown for each investment category reflects the value of investments in that category as a percentage of net assets. |
| (a) | | Represents an Affiliated Issuer. |
ADDITIONAL INVESTMENT INFORMATION
FUTURES CONTRACTS — At December 31, 2017, the Fund had the following futures contracts:
| | | | | | | | | | | | | | | | |
| Description | | Number of
Contracts | | | Expiration Date | | | Notional
Amount | | | Unrealized
Appreciation/
(Depreciation) | |
Long position contracts: | | | | | |
EURO STOXX 50 Index | | | 486 | | | | 03/16/2018 | | | $ | 20,368,629 | | | $ | (480,550 | ) |
FTSE 100 Index | | | 200 | | | | 03/16/2018 | | | | 20,624,891 | | | | 556,722 | |
Japan 10 Year Bond | | | 61 | | | | 03/13/2018 | | | | 81,629,288 | | | | (35,687 | ) |
S&P 500 E-Mini Index | | | 758 | | | | 03/16/2018 | | | | 101,420,400 | | | | 442,073 | |
TOPIX Index | | | 251 | | | | 03/08/2018 | | | | 40,476,326 | | | | 606,460 | |
| Total Futures Contracts | | | | | | | | | | | | | | $ | 1,089,018 | |
| | |
| The accompanying notes are an integral part of these financial statements. | | 9 |
GOLDMAN SACHS VARIABLE INSURANCE TRUST GLOBAL TRENDS ALLOCATION FUND
Statement of Assets and Liabilities
December 31, 2017
| | | | |
| | | | |
| Assets: | | | |
Investments in unaffiliated issuers, at value (cost $114,614,170) | | $ | 142,728,048 | |
Investments in affiliated issuers, at value (cost $223,975,274) | | | 223,975,274 | |
Cash | | | 46,398,982 | |
Receivables: | | | | |
Collateral on certain derivative contracts | | | 7,341,039 | |
Dividends | | | 205,122 | |
Fund shares sold | | | 104,934 | |
Reimbursement from investment adviser | | | 10,412 | |
Securities lending income | | | 1,158 | |
Variation margin on futures | | | 444,479 | |
Other assets | | | 286 | |
| Total assets | | | 421,209,734 | |
| | | | |
| | | | |
Liabilities: | |
Payables: | | | | |
Investments purchased | | | 13,866,895 | |
Management fees | | | 215,136 | |
Distribution and Service fees and Transfer Agency fees | | | 92,639 | |
Fund shares redeemed | | | 31,166 | |
Accrued expenses and other liabilities | | | 106,866 | |
| Total liabilities | | | 14,312,702 | |
| | | | |
| | | | |
| Net Assets: | |
Paid-in capital | | | 373,846,335 | |
Undistributed net investment income | | | 888,720 | |
Accumulated net realized gain | | | 2,972,979 | |
Net unrealized gain | | | 29,188,998 | |
| NET ASSETS | | $ | 406,897,032 | |
Net Assets: | | | | |
Institutional | | $ | 30,107 | |
Service | | | 406,866,925 | |
Total Net Assets | | $ | 406,897,032 | |
Shares outstanding $0.001 par value (unlimited shares authorized): | | | | |
Institutional | | | 2,415 | |
Service | | | 32,688,839 | |
Net asset value, offering and redemption price per share: | | | | |
Institutional | | | $12.46 | |
Service | | | 12.45 | |
| | |
| 10 | | The accompanying notes are an integral part of these financial statements. |
GOLDMAN SACHS VARIABLE INSURANCE TRUST GLOBAL TRENDS ALLOCATION FUND
Statement of Operations
For the Fiscal Year Ended December 31, 2017
| | | | |
| | | | |
| Investment income: | |
Dividends — unaffiliated issuers | | $ | 2,770,709 | |
Dividends — affiliated issuers | | | 1,450,194 | |
Interest | | | 88,833 | |
Securities lending income — affiliated issuer | | | 29,514 | |
| Total investment income | | | 4,339,250 | |
| |
| | | | |
| Expenses: | |
Management fees | | | 2,994,132 | |
Distribution and Service fees — Service Shares | | | 947,439 | |
Professional fees | | | 102,999 | |
Transfer Agency fees(a) | | | 75,796 | |
Custody, accounting and administrative services | | | 53,685 | |
Printing and mailing costs | | | 20,931 | |
Trustee fees | | | 18,255 | |
Other | | | 12,034 | |
| Total expenses | | | 4,225,271 | |
Less — expense reductions | | | (698,870 | ) |
| Net expenses | | | 3,526,401 | |
| NET INVESTMENT INCOME | | | 812,849 | |
| | | | |
| | | | |
| Realized and unrealized gain (loss): | |
Net realized gain from: | | | | |
Investments — unaffiliated issuers | | | 10,232,892 | |
Futures contracts | | | 20,192,438 | |
Foreign currency transactions | | | 190,458 | |
Net change in unrealized gain (loss) on: | | | | |
Investments — unaffiliated issuers | | | 16,219,348 | |
Futures contracts | | | (1,123,151 | ) |
Foreign currency translation | | | 6,039 | |
| Net realized and unrealized gain | | | 45,718,024 | |
| NET INCREASE IN NET ASSETS RESULTING FROM OPERATIONS | | $ | 46,530,873 | |
(a) Institutional and Service Shares incurred Transfer Agency fees of $7 and $75,789, respectively.
| | |
| The accompanying notes are an integral part of these financial statements. | | 11 |
GOLDMAN SACHS VARIABLE INSURANCE TRUST GLOBAL TRENDS ALLOCATION FUND
Statements of Changes in Net Assets
| | | | | | | | |
| | | For the
Fiscal Year Ended
December 31, 2017 | | | For the
Fiscal Year Ended
December 31, 2016 | |
| | | | | | | | |
| From operations: | |
Net investment income | | $ | 812,849 | | | $ | 701,709 | |
Net realized gain | | | 30,615,788 | | | | 225,837 | |
Net change in unrealized gain | | | 15,102,236 | | | | 14,319,840 | |
| Net increase in net assets resulting from operations | | | 46,530,873 | | | | 15,247,386 | |
| | | | | | | | |
| | | | | | | | |
| Distributions to shareholders: | |
From net investment income | | | | | | | | |
Institutional Shares | | | (157 | ) | | | (119 | ) |
Service Shares | | | (1,185,638 | ) | | | (992,542 | ) |
From net realized gains | | | | | | | | |
Institutional Shares | | | (744 | ) | | | — | |
Service Shares | | | (10,068,418 | ) | | | — | |
| Total distributions to shareholders | | | (11,254,957 | ) | | | (992,661 | ) |
| | | | | | | | |
| | | | | | | | |
| From share transactions: | |
Proceeds from sales of shares | | | 38,959,444 | | | | 57,559,506 | |
Reinvestment of distributions | | | 11,254,957 | | | | 992,661 | |
Cost of shares redeemed | | | (32,234,857 | ) | | | (74,879,513 | ) |
| Net increase (decrease) in net assets resulting from share transactions | | | 17,979,544 | | | | (16,327,346 | ) |
| TOTAL INCREASE (DECREASE) | | | 53,255,460 | | | | (2,072,621 | ) |
| | | | | | | | |
| | | | | | | | |
| Net assets: | |
| | |
Beginning of year | | | 353,641,572 | | | | 355,714,193 | |
End of year | | $ | 406,897,032 | | | $ | 353,641,572 | |
| Undistributed net investment income | | $ | 888,720 | | | $ | 887,561 | |
| | |
| 12 | | The accompanying notes are an integral part of these financial statements. |
GOLDMAN SACHS VARIABLE INSURANCE TRUST GLOBAL TRENDS ALLOCATION FUND
Financial Highlights
Selected Data for a Share Outstanding Throughout Each Year
| | | | | | | | | | | | | | | | | | | | | | | | | | | | | | | | | | | | | | | | | | | | | | | | | | | | | | | | |
| | | | | | Income (loss) from
investment operations | | | Distributions to shareholders | | | | | | | | | | | | | | | | | | | | | | |
| Year - Share Class | | Net asset
value,
beginning
of year | | | Net
investment
income
(loss)(a) | | | Net
realized
and
unrealized
gain (loss) | | | Total from
investment
operations | | | From net
investment
income | | | From net
realized
gains | | | Total
distributions | | | Net asset value,
end of
year | | | Total
return(b) | | | Net assets,
end of
period
(in 000s) | | | Ratio of
net expenses
to average
net assets | | | Ratio of
total
expenses
to average
net assets | | | Ratio of
net investment
income (loss)
to average
net assets | | | Portfolio
turnover
rate(c) | |
FOR THE FISCAL YEARS ENDED DECEMBER 31, | |
2017 - Institutional | | $ | 11.33 | | | $ | 0.06 | | | $ | 1.46 | | | $ | 1.52 | | | $ | (0.07 | ) | | $ | (0.32 | ) | | $ | (0.39 | ) | | $ | 12.46 | | | | 13.36 | % | | $ | 30 | | | | 0.68 | % | | | 0.86 | % | | | 0.46 | % | | | 64 | % |
2017 - Service | | | 11.32 | | | | 0.03 | | | | 1.46 | | | | 1.49 | | | | (0.04 | ) | | | (0.32 | ) | | | (0.36 | ) | | | 12.45 | | | | 13.11 | | | | 406,867 | | | | 0.93 | | | | 1.11 | | | | 0.21 | | | | 64 | |
2016 - Institutional | | | 10.89 | | | | (0.03 | ) | | | 0.52 | | | | 0.49 | | | | (0.05 | ) | | | — | | | | (0.05 | ) | | | 11.33 | | | | 4.49 | | | | 27 | | | | 0.74 | | | | 0.89 | | | | (0.25 | ) | | | 260 | |
2016 - Service | | | 10.88 | | | | 0.02 | | | | 0.45 | | | | 0.47 | | | | (0.03 | ) | | | — | | | | (0.03 | ) | | | 11.32 | | | | 4.33 | | | | 353,615 | | | | 1.00 | | | | 1.13 | | | | 0.20 | | | | 260 | |
2015 - Institutional | | | 11.82 | | | | 0.01 | | | | (0.67 | ) | | | (0.66 | ) | | | (0.03 | ) | | | (0.24 | ) | | | (0.27 | ) | | | 10.89 | | | | (5.52 | ) | | | 1,008 | | | | 0.75 | | | | 0.92 | | | | 0.12 | | | | 504 | |
2015 - Service | | | 11.82 | | | | (0.02 | ) | | | (0.67 | ) | | | (0.69 | ) | | | (0.01 | ) | | | (0.24 | ) | | | (0.25 | ) | | | 10.88 | | | | (5.82 | ) | | | 354,706 | | | | 1.00 | | | | 1.17 | | | | (0.16 | ) | | | 504 | |
2014 - Institutional | | | 11.46 | | | | 0.08 | | | | 0.41 | | | | 0.49 | | | | (0.03 | ) | | | (0.10 | ) | | | (0.13 | ) | | | 11.82 | | | | 4.23 | | | | 739 | | | | 0.77 | | | | 1.01 | | | | 0.68 | | | | 304 | |
2014 - Service | | | 11.47 | | | | — | (d) | | | 0.45 | | | | 0.45 | | | | — | (d) | | | (0.10 | ) | | | (0.10 | ) | | | 11.82 | | | | 3.95 | | | | 267,720 | | | | 1.03 | | | | 1.24 | | | | 0.04 | | | | 304 | |
2013 - Institutional (Commenced
October 16, 2013) | | | 11.41 | | | | 0.01 | | | | 0.34 | | | | 0.35 | | | | (0.02 | ) | | | (0.28 | ) | | | (0.30 | ) | | | 11.46 | | | | 3.17 | | | | 26 | | | | 0.81 | (e) | | | 1.09 | (e) | | | 0.33 | (e) | | | 195 | |
2013 - Service | | | 10.36 | | | | (0.02 | ) | | | 1.42 | | | | 1.40 | | | | (0.01 | ) | | | (0.28 | ) | | | (0.29 | ) | | | 11.47 | | | | 13.57 | | | | 136,116 | | | | 1.04 | | | | 1.51 | | | | (0.21 | ) | | | 195 | |
| (a) | Calculated based on the average shares outstanding methodology. |
| (b) | Assumes investment at the net asset value at the beginning of the year, reinvestment of all distributions, and a complete redemption of the investment at the net asset value at the end of the year. Total returns for periods less than one full year are not annualized. |
| (c) | The Fund’s portfolio turnover rate is calculated in accordance with regulatory requirements, without regard to transactions involving short term investments and certain derivatives. If such transactions were included, the Fund’s portfolio turnover rate may be higher. |
| (d) | Amount is less than $0.005 per share. |
| | | | |
| The accompanying notes are an integral part of these financial statements. | | 13 | | |
GOLDMAN SACHS VARIABLE INSURANCE TRUST GLOBAL TRENDS ALLOCATION FUND
Notes to Financial Statements
December 31, 2017
1. ORGANIZATION
Goldman Sachs Variable Insurance Trust (the “Trust” or “VIT”) is a Delaware statutory trust registered under the Investment Company Act of 1940, as amended (the “Act”), as an open-end management investment company. The Trust includes the Goldman Sachs Global Trends Allocation Fund (the “Fund”). The Fund is a diversified portfolio under the Act offering two classes of shares — Institutional and Service Shares. Shares of the Trust are offered to separate accounts of participating life insurance companies for the purpose of funding variable annuity contracts and variable life insurance policies.
Goldman Sachs Asset Management, L.P. (“GSAM”), an affiliate of Goldman Sachs & Co. LLC (formerly, Goldman, Sachs & Co.) (“Goldman Sachs”), serves as investment adviser to the Fund pursuant to a management agreement (the “Agreement”) with the Trust.
2. SIGNIFICANT ACCOUNTING POLICIES
The financial statements have been prepared in accordance with accounting principles generally accepted in the United States of America (“GAAP”) and require management to make estimates and assumptions that may affect the reported amounts and disclosures. Actual results may differ from those estimates and assumptions.
A. Investment Valuation — The Fund’s valuation policy is to value investments at fair value.
B. Investment Income and Investments — Investment income includes interest income, dividend income, and securities lending income. Interest income is accrued daily and adjusted for amortization of premiums and accretion of discounts. Dividend income is recognized on ex-dividend date or, for certain foreign securities, as soon as such information is obtained subsequent to the ex-dividend date. Investment transactions are reflected on trade date. Realized gains and losses are calculated using identified cost. Investment transactions are recorded on the following business day for daily net asset value (“NAV”) calculations. Investment income is recorded net of any foreign withholding taxes, less any amounts reclaimable. The Fund may file withholding tax reclaims in certain jurisdictions to recover a portion of amounts previously withheld. Any foreign capital gains tax is accrued daily based upon net unrealized gains, and is payable upon sale of such investments.
For derivative contracts, realized gains and losses are recorded upon settlement of the contract.
C. Class Allocations and Expenses — Investment income, realized and unrealized gain (loss), if any, and non-class specific expenses of the Fund are allocated daily based upon the proportion of net assets of each class. Non-class specific expenses directly incurred by the Fund are charged to the Fund, while such expenses incurred by the Trust are allocated across the Fund on a straight-line and/or pro-rata basis depending upon the nature of the expenses. Class-specific expenses, where applicable, are borne by the respective share classes and include Distribution and Service and Transfer Agency fees.
D. Federal Taxes and Distributions to Shareholders — It is the Fund’s policy to comply with the requirements of the Internal Revenue Code of 1986, as amended (the “Code”), applicable to regulated investment companies (mutual funds) and to distribute each year substantially all of its investment company taxable income and capital gains to its shareholders. Accordingly, the Fund is not required to make any provisions for the payment of federal income tax. Distributions to shareholders are recorded on the ex-dividend date. Income and capital gains distributions, if any, are declared and paid annually.
Net capital losses, if any, are carried forward to future fiscal years and may be used to the extent allowed by the Code to offset any future capital gains. Losses that are carried forward will retain their character as either short-term or long-term capital losses. Utilization of capital loss carryforwards will reduce the requirement of future capital gains distributions.
The characterization of distributions to shareholders for financial reporting purposes is determined in accordance with federal income tax rules, which may differ from GAAP. The source of the Fund’s distributions may be shown in the accompanying financial statements as either from net investment income, net realized gain or capital. Certain components of the Fund’s net assets on the Statement of Assets and Liabilities reflect permanent GAAP/tax differences based on the appropriate tax character.
E. Foreign Currency Translation — The accounting records and reporting currency of the Fund are maintained in United States (“U.S.”) dollars. Assets and liabilities denominated in foreign currencies are translated into U.S. dollars using the current exchange
14
GOLDMAN SACHS VARIABLE INSURANCE TRUST GLOBAL TRENDS ALLOCATION FUND
2. SIGNIFICANT ACCOUNTING POLICIES (continued)
rates at the close of each business day. The effect of changes in foreign currency exchange rates on investments is included within net realized and unrealized gain (loss) on investments. Changes in the value of other assets and liabilities as a result of fluctuations in foreign exchange rates are included in the Statement of Operations within net change in unrealized gain (loss) on foreign currency translation. Transactions denominated in foreign currencies are translated into U.S. dollars on the date the transaction occurred, the effects of which are included within net realized gain (loss) on foreign currency transactions.
3. INVESTMENTS AND FAIR VALUE MEASUREMENTS
U.S. GAAP defines the fair value of a financial instrument as the amount that would be received to sell an asset or paid to transfer a liability in an orderly transaction between market participants at the measurement date (i.e., the exit price); the Fund’s policy is to use the market approach. GAAP establishes a fair value hierarchy that prioritizes the inputs to valuation techniques used to measure fair value. The hierarchy gives the highest priority to unadjusted quoted prices in active markets for identical assets or liabilities (Level 1 measurements) and the lowest priority to unobservable inputs (Level 3 measurements). The levels used for classifying investments are not necessarily an indication of the risk associated with investing in these investments. The three levels of the fair value hierarchy are described below:
Level 1 — Unadjusted quoted prices in active markets that are accessible at the measurement date for identical, unrestricted assets or liabilities;
Level 2 — Quoted prices in markets that are not active or financial instruments for which significant inputs are observable (including, but not limited to, quoted prices for similar investments, interest rates, foreign exchange rates, volatility and credit spreads), either directly or indirectly;
Level 3 — Prices or valuations that require significant unobservable inputs (including GSAM’s assumptions in determining fair value measurement).
Changes in valuation techniques may result in transfers into or out of an assigned level within the hierarchy. In accordance with the Fund’s policy, transfers between different levels of the fair value hierarchy resulting from such changes are deemed to have occurred as of the beginning of the reporting period.
The Board of Trustees (“Trustees”) has approved Valuation Procedures that govern the valuation of the portfolio investments held by the Fund, including investments for which market quotations are not readily available. The Trustees have delegated to GSAM day-to-day responsibility for implementing and maintaining internal controls and procedures related to the valuation of the Fund’s investments. To assess the continuing appropriateness of pricing sources and methodologies, GSAM regularly performs price verification procedures and issues challenges as necessary to third party pricing vendors or brokers, and any differences are reviewed in accordance with the Valuation Procedures.
A. Level 1 and Level 2 Fair Value Investments — The valuation techniques and significant inputs used in determining the fair values for investments classified as Level 1 and Level 2 are as follows:
Equity Securities — Equity securities traded on a U.S. securities exchange or the NASDAQ system, or those located on certain foreign exchanges, including but not limited to the Americas, are valued daily at their last sale price or official closing price on the principal exchange or system on which they are traded. If there is no sale or official closing price or such price is believed by GSAM to not represent fair value, equity securities are valued at the last bid price for long positions and at the last ask price for short positions. To the extent these investments are actively traded, they are classified as Level 1 of the fair value hierarchy, otherwise they are generally classified as Level 2.
Unlisted equity securities for which market quotations are available are valued at the last sale price on the valuation date, or if no sale occurs, at the last bid price. Unlisted equities are generally classified as Level 2 (fair valued and single source broker securities may be treated differently). Securities traded on certain foreign securities exchanges are valued daily at fair value determined by an independent fair value service (if available) under Valuation Procedures approved by the Trustees and consistent with applicable regulatory guidance. The independent fair value service takes into account multiple factors including, but not
15
GOLDMAN SACHS VARIABLE INSURANCE TRUST GLOBAL TRENDS ALLOCATION FUND
Notes to Financial Statements (continued)
December 31, 2017
3. INVESTMENTS AND FAIR VALUE MEASUREMENTS (continued)
limited to, movements in the securities markets, certain depositary receipts, futures contracts and foreign currency exchange rates that have occurred subsequent to the close of the foreign securities exchange. These investments are generally classified as Level 2 of the fair value hierarchy.
Underlying Funds (including Money Market Funds) — Underlying Funds (“Underlying Funds”) include other investment companies and exchange-traded funds (“ETFs”). Investments in the Underlying Funds (except ETFs) are valued at the NAV per share of the Institutional Share class on the day of valuation. ETFs are valued daily at the last sale price or official closing price on the principal exchange or system on which the investment is traded. Because the Fund invests in Underlying Funds that fluctuate in value, the Fund’s shares will correspondingly fluctuate in value. To the extent these investments are actively traded, they are classified as Level 1 of the fair value hierarchy, otherwise they are generally classified as Level 2. For information regarding an Underlying Fund’s accounting policies and investment holdings, please see the Underlying Fund’s shareholder report.
Debt Securities — Debt securities for which market quotations are readily available are valued daily on the basis of quotations supplied by dealers or an independent pricing service approved by the Trustees. The pricing services may use valuation models or matrix pricing, which consider: (i) yield or price with respect to bonds that are considered comparable in characteristics such as rating, interest rate and maturity date or (ii) quotations from securities dealers to determine current value. With the exception of treasury securities of G8 countries, which are generally classified as Level 1, these investments are generally classified as Level 2 of the fair value hierarchy.
Derivative Contracts — A derivative is an instrument whose value is derived from underlying assets, indices, reference rates or a combination of these factors. The Fund enters into derivative transactions to hedge against changes in interest rates, securities prices, and/or currency exchange rates, to increase total return, or to gain access to certain markets or attain exposure to other underliers.
Exchange-traded derivatives, including futures and options contracts, are valued at the last sale or settlement price and typically fall within Level 1 of the fair value hierarchy. Over-the-counter (“OTC”) and centrally cleared derivatives are valued using market transactions and other market evidence, including market-based inputs to models, calibration to market-clearing transactions, broker or dealer quotations, or other alternative pricing sources. Where models are used, the selection of a particular model to value OTC and centrally cleared derivatives depends upon the contractual terms of, and specific risks inherent in, the instrument, as well as the availability of pricing information in the market. Valuation models require a variety of inputs, including contractual terms, market prices, yield curves, credit curves, measures of volatility, voluntary and involuntary prepayment rates, loss severity rates and correlations of such inputs. For OTC and centrally cleared derivatives that trade in liquid markets, model inputs can generally be verified and model selection does not involve significant management judgment. OTC and centrally cleared derivatives are classified within Level 2 of the fair value hierarchy when significant inputs are corroborated by market evidence.
i. Futures Contracts — Futures contracts are contracts to buy or sell a standardized quantity of a specified commodity or security and are valued based on exchanged settlement prices or independent market quotes. Futures contracts are valued at the last settlement price, or in the absence of a sale, the last bid price for long positions and at the last ask price for short positions, at the end of each day on the board of trade or exchange upon which they are traded. Upon entering into a futures contract, the Fund deposits cash or securities in an account on behalf of the broker in an amount sufficient to meet the initial margin requirement. Subsequent payments are made or received by the Fund equal to the daily change in the contract value and are recorded as variation margin receivable or payable with a corresponding offset to unrealized gains or losses. For financial reporting purposes, cash collateral that has been pledged to cover obligations of the Fund and cash collateral received, if any, is reported separately on the Statement of Assets and Liabilities as receivables/payables for collateral on certain derivative contracts. Non-cash collateral pledged by the Fund, if any, is noted in the Schedule of Investments.
B. Level 3 Fair Value Investments — To the extent that significant inputs to valuation models and other alternative pricing sources are unobservable, or if quotations are not readily available, or if GSAM believes that such quotations do not accurately reflect fair value, the fair value of the Fund’s investments may be determined under Valuation Procedures approved by the
16
GOLDMAN SACHS VARIABLE INSURANCE TRUST GLOBAL TRENDS ALLOCATION FUND
3. INVESTMENTS AND FAIR VALUE MEASUREMENTS (continued)
Trustees. GSAM, consistent with its procedures and applicable regulatory guidance, may make an adjustment to the most recent valuation prices of either domestic or foreign securities in light of significant events to reflect what it believes to be the fair value of the securities at the time of determining the Fund’s NAV. Significant events which could affect a large number of securities in a particular market may include, but are not limited to: significant fluctuations in U.S. or foreign markets; market dislocations; market disruptions; or unscheduled market closings. Significant events which could also affect a single issuer may include, but are not limited to: corporate actions such as reorganizations, mergers and buy-outs; ratings downgrades; and bankruptcies.
C. Fair Value Hierarchy — The following is a summary of the Fund’s investments and derivatives classified in the fair value hierarchy as of December 31, 2017:
| | | | | | | | | | | | |
| Investment Type | | Level 1 | | | Level 2 | | | Level 3 | |
| Assets | | | | | | | | | | | | |
| Exchange Traded Funds | | $ | 142,728,048 | | | $ | — | | | $ | — | |
| Investment Companies | | | 223,975,274 | | | | — | | | | — | |
| Total | | $ | 366,703,322 | | | $ | — | | | $ | — | |
| | | |
| Derivative Type | | | | | | | | | |
| Assets(a) | | | | | | | | | | | | |
| Futures Contracts | | $ | 1,605,255 | | | $ | — | | | $ | — | |
| Liabilities(a) | | | | | | | | | | | | |
| Futures Contracts | | $ | (516,237 | ) | | $ | — | | | $ | — | |
| (a) | Amount shown represents unrealized gain (loss) at fiscal year end. |
For further information regarding security characteristics, see the Schedule of Investments.
4. INVESTMENTS IN DERIVATIVES
The following table sets forth, by certain risk types, the gross value of derivative contracts (not considered to be hedging instruments for accounting purposes) as of December 31, 2017. These instruments were used as part of the Fund’s investment strategies and to obtain and/or manage exposure related to the risks below. The values in the table below exclude the effects of cash collateral received or posted pursuant to these derivative contracts, and therefore are not representative of the Fund’s net exposure.
| | | | | | | | | | | | | | |
| Risk | | | | Statement of Assets and Liabilities | | Assets(a) | | | Statement of Assets and Liabilities | | Liabilities(a) | |
| Equity | | | | Variation margin on futures | | $ | 1,605,255 | | | Variation margin on futures | | $ | (480,550 | ) |
| Interest Rate | | | | — | | | — | | | Variation margin on futures | | | (35,687 | ) |
| Total | | | | | | $ | 1,605,255 | | | | | $ | (516,237 | ) |
| (a) | Includes unrealized gain (loss) on futures contracts described in the Additional Investment Information section of the Schedule of Investments. Only the variation margin as of December 31,2017 is reported within the Statement of Assets and Liabilities. |
The following table sets forth, by certain risk types, the Fund’s gains (losses) related to these derivatives and their indicative volumes for the fiscal year ended December 31, 2017. These gains (losses) should be considered in the context that these derivative contracts may have been executed to create investment opportunities and/or economically hedge certain investments, and
17
GOLDMAN SACHS VARIABLE INSURANCE TRUST GLOBAL TRENDS ALLOCATION FUND
Notes to Financial Statements (continued)
December 31, 2017
4. INVESTMENTS IN DERIVATIVES (continued)
accordingly, certain gains (losses) on such derivative contracts may offset certain (losses) gains attributable to investments. These gains (losses) are included in “Net realized gain (loss)” or “Net change in unrealized gain (loss)” on the Statement of Operations:
| | | | | | | | | | | | | | |
| Risk | | Statement of Operations | | Net
Realized
Gain (Loss) | | | Net Change in
Unrealized
Gain (Loss) | | | Average
Number of
Contracts(a) | |
| Equity | | Net realized gain (loss) from futures contracts/Net change in unrealized gain (loss) on futures contracts | | $ | 19,573,284 | | | $ | (463,445 | ) | | | 2,072 | |
| Interest Rate | | Net realized gain (loss) from futures contracts/Net change in unrealized gain (loss) on futures contracts | | | 619,154 | | | | (659,706 | ) | | | 257 | |
| Total | | | | $ | 20,192,438 | | | $ | (1,123,151 | ) | | $ | 2,329 | |
| (a) | Average number of contracts is based on the average of month end balances for the fiscal year ended December 31, 2017. |
5. AGREEMENTS AND AFFILIATED TRANSACTIONS
A. Management Agreement — Under the Agreement, GSAM manages the Fund, subject to the general supervision of the Trustees.
As compensation for the services rendered pursuant to the Agreement, the assumption of the expenses related thereto and administration of the Fund’s business affairs, including providing facilities, GSAM is entitled to a management fee, accrued daily and paid monthly, equal to an annual percentage rate of the Fund’s average daily net assets.
For the fiscal year ended December 31, 2017, contractual and effective net management fees with GSAM were at the following rates:
| | | | | | | | | | | | | | | | | | | | | | | | | | |
| Contractual Management Rate | | | Effective Net
Management
Rate^ | |
First
$1 billion | | | Next
$1 billion | | | Next
$3 billion | | | Next
$3 billion | | | Over
$8 billion | | | Effective
Rate | | |
| | 0.79% | | | | 0.71 | % | | | 0.68 | % | | | 0.66 | % | | | 0.65 | % | | | 0.79 | % | | | 0.66 | * |
| ^ | Effective Net Management Rate includes the impact of management fee waivers of affiliated Underlying Funds, if any. |
| * | GSAM agreed to waive a portion of its management fee in order to achieve a net management rate, as defined in the Fund’s most recent prospectus. This waiver will be effective through at least April 28, 2018, and prior to such date GSAM may not terminate the arrangement without approval of the Trustees. For the fiscal year ended December 31, 2017, GSAM waived $315,433 of its management fee. |
The Fund invests in Institutional Shares of the Goldman Sachs Financial Square Government, Goldman Sachs Financial Square Treasury Obligations, and Goldman Sachs Financial Square Treasury Solutions Funds, which are affiliated Underlying Funds. GSAM has agreed to waive a portion of its management fee payable by the Fund in an amount equal to the management fee it earns as an investment adviser to the affiliated Underlying Funds in which the Fund invests, except those management fees it earns from the Fund’s investments of cash collateral received in connection with securities lending transactions in the Goldman Sachs Financial Square Government, Goldman Sachs Financial Square Treasury Obligations, and Goldman Sachs Financial Square Treasury Solutions Funds. For the fiscal year ended December 31, 2017, GSAM waived $172,323 of the Fund’s management fee.
B. Distribution and/or Service (12b-1) Plan — The Trust, on behalf of Service Shares of the Fund, has adopted a Distribution and Service Plan subject to Rule 12b-1 under the Act. Under the Distribution and Service Plan, Goldman Sachs, which serves as distributor, is entitled to a fee accrued daily and paid monthly, for distribution services and personal and account maintenance services, which may then be paid by Goldman Sachs to authorized dealers, equal to, on an annual basis, 0.25% of the Fund’s average daily net assets attributable to Service Shares.
C. Transfer Agency Agreement — Goldman Sachs also serves as the transfer agent of the Fund for a fee pursuant to the Transfer Agency Agreement. The fees charged for such transfer agency services are accrued daily and paid monthly at an annual rate of 0.02% of the average daily net assets of Institutional and Service Shares.
18
GOLDMAN SACHS VARIABLE INSURANCE TRUST GLOBAL TRENDS ALLOCATION FUND
5. AGREEMENTS AND AFFILIATED TRANSACTIONS (continued)
D. Other Expense Agreements and Affiliated Transactions — GSAM has agreed to limit certain “Other Expenses” of the Fund (excluding acquired fund fees and expenses, transfer agency fees and expenses, service fees and shareholder administration fees (as applicable), taxes, interest, brokerage fees, expenses of shareholder meetings, litigation and indemnification, and extraordinary expenses) to the extent such expenses exceed, on an annual basis, a percentage rate of the average daily net assets of the Fund. Such Other Expense reimbursements, if any, are accrued daily and paid monthly. In addition, the Fund is not obligated to reimburse GSAM for prior fiscal year expense reimbursements, if any. The Other Expense limitation as an annual percentage rate of average daily net assets for the Fund is 0.004%. The Other Expense limitation will remain in place through at least April 28, 2018, and prior to such date GSAM may not terminate the arrangement without the approval of the Trustees. For the fiscal year ended December 31, 2017, GSAM reimbursed $192,739 to the Fund. In addition, the Fund has entered into certain offset arrangements with the custodian and the transfer agent, which may result in a reduction of the Fund’s expenses and are received irrespective of the application of the “Other Expense” limitation described above. For the fiscal year ended December 31, 2017, custody fee credits were $18,375.
E. Line of Credit Facility — As of December 31, 2017, the Fund participated in a $1,100,000,000 committed, unsecured revolving line of credit facility (the “facility”) together with other funds of the Trust and certain registered investment companies having management agreements with GSAM or its affiliates. This facility is to be used for temporary emergency purposes, or to allow for an orderly liquidation of securities to meet redemption requests. The interest rate on borrowings is based on the federal funds rate. The facility also requires a fee to be paid by the Fund based on the amount of the commitment that has not been utilized. For the fiscal year ended December 31, 2017, the Fund did not have any borrowings under the facility.
F. Other Transactions with Affiliates — The following table provides information about the Fund’s investments in the Goldman Sachs Financial Square Government, Goldman Sachs Financial Square Treasury Obligations, and Goldman Sachs Financial Square Treasury Solutions Funds as of and for the fiscal year ended December 31, 2017:
| | | | | | | | | | | | | | | | | | | | | | | | |
| Investment Companies | | Beginning Value as of
December 31, 2016 | | | Purchases
at Cost | | | Proceeds
from Sales | | | Ending
Value as of December 31, 2017 | | | Shares as of
December 31, 2017 | | | Dividend
Income | |
Goldman Sachs Financial Square Government Fund | | $ | 74,421,507 | | | $ | 254,442,366 | | | $ | (206,493,669 | ) | | $ | 122,370,204 | | | | 122,370,204 | | | $ | 856,306 | |
Goldman Sachs Financial Square Treasury Obligations Fund | | | — | | | | 50,802,535 | | | | — | | | | 50,802,535 | | | | 50,802,535 | | | | 301,610 | |
Goldman Sachs Financial Square Treasury Solutions Fund | | | — | | | | 50,802,535 | | | | — | | | | 50,802,535 | | | | 50,802,535 | | | | 292,278 | |
| Total | | $ | 74,421,507 | | | $ | 356,047,436 | | | $ | (206,493,669 | ) | | $ | 223,975,274 | | | | 223,975,274 | | | $ | 1,450,194 | |
As of December 31, 2017, The Goldman Sachs Group, Inc. was the beneficial owner of approximately 100% of the Institutional Shares of the Fund.
6. PORTFOLIO SECURITIES TRANSACTIONS
The cost of purchases and proceeds from sales and maturities of long-term securities for the fiscal year ended December 31, 2017, were $85,292,517 and $128,086,869, respectively.
7. SECURITIES LENDING
Pursuant to exemptive relief granted by the Securities and Exchange Commission (“SEC”) and the terms and conditions contained therein, the Fund may lend its securities through a securities lending agent, Goldman Sachs Agency Lending (“GSAL”), a wholly-
19
GOLDMAN SACHS VARIABLE INSURANCE TRUST GLOBAL TRENDS ALLOCATION FUND
Notes to Financial Statements (continued)
December 31, 2017
7. SECURITIES LENDING (continued)
owned subsidiary of Goldman Sachs, to certain qualified borrowers including Goldman Sachs and affiliates. In accordance with the Fund’s securities lending procedures, the Fund receives cash collateral at least equal to the market value of the securities on loan. The market value of the loaned securities is determined at the close of business of the Fund, at their last sale price or official closing price on the principal exchange or system on which they are traded, and any additional required collateral is delivered to the Fund on the next business day. As with other extensions of credit, the Fund may experience delay in the recovery of its securities or incur a loss should the borrower of the securities breach its agreement with the Fund or become insolvent at a time when the collateral is insufficient to cover the cost of repurchasing securities on loan. Dividend income received from securities on loan may not be subject to withholding taxes and therefore withholding taxes paid may differ from the amounts listed in the Statement of Operations. Loans of securities are terminable at any time and as such 1) the remaining contractual maturities of the outstanding securities lending transactions are considered to be overnight and continuous and 2) the borrower, after notice, is required to return borrowed securities within the standard time period for settlement of securities transactions.
The Fund invests the cash collateral received in connection with securities lending transactions in the Goldman Sachs Financial Square Government Fund (“Government Money Market Fund”), an affiliated series of the Trust. The Government Money Market Fund is registered under the Act as an open end investment company, is subject to Rule 2a-7 under the Act, and is managed by GSAM, for which GSAM may receive a management fee of up to 0.205% on an annualized basis of the average daily net assets of the Government Money Market Fund.
In the event of a default by a borrower with respect to any loan, GSAL will exercise any and all remedies provided under the applicable borrower agreement to make the Fund whole. These remedies include purchasing replacement securities by applying the collateral held from the defaulting broker against the purchase cost of the replacement securities. If GSAL is unable to purchase replacement securities, GSAL will indemnify the Fund by paying the Fund an amount equal to the market value of the securities loaned minus the value of cash collateral received from the borrower for the loan, subject to an exclusion for any shortfalls resulting from a loss of value in such cash collateral due to reinvestment risk. The Fund’s loaned securities were all subject to enforceable Securities Lending Agreements and the value of the collateral was at least equal to the value of the cash received. The amounts of the Fund’s overnight and continuous agreements represent the gross amounts of recognized liabilities for securities lending transactions outstanding as of December 31, 2017 are disclosed as “Payable upon return of securities loaned” on the Statement of Assets and Liabilities, where applicable. The Fund did not have securities on loan as of December 31, 2017.
Both the Fund and GSAL received compensation relating to the lending of the Fund’s securities. The amounts earned, if any, by the Fund for the fiscal year ended December 31, 2017, are reported under Investment Income on the Statement of Operations.
The table below details securities lending activity with affiliates of Goldman Sachs:
| | | | | | | | |
| For the fiscal year ended December 31, 2017 | |
Earnings of GSAL
Relating to
Securities
Loaned | | Amount Received
by the Fund
from Lending to
Goldman Sachs | | | Amount Payable to
Goldman Sachs
Upon Return of
Securities Loaned as
of 12/31/17 | |
| $3,270 | | $ | 42 | | | $ | — | |
The following table provides information about the Fund’s investment in the Government Money Market Fund for the fiscal year ended December 31, 2017:
| | | | | | | | | | | | | | | | | | |
Beginning Value as of
December 31, 2016 | | | Purchases
at Cost | | | Proceeds
from Sales | | | Ending Value as of
December 31, 2017 | | | Shares as of
December 31, 2017 | |
| | $8,901,225 | | | $ | 247,002,600 | | | $ | (255,903,825 | ) | | $ | — | | | | — | |
20
GOLDMAN SACHS VARIABLE INSURANCE TRUST GLOBAL TRENDS ALLOCATION FUND
8. TAX INFORMATION
The tax character of distributions paid during the fiscal years ended December 31, 2016 and December 31, 2017 was as follows:
| | | | | | | | |
| | | 2016 | | | 2017 | |
| Distributions paid from: | | | | | | | | |
| Ordinary income | | $ | 992,661 | | | $ | 4,343,505 | |
| Net long-term capital gains | | | — | | | | 6,911,452 | |
| Total taxable distributions | | $ | 992,661 | | | $ | 11,254,957 | |
As of December 31, 2017, the components of accumulated earnings (losses) on a tax-basis were as follows:
| | | | |
| Undistributed ordinary income — net | | $ | 5,268,257 | |
| Undistributed long-term capital gains | | | 1,957,478 | |
| Total undistributed earnings | | $ | 7,225,735 | |
| Timing differences (Qualified Late Year Loss Deferral) | | $ | (24,600 | ) |
| Unrealized gains — net | | | 25,849,562 | |
| Total accumulated earnings | | $ | 33,050,697 | |
The Fund utilized $12,097,918 of capital loss carryforwards in the current fiscal year.
As of December 31, 2017, the Fund’s aggregate security unrealized gains and losses based on cost for U.S. federal income tax purposes were as follows:
| | | | |
| Tax cost | | $ | 341,928,880 | |
| Gross unrealized gain | | | 29,719,133 | |
| Gross unrealized loss | | | (3,869,571 | ) |
| Net unrealized gain | | $ | 25,849,562 | |
The difference between GAAP-basis and tax-basis unrealized gains (losses) is attributable primarily to wash sales and net mark to market gains (losses) on regulated futures contracts.
In order to present certain components of the Fund’s capital accounts on a tax-basis, the Fund has reclassified $374,105 of accumulated net realized gain to undistributed net investment income. These reclassifications have no impact on the NAV of the Fund and result primarily from differences in the tax treatment of foreign currency transactions.
GSAM has reviewed the Fund’s tax positions for all open tax years (the current and prior three years, as applicable) and has concluded that no provision for income tax is required in the Fund’s financial statements. Such open tax years remain subject to examination and adjustment by tax authorities.
9. OTHER RISKS
The Fund’s risks include, but are not limited to, the following:
Derivatives Risk — The Fund’s use of derivatives may result in loss. Derivative instruments, which may pose risks in addition to and greater than those associated with investing directly in securities, currencies or other instruments, may be illiquid or less liquid, volatile, difficult to price and leveraged so that small changes in the value of the underlying instruments may produce disproportionate losses to the Fund. Derivatives are also subject to counterparty risk, which is the risk that the other party in the transaction will not fulfill its contractual obligation. The use of derivatives is a highly specialized activity that involves investment
21
GOLDMAN SACHS VARIABLE INSURANCE TRUST GLOBAL TRENDS ALLOCATION FUND
Notes to Financial Statements (continued)
December 31, 2017
9. OTHER RISKS (continued)
techniques and risks different from those associated with investments in more traditional securities and instruments. Losses from derivatives can also result from a lack of correlation between changes in the value of derivative instruments and the portfolio assets (if any) being hedged.
Foreign and Emerging Countries Risk — Investing in foreign markets may involve special risks and considerations not typically associated with investing in the U.S. Foreign securities may be subject to risk of loss because of more or less foreign government regulation, less public information and less economic, political and social stability in the countries in which the Fund invests. The imposition of exchange controls (including repatriation restrictions), confiscations, trade restrictions (including tariffs) and other government restrictions by the U.S. or other governments, or from problems in share registration, settlement or custody, may also result in losses. Foreign risk also involves the risk of negative foreign currency rate fluctuations, which may cause the value of securities denominated in such foreign currency (or other instruments through which the Fund has exposure to foreign currencies) to decline in value. Currency exchange rates may fluctuate significantly over short periods of time. To the extent that the Fund also invests in securities of issuers located in emerging markets, these risks may be more pronounced.
Foreign Custody Risk — If the Fund invests in foreign securities, the Fund may hold such securities and cash with foreign banks, agents, and securities depositories appointed by the Fund’s custodian (each a “Foreign Custodian”). Some foreign custodians may be recently organized or new to the foreign custody business. In some countries, Foreign Custodians may be subject to little or no regulatory oversight over, or independent evaluation of, their operations. Further, the laws of certain countries may place limitations on the Fund’s ability to recover its assets if a Foreign Custodian enters bankruptcy. Investments in emerging markets may be subject to even greater custody risks than investments in more developed markets. Custody services in emerging market countries are very often undeveloped and may be considerably less well regulated than in more developed countries, and thus may not afford the same level of investor protection as would apply in developed countries.
Interest Rate Risk — When interest rates increase, fixed income securities or instruments held by the Fund will generally decline in value. Long-term fixed income securities or instruments will normally have more price volatility because of this risk than short-term fixed income securities or instruments. The risks associated with increasing rates are heightened given that interest rates are near historic lows, but may be expected to increase in the future with unpredictable effects on the markets and the Fund’s investments. Fluctuations in interest rates may also affect the liquidity of fixed income securities and instruments held by the Fund.
Investments in Other Investment Companies Risk — As a shareholder of another investment company, including an exchange-traded fund (“ETF”), the Fund will indirectly bear its proportionate share of any net management fees and other expenses paid by such other investment companies, in addition to the fees and expenses regularly borne by the Fund. ETFs are subject to risks that do not apply to conventional mutual funds, including but not limited to the following: (i) the market price of the ETF’s shares may trade at a premium or a discount to their NAV; and (ii) an active trading market for an ETF’s shares may not develop or be maintained.
Large Shareholder Transactions Risk — The Fund may experience adverse effects when certain large shareholders, such as other funds, participating insurance companies, accounts and Goldman Sachs affiliates, purchase or redeem large amounts of shares of the Fund. Such large shareholder redemptions may cause the Fund to sell portfolio securities at times when it would not otherwise do so, which may negatively impact the Fund’s NAV and liquidity. These transactions may also accelerate the realization of taxable income to shareholders if such sales of investments resulted in gains, and may also increase transaction costs. In addition, a large redemption could result in the Fund’s current expenses being allocated over a smaller asset base, leading to an increase in the Fund’s expense ratio. Similarly, large Fund share purchases may adversely affect the Fund’s performance to the extent that the Fund is delayed in investing new cash and is required to maintain a larger cash position than it ordinarily would.
Liquidity Risk — The Fund may make investments that are illiquid or that may become less liquid in response to market developments or adverse investor perceptions. Illiquid investments may be more difficult to value. Liquidity risk may also refer to the risk that the Fund will not be able to pay redemption proceeds within the allowable time period because of unusual market conditions, an unusually high volume of redemption requests, or other reasons. To meet redemption requests, the Fund may be
22
GOLDMAN SACHS VARIABLE INSURANCE TRUST GLOBAL TRENDS ALLOCATION FUND
9. OTHER RISKS (continued)
forced to sell investments at an unfavorable time and/or under unfavorable conditions. Liquidity risk may be the result of, among other things, the reduced number and capacity of traditional market participants to make a market in fixed income securities or the lack of an active market. The potential for liquidity risk may be magnified by a rising interest rate environment or other circumstances where investor redemptions from fixed income mutual funds may be higher than normal, potentially causing increased supply in the market due to selling activity.
Market and Credit Risks — In the normal course of business, the Fund trades financial instruments and enters into financial transactions where risk of potential loss exists due to changes in the market (market risk). Additionally, the Fund may also be exposed to credit risk in the event that an issuer or guarantor fails to perform or that an institution or entity with which the Fund has unsettled or open transactions defaults.
10. INDEMNIFICATIONS
Under the Trust’s organizational documents, its Trustees, officers, employees and agents are indemnified, to the extent permitted by the Act and state law, against certain liabilities that may arise out of performance of their duties to the Fund. Additionally, in the course of business, the Fund enters into contracts that contain a variety of indemnification clauses. The Fund’s maximum exposure under these arrangements is unknown, as this would involve future claims that may be made against the Fund that have not yet occurred. However, GSAM believes the risk of loss under these arrangements to be remote.
11. SUBSEQUENT EVENTS
Subsequent events after the Statement of Assets and Liabilities date have been evaluated, and GSAM has concluded that there is no impact requiring adjustment or disclosure in the financial statements.
12. SUMMARY OF SHARE TRANSACTIONS
Share activity is as follows:
| | | | | | | | | | | | | | | | |
| | | For the Fiscal Year Ended
December 31, 2017 | | | For the Fiscal Year Ended
December 31, 2016 | |
| | | Shares | | | Dollars | | | Shares | | | Dollars | |
| Institutional Shares | | | | | | | | | | | | | | | | |
| Reinvestment of distributions | | | 72 | | | $ | 901 | | | | 10 | | | $ | 119 | |
| Shares redeemed | | | — | | | | — | | | | (90,223 | ) | | | (961,682 | ) |
| | | | 72 | | | | 901 | | | | (90,213 | ) | | | (961,563 | ) |
| Service Shares | | | | | | | | | | | | | | | | |
| Shares sold | | | 3,237,201 | | | | 38,959,444 | | | | 5,287,482 | | | | 57,559,506 | |
| Reinvestment of distributions | | | 901,767 | | | | 11,254,056 | | | | 87,603 | | | | 992,542 | |
| Shares redeemed | | | (2,685,457 | ) | | | (32,234,857 | ) | | | (6,728,313 | ) | | | (73,917,831 | ) |
| | | | 1,453,511 | | | | 17,978,643 | | | | (1,353,228 | ) | | | (15,365,783 | ) |
| NET INCREASE (DECREASE) | | | 1,453,583 | | | $ | 17,979,544 | | | | (1,443,441 | ) | | $ | (16,327,346 | ) |
23
Report of Independent Registered Public Accounting Firm
To the Board of Trustees of
Goldman Sachs Variable Insurance Trust and Shareholders of the Goldman Sachs Global Trends Allocation Fund
Opinion on the Financial Statements
We have audited the accompanying statement of assets and liabilities, including the schedule of investments, of the Goldman Sachs Global Trends Allocation Fund (the “Fund”) as of December 31, 2017, the related statement of operations for the year ended December 31, 2017, the statements of changes in net assets for each of the two years in the period ended December 31, 2017, including the related notes, and the financial highlights for each of the periods indicated therein (collectively referred to as the “financial statements”). In our opinion, the financial statements present fairly, in all material respects, the financial position of the Fund as of December 31, 2017, the results of its operations for the year then ended, the changes in its net assets for each of the two years in the period ended December 31, 2017 and the financial highlights for each of the periods indicated therein in conformity with accounting principles generally accepted in the United States of America.
Basis for Opinion
These financial statements are the responsibility of the Fund’s management. Our responsibility is to express an opinion on the Fund’s financial statements based on our audits. We are a public accounting firm registered with the Public Company Accounting Oversight Board (United States) (“PCAOB”) and are required to be independent with respect to the Fund in accordance with the U.S. federal securities laws and the applicable rules and regulations of the Securities and Exchange Commission and the PCAOB.
We conducted our audits of these financial statements in accordance with the standards of the PCAOB. Those standards require that we plan and perform the audit to obtain reasonable assurance about whether the financial statements are free of material misstatement, whether due to error or fraud.
Our audits included performing procedures to assess the risks of material misstatement of the financial statements, whether due to error or fraud, and performing procedures that respond to those risks. Such procedures included examining, on a test basis, evidence regarding the amounts and disclosures in the financial statements. Our audits also included evaluating the accounting principles used and significant estimates made by management, as well as evaluating the overall presentation of the financial statements. Our procedures included confirmation of securities owned as of December 31, 2017 by correspondence with the custodian, transfer agent and brokers; when replies were not received from brokers, we performed other auditing procedures. We believe that our audits provide a reasonable basis for our opinion.
PricewaterhouseCoopers LLP
Boston, Massachusetts
February 14, 2018
We have served as the auditor of one or more investment companies in the Goldman Sachs Fund complex since 2000.
24
GOLDMAN SACHS VARIABLE INSURANCE TRUST GLOBAL TRENDS ALLOCATION FUND
| | |
| Fund Expenses — Period Ended December 31, 2017 (Unaudited) | | |
As a shareholder of Institutional or Service Shares of the Fund, you incur ongoing costs, including management fees, distribution and/or service (12b-1) fees (with respect to Service Shares) and other Fund expenses. This example is intended to help you understand your ongoing costs (in dollars) of investing in the Institutional Shares and Service Shares of the Fund and to compare these costs with the ongoing costs of investing in other mutual funds.
The example is based on an investment of $1,000 invested at the beginning of the period and held for the entire period from July 1, 2017 through December 31, 2017, which represents a period of 184 days of a 365 day year.
Actual Expenses — The first line under each share class in the table below provides information about actual account values and actual expenses. You may use the information in this line, together with the amount you invested, to estimate the expenses that you paid over the period. Simply divide your account value by $1,000 (for example, an $8,600 account value divided by $1,000=8.6), then multiply the result by the number in the first line under the heading entitled “Expenses Paid” to estimate the expenses you paid on your account during this period.
Hypothetical Example for Comparison Purposes — The second line under each share class in the table below provides information about hypothetical account values and hypothetical expenses based on the Fund’s actual net expense ratio and an assumed rate of return of 5% per year before expenses, which is not the Fund’s actual return. The hypothetical account values and expenses may not be used to estimate the actual ending account balance or expenses you paid for the period. You may use this information to compare the ongoing costs of investing in the Fund and other funds. To do so, compare this 5% hypothetical example with the 5% hypothetical examples that appear in the shareholder reports of the other funds.
Please note that the expenses shown in the table are meant to highlight your ongoing costs only. As a shareholder of the Fund, you do not incur any transaction costs, such as sales charges, redemption fees, or exchange fees, but shareholders of other funds may incur such costs. The second line of the table is useful in comparing ongoing costs only and will not help you determine the relative total costs of owning different funds whose shareholders may incur transaction costs.
| | | | | | | | | | | | |
| Share Class | | Beginning
Account Value 07/01/17 | | | Ending
Account Value 12/31/17 | | | Expenses Paid
for the
6 Months
Ended
12/31/17* | |
| Institutional | | | | | | | | | | | | |
| Actual | | $ | 1,000 | | | $ | 1,072.90 | | | $ | 3.34 | |
| Hypothetical 5% return | | | 1,000 | | | | 1,021.98 | + | | | 3.26 | |
| Service | | | | | | | | | | | | |
| Actual | | | 1,000 | | | | 1,072.40 | | | | 4.65 | |
| Hypothetical 5% return | | | 1,000 | | | | 1,020.72 | + | | | 4.53 | |
| | * | Expenses are calculated using the Fund’s annualized net expense ratio for each class, which represents the ongoing expenses as a percentage of net assets for the six months ended December 31, 2017. Expenses are calculated by multiplying the annualized net expense ratio by the average account value for the period; then multiplying the result by the number of days in the most recent fiscal half year; and then dividing that result by the number of days in the fiscal year. The annualized net expense ratios for the period were 0.64% and 0.89% for Institutional and Service Shares, respectively. | |
| | + | Hypothetical expenses are based on the Fund’s actual annualized net expense ratios and an assumed rate of return of 5% per year before expenses. | |
25
GOLDMAN SACHS VARIABLE INSURANCE TRUST GLOBAL TRENDS ALLOCATION FUND
Trustees and Officers (Unaudited)
Independent Trustees
| | | | | | | | | | |
| | | | | |
Name,
Address and Age1 | | Position(s) Held with the Trust | | Term of Office and
Length of
Time Served2 | | Principal Occupation(s) During Past 5 Years | | Number of
Portfolios in
Fund Complex
Overseen by
Trustee3 | | Other Directorships Held by Trustee4 |
Jessica Palmer Age: 68 | | Chair of the Board of Trustees | | 2018 (Trustee since 2007) | | Ms. Palmer is retired. She is Director, Emerson Center for the Arts and Culture (2011-Present); and was formerly a Consultant, Citigroup Human Resources Department (2007-2008); Managing Director, Citigroup Corporate and Investment Banking (previously, Salomon Smith Barney/Salomon Brothers) (1984-2006). Ms. Palmer was a Member of the Board of Trustees of Indian Mountain School (private elementary and secondary school) (2004-2009). Chair of the Board of Trustees — Goldman Sachs Trust and Goldman Sachs Variable Insurance Trust. | | 105 | | None |
Kathryn A. Cassidy Age: 63 | | Trustee | | Since 2015 | | Ms. Cassidy is retired. Formerly, she was Advisor to the Chairman (May 2014-December 2014); and Senior Vice President and Treasurer (2008-2014), General Electric Company & General Electric Capital Corporation (technology and financial services companies). Trustee — Goldman Sachs Trust and Goldman Sachs Variable Insurance Trust. | | 105 | | None |
Diana M. Daniels Age: 68 | | Trustee | | Since 2007 | | Ms. Daniels is retired. Formerly, she was Vice President, General Counsel and Secretary, The Washington Post Company (1991-2006). Ms. Daniels is a Trustee Emeritus and serves as a Presidential Councillor of Cornell University (2013-Present); former Member of the Legal Advisory Board, New York Stock Exchange (2003-2006) and of the Corporate Advisory Board, Standish Mellon Management Advisors (2006-2007). Trustee — Goldman Sachs Trust and Goldman Sachs Variable Insurance Trust. | | 105 | | None |
Herbert J. Markley Age: 67 | | Trustee | | Since 2013 | | Mr. Markley is retired. Formerly, he was Executive Vice President, Deere & Company (an agricultural and construction equipment manufacturer) (2007-2009); and President, Agricultural Division, Deere & Company (2001-2007). Previously, Mr. Markley served as an Advisory Board Member of Goldman Sachs Trust and Goldman Sachs Variable Insurance Trust (June 2013-October 2013). Trustee — Goldman Sachs Trust and Goldman Sachs Variable Insurance Trust. | | 105 | | None |
| | | | | | | | | | |
Roy W. Templin Age: 57 | | Trustee | | Since 2013 | | Mr. Templin is retired. He is Director, Armstrong World Industries, Inc. (a designer and manufacturer of ceiling, wall and suspension system solutions) (2016–Present); and was formerly Chairman of the Board of Directors, Con-Way Incorporated (a transportation, logistics and supply chain management service company) (2014-2015); Executive Vice President and Chief Financial Officer, Whirlpool Corporation (an appliance manufacturer and marketer) (2004-2012). Previously, Mr. Templin served as an Advisory Board Member of Goldman Sachs Trust and Goldman Sachs Variable Insurance Trust (June 2013-October 2013). Trustee — Goldman Sachs Trust and Goldman Sachs Variable Insurance Trust. | | 105 | | Armstrong World Industries, Inc. (a ceiling, wall and suspension systems solutions manufacturer) |
Gregory G. Weaver Age: 66 | | Trustee | | Since 2015 | | Mr. Weaver is retired. He is Director, Verizon Communications Inc. (2015-Present); and was formerly Chairman and Chief Executive Officer, Deloitte & Touche LLP (a professional services firm) (2001-2005 and 2012-2014); and Member of the Board of Directors, Deloitte & Touche LLP (2006-2012). Trustee — Goldman Sachs Trust and Goldman Sachs Variable Insurance Trust. | | 105 | | Verizon Communications Inc. |
| | | | | | | | | | |
26
GOLDMAN SACHS VARIABLE INSURANCE TRUST GLOBAL TRENDS ALLOCATION FUND
Trustees and Officers (Unaudited) (continued)
Interested Trustee*
| | | | | | | | | | |
| | | | | |
Name,
Address and Age1 | | Position(s) Held with the Trust | | Term of Office and
Length of
Time Served2 | | Principal Occupation(s) During Past 5 Years | | Number of
Portfolios in
Fund Complex
Overseen by
Trustee3 | | Other Directorships Held by Trustee4 |
James A. McNamara Age: 55 | | President and Trustee | | Since 2007 | | Managing Director, Goldman Sachs (January 2000-Present); Director of Institutional Fund Sales, GSAM (April 1998-December 2000); and Senior Vice President and Manager, Dreyfus Institutional Service Corporation (January 1993- April 1998). President and Trustee — Goldman Sachs Trust; Goldman Sachs Variable Insurance Trust; Goldman Sachs Trust II; Goldman Sachs MLP Income Opportunities Fund; Goldman Sachs MLP and Energy Renaissance Fund; Goldman Sachs ETF Trust; Goldman Sachs Private Markets Fund 2018 LLC; Goldman Sachs Private Markets Fund 2018 (A) LLC; and Goldman Sachs Private Markets Fund 2018 (B) LLC. | | 146 | | None |
| | | | | | | | | | |
| * | Mr. McNamara is considered to be an “Interested Trustee” because he holds positions with Goldman Sachs and owns securities issued by The Goldman Sachs Group, Inc. Mr. McNamara holds comparable positions with certain other companies of which Goldman Sachs, GSAM or an affiliate thereof is the investment adviser, administrator and/or distributor. |
| 1 | Each Trustee may be contacted by writing to the Trustee, c/o Goldman Sachs, 200 West Street, New York, New York, 10282, Attn: Caroline Kraus. Information is provided as of December 31, 2017. |
| 2 | Subject to such policies as may be adopted by the Board from time-to-time, each Trustee holds office for an indefinite term, until the earliest of: (a) the election of his or her successor; (b) the date the Trustee resigns or is removed by the Board or shareholders, in accordance with the Trust’s Declaration of Trust; or (c) the termination of the Trust. The Board has adopted policies which provide that (a) no Trustee shall hold office for more than 15 years and (b) a Trustee shall retire as of December 31st of the calendar year in which he or she reaches his or her 74th birthday, unless a waiver of such requirement shall have been adopted by a majority of the other Trustees. These policies may be changed by the Trustees without shareholder vote. |
| 3 | The Goldman Sachs Fund Complex includes certain other companies listed above for each respective Trustee. As of December 31, 2017, Goldman Sachs Trust consisted of 91 portfolios (90 of which offered shares to the public); Goldman Sachs Variable Insurance Trust consisted of 14 portfolios; Goldman Sachs Trust II consisted of 17 portfolios (16 of which offered shares to the public); Goldman Sachs BDC, Inc., Goldman Sachs Private Middle Market Credit LLC, Goldman Sachs MLP Income Opportunities Fund, Goldman Sachs MLP and Energy Renaissance Fund, Goldman Sachs Private Markets Fund 2018 LLC, Goldman Sachs Private Markets Fund 2018 (A) LLC and Goldman Sachs Private Markets Fund 2018 (B) LLC each consisted of one portfolio; and Goldman Sachs ETF Trust consisted of 19 portfolios (12 of which offered shares to the public). Goldman Sachs Private Middle Market Credit LLC, Goldman Sachs Private Markets Fund 2018 LLC, Goldman Sachs Private Markets Fund 2018 (A) LLC and Goldman Sachs Private Markets Fund 2018 (B) LLC do not offer shares to the public. |
| 4 | This column includes only directorships of companies required to report to the Securities and Exchange Commission under the Securities Exchange Act of 1934 (i.e., “public companies”) or other investment companies registered under the Act. |
Additional information about the Trustees is available in the Fund’s Statement of Additional Information, which can be obtained from Goldman Sachs free of charge by calling this toll-free number (in the United States of America): 1-800-526-7384.
27
GOLDMAN SACHS VARIABLE INSURANCE TRUST GLOBAL TRENDS ALLOCATION FUND
Trustees and Officers (Unaudited) (continued)
Officers of the Trust*
| | | | | | |
| | | |
| Name, Address and Age1 | | Position(s) Held with the Trust | | Term of
Office and
Length of
Time Served2 | | Principal Occupation(s) During Past 5 Years |
James A. McNamara 200 West Street New York, NY 10282 Age: 55 | | Trustee and President | | Since 2007 | | Managing Director, Goldman Sachs (January 2000-Present); Director of Institutional Fund Sales, GSAM (April 1998-December 2000); and Senior Vice President and Manager, Dreyfus Institutional Service Corporation (January 1993-April 1998). President and Trustee — Goldman Sachs Trust; Goldman Sachs Variable Insurance Trust; Goldman Sachs Trust II; Goldman Sachs MLP Income Opportunities Fund; Goldman Sachs MLP and Energy Renaissance Fund; Goldman Sachs ETF Trust; Goldman Sachs Private Markets Fund 2018 LLC; Goldman Sachs Private Markets Fund 2018 (A) LLC; and Goldman Sachs Private Markets Fund 2018 (B) LLC. |
Caroline L. Kraus 200 West Street New York, NY 10282 Age: 40 | | Secretary | | Since 2012 | | Managing Director, Goldman Sachs (January 2016-Present); Vice President, Goldman Sachs (August 2006-December 2015); Associate General Counsel, Goldman Sachs (2012-Present); Assistant General Counsel, Goldman Sachs (August 2006-December 2011); and Associate, Weil, Gotshal & Manges, LLP (2002-2006). Secretary — Goldman Sachs Trust (previously Assistant Secretary (2012)); Goldman Sachs Variable Insurance Trust (previously Assistant Secretary (2012)); Goldman Sachs Trust II; Goldman Sachs BDC, Inc.; Goldman Sachs Private Middle Market Credit LLC; Goldman Sachs Middle Market Lending Corp.; Goldman Sachs MLP Income Opportunities Fund; Goldman Sachs MLP and Energy Renaissance Fund; Goldman Sachs ETF Trust; Goldman Sachs Private Markets Fund 2018 LLC; Goldman Sachs Private Markets Fund 2018 (A) LLC; and Goldman Sachs Private Markets Fund 2018 (B) LLC. |
Scott M. McHugh 200 West Street New York, NY 10282 Age: 46 | | Treasurer, Senior Vice President and Principal Financial Officer | | Since 2009 (Principal Financial Officer since 2013) | | Managing Director, Goldman Sachs (January 2016-Present); Vice President, Goldman Sachs (February 2007-December 2015); Assistant Treasurer of certain mutual funds administered by DWS Scudder (2005-2007); and Director (2005-2007), Vice President (2000-2005), and Assistant Vice President (1998-2000), Deutsche Asset Management or its predecessor (1998-2007). Treasurer, Senior Vice President and Principal Financial Officer — Goldman Sachs Trust; Goldman Sachs Variable Insurance Trust; Goldman Sachs Trust II; Goldman Sachs MLP Income Opportunities Fund; Goldman Sachs MLP and Energy Renaissance Fund; Goldman Sachs ETF Trust; Goldman Sachs Private Markets Fund 2018 LLC; Goldman Sachs Private Markets Fund 2018 (A) LLC; and Goldman Sachs Private Markets Fund 2018 (B) LLC. |
Joseph F. DiMaria 30 Hudson Street Jersey City, NJ 07302 Age: 49 | | Assistant Treasurer and Principal Accounting Officer | | Since 2016 (Principal Accounting Officer since 2017) | | Managing Director, Goldman Sachs (November 2015-Present) and Vice President — Mutual Fund Administration, Columbia Management Investment Advisers, LLC (May 2010-October 2015). Assistant Treasurer and Principal Accounting Officer — Goldman Sachs Trust; Goldman Sachs Variable Insurance Trust; Goldman Sachs Trust II; Goldman Sachs MLP Income Opportunities Fund; Goldman Sachs MLP and Energy Renaissance Fund; Goldman Sachs ETF Trust; Goldman Sachs Private Markets Fund 2018 LLC; Goldman Sachs Private Markets Fund 2018 (A) LLC; and Goldman Sachs Private Markets Fund 2018 (B) LLC. |
| | | | | | |
| * | Represents a partial list of officers of the Trust. Additional information about all the officers is available in the Fund’s Statement of Additional Information, which can be obtained from Goldman Sachs free of charge by calling this toll-free number (in the United States): 1-800-526-7384. |
| 1 | Information is provided as of December 31, 2017. |
| 2 | Officers hold office at the pleasure of the Board of Trustees or until their successors are duly elected and qualified. Each officer holds comparable positions with certain other companies of which Goldman Sachs, GSAM or an affiliate thereof is the investment adviser, administrator and/or distributor. |
28
GOLDMAN SACHS VARIABLE INSURANCE TRUST GLOBAL TRENDS ALLOCATION FUND
Goldman Sachs Variable Insurance Trust — Tax Information (Unaudited)
For the year ended December 31, 2017, 38.10% of the dividends paid from net investment company taxable income by the Global Trends Allocation Fund qualify for the dividends received deduction available to corporations.
Pursuant to Section 852 of the Internal Revenue Code, the Global Trends Allocation Fund designates $6,911,452 or, if different, the maximum amount allowable, as capital gain dividends paid during the fiscal year ended December 31, 2017.
29
| | |
| TRUSTEES | | OFFICERS |
| Jessica Palmer, Chair | | James A. McNamara, President |
| Kathryn A. Cassidy | | Scott M. McHugh, Treasurer, Senior Vice |
| Diana M. Daniels | | President and Principal Financial Officer |
| Herbert J. Markley | | Joseph F. DiMaria, Assistant Treasurer and Principal Accounting Officer Caroline L. Kraus, Secretary |
| James A. McNamara | |
| Roy W. Templin | |
| Gregory G. Weaver | | |
GOLDMAN SACHS & CO. LLC
Distributor and Transfer Agent
GOLDMAN SACHS ASSET MANAGEMENT, L.P.
Investment Adviser
200 West Street, New York
New York 10282
Visit our web site at www.GSAMFUNDS.com to obtain the most recent month-end returns.
The reports concerning the Fund included in this shareholder report may contain certain forward-looking statements about the factors that may affect the performance of the Fund in the future. These statements are based on Fund management’s predictions and expectations concerning certain future events and their expected impact on the Fund, such as performance of the economy as a whole and of specific industry sectors, changes in the levels of interest rates, the impact of developing world events, and other factors that may influence the future performance of the Fund. Management believes these forward-looking statements to be reasonable, although they are inherently uncertain and difficult to predict. Actual events may cause adjustments in portfolio management strategies from those currently expected to be employed.
A description of the policies and procedures that the Fund uses to determine how to vote proxies relating to portfolio securities and information regarding how the Fund voted proxies relating to portfolio securities for the 12-month period ended December 31 is available (i) without charge, upon request by calling 1-800-621-2550; and (ii) on the Securities and Exchange Commission (“SEC”) web site at http://www.sec.gov.
The Fund files its complete schedule of portfolio holdings with the SEC for the first and third quarters of each fiscal year on Form N-Q. The Fund’s Forms N-Q are available on the SEC’s web site at http://www.sec.gov within 60 days after the Fund’s first and third fiscal quarters. The Fund’s Forms N-Q may be reviewed and copied at the SEC’s Public Reference Room in Washington, D.C. and information on the operation of the Public Reference Room may also be obtained by calling 1-800-SEC-0330. Forms N-Q may be obtained upon request and without charge by calling 1-800-621-2550.
Views and opinions expressed are for informational purposes only and do not constitute a recommendation by GSAM to buy, sell, or hold any security. Views and opinions are current as of the date of this presentation and may be subject to change, they should not be construed as investment advice.
Goldman Sachs & Co. LLC (“Goldman Sachs”) does not provide legal, tax or accounting advice. Any statement contained in this communication (including any attachments) concerning U.S. tax matters was not intended or written to be used, and cannot be used, for the purpose of avoiding penalties under the Internal Revenue Code, and was written to support the promotion or marketing of transaction or matter addressed. Clients of Goldman Sachs should obtain their own independent tax advice based on their particular circumstances.
The website links provided are for your convenience only and are not an endorsement or recommendation by GSAM of any of these websites or the products or services offered. GSAM is not responsible for the accuracy and validity of the content of these websites.
Fund holdings and allocations shown are as of December 31, 2017 and may not be representative of future investments. Fund holdings should not be relied on in making investment decisions and should not be construed as research or investment advice regarding particular securities. Current and future holdings are subject to risk.
References to indices, benchmarks or other measures of relative market performance over a specified period of time are provided for your information only and do not imply that the portfolio will achieve similar results. The index composition may not reflect the manner in which a portfolio is constructed. While an adviser seeks to design a portfolio which reflects appropriate risk and return features, portfolio characteristics may deviate from those of the benchmark.
The portfolio risk management process includes an effort to monitor and manage risk, but does not imply low risk.
Shares of the Goldman Sachs VIT Funds are offered to separate accounts of participating life insurance companies for the purpose of funding variable annuity contracts and variable life insurance policies. Shares of the Fund are not offered directly to the general public. The variable annuity contracts and variable life insurance policies are described in the separate prospectuses issued by participating insurance companies. You should refer to those prospectuses for information about surrender charges, mortality and expense risk fees and other charges that may be assessed by participating insurance companies under the variable annuity contracts or variable life insurance policies. Such fees or charges, if any, may affect the return you may realize with respect to your investments. Ask your representative for more complete information. Please consider a fund’s objectives, risks and charges and expenses, and read the prospectus carefully before investing. The prospectus contains this and other information about the Fund.
This material is not authorized for distribution to prospective investors unless preceded or accompanied by a current prospectus or summary prospectus, if applicable. Investors should consider the Fund’s objective, risks, and charges and expenses, and read the summary prospectus, if available, and/or the prospectus carefully before investing or sending money. The summary prospectus, if available, and the prospectus contain this and other information about the Fund and may be obtained from your authorized dealer or from Goldman Sachs & Co. LLC by calling 1-800-621-2550.
THIS MATERIAL IS FOR INFORMATIONAL PURPOSES ONLY AND IS PROVIDED SOLELY ON THE BASIS THAT IT WILL NOT CONSTITUTE INVESTMENT OR OTHER ADVICE OR A RECOMMENDATION RELATING TO ANY PERSON’S OR PLAN’S INVESTMENT OR OTHER DECISIONS, AND GOLDMAN SACHS IS NOT A FIDUCIARY OR ADVISOR WITH RESPECT TO ANY PERSON OR PLAN BY REASON OF PROVIDING THE MATERIAL OR CONTENT HEREIN INCLUDING UNDER THE EMPLOYEE RETIREMENT INCOME SECURITY ACT OF 1974 OR DEPARTMENT OF LABOR REGULATIONS. PLAN SPONSORS AND OTHER FIDUCIARIES SHOULD CONSIDER THEIR OWN CIRCUMSTANCES IN ASSESSING ANY POTENTIAL COURSE OF ACTION.
This report is prepared for the general information of contract owners and is not an offer of shares of the Goldman Sachs Variable Insurance Trust — Goldman Sachs Global Trends Allocation Fund.
© 2018 Goldman Sachs. All rights reserved.
VITNAVAR-18/119298-OTU-698863/12.4K
Goldman
Sachs Variable Insurance Trust
Goldman Sachs
Large Cap Value Fund
Annual Report
December 31, 2017

GOLDMAN SACHS VARIABLE INSURANCE TRUST LARGE CAP VALUE FUND
INVESTMENT OBJECTIVE
The Fund seeks long-term capital appreciation.
Portfolio Management Discussion and Analysis
Below, the Goldman Sachs Value Portfolio Management Team discusses the Goldman Sachs Variable Insurance Trust — Goldman Sachs Large Cap Value Fund’s (the “Fund”) performance and positioning for the 12-month period ended December 31, 2017 (the “Reporting Period”).
How did the Fund perform during the Reporting Period?
During the Reporting Period, the Fund’s Institutional and Service Shares generated average annual total returns of 9.85% and 9.56%, respectively. These returns compare to the 13.66% average annual total return of the Fund’s benchmark, the Russell 1000® Value Index (with dividends reinvested) (the “Russell Index”) during the same time period.
What economic and market factors most influenced the equity markets as a whole during the Reporting Period?
Representing the U.S. equity market, the S&P 500® Index gained 21.83% during the Reporting Period. It was a banner year for U.S. equities, with the S&P 500® Index advancing for 12 consecutive months in 2017, a feat that had previously never been accomplished in a single calendar year. Overall, stocks were boosted by a combination of accelerating economic growth, rising corporate earnings and a general lack of negative financial headlines. U.S. equity market volatility was at historic lows.
U.S. equities rallied to new highs at the start of 2017 on prospects of deregulation, tax reform and infrastructure spending as well as on stronger economic data. In March 2017, the U.S. Federal Reserve (the “Fed”) raised interest rates for the third time since the 2008 global financial crisis, which was met with dovish market reaction. (Dovish tends to suggest lower interest rates; opposite of hawkish.) U.S. equities were virtually flat, albeit positive, in March 2017 and then continued to climb higher in April 2017 on strong earnings results and receding European political risk. Although the labor market remained strong, economic activity and inflation moderated during the second calendar quarter. In the third calendar quarter, U.S. economic activity and labor market data showed consistent strength, with a reversal of five consecutive downside inflation surprises. Progress on tax reform and strong economic activity data remained supportive for U.S. equities in October and November 2017. The Fed delivered the third rate hike of 2017 in December as had been widely expected, having done similarly in June 2017, and maintained its projections for three additional interest rate hikes in 2018. U.S. equities gained additional momentum toward the end of the Reporting Period from the passage of a tax reform bill that reduced the corporate tax rate from 35% to 21%. The fourth quarter of 2017 marked the ninth consecutive quarter of positive returns for the S&P 500® Index, its strongest quarterly advance in four years.
For the Reporting Period overall, information technology, materials and consumer discretionary were the best performing sectors in the S&P 500 Index, as measured by total return. The weakest performing sectors in the S&P 500 Index were telecommunication services and energy, the only two to post negative absolute returns, followed by real estate, which was comparatively weak but generated a positive return during the Reporting Period.
Within the U.S. equity market, there was significant disparity in performance not only among sectors but also among the various capitalization and style segments. While all capitalization segments posted positive returns, large-cap stocks, as measured by the Russell 1000® Index, performed best, followed by mid-cap stocks, as measured by the Russell Midcap® Index, and then at some distance by small-cap stocks, as measured by the Russell 2000® Index. From a style perspective, growth-oriented stocks significantly outpaced value-oriented stocks across the capitalization spectrum. (All as measured by the Russell Investments indices.)
What key factors were responsible for the Fund’s performance during the Reporting Period?
While the Fund posted solid absolute gains, it underperformed the Russell Index during the Reporting Period due primarily to stock selection overall. Sector allocation as a whole contributed positively, albeit modestly, to the Fund’s performance relative to the Russell Index during the Reporting Period.
Which equity market sectors most significantly affected Fund performance?
Stock selection in the industrials, consumer discretionary and energy sectors detracted most from the Fund’s relative results. Only partially offsetting these detractors was stock selection in the information technology and financials sectors, which detracted. Having an overweighted allocation to the health care sector, which outpaced the Russell Index during the Period, also helped.
1
GOLDMAN SACHS VARIABLE INSURANCE TRUST LARGE CAP VALUE FUND
Which stocks detracted significantly from the Fund’s performance during the Reporting Period?
Detracting most from the Fund’s results relative to the Russell Index were positions in General Electric, Southwestern Energy and Allergan.
General Electric, a technology, industrial and financial conglomerate, was the top detractor from the Fund’s relative results during the Reporting Period. During the summer of 2017, the stock began to falter with the transition of its Chief Executive Officer (“CEO”) and Chairman. In November 2017, the newly appointed CEO, John Flannery, announced his restructure and financial framework, which resulted in a negative response from the market and an immediate hit to the stock. In addition to cutting its dividend by 50%, General Electric plans to increase its cost reduction target to restructure its capital allocation framework. The company intends on becoming a smaller company by focusing on its core businesses of aviation, health care and power, which currently account for the majority of operating profit. In streamlining its portfolio, the company intends to sell or spin off approximately $20 billion worth of assets over the next one to two years. While we believe the stock could provide optionality in the longer term, we also believed there were better risk/reward opportunities and subsequently exited the Fund’s position in General Electric. (In business, optionality is the value of additional optional investment opportunities available only after having made an initial investment.)
Southwestern Energy is a natural gas-focused exploration and production company. In 2017, the natural gas market was challenged, and such volatility plagued Southwestern Energy’s stock. Toward the end of the Reporting Period, its stock began to rebound, paralleling the positive pricing trends of oil and natural gas. At the end of the Reporting Period, we believed accelerating natural gas demand and lower inventories that were in line with five-year averages could drive higher natural gas prices in 2018 across the industry. Particular to Southwestern Energy, we were positive on the steps its management was taking to introduce new, more efficient drilling and completion technologies. In our view, the company continued to drive better capital efficiency, reduce costs and improve its balance sheet. Going forward, we continue to see upside potential for Southwestern Energy given what we view as the company’s attractive valuation among peers and its high quality, not fully-priced, assets in the Marcellus, Fayetteville and Utica Shales.
Allergan is a specialty pharmaceutical company. Early in the Reporting Period, its stock oscillated based on the market’s reactions to fiscal year guidance and on timing of contributions from pipeline drugs. In the third quarter of 2017, its stock was affected by the market’s negative reaction to a patent extension of Restasis, an agent to treat chronic dry eye. Ultimately, the extension was revoked, thus exposing the drug to the generic space when the patent expires in 2018. The market reacted negatively to the patent invalidation, as it is expected to impact earnings growth in 2018. Despite these near-term headwinds, we believed at the end of the Reporting Period that the market was significantly undervaluing what we see as Allergan’s strong aesthetics business, which has high barriers to entry and high return on invested capital. (Aesthetic medicine is an inclusive term for specialties that focus on improving cosmetic appearance through the treatment of conditions including scars, skin laxity, wrinkles, moles, liver spots, excess fat, cellulite, unwanted hair, skin discoloration and spider veins.) Additionally, excluding the Restasis impact in 2018, Allergan continued to be one of the fastest growing large-cap biopharmaceutical companies. In our view, Allergan’s strong aesthetics business, revenue growth profile and free cash flow generation make it one of the more attractive companies of its kind.
What were some of the Fund’s best-performing individual stocks?
Relative to the Russell Index, the Fund benefited most from positions in U.S.-based pharmaceutical company Vertex Pharmaceuticals, banking and financial services company Bank of America and health care company Abbott Laboratories.
Vertex Pharmaceuticals is primarily focused on treatments for cystic fibrosis. Its shares rose sharply in March 2017 after the company reported positive test results from one of its next-generation cystic fibrosis pipeline drugs. Its share price strengthened again in July 2017 following the successful outcome of a triple-drug combination aimed at improving lung function in patients with cystic fibrosis. In our view at the end of the Reporting Period, Vertex Pharmaceuticals’ strategy of bolstering the efficiency of its existing medicines, while developing a pipeline of assets to penetrate a larger population of patients is a strategy that we believe may generate compelling long-term shareholder value.
Bank of America’s stock performed well through most of the Reporting Period. Its stock particularly rose in October 2017 after the company reported third quarter 2017 results that beat consensus expectations, driven primarily by operating expense discipline and a benign credit environment. At the end of the Reporting Period, we remained positive on what we viewed as Bank of America’s solid banking fundamentals, healthy loan prospects and strong capital positioning. Additionally, we believed Bank of America was well positioned to capitalize on rising interest rates and potential easing of bank regulations.
2
GOLDMAN SACHS VARIABLE INSURANCE TRUST LARGE CAP VALUE FUND
Abbott Laboratories is a diversified medical devices business that focuses on diagnostics, devices, nutrition and established pharmaceuticals. Following a year of earnings misses, its stock executed well on earnings reports released in 2017. Its strong performance was also driven by its January 2017 acquisition and ongoing integration of St. Jude Medical, which we believe could continue to accelerate organic growth in 2018. The company also closed its acquisition of Alere in 2017. We believe synergies associated with these acquisitions could further expand operating margins. While the stock had solid performance and a strong organic growth profile during the Reporting Period, it still traded at a discount relative to its peers. Overall, at the end of the Reporting Period, we believed Abbott Laboratories remained an attractive investment with stable free cash flow and solid organic operating leverage.
How did the Fund use derivatives and similar instruments during the Reporting Period?
During the Reporting Period, we did not use derivatives.
Did the Fund make any significant purchases or sales during the Reporting Period?
During the Reporting Period, we initiated a Fund position in AT&T, a multinational telecommunications company. While the telecommunications industry has been squeezed by competition to consolidate and offer bundled content, we believe AT&T is a leader in the industry. We purchased the stock for the Fund during what we believe is a transition period, as the company cleans up its less profitable businesses in favor of more revenue-generating segments. Following the dissolution of the Sprint/T-Mobile deal, we believe AT&T is relatively well positioned, especially with its rather newly acquired content of DirecTV and Time Warner Cable. Likewise, we believe the company could be a potential beneficiary of U.S. tax reform.
While the Fund has owned DuPont for some time, during the Reporting Period, we established a Fund position in the newly-merged company DowDuPont. DuPont had been subject to scrutiny regarding what many analysts considered to be its bloated overhead cost structure and below peer segment margins. However, with the appointment of Ed Breen to CEO of the merged company, we believe these matters will finally be addressed. In our view, Breen is committed to improving working capital, reducing capital expenditures and introducing a higher level of rigor into the decision-making process. We further believe that synergies associated with the consolidated businesses will likely account for some of its cost savings opportunities.
Conversely, we exited the Fund’s position in Verizon Communications, a leading provider of wireless telecommunications in the U.S., after the company began offering an unlimited plan to its mobile subscribers, which reduced our long-range forecasts for revenue growth for the company. Additionally, with consolidation within cable and wireless operators accelerating, we believed there was heightened risk around Verizon Communications overpaying for an acquisition. With these two risks introduced, we believed the stock was no longer attractively valued and sold the position in favor of other names with what we considered to have greater risk-adjusted upside potential.
We eliminated the Fund’s position in American Express, a global financial services corporation. We had originally initiated the position because we believed concerns regarding credit and longer-term secular headwinds were overblown, leading to an excessively depressed valuation. While, at the end of the Reporting Period, we continued to view American Express as a high quality company with good long-term growth potential, the stock approached our price target after reporting strong first quarter 2017 results, and so we exited the position in favor of what we believed were more compelling investment opportunities.
Were there any notable changes in the Fund’s weightings during the Reporting Period?
In constructing the Fund’s portfolio, we focus on picking stocks rather than on making industry or sector bets. We seek to outpace the benchmark index by overweighting stocks that we expect to outperform and underweighting those that we think may lag. Consequently, changes in its sector weights are generally the direct result of individual stock selection or of stock appreciation or depreciation. That said, during the Reporting Period, the Fund’s exposure compared to the Russell Index to consumer discretionary, information technology and materials increased as did the Fund’s position in cash. The Fund’s allocations compared to the Russell Index in financials, real estate and utilities decreased.
How was the Fund positioned relative to its benchmark index at the end of the Reporting Period?
At the end of December 2017, the Fund had overweighted positions relative to the Russell Index in the consumer discretionary, information technology, health care, materials, telecommunication services and industrials sectors. On the same date, the Fund had underweighted positions compared to the Russell Index in real estate, financials and consumer staples and was rather neutrally weighted to the Russell Index in energy. The Fund had no exposure to the utilities sector at the end of the Reporting Period.
3
GOLDMAN SACHS VARIABLE INSURANCE TRUST LARGE CAP VALUE FUND
What is the Fund’s tactical view and strategy for the months ahead?
At the end of the Reporting Period, we were cautiously optimistic that the robust macroeconomic backdrop and strong corporate earnings trend could continue to drive positive economic growth. In addition to stimulating fiscal policy, including increased spending and a less restrictive regulatory environment, we believe many companies could potentially benefit from the reduction of corporate taxes by virtue of U.S. tax reform. All else being equal, we believe broadening global economic growth should be supportive of a continuation in corporate earnings growth and equity market appreciation. While our market return expectations remained relatively muted given what we perceive to be extended valuations at the end of the Reporting Period, we still believed U.S. equities remained more attractive than most other asset classes. Additionally, after several years of thematic-driven markets, we were positive at the end of the Reporting Period about lower correlations at the stock levels. We believe an active approach will likely continue to benefit in this type of environment.
Regardless of market direction, our fundamental, bottom-up stock selection continues to drive our process, rather than headlines or sentiment. We maintain high conviction in the companies the Fund owns and believe they have the potential to outperform relative to the broader market regardless of economic growth conditions. We continue to focus on undervalued companies that we believe have comparatively greater control of their own destiny, such as innovators with differentiated products, companies with low cost structures or companies that have been investing in their own businesses and may be poised to gain market share. We maintain our discipline in identifying companies with what we believe to be strong or improving balance sheets, led by quality management teams and trading at discounted valuations. We remain focused on the long-term performance of the Fund.
4
GOLDMAN SACHS VARIABLE INSURANCE TRUST LARGE CAP VALUE FUND
Index Definitions
The Russell 1000® Value Index (with dividends reinvested) is an unmanaged market capitalization weighted index of the 1000 largest U.S. companies with lower price-to-book ratios and lower forecasted growth values. The figures for the index do not include any deduction for fees, expenses or taxes. It is not possible to invest directly in an index.
The Russell 2000® Index (with dividends reinvested) is an unmanaged index of common stock prices that measures the performance of the 2000 smallest companies in the Russell 3000® Index. The figures for the index do not include any deduction for fees, expenses or taxes. It is not possible to invest directly in an index.
The S&P 500® Index (with dividends reinvested) is the Standard & Poor’s composite index of 500 stocks, an unmanaged index of common stock prices. The figures for the index do not include any deduction for fees, expenses or taxes. It is not possible to invest directly in an index.
The Russell Midcap® Index measures the performance of the 800 smallest companies in the Russell 1000® Index, which represents approximately 25% of the total market capitalization of the Russell 1000 Index. It is not possible to invest directly in an index.
The Russell 1000® Index measures the performance of the 1,000 largest companies in the Russell 3000® Index, which represents approximately 92% of the total market capitalization of the Russell 3000® Index. It is not possible to invest directly in an index.
5
FUND BASICS
Large Cap Value Fund
as of December 31, 2017
STANDARDIZED TOTAL RETURNS1
| | | | | | | | | | | | | | | | | | |
| For the period ended 12/31/17 | | One Year | | | Five Years | | | Ten Years | | | Since Inception | | | Inception Date |
| Institutional | | | 9.85 | % | | | 12.00 | % | | | 5.33 | % | | | 5.17 | % | | 1/12/98 |
| Service | | | 9.56 | | | | 11.73 | | | | 5.10 | | | | 4.47 | | | 7/24/07 |
| 1 | The Standardized Total Returns are average annual total returns as of the most recent calendar quarter-end. They assume reinvestment of all distributions at net asset value (“NAV”). Because Institutional Shares and Service Shares do not involve a sales charge, such a charge is not applied to their Standardized Total Returns. |
Total return figures in the above chart represent past performance and do not indicate future results, which will vary. The investment return and principal value of an investment will fluctuate and, therefore, an investor’s shares, when redeemed, may be worth more or less than their original cost. Current performance may be lower or higher than the total return figures in the above chart. Please visit www.GSAMFUNDS.com to obtain the most recent month-end returns. Performance reflects fee waivers and/or expense limitations in effect during the periods shown. In their absence, performance would be reduced.
EXPENSE RATIOS2
| | | | | | | | |
| | | Net Expense Ratio (Current) | | | Gross Expense Ratio (Before Waivers) | |
| Institutional | | | 0.71 | % | | | 0.81 | % |
| Service | | | 0.96 | | | | 1.06 | |
| 2 | The expense ratios of the Fund, both current (net of any fee waivers and/or expense limitations) and before waivers (gross of any fee waivers and/or expense limitations) are as set forth above according to the most recent publicly available Prospectuses for the Fund and may differ from the expense ratios disclosed in the Financial Highlights in this report. Pursuant to a contractual arrangement, the Fund’s fee waivers and/or expense limitations will remain in place through at least April 28, 2018, and prior to such date, the Investment Adviser may not terminate the arrangements without the approval of the Fund’s Board of Trustees. If these arrangements are discontinued in the future, the expense ratios may change without shareholder approval. |
TOP TEN HOLDINGS AS OF 12/31/173
| | | | | | |
| Holding | | % of Net Assets | | | Line of Business |
| Bank of America Corp. | | | 4.9% | | | Banks |
| Wells Fargo & Co. | | | 4.8 | | | Banks |
| AT&T, Inc. | | | 4.3 | | | Telecommunication Services |
| Pfizer, Inc. | | | 3.0 | | | Pharmaceuticals, Biotechnology & Life Sciences |
| Lowe’s Cos., Inc. | | | 2.8 | | | Retailing |
| Exxon Mobil Corp. | | | 2.8 | | | Energy |
| Procter & Gamble Co. (The) | | | 2.7 | | | Household & Personal Products |
| DowDuPont, Inc. | | | 2.7 | | | Materials |
| MetLife, Inc. | | | 2.5 | | | Insurance |
| JPMorgan Chase & Co. | | | 2.4 | | | Banks |
| 3 | The top 10 holdings may not be representative of the Fund’s future investments. |
6
FUND BASICS
FUND vs. BENCHMARK SECTOR ALLOCATIONS4
As of December 31, 2017
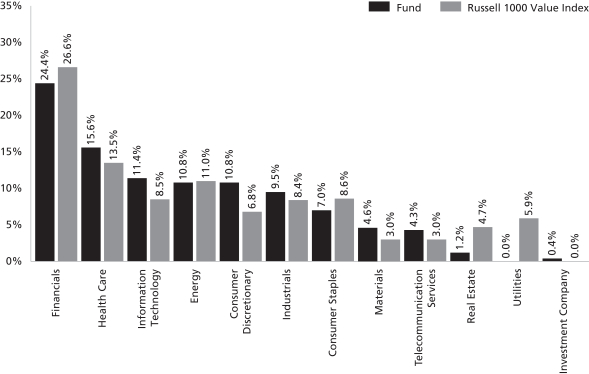
| 4 | The Fund is actively managed and, as such, its composition may differ over time. Consequently, the Fund’s overall sector allocations may differ from percentages contained in the graph above. The graph categorizes investments using Global Industry Classification Standard (“GICS”), however, the sector classifications used by the portfolio management team may differ from GICS. The percentage shown for each investment category reflects the value of investments in that category as a percentage of market value. Underlying sector allocations of exchange traded funds and investment companies held by the Fund are not reflected in the graph above. |
7
GOLDMAN SACHS VARIABLE INSURANCE TRUST LARGE CAP VALUE FUND
Performance Summary
December 31, 2017
The following graph shows the value, as of December 31, 2017, of a $10,000 investment made on January 1, 2008 in Service Shares at NAV. For comparative purposes, the performance of the Fund’s benchmark, the Russell 1000® Value Index (with distributions reinvested), is shown. This performance data represents past performance and should not be considered indicative of future performance, which will fluctuate with changes in market conditions. These performance fluctuations may cause an investor’s shares, when redeemed, to be worth more or less than their original cost. Performance reflects Fund level expenses but does not reflect fees and expenses associated with any variable annuity contract or variable life insurance policy that uses the Fund as an investment option for any contract or policy. Had performance reflected all of those fees and expenses, performance would have been reduced. Performance reflects applicable fee waivers and/or expense limitations in effect during the periods shown, and in their absence, performance would be reduced. Performance of Institutional Shares will vary from Service Shares due to differences in class specific fees. In addition to the Investment Adviser’s decisions regarding issuer/industry investment selection and allocation, other factors may affect Fund performance. These factors include, but are not limited to, Fund operating fees and expenses, portfolio turnover, and subscription and redemption cash flows affecting the Fund.
Large Cap Value Fund’s 10 Year Performance
Performance of a $10,000 investment, with distributions reinvested, from January 1, 2008 through December 31, 2017.
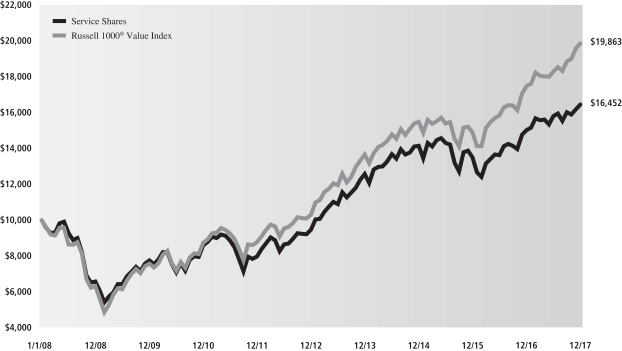
| | | | | | | | |
| Average Annual Total Return through December 31, 2017 | | One Year | | Five Years | | Ten Years | | Since Inception |
Institutional (Commenced January 12, 1998) | | 9.85% | | 12.00% | | 5.33% | | 5.17% |
Service (Commenced July 24, 2007) | | 9.56% | | 11.73% | | 5.10% | | 4.47% |
8
GOLDMAN SACHS VARIABLE INSURANCE TRUST LARGE CAP VALUE FUND
Schedule of Investments
December 31, 2017
| | | | | | | | |
| Shares | | | Description | | Value | |
| | Common Stocks – 98.0% | |
| | Automobiles & Components – 0.9% | |
| | 121,528 | | | Volkswagen AG ADR | | $ | 4,913,985 | |
| | |
| | Banks – 15.1% | |
| | 908,781 | | | Bank of America Corp. | | | 26,827,215 | |
| | 297,214 | | | Citizens Financial Group, Inc. | | | 12,477,044 | |
| | 206,445 | | | First Horizon National Corp. | | | 4,126,836 | |
| | 120,780 | | | JPMorgan Chase & Co. | | | 12,916,213 | |
| | 433,306 | | | Wells Fargo & Co. | | | 26,288,675 | |
| | | | | | | | |
| | | | | | | 82,635,983 | |
| | |
| | Capital Goods – 6.4% | |
| | 69,559 | | | Eaton Corp. plc | | | 5,495,857 | |
| | 31,329 | | | Hubbell, Inc. | | | 4,240,067 | |
| | 73,165 | | | ITT, Inc. | | | 3,904,816 | |
| | 97,994 | | | Textron, Inc. | | | 5,545,480 | |
| | 78,870 | | | United Technologies Corp. | | | 10,061,446 | |
| | 71,161 | | | Wabtec Corp. | | | 5,794,640 | |
| | | | | | | | |
| | | | | | | 35,042,306 | |
| | |
| | Consumer Durables & Apparel – 1.0% | |
| | 98,061 | | | Brunswick Corp. | | | 5,414,928 | |
| | |
| | Diversified Financials – 5.1% | |
| | 174,148 | | | Bank of New York Mellon Corp. (The) | | | 9,379,611 | |
| | 73,245 | | | Discover Financial Services | | | 5,634,006 | |
| | 85,643 | | | Northern Trust Corp. | | | 8,554,879 | |
| | 356,629 | | | SLM Corp.* | | | 4,029,908 | |
| | | | | | | | |
| | | | | | | 27,598,404 | |
| | |
| | Energy – 10.7% | |
| | 161,495 | | | Anadarko Petroleum Corp. | | | 8,662,592 | |
| | 168,545 | | | BP plc ADR | | | 7,083,946 | |
| | 131,556 | | | ConocoPhillips | | | 7,221,109 | |
| | 99,902 | | | Devon Energy Corp. | | | 4,135,943 | |
| | 180,575 | | | Exxon Mobil Corp. | | | 15,103,293 | |
| | 69,437 | | | Pioneer Natural Resources Co. | | | 12,002,185 | |
| | 757,056 | | | Southwestern Energy Co.* | | | 4,224,373 | |
| | | | | | | | |
| | | | | | | 58,433,441 | |
| | |
| | Food & Staples Retailing – 0.5% | |
| | 100,685 | | | Kroger Co. (The) | | | 2,763,803 | |
| | |
| | Food, Beverage & Tobacco – 3.6% | |
| | 61,626 | | | British American Tobacco plc ADR | | | 4,128,326 | |
| | 150,373 | | | Conagra Brands, Inc. | | | 5,664,551 | |
| | 56,690 | | | Molson Coors Brewing Co. Class B | | | 4,652,548 | |
| | 124,961 | | | Mondelez International, Inc. Class A | | | 5,348,331 | |
| | | | | | | | |
| | | | | | | 19,793,756 | |
| | |
| | Health Care Equipment & Services – 5.1% | |
| | 32,355 | | | Aetna, Inc. | | | 5,836,518 | |
| | 150,885 | | | Medtronic plc | | | 12,183,964 | |
| | 80,994 | | | Zimmer Biomet Holdings, Inc. | | | 9,773,546 | |
| | | | | | | | |
| | | | | | | 27,794,028 | |
| | |
| | Common Stocks – (continued) | |
| | Household & Personal Products – 2.7% | |
| | 161,897 | | | Procter & Gamble Co. (The) | | $ | 14,875,096 | |
| | |
| | Insurance – 3.8% | |
| | 125,736 | | | American International Group, Inc. | | | 7,491,351 | |
| | 265,380 | | | MetLife, Inc. | | | 13,417,613 | |
| | | | | | | | |
| | | | | | | 20,908,964 | |
| | |
| | Materials – 4.5% | |
| | 208,257 | | | DowDuPont, Inc. | | | 14,832,063 | |
| | 157,669 | | | Nucor Corp. | | | 10,024,595 | |
| | | | | | | | |
| | | | | | | 24,856,658 | |
| | |
| | Media – 2.7% | |
| | 295,062 | | | Comcast Corp. Class A | | | 11,817,233 | |
| | 64,596 | | | DISH Network Corp. Class A* | | | 3,084,459 | |
| | | | | | | | |
| | | | | | | 14,901,692 | |
| | |
| | Pharmaceuticals, Biotechnology & Life Sciences – 10.2% | |
| | 38,528 | | | Allergan plc | | | 6,302,410 | |
| | 51,998 | | | BioMarin Pharmaceutical, Inc.* | | | 4,636,662 | |
| | 100,041 | | | Bristol-Myers Squibb Co. | | | 6,130,512 | |
| | 40,550 | | | Celgene Corp.* | | | 4,231,798 | |
| | 78,565 | | | Johnson & Johnson | | | 10,977,102 | |
| | 454,777 | | | Pfizer, Inc. | | | 16,472,023 | |
| | 27,057 | | | Shire plc ADR | | | 4,197,082 | |
| | 20,116 | | | Vertex Pharmaceuticals, Inc.* | | | 3,014,584 | |
| | | | | | | | |
| | | | | | | 55,962,173 | |
| | |
| | Real Estate Investment Trusts – 1.2% | |
| | 35,693 | | | AvalonBay Communities, Inc. | | | 6,367,988 | |
| | |
| | Retailing – 6.0% | |
| | 76,878 | | | Expedia, Inc. | | | 9,207,678 | |
| | 163,832 | | | Lowe’s Cos., Inc. | | | 15,226,546 | |
| | 131,360 | | | Target Corp. | | | 8,571,240 | |
| | | | | | | | |
| | | | | | | 33,005,464 | |
| | |
| | Semiconductors & Semiconductor Equipment – 1.6% | |
| | 57,750 | | | Intel Corp. | | | 2,665,740 | |
| | 180,463 | | | Marvell Technology Group Ltd. | | | 3,874,541 | |
| | 36,823 | | | QUALCOMM, Inc. | | | 2,357,408 | |
| | | | | | | | |
| | | | | | | 8,897,689 | |
| | |
| | Software & Services – 6.8% | |
| | 10,406 | | | Alphabet, Inc. Class A* | | | 10,961,680 | |
| | 82,235 | | | Citrix Systems, Inc.* | | | 7,236,680 | |
| | 111,659 | | | Microsoft Corp. | | | 9,551,311 | |
| | 193,795 | | | Oracle Corp. | | | 9,162,628 | |
| | | | | | | | |
| | | | | | | 36,912,299 | |
| | |
| | Technology Hardware & Equipment – 2.8% | |
| | 15,414 | | | Apple, Inc. | | | 2,608,511 | |
| | 335,551 | | | Cisco Systems, Inc. | | | 12,851,603 | |
| | | | | | | | |
| | | | | | | 15,460,114 | |
| | |
| | |
| The accompanying notes are an integral part of these financial statements. | | 9 |
GOLDMAN SACHS VARIABLE INSURANCE TRUST LARGE CAP VALUE FUND
Schedule of Investments (continued)
December 31, 2017
| | | | | | | | |
| Shares | | | Description | | Value | |
| | Common Stocks – (continued) | |
| | Telecommunication Services – 4.3% | |
| | 601,801 | | | AT&T, Inc. | | $ | 23,398,023 | |
| | |
| | Transportation – 3.0% | |
| | 16,795 | | | FedEx Corp. | | | 4,191,025 | |
| | 283,559 | | | JetBlue Airways Corp.* | | | 6,334,708 | |
| | 41,753 | | | Union Pacific Corp. | | | 5,599,077 | |
| | | | | | | | |
| | | | | | | 16,124,810 | |
| | |
| | TOTAL COMMON STOCKS | | | | |
| | (Cost $452,277,380) | | $ | 536,061,604 | |
| | |
| | | | | | | | |
| Shares | | | Distribution
Rate | | Value | |
| | Investment Company(a) – 0.4% | |
| Goldman Sachs Financial Square Government Fund —
Institutional Shares |
|
| | 2,415,456 | | | 1.228% | | $ | 2,415,456 | |
| | (Cost $2,415,456) | | | | |
| | |
| | TOTAL INVESTMENTS – 98.4% | |
| | (Cost $454,692,836) | | $ | 538,477,060 | |
| | |
| OTHER ASSETS IN EXCESS OF
LIABILITIES – 1.6% | | | 8,480,940 | |
| | |
| | NET ASSETS – 100.0% | | $ | 546,958,000 | |
| | |
| | |
| The percentage shown for each investment category reflects the value of investments in that category as a percentage of net assets. |
| * | | Non-income producing security. |
| (a) | | Represents an Affiliated Issuer. |
| | |
| Investment Abbreviation: |
| ADR | | —American Depositary Receipt. |
| | |
| 10 | | The accompanying notes are an integral part of these financial statements. |
GOLDMAN SACHS VARIABLE INSURANCE TRUST LARGE CAP VALUE FUND
Statement of Assets and Liabilities
December 31, 2017
| | | | |
| | | | |
| Assets: | |
Investments in unaffiliated issuers, at value (cost $452,277,380) | | $ | 536,061,604 | |
Investments in affiliated issuers, at value (cost $2,415,456) | | | 2,415,456 | |
Cash | | | 8,457,917 | |
Receivables: | | | | |
Fund shares sold | | | 381,339 | |
Dividends | | | 314,528 | |
Reimbursement from investment adviser | | | 21,816 | |
Securities lending income | | | 127 | |
Other assets | | | 194 | |
| Total assets | | | 547,652,981 | |
| | | | |
| | | | |
| Liabilities: | | | |
Payables: | | | | |
Management fees | | | 319,017 | |
Fund shares redeemed | | | 197,348 | |
Distribution and Service fees and Transfer Agency fees | | | 85,065 | |
Printing fee | | | 50,366 | |
Audit fee | | | 37,494 | |
Accrued expenses | | | 5,691 | |
| Total liabilities | | | 694,981 | |
| | | | |
| | | | |
| Net Assets: | | | |
Paid-in capital | | | 473,002,041 | |
Undistributed net investment income | | | 149,195 | |
Accumulated net realized loss | | | (9,977,460 | ) |
Net unrealized gain | | | 83,784,224 | |
| NET ASSETS | | $ | 546,958,000 | |
Net Assets: | | | | |
Institutional | | $ | 188,182,125 | |
Service | | | 358,775,875 | |
Total Net Assets | | $ | 546,958,000 | |
Shares outstanding $0.001 par value (unlimited shares authorized): | | | | |
Institutional | | | 20,762,776 | |
Service | | | 39,590,227 | |
Net asset value, offering and redemption price per share: | | | | |
Institutional | | | $9.06 | |
Service | | | 9.06 | |
| | |
| The accompanying notes are an integral part of these financial statements. | | 11 |
GOLDMAN SACHS VARIABLE INSURANCE TRUST LARGE CAP VALUE FUND
Statement of Operations
For the Fiscal Year Ended December 31, 2017
| | | | |
| | | | |
| Investment income: | |
Dividends — unaffiliated issuers (net of foreign taxes withheld of $12,029) | | $ | 13,075,334 | |
Dividends — affiliated issuers | | | 26,855 | |
Securities lending income — unaffiliated issuer | | | 17,218 | |
| Total investment income | | | 13,119,407 | |
| | | | |
| | | | |
| Expenses: | | | |
Management fees | | | 4,410,966 | |
Distribution and Service fees — Service Shares | | | 972,687 | |
Transfer Agency fees(a) | | | 117,616 | |
Professional fees | | | 78,476 | |
Printing and mailing costs | | | 63,229 | |
Custody, accounting and administrative services | | | 62,759 | |
Trustee fees | | | 18,483 | |
Other | | | 24,007 | |
| Total expenses | | | 5,748,223 | |
Less — expense reductions | | | (523,714 | ) |
| Net expenses | | | 5,224,509 | |
| NET INVESTMENT INCOME | | | 7,894,898 | |
| | | | |
| | | | |
| Realized and unrealized gain (loss): | | | |
Net realized gain from investments — unaffiliated issuers (including commissions recaptured of $49,811) | | | 92,354,930 | |
Net change in unrealized loss on investments — unaffiliated issuers | | | (40,190,304 | ) |
| Net realized and unrealized gain | | | 52,164,626 | |
| NET INCREASE IN NET ASSETS RESULTING FROM OPERATIONS | | $ | 60,059,524 | |
(a) Institutional and Service Shares incurred Transfer Agency fees of $39,807 and $77,809, respectively.
| | |
| 12 | | The accompanying notes are an integral part of these financial statements. |
GOLDMAN SACHS VARIABLE INSURANCE TRUST LARGE CAP VALUE FUND
Statements of Changes in Net Assets
| | | | | | | | |
| | | For the Fiscal Year Ended
December 31, 2017 | | | For the
Fiscal Year Ended
December 31, 2016 | |
| | | | | | | | |
| From operations: | |
Net investment income | | $ | 7,894,898 | | | $ | 14,542,105 | |
Net realized gain | | | 92,354,930 | | | | 3,065,360 | |
Net change in unrealized gain (loss) | | | (40,190,304 | ) | | | 69,964,908 | |
| Net increase in net assets resulting from operations | | | 60,059,524 | | | | 87,572,373 | |
| | | | | | | | |
| | | | | | | | |
| Distributions to shareholders: | | | | | | |
From net investment income | | | | | | | | |
Institutional Shares | | | (3,091,197 | ) | | | (5,067,653 | ) |
Service Shares | | | (4,927,889 | ) | | | (9,637,716 | ) |
From net realized gains | | | | | | | | |
Institutional Shares | | | (32,382,198 | ) | | | (2,433,036 | ) |
Service Shares | | | (61,818,486 | ) | | | (5,324,082 | ) |
| Total distributions to shareholders | | | (102,219,770 | ) | | | (22,462,487 | ) |
| | | | | | | | |
| | | | | | | | |
| From share transactions: | | | | | | |
Proceeds from sales of shares | | | 23,300,375 | | | | 46,845,142 | |
Reinvestment of distributions | | | 102,219,770 | | | | 22,462,487 | |
Cost of shares redeemed | | | (311,829,893 | ) | | | (249,588,098 | ) |
| Net decrease in net assets resulting from share transactions | | | (186,309,748 | ) | | | (180,280,469 | ) |
| TOTAL DECREASE | | | (228,469,994 | ) | | | (115,170,583 | ) |
| | | | | | | | |
| | | | | | | | |
| Net assets: | | | | | | |
| | |
Beginning of year | | | 775,427,994 | | | | 890,598,577 | |
End of year | | $ | 546,958,000 | | | $ | 775,427,994 | |
| Undistributed net investment income | | $ | 149,195 | | | $ | 624,847 | |
| | |
| The accompanying notes are an integral part of these financial statements. | | 13 |
GOLDMAN SACHS VARIABLE INSURANCE TRUST LARGE CAP VALUE FUND
Financial Highlights
Selected Data for a Share Outstanding Throughout Each Year
| | | | | | | | | | | | | | | | | | | | | | | | | | | | | | | | | | | | | | | | | | | | | | | | | | | | | | | | |
| | | | | | Income (loss) from
investment operations | | | Distributions to shareholders | | | | | | | | | | | | | | | | | | | | | | |
| Year - Share Class | | Net asset value, beginning of year | | | Net investment income(a) | | | Net
realized and
unrealized gain (loss) | | | Total from investment operations | | | From net investment income | | | From
net realized gains | | | Total distributions | | | Net asset value, end of year | | | Total return(b) | | | Net assets, end of year (in 000s) | | | Ratio of net expenses to average net assets | | | Ratio of total expenses to average net assets | | | Ratio of net investment income to average
net assets | | | Portfolio
turnover
rate(c) | |
FOR THE FISCAL YEARS ENDED DECEMBER 31, | |
2017 - Institutional | | $ | 10.16 | | | $ | 0.16 | | | $ | 0.83 | | | $ | 0.99 | | | $ | (0.18 | ) | | $ | (1.91 | ) | | $ | (2.09 | ) | | $ | 9.06 | | | | 9.85 | % | | $ | 188,182 | | | | 0.72 | % | | | 0.81 | % | | | 1.50 | % | | | 127 | % |
2017 - Service | | | 10.16 | | | | 0.13 | | | | 0.83 | | | | 0.96 | | | | (0.15 | ) | | | (1.91 | ) | | | (2.06 | ) | | | 9.06 | | | | 9.56 | | | | 358,776 | | | | 0.97 | | | | 1.06 | | | | 1.26 | | | | 127 | |
2016 - Institutional | | | 9.39 | | | | 0.18 | | | | 0.91 | | | | 1.09 | | | | (0.22 | ) | | | (0.10 | ) | | | (0.32 | ) | | | 10.16 | | | | 11.55 | | | | 243,875 | | | | 0.74 | | | | 0.81 | | | | 1.91 | | | | 130 | |
2016 - Service | | | 9.39 | | | | 0.16 | | | | 0.90 | | | | 1.06 | | | | (0.19 | ) | | | (0.10 | ) | | | (0.29 | ) | | | 10.16 | | | | 11.25 | | | | 531,553 | | | | 0.99 | | | | 1.06 | | | | 1.66 | | | | 130 | |
2015 - Institutional | | | 11.39 | | | | 0.15 | | | | (0.67 | ) | | | (0.52 | ) | | | (0.16 | ) | | | (1.32 | ) | | | (1.48 | ) | | | 9.39 | | | | (4.41 | ) | | | 279,910 | | | | 0.74 | | | | 0.81 | | | | 1.38 | | | | 83 | |
2015 - Service | | | 11.38 | | | | 0.13 | | | | (0.67 | ) | | | (0.54 | ) | | | (0.13 | ) | | | (1.32 | ) | | | (1.45 | ) | | | 9.39 | | | | (4.58 | ) | | | 610,689 | | | | 0.99 | | | | 1.06 | | | | 1.13 | | | | 83 | |
2014 - Institutional | | | 12.59 | | | | 0.16 | | | | 1.38 | | | | 1.54 | | | | (0.19 | ) | | | (2.55 | ) | | | (2.74 | ) | | | 11.39 | | | | 12.94 | | | | 326,543 | | | | 0.75 | | | | 0.80 | | | | 1.21 | | | | 72 | |
2014 - Service | | | 12.58 | | | | 0.13 | | | | 1.37 | | | | 1.50 | | | | (0.15 | ) | | | (2.55 | ) | | | (2.70 | ) | | | 11.38 | | | | 12.61 | | | | 692,741 | | | | 1.00 | | | | 1.05 | | | | 0.96 | | | | 72 | |
2013 - Institutional | | | 10.76 | | | | 0.14 | | | | 3.39 | | | | 3.53 | | | | (0.16 | ) | | | (1.54 | ) | | | (1.70 | ) | | | 12.59 | | | | 33.23 | | | | 370,241 | | | | 0.75 | | | | 0.79 | | | | 1.15 | | | | 86 | |
2013 - Service | | | 10.75 | | | | 0.11 | | | | 3.39 | | | | 3.50 | | | | (0.13 | ) | | | (1.54 | ) | | | (1.67 | ) | | | 12.58 | | | | 32.93 | | | | 792,553 | | | | 1.00 | | | | 1.04 | | | | 0.91 | | | | 86 | |
| (a) | Calculated based on the average shares outstanding methodology. |
| (b) | Assumes investment at the net asset value at the beginning of the year, reinvestment of all distributions, and a complete redemption of the investment at the net asset value at the end of the year. |
| (c) | The Fund’s portfolio turnover rate is calculated in accordance with regulatory requirements, without regard to transactions involving short term investments. If such transactions were included, the Fund’s portfolio turnover rate may be higher. |
| | | | |
| The accompanying notes are an integral part of these financial statements. | | 14 | | |
GOLDMAN SACHS VARIABLE INSURANCE TRUST LARGE CAP VALUE FUND
Notes to Financial Statements
December 31, 2017
1. ORGANIZATION
Goldman Sachs Variable Insurance Trust (the “Trust” or “VIT”) is a Delaware statutory trust registered under the Investment Company Act of 1940, as amended (the “Act”), as an open-end management investment company. The Trust includes the Goldman Sachs Large Cap Value Fund (the “Fund”). The Fund is a diversified portfolio under the Act offering two classes of shares — Institutional and Service Shares. Shares of the Trust are offered to separate accounts of participating life insurance companies for the purpose of funding variable annuity contracts and variable life insurance policies.
Goldman Sachs Asset Management, L.P. (“GSAM”), an affiliate of Goldman Sachs & Co. LLC (formerly, Goldman, Sachs & Co.) (“Goldman Sachs”), serves as investment adviser to the Fund pursuant to a management agreement (the “Agreement”) with the Trust.
2. SIGNIFICANT ACCOUNTING POLICIES
The financial statements have been prepared in accordance with accounting principles generally accepted in the United States of America (“GAAP”) and require management to make estimates and assumptions that may affect the reported amounts and disclosures. Actual results may differ from those estimates and assumptions.
A. Investment Valuation — The Fund’s valuation policy is to value investments at fair value.
B. Investment Income and Investments — Investment income includes interest income, dividend income, and securities lending income. Interest income is accrued daily and adjusted for amortization of premiums and accretion of discounts. Dividend income is recognized on ex-dividend date or, for certain foreign securities, as soon as such information is obtained subsequent to the ex-dividend date. Investment transactions are reflected on trade date. Realized gains and losses are calculated using identified cost. Investment transactions are recorded on the following business day for daily net asset value (“NAV”) calculations. Investment income is recorded net of any foreign withholding taxes, less any amounts reclaimable. The Fund may file withholding tax reclaims in certain jurisdictions to recover a portion of amounts previously withheld. Any foreign capital gains tax is accrued daily based upon net unrealized gains, and is payable upon sale of such investments. Distributions received from the Fund’s investments in United States (“U.S.”) real estate investment trusts (“REITs”) may be characterized as ordinary income, net capital gain or a return of capital. A return of capital is recorded by the Fund as a reduction to the cost basis of the REIT.
C. Class Allocations and Expenses — Investment income, realized and unrealized gain (loss), if any, and non-class specific expenses of the Fund are allocated daily based upon the proportion of net assets of each class. Non-class specific expenses directly incurred by the Fund are charged to the Fund, while such expenses incurred by the Trust are allocated across the Fund on a straight-line and/or pro-rata basis depending upon the nature of the expenses. Class specific expenses, where applicable, are borne by the respective share classes and include Distribution and Service and Transfer Agency fees.
D. Federal Taxes and Distributions to Shareholders — It is the Fund’s policy to comply with the requirements of the Internal Revenue Code of 1986, as amended (the “Code”), applicable to regulated investment companies (mutual funds) and to distribute each year substantially all of its investment company taxable income and capital gains to its shareholders. Accordingly, the Fund is not required to make any provisions for the payment of federal income tax. Distributions to shareholders are recorded on the ex-dividend date. Income and capital gains distributions, if any, are declared and paid annually.
Net capital losses, if any, are carried forward to future fiscal years and may be used to the extent allowed by the Code to offset any future capital gains. Losses that are carried forward will retain their character as either short-term or long-term capital losses. Utilization of capital loss carryforwards will reduce the requirement of future capital gains distributions.
The characterization of distributions to shareholders for financial reporting purposes is determined in accordance with federal income tax rules, which may differ from GAAP. The source of the Fund’s distributions may be shown in the accompanying financial statements as either from net investment income, net realized gain or capital. Certain components of the Fund’s net assets on the Statement of Assets and Liabilities reflect permanent GAAP/tax differences based on the appropriate tax character.
15
GOLDMAN SACHS VARIABLE INSURANCE TRUST LARGE CAP VALUE FUND
Notes to Financial Statements (continued)
December 31, 2017
2. SIGNIFICANT ACCOUNTING POLICIES (continued)
E. Commission Recapture — GSAM, on behalf of certain Funds, may direct portfolio trades, subject to seeking best execution, to various brokers who have agreed to rebate a portion of the commissions generated. Such rebates are made directly to the Fund as cash payments and are included in net realized gain (loss) from investments on the Statement of Operations.
3. INVESTMENTS AND FAIR VALUE MEASUREMENTS
U.S. GAAP defines the fair value of a financial instrument as the amount that would be received to sell an asset or paid to transfer a liability in an orderly transaction between market participants at the measurement date (i.e., the exit price); the Fund’s policy is to use the market approach. GAAP establishes a fair value hierarchy that prioritizes the inputs to valuation techniques used to measure fair value. The hierarchy gives the highest priority to unadjusted quoted prices in active markets for identical assets or liabilities (Level 1 measurements) and the lowest priority to unobservable inputs (Level 3 measurements). The levels used for classifying investments are not necessarily an indication of the risk associated with investing in these investments. The three levels of the fair value hierarchy are described below:
Level 1 — Unadjusted quoted prices in active markets that are accessible at the measurement date for identical, unrestricted assets or liabilities;
Level 2 — Quoted prices in markets that are not active or financial instruments for which significant inputs are observable (including, but not limited to, quoted prices for similar investments, interest rates, foreign exchange rates, volatility and credit spreads), either directly or indirectly;
Level 3 — Prices or valuations that require significant unobservable inputs (including GSAM’s assumptions in determining fair value measurement).
Changes in valuation techniques may result in transfers into or out of an assigned level within the hierarchy. In accordance with the Fund’s policy, transfers between different levels of the fair value hierarchy resulting from such changes are deemed to have occurred as of the beginning of the reporting period.
The Board of Trustees (“Trustees”) has approved Valuation Procedures that govern the valuation of the portfolio investments held by the Fund, including investments for which market quotations are not readily available. The Trustees have delegated to GSAM day-to-day responsibility for implementing and maintaining internal controls and procedures related to the valuation of the Fund’s investments. To assess the continuing appropriateness of pricing sources and methodologies, GSAM regularly performs price verification procedures and issues challenges as necessary to third party pricing vendors or brokers, and any differences are reviewed in accordance with the Valuation Procedures.
A. Level 1 and Level 2 Fair Value Investments — The valuation techniques and significant inputs used in determining the fair values for investments classified as Level 1 and Level 2 are as follows:
Equity Securities — Equity securities traded on a U.S. securities exchange or the NASDAQ system, or those located on certain foreign exchanges, including but not limited to the Americas, are valued daily at their last sale price or official closing price on the principal exchange or system on which they are traded. If there is no sale or official closing price or such price is believed by GSAM to not represent fair value, equity securities are valued at the last bid price for long positions and at the last ask price for short positions. To the extent these investments are actively traded, they are classified as Level 1 of the fair value hierarchy, otherwise they are generally classified as Level 2.
Unlisted equity securities for which market quotations are available are valued at the last sale price on the valuation date, or if no sale occurs, at the last bid price. Unlisted equities are generally classified as Level 2 (fair valued and single source broker securities may be treated differently). Securities traded on certain foreign securities exchanges are valued daily at fair value determined by an independent fair value service (if available) under Valuation Procedures approved by the Trustees and consistent with applicable regulatory guidance. The independent fair value service takes into account multiple factors including, but not limited to, movements in the securities markets, certain depositary receipts, futures contracts and foreign currency exchange rates that have occurred subsequent to the close of the foreign securities exchange. These investments are generally classified as Level 2 of the fair value hierarchy.
16
GOLDMAN SACHS VARIABLE INSURANCE TRUST LARGE CAP VALUE FUND
3. INVESTMENTS AND FAIR VALUE MEASUREMENTS (continued)
Money Market Funds — Investments in the Goldman Sachs Financial Square Government Fund (“Underlying Fund”) are valued at the NAV of the Institutional Share class on the day of valuation. These investments are generally classified as Level 1 of the fair value hierarchy. For information regarding an Underlying Fund’s accounting policies and investment holdings, please see the Underlying Fund’s shareholder report.
B. Level 3 Fair Value Investments — To the extent that significant inputs to valuation models and other alternative pricing sources are unobservable, or if quotations are not readily available, or if GSAM believes that such quotations do not accurately reflect fair value, the fair value of the Fund’s investments may be determined under Valuation Procedures approved by the Trustees. GSAM, consistent with its procedures and applicable regulatory guidance, may make an adjustment to the most recent valuation prices of either domestic or foreign securities in light of significant events to reflect what it believes to be the fair value of the securities at the time of determining the Fund’s NAV. Significant events which could affect a large number of securities in a particular market may include, but are not limited to: significant fluctuations in U.S. or foreign markets; market dislocations; market disruptions; or unscheduled market closings. Significant events which could also affect a single issuer may include, but are not limited to: corporate actions such as reorganizations, mergers and buy-outs; ratings downgrades; and bankruptcies.
C. Fair Value Hierarchy — The following is a summary of the Fund’s investments classified in the fair value hierarchy as of December 31, 2017:
| | | | | | | | | | | | |
| Investment Type | | Level 1 | | | Level 2 | | | Level 3 | |
| Assets | | | | | | | | | | | | |
| Common Stock and/or Other Equity Investments(a) | | | | | | | | | | | | |
Europe | | $ | 16,126,257 | | | $ | — | | | $ | — | |
North America | | | 519,935,347 | | | | — | | | | — | |
| Investment Company | | | 2,415,456 | | | | — | | | | — | |
| Total | | $ | 538,477,060 | | | $ | — | | | $ | — | |
| (a) | Amounts are disclosed by continent to highlight the impact of time zone differences between local market close and the calculation of NAV. Security valuations are based on the principal exchange or system on which they are traded, which may differ from country of domicile noted in the table. |
For further information regarding security characteristics, see the Schedule of Investments.
4. AGREEMENTS AND AFFILIATED TRANSACTIONS
A. Management Agreement — Under the Agreement, GSAM manages the Fund, subject to the general supervision of the Trustees.
As compensation for the services rendered pursuant to the Agreement, the assumption of the expenses related thereto and administration of the Fund’s business affairs, including providing facilities, GSAM is entitled to a management fee, accrued daily and paid monthly, equal to an annual percentage rate of the Fund’s average daily net assets.
For the fiscal year ended December 31, 2017, contractual and effective net management fees with GSAM were at the following rates:
| | | | | | | | | | | | | | | | | | | | | | | | | | |
| Contractual Management Rate | | | Effective Net
Management Rate^ | |
First
$1 billion | | | Next
$1 billion | | | Next
$3 billion | | | Next
$3 billion | | | Over
$8 billion | | | Effective
Rate | | |
| | 0.75% | | | | 0.68 | % | | | 0.65 | % | | | 0.64 | % | | | 0.63 | % | | | 0.75 | % | | | 0.70 | %* |
| ^ | Effective Net Management Rate includes the impact of management fee waivers of affiliated Underlying Funds, if any. |
| * | Effective April 28, 2017, GSAM agreed to waive a portion of its management fee in order to achieve an effective net management fee rate of 0.69% as an annual percentage rate of the Fund’s average daily net assets. Prior to this date, the effective net management fee rate was 0.72% as an annual percentage rate of the Fund’s average daily net assets. This waiver will be effective through at least April 28, 2018, and prior to such date GSAM may not terminate the arrangement without approval of the Trustees. For the fiscal year ended December 31, 2017, GSAM waived $286,760 of its management fee. |
17
GOLDMAN SACHS VARIABLE INSURANCE TRUST LARGE CAP VALUE FUND
Notes to Financial Statements (continued)
December 31, 2017
4. AGREEMENTS AND AFFILIATED TRANSACTIONS (continued)
The Fund invests in Institutional Shares of the Goldman Sachs Financial Square Government Fund, which is an affiliated Underlying Fund. GSAM has agreed to waive a portion of its management fee payable by the Fund in an amount equal to the management fee it earns as an investment adviser to the affiliated Underlying Fund in which the Fund invests, except those management fees it earns from the Fund’s investments of cash collateral received in connection with securities lending transactions in the Goldman Sachs Financial Square Government Fund. For the fiscal year ended December 31, 2017, GSAM waived $5,842 of the Fund’s management fee.
B. Distribution and/or Service (12b-1) Plan — The Trust, on behalf of Service Shares of the Fund, has adopted a Distribution and Service Plan subject to Rule 12b-1 under the Act. Under the Distribution and Service Plan, Goldman Sachs, which serves as distributor, is entitled to a fee accrued daily and paid monthly, for distribution services and personal and account maintenance services, which may then be paid by Goldman Sachs to authorized dealers, equal to, on an annual basis, 0.25% of the Fund’s average daily net assets attributable to Service Shares.
C. Transfer Agency Agreement — Goldman Sachs also serves as the transfer agent of the Fund for a fee pursuant to the Transfer Agency Agreement. The fees charged for such transfer agency services are accrued daily and paid monthly at an annual rate of 0.02% of the average daily net assets of Institutional and Service Shares.
D. Other Expense Agreements and Affiliated Transactions — GSAM has agreed to limit certain “Other Expenses” of the Fund (excluding acquired fund fees and expenses, transfer agency fees and expenses, service fees and shareholder administration fees (as applicable), taxes, interest, brokerage fees, expenses of shareholder meetings, litigation and indemnification, and extraordinary expenses) to the extent such expenses exceed, on an annual basis, a percentage rate of the average daily net assets of the Fund. Such Other Expense reimbursements, if any, are accrued daily and paid monthly. In addition, the Fund is not obligated to reimburse GSAM for prior fiscal year expense reimbursements, if any. The Other Expense limitation as an annual percentage rate of average daily net assets for the Fund is 0.004%. The Other Expense limitation will remain in place through at least April 28, 2018, and prior to such date GSAM may not terminate the arrangement without the approval of the Trustees. For the fiscal year ended December 31, 2017, GSAM reimbursed $223,434 to the Fund. In addition, the Fund has entered into certain offset arrangements with the custodian and the transfer agent, which may result in a reduction of the Fund’s expenses and are received irrespective of the application of the “Other Expense” limitation described above. For the fiscal year ended December 31, 2017, custody fee credits were $7,678.
E. Line of Credit Facility — As of December 31, 2017, the Fund participated in a $1,100,000,000 committed, unsecured revolving line of credit facility (the “facility”) together with other funds of the Trust and certain registered investment companies having management agreements with GSAM or its affiliates. This facility is to be used for temporary emergency purposes, or to allow for an orderly liquidation of securities to meet redemption requests. The interest rate on borrowings is based on the federal funds rate. The facility also requires a fee to be paid by the Fund based on the amount of the commitment that has not been utilized. For the fiscal year ended December 31, 2017, the Fund did not have any borrowings under the facility.
F. Other Transactions with Affiliates — For the fiscal year ended December 31, 2017, Goldman Sachs earned $225 in brokerage commissions from portfolio transactions.
The following table provides information about the Fund’s investment in the Goldman Sachs Financial Square Government Fund as of and for the fiscal year ended December 31, 2017:
| | | | | | | | | | | | | | | | | | | | | | |
Beginning
Value as of
December 31, 2016 | | | Purchases
at Cost | | | Proceeds
from Sales | | | Ending
Value as of
December 31, 2017 | | | Shares as of
December 31, 2017 | | | Dividend Income
from Affiliated
Investment Company | |
| $ | 944 | | | $ | 165,497,483 | | | $ | (163,082,971 | ) | | $ | 2,415,456 | | | | 2,415,456 | | | $ | 26,855 | |
18
GOLDMAN SACHS VARIABLE INSURANCE TRUST LARGE CAP VALUE FUND
5. PORTFOLIO SECURITIES TRANSACTIONS
The cost of purchases and proceeds from sales and maturities of long-term securities for the fiscal year ended December 31, 2017, were $738,834,323 and $1,027,526,949, respectively.
6. SECURITIES LENDING
The Fund may lend its securities through a securities lending agent, the Bank of New York Mellon (“BNYM”), to certain qualified borrowers. In accordance with the Fund’s securities lending procedures, the Fund receives cash collateral at least equal to the market value of the securities on loan. The market value of the loaned securities is determined at the close of business of the Fund, at their last sale price or official closing price on the principal exchange or system on which they are traded, and any additional required collateral is delivered to the Fund on the next business day. As with other extensions of credit, the Fund may experience delay in the recovery of its securities or incur a loss should the borrower of the securities breach its agreement with the Fund or become insolvent at a time when the collateral is insufficient to cover the cost of repurchasing securities on loan. Dividend income received from securities on loan may not be subject to withholding taxes and therefore withholding taxes paid may differ from the amounts listed in the Statement of Operations. Loans of securities are terminable at any time and as such 1) the remaining contractual maturities of the outstanding securities lending transactions are considered to be overnight and continuous and 2) the borrower, after notice, is required to return borrowed securities within the standard time period for settlement of securities transactions.
The Fund invests the cash collateral received in connection with securities lending transactions in the Goldman Sachs Financial Square Government Fund (“Government Money Market Fund”), an affiliated series of the Trust. The Government Money Market Fund is registered under the Act as an open end investment company, is subject to Rule 2a-7 under the Act, and is managed by GSAM, for which GSAM may receive a management fee of up to 0.205% on an annualized basis of the average daily net assets of the Government Money Market Fund.
In the event of a default by a borrower with respect to any loan, BNYM may exercise any and all remedies provided under the applicable borrower agreement to make the Fund whole. These remedies include purchasing replacement securities by applying the collateral held from the defaulting broker against the purchase cost of the replacement securities. If BNYM is unable to purchase replacement securities, BNYM will indemnify the Fund by paying the Fund an amount equal to the market value of the securities loaned minus the value of cash collateral received from the borrower for the loan, subject to an exclusion for any shortfalls resulting from a loss of value in such cash collateral due to reinvestment risk. The Fund’s loaned securities were all subject to enforceable Securities Lending Agreements and the value of the collateral was at least equal to the value of the cash received. The amounts of the Fund’s overnight and continuous agreements represent the gross amounts of recognized liabilities for securities lending transactions outstanding as of December 31, 2017 are disclosed as “Payable upon return of securities loaned” on the Statement of Assets and Liabilities, where applicable. The Fund did not have securities on loan as of December 31, 2017.
Both the Fund and BNYM received compensation relating to the lending of the Fund’s securities. The amounts earned, if any, by the Fund for the fiscal year ended December 31, 2017, are reported under Investment Income on the Statement of Operations.
The following table provides information about the Fund’s investment in the Government Money Market Fund for the fiscal year ended December 31, 2017:
| | | | | | | | | | | | | | | | | | |
Beginning
Value as of
December 31, 2016 | | | Purchases at
Cost | | | Proceeds from Sales | | | Ending
Value as of
December 31, 2017 | | | Shares as of
December 31, 2017 | |
| $ | — | | | $ | 82,362,198 | | | $ | (82,362,198 | ) | | $ | — | | | | — | |
19
GOLDMAN SACHS VARIABLE INSURANCE TRUST LARGE CAP VALUE FUND
Notes to Financial Statements (continued)
December 31, 2017
7. TAX INFORMATION
The tax character of distributions paid during the fiscal years ended December 31, 2016 and December 31, 2017 was as follows:
| | | | | | | | |
| | | 2016 | | | 2017 | |
| Distributions paid from: | | | | | | | | |
Ordinary income | | $ | 14,929,563 | | | $ | 31,508,940 | |
Net long-term capital gains | | | 7,532,924 | | | | 70,710,830 | |
| Total taxable distributions | | $ | 22,462,487 | | | $ | 102,219,770 | |
As of December 31, 2017, the components of accumulated earnings (losses) on a tax-basis were as follows:
| | | | |
| Undistributed ordinary income — net | | $ | 327,471 | |
| Timing differences (Post October Loss Deferral) | | | (2,041,191 | ) |
| Unrealized gains — net | | | 75,669,679 | |
| Total accumulated earnings — net | | $ | 73,955,959 | |
As of December 31, 2017, the Fund’s aggregate security unrealized gains and losses based on cost for U.S. federal income tax purposes were as follows:
| | | | |
| Tax cost | | $ | 462,807,381 | |
| Gross unrealized gain | | | 89,093,197 | |
| Gross unrealized loss | | | (13,423,518 | ) |
| Net unrealized gain | | $ | 75,669,679 | |
The difference between GAAP-basis and tax-basis unrealized gains (losses) is attributable primarily to wash sales.
In order to present certain components of the Fund’s capital accounts on a tax-basis, the Fund has reclassified $351,464 from undistributed net investment income into accumulated net realized gain. This reclassification has no impact on the NAV of the Fund and results primarily from differences in the tax treatment of underlying fund investments.
GSAM has reviewed the Fund’s tax positions for all open tax years (the current and prior three years, as applicable) and has concluded that no provision for income tax is required in the Fund’s financial statements. Such open tax years remain subject to examination and adjustment by tax authorities.
8. OTHER RISKS
The Fund’s risks include, but are not limited to, the following:
Foreign Countries Risk — Investing in foreign markets may involve special risks and considerations not typically associated with investing in the U.S. Foreign securities may be subject to risk of loss because of more or less foreign government regulation, less public information and less economic, political and social stability in the countries in which the Fund invests. The imposition of exchange controls (including repatriation restrictions), confiscations, trade restrictions (including tariffs) and other government restrictions by the U.S. or other governments, or from problems in share registration, settlement or custody, may also result in losses. Foreign risk also involves the risk of negative foreign currency rate fluctuations, which may cause the value of securities denominated in such foreign currency (or other instruments through which the Fund has exposure to foreign currencies) to decline in value. Currency exchange rates may fluctuate significantly over short periods of time.
20
GOLDMAN SACHS VARIABLE INSURANCE TRUST LARGE CAP VALUE FUND
8. OTHER RISKS (continued)
Foreign Custody Risk — If the Fund invests in foreign securities, the Fund may hold such securities and cash with foreign banks, agents, and securities depositories appointed by the Fund’s custodian (each a “Foreign Custodian”). Some foreign custodians may be recently organized or new to the foreign custody business. In some countries, Foreign Custodians may be subject to little or no regulatory oversight over, or independent evaluation of, their operations. Further, the laws of certain countries may place limitations on the Fund’s ability to recover its assets if a Foreign Custodian enters bankruptcy.
Investments in Other Investment Companies Risk — As a shareholder of another investment company, including an exchange-traded fund (“ETF”), the Fund will indirectly bear its proportionate share of any net management fees and other expenses paid by such other investment companies, in addition to the fees and expenses regularly borne by the Fund. ETFs are subject to risks that do not apply to conventional mutual funds, including but not limited to the following: (i) the market price of the ETF’s shares may trade at a premium or a discount to their NAV; and (ii) an active trading market for an ETF’s shares may not develop or be maintained.
Large Shareholder Transactions Risk — The Fund may experience adverse effects when certain large shareholders, such as other funds, participating insurance companies, accounts and Goldman Sachs affiliates, purchase or redeem large amounts of shares of the Fund. Such large shareholder redemptions may cause the Fund to sell portfolio securities at times when it would not otherwise do so, which may negatively impact the Fund’s NAV and liquidity. These transactions may also accelerate the realization of taxable income to shareholders if such sales of investments resulted in gains, and may also increase transaction costs. In addition, a large redemption could result in the Fund’s current expenses being allocated over a smaller asset base, leading to an increase in the Fund’s expense ratio. Similarly, large Fund share purchases may adversely affect the Fund’s performance to the extent that the Fund is delayed in investing new cash and is required to maintain a larger cash position than it ordinarily would.
Market and Credit Risks — In the normal course of business, the Fund trades financial instruments and enters into financial transactions where risk of potential loss exists due to changes in the market (market risk). Additionally, the Fund may also be exposed to credit risk in the event that an issuer or guarantor fails to perform or that an institution or entity with which the Fund has unsettled or open transactions defaults.
9. INDEMNIFICATIONS
Under the Trust’s organizational documents, its Trustees, officers, employees and agents are indemnified, to the extent permitted by the Act and state law, against certain liabilities that may arise out of performance of their duties to the Fund. Additionally, in the course of business, the Fund enters into contracts that contain a variety of indemnification clauses. The Fund’s maximum exposure under these arrangements is unknown, as this would involve future claims that may be made against the Fund that have not yet occurred. However, GSAM believes the risk of loss under these arrangements to be remote.
10. SUBSEQUENT EVENTS
Subsequent events after the Statement of Assets and Liabilities date have been evaluated, and GSAM has concluded that there is no impact requiring adjustment or disclosure in the financial statements.
21
GOLDMAN SACHS VARIABLE INSURANCE TRUST LARGE CAP VALUE FUND
Notes to Financial Statements (continued)
December 31, 2017
11. SUMMARY OF SHARE TRANSACTIONS
Share activity is as follows:
| | | | | | | | | | | | | | | | |
| | | For the Fiscal Year Ended
December 31, 2017 | | | For the Fiscal Year Ended
December 31, 2016 | |
| | | Shares | | | Dollars | | | Shares | | | Dollars | |
| Institutional Shares | | | | | | | | | | | | | | | | |
| Shares sold | | | 993,800 | | | $ | 10,470,019 | | | | 1,208,095 | | | $ | 11,301,985 | |
| Reinvestment of distributions | | | 3,928,394 | | | | 35,473,395 | | | | 732,489 | | | | 7,500,689 | |
| Shares redeemed | | | (8,151,726 | ) | | | (86,109,541 | ) | | | (7,742,346 | ) | | | (74,469,762 | ) |
| | | | (3,229,532 | ) | | | (40,166,127 | ) | | | (5,801,762 | ) | | | (55,667,088 | ) |
| Service Shares | | | | | | | | | | | | | | | | |
| Shares sold | | | 1,222,029 | | | | 12,830,356 | | | | 3,825,318 | | | | 35,543,157 | |
| Reinvestment of distributions | | | 7,391,625 | | | | 66,746,375 | | | | 1,461,113 | | | | 14,961,798 | |
| Shares redeemed | | | (21,328,914 | ) | | | (225,720,352 | ) | | | (18,016,464 | ) | | | (175,118,336 | ) |
| | | | (12,715,260 | ) | | | (146,143,621 | ) | | | (12,730,033 | ) | | | (124,613,381 | ) |
| NET DECREASE | | | (15,944,792 | ) | | $ | (186,309,748 | ) | | | (18,531,795 | ) | | $ | (180,280,469 | ) |
22
Report of Independent Registered Public Accounting Firm
To the Board of Trustees of
Goldman Sachs Variable Insurance Trust and Shareholders of the Goldman Sachs Large Cap Value Fund
Opinion on the Financial Statements
We have audited the accompanying statement of assets and liabilities, including the schedule of investments, of the Goldman Sachs Large Cap Value Fund (the “Fund”) as of December 31, 2017, the related statement of operations for the year ended December 31, 2017, the statements of changes in net assets for each of the two years in the period ended December 31, 2017, including the related notes, and the financial highlights for each of the five years in the period ended December 31, 2017 (collectively referred to as the “financial statements”). In our opinion, the financial statements present fairly, in all material respects, the financial position of the Fund as of December 31, 2017, the results of its operations for the year then ended, the changes in its net assets for each of the two years in the period ended December 31, 2017 and the financial highlights for each of the five years in the period ended December 31, 2017 in conformity with accounting principles generally accepted in the United States of America.
Basis for Opinion
These financial statements are the responsibility of the Fund’s management. Our responsibility is to express an opinion on the Fund’s financial statements based on our audits. We are a public accounting firm registered with the Public Company Accounting Oversight Board (United States) (“PCAOB”) and are required to be independent with respect to the Fund in accordance with the U.S. federal securities laws and the applicable rules and regulations of the Securities and Exchange Commission and the PCAOB.
We conducted our audits of these financial statements in accordance with the standards of the PCAOB. Those standards require that we plan and perform the audit to obtain reasonable assurance about whether the financial statements are free of material misstatement, whether due to error or fraud.
Our audits included performing procedures to assess the risks of material misstatement of the financial statements, whether due to error or fraud, and performing procedures that respond to those risks. Such procedures included examining, on a test basis, evidence regarding the amounts and disclosures in the financial statements. Our audits also included evaluating the accounting principles used and significant estimates made by management, as well as evaluating the overall presentation of the financial statements. Our procedures included confirmation of securities owned as of December 31, 2017 by correspondence with the custodian and transfer agent. We believe that our audits provide a reasonable basis for our opinion.
PricewaterhouseCoopers LLP
Boston, Massachusetts
February 14, 2018
We have served as the auditor of one or more investment companies in the Goldman Sachs Fund complex since 2000.
23
GOLDMAN SACHS VARIABLE INSURANCE TRUST LARGE CAP VALUE FUND
| | |
| Fund Expenses — Six Month Period Ended December 31, 2017 (Unaudited) | | |
As a shareholder of Institutional or Service Shares of the Fund, you incur ongoing costs, including management fees, distribution and/or service (12b-1) fees (with respect to Service Shares) and other Fund expenses. This example is intended to help you understand your ongoing costs (in dollars) of investing in the Institutional Shares and Service Shares of the Fund and to compare these costs with the ongoing costs of investing in other mutual funds.
The example is based on an investment of $1,000 invested at the beginning of the period and held for the entire period from July 1, 2017 through December 31, 2017, which represents a period of 184 days of a 365 day year.
Actual Expenses — The first line under each share class in the table below provides information about actual account values and actual expenses. You may use the information in this line, together with the amount you invested, to estimate the expenses that you paid over the period. Simply divide your account value by $1,000 (for example, an $8,600 account value divided by $1,000=8.6), then multiply the result by the number in the first line under the heading entitled “Expenses Paid” to estimate the expenses you paid on your account during this period.
Hypothetical Example for Comparison Purposes — The second line under each share class in the table below provides information about hypothetical account values and hypothetical expenses based on the Fund’s actual net expense ratio and an assumed rate of return of 5% per year before expenses, which is not the Fund’s actual return. The hypothetical account values and expenses may not be used to estimate the actual ending account balance or expenses you paid for the period. You may use this information to compare the ongoing costs of investing in the Fund and other funds. To do so, compare this 5% hypothetical example with the 5% hypothetical examples that appear in the shareholder reports of the other funds.
Please note that the expenses shown in the table are meant to highlight your ongoing costs only. As a shareholder of the Fund, you do not incur any transaction costs, such as sales charges, redemption fees, or exchange fees, but shareholders of other funds may incur such costs. The second line of the table is useful in comparing ongoing costs only and will not help you determine the relative total costs of owning different funds whose shareholders may incur transaction costs.
| | | | | | | | | | | | |
| Share Class | | Beginning Account Value 07/01/17 | | | Ending Account Value 12/31/17 | | | Expenses Paid
for the 6 Months Ended 12/31/17* | |
| Institutional | | | | | | | | | | | | |
| Actual | | $ | 1,000 | | | $ | 1,042.10 | | | $ | 3.65 | |
| Hypothetical 5% return | | | 1,000 | | | | 1,021.63 | + | | | 3.62 | |
| Service | | | | | | | | | | | | |
| Actual | | | 1,000 | | | | 1,041.30 | | | | 4.94 | |
| Hypothetical 5% return | | | 1,000 | | | | 1,020.37 | + | | | 4.89 | |
| | * | Expenses are calculated using the Fund’s annualized net expense ratio for each class, which represents the ongoing expenses as a percentage of net assets for the six months ended December 31, 2017. Expenses are calculated by multiplying the annualized net expense ratio by the average account value for the period; then multiplying the result by the number of days in the most recent fiscal half year; and then dividing that result by the number of days in the fiscal year. The annualized net expense ratios for the period were 0.71% and 0.96% for the Institutional and Service Shares, respectively. | |
| | + | Hypothetical expenses are based on the Fund’s actual annualized net expense ratios and an assumed rate of return of 5% per year before expenses. | |
24
GOLDMAN SACHS VARIABLE INSURANCE TRUST LARGE CAP VALUE FUND
Trustees and Officers (Unaudited)
Independent Trustees
| | | | | | | | | | |
| | | | | |
Name,
Address and Age1 | | Position(s) Held with the Trust | | Term of Office and
Length of
Time Served2 | | Principal Occupation(s) During Past 5 Years | | Number of
Portfolios in
Fund Complex
Overseen by
Trustee3 | | Other Directorships Held by Trustee4 |
Jessica Palmer Age: 68 | | Chair of the
Board of Trustees | | 2018 (Trustee since 2007) | | Ms. Palmer is retired. She is Director, Emerson Center for the Arts and Culture (2011-Present); and was formerly a Consultant, Citigroup Human Resources Department (2007-2008); Managing Director, Citigroup Corporate and Investment Banking (previously, Salomon Smith Barney/Salomon Brothers) (1984-2006). Ms. Palmer was a Member of the Board of Trustees of Indian Mountain School (private elementary and secondary school) (2004-2009). Chair of the Board of Trustees — Goldman Sachs Trust and Goldman Sachs Variable Insurance Trust. | | 105 | | None |
Kathryn A. Cassidy Age: 63 | | Trustee | | Since 2015 | | Ms. Cassidy is retired. Formerly, she was Advisor to the Chairman (May 2014-December 2014); and Senior Vice President and Treasurer (2008-2014), General Electric Company & General Electric Capital Corporation (technology and financial services companies). Trustee — Goldman Sachs Trust and Goldman Sachs Variable Insurance Trust. | | 105 | | None |
Diana M. Daniels Age: 68 | | Trustee | | Since 2007 | | Ms. Daniels is retired. Formerly, she was Vice President, General Counsel and Secretary, The Washington Post Company (1991-2006). Ms. Daniels is a Trustee Emeritus and serves as a Presidential Councillor of Cornell University (2013-Present); former Member of the Legal Advisory Board, New York Stock Exchange (2003-2006) and of the Corporate Advisory Board, Standish Mellon Management Advisors (2006-2007). Trustee — Goldman Sachs Trust and Goldman Sachs Variable Insurance Trust. | | 105 | | None |
Herbert J. Markley Age: 67 | | Trustee | | Since 2013 | | Mr. Markley is retired. Formerly, he was Executive Vice President, Deere & Company (an agricultural and construction equipment manufacturer) (2007-2009); and President, Agricultural Division, Deere & Company (2001-2007). Previously, Mr. Markley served as an Advisory Board Member of Goldman Sachs Trust and Goldman Sachs Variable Insurance Trust (June 2013-October 2013). Trustee — Goldman Sachs Trust and Goldman Sachs Variable Insurance Trust. | | 105 | | None |
Roy W. Templin Age: 57 | | Trustee | | Since 2013 | | Mr. Templin is retired. He is Director, Armstrong World Industries, Inc. (a designer and manufacturer of ceiling, wall and suspension system solutions) (2016–Present); and was formerly Chairman of the Board of Directors, Con-Way Incorporated (a transportation, logistics and supply chain management service company) (2014-2015); Executive Vice President and Chief Financial Officer, Whirlpool Corporation (an appliance manufacturer and marketer) (2004-2012). Previously, Mr. Templin served as an Advisory Board Member of Goldman Sachs Trust and Goldman Sachs Variable Insurance Trust (June 2013-October 2013). Trustee — Goldman Sachs Trust and Goldman Sachs Variable Insurance Trust. | | 105 | | Armstrong World Industries, Inc. (a ceiling, wall and suspension systems solutions manufacturer) |
Gregory G. Weaver Age: 66 | | Trustee | | Since 2015 | | Mr. Weaver is retired. He is Director, Verizon Communications Inc. (2015-Present); and was formerly Chairman and Chief Executive Officer, Deloitte & Touche LLP (a professional services firm) (2001-2005 and 2012-2014); and Member of the Board of Directors, Deloitte & Touche LLP (2006-2012). Trustee — Goldman Sachs Trust and Goldman Sachs Variable Insurance Trust. | | 105 | | Verizon Communications Inc. |
| | | | | | | | | | |
25
GOLDMAN SACHS VARIABLE INSURANCE TRUST LARGE CAP VALUE FUND
Trustees and Officers (Unaudited) (continued)
Interested Trustee*
| | | | | | | | | | |
| | | | | |
Name,
Address and Age1 | | Position(s) Held with the Trust | | Term of Office and
Length of
Time Served2 | | Principal Occupation(s) During Past 5 Years | | Number of
Portfolios in
Fund Complex
Overseen by
Trustee3 | | Other Directorships Held by Trustee4 |
James A. McNamara Age: 55 | | President and Trustee | | Since 2007 | | Managing Director, Goldman Sachs (January 2000-Present); Director of Institutional Fund Sales, GSAM (April 1998-December 2000); and Senior Vice President and Manager, Dreyfus Institutional Service Corporation (January 1993- April 1998). President and Trustee — Goldman Sachs Trust; Goldman Sachs Variable Insurance Trust; Goldman Sachs Trust II; Goldman Sachs MLP Income Opportunities Fund; Goldman Sachs MLP and Energy Renaissance Fund; Goldman Sachs ETF Trust; Goldman Sachs Private Markets Fund 2018 LLC; Goldman Sachs Private Markets Fund 2018 (A) LLC; and Goldman Sachs Private Markets Fund 2018 (B) LLC. | | 146 | | None |
| | | | | | | | | | |
| * | Mr. McNamara is considered to be an “Interested Trustee” because he holds positions with Goldman Sachs and owns securities issued by The Goldman Sachs Group, Inc. Mr. McNamara holds comparable positions with certain other companies of which Goldman Sachs, GSAM or an affiliate thereof is the investment adviser, administrator and/or distributor. |
| 1 | Each Trustee may be contacted by writing to the Trustee, c/o Goldman Sachs, 200 West Street, New York, New York, 10282, Attn: Caroline Kraus. Information is provided as of December 31, 2017. |
| 2 | Subject to such policies as may be adopted by the Board from time-to-time, each Trustee holds office for an indefinite term, until the earliest of: (a) the election of his or her successor; (b) the date the Trustee resigns or is removed by the Board or shareholders, in accordance with the Trust’s Declaration of Trust; or (c) the termination of the Trust. The Board has adopted policies which provide that (a) no Trustee shall hold office for more than 15 years and (b) a Trustee shall retire as of December 31st of the calendar year in which he or she reaches his or her 74th birthday, unless a waiver of such requirement shall have been adopted by a majority of the other Trustees. These policies may be changed by the Trustees without shareholder vote. |
| 3 | The Goldman Sachs Fund Complex includes certain other companies listed above for each respective Trustee. As of December 31, 2017, Goldman Sachs Trust consisted of 91 portfolios (90 of which offered shares to the public); Goldman Sachs Variable Insurance Trust consisted of 14 portfolios; Goldman Sachs Trust II consisted of 17 portfolios (16 of which offered shares to the public); Goldman Sachs BDC, Inc., Goldman Sachs Private Middle Market Credit LLC, Goldman Sachs MLP Income Opportunities Fund, Goldman Sachs MLP and Energy Renaissance Fund, Goldman Sachs Private Markets Fund 2018 LLC, Goldman Sachs Private Markets Fund 2018 (A) LLC and Goldman Sachs Private Markets Fund 2018 (B) LLC each consisted of one portfolio; and Goldman Sachs ETF Trust consisted of 19 portfolios (12 of which offered shares to the public). Goldman Sachs Private Middle Market Credit LLC, Goldman Sachs Private Markets Fund 2018 LLC, Goldman Sachs Private Markets Fund 2018 (A) LLC and Goldman Sachs Private Markets Fund 2018 (B) LLC do not offer shares to the public. |
| 4 | This column includes only directorships of companies required to report to the Securities and Exchange Commission under the Securities Exchange Act of 1934 (i.e., “public companies”) or other investment companies registered under the Act. |
Additional information about the Trustees is available in the Fund’s Statement of Additional Information, which can be obtained from Goldman Sachs free of charge by calling this toll-free number (in the United States of America): 1-800-526-7384.
26
GOLDMAN SACHS VARIABLE INSURANCE TRUST LARGE CAP VALUE FUND
Trustees and Officers (Unaudited) (continued)
Officers of the Trust*
| | | | | | |
| | | |
| Name, Address and Age1 | | Position(s) Held with the Trust | | Term of
Office and
Length of
Time Served2 | | Principal Occupation(s) During Past 5 Years |
James A. McNamara 200 West Street New York, NY 10282 Age: 55 | | Trustee and President | | Since 2007 | | Managing Director, Goldman Sachs (January 2000-Present); Director of Institutional Fund Sales, GSAM (April 1998-December 2000); and Senior Vice President and Manager, Dreyfus Institutional Service Corporation (January 1993-April 1998). President and Trustee — Goldman Sachs Trust; Goldman Sachs Variable Insurance Trust; Goldman Sachs Trust II; Goldman Sachs MLP Income Opportunities Fund; Goldman Sachs MLP and Energy Renaissance Fund; Goldman Sachs ETF Trust; Goldman Sachs Private Markets Fund 2018 LLC; Goldman Sachs Private Markets Fund 2018 (A) LLC; and Goldman Sachs Private Markets Fund 2018 (B) LLC. |
Caroline L. Kraus 200 West Street New York, NY 10282 Age: 40 | | Secretary | | Since 2012 | | Managing Director, Goldman Sachs (January 2016-Present); Vice President, Goldman Sachs (August 2006-December 2015); Associate General Counsel, Goldman Sachs (2012-Present); Assistant General Counsel, Goldman Sachs (August 2006-December 2011); and Associate, Weil, Gotshal & Manges, LLP (2002-2006). Secretary — Goldman Sachs Trust (previously Assistant Secretary (2012)); Goldman Sachs Variable Insurance Trust (previously Assistant Secretary (2012)); Goldman Sachs Trust II; Goldman Sachs BDC, Inc.; Goldman Sachs Private Middle Market Credit LLC; Goldman Sachs Middle Market Lending Corp.; Goldman Sachs MLP Income Opportunities Fund; Goldman Sachs MLP and Energy Renaissance Fund; Goldman Sachs ETF Trust; Goldman Sachs Private Markets Fund 2018 LLC; Goldman Sachs Private Markets Fund 2018 (A) LLC; and Goldman Sachs Private Markets Fund 2018 (B) LLC. |
Scott M. McHugh 200 West Street New York, NY 10282 Age: 46 | | Treasurer, Senior Vice President and Principal Financial Officer | | Since 2009 (Principal Financial Officer since 2013) | | Managing Director, Goldman Sachs (January 2016-Present); Vice President, Goldman Sachs (February 2007-December 2015); Assistant Treasurer of certain mutual funds administered by DWS Scudder (2005-2007); and Director (2005-2007), Vice President (2000-2005), and Assistant Vice President (1998-2000), Deutsche Asset Management or its predecessor (1998-2007). Treasurer, Senior Vice President and Principal Financial Officer — Goldman Sachs Trust; Goldman Sachs Variable Insurance Trust; Goldman Sachs Trust II; Goldman Sachs MLP Income Opportunities Fund; Goldman Sachs MLP and Energy Renaissance Fund; Goldman Sachs ETF Trust; Goldman Sachs Private Markets Fund 2018 LLC; Goldman Sachs Private Markets Fund 2018 (A) LLC; and Goldman Sachs Private Markets Fund 2018 (B) LLC. |
Joseph F. DiMaria 30 Hudson Street Jersey City, NJ 07302 Age: 49 | | Assistant Treasurer and Principal Accounting Officer | | Since 2016 (Principal Accounting Officer since 2017) | | Managing Director, Goldman Sachs (November 2015-Present) and Vice President — Mutual Fund Administration, Columbia Management Investment Advisers, LLC (May 2010-October 2015). Assistant Treasurer and Principal Accounting Officer — Goldman Sachs Trust; Goldman Sachs Variable Insurance Trust; Goldman Sachs Trust II; Goldman Sachs MLP Income Opportunities Fund; Goldman Sachs MLP and Energy Renaissance Fund; Goldman Sachs ETF Trust; Goldman Sachs Private Markets Fund 2018 LLC; Goldman Sachs Private Markets Fund 2018 (A) LLC; and Goldman Sachs Private Markets Fund 2018 (B) LLC. |
| | | | | | |
| * | Represents a partial list of officers of the Trust. Additional information about all the officers is available in the Fund’s Statement of Additional Information, which can be obtained from Goldman Sachs free of charge by calling this toll-free number (in the United States): 1-800-526-7384. |
| 1 | Information is provided as of December 31, 2017. |
| 2 | Officers hold office at the pleasure of the Board of Trustees or until their successors are duly elected and qualified. Each officer holds comparable positions with certain other companies of which Goldman Sachs, GSAM or an affiliate thereof is the investment adviser, administrator and/or distributor. |
27
GOLDMAN SACHS VARIABLE INSURANCE TRUST LARGE CAP VALUE FUND
Goldman Sachs Variable Insurance Trust — Tax Information (Unaudited)
For the year ended December 31, 2017, 21.63% of the dividends paid from net investment company taxable income by the Large Cap Value Fund qualify for the dividends received deduction available to corporations.
Pursuant to Section 852 of the Internal Revenue Code, the Large Cap Value Fund designates $70,710,830 or, if different, the maximum amount allowable, as capital gain dividends paid during the fiscal year ended December 31, 2017.
28
| | |
| TRUSTEES | | OFFICERS |
Jessica Palmer, Chair | | James A. McNamara, President |
| Kathryn A. Cassidy | | Scott M. McHugh, Treasurer, Senior Vice |
| Diana M. Daniels | | President and Principal Financial Officer |
| Herbert J. Markley | | Joseph F. DiMaria, Assistant Treasurer |
| James A. McNamara | | and Principal Accounting Officer |
| Roy W. Templin | | Caroline L. Kraus, Secretary |
| Gregory G. Weaver | | |
GOLDMAN SACHS & CO. LLC
Distributor and Transfer Agent
GOLDMAN SACHS ASSET MANAGEMENT, L.P.
Investment Adviser
200 West Street, New York
New York 10282
Visit our web site at www.GSAMFUNDS.com to obtain the most recent month-end returns.
The reports concerning the Fund included in this shareholder report may contain certain forward-looking statements about the factors that may affect the performance of the Fund in the future. These statements are based on Fund management’s predictions and expectations concerning certain future events and their expected impact on the Fund, such as performance of the economy as a whole and of specific industry sectors, changes in the levels of interest rates, the impact of developing world events, and other factors that may influence the future performance of the Fund. Management believes these forward-looking statements to be reasonable, although they are inherently uncertain and difficult to predict. Actual events may cause adjustments in portfolio management strategies from those currently expected to be employed.
A description of the policies and procedures that the Fund uses to determine how to vote proxies relating to portfolio securities and information regarding how the Fund voted proxies relating to portfolio securities for the 12-month period ended December 31 is available (i) without charge, upon request by calling 1-800-621-2550; and (ii) on the Securities and Exchange Commission (“SEC”) web site at http://www.sec.gov.
The Fund files its complete schedule of portfolio holdings with the SEC for the first and third quarters of each fiscal year on Form N-Q. The Fund’s Form N-Qs are available on the SEC’s web site at http://www.sec.gov within 60 days after the Fund’s first and third fiscal quarters. The Fund’s Form N-Qs may be reviewed and copied at the SEC’s Public Reference Room in Washington, D.C. and information on the operation of the Public Reference Room may also be obtained by calling 1-800-SEC-0330. Form N-Qs may be obtained upon request and without charge by calling 1-800-621-2550.
Views and opinions expressed are for informational purposes only and do not constitute a recommendation by GSAM to buy, sell, or hold any security. Views and opinions are current as of the date of this presentation and may be subject to change, they should not be construed as investment advice.
Goldman Sachs & Co. LLC (“Goldman Sachs”) does not provide legal, tax or accounting advice. Any statement contained in this communication (including any attachments) concerning U.S. tax matters was not intended or written to be used, and cannot be used, for the purpose of avoiding penalties under the Internal Revenue Code, and was written to support the promotion or marketing of transaction or matter addressed. Clients of Goldman Sachs should obtain their own independent tax advice based on their particular circumstances.
The website links provided are for your convenience only and are not an endorsement or recommendation by GSAM of any of these websites or the products or services offered. GSAM is not responsible for the accuracy and validity of the content of these websites.
Fund holdings and allocations shown are as of December 31, 2017 and may not be representative of future investments. Fund holdings should not be relied on in making investment decisions and should not be construed as research or investment advice regarding particular securities. Current and future holdings are subject to risk.
References to indices, benchmarks or other measures of relative market performance over a specified period of time are provided for your information only and do not imply that the portfolio will achieve similar results. The index composition may not reflect the manner in which a portfolio is constructed. While an adviser seeks to design a portfolio which reflects appropriate risk and return features, portfolio characteristics may deviate from those of the benchmark.
The Global Industry Classification Standard (“GICS”) was developed by and is the exclusive property and a service mark of Morgan Stanley Capital International Inc. (“MSCI”) and Standard & Poor’s, a division of The McGraw-Hill Companies, Inc. (“S&P”) and is licensed for use by Goldman Sachs. Neither MSCI, S&P nor any other party involved in making or compiling the GICS or any GICS classifications makes any express or implied warranties or representations with respect to such standard or classification (or the results to be obtained by the use thereof), and all such parties hereby expressly disclaim all warranties of originality, accuracy, completeness, merchantability or fitness for a particular purpose with respect to any of such standard or classification. Without limiting any of the foregoing, in no event shall MSCI, S&P, any of their affiliates or any third party involved in making or compiling the GICS or any GICS classifications have any liability for any direct, indirect, special, punitive, consequential or any other damages (including lost profits) even if notified of the possibility of such damages.
The portfolio risk management process includes an effort to monitor and manage risk, but does not imply low risk.
Shares of the Goldman Sachs VIT Funds are offered to separate accounts of participating life insurance companies for the purpose of funding variable annuity contracts and variable life insurance policies. Shares of the Fund are not offered directly to the general public. The variable annuity contracts and variable life insurance policies are described in the separate prospectuses issued by participating insurance companies. You should refer to those prospectuses for information about surrender charges, mortality and expense risk fees and other charges that may be assessed by participating insurance companies under the variable annuity contracts or variable life insurance policies. Such fees or charges, if any, may affect the return you may realize with respect to your investments. Ask your representative for more complete information. Please consider a fund’s objectives, risks and charges and expenses, and read the prospectus carefully before investing. The prospectus contains this and other information about the Fund.
This material is not authorized for distribution to prospective investors unless preceded or accompanied by a current prospectus or summary prospectus, if applicable. Investors should consider the Fund’s objective, risks, and charges and expenses, and read the summary prospectus, if available, and/or the prospectus carefully before investing or sending money. The summary prospectus, if available, and the prospectus contain this and other information about the Fund and may be obtained from your authorized dealer or from Goldman Sachs & Co. LLC by calling 1-800-621-2550.
THIS MATERIAL IS FOR INFORMATIONAL PURPOSES ONLY AND IS PROVIDED SOLELY ON THE BASIS THAT IT WILL NOT CONSTITUTE INVESTMENT OR OTHER ADVICE OR A RECOMMENDATION RELATING TO ANY PERSON’S OR PLAN’S INVESTMENT OR OTHER DECISIONS, AND GOLDMAN SACHS IS NOT A FIDUCIARY OR ADVISOR WITH RESPECT TO ANY PERSON OR PLAN BY REASON OF PROVIDING THE MATERIAL OR CONTENT HEREIN INCLUDING UNDER THE EMPLOYEE RETIREMENT INCOME SECURITY ACT OF 1974 OR DEPARTMENT OF LABOR REGULATIONS. PLAN SPONSORS AND OTHER FIDUCIARIES SHOULD CONSIDER THEIR OWN CIRCUMSTANCES IN ASSESSING ANY POTENTIAL COURSE OF ACTION.
This report is prepared for the general information of contract owners and is not an offer of shares of the Goldman Sachs Variable Insurance Trust — Goldman Sachs Large Cap Value Fund.
© 2018 Goldman Sachs. All rights reserved.
VITLCVAR-18/121105-OTU-698882/42.5K
Goldman
Sachs Variable Insurance Trust
Goldman Sachs
Mid Cap Value Fund
Annual Report
December 31, 2017

GOLDMAN SACHS VARIABLE INSURANCE TRUST MID CAP VALUE FUND
INVESTMENT OBJECTIVE
The Fund seeks long-term capital appreciation.
Portfolio Management Discussion and Analysis
Below, the Goldman Sachs Value Portfolio Management Team discusses the Goldman Sachs Variable Insurance Trust — Goldman Sachs Mid Cap Value Fund’s (the “Fund”) performance and positioning for the 12-month period ended December 31, 2017 (the “Reporting Period”).
How did the Fund perform during the Reporting Period?
During the Reporting Period, the Fund’s Institutional and Service Shares generated average annual total returns of 11.07% and 10.85%, respectively. These returns compare to the 13.34% average annual total return of the Fund’s benchmark, the Russell Midcap® Value Index (with dividends reinvested) (the “Russell Index”), during the same time period.
What economic and market factors most influenced the equity markets as a whole during the Reporting Period?
Representing the U.S. equity market, the S&P 500® Index gained 21.83% during the Reporting Period. It was a banner year for U.S. equities, with the S&P 500® Index advancing for 12 consecutive months in 2017, a feat that had previously never been accomplished in a single calendar year. Overall, stocks were boosted by a combination of accelerating economic growth, rising corporate earnings and a general lack of negative financial headlines. U.S. equity market volatility was at historic lows.
U.S. equities rallied to new highs at the start of 2017 on prospects of deregulation, tax reform and infrastructure spending as well as on stronger economic data. In March 2017, the U.S. Federal Reserve (the “Fed”) raised interest rates for the third time since the 2008 global financial crisis, which was met with dovish market reaction. (Dovish tends to suggest lower interest rates; opposite of hawkish.) U.S. equities were virtually flat, albeit positive, in March 2017 and then continued to climb higher in April 2017 on strong earnings results and receding European political risk. Although the labor market remained strong, economic activity and inflation moderated during the second calendar quarter. In the third calendar quarter, U.S. economic activity and labor market data showed consistent strength, with a reversal of five consecutive downside inflation surprises. Progress on tax reform and strong economic activity data remained supportive for U.S. equities in October and November 2017. The Fed delivered the third rate hike of 2017 in December as had been widely expected, having done similarly in June 2017, and maintained its projections for three additional interest rate hikes in 2018. U.S. equities gained additional momentum toward the end of the Reporting Period from the passage of a tax reform bill that reduced the corporate tax rate from 35% to 21%. The fourth quarter of 2017 marked the ninth consecutive quarter of positive returns for the S&P 500® Index, its strongest quarterly advance in four years.
For the Reporting Period overall, information technology, materials and consumer discretionary were the best performing sectors in the S&P 500 Index, as measured by total return. The weakest performing sectors in the S&P 500 Index were telecommunication services and energy, the only two to post negative absolute returns, followed by real estate, which was comparatively weak but generated a positive return during the Reporting Period.
Within the U.S. equity market, there was significant disparity in performance not only among sectors but also among the various capitalization and style segments. While all capitalization segments posted positive returns, large-cap stocks, as measured by the Russell 1000® Index, performed best, followed by mid-cap stocks, as measured by the Russell Midcap® Index, and then at some distance by small-cap stocks, as measured by the Russell 2000® Index. From a style perspective, growth-oriented stocks significantly outpaced value-oriented stocks across the capitalization spectrum. (All as measured by the Russell Investments indices.)
What key factors were responsible for the Fund’s performance during the Reporting Period?
While the Fund posted solid double-digit absolute gains, it underperformed the Russell Index during the Reporting Period due primarily to stock selection overall. Sector allocation as a whole contributed positively, albeit modestly, to the Fund’s performance relative to the Russell Index during the Reporting Period.
1
GOLDMAN SACHS VARIABLE INSURANCE TRUST MID CAP VALUE FUND
Which equity market sectors most significantly affected Fund performance?
Detracting from the Fund’s relative results most was stock selection in the consumer discretionary, real estate and energy sectors. Such detractors were only partially offset by effective stock selection in the information technology, industrials and health care sectors, which contributed positively to the Fund’s performance relative to the Russell Index during the Reporting Period.
Which stocks detracted significantly from the Fund’s performance during the Reporting Period?
Detracting from the Fund’s results relative to the Russell Index were positions in retail shopping centers owner and manager DDR, grocery-anchored community shopping centers owner Brixmor Property Group and global media company Discovery Communications.
The majority of DDR’s underperformance of the Russell Index came in September 2017 when Hurricane Maria hit landfall in Puerto Rico, where DDR has the highest exposure among its retail shopping center peers. Additionally, we believe some of DDR’s weak performance during the Reporting Period can be attributed to market concerns around store closures and retailer bankruptcies within the industry, resulting from disappointing retail sales. Despite DDR’s challenging performance, we continued at the end of the Reporting Period to have a high level of conviction in the real estate investment trust’s (“REIT”) experienced management team, who made an announcement at the end of 2017 that they would be spinning off a portfolio of 50 assets, comprised of 38 continental U.S. assets and its entire Puerto Rico portfolio. At the end of the Reporting Period, we believed the company’s underlying fundamentals remained healthy, and, in our view, DDR’s high quality tenant base provides the company with an advantage relative to its peers.
Similarly, we believe Brixmor Property Group’s underperformance of the Russell Index during the Reporting Period was largely due to market concerns around store closures within the industry, resulting from disappointing retail sales. Additionally, shares of the company declined after it reported third quarter 2017 earnings with in-line funds from operations but lowered 2017 funds from operations guidance. While, at the end of the Reporting Period, we remained positive on Brixmor Property Group’s long-term growth potential and believed it has been more resilient to e-commerce threats than many of its competitors, we exited the Fund’s position in September 2017 to focus the Fund’s overall retail REIT exposure to higher conviction names in the Fund’s portfolio.
Discovery Communications reported earnings that were above consensus expectations throughout the Reporting Period. However, market concerns that millennials will likely fail to embrace the traditional cable/satellite companies plagued its stock. One of the sharpest declines of the Reporting Period came in November 2017 after the company reported slim revenue growth and, more notably, a decline in U.S. affiliate subscribers. In our view, Discovery Communications’ unique content has generated a demonstrated appeal to audiences across various cultures and languages, providing the company with the ability to repurpose its content across multiple platforms and international markets. Additionally, at the end of the Reporting Period, we were positive on the company’s networks, which reach more than 300 million international households and generate approximately 50% of its stand-alone revenues from faster growing international markets where pay-TV penetration trends continue to improve. While we continued to believe in the strategy of the company and its compelling valuation, the issues facing the broader U.S. media industry persisted, in our view, in overwhelming the company-specific factors to our investment thesis. Consequently, we decided to exit the position and reallocate to higher conviction names in the Fund’s portfolio.
What were some of the Fund’s best-performing individual stocks?
The Fund benefited most relative to the Russell Index from positions in U.S.-based pharmaceutical company Vertex Pharmaceuticals, storage, communications and consumer semiconductor products producer Marvell Technology Group and financial planning services provider Ameriprise Financial.
Vertex Pharmaceuticals is primarily focused on treatments for cystic fibrosis. Its shares rose sharply in March 2017 after the company reported positive test results from one of its next-generation cystic fibrosis pipeline drugs. Its share price strengthened again in July 2017 following the successful outcome of a triple-drug combination aimed at improving lung function in patients with cystic fibrosis. In our view at the end of the Reporting Period, Vertex Pharmaceuticals’ strategy of bolstering the efficiency of its existing medicines, while developing a pipeline of assets to penetrate a larger population of patients is a strategy that we believe may generate compelling long-term shareholder value.
We believe the majority of Marvell Technology Group’s strong performance came in November 2017 after the company announced its acquisition of smaller rival and chipmaker Cavium, undertaken in an effort to expand its wireless connectivity business in a rapidly consolidating semiconductor industry. The transaction, expected to close mid-2018, should allow Marvell Technology Group to diversify away from its traditional storage device business and provide a powerful research and development engine to accelerate product development. In our view, the acquisition is evidence of its management team’s commitment to focus on higher margin products and exit less profitable businesses.
2
GOLDMAN SACHS VARIABLE INSURANCE TRUST MID CAP VALUE FUND
Ameriprise Financial is a financial planning services, investments, insurance and annuity products provider. Its stock rose in July 2017 after the company reported second quarter 2017 earnings that exceeded consensus expectations. Its stock continued to gain momentum in September 2017 when Columbia Threadneedle, the global asset management group of Ameriprise, announced it had entered into an agreement to acquire Lionstone Investments, a leading national real estate investment firm in Houston. The acquisition, expected to close later in 2018, may extend Columbia Threadneedle’s investment capabilities into U.S. real estate, further developing the company’s multi-asset solution capabilities. In our view, the stock was trading at a compelling valuation at the end of the Reporting Period, and the company was well positioned to benefit from higher short-term interest rates. We remained positive on the company due to what we saw as its strong management team and capital allocation track record.
How did the Fund use derivatives and similar instruments during the Reporting Period?
During the Reporting Period, we did not use derivatives as part of an active management strategy.
Did the Fund make any significant purchases or sales during the Reporting Period?
During the Reporting Period, we initiated a position in Comerica, a financial services company. We are positive on the company’s plan to increase capital returns through improved efficiency, capital optimization and higher rates. Additionally, we believe Comerica is poised to be a significant beneficiary of tax reform, with its new effective tax rate being close to 21%.
We established a Fund position in Prologis, a logistics REIT with distribution facilities across the Americas, Europe and Asia. We believe Prologis is well positioned to capitalize on strong secular growth in e-commerce, while its mostly infill locations may relatively limit supply growth versus peers. (An infill location is a real estate location where most of the properties are built to fill in remaining spaces, often in urban centers, where space is scarce and new development often involves rebuilding higher buildings over older lots.) Additionally, we are positive on what we view as its management team’s long and demonstrated track record of value creation through development, which increases its scale while driving additional earnings growth potential.
Conversely, in addition to those sales already mentioned, we exited the Fund’s position in Synchrony Financial, formerly GE Capital Retail Finance, a consumer financial services company. We had initiated a Fund position in the stock due to what we saw as its above-average growth business with excess capital that, unlike the majority of its peers, did not rely on higher interest rates to generate earnings growth. Additionally, we were positive on the company’s online bank, which allowed it to replace higher-cost sources of funding with online retail deposits. As the stock appreciated, we decided to sell the Fund’s position, as we believed there were more compelling risk/reward opportunities elsewhere in the financials sector.
We sold the Fund’s position in Huntington Bancshares, a regional bank holding company headquartered in Columbus, Ohio. We originally purchased its stock due to what we viewed as its attractive valuation, the company’s improving balance sheet, its management team’s commitment to operating leverage, and its differentiated service-oriented consumer/commercial strategy. In our view, increased loan growth, faster than market expected synergies from recent merger and acquisition activity, and regulatory relief would also be positive for Huntington Bancshares’ shares. While we continue to believe in its management team, we exited the stock as we believed the consensus 2018 estimates for the company were overly optimistic, creating the possible risk of downward earnings per share revisions in 2018, which would likely pressure its stock price. As such, we decided to reallocate the proceeds to higher conviction names in the Fund’s portfolio.
Were there any notable changes in the Fund’s weightings during the Reporting Period?
In constructing the Fund’s portfolio, we focus on picking stocks rather than on making industry or sector bets. We seek to outpace the benchmark index by overweighting stocks that we expect to outperform and underweighting those that we think may lag. Consequently, changes in its sector weights are generally the direct result of individual stock selection or of stock appreciation or depreciation. That said, during the Reporting Period, the Fund’s exposure to consumer staples and telecommunication services increased and its exposure to financials and health care decreased compared to the Russell Index.
How was the Fund positioned relative to its benchmark index at the end of the Reporting Period?
At the end of December 2017, the Fund had overweighted positions relative to the Russell Index in the information technology and consumer staples sectors. On the same date, the Fund had underweighted positions compared to the Russell Index in utilities and real estate and was rather neutrally weighted to the Russell Index in financials, industrials, energy, consumer discretionary, materials, health care and telecommunication services.
3
GOLDMAN SACHS VARIABLE INSURANCE TRUST MID CAP VALUE FUND
What is the Fund’s tactical view and strategy for the months ahead?
At the end of the Reporting Period, we were cautiously optimistic that the robust macroeconomic backdrop and strong corporate earnings trend could continue to drive positive economic growth. In addition to stimulating fiscal policy, including increased spending and a less restrictive regulatory environment, we believe many companies could potentially benefit from the reduction of corporate taxes by virtue of U.S. tax reform. All else being equal, we believe broadening global economic growth should be supportive of a continuation in corporate earnings growth and equity market appreciation. While our market return expectations remained relatively muted given what we perceive to be extended valuations at the end of the Reporting Period, we still believed U.S. equities remained more attractive than most other asset classes. Additionally, after several years of thematic-driven markets, we were positive at the end of the Reporting Period about lower correlations at the stock levels. We believe an active approach will likely continue to benefit in this type of environment.
Regardless of market direction, our fundamental, bottom-up stock selection continues to drive our process, rather than headlines or sentiment. We maintain high conviction in the companies the Fund owns and believe they have the potential to outperform relative to the broader market regardless of economic growth conditions. We continue to focus on undervalued companies that we believe have comparatively greater control of their own destiny, such as innovators with differentiated products, companies with low cost structures or companies that have been investing in their own businesses and may be poised to gain market share. We maintain our discipline in identifying companies with what we believe to be strong or improving balance sheets, led by quality management teams and trading at discounted valuations. We remain focused on the long-term performance of the Fund.
4
GOLDMAN SACHS VARIABLE INSURANCE TRUST MID CAP VALUE FUND
Index Definitions
The Russell Midcap Value® Index is an unmanaged index of common stock prices that measures the performance of those Russell Midcap companies with lower price-to-book ratios and lower forecasted growth values. The Index figures do not reflect any deduction for fees, expenses or taxes. It is not possible to invest directly in an index.
The Russell 2000® Index (with dividends reinvested) is an unmanaged index of common stock prices that measures the performance of the 2000 smallest companies in the Russell 3000® Index. The figures for the index do not include any deduction for fees, expenses or taxes. It is not possible to invest directly in an index.
The S&P 500® Index (with dividends reinvested) is the Standard & Poor’s composite index of 500 stocks, an unmanaged index of common stock prices. The figures for the index do not include any deduction for fees, expenses or taxes. It is not possible to invest directly in an index.
The Russell Midcap® Index measures the performance of the 800 smallest companies in the Russell 1000® Index, which represents approximately 25% of the total market capitalization of the Russell 1000® Index. It is not possible to invest directly in an index.
The Russell 1000® Index measures the performance of the 1,000 largest companies in the Russell 3000® Index, which represents approximately 92% of the total market capitalization of the Russell 3000® Index. It is not possible to invest directly in an index.
5
FUND BASICS
Mid Cap Value Fund
as of December 31, 2017
STANDARDIZED TOTAL RETURNS1
| | | | | | | | | | | | | | | | | | |
| For the period ended 12/31/17 | | One Year | | | Five Years | | | Ten Years | | | Since Inception | | | Inception Date |
| Institutional | | | 11.07 | % | | | 11.54 | % | | | 7.21 | % | | | 8.80 | % | | 5/01/98 |
| Service | | | 10.85 | | | | 11.27 | | | | 6.94 | | | | 7.12 | | | 1/09/06 |
| 1 | The Standardized Total Returns are average annual total returns as of the most recent calendar quarter-end. They assume reinvestment of all distributions at net asset value (“NAV”). Because Institutional Shares and Service Shares do not involve a sales charge, such a charge is not applied to their Standardized Total Returns. |
Total return figures in the above chart represent past performance and do not indicate future results, which will vary. The investment return and principal value of an investment will fluctuate and, therefore, an investor’s shares, when redeemed, may be worth more or less than their original cost. Current performance may be lower or higher than the total return figures in the above chart. Please visit www.GSAMFUNDS.com to obtain the most recent month-end returns. Performance reflects fee waivers and/or expense limitations in effect during the periods shown. In their absence, performance would be reduced.
EXPENSE RATIOS2
| | | | | | | | |
| | | Net Expense Ratio (Current) | | | Gross Expense Ratio (Before Waivers) | |
| Institutional | | | 0.84 | % | | | 0.87 | % |
| Service | | | 1.09 | | | | 1.12 | |
| 2 | The expense ratios of the Fund, both current (net of any fee waivers and/or expense limitations) and before waivers (gross of any fee waivers and/or expense limitations) are as set forth above according to the most recent publicly available Prospectuses for the Fund and may differ from the expense ratios disclosed in the Financial Highlights in this report. Pursuant to a contractual arrangement, the Fund’s fee waivers and/or expense limitations will remain in place through at least April 28, 2018, and prior to such date, the Investment Adviser may not terminate the arrangements without the approval of the Fund’s Board of Trustees. If these arrangements are discontinued in the future, the expense ratios may change without shareholder approval. |
TOP TEN HOLDINGS AS OF 12/31/173
| | | | | | |
| Holding | | % of Net Assets | | | Line of Business |
| Citizens Financial Group, Inc. | | | 2.0% | | | Banks |
| Zimmer Biomet Holdings, Inc. | | | 1.9 | | | Health Care Equipment & Services |
| Stanley Black & Decker, Inc. | | | 1.9 | | | Capital Goods |
| Comerica, Inc. | | | 1.9 | | | Banks |
| SunTrust Banks, Inc. | | | 1.8 | | | Banks |
| Prologis, Inc. | | | 1.8 | | | Real Estate Investment Trust |
| Marvell Technology Group Ltd. | | | 1.8 | | | Semiconductors & Semiconductor Equipment |
| Expedia, Inc. | | | 1.7 | | | Retailing |
| First Horizon National Corp. | | | 1.6 | | | Banks |
| Steel Dynamics, Inc. | | | 1.5 | | | Materials |
| 3 | The top 10 holdings may not be representative of the Fund’s future investments. |
6
FUND BASICS
FUND vs. BENCHMARK SECTOR ALLOCATIONS4
As of December 31, 2017
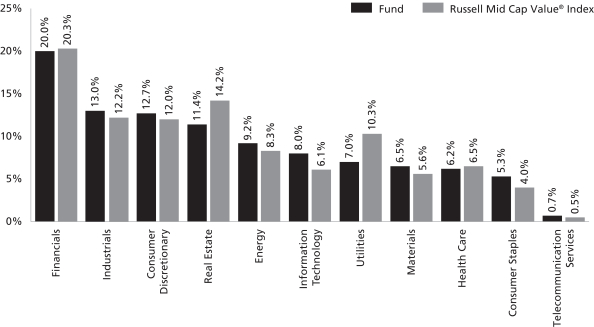
| 4 | The Fund is actively managed and, as such, its composition may differ over time. Consequently, the Fund’s overall sector allocations may differ from percentages contained in the graph above. The graph categorizes investments using Global Industry Classification Standard (“GICS”), however, the sector classifications used by the portfolio management team may differ from GICS. The percentage shown for each investment category reflects the value of investments in that category as a percentage of market value. |
7
GOLDMAN SACHS VARIABLE INSURANCE TRUST MID CAP VALUE FUND
Performance Summary
December 31, 2017
The following graph shows the value, as of December 31, 2017, of a $10,000 investment made on January 1, 2008 in Institutional Shares at NAV. For comparative purposes, the performance of the Fund’s benchmark, the Russell Midcap Value® Index (with distributions reinvested), is shown. This performance data represents past performance and should not be considered indicative of future performance, which will fluctuate with changes in market conditions. These performance fluctuations may cause an investor’s shares, when redeemed, to be worth more or less than their original cost. Performance reflects Fund level expenses but does not reflect fees and expenses associated with any variable annuity contract or variable life insurance policy that uses the Fund as an investment option for any contract or policy. Had performance reflected all of those fees and expenses, performance would have been reduced. Performance reflects applicable fee waivers and/or expense limitations in effect during the periods shown, and in their absence, performance would be reduced. Performance of Service Shares will vary from Institutional Shares due to differences in class specific fees. In addition to the Investment Adviser’s decisions regarding issuer/industry investment selection and allocation, other factors may affect Fund performance. These factors include, but are not limited to, Fund operating fees and expenses, portfolio turnover, and subscription and redemption cash flows affecting the Fund.
Mid Cap Value Fund’s 10 Year Performance
Performance of a $10,000 investment, with distributions reinvested, from January 1, 2008 through December 31, 2017.
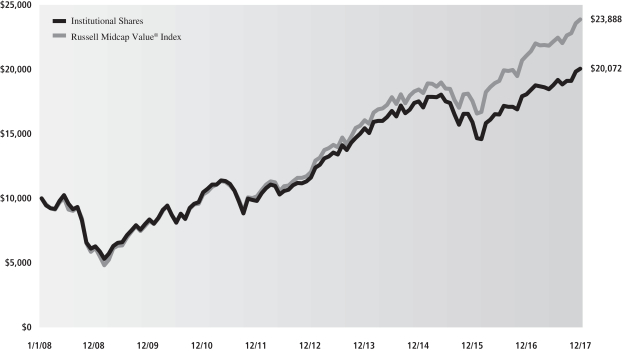
| | | | | | | | |
| Average Annual Total Return through December 31, 2017 | | One Year | | Five Years | | Ten Years | | Since Inception |
Institutional (Commenced May 1, 1998) | | 11.07% | | 11.54% | | 7.21% | | 8.80% |
Service (Commenced January 9, 2006) | | 10.85% | | 11.27% | | 6.94% | | 7.12% |
8
GOLDMAN SACHS VARIABLE INSURANCE TRUST MID CAP VALUE FUND
Schedule of Investments
December 31, 2017
| | | | | | | | |
| Shares | | | Description | | Value | |
| | Common Stocks – 97.6% | |
| | Banks – 8.8% | |
| | 368,006 | | | Citizens Financial Group, Inc. | | $ | 15,448,892 | |
| | 165,246 | | | Comerica, Inc. | | | 14,345,005 | |
| | 618,647 | | | First Horizon National Corp. | | | 12,366,754 | |
| | 60,508 | | | First Republic Bank | | | 5,242,413 | |
| | 43,652 | | | Signature Bank* | | | 5,991,673 | |
| | 220,510 | | | SunTrust Banks, Inc. | | | 14,242,741 | |
| | | | | | | | |
| | | | | | | 67,637,478 | |
| | |
| | Capital Goods – 9.0% | |
| | 155,951 | | | ITT, Inc. | | | 8,323,105 | |
| | 144,449 | | | Jacobs Engineering Group, Inc. | | | 9,527,856 | |
| | 55,795 | | | L3 Technologies, Inc. | | | 11,039,041 | |
| | 86,624 | | | Stanley Black & Decker, Inc. | | | 14,699,226 | |
| | 136,369 | | | Terex Corp. | | | 6,575,713 | |
| | 216,600 | | | Trinity Industries, Inc. | | | 8,113,836 | |
| | 134,651 | | | Wabtec Corp. | | | 10,964,631 | |
| | | | | | | | |
| | | | | | | 69,243,408 | |
| | |
| | Consumer Durables & Apparel – 3.8% | |
| | 123,843 | | | Brunswick Corp. | | | 6,838,611 | |
| | 138,967 | | | Lennar Corp. Class A | | | 8,788,273 | |
| | 2,302 | | | Lennar Corp. Class B | | | 118,967 | |
| | 29,968 | | | Mohawk Industries, Inc.* | | | 8,268,171 | |
| | 41,003 | | | PVH Corp. | | | 5,626,022 | |
| | | | | | | | |
| | | | | | | 29,640,044 | |
| | |
| | Consumer Services – 1.9% | |
| | 423,679 | | | La Quinta Holdings, Inc.* | | | 7,821,114 | |
| | 204,256 | | | MGM Resorts International | | | 6,820,108 | |
| | | | | | | | |
| | | | | | | 14,641,222 | |
| | |
| | Diversified Financials – 3.8% | |
| | 60,431 | | | Ameriprise Financial, Inc. | | | 10,241,242 | |
| | 96,863 | | | E*TRADE Financial Corp.* | | | 4,801,499 | |
| | 720,724 | | | SLM Corp.* | | | 8,144,181 | |
| | 286,971 | | | Starwood Property Trust, Inc. (REIT) | | | 6,126,831 | |
| | | | | | | | |
| | | | | | | 29,313,753 | |
| | |
| | Energy – 9.0% | |
| | 143,877 | | | Cheniere Energy, Inc.* | | | 7,746,338 | |
| | 164,219 | | | Devon Energy Corp. | | | 6,798,667 | |
| | 338,633 | | | Encana Corp. | | | 4,513,978 | |
| | 177,610 | | | EQT Corp. | | | 10,109,561 | |
| | 291,000 | | | Marathon Oil Corp. | | | 4,926,630 | |
| | 148,905 | | | Marathon Petroleum Corp. | | | 9,824,752 | |
| | 155,032 | | | Noble Energy, Inc. | | | 4,517,632 | |
| | 179,259 | | | Patterson-UTI Energy, Inc. | | | 4,124,750 | |
| | 219,993 | | | RSP Permian, Inc.* | | | 8,949,315 | |
| | 532,248 | | | WPX Energy, Inc.* | | | 7,488,729 | |
| | | | | | | | |
| | | | | | | 69,000,352 | |
| | |
| | Food & Staples Retailing – 1.4% | |
| | 333,580 | | | US Foods Holding Corp.* | | | 10,651,209 | |
| | |
| | Food, Beverage & Tobacco – 3.8% | |
| | 166,260 | | | Coca-Cola European Partners plc | | | 6,625,461 | |
| | 283,167 | | | Conagra Brands, Inc. | | | 10,666,901 | |
| | |
| | Common Stocks – (continued) | |
| | Food, Beverage & Tobacco – (continued) | |
| | 34,038 | | | Molson Coors Brewing Co. Class B | | $ | 2,793,498 | |
| | 154,791 | | | Pinnacle Foods, Inc. | | | 9,205,421 | |
| | | | | | | | |
| | | | | | | 29,291,281 | |
| | |
| | Health Care Equipment & Services – 4.2% | |
| | 184,624 | | | Acadia Healthcare Co., Inc.* | | | 6,024,281 | |
| | 69,486 | | | Laboratory Corp. of America Holdings* | | | 11,083,712 | |
| | 123,843 | | | Zimmer Biomet Holdings, Inc. | | | 14,944,135 | |
| | | | | | | | |
| | | | | | | 32,052,128 | |
| | |
| | Insurance – 7.0% | |
| | 55,823 | | | American Financial Group, Inc. | | | 6,059,029 | |
| | 87,477 | | | Arch Capital Group Ltd.* | | | 7,940,287 | |
| | 119,014 | | | Athene Holding Ltd. Class A* | | | 6,154,214 | |
| | 108,981 | | | Lincoln National Corp. | | | 8,377,370 | |
| | 111,869 | | | Progressive Corp. (The) | | | 6,300,462 | |
| | 71,503 | | | Torchmark Corp. | | | 6,486,037 | |
| | 47,109 | | | Willis Towers Watson plc | | | 7,098,855 | |
| | 73,419 | | | WR Berkley Corp. | | | 5,260,471 | |
| | | | | | | | |
| | | | | | | 53,676,725 | |
| | |
| | Materials – 6.4% | |
| | 302,894 | | | Ball Corp. | | | 11,464,538 | |
| | 105,399 | | | Celanese Corp. Series A | | | 11,286,125 | |
| | 450,257 | | | Freeport-McMoRan, Inc.* | | | 8,536,873 | |
| | 28,073 | | | Martin Marietta Materials, Inc. | | | 6,205,256 | |
| | 267,620 | | | Steel Dynamics, Inc. | | | 11,542,450 | |
| | | | | | | | |
| | | | | | | 49,035,242 | |
| | |
| | Media – 1.3% | |
| | 50,812 | | | DISH Network Corp. Class A* | | | 2,426,273 | |
| | 88,477 | | | Liberty Broadband Corp. Class C* | | | 7,534,701 | |
| | | | | | | | |
| | | | | | | 9,960,974 | |
| | |
| | Pharmaceuticals, Biotechnology & Life Sciences – 1.9% | |
| | 32,744 | | | Alexion Pharmaceuticals, Inc.* | | | 3,915,855 | |
| | 81,034 | | | BioMarin Pharmaceutical, Inc.* | | | 7,225,802 | |
| | 24,169 | | | Vertex Pharmaceuticals, Inc.* | | | 3,621,966 | |
| | | | | | | | |
| | | | | | | 14,763,623 | |
| | |
| | Real Estate Investment Trust – 11.1% | |
| | 81,453 | | | Alexandria Real Estate Equities, Inc. | | | 10,636,947 | |
| | 58,573 | | | AvalonBay Communities, Inc. | | | 10,450,009 | |
| | 45,152 | | | Boston Properties, Inc. | | | 5,871,115 | |
| | 118,730 | | | Camden Property Trust | | | 10,930,284 | |
| | 95,577 | | | CyrusOne, Inc. | | | 5,689,699 | |
| | 375,722 | | | DDR Corp. | | | 3,366,469 | |
| | 35,644 | | | Federal Realty Investment Trust | | | 4,733,880 | |
| | 108,702 | | | GGP, Inc. | | | 2,542,540 | |
| | 236,912 | | | Hudson Pacific Properties, Inc. | | | 8,114,236 | |
| | 213,628 | | | Prologis, Inc. | | | 13,781,142 | |
| | 190,957 | | | RLJ Lodging Trust | | | 4,195,325 | |
| | 64,383 | | | Vornado Realty Trust | | | 5,033,463 | |
| | | | | | | | |
| | | | | | | 85,345,109 | |
| | |
| | |
| The accompanying notes are an integral part of these financial statements. | | 9 |
GOLDMAN SACHS VARIABLE INSURANCE TRUST MID CAP VALUE FUND
Schedule of Investments (continued)
December 31, 2017
| | | | | | | | |
| Shares | | | Description | | Value | |
| | Common Stocks – (continued) | |
| | Retailing – 5.3% | |
| | 77,933 | | | Burlington Stores, Inc.* | | $ | 9,588,097 | |
| | 106,867 | | | Expedia, Inc. | | | 12,799,461 | |
| | 268,886 | | | LKQ Corp.* | | | 10,935,594 | |
| | 32,236 | | | O’Reilly Automotive, Inc.* | | | 7,754,047 | |
| | | | | | | | |
| | | | | | | 41,077,199 | |
| | |
| | Semiconductors & Semiconductor Equipment – 2.3% | |
| | 641,852 | | | Marvell Technology Group Ltd. | | | 13,780,562 | |
| | 65,856 | | | Qorvo, Inc.* | | | 4,386,010 | |
| | | | | | | | |
| | | | | | | 18,166,572 | |
| | |
| | Software & Services – 2.9% | |
| | 43,385 | | | Citrix Systems, Inc.* | | | 3,817,880 | |
| | 51,663 | | | DXC Technology Co. | | | 4,902,819 | |
| | 103,506 | | | Fidelity National Information Services, Inc. | | | 9,738,879 | |
| | 77,499 | | | GoDaddy, Inc. Class A* | | | 3,896,650 | |
| | | | | | | | |
| | | | | | | 22,356,228 | |
| | |
| | Technology Hardware & Equipment – 2.6% | |
| | 149,010 | | | CommScope Holding Co., Inc.* | | | 5,637,048 | |
| | 75,575 | | | Juniper Networks, Inc. | | | 2,153,888 | |
| | 134,595 | | | Keysight Technologies, Inc.* | | | 5,599,152 | |
| | 733,988 | | | Viavi Solutions, Inc.* | | | 6,415,055 | |
| | | | | | | | |
| | | | | | | 19,805,143 | |
| | |
| | Telecommunication Services – 0.7% | |
| | 309,544 | | | CenturyLink, Inc. | | | 5,163,194 | |
| | |
| | Transportation – 3.6% | |
| | 453,097 | | | JetBlue Airways Corp.* | | | 10,122,187 | |
| | 69,685 | | | Old Dominion Freight Line, Inc. | | | 9,167,062 | |
| | 96,204 | | | XPO Logistics, Inc.* | | | 8,811,324 | |
| | | | | | | | |
| | | | | | | 28,100,573 | |
| | |
| | Common Stocks – (continued) | |
| | Utilities – 6.8% | |
| | 97,180 | | | Atmos Energy Corp. | | $ | 8,346,790 | |
| | 163,982 | | | CMS Energy Corp. | | | 7,756,349 | |
| | 115,340 | | | FirstEnergy Corp. | | | 3,531,711 | |
| | 110,662 | | | Pinnacle West Capital Corp. | | | 9,426,189 | |
| | 212,725 | | | Public Service Enterprise Group, Inc. | | | 10,955,338 | |
| | 31,295 | | | Sempra Energy | | | 3,346,061 | |
| | 189,003 | | | Xcel Energy, Inc. | | | 9,092,934 | |
| | | | | | | | |
| | | | | | | 52,455,372 | |
| | |
| | TOTAL INVESTMENTS – 97.6% | |
| | (Cost $652,660,813) | | $ | 751,376,829 | |
| | |
| OTHER ASSETS IN EXCESS OF
LIABILITIES – 2.4% | | | 18,504,166 | |
| | |
| | NET ASSETS – 100.0% | | $ | 769,880,995 | |
| | |
| | |
| The percentage shown for each investment category reflects the value of investments in that category as a percentage of net assets. |
| * | | Non-income producing security. |
| | |
| Investment Abbreviation: |
| REIT | | —Real Estate Investment Trust |
| | |
| 10 | | The accompanying notes are an integral part of these financial statements. |
GOLDMAN SACHS VARIABLE INSURANCE TRUST MID CAP VALUE FUND
Statement of Assets and Liabilities
December 31, 2017
| | | | |
| | | | |
| Assets: | |
Investments in unaffiliated issuers, at value (cost $652,660,813) | | $ | 751,376,829 | |
Cash | | | 5,451,442 | |
Receivables: | | | | |
Investments sold | | | 13,019,200 | |
Dividends | | | 1,089,407 | |
Fund shares sold | | | 8,142 | |
Securities lending income | | | 856 | |
Other assets | | | 189 | |
| Total assets | | | 770,946,065 | |
| | | | |
| | | | |
| Liabilities: | | | |
Payables: | | | | |
Management fees | | | 501,247 | |
Fund shares redeemed | | | 362,718 | |
Distribution and Service fees and Transfer Agency fees | | | 93,406 | |
Investments purchased | | | 15,672 | |
Accrued expenses | | | 92,027 | |
| Total liabilities | | | 1,065,070 | |
| | | | |
| | | | |
| Net Assets: | | | |
Paid-in capital | | | 671,196,201 | |
Undistributed net investment income | | | 1,310,520 | |
Accumulated net realized loss | | | (1,341,742 | ) |
Net unrealized gain | | | 98,716,016 | |
| NET ASSETS | | $ | 769,880,995 | |
Net Assets: | | | | |
Institutional | | $ | 388,708,518 | |
Service | | | 381,172,477 | |
Total Net Assets | | $ | 769,880,995 | |
Shares outstanding $0.001 par value (unlimited shares authorized): | | | | |
Institutional | | | 22,966,110 | |
Service | | | 22,489,207 | |
Net asset value, offering and redemption price per share: | | | | |
Institutional | | | $16.93 | |
Service | | | 16.95 | |
| | |
| The accompanying notes are an integral part of these financial statements. | | 11 |
GOLDMAN SACHS VARIABLE INSURANCE TRUST MID CAP VALUE FUND
Statement of Operations
For the Fiscal Year Ended December 31, 2017
| | | | |
| | | | |
| Investment income: | |
Dividends — unaffiliated issuers (net of foreign taxes withheld of $9,231) | | $ | 11,983,836 | |
Dividends — affiliated issuers | | | 76,384 | |
Securities lending income — unaffiliated issuer | | | 41,114 | |
| Total investment income | | | 12,101,334 | |
| | | | |
| | | | |
| Expenses: | | | |
Management fees | | | 6,241,417 | |
Distribution and Service fees — Service Shares | | | 930,441 | |
Printing and mailing costs | | | 169,642 | |
Transfer Agency fees(a) | | | 156,023 | |
Custody, accounting and administrative services | | | 89,599 | |
Professional fees | | | 78,925 | |
Trustee fees | | | 18,897 | |
Other | | | 26,996 | |
| Total expenses | | | 7,711,940 | |
Less — expense reductions | | | (260,987 | ) |
| Net expenses | | | 7,450,953 | |
| NET INVESTMENT INCOME | | | 4,650,381 | |
| | | | |
| | | | |
| Realized and unrealized gain (loss): | | | |
Net realized gain from investments — unaffiliated issuers (including commissions recaptured of $66,478) | | | 75,406,510 | |
Net change in unrealized gain on investments — unaffiliated issuers | | | 850,845 | |
| Net realized and unrealized gain | | | 76,257,355 | |
| NET INCREASE IN NET ASSETS RESULTING FROM OPERATIONS | | $ | 80,907,736 | |
(a) Institutional and Service Shares incurred Transfer Agency fees of $81,594 and $74,429, respectively.
| | |
| 12 | | The accompanying notes are an integral part of these financial statements. |
GOLDMAN SACHS VARIABLE INSURANCE TRUST MID CAP VALUE FUND
Statements of Changes in Net Assets
| | | | | | | | |
| | | For the
Fiscal Year Ended
December 31, 2017 | | | For the
Fiscal Year Ended
December 31, 2016 | |
| | | | | | | | |
| From operations: | |
Net investment income | | $ | 4,650,381 | | | $ | 7,514,036 | |
Net realized gain (loss) | | | 75,406,510 | | | | (12,111,930 | ) |
Net change in unrealized gain | | | 850,845 | | | | 101,468,808 | |
| Net increase in net assets resulting from operations | | | 80,907,736 | | | | 96,870,914 | |
| | | | | | | | |
| | | | | | | | |
| Distributions to shareholders: | | | | | | |
From net investment income | | | | | | | | |
Institutional Shares | | | (2,801,151 | ) | | | (5,637,619 | ) |
Service Shares | | | (1,817,031 | ) | | | (4,045,785 | ) |
From net realized gains | | | | | | | | |
Institutional Shares | | | (21,035,754 | ) | | | (227,729 | ) |
Service Shares | | | (20,579,574 | ) | | | (194,596 | ) |
| Total distributions to shareholders | | | (46,233,510 | ) | | | (10,105,729 | ) |
| | | | | | | | |
| | | | | | | | |
| From share transactions: | | | | | | |
Proceeds from sales of shares | | | 25,661,942 | | | | 139,251,803 | |
Reinvestment of distributions | | | 46,233,510 | | | | 10,105,729 | |
Cost of shares redeemed | | | (145,139,270 | ) | | | (228,675,673 | ) |
| Net decrease in net assets resulting from share transactions | | | (73,243,818 | ) | | | (79,318,141 | ) |
| TOTAL INCREASE (DECREASE) | | | (38,569,592 | ) | | | 7,447,044 | |
| | | | | | | | |
| | | | | | | | |
| Net assets: | | | | | | |
| | |
Beginning of year | | | 808,450,587 | | | | 801,003,543 | |
End of year | | $ | 769,880,995 | | | $ | 808,450,587 | |
| Undistributed net investment income | | $ | 1,310,520 | | | $ | 1,572,110 | |
| | |
| The accompanying notes are an integral part of these financial statements. | | 13 |
GOLDMAN SACHS VARIABLE INSURANCE TRUST MID CAP VALUE FUND
Financial Highlights
Selected Data for a Share Outstanding Throughout Each Year
| | | | | | | | | | | | | | | | | | | | | | | | | | | | | | | | | | | | | | | | | | | | | | | | | | | | | | | | |
| | | | | | Income (loss) from
investment operations | | | Distributions to shareholders | | | | | | | | | | | | | | | | | | | | | | |
| Year - Share Class | | Net asset
value,
beginning
of year | | | Net
investment
income(a) | | | Net
realized
and
unrealized
gain (loss) | | | Total from
investment
operations | | | From net
investment
income | | | From
net
realized
gains | | | Total
distributions | | | Net asset
value,
end of
year | | | Total
return(b) | | | Net assets,
end of
year
(in 000s) | | | Ratio of
net expenses
to average
net assets | | | Ratio of
total
expenses
to average
net assets | | | Ratio of
net investment
income
to average
net assets | | | Portfolio
turnover
rate(c) | |
FOR THE FISCAL YEARS ENDED DECEMBER 31, | |
2017 - Institutional | | $ | 16.23 | | | $ | 0.12 | | | $ | 1.68 | | | $ | 1.80 | | | $ | (0.13 | ) | | $ | (0.97 | ) | | $ | (1.10 | ) | | $ | 16.93 | | | | 11.07 | % | | $ | 388,709 | | | | 0.84 | % | | | 0.87 | % | | | 0.71 | % | | | 134 | % |
2017 - Service | | | 16.25 | | | | 0.08 | | | | 1.68 | | | | 1.76 | | | | (0.09 | ) | | | (0.97 | ) | | | (1.06 | ) | | | 16.95 | | | | 10.85 | | | | 381,172 | | | | 1.09 | | | | 1.12 | | | | 0.47 | | | | 134 | |
2016 - Institutional | | | 14.49 | | | | 0.16 | | | | 1.80 | | | | 1.96 | | | | (0.21 | ) | | | (0.01 | ) | | | (0.22 | ) | | | 16.23 | | | | 13.49 | | | | 437,085 | | | | 0.84 | | | | 0.87 | | | | 1.08 | | | | 149 | |
2016 - Service | | | 14.51 | | | | 0.12 | | | | 1.81 | | | | 1.93 | | | | (0.18 | ) | | | (0.01 | ) | | | (0.19 | ) | | | 16.25 | | | | 13.24 | | | | 371,366 | | | | 1.09 | | | | 1.12 | | | | 0.78 | | | | 149 | |
2015 - Institutional | | | 17.43 | | | | 0.13 | | | | (1.75 | ) | | | (1.62 | ) | | | (0.07 | ) | | | (1.25 | ) | | | (1.32 | ) | | | 14.49 | | | | (9.24 | ) | | | 535,459 | | | | 0.84 | | | | 0.87 | | | | 0.74 | | | | 94 | |
2015 - Service | | | 17.45 | | | | 0.08 | | | | (1.75 | ) | | | (1.67 | ) | | | (0.02 | ) | | | (1.25 | ) | | | (1.27 | ) | | | 14.51 | | | | (9.52 | ) | | | 265,545 | | | | 1.09 | | | | 1.12 | | | | 0.48 | | | | 94 | |
2014 - Institutional | | | 18.64 | | | | 0.12 | | | | 2.31 | | | | 2.43 | | | | (0.21 | ) | | | (3.43 | ) | | | (3.64 | ) | | | 17.43 | | | | 13.57 | | | | 692,068 | | | | 0.83 | | | | 0.87 | | | | 0.62 | | | | 88 | |
2014 - Service | | | 18.66 | | | | 0.07 | | | | 2.31 | | | | 2.38 | | | | (0.16 | ) | | | (3.43 | ) | | | (3.59 | ) | | | 17.45 | | | | 13.29 | | | | 362,501 | | | | 1.08 | | | | 1.12 | | | | 0.38 | | | | 88 | |
2013 - Institutional | | | 15.33 | | | | 0.13 | | | | 4.88 | | | | 5.01 | | | | (0.16 | ) | | | (1.54 | ) | | | (1.70 | ) | | | 18.64 | | | | 32.89 | | | | 695,832 | | | | 0.83 | | | | 0.86 | | | | 0.74 | | | | 108 | |
2013 - Service | | | 15.35 | | | | 0.09 | | | | 4.88 | | | | 4.97 | | | | (0.12 | ) | | | (1.54 | ) | | | (1.66 | ) | | | 18.66 | | | | 32.56 | | | | 319,524 | | | | 1.08 | | | | 1.11 | | | | 0.51 | | | | 108 | |
| (a) | Calculated based on the average shares outstanding methodology. |
| (b) | Assumes investment at the net asset value at the beginning of the year, reinvestment of all distributions, and a complete redemption of the investment at the net asset value at the end of the year. |
| (c) | The Fund’s portfolio turnover rate is calculated in accordance with regulatory requirements, without regard to transactions involving short term investments. If such transactions were included, the Fund’s portfolio turnover rate may be higher. |
| | | | |
| The accompanying notes are an integral part of these financial statements. | | 14 | | |
GOLDMAN SACHS VARIABLE INSURANCE TRUST MID CAP VALUE FUND
Notes to Financial Statements
December 31, 2017
1. ORGANIZATION
Goldman Sachs Variable Insurance Trust (the “Trust” or “VIT”) is a Delaware statutory trust registered under the Investment Company Act of 1940, as amended (the “Act”), as an open-end management investment company. The Trust includes the Goldman Sachs Mid Cap Value Fund (the “Fund”). The Fund is a diversified portfolio under the Act offering two classes of shares — Institutional and Service Shares. Shares of the Trust are offered to separate accounts of participating life insurance companies for the purpose of funding variable annuity contracts and variable life insurance policies.
Goldman Sachs Asset Management, L.P. (“GSAM”), an affiliate of Goldman Sachs & Co. LLC (formerly, Goldman, Sachs & Co.) (“Goldman Sachs”), serves as investment adviser to the Fund pursuant to a management agreement (the “Agreement”) with the Trust.
2. SIGNIFICANT ACCOUNTING POLICIES
The financial statements have been prepared in accordance with accounting principles generally accepted in the United States of America (“GAAP”) and require management to make estimates and assumptions that may affect the reported amounts and disclosures. Actual results may differ from those estimates and assumptions.
A. Investment Valuation — The Fund’s valuation policy is to value investments at fair value.
B. Investment Income and Investments — Investment income includes interest income, dividend income, and securities lending income. Interest income is accrued daily and adjusted for amortization of premiums and accretion of discounts. Dividend income is recognized on ex-dividend date or, for certain foreign securities, as soon as such information is obtained subsequent to the ex-dividend date. Investment transactions are reflected on trade date. Realized gains and losses are calculated using identified cost. Investment transactions are recorded on the following business day for daily net asset value (“NAV”) calculations. Investment income is recorded net of any foreign withholding taxes, less any amounts reclaimable. The Fund may file withholding tax reclaims in certain jurisdictions to recover a portion of amounts previously withheld. Any foreign capital gains tax is accrued daily based upon net unrealized gains, and is payable upon sale of such investments. Distributions received from the Fund’s investments in United States (“U.S.”) real estate investment trusts (“REITs”) may be characterized as ordinary income, net capital gain or a return of capital. A return of capital is recorded by the Fund as a reduction to the cost basis of the REIT.
C. Class Allocations and Expenses — Investment income, realized and unrealized gain (loss), if any, and non-class specific expenses of the Fund are allocated daily based upon the proportion of net assets of each class. Non-class specific expenses directly incurred by the Fund are charged to the Fund, while such expenses incurred by the Trust are allocated across the Fund on a straight-line and/or pro-rata basis depending upon the nature of the expenses. Class specific expenses, where applicable, are borne by the respective share classes and include Distribution and Service and Transfer Agency fees.
D. Federal Taxes and Distributions to Shareholders — It is the Fund’s policy to comply with the requirements of the Internal Revenue Code of 1986, as amended (the “Code”), applicable to regulated investment companies (mutual funds) and to distribute each year substantially all of its investment company taxable income and capital gains to its shareholders. Accordingly, the Fund is not required to make any provisions for the payment of federal income tax. Distributions to shareholders are recorded on the ex-dividend date. Income and capital gains distributions, if any, are declared and paid annually.
Net capital losses, if any, are carried forward to future fiscal years and may be used to the extent allowed by the Code to offset any future capital gains. Losses that are carried forward will retain their character as either short-term or long-term capital losses. Utilization of capital loss carryforwards will reduce the requirement of future capital gains distributions.
The characterization of distributions to shareholders for financial reporting purposes is determined in accordance with federal income tax rules, which may differ from GAAP. The source of the Fund’s distributions may be shown in the accompanying financial statements as either from net investment income, net realized gain or capital. Certain components of the Fund’s net assets on the Statement of Assets and Liabilities reflect permanent GAAP/tax differences based on the appropriate tax character.
15
GOLDMAN SACHS VARIABLE INSURANCE TRUST MID CAP VALUE FUND
Notes to Financial Statements (continued)
December 31, 2017
2. SIGNIFICANT ACCOUNTING POLICIES (continued)
E. Commission Recapture — GSAM, on behalf of certain Funds, may direct portfolio trades, subject to seeking best execution, to various brokers who have agreed to rebate a portion of the commissions generated. Such rebates are made directly to the Fund as cash payments and are included in net realized gain (loss) from investments on the Statement of Operations.
3. INVESTMENTS AND FAIR VALUE MEASUREMENTS
U.S. GAAP defines the fair value of a financial instrument as the amount that would be received to sell an asset or paid to transfer a liability in an orderly transaction between market participants at the measurement date (i.e., the exit price); the Fund’s policy is to use the market approach. GAAP establishes a fair value hierarchy that prioritizes the inputs to valuation techniques used to measure fair value. The hierarchy gives the highest priority to unadjusted quoted prices in active markets for identical assets or liabilities (Level 1 measurements) and the lowest priority to unobservable inputs (Level 3 measurements). The levels used for classifying investments are not necessarily an indication of the risk associated with investing in these investments. The three levels of the fair value hierarchy are described below:
Level 1 — Unadjusted quoted prices in active markets that are accessible at the measurement date for identical, unrestricted assets or liabilities;
Level 2 — Quoted prices in markets that are not active or financial instruments for which significant inputs are observable (including, but not limited to, quoted prices for similar investments, interest rates, foreign exchange rates, volatility and credit spreads), either directly or indirectly;
Level 3 — Prices or valuations that require significant unobservable inputs (including GSAM’s assumptions in determining fair value measurement).
Changes in valuation techniques may result in transfers into or out of an assigned level within the hierarchy. In accordance with the Fund’s policy, transfers between different levels of the fair value hierarchy resulting from such changes are deemed to have occurred as of the beginning of the reporting period.
The Board of Trustees (“Trustees”) has approved Valuation Procedures that govern the valuation of the portfolio investments held by the Fund, including investments for which market quotations are not readily available. The Trustees have delegated to GSAM day-to-day responsibility for implementing and maintaining internal controls and procedures related to the valuation of the Fund’s investments. To assess the continuing appropriateness of pricing sources and methodologies, GSAM regularly performs price verification procedures and issues challenges as necessary to third party pricing vendors or brokers, and any differences are reviewed in accordance with the Valuation Procedures.
A. Level 1 and Level 2 Fair Value Investments — The valuation techniques and significant inputs used in determining the fair values for investments classified as Level 1 and Level 2 are as follows:
Equity Securities — Equity securities traded on a U.S. securities exchange or the NASDAQ system, or those located on certain foreign exchanges, including but not limited to the Americas, are valued daily at their last sale price or official closing price on the principal exchange or system on which they are traded. If there is no sale or official closing price or such price is believed by GSAM to not represent fair value, equity securities are valued at the last bid price for long positions and at the last ask price for short positions. To the extent these investments are actively traded, they are classified as Level 1 of the fair value hierarchy, otherwise they are generally classified as Level 2.
Unlisted equity securities for which market quotations are available are valued at the last sale price on the valuation date, or if no sale occurs, at the last bid price. Unlisted equities are generally classified as Level 2 (fair valued and single source broker securities may be treated differently). Securities traded on certain foreign securities exchanges are valued daily at fair value determined by an independent fair value service (if available) under Valuation Procedures approved by the Trustees and consistent with applicable regulatory guidance. The independent fair value service takes into account multiple factors including, but not limited to, movements in the securities markets, certain depositary receipts, futures contracts and foreign currency exchange rates that have occurred subsequent to the close of the foreign securities exchange. These investments are generally classified as Level 2 of the fair value hierarchy.
16
GOLDMAN SACHS VARIABLE INSURANCE TRUST MID CAP VALUE FUND
3. INVESTMENTS AND FAIR VALUE MEASUREMENTS (continued)
Money Market Funds — Investments in the Goldman Sachs Financial Square Government Fund (“Underlying Fund”) are valued at the NAV of the Institutional Share class on the day of valuation. These investments are generally classified as Level 1 of the fair value hierarchy. For information regarding an Underlying Fund’s accounting policies and investment holdings, please see the Underlying Fund’s shareholder report.
B. Level 3 Fair Value Investments — To the extent that significant inputs to valuation models and other alternative pricing sources are unobservable, or if quotations are not readily available, or if GSAM believes that such quotations do not accurately reflect fair value, the fair value of the Fund’s investments may be determined under Valuation Procedures approved by the Trustees. GSAM, consistent with its procedures and applicable regulatory guidance, may make an adjustment to the most recent valuation prices of either domestic or foreign securities in light of significant events to reflect what it believes to be the fair value of the securities at the time of determining the Fund’s NAV. Significant events which could affect a large number of securities in a particular market may include, but are not limited to: significant fluctuations in U.S. or foreign markets; market dislocations; market disruptions; or unscheduled market closings. Significant events which could also affect a single issuer may include, but are not limited to: corporate actions such as reorganizations, mergers and buy-outs; ratings downgrades; and bankruptcies.
C. Fair Value Hierarchy — The following is a summary of the Fund’s investments classified in the fair value hierarchy as of December 31, 2017:
| | | | | | | | | | | | |
| Investment Type | | Level 1 | | | Level 2 | | | Level 3 | |
| Assets | | | | | | | | | | | | |
| Common Stock and/or Other Equity Investments(a) | | | | | | | | | | | | |
Europe | | $ | 6,625,461 | | | $ | — | | | $ | — | |
North America | | | 744,751,368 | | | | — | | | | — | |
| Total | | $ | 751,376,829 | | | $ | — | | | $ | — | |
| (a) | Amounts are disclosed by continent to highlight the impact of time zone differences between local market close and the calculation of NAV. Security valuations are based on the principal exchange or system on which they are traded, which may differ from country of domicile noted in the table |
For further information regarding security characteristics, see the Schedule of Investments.
4. AGREEMENTS AND AFFILIATED TRANSACTIONS
A. Management Agreement — Under the Agreement, GSAM manages the Fund, subject to the general supervision of the Trustees.
As compensation for the services rendered pursuant to the Agreement, the assumption of the expenses related thereto and administration of the Fund’s business affairs, including providing facilities, GSAM is entitled to a management fee, accrued daily and paid monthly, equal to an annual percentage rate of the Fund’s average daily net assets.
For the fiscal year ended December 31, 2017, contractual and effective net management fees with GSAM were at the following rates:
| | | | | | | | | | | | | | | | | | | | | | |
| Contractual Management Rate | | | | |
First
$2 billion | | | Next
$3 billion | | | Next
$3 billion | | | Over
$8 billion | | | Effective
Rate | | | Effective Net
Management
Rate^ | |
| | 0.80 | % | | | 0.72 | % | | | 0.68 | % | | | 0.67 | % | | | 0.80 | % | | | 0.77 | %* |
| ^ | Effective Net Management Rate includes the impact of management fee waivers of affiliated Underlying Funds, if any. |
| * | GSAM agreed to waive a portion of its management fee in order to achieve a net management rate, as defined in the Fund’s most recent prospectus. This waiver will be effective through at least April 28, 2018, and prior to such date GSAM may not terminate the arrangement without approval of the Trustees. For the fiscal year ended December 31, 2017, GSAM waived $234,048 of its management fee. |
17
GOLDMAN SACHS VARIABLE INSURANCE TRUST MID CAP VALUE FUND
Notes to Financial Statements (continued)
December 31, 2017
4. AGREEMENTS AND AFFILIATED TRANSACTIONS (continued)
The Fund invests in Institutional Shares of the Goldman Sachs Financial Square Government Fund, which is an affiliated Underlying Fund. GSAM has agreed to waive a portion of its management fee payable by the Fund in an amount equal to the management fee it earns as an investment adviser to the affiliated Underlying Fund in which the Fund invests, except those management fees it earns from the Fund’s investments of cash collateral received in connection with securities lending transactions in the Goldman Sachs Financial Square Government Fund. For the fiscal year ended December 31, 2017, GSAM waived $16,505 of the Fund’s management fee.
B. Distribution and/or Service (12b-1) Plan — The Trust, on behalf of Service Shares of the Fund, has adopted a Distribution and Service Plan subject to Rule 12b-1 under the Act. Under the Distribution and Service Plan, Goldman Sachs, which serves as distributor, is entitled to a fee accrued daily and paid monthly, for distribution services and personal and account maintenance services, which may then be paid by Goldman Sachs to authorized dealers, equal to, on an annual basis, 0.25% of the Fund’s average daily net assets attributable to Service Shares.
C. Transfer Agency Agreement — Goldman Sachs also serves as the transfer agent of the Fund for a fee pursuant to the Transfer Agency Agreement. The fees charged for such transfer agency services are accrued daily and paid monthly at an annual rate of 0.02% of the average daily net assets of Institutional and Service Shares.
D. Other Expense Agreements and Affiliated Transactions — GSAM has agreed to limit certain “Other Expenses” of the Fund (excluding acquired fund fees and expenses, transfer agency fees and expenses, service fees and shareholder administration fees (as applicable), taxes, interest, brokerage fees, expenses of shareholder meetings, litigation and indemnification, and extraordinary expenses) to the extent such expenses exceed, on an annual basis, a percentage rate of the average daily net assets of the Fund. Such Other Expense reimbursements, if any, are accrued daily and paid monthly. In addition, the Fund is not obligated to reimburse GSAM for prior fiscal year expense reimbursements, if any. The Other Expense limitation as an annual percentage rate of average daily net assets for the Fund is 0.054%. The Other Expense limitation will remain in place through at least April 28, 2018, and prior to such date GSAM may not terminate the arrangement without the approval of the Trustees. For the fiscal year ended December 31, 2017, GSAM did not reimburse the Fund. In addition, the Fund has entered into certain offset arrangements with the custodian and the transfer agent, which may result in a reduction of the Fund’s expenses and are received irrespective of the application of the “Other Expense” limitation described above. For the fiscal year ended December 31, 2017, custody fee credits were $10,434.
E. Line of Credit Facility — As of December 31, 2017, the Fund participated in a $1,100,000,000 committed, unsecured revolving line of credit facility (the “facility”) together with other funds of the Trust and certain registered investment companies having management agreements with GSAM or its affiliates. This facility is to be used for temporary emergency purposes, or to allow for an orderly liquidation of securities to meet redemption requests. The interest rate on borrowings is based on the federal funds rate. The facility also requires a fee to be paid by the Fund based on the amount of the commitment that has not been utilized. For the fiscal year ended December 31, 2017, the Fund did not have any borrowings under the facility.
F. Other Transactions with Affiliates — For the fiscal year ended December 31, 2017, Goldman Sachs earned $65,961 in brokerage commissions from portfolio transactions.
The following table provides information about the Fund’s investment in the Goldman Sachs Financial Square Government Fund as of and for the fiscal year ended December 31, 2017:
| | | | | | | | | | | | | | | | | | | | | | |
Beginning
Value as of
December 31, 2016 | | | Purchases
at Cost | | | Proceeds from Sales | | | Ending
Value as of
December 31, 2017 | | | Shares as of
December 31, 2017 | | | Dividend Income from Affiliated
Investment Company | |
| $ | 8,285,364 | | | $ | 254,417,666 | | | $ | (262,703,030 | ) | | $ | — | | | | — | | | $ | 76,384 | |
18
GOLDMAN SACHS VARIABLE INSURANCE TRUST MID CAP VALUE FUND
5. PORTFOLIO SECURITIES TRANSACTIONS
The cost of purchases and proceeds from sales and maturities of long-term securities for the fiscal year ended December 31, 2017, were $1,018,528,246 and $1,132,311,603, respectively.
6. SECURITIES LENDING
The Fund may lend its securities through a securities lending agent, the Bank of New York Mellon (“BNYM”), to certain qualified borrowers. In accordance with the Fund’s securities lending procedures, the Fund receives cash collateral at least equal to the market value of the securities on loan. The market value of the loaned securities is determined at the close of business of the Fund, at their last sale price or official closing price on the principal exchange or system on which they are traded, and any additional required collateral is delivered to the Fund on the next business day. As with other extensions of credit, the Fund may experience delay in the recovery of its securities or incur a loss should the borrower of the securities breach its agreement with the Fund or become insolvent at a time when the collateral is insufficient to cover the cost of repurchasing securities on loan. Dividend income received from securities on loan may not be subject to withholding taxes and therefore withholding taxes paid may differ from the amounts listed in the Statement of Operations. Loans of securities are terminable at any time and as such 1) the remaining contractual maturities of the outstanding securities lending transactions are considered to be overnight and continuous and 2) the borrower, after notice, is required to return borrowed securities within the standard time period for settlement of securities transactions.
The Fund invests the cash collateral received in connection with securities lending transactions in the Goldman Sachs Financial Square Government Fund (“Government Money Market Fund”), an affiliated series of the Trust. The Government Money Market Fund is registered under the Act as an open end investment company, is subject to Rule 2a-7 under the Act, and is managed by GSAM, for which GSAM may receive a management fee of up to 0.205% on an annualized basis of the average daily net assets of the Government Money Market Fund.
In the event of a default by a borrower with respect to any loan, BNYM may exercise any and all remedies provided under the applicable borrower agreement to make the Fund whole. These remedies include purchasing replacement securities by applying the collateral held from the defaulting broker against the purchase cost of the replacement securities. If BNYM is unable to purchase replacement securities, BNYM will indemnify the Fund by paying the Fund an amount equal to the market value of the securities loaned minus the value of cash collateral received from the borrower for the loan, subject to an exclusion for any shortfalls resulting from a loss of value in such cash collateral due to reinvestment risk. The Fund’s loaned securities were all subject to enforceable Securities Lending Agreements and the value of the collateral was at least equal to the value of the cash received. The amounts of the Fund’s overnight and continuous agreements represent the gross amounts of recognized liabilities for securities lending transactions outstanding as of December 31, 2017 are disclosed as “Payable upon return of securities loaned” on the Statement of Assets and Liabilities, where applicable. The Fund did not have securities on loan as of December 31, 2017.
Both the Fund and BNYM received compensation relating to the lending of the Fund’s securities. The amounts earned, if any, by the Fund for the fiscal year ended December 31, 2017, are reported under Investment Income on the Statement of Operations.
The following table provides information about the Fund’s investment in the Government Money Market Fund for the fiscal year ended December 31, 2017:
| | | | | | | | | | | | | | | | | | |
Beginning
Value as of
December 31, 2016 | | | Purchases at
Cost | | | Proceeds
from Sales | | | Ending
Value as of
December 31, 2017 | | | Shares as of
December 31, 2017 | |
| $ | 3,827,250 | | | $ | 184,101,263 | | | $ | (187,928,513 | ) | | $ | — | | | | — | |
19
GOLDMAN SACHS VARIABLE INSURANCE TRUST MID CAP VALUE FUND
Notes to Financial Statements (continued)
December 31, 2017
7. TAX INFORMATION
The tax character of distributions paid during the fiscal years ended December 31, 2016 and December 31, 2017 was as follows:
| | | | | | | | |
| | | 2016 | | | 2017 | |
| Distributions paid from: | | | | | | | | |
Ordinary income | | $ | 9,870,345 | | | $ | 4,618,182 | |
Net long-term capital gains | | | 235,384 | | | | 41,615,328 | |
| Total taxable distributions | | $ | 10,105,729 | | | $ | 46,233,510 | |
As of December 31, 2017, the components of accumulated earnings (losses) on a tax-basis were as follows:(1)
| | | | |
| Undistributed ordinary income — net | | $ | 911,049 | |
| Undistributed long-term capital gains | | | 4,345,673 | |
| Total undistributed earnings | | $ | 5,256,722 | |
| Timing differences (Deferred Dividend) | | | 381,636 | |
| Unrealized gains — net | | | 93,046,436 | |
| Total accumulated gains — net | | $ | 98,684,794 | |
| (1) | The Fund utilized $30,069,451 of capital losses in the current fiscal year. |
As of December 31, 2017, the Fund’s aggregate security unrealized gains and losses based on cost for U.S. federal income tax purposes were as follows:
| | | | |
| Tax cost | | $ | 658,330,393 | |
| Gross unrealized gain | | | 104,552,313 | |
| Gross unrealized loss | | | (11,505,877 | ) |
| Net unrealized gain | | $ | 93,046,436 | |
The difference between GAAP-basis and tax-basis unrealized gains (losses) is attributable primarily to wash sales and differences in the tax treatment of underlying fund investments.
In order to present certain components of the Fund’s capital accounts on a tax-basis, the Fund has reclassified $293,789 from undistributed net investment income to accumulated net realized gain. This reclassification has no impact on the NAV of the Fund and results primarily from dividend resignations and differences in the tax treatment of underlying fund investments.
GSAM has reviewed the Fund’s tax positions for all open tax years (the current and prior three years, as applicable) and has concluded that no provision for income tax is required in the Fund’s financial statements. Such open tax years remain subject to examination and adjustment by tax authorities.
8. OTHER RISKS
The Fund’s risks include, but are not limited to, the following:
Foreign Countries Risk — Investing in foreign markets may involve special risks and considerations not typically associated with investing in the U. S. Foreign securities may be subject to risk of loss because of more or less foreign government regulation, less public information and less economic, political and social stability in the countries in which the Fund invests. The imposition of exchange controls (including repatriation restrictions), confiscations, trade restrictions (including tariffs) and other government restrictions by the U.S. or other governments, or from problems in share registration, settlement or custody, may also result in
20
GOLDMAN SACHS VARIABLE INSURANCE TRUST MID CAP VALUE FUND
8. OTHER RISKS (continued)
losses. Foreign risk also involves the risk of negative foreign currency rate fluctuations, which may cause the value of securities
denominated in such foreign currency (or other instruments through which the Fund has exposure to foreign currencies) to decline in value. Currency exchange rates may fluctuate significantly over short periods of time.
Foreign Custody Risk — If the Fund invests in foreign securities, the Fund may hold such securities and cash with foreign banks, agents, and securities depositories appointed by the Fund’s custodian (each a “Foreign Custodian”). Some foreign custodians may be recently organized or new to the foreign custody business. In some countries, Foreign Custodians may be subject to little or no regulatory oversight over, or independent evaluation of, their operations. Further, the laws of certain countries may place limitations on the Fund’s ability to recover its assets if a Foreign Custodian enters bankruptcy.
Geographic Risk — If the Fund focuses its investments in securities of issuers located in a particular country or geographic region, the Fund may be subjected, to a greater extent than if its investments were less focused, to the risks of volatile economic cycles and/or conditions and developments that may be particular to that country or region, such as: adverse securities markets; adverse exchange rates; adverse social, political, regulatory, economic, business, environmental or other developments; or natural disasters.
Investments in Other Investment Companies Risk — As a shareholder of another investment company, including an exchange-traded fund (“ETF”), the Fund will indirectly bear its proportionate share of any net management fees and other expenses paid by such other investment companies, in addition to the fees and expenses regularly borne by the Fund. ETFs are subject to risks that do not apply to conventional mutual funds, including but not limited to the following: (i) the market price of the ETF’s shares may trade at a premium or a discount to their NAV; and (ii) an active trading market for an ETF’s shares may not develop or be maintained.
Large Shareholder Transactions Risk — The Fund may experience adverse effects when certain large shareholders, such as other funds, participating insurance companies, accounts and Goldman Sachs affiliates, purchase or redeem large amounts of shares of the Fund. Such large shareholder redemptions may cause the Fund to sell portfolio securities at times when it would not otherwise do so, which may negatively impact the Fund’s NAV and liquidity. These transactions may also accelerate the realization of taxable income to shareholders if such sales of investments resulted in gains, and may also increase transaction costs. In addition, a large redemption could result in the Fund’s current expenses being allocated over a smaller asset base, leading to an increase in the Fund’s expense ratio. Similarly, large Fund share purchases may adversely affect the Fund’s performance to the extent that the Fund is delayed in investing new cash and is required to maintain a larger cash position than it ordinarily would.
Liquidity Risk — The Fund may make investments that are illiquid or that may become less liquid in response to market developments or adverse investor perceptions. Illiquid investments may be more difficult to value. Liquidity risk may also refer to the risk that the Fund will not be able to pay redemption proceeds within the allowable time period because of unusual market conditions, an unusually high volume of redemption requests, or other reasons. To meet redemption requests, the Fund may be forced to sell investments at an unfavorable time and/or under unfavorable conditions.
Market and Credit Risks — In the normal course of business, the Fund trades financial instruments and enters into financial transactions where risk of potential loss exists due to changes in the market (market risk). Additionally, the Fund may also be exposed to credit risk in the event that an issuer or guarantor fails to perform or that an institution or entity with which the Fund has unsettled or open transactions defaults.
9. INDEMNIFICATIONS
Under the Trust’s organizational documents, its Trustees, officers, employees and agents are indemnified, to the extent permitted by the Act and state law, against certain liabilities that may arise out of performance of their duties to the Fund. Additionally, in the course of business, the Fund enters into contracts that contain a variety of indemnification clauses. The Fund’s maximum exposure under these arrangements is unknown, as this would involve future claims that may be made against the Fund that have not yet occurred. However, GSAM believes the risk of loss under these arrangements to be remote.
21
GOLDMAN SACHS VARIABLE INSURANCE TRUST MID CAP VALUE FUND
Notes to Financial Statements (continued)
December 31, 2017
10. SUBSEQUENT EVENTS
Subsequent events after the Statement of Assets and Liabilities date have been evaluated, and GSAM has concluded that there is no impact requiring adjustment or disclosure in the financial statements.
11. SUMMARY OF SHARE TRANSACTIONS
Share activity is as follows:
| | | | | | | | | | | | | | | | |
| | | For the Fiscal Year Ended
December 31, 2017 | | | For the Fiscal Year Ended
December 31, 2016 | |
| | | Shares | | | Dollars | | | Shares | | | Dollars | |
| Institutional Shares | | | | | | | | | | | | | | | | |
| Shares sold | | | 705,644 | | | $ | 11,893,865 | | | | 1,446,124 | | | $ | 22,058,515 | |
| Reinvestment of distributions | | | 1,418,863 | | | | 23,836,905 | | | | 359,837 | | | | 5,865,348 | |
| Shares redeemed | | | (6,089,122 | ) | | | (102,715,737 | ) | | | (11,837,314 | ) | | | (176,540,514 | ) |
| | | | (3,964,615 | ) | | | (66,984,967 | ) | | | (10,031,353 | ) | | | (148,616,651 | ) |
| Service Shares | | | | | | | | | | | | | | | | |
| Shares sold | | | 816,894 | | | | 13,768,077 | | | | 7,792,442 | | | | 117,193,288 | |
| Reinvestment of distributions | | | 1,330,755 | | | | 22,396,605 | | | | 259,668 | | | | 4,240,381 | |
| Shares redeemed | | | (2,508,559 | ) | | | (42,423,533 | ) | | | (3,499,961 | ) | | | (52,135,159 | ) |
| | | | (360,910 | ) | | | (6,258,851 | ) | | | 4,552,149 | | | | 69,298,510 | |
| NET DECREASE | | | (4,325,525 | ) | | $ | (73,243,818 | ) | | | (5,479,204 | ) | | $ | (79,318,141 | ) |
22
Report of Independent Registered Public Accounting Firm
To the Board of Trustees of
Goldman Sachs Variable Insurance Trust and Shareholders of the Goldman Sachs Mid Cap Value Fund
Opinion on the Financial Statements
We have audited the accompanying statement of assets and liabilities, including the schedule of investments, of the Goldman Sachs Mid Cap Value Fund (the “Fund”) as of December 31, 2017, the related statement of operations for the year ended December 31, 2017, the statements of changes in net assets for each of the two years in the period ended December 31, 2017, including the related notes, and the financial highlights for each of the five years in the period ended December 31, 2017 (collectively referred to as the “financial statements”). In our opinion, the financial statements present fairly, in all material respects, the financial position of the Fund as of December 31, 2017, the results of its operations for the year then ended, the changes in its net assets for each of the two years in the period ended December 31, 2017 and the financial highlights for each of the five years in the period ended December 31, 2017 in conformity with accounting principles generally accepted in the United States of America.
Basis for Opinion
These financial statements are the responsibility of the Fund’s management. Our responsibility is to express an opinion on the Fund’s financial statements based on our audits. We are a public accounting firm registered with the Public Company Accounting Oversight Board (United States) (“PCAOB”) and are required to be independent with respect to the Fund in accordance with the U.S. federal securities laws and the applicable rules and regulations of the Securities and Exchange Commission and the PCAOB.
We conducted our audits of these financial statements in accordance with the standards of the PCAOB. Those standards require that we plan and perform the audit to obtain reasonable assurance about whether the financial statements are free of material misstatement, whether due to error or fraud.
Our audits included performing procedures to assess the risks of material misstatement of the financial statements, whether due to error or fraud, and performing procedures that respond to those risks. Such procedures included examining, on a test basis, evidence regarding the amounts and disclosures in the financial statements. Our audits also included evaluating the accounting principles used and significant estimates made by management, as well as evaluating the overall presentation of the financial statements. Our procedures included confirmation of securities owned as of December 31, 2017 by correspondence with the custodian, transfer agent and brokers; when replies were not received from brokers, we performed other auditing procedures. We believe that our audits provide a reasonable basis for our opinion.
PricewaterhouseCoopers LLP
Boston, Massachusetts
February 14, 2018
We have served as the auditor of one or more investment companies in the Goldman Sachs Fund complex since 2000.
23
GOLDMAN SACHS VARIABLE INSURANCE TRUST MID CAP VALUE FUND
| | |
| Fund Expenses — Six Month Period Ended December 31, 2017 (Unaudited) | | |
As a shareholder of Institutional or Service Shares of the Fund, you incur ongoing costs, including management fees, distribution and/or service (12b-1) fees (with respect to Service Shares) and other Fund expenses. This example is intended to help you understand your ongoing costs (in dollars) of investing in the Institutional Shares and Service Shares of the Fund and to compare these costs with the ongoing costs of investing in other mutual funds.
The example is based on an investment of $1,000 invested at the beginning of the period and held for the entire period from July 1, 2017 through December 31, 2017, which represents a period of 184 days of a 365 day year.
Actual Expenses — The first line under each share class in the table below provides information about actual account values and actual expenses. You may use the information in this line, together with the amount you invested, to estimate the expenses that you paid over the period. Simply divide your account value by $1,000 (for example, an $8,600 account value divided by $1,000=8.6), then multiply the result by the number in the first line under the heading entitled “Expenses Paid” to estimate the expenses you paid on your account during this period.
Hypothetical Example for Comparison Purposes — The second line under each share class in the table below provides information about hypothetical account values and hypothetical expenses based on the Fund’s actual net expense ratio and an assumed rate of return of 5% per year before expenses, which is not the Fund’s actual return. The hypothetical account values and expenses may not be used to estimate the actual ending account balance or expenses you paid for the period. You may use this information to compare the ongoing costs of investing in the Fund and other funds. To do so, compare this 5% hypothetical example with the 5% hypothetical examples that appear in the shareholder reports of the other funds.
Please note that the expenses shown in the table are meant to highlight your ongoing costs only. As a shareholder of the Fund you do not incur any transaction costs, such as sales charges, redemption fees, or exchange fees, but shareholders of other funds may incur such costs. The second line of the table is useful in comparing ongoing costs only and will not help you determine the relative total costs of owning different funds whose shareholders may incur transaction costs.
| | | | | | | | | | | | |
| Share Class | | Beginning
Account Value
07/01/17 | | | Ending Account Value 12/31/17 | | | Expenses Paid for the 6 Months Ended 12/31/17* | |
| Institutional | | | | | | | | | | | | |
| Actual | | $ | 1,000 | | | $ | 1,067.30 | | | $ | 4.38 | |
| Hypothetical 5% return | | | 1,000 | | | | 1,020.97 | + | | | 4.28 | |
| Service | | | | | | | | | | | | |
| Actual | | | 1,000 | | | | 1,066.50 | | | | 5.68 | |
| Hypothetical 5% return | | | 1,000 | | | | 1,019.71 | + | | | 5.55 | |
| | * | Expenses are calculated using the Fund’s annualized net expense ratio for each class, which represents the ongoing expenses as a percentage of net assets for the six months ended December 31, 2017. Expenses are calculated by multiplying the annualized net expense ratio by the average account value for the period; then multiplying the result by the number of days in the most recent fiscal half year; and then dividing that result by the number of days in the fiscal year. The annualized net expense ratios for the period were 0.84% and 1.09% for Institutional and Service Shares, respectively. | |
| | + | Hypothetical expenses are based on the Fund’s actual annualized net expense ratios and an assumed rate of return of 5% per year before expenses. | |
24
GOLDMAN SACHS VARIABLE INSURANCE TRUST MID CAP VALUE FUND
Trustees and Officers (Unaudited)
Independent Trustees
| | | | | | | | | | |
| | | | | |
Name,
Address and Age1 | | Position(s) Held with the Trust | | Term of Office and
Length of
Time Served2 | | Principal Occupation(s) During Past 5 Years | | Number of
Portfolios in
Fund Complex
Overseen by
Trustee3 | | Other Directorships Held by Trustee4 |
Jessica Palmer Age: 68 | | Chair of the Board of Trustees | | 2018 (Trustee since 2007) | | Ms. Palmer is retired. She is Director, Emerson Center for the Arts and Culture (2011-Present); and was formerly a Consultant, Citigroup Human Resources Department (2007-2008); Managing Director, Citigroup Corporate and Investment Banking (previously, Salomon Smith Barney/Salomon Brothers) (1984-2006). Ms. Palmer was a Member of the Board of Trustees of Indian Mountain School (private elementary and secondary school) (2004-2009). Trustee — Goldman Sachs Trust and Goldman Sachs Variable Insurance Trust. | | 105 | | None |
Kathryn A. Cassidy Age: 63 | | Trustee | | Since 2015 | | Ms. Cassidy is retired. Formerly, she was Advisor to the Chairman (May 2014-December 2014); and Senior Vice President and Treasurer (2008-2014), General Electric Company & General Electric Capital Corporation (technology and financial services companies). Trustee — Goldman Sachs Trust and Goldman Sachs Variable Insurance Trust. | | 105 | | None |
Diana M. Daniels Age: 68 | | Trustee | | Since 2007 | | Ms. Daniels is retired. Formerly, she was Vice President, General Counsel and Secretary, The Washington Post Company (1991-2006). Ms. Daniels is a Trustee Emeritus and serves as a Presidential Councillor of Cornell University (2013-Present); former Member of the Legal Advisory Board, New York Stock Exchange (2003-2006) and of the Corporate Advisory Board, Standish Mellon Management Advisors (2006-2007). Trustee — Goldman Sachs Trust and Goldman Sachs Variable Insurance Trust. | | 105 | | None |
Herbert J. Markley Age: 67 | | Trustee | | Since 2013 | | Mr. Markley is retired. Formerly, he was Executive Vice President, Deere & Company (an agricultural and construction equipment manufacturer) (2007-2009); and President, Agricultural Division, Deere & Company (2001-2007). Previously, Mr. Markley served as an Advisory Board Member of Goldman Sachs Trust and Goldman Sachs Variable Insurance Trust (June 2013-October 2013). Trustee — Goldman Sachs Trust and Goldman Sachs Variable Insurance Trust. | | 105 | | None |
Roy W. Templin Age: 57 | | Trustee | | Since 2013 | | Mr. Templin is retired. He is Director, Armstrong World Industries, Inc. (a designer and manufacturer of ceiling, wall and suspension system solutions) (2016–Present); and was formerly Chairman of the Board of Directors, Con-Way Incorporated (a transportation, logistics and supply chain management service company) (2014-2015); Executive Vice President and Chief Financial Officer, Whirlpool Corporation (an appliance manufacturer and marketer) (2004-2012). Previously, Mr. Templin served as an Advisory Board Member of Goldman Sachs Trust and Goldman Sachs Variable Insurance Trust (June 2013-October 2013). Trustee — Goldman Sachs Trust and Goldman Sachs Variable Insurance Trust. | | 105 | | Armstrong World Industries, Inc. (a ceiling, wall and suspension systems solutions manufacturer) |
Gregory G. Weaver Age: 66 | | Trustee | | Since 2015 | | Mr. Weaver is retired. He is Director, Verizon Communications Inc. (2015-Present); and was formerly Chairman and Chief Executive Officer, Deloitte & Touche LLP (a professional services firm) (2001-2005 and 2012-2014); and Member of the Board of Directors, Deloitte & Touche LLP (2006-2012). Trustee — Goldman Sachs Trust and Goldman Sachs Variable Insurance Trust. | | 105 | | Verizon Communications Inc. |
| | | | | | | | | | |
25
GOLDMAN SACHS VARIABLE INSURANCE TRUST MID CAP VALUE FUND
Trustees and Officers (Unaudited) (continued)
Interested Trustee*
| | | | | | | | | | |
| | | | | |
Name,
Address and Age1 | | Position(s) Held with the Trust | | Term of Office and
Length of
Time Served2 | | Principal Occupation(s) During Past 5 Years | | Number of
Portfolios in
Fund Complex
Overseen by
Trustee3 | | Other Directorships Held by Trustee4 |
James A. McNamara Age: 55 | | President and Trustee | | Since 2007 | | Managing Director, Goldman Sachs (January 2000-Present); Director of Institutional Fund Sales, GSAM (April 1998-December 2000); and Senior Vice President and Manager, Dreyfus Institutional Service Corporation (January 1993- April 1998). President and Trustee — Goldman Sachs Trust; Goldman Sachs Variable Insurance Trust; Goldman Sachs Trust II; Goldman Sachs MLP Income Opportunities Fund; Goldman Sachs MLP and Energy Renaissance Fund; Goldman Sachs ETF Trust; Goldman Sachs Private Markets Fund 2018 LLC; Goldman Sachs Private Markets Fund 2018 (A) LLC; and Goldman Sachs Private Markets Fund 2018 (B) LLC. | | 146 | | None |
| | | | | | | | | | |
| * | Mr. McNamara is considered to be an “Interested Trustee” because he holds positions with Goldman Sachs and owns securities issued by The Goldman Sachs Group, Inc. Mr. McNamara holds comparable positions with certain other companies of which Goldman Sachs, GSAM or an affiliate thereof is the investment adviser, administrator and/or distributor. |
| 1 | Each Trustee may be contacted by writing to the Trustee, c/o Goldman Sachs, 200 West Street, New York, New York, 10282, Attn: Caroline Kraus. Information is provided as of December 31, 2017. |
| 2 | Subject to such policies as may be adopted by the Board from time-to-time, each Trustee holds office for an indefinite term, until the earliest of: (a) the election of his or her successor; (b) the date the Trustee resigns or is removed by the Board or shareholders, in accordance with the Trust’s Declaration of Trust; or (c) the termination of the Trust. The Board has adopted policies which provide that (a) no Trustee shall hold office for more than 15 years and (b) a Trustee shall retire as of December 31st of the calendar year in which he or she reaches his or her 74th birthday, unless a waiver of such requirement shall have been adopted by a majority of the other Trustees. These policies may be changed by the Trustees without shareholder vote. |
| 3 | The Goldman Sachs Fund Complex includes certain other companies listed above for each respective Trustee. As of December 31, 2017, Goldman Sachs Trust consisted of 91 portfolios (90 of which offered shares to the public); Goldman Sachs Variable Insurance Trust consisted of 14 portfolios; Goldman Sachs Trust II consisted of 17 portfolios (16 of which offered shares to the public); Goldman Sachs BDC, Inc., Goldman Sachs Private Middle Market Credit LLC, Goldman Sachs MLP Income Opportunities Fund, Goldman Sachs MLP and Energy Renaissance Fund, Goldman Sachs Private Markets Fund 2018 LLC, Goldman Sachs Private Markets Fund 2018 (A) LLC and Goldman Sachs Private Markets Fund 2018 (B) LLC each consisted of one portfolio; and Goldman Sachs ETF Trust consisted of 19 portfolios (12 of which offered shares to the public). Goldman Sachs Private Middle Market Credit LLC, Goldman Sachs Private Markets Fund 2018 LLC, Goldman Sachs Private Markets Fund 2018 (A) LLC and Goldman Sachs Private Markets Fund 2018 (B) LLC do not offer shares to the public. |
| 4 | This column includes only directorships of companies required to report to the Securities and Exchange Commission under the Securities Exchange Act of 1934 (i.e., “public companies”) or other investment companies registered under the Act. |
Additional information about the Trustees is available in the Fund’s Statement of Additional Information, which can be obtained from Goldman Sachs free of charge by calling this toll-free number (in the United States of America): 1-800-526-7384.
26
GOLDMAN SACHS VARIABLE INSURANCE TRUST MID CAP VALUE FUND
Trustees and Officers (Unaudited) (continued)
Officers of the Trust*
| | | | | | |
| | | |
| Name, Address and Age1 | | Position(s) Held with the Trust | | Term of
Office and
Length of
Time Served2 | | Principal Occupation(s) During Past 5 Years |
James A. McNamara 200 West Street New York, NY 10282 Age: 55 | | Trustee and President | | Since 2007 | | Managing Director, Goldman Sachs (January 2000-Present); Director of Institutional Fund Sales, GSAM (April 1998-December 2000); and Senior Vice President and Manager, Dreyfus Institutional Service Corporation (January 1993-April 1998). President and Trustee — Goldman Sachs Trust; Goldman Sachs Variable Insurance Trust; Goldman Sachs Trust II; Goldman Sachs MLP Income Opportunities Fund; Goldman Sachs MLP and Energy Renaissance Fund; Goldman Sachs ETF Trust; Goldman Sachs Private Markets Fund 2018 LLC; Goldman Sachs Private Markets Fund 2018 (A) LLC; and Goldman Sachs Private Markets Fund 2018 (B) LLC. |
Caroline L. Kraus 200 West Street New York, NY 10282 Age: 40 | | Secretary | | Since 2012 | | Managing Director, Goldman Sachs (January 2016-Present); Vice President, Goldman Sachs (August 2006-December 2015); Associate General Counsel, Goldman Sachs (2012-Present); Assistant General Counsel, Goldman Sachs (August 2006-December 2011); and Associate, Weil, Gotshal & Manges, LLP (2002-2006). Secretary — Goldman Sachs Trust (previously Assistant Secretary (2012)); Goldman Sachs Variable Insurance Trust (previously Assistant Secretary (2012)); Goldman Sachs Trust II; Goldman Sachs BDC, Inc.; Goldman Sachs Private Middle Market Credit LLC; Goldman Sachs Middle Market Lending Corp.; Goldman Sachs MLP Income Opportunities Fund; Goldman Sachs MLP and Energy Renaissance Fund; Goldman Sachs ETF Trust; Goldman Sachs Private Markets Fund 2018 LLC; Goldman Sachs Private Markets Fund 2018 (A) LLC; and Goldman Sachs Private Markets Fund 2018 (B) LLC. |
Scott M. McHugh 200 West Street New York, NY 10282 Age: 46 | | Treasurer, Senior Vice President and Principal Financial Officer | | Since 2009 (Principal Financial Officer since 2013) | | Managing Director, Goldman Sachs (January 2016-Present); Vice President, Goldman Sachs (February 2007-December 2015); Assistant Treasurer of certain mutual funds administered by DWS Scudder (2005-2007); and Director (2005-2007), Vice President (2000-2005), and Assistant Vice President (1998-2000), Deutsche Asset Management or its predecessor (1998-2007). Treasurer, Senior Vice President and Principal Financial Officer — Goldman Sachs Trust; Goldman Sachs Variable Insurance Trust; Goldman Sachs Trust II; Goldman Sachs MLP Income Opportunities Fund; Goldman Sachs MLP and Energy Renaissance Fund; Goldman Sachs ETF Trust; Goldman Sachs Private Markets Fund 2018 LLC; Goldman Sachs Private Markets Fund 2018 (A) LLC; and Goldman Sachs Private Markets Fund 2018 (B) LLC. |
Joseph F. DiMaria 30 Hudson Street Jersey City, NJ 07302 Age: 49 | | Assistant Treasurer and Principal Accounting Officer | | Since 2016 (Principal Accounting Officer since 2017) | | Managing Director, Goldman Sachs (November 2015-Present) and Vice President — Mutual Fund Administration, Columbia Management Investment Advisers, LLC (May 2010-October 2015). Assistant Treasurer and Principal Accounting Officer — Goldman Sachs Trust; Goldman Sachs Variable Insurance Trust; Goldman Sachs Trust II; Goldman Sachs MLP Income Opportunities Fund; Goldman Sachs MLP and Energy Renaissance Fund; Goldman Sachs ETF Trust; Goldman Sachs Private Markets Fund 2018 LLC; Goldman Sachs Private Markets Fund 2018 (A) LLC; and Goldman Sachs Private Markets Fund 2018 (B) LLC. |
| | | | | | |
| * | Represents a partial list of officers of the Trust. Additional information about all the officers is available in the Fund’s Statement of Additional Information, which can be obtained from Goldman Sachs free of charge by calling this toll-free number (in the United States): 1-800-526-7384. |
| 1 | Information is provided as of December 31, 2017. |
| 2 | Officers hold office at the pleasure of the Board of Trustees or until their successors are duly elected and qualified. Each officer holds comparable positions with certain other companies of which Goldman Sachs, GSAM or an affiliate thereof is the investment adviser, administrator and/or distributor. |
27
GOLDMAN SACHS VARIABLE INSURANCE TRUST MID CAP VALUE FUND
Goldman Sachs Variable Insurance Trust — Tax Information (Unaudited)
For the year ended December 31, 2017, 71.77% of the dividends paid from net investment company taxable income by the Mid Cap Value Fund qualify for the dividends received deduction available to corporations.
Pursuant to Section 852 of the Internal Revenue Code, the Mid Cap Value Fund designates $41,615,328 or, if different, the maximum amount allowable, as capital gain dividends paid during the fiscal year ended December 31, 2017.
28
| | |
| TRUSTEES | | OFFICERS |
Jessica Palmer, Chair Kathryn A. Cassidy Diana M. Daniels Herbert J. Markley James A. McNamara Roy W. Templin Gregory G. Weaver | | James A. McNamara, President Scott M. McHugh, Treasurer, Senior Vice President and Principal Financial Officer Joseph F. DiMaria, Assistant Treasurer and Principal Accounting Officer Caroline L. Kraus, Secretary |
GOLDMAN SACHS & CO. LLC
Distributor and Transfer Agent
GOLDMAN SACHS ASSET MANAGEMENT, L.P.
Investment Adviser
200 West Street, New York
New York 10282
Visit our web site at www.GSAMFUNDS.com to obtain the most recent month-end returns.
The reports concerning the Fund included in this shareholder report may contain certain forward-looking statements about the factors that may affect the performance of the Fund in the future. These statements are based on Fund management’s predictions and expectations concerning certain future events and their expected impact on the Fund, such as performance of the economy as a whole and of specific industry sectors, changes in the levels of interest rates, the impact of developing world events, and other factors that may influence the future performance of the Fund. Management believes these forward-looking statements to be reasonable, although they are inherently uncertain and difficult to predict. Actual events may cause adjustments in portfolio management strategies from those currently expected to be employed.
A description of the policies and procedures that the Fund uses to determine how to vote proxies relating to portfolio securities and information regarding how the Fund voted proxies relating to portfolio securities for the 12-month period ended December 31 is available (i) without charge, upon request by calling 1-800-621-2550; and (ii) on the Securities and Exchange Commission (“SEC”) web site at http://www.sec.gov.
The Fund files its complete schedule of portfolio holdings with the SEC for the first and third quarters of each fiscal year on Form N-Q. The Fund’s Form N-Qs are available on the SEC’s web site at http://www.sec.gov within 60 days after the Fund’s first and third fiscal quarters. The Fund’s Form N-Qs may be reviewed and copied at the SEC’s Public Reference Room in Washington, D.C. and information on the operation of the Public Reference Room may also be obtained by calling 1-800-SEC-0330. Form N-Qs may be obtained upon request and without charge by calling 1-800-621-2550.
Views and opinions expressed are for informational purposes only and do not constitute a recommendation by GSAM to buy, sell, or hold any security. Views and opinions are current as of the date of this presentation and may be subject to change, they should not be construed as investment advice.
Goldman Sachs & Co. LLC (“Goldman Sachs”) does not provide legal, tax or accounting advice. Any statement contained in this communication (including any attachments) concerning U.S. tax matters was not intended or written to be used, and cannot be used, for the purpose of avoiding penalties under the Internal Revenue Code, and was written to support the promotion or marketing of transaction or matter addressed. Clients of Goldman Sachs should obtain their own independent tax advice based on their particular circumstances.
The website links provided are for your convenience only and are not an endorsement or recommendation by GSAM of any of these websites or the products or services offered. GSAM is not responsible for the accuracy and validity of the content of these websites.
Fund holdings and allocations shown are as of December 31, 2017 and may not be representative of future investments. Fund holdings should not be relied on in making investment decisions and should not be construed as research or investment advice regarding particular securities. Current and future holdings are subject to risk.
References to indices, benchmarks or other measures of relative market performance over a specified period of time are provided for your information only and do not imply that the portfolio will achieve similar results. The index composition may not reflect the manner in which a portfolio is constructed. While an adviser seeks to design a portfolio which reflects appropriate risk and return features, portfolio characteristics may deviate from those of the benchmark.
The Global Industry Classification Standard (“GICS”) was developed by and is the exclusive property and a service mark of Morgan Stanley Capital International Inc. (“MSCI”) and Standard & Poor’s, a division of The McGraw-Hill Companies, Inc. (“S&P”) and is licensed for use by Goldman Sachs. Neither MSCI, S&P nor any other party involved in making or compiling the GICS or any GICS classifications makes any express or implied warranties or representations with respect to such standard or classification (or the results to be obtained by the use thereof), and all such parties hereby expressly disclaim all warranties of originality, accuracy, completeness, merchantability or fitness for a particular purpose with respect to any of such standard or classification. Without limiting any of the foregoing, in no event shall MSCI, S&P, any of their affiliates or any third party involved in making or compiling the GICS or any GICS classifications have any liability for any direct, indirect, special, punitive, consequential or any other damages (including lost profits) even if notified of the possibility of such damages.
The portfolio risk management process includes an effort to monitor and manage risk, but does not imply low risk.
Shares of the Goldman Sachs VIT Funds are offered to separate accounts of participating life insurance companies for the purpose of funding variable annuity contracts and variable life insurance policies. Shares of the Fund are not offered directly to the general public. The variable annuity contracts and variable life insurance policies are described in the separate prospectuses issued by participating insurance companies. You should refer to those prospectuses for information about surrender charges, mortality and expense risk fees and other charges that may be assessed by participating insurance companies under the variable annuity contracts or variable life insurance policies. Such fees or charges, if any, may affect the return you may realize with respect to your investments. Ask your representative for more complete information. Please consider a fund’s objectives, risks and charges and expenses, and read the prospectus carefully before investing. The prospectus contains this and other information about the Fund.
This material is not authorized for distribution to prospective investors unless preceded or accompanied by a current prospectus or summary prospectus, if applicable. Investors should consider the Fund’s objective, risks, and charges and expenses, and read the summary prospectus, if available, and/or the prospectus carefully before investing or sending money. The summary prospectus, if available, and the prospectus contain this and other information about the Fund and may be obtained from your authorized dealer or from Goldman Sachs & Co. LLC by calling 1-800-621-2550.
THIS MATERIAL IS FOR INFORMATIONAL PURPOSES ONLY AND IS PROVIDED SOLELY ON THE BASIS THAT IT WILL NOT CONSTITUTE INVESTMENT OR OTHER ADVICE OR A RECOMMENDATION RELATING TO ANY PERSON’S OR PLAN’S INVESTMENT OR OTHER DECISIONS, AND GOLDMAN SACHS IS NOT A FIDUCIARY OR ADVISOR WITH RESPECT TO ANY PERSON OR PLAN BY REASON OF PROVIDING THE MATERIAL OR CONTENT HEREIN INCLUDING UNDER THE EMPLOYEE RETIREMENT INCOME SECURITY ACT OF 1974 OR DEPARTMENT OF LABOR REGULATIONS. PLAN SPONSORS AND OTHER FIDUCIARIES SHOULD CONSIDER THEIR OWN CIRCUMSTANCES IN ASSESSING ANY POTENTIAL COURSE OF ACTION.
This report is prepared for the general information of contract owners and is not an offer of shares of the Goldman Sachs Variable Insurance Trust — Goldman Sachs Mid Cap Value Fund.
© 2018 Goldman Sachs. All rights reserved.
VITMCVAR-18/121104-OTU-698899/30962
Goldman
Sachs Variable Insurance Trust
Goldman Sachs Government
Money Market Fund
Annual Report
December 31, 2017

You could lose money by investing in the Fund. Although the Fund seeks to preserve the value of your investment at $1.00 per share, it cannot guarantee it will do so. An investment in the Fund is not a deposit of the bank and is not insured or guaranteed by the Federal Deposit Insurance Corporation or any other government agency. The Fund’s sponsor has no legal obligation to provide financial support to the Fund, and you should not expect that the sponsor will provide financial support to the Fund at any time.
GOLDMAN SACHS VARIABLE INSURANCE TRUST GOVERNMENT MONEY MARKET FUND
INVESTMENT OBJECTIVE
The Fund seeks to maximize current income to the extent consistent with the preservation of capital and the maintenance of liquidity by investing exclusively in high quality money market instruments.
Portfolio Management Discussion and Analysis
Below, the Goldman Sachs Money Market Portfolio Management Team discusses the Goldman Sachs Variable Insurance Trust — Goldman Sachs Government Money Market Fund’s (the “Fund”) performance and positioning for the 12-month period ended December 31, 2017 (the “Reporting Period”).
How did the Fund perform during the Reporting Period?
The Fund’s Institutional Shares’ standardized 7-day current yield was 1.21% and their standardized 7-day effective yield was 1.21% as of December 31, 2017. The Institutional Shares’ one-month simple average yield was 1.08% as of December 31, 2017. The Institutional Shares’ 7-day distribution yield as of December 31, 2017 was 1.21%.
The Fund’s Service Shares’ standardized 7-day current yield was 0.96% and their standardized 7-day effective yield was 0.96% as of December 31, 2017. The Service Shares’ one-month simple average yield was 0.83% as of December 31, 2017. The Service Shares’ 7-day distribution yield as of December 31, 2017 was 0.96%.
The yields represent past performance. Past performance does not guarantee future results. Current performance may be lower or higher than the performance quoted above.
Yields will fluctuate as market conditions change. The yield quotations more closely reflect the current earnings of the Fund than total return quotations.
What economic and market factors most influenced the money markets as a whole during the Reporting Period?
The Reporting Period was one wherein money market yields remained low throughout, but did move higher as the Federal Reserve (the “Fed”) proceeded to raise the target range of the federal funds rate three times, bringing it to a range of 1.25% to 1.50% by the end of December 2017. In making its three interest rate hikes — one in March 2017, one in June 2017 and one in December 2017, the Fed cited ongoing strength in the U.S. labor market and a pick-up in household spending and business fixed investment. The money market yield curve, or spectrum of maturities, flattened, meaning differentials between yields on shorter-term maturities rose more than on longer-term maturities during the Reporting Period. Other significant events that influenced the money markets during the Reporting Period included the Fed’s discussion and then implementation of balance sheet normalization beginning in October 2017, the expectation of the European Central Bank (“ECB”) tapering its asset purchases early in 2018, and U.K. parliamentary elections. (Balance sheet normalization refers to the steps the Fed will take to reverse quantitative easing and remove the substantial monetary accommodation it has provided to the economy since the financial crisis began in 2007.)
What key factors were responsible for the Fund’s performance during the Reporting Period?
The Fund’s yields remained low but did rise during the Reporting Period due primarily to the market factors discussed above. The targeted federal funds rate was gradually increased during the Reporting Period to a range of 1.25% to 1.50%, and, as such, money market yields similarly rose modestly though with little difference between maturities during that time. As mentioned, the money market yield curve, or spectrum of maturities, flattened during the Reporting Period overall, as shorter-term rates rose more than longer-term rates did. The Fund remained highly liquid throughout.
We felt comfortable that the Fund was appropriately positioned given the interest rate environment during the Reporting Period, as we sought to take advantage of anticipated interest rate movements throughout. While conditions throughout the Reporting Period did not provide bountiful opportunities to pick up yield, as the interest rate yield curve flattened through most of the Reporting Period, it should be noted that regardless of interest rate conditions, we manage the Fund consistently. Our investment approach has always been tri-fold — to seek preservation of capital, daily liquidity and maximization of yield potential. We manage interest and credit risk daily. Whether interest rates are historically low, high or in-between, we intend to continue to use our actively managed approach to provide the best possible return within the framework of the Fund’s guidelines and objectives.
1
GOLDMAN SACHS VARIABLE INSURANCE TRUST GOVERNMENT MONEY MARKET FUND
How did you manage the Fund’s weighted average maturity during the Reporting Period?
On December 31, 2016, the Fund’s weighted average maturity was 55 days. During the first quarter of 2017, we targeted a weighted average maturity for the Fund in a 30 to 45 day range in anticipation of the March 2017 federal debt ceiling deadline. We had a bias in the Fund to move shorter during the first calendar quarter and targeted a 30 to 35 day weighted average maturity range by the end of March 2017. We focused the Fund’s purchases on U.S. Treasury debt and U.S. government agency securities, which helped us manage duration in the event of a more aggressive than consensus-expected Fed interest rate hike scenario. (Duration is a measure of a portfolio’s sensitivity to changes in interest rates.)
During the second quarter of 2017, because of comments from the Fed about a potential June 2017 interest rate increase, we targeted a weighted average maturity for the Fund in a 29 to 35 day range, moving down to a weighted average maturity of 26 days by the end of June 2017. We continued to focus on U.S. government agency securities, U.S. government repurchase agreements and U.S. Treasuries when and where we saw what we considered to be attractive opportunities. As the U.S. Treasury money market yield curve steepened ahead of the widely anticipated June 2017 Fed interest rate hike, we also identified what we believed to be compelling opportunities at the longer end of the U.S. Treasury money market yield curve. (A steepening yield curve is one wherein yields on longer-term maturities move higher than those on shorter-term maturities.) After the Fed raised interest rates at its June 2017 meeting, we allowed the weighted average maturity of the Fund to extend to a range of between 33 days and 37 days.
During July 2017, we kept the Fund’s weighted average maturity in a range between 26 days and 34 days. Yields did not, in our view, offer enough compensation to extend maturities. We focused the Fund’s purchases on U.S. government agency debt, which offered what we considered to be attractive opportunities. In August 2017, as market expectations of a U.S. debt ceiling deal stayed strong, we maintained the Fund’s weighted average maturity in a range between 25 days and 33 days. In September 2017, we selectively added exposure to U.S. Treasury notes maturing in October 2017 and shortened the Fund’s weighted average maturity to range of between 20 days and 27 days.
Heading into the fourth calendar quarter, we further shortened the Fund’s weighted average maturity to a range of between 15 days and 23 days ahead of the consensus-anticipated Fed interest rate hike in December 2017. After the Fed indeed raised interest rates in mid-December 2017, we allowed the Fund’s weighted average maturity to extend from approximately 15 days to 23 days. The Fund’s weighted average maturity on December 31, 2017 was 18 days. The weighted average maturity of a money market fund is a measure of its price sensitivity to changes in interest rates. Also known as effective maturity, weighted average maturity measures the weighted average of the maturity date of bonds held by the Fund taking into consideration any available maturity shortening features.
How did you manage the Fund’s weighted average life during the Reporting Period?
During the Reporting Period, we managed the weighted average life of the Fund below 120 days. The weighted average life of the Fund was 91 days as of December 31, 2017. The weighted average life of a money market fund is a measure of a money market fund’s price sensitivity to changes in liquidity and/or credit risk.
Under SEC Rule 2a-7, the maximum allowable weighted average life of a money market fund is 120 days. While one of the goals of the SEC’s money market fund rule is to reinforce conservative investment practices across the money market fund industry, our security selection process has long emphasized conservative investment choices.
How was the Fund invested during the Reporting Period?
The Fund had investments in U.S. government agency debt, U.S. Treasury securities and U.S. government agency repurchase agreements during the Reporting Period.
With yields bounds in a still-low range, there was not a lot of dispersion in performance among securities available for purchase. Throughout, though, we stayed true to our investment discipline, favoring liquidity and high quality credits over added yield. The primary focal points for our team are consistently managing interest rate risk and credit risk. We were able to navigate interest rate risk by adjusting the Fund’s weighted average maturity longer or shorter as market conditions shifted and to mitigate potential credit risk by buying high quality, creditworthy names, strategies which added to the Fund’s performance during the Reporting Period.
Did you make any changes in the Fund’s portfolio during the Reporting Period?
As indicated earlier, we made adjustments to the Fund’s weighted average maturity and to specific security type composition allocations based on then-current market conditions, our near-term view, and anticipated and actual Fed monetary policy statements. During the Reporting Period, the Fund’s exposure to U.S. government agency repurchase agreements increased slightly,
2
GOLDMAN SACHS VARIABLE INSURANCE TRUST GOVERNMENT MONEY MARKET FUND
with a proportional reduction in U.S. government agency debt. Exposure to U.S. Treasury securities remained rather constant through most of the Reporting Period. Our duration positioning in the Fund ahead of the June 2017 and December 2017 Fed meetings was particularly positive for the Fund.
What is the Fund’s tactical view and strategy for the months ahead?
At the end of the Reporting Period, we saw scope for three further interest rate hikes by the Fed over the course of 2018 — in addition to balance sheet normalization. We expect the Fed’s rundown to continue to be, as it has been since beginning in October 2017, at a rate of no greater than $10 billion a month, divided between mortgage-backed securities and U.S. Treasuries. At the end of its normalization process, anticipated by the Fed to be in either September or October 2018, we expect the Fed’s balance sheet to be larger than pre-2008 financial crisis norms and for quantitative easing to remain in its monetary policy toolbox for possible future use.
We expect the Fed to take the lead among developed markets’ central banks in terms of interest rate hikes and balance sheet normalization. That said, we anticipate central banks in Europe and Japan to scale back quantitative easing due to scarcity of assets but at the same time to maintain low rates amid subdued inflation outlooks.
Looking ahead, our strategy continues to be flexibly guided by shifting market conditions, positioning the Fund to seek to take advantage of anticipated interest rate movements. More specifically, at the end of the Reporting Period, we intended to adjust duration guided by the context of market pricing in relation to our expectations. As always, we intend to continue to use our actively managed approach to seek the best possible return within the framework of the Fund’s investment guidelines and objectives. In addition, we will continue to manage interest, liquidity and credit risk daily.
We will, of course, continue to closely monitor economic data, Fed policy, and any shifts in the money market yield curve, as we strive to strategically navigate the interest rate environment.
3
FUND BASICS
FUND COMPOSITION†
Security Type
(Percentage of Net Assets)

| † | The Fund is actively managed and, as such, its portfolio composition may differ over time. The percentage shown for each investment category reflects the value (based on amortized cost) of investments in that category as a percentage of net assets. Figures in the above chart may not sum to 100% due to the exclusion of other assets and liabilities. |
4
GOLDMAN SACHS VARIABLE INSURANCE TRUST GOVERNMENT MONEY MARKET FUND
Schedule of Investments
December 31, 2017
| | | | | | | | | | | | | | |
Principal
Amount | | | Interest
Rate | | | Maturity
Date | | | Amortized
Cost | |
| | U.S. Government Agency Obligations – 15.3% | |
| | Federal Farm Credit Bank (1 Mo. LIBOR – 0.09%) | |
| $ | 1,000,000 | | | | 1.473 | %(a) | | | 03/28/19 | | | $ | 1,000,000 | |
| | Federal Farm Credit Bank (3 Mo. LIBOR – 0.14%) | |
| | 1,700,000 | | | | 1.555 | (a) | | | 09/30/19 | | | | 1,699,851 | |
| | Federal Farm Credit Bank (3 Mo. U.S. T-Bill MMY + 0.07%)(a) | |
| | 1,300,000 | | | | 1.515 | | | | 11/20/19 | | | | 1,299,927 | |
| | 650,000 | | | | 1.515 | | | | 11/29/19 | | | | 650,000 | |
| | Federal Farm Credit Bank (3 Mo. U.S. T-Bill MMY + 0.08%)(a) | |
| | 800,000 | | | | 1.525 | | | | 10/18/19 | | | | 799,957 | |
| | 650,000 | | | | 1.525 | | | | 12/26/19 | | | | 649,949 | |
| | Federal Farm Credit Bank (3 Mo. U.S. T-Bill MMY + 0.09%)(a) | |
| | 800,000 | | | | 1.540 | | | | 02/19/19 | | | | 799,927 | |
| | 800,000 | | | | 1.535 | | | | 07/05/19 | | | | 799,976 | |
| | Federal Farm Credit Bank (Prime Rate – 3.08%)(a) | |
| | 250,000 | | | | 1.420 | | | | 06/27/19 | | | | 249,981 | |
| | 1,600,000 | | | | 1.420 | | | | 07/17/19 | | | | 1,599,753 | |
| | Federal Farm Credit Bank (Prime Rate – 3.12%) | |
| | 1,000,000 | | | | 1.380 | (a) | | | 01/24/19 | | | | 999,883 | |
| | Federal Home Loan Bank (1 Mo. LIBOR – 0.05%) | |
| | 2,800,000 | | | | 1.410 | (a) | | | 07/13/18 | | | | 2,800,000 | |
| | Federal Home Loan Bank (1 Mo. LIBOR – 0.08%) | |
| | 13,000,000 | | | | 1.415 | (a) | | | 03/19/19 | | | | 13,000,000 | |
| | Federal Home Loan Bank (1 Mo. LIBOR – 0.09%) | |
| | 1,200,000 | | | | 1.382 | (a) | | | 01/14/19 | | | | 1,200,000 | |
| | Federal Home Loan Bank (1 Mo. LIBOR – 0.10%) | |
| | 5,700,000 | | | | 1.396 | (a) | | | 04/18/19 | | | | 5,700,000 | |
| | Federal Home Loan Bank (1 Mo. LIBOR – 0.14%) | |
| | 1,300,000 | | | | 1.351 | (a) | | | 05/18/18 | | | | 1,300,000 | |
| | Federal Home Loan Bank (1 Mo. LIBOR – 0.15%) | |
| | 1,700,000 | | | | 1.346 | (a) | | | 05/18/18 | | | | 1,700,000 | |
| | Federal Home Loan Bank (1 Mo. LIBOR – 0.16%) | |
| | 6,300,000 | | | | 1.331 | (a) | | | 01/16/18 | | | | 6,300,000 | |
| | Federal Home Loan Bank (1 Mo. LIBOR – 0.17%)(a) | |
| | 5,500,000 | | | | 1.330 | | | | 01/19/18 | | | | 5,500,000 | |
| | 6,800,000 | | | | 1.370 | | | | 01/22/18 | | | | 6,800,000 | |
| | 3,400,000 | | | | 1.387 | | | | 01/23/18 | | | | 3,400,000 | |
| | 2,000,000 | | | | 1.387 | | | | 01/25/18 | | | | 2,000,000 | |
| | 6,000,000 | | | | 1.387 | | | | 01/26/18 | | | | 6,000,000 | |
| | Federal Home Loan Bank (1 Mo. LIBOR + 0.01%)(a) | |
| | 4,000,000 | | | | 1.505 | | | | 06/19/18 | | | | 4,000,000 | |
| | 2,710,000 | | | | 1.574 | | | | 06/28/18 | | | | 2,710,000 | |
| | Federal Home Loan Bank (3 Mo. LIBOR – 0.11%) | |
| | 2,000,000 | | | | 1.286 | (a) | | | 02/05/18 | | | | 2,000,000 | |
| | Federal Home Loan Bank (3 Mo. LIBOR – 0.15%)(a) | |
| | 2,000,000 | | | | 1.266 | | | | 02/15/18 | | | | 2,000,000 | |
| | 3,000,000 | | | | 1.296 | | | | 02/22/18 | | | | 3,000,000 | |
| | Federal Home Loan Bank (3 Mo. LIBOR – 0.16%) | |
| | 1,800,000 | | | | 1.318 | (a) | | | 03/01/18 | | | | 1,800,150 | |
| | Federal Home Loan Bank (3 Mo. LIBOR – 0.17%)(a) | |
| | 1,430,000 | | | | 1.418 | | | | 03/15/18 | | | | 1,430,000 | |
| | 1,430,000 | | | | 1.430 | | | | 03/16/18 | | | | 1,429,985 | |
| | Federal Home Loan Bank (3 Mo. LIBOR – 0.22%)(a) | |
| | 4,000,000 | | | | 1.455 | | | | 03/23/18 | | | | 4,000,000 | |
| | 600,000 | | | | 1.129 | | | | 07/09/18 | | | | 599,984 | |
| | 800,000 | | | | 1.137 | | | | 07/12/18 | | | | 799,979 | |
| | |
| | U.S. Government Agency Obligations – (continued) | |
| | Federal Home Loan Bank Discount Note | |
| $ | 4,030,000 | | | | 1.160 | % | | | 01/19/18 | | | $ | 4,027,715 | |
| | Federal Home Loan Mortgage Corporation | |
| | 2,470,000 | | | | 0.750 | | | | 01/12/18 | | | | 2,469,811 | |
| Federal Home Loan Mortgage Corporation
(3 Mo. LIBOR – 0.03%)(a) |
|
| | 3,000,000 | | | | 1.319 | | | | 01/08/18 | | | | 3,000,000 | |
| | 1,000,000 | | | | 1.327 | | | | 01/12/18 | | | | 1,000,000 | |
| | |
| TOTAL U.S. GOVERNMENT AGENCY
OBLIGATIONS |
| | $ | 100,516,828 | |
| | |
| | | | | | | | | | | | | | |
| | U.S. Treasury Obligations – 16.4% | |
| | United States Treasury Bills | |
| $ | 2,500,000 | | | | 1.271 | % | | | 01/18/18 | | | $ | 2,498,530 | |
| | 100,000 | | | | 1.276 | | | | 02/01/18 | | | | 99,892 | |
| | 800,000 | | | | 1.314 | | | | 03/08/18 | | | | 798,115 | |
| | 2,200,000 | | | | 1.207 | | | | 03/22/18 | | | | 2,194,211 | |
| | 100,000 | | | | 1.375 | | | | 03/22/18 | | | | 99,701 | |
| | 2,200,000 | | | | 1.411 | | | | 03/29/18 | | | | 2,192,663 | |
| | 700,000 | | | | 1.417 | | | | 03/29/18 | | | | 697,657 | |
| | 300,000 | | | | 1.463 | | | | 03/29/18 | | | | 298,963 | |
| | 3,000,000 | | | | 1.468 | | | | 03/29/18 | | | | 2,989,596 | |
| | 600,000 | | | | 1.463 | (b) | | | 04/05/18 | | | | 597,831 | |
| | 6,600,000 | | | | 1.269 | | | | 04/19/18 | | | | 6,575,448 | |
| | 300,000 | | | | 1.356 | | | | 04/19/18 | | | | 298,807 | |
| | 300,000 | | | | 1.386 | | | | 04/19/18 | | | | 298,781 | |
| | 400,000 | | | | 1.438 | | | | 05/03/18 | | | | 398,095 | |
| | 100,000 | | | | 1.444 | | | | 05/10/18 | | | | 99,495 | |
| | 500,000 | | | | 1.470 | | | | 05/10/18 | | | | 497,429 | |
| | 200,000 | | | | 1.445 | | | | 05/24/18 | | | | 198,880 | |
| | 200,000 | | | | 1.450 | | | | 05/24/18 | | | | 198,876 | |
| | 800,000 | | | | 1.471 | | | | 05/31/18 | | | | 795,217 | |
| | 14,800,000 | | | | 1.497 | | | | 06/14/18 | | | | 14,701,564 | |
| | 17,500,000 | | | | 1.518 | | | | 06/21/18 | | | | 17,376,975 | |
| | 2,600,000 | | | | 1.569 | | | | 06/28/18 | | | | 2,580,331 | |
| United States Treasury Floating Rate Note (3 Mo. U.S. T-Bill
MMY + 0.05%) |
|
| | 46,000,000 | | | | 1.498 | (a) | | | 10/31/19 | | | | 46,008,249 | |
| United States Treasury Floating Rate Note (3 Mo. U.S. T-Bill
MMY + 0.27%) |
|
| | 2,000,000 | | | | 1.722 | (a) | | | 01/31/18 | | | | 2,000,487 | |
| | United States Treasury Notes | |
| | 2,800,000 | | | | 2.625 | | | | 01/31/18 | | | | 2,803,321 | |
| | 200,000 | | | | 1.000 | | | | 02/15/18 | | | | 199,933 | |
| | |
| TOTAL U.S. TREASURY
OBLIGATIONS |
| | $ | 107,499,047 | |
| | |
| TOTAL INVESTMENTS BEFORE
REPURCHASE AGREEMENTS |
| | $ | 208,015,875 | |
| | |
| | |
| The accompanying notes are an integral part of these financial statements. | | 5 |
GOLDMAN SACHS VARIABLE INSURANCE TRUST GOVERNMENT MONEY MARKET FUND
Schedule of Investments (continued)
December 31, 2017
| | | | | | | | | | | | | | |
Principal
Amount | | | Interest
Rate | | | Maturity
Date | | | Amortized
Cost | |
| | Repurchase Agreements(c) – 65.5% | |
| | Joint Repurchase Agreement Account III | |
| $ | 420,000,000 | | | | 1.399 | % | | | 01/02/18 | | | $ | 420,000,000 | |
| | Maturity Value: $420,065,296 | |
| | |
| | RBC Capital Markets LLC | |
| | 10,000,000 | | | | 1.320 | (d) | | | 01/07/18 | | | | 10,000,000 | |
| | Maturity Value: $10,021,633 | |
| | Settlement Date: 12/05/17 | |
| Collateralized by Federal Home Loan Mortgage Corp., 2.500% to
4.000%, due 12/01/32 to 12/15/47, Federal National Mortgage
Association, 3.000% to 4.000%, due 12/01/32 to 10/01/47 and
Government National Mortgage Association, 3.500%, due
12/20/47. The aggregate market value of the collateral,
including accrued interest, was $10,200,396. |
|
| | |
| | TOTAL REPURCHASE AGREEMENTS | | | $ | 430,000,000 | |
| | |
| | TOTAL INVESTMENTS – 97.2% | | | $ | 638,015,875 | |
| | |
| OTHER ASSETS IN EXCESS OF
LIABILITIES – 2.8% |
| | | 18,738,505 | |
| | |
| | NET ASSETS – 100.0% | | | $ | 656,754,380 | |
| | |
| | |
| The percentage shown for each investment category reflects the value of investments in that category as a percentage of net assets. |
| (a) | | Variable or floating rate security. Except for floating rate notes (for which final maturity is disclosed), maturity date disclosed is the next interest reset date. Interest rate disclosed is that which is in effect on December 31, 2017. |
| (b) | | All or a portion represents a forward commitment. |
| (c) | | Unless noted, all repurchase agreements were entered into on December 29, 2017. Additional information on Joint Repurchase Agreement Account III appears on page 7. |
| (d) | | The instrument is subject to a demand feature. |
Interest rates represent either the stated coupon rate, annualized yield on date of purchase for discounted securities, or, for floating rate securities, the current reset rate, which is based upon current interest rate indices.
Maturity dates represent either the final legal maturity date on the security, the demand date for puttable securities, or the prerefunded date for those types of securities.
| | |
| Investment Abbreviations: |
| LIBOR | | —London Interbank Offered Rates |
| MMY | | —Money Market Yield |
| Prime | | —Federal Reserve Bank Prime Loan Rate US |
| T-Bill | | —Treasury Bill |
| | |
| 6 | | The accompanying notes are an integral part of these financial statements. |
GOLDMAN SACHS VARIABLE INSURANCE TRUST GOVERNMENT MONEY MARKET FUND
ADDITIONAL INVESTMENT INFORMATION
JOINT REPURCHASE AGREEMENT ACCOUNT III — At December 31, 2017, the Fund had undivided interests in the Joint Repurchase Agreement Account III, with a maturity date of January 2, 2018, as follows:
| | | | | | | | | | | | | |
| Principal Amount | | Maturity Value | | Collateral Value |
| | | $420,000,000 | | | | $ | 420,065,296 | | | | $ | 431,702,946 | |
REPURCHASE AGREEMENTS — At December 31, 2017, the Principal Amounts of the Fund’s interest in the Joint Repurchase Agreement Account III were as follows:
| | | | | | | | |
| Counterparty | | Interest
Rate | | | Principal
Amount | |
| ABN Amro Bank N.V. | | | 1.400 | % | | $ | 38,305,954 | |
| Bank of America, N.A. | | | 1.420 | | | | 22,532,914 | |
| Bank of Nova Scotia (The) | | | 1.370 | | | | 99,144,822 | |
| BNP Paribas | | | 1.400 | | | | 31,546,080 | |
| Citigroup Global Markets, Inc. | | | 1.400 | | | | 27,670,419 | |
| Merrill Lynch, Pierce, Fenner & Smith, Inc. | | | 1.420 | | | | 18,283,207 | |
| TD Securities USA, LLC | | | 1.410 | | | | 13,519,748 | |
Wells Fargo Securities, LLC | | | 1.410 | | | | 168,996,856 | |
| TOTAL | | | | | | $ | 420,000,000 | |
At December 31, 2017, the Joint Repurchase Agreement Account III was fully collateralized by:
| | | | | | | | |
| Issuer | | Interest
Rates | | | Maturity
Dates | |
| Federal Farm Credit Bank | | | 1.307 to 3.430 | % | | | 06/20/19 to 10/26/37 | |
| Federal Home Loan Bank | | | 4.000 | | | | 09/01/28 | |
| Federal Home Loan Mortgage Corp. | | | 2.500 to 8.000 | | | | 01/01/21 to 12/01/47 | |
| Federal National Mortgage Association | | | 2.500 to 7.500 | | | | 01/01/21 to 12/01/47 | |
| Government National Mortgage Association | | | 2.500 to 6.500 | | | | 09/15/25 to 12/20/47 | |
| U.S. Treasury Bill | | | 0.000 | | | | 03/08/18 | |
| U.S. Treasury Bonds | | | 3.000 to 6.125 | | | | 08/15/29 to 02/15/47 | |
| U.S. Treasury Inflation-Indexed Bonds | | | 0.750 to 2.500 | | | | 01/15/28 to 02/15/46 | |
| U.S. Treasury Inflation-Indexed Notes | | | 0.125 to 0.375 | | | | 04/15/22 to 01/15/27 | |
| U.S. Treasury Interest-Only Stripped Securities | | | 0.000 | | | | 11/15/22 to 05/15/33 | |
| U.S. Treasury Notes | | | 0.750 to 3.625 | | | | 07/31/18 to 11/15/27 | |
| U.S. Treasury Principal-Only Stripped Securities | | | 0.000 | | | | 08/15/19 to 11/15/27 | |
| | |
| The accompanying notes are an integral part of these financial statements. | | 7 |
GOLDMAN SACHS VARIABLE INSURANCE TRUST GOVERNMENT MONEY MARKET FUND
Statement of Assets and Liabilities
December 31, 2017
| | | | |
| | | | |
| Assets: | | | |
Investments based on amortized cost | | $ | 208,015,875 | |
Repurchase agreements based on amortized cost | | | 430,000,000 | |
Cash | | | 52,418 | |
Receivables: | | | | |
Fund shares sold | | | 18,372,114 | |
Investment securities sold | | | 2,093,238 | |
Interest | | | 292,119 | |
Reimbursement from investment adviser | | | 28,141 | |
Other assets | | | 263 | |
| Total assets | | | 658,854,168 | |
| |
| | | | |
| Liabilities: | | | |
Payables: | | | | |
Fund shares redeemed | | | 1,252,049 | |
Investment securities purchased | | | 597,831 | |
Distribution and Service fees and Transfer Agency fees | | | 85,790 | |
Management fees | | | 79,609 | |
Accrued expenses | | | 84,509 | |
| Total liabilities | | | 2,099,788 | |
| | | | |
| | | | |
| Net Assets: | | | |
Paid-in capital | | | 656,761,144 | |
Undistributed net investment income | | | 6,724 | |
Accumulated net realized loss | | | (13,488 | ) |
| NET ASSETS | | $ | 656,754,380 | |
Net asset value, offering and redemption price per share | | $ | 1.00 | |
Net Assets: | | | | |
Institutional Shares | | $ | 302,506,778 | |
Service Shares | | | 354,247,602 | |
Total Net Assets | | $ | 656,754,380 | |
Shares of beneficial interest outstanding $0.001 par value (unlimited shares authorized): | | | | |
Institutional Shares | | | 302,510,407 | |
Service Shares | | | 354,250,718 | |
| | |
| 8 | | The accompanying notes are an integral part of these financial statements. |
GOLDMAN SACHS VARIABLE INSURANCE TRUST GOVERNMENT MONEY MARKET FUND
Statement of Operations
For the Fiscal Year Ended December 31, 2017
| | | | |
| | | | |
| Investment Income: | | | |
| |
Interest | | $ | 5,609,713 | |
| | | | |
| | | | |
| Expenses: | | | |
Management fees | | | 1,221,523 | |
Distribution and Service fees — Service Shares | | | 906,166 | |
Transfer Agency fees(a) | | | 119,173 | |
Professional fees | | | 94,051 | |
Printing and mailing costs | | | 61,810 | |
Custody, accounting and administrative services | | | 56,175 | |
Trustee fees | | | 14,354 | |
Other | | | 12,649 | |
| Total expenses | | | 2,485,901 | |
Less — expense reductions | | | (483,622 | ) |
| Net expenses | | | 2,002,279 | |
| NET INVESTMENT INCOME | | | 3,607,434 | |
| NET REALIZED LOSS FROM INVESTMENT TRANSACTIONS | | | (9,695 | ) |
| NET INCREASE IN NET ASSETS RESULTING FROM OPERATIONS | | $ | 3,597,739 | |
(a) Institutional and Service Shares incurred Transfer Agency fees of $46,680 and $72,493, respectively.
| | |
| The accompanying notes are an integral part of these financial statements. | | 9 |
GOLDMAN SACHS VARIABLE INSURANCE TRUST GOVERNMENT MONEY MARKET FUND
Statements of Changes in Net Assets
| | | | | | | | |
| | | For the
Fiscal Year Ended
December 31, 2017 | | | For the
Fiscal Year Ended
December 31, 2016 | |
| | | | | | | | |
| From operations: | |
Net investment income | | $ | 3,607,434 | | | $ | 297,342 | |
Net realized gain (loss) from investment transactions | | | (9,695 | ) | | | 45,052 | |
| Net increase in net assets resulting from operations | | | 3,597,739 | | | | 342,394 | |
| |
| | | | | | | | |
| Distributions to shareholders: | | | | | | |
From net investment income: | | | | | | | | |
Institutional Shares | | | (1,764,524 | ) | | | (193,798 | ) |
Service Shares | | | (1,838,690 | ) | | | (103,544 | ) |
From net realized gains: | | | | | | | | |
Institutional Shares | | | – | | | | (5,258 | ) |
Service Shares | | | – | | | | (42,567 | ) |
| Total distributions to shareholders | | | (3,603,214 | ) | | | (345,167 | ) |
| | | | | | | | |
| | | | | | | | |
| From share transactions (at $1.00 per share): | | | | | | |
Proceeds from sales of shares | | | 475,485,463 | | | | 542,052,079 | |
Reinvestment of distributions | | | 3,592,877 | | | | 345,167 | |
Cost of shares redeemed | | | (404,885,071 | ) | | | (289,172,490 | ) |
| Net increase in net assets resulting from share transactions | | | 74,193,269 | | | | 253,224,756 | |
| TOTAL INCREASE | | | 74,187,794 | | | | 253,221,983 | |
| | | | | | | | |
| | | | | | | | |
| Net assets: | | | | | | |
| | |
Beginning of year | | | 582,566,586 | | | | 329,344,603 | |
| | |
End of year | | $ | 656,754,380 | | | $ | 582,566,586 | |
| Undistributed net investment income | | $ | 6,724 | | | | – | |
| | |
| 10 | | The accompanying notes are an integral part of these financial statements. |
GOLDMAN SACHS VARIABLE INSURANCE TRUST GOVERNMENT MONEY MARKET FUND
Financial Highlights
Selected Data for a Share Outstanding Throughout Each Period
| | | | | | | | | | | | | | | | | | | | | | | | | | | | | | | | | | | | |
| Year - Share Class | | Net asset
value,
beginning
of period | | | Net
investment
income(a) | | | Distributions
from net
investment
income(b) | | | Net asset
value, end
of period | | | Total
return(c) | | | Net assets,
end of
period
(in 000’s) | | | Ratio of
net expenses
to average
net assets | | | Ratio of
total
expenses
to average
net assets | | | Ratio of
net investment
income
to average
net assets | |
FOR THE FISCAL YEARS ENDED DECEMBER 31, | |
2017 - Institutional | | $ | 1.00 | | | $ | 0.008 | | | $ | (0.008 | ) | | $ | 1.00 | | | | 0.76 | % | | $ | 302,507 | | | | 0.18 | % | | | 0.27 | % | | | 0.76 | % |
2017 - Service | | | 1.00 | | | | 0.005 | | | | (0.005 | ) | | | 1.00 | | | | 0.51 | | | | 354,248 | | | | 0.43 | | | | 0.52 | | | | 0.51 | |
2016 - Institutional | | | 1.00 | | | | 0.003 | | | | (0.003 | ) | | | 1.00 | | | | 0.29 | | | | 206,987 | | | | 0.19 | | | | 0.30 | | | | 0.31 | |
2016 - Service | | | 1.00 | | | | — | (d) | | | — | (d) | | | 1.00 | | | | 0.04 | | | | 375,580 | | | | 0.44 | | | | 0.55 | | | | 0.03 | |
2015 - Institutional | | | 1.00 | | | | — | (d) | | | — | (d) | | | 1.00 | | | | 0.02 | | | | 1,143 | | | | 0.23 | | | | 0.31 | | | | 0.03 | |
2015 - Service | | | 1.00 | | | | — | (d) | | | — | (d) | | | 1.00 | | | | 0.01 | | | | 328,202 | | | | 0.26 | | | | 0.56 | | | | 0.01 | |
2014 - Institutional | | | 1.00 | | | | — | (d) | | | — | (d) | | | 1.00 | | �� | | 0.01 | | | | 773 | | | | 0.23 | | | | 0.31 | | | | 0.03 | |
2014 - Service | | | 1.00 | | | | — | (d) | | | — | (d) | | | 1.00 | | | | 0.01 | | | | 305,994 | | | | 0.24 | | | | 0.56 | | | | — | (e) |
2013 - Institutional(f) | | | 1.00 | | | | — | (d) | | | — | (d) | | | 1.00 | | | | 0.01 | | | | 25 | | | | 0.24 | (g) | | | 0.36 | (g) | | | 0.04 | (g) |
2013 - Service | | | 1.00 | | | | — | (d) | | | — | (d) | | | 1.00 | | | | 0.01 | | | | 316,404 | | | | 0.28 | | | | 0.55 | | | | — | (e) |
| (a) | Calculated based on the average shares outstanding methodology. |
| (b) | Distributions may not coincide with the current year net investment income or net realized gains as distributions may be paid from current or prior year earnings. |
| (c) | Assumes reinvestment of all distributions. |
| (d) | Amount is less than $0.0005 per share. |
| (e) | Amount is less than 0.005% of average net assets. |
| (f) | Commenced operations on October 16, 2013. |
| | | | |
| The accompanying notes are an integral part of these financial statements. | | 11 | | |
GOLDMAN SACHS VARIABLE INSURANCE TRUST GOVERNMENT MONEY MARKET FUND
Notes to Financial Statements
December 31, 2017
1. ORGANIZATION
Goldman Sachs Variable Insurance Trust (the “Trust” or “VIT”) is a Delaware statutory trust registered under the Investment Company Act of 1940, as amended (the “Act”), as an open-end management investment company. The Trust includes the Goldman Sachs Government Money Market Fund (the “Fund”). The Fund is a diversified portfolio under the Act offering two classes of shares — Institutional and Service Shares. Shares of the Trust are offered to separate accounts of participating life insurance companies for the purpose of funding variable annuity contracts and variable life insurance policies.
Goldman Sachs Asset Management, L.P. (“GSAM”), an affiliate of Goldman Sachs & Co. LLC (formerly Goldman, Sachs & Co.) (“Goldman Sachs”), serves as investment adviser to the Fund pursuant to a management agreement (the “Agreement”) with the Trust.
2. SIGNIFICANT ACCOUNTING POLICIES
The financial statements have been prepared in accordance with accounting principles generally accepted in the United States of America (“GAAP”) and require management to make estimates and assumptions that may affect the reported amounts and disclosures. Actual results may differ from those estimates and assumptions.
A. Investment Valuation — The investment valuation policy of the Fund is to use the amortized-cost method permitted by Rule 2a-7 under the Act for valuing portfolio securities. The amortized-cost method of valuation involves valuing a security at its cost and thereafter applying a constant accretion or amortization to maturity of any discount or premium. Normally, a security’s amortized cost will approximate its market value. Under procedures and tolerances approved by the Board of Trustees (“Trustees”), GSAM evaluates daily the difference between the Fund’s net asset value (“NAV”) per share using the amortized costs of its portfolio securities and the Fund’s NAV per share using market-based values of its portfolio securities. The market-based value of a portfolio security is determined, where readily available, on the basis of market quotations provided by pricing services or securities dealers, or, where accurate market quotations are not readily available, on the basis of the security’s fair value as determined in accordance with Valuation Procedures approved by the Trustees. The pricing services may use valuation models or matrix pricing, which may consider (among other things): (i) yield or price with respect to debt securities that are considered comparable in characteristics such as rating, interest rate and maturity date or (ii) quotations from securities dealers to determine current value.
B. Investment Income and Investments — Interest income is accrued daily and adjusted for amortization of premiums and accretion of discounts. Investment transactions are reflected on trade date. Realized gains and losses are calculated using identified cost.
12
GOLDMAN SACHS VARIABLE INSURANCE TRUST GOVERNMENT MONEY MARKET FUND
2. SIGNIFICANT ACCOUNTING POLICIES (continued)
C. Class Allocations and Expenses — Investment income, realized and unrealized gain (loss), if any, and non-class specific expenses of the Fund are allocated daily based upon the proportion of net assets of each class. Class specific expenses, where applicable, are borne by the respective share classes and include Distribution and Service and Transfer Agency fees. Non-class specific expenses directly incurred by the Fund are charged to the Fund, while such expenses incurred by the Trust are allocated across the applicable Funds on a straight-line and/or pro-rata basis depending upon the nature of the expenses.
D. Federal Taxes and Distributions to Shareholders — It is the Fund’s policy to comply with the requirements of the Internal Revenue Code of 1986, as amended (the “Code”), applicable to regulated investment companies (mutual funds) and to distribute each year substantially all of its investment company taxable and tax-exempt income and capital gains to its shareholders. Accordingly, the Fund is not required to make any provisions for the payment of federal income tax. Distributions to shareholders are declared and recorded daily and paid monthly by the Fund and may include short-term capital gains. Long-term capital gain distributions, if any, are declared and paid annually. The Fund may defer or accelerate the timing of the distributions of short-term capital gains (or any portion thereof).
The characterization of distributions to shareholders for financial reporting purposes is determined in accordance with federal income tax rules, which may differ from GAAP. The source of the Fund’s distributions may be shown in the accompanying financial statements as either from net investment income, net realized gain or capital. Certain components of the Fund’s net assets on the Statement of Assets and Liabilities reflect permanent GAAP/tax differences based on the appropriate tax character.
The tax character of distributions paid during the fiscal years ended December 31, 2017 and December 31, 2016 were as follows:
| | | | | | | | |
| | | 2017 | | | 2016 | |
| Distributions paid from: | | | | | | | | |
| Ordinary income | | $ | 3,603,214 | | | $ | 341,931 | |
| Net long-term capital gains | | | — | | | | 3,236 | |
| Total taxable distributions | | $ | 3,603,214 | | | $ | 345,167 | |
As of December 31, 2017, the components of accumulated earnings on a tax basis were as follows:
| | | | |
| Undistributed (Distributions in excess of) ordinary income — net | | $ | 6,724 | |
| Perpetual Short-term Capital loss carryforward | | | (4,164 | ) |
| Timing differences (Post October Capital Loss Deferral/Distributions Payable) | | | (8,259 | ) |
| Unrealized gains (losses) — net | | | (1,065 | ) |
| Total accumulated earnings (losses) — net | | $ | (6,764 | ) |
13
GOLDMAN SACHS VARIABLE INSURANCE TRUST GOVERNMENT MONEY MARKET FUND
Notes to Financial Statements (continued)
December 31, 2017
2. SIGNIFICANT ACCOUNTING POLICIES (continued)
The amortized cost for the Fund stated in the accompanying Statement of Assets and Liabilities also represents aggregate cost for U.S. federal income tax purposes.
GSAM has reviewed the Fund’s tax positions for all open tax years (the current and prior three years, as applicable) and has concluded that no provision for income tax is required in the Fund’s financial statements. Such open tax years remain subject to examination and adjustment by tax authorities.
E. Forward Commitments — A forward commitment involves entering into a contract to purchase or sell securities, typically on an extended settlement basis, for a fixed price at a future date. The purchase of securities on a forward commitment basis involves a risk of loss if the value of the security to be purchased declines before the settlement date. Conversely, the sale of securities on a forward commitment basis involves the risk that the value of the securities sold may increase before the settlement date. Although the Fund will generally purchase securities on a forward commitment basis with the intention of acquiring the securities for its portfolio, the Fund may dispose of forward commitments prior to settlement which may result in a realized gain or loss.
F. Repurchase Agreements — Repurchase agreements involve the purchase of securities subject to the seller’s agreement to repurchase the securities at a mutually agreed upon date and price, under the terms of a Master Repurchase Agreement (“MRA”). During the term of a repurchase agreement, the value of the underlying securities held as collateral on behalf of a Fund, including accrued interest, is required to exceed the value of the repurchase agreement, including accrued interest. The gross value of repurchase agreements is included in the Statement of Assets and Liabilities for financial reporting purposes. The underlying securities for all repurchase agreements are held at the Fund’s custodian or designated sub-custodians under tri-party repurchase agreements.
An MRA governs transactions between the Fund and select counterparties. An MRA contains provisions for, among other things, initiation of the transaction, income payments, events of default, and maintenance of securities for repurchase agreements. An MRA also permits offsetting with collateral to create one single net payment in the event of default or similar events, including the bankruptcy or insolvency of a counterparty.
If the seller defaults, the Fund could suffer a loss to the extent that the proceeds from the sale of the underlying securities and other collateral held by the Fund are less than the repurchase price and the Fund’s costs associated with delay and enforcement of the repurchase agreement. In addition, in the event of default or insolvency of the seller, a court could determine that a Fund’s interest in the collateral is not enforceable, resulting in additional losses to the Fund.
Pursuant to exemptive relief granted by the Securities and Exchange Commission (“SEC”) and terms and conditions contained therein, the Fund, together with other funds of the Trust and registered investment companies having management agreements with GSAM or its affiliates, may transfer uninvested cash into joint accounts, the daily aggregate balance of which is invested in one or more repurchase agreements. Under these joint accounts, the Fund maintains pro-rata credit exposure to the underlying repurchase agreements’ counterparties. With the exception of certain transaction fees, the Fund is not subject to any expenses in relation to these investments.
14
GOLDMAN SACHS VARIABLE INSURANCE TRUST GOVERNMENT MONEY MARKET FUND
3. INVESTMENTS AND FAIR VALUE MEASUREMENTS
U.S. GAAP defines the fair value of a financial instrument as the amount that would be received to sell an asset or paid to transfer a liability in an orderly transaction between market participants at the measurement date (i.e., the exit price); the Fund measures fair value in accordance with GAAP. GAAP establishes a fair value hierarchy that prioritizes the inputs to valuation techniques used to measure fair value. The hierarchy gives the highest priority to unadjusted quoted prices in active markets for identical assets or liabilities (Level 1 measurements) and the lowest priority to unobservable inputs (Level 3 measurements). The levels used for classifying investments are not necessarily an indication of the risk associated with investing in these investments. The three levels of the fair value hierarchy are described below:
Level 1 — Unadjusted quoted prices in active markets that are accessible at the measurement date for identical, unrestricted assets or liabilities;
Level 2 — Quoted prices in markets that are not active or financial instruments for which significant inputs are observable (including, but not limited to, quoted prices for similar investments, interest rates, foreign exchange rates, volatility and credit spreads), either directly or indirectly;
Level 3 — Prices or valuations that require significant unobservable inputs (including GSAM’s assumptions in determining fair value measurement).
The Trustees have approved Valuation Procedures that govern the valuation of the portfolio investments held by the Fund, including investments for which market quotations are not readily available. The Trustees have delegated to GSAM day-to-day responsibility for implementing and maintaining internal controls and procedures related to the valuation (including both the amortized cost and market-based methods of valuation) of the Fund’s investments. To assess the continuing appropriateness of pricing sources and methodologies related to the market-based method of valuation, GSAM regularly performs price verification procedures and issues challenges as necessary to third party pricing vendors or brokers, and any differences are reviewed in accordance with the Valuation Procedures.
As of December 31, 2017, all investments are classified as Level 2 of the fair value hierarchy. Please refer to the Schedule of Investments for further detail.
15
GOLDMAN SACHS VARIABLE INSURANCE TRUST GOVERNMENT MONEY MARKET FUND
Notes to Financial Statements (continued)
December 31, 2017
4. AGREEMENTS AND AFFILIATED TRANSACTIONS
A. Management Agreement — Under the Agreement, GSAM manages the Fund, subject to the general supervision of the Trustees.
As compensation for the services rendered pursuant to the Agreement, the assumption of the expenses related thereto and administration of the Fund’s business affairs, including providing facilities, GSAM is entitled to a management fee, accrued daily and paid monthly, equal to an annual percentage rate of the Fund’s average daily net assets. GSAM has agreed to waive a portion of the management fee equal to 0.045% of the annual contractual rate applicable to the Fund’s average daily net assets. The management fee waiver will remain in effect through at least April 28, 2018, and prior to such date GSAM may not terminate the arrangement without the approval of the Board of Trustees. For the fiscal year ended December 31, 2017, GSAM waived $268,144 of its management fee pursuant to the contractual management fee waiver.
B. Distribution and Service (12b-1) Plan — The Trust, on behalf of the Service Shares of the Portfolio, has adopted a Distribution and Service Plan subject to Rule 12b-1 under the Act. Under the Distribution and Service Plan, Goldman Sachs, which serves as distributor (the “Distributor”), is entitled to a fee accrued daily and paid monthly, for distribution services and personal and account maintenance services, which may then be paid by Goldman Sachs to authorized dealers, equal to, on an annual basis, 0.25% of the Portfolio’s average daily net assets attributable to Service Shares.
C. Transfer Agency Agreement — Goldman Sachs also serves as the transfer agent of the Fund for a fee pursuant to a Transfer Agency Agreement. The fee charged for such transfer agency services is accrued daily and paid monthly at an annual rate of 0.02% of the average daily net assets of Institutional and Service Shares.
D. Other Expense Agreements — GSAM has agreed to limit certain “Other Expenses” of the Fund (excluding transfer agency fees and expenses, taxes, interest, brokerage fees, expenses of shareholder meetings, litigation and indemnification, and extraordinary expenses) to the extent that such expenses exceed, on an annual basis, 0.004% of the average daily net assets of the Fund. Such Other Expense reimbursements, if any, are accrued daily and paid monthly. In addition, the Fund is not obligated to reimburse GSAM for prior fiscal year expense reimbursements, if any. This Other Expense limitation will remain in place through April 28, 2018, and prior to such date GSAM may not terminate the arrangement without the approval of the Trustees. For the fiscal year ended December 31, 2017, GSAM reimbursed $215,205 to the Fund. In addition, the Fund has entered into certain offset arrangements with the custodian and the transfer agent, which may result in a reduction of the Fund’s expenses and are received irrespective of the application of the “Other Expense” limitation described above. For the fiscal year ended December 31, 2017, custody fee credits were $245.
16
GOLDMAN SACHS VARIABLE INSURANCE TRUST GOVERNMENT MONEY MARKET FUND
4. AGREEMENTS AND AFFILIATED TRANSACTIONS (continued)
E. Contractual and Net Fund Expenses — During the fiscal year ended December 31, 2017, GSAM, as the investment adviser, and Goldman Sachs, as distributor and transfer agent, voluntarily agreed to waive a portion of management fees, distribution and service plan fees and transfer agency fees attributable to the Fund. These waivers may be modified or terminated at any time at the option of GSAM or Goldman Sachs (as applicable). The following table outlines such fees (net of waivers) and Other Expenses (net of reimbursements and custodian and transfer agency fee credit reductions) in order to determine the Fund’s net annualized expenses for the fiscal period. The Fund is not obligated to reimburse Goldman Sachs for prior fiscal year fee waivers, if any.
| | | | | | | | | | | | | | | | |
| | | Institutional Shares | | | Service Shares | |
| Fee/Expense Type | | Contractual rate,
if any | | | Ratio of net expenses to
average net assets
for the fiscal year ended
December 31, 2017 | | | Contractual rate,
if any | | | Ratio of net expenses to
average net assets
for the fiscal year ended
December 31, 2017 | |
| Management Fee | | | 0.205 | % | | | 0.160 | % | | | 0.205 | % | | | 0.160 | % |
| Distribution and Service Fees | | | N/A | | | | N/A | | | | 0.25 | | | | 0.25 | |
| Transfer Agency Fees | | | 0.02 | | | | 0.02 | | | | 0.02 | | | | 0.02 | |
| Other Expenses | | | — | | | | 0.00 | (a) | | | — | | | | 0.00 | (a) |
| Net Expenses | | | | | | | 0.18 | % | | | | | | | 0.43 | % |
| (a) | Amount is less than 0.005% of average net assets. |
| N/A | - Fees not applicable to respective share class. |
For the fiscal year ended December 31, 2017, Goldman Sachs waived $268,144, $16 and $12 in management, distribution and service fees, and transfer agency fees, respectively.
F. Other Transactions with Affiliates — The Fund may purchase securities from, or sell securities to, an affiliated fund provided the affiliation is solely due to having a common investment adviser, common officers, or common Trustees. For the fiscal year ended December 31, 2017, there were no purchase and sale transactions for the Fund with affiliated funds in compliance with Rule 17a-7 under the Act.
G. Line of Credit Facility — As of December 31, 2017, the Fund participated in a $1,100,000,000 committed, unsecured revolving line of credit facility (the “facility”) together with other funds of the Trust and registered investment companies having management agreements with GSAM or its affiliates. This facility is to be used for temporary emergency purposes, or to allow for an orderly liquidation of securities to meet redemption requests. The interest rate on borrowings is based on the federal funds rate. The facility also requires a fee to be paid by the Fund based on the amount of the commitment that has not been utilized. For the fiscal year ended December 31, 2017, the Fund did not have any borrowings under the facility.
17
GOLDMAN SACHS VARIABLE INSURANCE TRUST GOVERNMENT MONEY MARKET FUND
Notes to Financial Statements (continued)
December 31, 2017
5. OTHER RISKS
The Fund’s risks include, but are not limited to, the following:
Large Shareholder Transactions Risk — The Fund may experience adverse effects when certain large shareholders, such as other funds, participating insurance companies, accounts and Goldman Sachs affiliates, purchase or redeem large amounts of shares of the Fund. Such large shareholder redemptions may cause the Fund to sell portfolio securities at times when it would not otherwise do so, which may negatively impact the Fund’s NAV and liquidity. Similarly, large Fund share purchases may adversely affect the Fund’s performance to the extent that the Fund is delayed in investing new cash and is required to maintain a larger cash position than it ordinarily would. These transactions may also increase transaction costs. In addition, a large redemption could result in the Fund’s current expenses being allocated over a smaller asset base, leading to an increase in the Fund’s expense ratio.
Interest Rate Risk — When interest rates increase, the Fund’s yield will tend to be lower than prevailing market rates, and the market value of its securities or instruments may also be adversely affected. A low interest rate environment poses additional risks to the Fund, because low yields on the Fund’s portfolio holdings may have an adverse impact on the Fund’s ability to provide a positive yield to its shareholders, pay expenses out of Fund assets, or, at times, maintain a stable $1.00 share price. The risks associated with increasing interest rates are heightened given that interest rates are near historic lows, but may be expected to increase in the future with unpredictable effects on the markets and the Fund’s investments. Fluctuations in interest rates may also affect the liquidity of fixed income securities and instruments held by the Fund.
Market and Credit Risks — In the normal course of business, the Fund trades financial instruments and enters into financial transactions where risk of potential loss exists due to changes in the market (market risk). Additionally, the Fund may also be exposed to credit risk in the event that an issuer or guarantor fails to perform or that an institution or entity with which the Fund has unsettled or open transactions defaults.
6. INDEMNIFICATIONS
Under the Trust’s organizational documents, its Trustees, officers, employees and agents are indemnified, to the extent permitted by the Act and state law, against certain liabilities that may arise out of performance of their duties to the Fund. Additionally, in the course of business, the Fund enters into contracts that contain a variety of indemnification clauses. The Fund’s maximum exposure under these arrangements is unknown, as this would involve future claims that may be made against the Fund that have not yet occurred. However, GSAM believes the risk of loss under these arrangements to be remote.
18
GOLDMAN SACHS VARIABLE INSURANCE TRUST GOVERNMENT MONEY MARKET FUND
7. SUBSEQUENT EVENTS
Subsequent events after the Statements of Assets and Liabilities date have been evaluated and GSAM has concluded that there is no impact requiring adjustment or disclosure in the financial statements.
8. SUMMARY OF SHARE TRANSACTIONS
Share activity is as follows:
| | | | | | | | |
| | | For the Fiscal Year Ended
December 31, 2017 | | | For the Fiscal Year Ended
December 31, 2016 | |
| Institutional Shares* | | | | | | | | |
| Shares sold | | | 289,673,821 | | | | 273,054,154 | |
| Reinvestment of distributions | | | 1,754,187 | | | | 199,056 | |
| Shares redeemed | | | (195,904,682 | ) | | | (67,408,741 | ) |
| | | | 95,523,326 | | | | 205,844,469 | |
| Service Shares* | | | | | | | | |
| Shares sold | | | 185,811,642 | | | | 268,997,925 | |
| Reinvestment of distributions | | | 1,838,690 | | | | 146,111 | |
| Shares redeemed | | | (208,980,389 | ) | | | (221,763,749 | ) |
| | | | (21,330,057 | ) | | | 47,380,287 | |
| NET INCREASE IN SHARES | | | 74,193,269 | | | | 253,224,756 | |
| * | Valued at $1.00 per share. |
19
Report of Independent Registered Public Accounting Firm
To the Board of Trustees of Goldman Sachs Variable Insurance Trust and Shareholders of the
Goldman Sachs Government Money Market Fund
Opinion on the Financial Statements
We have audited the accompanying statement of assets and liabilities, including the schedule of investments, of the Goldman Sachs Government Money Market Fund (the “Fund”) as of December 31, 2017, the related statement of operations for the year ended December 31, 2017, the statements of changes in net assets for each of the two years in the period ended December 31, 2017, including the related notes, and the financial highlights for each of the periods indicated therein (collectively referred to as the “financial statements”). In our opinion, the financial statements present fairly, in all material respects, the financial position of the Fund as of December 31, 2017, the results of its operations for the year then ended, the changes in its net assets for each of the two years in the period ended December 31, 2017 and the financial highlights for each of the periods indicated therein in conformity with accounting principles generally accepted in the United States of America.
Basis for Opinion
These financial statements are the responsibility of the Fund’s management. Our responsibility is to express an opinion on the Fund’s financial statements based on our audits. We are a public accounting firm registered with the Public Company Accounting Oversight Board (United States) (“PCAOB”) and are required to be independent with respect to the Fund in accordance with the U.S. federal securities laws and the applicable rules and regulations of the Securities and Exchange Commission and the PCAOB.
We conducted our audits of these financial statements in accordance with the standards of the PCAOB. Those standards require that we plan and perform the audit to obtain reasonable assurance about whether the financial statements are free of material misstatement, whether due to error or fraud.
Our audits included performing procedures to assess the risks of material misstatement of the financial statements, whether due to error or fraud, and performing procedures that respond to those risks. Such procedures included examining, on a test basis, evidence regarding the amounts and disclosures in the financial statements. Our audits also included evaluating the accounting principles used and significant estimates made by management, as well as evaluating the overall presentation of the financial statements. Our procedures included confirmation of securities owned as of December 31, 2017 by correspondence with the custodian and brokers; when replies were not received from brokers, we performed other auditing procedures. We believe that our audits provide a reasonable basis for our opinion.
PricewaterhouseCoopers LLP
Boston, Massachusetts
February 14, 2018
We have served as the auditor of one or more investment companies in the Goldman Sachs Fund complex since 2000.
20
GOLDMAN SACHS VARIABLE INSURANCE TRUST GOVERNMENT MONEY MARKET FUND
| | |
| Fund Expenses — Six Month Period Ended December 31, 2017 (Unaudited) | | |
As a shareholder of the Institutional Shares and Service Shares of the Fund, you incur ongoing costs, including management fees; distribution and service (12b-1) fees (with respect to Service Shares); and other Fund expenses. This Example is intended to help you understand your ongoing costs (in dollars) of investing in the Fund and to compare these costs with the ongoing costs of investing in other mutual funds.
The example is based on an investment of $1,000 invested at the beginning of the period and held for the entire period from July 1, 2017 through December 31, 2017, which represents a period of 184 days of a 365 day year.
Actual Expenses — The first line in the table below provides information about actual account values and actual expenses. You may use the information in this line, together with the amount you invested, to estimate the expenses that you paid over the period. Simply divide your account value by $1,000 (for example, an $8,600 account value divided by $1,000=8.6), then multiply the result by the number in the first line under the heading entitled “Expenses Paid” to estimate the expenses you paid on your account during this period.
Hypothetical Example for Comparison Purposes — The second line in the table below provides information about hypothetical account values and hypothetical expenses based on the Fund’s actual net expense ratio and an assumed rate of return of 5% per year before expenses, which is not the Fund’s actual return. The hypothetical account values and expenses may not be used to estimate the actual ending account balance or expenses you paid for the period. You may use this information to compare the ongoing costs of investing in the Fund and other funds. To do so, compare this 5% hypothetical example with the 5% hypothetical examples that appear in the shareholder reports of the other funds.
Please note that the expenses shown in the table are meant to highlight your ongoing costs only and do not reflect any transactional costs, such as sales charges, redemption fees, or exchange fees. Therefore, the second line of the table is useful in comparing ongoing costs only and will not help you determine the relative total costs of owning different funds. In addition, if these transactional costs were included, your costs would have been higher.
| | | | | | | | | | | | |
| Share Class | | Beginning
Account Value
7/1/17 | | | Ending
Account Value
12/31/17 | | | Expenses Paid
for the
6 Months
Ended
12/31/17* | |
| Institutional Shares | | | | | | | | | | | | |
| Actual | | $ | 1,000.00 | | | $ | 1,004.70 | | | $ | 0.86 | |
| Hypothetical 5% return | | $ | 1,000.00 | | | | 1,024.35 | + | | $ | 0.87 | |
| Service Shares | | | | | | | | | | | | |
| Actual | | $ | 1,000.00 | | | $ | 1,003.43 | | | $ | 2.12 | |
| Hypothetical 5% return | | $ | 1,000.00 | | | | 1,023.09 | + | | $ | 2.14 | |
| | * | Expenses are calculated using the Fund’s annualized net expense ratio for each class, which represents the ongoing expenses as a percentage of net assets for the six months ended December 31, 2017. Expenses are calculated by multiplying the annualized net expense ratio by the average account value for the period; then multiplying the result by the number of days in the most recent fiscal half year (or, since inception, if shorter); and then dividing that result by the number of days in the period. The annualized net expense ratios for the period were 0.17% and 0.42% for the Institutional Shares and Service Shares, respectively. | |
| | + | Hypothetical expenses are based on the Fund’s actual annualized net expense ratio and an assumed rate of return of 5% per year before expenses. | |
21
GOLDMAN SACHS VARIABLE INSURANCE TRUST GOVERNMENT MONEY MARKET FUND
Trustees and Officers (Unaudited)
Independent Trustees
| | | | | | | | | | | | |
| | | | | |
Name,
Address and Age1 | | Position(s) Held
with the Trust | | Term of Office and
Length of
Time Served2 | | Principal Occupation(s) During Past 5 Years | | Number of
Portfolios in
Fund Complex
Overseen by
Trustee3 | | | Other Directorships Held by Trustee4 |
Jessica Palmer Age: 68 | | Chair of the Board of Trustees | | 2018 (Trustee since 2007) | | Ms. Palmer is retired. She is Director, Emerson Center for the Arts and Culture (2011-Present); and was formerly a Consultant, Citigroup Human Resources Department (2007-2008); Managing Director, Citigroup Corporate and Investment Banking (previously, Salomon Smith Barney/Salomon Brothers) (1984-2006). Ms. Palmer was a Member of the Board of Trustees of Indian Mountain School (private elementary and secondary school) (2004-2009). Chair of the Board of Trustees — Goldman Sachs Trust and Goldman Sachs Variable Insurance Trust. | | | 105 | | | None |
Kathryn A. Cassidy Age: 63 | | Trustee | | Since 2015 | | Ms. Cassidy is retired. Formerly, she was Advisor to the Chairman (May 2014-December 2014); and Senior Vice President and Treasurer (2008-2014), General Electric Company & General Electric Capital Corporation (technology and financial services companies). Trustee — Goldman Sachs Trust and Goldman Sachs Variable Insurance Trust. | | | 105 | | | None |
Diana M. Daniels Age: 68 | | Trustee | | Since 2007 | | Ms. Daniels is retired. Formerly, she was Vice President, General Counsel and Secretary, The Washington Post Company (1991-2006). Ms. Daniels is a Trustee Emeritus and serves as a Presidential Councillor of Cornell University (2013-Present); former Member of the Legal Advisory Board, New York Stock Exchange (2003-2006) and of the Corporate Advisory Board, Standish Mellon Management Advisors (2006-2007). Trustee — Goldman Sachs Trust and Goldman Sachs Variable Insurance Trust. | | | 105 | | | None |
Herbert J. Markley Age: 67 | | Trustee | | Since 2013 | | Mr. Markley is retired. Formerly, he was Executive Vice President, Deere & Company (an agricultural and construction equipment manufacturer) (2007-2009); and President, Agricultural Division, Deere & Company (2001-2007). Previously, Mr. Markley served as an Advisory Board Member of Goldman Sachs Trust and Goldman Sachs Variable Insurance Trust (June 2013-October 2013). Trustee — Goldman Sachs Trust and Goldman Sachs Variable Insurance Trust. | | | 105 | | | None |
Roy W. Templin Age: 57 | | Trustee | | Since 2013 | | Mr. Templin is retired. He is Director, Armstrong World Industries, Inc. (a designer and manufacturer of ceiling, wall and suspension system solutions) (2016-Present); and was formerly Chairman of the Board of Directors, Con-Way Incorporated (a transportation, logistics and supply chain management service company) (2014-2015); Executive Vice President and Chief Financial Officer, Whirlpool Corporation (an appliance manufacturer and marketer) (2004-2012). Previously, Mr. Templin served as an Advisory Board Member of Goldman Sachs Trust and Goldman Sachs Variable Insurance Trust (June 2013-October 2013). Trustee — Goldman Sachs Trust and Goldman Sachs Variable Insurance Trust. | | | 105 | | | Armstrong World Industries, Inc. (a ceiling, wall and suspension systems solutions manufacturer) |
Gregory G. Weaver Age: 66 | | Trustee | | Since 2015 | | Mr. Weaver is retired. He is Director, Verizon Communications Inc. (2015-Present); and was formerly Chairman and Chief Executive Officer, Deloitte & Touche LLP (a professional services firm) (2001-2005 and 2012-2014); and Member of the Board of Directors, Deloitte & Touche LLP (2006-2012). Trustee — Goldman Sachs Trust and Goldman Sachs Variable Insurance Trust. | | | 105 | | | Verizon Communications Inc. |
| | | | | | | | | | | | |
22
GOLDMAN SACHS VARIABLE INSURANCE TRUST GOVERNMENT MONEY MARKET FUND
Trustees and Officers (Unaudited) (continued)
Interested Trustee
| | | | | | | | | | | | |
| | | | | |
Name,
Address and Age1 | | Position(s) Held
with the Trust | | Term of Office and
Length of
Time Served2 | | Principal Occupation(s) During Past 5 Years | | Number of
Portfolios in
Fund Complex
Overseen by
Trustee3 | | | Other Directorships Held by Trustee4 |
James A. McNamara* Age: 55 | | President and Trustee | | Since 2007 | | Managing Director, Goldman Sachs (January 2000-Present); Director of Institutional Fund Sales, GSAM (April 1998-December 2000); and Senior Vice President and Manager, Dreyfus Institutional Service Corporation (January 1993- April 1998). President and Trustee — Goldman Sachs Trust; Goldman Sachs Variable Insurance Trust; Goldman Sachs Trust II; Goldman Sachs MLP Income Opportunities Fund; Goldman Sachs MLP and Energy Renaissance Fund; Goldman Sachs ETF Trust; Goldman Sachs Private Markets Fund 2018 LLC; Goldman Sachs Private Markets Fund 2018 (A) LLC; and Goldman Sachs Private Markets Fund 2018 (B) LLC. | | | 146 | | | None |
| | | | | | | | | | | | |
| * | Mr. McNamara is considered to be an “Interested Trustee” because he holds positions with Goldman Sachs and own securities issued by The Goldman Sachs Group, Inc. Each Interested Trustee holds comparable positions with certain other companies of which Goldman Sachs, GSAM or an affiliate thereof is the investment adviser, administrator and/or distributor. |
| 1 | Each Trustee may be contacted by writing to the Trustee, c/o Goldman Sachs, 200 West Street, New York, New York, 10282, Attn: Caroline Kraus. Information is provided as of December 31, 2017. |
| 2 | Subject to such policies as may be adopted by the Board from time-to-time, each Trustee holds office for an indefinite term, until the earliest of: (a) the election of his or her successor; (b) the date the Trustee resigns or is removed by the Board or shareholders, in accordance with the Trust’s Declaration of Trust; or (c) the termination of the Trust. The Board has adopted policies which provide that (a) no Trustee shall hold office for more than 15 years and (b) a Trustee shall retire as of December 31st of the calendar year in which he or she reaches his or her 74th birthday, unless a waiver of such requirement shall have been adopted by a majority of the other Trustees. These policies may be changed by the Trustees without shareholder vote. |
| 3 | The Goldman Sachs Fund Complex includes certain other companies listed above for each respective Trustee. As of December 31, 2017, Goldman Sachs Trust consisted of 91 portfolios (90 of which offered shares to the public); Goldman Sachs Variable Insurance Trust consisted of 14 portfolios; Goldman Sachs Trust II consisted of 17 portfolios (16 of which offered shares to the public); Goldman Sachs BDC, Inc., Goldman Sachs Private Middle Market Credit LLC, Goldman Sachs MLP Income Opportunities Fund, Goldman Sachs MLP and Energy Renaissance Fund; Goldman Sachs Private Markets Fund 2018 LLC; Goldman Sachs Private Markets Fund 2018 (A) LLC; and Goldman Sachs Private Markets Fund 2018 (B) LLC, each consisted of one portfolio; and Goldman Sachs ETF Trust consisted of 19 portfolios (12 of which offered shares to the public). Goldman Sachs Private Middle Market Credit LLC, Goldman Sachs Private Markets Fund 2018 LLC, Goldman Sachs Private Markets Fund 2018 (A) LLC and Goldman Sachs Private Markets Fund 2018 (B) LLC do not offer shares to the public. |
| 4 | This column includes only directorships of companies required to report to the Securities and Exchange Commission under the Securities Exchange Act of 1934 (i.e., “public companies”) or other investment companies registered under the Act. |
Additional information about the Trustees is available in the Fund’s Statement of Additional Information, which can be obtained from Goldman Sachs free of charge by calling this toll-free number (in the United States of America): 1-800-526-7384.
23
GOLDMAN SACHS VARIABLE INSURANCE TRUST GOVERNMENT MONEY MARKET FUND
Trustees and Officers (Unaudited) (continued)
Officers of the Trust*
| | | | | | |
| | | |
| Name, Address and Age1 | | Position(s) Held with the Trust | | Term of
Office and
Length of
Time Served2 | | Principal Occupation(s) During Past 5 Years |
James A. McNamara
200 West Street New York, NY 10282 Age: 55 | | President and
Trustee | | Since 2007 | | Managing Director, Goldman Sachs (January 2000-Present); Director of Institutional Fund Sales, GSAM (April 1998-December 2000); and Senior Vice President and Manager, Dreyfus Institutional Service Corporation (January 1993-April 1998). President and Trustee — Goldman Sachs Trust; Goldman Sachs Variable Insurance Trust; Goldman Sachs Trust II; Goldman Sachs MLP Income Opportunities Fund; Goldman Sachs MLP and Energy Renaissance Fund; Goldman Sachs ETF Trust; Goldman Sachs Private Markets Fund 2018 LLC; Goldman Sachs Private Markets Fund 2018 (A) LLC; and Goldman Sachs Private Markets Fund 2018 (B) LLC. |
Caroline L. Kraus
200 West Street New York, NY 10282 Age: 40 | | Secretary | | Since 2012 | | Managing Director, Goldman Sachs (January 2016 – Present); Vice President, Goldman Sachs (August 2006-December 2015); Associate General Counsel, Goldman Sachs (2012-Present); Assistant General Counsel, Goldman Sachs (August 2006-December 2011); and Associate, Weil, Gotshal & Manges, LLP (2002-2006). Secretary — Goldman Sachs Trust (previously Assistant Secretary (2012)); Goldman Sachs Variable Insurance Trust (previously Assistant Secretary (2012)); Goldman Sachs Trust II; Goldman Sachs BDC, Inc.; Goldman Sachs Private Middle Market Credit LLC; Goldman Sachs Middle Market Lending LLC; Goldman Sachs MLP Income Opportunities Fund; Goldman Sachs MLP and Energy Renaissance Fund; Goldman Sachs ETF Trust; Goldman Sachs Private Markets Fund 2018 LLC; Goldman Sachs Private Markets Fund 2018 (A) LLC; and Goldman Sachs Private Markets Fund 2018 (B) LLC. |
Scott M. McHugh
200 West Street New York, NY 10282 Age: 46 | | Treasurer,
Senior Vice
President and
Principal
Financial
Officer | | Since 2009
(Principal
Financial
Officer since
2013) | | Managing Director, Goldman Sachs (January 2016-Present); Vice President, Goldman Sachs (February 2007-December 2015); Assistant Treasurer of certain mutual funds administered by DWS Scudder (2005-2007); and Director (2005-2007), Vice President (2000-2005), and Assistant Vice President (1998-2000); Deutsche Asset Management or its predecessor (1998-2007). Treasurer, Senior Vice President and Principal Financial Officer — Goldman Sachs Trust; Goldman Sachs Variable Insurance Trust; Goldman Sachs Trust II; Goldman Sachs MLP Income Opportunities Fund; Goldman Sachs MLP and Energy Renaissance Fund; Goldman Sachs ETF Trust; Goldman Sachs Private Markets Fund 2018 LLC; Goldman Sachs Private Markets Fund 2018 (A) LLC; and Goldman Sachs Private Markets Fund 2018 (B) LLC. |
Joseph F. DiMaria
30 Hudson Street Jersey City, NJ 07302 Age: 49 | | Assistant
Treasurer
and Principal
Accounting
Officer | | Since 2016
(Principal
Accounting
Officer since
2017) | | Managing Director, Goldman Sachs (November 2015-Present) and Vice President — Mutual Fund Administration, Columbia Management Investment Advisers, LLC (May 2010-October 2015). Assistant Treasurer and Principal Accounting Officer — Goldman Sachs Trust; Goldman Sachs Variable Insurance Trust; Goldman Sachs Trust II; Goldman Sachs MLP Income Opportunities Fund; Goldman Sachs MLP and Energy Renaissance Fund; Goldman Sachs ETF Trust; Goldman Sachs Private Markets Fund 2018 LLC; Goldman Sachs Private Markets Fund 2018 (A) LLC; and Goldman Sachs Private Markets Fund 2018 (B) LLC. |
| | | | | | |
| * | Represents a partial list of officers of the Trust. Additional information about all the officers is available in the Fund’s Statement of Additional Information, which can be obtained from Goldman Sachs free of charge by calling this toll-free number (in the United States): 1-800-526-7384. |
| 1 | Information is provided as of December 31, 2017. |
| 2 | Officers hold office at the pleasure of the Board of Trustees or until their successors are duly elected and qualified. Each officer holds comparable positions with certain other companies of which Goldman Sachs, GSAM or an affiliate thereof is the investment adviser, administrator and/or distributor. |
24
| | |
TRUSTEES Jessica Palmer, Chair Kathryn A. Cassidy Diana M. Daniels Herbert J. Markley James A. McNamara Roy W. Templin Gregory G. Weaver | | OFFICERS James A. McNamara, President Scott M. McHugh, Treasurer, Senior Vice President and Principal Financial Officer Joseph F. DiMaria, Assistant Treasuer and Principal Accounting Officer Caroline L. Kraus, Secretary |
GOLDMAN SACHS & CO. LLC
Distributor and Transfer Agent
GOLDMAN SACHS ASSET MANAGEMENT, L.P.
Investment Adviser
200 West Street, New York
New York 10282
Visit our Web site at www.GSAMFUNDS.com to obtain the most recent month-end returns.
The reports concerning the Fund included in this shareholder report may contain certain forward-looking statements about the factors that may affect the performance of the Fund in the future. These statements are based on Fund management’s predictions and expectations concerning certain future events and their expected impact on the Fund, such as performance of the economy as a whole and of specific industry sectors, changes in the levels of interest rates, the impact of developing world events, and other factors that may influence the future performance of the Fund. Management believes these forward-looking statements to be reasonable, although they are inherently uncertain and difficult to predict. Actual events may cause adjustments in portfolio management strategies from those currently expected to be employed.
A description of the policies and procedures that the Fund uses to determine how to vote proxies relating to portfolio securities and information regarding how the Fund voted proxies relating to portfolio securities during the most recent 12-month period ended June 30 is available (i) without charge, upon request by calling 1-800-621-2550; and (ii) on the Securities and Exchange Commission (“SEC”) Web site at http://www.sec.gov.
Views and opinions expressed are for informational purposes only and do not constitute a recommendation by GSAM to buy, sell, or hold any security. Views and opinions are current as of the date of this presentation and may be subject to change, they should not be construed as investment advice.
The Fund files its complete schedule of portfolio holdings with the SEC for the first and third quarters of each fiscal year on Form N-Q. The Fund’s Forms N-Q are available on the SEC’s web site at http://www.sec.gov within 60 days after the Fund’s first and third fiscal quarters. The Fund’s Forms N-Q may be reviewed and copied at the SEC’s Public Reference Room in Washington, D.C. and information on the operation of the Public Reference Room may also be obtained by calling 1-800-SEC-0330. Forms N-Q may be obtained upon request and without charge by calling 1-800-621-2550.
Goldman Sachs & Co. LLC (“Goldman Sachs”) does not provide legal, tax or accounting advice. Any statement contained in this communication (including any attachments) concerning U.S. tax matters was not intended or written to be used, and cannot be used, for the purpose of avoiding penalties under the Internal Revenue Code, and was written to support the promotion or marketing of transaction or matter addressed. Clients of Goldman Sachs should obtain their own independent tax advice based on their particular circumstances.
The web site links provided are for your convenience only and are not an endorsement or recommendation by GSAM of any of these web sites or the products or services offered. GSAM is not responsible for the accuracy and validity of the content of these web sites.
Fund holdings and allocations shown are as of December 31, 2017 and may not be representative of future investments. Fund holdings should not be relied on in making investment decisions and should not be construed as research or investment advice regarding particular securities. Current and future holdings are subject to risk.
The portfolio risk management process includes an effort to monitor and manage risk, but does not imply low risk.
Shares of the Goldman Sachs VIT Funds are offered to separate accounts of participating life insurance companies for the purpose of funding variable annuity contracts and variable life insurance policies. Shares of the Fund are not offered directly to the general public. The variable annuity contracts and variable life insurance policies are described in the separate prospectuses issued by participating insurance companies. You should refer to those prospectuses for information about surrender charges, mortality and expense risk fees and other charges that may be assessed by participating insurance companies under the variable annuity contracts or variable life insurance policies. Such fees or charges, if any, may affect the return you may realize with respect to your investments. Ask your representative for more complete information. Please consider a fund’s objectives, risks and charges and expenses, and read the prospectus carefully before investing. The prospectus contains this and other information about the Fund.
This material is not authorized for distribution to prospective investors unless preceded or accompanied by a current prospectus or summary prospectus, if applicable. Investors should consider the Fund’s objective, risks, and charges and expenses, and read the summary prospectus, if available, and/or the prospectus carefully before investing or sending money. The summary prospectus, if available, and the prospectus contain this and other information about the Fund and may be obtained from your authorized dealer or from Goldman Sachs & Co. LLC by calling 1-800-621-2550.
THIS MATERIAL IS FOR INFORMATIONAL PURPOSES ONLY AND IS PROVIDED SOLELY ON THE BASIS THAT IT WILL NOT CONSTITUTE INVESTMENT OR OTHER ADVICE OR A RECOMMENDATION RELATING TO ANY PERSON’S OR PLAN’S INVESTMENT OR OTHER DECISIONS, AND GOLDMAN SACHS IS NOT A FIDUCIARY OR ADVISOR WITH RESPECT TO ANY PERSON OR PLAN BY REASON OF PROVIDING THE MATERIAL OR CONTENT HEREIN INCLUDING UNDER THE EMPLOYEE RETIREMENT INCOME SECURITY ACT OF 1974 OR DEPARTMENT OF LABOR REGULATIONS. PLAN SPONSORS AND OTHER FIDUCIARIES SHOULD CONSIDER THEIR OWN CIRCUMSTANCES IN ASSESSING ANY POTENTIAL COURSE OF ACTION.
This report is prepared for the general information of contract owners and is not an offer of shares of the Goldman Sachs Variable Insurance Trust — Goldman Sachs Government Money Market Fund.
© 2018 Goldman Sachs. All rights reserved.
VITMMAR-18/119289-OTU-699962
Goldman
Sachs Variable Insurance Trust
Goldman Sachs
Multi-Strategy
Alternatives Portfolio
Annual Report
December 31, 2017

GOLDMAN SACHS VARIABLE INSURANCE TRUST MULTI-STRATEGY ALTERNATIVES PORTFOLIO
INVESTMENT OBJECTIVE
The Portfolio seeks long-term growth of capital.
Portfolio Management Discussion and Analysis
Below, the Goldman Sachs Global Portfolio Solutions Team discusses the Goldman Sachs Variable Insurance Trust — Goldman Sachs Multi-Strategy Alternatives Portfolio’s (the “Portfolio”) performance and positioning for the 12-month period ended December 31, 2017 (the “Reporting Period”).
How did the Portfolio perform during the Reporting Period?
During the Reporting Period, the Portfolio’s Institutional, Service and Advisor Shares generated average annual total returns of 5.60%, 5.37% and 5.14%, respectively. These returns compare to the 1.11% average annual total return of the Portfolio’s benchmark, the ICE® BofAML® U.S. Dollar Three-Month LIBOR Constant Maturity Index (the “LIBOR Index”), during the same period.
Please note that the Portfolio’s benchmark being the LIBOR Index is a means of emphasizing that the Portfolio has an unconstrained strategy. That said, this Portfolio employs a benchmark agnostic strategy and thus comparisons to a benchmark index are not particularly relevant.
What economic and market factors most influenced the Portfolio during the Reporting Period?
The first quarter of 2017, when the Reporting Period started, witnessed the continuation of a broad risk-on rally, which had started following the U.S. elections in November 2016. The rally was further supported by a stream of better than consensus expected U.S. economic data, reflected in non-farm payroll numbers, purchasing managers’ indices, and consumer- and producer-sentiment gauges — all of which reinforced opinions about a positive macroeconomic picture. In addition, the U.S. inflation rate rose higher than the Federal Reserve’s (the “Fed”) stated 2.0% target. These factors, along with positive survey data, led Fed policymakers, who had previously raised short-term interest rates in December 2016, to guide market expectations toward another interest rate hike in March 2017. As a result, the March interest rate increase caused minimal market disruption. Fed officials also said that several interest rate hikes could occur during 2017, and the minutes from the Fed’s March policy meeting indicated that balance sheet normalization might begin by the end of the calendar year. (Balance sheet normalization refers to the steps the Fed takes to reverse quantitative easing and remove the substantial monetary accommodation it has provided to the economy since the financial crisis began in 2007.) However, economic data at the end of the first quarter of 2017 failed to keep up with lofty survey data. Additionally, the U.S. Administration was unsuccessful in its first attempt to pass a health care bill, raising concerns about its ability to enact legislation related to taxes and infrastructure. In this environment, global stocks gave up some of their gains, with cyclical stocks generally underperforming defensive stocks. Yields fell, driving a rally in the U.S. Treasury market, and the U.S. dollar weakened. Sharp rallies followed in emerging markets assets, particularly emerging markets currencies. In Europe, optimism about the European Central Bank’s (“ECB”) eventual tapering of its asset purchases, as well as positive purchasing managers’ data, boosted market sentiment, but investors nevertheless remained cautious given political uncertainties surrounding the presidential election in France.
Heading into the second quarter of 2017, market sentiment remained pro-risk, driven by the outcome of the French election, broadly improving global economic growth and robust corporate earnings reports. In France, the victory of the centrist candidate was viewed as positive by many market participants, leading to rallies in European equities and the euro. In the U.S., Fed policymakers noted that the fundamentals underpinning consumption growth remained solid despite data showing lackluster first quarter 2017 economic growth. Political risks centering on the U.S. Administration and the speed of its pro-growth agenda led to increased U.S. equity market volatility. Commodities, specifically crude oil, struggled due to oversupply concerns even though the Organization of the Petroleum Exporting Countries (“OPEC”) announced extended output cuts. Near the end of the second calendar quarter, a flurry of central bank comments as well as a Fed interest rate hike in June 2017, signaled a hawkish shift, causing longer-term interest rates to rise. (Hawkish tends to imply higher interest rates.) The weaker U.S. dollar, easier financial conditions and a more stable macro environment pushed emerging markets assets higher, led by Chinese equities.
During the third quarter of 2017, the global economic recovery continued in a synchronized fashion, and inflationary pressures remained generally benign. Global equities delivered positive returns, with emerging markets equities outperforming developed markets equities. U.K. equities recorded positive returns, but lagged the broader global equity market, primarily because of a
1
GOLDMAN SACHS VARIABLE INSURANCE TRUST MULTI-STRATEGY ALTERNATIVES PORTFOLIO
stronger British pound, which appreciated on the back of increased U.K. inflation and hawkish comments from the Bank of England. In the U.S., Fed policymakers confirmed they would start balance sheet normalization starting in October 2017 and continued to signal their intention to raise short-term rates once more in 2017, if the U.S. economy continued to progress as they expected. Global bond yields, which had dropped in July and August 2017 amid weaker inflation and heightened geopolitical tensions related to North Korea, bounced back sharply in September 2017 as inflation data surprised to the upside, leading to slightly hawkish commentary from the Fed. Toward the end of the third calendar quarter, investors focused on developments surrounding possible U.S. tax reform and the potential announcement of a new Fed chair to take Janet Yellen’s place when her term expired in February 2018.
In the fourth quarter of 2017, a mix of strong global economic growth data, higher commodity prices and the absence of hawkish surprises from major central banks led to a continued rally in global equities. Japanese equities performed best, as the Prime Minister’s big win in Japan’s national election reinforced “Abenomics,” pushing stock prices higher. (Abenomics refers to the multi-pronged economic program of Japanese Prime Minister Shinzo Abe. It seeks to remedy two decades of economic stagnation by increasing Japan’s money supply, boosting government spending and enacting reforms to make the economy more competitive.) Meanwhile, U.S. stocks outpaced global equities, as investors priced in a higher probability of a U.S. corporate tax rate cut. Conversely, European and U.K. equities lagged, as strength in the euro and British pound weighed on their respective equity markets. Emerging markets stocks outperformed their developed markets peers, thanks to steady economic data emanating from China, higher commodity prices and improving exports. In November 2017, the U.S. President nominated Jerome Powell to replace Janet Yellen as Fed chair when her term expired. In December 2017, Fed policymakers raised interest rates and upgraded their cumulative growth projections after taking into account the potential impact of a corporate tax cut. Also in December, tax legislation was passed by the U.S. Congress. During the fourth calendar quarter overall, the 10-year U.S. Treasury yield rose seven basis points, driven by low inflation and market expectations of tax cuts. (A basis point is 1/100th of a percentage point.) In commodities, crude oil prices rallied more than 10% as the market anticipated an extension of OPEC’s production cuts. Metals also rallied, with base metals outperforming precious metals amid continuing strong global economic growth and steady Chinese economic data. Overall, the fourth quarter of 2017 was noteworthy for investors’ broad “risk on” sentiment, or reduced risk aversion, as equities, bond yields and commodities prices all moved higher.
What key factors were responsible for the Portfolio’s performance during the Reporting Period?
The Portfolio’s performance is driven by four sources of return: long-term strategic asset allocation to market exposures, medium-term cycle-aware allocation, short-term tactical allocation and excess returns from investments in underlying funds. Strategic asset allocation is the process by which the Portfolio’s assets are allocated across underlying asset classes and strategies in a way that considers the risks of each underlying asset class and strategy. Medium-term cycle-aware allocation is the process by which we adjust the portfolio for changes in the business or economic cycle. Short-term tactical allocation is the implementation of tactical market views with the goal of improving the Portfolio’s risk-adjusted return. The risk-adjusted return on an investment takes into account the risk associated with that investment relative to other potential investments.
During the Reporting Period, the Portfolio generated positive returns, driven by strategic asset allocation and medium-term cycle-aware allocation. Short-term tactical asset allocation and security selection within the Portfolio’s underlying funds detracted from its results.
Strategic asset allocation added to the Portfolio’s performance during the Reporting Period. Allocations to specific liquid alternatives strategies contributed positively, with the Portfolio’s volatility selling strategy and hedge fund replication strategy proving particularly beneficial to performance. Within equities, allocations to emerging markets equities was the primary contributor to the Portfolio’s returns, as emerging markets stocks were up more than 37% (as measured by the MSCI Emerging Markets Index) during the Reporting Period. Within real assets, allocations to U.S. and international real estate securities enhanced results, as they benefited from continued accommodative monetary policy globally. Within fixed income, the Portfolio’s allocation to emerging markets debt further added to returns.
Medium-term cycle-aware allocation also helped the Portfolio’s performance. Over the course of the Reporting Period, the Portfolio held two medium-term cycle-aware views. The first was to have a short duration position, which we expressed through a short position in long-maturity German government bonds and a tactical steepening position on the U.S. Treasury yield curve. (Duration is a measure of the Fund’s sensitivity to changes in interest rates. A steepening yield curve is one wherein the differential in yields between longer-term and shorter-term maturities widens; opposite of flattening. Yield curve is a spectrum of maturities.) Collectively, these positions detracted from the Portfolio’s performance, as U.S. short-term interest rates rose and U.S. longer-term interest rates fell, causing the U.S. Treasury yield curve to flatten instead of steepen. More than offsetting these negative results was
2
GOLDMAN SACHS VARIABLE INSURANCE TRUST MULTI-STRATEGY ALTERNATIVES PORTFOLIO
our second medium-term cycle-aware view, which was to hold a long position in emerging markets equities versus developed markets equities. This positioning added to the Portfolio’s returns, as emerging markets equities outperformed developed markets equities on a combination of the ongoing global “risk on” rally, stable economic data from China, and U.S. dollar weakness.
Short-term tactical allocation detracted from the Portfolio’s performance during the Reporting Period. Specifically, tactical country positioning across the developed and emerging markets hurt returns. In particular, long positions in European equities detracted from results, as the region came under pressure due to continued Brexit-related uncertainty. (Brexit refers to the U.K.’s efforts to exit the European Union.) Our tactical long-short currency basket further hampered performance, as the U.S. dollar weakened relative to other developed currencies. Select tactical country views within the developed markets, such as China and India, contributed positively.
Overall, security selection within underlying funds detracted from the Portfolio’s performance during the Reporting Period. The Goldman Sachs Long Short Fund, the Goldman Sachs Strategic Macro Fund and the Goldman Sachs Strategic Income Fund, which are each benchmarked to the LIBOR Index, underperformed. The Goldman Sachs Total Emerging Markets Income Fund and the Goldman Sachs Emerging Markets Equity Fund outperformed their respective benchmark indices the most (The Goldman Sachs Long Short Fund was liquidated on December 12, 2017.)
How was the Portfolio positioned at the beginning of the Reporting Period?
At the beginning of the Reporting Period, the Portfolio was positioned, in terms of its total net assets, with 76.1% in liquid alternative strategies, 11.4% in real assets and 1.4% in cash. (Liquid alternatives strategies generally include, but are not limited to, momentum or trend trading strategies (investment decisions based on trends in asset prices over time), hedge fund beta (long term total returns consistent with investment results that approximate the return and risk patterns of a diversified universe of hedge funds), managed risk investment strategies (which seek to manage extreme risk scenarios by implementing daily and monthly risk targets across a diversified mix of asset classes), emerging markets debt and unconstrained fixed income strategies (which have the ability to move across various fixed income sectors). Real assets generally include, but are not limited to, commodities, global real estate securities, infrastructure and master limited partnerships (“MLPs”).) The strategic asset allocation of the Portfolio reflects a risk-based allocation approach to increase diversification across the Portfolio. The Portfolio had 11.1% of its total net assets invested in tactical exposures at the beginning of the Reporting Period.
How did you manage the Portfolio’s allocations during the Reporting Period?
Over the course of the Reporting Period, we made changes to the Portfolio’s strategic allocation, medium-term cycle-aware allocation and short-term tactical allocation. Within the strategic allocation, in the middle of the Reporting Period, we looked for opportunities to redistribute the amount of active risk across our liquid alternative strategies and long-only strategies such as, but not limited to, emerging markets debt and real estate so that they would be more in line with our strategic views. We consider the Portfolio’s strategic asset allocation and underlying active security selection strategies the largest drivers of risk and performance.
We also sought to adjust the Portfolio’s exposure for medium-term changes to the business or economic cycle. At the beginning of the Reporting Period, we increased the Portfolio’s already short duration position through a steepening position at the front, or short-term, end of the U.S. Treasury yield curve. In our view, U.S. economic fundamentals were positive, with inflation data firming and the labor market at what is considered by the government to be full employment, and we thought the market was underpricing the pace at which the Fed would raise interest rates. At the end of June 2017, we initiated a short position in long-maturity German government bonds as an additional means of expressing our views on interest rates. We believed the market was mispricing the pace of economic growth in Europe. In October 2017, we shifted the Portfolio from its steepening position at the front end of the U.S. Treasury yield curve to an outright short duration position in U.S. interest rates (accomplished through Eurodollar futures), as we maintained our belief that U.S. interest rates would increase in the next one to three years, and we thought the market had a lesser ability to price rate hikes further out on the yield curve. Finally, we held our long emerging markets equity versus developed markets equity cycle-aware view (which was initiated late in 2016) throughout the Reporting Period.
Within the Portfolio’s short-term tactical allocation, we continued to position the portfolio to take advantage of short-term market dislocations or mispricings. The Portfolio started 2017 with an overweight in risk assets, and we added meaningfully to positions within equities because we expected the 2016 year-end rally to continue into the first part of 2017. We also underweighted the short volatility selling strategy, which would profit if the CBOE Volatility Index® (“VIX®”) fell or would take a loss if it rose. The VIX® was at a historical low when the Reporting Period started, a situation we did not expect to continue, as we believed volatility could suddenly spike from political uncertainty. Once we thought these risks had passed, we eliminated the Portfolio’s underweight to the short volatility selling strategy. Within equities at the beginning of the Reporting Period, the Portfolio held positions in both the developed markets (such as a short position in European equities and a long position in Spanish equities) and the emerging markets
3
GOLDMAN SACHS VARIABLE INSURANCE TRUST MULTI-STRATEGY ALTERNATIVES PORTFOLIO
(such as a long position in Indian equities and a long position in Chinese offshore-listed equities versus a relative value position in Chinese onshore-listed equities). The Portfolio’s tactical bias toward the emerging markets equities was based on our belief that better economic growth prospects and attractive valuations provided scope for substantial upside for emerging markets stocks in the medium term. In particular, we held a positive view on Singaporean equities, as the fundamentals of its banks had improved due to rising net interest margins and improving balance sheets.
Heading into the second quarter of 2017, we remained positive on risk assets because of the favorable macroeconomic backdrop, and we also maintained the Portfolio’s tactical bias toward emerging markets equities. Within the developed markets, the Portfolio held a tactical overweight in Europe where we had started seeing earnings revision and recovery in the manufacturing sector. On the sector level, the Portfolio initiated a long position in U.S. large-cap banks on the belief the environment was one of higher economic growth and inflation, which could, in our view, lead to higher equity prices and higher yields. Overall, we thought the environment would be particularly advantageous for U.S. banks. Also, banks are potentially one of the largest beneficiaries of possible U.S. fiscal policy initiatives, such as tax legislation signed into law in December 2017, reduced regulation and infrastructure spending.
Heading into the third calendar quarter, we believed that after an impressive rally in stock prices, the market was due for a period of consolidation, and we expected to see increased volatility. In this environment, we favored carry trades in which the Portfolio held long positions in high-yielding currencies. As for equities, we continued to favor emerging markets stocks, which were continuing to post gains. We also initiated a long tactical position in Brazilian equities, as we believed improving economic growth after a two-year recession, prospects of reforms, and positive momentum in asset prices should provide tailwinds for Brazil. We continued to favor European equities, adding a Portfolio position in European banks to continue expressing our pro-growth and pro-cyclical views. Within fixed income, we implemented a long position in emerging markets debt, as emerging markets fundamentals, we believed, remained strong.
In the fourth quarter of 2017, the Portfolio was overweight risk assets, and we planned to add to its holdings once we saw a suitable catalyst. Within equities, we added a short position in South African equities because of what we considered lackluster economic growth in the region, waning business confidence, negative earnings revisions and general outflows. We maintained the Portfolio’s country-level positions in the developed markets (such as Australian and Japanese equities) and the emerging markets (such as Singaporean and Brazilian equities).
Within currencies, the Portfolio continued to hold a strategic allocation to a basket of international currencies, which we tactically managed during the Reporting Period. We used this basket as we sought to take advantage of the monetary and inflationary environment across developed and emerging market countries. It was also used to express our views on issues such as slowing economic growth in China, economic developments in other emerging market countries and commodity prices.
How was the Portfolio positioned at the end of the Reporting Period?
At the end of the Reporting Period, the Portfolio was positioned, in terms of its total net assets, with 61.1% in liquid alternative strategies, 31.4% in real assets and 15.4% in cash. The Portfolio had -7.9% of its total net assets invested in tactical exposures. These positions were accomplished through investments in underlying funds and ETFs, as well as through derivatives and similar instruments.
How did the Portfolio use derivatives and similar instruments during the Reporting Period?
During the Reporting Period, the Portfolio used derivatives primarily to express views across developed and emerging markets equities. The Portfolio employed equity index futures to replicate exposures to U.S. large-cap equities (negative impact), European equities (negative impact) and emerging market equities (positive impact). Additionally, the Portfolio used equity index futures to gain tactical exposure to U.K. large-cap equities versus U.K. domestically focused equities (negative impact), Japanese equities (positive impact), Australian equities (positive impact), European equities (negative impact) and the equities of select emerging market countries (positive impact). The Portfolio also used emerging markets equity index futures to partially hedge the beta associated with investing in emerging markets equities, thus isolating active security selection (positive impact). Beta is a measure of the volatility, or systematic risk, of a security or a portfolio in comparison to the market as a whole.
Within fixed income, the Portfolio used interest rate futures, specifically U.S. Treasury futures and Eurodollar futures, to take views on the U.S. Treasury yield curve (negative impact). Eurodollar futures are contracts that have underlying assets linked to time deposits denominated in U.S. dollars at banks outside the U.S. The Portfolio also used bond futures to affect a short position in German government bonds (negative impact). The Portfolio employed interest rate options in a macroeconomic hedge that seeks to profit if interest rates fall, remain constant or rise less than anticipated (negative impact). In addition, during the Reporting Period,
4
GOLDMAN SACHS VARIABLE INSURANCE TRUST MULTI-STRATEGY ALTERNATIVES PORTFOLIO
the Portfolio employed foreign exchange forwards to go long and short select developed and emerging markets currencies within a tactical basket of currencies (negative impact).
Additionally, some of the underlying funds used derivatives during the Reporting Period to apply their active investment views with greater versatility and potentially to afford greater risk management precision. As market conditions warranted during the Reporting Period, some of these underlying funds engaged in forward foreign currency exchange contracts, financial futures contracts, options, swap contracts and structured securities to attempt to enhance portfolio return and for hedging purposes.
What is the Portfolio’s tactical view and strategy for the months ahead?
At the end of the Reporting Period, we emphasized three macro themes. First, we expected to see a continuation of the global economic expansion into 2018, although we think the pace of growth is likely to moderate relative to what we saw in 2017. Second, we believed that weakness in U.S. inflation was largely behind us. Third, we continued to believe in the importance of a dynamic approach to asset allocation in an environment where volatility is likely to pick up. In the months ahead, we think investors may need to balance the positives from the ongoing global economic expansion with headwinds from rising bond yields, and this is likely to lead to increased equity market volatility, in our opinion. In this environment, we believe managers who focus on alternative strategies may outperform traditional managers through their ability to short asset classes, regions, countries or sectors and through their ability to implement relative value positions and manage tail risk. We continue to believe the market is underestimating the pace of interest rate hikes in the U.S., where the labor market is now at or beyond full employment. Given this environment, we were bearish at the end of the Reporting Period on government bonds and concerned that a rapid sell-off from an inflation scare could lead to temporary drawdowns in risk assets.
5
GOLDMAN SACHS VARIABLE INSURANCE TRUST MULTI-STRATEGY ALTERNATIVES PORTFOLIO
Index Definitions
ICE® BofAML® U.S. Dollar Three-Month LIBOR Constant Maturity Index is based on the assumed purchase of a synthetic instrument having three months to maturity and with a coupon equal to the closing quote for three-month LIBOR. That issue is sold the following day (priced at a yield equal to the current day closing three-month LIBOR rate) and is rolled into a new three-month instrument. The index, therefore, will always have a constant maturity equal to exactly three months.
MSCI Emerging Markets Index captures large- and mid-cap representation across 24 emerging markets countries. The index covers approximately 85% of the free float-adjusted market capitalization in each country.
CBOE Volatility Index® (VIX®) is a key measure of market expectations of near-term volatility conveyed by S&P 500® Index option prices. Since its introduction in 1993, VIX® has been considered by many to be the world’s premier barometer of investor sentiment and market volatility.
S&P 500® Index is a U.S. stock market index based on the market capitalizations of 500 large companies having common stock listed on the New York Stock Exchange or NASDAQ. The S&P 500® Index components and their weightings are determined by S&P Dow Jones Indices.
It is not possible to invest directly in an unmanaged index.
6
FUND BASICS
Multi-Strategy Alternatives Portfolio
as of December 31, 2017
STANDARDIZED TOTAL RETURNS1
| | | | | | | | | | | | | | |
| For the period ended 12/31/17 | | One Year | | | Three Years | | | Since Inception | | | Inception Date |
| Institutional | | | 5.60 | % | | | 0.45 | % | | | 0.19 | % | | 4/25/14 |
| Service | | | 5.37 | | | | 0.21 | | | | -0.06 | | | 4/25/14 |
| Advisor | | | 5.14 | | | | 0.09 | | | | -0.19 | | | 4/25/14 |
| 1 | The Standardized Total Returns are average annual total returns as of the most recent calendar quarter-end. They assume reinvestment of all distributions at net asset value (“NAV”). Because Institutional, Service and Advisor Shares do not involve a sales charge, such a charge is not applied to their Standardized Total Returns. |
Total return figures in the above chart represent past performance and do not indicate future results, which will vary. The investment return and principal value of an investment will fluctuate and, therefore, an investor’s shares, when redeemed, may be worth more or less than their original cost. Current performance may be lower or higher than the total return figures in the above chart. Please visit www.GSAMFUNDS.com to obtain the most recent month-end returns. Performance reflects fee waivers and/or expense limitations in effect during the periods shown. In their absence, performance would be reduced.
EXPENSE RATIOS2
| | | | | | | | |
| | | Net Expense Ratio (Current) | | | Gross Expense Ratio (Before Waivers) | |
| Institutional | | | 1.27 | % | | | 3.42 | % |
| Service | | | 1.52 | | | | 3.02 | |
| Advisor | | | 1.67 | | | | 3.63 | |
| 2 | The expense ratios of the Portfolio, both current (net of any fee waivers and/or expense limitations) and before waivers (gross of any fee waivers and/or expense limitations) are as set forth above according to the most recent publicly available Prospectuses for the Portfolio and may differ from the expense ratios disclosed in the Financial Highlights of this report. Pursuant to a contractual arrangement, the Portfolio’s fee waivers and/or expense limitations will remain in place through at least April 28, 2018, and prior to such date, the Investment Adviser may not terminate the arrangements without the approval of the Portfolio’s Board of Trustees. If these arrangements are discontinued in the future, the expense ratios may change without shareholder approval. |
7
FUND BASICS
OVERALL UNDERLYING FUND AND ETF WEIGHTINGS3
Percentage of Net Assets
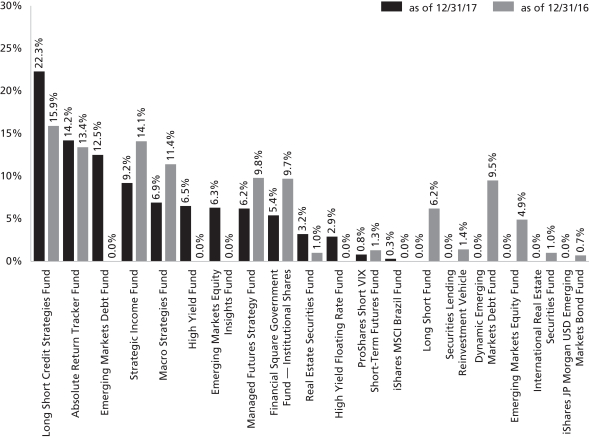
| 3 | The Portfolio is actively managed and, as such, its composition may differ over time. The percentage shown for each Underlying Fund and exchange traded fund (“ETF”) reflects the value of that Underlying Fund or ETF as a percentage of net assets of the Portfolio. Figures in the graph above may not sum to 100% due to rounding and/or exclusion of other assets and liabilities. Underlying sector allocations of exchange traded funds and investment companies held by the Portfolio are not reflected in the graph above. The graph depicts the Portfolio’s investments but may not represent the Portfolio’s market exposure due to the exclusion of certain derivatives, if any, as listed in the Additional Investment Information section of the Schedule of Investments. |
8
GOLDMAN SACHS VARIABLE INSURANCE TRUST MULTI-STRATEGY ALTERNATIVES PORTFOLIO
Performance Summary
December 31, 2017
The following graph shows the value, as of December 31, 2017, of a $10,000 investment made on April 25, 2014 (commencement of the Portfolio’s operations) in Advisor Shares at NAV. For comparative purposes, the performance of the Portfolio’s benchmark, the ICE Bank of America Merrill Lynch U.S. Dollar Three-Month LIBOR Constant Maturity Index, is shown. This performance data represents past performance and should not be considered indicative of future performance, which will fluctuate with changes in market conditions. These performance fluctuations may cause an investor’s shares, when redeemed, to be worth more or less than their original cost. Performance reflects Portfolio level expenses but does not reflect fees and expenses associated with any variable annuity contract or variable life insurance policy that uses the Portfolio as an investment option for any contract or policy. Had performance reflected all of those fees and expenses, performance would have been reduced. Performance reflects applicable fee waivers and/or expense limitations in effect during the periods shown, and in their absence, performance would be reduced. Performance of Institutional and Service Shares will vary from Advisor Shares due to differences in class specific fees. In addition to the Investment Adviser’s decisions regarding issuer/industry investment selection and allocation, other factors may affect Portfolio performance. These factors include, but are not limited to, Portfolio operating fees and expenses, portfolio turnover, and subscription and redemption cash flows affecting the Portfolio.
Multi-Strategy Alternatives Portfolio’s Lifetime Performance
Performance of a $10,000 investment, with distributions reinvested, from April 25, 2014 through December 31, 2017.
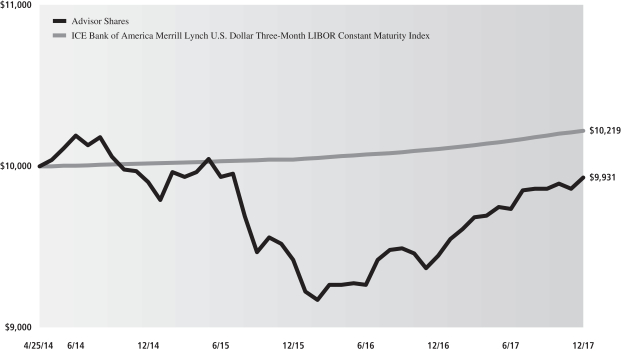
| | | | | | | | |
| Average Annual Total Return through December 31, 2017 | | One Year | | Three Years | | Since Inception | |
Institutional (Commenced April 25, 2014) | | 5.60% | | 0.45% | | | 0.19% | |
Service (Commenced April 25, 2014) | | 5.37% | | 0.21% | | | -0.06% | |
Advisor (Commenced April 25, 2014) | | 5.14% | | 0.09% | | | -0.19% | |
9
GOLDMAN SACHS VARIABLE INSURANCE TRUST MULTI-STRATEGY ALTERNATIVES PORTFOLIO
Schedule of Investments
December 31, 2017
| | | | | | | | |
| Shares | | | Description | | Value | |
| | Underlying Funds(a) – 90.2% | |
| | Equity – 23.7% | |
| | 238,232 | | | Goldman Sachs Absolute Return Tracker Fund | | $ | 2,282,265 | |
| | 94,614 | | | Goldman Sachs Emerging Markets Equity Insights Fund | | | 1,015,209 | |
| | 32,036 | | | Goldman Sachs Real Estate Securities Fund | | | 511,928 | |
| | | | | | | | |
| | | | | | | 3,809,402 | |
| | |
| | Fixed Income – 66.5% | |
| | 385,882 | | | Goldman Sachs Long Short Credit Strategies Fund | | | 3,577,130 | |
| | 156,210 | | | Goldman Sachs Emerging Markets Debt Fund | | | 2,016,665 | |
| | 155,270 | | | Goldman Sachs Strategic Income Fund | | | 1,473,510 | |
| | 134,461 | | | Goldman Sachs Strategic Macro Fund | | | 1,103,929 | |
| | 160,375 | | | Goldman Sachs High Yield Fund | | | 1,048,853 | |
| | 94,688 | | | Goldman Sachs Managed Futures Strategy Fund | | | 996,123 | |
| | 48,635 | | | Goldman Sachs High Yield Floating Rate Fund | | | 470,785 | |
| | | | | | | | |
| | | | | | | 10,686,995 | |
| | |
| | TOTAL UNDERLYING FUNDS (INSTITUTIONAL SHARES) | |
| | (Cost $14,602,532) | | $ | 14,496,397 | |
| | |
| | | | | | | | |
| | Exchange Traded Funds – 1.1% | |
| | 1,134 | | | iShares MSCI Brazil Fund | | $ | 45,871 | |
| | 963 | | | ProShares Short VIX Short-Term Futures Fund | | | 123,466 | |
| | |
| | TOTAL EXCHANGE TRADED FUNDS | | | | |
| | (Cost $63,322) | | $ | 169,337 | |
| | |
| | | | | | | | |
| Shares | | | Distribution
Rate | | Value | |
| | Investment Company(a) – 5.4% | |
| Goldman Sachs Financial Square Government Fund —
Institutional Shares |
|
| | 868,891 | | | 1.228% | | $ | 868,891 | |
| | (Cost $868,891) | | | | |
| | |
| | TOTAL INVESTMENTS – 96.7% | | | | |
| | (Cost $15,534,745) | | $ | 15,534,625 | |
| | |
| OTHER ASSETS IN EXCESS OF
LIABILITIES – 3.3% | | | 536,017 | |
| | |
| | NET ASSETS – 100.0% | | $ | 16,070,642 | |
| | |
| | |
| The percentage shown for each investment category reflects the value of investments in that category as a percentage of net assets. |
| (a) | | Represents an Affiliated Issuer. |
| | |
| Currency Abbreviations: |
| BRL | | —Brazilian Real |
| CAD | | —Canadian Dollar |
| CHF | | —Swiss Franc |
| CLP | | —Chilean Peso |
| COP | | —Colombian Peso |
| EUR | | —Euro |
| GBP | | —British Pound |
| IDR | | —Indonesian Rupiah |
| INR | | —Indian Rupee |
| JPY | | —Japanese Yen |
| KRW | | —South Korean Won |
| RUB | | —Russian Ruble |
| SEK | | —Swedish Krona |
| TWD | | —Taiwan Dollar |
| USD | | —United States Dollar |
| | |
| 10 | | The accompanying notes are an integral part of these financial statements. |
GOLDMAN SACHS VARIABLE INSURANCE TRUST MULTI-STRATEGY ALTERNATIVES PORTFOLIO
ADDITIONAL INVESTMENT INFORMATION
FORWARD FOREIGN CURRENCY EXCHANGE CONTRACTS — At December 31, 2017, the Portfolio had the following forward foreign currency exchange contracts:
FORWARD FOREIGN CURRENCY EXCHANGE CONTRACTS WITH UNREALIZED GAIN
| | | | | | | | | | | | | | | | | | | | |
| Counterparty | | Currency
Purchased | | | Currency
Sold | | | Current
Value | | | Settlement
Date | | | Unrealized
Gain | |
Morgan Stanley Co., Inc. | | BR | L240,000 | | | USD | 71,910 | | | $ | 72,085 | | | | 02/02/2018 | | | $ | 175 | |
| | CAD | 90,000 | | | USD | 70,475 | | | | 71,672 | | | | 03/21/2018 | | | | 1,197 | |
| | CLP | 90,000,000 | | | USD | 141,509 | | | | 146,166 | | | | 03/21/2018 | | | | 4,657 | |
| | COP | 220,000,000 | | | USD | 72,824 | | | | 73,230 | | | | 03/21/2018 | | | | 406 | |
| | GBP | 55,000 | | | USD | 74,197 | | | | 74,449 | | | | 03/21/2018 | | | | 252 | |
| | IDR | 1,890,000,000 | | | USD | 138,553 | | | | 138,966 | | | | 03/21/2018 | | | | 413 | |
| | INR | 4,500,000 | | | USD | 69,212 | | | | 69,986 | | | | 03/21/2018 | | | | 774 | |
| | RUB | 4,250,000 | | | USD | 71,254 | | | | 72,912 | | | | 03/21/2018 | | | | 1,658 | |
| | SEK | 1,425,000 | | | USD | 170,229 | | | | 174,536 | | | | 03/21/2018 | | | | 4,307 | |
| | | USD | 214,858 | | | JPY | 24,000,000 | | | | 213,859 | | | | 03/22/2018 | | | | 999 | |
| TOTAL | | | | | | | $ | 14,838 | |
FORWARD FOREIGN CURRENCY EXCHANGE CONTRACTS WITH UNREALIZED LOSS
| | | | | | | | | | | | | | | | | | | | |
| Counterparty | | Currency
Purchased | | | Currency
Sold | | | Current
Value | | | Settlement
Date | | | Unrealized
Loss | |
Morgan Stanley Co., Inc. | | BRL | 240,000 | | | USD | 74,080 | | | $ | 72,352 | | | | 01/03/2018 | | | $ | (1,728 | ) |
| | USD | 72,180 | | | BRL | 240,000 | | | | 72,352 | | | | 01/03/2018 | | | | (172 | ) |
| | USD | 142,525 | | | CHF | 140,000 | | | | 144,476 | | | | 03/21/2018 | | | | (1,951 | ) |
| | USD | 68,802 | | | CLP | 45,000,000 | | | | 73,083 | | | | 03/21/2018 | | | | (4,281 | ) |
| | USD | 72,848 | | | COP | 220,000,000 | | | | 73,230 | | | | 03/21/2018 | | | | (382 | ) |
| | USD | 142,448 | | | EUR | 120,000 | | | | 144,655 | | | | 03/21/2018 | | | | (2,207 | ) |
| | USD | 73,880 | | | GBP | 55,000 | | | | 74,449 | | | | 03/21/2018 | | | | (569 | ) |
| | USD | 73,334 | | | KRW | 80,000,000 | | | | 75,025 | | | | 03/21/2018 | | | | (1,691 | ) |
| | | USD | 100,903 | | | TWD | 3,000,000 | | | | 102,020 | | | | 03/21/2018 | | | | (1,117 | ) |
| TOTAL | | | | | | | $ | (14,098 | ) |
| | |
| The accompanying notes are an integral part of these financial statements. | | 11 |
GOLDMAN SACHS VARIABLE INSURANCE TRUST MULTI-STRATEGY ALTERNATIVES PORTFOLIO
Schedule of Investments (continued)
December 31, 2017
ADDITIONAL INVESTMENT INFORMATION (continued)
FUTURES CONTRACTS — At December 31, 2017, the Portfolio had the following futures contracts:
| | | | | | | | | | | | | | | | |
| Description | | Number of
Contracts | | | Expiration Date | | | Notional Amount | | | Unrealized Appreciation/ (Depreciation) | |
Long position contracts: | |
| EURO STOXX 50 Index | | | 12 | | | | 12/20/2019 | | | $ | 184,009 | | | $ | 9,698 | |
| HSCEI | | | 1 | | | | 01/30/2018 | | | | 75,069 | | | | 711 | |
| MSCI Emerging Markets E-Mini Index | | | 12 | | | | 03/16/2018 | | | | 698,220 | | | | 24,141 | |
| MSCI Singapore Index | | | 4 | | | | 01/30/2018 | | | | 116,072 | | | | 350 | |
| STOXX 600 Banks Index | | | 5 | | | | 03/16/2018 | | | | 54,713 | | | | (801 | ) |
TOPIX Index | | | 1 | | | | 03/08/2018 | | | | 161,260 | | | | 2,206 | |
| Total | | | | | | | | | | | | | | $ | 36,305 | |
Short position contracts: | | | | | | | | | | | | | | | | |
| 3 Month Eurodollar | | | (57 | ) | | | 03/16/2020 | | | | (13,916,550 | ) | | | 843 | |
| Euro-Buxl | | | (5 | ) | | | 03/08/2018 | | | | (983,037 | ) | | | 24,526 | |
| FTSE 250 Index | | | (2 | ) | | | 03/16/2018 | | | | (111,522 | ) | | | (3,601 | ) |
| FTSE/JSE Top 40 Index | | | (3 | ) | | | 03/15/2018 | | | | (128,933 | ) | | | (3,371 | ) |
| MSCI EAFE E-Mini Index | | | (3 | ) | | | 03/16/2018 | | | | (306,825 | ) | | | (4,365 | ) |
| S&P 500 E-Mini Index | | | (1 | ) | | | 03/16/2018 | | | | (133,800 | ) | | | (1,109 | ) |
SPI 200 Index | | | (1 | ) | | | 03/15/2018 | | | | (117,428 | ) | | | (573 | ) |
| Total | | | | | | | | | | | | | | $ | 12,350 | |
| Total Futures Contracts | | | | | | | | | | | | | | $ | 48,655 | |
PURCHASED OPTIONS CONTRACTS — At December 31, 2017, the Portfolio had the following purchased options:
| | | | | | | | | | | | | | | | | | | | | | | | | | | | | | |
| Description | | Counterparty | | Exercise
Price | | | Expiration Date | | | Number of
Contracts | | | Notional
Amount | | | Value | | | Premiums
Paid
(Received) by the
Portfolio | | | Unrealized
Appreciation/ (Depreciation) | |
Purchased options contracts: | | | | | | | | | | | | | | | | | | | | | | | | | | | | |
Calls | | | | | | | | | | | | | | | | | | | | | | | | | | | | | | |
| 3 Month Eurodollar | | Barclays Bank PLC | | | 97.50USD | | | | 03/19/2018 | | | USD | 20 | | | $ | 5,000,000 | | | $ | 37,000 | | | $ | 48,046 | | | $ | (11,046 | ) |
| | | | | 97.75USD | | | | 03/19/2018 | | | USD | 11 | | | | 2,750,000 | | | | 13,475 | | | | 13,088 | | | | 387 | |
| | | | | 97.63USD | | | | 06/18/2018 | | | USD | 16 | | | | 4,000,000 | | | | 18,000 | | | | 21,618 | | | | (3,618 | ) |
| | | | | 97.38USD | | | | 09/17/2018 | | | USD | 12 | | | | 3,000,000 | | | | 17,550 | | | | 24,403 | | | | (6,853 | ) |
| | | | | 97.25USD | | | | 12/17/2018 | | | USD | 5 | | | | 1,250,000 | | | | 7,594 | | | | 8,074 | | | | (480 | ) |
| | | | | 99.00USD | | | | 12/17/2018 | | | USD | 205 | | | | 51,250,000 | | | | 1,281 | | | | 13,286 | | | | (12,005 | ) |
| | | | | 97.13USD | | | | 03/18/2019 | | | USD | 13 | | | | 3,250,000 | | | | 22,019 | | | | 32,130 | | | | (10,111 | ) |
| | | | | 99.00USD | | | | 03/18/2019 | | | USD | 154 | | | | 38,500,000 | | | | 1,925 | | | | 13,831 | | | | (11,906 | ) |
| | | | | 96.88USD | | | | 06/17/2019 | | | USD | 11 | | | | 2,750,000 | | | | 23,925 | | | | 33,063 | | | | (9,138 | ) |
| | | | | 99.00USD | | | | 06/17/2019 | | | USD | 86 | | | | 21,500,000 | | | | 1,075 | | | | 8,799 | | | | (7,724 | ) |
| | | | | 96.75USD | | | | 09/16/2019 | | | USD | 12 | | | | 3,000,000 | | | | 28,875 | | | | 39,228 | | | | (10,353 | ) |
| | | | | 97.75USD | | | | 09/16/2019 | | | USD | 7 | | | | 1,750,000 | | | | 3,806 | | | | 4,391 | | | | (585 | ) |
| | | | | | 96.50USD | | | | 12/16/2019 | | | USD | 4 | | | | 1,000,000 | | | | 11,725 | | | | 12,159 | | | | (434 | ) |
| Total purchased options contracts | | | | | | | | 556 | | | | | | | $ | 188,250 | | | $ | 272,116 | | | $ | (83,866 | ) |
| | |
| 12 | | The accompanying notes are an integral part of these financial statements. |
GOLDMAN SACHS VARIABLE INSURANCE TRUST MULTI-STRATEGY ALTERNATIVES PORTFOLIO
Statement of Assets and Liabilities
December 31, 2017
| | | | |
| | | | |
| Assets: | |
Investments in affiliated Underlying Funds, at value (cost $15,471,423) | | $ | 15,365,288 | |
Investments in unaffiliated Funds, at value (cost $63,322) | | | 169,337 | |
Purchased Options, at value (premiums paid $272,116) | | | 188,250 | |
Cash | | | 273,645 | |
Receivables: | | | | |
Collateral on certain derivative contracts(a) | | | 100,562 | |
Portfolio shares sold | | | 32,399 | |
Dividends | | | 17,372 | |
Reimbursement from investment adviser | | | 16,381 | |
Unrealized gain on forward foreign currency exchange contracts | | | 14,838 | |
Variation margin on futures | | | 2,480 | |
Other assets | | | 358 | |
| Total assets | | | 16,180,910 | |
| | | | |
| | | | |
| Liabilities: | | | | |
Unrealized loss on forward foreign currency exchange contracts | | | 14,098 | |
Payables: | | | | |
Portfolio shares redeemed | | | 23,505 | |
Investments purchased | | | 18,257 | |
Distribution and Service fees and Transfer Agency fees | | | 5,504 | |
Accrued expenses | | | 48,904 | |
| Total liabilities | | | 110,268 | |
| | | | |
| | | | |
| Net Assets: | | | |
Paid-in capital | | | 16,661,306 | |
Undistributed net investment income | | | 43,805 | |
Accumulated net realized loss | | | (598,944 | ) |
Net unrealized loss | | | (35,525 | ) |
| NET ASSETS | | $ | 16,070,642 | |
Net Assets: | | | | |
Institutional | | $ | 453,243 | |
Service | | | 105,135 | |
Advisor | | | 15,512,264 | |
Total Net Assets | | $ | 16,070,642 | |
Shares outstanding $0.001 par value (unlimited shares authorized): | | | | |
Institutional | | | 48,270 | |
Service | | | 11,174 | |
Advisor | | | 1,657,731 | |
Net asset value, offering and redemption price per share: | | | | |
Institutional | | | $9.39 | |
Service | | | 9.41 | |
Advisor | | | 9.36 | |
(a) Includes amounts segregated for initial margin on futures transactions.
| | |
| The accompanying notes are an integral part of these financial statements. | | 13 |
GOLDMAN SACHS VARIABLE INSURANCE TRUST MULTI-STRATEGY ALTERNATIVES PORTFOLIO
Statement of Operations
For the Fiscal Year Ended December 31, 2017
| | | | |
| | | | |
| Investment income: | |
Dividends from affiliated Underlying Funds | | $ | 324,057 | |
Dividends from unaffiliated Funds | | | 1,471 | |
Securities lending income — unaffiliated issuer | | | 919 | |
| Total investment income | | | 326,447 | |
| | | | |
| | | | |
| Expenses: | | | |
Professional fees | | | 64,957 | |
Custody, accounting and administrative services | | | 53,619 | |
Distribution and Service fees(a) | | | 52,977 | |
Printing and mailing costs | | | 38,743 | |
Management fees | | | 20,464 | |
Trustee fees | | | 17,679 | |
Transfer Agency fees(a) | | | 2,728 | |
Other | | | 3,109 | |
| Total expenses | | | 254,276 | |
Less — expense reductions | | | (172,455 | ) |
| Net expenses | | | 81,821 | |
| NET INVESTMENT INCOME | | | 244,626 | |
| | | | |
| | | | |
| Realized and unrealized gain (loss): | | | |
Net realized gain (loss) from: | | | | |
Investments in affiliated Underlying Funds | | | 3,583 | |
Investments in unaffiliated Funds | | | 78,993 | |
Futures contracts | | | (9,211 | ) |
Purchased options | | | (14,088 | ) |
Forward foreign currency exchange contracts | | | (5,090 | ) |
Foreign currency transactions | | | (603 | ) |
Capital gain distributions from affiliated Underlying Funds | | | 197,831 | |
Net change in unrealized gain (loss) on: | | | | |
Investments in affiliated Underlying Funds | | | 145,027 | |
Investments in unaffiliated Funds | | | 55,352 | |
Futures contracts | | | 53,082 | |
Purchased options | | | (83,866 | ) |
Forward foreign currency exchange contracts | | | (11,282 | ) |
Foreign currency translation | | | (2,159 | ) |
| Net realized and unrealized gain | | | 407,569 | |
| NET INCREASE IN NET ASSETS RESULTING FROM OPERATIONS | | $ | 652,195 | |
(a) Class specific Distribution and Service, and Transfer Agency fees were as follows:
| | | | | | | | | | | | | | | | | | |
Distribution and
Service Fees | | | Transfer Agency Fees | |
Advisor | | | Service | | | Advisor | | | Institutional | | | Service | |
| $ | 52,860 | | | $ | 117 | | | $ | 2,643 | | | $ | 76 | | | $ | 9 | |
| | |
| 14 | | The accompanying notes are an integral part of these financial statements. |
GOLDMAN SACHS VARIABLE INSURANCE TRUST MULTI-STRATEGY ALTERNATIVES PORTFOLIO
Statements of Changes in Net Assets
| | | | | | | | |
| | | For the
Fiscal Year Ended
December 31, 2017 | | | For the
Fiscal Year Ended
December 31, 2016 | |
| | | | | | | | |
| From operations: | |
Net investment income | | $ | 244,626 | | | $ | 111,842 | |
Net realized gain (loss) | | | 251,415 | | | | (571,447 | ) |
Net change in unrealized gain | | | 156,154 | | | | 484,829 | |
| Net increase in net assets resulting from operations | | | 652,195 | | | | 25,224 | |
| | | | | | | | |
| | | | | | | | |
| Distributions to shareholders: | | | | | | |
From net investment income | | | | | | | | |
Institutional Shares | | | (10,357 | ) | | | (3,280 | ) |
Service Shares | | | (2,291 | ) | | | (131 | ) |
Advisor Shares | | | (303,417 | ) | | | (76,669 | ) |
| Total distributions to shareholders | | | (316,065 | ) | | | (80,080 | ) |
| | | | | | | | |
| | | | | | | | |
| From share transactions: | | | | | | |
Proceeds from sales of shares | | | 5,892,266 | | | | 4,005,564 | |
Reinvestment of distributions | | | 316,065 | | | | 80,080 | |
Cost of shares redeemed | | | (1,594,340 | ) | | | (3,556,068 | ) |
| Net increase in net assets resulting from share transactions | | | 4,613,991 | | | | 529,576 | |
| TOTAL INCREASE | | | 4,950,121 | | | | 474,720 | |
| | | | | | | | |
| | | | | | | | |
| Net assets: | | | | | | |
| | |
Beginning of year | | | 11,120,521 | | | | 10,645,801 | |
End of year | | $ | 16,070,642 | | | $ | 11,120,521 | |
| Undistributed net investment income | | $ | 43,805 | | | $ | 36,841 | |
| | |
| The accompanying notes are an integral part of these financial statements. | | 15 |
GOLDMAN SACHS VARIABLE INSURANCE TRUST MULTI-STRATEGY ALTERNATIVES PORTFOLIO
Financial Highlights
Selected Data for a Share Outstanding Throughout Each Period
| | | | | | | | | | | | | | | | | | | | | | | | | | | | | | | | | | | | | | | | | | | | | | | | | | | | | | | | |
| | | | | | Income (loss) from
investment operations | | | Distributions to shareholders | | | | | | | | | | | | | | | | | | | | | | |
| Year - Share Class | | Net asset value, beginning of period | | | Net investment income(a)(b) | | | Net
realized and
unrealized gain (loss) | | | Total from investment operations | | | From net investment income | | | From
net realized gains | | | Total distributions | | | Net asset value, end of period | | | Total return(c) | | | Net assets, end of period (in 000s) | | | Ratio of net expenses to average net assets(d) | | | Ratio of total
expenses to average net assets(d) | | | Ratio of net investment income
to average
net assets(b) | | | Portfolio
turnover
rate(e) | |
FOR THE FISCAL YEARS ENDED DECEMBER 31, | |
2017 - Institutional | | $ | 9.10 | | | $ | 0.21 | | | $ | 0.30 | | | $ | 0.51 | | | $ | (0.22 | ) | | $ | — | | | $ | (0.22 | ) | | $ | 9.39 | | | | 5.60 | % | | $ | 453 | | | | 0.21 | % | | | 1.47 | % | | | 2.20 | % | | | 53 | % |
2017 - Service | | | 9.13 | | | | 0.27 | | | | 0.22 | | | | 0.49 | | | | (0.21 | ) | | | — | | | | (0.21 | ) | | | 9.41 | | | | 5.37 | | | | 105 | | | | 0.46 | | | | 1.73 | | | | 2.88 | | | | 53 | |
2017 - Advisor | | | 9.08 | | | | 0.17 | | | | 0.30 | | | | 0.47 | | | | (0.19 | ) | | | — | | | | (0.19 | ) | | | 9.36 | | | | 5.14 | | | | 15,512 | | | | 0.61 | | | | 1.88 | | | | 1.78 | | | | 53 | |
2016 - Institutional | | | 9.15 | | | | 0.11 | | | | (0.06 | ) | | | 0.05 | | | | (0.10 | ) | | | — | | | | (0.10 | ) | | | 9.10 | | | | 0.52 | | | | 309 | | | | 0.24 | | | | 2.37 | | | | 1.17 | | | | 44 | |
2016 - Service | | | 9.14 | | | | 0.08 | | | | (0.05 | ) | | | 0.03 | | | | (0.04 | ) | | | — | | | | (0.04 | ) | | | 9.13 | | | | 0.28 | | | | 34 | | | | 0.46 | | | | 1.97 | | | | 0.92 | | | | 44 | |
2016 - Advisor | | | 9.12 | | | | 0.10 | | | | (0.07 | ) | | | 0.03 | | | | (0.07 | ) | | | — | | | | (0.07 | ) | | | 9.08 | | | | 0.27 | | | | 10,778 | | | | 0.61 | | | | 2.58 | | | | 1.06 | | | | 44 | |
2015 - Institutional | | | 9.81 | | | | 0.20 | | | | (0.65 | ) | | | (0.45 | ) | | | (0.20 | ) | | | (0.01 | ) | | | (0.21 | ) | | | 9.15 | | | | (4.51 | ) | | | 958 | | | | 0.22 | | | | 4.40 | | | | 2.02 | | | | 53 | |
2015 - Service | | | 9.81 | | | | 0.24 | | | | (0.71 | ) | | | (0.47 | ) | | | (0.19 | ) | | | (0.01 | ) | | | (0.20 | ) | | | 9.14 | | | | (4.76 | ) | | | 22 | | | | 0.48 | | | | 3.33 | | | | 2.54 | | | | 53 | |
2015 - Advisor | | | 9.79 | | | | 0.21 | | | | (0.69 | ) | | | (0.48 | ) | | | (0.18 | ) | | | (0.01 | ) | | | (0.19 | ) | | | 9.12 | | | | (4.89 | ) | | | 9,666 | | | | 0.62 | | | | 3.51 | | | | 2.16 | | | | 53 | |
| | | | | | | | | | | | | | | | | | | | | | | | | | | | | | | | | | | | | | | | | | | | | | | | | | | | | | | | |
FOR THE PERIOD ENDED DECEMBER 31, | |
2014 - Institutional (Commenced April 25, 2014) | | | 10.00 | | | | 0.09 | | | | (0.16 | ) | | | (0.07 | ) | | | (0.12 | ) | | | — | (f) | | | (0.12 | ) | | | 9.81 | | | | (0.67 | ) | | | 1,003 | | | | 0.22 | (g) | | | 24.63 | (g) | | | 1.30 | (g) | | | 25 | |
2014 - Service (Commenced April 25, 2014) | | | 10.00 | | | | 0.07 | | | | (0.16 | ) | | | (0.09 | ) | | | (0.10 | ) | | | — | (f) | | | (0.10 | ) | | | 9.81 | | | | (0.85 | ) | | | 10 | | | | 0.49 | (g) | | | 25.05 | (g) | | | 1.02 | (g) | | | 25 | |
2014 - Advisor (Commenced April 25, 2014) | | | 10.00 | | | | 0.11 | | | | (0.21 | ) | | | (0.10 | ) | | | (0.11 | ) | | | — | (f) | | | (0.11 | ) | | | 9.79 | | | | (0.97 | ) | | | 3,246 | | | | 0.62 | (g) | | | 16.16 | (g) | | | 1.66 | (g) | | | 25 | |
| (a) | Calculated based on the average shares outstanding methodology. |
| (b) | Recognition of net investment income by the Portfolio is affected by the timing of declaration of dividends by the Underlying Funds in which the Portfolio invests. |
| (c) | Assumes investment at the net asset value at the beginning of the year, reinvestment of all distributions, and a complete redemption of the investment at the net asset value at the end of the period. Total returns for periods less than one full year are not annualized. |
| (d) | Expense ratios exclude the expenses of the Underlying Funds in which the Portfolio invests. |
| (e) | The portfolio turnover rate is calculated in accordance with regulatory requirements, without regard to transactions involving short term investments and certain derivatives. If such transactions were included, the portfolio turnover rate may be higher. |
| (f) | Amount is less than $0.005 per share. |
| | | | |
| The accompanying notes are an integral part of these financial statements. | | 16 | | |
GOLDMAN SACHS VARIABLE INSURANCE TRUST MULTI-STRATEGY ALTERNATIVES PORTFOLIO
Notes to Financial Statements
December 31, 2017
1. ORGANIZATION
Goldman Sachs Variable Insurance Trust (the “Trust” or “VIT”) is a Delaware statutory trust registered under the Investment Company Act of 1940, as amended (the “Act”), as an open-end management investment company. The Trust includes the Goldman Sachs Multi-Strategy Alternatives Portfolio (the “Portfolio”). The Portfolio is a diversified portfolio under the Act offering three classes of shares — Institutional, Service and Advisor Shares. Shares of the Trust are offered to separate accounts of participating life insurance companies for the purpose of funding variable annuity contracts and variable life insurance policies.
Goldman Sachs Asset Management, L.P. (“GSAM”), an affiliate of Goldman Sachs & Co. LLC (formerly, Goldman, Sachs & Co.) (“Goldman Sachs”), serves as investment adviser to the Portfolio pursuant to a management agreement (the “Agreement”) with the Trust.
The Portfolio invests primarily in a combination of domestic and international equity and fixed income underlying funds (“Underlying Funds”) which are registered under the Act, for which GSAM or Goldman Sachs Asset Management International (“GSAMI”) (until November 1, 2017), also an affiliate of Goldman Sachs, act as investment advisers. Additionally, this Portfolio may invest a portion of its assets directly in other securities and instruments, including unaffiliated exchange traded funds (“Unaffiliated Funds”).
2. SIGNIFICANT ACCOUNTING POLICIES
The financial statements have been prepared in accordance with accounting principles generally accepted in the United States of America (“GAAP”) and require management to make estimates and assumptions that may affect the reported amounts and disclosures. Actual results may differ from those estimates and assumptions.
A. Investment Valuation — The valuation policy of the Portfolio and Underlying Funds is to value investments at fair value.
B. Investment Income and Investments — Investment income includes interest income, dividend income, and securities lending income. Interest income is accrued daily and adjusted for amortization of premiums and accretion of discounts. Dividend income is recognized on ex-dividend date or, for certain foreign securities, as soon as such information is obtained subsequent to the ex-dividend date. Capital gain distributions received from Underlying Funds are recognized on ex-dividend date. Investment transactions are reflected on trade date. Realized gains and losses are calculated using identified cost. Investment transactions are recorded on the following business day for daily net asset value (“NAV”) calculations. Income distributions are recognized as capital gains or income in the financial statements in accordance with the character that is distributed. Distributions received from the Fund’s investments in the Goldman Sachs Real Estate Securities Fund (the “Underlying Fund invested in REITs”) may be characterized as ordinary income, net capital gain or a return of capital. A return of capital is recorded by the Fund as a reduction to the cost basis of the Underlying Fund invested in REITs.
For derivative contracts, realized gains and losses are recorded upon settlement of the contract.
C. Class Allocations and Expenses — Investment income, realized and unrealized gain (loss), if any, and non-class specific expenses of the Portfolio are allocated daily based upon the proportion of net assets of each class. Non-class specific expenses directly incurred by the Portfolio are charged to the Portfolio, while such expenses incurred by the Trust are allocated across the applicable Portfolios on a straight-line and/or pro-rata basis depending upon the nature of the expenses. Class specific expenses, where applicable, are borne by the respective share classes and include Distribution and Service and Transfer Agency fees. Expenses included in the accompanying financial statements reflect the expenses of the Portfolio and do not include any expenses associated with the Underlying Funds (“Underlying Funds”). Because the Underlying Funds have varied expense and fee levels and the Portfolio may own different proportions of the Underlying Funds at different times, the amount of fees and expenses incurred indirectly by the Portfolio will vary.
D. Federal Taxes and Distributions to Shareholders — It is the Portfolio’s policy to comply with the requirements of the Internal Revenue Code of 1986, as amended (the “Code”), applicable to regulated investment companies (mutual funds) and to distribute each year substantially all of its investment company taxable income and capital gains to its shareholders. Accordingly,
17
GOLDMAN SACHS VARIABLE INSURANCE TRUST MULTI-STRATEGY ALTERNATIVES PORTFOLIO
Notes to Financial Statements (continued)
December 31, 2017
2. SIGNIFICANT ACCOUNTING POLICIES (continued)
the Portfolio is not required to make any provisions for the payment of federal income tax. Distributions to shareholders are recorded on the ex-dividend date. Income and capital gains distributions, if any, are declared and paid annually.
Net capital losses, if any, are carried forward to future fiscal years and may be used to the extent allowed by the Code to offset any future capital gains. Losses that are carried forward will retain their character as either short-term or long-term capital losses. Utilization of capital loss carryforwards will reduce the requirement of future capital gains distributions.
The characterization of distributions to shareholders for financial reporting purposes is determined in accordance with federal income tax rules, which may differ from GAAP. The source of the Portfolio’s distributions may be shown in the accompanying financial statements as either from net investment income, net realized gain or capital. Certain components of the Portfolio’s net assets on the Statement of Assets and Liabilities reflect permanent GAAP/tax differences based on the appropriate tax character.
3. INVESTMENTS AND FAIR VALUE MEASUREMENTS
U.S. GAAP defines the fair value of a financial instrument as the amount that would be received to sell an asset or paid to transfer a liability in an orderly transaction between market participants at the measurement date (i.e., the exit price); the Portfolio’s policy is to use the market approach. GAAP establishes a fair value hierarchy that prioritizes the inputs to valuation techniques used to measure fair value. The hierarchy gives the highest priority to unadjusted quoted prices in active markets for identical assets or liabilities (Level 1 measurements) and the lowest priority to unobservable inputs (Level 3 measurements). The levels used for classifying investments are not necessarily an indication of the risk associated with investing in these investments. The three levels of the fair value hierarchy are described below:
Level 1 — Unadjusted quoted prices in active markets that are accessible at the measurement date for identical, unrestricted assets or liabilities;
Level 2 — Quoted prices in markets that are not active or financial instruments for which significant inputs are observable (including, but not limited to, quoted prices for similar investments, interest rates, foreign exchange rates, volatility and credit spreads), either directly or indirectly;
Level 3 — Prices or valuations that require significant unobservable inputs (including GSAM’s assumptions in determining fair value measurement).
Changes in valuation techniques may result in transfers into or out of an assigned level within the hierarchy. In accordance with the Portfolio’s policy, transfers between different levels of the fair value hierarchy resulting from such changes are deemed to have occurred as of the beginning of the reporting period.
The Board of Trustees (“Trustees”) has approved Valuation Procedures that govern the valuation of the portfolio investments held by the Portfolio, including investments for which market quotations are not readily available. The Trustees have delegated to GSAM day-to-day responsibility for implementing and maintaining internal controls and procedures related to the valuation of the Portfolio’s investments. To assess the continuing appropriateness of pricing sources and methodologies, GSAM regularly performs price verification procedures and issues challenges as necessary to third party pricing vendors or brokers, and any differences are reviewed in accordance with the Valuation Procedures.
A. Level 1 and Level 2 Fair Value Investments — The valuation techniques and significant inputs used in determining the fair values for investments classified as Level 1 and Level 2 are as follows:
Underlying Funds (Including Money Market Funds) — Investments in the Underlying Funds are valued at the NAV per share of the Institutional Share class of each Underlying Fund on the day of valuation. Because the Portfolio invests primarily in other mutual funds that fluctuate in value, the Portfolio’s shares will correspondingly fluctuate in value. These investments are generally classified as Level 1 of the fair value hierarchy. For information regarding an Underlying Fund’s accounting policies and investment holdings, please see the Underlying Fund’s shareholder report.
Derivative Contracts — A derivative is an instrument whose value is derived from underlying assets, indices, reference rates or a combination of these factors. The Portfolio enters into derivative transactions to hedge against changes in interest rates, securities
18
GOLDMAN SACHS VARIABLE INSURANCE TRUST MULTI-STRATEGY ALTERNATIVES PORTFOLIO
3. INVESTMENTS AND FAIR VALUE MEASUREMENTS (continued)
prices, and/or currency exchange rates, to increase total return, or to gain access to certain markets or attain exposure to other underliers.
Exchange-traded derivatives, including futures and options contracts, are valued at the last sale or settlement price and typically fall within Level 1 of the fair value hierarchy. Over-the-counter (“OTC”) and centrally cleared derivatives are valued using market transactions and other market evidence, including market-based inputs to models, calibration to market-clearing transactions, broker or dealer quotations, or other alternative pricing sources. Where models are used, the selection of a particular model to value OTC and centrally cleared derivatives depends upon the contractual terms of, and specific risks inherent in, the instrument, as well as the availability of pricing information in the market. Valuation models require a variety of inputs, including contractual terms, market prices, yield curves, credit curves, measures of volatility, voluntary and involuntary prepayment rates, loss severity rates and correlations of such inputs. For OTC and centrally cleared derivatives that trade in liquid markets, model inputs can generally be verified and model selection does not involve significant management judgment. OTC and centrally cleared derivatives are classified within Level 2 of the fair value hierarchy when significant inputs are corroborated by market evidence.
i. Forward Contracts — A forward contract is a contract between two parties to buy or sell an asset at a specified price on a future date. A forward contract settlement can occur on a cash or delivery basis. Forward contracts are marked-to-market daily using independent vendor prices, and the change in value, if any, is recorded as an unrealized gain or loss. Cash and certain investments may be used to collateralize forward contracts.
A forward foreign currency exchange contract is a forward contract in which the Portfolio agrees to receive or deliver a fixed quantity of one currency for another, at a pre-determined price at a future date. All forward foreign currency exchange contracts are marked-to-market daily at the applicable forward rate. Non-deliverable forward foreign currency exchange contracts are settled with the counterparty in cash without the delivery of foreign currency.
ii. Futures Contracts — Futures contracts are contracts to buy or sell a standardized quantity of a specified commodity or security and are valued based on exchanged settlement prices or independent market quotes. Futures contracts are valued at the last settlement price, or in the absence of a sale, the last bid price for long positions and at the last ask price for short positions, at the end of each day on the board of trade or exchange upon which they are traded. Upon entering into a futures contract, the Portfolio deposits cash or securities in an account on behalf of the broker in an amount sufficient to meet the initial margin requirement. Subsequent payments are made or received by the Portfolio equal to the daily change in the contract value and are recorded as variation margin receivable or payable with a corresponding offset to unrealized gains or losses. For financial reporting purposes, cash collateral that has been pledged to cover obligations of the Portfolio and cash collateral received, if, any, is reported separately on the Statement of Assets and Liabilities as receivables/payables for collateral on certain derivative contracts. Non-cash collateral pledged by the Portfolio, if any, is noted in the Schedule of Investments.
iii. Options — When the Portfolio writes call or put options, an amount equal to the premium received is recorded as a liability and is subsequently marked-to-market to reflect the current value of the option written.
Upon the purchase of a call option or a put option by the Portfolio, the premium paid is recorded as an investment and subsequently marked-to-market to reflect the current value of the option. Certain options may be purchased with premiums to be determined on a future date. The premiums for these options are based upon implied volatility parameters at specified terms.
B. Level 3 Fair Value Investments — To the extent that significant inputs to valuation models and other alternative pricing sources are unobservable, or if quotations are not readily available, or if GSAM believes that such quotations do not accurately reflect fair value, the fair value of the Portfolio’s investments may be determined under Valuation Procedures approved by the Trustees. GSAM, consistent with its procedures and applicable regulatory guidance, may make an adjustment to the most recent valuation prices of either domestic or foreign securities in light of significant events to reflect what it believes to be the fair value of the securities at the time of determining the Portfolio’s NAV. Significant events which could affect a large number of securities in a particular market may include, but are not limited to: significant fluctuations in U.S. or foreign markets; market dislocations; market disruptions; or unscheduled market closings. Significant events which could also affect a single issuer may include, but are not limited to: corporate actions such as reorganizations, mergers and buy-outs; ratings downgrades; and bankruptcies.
19
GOLDMAN SACHS VARIABLE INSURANCE TRUST MULTI-STRATEGY ALTERNATIVES PORTFOLIO
Notes to Financial Statements (continued)
December 31, 2017
3. INVESTMENTS AND FAIR VALUE MEASUREMENTS (continued)
C. Fair Value Hierarchy — The following is a summary of the Portfolio’s investments and derivatives classified in the fair value hierarchy as of December 31, 2017:
| | | | | | | | | | | | |
| Investment Type | | Level 1 | | | Level 2 | | | Level 3 | |
| Assets | | | | | | | | | | | | |
| Equity Underlying Funds | | $ | 3,809,402 | | | $ | — | | | $ | — | |
| Fixed Income Underlying Funds | | | 10,686,995 | | | | — | | | | — | |
| Exchange Traded Funds | | | 169,337 | | | | — | | | | — | |
| Investment Company | | | 868,891 | | | | — | | | | — | |
| Total | | $ | 15,534,625 | | | $ | — | | | $ | — | |
| | | |
| Derivative Type | | | | | | | | | |
| Assets | | | | | | | | | | | | |
| Forward Foreign Currency Exchange Contracts(a) | | $ | — | | | $ | 14,838 | | | $ | — | |
| Futures Contracts(a) | | | 62,475 | | | | — | | | | — | |
| Purchased Options Contracts | | | 188,250 | | | | — | | | | — | |
| Total | | $ | 250,725 | | | $ | 14,838 | | | $ | — | |
| Liabilities(a) | | | | | | | | | | | | |
| Forward Foreign Currency Exchange Contracts | | $ | — | | | $ | (14,098 | ) | | $ | — | |
| Futures Contracts | | | (13,820 | ) | | | — | | | | — | |
| Total | | $ | (13,820 | ) | | $ | (14,098 | ) | | $ | — | |
| (a) | Amount shown represents unrealized gain (loss) at fiscal year end. |
For further information regarding security characteristics, see the Schedule of Investments.
4. INVESTMENTS IN DERIVATIVES
The following table sets forth, by certain risk types, the gross value of derivative contracts (not considered to be hedging instruments for accounting disclosure purposes) as of December 31, 2017. These instruments were used as part of the Portfolio’s investment strategies and to obtain and/or manage exposure related to the risks below. The values in the table below exclude the effects of cash collateral received or posted pursuant to these derivative contracts, and therefore are not representative of the Portfolio’s net exposure.
| | | | | | | | | | | | |
| Risk | | Statement of Assets and Liabilities | | Assets | | | Statement of Assets and Liabilities | | Liabilities | |
| Equity | | Variation margin on futures | | $ | 37,106 | (a) | | Variation margin on futures | | $ | (13,820 | )(a) |
| Currency | | Receivables for unrealized gain on forward foreign currency exchange contracts | | | 14,838 | | | Payable for unrealized loss on forward foreign currency exchange contracts | | | (14,098 | ) |
| Interest Rate | | Variation margin on futures and purchased options contracts at value | | | 213,619 | (a) | | — | | | — | |
| Total | | | | $ | 265,563 | | | | | $ | (27,918 | ) |
| (a) | Includes unrealized gain (loss) on futures contracts described in the Additional Investment Information section of the Schedule of Investments. Only the variation margin as of December 31, 2017 is reported within the Statement of Assets and Liabilities. |
The following table sets forth, by certain risk types, the Portfolio’s gains (losses) related to these derivatives and their indicative volumes for the fiscal year ended December 31, 2017. These gains (losses) should be considered in the context that these
20
GOLDMAN SACHS VARIABLE INSURANCE TRUST MULTI-STRATEGY ALTERNATIVES PORTFOLIO
4. INVESTMENTS IN DERIVATIVES (continued)
derivative contracts may have been executed to create investment opportunities and/or economically hedge certain investments, and accordingly, certain gains (losses) on such derivative contracts may offset certain (losses) gains attributable to investments. These gains (losses) are included in “Net realized gain (loss)” or “Net change in unrealized gain (loss)” on the Statement of Operations.
| | | | | | | | | | | | | | |
| Risk | | Statement of Operations | | Net
Realized
Gain (Loss) | | | Net Change in
Unrealized
Gain (Loss) | | | Average
Number of
Contracts(a) | |
| Equity | | Net realized gain (loss) from futures contracts/Net change in unrealized gain (loss) on futures contracts | | $ | 37,178 | | | $ | 23,119 | | | | 40 | |
| Currency | | Net realized gain (loss) from forward foreign currency exchange contracts/Net change in unrealized gain (loss) on forward foreign currency exchange contracts | | | (5,090 | ) | | | (11,282 | ) | | | 43 | |
| Interest Rate | | Net realized gain (loss) from futures contracts and purchased options/Net change in unrealized gain (loss) on futures contracts and purchased options | | | (60,477 | ) | | | (53,903 | ) | | | 411 | |
| Total | | | | $ | (28,389 | ) | | $ | (42,066 | ) | | | 494 | |
| (a) | Average number of contracts is based on the average of month end balances for the fiscal year ended December 31, 2017. |
5. AGREEMENTS AND AFFILIATED TRANSACTIONS
A. Management Agreement — Under the Agreement, GSAM manages the Portfolio, subject to the general supervision of the Trustees.
As compensation for the services rendered pursuant to the Agreement, the assumption of the expenses related thereto and administration of the Portfolio’s business affairs, including providing facilities, GSAM is entitled to a management fee, accrued daily and paid monthly, equal to an annual percentage rate of 0.15% of the Portfolio’s average daily net assets. GSAM has agreed to waive all of its management fee. The management fee waiver will remain in effect through at least April 28, 2018, and prior to such date, GSAM may not terminate the arrangement without the approval of the Board of Trustees. For the fiscal year ended December 31, 2017, GSAM waived $20,464 of its management fee.
The Portfolio invests in Institutional Shares of the Goldman Sachs Financial Square Government Fund, which is an affiliated Underlying Fund. GSAM has agreed to waive a portion of its management fee payable by the Portfolio in an amount equal to the management fee it earns as an investment adviser to the affiliated Underlying Fund in which the Portfolio invests, except those management fees it earns from the Portfolio’s investments of cash collateral received in connection with securities lending transactions in the Goldman Sachs Financial Square Government Fund. For the fiscal year ended December 31, 2017, GSAM waived $1,529 of the Portfolio’s management fee.
B. Distribution and/or Service (12b-1) Plans — The Trust, on behalf of Service Shares of the Portfolio, has adopted a Distribution and Service Plan subject to Rule 12b-1 under the Act. Under the Distribution and Service Plan, Goldman Sachs, which serves as distributor (the “Distributor”), is entitled to a fee accrued daily and paid monthly, for distribution services and personal and account maintenance services, which may then be paid by Goldman Sachs to authorized dealers, equal to, on an annual basis, 0.25% of the Portfolio’s average daily net assets attributable to Service Shares.
The Trust, on behalf of Advisor Shares of the Portfolio, has adopted a Distribution Plan subject to Rule 12b-1 under the Act. Under the Distribution Plan, Goldman Sachs as Distributor is entitled to a fee accrued daily and paid monthly for distribution services, which may then be paid by Goldman Sachs to authorized dealers, equal to, on an annual basis, 0.15% of the Portfolio’s average daily net assets attributable to Advisor Shares.
C. Service Plans — The Trust, on behalf of Advisor Shares of the Portfolio, has adopted a Service Plan to allow Advisor Shares to compensate service organizations (including Goldman Sachs) for providing varying levels of personal and account maintenance and administration services to their customers who are beneficial owners of such shares. The Service Plans each provide for compensation to the service organizations equal to 0.25% of the average daily net assets attributable to Advisor Shares of the Portfolio.
21
GOLDMAN SACHS VARIABLE INSURANCE TRUST MULTI-STRATEGY ALTERNATIVES PORTFOLIO
Notes to Financial Statements (continued)
December 31, 2017
5. AGREEMENTS AND AFFILIATED TRANSACTIONS (continued)
D. Transfer Agency Agreement — Goldman Sachs also serves as the transfer agent of the Portfolio for a fee pursuant to the Transfer Agency Agreement. The fees charged for such transfer agency services are accrued daily and paid monthly at an annual rate of 0.02% of the average daily net assets of Institutional, Service and Advisor Shares.
E. Other Expense Agreements and Affiliated Transactions — GSAM has agreed to limit certain “Other Expenses” of the Portfolio (excluding acquired fund fees and expenses, transfer agency fees and expenses, service fees and shareholder administration fees (as applicable), taxes, interest, brokerage fees, expenses of shareholder meetings, litigation and indemnification, and extraordinary expenses) to the extent such expenses exceed, on an annual basis, a percentage rate of the average daily net assets of the Portfolio. Such Other Expense reimbursements, if any, are accrued daily and paid monthly. In addition, the Portfolio is not obligated to reimburse GSAM for prior fiscal year expense reimbursements, if any. The Other Expense limitation as an annual percentage rate of average daily net assets for the Portfolio is 0.204%. The Other Expense limitation will remain in place through at least April 28, 2018, and prior to such date GSAM may not terminate the arrangement without the approval of the Trustees. For the fiscal year ended December 31, 2017, GSAM reimbursed $150,274 to the Portfolio. In addition, the Portfolio has entered into certain offset arrangements with the custodian and the transfer agent, which may result in a reduction of the Portfolio’s expenses and are received irrespective of the application of the “Other Expense” limitation described above. For the fiscal year ended December 31, 2017, custody fee credits were $188.
F. Line of Credit Facility — As of December 31, 2017, the Portfolio participated in a $1,100,000,000 committed, unsecured revolving line of credit facility (the “facility”) together with other funds of the Trust and certain registered investment companies having management agreements with GSAM or its affiliates. This facility is to be used for temporary emergency purposes, or to allow for an orderly liquidation of securities to meet redemption requests. The interest rate on borrowings is based on the federal funds rate. The facility also requires a fee to be paid by the Portfolio based on the amount of the commitment that has not been utilized. For the fiscal year ended December 31, 2017, the Portfolio did not have any borrowings under the facility.
F. Other Transactions with Affiliates — The Portfolio invests primarily in the Institutional Shares of the Underlying Funds. These Underlying Funds are considered to be affiliated with the Portfolio. The table below shows the transactions in and earnings from investments in these Underlying Funds for the fiscal year ended December 31, 2017:
| | | | | | | | | | | | | | | | | | | | | | | | | | | | | | | | | | | | |
| Underlying Funds | | Beginning
Value as of
December 31,
2016 | | | Purchases
at Cost | | | Proceeds
from Sales | | | Net
Realized
Gain
(Loss)
from
Affiliated
Investment
Company | | | Change in
Unrealized
Appreciation
(Depreciation) | | | Ending Value
as of
December 31,
2017 | | | Shares as of
December 31,
2017 | | | Dividend
Income
from
Affiliated
Investment
Company | | | Capital Gain
Distributions
from
Affiliated
Investment
Company | |
Goldman Sachs Absolute Return Tracker Fund | | $ | 1,482,676 | | | $ | 1,148,634 | | | $ | (405,000 | ) | | $ | (680 | ) | | $ | 56,635 | | | $ | 2,282,265 | | | | 238,232 | | | $ | 857 | | | $ | 75,777 | |
Goldman Sachs Emerging Markets Debt Fund | | | — | | | | 2,018,401 | | | | — | | | | — | | | | (1,736 | ) | | | 2,016,665 | | | | 156,210 | | | | 47,044 | | | | — | |
Goldman Sachs Emerging Markets Equity Fund | | | 547,542 | | | | 47,000 | | | | (712,953 | ) | | | 136,756 | | | | (18,345 | ) | | | — | | | | — | | | | — | | | | — | |
Goldman Sachs Emerging Markets Equity Insights Fund | | $ | — | | | $ | 952,270 | | | $ | (40,000 | ) | | $ | 5,194 | | | $ | 97,745 | | | $ | 1,015,209 | | | | 94,614 | | | $ | 14,444 | | | $ | 37,826 | |
Goldman Sachs Financial Square Government Fund | | | 1,079,735 | | | | 4,988,803 | | | | (5,199,647 | ) | | | — | | | | — | | | | 868,891 | | | | 868,891 | | | | 7,214 | | | | — | |
22
GOLDMAN SACHS VARIABLE INSURANCE TRUST MULTI-STRATEGY ALTERNATIVES PORTFOLIO
5. AGREEMENTS AND AFFILIATED TRANSACTIONS (continued)
| | | | | | | | | | | | | | | | | | | | | | | | | | | | | | | | | | | | |
| Underlying Funds | | Beginning
Value as of
December 31,
2016 | | | Purchases
at Cost | | | Proceeds from
Sales | | | Net
Realized
Gain
(Loss)
from
Affiliated
Investment
Company | | | Change in
Unrealized
Appreciation
(Depreciation) | | | Ending Value
as of
December 31,
2017 | | | Shares as of
December 31,
2017 | | | Dividend
Income
from
Affiliated
Investment
Company | | | Capital Gain
Distributions
from
Affiliated
Investment
Company | |
Goldman Sachs High Yield Floating Rate Fund | | | — | | | | 471,866 | | | | — | | | | — | | | | (1,081 | ) | | | 470,785 | | | | 48,635 | | | | 5,721 | | | | — | |
Goldman Sachs High Yield Fund | | | — | | | | 1,055,428 | | | | — | | | | — | | | | (6,575 | ) | | | 1,048,853 | | | | 160,375 | | | | 25,042 | | | | — | |
Goldman Sachs International Real Estate Securities Fund | | | 114,391 | | | | 2,527 | | | | (124,958 | ) | | | (4,845 | ) | | | 12,885 | | | | — | | | | — | | | | 2,527 | | | | — | |
Goldman Sachs Long Short Credit Strategies Fund | | | 1,768,151 | | | | 1,942,406 | | | | (65,000 | ) | | | (2,779 | ) | | | (65,648 | ) | | | 3,577,130 | | | | 385,882 | | | | 120,746 | | | | — | |
Goldman Sachs Long Short Fund | | | 685,145 | | | | 246,000 | | | | (922,775 | ) | | | (62,867 | ) | | | 54,497 | | | | — | | | | — | | | | — | | | | — | |
Goldman Sachs Managed Futures Strategy Fund | | | 1,090,475 | | | | 658,796 | | | | (770,000 | ) | | | (38,826 | ) | | | 55,678 | | | | 996,123 | | | | 94,688 | | | | — | | | | 4,796 | |
Goldman Sachs Real Estate Securities Fund | | | 114,560 | | | | 469,409 | | | | — | | | | — | | | | (72,041 | ) | | | 511,928 | | | | 32,036 | | | | 4,977 | | | | 79,432 | |
Goldman Sachs Strategic Income Fund | | | 1,569,457 | | | | 841,922 | | | | (920,000 | ) | | | (44,993 | ) | | | 27,124 | | | | 1,473,510 | | | | 155,270 | | | | 21,921 | | | | — | |
Goldman Sachs Strategic Macro Fund | | | 1,265,829 | | | | 669,370 | | | | (770,000 | ) | | | (36,318 | ) | | | (24,952 | ) | | | 1,103,929 | | | | 134,461 | | | | 63,370 | | | | — | |
Goldman Sachs Total Emerging Markets Income Fund | | | 1,059,082 | | | | 407,990 | | | | (1,534,052 | ) | | | 30,904 | | | | 36,076 | | | | — | | | | — | | | | 26,996 | | | | — | |
| Total | | $ | 10,777,043 | | | $ | 15,920,822 | | | $ | (11,464,385 | ) | | $ | (18,454 | ) | | $ | 150,262 | | | $ | 15,365,288 | | | | | | | $ | 340,859 | | | $ | 197,831 | |
As of December 31, 2017, The Goldman Sachs Group, Inc. was the beneficial owner of approximately 9% of the Service Shares of the Portfolio.
6. PORTFOLIO SECURITIES TRANSACTIONS
The cost of purchases and proceeds from sales and maturities of long-term securities for the fiscal year ended December 31, 2017, were $11,233,352 and $6,566,450, respectively.
23
GOLDMAN SACHS VARIABLE INSURANCE TRUST MULTI-STRATEGY ALTERNATIVES PORTFOLIO
Notes to Financial Statements (continued)
December 31, 2017
7. SECURITIES LENDING
The Portfolio may lend its securities through a securities lending agent, the Bank of New York Mellon (“BNYM”), to certain qualified borrowers. In accordance with the Portfolio’s securities lending procedures, the Portfolio receives cash collateral at least equal to the market value of the securities on loan. The market value of the loaned securities is determined at the close of business of the Portfolio, at their last sale price or official closing price on the principal exchange or system on which they are traded, and any additional required collateral is delivered to the Portfolio on the next business day. As with other extensions of credit, the Portfolio may experience delay in the recovery of its securities or incur a loss should the borrower of the securities breach its agreement with the Portfolio or become insolvent at a time when the collateral is insufficient to cover the cost of repurchasing securities on loan. Dividend income received from securities on loan may not be subject to withholding taxes and therefore withholding taxes paid may differ from the amounts listed in the Statement of Operations. Loans of securities are terminable at any time and as such 1) the remaining contractual maturities of the outstanding securities lending transactions are considered to be overnight and continuous and 2) the borrower, after notice, is required to return borrowed securities within the standard time period for settlement of securities transactions.
The Portfolio invests the cash collateral received in connection with securities lending transactions in the Goldman Sachs Financial Square Government Fund (“Government Money Market Fund”), an affiliated series of the Trust. The Government Money Market Fund is registered under the Act as an open end investment company, is subject to Rule 2a-7 under the Act, and is managed by GSAM, for which GSAM may receive a management fee of up to 0.205% on an annualized basis of the average daily net assets of the Government Money Market Fund.
In the event of a default by a borrower with respect to any loan, BNYM may exercise any and all remedies provided under the applicable borrower agreement to make the Portfolio whole. These remedies include purchasing replacement securities by applying the collateral held from the defaulting broker against the purchase cost of the replacement securities. If BNYM is unable to purchase replacement securities, BNYM will indemnify the Portfolio by paying the Portfolio an amount equal to the market value of the securities loaned minus the value of cash collateral received from the borrower for the loan, subject to an exclusion for any shortfalls resulting from a loss of value in such cash collateral due to reinvestment risk. The Portfolio’s loaned securities were all subject to enforceable Securities Lending Agreements and the value of the collateral was at least equal to the value of the cash received. The amounts of the Portfolio’s overnight and continuous agreements represent the gross amounts of recognized liabilities for securities lending transactions outstanding as of December 31, 2017 are disclosed as “Payable upon return of securities loaned” on the Statement of Assets and Liabilities, where applicable. The Fund did not have securities on loan as of December 31, 2017.
Both the Portfolio and BNYM received compensation relating to the lending of the Portfolio’s securities. The amounts earned, if any, by the Portfolio for the fiscal year ended December 31, 2017, are reported under Investment Income on the Statement of Operations.
The following table provides information about the Portfolio’s investment in the Government Money Market Fund for the fiscal year ended December 31, 2017:
| | | | | | | | | | | | | | | | | | |
Beginning
Value as of
December 31, 2016 | | | Purchases
at Cost | | | Proceeds
from Sales | | | Ending
Value as of
December 31, 2017 | | | Shares as of
December 31, 2017 | |
| $ | 162,650 | | | $ | 1,543,046 | | | $ | (1,705,696 | ) | | $ | — | | | | — | |
8. TAX INFORMATION
The tax character of distributions paid during the fiscal years ended December 31, 2016 and December 31, 2017 was as follows:
| | | | | | | | |
| | | 2016 | | | 2017 | |
| Distributions paid from ordinary income | | $ | 80,080 | | | $ | 316,065 | |
24
GOLDMAN SACHS VARIABLE INSURANCE TRUST MULTI-STRATEGY ALTERNATIVES PORTFOLIO
8. TAX INFORMATION (continued)
As of December 31, 2017, the components of accumulated earnings (losses) on a tax-basis were as follows:
| | | | |
| Undistributed ordinary income — net | | $ | 49,133 | |
| Capital loss carryforwards:(1) | | | | |
Perpetual Short-term | | | (276,579 | ) |
Perpetual Long-term | | | (88,679 | ) |
| Total capital loss carryforwards | | $ | (365,258 | ) |
| Timing differences (Qualified Late Year Loss Deferral) | | | (5,108 | ) |
| Unrealized losses — net | | | (269,431 | ) |
| Total accumulated losses — net | | $ | (590,664 | ) |
As of December 31, 2017, the Portfolio’s aggregate security unrealized gains and losses based on cost for U.S. federal income tax purposes were as follows:
| | | | |
| Tax cost | | $ | 15,768,651 | |
| Gross unrealized gain | | | 121,014 | |
| Gross unrealized loss | | | (390,445 | ) |
| Net unrealized loss | | $ | (269,431 | ) |
| (1) | The Fund utilized $114,966 of capital losses in the current fiscal year. |
The difference between GAAP-basis and tax-basis unrealized gains (losses) is attributable primarily to wash sales, net mark to market gains (losses) on regulated futures, options and foreign exchange contracts and differences in the tax treatment of underlying fund investments and partnership investments.
In order to present certain components of the Portfolio’s capital accounts on a tax-basis, the Portfolio has reclassified $78,403 of accumulated net realized gain to undistributed net investment income. These reclassifications have no impact on the NAV of the Portfolio and result primarily from differences in the tax treatment of foreign currency transactions and underlying fund investments.
GSAM has reviewed the Portfolio’s tax position for all open tax years (the current and prior three years, as applicable) and has concluded that no provision for income tax is required in the Portfolio’s financial statements. Such open tax years remain subject to examination and adjustment by tax authorities.
9. OTHER RISKS
The Portfolio’s risks include, but are not limited to, the following:
Derivatives Risk — The Portfolio’s use of derivatives may result in loss. Derivative instruments, which may pose risks in addition to and greater than those associated with investing directly in securities, currencies or other instruments, may be illiquid or less liquid, volatile, difficult to price and leveraged so that small changes in the value of the underlying instruments may produce disproportionate losses to the Portfolio. Derivatives are also subject to counterparty risk, which is the risk that the other party in the transaction will not fulfill its contractual obligation. The use of derivatives is a highly specialized activity that involves investment techniques and risks different from those associated with investments in more traditional securities and instruments. Losses from derivatives can also result from a lack of correlation between changes in the value of derivative instruments and the portfolio assets (if any) being hedged.
Investments in the Underlying Funds — The investments of the Portfolio are concentrated in the Underlying Funds, and the Portfolio’s investment performance is directly related to the investment performance of the Underlying Funds it holds. The
25
GOLDMAN SACHS VARIABLE INSURANCE TRUST MULTI-STRATEGY ALTERNATIVES PORTFOLIO
Notes to Financial Statements (continued)
December 31, 2017
9. OTHER RISKS (continued)
Portfolio is subject to the risk factors associated with the investments of the Underlying Funds in direct proportion to the amount of assets allocated to each. To the extent that the Portfolio has a relative concentration of its portfolio in a single Underlying Fund, the Portfolio may be more susceptible to adverse developments affecting that Underlying Fund, and may be more susceptible to losses because of these developments.
Investments in Other Investment Companies Risk — As a shareholder of another investment company, including an exchange-traded fund (“ETF”), the Portfolio will indirectly bear its proportionate share of any net management fees and other expenses paid by such other investment companies, in addition to the fees and expenses regularly borne by the Portfolio. ETFs are subject to risks that do not apply to conventional mutual funds, including but not limited to the following: (i) the market price of the ETF’s shares may trade at a premium or a discount to their NAV; and (ii) an active trading market for an ETF’s shares may not develop or be maintained.
Large Shareholder Transactions Risk — The Portfolio or an Underlying Fund may experience adverse effects when certain large shareholders, such as other funds, participating insurance companies, accounts and Goldman Sachs affiliates, purchase or redeem large amounts of shares of the Portfolio or an Underlying Fund. Such large shareholder redemptions may cause the Portfolio or an Underlying Fund to sell portfolio securities at times when it would not otherwise do so, which may negatively impact the Portfolio’s or an Underlying Fund’s NAV and liquidity. These transactions may also accelerate the realization of taxable income to shareholders if such sales of investments resulted in gains, and may also increase transaction costs. In addition, a large redemption could result in the Portfolio’s or an Underlying Fund’s current expenses being allocated over a smaller asset base, leading to an increase in the Portfolio’s or an Underlying Fund’s expense ratio. Similarly, large Portfolio or Underlying Fund share purchases may adversely affect the Portfolio’s or an Underlying Fund’s performance to the extent that the Portfolio or an Underlying Fund is delayed in investing new cash and is required to maintain a larger cash position than it ordinarily would.
Liquidity Risk — The Underlying Funds may make investments that are illiquid or that may become less liquid in response to market developments or adverse investor perceptions. Illiquid investments may be more difficult to value. Liquidity risk may also refer to the risk that the Portfolio will not be able to pay redemption proceeds within the allowable time period because of unusual market conditions, an unusually high volume of redemption requests, or other reasons. To meet redemption requests, the Portfolio may be forced to sell investments at an unfavorable time and/or under unfavorable conditions. Liquidity risk may be the result of, among other things, the reduced number and capacity of traditional market participants to make a market in fixed income securities or the lack of an active market. The potential for liquidity risk may be magnified by a rising interest rate environment or other circumstances where investor redemptions from fixed income mutual funds may be higher than normal, potentially causing increased supply in the market due to selling activity.
Market and Credit Risks — In the normal course of business, the Portfolio and the Underlying Funds trade financial instruments and enter into financial transactions where risk of potential loss exists due to changes in the market (market risk). Additionally, the Portfolio and the Underlying Funds may also be exposed to credit risk in the event that an issuer or guarantor fails to perform or that an institution or entity with which the Portfolio or the Underlying Funds have unsettled or open transactions defaults.
10. INDEMNIFICATIONS
Under the Trust’s organizational documents, its Trustees, officers, employees and agents are indemnified, to the extent permitted by the Act and state law, against certain liabilities that may arise out of performance of their duties to the Portfolio. Additionally, in the course of business, the Portfolio enters into contracts that contain a variety of indemnification clauses. The Portfolio’s maximum exposure under these arrangements is unknown, as this would involve future claims that may be made against the Portfolio that have not yet occurred. However, GSAM believes the risk of loss under these arrangements to be remote.
26
GOLDMAN SACHS VARIABLE INSURANCE TRUST MULTI-STRATEGY ALTERNATIVES PORTFOLIO
11. SUBSEQUENT EVENTS
Subsequent events after the Statement of Assets and Liabilities date have been evaluated, and GSAM has concluded that there is no impact requiring adjustment or disclosure in the financial statements.
12. SUMMARY OF SHARE TRANSACTIONS
Share activity is as follows:
| | | | | | | | | | | | | | | | |
| | | For the Fiscal Year Ended
December 31, 2017 | | | For the Fiscal Year Ended
December 31, 2016 | |
| | | Shares | | | Dollars | | | Shares | | | Dollars | |
| Institutional Shares | | | | | | | | | | | | | | | | |
| Shares sold | | | 14,083 | | | $ | 133,278 | | | | 30,367 | | | $ | 278,375 | |
| Reinvestment of distributions | | | 1,104 | | | | 10,357 | | | | 360 | | | | 3,280 | |
| Shares redeemed | | | (837 | ) | | | (7,840 | ) | | | (101,512 | ) | | | (911,862 | ) |
| | | | 14,350 | | | | 135,795 | | | | (70,785 | ) | | | (630,207 | ) |
| Service Shares | | | | | | | | | | | | | | | | |
| Shares sold | | | 7,288 | | | | 69,479 | | | | 2,700 | | | | 24,286 | |
| Reinvestment of distributions | | | 244 | | | | 2,291 | | | | 14 | | | | 131 | |
| Shares redeemed | | | (27 | ) | | | (254 | ) | | | (1,411 | ) | | | (17,774 | ) |
| | | | 7,505 | | | | 71,516 | | | | 1,303 | | | | 6,643 | |
| Advisor Shares | | | | | | | | | | | | | | | | |
| Shares sold | | | 608,399 | | | | 5,689,509 | | | | 410,465 | | | | 3,702,903 | |
| Reinvestment of distributions | | | 32,451 | | | | 303,417 | | | | 8,435 | | | | 76,669 | |
| Shares redeemed | | | (170,306 | ) | | | (1,586,246 | ) | | | (291,572 | ) | | | (2,626,432 | ) |
| | | | 470,544 | | | | 4,406,680 | | | | 127,328 | | | | 1,153,140 | |
| NET INCREASE | | | 492,399 | | | $ | 4,613,991 | | | | 57,846 | | | $ | 529,576 | |
27
Report of Independent Registered Public Accounting Firm
To the Board of Trustees of
Goldman Sachs Variable Insurance Trust and Shareholders of the Goldman Sachs Multi-Strategy Alternatives Portfolio
Opinion on the Financial Statements
We have audited the accompanying statement of assets and liabilities, including the schedule of investments, of the Goldman Sachs Multi-Strategy Alternatives Portfolio (the “Portfolio”) as of December 31, 2017, the related statement of operations for the year ended December 31, 2017, the statements of changes in net assets for each of the two years in the period ended December 31, 2017, including the related notes, and the financial highlights for each of the periods indicated therein (collectively referred to as the “financial statements”). In our opinion, the financial statements present fairly, in all material respects, the financial position of the Portfolio as of December 31, 2017, the results of its operations for the year then ended, the changes in its net assets for each of the two years in the period ended December 31, 2017 and the financial highlights for each of the periods indicated therein in conformity with accounting principles generally accepted in the United States of America.
Basis for Opinion
These financial statements are the responsibility of the Portfolio’s management. Our responsibility is to express an opinion on the Portfolio’s financial statements based on our audits. We are a public accounting firm registered with the Public Company Accounting Oversight Board (United States) (“PCAOB”) and are required to be independent with respect to the Portfolio in accordance with the U.S. federal securities laws and the applicable rules and regulations of the Securities and Exchange Commission and the PCAOB.
We conducted our audits of these financial statements in accordance with the standards of the PCAOB. Those standards require that we plan and perform the audit to obtain reasonable assurance about whether the financial statements are free of material misstatement, whether due to error or fraud.
Our audits included performing procedures to assess the risks of material misstatement of the financial statements, whether due to error or fraud, and performing procedures that respond to those risks. Such procedures included examining, on a test basis, evidence regarding the amounts and disclosures in the financial statements. Our audits also included evaluating the accounting principles used and significant estimates made by management, as well as evaluating the overall presentation of the financial statements. Our procedures included confirmation of securities owned as of December 31, 2017 by correspondence with the custodian, transfer agent and brokers; when replies were not received from brokers, we performed other auditing procedures. We believe that our audits provide a reasonable basis for our opinion.
PricewaterhouseCoopers LLP
Boston, Massachusetts
February 14, 2018
We have served as the auditor of one or more investment companies in the Goldman Sachs Fund complex since 2000.
28
GOLDMAN SACHS VARIABLE INSURANCE TRUST MULTI-STRATEGY ALTERNATIVES PORTFOLIO
| | |
| Portfolio Expenses — Six Month Period Ended December 31, 2017 (Unaudited) | | |
As a shareholder of Institutional, Service or Advisor Shares of the Portfolio, you incur ongoing costs, including management fees, distribution and/or service (12b-1) fees (with respect to Service and Advisor Shares) and other Portfolio expenses. This example is intended to help you understand your ongoing costs (in dollars) of investing in the Institutional Shares, Service Shares and Advisor Shares of the Portfolio and to compare these costs with the ongoing costs of investing in other mutual funds.
The example is based on an investment of $1,000 invested at the beginning of the period and held for the entire period from July 1, 2017 through December 31, 2017, which represents a period of 184 days of a 365 day year.
Actual Expenses — The first line under each share class in the table below provides information about actual account values and actual expenses. You may use the information in this line, together with the amount you invested, to estimate the expenses that you paid over the period. Simply divide your account value by $1,000 (for example, an $8,600 account value divided by $1,000=8.6), then multiply the result by the number in the first line under the heading entitled “Expenses Paid” to estimate the expenses you paid on your account during this period.
Hypothetical Example for Comparison Purposes — The second line under each share class in the table below provides information about hypothetical account values and hypothetical expenses based on the Portfolio’s actual net expense ratio and an assumed rate of return of 5% per year before expenses, which is not the Portfolio’s actual return. The hypothetical account values and expenses may not be used to estimate the actual ending account balance or expenses you paid for the period. You may use this information to compare the ongoing costs of investing in the Portfolio and other funds. To do so, compare this 5% hypothetical example with the 5% hypothetical examples that appear in the shareholder reports of the other funds.
Please note that the expenses shown in the table are meant to highlight your ongoing costs only. As a shareholder of the Portfolio you do not incur any transaction costs, such as sales charges, redemption fees, or exchange fees, but shareholders of other funds may incur such costs. The second line of the table is useful in comparing ongoing costs only and will not help you determine the relative total costs of owning different funds whose shareholders may incur transaction costs.
| | | | | | | | | | | | |
| Share Class | | Beginning
Account Value
07/01/17 | | | Ending
Account Value
12/31/17 | | | Expenses
Paid for the
6 Months
Ended
12/31/17* | |
| Institutional | | | | | | | | | | | | |
| Actual | | $ | 1,000 | | | $ | 1,022.30 | | | $ | 1.07 | |
| Hypothetical 5% return | | | 1,000 | | | | 1,024.15 | + | | | 1.07 | |
| Service | | | | | | | | | | | | |
| Actual | | | 1,000 | | | | 1,021.20 | | | | 2.34 | |
| Hypothetical 5% return | | | 1,000 | | | | 1,022.89 | + | | | 2.35 | |
| Advisor | | | | | | | | | | | | |
| Actual | | | 1,000 | | | | 1,020.00 | | | | 3.11 | |
| Hypothetical 5% return | | | 1,000 | | | | 1,022.13 | + | | | 3.11 | |
| | * | Expenses are calculated using the Portfolio’s annualized net expense ratio for each class, which represents the ongoing expenses as a percentage of net assets for the six months ended December 31, 2017. Expenses are calculated by multiplying the annualized net expense ratio by the average account value for the period; then multiplying the result by the number of days in the most recent fiscal half year; and then dividing that result by the number of days in the fiscal year. The annualized net expense ratios for the period were 0.21%, 0.46% and 0.61% for Institutional, Service and Advisor Shares, respectively. | |
| | + | Hypothetical expenses are based on the Portfolio’s actual annualized net expense ratios and an assumed rate of return of 5% per year before expenses. | |
29
GOLDMAN SACHS VARIABLE INSURANCE TRUST MULTI-STRATEGY ALTERNATIVES PORTFOLIO
Trustees and Officers (Unaudited)
Independent Trustees
| | | | | | | | | | |
| | | | | |
Name,
Address and Age1 | | Position(s) Held with the Trust | | Term of Office and
Length of
Time Served2 | | Principal Occupation(s) During Past 5 Years | | Number of
Portfolios in
Fund Complex
Overseen by
Trustee3 | | Other Directorships Held by Trustee4 |
Jessica Palmer Age: 68 | | Chair of the Board of Trustees | | 2018 (Trustee since 2007) | | Ms. Palmer is retired. She is Director, Emerson Center for the Arts and Culture (2011-Present); and was formerly a Consultant, Citigroup Human Resources Department (2007-2008); Managing Director, Citigroup Corporate and Investment Banking (previously, Salomon Smith Barney/Salomon Brothers) (1984-2006). Ms. Palmer was a Member of the Board of Trustees of Indian Mountain School (private elementary and secondary school) (2004-2009). Chair of the Board of Trustees — Goldman Sachs Trust and Goldman Sachs Variable Insurance Trust. | | 105 | | None |
Kathryn A. Cassidy Age: 63 | | Trustee | | Since 2015 | | Ms. Cassidy is retired. Formerly, she was Advisor to the Chairman (May 2014-December 2014); and Senior Vice President and Treasurer (2008-2014), General Electric Company & General Electric Capital Corporation (technology and financial services companies). Trustee — Goldman Sachs Trust and Goldman Sachs Variable Insurance Trust. | | 105 | | None |
Diana M. Daniels Age: 68 | | Trustee | | Since 2007 | | Ms. Daniels is retired. Formerly, she was Vice President, General Counsel and Secretary, The Washington Post Company (1991-2006). Ms. Daniels is a Trustee Emeritus and serves as a Presidential Councillor of Cornell University (2013-Present); former Member of the Legal Advisory Board, New York Stock Exchange (2003-2006) and of the Corporate Advisory Board, Standish Mellon Management Advisors (2006-2007). Trustee — Goldman Sachs Trust and Goldman Sachs Variable Insurance Trust. | | 105 | | None |
Herbert J. Markley Age: 67 | | Trustee | | Since 2013 | | Mr. Markley is retired. Formerly, he was Executive Vice President, Deere & Company (an agricultural and construction equipment manufacturer) (2007-2009); and President, Agricultural Division, Deere & Company (2001-2007). Previously, Mr. Markley served as an Advisory Board Member of Goldman Sachs Trust and Goldman Sachs Variable Insurance Trust (June 2013-October 2013). Trustee — Goldman Sachs Trust and Goldman Sachs Variable Insurance Trust. | | 105 | | None |
Roy W. Templin Age: 57 | | Trustee | | Since 2013 | | Mr. Templin is retired. He is Director, Armstrong World Industries, Inc. (a designer and manufacturer of ceiling, wall and suspension system solutions) (2016–Present); and was formerly Chairman of the Board of Directors, Con-Way Incorporated (a transportation, logistics and supply chain management service company) (2014-2015); Executive Vice President and Chief Financial Officer, Whirlpool Corporation (an appliance manufacturer and marketer) (2004-2012). Previously, Mr. Templin served as an Advisory Board Member of Goldman Sachs Trust and Goldman Sachs Variable Insurance Trust (June 2013-October 2013). Trustee — Goldman Sachs Trust and Goldman Sachs Variable Insurance Trust. | | 105 | | Armstrong World Industries, Inc. (a ceiling, wall and suspension systems solutions manufacturer) |
Gregory G. Weaver Age: 66 | | Trustee | | Since 2015 | | Mr. Weaver is retired. He is Director, Verizon Communications Inc. (2015-Present); and was formerly Chairman and Chief Executive Officer, Deloitte & Touche LLP (a professional services firm) (2001-2005 and 2012-2014); and Member of the Board of Directors, Deloitte & Touche LLP (2006-2012). Trustee — Goldman Sachs Trust and Goldman Sachs Variable Insurance Trust. | | 105 | | Verizon Communications Inc. |
| | | | | | | | | | |
30
GOLDMAN SACHS VARIABLE INSURANCE TRUST MULTI-STRATEGY ALTERNATIVES PORTFOLIO
Trustees and Officers (Unaudited) (continued)
Interested Trustee*
| | | | | | | | | | |
| | | | | |
Name,
Address and Age1 | | Position(s) Held with the Trust | | Term of Office and
Length of
Time Served2 | | Principal Occupation(s) During Past 5 Years | | Number of
Portfolios in
Fund Complex
Overseen by
Trustee3 | | Other Directorships Held by Trustee4 |
James A. McNamara Age: 55 | | President and Trustee | | Since 2007 | | Managing Director, Goldman Sachs (January 2000-Present); Director of Institutional Fund Sales, GSAM (April 1998-December 2000); and Senior Vice President and Manager, Dreyfus Institutional Service Corporation (January 1993- April 1998). President and Trustee — Goldman Sachs Trust; Goldman Sachs Variable Insurance Trust; Goldman Sachs Trust II; Goldman Sachs MLP Income Opportunities Fund; Goldman Sachs MLP and Energy Renaissance Fund; Goldman Sachs ETF Trust; Goldman Sachs Private Markets Fund 2018 LLC; Goldman Sachs Private Markets Fund 2018 (A) LLC; and Goldman Sachs Private Markets Fund 2018 (B) LLC. | | 146 | | None |
| | | | | | | | | | |
| * | Mr. McNamara is considered to be an “Interested Trustee” because he holds positions with Goldman Sachs and owns securities issued by The Goldman Sachs Group, Inc. Mr. McNamara holds comparable positions with certain other companies of which Goldman Sachs, GSAM or an affiliate thereof is the investment adviser, administrator and/or distributor. |
| 1 | Each Trustee may be contacted by writing to the Trustee, c/o Goldman Sachs, 200 West Street, New York, New York, 10282, Attn: Caroline Kraus. Information is provided as of December 31, 2017. |
| 2 | Subject to such policies as may be adopted by the Board from time-to-time, each Trustee holds office for an indefinite term, until the earliest of: (a) the election of his or her successor; (b) the date the Trustee resigns or is removed by the Board or shareholders, in accordance with the Trust’s Declaration of Trust; or (c) the termination of the Trust. The Board has adopted policies which provide that (a) no Trustee shall hold office for more than 15 years and (b) a Trustee shall retire as of December 31st of the calendar year in which he or she reaches his or her 74th birthday, unless a waiver of such requirement shall have been adopted by a majority of the other Trustees. These policies may be changed by the Trustees without shareholder vote. |
| 3 | The Goldman Sachs Fund Complex includes certain other companies listed above for each respective Trustee. As of December 31, 2017, Goldman Sachs Trust consisted of 91 portfolios (90 of which offered shares to the public); Goldman Sachs Variable Insurance Trust consisted of 14 portfolios; Goldman Sachs Trust II consisted of 17 portfolios (16 of which offered shares to the public); Goldman Sachs BDC, Inc., Goldman Sachs Private Middle Market Credit LLC, Goldman Sachs MLP Income Opportunities Fund, Goldman Sachs MLP and Energy Renaissance Fund, Goldman Sachs Private Markets Fund 2018 LLC, Goldman Sachs Private Markets Fund 2018 (A) LLC and Goldman Sachs Private Markets Fund 2018 (B) LLC each consisted of one portfolio; and Goldman Sachs ETF Trust consisted of 19 portfolios (12 of which offered shares to the public). Goldman Sachs Private Middle Market Credit LLC, Goldman Sachs Private Markets Fund 2018 LLC, Goldman Sachs Private Markets Fund 2018 (A) LLC and Goldman Sachs Private Markets Fund 2018 (B) LLC do not offer shares to the public. |
| 4 | This column includes only directorships of companies required to report to the Securities and Exchange Commission under the Securities Exchange Act of 1934 (i.e., “public companies”) or other investment companies registered under the Act. |
Additional information about the Trustees is available in the Portfolio’s Statement of Additional Information, which can be obtained from Goldman Sachs free of charge by calling this toll-free number (in the United States of America): 1-800-526-7384.
31
GOLDMAN SACHS VARIABLE INSURANCE TRUST MULTI-STRATEGY ALTERNATIVES PORTFOLIO
Trustees and Officers (Unaudited) (continued)
Officers of the Trust*
| | | | | | |
| | | |
| Name, Address and Age1 | | Position(s) Held with the Trust | | Term of
Office and
Length of
Time Served2 | | Principal Occupation(s) During Past 5 Years |
James A. McNamara 200 West Street New York, NY 10282 Age: 55 | | Trustee and President | | Since 2007 | | Managing Director, Goldman Sachs (January 2000-Present); Director of Institutional Fund Sales, GSAM (April 1998-December 2000); and Senior Vice President and Manager, Dreyfus Institutional Service Corporation (January 1993-April 1998). President and Trustee — Goldman Sachs Trust; Goldman Sachs Variable Insurance Trust; Goldman Sachs Trust II; Goldman Sachs MLP Income Opportunities Fund; Goldman Sachs MLP and Energy Renaissance Fund; Goldman Sachs ETF Trust; Goldman Sachs Private Markets Fund 2018 LLC; Goldman Sachs Private Markets Fund 2018 (A) LLC; and Goldman Sachs Private Markets Fund 2018 (B) LLC. |
Caroline L. Kraus 200 West Street New York, NY 10282 Age: 40 | | Secretary | | Since 2012 | | Managing Director, Goldman Sachs (January 2016-Present); Vice President, Goldman Sachs (August 2006-December 2015); Associate General Counsel, Goldman Sachs (2012-Present); Assistant General Counsel, Goldman Sachs (August 2006-December 2011); and Associate, Weil, Gotshal & Manges, LLP (2002-2006). Secretary — Goldman Sachs Trust (previously Assistant Secretary (2012)); Goldman Sachs Variable Insurance Trust (previously Assistant Secretary (2012)); Goldman Sachs Trust II; Goldman Sachs BDC, Inc.; Goldman Sachs Private Middle Market Credit LLC; Goldman Sachs Middle Market Lending Corp.; Goldman Sachs MLP Income Opportunities Fund; Goldman Sachs MLP and Energy Renaissance Fund; Goldman Sachs ETF Trust; Goldman Sachs Private Markets Fund 2018 LLC; Goldman Sachs Private Markets Fund 2018 (A) LLC; and Goldman Sachs Private Markets Fund 2018 (B) LLC. |
Scott M. McHugh 200 West Street New York, NY 10282 Age: 46 | | Treasurer, Senior Vice President and Principal Financial Officer | | Since 2009 (Principal Financial Officer since 2013) | | Managing Director, Goldman Sachs (January 2016-Present); Vice President, Goldman Sachs (February 2007-December 2015); Assistant Treasurer of certain mutual funds administered by DWS Scudder (2005-2007); and Director (2005-2007), Vice President (2000-2005), and Assistant Vice President (1998-2000), Deutsche Asset Management or its predecessor (1998-2007). Treasurer, Senior Vice President and Principal Financial Officer — Goldman Sachs Trust; Goldman Sachs Variable Insurance Trust; Goldman Sachs Trust II; Goldman Sachs MLP Income Opportunities Fund; Goldman Sachs MLP and Energy Renaissance Fund; Goldman Sachs ETF Trust; Goldman Sachs Private Markets Fund 2018 LLC; Goldman Sachs Private Markets Fund 2018 (A) LLC; and Goldman Sachs Private Markets Fund 2018 (B) LLC. |
Joseph F. DiMaria 30 Hudson Street Jersey City, NJ 07302 Age: 49 | | Assistant Treasurer and Principal Accounting Officer | | Since 2016 (Principal Accounting Officer since 2017) | | Managing Director, Goldman Sachs (November 2015-Present) and Vice President — Mutual Fund Administration, Columbia Management Investment Advisers, LLC (May 2010-October 2015). Assistant Treasurer and Principal Accounting Officer — Goldman Sachs Trust; Goldman Sachs Variable Insurance Trust; Goldman Sachs Trust II; Goldman Sachs MLP Income Opportunities Fund; Goldman Sachs MLP and Energy Renaissance Fund; Goldman Sachs ETF Trust; Goldman Sachs Private Markets Fund 2018 LLC; Goldman Sachs Private Markets Fund 2018 (A) LLC; and Goldman Sachs Private Markets Fund 2018 (B) LLC. |
| | | | | | |
| * | Represents a partial list of officers of the Trust. Additional information about all the officers is available in the Portfolio’s Statement of Additional Information, which can be obtained from Goldman Sachs free of charge by calling this toll-free number (in the United States): 1-800-526-7384. |
| 1 | Information is provided as of December 31, 2017. |
| 2 | Officers hold office at the pleasure of the Board of Trustees or until their successors are duly elected and qualified. Each officer holds comparable positions with certain other companies of which Goldman Sachs, GSAM or an affiliate thereof is the investment adviser, administrator and/or distributor. |
32
GOLDMAN SACHS VARIABLE INSURANCE TRUST MULTI-STRATEGY ALTERNATIVES PORTFOLIO
Goldman Sachs Variable Insurance Trust — Tax Information (Unaudited)
For the year ended December 31, 2017, 3.05% of the dividends paid from net investment company taxable income by the Multi-Strategy Alternatives Portfolio Fund qualify for the dividends received deduction available to corporations.
For the 2017 tax year, the Multi-Strategy Alternatives Portfolio Fund has elected to pass through a credit for taxes paid to foreign jurisdictions. The total amount of income received by the Multi-Strategy Alternatives Portfolio Fund from sources within foreign countries and possessions of the United States was $0.0219 per share, all of which is attributable to qualified passive income. The percentage of net investment income dividends paid by the Fund during the year ended December 31, 2017 from foreign sources was 8.55%. The total amount of foreign taxes paid by the Fund was $0.0018 per share.
33
| | |
| TRUSTEES | | OFFICERS |
| Jessica Palmer, Chair | | James A. McNamara, President |
| Kathryn A. Cassidy | | Scott M. McHugh, Treasurer, Senior Vice |
| Diana M. Daniels | | President and Principal Financial Officer |
| Herbert J. Markley | | Joseph F. DiMaria, Assistant Treasurer and |
| James A. McNamara | | Principal Accounting Officer |
| Roy W. Templin | | Caroline L. Kraus, Secretary |
| Gregory G. Weaver | | |
GOLDMAN SACHS & CO. LLC
Distributor and Transfer Agent
GOLDMAN SACHS ASSET MANAGEMENT, L.P.
Investment Adviser
200 West Street, New York
New York 10282
Visit our web site at www.GSAMFUNDS.com to obtain the most recent month-end returns.
The reports concerning the Portfolio included in this shareholder report may contain certain forward-looking statements about the factors that may affect the performance of the Portfolio in the future. These statements are based on Portfolio management’s predictions and expectations concerning certain future events and their expected impact on the Portfolio, such as performance of the economy as a whole and of specific industry sectors, changes in the levels of interest rates, the impact of developing world events, and other factors that may influence the future performance of the Portfolio. Management believes these forward-looking statements to be reasonable, although they are inherently uncertain and difficult to predict. Actual events may cause adjustments in portfolio management strategies from those currently expected to be employed.
A description of the policies and procedures that the Portfolio uses to determine how to vote proxies relating to portfolio securities and information regarding how the Portfolio voted proxies relating to portfolio securities for the 12-month period ended December 31 is available (i) without charge, upon request by calling 1-800-621-2550; and (ii) on the Securities and Exchange Commission (“SEC”) web site at http://www.sec.gov.
The Portfolio files its complete schedule of portfolio holdings with the SEC for the first and third quarters of each fiscal year on Form N-Q. The Portfolio’s Form N-Qs are available on the SEC’s web site at http://www.sec.gov within 60 days after the Portfolio’s first and third fiscal quarters. The Portfolio’s Form N-Qs may be reviewed and copied at the SEC’s Public Reference Room in Washington, D.C. and information on the operation of the Public Reference Room may also be obtained by calling 1-800-SEC-0330. Form N-Qs may be obtained upon request and without charge by calling 1-800-621-2550.
Views and opinions expressed are for informational purposes only and do not constitute a recommendation by GSAM to buy, sell, or hold any security. Views and opinions are current as of the date of this presentation and may be subject to change, they should not be construed as investment advice.
Goldman Sachs & Co. LLC (“Goldman Sachs”) does not provide legal, tax or accounting advice. Any statement contained in this communication (including any attachments) concerning U.S. tax matters was not intended or written to be used, and cannot be used, for the purpose of avoiding penalties under the Internal Revenue Code, and was written to support the promotion or marketing of transactions or matters addressed. Clients of Goldman Sachs should obtain their own independent tax advice based on their particular circumstances.
The website links provided are for your convenience only and are not an endorsement or recommendation by GSAM of any of these websites or the products or services offered. GSAM is not responsible for the accuracy and validity of the content of these websites.
Portfolio holdings and allocations shown are as of December 31, 2017 and may not be representative of future investments. Portfolio holdings should not be relied on in making investment decisions and should not be construed as research or investment advice regarding particular securities. Current and future holdings are subject to risk.
References to indices, benchmarks or other measures of relative market performance over a specified period of time are provided for your information only and do not imply that the portfolio will achieve similar results. The index composition may not reflect the manner in which a portfolio is constructed. While an adviser seeks to design a portfolio which reflects appropriate risk and return features, portfolio characteristics may deviate from those of the benchmark.
The Global Industry Classification Standard (“GICS”) was developed by and is the exclusive property and a service mark of Morgan Stanley Capital International Inc. (“MSCI”) and Standard & Poor’s, a division of The McGraw-Hill Companies, Inc. (“S&P”) and is licensed for use by Goldman Sachs. Neither MSCI, S&P nor any other party involved in making or compiling the GICS or any GICS classifications makes any express or implied warranties or representations with respect to such standard or classification (or the results to be obtained by the use thereof), and all such parties hereby expressly disclaim all warranties of originality, accuracy, completeness, merchantability or fitness for a particular purpose with respect to any of such standard or classification. Without limiting any of the foregoing, in no event shall MSCI, S&P, any of their affiliates or any third party involved in making or compiling the GICS or any GICS classifications have any liability for any direct, indirect, special, punitive, consequential or any other damages (including lost profits) even if notified of the possibility of such damages.
The portfolio risk management process includes an effort to monitor and manage risk, but does not imply low risk.
Diversification does not protect an investor from market risk and does not ensure a profit.
Shares of the Goldman Sachs VIT Funds are offered to separate accounts of participating life insurance companies for the purpose of funding variable annuity contracts and variable life insurance policies. Shares of the Portfolio are not offered directly to the general public. The variable annuity contracts and variable life insurance policies are described in the separate prospectuses issued by participating insurance companies. You should refer to those prospectuses for information about surrender charges, mortality and expense risk fees and other charges that may be assessed by participating insurance companies under the variable annuity contracts or variable life insurance policies. Such fees or charges, if any, may affect the return you may realize with respect to your investments. Ask your representative for more complete information. Please consider a fund’s objectives, risks and charges and expenses, and read the prospectus carefully before investing. The prospectus contains this and other information about the Portfolio.
This material is not authorized for distribution to prospective investors unless preceded or accompanied by a current prospectus or summary prospectus, if applicable. Investors should consider the Portfolio’s objective, risks, and charges and expenses, and read the summary prospectus, if available, and/or the prospectus carefully before investing or sending money. The summary prospectus, if available, and the prospectus contain this and other information about the Portfolio and may be obtained from your authorized dealer or from Goldman Sachs & Co. LLC by calling 1-800-621-2550.
THIS MATERIAL IS FOR INFORMATIONAL PURPOSES ONLY AND IS PROVIDED SOLELY ON THE BASIS THAT IT WILL NOT CONSTITUTE INVESTMENT OR OTHER ADVICE OR A RECOMMENDATION RELATING TO ANY PERSON’S OR PLAN’S INVESTMENT OR OTHER DECISIONS, AND GOLDMAN SACHS IS NOT A FIDUCIARY OR ADVISOR WITH RESPECT TO ANY PERSON OR PLAN BY REASON OF PROVIDING THE MATERIAL OR CONTENT HEREIN INCLUDING UNDER THE EMPLOYEE RETIREMENT INCOME SECURITY ACT OF 1974 OR DEPARTMENT OF LABOR REGULATIONS. PLAN SPONSORS AND OTHER FIDUCIARIES SHOULD CONSIDER THEIR OWN CIRCUMSTANCES IN ASSESSING ANY POTENTIAL COURSE OF ACTION.
This report is prepared for the general information of contract owners and is not an offer of shares of the Goldman Sachs Variable Insurance Trust — Goldman Sachs Multi-Strategy Alternatives Portfolio.
© 2018 Goldman Sachs. All rights reserved.
VITMSAAR-18/119291-OTU-698865/585
Goldman
Sachs Variable Insurance Trust
Goldman Sachs Core Fixed Income Fund
Goldman Sachs Equity Index Fund
Goldman Sachs Growth Opportunities Fund
Goldman Sachs High Quality Floating Rate Fund
Annual Report
December 31, 2017

MARKET REVIEW
Goldman Sachs Variable Insurance Trust Funds
Market Review
During the 12 months ended December 31, 2017 (the “Reporting Period”), the U.S. equity market recorded a strong gain, while the broad fixed income market generated modestly positive returns.
Equity Markets
As the Reporting Period began in January 2017, U.S. equities rallied to new highs on prospects of deregulation, tax reform and infrastructure spending as well as on stronger economic data. In March 2017, the Federal Reserve (the “Fed”) raised interest rates for the third time since the 2008 global financial crisis, which was met with dovish market reaction. (Dovish tends to suggest lower interest rates; opposite of hawkish.) U.S. equities were virtually flat, albeit positive, in March 2017 and then continued to climb higher in April 2017 on strong earnings results and receding European political risk. Although the labor market remained strong, economic activity and inflation moderated during the second calendar quarter. In the third calendar quarter, U.S. economic activity and labor market data showed consistent strength, with a reversal of five consecutive downside inflation surprises. Progress on tax reform and strong economic activity data remained supportive for U.S. equities in October and November 2017. The Fed delivered the third rate hike of 2017 in December, as had been widely expected, having done similarly in June 2017, and maintained its projections for three additional interest rate hikes in 2018. U.S. equities gained additional momentum toward the end of the Reporting Period from the passage of a tax reform bill that reduced the corporate tax rate from 35% to 21%. The fourth quarter of 2017 marked the ninth consecutive quarter of positive returns for the S&P 500® Index, its strongest quarterly advance in four years.
U.S. equities, as represented by the Standard & Poor’s 500® Index (the “S&P 500® Index”) gained 21.83% during the Reporting Period. It was a banner year for U.S. equities, with the S&P 500® Index advancing for 12 consecutive months in 2017, a feat that had previously never been accomplished in a single calendar year. U.S. equity market volatility was at historic lows. Information technology, materials and consumer discretionary were the best performing sectors in the S&P 500® Index during the Reporting Period. The weakest performing sectors were telecommunication services and energy, the only two to post negative absolute returns, followed by real estate, which was comparatively weak but generated a positive return during the Reporting Period.
Within the U.S. equity market, there was significant disparity in performance not only among sectors but also among the various capitalization and style segments. While all capitalization segments posted positive returns, large-cap stocks, as measured by the Russell 1000® Index, performed best, followed by mid-cap stocks, as measured by the Russell Midcap® Index, and then at some distance by small-cap stocks, as measured by the Russell 2000® Index. From a style perspective, growth-oriented stocks significantly outpaced value-oriented stocks across the capitalization spectrum. (All as measured by the Russell Investments indices.)
Fixed Income Markets
When the Reporting Period began in the first quarter of 2017, government bond sectors sold off and spread (or non-government bond) sectors generally posted gains. Investors focused on the prospect of pro-growth policies from the U.S. Administration, which helped boost business and consumer sentiment to near record levels, and also on the positive impact of earlier fiscal stimulus in China. Global purchasing managers’ indices (“PMI”) pointed to solid expansion across the largest global economies, the U.S. in particular. In Europe, economic data strengthened and political risk remained contained, as markets weathered the official start of Brexit negotiations. (Brexit refers to the U.K.’s efforts to exit the European Union.) Monetary policy presented few surprises during the first calendar quarter, as the European Central Bank (“ECB”), Bank of Japan (“BoJ”) and Bank of England (“BoE”) kept their respective monetary policies unchanged. In March 2017, the ECB raised its economic growth and inflation forecast. The same month, Fed policymakers hiked interest rates. The U.S. dollar weakened versus many global currencies during the first calendar quarter.
Spread sectors generally recorded positive returns during the second quarter of 2017, though with mixed results relative to government bond sectors. Political developments led to temporary bouts of volatility early in the quarter. However, political risks receded in May 2017 on the centrist candidate’s victory in the French presidential election, which was supportive of French and European peripheral bonds broadly. On the economic front, U.S. core inflation weakened for the third consecutive month in May 2017, casting uncertainty over the pace of Fed monetary tightening. Nonetheless, comments included in minutes from the Fed’s
1
MARKET REVIEW
May and June 2017 policy meetings suggested an announcement about how and when the Fed would begin reducing the size of its balance sheet would be made sooner than the markets had previously anticipated. In Europe, economic data continued to surprise to the upside. At its June 2017 policy meeting, the ECB provided an optimistic assessment of the risks to economic growth but revised downward its medium-term inflation forecasts. The ECB, BoJ and BoE left their respective monetary policies unchanged during the second calendar quarter, while the Fed raised interest rates for the second time in 2017 at its June policy meeting. As the quarter came to an end, a string of comments from global central bankers triggered a hawkish market reaction. Global interest rates rose as the market anticipated a faster than expected pace of monetary policy tightening by the BoE, ECB and Bank of Canada (“BoC”). During the second quarter of 2017, the U.S. dollar weakened versus many global currencies.
In the third quarter of 2017, spread sectors broadly advanced, outperforming government bond sectors. The Fed kept its monetary policy unchanged but unveiled its plans for balance sheet normalization. (Balance sheet normalization refers to the steps the Fed takes to reverse quantitative easing and remove the substantial monetary accommodation it has provided to the economy since the financial crisis began in 2007.) This prompted a hawkish market reaction, with the U.S. dollar appreciating and yields on U.S. government bonds rising. However, the U.S. Treasury yield curve only steepened modestly due to geopolitical uncertainty and mixed U.S. economic data, including weak inflation readings. The central banks of other developed countries also set the stage for less accommodative monetary policy. The BoE noted “a majority” of its policymakers were in favor of tightening policy “over the coming months,” while the BoC surprised the markets with two consecutive rate hikes. The market’s expectations for a BoE rate hike in November 2017, along with a constructive tone for Brexit negotiations, drove the British pound higher versus the U.S. dollar. The U.S. dollar also continued to weaken relative to many other global currencies during the third calendar quarter.
During the fourth calendar quarter, spread sector performance was broadly positive, supported by ongoing strength in the global macro environment and contained market, macro and political volatility. Passage of U.S. tax legislation and solid corporate earnings were particularly supportive of U.S. corporate credit. In October 2017, the ECB announced it would reduce its monthly asset purchases from €60 billion to €30 billion for nine months beginning in January 2018, mainly by purchasing fewer sovereign government bonds. The ECB also said its policy rates would remain low for “an extended period of time, and well past the horizon of the net asset purchases.” During the same month, the BoE reversed an emergency interest rate cut, made in August 2016 following the Brexit referendum, and signaled that future monetary policy tightening would be limited, gradual and dependent on the economic reaction to the U.K.’s eventual departure from the European Union. In December 2017, the Fed delivered its third short-term interest rate hike of 2017. The Fed’s dot plot, which shows rate projections of the members of the Fed’s Open Market Committee, indicated that three rate increases were on tap for 2018 and potentially two in 2019. The U.S. dollar weakened further versus many global currencies during the fourth quarter of 2017.
For the Reporting Period overall, sovereign emerging markets debt and high yield corporate bonds outperformed U.S. Treasuries. Investment grade corporate bonds also outpaced U.S. Treasuries. In addition, commercial mortgage-backed securities, agency securities, asset-backed securities and mortgage-backed securities outperformed U.S. Treasuries, though more modestly. The U.S. Treasury yield curve flattened during the Reporting Period, as yields on maturities of seven years and shorter rose and yields on maturities of 10 years and longer fell. The yield on the bellwether 10-year U.S. Treasury edged down approximately five basis points to end the Reporting Period at 2.40%. (A basis point is 1/100th of a percentage point. Yield curve is a spectrum of maturities. A flattening yield curve is one wherein the differential in yields between longer-term and shorter-term maturities narrows.)
Looking Ahead
Equity Markets
At the end of the Reporting Period, we maintained a positive outlook for equities based on economic and earnings growth prospects. For the first year since 2010, consensus global economic growth and earnings per share growth forecasts were positive in all major global regions at the end of the Reporting Period. The U.S. economy continued to offer the strongest growth among developed countries, and there was significant investor and business optimism about the potentially pro-growth policies of the current Administration that could support further economic and earnings growth. However, such optimism may already be reflected in elevated equity valuations and U.S. equity indices reaching all-time highs. That said, we believe there remain pockets of
2
MARKET REVIEW
opportunity. At the end of the Reporting Period, we generally liked companies that invest in their future growth through capital expenditures and research and development, rather than those focusing on shareholder returns. While companies with high shareholder returns have historically performed better, those focused on investing for the future have performed better since 2016. We expect this trend to continue with solid economic growth.
Fixed Income Markets
At the end of the Reporting Period, we believed the global economic expansion was likely to continue in 2018. This view was supported, in our opinion, by solid household consumption due to labor market strength, improvement in business investment and continuing accommodative monetary policy conditions. Forward-looking economic activity indicators, such as PMI surveys, remained comfortably in what we consider expansionary territory for most countries, with notable strength in manufacturing data. That being said, global economic growth appears to have reached a pace that is unlikely to be sustainable, in our view. We believe risks are broadly skewed to the downside, though the reasons vary across regions — ranging from the risk of the U.S. economy potentially overheating, which could encourage more abrupt Fed tightening, to less monetary and fiscal support in Europe and less growth-friendly policies in China. Accordingly, we expect global economic growth to pull back somewhat from the above-trend levels seen at the end of the Reporting Period, which we believe will be accompanied by higher fixed income market volatility. We consider the emerging markets, aside from China, a potential bright spot. Therefore, we expect the economies of emerging countries to outperform during 2018, which should widen the gap between their economic growth and that of developed market countries broadly.
Despite solid economic growth momentum, inflationary pressures remained subdued during the Reporting Period. At the end of the reporting period, we expect inflation to trend toward central bank targets as output gaps near or move further into positive territory and as unemployment continues to approach or stay below estimates of the non-accelerating inflation rate of unemployment (i.e., a level of unemployment below which inflation rises).
Regionally, we continue to expect the U.S. to take the lead in unwinding the accommodative monetary policy that was put in place by many of the world’s central banks after the 2008-2009 financial crisis. We think the Fed will raise interest rates three times in 2018, in line with projections provided at its December 2017 policy meeting, while continuing to trim its balance sheet. We also see scope for several other developed markets central banks, including the BoC and Reserve Bank of New Zealand, to tighten monetary policy in 2018, due to domestic economic strength. In contrast, we expect prolonged monetary policy accommodation in Europe and Japan, where core inflation lacks upward momentum.
3
GOLDMAN SACHS VARIABLE INSURANCE TRUST CORE FIXED INCOME FUND
INVESTMENT OBJECTIVE
The Fund seeks a total return consisting of capital appreciation and income that exceeds the total return of the Bloomberg Barclays U.S. Aggregate Bond Index.
Portfolio Management Discussion and Analysis
Below, the Goldman Sachs Fixed Income Portfolio Management Team discusses the Goldman Sachs Variable Insurance Trust — Goldman Sachs Core Fixed Income Fund’s (the “Fund”) performance and positioning for the 12-month period ended December 31, 2017 (the “Reporting Period”).
How did the Fund perform during the Reporting Period?
During the Reporting Period, the Fund’s Institutional and Service Shares generated average annual total returns of 3.40% and 3.14%, respectively. This compares to the 3.54% average annual total return of the Fund’s benchmark, the Bloomberg Barclays U.S. Aggregate Bond Index (the “Bloomberg Barclays Index”), during the same time period.
What key factors were responsible for the Fund’s performance during the Reporting Period?
During the Reporting Period, the Fund’s top-down country strategy detracted from relative performance, driven by long positions in Canada versus short positions in the U.S. Within our top-down currency strategy, the Fund was hurt by short positions in the euro and the New Taiwan dollar. These results were partially offset by long positions in the Swedish krona, Norwegian krone and New Zealand dollar.
Conversely, the Fund’s top-down cross-sector strategy contributed positively to relative performance. In our cross-sector strategy, we invest Fund assets across a variety of fixed income sectors, including some that may not be included in the Bloomberg Barclays Index. Our bottom-up individual issue selection also added to relative returns.
The Fund’s combined tactical duration and yield curve positioning did not have a meaningful impact on performance during the Reporting Period. (Duration is a measure of the Fund’s sensitivity to changes in interest rates. Yield curve is a spectrum of maturities.)
Which fixed income market sectors most affected Fund performance during the Reporting Period?
During the Reporting Period, the Fund benefited from its overweight compared to the Bloomberg Barclays Index in asset-backed securities (“ABS”). Its allocations to collateralized loan obligations and non-agency mortgage-backed securities as well as its exposure to the government/swaps sector further aided relative performance. However, an underweight position in agency mortgage-backed securities detracted from its returns. The Fund was underweight agency mortgage-backed securities because we expected their spreads (yield differentials versus U.S. Treasuries of comparable maturity) to become more volatile as the Federal Reserve (the “Fed”) began tapering the reinvestment of its maturing holdings of agency mortgage-backed securities and U.S. Treasuries. We generally expected spreads to widen. In addition, the Fund’s underweight positions relative to the Bloomberg Barclays Index in U.S. corporate bonds, emerging markets corporate bonds and commercial mortgage-backed securities (“CMBS”) detracted from results.
As for individual issue selection, holdings within the government/swaps sector bolstered the Fund’s performance. More specifically, the Fund benefited from issue selection of U.S. government securities as well as investments that facilitated steepening positions on European government bond yield curves. (A steepening yield curve is one wherein the differential in yields between longer-term and shorter-term maturities widens; opposite of flattening.) Within corporate credit, the Fund was helped by our selection of various maturities along the yield curve and its holdings of investment grade corporate bonds in the financial sector. Conversely, issue selection of mortgage backed-securities within the securitized sector detracted from the Fund’s returns during the Reporting Period.
Did the Fund’s duration and yield curve positioning strategy help or hurt its results during the Reporting Period?
The Fund’s combined duration and yield curve positioning did not have a meaningful impact on relative returns during the Reporting Period. Compared to the Bloomberg Barclays Index, the Fund held a short duration position, which we tactically increased and decreased throughout the Reporting Period, as the U.S. Treasury yield curve flattened. Yields on the front, or
4
GOLDMAN SACHS VARIABLE INSURANCE TRUST CORE FIXED INCOME FUND
short-term, end of the yield curve rose on market expectations of and actual Fed interest rate hikes. Long-term yields were subdued on strong demand from pension funds, increased issuance of intermediate-term U.S. Treasury securities and muted inflationary pressures. In our view, the market was underestimating the potential pace of Fed interest rate increases during the Reporting Period and in 2018. In addition, U.S. financial conditions had not materially tightened amidst Fed rate hikes.
How did the Fund use derivatives and similar instruments during the Reporting Period?
As market conditions warranted during the Reporting Period, currency transactions were carried out using primarily over-the-counter (“OTC”) forward foreign exchange contracts. Currency transactions were used as we sought both to enhance returns and to hedge the Fund’s portfolio against currency exchange rate fluctuations. OTC forward foreign exchange contracts detracted from Fund performance during the Reporting Period. In addition, Treasury futures were employed as warranted to facilitate specific duration, yield curve and country strategies. During the Reporting Period, Treasury futures contributed positively to Fund results. Swaptions (options on interest rate swap contracts), which were used to express our interest rate views and to hedge volatility and yield curve risks in the Fund, did not have a meaningful impact on the Fund’s performance during the Reporting Period. Interest rate swaps, which were used to manage exposure to fluctuations in interest rates, detracted from Fund performance during the Reporting Period. Additionally, the Fund employed credit default swaps to implement specific credit-related investment strategies, including management of the Fund’s exposure to credit spreads. Credit default swaps did not have a material impact on the Fund’s results during the Reporting Period. The Fund also used inflation-linked swaps to express our views on U.K. inflation. Inflation-linked swaps did not have a meaningful impact on the Fund’s performance during the Reporting Period. Overall, we employ derivatives and similar instruments for the efficient management of the Fund’s portfolio. Derivatives and similar instruments allow us to manage interest rate, credit and currency risks more effectively by allowing us both to hedge and to apply active investment views with greater versatility and to afford greater risk management precision than we would otherwise be able to implement.
Were there any notable changes in the Fund’s weightings versus the Bloomberg Index during the Reporting Period?
During the Reporting Period, we reduced the Fund’s underweight relative to the Bloomberg Barclays Index in U.S. government securities. We increased its overweight position in ABS. In March 2017, we shifted the Fund from a small overweight in sovereign emerging markets debt to a small underweight position because of tight valuations and commodity price uncertainty. In October 2017, we moved the Fund to a rather neutral position compared to the Bloomberg Barclays Index in sovereign emerging markets debt.
Were there any changes to the Fund’s portfolio management team during the Reporting Period?
There were no changes to the Fund’s portfolio management team during the Reporting Period.
How was the Fund positioned relative to the Bloomberg Barclays Index at the end of the Reporting Period?
At the end of the Reporting Period, the Fund was underweight U.S. government securities compared to the Bloomberg Barclays Index on a market-value weighted basis. The Fund was overweight ABS and investment grade corporate bonds. (As measured by contribution to duration, the Fund was rather neutral in corporate credit.) On a market-value weighted basis, the Fund was underweight agency mortgage-backed securities, especially mortgage-backed pass-through securities. (Pass-through mortgages consist of a pool of residential mortgage loans, where homeowners’ monthly payments of principal, interest and prepayments pass from the original bank through a government agency or investment bank to investors.) The Fund was marginally overweight non-agency mortgage-backed securities and marginally underweight CMBS. The Fund was neutral relative to the Bloomberg Barclays Index in quasi-government bonds and emerging markets debt. It did not have any exposure to covered bonds at the end of the Reporting Period. (Covered bonds are securities created from either mortgage loans or public sector loans.)
5
FUND BASICS
Core Fixed Income Fund
As of December 31, 2017
STANDARDIZED TOTAL RETURNS1
| | | | | | | | | | | | | | | | | | |
| For the period ended 12/31/17 | | One Year | | | Five Years | | | Ten Years | | | Since Inception | | | Inception Date |
| Institutional | | | 3.40 | % | | | N/A | | | | N/A | | | | 2.22 | % | | 4/30/13 |
| Service | | | 3.14 | | | | 2.04 | % | | | 3.56 | % | | | 3.87 | | | 1/09/06 |
| 1 | The Standardized Total Returns are average annual total returns as of the most recent calendar quarter-end. They assume reinvestment of all distributions at net asset value (“NAV”). Because Institutional and Service Shares do not involve a sales charge, such a charge is not applied to their Standardized Total Returns. |
Total return figures in the above chart represent past performance and do not indicate future results, which will vary. The investment return and principal value of an investment will fluctuate and, therefore, an investor’s shares, when redeemed, may be worth more or less than their original cost. Current performance may be lower or higher than the total return figures in the above chart. Please visit www.GSAMFUNDS.com to obtain the most recent month-end returns. Performance reflects fee waivers and/or expense limitations in effect during the periods shown. In their absence, performance would be reduced.
EXPENSE RATIOS2
| | | | | | | | |
| | | Net Expense Ratio (Current) | | | Gross Expense Ratio (Before Waivers) | |
| Institutional | | | 0.42 | % | | | 0.65 | % |
| Service | | | 0.67 | | | | 0.91 | |
| 2 | The expense ratios of the Fund, both current (net of any fee waivers and/or expense limitations) and before waivers (gross of any fee waivers and/or expense limitations) are as set forth above according to the most recent publicly available Prospectus for the Fund and may differ from the expense ratios disclosed in the Financial Highlights in this report. Pursuant to a contractual arrangement, the Fund’s fee waivers and/or expense limitations will remain in place through at least April 28, 2018, and prior to such date, the Investment Adviser may not terminate the arrangements without the approval of the Fund’s Board of Trustees. If these arrangements are discontinued in the future, the expense ratios may change without shareholder approval. |
6
FUND BASICS
FUND COMPOSITION3
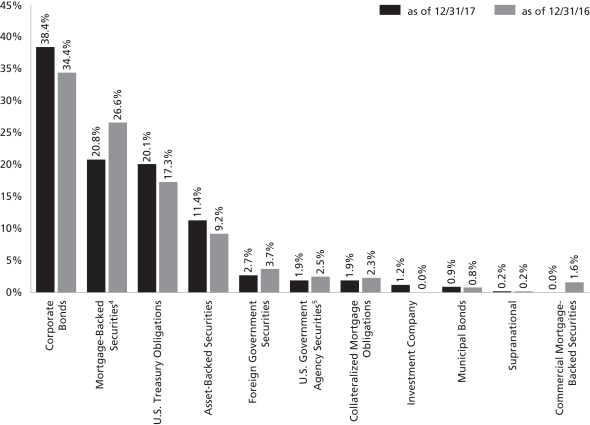
| 3 | The percentage shown for each investment category reflects the value of investments in that category as a percentage of net assets. Figures in the graph may not sum to 100% due to the exclusion of other assets and liabilities. The graph depicts the Fund’s investments but may not represent the Fund’s market exposure due to the exclusion of certain derivatives, if any, as listed in the Additional Investment Information section of the Schedule of Investments. |
| 4 | “Mortgage-Backed Securities” are guaranteed by the Government National Mortgage Association (“GNMA”), the Federal National Mortgage Association (“FNMA”) or the Federal Home Loan Mortgage Corp. (“FHLMC”). GNMA instruments are backed by the full faith and credit of the United States Government. |
| 5 | “U.S. Government Agency Securities” include agency securities offered by companies such as FNMA and the Federal Home Loan Bank (“FHLB”), which operate under a government charter. While they are required to report to a government regulator, their assets are not explicitly guaranteed by the government and they otherwise operate like any other publicly traded company. |
7
GOLDMAN SACHS VARIABLE INSURANCE TRUST CORE FIXED INCOME FUND
Performance Summary
December 31, 2017
The following graph shows the value, as of December 31, 2017, of a $10,000 investment made on January 1, 2008 in Service Shares. For comparative purposes, the performance of the Fund’s benchmark, the Bloomberg Barclays U.S. Aggregate Bond Index, is shown. This performance data represents past performance and should not be considered indicative of future performance, which will fluctuate with changes in market conditions. These performance fluctuations may cause an investor’s shares, when redeemed, to be worth more or less than their original cost. Performance reflects Fund level expenses, but does not reflect fees and expenses associated with any variable annuity contract or variable life insurance policy that uses the Fund as an investment option for any contract or policy. Had performance reflected all of those fees and expenses, performance would have been reduced. Performance reflects applicable fee waivers and/or expense limitations in effect during the periods shown, and in their absence, performance would be reduced. Performance of Institutional Shares will vary from Service Shares due to differences in class specific fees. In addition to the Investment Adviser’s decisions regarding issuer/industry/country investment selection and allocation, other factors may affect Fund performance. These factors include, but are not limited to, Fund operating fees and expenses, portfolio turnover, and subscription and redemption cash flows affecting the Fund.
Core Fixed Income Fund’s 10 Year Performance
Performance of a $10,000 investment, with distributions reinvested, from January 1, 2008 through December 31, 2017.

| | | | | | | | |
| Average Annual Total Return through December 31, 2017 | | One Year | | Five Years | | Ten Years | | Since Inception |
Institutional (Commenced April 30, 2013) | | 3.40% | | N/A | | N/A | | 2.22% |
Service (Commenced January 9, 2006) | | 3.14% | | 2.04% | | 3.56% | | 3.87% |
8
GOLDMAN SACHS VARIABLE INSURANCE TRUST EQUITY INDEX FUND
INVESTMENT OBJECTIVE
The Fund seeks to achieve investment results that correspond to the aggregate price and yield performance of a benchmark index that measures the investment returns of large capitalization stocks.
Portfolio Management Discussion and Analysis
Below, SSgA Funds Management, Inc. (“SSgA”), the Fund’s Subadviser, discusses the Goldman Sachs Variable Insurance Trust — Goldman Sachs Equity Index Fund’s (the “Fund”) performance and positioning for the 12-month period ended December 31, 2017 (the “Reporting Period”).
How did the Fund perform during the Reporting Period?
During the Reporting Period, the Fund’s Service Shares generated an average annual total return of 21.29%. This compares to the 21.83% average annual total return of the Fund’s benchmark, the Standard & Poor’s 500® Index (with dividends reinvested) (the “S&P 500® Index”), during the same time period.
During the Reporting Period, which sectors and which industries in the S&P 500® Index were the strongest contributors to the Fund’s performance?
Nine of the 11 sectors in the S&P 500® Index recorded gains during the Reporting Period. In terms of total return, the sectors that made the strongest positive contributions to the S&P 500® Index and to the Fund were information technology, materials and consumer discretionary. The largest sector by weighting in the S&P 500® Index at the end of the Reporting Period was information technology at a weighting of 23.75%. The industries with the strongest performance in terms of total return were casinos/gambling; homebuilding; electronics/appliance stores; electronic production equipment; and Internet retail.
On the basis of impact (which takes both total returns and weightings into account), the sectors that made the strongest positive contributions to the S&P 500® Index and to the Fund were information technology, health care and financials. The industries with the strongest performance on the basis of impact were Internet software/services; packaged software; telecommunications equipment; semiconductors; and medical specialties.
Which sectors and industries in the S&P 500® Index were the weakest contributors to the Fund’s performance?
In terms of total return, during the Reporting Period, the weakest performing sectors were telecommunication services, energy and real estate. The weakest performing industries in terms of total return were specialty telecommunications; contract drilling; food retail; oilfield services/equipment; and advertising/marketing services.
On the basis of impact, the weakest performing sectors were energy, telecommunication services and real estate. The weakest performing industries on the basis of impact were oilfield services/equipment; oil and gas production; industrial conglomerates; specialty stores; and major telecommunications.
Which individual stocks were the top performers, and which were the greatest detractors?
On the basis of impact, the stocks that made the strongest positive contribution during the Reporting Period were Alphabet, Amazon.com, Apple, Facebook and Microsoft. The weakest performers were Schlumberger, General Electric, Exxon Mobil, AT&T and Anadarko Petroleum.
How did the Fund use derivatives and similar instruments during the Reporting Period?
During the Reporting Period, the Fund did not use derivatives as part of an active management strategy to add value to the Fund’s results. However, equity index futures were used to equitize the Fund’s cash holdings. In other words, we put the Fund’s cash holdings to work by using them as collateral for the purchase of equity index futures. We also used these equity index futures to provide liquidity for daily cash flow requirements. Equity index futures had a neutral impact on the Fund’s performance during the Reporting Period.
Were there any changes to the Fund’s portfolio management team during the Reporting Period?
On January 3, 2017, co-portfolio manager John Tucker no longer served as a Portfolio Manager for the Fund. By design, all investment decisions for the Fund are performed within a co-lead or team structure. Effective January 3, 2017, Daniel TenPas, Principal and Portfolio Manager, replaced Mr. Tucker as Portfolio Manager for the Fund. Mr. TenPas joined Michael Feehily,
9
GOLDMAN SACHS VARIABLE INSURANCE TRUST EQUITY INDEX FUND
Senior Managing Director and the Head of Global Equity Beta Solutions in the Americas of SSgA, and Melissa Kapitulik, Vice President and Senior Portfolio Manager of SSgA, both of whom have managed the Fund since 2014.
What changes were made to the makeup of the S&P 500® Index during the Reporting Period?
Thirty-six stocks were removed from the S&P 500® Index during the Reporting Period. They were AutoNation, Bed Bath & Beyond, Bioverativ, Cars.com, Conduent, Delphi Technologies, Dun & Bradstreet, E. I. du Pont de Nemours and Company, Endo International, Everett SpinCo, First Solar, Frontier Communications, GetGo, Harman International Industries, JBG Smith Properties, Lennar B, Level 3 Communications, Linear Technology, Mallinckrodt, Mead Johnson Nutrition, Murphy Oil, Pitney Bowes, Reynolds American, Ryder System, Seattle SpinCo, Southwestern Energy, Spectra Energy, St. Jude Medical, Staples, TEGNA, Teradata, Transocean, Urban Outfitters, Varex Imaging, Whole Foods Market and Yahoo. There were 36 stocks added to the S&P 500® Index during the Reporting Period. They were Advanced Micro Devices, Alexandria Real Estate Equities, Align Technology, ANSYS, Bioverativ, Brighthouse Financial, Cadence Design Systems, Cars.com, CBOE Holdings, Conduent, Delphi Technologies, DISH Network A, DXC Technology Company, Duke Realty, Everest Re Group, Everett SpinCo, Gartner, GetGo, Hilton Worldwide Holdings, IDEXX Laboratories, IHS Markit, Incyte, JBG Smith Properties, Lennar B, MGM Resorts International, Packaging Corporation of America, Norwegian Cruise Line Holdings, Quintiles IMS Holdings, Raymond James Financial, Regency Centers, ResMed, SBA Communications, Seattle SpinCo, Smith A.O., Synopsys and Varex Imaging.
The source of the data included in the above Portfolio Management Discussion and Analysis with respect to the Goldman Sachs Equity Index Fund is FactSet as of 12/31/17.
Characteristics presented are calculated using the month end market value of holdings, except for beta and standard deviation, if shown, which use month end return values. Averages reflect the market weight of securities in the portfolio. Market data, prices, and dividend estimates for characteristics calculations provided by FactSet Research Systems, Inc. All other portfolio data provided by SSgA. Characteristics are as of the date indicated, are subject to change, and should not be relied upon as current thereafter.
Past performance is not a guarantee of future results.
Index returns are unmanaged and do not reflect the deduction of any fees or expenses. Index returns reflect all items of income, gain and loss and the reinvestment of dividends and other income.
SSgA may have or may seek investment management or other business relationships with companies discussed in this material or affiliates of those companies, such as their officers, directors and pension plans.
The views expressed in this material are the views of SSgA’s Global Equity Beta Solutions Team through the period ended December 31, 2017 and are subject to change based on market and other conditions. All information has been obtained from sources believed to be reliable, but its accuracy is not guaranteed. There is no representation or warranty as to the current accuracy, reliability or completeness of, nor liability for, decisions based on such information and it should not be relied on as such. This document contains certain statements that may be deemed forward-looking statements. Please note that any such statements are not guarantees of any future performance and actual results or developments may differ materially from those projected.
10
FUND BASICS
Equity Index Fund
as of December 31, 2017
STANDARDIZED TOTAL RETURNS1
| | | | | | | | | | | | | | | | | | |
| For the period ended 12/31/17 | | One Year | | | Five Years | | | Ten Years | | | Since Inception | | | Inception Date |
| Service | | | 21.29 | % | | | 15.28 | % | | | 8.10 | % | | | 8.21 | % | | 1/09/06 |
| 1 | The Standardized Total Returns are average annual total returns as of the most recent calendar quarter-end. They assume reinvestment of all distributions at net asset value (“NAV”). Because Service Shares do not involve a sales charge, such a charge is not applied to their Standardized Total Returns. |
Total return figures in the above chart represent past performance and do not indicate future results, which will vary. The investment return and principal value of an investment will fluctuate and, therefore, an investor’s shares, when redeemed, may be worth more or less than their original cost. Current performance may be lower or higher than the total return figures in the above chart. Please visit www.GSAMFUNDS.com to obtain the most recent month-end returns. Performance reflects fee waivers and/or expense limitations in effect during the periods shown. In their absence, performance would be reduced.
EXPENSE RATIOS2
| | | | | | | | |
| | | Net Expense Ratio (Current) | | | Gross Expense Ratio (Before Waivers) | |
| Service | | | 0.48 | % | | | 0.73 | % |
| 2 | The expense ratios of the Fund, both current (net of any fee waivers and/or expense limitations) and before waivers (gross of any fee waivers and/or expense limitations) are as set forth above according to the most recent publicly available Prospectus for the Fund and may differ from the expense ratios disclosed in the Financial Highlights in this report. Pursuant to a contractual arrangement, the Fund’s fee waivers and/or expense limitations will remain in place through at least April 28, 2018, and prior to such date, the Investment Adviser may not terminate the arrangements without the approval of the Fund’s Board of Trustees. If these arrangements are discontinued in the future, the expense ratios may change without shareholder approval. |
TOP TEN HOLDINGS AS OF 12/31/173
| | | | | | |
| Holding | | % of Net Assets | | | Line of Business |
| Apple, Inc. | | | 3.8 | % | | Technology Hardware & Equipment |
| Microsoft Corp. | | | 2.9 | | | Software & Services |
| Amazon.com, Inc. | | | 2.0 | | | Retailing |
| Facebook, Inc. Class A | | | 1.8 | | | Software & Services |
| Berkshire Hathaway, Inc. Class B | | | 1.7 | | | Diversified Financials |
| Johnson & Johnson | | | 1.6 | | | Pharmaceuticals, Biotechnology & Life Sciences |
| JPMorgan Chase & Co. | | | 1.6 | | | Banks |
| Exxon Mobil Corp. | | | 1.5 | | | Energy |
| Alphabet, Inc. Class C | | | 1.4 | | | Software & Services |
| Alphabet, Inc. Class A | | | 1.4 | | | Software & Services |
| 3 | The top 10 holdings may not be representative of the Fund’s future investments. |
11
FUND BASICS
FUND VS. BENCHMARK SECTOR ALLOCATIONS4
As of December 31, 2017
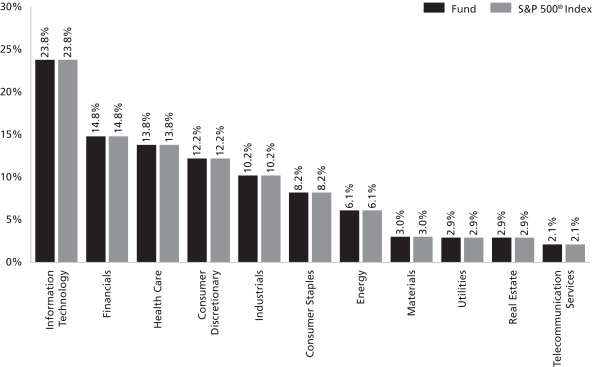
| 4 | The graph categorizes investments using Global Industry Classification Standard (“GICS”); however, the sector classifications used by the portfolio management team may differ from GICS. The percentage shown for each investment category reflects the value of investments in that category as a percentage of total market value (excluding investments in the securities lending reinvestment vehicle, if any). Underlying sector allocations of exchange traded funds and investment companies held by the Fund are not reflected in the graph above. Investments in the securities lending reinvestment vehicle represented 0.1% of the Fund’s net assets at December 31, 2017. The graph depicts the Fund’s investments but may not represent the Fund’s market exposure due to the exclusion of certain derivatives, if any, as listed in the Additional Investment Information section of the Schedule of Investments. |
12
GOLDMAN SACHS VARIABLE INSURANCE TRUST EQUITY INDEX FUND
Performance Summary
December 31, 2017
The following graph shows the value, as of December 31, 2017, of a $10,000 investment made in the Fund on January 1, 2008. For comparative purposes, the performance of the Fund’s benchmark, the S&P 500 Index (with distributions reinvested), is shown. This performance data represents past performance and should not be considered indicative of future performance, which will fluctuate with changes in market conditions. These performance fluctuations may cause an investor’s shares, when redeemed, to be worth more or less than their original cost. Performance reflects Fund level expenses, but does not reflect fees and expenses associated with any variable annuity contract or variable life insurance policy that uses the Fund as an investment option for any contract or policy. Had performance reflected all of those fees and expenses, performance would have been reduced. Performance reflects applicable fee waivers and/or expense limitations in effect during the periods shown, and in their absence, performance would be reduced. In addition to the Investment Adviser’s decisions regarding issuer/industry investment selection and allocation, other factors may affect Fund performance. These factors include, but are not limited to, Fund operating fees and expenses, portfolio turnover, and subscription and redemption cash flows affecting the Fund.
Equity Index Fund’s 10 Year Performance
Performance of a $10,000 investment, with distributions reinvested, from January 1, 2008 through December 31, 2017.
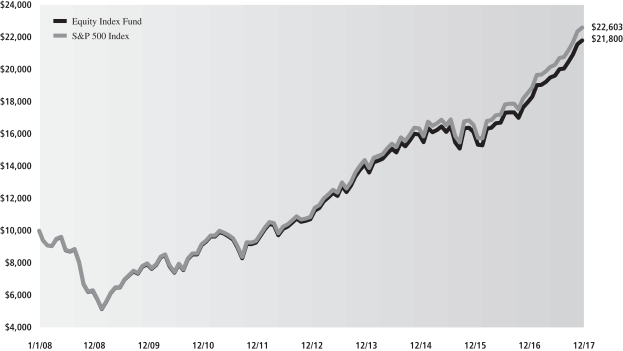
| | | | | | | | |
| Average Annual Total Return through December 31, 2017 | | One Year | | Five Years | | Ten Years | | Since Inception |
Equity Index Fund (Commenced January 9, 2006) | | 21.29% | | 15.28% | | 8.10% | | 8.21% |
13
GOLDMAN SACHS VARIABLE INSURANCE TRUST GROWTH OPPORTUNITIES FUND
INVESTMENT OBJECTIVE
The Fund seeks long-term growth of capital.
Portfolio Management Discussion and Analysis
Below, the Goldman Sachs Growth Investment Team discusses the Goldman Sachs Variable Insurance Trust — Goldman Sachs Growth Opportunities Fund’s (the “Fund”) performance and positioning for the 12-month period ended December 31, 2017 (the “Reporting Period”).
How did the Fund perform during the Reporting Period?
During the Reporting Period, the Fund’s Institutional and Service Shares generated average annual total returns of 27.14% and 26.92%, respectively. These returns compare to the 25.27% average annual total return of the Fund’s benchmark, the Russell Midcap® Growth Index (with dividends reinvested) (the “Russell Index”), during the same time period.
What key factors were responsible for the Fund’s performance during the Reporting Period?
The Fund outperformed the Russell Index during the Reporting Period primarily due to stock selection.
Which equity market sectors helped and hurt Fund performance?
Our bottom-up approach focuses on security selection, and as a result, we do not make active sector-level investment decisions. That said, on a sector level, stock selection in the consumer staples, health care and industrials sectors contributed positively to the Fund’s relative returns. Stock selection in one sector — financials — detracted from relative performance.
Which individual stocks added to the Fund’s relative performance during the Reporting Period?
The Fund benefited most relative to the Russell Index from its investments in Panera Bread, Roper Technologies and C.R. Bard.
Panera Bread was the top positive contributor to the Fund’s relative returns during the Reporting Period. Shares of the fast-casual restaurant chain advanced on news of strong fourth quarter 2016 results, with its earnings ahead of market estimates as driven by better than market expected operating margins. The company also announced record new store sales volume and provided better than market expected 2017 guidance. In the spring of 2017, its shares surged higher after the restaurant chain agreed to a buyout by JAB Holding Company. The premium offered was, in our view, positive recognition of Panera Bread’s earlier investments to improve efficiencies and grow margins. After the stock’s strong performance and a potential shift in leadership, we decided to exit the Fund’s position and look for opportunities elsewhere.
Roper Technologies, a provider of engineered products to global niche markets, was another of the Fund’s top contributors. Its stock price was pushed higher by strong quarterly results that beat market estimates on earnings per share. We think Roper Technologies’ margins and its cash return on invested capital (“CROI”) could continue to expand as it transitions from an industrial company to one that is more software aligned. (CROI is a method of valuation that compares a company’s cash return to its equity.) At the end of the Reporting Period, the Fund continued to hold the stock, as we are optimistic about what we consider to be the company’s innovative measures, disciplined capital deployment and solid management execution ability.
Notable contributor C.R. Bard, a multinational developer, manufacturer and marketer of medical devices, announced it had accepted a buyout offer from Becton Dickinson, causing its stock price to rise. We have long viewed C.R. Bard as a strong business franchise with favorable long-term prospects and a high quality management team. We decided to exit the Fund’s position in the stock as we sought to capture profits.
Which individual stocks detracted from the Fund’s performance during the Reporting Period?
During the Reporting Period, Advance Auto Parts, Middleby and Ross Stores were top detractors from the Fund’s relative performance.
The Fund’s leading detractor was Advance Auto Parts, which was weak throughout the Reporting Period on a combination of concerns around increased competition in the auto parts industry and weaker than market expected earnings. The auto parts retailer also announced first fiscal quarter 2017 earnings that were lower than market estimates, causing its stock to fall further. While we still believed the company was attractively valued and expected to see continued comparable store sales growth, we decided to eliminate the Fund’s position as we felt the risk/reward opportunity was less compelling given the competitive headwinds.
14
GOLDMAN SACHS VARIABLE INSURANCE TRUST GROWTH OPPORTUNITIES FUND
Another key detractor during the Reporting Period was Middleby, which designs, manufactures and distributes kitchen equipment around the world. Its shares declined during the first half of the Reporting Period, as the company reported mixed first quarter 2017 results, delivering impressive margin expansion but failing to grow revenues at the pace investors had expected. Its management explained the weakness as delayed capital expenditure spending by U.S.-based restaurants. In our opinion, the weakness was a short-term challenge. We also believed Middleby has what we consider a best-in-class product line that positions it well going forward. In our view, its stock’s decline provided a strong risk/reward opportunity for us to increase the Fund’s investment in the name at attractive valuations. In fact, during November and December 2017, the company’s share price rose sharply. At the end of the Reporting Period, we continued to believe Middleby’s market share gains, partnerships with strong franchises and innovative products positioned it as an industry leader.
Ross Stores also detracted from the Fund’s relative returns, with most of the decline occurring in the first half of the Reporting Period. In May 2017, the off-price retailer announced strong earnings, beating market expectations for comparable store sales and earnings per share. Despite the strong earnings, fears that Amazon.com and other e-commerce companies might displace physical stores and increase competition was a headwind for its stock price, causing it to drop in June 2017. In our view, Ross Stores is well positioned within its industry, and we believe it is relatively insulated from Amazon.com pressures because it is an off-price retailer. We also think it was attractively valued for a high quality company, a view that seemed to be confirmed by the market in the second half of the Reporting Period when the stock performed strongly. At the end of the Reporting Period, we remained encouraged by Ross Stores’ consistent sales and earnings growth over time, strong free cash flows and demonstrated track record of returning capital to investors.
Did the Fund make any significant purchases or sales during the Reporting Period?
Among the positions initiated by the Fund during the Reporting Period was an investment in Dunkin’ Brands Group. We were encouraged by the new president of the U.S. business. The company vision includes cutting the number of products held in stores while boosting advertising spending. In our view, these changes will contribute to an improved customer experience and increased revenues as management cuts unnecessary expenses. Overall, we believe Dunkin’ Brands Group presents a strong growth story at an attractive valuation.
We also added a Fund position in Lam Research, a supplier of wafer fabrication equipment and services to the semiconductor industry. In addition, the company designs systems that are used in the fabrication of integrated circuits. We think Lam Research is well-positioned to continue benefiting from industry-wide inflections, which are driving increased capital intensity and market share growth potential. (Capital intensity is the amount of fixed or real capital present in relation to other factors of production, especially labor.) In our opinion, the company was attractively valued relative to its peers at the time of purchase and has a history of substantial capital return to shareholders.
During the Reporting Period, the Fund’s most notable sales were Panera Bread and C.R. Bard, which have both been previously mentioned.
Were there any notable changes in the Fund’s weightings during the Reporting Period?
Changes to the Fund’s sector weightings relative to the Russell Index are due to our stock selection. As a result of these decisions during the Reporting Period, the Fund moved from an underweight position in the health care sector to an overweight position. It shifted from an overweight position in telecommunication services to a neutral position.
How did the Fund use derivatives and similar instruments during the Reporting Period?
The Fund did not use derivatives or similar instruments within its investment process during the Reporting Period.
Were there any changes to the Fund’s portfolio management team during the Reporting Period?
There were no changes to the Fund’s portfolio management team during the Reporting Period.
How was the Fund positioned relative to the Russell Index at the end of the Reporting Period?
As mentioned, the Fund’s sector positioning relative to the Russell Index is the result of our stock selection, as we take a pure bottom-up, research-intensive approach to investing. From that perspective, then, at the end of the Reporting Period, the Fund’s portfolio was broadly diversified with overweight positions compared to the Russell Index in the health care and financials sectors. The Fund had smaller weightings than the Russell Index in the consumer discretionary and information technology sectors at the end of the Reporting Period. It was relatively neutral compared to the Russell Index at the end of the Reporting Period in the industrials, materials, energy, utilities, consumer staples, telecommunication services and real estate sectors.
15
FUND BASICS
Growth Opportunities Fund
as of December 31, 2017
STANDARDIZED TOTAL RETURNS1
| | | | | | | | | | | | | | | | | | |
| For the period ended 12/31/17 | | One Year | | | Five Years | | | Ten Years | | | Since Inception | | | Inception Date |
| Institutional | | | 27.14 | % | | | N/A | | | | N/A | | | | 11.07 | % | | 4/30/13 |
| Service | | | 26.92 | | | | 12.37 | % | | | 8.69 | % | | | 9.02 | | | 1/09/06 |
| 1 | The Standardized Total Returns are average annual total returns as of the most recent calendar quarter-end. They assume reinvestment of all distributions at net asset value (“NAV”). Because Institutional and Service Shares do not involve a sales charge, such a charge is not applied to their Standardized Total Returns. |
Total return figures in the above chart represent past performance and do not indicate future results, which will vary. The investment return and principal value of an investment will fluctuate and, therefore, an investor’s shares, when redeemed, may be worth more or less than their original cost. Current performance may be lower or higher than the total return figures in the above chart. Please visit www.GSAMFUNDS.com to obtain the most recent month-end returns. Performance reflects fee waivers and/or expense limitations in effect during the periods shown. In their absence, performance would be reduced.
EXPENSE RATIOS2
| | | | | | | | |
| | | Net Expense Ratio (Current) | | | Gross Expense Ratio (Before Waivers) | |
| Institutional | | | 0.85 | % | | | 1.16 | % |
| Service | | | 1.01 | | | | 1.40 | |
| 2 | The expense ratios of the Fund, both current (net of any fee waivers and/or expense limitations) and before waivers (gross of any fee waivers and/or expense limitations) are as set forth above according to the most recent publicly available Prospectus for the Fund and may differ from the expense ratios disclosed in the Financial Highlights in this report. Pursuant to a contractual arrangement, the Fund’s fee waivers and/or expense limitations will remain in place through at least April 28, 2018, and prior to such date, the Investment Adviser may not terminate the arrangements without the approval of the Fund’s Board of Trustees. If these arrangements are discontinued in the future, the expense ratios may change without shareholder approval. |
TOP TEN HOLDINGS AS OF 12/31/173
| | | | | | |
| Holding | | % of Net Assets | | | Line of Business |
| Amphenol Corp. Class A | | | 2.9 | % | | Technology Hardware & Equipment |
| Roper Technologies, Inc. | | | 2.9 | | | Capital Goods |
| Middleby Corp. (The) | | | 2.5 | | | Capital Goods |
| Zoetis, Inc. | | | 2.3 | | | Pharmaceuticals, Biotechnology & Life Sciences |
| Northern Trust Corp. | | | 2.2 | | | Diversified Financials |
| Illumina, Inc. | | | 2.2 | | | Pharmaceuticals, Biotechnology & Life Sciences |
| Dunkin’ Brands Group, Inc. | | | 2.2 | | | Consumer Services |
| Global Payments, Inc. | | | 2.0 | | | Software & Services |
| Agilent Technologies, Inc. | | | 2.0 | | | Pharmaceuticals, Biotechnology & Life Sciences |
| Avery Dennison Corp. | | | 2.0 | | | Materials |
| 3 | The top 10 holdings may not be representative of the Fund’s future investments. |
16
FUND BASICS
FUND vs. BENCHMARK SECTOR ALLOCATIONS4
As of December 31, 2017

| 4 | The Fund is actively managed and, as such, its composition may differ over time. Consequently, the Fund’s overall sector allocations may differ from percentages contained in the graph above. The graph categorizes investments using Global Industry Classification Standard (“GICS”); however, the sector classifications used by the portfolio management team may differ from GICS. The percentage shown for each investment category reflects the value of investments in that category as a percentage of market value. Underlying sector allocations of exchange traded funds and investment companies held by the Fund are not reflected in the graph above. Investments in the securities lending reinvestment vehicle represented 0.6% of the Fund’s net assets at December 31, 2017. The graph depicts the Fund’s investments but may not represent the Fund’s market exposure due to the exclusion of certain derivatives, if any, as listed in the Additional Investment Information section of the Schedule of Investments. |
17
GOLDMAN SACHS VARIABLE INSURANCE TRUST GROWTH OPPORTUNITIES FUND
Performance Summary
December 31, 2017
The following graph shows the value, as of December 31, 2017, of a $10,000 investment made on January 1, 2008 in Service Shares. For comparative purposes, the performance of the Fund’s benchmark, the Russell Midcap Growth Index (with distributions reinvested), is shown. This performance data represents past performance and should not be considered indicative of future performance which will fluctuate with changes in market conditions. These performance fluctuations may cause an investor’s shares, when redeemed, to be worth more or less than their original cost. Performance reflects Fund level expenses, but does not reflect fees and expenses associated with any variable annuity contract or variable life insurance policy that uses the Fund as an investment option for any contract or policy. Had performance reflected all of those fees and expenses, performance would have been reduced. Performance reflects applicable fee waivers and/or expense limitations in effect during the periods shown, and in their absence, performance would be reduced. Performance of Institutional Shares will vary from Service Shares due to differences in class specific fees. In addition to the Investment Adviser’s decisions regarding issuer/industry investment selection and allocation, other factors may affect Fund performance. These factors include, but are not limited to, Fund operating fees and expenses, portfolio turnover, and subscription and redemption cash flows affecting the Fund.
Growth Opportunities Fund’s 10 Year Performance
Performance of a $10,000 investment, with distributions reinvested, from January 1, 2008 through December 31, 2017.
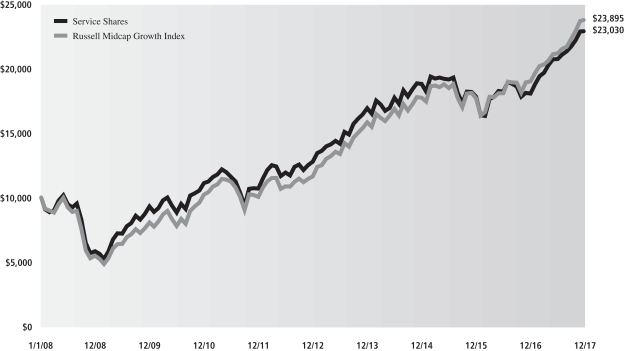
| | | | | | | | |
| Average Annual Total Return through December 31, 2017 | | One Year | | Five Years | | Ten Years | | Since Inception |
Institutional (Commenced April 30, 2013) | | 27.14% | | N/A | | N/A | | 11.07% |
Service (Commenced January 9, 2006) | | 26.92% | | 12.37% | | 8.69% | | 9.02% |
18
GOLDMAN SACHS VARIABLE INSURANCE TRUST HIGH QUALITY FLOATING RATE FUND
INVESTMENT OBJECTIVE
The Fund seeks to provide a high level of current income, consistent with low volatility of principal.
Portfolio Management Discussion and Analysis
Below, the Goldman Sachs Fixed Income Portfolio Management Team discusses the Goldman Sachs High Quality Floating Rate Fund’s (the “Fund”) performance and positioning for the 12-month period ended December 31, 2017 (the “Reporting Period”).
How did the Fund perform during the Reporting Period?
During the Reporting Period, the Fund’s Institutional, Service and Advisor Shares generated average annual total returns of 1.62%, 1.47% and 1.26%, respectively. These returns compare to the 0.86% average annual total return of the Fund’s benchmark, the ICE BofAML® Three-Month U.S. Treasury Bill Index (the “BofA Index”), during the Reporting Period.
We note that the Fund’s benchmark being the BofA Index is a means of emphasizing that the Fund has an unconstrained strategy. That said, this Fund employs a benchmark agnostic strategy and thus comparisons to a benchmark index are not particularly relevant.
What key factors had the greatest impact on the Fund’s performance during the Reporting Period?
During the Reporting Period, our top-down cross-sector strategy contributed most positively to the Fund’s performance. In our cross-sector strategy, we invest Fund assets based on a discipline of valuing each fixed income sector in the context of all investment opportunities within the Fund’s universe. Our individual issue selection also added to relative returns.
Conversely, the Fund’s combined tactical duration and yield curve positioning detracted from results. Duration is a measure of the Fund’s sensitivity to changes in interest rates. Yield curve indicates a spectrum of maturities.
Which fixed income market sectors helped or hurt Fund performance during the Reporting Period?
Our cross-sector strategy added most to the Fund’s relative returns during the Reporting Period. The Fund benefited from its overweight versus the BofA Index in agency mortgage-backed securities and asset backed securities (“ABS”). Although agency mortgage-backed securities faced some headwinds in early 2017, as U.S. Treasury yields fell, they were supported toward the end of the calendar year by strong carry and low volatility levels. Agency mortgage-backed securities outperformed duration-neutral U.S. Treasuries by 16 basis points in December 2017, 24 basis points in the fourth calendar quarter and 52 basis points during the Reporting Period overall. (A basis point is 1/100th of a percentage point.) Also adding to the Fund’s performance during the Reporting Period was its allocation to collateralized loan obligations. Conversely, the Fund’s lack of exposure to U.S. Treasuries detracted slightly from results.
In addition, individual issue selection contributed positively to relative returns during the Reporting Period. Within the government/swaps sector, our selection of short maturity U.S. Treasuries bolstered performance. Within the securitized sector, our selection of ABS proved positive for results. These gains were offset slightly by the Fund’s selection of agency adjustable-rate mortgage-backed securities, which detracted.
Did the Fund’s duration and yield curve positioning strategy help or hurt its results during the Reporting Period?
The Fund’s combined tactical duration and yield curve positioning detracted from performance during the Reporting Period. Compared to the BofA Index, the Fund held a short duration position, which we tactically increased and decreased throughout the Reporting Period, as the U.S. Treasury yield curve flattened. Yields on the front, or short-term, end of the yield curve rose on market expectations of Federal Reserve (“Fed”) interest rate hikes. Long-term yields were subdued on strong demand from pension funds, increased issuance of intermediate-term U.S. Treasury securities and muted inflationary pressures. In our view, the market was underestimating the potential pace of Fed interest rate increases during the Reporting Period and in 2018. In addition, U.S. financial conditions had not materially tightened amidst Fed rate hikes.
Were there any notable changes in the Fund’s weightings during the Reporting Period?
During the Reporting Period, we increased the Fund’s exposure to ABS and collateralized mortgage obligations as well as its cash position. We reduced its exposure to U.S. Treasuries. In addition, we decreased the Fund’s exposure to the three- to 10-year segments of the U.S. Treasury yield curve and increased its exposure to the seven-year segment.
19
GOLDMAN SACHS VARIABLE INSURANCE TRUST HIGH QUALITY FLOATING RATE FUND
How did the Fund use derivatives and similar instruments during the Reporting Period?
As market conditions warranted, the Fund used Treasury futures to manage the duration and term structure of the Fund. (Term structure, most often depicted as a yield curve, refers to the term structure of interest rates, which is the relationship between the yield to maturity and the time to maturity for pure discount bonds.) In addition, the Fund employed interest rate swaps to manage interest rate risk and to express our views on the direction of interest rates. The use of derivatives overall had a negative impact on the Fund performance during the Reporting Period.
Were there any changes to the Fund’s portfolio management team during the Reporting Period?
There were no changes to the Fund’s portfolio management team during the Reporting Period.
How was the Fund positioned relative to the BofA Index at the end of the Reporting Period?
At the end of the Reporting Period, the Fund had little exposure to U.S. government securities, which represent 100% of the BofA Index. The Fund had positions in ABS, agency collateralized mortgage obligations, residential mortgage-backed securities, agency adjustable-rate mortgage-backed securities and mortgage pass-through securities, none of which are represented in the BofA Index. (Pass-through mortgages consist of a pool of residential mortgage loans, where homeowners’ monthly payments of principal, interest and prepayments pass from the original bank through a government agency or investment bank to investors.)
20
FUND BASICS
High Quality Floating Rate Fund
as of December 31, 2017
STANDARDIZED TOTAL RETURNS1
| | | | | | | | | | | | | | | | | | |
| For the period ended 12/31/17 | | One Year | | | Five Years | | | Ten Years | | | Since Inception | | | Inception Date |
| Institutional | | | 1.62 | % | | | N/A | | | | N/A | | | | 0.74 | % | | 4/30/13 |
| Service | | | 1.47 | | | | 0.47 | % | | | 2.60 | % | | | 3.09 | | | 1/09/06 |
| Advisor | | | 1.26 | | | | N/A | | | | N/A | | | | 0.48 | | | 10/15/14 |
| 1 | The Standardized Total Returns are average annual total returns as of the most recent calendar quarter-end. They assume reinvestment of all distributions at net asset value (“NAV”). Because Institutional and Service Shares do not involve a sales charge, such a charge is not applied to their Standardized Total Returns. |
Total return figures in the above chart represent past performance and do not indicate future results, which will vary. The investment return and principal value of an investment will fluctuate and, therefore, an investor’s shares, when redeemed, may be worth more or less than their original cost. Current performance may be lower or higher than the total return figures in the above chart. Please visit www.GSAMFUNDS.com to obtain the most recent month-end returns. Performance reflects fee waivers and/or expense limitations in effect during the periods shown. In their absence, performance would be reduced.
EXPENSE RATIOS2
| | | | | | | | |
| | | Net Expense Ratio (Current) | | | Gross Expense Ratio (Before Waivers) | |
| Institutional | | | 0.36 | % | | | 0.79 | % |
| Service | | | 0.61 | | | | 1.05 | |
| Advisor | | | 0.76 | | | | 1.19 | |
| 2 | The expense ratios of the Fund, both current (net of any fee waivers and/or expense limitations) and before waivers (gross of any fee waivers and/or expense limitations) are as set forth above according to the most recent publicly available Prospectus for the Fund and may differ from the expense ratios disclosed in the Financial Highlights in this report. Pursuant to a contractual arrangement, the Fund’s fee waivers and/or expense limitations will remain in place through at least April 28, 2018, and prior to such date, the Investment Adviser may not terminate the arrangements without the approval of the Fund’s Board of Trustees. If these arrangements are discontinued in the future, the expense ratios may change without shareholder approval. |
21
FUND BASICS
FUND COMPOSITION3
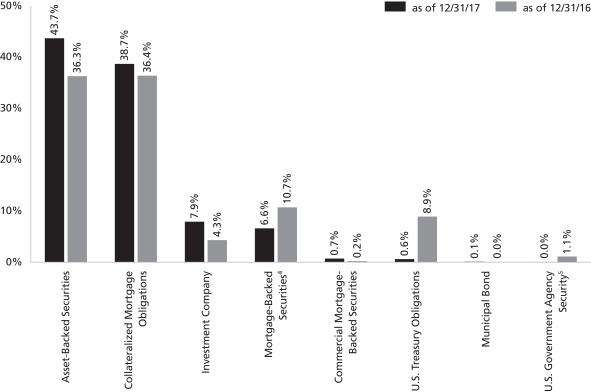
| 3 | The percentage shown for each investment category reflects the value of investments in that category as a percentage of net assets. Figures in the above graph may not sum to 100% due to the exclusion of other assets and liabilities. Underlying sector allocations of investment companies held by the Fund are not reflected in the graph above. The graph depicts the Fund’s investments but may not represent the Fund’s market exposure due to the exclusion of certain derivatives, if any, as listed in the Additional Investment Information section of the Schedule of Investments. |
| 4 | Mortgage-backed securities guaranteed by the Government National Mortgage Association (“GNMA”), the Federal National Mortgage Association (“FNMA”) or the Federal Home Loan Mortgage Corp. (“FHLMC”). GNMA instruments are backed by the full faith and credit of the United States Government. |
| 5 | “U.S. Government Agency Security” includes agency securities offered by companies such as FNMA and the Federal Home Loan Bank (“FHLB”), which operate under a government charter. While they are required to report to a government regulator, their assets are not explicitly guaranteed by the government and they otherwise operate like any other publicly traded company. |
22
GOLDMAN SACHS VARIABLE INSURANCE TRUST HIGH QUALITY FLOATING RATE FUND
Performance Summary
December 31, 2017
The following graph shows the value, as of December 31, 2017, of a $10,000 investment made on January 1, 2008 in Service Shares. For comparative purposes, the performance of the Fund’s benchmark, the ICE BofAML® Three-Month U.S. Treasury Bill Index, is shown. This performance data represents past performance and should not be considered indicative of future performance, which will fluctuate with changes in market conditions. These performance fluctuations may cause an investor’s shares, when redeemed, to be worth more or less than their original cost. Performance reflects Fund level expenses, but does not reflect fees and expenses associated with any variable annuity contract or variable life insurance policy that uses the Fund as an investment option for any contract or policy. Had performance reflected all of those fees and expenses, performance would have been reduced. Performance reflects applicable fee waivers and/or expense limitations in effect during the periods shown, and in their absence, performance would be reduced. Performance of Institutional and Advisor Shares will vary from Service Shares due to differences in class specific fees. In addition to the Investment Adviser’s decisions regarding issuer/industry investment selection and allocation, other factors may affect Fund performance. These factors include, but are not limited to, Fund operating fees and expenses, portfolio turnover, and subscription and redemption cash flows affecting the Fund.
High Quality Floating Rate Fund’s 10 Year Performance
Performance of a $10,000 investment, with distributions reinvested, from January 1, 2008 through December 31, 2017.
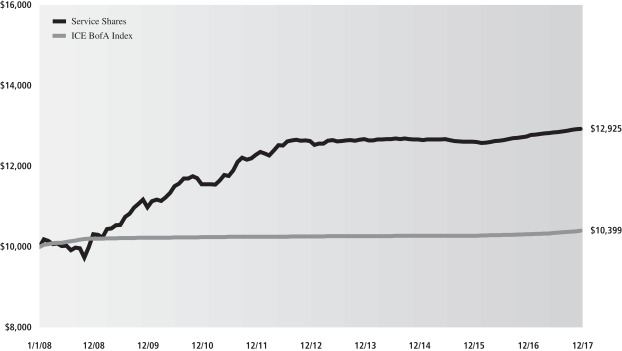
| | | | | | | | |
| Average Annual Total Return through December 31, 2017 | | One Year | | Five Years | | Ten Years | | Since Inception |
Institutional (Commenced April 30, 2013) | | 1.62% | | N/A | | N/A | | 0.74% |
Service (Commenced January 9, 2006) | | 1.47% | | 0.47% | | 2.60% | | 3.09% |
Advisor (Commenced October 15, 2014) | | 1.26% | | N/A | | N/A | | 0.48% |
23
GOLDMAN SACHS VARIABLE INSURANCE TRUST FUNDS
Index Definitions
Bloomberg Barclays U.S. Aggregate Bond Index is a broad based index that follows the U.S. dollar denominated investment grade fixed rate taxable bond market. It includes U.S. Treasuries, agency and corporate securities, mortgage-backed securities, asset-backed securities and commercial mortgage-backed securities.
S&P 500® Index is a U.S. stock market index based on the market capitalizations of 500 large companies having common stock listed on the New York Stock Exchange or NASDAQ. The S&P 500® Index components and their weightings are determined by S&P Dow Jones Indices.
Russell Midcap® Index measures the performance of the mid-cap segment of the U.S. equity universe. The Russell Midcap® Index is a subset of the Russell 1000® Index. The Russell Midcap® Index includes approximately 800 of the smallest securities based on a combination of their market cap and current index membership. The Russell Midcap® Index represents approximately 31% of the total market capitalization of the Russell 1000® Index companies. The Russell Midcap® Index is constructed to provide a comprehensive and unbiased barometer for the mid-cap segment. The Russell Midcap® Index is completely reconstituted annually to ensure larger stocks do not distort the performance and characteristics of the true mid-cap opportunity set.
Russell Midcap® Growth Index is an unmanaged index that measures the performance of those companies in the Russell Midcap® Index with higher price-to-book ratios and higher forecasted growth values. Its figures do not reflect any deduction for fees, expenses or taxes.
Russell 1000® Index measures the performance of the large-cap segment of the U.S. equity universe. The Russell 1000® Index is a subset of the Russell 3000® Index and includes approximately 1000 of the largest securities based on a combination of their market cap and current index membership. The Russell 1000® Index represents approximately 92% of the U.S. market. The Russell 1000® Index is constructed to provide a comprehensive and unbiased barometer for the large-cap segment and is completely reconstituted annually to ensure new and growing equities are reflected.
Russell 2000® Index measures the performance of the small-cap segment of the U.S. equity universe. The Russell 2000® Index is a subset of the Russell 3000® Index representing approximately 10% of the total market capitalization of that index. The Russell 2000® Index includes approximately 2000 of the smallest securities based on a combination of their market cap and current index membership. The Russell 2000® Index is constructed to provide a comprehensive and unbiased small-cap barometer and is completely reconstituted annually to ensure larger stocks do not distort the performance and characteristics of the true small-cap opportunity set.
ICE BofAML® Three-Month U.S. Treasury Bill Index is an unmanaged market index of U.S. Treasury securities maturing in 90 days that assumes reinvestment of all income. It is composed of a single issue purchased at the beginning of the month and held for a full month. At the end of the month that issue is sold and rolled into a newly selected issue. The issue selected at each month-end rebalancing is the outstanding U.S. Treasury Bill that matures closest to, but not beyond, three months from the rebalancing date. To qualify for selection, an issue must have settled on or before the month-end rebalancing date. While the index will often hold the U.S. Treasury Bill issued at the most recent three-month auction, it is also possible for a seasoned six-month U.S. Treasury Bill to be selected.
It is not possible to invest directly in an unmanaged index.
24
GOLDMAN SACHS VARIABLE INSURANCE TRUST CORE FIXED INCOME FUND
Schedule of Investments
December 31, 2017
| | | | | | | | | | | | |
Principal
Amount | | | Interest
Rate | | Maturity
Date | | | Value | |
| | Corporate Bonds – 38.4% | |
| | Automobiles & Components – 0.5% | |
| | Ford Motor Credit Co. LLC | |
| $ | 475,000 | | | 5.875% | | | 08/02/2021 | | | $ | 521,600 | |
| | |
| | Banks – 10.9% | |
| | American Express Co.(a) | |
| | 75,000 | | | 3.625 | | | 12/05/2024 | | | | 77,171 | |
| | Banco Santander SA | |
| | 200,000 | | | 3.125 | | | 02/23/2023 | | | | 198,982 | |
| | Bank of America Corp. | |
| | 325,000 | | | (3 Mo. LIBOR + 0.66%),
2.369(a)(b) | | | 07/21/2021 | | | | 324,431 | |
| | 225,000 | | | 4.125 | | | 01/22/2024 | | | | 239,300 | |
| | 149,000 | | | 4.000 | | | 04/01/2024 | | | | 157,512 | |
| | 125,000 | | | 3.248(a) | | | 10/21/2027 | | | | 124,040 | |
| | 225,000 | | | (3 Mo. LIBOR + 1.58%),
3.824(a)(b) | | | 01/20/2028 | | | | 232,733 | |
| | 245,000 | | | (3 Mo. LIBOR + 1.04%),
3.419(a)(b)(c) | | | 12/20/2028 | | | | 245,052 | |
| | Bank of Montreal(a)(b) | |
| | 125,000 | | | (5 Yr. Swap Rate + 1.43%),
3.803 | | | 12/15/2032 | | | | 123,579 | |
| | Bank of New York Mellon Corp. (The)(a) | |
| | 75,000 | | | 3.300 | | | 08/23/2029 | | | | 74,763 | |
| | Bank of Tokyo-Mitsubishi UFJ Ltd. (The)(c) | |
| | 300,000 | | | 2.150 | | | 09/14/2018 | | | | 300,302 | |
| | Citigroup, Inc. | |
| | 200,000 | | | 3.400 | | | 05/01/2026 | | | | 201,195 | |
| | 75,000 | | | 4.125 | | | 07/25/2028 | | | | 77,299 | |
| | Compass Bank(a) | |
| | 375,000 | | | 2.750 | | | 09/29/2019 | | | | 376,037 | |
| | Credit Agricole SA(c) | |
| | 250,000 | | | 3.250 | | | 10/04/2024 | | | | 248,318 | |
| | Credit Suisse AG | |
| | 325,000 | | | 2.300 | | | 05/28/2019 | | | | 325,315 | |
| | Credit Suisse Group Funding Guernsey Ltd. | |
| | 400,000 | | | 3.125 | | | 12/10/2020 | | | | 404,811 | |
| | Deutsche Bank AG | |
| | 50,000 | | | 2.500 | | | 02/13/2019 | | | | 49,980 | |
| | 275,000 | | | 2.700 | | | 07/13/2020 | | | | 273,839 | |
| | Discover Financial Services(a) | |
| | 225,000 | | | 3.750 | | | 03/04/2025 | | | | 226,485 | |
| | HSBC Holdings plc | |
| | 225,000 | | | 3.400 | | | 03/08/2021 | | | | 229,972 | |
| | 225,000 | | | (3 Mo. LIBOR + 1.06%),
3.262(a)(b) | | | 03/13/2023 | | | | 228,132 | |
| | ING Bank NV(a)(b) | |
| | 325,000 | | | (5 Yr. Swap Rate + 2.70%),
4.125 | | | 11/21/2023 | | | | 328,225 | |
| | Intesa Sanpaolo SpA | |
| | 350,000 | | | 3.875 | | | 01/16/2018 | | | | 350,234 | |
| | JPMorgan Chase & Co. | |
| | 450,000 | | | 4.400 | | | 07/22/2020 | | | | 472,741 | |
| | 275,000 | | | 2.700(a) | | | 05/18/2023 | | | | 273,197 | |
| | 40,000 | | | 3.625(a) | | | 12/01/2027 | | | | 40,431 | |
| | |
| | Corporate Bonds – (continued) | |
| | Banks – (continued) | |
| $ | 225,000 | | | (3 Mo. LIBOR + 1.34%),
3.782%(a)(b) | | | 02/01/2028 | | | $ | 233,156 | |
| | JPMorgan Chase & Co. Series Z(a)(b) | |
| | 250,000 | | | (3 Mo. LIBOR + 3.80%),
5.300 | | | 12/31/2049 | | | | 259,275 | |
| | KBC Bank NV(a)(b) | |
| | 200,000 | | | (5 Yr. Swap Rate + 7.10%),
8.000 | | | 01/25/2023 | | | | 200,944 | |
| | KeyCorp | | | | | | | | | | | |
| | 400,000 | | | 2.900 | | | 09/15/2020 | | | | 403,743 | |
| | Kreditanstalt fuer Wiederaufbau(d) | |
| | 1,000,000 | | | 1.125 | | | 08/06/2018 | | | | 996,674 | |
| | Lloyds Bank plc | |
| | 175,000 | | | 2.300 | | | 11/27/2018 | | | | 175,440 | |
| | Macquarie Bank Ltd.(c) | |
| | 25,000 | | | 6.625 | | | 04/07/2021 | | | | 27,591 | |
| | Mizuho Financial Group, Inc. | |
| | 450,000 | | | 2.601 | | | 09/11/2022 | | | | 442,918 | |
| | Morgan Stanley | |
| | 150,000 | | | (3 Mo. LIBOR + 1.40%),
2.765(a)(b) | | | 10/24/2023 | | | | 154,267 | |
| | 650,000 | | | 3.700 | | | 10/23/2024 | | | | 671,663 | |
| | 75,000 | | | 3.625 | | | 01/20/2027 | | | | 76,759 | |
| | Morgan Stanley Series F | |
| | 100,000 | | | 3.875 | | | 04/29/2024 | | | | 104,408 | |
| | Regions Bank | |
| | 250,000 | | | 7.500 | | | 05/15/2018 | | | | 255,006 | |
| | Royal Bank of Scotland Group plc | |
| | 227,000 | | | 3.875 | | | 09/12/2023 | | | | 230,846 | |
| | Synchrony Financial(a) | |
| | 350,000 | | | 2.600 | | | 01/15/2019 | | | | 350,662 | |
| | UBS Group Funding Switzerland AG(c) | |
| | 350,000 | | | 3.000 | | | 04/15/2021 | | | | 352,457 | |
| | Wells Fargo & Co. | |
| | 650,000 | | | 3.000 | | | 10/23/2026 | | | | 637,102 | |
| | Westpac Banking Corp.(a)(b) | |
| | 150,000 | | | (5 Yr. Swap Rate + 2.24%),
4.322 | | | 11/23/2031 | | | | 154,547 | |
| | | | | | | | | | | | |
| | | | | | | | | | | 11,931,534 | |
| | |
| | Capital Goods(a) – 0.4% | |
| | Northrop Grumman Corp. | |
| | 225,000 | | | 2.930 | | | 01/15/2025 | | | | 223,663 | |
| | 200,000 | | | 3.250 | | | 01/15/2028 | | | | 200,292 | |
| | | | | | | | | | | | |
| | | | | | | | | | | 423,955 | |
| | |
| | Commercial Services – 0.5% | |
| | Rensselaer Polytechnic Institute | |
| | 475,000 | | | 5.600 | | | 09/01/2020 | | | | 508,128 | |
| | |
| | Consumer Services(a) – 0.3% | |
| | Marriott International, Inc. | |
| | 125,000 | | | 2.875 | | | 03/01/2021 | | | | 125,803 | |
| | 250,000 | | | 2.300 | | | 01/15/2022 | | | | 245,445 | |
| | | | | | | | | | | | |
| | | | | | | | | | | 371,248 | |
| | |
| | |
| The accompanying notes are an integral part of these financial statements. | | 25 |
GOLDMAN SACHS VARIABLE INSURANCE TRUST CORE FIXED INCOME FUND
Schedule of Investments (continued)
December 31, 2017
| | | | | | | | | | | | | | |
Principal
Amount | | | Interest
Rate | | | Maturity
Date | | | Value | |
| | Corporate Bonds – (continued) | |
| | Diversified Financials – 0.3% | |
| | General Motors Financial Co., Inc. | |
| $ | 125,000 | | | | 3.250 | % | | | 05/15/2018 | | | $ | 125,470 | |
| | 175,000 | | | | 3.500 | | | | 07/10/2019 | | | | 177,637 | |
| | | | | | | | | | | | | | |
| | | | | | | | | | | | | 303,107 | |
| | |
| | Diversified Manufacturing(a) – 0.2% | |
| | Roper Technologies, Inc. | |
| | 125,000 | | | | 3.000 | | | | 12/15/2020 | | | | 126,488 | |
| | 100,000 | | | | 2.800 | | | | 12/15/2021 | | | | 100,176 | |
| | | | | | | | | | | | | | |
| | | | | | | | | | | | | 226,664 | |
| | |
| | Electric – 2.2% | |
| | Arizona Public Service Co.(a) | |
| | 125,000 | | | | 2.950 | | | | 09/15/2027 | | | | 123,113 | |
| | Dominion Energy, Inc. | |
| | 250,000 | | | | 2.579 | | | | 07/01/2020 | | | | 250,105 | |
| | Emera US Finance LP(a) | |
| | 125,000 | | | | 2.700 | | | | 06/15/2021 | | | | 124,696 | |
| | Entergy Corp.(a) | |
| | 125,000 | | | | 2.950 | | | | 09/01/2026 | | | | 121,618 | |
| | Exelon Corp.(a) | |
| | 125,000 | | | | 3.497 | | | | 06/01/2022 | | | | 127,388 | |
| | Florida Power & Light Co.(a) | |
| | 193,000 | | | | 4.125 | | | | 02/01/2042 | | | | 213,167 | |
| | NiSource Finance Corp.(a) | |
| | 275,000 | | | | 3.490 | | | | 05/15/2027 | | | | 279,906 | |
| | Pacific Gas & Electric Co.(a) | |
| | 100,000 | | | | 3.500 | | | | 06/15/2025 | | | | 102,232 | |
| | Progress Energy, Inc. | |
| | 350,000 | | | | 7.000 | | | | 10/30/2031 | | | | 467,701 | |
| | Puget Sound Energy, Inc. Series A(a)(b) | |
| | (3 Mo. LIBOR + 2.53%), | | | | | |
| | 150,000 | | | | 4.011 | | | | 06/01/2067 | | | | 147,187 | |
| | Southern California Edison Co.(a) | |
| | 175,000 | | | | 4.050 | | | | 03/15/2042 | | | | 187,909 | |
| | Southern Co. (The)(a) | |
| | 225,000 | | | | 2.350 | | | | 07/01/2021 | | | | 223,665 | |
| | | | | | | | | | | | | | |
| | | | | | | | | | | | | 2,368,687 | |
| | |
| | Energy – 2.6% | |
| | Anadarko Petroleum Corp. | |
| | 35,000 | | | | 3.450 | (a) | | | 07/15/2024 | | | | 34,855 | |
| | 50,000 | | | | 5.550 | (a) | | | 03/15/2026 | | | | 56,099 | |
| | 50,000 | | | | 6.450 | | | | 09/15/2036 | | | | 61,241 | |
| | Apache Corp.(a) | |
| | 50,000 | | | | 2.625 | | | | 01/15/2023 | | | | 49,032 | |
| | Baker Hughes a GE Co. LLC(a)(c) | |
| | 200,000 | | | | 3.337 | | | | 12/15/2027 | | | | 199,664 | |
| | Canadian Natural Resources Ltd.(a) | |
| | 100,000 | | | | 3.850 | | | | 06/01/2027 | | | | 102,067 | |
| | ConocoPhillips Co.(a) | |
| | 25,000 | | | | 3.350 | | | | 11/15/2024 | | | | 25,739 | |
| | Devon Energy Corp.(a) | |
| | 25,000 | | | | 4.000 | | | | 07/15/2021 | | | | 26,034 | |
| | 75,000 | | | | 5.600 | | | | 07/15/2041 | | | | 88,400 | |
| | |
| | Corporate Bonds – (continued) | |
| | Energy – (continued) | |
| $ | 30,000 | | | | 4.750 | % | | | 05/15/2042 | | | $ | 31,767 | |
| | Dolphin Energy Ltd.(c) | |
| | 28,032 | | | | 5.888 | | | | 06/15/2019 | | | | 28,768 | |
| | Energy Transfer LP(a) | |
| | 75,000 | | | | 4.650 | | | | 06/01/2021 | | | | 78,725 | |
| | 75,000 | | | | 4.750 | | | | 01/15/2026 | | | | 77,811 | |
| | Kinder Morgan Energy Partners LP(a) | |
| | 150,000 | | | | 5.400 | | | | 09/01/2044 | | | | 158,589 | |
| | Kinder Morgan, Inc.(a) | |
| | 425,000 | | | | 3.050 | | | | 12/01/2019 | | | | 428,723 | |
| | Petroleos Mexicanos | |
| | 30,000 | | | | 5.500 | | | | 02/04/2019 | | | | 30,937 | |
| | 60,000 | | | | 6.375 | | | | 02/04/2021 | | | | 65,250 | |
| | 120,000 | | | | 6.500 | (c) | | | 03/13/2027 | | | | 131,400 | |
| | 13,000 | | | | 5.500 | | | | 06/27/2044 | | | | 12,009 | |
| | 70,000 | | | | 5.625 | | | | 01/23/2046 | | | | 64,925 | |
| | 80,000 | | | | 6.750 | (c) | | | 09/21/2047 | | | | 83,558 | |
| | Pioneer Natural Resources Co.(a) | |
| | 125,000 | | | | 3.450 | | | | 01/15/2021 | | | | 127,516 | |
| | 70,000 | | | | 3.950 | | | | 07/15/2022 | | | | 72,961 | |
| | Plains All American Pipeline LP(a) | |
| | 50,000 | | | | 3.650 | | | | 06/01/2022 | | | | 50,291 | |
| | 100,000 | | | | 3.850 | | | | 10/15/2023 | | | | 99,525 | |
| | 125,000 | | | | 4.500 | | | | 12/15/2026 | | | | 126,713 | |
| | Sabine Pass Liquefaction LLC(a) | |
| | 175,000 | | | | 6.250 | | | | 03/15/2022 | | | | 194,710 | |
| | 175,000 | | | | 5.625 | | | | 03/01/2025 | | | | 193,027 | |
| | Valero Energy Corp. | |
| | 100,000 | | | | 3.650 | | | | 03/15/2025 | | | | 102,686 | |
| | | | | | | | | | | | | | |
| | | | | | | | | | | | | 2,803,022 | |
| | |
| | Food & Beverage – 1.7% | |
| | Anheuser-Busch InBev Finance, Inc.(a) | |
| | 675,000 | | | | 2.650 | | | | 02/01/2021 | | | | 678,387 | |
| | 200,000 | | | | 3.650 | | | | 02/01/2026 | | | | 206,396 | |
| | 100,000 | | | | 4.700 | | | | 02/01/2036 | | | | 111,815 | |
| | Kraft Heinz Foods Co.(a) | |
| | 100,000 | | | | 2.800 | | | | 07/02/2020 | | | | 100,577 | |
| | 75,000 | | | | 3.950 | | | | 07/15/2025 | | | | 77,465 | |
| | 125,000 | | | | 4.375 | | | | 06/01/2046 | | | | 123,819 | |
| | Molson Coors Brewing Co.(a) | |
| | 50,000 | | | | 2.100 | | | | 07/15/2021 | | | | 49,007 | |
| | 75,000 | | | | 3.000 | | | | 07/15/2026 | | | | 73,408 | |
| | Smithfield Foods, Inc.(c) | |
| | 125,000 | | | | 2.700 | | | | 01/31/2020 | | | | 124,184 | |
| | Suntory Holdings Ltd.(c) | |
| | 275,000 | | | | 2.550 | | | | 09/29/2019 | | | | 275,331 | |
| | | | | | | | | | | | | | |
| | | | | | | | | | | | | 1,820,389 | |
| | |
| | Food & Staples Retailing(a) – 0.7% | |
| | CVS Health Corp. | |
| | 125,000 | | | | 2.800 | | | | 07/20/2020 | | | | 125,521 | |
| | 125,000 | | | | 4.125 | | | | 05/15/2021 | | | | 129,871 | |
| | 225,000 | | | | 3.500 | | | | 07/20/2022 | | | | 229,185 | |
| | 75,000 | | | | 3.875 | | | | 07/20/2025 | | | | 77,240 | |
| | |
| | |
| 26 | | The accompanying notes are an integral part of these financial statements. |
GOLDMAN SACHS VARIABLE INSURANCE TRUST CORE FIXED INCOME FUND
| | | | | | | | | | | | | | |
Principal
Amount | | | Interest
Rate | | | Maturity
Date | | | Value | |
| | Corporate Bonds – (continued) | |
| | Food & Staples Retailing(a) – (continued) | |
| $ | 175,000 | | | | 2.875 | % | | | 06/01/2026 | | | $ | 167,783 | |
| | 25,000 | | | | 5.125 | | | | 07/20/2045 | | | | 28,652 | |
| | | | | | | | | | | | | | |
| | | | | | | | | | | | | 758,252 | |
| | |
| | Health Care Equipment & Services – 1.5% | |
| | Aetna, Inc.(a) | |
| | 75,000 | | | | 2.800 | | | | 06/15/2023 | | | | 73,813 | |
| | Becton Dickinson and Co. | |
| | 175,000 | | | | 2.675 | | | | 12/15/2019 | | | | 175,632 | |
| | 275,000 | | | | 2.894 | (a) | | | 06/06/2022 | | | | 273,280 | |
| | 275,000 | | | | 3.363 | (a) | | | 06/06/2024 | | | | 275,768 | |
| | 260,000 | | | | 3.000 | (a)(c) | | | 05/15/2026 | | | | 257,470 | |
| | 100,000 | | | | 4.685 | (a) | | | 12/15/2044 | | | | 109,350 | |
| | Medtronic, Inc. | |
| | 75,000 | | | | 2.500 | | | | 03/15/2020 | | | | 75,444 | |
| | 150,000 | | | | 3.150 | | | | 03/15/2022 | | | | 153,637 | |
| | Stryker Corp.(a) | |
| | 50,000 | | | | 2.625 | | | | 03/15/2021 | | | | 50,118 | |
| | 125,000 | | | | 3.375 | | | | 11/01/2025 | | | | 127,983 | |
| | UnitedHealth Group, Inc. | |
| | 100,000 | | | | 4.625 | | | | 07/15/2035 | | | | 116,458 | |
| | | | | | | | | | | | | | |
| | | | | | | | | | | | | 1,688,953 | |
| | |
| | Life Insurance – 0.9% | |
| | American International Group, Inc.(a) | |
| | 50,000 | | | | 3.750 | | | | 07/10/2025 | | | | 51,551 | |
| | 125,000 | | | | 4.500 | | | | 07/16/2044 | | | | 134,638 | |
| | Northwestern Mutual Life Insurance Co. (The)(c) | |
| | 200,000 | | | | 6.063 | | | | 03/30/2040 | | | | 268,507 | |
| | 100,000 | | | | 3.850 | (a) | | | 09/30/2047 | | | | 101,376 | |
| | Principal Financial Group, Inc.(a) | |
| | 150,000 | | | | 3.100 | | | | 11/15/2026 | | | | 148,147 | |
| | Reliance Standard Life Global Funding II(c) | |
| | 225,000 | | | | 2.500 | | | | 01/15/2020 | | | | 225,010 | |
| | | | | | | | | | | | | | |
| | | | | | | | | | | | | 929,229 | |
| | |
| | Materials – 0.8% | |
| | Ecolab, Inc. | |
| | 14,000 | | | | 5.500 | | | | 12/08/2041 | | | | 17,527 | |
| | 110,000 | | | | 3.950 | (a)(c) | | | 12/01/2047 | | | | 112,443 | |
| | LYB International Finance II BV(a) | |
| | 200,000 | | | | 3.500 | | | | 03/02/2027 | | | | 201,013 | |
| | Sherwin-Williams Co. (The) | |
| | 125,000 | | | | 2.250 | | | | 05/15/2020 | | | | 124,581 | |
| | 25,000 | | | | 2.750 | (a) | | | 06/01/2022 | | | | 24,903 | |
| | 50,000 | | | | 3.125 | (a) | | | 06/01/2024 | | | | 50,276 | |
| | 200,000 | | | | 3.450 | (a) | | | 06/01/2027 | | | | 203,199 | |
| | Westlake Chemical Corp.(a) | |
| | 75,000 | | | | 3.600 | | | | 08/15/2026 | | | | 75,433 | |
| | Yamana Gold, Inc.(a)(c) | |
| | 50,000 | | | | 4.625 | | | | 12/15/2027 | | | | 49,875 | |
| | | | | | | | | | | | | | |
| | | | | | | | | | | | | 859,250 | |
| | |
| | Corporate Bonds – (continued) | |
| | Media – 0.6% | |
| | 21st Century Fox America, Inc. | |
| $ | 75,000 | | | | 3.700 | %(a) | | | 09/15/2024 | | | $ | 78,006 | |
| | 75,000 | | | | 6.150 | | | | 03/01/2037 | | | | 98,223 | |
| | CCO Safari II LLC(a) | |
| | 50,000 | | | | 4.464 | | | | 07/23/2022 | | | | 52,168 | |
| | 200,000 | | | | 4.908 | | | | 07/23/2025 | | | | 212,637 | |
| | 25,000 | | | | 6.484 | | | | 10/23/2045 | | | | 29,148 | |
| | Comcast Corp.(a) | | | | | |
| | 125,000 | | | | 3.375 | | | | 08/15/2025 | | | | 128,285 | |
| | Time Warner Cable LLC | |
| | 50,000 | | | | 5.000 | | | | 02/01/2020 | | | | 52,180 | |
| | 25,000 | | | | 5.875 | (a) | | | 11/15/2040 | | | | 27,125 | |
| | | | | | | | | | | | | | |
| | | | | | | | | | | | | 677,772 | |
| | |
| | Metals and Mining(c) – 0.0% | |
| | Glencore Funding LLC | |
| | 50,000 | | | | 4.125 | | | | 05/30/2023 | | | | 51,725 | |
| | |
| | Noncaptive-Financial – 0.4% | |
| | AerCap Ireland Capital DAC | |
| | 250,000 | | | | 4.625 | | | | 07/01/2022 | | | | 264,848 | |
| | International Lease Finance Corp.(c) | |
| | 150,000 | | | | 7.125 | | | | 09/01/2018 | | | | 154,780 | |
| | | | | | | | | | | | | | |
| | | | | | | | | | | | | 419,628 | |
| | |
| | Pharmaceuticals, Biotechnology & Life Sciences – 2.3% | |
| | AbbVie, Inc.(a) | |
| | 125,000 | | | | 2.500 | | | | 05/14/2020 | | | | 125,385 | |
| | 75,000 | | | | 2.300 | | | | 05/14/2021 | | | | 74,452 | |
| | Allergan Funding SCS | |
| | 225,000 | | | | 2.350 | | | | 03/12/2018 | | | | 225,178 | |
| | 25,000 | | | | 4.850 | (a) | | | 06/15/2044 | | | | 26,761 | |
| | Amgen, Inc.(a) | |
| | 200,000 | | | | 3.125 | | | | 05/01/2025 | | | | 200,819 | |
| | Bayer US Finance LLC(c) | |
| | 400,000 | | | | 3.000 | | | | 10/08/2021 | | | | 404,106 | |
| | EMD Finance LLC(a)(c) | |
| | 200,000 | | | | 2.950 | | | | 03/19/2022 | | | | 200,859 | |
| | Forest Laboratories LLC(a)(c) | |
| | 100,000 | | | | 5.000 | | | | 12/15/2021 | | | | 106,948 | |
| | Mylan NV(a) | |
| | 225,000 | | | | 3.950 | | | | 06/15/2026 | | | | 226,883 | |
| | Shire Acquisitions Investments Ireland DAC | |
| | 225,000 | | | | 1.900 | | | | 09/23/2019 | | | | 222,963 | |
| | 200,000 | | | | 3.200 | (a) | | | 09/23/2026 | | | | 195,550 | |
| | Teva Pharmaceutical Finance Netherlands III BV | |
| | 85,000 | | | | 2.200 | | | | 07/21/2021 | | | | 77,645 | |
| | 85,000 | | | | 2.800 | | | | 07/21/2023 | | | | 74,019 | |
| | Thermo Fisher Scientific, Inc.(a) | |
| | 175,000 | | | | 3.000 | | | | 04/15/2023 | | | | 176,079 | |
| | 100,000 | | | | 3.650 | | | | 12/15/2025 | | | | 102,622 | |
| | Zoetis, Inc.(a) | |
| | 125,000 | | | | 3.000 | | | | 09/12/2027 | | | | 122,104 | |
| | | | | | | | | | | | | | |
| | | | | | | | | | | | | 2,562,373 | |
| | |
| | |
| The accompanying notes are an integral part of these financial statements. | | 27 |
GOLDMAN SACHS VARIABLE INSURANCE TRUST CORE FIXED INCOME FUND
Schedule of Investments (continued)
December 31, 2017
| | | | | | | | | | | | |
Principal
Amount | | | Interest
Rate | | Maturity
Date | | | Value | |
| | Corporate Bonds – (continued) | |
| | Pipelines(a) – 0.8% | |
| | Columbia Pipeline Group, Inc. | |
| $ | 100,000 | | | 3.300% | | | 06/01/2020 | | | $ | 101,428 | |
| | Enbridge, Inc. | |
| | 100,000 | | | 2.900 | | | 07/15/2022 | | | | 99,395 | |
| | 50,000 | | | 3.500 | | | 06/10/2024 | | | | 50,559 | |
| | Enterprise Products Operating LLC | |
| | 25,000 | | | 3.350 | | | 03/15/2023 | | | | 25,493 | |
| | Enterprise Products Operating LLC Series A(b) | |
| | 250,000 | | | (3 Mo. LIBOR + 3.71%),
5.084 | | | 08/01/2066 | | | | 250,000 | |
| | Sunoco Logistics Partners Operations LP | |
| | 50,000 | | | 4.250 | | | 04/01/2024 | | | | 50,974 | |
| | Williams Partners LP | |
| | 80,000 | | | 3.600 | | | 03/15/2022 | | | | 81,833 | |
| | 150,000 | | | 3.900 | | | 01/15/2025 | | | | 152,877 | |
| | 100,000 | | | 4.000 | | | 09/15/2025 | | | | 102,321 | |
| | | | | | | | | | | | |
| | | | | | | | | | | 914,880 | |
| | |
| | Property/Casualty Insurance – 0.4% | |
| | Arch Capital Group US, Inc. | |
| | 106,000 | | | 5.144 | | | 11/01/2043 | | | | 123,640 | |
| | Chubb Corp. (The)(a)(b) | |
| | 125,000 | | | (3 Mo. LIBOR + 2.25%),
3.609 | | | 04/15/2037 | | | | 124,063 | |
| | Hartford Financial Services Group, Inc. (The) | |
| | 25,000 | | | 5.125 | | | 04/15/2022 | | | | 27,282 | |
| | XLIT Ltd. | |
| | 125,000 | | | 4.450 | | | 03/31/2025 | | | | 127,850 | |
| | | | | | | | | | | | |
| | | | | | | | | | | 402,835 | |
| | |
| | Real Estate Investment Trusts – 1.7% | |
| | American Campus Communities Operating Partnership LP(a) | |
| | 275,000 | | | 4.125 | | | 07/01/2024 | | | | 286,435 | |
| | Crown Castle International Corp.(a) | |
| | 75,000 | | | 2.250 | | | 09/01/2021 | | | | 73,735 | |
| | 75,000 | | | 3.200 | | | 09/01/2024 | | | | 74,222 | |
| | 175,000 | | | 3.650 | | | 09/01/2027 | | | | 174,572 | |
| | CubeSmart LP(a) | |
| | 125,000 | | | 4.000 | | | 11/15/2025 | | | | 128,462 | |
| | HCP, Inc.(a) | |
| | 25,000 | | | 2.625 | | | 02/01/2020 | | | | 25,090 | |
| | Healthcare Trust of America Holdings LP(a) | |
| | 100,000 | | | 3.375 | | | 07/15/2021 | | | | 101,848 | |
| | Life Storage LP(a) | |
| | 50,000 | | | 3.875 | | | 12/15/2027 | | | | 49,816 | |
| | National Retail Properties, Inc.(a) | |
| | 125,000 | | | 4.000 | | | 11/15/2025 | | | | 128,226 | |
| | Realty Income Corp.(a) | |
| | 100,000 | | | 3.650 | | | 01/15/2028 | | | | 100,737 | |
| | Select Income REIT(a) | |
| | 50,000 | | | 2.850 | | | 02/01/2018 | | | | 50,000 | |
| | 75,000 | | | 3.600 | | | 02/01/2020 | | | | 75,465 | |
| | Ventas Realty LP(a) | |
| | 125,000 | | | 3.500 | | | 02/01/2025 | | | | 125,930 | |
| | |
| | Corporate Bonds – (continued) | |
| | Real Estate Investment Trusts – (continued) | |
| | VEREIT Operating Partnership LP(a) | |
| $ | 50,000 | | | 4.875% | | | 06/01/2026 | | | $ | 52,915 | |
| | Welltower, Inc. | |
| | 375,000 | | | 2.250 | | | 03/15/2018 | | | | 375,145 | |
| | | | | | | | | | | | |
| | | | | | | | | | | 1,822,598 | |
| | |
| | Retailing(a) – 0.5% | |
| | Alimentation Couche-Tard, Inc.(c) | |
| | 125,000 | | | 2.700 | | | 07/26/2022 | | | | 123,851 | |
| | 50,000 | | | 3.550 | | | 07/26/2027 | | | | 49,954 | |
| | Amazon.com, Inc.(c) | |
| | 100,000 | | | 3.150 | | | 08/22/2027 | | | | 100,151 | |
| | 50,000 | | | 3.875 | | | 08/22/2037 | | | | 53,055 | |
| | Expedia, Inc.(c) | |
| | 125,000 | | | 3.800 | | | 02/15/2028 | | | | 120,802 | |
| | Home Depot, Inc. (The) | |
| | 75,000 | | | 4.250 | | | 04/01/2046 | | | | 83,760 | |
| | | | | | | | | | | | |
| | | | | | | | | | | 531,573 | |
| | |
| | Software & Services(a) – 0.4% | |
| | Fidelity National Information Services, Inc. | |
| | 140,000 | | | 3.625 | | | 10/15/2020 | | | | 143,846 | |
| | 125,000 | | | 3.000 | | | 08/15/2026 | | | | 120,821 | |
| | Fiserv, Inc. | |
| | 150,000 | | | 2.700 | | | 06/01/2020 | | | | 150,937 | |
| | | | | | | | | | | | |
| | | | | | | | | | | 415,604 | |
| | |
| | Technology – 1.9% | |
| | Amphenol Corp.(a) | |
| | 125,000 | | | 3.125 | | | 09/15/2021 | | | | 126,986 | |
| | Broadcom Corp.(a)(c) | |
| | 175,000 | | | 2.650 | | | 01/15/2023 | | | | 168,701 | |
| | 275,000 | | | 3.625 | | | 01/15/2024 | | | | 273,456 | |
| | 125,000 | | | 3.125 | | | 01/15/2025 | | | | 119,496 | |
| | Cisco Systems, Inc. | |
| | 100,000 | | | 2.200 | | | 02/28/2021 | | | | 99,683 | |
| | Dell International LLC(a)(c) | |
| | 125,000 | | | 5.450 | | | 06/15/2023 | | | | 135,080 | |
| | Hewlett Packard Enterprise Co.(a) | |
| | 125,000 | | | 4.900 | | | 10/15/2025 | | | | 131,967 | |
| | NXP BV(c) | | | | | |
| | 375,000 | | | 4.125 | | | 06/01/2021 | | | | 382,500 | |
| | Oracle Corp.(a) | |
| | 200,000 | | | 2.500 | | | 05/15/2022 | | | | 200,315 | |
| | 400,000 | | | 3.250 | | | 11/15/2027 | | | | 406,786 | |
| | QUALCOMM, Inc.(a) | |
| | 75,000 | | | 2.600 | | | 01/30/2023 | | | | 73,156 | |
| | | | | | | | | | | | |
| | | | | | | | | | | 2,118,126 | |
| | |
| | Tobacco – 2.0% | |
| | BAT Capital Corp.(a)(c) | |
| | 725,000 | | | 3.222 | | | 08/15/2024 | | | | 724,971 | |
| | 700,000 | | | 3.557 | | | 08/15/2027 | | | | 700,908 | |
| | Imperial Brands Finance plc(c) | |
| | 400,000 | | | 2.050 | | | 02/11/2018 | | | | 399,948 | |
| | |
| | |
| 28 | | The accompanying notes are an integral part of these financial statements. |
GOLDMAN SACHS VARIABLE INSURANCE TRUST CORE FIXED INCOME FUND
| | | | | | | | | | | | | | |
Principal
Amount | | | Interest
Rate | | | Maturity
Date | | | Value | |
| | Corporate Bonds – (continued) | |
| | Tobacco – (continued) | |
| | Reynolds American, Inc.(a) | |
| $ | 375,000 | | | | 4.450 | % | | | 06/12/2025 | | | $ | 399,842 | |
| | | | | | | | | | | | | | |
| | | | | | | | | | | | | 2,225,669 | |
| | |
| | Transportation(c) – 0.5% | |
| | ERAC USA Finance LLC | |
| | 350,000 | | | | 2.350 | | | | 10/15/2019 | | | | 349,001 | |
| | Penske Truck Leasing Co. LP(a) | |
| | 200,000 | | | | 3.375 | | | | 02/01/2022 | | | | 203,745 | |
| | | | | | | | | | | | | | |
| | | | | | | | | | | | | 552,746 | |
| | |
| | Wireless Telecommunications – 3.0% | |
| | American Tower Corp. | |
| | 75,000 | | | | 3.300 | (a) | | | 02/15/2021 | | | | 76,375 | |
| | 125,000 | | | | 4.700 | | | | 03/15/2022 | | | | 133,809 | |
| | AT&T, Inc. | |
| | 25,000 | | | | 2.800 | (a) | | | 02/17/2021 | | | | 25,111 | |
| | 175,000 | | | | 3.200 | (a) | | | 03/01/2022 | | | | 176,888 | |
| | 300,000 | | | | 3.800 | | | | 03/15/2022 | | | | 310,045 | |
| | 150,000 | | | | 3.000 | (a) | | | 06/30/2022 | | | | 150,267 | |
| | 135,000 | | | | 3.600 | (a) | | | 02/17/2023 | | | | 138,101 | |
| | 200,000 | | | | 3.400 | (a) | | | 05/15/2025 | | | | 196,630 | |
| | 100,000 | | | | 4.125 | (a) | | | 02/17/2026 | | | | 102,286 | |
| | 325,000 | | | | 4.250 | (a) | | | 03/01/2027 | | | | 331,310 | |
| | 25,000 | | | | 3.900 | (a) | | | 08/14/2027 | | | | 25,167 | |
| | Verizon Communications, Inc. | |
| | 1,021,000 | | | | 2.946 | | | | 03/15/2022 | | | | 1,027,218 | |
| | 400,000 | | | | 5.150 | | | | 09/15/2023 | | | | 445,058 | |
| | 150,000 | | | | 2.625 | | | | 08/15/2026 | | | | 141,283 | |
| | | | | | | | | | | | | | |
| | | | | | | | | | | | | 3,279,548 | |
| | |
| | Wirelines Telecommunications – 0.4% | |
| | Telefonica Emisiones SAU | |
| | 175,000 | | | | 3.192 | | | | 04/27/2018 | | | | 175,622 | |
| | 225,000 | | | | 5.462 | | | | 02/16/2021 | | | | 243,385 | |
| | | | | | | | | | | | | | |
| | | | | | | | | | | | | 419,007 | |
| | |
| | TOTAL CORPORATE BONDS | |
| | (Cost $41,369,788) | | | $ | 41,908,102 | |
| | |
| | | | | | | | | | | | | | |
| | Mortgage-Backed Securities – 20.8% | |
| | Adjustable Rate FHLMC(b) – 0.4% | |
| $ | 408,748 | | | | 3.381 | % | | | 09/01/2035 | | | $ | 431,410 | |
| | |
| | Adjustable Rate FNMA(b) – 0.6% | |
| | 133,241 | | | | 3.129 | | | | 05/01/2033 | | | | 136,092 | |
| | 267,056 | | | | 3.208 | | | | 05/01/2035 | | | | 276,969 | |
| | 205,690 | | | | 3.458 | | | | 09/01/2035 | | | | 218,414 | |
| | | | | | | | | | | | | | |
| | | | | | | | | | | | | 631,475 | |
| | |
| | FHLMC – 1.6% | |
| | 897 | | | | 5.500 | | | | 02/01/2018 | | | | 898 | |
| | 347 | | | | 5.500 | | | | 04/01/2018 | | | | 348 | |
| | 336 | | | | 4.500 | | | | 09/01/2018 | | | | 338 | |
| | |
| | Mortgage-Backed Securities –(continued) | |
| | FHLMC – (continued) | |
| $ | 1,198 | | | | 5.500 | % | | | 09/01/2018 | | | $ | 1,209 | |
| | 7 | | | | 9.500 | | | | 08/01/2020 | | | | 7 | |
| | 14,933 | | | | 6.500 | | | | 10/01/2020 | | | | 15,285 | |
| | 5,254 | | | | 4.500 | | | | 07/01/2024 | | | | 5,509 | |
| | 29,397 | | | | 4.500 | | | | 11/01/2024 | | | | 30,886 | |
| | 7,076 | | | | 4.500 | | | | 12/01/2024 | | | | 7,425 | |
| | 7,873 | | | | 6.000 | | | | 03/01/2029 | | | | 8,794 | |
| | 147 | | | | 6.000 | | | | 04/01/2029 | | | | 164 | |
| | 8,958 | | | | 7.500 | | | | 12/01/2029 | | | | 10,250 | |
| | 100,575 | | | | 7.000 | | | | 05/01/2032 | | | | 116,686 | |
| | 162 | | | | 6.000 | | | | 08/01/2032 | | | | 184 | |
| | 52,570 | | | | 7.000 | | | | 12/01/2032 | | | | 61,077 | |
| | 2,989 | | | | 5.000 | | | | 10/01/2033 | | | | 3,258 | |
| | 4,451 | | | | 5.000 | | | | 07/01/2035 | | | | 4,859 | |
| | 6,135 | | | | 5.000 | | | | 12/01/2035 | | | | 6,712 | |
| | 49,932 | | | | 5.500 | | | | 01/01/2037 | | | | 55,096 | |
| | 1,297 | | | | 5.000 | | | | 03/01/2038 | | | | 1,410 | |
| | 84,226 | | | | 7.000 | | | | 02/01/2039 | | | | 97,953 | |
| | 3,327 | | | | 5.000 | | | | 06/01/2041 | | | | 3,602 | |
| | 1,329,653 | | | | 3.500 | | | | 04/01/2043 | | | | 1,373,698 | |
| | | | | | | | | | | | | | |
| | | | | | | | | | | | | 1,805,648 | |
| | |
| | FNMA – 7.3% | |
| | 1,579 | | | | 5.500 | | | | 02/01/2018 | | | | 1,580 | |
| | 5,101 | | | | 5.000 | | | | 05/01/2018 | | | | 5,116 | |
| | 752 | | | | 6.500 | | | | 08/01/2018 | | | | 759 | |
| | 4,333 | | | | 7.000 | | | | 08/01/2018 | | | | 4,358 | |
| | 619 | | | | 5.000 | | | | 06/01/2023 | | | | 652 | |
| | 55,005 | | | | 5.500 | | | | 09/01/2023 | | | | 57,797 | |
| | 15,215 | | | | 5.500 | | | | 10/01/2023 | | | | 16,046 | |
| | 2,968 | | | | 4.500 | | | | 07/01/2024 | | | | 3,107 | |
| | 78,008 | | | | 4.500 | | | | 11/01/2024 | | | | 81,969 | |
| | 33,737 | | | | 4.500 | | | | 12/01/2024 | | | | 35,469 | |
| | 57 | | | | 7.000 | | | | 07/01/2025 | | | | 64 | |
| | 9,663 | | | | 9.000 | | | | 11/01/2025 | | | | 11,013 | |
| | 34,808 | | | | 7.000 | | | | 08/01/2026 | | | | 38,841 | |
| | 608 | | | | 7.000 | | | | 08/01/2027 | | | | 696 | |
| | 3,364 | | | | 7.000 | | | | 09/01/2027 | | | | 3,582 | |
| | 98 | | | | 7.000 | | | | 01/01/2028 | | | | 112 | |
| | 55,555 | | | | 6.000 | | | | 02/01/2029 | | | | 62,654 | |
| | 50,414 | | | | 6.000 | | | | 06/01/2029 | | | | 56,868 | |
| | 17,404 | | | | 8.000 | | | | 10/01/2029 | | | | 19,768 | |
| | 4,691 | | | | 7.000 | | | | 12/01/2029 | | | | 5,352 | |
| | 1,246 | | | | 8.500 | | | | 04/01/2030 | | | | 1,503 | |
| | 2,318 | | | | 8.000 | | | | 05/01/2030 | | | | 2,661 | |
| | 133 | | | | 8.500 | | | | 06/01/2030 | | | | 137 | |
| | 5,622 | | | | 7.000 | | | | 05/01/2032 | | | | 6,486 | |
| | 44,581 | | | | 7.000 | | | | 06/01/2032 | | | | 51,745 | |
| | 50,280 | | | | 7.000 | | | | 08/01/2032 | | | | 58,485 | |
| | 8,755 | | | | 8.000 | | | | 08/01/2032 | | | | 9,874 | |
| | 2,405 | | | | 5.000 | | | | 08/01/2033 | | | | 2,601 | |
| | 628 | | | | 5.500 | | | | 09/01/2033 | | | | 696 | |
| | 786 | | | | 5.500 | | | | 02/01/2034 | | | | 870 | |
| | 155 | | | | 5.500 | | | | 04/01/2034 | | | | 173 | |
| | 4,965 | | | | 5.500 | | | | 12/01/2034 | | | | 5,499 | |
| | |
| | |
| The accompanying notes are an integral part of these financial statements. | | 29 |
GOLDMAN SACHS VARIABLE INSURANCE TRUST CORE FIXED INCOME FUND
Schedule of Investments (continued)
December 31, 2017
| | | | | | | | | | | | | | |
Principal
Amount | | | Interest
Rate | | | Maturity
Date | | | Value | |
| | Mortgage-Backed Securities – (continued) | |
| | FNMA – (continued) | |
| $ | 25,848 | | | | 5.000 | % | | | 04/01/2035 | | | $ | 28,167 | |
| | 42,674 | | | | 6.000 | | | | 04/01/2035 | | | | 48,267 | |
| | 967 | | | | 5.500 | | | | 09/01/2035 | | | | 1,076 | |
| | 99,061 | | | | 6.000 | | | | 10/01/2035 | | | | 112,208 | |
| | 212,984 | | | | 6.000 | | | | 09/01/2036 | | | | 240,541 | |
| | 67 | | | | 5.500 | | | | 02/01/2037 | | | | 74 | |
| | 101 | | | | 5.500 | | | | 04/01/2037 | | | | 112 | |
| | 132,515 | | | | 5.500 | | | | 08/01/2037 | | | | 146,443 | |
| | 188 | | | | 5.500 | | | | 03/01/2038 | | | | 209 | |
| | 161 | | | | 5.500 | | | | 06/01/2038 | | | | 179 | |
| | 129 | | | | 5.500 | | | | 07/01/2038 | | | | 144 | |
| | 138 | | | | 5.500 | | | | 08/01/2038 | | | | 153 | |
| | 113 | | | | 5.500 | | | | 09/01/2038 | | | | 126 | |
| | 1,691 | | | | 5.500 | | | | 10/01/2038 | | | | 1,879 | |
| | 49 | | | | 5.500 | | | | 12/01/2038 | | | | 55 | |
| | 116,544 | | | | 5.000 | | | | 01/01/2039 | | | | 127,121 | |
| | 53,245 | | | | 7.000 | | | | 03/01/2039 | | | | 61,635 | |
| | 189,437 | | | | 6.000 | | | | 05/01/2039 | | | | 212,989 | |
| | 12,531 | | | | 4.500 | | | | 08/01/2039 | | | | 13,513 | |
| | 52,126 | | | | 3.000 | | | | 01/01/2043 | | | | 52,627 | |
| | 202,193 | | | | 3.000 | | | | 03/01/2043 | | | | 204,135 | |
| | 284,386 | | | | 3.000 | | | | 04/01/2043 | | | | 287,119 | |
| | 213,359 | | | | 3.000 | | | | 05/01/2043 | | | | 215,409 | |
| | 708,106 | | | | 3.500 | | | | 07/01/2043 | | | | 730,918 | |
| | 730,087 | | | | 4.500 | | | | 04/01/2045 | | | | 790,975 | |
| | 81,940 | | | | 4.500 | | | | 05/01/2045 | | | | 87,338 | |
| | 793,602 | | | | 3.500 | | | | 05/01/2046 | | | | 819,085 | |
| | 2,999,900 | | | | 4.500 | | | | 01/01/2048 | | | | 3,194,308 | |
| | | | | | | | | | | | | | |
| | | | | | | | | | | | | 7,923,338 | |
| | |
| | GNMA – 10.9% | |
| | 1,881 | | | | 7.000 | | | | 10/15/2025 | | | | 1,905 | |
| | 6,897 | | | | 7.000 | | | | 11/15/2025 | | | | 7,340 | |
| | 1,100 | | | | 7.000 | | | | 02/15/2026 | | | | 1,123 | |
| | 5,057 | | | | 7.000 | | | | 04/15/2026 | | | | 5,535 | |
| | 3,062 | | | | 7.000 | | | | 03/15/2027 | | | | 3,516 | |
| | 22,531 | | | | 7.000 | | | | 11/15/2027 | | | | 25,036 | |
| | 341 | | | | 7.000 | | | | 01/15/2028 | | | | 368 | |
| | 16,668 | | | | 7.000 | | | | 02/15/2028 | | | | 17,856 | |
| | 1,918 | | | | 7.000 | | | | 03/15/2028 | | | | 2,201 | |
| | 980 | | | | 7.000 | | | | 04/15/2028 | | | | 1,135 | |
| | 199 | | | | 7.000 | | | | 05/15/2028 | | | | 226 | |
| | 3,621 | | | | 7.000 | | | | 06/15/2028 | | | | 4,170 | |
| | 7,621 | | | | 7.000 | | | | 07/15/2028 | | | | 8,820 | |
| | 11,182 | | | | 7.000 | | | | 09/15/2028 | | | | 12,978 | |
| | 2,185 | | | | 7.000 | | | | 11/15/2028 | | | | 2,531 | |
| | 2,250 | | | | 7.500 | | | | 11/15/2030 | | | | 2,256 | |
| | 135,467 | | | | 6.000 | | | | 08/20/2034 | | | | 153,622 | |
| | 139,231 | | | | 5.000 | | | | 06/15/2040 | | | | 151,067 | |
| | 655,509 | | | | 4.000 | | | | 08/20/2043 | | | | 690,461 | |
| | 334,561 | | | | 4.000 | | | | 08/20/2045 | | | | 351,459 | |
| | 1,369,086 | | | | 4.000 | | | | 10/20/2045 | | | | 1,438,235 | |
| | 52,796 | | | | 4.000 | | | | 11/20/2045 | | | | 55,462 | |
| | 725,654 | | | | 4.000 | | | | 01/20/2046 | | | | 761,852 | |
| | |
| | Mortgage-Backed Securities – (continued) | |
| | GNMA – (continued) | |
| $ | 254,485 | | | | 4.000 | % | | | 02/20/2046 | | | $ | 267,180 | |
| | 688,118 | | | | 4.000 | | | | 03/20/2046 | | | | 722,443 | |
| | 1,000,001 | | | | 4.000 | | | | 05/20/2047 | | | | 1,043,321 | |
| | 2,956,849 | | | | 4.000 | | | | 06/20/2047 | | | | 3,084,941 | |
| | 971,985 | | | | 4.000 | | | | 07/20/2047 | | | | 1,015,002 | |
| | 2,000,000 | | | | 4.000 | | | | TBA-30yr | (e) | | | 2,085,312 | |
| | | | | | | | | | | | | | |
| | | | | | | | | | | | | 11,917,353 | |
| | |
| | TOTAL MORTGAGE-BACKED SECURITIES | |
| | (Cost $22,640,971) | | | $ | 22,709,224 | |
| | |
| | | | | | | | | | | | | | |
| | Collateralized Mortgage Obligations – 1.9% | |
| | Adjustable Rate Non-Agency(a)(b) – 0.5% | |
| | Alternative Loan Trust Series 2005-38, Class A1 | |
| $ | 103,470 | | | | 2.563 | % | | | 09/25/2035 | | | $ | 103,085 | |
| | Lehman XS Trust Series 2005-7N, Class 1A1A | |
| | 188,207 | | | | 1.822 | | | | 12/25/2035 | | | | 183,458 | |
| MASTR Adjustable Rate Mortgages Trust Series 2006-OA2,
Class 4A1A |
|
| | 227,877 | | | | 1.913 | | | | 12/25/2046 | | | | 220,905 | |
| | | | | | | | | | | | | | |
| | | | | | | | | | | | | 507,448 | |
| | |
| | Regular Floater(b)(c) – 1.1% | |
| Mortgage Repurchase Agreement Financing Trust
Series 2017-1, Class A1(a) |
|
| | 150,000 | | | | 2.282 | | | | 07/10/2019 | | | | 150,011 | |
| Mortgage Repurchase Agreement Financing Trust
Series 2017-2, Class A1 |
|
| | 800,000 | | | | 1.779 | | | | 08/12/2019 | | | | 800,000 | |
| | Station Place Securitization Trust Series 2015-2, Class A | |
| | 300,000 | | | | 2.522 | | | | 05/15/2018 | | | | 300,000 | |
| | | | | | | | | | | | | | |
| | | | | | | | | | | | | 1,250,011 | |
| | |
| | Sequential Fixed Rate – 0.3% | |
| | FNMA REMIC Series 2012-111, Class B | |
| | 17,051 | | | | 7.000 | | | | 10/25/2042 | | | | 19,607 | |
| | FNMA REMIC Series 2012-153, Class B | |
| | 45,355 | | | | 7.000 | | | | 07/25/2042 | | | | 52,276 | |
| | NCUA Guaranteed Notes Series A4 | |
| | 300,000 | | | | 3.000 | | | | 06/12/2019 | | | | 303,804 | |
| | | | | | | | | | | | | | |
| | | | | | | | | | | | | 375,687 | |
| | |
| | TOTAL COLLATERALIZED MORTGAGE OBLIGATIONS | |
| | (Cost $2,075,773) | | | $ | 2,133,146 | |
| | |
| | | | | | | | | | | | | | |
| | U.S. Government Agency Securities – 1.9% | |
| | FHLB | |
| $ | 600,000 | | | | 2.125 | % | | | 06/09/2023 | | | $ | 592,474 | |
| | 100,000 | | | | 3.375 | | | | 12/08/2023 | | | | 105,427 | |
| | FNMA | | | | | | | | | | | | | |
| | 400,000 | | | | 1.875 | | | | 09/24/2026 | | | | 377,055 | |
| | 400,000 | | | | 6.250 | | | | 05/15/2029 | | | | 534,076 | |
| | |
| | |
| 30 | | The accompanying notes are an integral part of these financial statements. |
GOLDMAN SACHS VARIABLE INSURANCE TRUST CORE FIXED INCOME FUND
| | | | | | | | | | | | | | |
Principal
Amount | | | Interest
Rate | | | Maturity
Date | | | Value | |
| | U.S. Government Agency Securities – (continued) | |
| | Tennessee Valley Authority | |
| $ | 500,000 | | | | 3.875 | % | | | 02/15/2021 | | | $ | 526,575 | |
| | |
| | TOTAL U.S. GOVERNMENT AGENCY SECURITIES | |
| | (Cost $2,146,354) | | | $ | 2,135,607 | |
| | |
| | | | | | | | | | | | | | |
| | Asset-Backed Securities(b) – 11.4% | |
| | Collateralized Loan Obligations(c) – 4.3% | |
| | Acis CLO Ltd. Series 2013-1A, Class ACOM(a) | |
| $ | 1,123,765 | | | | 2.581 | % | | | 04/18/2024 | | | $ | 1,122,753 | |
| | BlueMountain CLO Ltd. Series 2014-2A, Class AR(a) | |
| | 550,000 | | | | 2.293 | | | | 07/20/2026 | | | | 551,505 | |
| | Cutwater Ltd. Series 2014-1A, Class A1AR(a) | |
| | 550,000 | | | | 2.609 | | | | 07/15/2026 | | | | 549,822 | |
| | Neuberger Berman CLO XIX Ltd. Series 2015-19A, Class A1R(a) | |
| | 550,000 | | | | 2.409 | | | | 07/15/2027 | | | | 553,137 | |
| | OFSI Fund V Ltd. Series 2013-5A, Class A1LA | |
| | 395,162 | | | | 2.283 | | | | 04/17/2025 | | | | 395,272 | |
| | Recette Clo Ltd. Series 2015-1A, Class AR(a) | |
| | 750,000 | | | | 2.283 | (a) | | | 10/20/2027 | | | | 752,088 | |
| | Voya CLO Ltd. Series 2014-4A, Class A1R(a) | |
| | 800,000 | | | | 2.309 | (a) | | | 10/14/2026 | | | | 801,586 | |
| | | | | | | | | | | | | | |
| | | | | | | | | | | | | 4,726,163 | |
| | |
| | Home Equity(a) – 0.1% | |
| | GMACM Home Equity Loan Trust Series 2007-HE3, Class 1A1 | |
| | 21,105 | | | | 6.969 | | | | 09/25/2037 | | | | 21,351 | |
| | GMACM Home Equity Loan Trust Series 2007-HE3, Class 2A1 | |
| | 71,839 | | | | 6.803 | | | | 09/25/2037 | | | | 73,927 | |
| | | | | | | | | | | | | | |
| | | | | | | | | | | | | 95,278 | |
| | |
| | Student Loans(a) – 7.0% | |
| | Academic Loan Funding Trust Series 2012-1A, Class A2(c) | |
| | 550,000 | | | | 2.428 | | | | 12/27/2044 | | | | 549,347 | |
| | AccessLex Institute Series 2005-2, Class A3 | |
| | 92,817 | | | | 1.495 | | | | 11/22/2024 | | | | 92,817 | |
| | Chase Education Loan Trust Series 2007-A, Class A3 | |
| | 32,818 | | | | 1.756 | | | | 12/28/2023 | | | | 32,740 | |
| | ECMC Group Student Loan Trust Series 2016-1A, Class A(c) | |
| | 450,588 | | | | 2.902 | | | | 07/26/2066 | | | | 454,752 | |
| | Edsouth Indenture No. 10 LLC Series 2015-2, Class A(c) | |
| | 286,969 | | | | 2.552 | | | | 12/25/2056 | | | | 288,361 | |
| | EFS Volunteer No. 2 LLC Series 2012-1, Class A2(c) | |
| | 550,000 | | | | 2.902 | | | | 03/25/2036 | | | | 564,855 | |
| | EFS Volunteer No. 3 LLC Series 2012-1, Class A3(c) | |
| | 350,000 | | | | 2.552 | | | | 04/25/2033 | | | | 350,000 | |
| Montana Higher Education Student Assistance Corp.
Series 2012-1, Class A3 |
|
| | 300,000 | | | | 2.333 | | | | 07/20/2043 | | | | 304,482 | |
| | Navient Student Loan Trust Series 2016-5A, Class A(c) | |
| | 962,682 | | | | 2.802 | | | | 06/25/2065 | | | | 985,769 | |
| | Navient Student Loan Trust Series 2016-7A, Class A(c) | |
| | 485,990 | | | | 2.702 | | | | 03/25/2066 | | | | 497,274 | |
| | Nelnet Student Loan Trust Series 2006-1, Class A6(c) | |
| | 500,000 | | | | 1.904 | | | | 08/23/2036 | | | | 488,467 | |
| | |
| | Asset-Backed Securities(b) – (continued) | |
| | Student Loans(a) – (continued) | |
| | Nelnet Student Loan Trust Series 2006-2, Class A5 | |
| $ | 226,269 | | | | 1.467 | % | | | 01/25/2030 | | | $ | 225,991 | |
| | Northstar Education Finance, Inc. Series 2007-1, Class A1 | |
| | 85,492 | | | | 1.478 | | | | 04/28/2030 | | | | 85,007 | |
| | Scholar Funding Trust Series 2010-A, Class A(c) | |
| | 133,658 | | | | 2.128 | | | | 10/28/2041 | | | | 132,687 | |
| | SLC Student Loan Trust Series 2006-1, Class A5 | |
| | 406,069 | | | | 1.698 | | | | 03/15/2027 | | | | 404,053 | |
| | SLM Student Loan Trust Series 2003-7A, Class A5A(c) | |
| | 391,366 | | | | 2.788 | | | | 12/15/2033 | | | | 391,363 | |
| | SLM Student Loan Trust Series 2004-8A, Class A6(c) | |
| | 400,000 | | | | 1.997 | | | | 01/25/2040 | | | | 398,042 | |
| | SLM Student Loan Trust Series 2005-3, Class A5 | |
| | 134,128 | | | | 1.457 | | | | 10/25/2024 | | | | 133,998 | |
| | SLM Student Loan Trust Series 2005-5, Class A5 | |
| | 100,000 | | | | 2.117 | | | | 10/25/2040 | | | | 99,360 | |
| | SLM Student Loan Trust Series 2006-2, Class A5 | |
| | 104,558 | | | | 1.477 | | | | 07/25/2025 | | | | 104,528 | |
| | SLM Student Loan Trust Series 2007-7, Class A4 | |
| | 194,751 | | | | 1.697 | | | | 01/25/2022 | | | | 192,312 | |
| | SLM Student Loan Trust Series 2008-5, Class A4 | |
| | 403,666 | | | | 3.067 | | | | 07/25/2023 | | | | 416,423 | |
| | SLM Student Loan Trust Series 2008-6, Class A | |
| | 300,000 | | | | 2.467 | | | | 07/25/2023 | | | | 303,762 | |
| | SLM Student Loan Trust Series 2008-8, Class A | |
| | 150,000 | | | | 2.867 | | | | 04/25/2023 | | | | 153,788 | |
| | | | | | | | | | | | | | |
| | | | | | | | | | | | | 7,650,178 | |
| | |
| | TOTAL ASSET-BACKED SECURITIES | |
| | (Cost $12,272,993) | | | $ | 12,471,619 | |
| | |
| | | | | | | | | | | | | | |
| | Foreign Government Securities – 2.7% | |
| | Colombia Government International Bond(a) | |
| $ | 240,000 | | | | 4.000 | % | | | 02/26/2024 | | | $ | 249,000 | |
| | 200,000 | | | | 3.875 | | | | 04/25/2027 | | | | 203,750 | |
| | Hashemite Kingdom of Jordan Government AID Bond(f) | |
| | 700,000 | | | | 2.503 | | | | 10/30/2020 | | | | 707,917 | |
| | Indonesia Government International Note(c) | |
| | 230,000 | | | | 4.750 | | | | 01/08/2026 | | | | 249,838 | |
| | 260,000 | | | | 3.850 | | | | 07/18/2027 | | | | 266,825 | |
| | Israel Government AID Bond(f) | |
| | 400,000 | | | | 5.500 | | | | 09/18/2023 | | | | 465,400 | |
| | 200,000 | | | | 5.500 | | | | 12/04/2023 | | | | 233,396 | |
| | 100,000 | | | | 5.500 | | | | 04/26/2024 | | | | 117,658 | |
| | Mexico Government International Bond | |
| | 200,000 | | | | 4.600 | | | | 02/10/2048 | | | | 197,750 | |
| | United Arab Emirates Government International Bond(c) | |
| | 220,000 | | | | 3.125 | | | | 10/11/2027 | | | | 215,325 | |
| | |
| | TOTAL FOREIGN GOVERNMENT SECURITIES | |
| | (Cost $2,873,248) | | | $ | 2,906,859 | |
| | |
| | |
| The accompanying notes are an integral part of these financial statements. | | 31 |
GOLDMAN SACHS VARIABLE INSURANCE TRUST CORE FIXED INCOME FUND
Schedule of Investments (continued)
December 31, 2017
| | | | | | | | | | | | | | |
Principal
Amount | | | Interest
Rate | | | Maturity
Date | | | Value | |
| | Supranational – 0.2% | |
| | Inter-American Development Bank | |
| $ | 200,000 | | | | 1.000 | % | | | 02/27/2018 | | | $ | 199,636 | |
| | (Cost $199,937) | | | | | | | | | | | | | |
| | |
| | | | | | | | | | | | | | |
| | Municipal Bonds – 0.9% | |
| | California – 0.3% | |
| | California State Various Purpose GO Bonds Series 2010 | |
| $ | 140,000 | | | | 7.950 | % | | | 03/01/2036 | | | $ | 156,341 | |
| | 105,000 | | | | 7.625 | | | | 03/01/2040 | | | | 164,267 | |
| | | | | | | | | | | | | | |
| | | | | | | | | | | | | 320,608 | |
| | |
| | Illinois – 0.3% | | | | | | | | | | | | | |
| | Illinois State GO Bonds for Build America Bonds Series 2010-5 | |
| | 275,000 | | | | 7.350 | | | | 07/01/2035 | | | | 317,947 | |
| | Illinois State GO Bonds Pension Funding Series 2003 | |
| | 25,000 | | | | 5.100 | | | | 06/01/2033 | | | | 24,958 | |
| | | | | | | | | | | | | | |
| | | | | | | | | | | | | 342,905 | |
| | |
| | Ohio – 0.3% | | | | | | | | | | | | | |
| American Municipal Power, Inc. RB Build America Bond
Series 2010 E RMKT |
|
| | 250,000 | | | | 6.270 | | | | 02/15/2050 | | | | 327,078 | |
| | |
| | TOTAL MUNICIPAL BONDS | |
| | (Cost $802,422) | | | | | | | | | | | $ | 990,591 | |
| | |
| | | | | | | | | | | | | | |
| | U.S. Treasury Obligations – 20.1% | |
| | U.S. Treasury Bonds | |
| $ | 470,000 | | | | 2.750 | % | | | 11/15/2042 | | | $ | 473,022 | |
| | 410,000 | | | | 3.125 | | | | 02/15/2043 | | | | 440,574 | |
| | 490,000 | | | | 3.625 | | | | 02/15/2044 | | | | 572,781 | |
| | 490,000 | | | | 3.125 | | | | 08/15/2044 | | | | 526,637 | |
| | 100,000 | | | | 3.000 | | | | 11/15/2044 | | | | 105,075 | |
| | 200,000 | | | | 2.875 | | | | 08/15/2045 | | | | 205,176 | |
| | 1,350,000 | | | | 3.000 | | | | 11/15/2045 | | | | 1,418,053 | |
| | 3,600,000 | | | | 2.875 | | | | 11/15/2046 | | | | 3,693,708 | |
| | 120,000 | | | | 3.000 | | | | 05/15/2047 | | | | 126,187 | |
| | U.S. Treasury Inflation Linked Bonds (TIPS) | |
| | 172,331 | | | | 2.500 | | | | 01/15/2029 | | | | 209,222 | |
| | 62,461 | | | | 1.000 | | | | 02/15/2046 | | | | 66,807 | |
| | 102,183 | | | | 0.875 | | | | 02/15/2047 | | | | 106,304 | |
| | U.S. Treasury Inflation Linked Notes (TIPS) | |
| | 102,904 | | | | 0.125 | | | | 07/15/2026 | | | | 100,596 | |
| | 255,283 | | | | 0.375 | | | | 01/15/2027 | | | | 253,595 | |
| | U.S. Treasury Notes | |
| | 10,340,000 | | | | 2.125 | | | | 07/31/2024 | | | | 10,219,125 | |
| | 620,000 | | | | 2.125 | | | | 11/30/2024 | | | | 611,872 | |
| | 250,000 | | | | 2.250 | | | | 12/31/2024 | | | | 248,673 | |
| | 1,500,000 | | | | 2.000 | | | | 11/15/2026 | | | | 1,451,775 | |
| | U.S. Treasury STRIPS Bond(g) | |
| | 1,800,000 | | | | 0.000 | | | | 02/15/2036 | | | | 1,103,688 | |
| | |
| | TOTAL U.S. TREASURY OBLIGATIONS | |
| | (Cost $21,772,937) | | | $ | 21,932,870 | |
| | |
| Shares | | | Distribution Rate | | | Value | |
| | Investment Company(h) –1.2% | |
| Goldman Sachs Financial Square Government Fund —
Institutional Shares |
|
| | 1,280,522 | | | | 1.228 | % | | $ | 1,280,522 | |
| | (Cost $1,280,522) | | | | | |
| | |
| | TOTAL INVESTMENTS – 99.5% | |
| | (Cost $107,434,945) | | | $ | 108,668,176 | |
| | |
| OTHER ASSETS IN EXCESS
OF LIABILITIES – 0.5% |
| | | 520,625 | |
| | |
| | NET ASSETS – 100.0% | | | $ | 109,188,801 | |
| | |
| | |
| The percentage shown for each investment category reflects the value of investments in that category as a percentage of net assets. |
| (a) | | Securities with “Call” features. Maturity dates disclosed are the final maturity dates. |
| (b) | | Variable rate security. Except for floating rate notes (for which final maturity is disclosed), maturity date disclosed is the next interest reset date. Interest rate disclosed is that which is in effect on December 31, 2017. |
| (c) | | Exempt from registration under Rule 144A of the Securities Act of 1933. Under procedures approved by the Board of Trustees, such securities may be deemed liquid by the Investment Adviser and may be resold, normally to qualified institutional buyers in transactions exempt from registration. Total market value of Rule 144A securities amounts to $19,664,422, which represents approximately 18.0% of net assets as of December 31, 2017. The liquidity determination is unaudited. |
| (d) | | Guaranteed by a foreign government until maturity. Total market value of these securities amounts to $996,674, which represents 0.9% of net assets as of December 31, 2017. |
| (e) | | TBA (To Be Announced) Securities are purchased on a forward commitment basis with an approximate principal amount and no defined maturity date. The actual principal and maturity date will be determined upon settlement when the specific mortgage pools are assigned. Total market value of TBA securities (excluding forward sales contracts, if any) amounts to $2,085,312 which represents approximately 1.9% of net assets as of December 31, 2017. |
| (f) | | Guaranteed by the United States Government. Total market value of these securities amounts to $1,524,371, which represents 1.4% of net assets as of December 31, 2017. |
| (g) | | Issued with a zero coupon. Income is recognized through the accretion of discount. |
| (h) | | Represents an affiliated issuer. |
| | |
| 32 | | The accompanying notes are an integral part of these financial statements. |
GOLDMAN SACHS VARIABLE INSURANCE TRUST CORE FIXED INCOME FUND
| | |
| Investment Abbreviations: |
| BA | | —Banker Acceptance Rate |
| BBR | | —Bank Bill Reference Rate |
| EURIBOR | | —Euro Interbank Offered Rate |
| FHLB | | —Federal Home Loan Bank |
| FHLMC | | —Federal Home Loan Mortgage Corp. |
| FNMA | | —Federal National Mortgage Association |
| GNMA | | —Government National Mortgage Association |
| GO | | —General Obligation |
| HICPXT | | —Harmonised Index of Consumer Prices excluding Tobacco |
| LIBOR | | —London Interbank Offered Rate |
| Mo. | | —Month |
| NIBOR | | —Norwegian Interbank Offered Rate |
| RB | | —Revenue Bond |
| REIT | | —Real Estate Investment Trust |
| REMIC | | —Real Estate Mortgage Investment Conduit |
| RMKT | | —Remarketed |
| STIBOR | | —Stockholm Interbank Offered Rate |
| STRIPS | | —Separate Trading of Registered Interest and Principal of Securities |
| TIPS | | —Treasury Inflation-Protected Securities |
| UK-RPI | | —United Kingdom Retail Price Index |
| Yr. | | —Year |
| Currency Abbreviations: |
| AUD | | —Australian Dollar |
| CAD | | —Canadian Dollar |
| CHF | | —Swiss Franc |
| EUR | | —Euro |
| GBP | | —British Pound |
| JPY | | —Japanese Yen |
| NOK | | —Norwegian Krone |
| NZD | | —New Zealand Dollar |
| SEK | | —Swedish Krona |
| USD | | —United States Dollar |
ADDITIONAL INVESTMENT INFORMATION
FORWARD FOREIGN CURRENCY EXCHANGE CONTRACTS — At December 31, 2017, the Fund had the following forward foreign currency exchange contracts:
FORWARD FOREIGN CURRENCY EXCHANGE CONTRACTS WITH UNREALIZED GAIN
| | | | | | | | | | | | | | | | | | | | |
| Counterparty | | Currency
Purchased | | | Currency
Sold | | | Current
Value | | | Settlement
Date | | | Unrealized
Gain | |
| Morgan Stanley Co., Inc. | | AUD | 478,000 | | | NZD | 525,675 | | | $ | 372,904 | | | | 03/21/2018 | | | $ | 719 | |
| | AUD | 201,659 | | | USD | 154,277 | | | | 157,344 | | | | 01/16/2018 | | | | 3,067 | |
| | AUD | 1,429,541 | | | USD | 1,089,883 | | | | 1,115,232 | | | | 03/21/2018 | | | | 25,349 | |
| | CAD | 258,925 | | | USD | 202,177 | | | | 206,042 | | | | 01/17/2018 | | | | 3,865 | |
| | CAD | 1,894,338 | | | USD | 1,480,494 | | | | 1,508,562 | | | | 03/21/2018 | | | | 28,068 | |
| | CHF | 496,112 | | | EUR | 423,791 | | | | 511,971 | | | | 03/21/2018 | | | | 1,113 | |
| | CHF | 38,628 | | | USD | 39,300 | | | | 39,863 | | | | 03/21/2018 | | | | 563 | |
| | EUR | 747,825 | | | CHF | 869,801 | | | | 901,467 | | | | 03/21/2018 | | | | 3,857 | |
| | EUR | 1,066,654 | | | GBP | 940,095 | | | | 1,285,798 | | | | 03/21/2018 | | | | 13,270 | |
| | EUR | 225,274 | | | JPY | 30,033,343 | | | | 271,574 | | | | 03/22/2018 | | | | 3,953 | |
| | EUR | 156,868 | | | NOK | 1,544,470 | | | | 189,098 | | | | 03/21/2018 | | | | 584 | |
| | EUR | 775,322 | | | USD | 924,177 | | | | 931,914 | | | | 01/31/2018 | | | | 7,737 | |
| | EUR | 629,543 | | | USD | 749,869 | | | | 758,884 | | | | 03/21/2018 | | | | 9,015 | |
| | GBP | 299,534 | | | USD | 393,825 | | | | 404,637 | | | | 01/19/2018 | | | | 10,812 | |
| | GBP | 596,268 | | | USD | 803,319 | | | | 807,122 | | | | 03/21/2018 | | | | 3,803 | |
| | JPY | 11,613,101 | | | USD | 102,475 | | | | 103,114 | | | | 01/12/2018 | | | | 639 | |
| | JPY | 140,074,585 | | | USD | 1,244,005 | | | | 1,248,178 | | | | 03/22/2018 | | | | 4,173 | |
| | NOK | 4,501,997 | | | EUR | 454,489 | | | | 549,499 | | | | 03/21/2018 | | | | 1,636 | |
| | NOK | 1,173,889 | | | USD | 141,904 | | | | 143,280 | | | | 03/21/2018 | | | | 1,376 | |
| | NZD | 3,730,031 | | | USD | 2,574,063 | | | | 2,640,913 | | | | 03/21/2018 | | | | 66,850 | |
| | SEK | 39,995,628 | | | EUR | 4,022,340 | | | | 4,898,709 | | | | 03/21/2018 | | | | 49,981 | |
| | SEK | 875,990 | | | USD | 104,361 | | | | 107,019 | | | | 02/06/2018 | | | | 2,658 | |
| | |
| The accompanying notes are an integral part of these financial statements. | | 33 |
GOLDMAN SACHS VARIABLE INSURANCE TRUST CORE FIXED INCOME FUND
Schedule of Investments (continued)
December 31, 2017
ADDITIONAL INVESTMENT INFORMATION (continued)
FORWARD FOREIGN CURRENCY EXCHANGE CONTRACTS WITH UNREALIZED GAIN (continued)
| | | | | | | | | | | | | | | | | | | | |
| Counterparty | | Currency
Purchased | | | Currency
Sold | | | Current
Value | | | Settlement
Date | | | Unrealized
Gain | |
| Morgan Stanley Co., Inc. (continued) | | SEK | 1,731,111 | | | USD | 206,559 | | | $ | 212,029 | | | | 03/21/2018 | | | $ | 5,470 | |
| | USD | 91,551 | | | AUD | 117,219 | | | | 91,446 | | | | 03/21/2018 | | | | 105 | |
| | USD | 83,991 | | | CAD | 105,220 | | | | 83,792 | | | | 03/21/2018 | | | | 199 | |
| | USD | 67,580 | | | EUR | 56,027 | | | | 67,538 | | | | 03/21/2018 | | | | 42 | |
| | USD | 110,166 | | | GBP | 81,317 | | | | 110,072 | | | | 03/21/2018 | | | | 94 | |
| | USD | 973,790 | | | JPY | 108,672,313 | | | | 968,358 | | | | 03/22/2018 | | | | 5,432 | |
| | | USD | 251,976 | | | NZD | 355,014 | | | | 251,355 | | | | 03/21/2018 | | | | 621 | |
| TOTAL | | | | | | | | | | | | | | | | | | $ | 255,051 | |
FORWARD FOREIGN CURRENCY EXCHANGE CONTRACTS WITH UNREALIZED LOSS
| | | | | | | | | | | | | | | | | | | | |
| Counterparty | | Currency
Purchased | | | Currency
Sold | | | Current
Value | | | Settlement
Date | | | Unrealized
Loss | |
| Morgan Stanley Co., Inc. | | CHF | 421,048 | | | EUR | 360,949 | | | $ | 434,510 | | | | 03/21/2018 | | | $ | (597 | ) |
| | EUR | 712,642 | | | CHF | 834,236 | | | | 859,054 | | | | 03/21/2018 | | | | (1,852 | ) |
| | EUR | 111,982 | | | NOK | 1,107,551 | | | | 134,989 | | | | 03/21/2018 | | | | (196 | ) |
| | EUR | 71,000 | | | NZD | 122,709 | | | | 85,587 | | | | 03/21/2018 | | | | (1,293 | ) |
| | EUR | 324,927 | | | SEK | 3,209,815 | | | | 391,684 | | | | 03/21/2018 | | | | (1,458 | ) |
| | GBP | 411,121 | | | EUR | 465,372 | | | | 556,502 | | | | 03/21/2018 | | | | (4,480 | ) |
| | GBP | 66,237 | | | USD | 89,780 | | | | 89,660 | | | | 03/21/2018 | | | | (120 | ) |
| | JPY | 19,210,172 | | | EUR | 143,280 | | | | 171,178 | | | | 03/22/2018 | | | | (1,550 | ) |
| | JPY | 126,068,380 | | | USD | 1,128,219 | | | | 1,123,370 | | | | 03/22/2018 | | | | (4,849 | ) |
| | NOK | 19,280,707 | | | EUR | 1,963,015 | | | | 2,353,340 | | | | 03/21/2018 | | | | (12,978 | ) |
| | NOK | 364,782 | | | SEK | 366,850 | | | | 44,524 | | | | 03/21/2018 | | | | (408 | ) |
| | USD | 125,065 | | | AUD | 163,475 | | | | 127,551 | | | | 01/16/2018 | | | | (2,486 | ) |
| | USD | 1,008,528 | | | AUD | 1,313,821 | | | | 1,024,955 | | | | 03/21/2018 | | | | (16,427 | ) |
| | USD | 193,142 | | | CAD | 247,355 | | | | 196,834 | | | | 01/17/2018 | | | | (3,692 | ) |
| | USD | 1,486,276 | | | CAD | 1,888,389 | | | | 1,503,823 | | | | 03/21/2018 | | | | (17,547 | ) |
| | USD | 192,667 | | | CHF | 189,006 | | | | 195,050 | | | | 03/21/2018 | | | | (2,383 | ) |
| | USD | 843,659 | | | EUR | 707,773 | | | | 850,722 | | | | 01/31/2018 | | | | (7,063 | ) |
| | USD | 1,296,862 | | | EUR | 1,091,540 | | | | 1,315,799 | | | | 03/21/2018 | | | | (18,937 | ) |
| | USD | 399,434 | | | GBP | 303,801 | | | | 410,400 | | | | 01/19/2018 | | | | (10,966 | ) |
| | USD | 309,817 | | | GBP | 229,635 | | | | 310,838 | | | | 03/21/2018 | | | | (1,021 | ) |
| | USD | 91,027 | | | JPY | 10,315,706 | | | | 91,595 | | | | 01/12/2018 | | | | (568 | ) |
| | USD | 4,430,959 | | | JPY | 499,693,656 | | | | 4,452,670 | | | | 03/22/2018 | | | | (21,711 | ) |
| | USD | 685,575 | | | NZD | 989,608 | | | | 700,657 | | | | 03/21/2018 | | | | (15,082 | ) |
| | USD | 97,991 | | | SEK | 822,514 | | | | 100,486 | | | | 02/06/2018 | | | | (2,495 | ) |
| | | USD | 192,542 | | | SEK | 1,597,110 | | | | 195,617 | | | | 03/21/2018 | | | | (3,075 | ) |
| TOTAL | | | | | | | | | | | | | | | | | | $ | (153,234 | ) |
| | |
| 34 | | The accompanying notes are an integral part of these financial statements. |
GOLDMAN SACHS VARIABLE INSURANCE TRUST CORE FIXED INCOME FUND
ADDITIONAL INVESTMENT INFORMATION (continued)
FORWARD SALES CONTRACTS — At December 31, 2017, the Fund had the following forward sales contracts:
| | | | | | | | | | | | | | | | | | | | |
| Description | | Interest
Rate | | | Maturity
Date(a) | | | Principal
Amount | | | Settlement
Date | | | Value | |
| FHLMC | | | 3.500 | % | | | TBA-30yr | | | $ | (1,000,000 | ) | | | 01/11/2018 | | | $ | (1,027,188 | ) |
FNMA | | | 3.500 | | | | TBA-30yr | | | | (1,000,000 | ) | | | 01/11/2018 | | | | (1,027,109 | ) |
| TOTAL (Proceeds Received: $2,052,969) | | | | | | | | | | | | | | | $ | (2,054,297 | ) |
| (a) | TBA (To Be Announced) Securities are sold on a forward commitment basis with an approximate principal amount and no defined maturity date. The actual principal and maturity date will be determined upon settlement when the specific mortgage pools are assigned. |
FUTURES CONTRACTS — At December 31, 2017, the Fund had the following futures contracts:
| | | | | | | | | | | | | | | | |
| Description | | Number of
Contracts | | | Expiration
Date | | | Notional
Amount
| | | Unrealized
Appreciation/ (Depreciation) | |
Long position contracts: | | | | | | | | | | | | | | | | |
| Australia 3 Year Bond | | | 1 | | | | 03/15/2018 | | | $ | 86,683 | | | $ | (1 | ) |
| U.S. Treasury 10 Year Ultra Note | | | 7 | | | | 03/20/2018 | | | | 934,938 | | | | (4,943 | ) |
| U.S. Treasury 2 Year Note | | | 48 | | | | 03/29/2018 | | | | 10,277,250 | | | | (16,412 | ) |
| U.S. Treasury 5 Year Note | | | 88 | | | | 03/29/2018 | | | | 10,222,437 | | | | (37,019 | ) |
| U.S. Treasury Long Bond | | | 19 | | | | 03/20/2018 | | | | 2,907,000 | | | | (4,442 | ) |
U.S. Treasury Ultra Bond | | | 3 | | | | 03/20/2018 | | | | 502,969 | | | | 5,401 | |
| Total | | | | | | | | | | | | | | $ | (57,416 | ) |
Short position contracts: | | | | | | | | | | | | | | | | |
U.S. Treasury 10 Year Note | | | (55 | ) | | | 03/20/2018 | | | | (6,822,578 | ) | | $ | 39,748 | |
| Total Futures Contracts | | | | | | | | | | | | | | $ | (17,668 | ) |
SWAP CONTRACTS — At December 31, 2017, the Fund had the following swap contracts:
CENTRALLY CLEARED INTEREST RATE SWAP CONTRACTS
| | | | | | | | | | | | | | | | | | | | |
| Payments Made by the Fund | | Payments
Received
by the Fund | | Termination
Date | | Notional
Amount (000’s) | | | Value | | | Upfront
Premium
(Received) Paid | | | Unrealized
Appreciation/
(Depreciation) | |
| 3 Month STIBOR(a) | | 0.050% | | 06/15/2018 | | SEK | 9,470 | | | $ | 3,539 | | | $ | 2,166 | | | $ | 1,373 | |
| 3 Month STIBOR(a) | | (0.330) | | 09/15/2018 | | | 9,950 | | | | 155 | | | | 36 | | | | 119 | |
| 3 Month BA(b) | | 1.000 | | 03/21/2019 | | CAD | 320 | (c) | | | (2,465 | ) | | | (2,471 | ) | | | 6 | |
| 3 Month STIBOR(a) | | (0.100) | | 06/29/2019 | | SEK | 19,490 | (c) | | | 2,007 | | | | (331 | ) | | | 2,338 | |
| 2.000%(a) | | 3 Month BBR | | 03/21/2020 | | AUD | 1,640 | (c) | | | 1,596 | | | | (958 | ) | | | 2,554 | |
| 3 Month BA(b) | | 1.250 | | 03/21/2020 | | CAD | 2,750 | (c) | | | (38,310 | ) | | | (29,356 | ) | | | (8,954 | ) |
| 6 Month LIBOR(b) | | 0.750 | | 03/21/2020 | | GBP | 3,490 | (c) | | | (8,102 | ) | | | (14,826 | ) | | | 6,724 | |
| 2.250(b) | | 3 Month BBR | | 03/21/2020 | | NZD | 3,260 | (c) | | | 1,936 | | | | (152 | ) | | | 2,088 | |
| 3 Month LIBOR(a) | | 1.750 | | 03/21/2020 | | USD | 1,260 | (c) | | | (9,710 | ) | | | (8,294 | ) | | | (1,416 | ) |
| 3 Month LIBOR(a) | | 2.139 | | 11/20/2020 | | | 3,220 | (c) | | | (9,200 | ) | | | (2,902 | ) | | | (6,298 | ) |
| 0.250(d) | | 3 Month STIBOR | | 03/21/2021 | | SEK | 1,520 | (c) | | | (487 | ) | | | (469 | ) | | | (18 | ) |
| | |
| The accompanying notes are an integral part of these financial statements. | | 35 |
GOLDMAN SACHS VARIABLE INSURANCE TRUST CORE FIXED INCOME FUND
Schedule of Investments (continued)
December 31, 2017
ADDITIONAL INVESTMENT INFORMATION (continued)
CENTRALLY CLEARED INTEREST RATE SWAP CONTRACTS (continued)
| | | | | | | | | | | | | | | | | | | | | | | | |
| Payments Made by the Fund | | Payments
Received
by the Fund | | | Termination
Date | | | Notional
Amount (000’s) | | | Value | | | Upfront
Premium
(Received) Paid | | | Unrealized
Appreciation/
(Depreciation) | |
| 6 Month EURIBOR(b) | | | 0.350 % | | | | 12/16/2021 | | | EUR | 2,270 | (c) | | $ | (6,991 | ) | | $ | (1,777 | ) | | $ | (5,214 | ) |
| 0.500(d) | | | 3 Month STIBOR | | | | 12/16/2021 | | | SEK | 14,150 | (c) | | | 7,602 | | | | 4,230 | | | | 3,372 | |
| 3 Month BA(b) | | | 1.500 | | | | 03/21/2023 | | | CAD | 440 | (c) | | | (13,135 | ) | | | (10,727 | ) | | | (2,408 | ) |
| 0.250(d) | | | 6 Month EURIBOR | | | | 03/21/2023 | | | EUR | 1,740 | (c) | | | 12,711 | | | | 1,775 | | | | 10,936 | |
| 6 Month LIBOR(b) | | | 1.000 | | | | 03/21/2023 | | | GBP | 90 | (c) | | | (404 | ) | | | (841 | ) | | | 437 | |
| 1.500(d) | | | 6 Month NIBOR | | | | 03/21/2023 | | | NOK | 6,440 | (c) | | | 3,574 | | | | (1,396 | ) | | | 4,970 | |
| 0.500(d) | | | 3 Month STIBOR | | | | 03/21/2023 | | | SEK | 4,830 | (c) | | | 2,199 | | | | (1,145 | ) | | | 3,344 | |
| 3 Month LIBOR(a) | | | 2.000 | | | | 03/21/2023 | | | USD | 290 | (c) | | | (3,791 | ) | | | (3,185 | ) | | | (606 | ) |
| 2.143(b) | | | 3 Month LIBOR | | | | 07/03/2023 | | | | 250 | (c) | | | 2,022 | | | | (415 | ) | | | 2,437 | |
| 2.275(b) | | | 3 Month LIBOR | | | | 11/20/2023 | | | | 1,430 | (c) | | | 5,099 | | | | 1,611 | | | | 3,488 | |
| 6 Month LIBOR(b) | | | 1.200 | | | | 11/21/2023 | | | GBP | 500 | (c) | | | 1,121 | | | | (286 | ) | | | 1,407 | |
| 6 Month EURIBOR(b) | | | 1.330 | | | | 01/12/2027 | | | EUR | 340 | (c) | | | 712 | | | | (2,931 | ) | | | 3,643 | |
| 6 Month LIBOR(b) | | | 1.600 | | | | 03/16/2027 | | | GBP | 1,670 | (c) | | | 12,931 | | | | 10,195 | | | | 2,736 | |
| 1.500(d) | | | 6 Month EURIBOR | | | | 08/31/2027 | | | EUR | 310 | (c) | | | (1,586 | ) | | | (519 | ) | | | (1,067 | ) |
| 3 Month LIBOR(a) | | | 2.400 | | | | 08/31/2027 | | | USD | 350 | (c) | | | (2,126 | ) | | | (401 | ) | | | (1,725 | ) |
| 6 Month EURIBOR(b) | | | 1.600 | | | | 10/25/2027 | | | EUR | 590 | (c) | | | 5,445 | | | | 2,744 | | | | 2,701 | |
| 2.000(d) | | | 3 Month STIBOR | | | | 10/25/2027 | | | SEK | 5,440 | (c) | | | (2,649 | ) | | | (220 | ) | | | (2,429 | ) |
| 2.000(d) | | | 3 Month STIBOR | | | | 11/02/2027 | | | | 3,850 | (c) | | | (1,788 | ) | | | 179 | | | | (1,967 | ) |
| 6 Month EURIBOR(b) | �� | | 1.500 | | | | 12/19/2027 | | | EUR | 690 | (c) | | | 1,309 | | | | 2,685 | | | | (1,376 | ) |
| 2.750(b) | | | 6 Month BBR | | | | 03/21/2028 | | | AUD | 650 | (c) | | | 3,691 | | | | 2,603 | | | | 1,088 | |
| 3 Month BA(b) | | | 1.750 | | | | 03/21/2028 | | | CAD | 1,550 | (c) | | | (74,692 | ) | | | (64,538 | ) | | | (10,154 | ) |
| 6 Month EURIBOR(b) | | | 1.000 | | | | 03/21/2028 | | | EUR | 1,010 | (c) | | | 8,403 | | | | 15,865 | | | | (7,462 | ) |
| 1.250(b) | | | 6 Month LIBOR | | | | 03/21/2028 | | | GBP | 720 | (c) | | | 4,614 | | | | 10,464 | | | | (5,850 | ) |
| 0.250(b) | | | 6 Month LIBOR | | | | 03/21/2028 | | | JPY | 62,750 | (c) | | | 5,191 | | | | 4,006 | | | | 1,185 | |
| 3 Month LIBOR(a) | | | 2.250 | | | | 03/21/2028 | | | USD | 530 | (c) | | | (7,966 | ) | | | (6,297 | ) | | | (1,669 | ) |
| 3 Month LIBOR(a) | | | 2.378 | | | | 07/03/2028 | | | | 940 | (c) | | | (5,569 | ) | | | 15 | | | | (5,584 | ) |
| 1.400(b) | | | 6 Month LIBOR | | | | 11/21/2028 | | | GBP | 300 | (c) | | | (1,158 | ) | | | 728 | | | | (1,886 | ) |
| 1.940(b) | | | 6 Month LIBOR | | | | 01/11/2032 | | | | 260 | (c) | | | (3,809 | ) | | | (56 | ) | | | (3,753 | ) |
| 1.500(b) | | | 6 Month LIBOR | | | | 03/21/2033 | | | | 580 | (c) | | | (8,168 | ) | | | (2,377 | ) | | | (5,791 | ) |
| 1.750(b) | | | 6 Month LIBOR | | | | 03/17/2037 | | | | 1,160 | (c) | | | (10,427 | ) | | | (2,708 | ) | | | (7,719 | ) |
| 1.750(b) | | | 6 Month LIBOR | | | | 12/14/2037 | | | | 350 | (c) | | | (3,489 | ) | | | (2,860 | ) | | | (629 | ) |
2.560(b) | | | 3 Month LIBOR | | | | 07/03/2048 | | | USD | 390 | (c) | | | (656 | ) | | | 14 | | | | (670 | ) |
| TOTAL | | | | | | | | | | | | | | $ | (130,821 | ) | | $ | (103,122 | ) | | $ | (27,699 | ) |
| (a) | Payments made quarterly. |
| (b) | Payments made semi-annually. |
| (c) | Represents forward starting interest rate swaps whose effective dates of commencement of accruals and cash flows occur subsequent to December 31, 2017. |
| (d) | Payments made annually. |
| | |
| 36 | | The accompanying notes are an integral part of these financial statements. |
GOLDMAN SACHS VARIABLE INSURANCE TRUST CORE FIXED INCOME FUND
ADDITIONAL INVESTMENT INFORMATION (continued)
CENTRALLY CLEARED INFLATION-LINKED SWAP CONTRACTS
| | | | | | | | | | | | | | | | | | | | | | | | |
Payments Made by the Fund(a) | | Payments
Received
by the
Fund | | | Termination
Date | | | Notional
Amount (000’s) | | | Value | | | Upfront
Premium
(Received) Paid | | | Unrealized
Appreciation/
(Depreciation) | |
| 1 Month UK-RPI | | | 3.370% | | | | 07/15/2022 | | | GBP | 280 | | | $ | 502 | | | $ | 11 | | | $ | 491 | |
1 Month HICPXT | | | 1.600 | | | | 08/15/2032 | | | EUR | 230 | | | | (5,307 | ) | | | 6 | | | | (5,313 | ) |
| TOTAL | | | | | | | | | | | | | | $ | (4,805 | ) | | $ | 17 | | | $ | (4,822 | ) |
| (a) | Payments made at termination date. |
PURCHASED OPTIONS CONTRACTS — At December 31, 2017, the Fund had the following purchased options contracts:
| | | | | | | | | | | | | | | | | | | | | | | | | | | | | | | | |
| Description | | Counterparty | | | Exercise
Price | | | Expiration
Date | | | Number of
Contracts | | | Notional
Amount | | | Market Value | | | Premiums
Paid
(Received) by the Fund | | | Unrealized Appreciation/ (Depreciation) | |
Purchased option contracts: | | | | | | | | | | | | | | | | | | | | | | | | | | | | | | | | |
Puts | | | | | | | | | | | | | | | | | | | | | | | | | | | | | | | | |
| Mid-Curve 1-Year Eurodollar | | | Bank of America Merrill Lynch | | | | 98.00 USD | | | | 06/15/2018 | | | USD | 4 | | | | 1,000,000 | | | $ | 3,075 | | | $ | 1,109 | | | $ | 1,966 | |
| | |
| The accompanying notes are an integral part of these financial statements. | | 37 |
GOLDMAN SACHS VARIABLE INSURANCE TRUST EQUITY INDEX FUND
Schedule of Investments
December 31, 2017
| | | | | | | | |
| Shares | | | Description | | Value | |
| | Common Stocks – 99.2% | |
| | Automobiles & Components – 0.7% | |
| | 2,077 | | | Aptiv plc | | $ | 176,192 | |
| | 1,556 | | | BorgWarner, Inc. | | | 79,496 | |
| | 30,233 | | | Ford Motor Co. | | | 377,610 | |
| | 9,919 | | | General Motors Co. | | | 406,580 | |
| | 1,969 | | | Goodyear Tire & Rubber Co. (The) | | | 63,618 | |
| | 1,380 | | | Harley-Davidson, Inc. | | | 70,215 | |
| | | | | | | | |
| | | | | | | 1,173,711 | |
| | |
| | Banks – 6.5% | | | | |
| | 75,564 | | | Bank of America Corp. | | | 2,230,649 | |
| | 6,107 | | | BB&T Corp. | | | 303,640 | |
| | 20,562 | | | Citigroup, Inc. | | | 1,530,018 | |
| | 3,888 | | | Citizens Financial Group, Inc. | | | 163,218 | |
| | 1,334 | | | Comerica, Inc. | | | 115,805 | |
| | 5,422 | | | Fifth Third Bancorp | | | 164,504 | |
| | 8,596 | | | Huntington Bancshares, Inc. | | | 125,158 | |
| | 27,036 | | | JPMorgan Chase & Co. | | | 2,891,230 | |
| | 8,480 | | | KeyCorp | | | 171,042 | |
| | 1,177 | | | M&T Bank Corp. | | | 201,255 | |
| | 2,617 | | | People’s United Financial, Inc. | | | 48,938 | |
| | 3,692 | | | PNC Financial Services Group, Inc. (The) | | | 532,719 | |
| | 8,903 | | | Regions Financial Corp. | | | 153,844 | |
| | 3,760 | | | SunTrust Banks, Inc. | | | 242,858 | |
| | 12,262 | | | US Bancorp | | | 656,998 | |
| | 34,520 | | | Wells Fargo & Co. | | | 2,094,328 | |
| | 1,582 | | | Zions Bancorp | | | 80,413 | |
| | | | | | | | |
| | | | | | | 11,706,617 | |
| | |
| | Capital Goods – 7.3% | | | | |
| | 4,639 | | | 3M Co. | | | 1,091,881 | |
| | 343 | | | Acuity Brands, Inc. | | | 60,368 | |
| | 740 | | | Allegion plc | | | 58,874 | |
| | 1,824 | | | AMETEK, Inc. | | | 132,185 | |
| | 1,186 | | | AO Smith Corp. | | | 72,678 | |
| | 2,985 | | | Arconic, Inc. | | | 81,341 | |
| | 4,342 | | | Boeing Co. (The) | | | 1,280,499 | |
| | 4,600 | | | Caterpillar, Inc. | | | 724,868 | |
| | 1,203 | | | Cummins, Inc. | | | 212,498 | |
| | 2,493 | | | Deere & Co. | | | 390,179 | |
| | 1,236 | | | Dover Corp. | | | 124,824 | |
| | 3,402 | | | Eaton Corp. plc | | | 268,792 | |
| | 5,041 | | | Emerson Electric Co. | | | 351,307 | |
| | 2,214 | | | Fastenal Co. | | | 121,084 | |
| | 1,025 | | | Flowserve Corp. | | | 43,183 | |
| | 1,113 | | | Fluor Corp. | | | 57,486 | |
| | 2,362 | | | Fortive Corp. | | | 170,891 | |
| | 1,257 | | | Fortune Brands Home & Security, Inc. | | | 86,029 | |
| | 2,168 | | | General Dynamics Corp. | | | 441,080 | |
| | 67,661 | | | General Electric Co. | | | 1,180,684 | |
| | 5,924 | | | Honeywell International, Inc. | | | 908,505 | |
| | 2,390 | | | Illinois Tool Works, Inc. | | | 398,772 | |
| | 1,972 | | | Ingersoll-Rand plc | | | 175,883 | |
| | 903 | | | Jacobs Engineering Group, Inc. | | | 59,562 | |
| | 7,158 | | | Johnson Controls International plc | | | 272,791 | |
| | 613 | | | L3 Technologies, Inc. | | | 121,282 | |
| | |
| | Common Stocks – (continued) | |
| | Capital Goods – (continued) | |
| | 1,940 | | | Lockheed Martin Corp. | | $ | 622,837 | |
| | 2,528 | | | Masco Corp. | | | 111,080 | |
| | 1,368 | | | Northrop Grumman Corp. | | | 419,853 | |
| | 2,759 | | | PACCAR, Inc. | | | 196,110 | |
| | 1,026 | | | Parker-Hannifin Corp. | | | 204,769 | |
| | 1,321 | | | Pentair plc | | | 93,289 | |
| | 1,227 | | | Quanta Services, Inc.* | | | 47,988 | |
| | 2,240 | | | Raytheon Co. | | | 420,784 | |
| | 998 | | | Rockwell Automation, Inc. | | | 195,957 | |
| | 1,288 | | | Rockwell Collins, Inc. | | | 174,679 | |
| | 812 | | | Roper Technologies, Inc. | | | 210,308 | |
| | 436 | | | Snap-on, Inc. | | | 75,995 | |
| | 1,213 | | | Stanley Black & Decker, Inc. | | | 205,834 | |
| | 2,020 | | | Textron, Inc. | | | 114,312 | |
| | 373 | | | TransDigm Group, Inc. | | | 102,433 | |
| | 647 | | | United Rentals, Inc.* | | | 111,226 | |
| | 5,808 | | | United Technologies Corp. | | | 740,927 | |
| | 415 | | | WW Grainger, Inc. | | | 98,044 | |
| | 1,425 | | | Xylem, Inc. | | | 97,185 | |
| | | | | | | | |
| | | | | | | 13,131,136 | |
| | |
| | Commercial & Professional Services – 0.6% | | | | |
| | 653 | | | Cintas Corp. | | | 101,757 | |
| | 957 | | | Equifax, Inc. | | | 112,849 | |
| | 2,597 | | | IHS Markit Ltd.* | | | 117,255 | |
| | 2,557 | | | Nielsen Holdings plc | | | 93,075 | |
| | 1,762 | | | Republic Services, Inc. | | | 119,129 | |
| | 1,037 | | | Robert Half International, Inc. | | | 57,595 | |
| | 647 | | | Stericycle, Inc.* | | | 43,989 | |
| | 1,243 | | | Verisk Analytics, Inc.* | | | 119,328 | |
| | 3,151 | | | Waste Management, Inc. | | | 271,931 | |
| | | | | | | | |
| | | | | | | 1,036,908 | |
| | |
| | Consumer Durables & Apparel – 1.2% | | | | |
| | 2,680 | | | DR Horton, Inc. | | | 136,868 | |
| | 923 | | | Garmin Ltd. | | | 54,983 | |
| | 3,009 | | | Hanesbrands, Inc. | | | 62,918 | |
| | 886 | | | Hasbro, Inc. | | | 80,528 | |
| | 1,075 | | | Leggett & Platt, Inc. | | | 51,310 | |
| | 1,593 | | | Lennar Corp. Class A | | | 100,741 | |
| | 2,776 | | | Mattel, Inc. | | | 42,695 | |
| | 1,146 | | | Michael Kors Holdings Ltd.* | | | 72,141 | |
| | 498 | | | Mohawk Industries, Inc.* | | | 137,398 | |
| | 3,891 | | | Newell Brands, Inc. | | | 120,232 | |
| | 10,247 | | | NIKE, Inc. Class B | | | 640,950 | |
| | 2,176 | | | PulteGroup, Inc. | | | 72,352 | |
| | 625 | | | PVH Corp. | | | 85,756 | |
| | 413 | | | Ralph Lauren Corp. | | | 42,824 | |
| | 2,290 | | | Tapestry, Inc. | | | 101,287 | |
| | 1,605 | | | Under Armour, Inc. Class A*(a) | | | 23,160 | |
| | 1,616 | | | Under Armour, Inc. Class C*(a) | | | 21,525 | |
| | 2,570 | | | VF Corp. | | | 190,180 | |
| | 545 | | | Whirlpool Corp. | | | 91,909 | |
| | | | | | | | |
| | | | | | | 2,129,757 | |
| | |
| | |
| 38 | | The accompanying notes are an integral part of these financial statements. |
GOLDMAN SACHS VARIABLE INSURANCE TRUST EQUITY INDEX FUND
| | | | | | | | |
| Shares | | | Description | | Value | |
| | Common Stocks – (continued) | |
| | Consumer Services – 1.9% | |
| | 3,199 | | | Carnival Corp. | | $ | 212,318 | |
| | 191 | | | Chipotle Mexican Grill, Inc.* | | | 55,205 | |
| | 1,000 | | | Darden Restaurants, Inc. | | | 96,020 | |
| | 1,623 | | | H&R Block, Inc. | | | 42,555 | |
| | 1,572 | | | Hilton Worldwide Holdings, Inc. | | | 125,540 | |
| | 2,371 | | | Marriott International, Inc. Class A | | | 321,816 | |
| | 6,225 | | | McDonald’s Corp. | | | 1,071,447 | |
| | 3,888 | | | MGM Resorts International | | | 129,820 | |
| | 1,409 | | | Norwegian Cruise Line Holdings Ltd.* | | | 75,029 | |
| | 1,323 | | | Royal Caribbean Cruises Ltd. | | | 157,807 | |
| | 11,064 | | | Starbucks Corp. | | | 635,406 | |
| | 774 | | | Wyndham Worldwide Corp. | | | 89,683 | |
| | 612 | | | Wynn Resorts Ltd. | | | 103,177 | |
| | 2,660 | | | Yum Brands, Inc. | | | 217,083 | |
| | | | | | | | |
| | | | | | | 3,332,906 | |
| | |
| | Diversified Financials – 5.5% | |
| | 424 | | | Affiliated Managers Group, Inc. | | | 87,026 | |
| | 5,599 | | | American Express Co. | | | 556,037 | |
| | 1,168 | | | Ameriprise Financial, Inc. | | | 197,941 | |
| | 8,025 | | | Bank of New York Mellon Corp. (The) | | | 432,227 | |
| | 14,974 | | | Berkshire Hathaway, Inc. Class B* | | | 2,968,146 | |
| | 958 | | | BlackRock, Inc. | | | 492,134 | |
| | 3,793 | | | Capital One Financial Corp. | | | 377,707 | |
| | 896 | | | Cboe Global Markets, Inc. | | | 111,633 | |
| | 9,261 | | | Charles Schwab Corp. (The) | | | 475,738 | |
| | 2,660 | | | CME Group, Inc. | | | 388,493 | |
| | 2,802 | | | Discover Financial Services | | | 215,530 | |
| | 2,106 | | | E*TRADE Financial Corp.* | | | 104,394 | |
| | 2,549 | | | Franklin Resources, Inc. | | | 110,448 | |
| | 2,736 | | | Goldman Sachs Group, Inc. (The)(b) | | | 697,023 | |
| | 4,524 | | | Intercontinental Exchange, Inc. | | | 319,213 | |
| | 3,275 | | | Invesco Ltd. | | | 119,669 | |
| | 2,395 | | | Leucadia National Corp. | | | 63,444 | |
| | 1,289 | | | Moody’s Corp. | | | 190,269 | |
| | 10,820 | | | Morgan Stanley | | | 567,725 | |
| | 905 | | | Nasdaq, Inc. | | | 69,531 | |
| | 2,165 | | | Navient Corp. | | | 28,838 | |
| | 1,663 | | | Northern Trust Corp. | | | 166,117 | |
| | 993 | | | Raymond James Financial, Inc. | | | 88,675 | |
| | 1,975 | | | S&P Global, Inc. | | | 334,565 | |
| | 2,789 | | | State Street Corp. | | | 272,234 | |
| | 5,682 | | | Synchrony Financial | | | 219,382 | |
| | 1,872 | | | T. Rowe Price Group, Inc. | | | 196,429 | |
| | | | | | | | |
| | | | | | | 9,850,568 | |
| | |
| | Energy – 6.0% | |
| | 4,217 | | | Anadarko Petroleum Corp. | | | 226,200 | |
| | 1,123 | | | Andeavor | | | 128,404 | |
| | 3,059 | | | Apache Corp. | | | 129,151 | |
| | 3,460 | | | Baker Hughes a GE Co. | | | 109,474 | |
| | 3,676 | | | Cabot Oil & Gas Corp. | | | 105,134 | |
| | 5,166 | | | Chesapeake Energy Corp.* | | | 20,457 | |
| | 14,786 | | | Chevron Corp. | | | 1,851,059 | |
| | 760 | | | Cimarex Energy Co. | | | 92,728 | |
| | 1,139 | | | Concho Resources, Inc.* | | | 171,101 | |
| | |
| | Common Stocks – (continued) | |
| | Energy – (continued) | |
| | 9,284 | | | ConocoPhillips | | $ | 509,599 | |
| | 4,184 | | | Devon Energy Corp. | | | 173,218 | |
| | 4,537 | | | EOG Resources, Inc. | | | 489,588 | |
| | 1,888 | | | EQT Corp. | | | 107,465 | |
| | 33,014 | | | Exxon Mobil Corp. | | | 2,761,291 | |
| | 6,848 | | | Halliburton Co. | | | 334,662 | |
| | 897 | | | Helmerich & Payne, Inc.(a) | | | 57,982 | |
| | 2,186 | | | Hess Corp. | | | 103,769 | |
| | 14,884 | | | Kinder Morgan, Inc. | | | 268,954 | |
| | 6,824 | | | Marathon Oil Corp. | | | 115,530 | |
| | 3,773 | | | Marathon Petroleum Corp. | | | 248,943 | |
| | 2,909 | | | National Oilwell Varco, Inc. | | | 104,782 | |
| | 1,619 | | | Newfield Exploration Co.* | | | 51,047 | |
| | 3,593 | | | Noble Energy, Inc. | | | 104,700 | |
| | 5,950 | | | Occidental Petroleum Corp. | | | 438,277 | |
| | 2,965 | | | ONEOK, Inc. | | | 158,479 | |
| | 3,328 | | | Phillips 66 | | | 336,627 | |
| | 1,315 | | | Pioneer Natural Resources Co. | | | 227,298 | |
| | 1,521 | | | Range Resources Corp. | | | 25,948 | |
| | 10,775 | | | Schlumberger Ltd. | | | 726,127 | |
| | 3,395 | | | TechnipFMC plc | | | 106,297 | |
| | 3,383 | | | Valero Energy Corp. | | | 310,931 | |
| | 6,532 | | | Williams Cos., Inc. (The) | | | 199,161 | |
| | | | | | | | |
| | | | | | | 10,794,383 | |
| | |
| | Food & Staples Retailing – 1.8% | |
| | 3,421 | | | Costco Wholesale Corp. | | | 636,717 | |
| | 7,943 | | | CVS Health Corp. | | | 575,867 | |
| | 7,004 | | | Kroger Co. (The) | | | 192,260 | |
| | 3,781 | | | Sysco Corp. | | | 229,620 | |
| | 6,799 | | | Walgreens Boots Alliance, Inc. | | | 493,743 | |
| | 11,437 | | | Wal-Mart Stores, Inc. | | | 1,129,404 | |
| | | | | | | | |
| | | | | | | 3,257,611 | |
| | |
| | Food, Beverage & Tobacco – 4.5% | |
| | 14,845 | | | Altria Group, Inc. | | | 1,060,081 | |
| | 4,375 | | | Archer-Daniels-Midland Co. | | | 175,350 | |
| | 1,436 | | | Brown-Forman Corp. Class B | | | 98,610 | |
| | 1,507 | | | Campbell Soup Co. | | | 72,502 | |
| | 29,939 | | | Coca-Cola Co. (The) | | | 1,373,601 | |
| | 3,225 | | | Conagra Brands, Inc. | | | 121,486 | |
| | 1,342 | | | Constellation Brands, Inc. Class A | | | 306,741 | |
| | 1,399 | | | Dr Pepper Snapple Group, Inc. | | | 135,787 | |
| | 4,494 | | | General Mills, Inc. | | | 266,449 | |
| | 1,108 | | | Hershey Co. (The) | | | 125,769 | |
| | 2,176 | | | Hormel Foods Corp. | | | 79,185 | |
| | 878 | | | JM Smucker Co. (The) | | | 109,083 | |
| | 1,911 | | | Kellogg Co. | | | 129,910 | |
| | 4,698 | | | Kraft Heinz Co. (The) | | | 365,316 | |
| | 926 | | | McCormick & Co., Inc. (Non-Voting) | | | 94,369 | |
| | 1,484 | | | Molson Coors Brewing Co. Class B | | | 121,792 | |
| | 11,607 | | | Mondelez International, Inc. Class A | | | 496,780 | |
| | 3,219 | | | Monster Beverage Corp.* | | | 203,730 | |
| | 11,083 | | | PepsiCo, Inc. | | | 1,329,073 | |
| | 12,112 | | | Philip Morris International, Inc. | | | 1,279,633 | |
| | |
| | |
| The accompanying notes are an integral part of these financial statements. | | 39 |
GOLDMAN SACHS VARIABLE INSURANCE TRUST EQUITY INDEX FUND
Schedule of Investments (continued)
December 31, 2017
| | | | | | | | |
| Shares | | | Description | | Value | |
| | Common Stocks – (continued) | |
| | Food, Beverage & Tobacco – (continued) | |
| | 2,228 | | | Tyson Foods, Inc. Class A | | $ | 180,624 | |
| | | | | | | | |
| | | | | | | 8,125,871 | |
| | |
| | Health Care Equipment & Services – 5.5% | |
| | 13,521 | | | Abbott Laboratories | | | 771,643 | |
| | 2,531 | | | Aetna, Inc. | | | 456,567 | |
| | 560 | | | Align Technology, Inc.* | | | 124,426 | |
| | 1,249 | | | AmerisourceBergen Corp. | | | 114,683 | |
| | 1,998 | | | Anthem, Inc. | | | 449,570 | |
| | 3,898 | | | Baxter International, Inc. | | | 251,967 | |
| | 2,068 | | | Becton Dickinson and Co. | | | 442,644 | |
| | 10,667 | | | Boston Scientific Corp.* | | | 264,435 | |
| | 2,492 | | | Cardinal Health, Inc. | | | 152,685 | |
| | 1,321 | | | Centene Corp.* | | | 133,262 | |
| | 2,394 | | | Cerner Corp.* | | | 161,332 | |
| | 1,917 | | | Cigna Corp. | | | 389,324 | |
| | 395 | | | Cooper Cos., Inc. (The) | | | 86,063 | |
| | 4,790 | | | Danaher Corp. | | | 444,608 | |
| | 1,218 | | | DaVita, Inc.* | | | 88,000 | |
| | 1,815 | | | DENTSPLY SIRONA, Inc. | | | 119,481 | |
| | 1,627 | | | Edwards Lifesciences Corp.* | | | 183,379 | |
| | 912 | | | Envision Healthcare Corp.* | | | 31,519 | |
| | 4,386 | | | Express Scripts Holding Co.* | | | 327,371 | |
| | 2,182 | | | HCA Healthcare, Inc.* | | | 191,667 | |
| | 1,242 | | | Henry Schein, Inc.* | | | 86,791 | |
| | 2,080 | | | Hologic, Inc.* | | | 88,920 | |
| | 1,105 | | | Humana, Inc. | | | 274,117 | |
| | 670 | | | IDEXX Laboratories, Inc.* | | | 104,775 | |
| | 879 | | | Intuitive Surgical, Inc.* | | | 320,782 | |
| | 803 | | | Laboratory Corp. of America Holdings* | | | 128,087 | |
| | 1,640 | | | McKesson Corp. | | | 255,758 | |
| | 10,553 | | | Medtronic plc | | | 852,155 | |
| | 642 | | | Patterson Cos., Inc. | | | 23,195 | |
| | 1,088 | | | Quest Diagnostics, Inc. | | | 107,157 | |
| | 1,142 | | | ResMed, Inc. | | | 96,716 | |
| | 2,483 | | | Stryker Corp. | | | 384,468 | |
| | 7,544 | | | UnitedHealth Group, Inc. | | | 1,663,150 | |
| | 668 | | | Universal Health Services, Inc. Class B | | | 75,718 | |
| | 711 | | | Varian Medical Systems, Inc.* | | | 79,028 | |
| | 1,572 | | | Zimmer Biomet Holdings, Inc. | | | 189,693 | |
| | | | | | | | |
| | | | | | | 9,915,136 | |
| | |
| | Household & Personal Products – 1.8% | |
| | 1,894 | | | Church & Dwight Co., Inc. | | | 95,022 | |
| | 990 | | | Clorox Co. (The) | | | 147,253 | |
| | 6,812 | | | Colgate-Palmolive Co. | | | 513,965 | |
| | 3,784 | | | Coty, Inc. Class A | | | 75,264 | |
| | 1,767 | | | Estee Lauder Cos., Inc. (The) Class A | | | 224,833 | |
| | 2,770 | | | Kimberly-Clark Corp. | | | 334,228 | |
| | 19,843 | | | Procter & Gamble Co. (The) | | | 1,823,175 | |
| | | | | | | | |
| | | | | | | 3,213,740 | |
| | |
| | Insurance – 2.6% | |
| | 3,035 | | | Aflac, Inc. | | | 266,412 | |
| | 2,777 | | | Allstate Corp. (The) | | | 290,780 | |
| | 6,962 | | | American International Group, Inc. | | | 414,796 | |
| | |
| | Common Stocks – (continued) | |
| | Insurance – (continued) | |
| | 1,932 | | | Aon plc | | $ | 258,888 | |
| | 1,466 | | | Arthur J Gallagher & Co. | | | 92,769 | |
| | 397 | | | Assurant, Inc. | | | 40,034 | |
| | 795 | | | Brighthouse Financial, Inc.* | | | 46,619 | |
| | 3,602 | | | Chubb Ltd. | | | 526,360 | |
| | 1,136 | | | Cincinnati Financial Corp. | | | 85,166 | |
| | 335 | | | Everest Re Group Ltd. | | | 74,122 | |
| | 2,737 | | | Hartford Financial Services Group, Inc. (The) | | | 154,038 | |
| | 1,712 | | | Lincoln National Corp. | | | 131,601 | |
| | 2,121 | | | Loews Corp. | | | 106,114 | |
| | 4,009 | | | Marsh & McLennan Cos., Inc. | | | 326,293 | |
| | 8,275 | | | MetLife, Inc. | | | 418,384 | |
| | 2,104 | | | Principal Financial Group, Inc. | | | 148,458 | |
| | 4,601 | | | Progressive Corp. (The) | | | 259,128 | |
| | 3,286 | | | Prudential Financial, Inc. | | | 377,824 | |
| | 821 | | | Torchmark Corp. | | | 74,473 | |
| | 2,115 | | | Travelers Cos., Inc. (The) | | | 286,879 | |
| | 1,797 | | | Unum Group | | | 98,637 | |
| | 1,018 | | | Willis Towers Watson plc | | | 153,402 | |
| | 2,055 | | | XL Group Ltd. | | | 72,254 | |
| | | | | | | | |
| | | | | | | 4,703,431 | |
| | |
| | Materials – 3.0% | |
| | 1,710 | | | Air Products & Chemicals, Inc. | | | 280,577 | |
| | 874 | | | Albemarle Corp. | | | 111,776 | |
| | 688 | | | Avery Dennison Corp. | | | 79,024 | |
| | 2,742 | | | Ball Corp. | | | 103,785 | |
| | 1,827 | | | CF Industries Holdings, Inc. | | | 77,721 | |
| | 18,195 | | | DowDuPont, Inc. | | | 1,295,848 | |
| | 1,141 | | | Eastman Chemical Co. | | | 105,702 | |
| | 2,048 | | | Ecolab, Inc. | | | 274,801 | |
| | 1,065 | | | FMC Corp. | | | 100,813 | |
| | 10,104 | | | Freeport-McMoRan, Inc.* | | | 191,572 | |
| | 604 | | | International Flavors & Fragrances, Inc. | | | 92,176 | |
| | 3,184 | | | International Paper Co. | | | 184,481 | |
| | 2,547 | | | LyondellBasell Industries NV Class A | | | 280,985 | |
| | 481 | | | Martin Marietta Materials, Inc. | | | 106,320 | |
| | 3,426 | | | Monsanto Co. | | | 400,088 | |
| | 2,830 | | | Mosaic Co. (The) | | | 72,618 | |
| | 4,246 | | | Newmont Mining Corp. | | | 159,310 | |
| | 2,447 | | | Nucor Corp. | | | 155,580 | |
| | 759 | | | Packaging Corp. of America | | | 91,497 | |
| | 2,000 | | | PPG Industries, Inc. | | | 233,640 | |
| | 2,218 | | | Praxair, Inc. | | | 343,080 | |
| | 1,440 | | | Sealed Air Corp. | | | 70,992 | |
| | 636 | | | Sherwin-Williams Co. (The) | | | 260,785 | |
| | 1,022 | | | Vulcan Materials Co. | | | 131,194 | |
| | 1,950 | | | WestRock Co. | | | 123,260 | |
| | | | | | | | |
| | | | | | | 5,327,625 | |
| | |
| | Media – 2.7% | |
| | 2,538 | | | CBS Corp. (Non-Voting) Class B | | | 149,742 | |
| | 1,510 | | | Charter Communications, Inc. Class A* | | | 507,300 | |
| | 36,356 | | | Comcast Corp. Class A | | | 1,456,058 | |
| | |
| | |
| 40 | | The accompanying notes are an integral part of these financial statements. |
GOLDMAN SACHS VARIABLE INSURANCE TRUST EQUITY INDEX FUND
| | | | | | | | |
| Shares | | | Description | | Value | |
| | Common Stocks – (continued) | |
| | Media – (continued) | |
| | 1,181 | | | Discovery Communications, Inc. Class A* | | $ | 26,431 | |
| | 1,693 | | | Discovery Communications, Inc. Class C* | | | 35,841 | |
| | 1,800 | | | DISH Network Corp. Class A* | | | 85,950 | |
| | 2,948 | | | Interpublic Group of Cos., Inc. (The) | | | 59,432 | |
| | 3,213 | | | News Corp. Class A | | | 52,083 | |
| | 1,017 | | | News Corp. Class B | | | 16,882 | |
| | 1,775 | | | Omnicom Group, Inc. | | | 129,273 | |
| | 742 | | | Scripps Networks Interactive, Inc. Class A | | | 63,352 | |
| | 6,105 | | | Time Warner, Inc. | | | 558,424 | |
| | 8,219 | | | Twenty-First Century Fox, Inc. Class A | | | 283,802 | |
| | 3,394 | | | Twenty-First Century Fox, Inc. Class B | | | 115,803 | |
| | 2,857 | | | Viacom, Inc. Class B | | | 88,024 | |
| | 11,742 | | | Walt Disney Co. (The) | | | 1,262,382 | |
| | | | | | | | |
| | | | | | | 4,890,779 | |
| | |
| | Pharmaceuticals, Biotechnology & Life Sciences – 8.1% | |
| | 12,393 | | | AbbVie, Inc. | | | 1,198,527 | |
| | 2,507 | | | Agilent Technologies, Inc. | | | 167,894 | |
| | 1,745 | | | Alexion Pharmaceuticals, Inc.* | | | 208,685 | |
| | 2,578 | | | Allergan plc | | | 421,709 | |
| | 5,642 | | | Amgen, Inc. | | | 981,144 | |
| | 1,651 | | | Biogen, Inc.* | | | 525,959 | |
| | 12,738 | | | Bristol-Myers Squibb Co. | | | 780,585 | |
| | 6,089 | | | Celgene Corp.* | | | 635,448 | |
| | 7,557 | | | Eli Lilly & Co. | | | 638,264 | |
| | 10,146 | | | Gilead Sciences, Inc. | | | 726,859 | |
| | 1,132 | | | Illumina, Inc.* | | | 247,331 | |
| | 1,335 | | | Incyte Corp.* | | | 126,438 | |
| | 1,097 | | | IQVIA Holdings, Inc.* | | | 107,396 | |
| | 20,904 | | | Johnson & Johnson | | | 2,920,707 | |
| | 21,264 | | | Merck & Co., Inc. | | | 1,196,525 | |
| | 197 | | | Mettler-Toledo International, Inc.* | | | 122,045 | |
| | 4,263 | | | Mylan NV* | | | 180,367 | |
| | 857 | | | PerkinElmer, Inc. | | | 62,664 | |
| | 1,026 | | | Perrigo Co. plc | | | 89,426 | |
| | 46,359 | | | Pfizer, Inc. | | | 1,679,123 | |
| | 605 | | | Regeneron Pharmaceuticals, Inc.* | | | 227,456 | |
| | 3,115 | | | Thermo Fisher Scientific, Inc. | | | 591,476 | |
| | 1,988 | | | Vertex Pharmaceuticals, Inc.* | | | 297,922 | |
| | 612 | | | Waters Corp.* | | | 118,232 | |
| | 3,768 | | | Zoetis, Inc. | | | 271,447 | |
| | | | | | | | |
| | | | | | | 14,523,629 | |
| | |
| | Real Estate – 2.9% | |
| | 743 | | | Alexandria Real Estate Equities, Inc. (REIT) | | | 97,028 | |
| | 3,343 | | | American Tower Corp. (REIT) | | | 476,946 | |
| | 1,262 | | | Apartment Investment & Management Co. Class A (REIT) | | | 55,162 | |
| | 1,095 | | | AvalonBay Communities, Inc. (REIT) | | | 195,359 | |
| | 1,188 | | | Boston Properties, Inc. (REIT) | | | 154,476 | |
| | 2,311 | | | CBRE Group, Inc. Class A* | | | 100,089 | |
| | |
| | Common Stocks – (continued) | |
| | Real Estate – (continued) | |
| | 3,133 | | | Crown Castle International Corp. (REIT) | | $ | 347,794 | |
| | 1,627 | | | Digital Realty Trust, Inc. (REIT) | | | 185,315 | |
| | 2,864 | | | Duke Realty Corp. (REIT) | | | 77,929 | |
| | 598 | | | Equinix, Inc. (REIT) | | | 271,026 | |
| | 2,917 | | | Equity Residential (REIT) | | | 186,017 | |
| | 515 | | | Essex Property Trust, Inc. (REIT) | | | 124,306 | |
| | 1,008 | | | Extra Space Storage, Inc. (REIT) | | | 88,150 | |
| | 562 | | | Federal Realty Investment Trust (REIT) | | | 74,639 | |
| | 4,808 | | | GGP, Inc. (REIT) | | | 112,459 | |
| | 3,709 | | | HCP, Inc. (REIT) | | | 96,731 | |
| | 5,845 | | | Host Hotels & Resorts, Inc. (REIT) | | | 116,023 | |
| | 1,967 | | | Iron Mountain, Inc. (REIT) | | | 74,215 | |
| | 3,427 | | | Kimco Realty Corp. (REIT) | | | 62,200 | |
| | 813 | | | Macerich Co. (The) (REIT) | | | 53,398 | |
| | 862 | | | Mid-America Apartment Communities, Inc. (REIT) | | | 86,683 | |
| | 4,143 | | | Prologis, Inc. (REIT) | | | 267,265 | |
| | 1,166 | | | Public Storage (REIT) | | | 243,694 | |
| | 2,160 | | | Realty Income Corp. (REIT) | | | 123,163 | |
| | 1,137 | | | Regency Centers Corp. (REIT) | | | 78,658 | |
| | 901 | | | SBA Communications Corp. (REIT)* | | | 147,187 | |
| | 2,410 | | | Simon Property Group, Inc. (REIT) | | | 413,893 | |
| | 760 | | | SL Green Realty Corp. (REIT) | | | 76,707 | |
| | 2,104 | | | UDR, Inc. (REIT) | | | 81,046 | |
| | 2,801 | | | Ventas, Inc. (REIT) | | | 168,088 | |
| | 1,322 | | | Vornado Realty Trust (REIT) | | | 103,354 | |
| | 2,898 | | | Welltower, Inc. (REIT) | | | 184,805 | |
| | 5,848 | | | Weyerhaeuser Co. (REIT) | | | 206,201 | |
| | | | | | | | |
| | | | | | | 5,130,006 | |
| | |
| | Retailing – 5.7% | |
| | 607 | | | Advance Auto Parts, Inc. | | | 60,512 | |
| | 3,113 | | | Amazon.com, Inc.* | | | 3,640,560 | |
| | 211 | | | AutoZone, Inc.* | | | 150,099 | |
| | 1,946 | | | Best Buy Co., Inc. | | | 133,243 | |
| | 1,465 | | | CarMax, Inc.* | | | 93,950 | |
| | 1,985 | | | Dollar General Corp. | | | 184,625 | |
| | 1,843 | | | Dollar Tree, Inc.* | | | 197,772 | |
| | 972 | | �� | Expedia, Inc. | | | 116,416 | |
| | 910 | | | Foot Locker, Inc. | | | 42,661 | |
| | 1,637 | | | Gap, Inc. (The) | | | 55,756 | |
| | 1,137 | | | Genuine Parts Co. | | | 108,026 | |
| | 9,082 | | | Home Depot, Inc. (The) | | | 1,721,312 | |
| | 1,267 | | | Kohl’s Corp. | | | 68,709 | |
| | 1,960 | | | L Brands, Inc. | | | 118,031 | |
| | 2,396 | | | LKQ Corp.* | | | 97,445 | |
| | 6,473 | | | Lowe’s Cos., Inc. | | | 601,601 | |
| | 2,445 | | | Macy’s, Inc. | | | 61,590 | |
| | 3,360 | | | Netflix, Inc.* | | | 644,986 | |
| | 849 | | | Nordstrom, Inc. | | | 40,226 | |
| | 652 | | | O’Reilly Automotive, Inc.* | | | 156,832 | |
| | 379 | | | Priceline Group, Inc. (The)* | | | 658,603 | |
| | 3,020 | | | Ross Stores, Inc. | | | 242,355 | |
| | |
| | |
| The accompanying notes are an integral part of these financial statements. | | 41 |
GOLDMAN SACHS VARIABLE INSURANCE TRUST EQUITY INDEX FUND
Schedule of Investments (continued)
December 31, 2017
| | | | | | | | |
| Shares | | | Description | | Value | |
| | Common Stocks – (continued) | |
| | Retailing – (continued) | |
| | 442 | | | Signet Jewelers Ltd. | | $ | 24,995 | |
| | 4,293 | | | Target Corp. | | | 280,118 | |
| | 828 | | | Tiffany & Co. | | | 86,071 | |
| | 4,930 | | | TJX Cos., Inc. (The) | | | 376,948 | |
| | 984 | | | Tractor Supply Co. | | | 73,554 | |
| | 829 | | | TripAdvisor, Inc.* | | | 28,567 | |
| | 456 | | | Ulta Beauty, Inc.* | | | 101,989 | |
| | | | | | | | |
| | | | | | | 10,167,552 | |
| | |
| | Semiconductors & Semiconductor Equipment – 3.9% | |
| | 6,445 | | | Advanced Micro Devices, Inc.*(a) | | | 66,254 | |
| | 2,848 | | | Analog Devices, Inc. | | | 253,557 | |
| | 8,380 | | | Applied Materials, Inc. | | | 428,386 | |
| | 3,175 | | | Broadcom Ltd. | | | 815,657 | |
| | 36,442 | | | Intel Corp. | | | 1,682,163 | |
| | 1,211 | | | KLA-Tencor Corp. | | | 127,240 | |
| | 1,281 | | | Lam Research Corp. | | | 235,794 | |
| | 1,737 | | | Microchip Technology, Inc. | | | 152,647 | |
| | 8,706 | | | Micron Technology, Inc.* | | | 357,991 | |
| | 4,686 | | | NVIDIA Corp. | | | 906,741 | |
| | 1,028 | | | Qorvo, Inc.* | | | 68,465 | |
| | 11,455 | | | QUALCOMM, Inc. | | | 733,349 | |
| | 1,413 | | | Skyworks Solutions, Inc. | | | 134,164 | |
| | 7,670 | | | Texas Instruments, Inc. | | | 801,055 | |
| | 1,904 | | | Xilinx, Inc. | | | 128,368 | |
| | | | | | | | |
| | | | | | | 6,891,831 | |
| | |
| | Software & Services – 14.1% | |
| | 4,812 | | | Accenture plc Class A | | | 736,669 | |
| | 5,895 | | | Activision Blizzard, Inc. | | | 373,271 | |
| | 3,858 | | | Adobe Systems, Inc.* | | | 676,076 | |
| | 1,353 | | | Akamai Technologies, Inc.* | | | 87,999 | |
| | 372 | | | Alliance Data Systems Corp. | | | 94,294 | |
| | 2,319 | | | Alphabet, Inc. Class A* | | | 2,442,835 | |
| | 2,348 | | | Alphabet, Inc. Class C* | | | 2,456,947 | |
| | 650 | | | ANSYS, Inc.* | | | 95,933 | |
| | 1,742 | | | Autodesk, Inc.* | | | 182,614 | |
| | 3,436 | | | Automatic Data Processing, Inc. | | | 402,665 | |
| | 2,472 | | | CA, Inc. | | | 82,268 | |
| | 2,227 | | | Cadence Design Systems, Inc.* | | | 93,133 | |
| | 1,105 | | | Citrix Systems, Inc.* | | | 97,240 | |
| | 4,589 | | | Cognizant Technology Solutions Corp. Class A | | | 325,911 | |
| | 1,121 | | | CSRA, Inc. | | | 33,540 | |
| | 2,202 | | | DXC Technology Co. | | | 208,970 | |
| | 7,516 | | | eBay, Inc.* | | | 283,654 | |
| | 2,398 | | | Electronic Arts, Inc.* | | | 251,934 | |
| | 18,508 | | | Facebook, Inc. Class A* | | | 3,265,922 | |
| | 2,570 | | | Fidelity National Information Services, Inc. | | | 241,811 | |
| | 1,651 | | | Fiserv, Inc.* | | | 216,496 | |
| | 691 | | | Gartner, Inc.* | | | 85,097 | |
| | 1,203 | | | Global Payments, Inc. | | | 120,589 | |
| | 6,706 | | | International Business Machines Corp. | | | 1,028,834 | |
| | 1,901 | | | Intuit, Inc. | | | 299,940 | |
| | 7,236 | | | Mastercard, Inc. Class A | | | 1,095,241 | |
| | |
| | Common Stocks – (continued) | |
| | Software & Services – (continued) | |
| | 60,042 | | | Microsoft Corp. | | $ | 5,135,993 | |
| | 23,545 | | | Oracle Corp. | | | 1,113,208 | |
| | 2,465 | | | Paychex, Inc. | | | 167,817 | |
| | 8,772 | | | PayPal Holdings, Inc.* | | | 645,795 | |
| | 1,405 | | | Red Hat, Inc.* | | | 168,740 | |
| | 5,335 | | | salesforce.com, Inc.* | | | 545,397 | |
| | 4,731 | | | Symantec Corp. | | | 132,752 | |
| | 1,181 | | | Synopsys, Inc.* | | | 100,668 | |
| | 1,275 | | | Total System Services, Inc. | | | 100,840 | |
| | 648 | | | VeriSign, Inc.* | | | 74,157 | |
| | 14,138 | | | Visa, Inc. Class A | | | 1,612,015 | |
| | 3,541 | | | Western Union Co. (The) | | | 67,314 | |
| | | | | | | | |
| | | | | | | 25,144,579 | |
| | |
| | Technology Hardware & Equipment – 5.7% | |
| | 2,357 | | | Amphenol Corp. Class A | | | 206,945 | |
| | 39,964 | | | Apple, Inc. | | | 6,763,107 | |
| | 38,443 | | | Cisco Systems, Inc. | | | 1,472,367 | |
| | 6,703 | | | Corning, Inc. | | | 214,429 | |
| | 478 | | | F5 Networks, Inc.* | | | 62,723 | |
| | 1,120 | | | FLIR Systems, Inc. | | | 52,214 | |
| | 916 | | | Harris Corp. | | | 129,751 | |
| | 12,296 | | | Hewlett Packard Enterprise Co. | | | 176,571 | |
| | 13,130 | | | HP, Inc. | | | 275,861 | |
| | 2,831 | | | Juniper Networks, Inc. | | | 80,684 | |
| | 1,293 | | | Motorola Solutions, Inc. | | | 116,810 | |
| | 2,164 | | | NetApp, Inc. | | | 119,712 | |
| | 2,197 | | | Seagate Technology plc | | | 91,922 | |
| | 2,739 | | | TE Connectivity Ltd. | | | 260,315 | |
| | 2,331 | | | Western Digital Corp. | | | 185,384 | |
| | 1,790 | | | Xerox Corp. | | | 52,179 | |
| | | | | | | | |
| | | | | | | 10,260,975 | |
| | |
| | Telecommunication Services – 2.1% | |
| | 47,817 | | | AT&T, Inc. | | | 1,859,125 | |
| | 7,795 | | | CenturyLink, Inc. | | | 130,021 | |
| | 31,827 | | | Verizon Communications, Inc. | | | 1,684,603 | |
| | | | | | | | |
| | | | | | | 3,673,749 | |
| | |
| | Transportation – 2.2% | |
| | 959 | | | Alaska Air Group, Inc. | | | 70,496 | |
| | 3,273 | | | American Airlines Group, Inc. | | | 170,294 | |
| | 1,075 | | | CH Robinson Worldwide, Inc. | | | 95,772 | |
| | 6,929 | | | CSX Corp. | | | 381,164 | |
| | 5,166 | | | Delta Air Lines, Inc. | | | 289,296 | |
| | 1,416 | | | Expeditors International of Washington, Inc. | | | 91,601 | |
| | 1,925 | | | FedEx Corp. | | | 480,365 | |
| | 667 | | | JB Hunt Transport Services, Inc. | | | 76,692 | |
| | 827 | | | Kansas City Southern | | | 87,017 | |
| | 2,216 | | | Norfolk Southern Corp. | | | 321,098 | |
| | 4,269 | | | Southwest Airlines Co. | | | 279,406 | |
| | 6,141 | | | Union Pacific Corp. | | | 823,508 | |
| | 2,015 | | | United Continental Holdings, Inc.* | | | 135,811 | |
| | 5,384 | | | United Parcel Service, Inc. Class B | | | 641,504 | |
| | | | | | | | |
| | | | | | | 3,944,024 | |
| | |
| | |
| 42 | | The accompanying notes are an integral part of these financial statements. |
GOLDMAN SACHS VARIABLE INSURANCE TRUST EQUITY INDEX FUND
| | | | | | | | |
Shares | | | Description | | Value | |
| | Common Stocks – (continued) | |
| | Utilities – 2.9% | |
| | 5,392 | | | AES Corp. | | $ | 58,395 | |
| | 1,855 | | | Alliant Energy Corp. | | | 79,042 | |
| | 1,901 | | | Ameren Corp. | | | 112,140 | |
| | 3,851 | | | American Electric Power Co., Inc. | | | 283,318 | |
| | 1,405 | | | American Water Works Co., Inc. | | | 128,543 | |
| | 3,307 | | | CenterPoint Energy, Inc. | | | 93,787 | |
| | 2,150 | | | CMS Energy Corp. | | | 101,695 | |
| | 2,413 | | | Consolidated Edison, Inc. | | | 204,984 | |
| | 5,054 | | | Dominion Energy, Inc. | | | 409,677 | |
| | 1,431 | | | DTE Energy Co. | | | 156,637 | |
| | 5,439 | | | Duke Energy Corp. | | | 457,474 | |
| | 2,519 | | | Edison International | | | 159,302 | |
| | 1,383 | | | Entergy Corp. | | | 112,562 | |
| | 2,462 | | | Eversource Energy | | | 155,549 | |
| | 7,473 | | | Exelon Corp. | | | 294,511 | |
| | 3,421 | | | FirstEnergy Corp. | | | 104,751 | |
| | 3,673 | | | NextEra Energy, Inc. | | | 573,686 | |
| | 2,594 | | | NiSource, Inc. | | | 66,588 | |
| | 2,439 | | | NRG Energy, Inc. | | | 69,463 | |
| | 4,048 | | | PG&E Corp. | | | 181,472 | |
| | 870 | | | Pinnacle West Capital Corp. | | | 74,107 | |
| | 5,299 | | | PPL Corp. | | | 164,004 | |
| | 3,993 | | | Public Service Enterprise Group, Inc. | | | 205,640 | |
| | 1,159 | | | SCANA Corp. | | | 46,105 | |
| | 1,949 | | | Sempra Energy | | | 208,387 | |
| | 7,759 | | | Southern Co. (The) | | | 373,130 | |
| | 2,443 | | | WEC Energy Group, Inc. | | | 162,289 | |
| | 3,993 | | | Xcel Energy, Inc. | | | 192,103 | |
| | | | | | | | |
| | | | | | | 5,229,341 | |
| | |
| | TOTAL COMMON STOCKS | |
| | (Cost $65,904,083) | | $ | 177,555,864 | |
| | |
| | | | | | | | | | | | | | |
Principal
Amount | | | Interest
Rate | | | Maturity
Date | | | Value | |
| | Short-Term Investment(c)(d) –0.0% | | | | | |
| | U.S. Treasury Obligation –0.0% | |
| | U.S. Treasury Bills | |
| $ | 50,000 | | | | 0.000 | % | | | 02/01/2018 | | | $ | 49,947 | |
| | (Cost $49,952) | | | | | | | | | |
| | |
| TOTAL INVESTMENTS BEFORE SECURITIES LENDING
REINVESTMENT VEHICLE |
|
| | (Cost $65,954,035) | | | $ | 177,605,811 | |
| | |
| Shares | | Distribution
Rate | | | Value | |
| Securities Lending Reinvestment Vehicle(b) – 0.1% | |
Goldman Sachs Financial Square Government Fund — Institutional Shares | |
| 165,850 | | | 1.228 | % | | $ | 165,850 | |
| (Cost $165,850) | | | | | |
| |
| TOTAL INVESTMENTS – 99.3% | |
| (Cost $66,119,885) | | | $ | 177,771,661 | |
| |
OTHER ASSETS IN EXCESS OF LIABILITIES – 0.7% | | | | 1,263,941 | |
| |
| NET ASSETS – 100.0% | | | $ | 179,035,602 | |
| |
| | |
| The percentage shown for each investment category reflects the value of investments in that category as a percentage of net assets. |
| * | | Non-income producing security. |
| (a) | | All or a portion of security is on loan. |
| (b) | | Represents an Affiliated Issuer. |
| (c) | | Issued with a zero coupon. Income is recognized through the accretion of discount. |
| (d) | | All or a portion of security is segregated as collateral for initial margin requirements on futures transactions. |
| | |
| Investment Abbreviation: |
| REIT | | —Real Estate Investment Trust |
| | |
| The accompanying notes are an integral part of these financial statements. | | 43 |
GOLDMAN SACHS VARIABLE INSURANCE TRUST EQUITY INDEX FUND
Schedule of Investments (continued)
December 31, 2017
ADDITIONAL INVESTMENT INFORMATION
FUTURES CONTRACTS — At December 31, 2017, the Fund had the following futures contracts:
| | | | | | | | | | | | | | |
| Description | | Number of
Contracts | | | Expiration
Date | | Notional
Amount | | | Unrealized
Appreciation/
(Depreciation) | |
| Long position contracts: | |
| S&P 500 E-Mini Index | | | 10 | | | 03/16/2018 | | $ | 1,338,000 | | | $ | 16,846 | |
| | |
| 44 | | The accompanying notes are an integral part of these financial statements. |
GOLDMAN SACHS VARIABLE INSURANCE TRUST GROWTH OPPORTUNITIES FUND
Schedule of Investments
December 31, 2017
| | | | | | | | |
| Shares | | | Description | | Value | |
| | Common Stocks – 98.9% | |
| | Automobiles & Components – 0.6% | |
| | 9,368 | | | Aptiv plc | | $ | 794,688 | |
| | 3,122 | | | Delphi Technologies plc* | | | 163,811 | |
| | | | | | | | |
| | | | | | | 958,499 | |
| | |
| | Banks – 3.2% | | | | |
| | 20,285 | | | Eagle Bancorp, Inc.* | | | 1,174,502 | |
| | 26,133 | | | First Republic Bank | | | 2,264,163 | |
| | 32,409 | | | SunTrust Banks, Inc. | | | 2,093,297 | |
| | | | | | | | |
| | | | | | | 5,531,962 | |
| | |
| | Capital Goods – 17.1% | | | | |
| | 39,232 | | | Fortive Corp. | | | 2,838,435 | |
| | 26,230 | | | Fortune Brands Home & Security, Inc. | | | 1,795,181 | |
| | 9,486 | | | HEICO Corp. | | | 895,004 | |
| | 15,506 | | | Hubbell, Inc. | | | 2,098,582 | |
| | 13,131 | | | IDEX Corp. | | | 1,732,898 | |
| | 16,216 | | | John Bean Technologies Corp. | | | 1,796,733 | |
| | 11,468 | | | L3 Technologies, Inc. | | | 2,268,944 | |
| | 31,964 | | | Middleby Corp. (The)* | | | 4,313,542 | |
| | 19,043 | | | Roper Technologies, Inc. | | | 4,932,137 | |
| | 63,943 | | | Sensata Technologies Holding NV* | | | 3,268,127 | |
| | 30,365 | | | Welbilt, Inc.* | | | 713,881 | |
| | 38,828 | | | Xylem, Inc. | | | 2,648,070 | |
| | | | | | | | |
| | | | | | | 29,301,534 | |
| | |
| | Consumer Durables & Apparel – 2.1% | | | | |
| | 19,721 | | | PVH Corp. | | | 2,705,918 | |
| | 22,847 | | | Skechers U.S.A., Inc. Class A* | | | 864,531 | |
| | | | | | | | |
| | | | | | | 3,570,449 | |
| | |
| | Consumer Services – 7.0% | | | | |
| | 28,804 | | | Bright Horizons Family Solutions, Inc.* | | | 2,707,576 | |
| | 11,372 | | | Choice Hotels International, Inc. | | | 882,467 | |
| | 58,265 | | | Dunkin’ Brands Group, Inc. | | | 3,756,344 | |
| | 34,758 | | | Hilton Worldwide Holdings, Inc. | | | 2,775,774 | |
| | 21,562 | | | Yum Brands, Inc. | | | 1,759,675 | |
| | | | | | | | |
| | | | | | | 11,881,836 | |
| | |
| | Diversified Financials – 6.7% | | | | |
| | 8,584 | | | Affiliated Managers Group, Inc. | | | 1,761,866 | |
| | 16,780 | | | Intercontinental Exchange, Inc. | | | 1,183,997 | |
| | 50,133 | | | Lazard Ltd. Class A | | | 2,631,982 | |
| | 16,394 | | | MSCI, Inc. | | | 2,074,497 | |
| | 38,230 | | | Northern Trust Corp. | | | 3,818,795 | |
| | | | | | | | |
| | | | | | | 11,471,137 | |
| | |
| | Energy – 2.0% | | | | |
| | 11,322 | | | Concho Resources, Inc.* | | | 1,700,791 | |
| | 14,133 | | | Diamondback Energy, Inc.* | | | 1,784,291 | |
| | | | | | | | |
| | | | | | | 3,485,082 | |
| | |
| | Food, Beverage & Tobacco – 4.0% | | | | |
| | 48,743 | | | Blue Buffalo Pet Products, Inc.*(a) | | | 1,598,283 | |
| | 39,361 | | | Brown-Forman Corp. Class B | | | 2,702,920 | |
| | |
| | Common Stocks – (continued) | |
| | Food, Beverage & Tobacco – (continued) | | | | |
| | 39,102 | | | Monster Beverage Corp.* | | $ | 2,474,765 | |
| | | | | | | | |
| | | | | | | 6,775,968 | |
| | |
| | Health Care Equipment & Services – 3.0% | | | | |
| | 3,624 | | | Cooper Cos., Inc. (The) | | | 789,597 | |
| | 26,634 | | | Edwards Lifesciences Corp.* | | | 3,001,918 | |
| | 18,623 | | | Nevro Corp.* | | | 1,285,732 | |
| | | | | | | | |
| | | | | | | 5,077,247 | |
| | |
| | Materials – 6.0% | | | | |
| | 31,523 | | | Ashland Global Holdings, Inc. | | | 2,244,438 | |
| | 29,202 | | | Avery Dennison Corp. | | | 3,354,142 | |
| | 3,731 | | | Sherwin-Williams Co. (The) | | | 1,529,859 | |
| | 125,156 | | | Valvoline, Inc. | | | 3,136,409 | |
| | | | | | | | |
| | | | | | | 10,264,848 | |
| | |
| | Media – 0.6% | | | | |
| | 51,894 | | | Altice USA, Inc. Class A* | | | 1,101,710 | |
| | |
| | Pharmaceuticals, Biotechnology & Life Sciences – 13.8% | |
| | 50,231 | | | Agilent Technologies, Inc. | | | 3,363,970 | |
| | 7,672 | | | Agios Pharmaceuticals, Inc.* | | | 438,608 | |
| | 38,819 | | | Alkermes plc* | | | 2,124,564 | |
| | 52,863 | | | Exelixis, Inc.* | | | 1,607,035 | |
| | 17,476 | | | Illumina, Inc.* | | | 3,818,331 | |
| | 13,406 | | | Incyte Corp.* | | | 1,269,682 | |
| | 3,796 | | | Mettler-Toledo International, Inc.* | | | 2,351,698 | |
| | 15,780 | | | Neurocrine Biosciences, Inc.* | | | 1,224,370 | |
| | 14,177 | | | PRA Health Sciences, Inc.* | | | 1,291,100 | |
| | 19,769 | | | Seattle Genetics, Inc.* | | | 1,057,642 | |
| | 6,558 | | | Vertex Pharmaceuticals, Inc.* | | | 982,782 | |
| | 55,383 | | | Zoetis, Inc. | | | 3,989,791 | |
| | | | | | | | |
| | | | | | | 23,519,573 | |
| | |
| | Real Estate Investment Trusts – 2.5% | | | | |
| | 3,400 | | | Equinix, Inc. | | | 1,540,948 | |
| | 17,072 | | | SBA Communications Corp.* | | | 2,788,882 | |
| | | | | | | | |
| | | | | | | 4,329,830 | |
| | |
| | Retailing – 5.5% | | | | |
| | 22,838 | | | Expedia, Inc. | | | 2,735,307 | |
| | 20,690 | | | Five Below, Inc.* | | | 1,372,161 | |
| | 31,760 | | | LKQ Corp.* | | | 1,291,679 | |
| | 31,174 | | | Ross Stores, Inc. | | | 2,501,714 | |
| | 6,332 | | | Ulta Beauty, Inc.* | | | 1,416,215 | |
| | | | | | | | |
| | | | | | | 9,317,076 | |
| | |
| | Semiconductors & Semiconductor Equipment – 5.3% | |
| | 30,151 | | | Analog Devices, Inc. | | | 2,684,344 | |
| | 18,090 | | | Lam Research Corp. | | | 3,329,826 | |
| | 7,502 | | | Monolithic Power Systems, Inc. | | | 842,925 | |
| | 31,851 | | | Xilinx, Inc. | | | 2,147,394 | |
| | | | | | | | |
| | | | | | | 9,004,489 | |
| | |
| | Software & Services – 16.6% | | | | |
| | 23,581 | | | Autodesk, Inc.* | | | 2,471,996 | |
| | 53,719 | | | Black Knight, Inc.* | | | 2,371,694 | |
| | |
| | |
| The accompanying notes are an integral part of these financial statements. | | 45 |
GOLDMAN SACHS VARIABLE INSURANCE TRUST GROWTH OPPORTUNITIES FUND
Schedule of Investments (continued)
December 31, 2017
| | | | | | | | |
| Shares | | | Description | | Value | |
| | Common Stocks – (continued) | |
| | Software & Services – (continued) | |
| | 27,506 | | | DXC Technology Co. | | $ | 2,610,319 | |
| | 8,415 | | | Electronic Arts, Inc.* | | | 884,080 | |
| | 24,566 | | | Fiserv, Inc.* | | | 3,221,340 | |
| | 33,870 | | | Global Payments, Inc. | | | 3,395,129 | |
| | 39,684 | | | GoDaddy, Inc. Class A* | | | 1,995,311 | |
| | 18,165 | | | Intuit, Inc. | | | 2,866,074 | |
| | 8,867 | | | Proofpoint, Inc.* | | | 787,478 | |
| | 18,542 | | | Red Hat, Inc.* | | | 2,226,894 | |
| | 10,886 | | | ServiceNow, Inc.* | | | 1,419,426 | |
| | 19,201 | | | Splunk, Inc.* | | | 1,590,611 | |
| | 31,058 | | | Total System Services, Inc. | | | 2,456,377 | |
| | | | | | | | |
| | | | | | | 28,296,729 | |
| | |
| | Technology Hardware & Equipment –2.9% | |
| | 57,309 | | | Amphenol Corp. Class A | | | 5,031,730 | |
| | |
| | TOTAL COMMON STOCKS | |
| | (Cost $120,854,033) | | $ | 168,919,699 | |
| | |
| | | | | | | | |
| Shares | | Distribution
Rate | | | Value | |
| Investment Company(b) – 0.0% | |
Goldman Sachs Financial Square Government Fund —
Institutional Shares | |
| 572 | | | 1.228 | % | | $ | 572 | |
| (Cost $572) | | | | | |
| |
| TOTAL INVESTMENTS BEFORE SECURITIES LENDING REINVESTMENT VEHICLE | |
| (Cost $120,854,605) | | | $ | 168,920,271 | |
| |
| | | | | | | | |
| Securities Lending Reinvestment Vehicle(b) – 0.6% | |
Goldman Sachs Financial Square Government Fund — Institutional Shares | |
| 1,040,835 | | | 1.228 | % | | $ | 1,040,835 | |
| (Cost $1,040,835) | |
| |
| TOTAL INVESTMENTS – 99.5% | |
| (Cost $121,895,440) | | | $ | 169,961,106 | |
| |
OTHER ASSETS IN EXCESS OF LIABILITIES – 0.5% | | | | 875,570 | |
| |
| NET ASSETS – 100.0% | | | $ | 170,836,676 | |
| |
| | |
| The percentage shown for each investment category reflects the value of investments in that category as a percentage of net assets. |
| * | | Non-income producing security. |
| (a) | | All or a portion of security is on loan. |
| (b) | | Represents an Affiliated Issuer. |
| | |
| 46 | | The accompanying notes are an integral part of these financial statements. |
GOLDMAN SACHS VARIABLE INSURANCE TRUST HIGH QUALITY FLOATING RATE FUND
Schedule of Investments
December 31, 2017
| | | | | | | | | | | | | | |
Principal
Amount | | | Interest
Rate | | | Maturity
Date | | | Value | |
| | Mortgage-Backed Securities – 6.6% | |
| | Adjustable Rate FHLMC(a) – 2.6% | |
| $ | 186,705 | | | | 3.537 | % | | | 05/01/2035 | | | $ | 195,794 | |
| | 102,187 | | | | 3.381 | | | | 09/01/2035 | | | | 107,853 | |
| | 221,037 | | | | 3.583 | | | | 12/01/2036 | | | | 231,615 | |
| | 454,516 | | | | 3.930 | | | | 04/01/2037 | | | | 482,633 | |
| | 461,033 | | | | 3.320 | | | | 01/01/2038 | | | | 485,493 | |
| | 365,410 | | | | 3.561 | | | | 01/01/2038 | | | | 377,665 | |
| | | | | | | | | | | | | | |
| | | | | | | | | | | | | 1,881,053 | |
| | |
| | Adjustable Rate FNMA(a) – 2.3% | |
| | 44,414 | | | | 3.129 | | | | 05/01/2033 | | | | 45,364 | |
| | 133,528 | | | | 3.208 | | | | 05/01/2035 | | | | 138,484 | |
| | 422,765 | | | | 3.112 | | | | 06/01/2035 | | | | 443,953 | |
| | 584,701 | | | | 3.309 | | | | 11/01/2035 | | | | 609,519 | |
| | 78,580 | | | | 3.395 | | | | 12/01/2035 | | | | 81,015 | |
| | 274,809 | | | | 3.655 | | | | 03/01/2037 | | | | 289,926 | |
| | | | | | | | | | | | | | |
| | | | | | | | | | | | | 1,608,261 | |
| | |
| | Adjustable Rate GNMA(a) – 0.4% | |
| | 276,608 | | | | 2.625 | | | | 04/20/2033 | | | | 283,412 | |
| | |
| | Agency Multi-Family – 1.3% | |
| | FNMA | | | | | | | | | | | | | |
| | 171,529 | | | | 2.800 | | | | 03/01/2018 | | | | 171,622 | |
| | 110,000 | | | | 3.840 | | | | 05/01/2018 | | | | 110,587 | |
| | 78,241 | | | | 3.416 | | | | 10/01/2020 | | | | 80,421 | |
| | 70,545 | | | | 3.619 | | | | 12/01/2020 | | | | 72,972 | |
| | 302,872 | | | | 3.762 | | | | 12/01/2020 | | | | 314,311 | |
| | 174,776 | | | | 4.381 | | | | 06/01/2021 | | | | 185,393 | |
| | | | | | | | | | | | | | |
| | | | | | | | | | | | | 935,306 | |
| | |
| | TOTAL MORTGAGE-BACKED SECURITIES | |
| | (Cost $4,736,321) | | | $ | 4,708,032 | |
| | |
| | | | | | | | | | | | | | |
| | Collateralized Mortgage Obligations(a) – 38.7% | |
| | Agency Multi-Family – 7.4% | |
| FHLMC Multifamily Structured Pass-Through Certificates Series
KF02, Class A1 |
|
| $ | 31,652 | | | | 1.752 | % | | | 07/25/2020 | | | $ | 31,652 | |
| FHLMC Multifamily Structured Pass-Through Certificates
REMIC Series KP04, Class AG1(b) |
|
| | 1,350,000 | | | | 1.772 | | | | 07/25/2020 | | | | 1,342,481 | |
| FHLMC Multifamily Structured Pass-Through Certificates
REMIC Series KF03, Class A |
|
| | 110,131 | | | | 1.712 | | | | 01/25/2021 | | | | 109,521 | |
| FHLMC Multifamily Structured Pass-Through Certificates
REMIC Series KS02, Class A |
|
| | 1,005,216 | | | | 1.752 | | | | 08/25/2023 | | | | 1,005,875 | |
| FHLMC Multifamily Structured Pass-Through Certificates
REMIC Series KF32, Class A(b) |
|
| | 1,499,785 | | | | 1.742 | | | | 05/25/2024 | | | | 1,499,785 | |
| FHLMC Multifamily Structured Pass-Through Certificates
REMIC Series J15L, Class AFL(b) |
|
| | 1,374,421 | | | | 1.722 | | | | 08/25/2025 | | | | 1,373,982 | |
| | | | | | | | | | | | | | |
| | | | | | | | | | | | | 5,363,296 | |
| | |
| | Collateralized Mortgage Obligations(a) – (continued) | |
| | Regular Floater – 31.3% | |
| | FHLMC REMIC Series 3049, Class FP | |
| $ | 218,765 | | | | 1.827 | % | | | 10/15/2035 | | | $ | 219,316 | |
| | FHLMC REMIC Series 3208, Class FB(b) | |
| | 129,194 | | | | 1.877 | | | | 08/15/2036 | | | | 129,518 | |
| | FHLMC REMIC Series 3208, Class FD(b) | |
| | 192,499 | | | | 1.877 | | | | 08/15/2036 | | | | 193,630 | |
| | FHLMC REMIC Series 3208, Class FG(b) | |
| | 775,162 | | | | 1.877 | | | | 08/15/2036 | | | | 779,716 | |
| | FHLMC REMIC Series 3307, Class FT | |
| | 1,211,183 | | | | 1.717 | | | | 07/15/2034 | | | | 1,211,689 | |
| | FHLMC REMIC Series 3311, Class KF(b) | |
| | 2,178,704 | | | | 1.817 | | | | 05/15/2037 | | | | 2,179,531 | |
| | FHLMC REMIC Series 3371, Class FA(b) | |
| | 489,693 | | | | 2.077 | | | | 09/15/2037 | | | | 495,077 | |
| | FHLMC REMIC Series 4174, Class FB(b) | |
| | 970,100 | | | | 1.777 | | | | 05/15/2039 | | | | 970,099 | |
| | FHLMC REMIC Series 4320, Class FD | |
| | 447,227 | | | | 1.877 | | | | 07/15/2039 | | | | 449,227 | |
| | FHLMC REMIC Series 4477, Class FG | |
| | 757,333 | | | | 1.661 | | | | 10/15/2040 | | | | 755,614 | |
| | FHLMC REMIC Series 4508, Class CF | |
| | 436,796 | | | | 1.877 | | | | 09/15/2045 | | | | 437,808 | |
| | FHLMC REMIC Series 4631, Class GF | |
| | 2,619,644 | | | | 1.977 | | | | 11/15/2046 | | | | 2,644,733 | |
| | FHLMC REMIC Series 4637, Class QF(b) | |
| | 2,129,003 | | | | 2.361 | | | | 04/15/2044 | | | | 2,143,337 | |
| | FNMA REMIC Series 2006-82, Class F | |
| | 259,628 | | | | 2.122 | | | | 09/25/2036 | | | | 261,713 | |
| | FNMA REMIC Series 2006-96, Class FA | |
| | 673,325 | | | | 1.852 | | | | 10/25/2036 | | | | 672,758 | |
| | FNMA REMIC Series 2007-33, Class HF | |
| | 115,060 | | | | 1.902 | | | | 04/25/2037 | | | | 115,383 | |
| | FNMA REMIC Series 2007-36, Class F | |
| | 187,204 | | | | 1.782 | | | | 04/25/2037 | | | | 186,899 | |
| | FNMA REMIC Series 2007-85, Class FC | |
| | 521,071 | | | | 2.092 | | | | 09/25/2037 | | | | 525,612 | |
| | FNMA REMIC Series 2008-8, Class FB | |
| | 539,016 | | | | 2.372 | | | | 02/25/2038 | | | | 544,665 | |
| | FNMA REMIC Series 2011-63, Class FG | |
| | 472,680 | | | | 2.002 | | | | 07/25/2041 | | | | 475,441 | |
| | FNMA REMIC Series 2012-35, Class QF | |
| | 1,357,119 | | | | 1.952 | | | | 04/25/2042 | | | | 1,361,368 | |
| | FNMA REMIC Series 2016-1, Class FT | |
| | 1,327,151 | | | | 1.902 | | | | 02/25/2046 | | | | 1,329,983 | |
| | FNMA REMIC Series 2017-45, Class FA | |
| | 939,969 | | | | 1.562 | | | | 06/25/2047 | | | | 939,978 | |
| | GNMA REMIC Series 2005-48, Class AF | |
| | 651,985 | | | | 1.701 | | | | 06/20/2035 | | | | 650,396 | |
| | GNMA REMIC Series 2012-98, Class FA | |
| | 610,375 | | | | 1.901 | | | | 08/20/2042 | | | | 613,735 | |
| | NCUA Guaranteed Notes Trust Series 2011-R1, Class 1A(b) | |
| | 1,393,166 | | | | 1.779 | | | | 01/08/2020 | | | | 1,395,614 | |
| | NCUA Guaranteed Notes Trust Series 2010-R1, Class 1A(b) | |
| | 165,684 | | | | 1.779 | | | | 10/07/2020 | | | | 166,059 | |
| | |
| | |
| The accompanying notes are an integral part of these financial statements. | | 47 |
GOLDMAN SACHS VARIABLE INSURANCE TRUST HIGH QUALITY FLOATING RATE FUND
Schedule of Investments (continued)
December 31, 2017
| | | | | | | | | | | | | | |
Principal
Amount | | | Interest
Rate | | | Maturity
Date | | | Value | |
| | Collateralized Mortgage Obligations(a) – (continued) | |
| | Regular Floater – (continued) | |
| | NCUA Guaranteed Notes Trust Series 2010-R2, Class 2A(b) | |
| $ | 370,005 | | | | 1.873 | % | | | 11/05/2020 | | | $ | 371,133 | |
| | | | | | | | | | | | | | |
| | | | | | | | | | | | | 22,220,032 | |
| | |
| | TOTAL COLLATERALIZED MORTGAGE OBLIGATIONS | |
| | (Cost $27,524,325) | | | $ | 27,583,328 | |
| | |
| | | | | | | | | | | | | | |
| | Commercial Mortgage-Backed Security(a) – 0.7% | |
| | Agency Multi-Family – 0.7% | |
| | FNMA ACES REMIC Series 2017-M13, Class FA | |
| $ | 499,767 | | | | 1.638 | % | | | 10/25/2024 | | | $ | 498,510 | |
| | (Cost $499,221) | | | | | | | | | |
| | |
| | | | | | | | | | | | | | |
| | Asset-Backed Securities(a) – 43.7% | |
| | Automobile(b) – 4.9% | |
| | Ally Master Owner Trust Series 2017-3, Class A1 | |
| $ | 1,350,000 | | | | 1.907 | % | | | 06/15/2022 | | | $ | 1,351,503 | |
| | Chesapeake Funding II LLC Series 2016-2A, Class A2(c) | |
| | 407,351 | | | | 2.477 | | | | 06/15/2028 | | | | 409,598 | |
| | Chesapeake Funding II LLC Series 2017-3A, Class A2(c) | |
| | 550,000 | | | | 1.817 | | | | 08/15/2029 | | | | 550,471 | |
| | GMF Floorplan Owner Revolving Trust Series 2017-2, Class A2(c) | |
| | 900,000 | | | | 1.907 | | | | 07/15/2022 | | | | 903,155 | |
| | Nissan Master Owner Trust Receivables Series 2017-C, Class A | |
| | 300,000 | | | | 1.797 | | | | 10/17/2022 | | | | 300,580 | |
| | | | | | | | | | | | | | |
| | | | | | | | | | | | | 3,515,307 | |
| | |
| | Collateralized Loan Obligations(c) – 6.5% | |
| | Apidos CLO X Series 2012-10A, Class A(b) | |
| | 141,939 | | | | 2.798 | | | | 10/30/2022 | | | | 142,078 | |
| | BlueMountain CLO Ltd. Series 2014-2A, Class AR(b) | |
| | 350,000 | | | | 2.293 | | | | 07/20/2026 | | | | 350,958 | |
| | Bowman Park CLO Ltd. Series 2014-1A, Class AR | |
| | 250,000 | | | | 2.642 | | | | 11/23/2025 | | | | 250,876 | |
| | Cutwater Ltd. Series 2014-1A, Class A1AR(b) | |
| | 350,000 | | | | 2.609 | | | | 07/15/2026 | | | | 349,887 | |
| Halcyon Loan Advisors Funding Ltd. Series 2014-1A,
Class A1R(b) |
|
| | 350,000 | | | | 2.484 | | | | 04/18/2026 | | | | 351,402 | |
| | Neuberger Berman CLO XIX Ltd. Series 2015-19A, Class A1R(b) | |
| | 350,000 | | | | 2.409 | | | | 07/15/2027 | | | | 351,996 | |
| | OFSI Fund V Ltd. Series 2013-5A, Class A1LA(b) | |
| | 161,445 | | | | 2.283 | | | | 04/17/2025 | | | | 161,490 | |
| | OFSI Fund VI Ltd. Series 2014-6A, Class A1(b) | |
| | 350,000 | | | | 2.389 | | | | 03/20/2025 | | | | 349,862 | |
| | Parallel Ltd. Series 2015-1A, Class A(b) | |
| | 300,000 | | | | 2.813 | | | | 07/20/2027 | | | | 300,247 | |
| | Sound Point CLO XI Ltd. Series 2016-1A, Class A(b) | |
| | 700,000 | | | | 3.013 | | | | 07/20/2028 | | | | 703,481 | |
| | Voya CLO Ltd. Series 2014-4A, Class A1R(b) | |
| | 500,000 | | | | 2.309 | | | | 10/14/2026 | | | | 500,991 | |
| | |
| | Asset-Backed Securities(a) – (continued) | |
| | Collateralized Loan Obligations(c) – (continued) | |
| | WhiteHorse IX Ltd. Series 2014-9A, Class AR(b) | |
| $ | 400,000 | | | | 2.513 | % | | | 07/17/2026 | | | $ | 400,658 | |
| | Z Capital Credit Partners CLO Ltd. Series 2015-1A, Class A1(b) | |
| | 400,000 | | | | 2.689 | | | | 07/16/2027 | | | | 400,200 | |
| | | | | | | | | | | | | | |
| | | | | | | | | | | | | 4,614,126 | |
| | |
| | Credit Card – 12.2% | |
| | BA Credit Card Trust Series 2014-A1, Class A | |
| | 1,000,000 | | | | 1.857 | | | | 06/15/2021 | | | | 1,003,029 | |
| Capital One Multi-Asset Execution Trust Series 2016-A1,
Class A1(b) |
|
| | 300,000 | | | | 1.927 | | | | 02/15/2022 | | | | 301,269 | |
| | CARDS II Trust Series 2016-1A, Class A(b)(c) | |
| | 300,000 | | | | 2.177 | | | | 07/15/2021 | | | | 300,887 | |
| | CARDS II Trust Series 2017-1A, Class A(c) | |
| | 300,000 | | | | 1.847 | | | | 04/18/2022 | | | | 300,689 | |
| | Chase Issuance Trust Series 2013-A9, Class A(b) | |
| | 2,000,000 | | | | 1.897 | | | | 11/16/2020 | | | | 2,005,397 | |
| | Citibank Credit Card Issuance Trust Series 2013-A7, Class A7(b) | |
| | 900,000 | | | | 1.862 | | | | 09/10/2020 | | | | 902,242 | |
| | Citibank Credit Card Issuance Trust Series 2017-A5, Class A5(b) | |
| | 1,400,000 | | | | 2.155 | | | | 04/22/2026 | | | | 1,415,940 | |
| | Discover Card Execution Note Trust Series 2013-A1, Class A1(b) | |
| | 1,500,000 | | | | 1.777 | | | | 08/17/2020 | | | | 1,500,464 | |
| | Evergreen Credit Card Trust Series 2016-1, Class A(b)(c) | |
| | 500,000 | | | | 2.197 | | | | 04/15/2020 | | | | 500,907 | |
| | Trillium Credit Card Trust II Series 2016-1A, Class A(b)(c) | |
| | 500,000 | | | | 2.272 | | | | 05/26/2021 | | | | 501,237 | |
| | | | | | | | | | | | | | |
| | | | | | | | | | | | | 8,732,061 | |
| | |
| | Student Loans – 20.1% | |
| | Academic Loan Funding Trust Series 2013-1A, Class A(b)(c) | |
| | 486,102 | | | | 2.352 | | | | 12/26/2044 | | | | 483,711 | |
| | Access Group, Inc. Series 2015-1, Class A(b)(c) | |
| | 211,246 | | | | 2.252 | | | | 07/25/2056 | | | | 211,500 | |
| Access to Loans for Learning Student Loan Corp. Series 2013-I,
Class A |
|
| | 471,899 | | | | 2.352 | | | | 02/25/2041 | | | | 472,187 | |
| | ECMC Group Student Loan Trust Series 2016-1A, Class A(b)(c) | |
| | 262,843 | | | | 2.902 | | | | 07/26/2066 | | | | 265,272 | |
| | Edsouth Indenture No. 1 LLC Series 2010-1, Class A1(b)(c) | |
| | 504,001 | | | | 2.217 | | | | 07/25/2023 | | | | 504,297 | |
| | Edsouth Indenture No. 4 LLC Series 2013-1, Class A(b)(c) | |
| | 81,326 | | | | 2.122 | | | | 02/26/2029 | | | | 81,090 | |
| | Edsouth Indenture No. 5 LLC Series 2014-1, Class A(b)(c) | |
| | 267,557 | | | | 2.252 | | | | 02/25/2039 | | | | 264,177 | |
| | Education Loan Asset-Backed Trust I Series 2013-1, Class A1(c) | |
| | 251,590 | | | | 2.352 | | | | 06/25/2026 | | | | 251,750 | |
| | Education Loan Asset-Backed Trust I Series 2013-1, Class A2(c) | |
| | 500,000 | | | | 2.352 | | | | 04/26/2032 | | | | 492,418 | |
| | Educational Funding of the South, Inc. Series 2011-1, Class A2(b) | |
| | 522,246 | | | | 2.017 | | | | 04/25/2035 | | | | 522,237 | |
| | Educational Funding of the South, Inc. Series 2012-1, Class A(b) | |
| | 355,023 | | | | 2.602 | | | | 03/25/2036 | | | | 356,785 | |
| | |
| | |
| 48 | | The accompanying notes are an integral part of these financial statements. |
GOLDMAN SACHS VARIABLE INSURANCE TRUST HIGH QUALITY FLOATING RATE FUND
| | | | | | | | | | | | | | |
Principal
Amount | | | Interest
Rate | | | Maturity
Date | | | Value | |
| | Asset-Backed Securities(a) – (continued) | |
| | Student Loans – (continued) | |
| | EFS Volunteer No. 3 LLC Series 2012-1, Class A2(b)(c) | |
| $ | 513,099 | | | | 2.552 | % | | | 02/25/2025 | | | $ | 513,979 | |
| | GCO Education Loan Funding Trust Series 2006-1, Class A8L | |
| | 267,602 | | | | 1.592 | | | | 05/25/2025 | | | | 267,305 | |
| | Higher Education Funding I Series 2005-1, Class A4 | |
| | 7,175 | | | | 1.602 | | | | 02/25/2030 | | | | 7,175 | |
| | Higher Education Funding I Series 2014-1, Class A(b)(c) | |
| | 272,737 | | | | 2.512 | | | | 05/25/2034 | | | | 272,780 | |
| | Illinois Student Assistance Commission Series 2010-1, Class A3(b) | |
| | 200,000 | | | | 2.267 | | | | 07/25/2045 | | | | 200,608 | |
| Kentucky Higher Education Student Loan Corp. Series 2015-1,
Class A1 |
|
| | 647,799 | | | | 2.111 | | | | 12/01/2031 | | | | 646,517 | |
| Montana Higher Education Student Assistance Corp.
Series 2012-1, Class A2(b) |
|
| | 763,559 | | | | 2.283 | | | | 05/20/2030 | | | | 771,107 | |
| | Navient Student Loan Trust Series 2016-2A, Class A1(b)(c) | |
| | 155,040 | | | | 2.302 | | | | 06/25/2065 | | | | 155,416 | |
| | Navient Student Loan Trust Series 2016-5A, Class A(b)(c) | |
| | 1,171,961 | | | | 2.802 | | | | 06/25/2065 | | | | 1,200,067 | |
| | Navient Student Loan Trust Series 2016-7A, Class A(b)(c) | |
| | 265,085 | | | | 2.702 | | | | 03/25/2066 | | | | 271,241 | |
| | Nelnet Student Loan Trust Series 2005-4, Class A3(b) | |
| | 22,451 | | | | 1.453 | | | | 06/22/2026 | | | | 22,445 | |
| | Nelnet Student Loan Trust Series 2006-1, Class A5(b) | |
| | 1,046,333 | | | | 1.564 | | | | 08/23/2027 | | | | 1,043,427 | |
| | Nelnet Student Loan Trust Series 2006-2, Class A5(b) | |
| | 294,150 | | | | 1.467 | | | | 01/25/2030 | | | | 293,789 | |
| | Nelnet Student Loan Trust Series 2013-5A, Class A(b)(c) | |
| | 91,421 | | | | 2.182 | | | | 01/25/2037 | | | | 90,969 | |
| New Hampshire Higher Education Loan Corp. Series 2011-1,
Class A3(b) |
|
| | 200,000 | | | | 2.217 | | | | 10/25/2037 | | | | 199,164 | |
| North Carolina State Education Assistance Authority
Series 2010-1, Class A1(b) |
|
| | 115,664 | | | | 2.267 | | | | 07/25/2041 | | | | 115,263 | |
| Panhandle-Plains Higher Education Authority, Inc. Series 2011-1,
Class A2(b) |
|
| | 267,384 | | | | 2.285 | | | | 07/01/2024 | | | | 267,935 | |
| Pennsylvania Higher Education Assistance Agency Series 2006-1,
Class A3(b) |
|
| | 573,119 | | | | 1.507 | | | | 10/25/2035 | | | | 564,677 | |
| | Scholar Funding Trust Series 2010-A, Class A(b)(c) | |
| | 237,614 | | | | 2.128 | | | | 10/28/2041 | | | | 235,888 | |
| | Scholar Funding Trust Series 2011-A, Class A(b)(c) | |
| | 233,467 | | | | 2.278 | | | | 10/28/2043 | | | | 231,298 | |
| | SLM Student Loan Trust Series 2003-12, Class A5(b)(c) | |
| | 12,378 | | | | 1.868 | | | | 09/15/2022 | | | | 12,383 | |
| | SLM Student Loan Trust Series 2003-14, Class A5(b) | |
| | 18,169 | | | | 1.597 | | | | 01/25/2023 | | | | 18,175 | |
| | SLM Student Loan Trust Series 2005-5, Class A4(b) | |
| | 1,100,000 | | | | 1.507 | | | | 10/25/2028 | | | | 1,095,806 | |
| | SLM Student Loan Trust Series 2005-9, Class A6(b) | |
| | 316,419 | | | | 1.917 | | | | 10/26/2026 | | | | 317,355 | |
| | |
| | Asset-Backed Securities(a) – (continued) | |
| | Student Loans – (continued) | |
| | SLM Student Loan Trust Series 2006-2, Class A5(b) | |
| $ | 146,381 | | | | 1.477 | % | | | 07/25/2025 | | | $ | 146,339 | |
| | SLM Student Loan Trust Series 2007-1, Class A5(b) | |
| | 765,586 | | | | 1.457 | | | | 01/26/2026 | | | | 764,061 | |
| | SLM Student Loan Trust Series 2008-5, Class A4(b) | |
| | 146,788 | | | | 3.067 | | | | 07/25/2023 | | | | 151,427 | |
| | SLM Student Loan Trust Series 2013-3, Class A2(b) | |
| | 1,602 | | | | 1.852 | | | | 05/26/2020 | | | | 1,602 | |
| | SLM Student Loan Trust Series 2014-1, Class A2(b) | |
| | 1,126 | | | | 1.932 | | | | 07/26/2021 | | | | 1,126 | |
| South Texas Higher Education Authority, Inc. Series 2012-1,
Class A2(b) |
|
| | 107,883 | | | | 2.185 | | | | 10/01/2024 | | | | 108,415 | |
| | Utah State Board of Regents Series 2015-1, Class A(b) | |
| | 411,124 | | | | 2.152 | | | | 02/25/2043 | | | | 410,238 | |
| | Wachovia Student Loan Trust Series 2005-1, Class A5(b) | |
| | 30,829 | | | | 1.497 | | | | 01/26/2026 | | | | 30,821 | |
| | | | | | | | | | | | | | |
| | | | | | | | | | | | | 14,334,222 | |
| | |
| | TOTAL ASSET-BACKED SECURITIES | |
| | (Cost $31,032,551) | | | $ | 31,195,716 | |
| | |
| | | | | | | | | | | | | | |
| | Municipal Bond(a)(b)(c) – 0.1% | |
| | New York – 0.1% | |
| Freddie Mac Multifamily ML Certificates RB Pass Through
Series 2017 |
|
| | (1 Mo. LIBOR + 0.50%), | | | | | |
| $ | 98,248 | | | | 2.052 | % | | | 01/25/2033 | | | $ | 99,333 | |
| | (Cost $98,248) | | | | | | | | | |
| | |
| | | | | | | | | | | | | | |
| | U.S. Treasury Obligations – 0.6% | |
| | U.S. Treasury Inflation Linked Bonds (TIPS) | |
| $ | 83,281 | | | | 1.000 | % | | | 02/15/2046 | | | $ | 89,077 | |
| | U.S. Treasury Inflation Linked Notes (TIPS) | |
| | 315,990 | | | | 0.125 | | | | 04/15/2020 | | | | 315,421 | |
| | |
| | TOTAL U.S. TREASURY OBLIGATIONS | | | | | |
| | (Cost $400,778) | | | $ | 404,498 | |
| | |
| | | | | | |
| Shares | | Distribution Rate | | Value | |
| Investment Company(d) –7.9% | |
Goldman Sachs Financial Square Government Fund – Institutional Shares | |
| $5,655,467 | | 1.228% | | $ | 5,655,467 | |
| (Cost $5,655,467) | |
| |
| TOTAL INVESTMENTS – 98.3% | |
| (Cost $69,946,911) | | $ | 70,144,884 | |
| |
OTHER ASSETS IN EXCESS OF LIABILITIES – 1.7% | | | 1,185,695 | |
| |
| NET ASSETS – 100.0% | | $ | 71,330,579 | |
| |
| | |
| The accompanying notes are an integral part of these financial statements. | | 49 |
GOLDMAN SACHS VARIABLE INSURANCE TRUST HIGH QUALITY FLOATING RATE FUND
Schedule of Investments (continued)
December 31, 2017
| | |
| The percentage shown for each investment category reflects the value of investments in that category as a percentage of net assets. |
| (a) | | Variable rate security. Except for floating rate notes (for which final maturity is disclosed), maturity date disclosed is the next interest reset date. Interest rate disclosed is that which is in effect on December 31, 2017. |
| (b) | | Securities with “Call” features. Maturity dates disclosed are the final maturity dates. |
| (c) | | Exempt from registration under Rule 144A of the Securities Act of 1933. Under procedures approved by the Board of Trustees, such securities may be deemed liquid by the Investment Adviser and may be resold, normally to qualified institutional buyers in transactions exempt from registration. Total market value of Rule 144A securities amounts to $13,718,639, which represents approximately 19.2% of net assets as of December 31, 2017. The liquidity determination is unaudited. |
| (d) | | Represents an Affiliated Issuer. |
| | |
| Investment Abbreviations: |
| ACES | | —Alternative Credit Enhancement Securities |
| FHLMC | | —Federal Home Loan Mortgage Corp. |
| FNMA | | —Federal National Mortgage Association |
| GNMA | | —Government National Mortgage Association |
| LIBOR | | —London Interbank Offered Rate |
| Mo. | | —Month |
| RB | | —Revenue Bond |
| REMIC | | —Real Estate Mortgage Investment Conduit |
| TIPS | | —Treasury Inflation-Protected Securities |
|
| Currency Abbreviation: |
| USD | | —United States Dollar |
ADDITIONAL INVESTMENT INFORMATION
FUTURES CONTRACTS — At December 31, 2017, the Fund had the following futures contracts:
| | | | | | | | | | | | | | | | |
| Description | | Number of Contracts | | | Expiration Date | | | Notional Amount | | | Unrealized Appreciation/ (Depreciation) | |
Long position contracts: | |
| 3 Month Eurodollar | | | 1 | | | | 03/19/2018 | | | $ | 245,600 | | | $ | (1,660 | ) |
| 3 Month Eurodollar | | | 1 | | | | 06/18/2018 | | | | 245,188 | | | | (1,993 | ) |
| U.S. Treasury 10 Year Note | | | 37 | | | | 03/20/2018 | | | | 4,589,734 | | | | (29,060 | ) |
U.S. Treasury Ultra Bond | | | 3 | | | | 03/20/2018 | | | | 502,969 | | | | 548 | |
| Total | | | | | | | | | | | | | | $ | (32,165 | ) |
Short position contracts: | | | | | | | | | | | | | |
| U.S. Treasury 10 Year Ultra Note | | | (3 | ) | | | 03/20/2018 | | | | (400,688 | ) | | | 1,862 | |
| U.S. Treasury 2 Year Note | | | (6 | ) | | | 03/29/2018 | | | | (1,284,656 | ) | | | 2,739 | |
| U.S. Treasury 5 Year Note | | | (30 | ) | | | 03/29/2018 | | | | (3,484,922 | ) | | | 16,607 | |
U.S. Treasury Long Bond | | | (12 | ) | | | 03/20/2018 | | | | (1,836,000 | ) | | | 2,909 | |
| Total | | | | | | | | | | | | | | $ | 24,117 | |
| Total Futures Contracts | | | $ | (8,048 | ) |
| | |
| 50 | | The accompanying notes are an integral part of these financial statements. |
GOLDMAN SACHS VARIABLE INSURANCE TRUST HIGH QUALITY FLOATING RATE FUND
ADDITIONAL INVESTMENT INFORMATION (continued)
SWAP CONTRACTS — At December 31, 2017, the Fund had the following swap contracts:
CENTRALLY CLEARED INTEREST RATE SWAP CONTRACTS
| | | | | | | | | | | | | | | | | | | | | | | | |
| Payments Made by the Fund | | Payments
Received by the Fund | | | Termination Date | | | Notional
Amount(a) (000’s) | | | Value | | | Upfront Premium (Received) Paid | | | Unrealized Appreciation/ (Depreciation) | |
| 2.143%(b) | | | 3 Month LIBOR | | | | 07/03/2023 | | | | USD 120 | | | $ | 970 | | | $ | (201 | ) | | $ | 1,171 | |
| 3 Month LIBOR(c) | | | 2.378% | | | | 07/03/2028 | | | | 460 | | | | (2,725 | ) | | | – | | | | (2,725 | ) |
2.56(b) | | | 3 Month LIBOR | | | | 07/03/2048 | | | | 190 | | | | (319 | ) | | | – | | | | (319 | ) |
| TOTAL | | | | | | | | | | | | | | $ | (2,074 | ) | | $ | (201 | ) | | $ | (1,873 | ) |
| (a) | Represents forward starting interest rate swaps whose effective dates of commencement of accruals and cash flows occur subsequent to December 31, 2017. |
| (b) | Payments made semi-annually. |
| (c) | Payments made quarterly. |
| | |
| The accompanying notes are an integral part of these financial statements. | | 51 |
GOLDMAN SACHS VARIABLE INSURANCE TRUST FUNDS
Statements of Assets and Liabilities
December 31, 2017
| | | | | | | | | | | | | | | | |
| | | Core Fixed
Income
Fund | | | Equity Index
Fund | | | Growth
Opportunities
Fund | | | High Quality
Floating Rate
Fund | |
| | | | | | | | | | | | | | | | |
| Assets: | | | | | | | | | | | | |
Investments in unaffiliated issuers, at value (cost $106,154,423, $65,656,943, $120,854,033 and $64,291,444)(a) | | $ | 107,387,654 | | | $ | 176,908,788 | | | $ | 168,919,699 | | | $ | 64,489,417 | |
Investments in affiliated issuers, at value (cost $1,280,522, $297,092, $572 and $5,655,467) | | | 1,280,522 | | | | 697,023 | | | | 572 | | | | 5,655,467 | |
Investments in affiliated securities lending reinvestment vehicle, at value (cost $0, $165,850, $1,040,835 and $0) | | | — | | | | 165,850 | | | | 1,040,835 | | | | — | |
Purchased Options, at value (premiums paid $1,109, $0, $0 and $0) | | | 3,075 | | | | — | | | | — | | | | — | |
Cash | | | 1,731,293 | | | | 968,639 | | | | 2,225,420 | | | | 1,120,549 | |
Foreign currencies, at value (cost $20,259, $0, $0 and $0) | | | 20,624 | | | | — | | | | — | | | | — | |
Receivables: | | | | | | | | | | | | | | | | |
Investments sold on an extended-settlement basis | | | 2,052,821 | | | | — | | | | — | | | | 82,915 | |
Interest and dividends | | | 717,747 | | | | 181,028 | | | | 65,703 | | | | 107,830 | |
Collateral on certain derivative contracts(b) | | | 449,686 | | | | — | | | | — | | | | 34,608 | |
Investments sold | | | 418,092 | | | | 422,459 | | | | — | | | | — | |
Reimbursement from investment adviser | | | 15,909 | | | | 24,564 | | | | 21,651 | | | | 16,408 | |
Securities lending income | | | — | | | | 165 | | | | 670 | | | | — | |
Fund shares sold | | | — | | | | — | | | | 8,761 | | | | 18 | |
Unrealized gain on forward foreign currency exchange contracts | | | 255,051 | | | | — | | | | — | | | | — | |
Variation margin on futures | | | 8,248 | | | | — | | | | — | | | | — | |
Variation margin on swaps | | | — | | | | — | | | | — | | | | 129 | |
Other assets | | | 335 | | | | 324 | | | | 325 | | | | 344 | |
| Total assets | | | 114,341,057 | | | | 179,368,840 | | | | 172,283,636 | | | | 71,507,685 | |
| | | | | | | | | | | | | | | | |
| | | | | | | | | | | | | | | | |
| Liabilities: | | | | | | | | | | | | |
Forward sale contracts, at value (proceeds received $2,052,969, $0, $0 and $0) | | | 2,054,297 | | | | — | | | | — | | | | — | |
Unrealized loss on forward foreign currency exchange contracts | | | 153,234 | | | | — | | | | — | | | | — | |
Variation margin on swaps | | | 47 | | | | — | | | | — | | | | — | |
Variation margin on futures | | | — | | | | 4,697 | | | | — | | | | 24,210 | |
Payables: | | | | | | | | | | | | | | | | |
Investments purchased on an extended-settlement basis | | | 2,091,563 | | | | — | | | | — | | | | — | |
Investments purchased | | | 665,707 | | | | — | | | | 105,553 | | | | — | |
Management fees | | | 36,991 | | | | 31,974 | | | | 120,011 | | | | 17,600 | |
Distribution and Service fees and Transfer Agency fees | | | 24,958 | | | | 41,109 | | | | 26,037 | | | | 16,959 | |
Fund shares redeemed | | | 7,526 | | | | 6,026 | | | | 84,253 | | | | 28,788 | |
Payable upon return of securities loaned | | | — | | | | 165,850 | | | | 1,040,835 | | | | — | |
Accrued expenses | | | 117,933 | | | | 83,582 | | | | 70,271 | | | | 89,549 | |
| Total liabilities | | | 5,152,256 | | | | 333,238 | | | | 1,446,960 | | | | 177,106 | |
| | | | | | | | | | | | | | | | |
| | | | | | | | | | | | | | | | |
| Net Assets: | | | | | | | | | | | | |
Paid-in capital | | | 112,776,469 | | | | 72,161,963 | | | | 119,988,311 | | | | 72,170,997 | |
Undistributed net investment income | | | 134,428 | | | | 262,554 | | | | 3,637 | | | | 94,959 | |
Accumulated net realized gain (loss) | | | (5,008,843 | ) | | | (5,057,537 | ) | | | 2,779,062 | | | | (1,123,429 | ) |
Net unrealized gain | | | 1,286,747 | | | | 111,668,622 | | | | 48,065,666 | | | | 188,052 | |
| NET ASSETS | | $ | 109,188,801 | | | $ | 179,035,602 | | | $ | 170,836,676 | | | $ | 71,330,579 | |
Net Assets: | | | | | | | | | | | | | | | | |
Institutional | | $ | 240,538 | | | $ | — | | | $ | 51,733 | | | $ | 56,580 | |
Service | | | 108,948,263 | | | | 179,035,602 | | | | 170,784,943 | | | | 66,548,286 | |
Advisor | | | — | | | | — | | | | — | | | | 4,725,713 | |
Total Net Assets | | $ | 109,188,801 | | | $ | 179,035,602 | | | $ | 170,836,676 | | | $ | 71,330,579 | |
Shares outstanding $0.001 par value (unlimited shares authorized): | | | | | | | | | | | | | | | | |
Institutional | | | 22,571 | | | | — | | | | 6,648 | | | | 5,430 | |
Service | | | 10,228,645 | | | | 10,785,574 | | | | 22,182,853 | | | | 6,398,990 | |
Advisor | | | — | | | | — | | | | — | | | | 453,901 | |
Net asset value, offering and redemption price per share: | | | | | | | | | | | | | | | | |
Institutional | | | $10.66 | | | | $ — | | | | $7.78 | | | | $10.42 | |
Service | | | 10.65 | | | | 16.60 | | | | 7.70 | | | | 10.40 | |
Advisor | | | — | | | | — | | | | — | | | | 10.41 | |
(a) Includes loaned securities having a market value of $156,045 and $623,796 for the Equity Index and Growth Opportunities Funds, respectively.
(b) Segregated for initial margin and/or collateral on transactions as follows:
| | | | | | | | | | | | |
Fund | | Forwards | | | Futures | | | Swaps | |
| Core Fixed Income | | $ | 210,000 | | | $ | 111,984 | | | $ | 127,702 | |
| High Quality Floating Rate | | | — | | | | 21,551 | | | | 13,057 | |
| | |
| 52 | | The accompanying notes are an integral part of these financial statements. |
GOLDMAN SACHS VARIABLE INSURANCE TRUST FUNDS
Statements of Operations
For the Fiscal Year Ended December 31, 2017
| | | | | | | | | | | | | | | | |
| | | Core Fixed
Income
Fund | | | Equity Index
Fund | | | Growth
Opportunities
Fund | | | High Quality
Floating Rate
Fund | |
| | | | | | | | | | | | | | | | |
| Investment income: | |
Interest | | $ | 2,873,789 | | | $ | 604 | | | $ | — | | | $ | 1,162,868 | |
Dividends — unaffiliated issuers | | | — | | | | 3,453,867 | | | | 1,243,471 | | | | — | |
Dividends — affiliated issuers | | | 16,352 | | | | 8,592 | | | | 8,110 | | | | 28,595 | |
Securities lending income — affiliated issuer | | | — | | | | 2,630 | | | | 44,308 | | | | — | |
| Total investment income | | | 2,890,141 | | | | 3,465,693 | | | | 1,295,889 | | | | 1,191,463 | |
| | | | | | | | | | | | | | | | |
| | | | | | | | | | | | | | | | |
| Expenses: | | | | | | | | | | | | |
Management fees | | | 441,682 | | | | 514,959 | | | | 1,687,639 | | | | 281,841 | |
Distribution and Service fees(a) | | | 275,584 | | | | 429,131 | | | | 415,692 | | | | 181,353 | |
Professional fees | | | 118,273 | | | | 84,129 | | | | 78,846 | | | | 101,938 | |
Custody, accounting and administrative services | | | 64,032 | | | | 54,332 | | | | 56,893 | | | | 55,876 | |
Printing and mailing costs | | | 45,929 | | | | 53,716 | | | | 39,294 | | | | 27,398 | |
Transfer Agency fees(a) | | | 22,082 | | | | 34,328 | | | | 33,750 | | | | 14,091 | |
Trustee fees | | | 17,840 | | | | 17,934 | | | | 17,939 | | | | 17,775 | |
Other | | | 6,099 | | | | 24,919 | | | | 8,001 | | | | 7,275 | |
| Total expenses | | | 991,521 | | | | 1,213,448 | | | | 2,338,054 | | | | 687,547 | |
Less — expense reductions | | | (253,059 | ) | | | (382,685 | ) | | | (613,231 | ) | | | (251,865 | ) |
| Net expenses | | | 738,462 | | | | 830,763 | | | | 1,724,823 | | | | 435,682 | |
| NET INVESTMENT INCOME (LOSS) | | | 2,151,679 | | | | 2,634,930 | | | | (428,934 | ) | | | 755,781 | |
| | | | | | | | | | | | | | | | |
| | | | | | | | | | | | | | | | |
| Realized and unrealized gain (loss): | | | | | | | | | | | | |
Net realized gain (loss) from: | | | | | | | | | | | | | | | | |
Investments — unaffiliated issuers (including commissions recaptured of $0, $0, $2,597 and $0) | | | 1,047,880 | | | | 9,418,504 | | | | 21,900,883 | | | | 61,678 | |
Investments — affiliated issuers | | | — | | | | 49,776 | | | | — | | | | — | |
Futures contracts | | | 237,692 | | | | 197,887 | | | | — | | | | (36,923 | ) |
Purchased options | | | 4,623 | | | | — | | | | — | | | | — | |
Swap contracts | | | (142,765 | ) | | | — | | | | — | | | | 3,295 | |
Forward foreign currency exchange contracts | | | (116,141 | ) | | | — | | | | — | | | | — | |
Foreign currency transactions | | | (10,757 | ) | | | — | | | | — | | | | — | |
Net change in unrealized gain (loss) on: | | | | | | | | | | | | | | | | |
Investments — unaffiliated issuers | | | 332,723 | | | | 20,844,044 | | | | 18,521,181 | | | | 217,546 | |
Investments — affiliated issuer | | | — | | | | (9,645 | ) | | | — | | | | — | |
Futures contracts | | | (87,736 | ) | | | 23,969 | | | | — | | | | (13,001 | ) |
Purchased options | | | 1,966 | | | | — | | | | — | | | | — | |
Swap contracts | | | 30,875 | | | | — | | | | — | | | | (1,873 | ) |
Forward foreign currency exchange contracts | | | (16,876 | ) | | | — | | | | — | | | | — | |
Foreign currency translation | | | 310 | | | | — | | | | — | | | | — | |
| Net realized and unrealized gain | | | 1,281,794 | | | | 30,524,535 | | | | 40,422,064 | | | | 230,722 | |
| NET INCREASE IN NET ASSETS RESULTING FROM OPERATIONS | | $ | 3,433,473 | | | $ | 33,159,465 | | | $ | 39,993,130 | | | $ | 986,503 | |
(a) Class specific Distribution and Service, and Transfer Agency fees were as follows:
| | | | | | | | | | | | | | | | | | | | |
| | | Distribution and
Service Fees | | | Transfer Agency Fees | |
Fund | | Service | | | Advisor | | | Institutional | | | Service | | | Advisor | |
Core Fixed Income | | $ | 275,584 | | | | N/A | | | $ | 37 | | | $ | 22,045 | | | | N/A | |
Equity Index | | | 429,131 | | | | N/A | | | | N/A | | | | 34,328 | | | | N/A | |
Growth Opportunities | | | 415,692 | | | | N/A | | | | 497 | | | | 33,253 | | | | N/A | |
High Quality Floating Rate | | | 167,078 | | | $ | 14,275 | | | | 12 | | | | 13,365 | | | $ | 714 | |
| | |
| The accompanying notes are an integral part of these financial statements. | | 53 |
GOLDMAN SACHS VARIABLE INSURANCE TRUST FUNDS
Statements of Changes in Net Assets
| | | | | | | | | | | | | | | | |
| | | Core Fixed Income Fund | | | Equity Index Fund | |
| | | For the
Fiscal Year Ended
December 31, 2017 | | | For the
Fiscal Year Ended
December 31, 2016 | | | For the
Fiscal Year Ended
December 31, 2017 | | | For the
Fiscal Year Ended
December 31, 2016 | |
| | | | | | | | | | | | | | | | |
| From operations: | | | | | | | |
Net investment income (loss) | | $ | 2,151,679 | | | $ | 2,275,333 | | | $ | 2,634,930 | | | $ | 2,824,658 | |
Net realized gain (loss) | | | 1,020,532 | | | | 341,177 | | | | 9,666,167 | | | | 9,625,482 | |
Net change in unrealized gain | | | 261,262 | | | | 197,933 | | | | 20,858,368 | | | | 5,122,443 | |
| Net increase in net assets resulting from operations | | | 3,433,473 | | | | 2,814,443 | | | | 33,159,465 | | | | 17,572,583 | |
| | | | | | | | | | | | | | | | |
| | | | | | | | | | | | | | | | |
| Distributions to shareholders: | | | | | | | |
From net investment income | | | | | | | | | | | | | | | | |
Institutional Shares | | | (5,356 | ) | | | (712 | ) | | | — | | | | — | |
Service Shares | | | (2,870,144 | ) | | | (2,237,128 | ) | | | (2,616,868 | ) | | | (3,549,296 | ) |
Advisor Shares | | | — | | | | — | | | | — | | | | — | |
From net realized gains | | | | | | | | | | | | | | | | |
Institutional Shares | | | — | | | | — | | | | — | | | | — | |
Service Shares | | | — | | | | — | | | | (7,410,709 | ) | | | (7,414,419 | ) |
| Total distributions to shareholders | | | (2,875,500 | ) | | | (2,237,840 | ) | | | (10,027,577 | ) | | | (10,963,715 | ) |
| | | | | | | | | | | | | | | | |
| | | | | | | | | | | | | | | | |
| From share transactions: | | | | | | | |
Proceeds from sales of shares | | | 7,052,506 | | | | 18,825,312 | | | | 2,056,692 | | | | 3,310,921 | |
Reinvestment of distributions | | | 2,875,500 | | | | 2,237,840 | | | | 10,027,577 | | | | 10,963,715 | |
Cost of shares redeemed | | | (11,863,453 | ) | | | (16,023,575 | ) | | | (21,731,411 | ) | | | (24,627,725 | ) |
| Net increase (decrease) in net assets resulting from share transactions | | | (1,935,447 | ) | | | 5,039,577 | | | | (9,647,142 | ) | | | (10,353,089 | ) |
| TOTAL INCREASE (DECREASE) | | | (1,377,474 | ) | | | 5,616,180 | | | | 13,484,746 | | | | (3,744,221 | ) |
| | | | | | | | | | | | | | | | |
| | | | | | | | | | | | | | | | |
| Net assets: | | | | | | | |
| | | | |
Beginning of year | | | 110,566,275 | | | | 104,950,095 | | | | 165,550,856 | | | | 169,295,077 | |
End of year | | $ | 109,188,801 | | | $ | 110,566,275 | | | $ | 179,035,602 | | | $ | 165,550,856 | |
| Undistributed net investment income | | $ | 134,428 | | | $ | 627,950 | | | $ | 262,554 | | | $ | 255,499 | |
| | |
| 54 | | The accompanying notes are an integral part of these financial statements. |
GOLDMAN SACHS VARIABLE INSURANCE TRUST FUNDS
| | | | | | | | | | | | | | |
| Growth Opportunities Fund | | | High Quality Floating Rate Fund | |
For the
Fiscal Year Ended
December 31, 2017 | | | For the
Fiscal Year Ended
December 31, 2016 | | | For the
Fiscal Year Ended
December 31, 2017 | | | For the
Fiscal Year Ended
December 31, 2016 | |
| | | | | | | | | | | | | | |
| | | | | | | | | | | |
| $ | (428,934 | ) | | $ | (604,577 | ) | | $ | 755,781 | | | $ | 532,255 | |
| | 21,900,883 | | | | (776,503 | ) | | | 28,050 | | | | 58,118 | |
| | 18,521,181 | | | | 3,723,297 | | | | 202,672 | | | | 123,607 | |
| | 39,993,130 | | | | 2,342,217 | | | | 986,503 | | | | 713,980 | |
| | | | | | | | | | | | | | |
| | | | | | | | | | | | | | |
| | | | | | | | | | | |
| | | | | | | | | | | | | | |
| | — | | | | — | | | | (956 | ) | | | (314 | ) |
| | — | | | | — | | | | (842,342 | ) | | | (665,766 | ) |
| | — | | | | — | | | | (43,482 | ) | | | (15,910 | ) |
| | | | | | | | | | | | | | |
| | (4,985 | ) | | | (23,519 | ) | | | — | | | | — | |
| | (16,867,555 | ) | | | (1,048,654 | ) | | | — | | | | — | |
| | (16,872,540 | ) | | | (1,072,173 | ) | | | (886,780 | ) | | | (681,990 | ) |
| | | | | | | | | | | | | | |
| | | | | | | | | | | | | | |
| | | | | | | | | | | |
| | 4,405,396 | | | | 18,099,066 | | | | 12,689,584 | | | | 9,233,882 | |
| | 16,872,540 | | | | 1,072,173 | | | | 886,780 | | | | 681,989 | |
| | (33,003,465 | ) | | | (29,684,783 | ) | | | (10,739,000 | ) | | | (12,519,662 | ) |
| (11,725,529 | ) | | | (10,513,544 | ) | | | 2,837,364 | | | | (2,603,791 | ) |
| | 11,395,061 | | | | (9,243,500 | ) | | | 2,937,087 | | | | (2,571,801 | ) |
| | | | | | | | | | | | | | |
| | | | | | | | | | | | | | |
| | | | | | | | | | | |
| | | |
| | 159,441,615 | | | | 168,685,115 | | | | 68,393,492 | | | | 70,965,293 | |
| $ | 170,836,676 | | | $ | 159,441,615 | | | $ | 71,330,579 | | | $ | 68,393,492 | |
| $ | 3,637 | | | $ | 9,808 | | | $ | 94,959 | | | $ | 68,154 | |
| | |
| The accompanying notes are an integral part of these financial statements. | | 55 |
GOLDMAN SACHS VARIABLE INSURANCE CORE FIXED INCOME FUND
Financial Highlights
Selected Data for a Share Outstanding Throughout Each Year
| | | | | | | | | | | | | | | | | | | | | | | | | | | | | | | | | | | | | | | | | | | | | | | | |
| | | | | | Income (loss) from
investment operations | | | | |
| | | Net asset
value,
beginning
of year | | | Net
investment
income(a) | | | Net
realized
and
unrealized
gain (loss) | | | Total from
investment
operations | | | Distributions to
shareholders
From net
investment
income | | | Net asset
value,
end of
year | | | Total
return(b) | | | Net assets,
end of
year
(in 000s) | | | Ratio of
net expenses
to average
net assets | | | Ratio of
total
expenses
to average
net assets | | | Ratio of
net investment
income
to average
net assets | | | Portfolio
turnover
rate(c) | |
FOR THE FISCAL YEARS ENDED DECEMBER 31, | |
2017 - Institutional | | $ | 10.61 | | | $ | 0.23 | | | $ | 0.13 | | | $ | 0.36 | | | $ | (0.31 | ) | | $ | 10.66 | | | | 3.40 | % | | $ | 241 | | | | 0.42 | % | | | 0.65 | % | | | 2.18 | % | | | 229 | % |
2017 - Service | | | 10.60 | | | | 0.21 | | | | 0.12 | | | | 0.33 | | | | (0.28 | ) | | | 10.65 | | | | 3.14 | | | | 108,948 | | | | 0.67 | | | | 0.90 | | | | 1.95 | | | | 229 | |
2016 - Institutional | | | 10.53 | | | | 0.24 | | | | 0.08 | | | | 0.32 | | | | (0.24 | ) | | | 10.61 | | | | 2.98 | | | | 90 | | | | 0.43 | | | | 0.65 | | | | 2.28 | | | | 329 | |
2016 - Service | | | 10.53 | | | | 0.22 | | | | 0.07 | | | | 0.29 | | | | (0.22 | ) | | | 10.60 | | | | 2.70 | | | | 110,476 | | | | 0.67 | | | | 0.91 | | | | 2.05 | | | | 329 | |
2015 - Institutional | | | 10.75 | | | | 0.27 | | | | (0.20 | ) | | | 0.07 | | | | (0.29 | ) | | | 10.53 | | | | 0.60 | | | | 26 | | | | 0.42 | | | | 0.74 | | | | 2.53 | | | | 376 | |
2015 - Service | | | 10.76 | | | | 0.24 | | | | (0.21 | ) | | | 0.03 | | | | (0.26 | ) | | | 10.53 | | | | 0.27 | | | | 104,924 | | | | 0.67 | | | | 0.99 | | | | 2.27 | | | | 376 | |
2014 - Institutional | | | 10.48 | | | | 0.25 | | | | 0.34 | | | | 0.59 | | | | (0.32 | ) | | | 10.75 | | | | 5.68 | | | | 26 | | | | 0.44 | | | | 0.65 | | | | 2.31 | | | | 353 | |
2014 - Service | | | 10.47 | | | | 0.22 | | | | 0.36 | | | | 0.58 | | | | (0.29 | ) | | | 10.76 | | | | 5.61 | | | | 107,063 | | | | 0.68 | | | | 0.91 | | | | 2.06 | | | | 353 | |
2013 - Institutional (Commenced April 30, 2013) | | | 10.91 | | | | 0.15 | | | | (0.38 | ) | | | (0.23 | ) | | | (0.20 | ) | | | 10.48 | | | | (2.13 | ) | | | 24 | | | | 0.43 | (d) | | | 0.69 | (d) | | | 2.10 | (d) | | | 557 | |
2013 - Service | | | 10.88 | | | | 0.20 | | | | (0.35 | ) | | | (0.15 | ) | | | (0.26 | ) | | | 10.47 | | | | (1.35 | ) | | | 116,530 | | | | 0.67 | | | | 0.89 | | | | 1.88 | | | | 557 | |
| (a) | Calculated based on the average shares outstanding methodology. |
| (b) | Assumes investment at the net asset value at the beginning of the year, reinvestment of all distributions, and a complete redemption of the investment at the net asset value at the end of the year. Total returns for periods less than one full year are not annualized. |
| (c) | The Fund’s portfolio turnover rate is calculated in accordance with regulatory requirements, without regard to transactions involving short term investments and certain derivatives. If such transactions were included, the Fund’s portfolio turnover rate may be higher. |
| | | | |
| The accompanying notes are an integral part of these financial statements. | | 56 | | |
GOLDMAN SACHS VARIABLE INSURANCE TRUST EQUITY INDEX FUND
Financial Highlights
Selected Data for a Share Outstanding Throughout Each Year
| | | | | | | | | | | | | | | | | | | | | | | | | | | | | | | | | | | | | | | | | | | | | | | | | | | | | | | | |
| | | | | | Income (loss) from
investment operations | | | Distributions to shareholders | | | | | | | | | | | | | | | | | | | | | | |
| | | Net asset
value,
beginning
of year | | | Net
investment
income(a) | | | Net
realized
and
unrealized
gain (loss) | | | Total from
investment
operations | | | From net
investment
income | | | From
net
realized
gains | | | Total
distributions | | | Net asset
value,
end of
year | | | Total
return(b) | | | Net assets,
end of
year
(in 000s) | | | Ratio of
net expenses
to average
net assets | | | Ratio of
total
expenses
to average
net assets | | | Ratio of
net investment
income
to average
net assets | | | Portfolio
turnover
rate(c) | |
FOR THE FISCAL YEARS ENDED DECEMBER 31, | |
2017 - Service | | $ | 14.49 | | | $ | 0.24 | | | $ | 2.85 | | | $ | 3.09 | | | $ | (0.26 | ) | | $ | (0.72 | ) | | $ | (0.98 | ) | | $ | 16.60 | | | | 21.29 | % | | $ | 179,036 | | | | 0.48 | % | | | 0.71 | % | | | 1.53 | % | | | 2 | % |
2016 - Service | | | 13.91 | | | | 0.25 | | | | 1.35 | | | | 1.60 | | | | (0.33 | ) | | | (0.69 | ) | | | (1.02 | ) | | | 14.49 | | | | 11.41 | | | | 165,551 | | | | 0.48 | | | | 0.73 | | | | 1.73 | | | | 3 | |
2015 - Service | | | 14.91 | | | | 0.32 | | | | (0.18 | ) | | | 0.14 | | | | (0.28 | ) | | | (0.86 | ) | | | (1.14 | ) | | | 13.91 | | | | 0.94 | | | | 169,295 | | | | 0.48 | | | | 0.70 | | | | 2.15 | | | | 4 | |
2014 - Service | | | 13.68 | | | | 0.22 | | | | 1.58 | | | | 1.80 | | | | (0.25 | ) | | | (0.32 | ) | | | (0.57 | ) | | | 14.91 | | | | 13.22 | | | | 190,009 | | | | 0.49 | | | | 0.71 | | | | 1.55 | | | | 2 | |
2013 - Service | | | 10.54 | | | | 0.20 | | | | 3.15 | | | | 3.35 | | | | (0.21 | ) | | | — | | | | (0.21 | ) | | | 13.68 | | | | 31.83 | | | | 193,899 | | | | 0.49 | | | | 0.73 | | | | 1.61 | | | | 3 | |
| (a) | Calculated based on the average shares outstanding methodology. |
| (b) | Assumes investment at the net asset value at the beginning of the year, reinvestment of all distributions, and a complete redemption of the investment at the net asset value at the end of the year. |
| (c) | The Fund’s portfolio turnover rate is calculated in accordance with regulatory requirements, without regard to transactions involving short term investments and certain derivatives. If such transactions were included, the Fund’s portfolio turnover rate may be higher. |
| | | | |
| The accompanying notes are an integral part of these financial statements. | | 57 | | |
GOLDMAN SACHS GROWTH OPPORTUNITIES FUND
Financial Highlights
Selected Data for a Share Outstanding Throughout Each Year
| | | | | | | | | | | | | | | | | | | | | | | | | | | | | | | | | | | | | | | | | | | | | | | | |
| | | | | | Income (loss) from
investment operations | | | | |
| | | Net asset
value,
beginning
of year | | | Net
investment
loss(a) | | | Net
realized
and
unrealized
gain (loss) | | | Total from
investment
operations | | | Distributions to
shareholders
from net
realized gains | | | Net asset
value,
end of
year | | | Total
return(b) | | | Net assets,
end of
year
(in 000s) | | | Ratio of
net expenses
to average
net assets | | | Ratio of
total
expenses
to average
net assets | | | Ratio of
net investment
loss
to average
net assets | | | Portfolio
turnover
rate(c) | |
FOR THE FISCAL YEARS ENDED DECEMBER 31, | |
2017 - Institutional | | $ | 6.78 | | | $ | (0.01 | ) | | $ | 1.85 | | | $ | 1.84 | | | $ | (0.84 | ) | | $ | 7.78 | | | | 27.14 | % | | $ | 52 | | | | 0.87 | % | | | 1.14 | % | | | (0.13 | )% | | | 57 | % |
2017 - Service | | | 6.73 | | | | (0.02 | ) | | | 1.83 | | | | 1.81 | | | | (0.84 | ) | | | 7.70 | | | | 26.92 | | | | 170,785 | | | | 1.02 | | | | 1.39 | | | | (0.26 | ) | | | 57 | |
2016 - Institutional | | | 6.71 | | | | (0.02 | ) | | | 0.14 | | | | 0.12 | | | | (0.05 | ) | | | 6.78 | | | | 1.71 | | | | 3,518 | | | | 0.89 | | | | 1.16 | | | | (0.26 | ) | | | 63 | |
2016 - Service | | | 6.68 | | | | (0.02 | ) | | | 0.12 | | | | 0.10 | | | | (0.05 | ) | | | 6.73 | | | | 1.42 | | | | 155,924 | | | | 1.05 | | | | 1.40 | | | | (0.37 | ) | | | 63 | |
2015 - Institutional | | | 7.72 | | | | (0.01 | ) | | | (0.39 | ) | | | (0.40 | ) | | | (0.61 | ) | | | 6.71 | | | | (5.20 | ) | | | 32 | | | | 0.93 | | | | 1.14 | | | | (0.19 | ) | | | 57 | |
2015 - Service | | | 7.69 | | | | (0.03 | ) | | | (0.37 | ) | | | (0.40 | ) | | | (0.61 | ) | | | 6.68 | | | | (5.20 | ) | | | 168,653 | | | | 1.09 | | | | 1.40 | | | | (0.36 | ) | | | 57 | |
2014 - Institutional | | | 8.59 | | | | (0.02 | ) | | | 0.94 | | | | 0.92 | | | | (1.79 | ) | | | 7.72 | | | | 11.32 | | | | 33 | | | | 1.01 | | | | 1.15 | | | | (0.24 | ) | | | 62 | |
2014 - Service | | | 8.58 | | | | (0.03 | ) | | | 0.93 | | | | 0.90 | | | | (1.79 | ) | | | 7.69 | | | | 11.10 | | | | 201,519 | | | | 1.17 | | | | 1.39 | | | | (0.39 | ) | | | 62 | |
2013 - Institutional (Commenced April 30, 2013) | | | 7.66 | | | | (0.02 | ) | | | 1.52 | | | | 1.50 | | | | (0.57 | ) | | | 8.59 | | | | 19.73 | | | | 30 | | | | 1.00 | (d) | | | 1.16 | (d) | | | (0.27 | )(d) | | | 42 | |
2013 - Service | | | 6.93 | | | | (0.04 | ) | | | 2.26 | | | | 2.22 | | | | (0.57 | ) | | | 8.58 | | | | 32.20 | | | | 201,872 | | | | 1.16 | | | | 1.39 | | | | (0.47 | ) | | | 42 | |
| (a) | Calculated based on the average shares outstanding methodology. |
| (b) | Assumes investment at the net asset value at the beginning of the year, reinvestment of all distributions, and a complete redemption of the investment at the net asset value at the end of the year. Total returns for periods less than one full year are not annualized. |
| (c) | The Fund’s portfolio turnover rate is calculated in accordance with regulatory requirements, without regard to transactions involving short term investments. If such transactions were included, the Fund’s portfolio turnover rate may be higher. |
| | | | |
| The accompanying notes are an integral part of these financial statements. | | 58 | | |
GOLDMAN SACHS VARIABLE INSURANCE TRUST HIGH QUALITY FLOATING RATE FUND
Financial Highlights
Selected Data for a Share Outstanding Throughout Each Year
| | | | | | | | | | | | | | | | | | | | | | | | | | | | | | | | | | | | | | | | | | | | | | | | | | | | | | | | |
| | | | | | Income (loss) from
investment operations | | | Distributions to shareholders | | | | | | | | | | | | | | | | | | | | | | |
| | | Net asset
value,
beginning
of year | | | Net
investment
income(a) | | | Net
realized
and unrealized
gain (loss) | | | Total from
investment
operations | | | From net
investment
income | | | From
net
realized
gains | | | Total
distributions | | | Net asset
value,
end of
year | | | Total
return(b) | | | Net assets,
end of
year
(in 000s) | | | Ratio of
net expenses
to average
net assets | | | Ratio of
total
expenses to
average
net assets | | | Ratio of
net investment
income
to average
net assets | | | Portfolio
turnover
rate(c) | |
FOR THE FISCAL YEARS ENDED DECEMBER 31, | |
2017 - Institutional | | $ | 10.41 | | | $ | 0.14 | | | $ | 0.03 | | | $ | 0.17 | | | $ | (0.16 | ) | | $ | — | | | $ | (0.16 | ) | | $ | 10.42 | | | | 1.62 | % | | $ | 57 | | | | 0.36 | % | | | 0.72 | % | | | 1.33 | % | | | 38 | % |
2017 - Service | | | 10.38 | | | | 0.11 | | | | 0.04 | | | | 0.15 | | | | (0.13 | ) | | | — | | | | (0.13 | ) | | | 10.40 | | | | 1.47 | | | | 66,548 | | | | 0.61 | | | | 0.97 | | | | 1.08 | | | | 38 | |
2017 - Advisor | | | 10.40 | | | | 0.10 | | | | 0.03 | | | | 0.13 | | | | (0.12 | ) | | | — | | | | (0.12 | ) | | | 10.41 | | | | 1.26 | | | | 4,726 | | | | 0.76 | | | | 1.12 | | | | 0.96 | | | | 38 | |
2016 - Institutional | | | 10.40 | | | | 0.11 | | | | 0.03 | | | | 0.14 | | | | (0.13 | ) | | | — | | | | (0.13 | ) | | | 10.41 | | | | 1.35 | | | | 25 | | | | 0.39 | | | | 0.78 | | | | 1.03 | | | | 47 | |
2016 - Service | | | 10.38 | | | | 0.08 | | | | 0.02 | | | | 0.10 | | | | (0.10 | ) | | | — | | | | (0.10 | ) | | | 10.38 | | | | 1.00 | | | | 66,710 | | | | 0.65 | | | | 1.04 | | | | 0.77 | | | | 47 | |
2016 - Advisor | | | 10.40 | | | | 0.06 | | | | 0.03 | | | | 0.09 | | | | (0.09 | ) | | | — | | | | (0.09 | ) | | | 10.40 | | | | 0.96 | | | | 1,658 | | | | 0.80 | | | | 1.18 | | | | 0.62 | | | | 47 | |
2015 - Institutional | | | 10.49 | | | | 0.06 | | | | (0.08 | ) | | | (0.02 | ) | | | (0.07 | ) | | | — | | | | (0.07 | ) | | | 10.40 | | | | (0.16 | ) | | | 25 | | | | 0.38 | | | | 0.81 | | | | 0.54 | | | | 14 | |
2015 - Service | | | 10.47 | | | | 0.03 | | | | (0.07 | ) | | | (0.04 | ) | | | (0.05 | ) | | | — | | | | (0.05 | ) | | | 10.38 | | | | (0.42 | ) | | | 69,625 | | | | 0.64 | | | | 1.05 | | | | 0.28 | | | | 14 | |
2015 - Advisor | | | 10.49 | | | | 0.01 | | | | (0.06 | ) | | | (0.05 | ) | | | (0.04 | ) | | | — | | | | (0.04 | ) | | | 10.40 | | | | (0.57 | ) | | | 1,315 | | | | 0.78 | | | | 1.25 | | | | 0.12 | | | | 14 | |
2014 - Institutional | | | 10.51 | | | | 0.05 | | | | (0.03 | ) | | | 0.02 | | | | (0.04 | ) | | | — | | | | (0.04 | ) | | | 10.49 | | | | 0.17 | | | | 25 | | | | 0.40 | | | | 0.70 | | | | 0.51 | | | | 17 | |
2014 - Service | | | 10.51 | | | | 0.03 | | | | (0.04 | ) | | | (0.01 | ) | | | (0.03 | ) | | | — | | | | (0.03 | ) | | | 10.47 | | | | (0.09 | ) | | | 74,892 | | | | 0.66 | | | | 0.96 | | | | 0.25 | | | | 17 | |
2014-Advisor (Commenced
October 15, 2014) | | | 10.51 | | | | — | (d) | | | (0.02 | ) | | | (0.02 | ) | | | — | | | | — | | | | — | | | | 10.49 | | | | (0.10 | )* | | | 10 | | | | 0.77 | (e) | | | 1.13 | (e) | | | 0.15 | (e) | | | 17 | |
2013 - Institutional (Commenced
April 30, 2013) | | | 10.56 | | | | 0.02 | | | | 0.03 | | | | 0.05 | | | | (0.04 | ) | | | (0.06 | ) | | | (0.10 | )(f) | | | 10.51 | | | | 0.50 | | | | 25 | | | | 0.40 | (e) | | | 0.86 | (e) | | | 0.25 | (e) | | | 467 | |
2013-Service | | | 10.58 | | | | 0.01 | | | | 0.03 | | | | 0.04 | | | | (0.05 | ) | | | (0.06 | ) | | | (0.11 | )(f) | | | 10.51 | | | | 0.40 | | | | 78,142 | | | | 0.70 | | | | 1.10 | | | | 0.08 | | | | 467 | |
| (a) | Calculated based on the average shares outstanding methodology. |
| (b) | Assumes investment at the net asset value at the beginning of the year, reinvestment of all distributions, and a complete redemption of the investment at the net asset value at the end of the year. Total returns for periods less than one full year are not annualized. |
| (c) | The Fund’s portfolio turnover rate is calculated in accordance with regulatory requirements, without regard to transactions involving short term investments and certain derivatives. If such transactions were included, the Fund’s portfolio turnover rate may be higher. |
| (d) | Amount is less than $0.005 per share. |
| (f) | Included a distribution from capital of less than $0.01 per share. |
| * | Represents cumulative total returns |
| | | | |
| The accompanying notes are an integral part of these financial statements. | | 59 | | |
GOLDMAN SACHS VARIABLE INSURANCE TRUST FUNDS
Notes to Financial Statements
December 31, 2017
1. ORGANIZATION
Goldman Sachs Variable Insurance Trust (the “Trust” or “VIT”) is a Delaware statutory trust registered under the Investment Company Act of 1940, as amended (the “Act”), as an open-end management investment company. The following table lists those series of the Trust that are included in this report (collectively, the “Funds” or individually a “Fund”), along with their corresponding share classes and respective diversification status under the Act:
| | | | |
| Fund | | Share Classes Offered | | Diversified/ Non-diversified |
High Quality Floating Rate | | Institutional, Service and Advisor | | Diversified |
Core Fixed Income and Growth Opportunities | | Institutional and Service | | Diversified |
Equity Index | | Service | | Diversified |
Shares of the Trust are offered to a separate account of participating life insurance companies for the purpose of funding variable annuity contracts and variable life insurance policies.
Goldman Sachs Asset Management, L.P. (“GSAM”), an affiliate of Goldman Sachs & Co. LLC (formerly, Goldman, Sachs & Co.) (“Goldman Sachs”), serves as investment adviser to the Funds pursuant to management agreements (the “Agreements”) with the Trust.
2. SIGNIFICANT ACCOUNTING POLICIES
The financial statements have been prepared in accordance with accounting principles generally accepted in the United States of America (“GAAP”) and require management to make estimates and assumptions that may affect the reported amounts and disclosures. Actual results may differ from those estimates and assumptions.
A. Investment Valuation — The Funds’ valuation policy is to value investments at fair value.
B. Investment Income and Investments — Investment income includes interest income, dividend income, and securities lending income. Interest income is accrued daily and adjusted for amortization of premiums and accretion of discounts. Dividend income is recognized on ex-dividend date or, for certain foreign securities, as soon as such information is obtained subsequent to the ex-dividend date. Investment transactions are reflected on trade date. Realized gains and losses are calculated using identified cost. Investment transactions are recorded on the following business day for daily net asset value (“NAV”) calculations. Distributions received from the Funds’ investments in United States (“U.S.”) real estate investment trusts (“REITs”) may be characterized as ordinary income, net capital gain or a return of capital. A return of capital is recorded by the Funds as a reduction to the cost basis of the REIT.
For derivative contracts, realized gains and losses are recorded upon settlement of the contract. Upfront payments, if any, are made or received upon entering into a swap agreement and are reflected in the Statements of Assets and Liabilities. Upfront payments are recognized over the contract’s term/event as realized gains or losses, with the exception of forward starting interest rate swaps whose realized gains or losses are recognized from the effective start date. For securities with paydown provisions, principal payments received are treated as a proportionate reduction to the cost basis of the securities, and excess or shortfall amounts are recorded as income. For treasury inflation protected securities (“TIPS”), adjustments to principal due to inflation/deflation are reflected as increases/decreases to interest income with a corresponding adjustment to cost.
C. Class Allocations and Expenses — Investment income, realized and unrealized gain (loss), if any, and non-class specific expenses of each Fund are allocated daily based upon the proportion of net assets of each class. Non-class specific expenses directly incurred by a Fund are charged to that Fund, while such expenses incurred by the Trust are allocated across the applicable Funds on a straight-line and/or pro-rata basis depending upon the nature of the expenses. Class-specific expenses, where applicable, are borne by the respective share classes and include Distribution and Service and Transfer Agency fees.
60
GOLDMAN SACHS VARIABLE INSURANCE TRUST FUNDS
2. SIGNIFICANT ACCOUNTING POLICIES (continued)
D. Federal Taxes and Distributions to Shareholders — It is each Fund’s policy to comply with the requirements of the Internal Revenue Code of 1986, as amended (the “Code”), applicable to regulated investment companies (mutual funds) and to distribute each year substantially all of its investment company taxable income and capital gains to its shareholders. Accordingly, each Fund is not required to make any provisions for the payment of federal income tax. Distributions to shareholders are recorded on the ex-dividend date. Income and capital gains distributions, if any, are declared and paid according to the following schedule:
| | | | |
| Fund | | Income Distributions Declared/Paid | | Capital Gains Distributions Declared/Paid |
Core Fixed Income and High Quality Floating Rate | | Quarterly | | Annually |
Equity Index and Growth Opportunities | | Annually | | Annually |
Net capital losses, if any, are carried forward to future fiscal years and may be used to the extent allowed by the Code to offset any future capital gains. Losses that are carried forward will retain their character as either short-term or long-term capital losses. Utilization of capital loss carryforwards will reduce the requirement of future capital gains distributions.
The characterization of distributions to shareholders for financial reporting purposes is determined in accordance with federal income tax rules, which may differ from GAAP. The source of each Fund’s distributions may be shown in the accompanying financial statements as either from net investment income, net realized gain or capital. Certain components of the Funds’ net assets on the Statements of Assets and Liabilities reflect permanent GAAP/tax differences based on the appropriate tax character.
E. Foreign Currency Translation — The accounting records and reporting currency of a Fund are maintained in U.S. dollars. Assets and liabilities denominated in foreign currencies are translated into U.S. dollars using the current exchange rates at the close of each business day. The effect of changes in foreign currency exchange rates on investments is included within net realized and unrealized gain (loss) on investments. Changes in the value of other assets and liabilities as a result of fluctuations in foreign exchange rates are included in the Statements of Operations within net change in unrealized gain (loss) on foreign currency translation. Transactions denominated in foreign currencies are translated into U.S. dollars on the date the transaction occurred, the effects of which are included within net realized gain (loss) on foreign currency transactions.
F. Commission Recapture — GSAM, on behalf of certain Funds, may direct portfolio trades, subject to seeking best execution, to various brokers who have agreed to rebate a portion of the commissions generated. Such rebates are made directly to a Fund as cash payments and are included in net realized gain (loss) from investments on the Statements of Operations.
3. INVESTMENTS AND FAIR VALUE MEASUREMENTS
U.S. GAAP defines the fair value of a financial instrument as the amount that would be received to sell an asset or paid to transfer a liability in an orderly transaction between market participants at the measurement date (i.e., the exit price); the Funds’ policy is to use the market approach. GAAP establishes a fair value hierarchy that prioritizes the inputs to valuation techniques used to measure fair value. The hierarchy gives the highest priority to unadjusted quoted prices in active markets for identical assets or liabilities (Level 1 measurements) and the lowest priority to unobservable inputs (Level 3 measurements). The levels used for classifying investments are not necessarily an indication of the risk associated with investing in these investments. The three levels of the fair value hierarchy are described below:
Level 1 — Unadjusted quoted prices in active markets that are accessible at the measurement date for identical, unrestricted assets or liabilities;
Level 2 — Quoted prices in markets that are not active or financial instruments for which significant inputs are observable (including, but not limited to, quoted prices for similar investments, interest rates, foreign exchange rates, volatility and credit spreads), either directly or indirectly;
Level 3 — Prices or valuations that require significant unobservable inputs (including GSAM’s assumptions in determining fair value measurement).
61
GOLDMAN SACHS VARIABLE INSURANCE TRUST FUNDS
Notes to Financial Statements (continued)
December 31, 2017
3. INVESTMENTS AND FAIR VALUE MEASUREMENTS (continued)
Changes in valuation techniques may result in transfers into or out of an assigned level within the hierarchy. In accordance with the Funds’ policy, transfers between different levels of the fair value hierarchy resulting from such changes are deemed to have occurred as of the beginning of the reporting period.
The Board of Trustees (“Trustees”) has approved Valuation Procedures that govern the valuation of the portfolio investments held by the Funds, including investments for which market quotations are not readily available. The Trustees have delegated to GSAM day-to-day responsibility for implementing and maintaining internal controls and procedures related to the valuation of the Funds’ investments. To assess the continuing appropriateness of pricing sources and methodologies, GSAM regularly performs price verification procedures and issues challenges as necessary to third party pricing vendors or brokers, and any differences are reviewed in accordance with the Valuation Procedures.
A. Level 1 and Level 2 Fair Value Investments — The valuation techniques and significant inputs used in determining the fair values for investments classified as Level 1 and Level 2 are as follows:
Equity Securities — Equity securities traded on a U.S. securities exchange or the NASDAQ system, or those located on certain foreign exchanges, including but not limited to the Americas, are valued daily at their last sale price or official closing price on the principal exchange or system on which they are traded. If there is no sale or official closing price or such price is believed by GSAM to not represent fair value, equity securities are valued at the last bid price for long positions and at the last ask price for short positions. To the extent these investments are actively traded, they are classified as Level 1 of the fair value hierarchy, otherwise they are generally classified as Level 2.
Unlisted equity securities for which market quotations are available are valued at the last sale price on the valuation date, or if no sale occurs, at the last bid price. Unlisted equities are generally classified as Level 2 (fair valued and single source broker securities may be treated differently).
Money Market Funds — Investments in the Goldman Sachs Financial Square Government Fund (“Underlying Fund”) are valued at the NAV of the Institutional Share class on the day of valuation. These investments are generally classified as Level 1 of the fair value hierarchy. For information regarding an Underlying Fund’s accounting policies and investment holdings, please see the Underlying Fund’s shareholder report.
Debt Securities — Debt securities for which market quotations are readily available are valued daily on the basis of quotations supplied by dealers or an independent pricing service approved by the Trustees. The pricing services may use valuation models or matrix pricing, which consider: (i) yield or price with respect to bonds that are considered comparable in characteristics such as rating, interest rate and maturity date or (ii) quotations from securities dealers to determine current value. With the exception of treasury securities of G8 countries, which are generally classified as Level 1, these investments are generally classified as Level 2 of the fair value hierarchy.
i. Mortgage-Backed and Asset-Backed Securities — Mortgage-backed securities represent direct or indirect participations in, or are collateralized by and payable from, mortgage loans secured by residential and/or commercial real estate property. Asset-backed securities include securities whose principal and interest payments are collateralized by pools of other assets or receivables. The value of certain mortgage-backed and asset-backed securities (including adjustable rate mortgage loans) may be particularly sensitive to changes in prevailing interest rates. The value of these securities may also fluctuate in response to the market’s perception of the creditworthiness of the issuers.
Asset-backed securities may present credit risks that are not presented by mortgage-backed securities because they generally do not have the benefit of a security interest in collateral that is comparable to mortgage assets. Some asset-backed securities may only have a subordinated claim on collateral.
Stripped mortgage-backed securities are usually structured with two different classes: one that receives substantially all interest payments (interest-only, or “IO” and/or high coupon rate with relatively low principal amount, or “IOette”), and the other that receives substantially all principal payments (principal-only, or “PO”) from a pool of mortgage loans. Little to no principal will be received at the maturity of an IO; as a result, periodic adjustments are recorded to reduce the cost of the security until maturity. These adjustments are included in interest income.
62
GOLDMAN SACHS VARIABLE INSURANCE TRUST FUNDS
3. INVESTMENTS AND FAIR VALUE MEASUREMENTS (continued)
ii. Mortgage Dollar Rolls — Mortgage dollar rolls are transactions whereby a Fund sells mortgage-backed-securities and simultaneously contracts with the same counterparty to repurchase similar securities on a specified future date. During the settlement period, a Fund will not be entitled to accrue interest and receive principal payments on the securities sold. The Funds account for mortgage dollar roll transactions as purchases and sales and realize gains and losses on these transactions.
iii. Treasury Inflation Protected Securities — TIPS are treasury securities in which the principal amount is adjusted daily to keep pace with inflation, as measured by the U.S. Consumer Pricing Index for Urban Consumers. The repayment of the original bond principal upon maturity is guaranteed by the full faith and credit of the U.S. Government.
iv. When-Issued Securities and Forward Commitments — When-issued securities, including TBA (“To Be Announced”) securities, are securities that are authorized but not yet issued in the market and purchased in order to secure what is considered to be an advantageous price or yield to a Fund. A forward commitment involves entering into a contract to purchase or sell securities, typically on an extended settlement basis, for a fixed price at a future date. The purchase of securities on a when-issued or forward commitment basis involves a risk of loss if the value of the security to be purchased declines before the settlement date. Conversely, the sale of securities on a forward commitment basis involves the risk that the value of the securities sold may increase before the settlement date. Although a Fund will generally purchase securities on a when-issued or forward commitment basis with the intention of acquiring the securities for its portfolio, the Fund may dispose of when-issued securities or forward commitments prior to settlement, which may result in a realized gain or loss.
Derivative Contracts — A derivative is an instrument whose value is derived from underlying assets, indices, reference rates or a combination of these factors. A Fund enters into derivative transactions to hedge against changes in interest rates, securities prices, and/or currency exchange rates, to increase total return, or to gain access to certain markets or attain exposure to other underliers.
Exchange-traded derivatives, including futures and options contracts, are valued at the last sale or settlement price and typically fall within Level 1 of the fair value hierarchy. Over-the-counter (“OTC”) and centrally cleared derivatives are valued using market transactions and other market evidence, including market-based inputs to models, calibration to market-clearing transactions, broker or dealer quotations, or other alternative pricing sources. Where models are used, the selection of a particular model to value OTC and centrally cleared derivatives depends upon the contractual terms of, and specific risks inherent in, the instrument, as well as the availability of pricing information in the market. Valuation models require a variety of inputs, including contractual terms, market prices, yield curves, credit curves, measures of volatility, voluntary and involuntary prepayment rates, loss severity rates and correlations of such inputs. For OTC and centrally cleared derivatives that trade in liquid markets, model inputs can generally be verified and model selection does not involve significant management judgment. OTC and centrally cleared derivatives are classified within Level 2 of the fair value hierarchy when significant inputs are corroborated by market evidence.
i. Forward Contracts — A forward contract is a contract between two parties to buy or sell an asset at a specified price on a future date. A forward contract settlement can occur on a cash or delivery basis. Forward contracts are marked-to-market daily using independent vendor prices, and the change in value, if any, is recorded as an unrealized gain or loss. Cash and certain investments may be used to collateralize forward contracts.
A forward foreign currency exchange contract is a forward contract in which a Fund agrees to receive or deliver a fixed quantity of one currency for another, at a pre-determined price at a future date. All forward foreign currency exchange contracts are marked-to-market daily at the applicable forward rate. Non-deliverable forward foreign currency exchange contracts are settled with the counterparty in cash without the delivery of foreign currency.
ii. Futures Contracts — Futures contracts are contracts to buy or sell a standardized quantity of a specified commodity or security and are valued based on exchanged settlement prices or independent market quotes. Futures contracts are valued at the last settlement price, or in the absence of a sale, the last bid price for long positions and at the last ask price for short positions, at the end of each day on the board of trade or exchange upon which they are traded. Upon entering into a futures contract, a Fund deposits cash or securities in an account on behalf of the broker in an amount sufficient to meet the initial margin requirement. Subsequent payments are made or received by a Fund equal to the daily change in the contract value and are
63
GOLDMAN SACHS VARIABLE INSURANCE TRUST FUNDS
Notes to Financial Statements (continued)
December 31, 2017
3. INVESTMENTS AND FAIR VALUE MEASUREMENTS (continued)
recorded as variation margin receivable or payable with a corresponding offset to unrealized gains or losses. For financial reporting purposes, cash collateral that has been pledged to cover obligations of the Funds and cash collateral received, if, any, is reported separately on the Statements of Assets and Liabilities as receivables/payables for collateral on certain derivative contracts. Non-cash collateral pledged by a Fund, if any, is noted in the Schedules of Investments.
iii. Options — When a Fund writes call or put options, an amount equal to the premium received is recorded as a liability and is subsequently marked-to-market to reflect the current value of the option written. Swaptions are options on interest rate swap contracts.
Upon the purchase of a call option or a put option by a Fund, the premium paid is recorded as an investment and subsequently marked-to-market to reflect the current value of the option. Certain options may be purchased with premiums to be determined on a future date. The premiums for these options are based upon implied volatility parameters at specified terms.
iv. Swap Contracts — Bilateral swap contracts are agreements in which a Fund and a counterparty agree to exchange periodic payments on a specified notional amount or make a net payment upon termination. Bilateral swap transactions are privately negotiated in the OTC market and payments are settled through direct payments between a Fund and the counterparty. By contrast, certain swap transactions are subject to mandatory central clearing. These swaps are executed through a derivatives clearing member (“DCM”), acting in an agency capacity, and submitted to a central counterparty (“CCP”) (“centrally cleared swaps”), in which case all payments are settled with the CCP through the DCM. Swaps are marked-to-market daily using pricing vendor quotations, counterparty or clearinghouse prices or model prices, and the change in value, if any, is recorded as an unrealized gain or loss. Upon entering into a swap contract, a Fund is required to satisfy an initial margin requirement by delivering cash or securities to the counterparty (or in some cases, segregated in a triparty account on behalf of the counterparty), which can be adjusted by any mark-to-market gains or losses pursuant to bilateral or centrally cleared arrangements. For centrally cleared swaps the daily change in valuation, if any, is recorded as a receivable or payable for variation margin.
An interest rate swap is an agreement that obligates two parties to exchange a series of cash flows at specified intervals, based upon or calculated by reference to changes in interest rates on a specified notional principal amount. The payment flows are usually netted against each other, with the difference being paid by one party to the other.
A credit default swap is an agreement that involves one party (the buyer of protection) making a stream of payments to another party (the seller of protection) in exchange for the right to receive protection on a reference security or obligation, including a group of assets or exposure to the performance of an index. A Fund’s investment in credit default swaps may involve greater risks than if the Fund had invested in the referenced obligation directly. Credit events are contract specific but may include bankruptcy, failure to pay, restructuring and obligation acceleration. If a Fund buys protection through a credit default swap and no credit event occurs, its payments are limited to the periodic payments previously made to the counterparty. Upon the occurrence of a specified credit event, a Fund, as a buyer of credit protection, is entitled to receive an amount equal to the notional amount of the swap and deliver to the seller the defaulted reference obligation in a physically settled trade. A Fund may also receive a net settlement amount in the form of cash or securities equal to the notional amount of the swap reduced by the recovery value of the reference obligation in a cash settled trade.
As a seller of protection, a Fund generally receives a payment stream throughout the term of the swap, provided that there is no credit event. In addition, if a Fund sells protection through a credit default swap, a Fund could suffer a loss because the value of the referenced obligation and the premium payments received may be less than the notional amount of the swap paid to the buyer of protection. Upon the occurrence of a specified credit event, a Fund, as a seller of credit protection, may be required to take possession of the defaulted reference obligation and pay the buyer an amount equal to the notional amount of the swap in a physically settled trade. A Fund may also pay a net settlement amount in the form of cash or securities equal to the notional amount of the swap reduced by the recovery value of the reference obligation in a cash settled trade. Recovery values are at times established through the credit event auction process in which market participants are ensured that a
64
GOLDMAN SACHS VARIABLE INSURANCE TRUST FUNDS
3. INVESTMENTS AND FAIR VALUE MEASUREMENTS (continued)
transparent price has been set for the defaulted security or obligation. In addition, a Fund is entitled to a return of any assets, which have been pledged as collateral to the counterparty upon settlement.
The maximum potential amount of future payments (undiscounted) that a Fund as seller of protection could be required to make under a credit default swap would be an amount equal to the notional amount of the agreement. These potential amounts would be partially offset by any recovery values of the respective referenced obligations or net amounts received from a settlement of a credit default swap for the same reference security or obligation where a Fund bought credit protection.
B. Level 3 Fair Value Investments — To the extent that significant inputs to valuation models and other alternative pricing sources are unobservable, or if quotations are not readily available, or if GSAM believes that such quotations do not accurately reflect fair value, the fair value of a Fund’s investments may be determined under Valuation Procedures approved by the Trustees. GSAM, consistent with its procedures and applicable regulatory guidance, may make an adjustment to the most recent valuation prices of either domestic or foreign securities in light of significant events to reflect what it believes to be the fair value of the securities at the time of determining a Fund’s NAV. Significant events which could affect a large number of securities in a particular market may include, but are not limited to: significant fluctuations in U.S. or foreign markets; market dislocations; market disruptions; or unscheduled market closings. Significant events which could also affect a single issuer may include, but are not limited to: corporate actions such as reorganizations, mergers and buy-outs; ratings downgrades; and bankruptcies.
C. Fair Value Hierarchy — The following is a summary of the Funds’ investments and derivatives classified in the fair value hierarchy as of December 31, 2017:
| | | | | | | | | | | | |
| | | |
| CORE FIXED INCOME | | | | | | | | | |
| Investment Type | | Level 1 | | | Level 2 | | | Level 3 | |
| Assets | | | | | | | | | | | | |
| Fixed Income | | | | | | | | | | | | |
Corporate Bonds | | $ | — | | | $ | 41,908,102 | | | $ | — | |
Mortgage-Backed Securities | | | — | | | | 22,709,224 | | | | — | |
Collateralized Mortgage Obligations | | | — | | | | 2,133,146 | | | | — | |
U.S. Treasury Obligations and/or Other U.S. Government Agencies | | | 21,932,870 | | | | 2,135,607 | | | | — | |
Asset-Backed Securities | | | — | | | | 12,471,619 | | | | — | |
Foreign Government Securities | | | — | | | | 2,906,859 | | | | — | |
Supranational | | | — | | | | 199,636 | | | | — | |
Municipal Bonds | | | — | | | | 990,591 | | | | — | |
| Investment Company | | | 1,280,522 | | | | — | | | | — | |
| Total | | $ | 23,213,392 | | | $ | 85,454,784 | | | $ | — | |
| Liabilities | | | | | | | | | | | | |
| Fixed Income | | | | | | | | | | | | |
Mortgage-Backed Obligations — Forward Sales Contracts | | $ | — | | | $ | (2,054,297 | ) | | $ | — | |
| | | |
| Derivative Type | | | | | | | | | |
| Assets | | | | | | | | | | | | |
| Forward Foreign Currency Exchange Contracts(a) | | $ | — | | | $ | 255,051 | | | $ | — | |
| Futures Contracts(a) | | | 45,149 | | | | — | | | | — | |
| Inflation-Linked Swap Contracts(a) | | | — | | | | 491 | | | | — | |
| Interest Rate Swap Contracts(a) | | | — | | | | 56,946 | | | | — | |
| Purchased Option Contract | | | 3,075 | | | | — | | | | — | |
| Total | | $ | 48,224 | | | $ | 312,488 | | | $ | — | |
65
GOLDMAN SACHS VARIABLE INSURANCE TRUST FUNDS
Notes to Financial Statements (continued)
December 31, 2017
3. INVESTMENTS AND FAIR VALUE MEASUREMENTS (continued)
| | | | | | | | | | | | |
| | | |
| CORE FIXED INCOME (continued) | | | | | | | | | |
| Derivative Type | | Level 1 | | | Level 2 | | | Level 3 | |
| Liabilities(a) | | | | | | | | | | | | |
| Forward Foreign Currency Exchange Contracts | | $ | — | | | $ | (153,234 | ) | | $ | — | |
| Futures Contracts | | | (62,817 | ) | | | — | | | | — | |
| Inflation-Linked Swap Contracts | | | — | | | | (5,313 | ) | | | — | |
| Interest Rate Swap Contracts | | | — | | | | (84,645 | ) | | | — | |
| Total | | $ | (62,817 | ) | | $ | (243,192 | ) | | $ | — | |
| | | |
| EQUITY INDEX | | | | | | | | | |
| Investment Type | | Level 1 | | | Level 2 | | | Level 3 | |
| Assets | | | | | | | | | | | | |
| Common Stock and/or Other Equity Investments(b) | | | | | | | | | | | | |
Europe | | $ | 199,586 | | | $ | — | | | $ | — | |
North America | | | 177,356,278 | | | | — | | | | — | |
| U.S. Treasury Obligations and/or Other U.S. Government Agencies | | | 49,947 | | | | — | | | | — | |
| Securities Lending Reinvestment Vehicle | | | 165,850 | | | | — | | | | — | |
| Total | | $ | 177,771,661 | | | $ | — | | | $ | — | |
| | | |
| Derivative Type | | | | | | | | | |
| Assets(a) | | | | | | | | | | | | |
| Futures Contracts | | $ | 16,846 | | | $ | — | | | $ | — | |
| | | |
| GROWTH OPPORTUNITIES | | | | | | | | | |
| Investment Type | | Level 1 | | | Level 2 | | | Level 3 | |
| Assets | | | | | | | | | | | | |
| Common Stock and/or Other Equity Investments(b) | | | | | | | | | | | | |
North America | | $ | 168,919,699 | | | $ | — | | | $ | — | |
| Investment Company | | | 572 | | | | — | | | | — | |
| Securities Lending Reinvestment Vehicle | | | 1,040,835 | | | | — | | | | — | |
| Total | | $ | 169,961,106 | | | $ | — | | | $ | — | |
66
GOLDMAN SACHS VARIABLE INSURANCE TRUST FUNDS
3. INVESTMENTS AND FAIR VALUE MEASUREMENTS (continued)
| | | | | | | | | | | | |
| | | |
| HIGH QUALITY FLOATING RATE | | | | | | | | | |
| Investment Type | | Level 1 | | | Level 2 | | | Level 3 | |
| Assets | | | | | | | | | | | | |
| Fixed Income | | | | | �� | | | | | | | |
U.S. Treasury Obligations and/or Other U.S. Government Agencies | | $ | 404,498 | | | $ | — | | | $ | — | |
Mortgage-Backed Securities | | | — | | | | 4,708,032 | | | | — | |
Collateralized Mortgage Obligations | | | — | | | | 27,583,328 | | | | — | |
Commercial Mortgage-Backed Security | | | — | | | | 498,510 | | | | — | |
Asset-Backed Securities | | | — | | | | 31,195,716 | | | | — | |
Municipal Bonds | | | — | | | | 99,333 | | | | — | |
| Investment Company | | | 5,655,467 | | | | — | | | | — | |
| Total | | $ | 6,059,965 | | | $ | 64,084,919 | | | $ | — | |
| | | |
| Derivative Type | | | | | | | | | |
| Assets(a) | | | | | | | | | | | | |
| Futures Contracts | | $ | 24,665 | | | $ | — | | | $ | — | |
| Interest Rate Swap Contracts | | | — | | | | 1,171 | | | | — | |
| Total | | $ | 24,665 | | | $ | 1,171 | | | $ | — | |
| Liabilities(a) | | | | | | | | | | | | |
| Futures Contracts | | $ | (32,713 | ) | | $ | — | | | $ | — | |
| Interest Rate Swap Contracts | | | — | | | | (3,044 | ) | | | — | |
| Total | | $ | (32,713 | ) | | $ | (3,044 | ) | | $ | — | |
| (a) | Amount shown represents unrealized gain (loss) at fiscal year end. |
| (b) | Amounts are disclosed by continent to highlight the impact of time zone differences between local market close and the calculation of NAV. Security valuations are based on the principal exchange or system on which they are traded, which may differ from country of domicile noted in the table. |
For further information regarding security characteristics, see the Schedules of Investments.
4. INVESTMENTS IN DERIVATIVES
The following tables set forth, by certain risk types, the gross value of derivative contracts (not considered to be hedging instruments for accounting disclosure purposes) as of December 31, 2017. These instruments were used as part of the Funds’ investment strategies and to obtain and/or manage exposure related to the risks below. The values in the tables below exclude the effects of cash collateral received or posted pursuant to these derivative contracts, and therefore are not representative of the Funds’ net exposure.
Core Fixed Income
| | | | | | | | | | | | | | |
| Risk | | | | Statements of Assets and Liabilities | | Assets | | | Statements of Assets and Liabilities | | Liabilities | |
| Interest Rate | | | | Variation margin on futures and swaps and purchased option contracts | | $ | 105,661 | (a) | | Variation margin on futures and swaps | | $ | (152,775 | )(a) |
| Currency | | | | Receivables for unrealized gain on forward foreign currency exchange contracts | | | 255,051 | | | Payable for unrealized loss on forward foreign currency exchange contracts | | | (153,234 | ) |
| Total | | | | | | $ | 360,712 | | | | | $ | (306,009 | ) |
67
GOLDMAN SACHS VARIABLE INSURANCE TRUST FUNDS
Notes to Financial Statements (continued)
December 31, 2017
4. INVESTMENTS IN DERIVATIVES (continued)
| | | | | | | | | | | | | | |
| Fund | | Risk | | Statements of Assets and Liabilities | | Assets(a) | | | Statements of Assets and Liabilities | | Liabilities(a) | |
| Equity Index | | Equity | | Variation margin on futures | | $ | 16,846 | | | — | | $ | — | |
| High Quality Floating Rate | | Interest Rate | | Variation margin on futures and swaps | | | 25,836 | | | Variation margin on futures and swaps | | | (35,757 | ) |
| (a) | Includes unrealized gain (loss) on futures contracts and centrally cleared swap contracts described in the Additional Investment Information sections of the Schedules of Investments. Only the variation margin as of December 31, 2017 is reported within the Statements of Assets and Liabilities. |
The following tables set forth, by certain risk types, the Funds’ gains (losses) related to these derivatives and their indicative volumes for the fiscal year ended December 31, 2017. These gains (losses) should be considered in the context that these derivative contracts may have been executed to create investment opportunities and/or economically hedge certain investments, and accordingly, certain gains (losses) on such derivative contracts may offset certain (losses) gains attributable to investments. These gains (losses) are included in “Net realized gain (loss)” or “Net change in unrealized gain (loss)” on the Statements of Operations:
Core Fixed Income
| | | | | | | | | | | | | | |
| Risk | | Statements of Operations | | Net Realized Gain (Loss) | | | Net Change in Unrealized Gain (Loss) | | | Average Number of Contracts(a) | |
| Interest Rate | | Net realized gain (loss) from futures contracts, purchased options and swap contracts/Net change in unrealized gain (loss) on futures contracts, purchased options and swap contracts | | $ | 101,926 | | | $ | (56,822 | ) | | | 221 | |
| Credit | | Net realized gain (loss) from swap contracts/Net change in unrealized gain (loss) on swap contracts | | | (2,376 | ) | | | 1,927 | | | | 1 | |
| Currency | | Net realized gain (loss) from forward foreign currency exchange contracts/Net change in unrealized gain (loss) on forward foreign currency exchange contracts | | | (116,141 | ) | | | (16,876 | ) | | | 434 | |
| Total | | | | $ | (16,591 | ) | | $ | (71,771 | ) | | | 656 | |
Equity Index
| | | | | | | | | | | | | | |
| Risk | | Statements of Operations | | Net
Realized
Gain (Loss) | | | Net Change in
Unrealized
Gain (Loss) | | | Average
Number of
Contracts(a) | |
| Equity | | Net realized gain (loss) from futures contracts/Net change in unrealized gain (loss) on futures contracts | | $ | 197,887 | | | $ | 23,969 | | | | 10 | |
High Quality Floating Rate
| | | | | | | | | | | | | | |
| Risk | | Statements of Operations | | Net Realized Gain (Loss) | | | Net Change in Unrealized Gain (Loss) | | | Average Number of Contracts(a) | |
| Interest Rate | | Net realized gain (loss) from futures contracts and swap contracts/Net change in unrealized gain (loss) on futures contracts and swap contracts | | $ | (33,628 | ) | | $ | (14,874 | ) | | | 95 | |
| (a) | Average number of contracts is based on the average of month end balances for the fiscal year ended December 31, 2017. |
68
GOLDMAN SACHS VARIABLE INSURANCE TRUST FUNDS
5. AGREEMENTS AND AFFILIATED TRANSACTIONS
A. Management Agreements — Under the Agreements, GSAM manages the Funds, subject to the general supervision of the Trustees.
As compensation for the services rendered pursuant to the Agreements, the assumption of the expenses related thereto and administration of the Funds’ business affairs, including providing facilities, GSAM is entitled to a management fee, accrued daily and paid monthly, equal to an annual percentage rate of each Fund’s average daily net assets.
For the fiscal year ended December 31, 2017, contractual and effective net management fees with GSAM were at the following rates:
| | | | | | | | | | | | | | | | | | | | | | | | | | | | |
| | | Contractual Management Rate | | | Effective Net Management
Rate^ | |
| Fund | | First $1 billion | | | Next $1 billion | | | Next $3 billion | | | Next $3 billion | | | Over $8 billion | | | Effective Rate | | |
| Core Fixed Income | | | 0.40 | % | | | 0.36 | % | | | 0.34 | % | | | 0.33 | % | | | 0.32 | % | | | 0.40 | % | | | 0.40 | % |
| Growth Opportunities | | | 1.00 | | | | 1.00 | | | | 0.90 | | | | 0.86 | | | | 0.84 | | | | 1.00 | | | | 0.84 | * |
| High Quality Floating Rate | | | 0.40 | | | | 0.36 | | | | 0.34 | | | | 0.33 | | | | 0.32 | | | | 0.40 | | | | 0.29 | * |
| ^ | Effective Net Management Rate includes the impact of management fee waivers of affiliated Underlying Funds, if any. |
| * | GSAM agreed to waive a portion of its management fee in order to achieve net management rates, as defined in the Funds’ most recent prospectuses. These waivers will be effective through at least April 28, 2018, and prior to such date GSAM may not terminate the arrangements without approval of the Trustees. |
The Core Fixed Income, Growth Opportunities and High Quality Floating Rate Funds invest in Institutional Shares of the Goldman Sachs Financial Square Government Fund, which is an affiliated Underlying Fund. GSAM has agreed to waive a portion of its management fee payable by the Funds in an amount equal to the management fee it earns as an investment adviser to the affiliated Underlying Fund in which the Funds invest, except those management fees it earns from the Funds’ investments of cash collateral received in connection with securities lending transactions in the Goldman Sachs Financial Square Government Fund. For the fiscal year ended December 31, 2017, GSAM waived $3,851, $1,736, and $6,038 of the Core Fixed Income, Growth Opportunities, and High Quality Floating Rate Funds’ management fees, respectively.
The Agreement for the Equity Index Fund provides for a contractual management fee at an annual rate equal to 0.30% of the Fund’s average daily net assets. For the fiscal year ended December 31, 2017, GSAM agreed to waive a portion of its management fee in order to achieve the following effective annual rates which will remain in effect through at least April 28, 2018 and prior to such date GSAM may not terminate the arrangement without the approval of the Trustees:
| | | | | | | | | | | | | | |
| Net Management Rate | |
| Fund | | | $0-$400 million | | | Over $400 million | | | Effective Rate | |
| | Equity Index | | | | 0.21 | % | | | 0.20 | % | | | 0.21 | % |
As authorized by the Agreement for the Equity Index Fund, GSAM has entered into a Sub-advisory Agreement with SSgA Funds Management, Inc. (“SSgA”) which serves as the sub-adviser to the Fund and provides the day-to-day advice regarding the Fund’s portfolio transactions. As compensation for its services, SSgA is entitled to a fee, accrued daily and paid monthly by GSAM, at the following annual rates of the Fund’s average daily net assets: 0.03% on the first $50 million, 0.02% on the next $200 million, 0.01% on the next $750 million and 0.008% over $1 billion. The effective sub-advisory fee was 0.02% for the fiscal year ended December 31, 2017.
69
GOLDMAN SACHS VARIABLE INSURANCE TRUST FUNDS
Notes to Financial Statements (continued)
December 31, 2017
5. AGREEMENTS AND AFFILIATED TRANSACTIONS (continued)
B. Distribution and/or Service (12b-1) Plans — The Trust, on behalf of Service Shares of each applicable Fund, has adopted a Distribution and Service Plan subject to Rule 12b-1 under the Act. Under the Distribution and Service Plan, Goldman Sachs, which serves as distributor (the “Distributor”), is entitled to a fee accrued daily and paid monthly, for distribution services and personal and account maintenance services, which may then be paid by Goldman Sachs to authorized dealers, equal to, on an annual basis, 0.25% of the Fund’s average daily net assets attributable to Service Shares. For the fiscal year ended December 31, 2017 for the Growth Opportunities Fund, Goldman Sachs agreed to waive distribution and services fees so as not to exceed an annual rate of 0.16% of average daily net assets of the Fund. This distribution and service fee waiver will remain in place through at least April 28, 2018, and prior to such date Goldman Sachs may not terminate the arrangement without the approval of the Trustees.
The Trust, on behalf of Advisor Shares of each applicable Fund, has adopted a Distribution Plan subject to Rule 12b-1 under the Act. Under the Distribution Plan, Goldman Sachs as Distributor is entitled to a fee accrued daily and paid monthly for distribution services, which may then be paid by Goldman Sachs to authorized dealers, equal to, on an annual basis, 0.15% of the Fund’s average daily net assets attributable to Advisor Shares.
C. Service Plans — The Trust, on behalf of Advisor Shares of each applicable Fund, has adopted a Service Plan to allow Advisor Shares to compensate service organizations (including Goldman Sachs) for providing varying levels of personal and account maintenance and administration services to their customers who are beneficial owners of such shares. The Service Plans each provide for compensation to the service organizations equal to 0.25% of the average daily net assets attributable to Advisor Shares of the Fund.
D. Transfer Agency Agreement — Goldman Sachs also serves as the transfer agent of the Funds for a fee pursuant to the Transfer Agency Agreement. The fees charged for such transfer agency services are accrued daily and paid monthly at an annual rate of 0.02% of the average daily net assets of Institutional, Service and Advisor Shares.
E. Other Expense Agreements and Affiliated Transactions — GSAM has agreed to limit certain “Other Expenses” of the Funds (excluding acquired fund fees and expenses, transfer agency fees and expenses, service fees and shareholder administration fees (as applicable), taxes, interest, brokerage fees, expenses of shareholder meetings, litigation and indemnification, and extraordinary expenses) to the extent such expenses exceed, on an annual basis, a percentage rate of the average daily net assets of each Fund. Such Other Expense reimbursements, if any, are accrued daily and paid monthly. In addition, the Funds are not obligated to reimburse GSAM for prior fiscal year expense reimbursements, if any. The Other Expense limitations as an annual percentage rate of average daily net assets for Core Fixed Income, Equity Index, Growth Opportunities and High Quality Floating Rate Funds are 0.004%, 0.004%, 0.004% and 0.034%, respectively. Prior to April 28, 2017, the Other Expense limitation was 0.074% for the High Quality Floating Rate Fund. These Other Expense limitations will remain in place through at least April 28, 2018, and prior to such date GSAM may not terminate the arrangements without the approval of the Trustees. In addition, the Funds have entered into certain offset arrangements with the custodian and the transfer agent, which may result in a reduction of the Funds’ expenses and are received irrespective of the application of the “Other Expense” limitations described above.
For the fiscal year ended December 31, 2017, these expense reductions, including any fee waivers and Other Expense reimbursements, were as follows:
| | | | | | | | | | | | | | | | | | | | |
| Fund | | Management
Fee Waiver | | | Distribution and
Service Fee
Waiver | | | Custody Fee
Credits | | | Other Expense
Reimbursement | | | Total Expense
Reductions | |
| Core Fixed Income | | $ | 3,851 | | | $ | — | | | $ | 1,829 | | | $ | 247,379 | | | $ | 253,059 | |
| Equity Index | | | 154,490 | | | | — | | | | 690 | | | | 227,505 | | | | 382,685 | |
| Growth Opportunities | | | 267,281 | | | | 149,652 | | | | 2,078 | | | | 194,220 | | | | 613,231 | |
| High Quality Floating Rate | | | 74,262 | | | | — | | | | 2,071 | | | | 175,532 | | | | 251,865 | |
70
GOLDMAN SACHS VARIABLE INSURANCE TRUST FUNDS
5. AGREEMENTS AND AFFILIATED TRANSACTIONS (continued)
F. Line of Credit Facility — As of December 31, 2017, the Funds participated in a $1,100,000,000 committed, unsecured revolving line of credit facility (the “facility”) together with other funds of the Trust and certain registered investment companies having management agreements with GSAM or its affiliates. This facility is to be used for temporary emergency purposes, or to allow for an orderly liquidation of securities to meet redemption requests. The interest rate on borrowings is based on the federal funds rate. The facility also requires a fee to be paid by the Funds based on the amount of the commitment that has not been utilized. For the fiscal year ended December 31, 2017, the Funds did not have any borrowings under the facility.
G. Other Transactions with Affiliates — The following table provides information about the investment in shares of issuers of which a Fund is an affiliate as of and for the fiscal year ended December 31, 2017:
| | | | | | | | | | | | | | | | | | | | | | | | | | | | | | | | | | |
| Fund | | Name of
Affiliated Issuer | | Beginning
Value as of
December 31, 2016 | | | Purchases
at Cost | | | Proceeds
from Sales | | | Net Realized
Gain (Loss) | | | Change in
Unrealized
Appreciation
(Depreciation) | | | Ending
Value as of
December 31, 2017 | | | Shares as of
December 31, 2017 | | | Dividend
income from
affiliated issuer | |
| Equity Index | | Goldman Sachs Group, Inc. (The) | | $ | 758,338 | | | $ | — | | | $ | (101,446 | ) | | $ | 49,776 | | | $ | (9,645 | ) | | $ | 697,023 | | | | 2,736 | | | $ | 8,592 | |
The following table provides information about the Funds’ investment in the Goldman Sachs Financial Square Government Fund as of and for the fiscal year ended December 31, 2017:
| | | | | | | | | | | | | | | | | | | | | | | | |
| Fund | | Beginning
Value as of
December 31, 2016 | | | Purchases at Cost | | | Proceeds from
Sales | | | Ending
Value as of
December 31, 2017 | | | Shares as of
December 31, 2017 | | | Dividend
income from
affiliated issuer | |
Core Fixed Income | | $ | 289 | | | $ | 40,394,730 | | | $ | (39,114,497 | ) | | $ | 1,280,522 | | | | 1,280,522 | | | $ | 16,352 | |
Growth Opportunities | | | 4,209,790 | | | | 34,617,737 | | | | (38,826,955 | ) | | | 572 | | | | 572 | | | | 8,110 | |
High Quality Floating Rate | | | 2,927,684 | | | | 30,618,712 | | | | (27,890,929 | ) | | | 5,655,467 | | | | 5,655,467 | | | | 28,595 | |
As of December 31, 2017, The Goldman Sachs Group, Inc. was the beneficial owner of approximately 12%, 79% and 46% of the Institutional Shares of the Core Fixed Income, Growth Opportunities and High Quality Floating Rate Funds, respectively.
6. PORTFOLIO SECURITIES TRANSACTIONS
The cost of purchases and proceeds from sales and maturities of long-term securities for the fiscal year ended December 31, 2017, were as follows:
| | | | | | | | | | | | | | | | |
| Fund | | Purchases of U.S.
Government and
Agency Obligations | | | Purchases
(Excluding U.S.
Government and
Agency Obligations) | | | Sales and
Maturities of U.S.
Government and
Agency Obligations | | | Sales and Maturities
(Excluding U.S.
Government and
Agency Obligations) | |
Core Fixed Income | | | $228,714,181 | | | $ | 33,059,157 | | | $ | 228,724,413 | | | $ | 30,384,822 | |
Equity Index | | | — | | | | 3,932,891 | | | | — | | | | 20,958,778 | |
Growth Opportunities | | | — | | | | 93,794,050 | | | | — | | | | 118,348,312 | |
High Quality Floating Rate | | | 9,755,211 | | | | 17,292,752 | | | | 13,924,685 | | | | 10,948,447 | |
71
GOLDMAN SACHS VARIABLE INSURANCE TRUST FUNDS
Notes to Financial Statements (continued)
December 31, 2017
7. SECURITIES LENDING
The Growth Opportunities Fund may lend its securities through a securities lending agent, the Bank of New York Mellon (“BNYM”), to certain qualified borrowers. Pursuant to exemptive relief granted by the Securities and Exchange Commission (“SEC”) and the terms and conditions contained therein, the Equity Index Fund may lend its securities through a securities lending agent, Goldman Sachs Agency Lending (“GSAL”), a wholly-owned subsidiary of Goldman Sachs, to certain qualified borrowers including Goldman Sachs and affiliates. In accordance with the Funds’ securities lending procedures, the Funds receive cash collateral at least equal to the market value of the securities on loan. The market value of the loaned securities is determined at the close of business of the Funds, at their last sale price or official closing price on the principal exchange or system on which they are traded, and any additional required collateral is delivered to the Funds on the next business day. As with other extensions of credit, the Funds may experience delay in the recovery of their securities or incur a loss should the borrower of the securities breach its agreement with the Funds or become insolvent at a time when the collateral is insufficient to cover the cost of repurchasing securities on loan. Dividend income received from securities on loan may not be subject to withholding taxes and therefore withholding taxes paid may differ from the amounts listed in the Statements of Operations. Loans of securities are terminable at any time and as such 1) the remaining contractual maturities of the outstanding securities lending transactions are considered to be overnight and continuous and 2) the borrower, after notice, is required to return borrowed securities within the standard time period for settlement of securities transactions.
The Equity Index and Growth Opportunities Funds invest the cash collateral received in connection with securities lending transactions in the Goldman Sachs Financial Square Government Fund (“Government Money Market Fund”), an affiliated series of the Trust. The Government Money Market Fund is registered under the Act as an open end investment company, is subject to Rule 2a-7 under the Act, and is managed by GSAM, for which GSAM may receive a management fee of up to 0.205% on an annualized basis of the average daily net assets of the Government Money Market Fund.
In the event of a default by a borrower with respect to any loan, GSAL will and BNYM may exercise any and all remedies provided under the applicable borrower agreement to make the Funds whole. These remedies include purchasing replacement securities by applying the collateral held from the defaulting broker against the purchase cost of the replacement securities. If GSAL or BNYM are unable to purchase replacement securities, GSAL and/or BNYM will indemnify the Funds by paying the Funds an amount equal to the market value of the securities loaned minus the value of cash collateral received from the borrower for the loan, subject to an exclusion for any shortfalls resulting from a loss of value in such cash collateral due to reinvestment risk. The Funds’ loaned securities were all subject to enforceable Securities Lending Agreements and the value of the collateral was at least equal to the value of the cash received. The amounts of the Funds’ overnight and continuous agreements represent the gross amounts of recognized liabilities for securities lending transactions outstanding as of December 31, 2017 are disclosed as “Payable upon return of securities loaned” on the Statements of Assets and Liabilities, where applicable.
Each of the Equity Index and Growth Opportunities Funds and GSAL and BNYM received compensation relating to the lending of the Funds’ securities. The amounts earned, if any, by the Funds for the fiscal year ended December 31, 2017, are reported under Investment Income on the Statements of Operations.
The table below details securities lending activity with affiliates of Goldman Sachs:
| | | | | | | | | | | | | | |
| | | | | For the Fiscal Year ended December 31, 2017 | | | | |
| Fund | | | | Earnings of GSAL Relating
to Securities Loaned | | | Amounts Received by
the Funds from Lending
to Goldman Sachs | | | Amounts Payable to Goldman Sachs upon
Return of Securities Loaned
as of December 31, 2017 | |
Equity Index | | | | $ | 290 | | | $ | 1,235 | | | $ | 120,100 | |
72
GOLDMAN SACHS VARIABLE INSURANCE TRUST FUNDS
7. SECURITIES LENDING (continued)
The following table provides information about the Funds’ investment in the Government Money Market Fund for the fiscal year ended December 31, 2017:
| | | | | | | | | | | | | | | | | | | | |
| Fund | | Beginning Value as of
December 31, 2016 | | | Purchases
at Cost | | | Proceeds
from Sales | | | Ending Value as of
December 31, 2017 | | | Shares as of
December 31, 2017 | |
Equity Index | | $ | 153,725 | | | $ | 3,355,825 | | | $ | (3,343,700 | ) | | $ | 165,850 | | | | 165,850 | |
Growth Opportunities | | | 3,236,725 | | | | 48,402,662 | | | | (50,598,552 | ) | | | 1,040,835 | | | | 1,040,835 | |
8. TAX INFORMATION
The tax character of distributions paid during the fiscal year ended December 31, 2017 was as follows:
| | | | | | | | | | | | | | | | |
| | | Core Fixed Income | | | Equity Index | | | Growth Opportunities | | | High Quality Floating Rate | |
Distributions paid from: | | | | | | | | | | | | | | | | |
Ordinary income | | $ | 2,875,500 | | | $ | 2,728,376 | | | $ | — | | | $ | 886,780 | |
Net long-term capital gains | | | — | | | | 7,299,201 | | | | 16,872,540 | | | | — | |
Total taxable distributions | | $ | 2,875,500 | | | $ | 10,027,577 | | | $ | 16,872,540 | | | $ | 886,780 | |
The tax character of distributions paid during the fiscal year ended December 31, 2016 was as follows:
| | | | | | | | | | | | | | | | |
| | | Core Fixed Income | | | Equity Index | | | Growth Opportunities | | | High Quality Floating Rate | |
Distributions paid from: | | | | | | | | | | | | | | | | |
Ordinary income | | $ | 2,237,840 | | | $ | 3,613,751 | | | $ | — | | | $ | 681,990 | |
Net long-term capital gains | | | — | | | | 7,349,964 | | | | 1,072,082 | | | | — | |
Total taxable distributions | | $ | 2,237,840 | | | $ | 10,963,715 | | | $ | 1,072,082 | | | $ | 681,990 | |
73
GOLDMAN SACHS VARIABLE INSURANCE TRUST FUNDS
Notes to Financial Statements (continued)
December 31, 2017
8. TAX INFORMATION (continued)
As of December 31, 2017, the components of accumulated earnings (losses) on a tax-basis were as follows:
| | | | | | | | | | | | | | | | |
| | | Core Fixed Income | | | Equity Index | | | Growth Opportunities | | | High Quality Floating Rate | |
Undistributed ordinary income — net | | $ | 235,184 | | | $ | 202,057 | | | $ | 728,197 | | | $ | 94,959 | |
Undistributed long-term capital gains | | | — | | | | 1,636,013 | | | | 2,315,671 | | | | — | |
Total undistributed earnings | | $ | 235,184 | | | $ | 1,838,070 | | | $ | 3,043,868 | | | $ | 94,959 | |
Capital loss carryforwards: | | | | | | | | | | | | | | | | |
Expiring 2018(1) | | $ | (4,214,815 | ) | | $ | — | | | $ | — | | | $ | — | |
Perpetual short-term | | | — | | | | — | | | | — | | | | (197,425 | ) |
Perpetual long-term | | | (345,051 | ) | | | — | | | | — | | | | (908,667 | ) |
Total capital loss carryforwards | | $ | (4,559,866 | ) | | $ | — | | | $ | — | | | $ | (1,106,092 | ) |
Timing differences (§ 857 (b)(9) deferred dividend, post October loss deferral and straddle loss deferrals) | | | (463,889 | ) | | | 5,635 | | | | — | | | | (25,387 | ) |
Unrealized gains — net | | | 1,200,903 | | | | 104,969,151 | | | | 47,804,497 | | | | 196,102 | |
Total accumulated earnings (losses) — net | | | (3,587,668 | ) | | | 106,812,856 | | | | 50,848,365 | | | | (840,418 | ) |
| (1) | Expiration occurs on December 31 of the year indicated. The Growth Opportunities Fund utilized $249,583 of capital losses in the current fiscal year. |
As of December 31, 2017, the Funds’ aggregate security unrealized gains and losses based on cost for U.S. federal income tax purposes were as follows:
| | | | | | | | | | | | | | | | |
| | | Core Fixed Income | | | Equity Index | | | Growth Opportunities | | | High Quality Floating Rate | |
Tax cost | | $ | 107,521,851 | | | $ | 72,819,356 | | | $ | 122,156,609 | | | $ | 69,938,861 | |
Gross unrealized gain | | | 4,413,283 | | | | 114,476,585 | | | | 49,247,812 | | | | 399,766 | |
Gross unrealized loss | | | (3,212,380 | ) | | | (9,507,434 | ) | | | (1,443,315 | ) | | | (1,240,184 | ) |
Net unrealized gain (loss) | | $ | 1,200,903 | | | $ | 104,969,151 | | | $ | 47,804,497 | | | $ | (840,418 | ) |
The difference between GAAP-basis and tax-basis unrealized gains (losses) is attributable primarily to wash sales, net mark to market gains (losses) on regulated futures, options and foreign currency contracts, and differences in the tax treatment of underlying fund investments, real estate investment trust investments, partnership investments and swap transactions.
74
GOLDMAN SACHS VARIABLE INSURANCE TRUST FUNDS
8. TAX INFORMATION (continued)
In order to present certain components of the Funds’ capital accounts on a tax-basis, certain reclassifications have been recorded to the Funds’ accounts. These reclassifications have no impact on the NAV of the Funds and result primarily from net operating losses, and differences in the tax treatment of foreign currency transactions, underlying fund investments, paydown gains and losses, swap transactions and real estate investment trust investments.
| | | | | | | | | | | | | | |
| Fund | | | | Paid-in Capital | | | Accumulated
Net Realized
Gain (Loss) | | | Undistributed
Net Investment
Income (Loss) | |
Core Fixed Income | | | | $ | — | | | $ | (230,299 | ) | | $ | 230,299 | |
Equity Index | | | | | (60,783 | ) | | | 71,790 | | | | (11,007 | ) |
Growth Opportunities | | | | | (8 | ) | | | (422,755 | ) | | | 422,763 | |
High Quality Floating Rate | | | | | — | | | | (157,804 | ) | | | 157,804 | |
GSAM has reviewed the Funds’ tax positions for all open tax years (the current and prior three years, as applicable) and has concluded that no provision for income tax is required in the Funds’ financial statements. Such open tax years remain subject to examination and adjustment by tax authorities.
9. OTHER RISKS
The Funds’ risks include, but are not limited to, the following:
Derivatives Risk — The Funds’ use of derivatives may result in loss. Derivative instruments, which may pose risks in addition to and greater than those associated with investing directly in securities, currencies or other instruments, may be illiquid or less liquid, volatile, difficult to price and leveraged so that small changes in the value of the underlying instruments may produce disproportionate losses to the Funds. Derivatives are also subject to counterparty risk, which is the risk that the other party in the transaction will not fulfill its contractual obligation. The use of derivatives is a highly specialized activity that involves investment techniques and risks different from those associated with investments in more traditional securities and instruments. Losses from derivatives can also result from a lack of correlation between changes in the value of derivative instruments and the portfolio assets (if any) being hedged.
Interest Rate Risk — When interest rates increase, fixed income securities or instruments held by a Fund will generally decline in value. Long-term fixed income securities or instruments will normally have more price volatility because of this risk than short-term fixed income securities or instruments. The risks associated with increasing rates are heightened given that interest rates are near historic lows, but may be expected to increase in the future with unpredictable effects on the markets and a Fund’s investments. Fluctuations in interest rates may also affect the liquidity of fixed income securities and instruments held by the Funds.
Investments in Other Investment Companies Risk — As a shareholder of another investment company, including an exchange traded fund (“ETF”), a Fund will indirectly bear its proportionate share of any net management fees and other expenses paid by such other investment companies, in addition to the fees and expenses regularly borne by the Fund. ETFs are subject to risks that do not apply to conventional mutual funds, including but not limited to the following: (i) the market price of the ETF’s shares may trade at a premium or a discount to their NAV; and (ii) an active trading market for an ETF’s shares may not develop or be maintained.
75
GOLDMAN SACHS VARIABLE INSURANCE TRUST FUNDS
Notes to Financial Statements (continued)
December 31, 2017
9. OTHER RISKS (continued)
Large Shareholder Transactions Risk — A Fund may experience adverse effects when certain large shareholders, such as other funds, participating insurance companies, accounts and Goldman Sachs affiliates, purchase or redeem large amounts of shares of the Fund. Such large shareholder redemptions may cause a Fund to sell portfolio securities at times when it would not otherwise do so, which may negatively impact a Fund’s NAV and liquidity. These transactions may also accelerate the realization of taxable income to shareholders if such sales of investments resulted in gains, and may also increase transaction costs. In addition, a large redemption could result in a Fund’s current expenses being allocated over a smaller asset base, leading to an increase in the Fund’s expense ratio. Similarly, large Fund share purchases may adversely affect a Fund’s performance to the extent that the Fund is delayed in investing new cash and is required to maintain a larger cash position than it ordinarily would.
Liquidity Risk — A Fund may make investments that are illiquid or that may become less liquid in response to market developments or adverse investor perceptions. Illiquid investments may be more difficult to value. Liquidity risk may also refer to the risk that a Fund will not be able to pay redemption proceeds within the allowable time period because of unusual market conditions, an unusually high volume of redemption requests, or other reasons. To meet redemption requests, a Fund may be forced to sell investments at an unfavorable time and/or under unfavorable conditions. Liquidity risk may be the result of, among other things, the reduced number and capacity of traditional market participants to make a market in fixed income securities or the lack of an active market. The potential for liquidity risk may be magnified by a rising interest rate environment or other circumstances where investor redemptions from fixed income mutual funds may be higher than normal, potentially causing increased supply in the market due to selling activity.
Market and Credit Risks — In the normal course of business, a Fund trades financial instruments and enters into financial transactions where risk of potential loss exists due to changes in the market (market risk). Additionally, a Fund may also be exposed to credit risk in the event that an issuer or guarantor fails to perform or that an institution or entity with which the Fund has unsettled or open transactions defaults.
10. INDEMNIFICATIONS
Under the Trust’s organizational documents, its Trustees, officers, employees and agents are indemnified, to the extent permitted by the Act and state law, against certain liabilities that may arise out of performance of their duties to the Funds. Additionally, in the course of business, the Funds enter into contracts that contain a variety of indemnification clauses. The Funds’ maximum exposure under these arrangements is unknown, as this would involve future claims that may be made against the Funds that have not yet occurred. However, GSAM believes the risk of loss under these arrangements to be remote.
11. SUBSEQUENT EVENTS
Subsequent events after the Statements of Assets and Liabilities date have been evaluated, and GSAM has concluded that there is no impact requiring adjustment or disclosure in the financial statements.
76
GOLDMAN SACHS VARIABLE INSURANCE TRUST FUNDS
12. SUMMARY OF SHARE TRANSACTIONS
Share activity is as follows:
| | | | | | | | | | | | | | | | |
| | | Core Fixed Income Fund | |
| | | For the Fiscal Year Ended
December 31, 2017 | | | For the Fiscal Year Ended
December 31, 2016 | |
| | | Shares | | | Dollars | | | Shares | | | Dollars | |
| Institutional Shares | | | | | | | | | | | | | | | | |
| Shares sold | | | 15,479 | | | $ | 164,881 | | | | 6,000 | | | $ | 64,838 | |
| Reinvestment of distributions | | | 504 | | | | 5,356 | | | | 66 | | | | 712 | |
| Shares redeemed | | | (1,931 | ) | | | (20,628 | ) | | | (18 | ) | | | (188 | ) |
| | | | 14,052 | | | | 149,609 | | | | 6,048 | | | | 65,362 | |
| Service Shares | | | | | | | | | | | | | | | | |
| Shares sold | | | 646,406 | | | | 6,887,625 | | | | 1,743,245 | | | | 18,760,474 | |
| Reinvestment of distributions | | | 270,542 | | | | 2,870,144 | | | | 206,845 | | | | 2,237,128 | |
| Shares redeemed | | | (1,110,095 | ) | | | (11,842,825 | ) | | | (1,488,768 | ) | | | (16,023,387 | ) |
| | | | (193,147 | ) | | | (2,085,056 | ) | | | 461,322 | | | | 4,974,215 | |
| NET INCREASE (DECREASE) | | | (179,095 | ) | | $ | (1,935,447 | ) | | | 467,370 | | | $ | 5,039,577 | |
| | | | | | | | | | | | | | | | |
| | | Equity Index Fund | |
| | | For the Fiscal Year Ended
December 31, 2017 | | | For the Fiscal Year Ended
December 31, 2016 | |
| | | Shares | | | Dollars | | | Shares | | | Dollars | |
| Service Shares | | | | | | | | | | | | | | | | |
| Shares sold | | | 128,581 | | | $ | 2,056,692 | | | | 232,981 | | | $ | 3,310,921 | |
| Reinvestment of distributions | | | 600,454 | | | | 10,027,577 | | | | 750,425 | | | | 10,963,715 | |
| Shares redeemed | �� | | (1,367,871 | ) | | | (21,731,411 | ) | | | (1,727,994 | ) | | | (24,627,725 | ) |
| NET DECREASE | | | (638,836 | ) | | $ | (9,647,142 | ) | | | (744,588 | ) | | $ | (10,353,089 | ) |
| | | | | | | | | | | | | | | | |
| | | Growth Opportunities Fund | |
| | | For the Fiscal Year Ended
December 31, 2017 | | | For the Fiscal Year Ended
December 31, 2016 | |
| | | Shares | | | Dollars | | | Shares | | | Dollars | |
| Institutional Shares | | | | | | | | | | | | | | | | |
| Shares sold | | | 48,128 | | | $ | 365,935 | | | | 524,410 | | | $ | 3,733,669 | |
| Reinvestment of distributions | | | 642 | | | | 4,985 | | | | 3,423 | | | | 23,519 | |
| Shares redeemed | | | (560,729 | ) | | | (4,411,997 | ) | | | (13,935 | ) | | | (95,699 | ) |
| | | | (511,959 | ) | | | (4,041,077 | ) | | | 513,898 | | | | 3,661,489 | |
| Service Shares | | | | | | | | | | | | | | | | |
| Shares sold | | | 531,350 | | | | 4,039,461 | | | | 2,139,566 | | | | 14,365,397 | |
| Reinvestment of distributions | | | 2,196,296 | | | | 16,867,555 | | | | 153,762 | | | | 1,048,654 | |
| Shares redeemed | | | (3,713,893 | ) | | | (28,591,468 | ) | | | (4,384,503 | ) | | | (29,589,084 | ) |
| | | | (986,247 | ) | | | (7,684,452 | ) | | | (2,091,175 | ) | | | (14,175,033 | ) |
| NET DECREASE | | | (1,498,206 | ) | | $ | (11,725,529 | ) | | | (1,577,277 | ) | | $ | (10,513,544 | ) |
77
GOLDMAN SACHS VARIABLE INSURANCE TRUST FUNDS
Notes to Financial Statements (continued)
December 31, 2017
12. SUMMARY OF SHARE TRANSACTIONS (continued)
| | | | | | | | | | | | | | | | |
| | | High Quality Floating Rate Fund | |
| | | For the Fiscal Year Ended
December 31, 2017 | | | For the Fiscal Year Ended
December 31, 2016 | |
| | | Shares | | | Dollars | | | Shares | | | Dollars | |
| Institutional Shares | | | | | | | | | | | | | | | | |
| Shares sold | | | 6,236 | | | $ | 65,055 | | | | — | | | $ | — | |
| Reinvestment of distributions | | | 92 | | | | 956 | | | | 31 | | | | 314 | |
| Shares redeemed | | | (3,345 | ) | | | (34,922 | ) | | | — | | | | — | |
| | | | 2,983 | | | | 31,089 | | | | 31 | | | | 314 | |
| Service Shares | | | | | | | | | | | | | | | | |
| Shares sold | | | 537,817 | | | | 5,602,003 | | | | 615,563 | | | | 6,386,630 | |
| Reinvestment of distributions | | | 80,994 | | | | 842,342 | | | | 64,247 | | | | 665,765 | |
| Shares redeemed | | | (643,776 | ) | | | (6,705,632 | ) | | | (963,897 | ) | | | (9,999,019 | ) |
| | | | (24,965 | ) | | | (261,287 | ) | | | (284,087 | ) | | | (2,946,624 | ) |
| Advisor Shares | | | | | | | | | | | | | | | | |
| Shares sold | | | 673,871 | | | | 7,022,526 | | | | 274,402 | | | | 2,847,252 | |
| Reinvestment of distributions | | | 4,176 | | | | 43,482 | | | | 1,533 | | | | 15,910 | |
| Shares redeemed | | | (383,555 | ) | | | (3,998,446 | ) | | | (243,055 | ) | | | (2,520,643 | ) |
| | | | 294,492 | | | | 3,067,562 | | | | 32,880 | | | | 342,519 | |
| NET INCREASE (DECREASE) | | | 272,510 | | | $ | 2,837,364 | | | | (251,176 | ) | | $ | (2,603,791 | ) |
78
GOLDMAN SACHS VARIABLE INSURANCE TRUST FUNDS
| | |
| Fund Expenses — Six Month Period Ended December 31, 2017 (Unaudited) | | |
As a shareholder of Institutional, Service or Advisor Shares of the Funds, you incur ongoing costs, including management fees, distribution and/or service (12b-1) fees (with respect to Service and Advisor Shares) and other Fund expenses. This example is intended to help you understand your ongoing costs (in dollars) of investing in the Institutional Shares, Service Shares and Advisor Shares of the Funds and to compare these costs with the ongoing costs of investing in other mutual funds.
The example is based on an investment of $1,000 invested at the beginning of the period and held for the entire period from July 1, 2017 through December 31, 2017, which represents a period of 184 days of a 365 day year.
Actual Expenses — The first line under each share class in the table below provides information about actual account values and actual expenses. You may use the information in this line, together with the amount you invested, to estimate the expenses that you paid over the period. Simply divide your account value by $1,000 (for example, an $8,600 account value divided by $1,000=8.6), then multiply the result by the number in the first line under the heading entitled “Expenses Paid” to estimate the expenses you paid on your account during this period.
Hypothetical Example for Comparison Purposes — The second line under each share class in the table below provides information about hypothetical account values and hypothetical expenses based on the Funds’ actual net expense ratio and an assumed rate of return of 5% per year before expenses, which is not the Funds’ actual return. The hypothetical account values and expenses may not be used to estimate the actual ending account balance or expenses you paid for the period. You may use this information to compare the ongoing costs of investing in the Funds and other funds. To do so, compare this 5% hypothetical example with the 5% hypothetical examples that appear in the shareholder reports of the other funds.
Please note that the expenses shown in the table are meant to highlight your ongoing costs only. As a shareholder of the Funds you do not incur any transaction costs, such as sales charges, redemption fees, or exchange fees, but shareholders of other funds may incur such costs. The second line of the table is useful in comparing ongoing costs only and will not help you determine the relative total costs of owning different funds whose shareholders may incur transaction costs.
| | | | | | | | | | | | | | | | | | | | | | | | | | | | | | | | | | | | | | | | | | | | | | | | |
| | | Core Fixed Income Fund | | | Equity Index Fund | | | Growth Opportunities Fund | | | High Quality Floating Rate Fund | |
| Share Class | | Beginning
Account
Value
07/01/17 | | | Ending
Account
Value
12/31/17 | | | Expenses
Paid for the
6 Months
Ended
12/31/17* | | | Beginning
Account
Value
07/01/17 | | | Ending
Account
Value
12/31/17 | | | Expenses
Paid for the
6 Months
Ended
12/31/17* | | | Beginning
Account
Value
07/01/17 | | | Ending
Account
Value
12/31/17 | | | Expenses
Paid for the
6 Months
Ended
12/31/17* | | | Beginning
Account
Value
07/01/17 | | | Ending
Account
Value
12/31/17 | | | Expenses
Paid for the
6 Months
Ended
12/31/17* | |
| Institutional | | | | | | | | | | | | | | | | | | | | | | | | | | | | | | | | | | | | | | | | | | | | | | | | |
Actual | | $ | 1,000 | | | $ | 1,009.70 | | | $ | 2.13 | | | | N/A | | | | N/A | | | | N/A | | | $ | 1,000 | | | $ | 1,106.60 | | | $ | 4.51 | | | $ | 1,000 | | | $ | 1,008.20 | | | $ | 1.77 | |
Hypothetical 5% return | | | 1,000 | | | | 1023.09 | + | | | 2.14 | | | | N/A | | | | N/A | | | | N/A | | | | 1,000 | | | | 1,020.92 | + | | | 4.33 | | | | 1,000 | | | | 1,023.44 | + | | | 1.79 | |
| Service | | | | | | | | | | | | | | | | | | | | | | | | | | | | | | | | | | | | | | | | | | | | | | | | |
Actual | | | 1,000 | | | | 1,008.40 | | | | 3.39 | | | $ | 1,000 | | | $ | 1,111.60 | | | $ | 2.55 | | | | 1,000 | | | | 1,106.40 | | | | 5.36 | | | | 1,000 | | | | 1,006.80 | | | | 3.03 | |
Hypothetical 5% return | | | 1,000 | | | | 1021.83 | + | | | 3.41 | | | | 1,000 | | | | 1022.79 | + | | | 2.45 | | | | 1,000 | | | | 1,020.11 | + | | | 5.14 | | | | 1,000 | | | | 1,022.18 | + | | | 3.06 | |
| Advisor | | | | | | | | | | | | | | | | | | | | | | | | | | | | | | | | | | | | | | | | | | | | | | | | |
Actual | | | N/A | | | | N/A | | | | N/A | | | | N/A | | | | N/A | | | | N/A | | | | N/A | | | | N/A | | | | N/A | | | | 1,000 | | | | 1,006.10 | | | | 3.79 | |
Hypothetical 5% return | | | N/A | | | | N/A | | | | N/A | | | | N/A | | | | N/A | | | | N/A | | | | N/A | | | | N/A | | | | N/A | | | | 1,000 | | | | 1,021.42 | + | | | 3.82 | |
| | * | Expenses are calculated using each Fund’s annualized net expense ratio for each class, which represents the ongoing expenses as a percentage of net assets for the six months ended December 31, 2017. Expenses are calculated by multiplying the annualized net expense ratio by the average account value for the period; then multiplying the result by the number of days in the most recent fiscal half year; and then dividing that result by the number of days in the fiscal year. The annualized net expense ratios for the period were as follows: | |
| | | | | | | | | | | | |
| Fund | | Institutional | | | Service | | | Advisor | |
| Core Fixed Income | | | 0.42 | % | | | 0.67 | % | | | N/A | |
| Equity Index | | | N/A | | | | 0.48 | | | | N/A | |
| Growth Opportunities | | | 0.85 | | | | 1.01 | | | | N/A | |
| High Quality Floating Rate | | | 0.35 | | | | 0.60 | | | | 0.75 | % |
| | + | Hypothetical expenses are based on each Fund’s actual annualized net expense ratios and an assumed rate of return of 5% per year before expenses. | |
79
Report of Independent Registered Public Accounting Firm
To the Board of Trustees of Goldman Sachs Variable Insurance Trust and Shareholders of the
Goldman Sachs Core Fixed Income Fund, Goldman Sachs Equity Index Fund, Goldman Sachs Growth Opportunities Fund, and Goldman Sachs High Quality Floating Rate Fund
Opinion on the Financial Statements
We have audited the accompanying statements of assets and liabilities, including the schedules of investments, of the Goldman Sachs Core Fixed Income Fund, Goldman Sachs Equity Index Fund, Goldman Sachs Growth Opportunities Fund, and Goldman Sachs High Quality Floating Rate Fund (four of the funds constituting the Goldman Sachs Variable Insurance Trust, hereafter collectively referred to as the “Funds”) as of December 31, 2017, the related statements of operations for the year ended December 31, 2017, the statements of changes in net assets for each of the two years in the period ended December 31, 2017, including the related notes, and the financial highlights for each of the periods indicated therein (collectively referred to as the “financial statements”). In our opinion, the financial statements present fairly, in all material respects, the financial position of the Funds as of December 31, 2017, the results of their operations for the year then ended, the changes in their net assets for each of the two years in the period ended December 31, 2017 and the financial highlights for each of the periods indicated therein in conformity with accounting principles generally accepted in the United States of America.
Basis for Opinion
These financial statements are the responsibility of the Funds’ management. Our responsibility is to express an opinion on the Funds’ financial statements based on our audits. We are a public accounting firm registered with the Public Company Accounting Oversight Board (United States) (“PCAOB”) and are required to be independent with respect to the Funds in accordance with the U.S. federal securities laws and the applicable rules and regulations of the Securities and Exchange Commission and the PCAOB.
We conducted our audits of these financial statements in accordance with the standards of the PCAOB. Those standards require that we plan and perform the audit to obtain reasonable assurance about whether the financial statements are free of material misstatement, whether due to error or fraud.
Our audits included performing procedures to assess the risks of material misstatement of the financial statements, whether due to error or fraud, and performing procedures that respond to those risks. Such procedures included examining, on a test basis, evidence regarding the amounts and disclosures in the financial statements. Our audits also included evaluating the accounting principles used and significant estimates made by management, as well as evaluating the overall presentation of the financial statements. Our procedures included confirmation of securities owned as of December 31, 2017 by correspondence with the custodian, transfer agent and brokers; when replies were not received from brokers, we performed other auditing procedures. We believe that our audits provide a reasonable basis for our opinion.
PricewaterhouseCoopers LLP
Boston, Massachusetts
February 14, 2018
We have served as the auditor of one or more investment companies in the Goldman Sachs Fund complex since 2000.
80
GOLDMAN SACHS VARIABLE INSURANCE TRUST FUNDS
Trustees and Officers (Unaudited)
Independent Trustees
| | | | | | | | | | | | |
| | | | | |
Name,
Address and Age1 | | Position(s) Held with the Trust | | Term of Office and
Length of
Time Served2 | | Principal Occupation(s) During Past 5 Years | | Number of
Portfolios in
Fund Complex
Overseen by
Trustee3 | | | Other Directorships Held by Trustee4 |
Jessica Palmer Age: 68 | | Chair of the Board of Trustees | | 2018 (Trustee Since 2007) | | Ms. Palmer is retired. She is Director, Emerson Center for the Arts and Culture (2011-Present); and was formerly a Consultant, Citigroup Human Resources Department (2007-2008); Managing Director, Citigroup Corporate and Investment Banking (previously, Salomon Smith Barney/Salomon Brothers) (1984-2006). Ms. Palmer was a Member of the Board of Trustees of Indian Mountain School (private elementary and secondary school) (2004-2009). Chair of the Board of Trustees — Goldman Sachs Trust and Goldman Sachs Variable Insurance Trust. | | | 105 | | | None |
Kathryn A. Cassidy Age: 63 | | Trustee | | Since 2015 | | Ms. Cassidy is retired. Formerly, she was Advisor to the Chairman (May 2014-December 2014); and Senior Vice President and Treasurer (2008-2014), General Electric Company & General Electric Capital Corporation (technology and financial services companies). Trustee — Goldman Sachs Trust and Goldman Sachs Variable Insurance Trust. | | | 105 | | | None |
Diana M. Daniels Age: 68 | | Trustee | | Since 2007 | | Ms. Daniels is retired. Formerly, she was Vice President, General Counsel and Secretary, The Washington Post Company (1991-2006). Ms. Daniels is a Trustee Emeritus and serves as a Presidential Councillor of Cornell University (2013-Present); former Member of the Legal Advisory Board, New York Stock Exchange (2003-2006) and of the Corporate Advisory Board, Standish Mellon Management Advisors (2006-2007). Trustee — Goldman Sachs Trust and Goldman Sachs Variable Insurance Trust. | | | 105 | | | None |
Herbert J. Markley Age: 67 | | Trustee | | Since 2013 | | Mr. Markley is retired. Formerly, he was Executive Vice President, Deere & Company (an agricultural and construction equipment manufacturer) (2007-2009); and President, Agricultural Division, Deere & Company (2001-2007). Previously, Mr. Markley served as an Advisory Board Member of Goldman Sachs Trust and Goldman Sachs Variable Insurance Trust (June 2013-October 2013). Trustee — Goldman Sachs Trust and Goldman Sachs Variable Insurance Trust. | | | 105 | | | None |
Roy W. Templin Age: 57 | | Trustee | | Since 2013 | | Mr. Templin is retired. He is Director, Armstrong World Industries, Inc. (a designer and manufacturer of ceiling, wall and suspension system solutions) (2016–Present); and was formerly Chairman of the Board of Directors, Con-Way Incorporated (a transportation, logistics and supply chain management service company) (2014-2015); Executive Vice President and Chief Financial Officer, Whirlpool Corporation (an appliance manufacturer and marketer) (2004-2012). Previously, Mr. Templin served as an Advisory Board Member of Goldman Sachs Trust and Goldman Sachs Variable Insurance Trust (June 2013-October 2013). Trustee — Goldman Sachs Trust and Goldman Sachs Variable Insurance Trust. | | | 105 | | | Armstrong World Industries, Inc. (a ceiling, wall and suspension systems solutions manufacturer) |
Gregory G. Weaver Age: 66 | | Trustee | | Since 2015 | | Mr. Weaver is retired. He is Director, Verizon Communications Inc. (2015-Present); and was formerly Chairman and Chief Executive Officer, Deloitte & Touche LLP (a professional services firm) (2001-2005 and 2012-2014); and Member of the Board of Directors, Deloitte & Touche LLP (2006-2012). Trustee — Goldman Sachs Trust and Goldman Sachs Variable Insurance Trust. | | | 105 | | | Verizon Communications Inc. |
| | | | | | | | | | | | |
81
GOLDMAN SACHS VARIABLE INSURANCE TRUST FUNDS
Trustees and Officers (Unaudited) (continued)
Interested Trustee*
| | | | | | | | | | | | |
| | | | | |
Name,
Address and Age1 | | Position(s) Held with the Trust | | Term of Office and
Length of
Time Served2 | | Principal Occupation(s) During Past 5 Years | | Number of
Portfolios in
Fund Complex
Overseen by
Trustee3 | | | Other Directorships Held by Trustee4 |
James A. McNamara Age: 55 | | President and Trustee | | Since 2007 | | Managing Director, Goldman Sachs (January 2000-Present); Director of Institutional Fund Sales, GSAM (April 1998-December 2000); and Senior Vice President and Manager, Dreyfus Institutional Service Corporation (January 1993- April 1998). President and Trustee — Goldman Sachs Trust; Goldman Sachs Variable Insurance Trust; Goldman Sachs Trust II; Goldman Sachs MLP Income Opportunities Fund; Goldman Sachs MLP and Energy Renaissance Fund; Goldman Sachs ETF Trust; Goldman Sachs Private Markets Fund 2018 LLC; Goldman Sachs Private Markets Fund 2018 (A) LLC; and Goldman Sachs Private Markets Fund 2018 (B) LLC. | | | 146 | | | None |
| | | | | | | | | | | | |
| * | Mr. McNamara is considered to be an “Interested Trustee” because he holds positions with Goldman Sachs and owns securities issued by The Goldman Sachs Group, Inc. Mr. McNamara holds comparable positions with certain other companies of which Goldman Sachs, GSAM or an affiliate thereof is the investment adviser, administrator and/or distributor. |
| 1 | Each Trustee may be contacted by writing to the Trustee, c/o Goldman Sachs, 200 West Street, New York, New York, 10282, Attn: Caroline Kraus. Information is provided as of December 31, 2017. |
| 2 | Subject to such policies as may be adopted by the Board from time-to-time, each Trustee holds office for an indefinite term, until the earliest of: (a) the election of his or her successor; (b) the date the Trustee resigns or is removed by the Board or shareholders, in accordance with the Trust’s Declaration of Trust; or (c) the termination of the Trust. The Board has adopted policies which provide that (a) no Trustee shall hold office for more than 15 years and (b) a Trustee shall retire as of December 31st of the calendar year in which he or she reaches his or her 74th birthday, unless a waiver of such requirement shall have been adopted by a majority of the other Trustees. These policies may be changed by the Trustees without shareholder vote. |
| 3 | The Goldman Sachs Fund Complex includes certain other companies listed above for each respective Trustee. As of December 31, 2017, Goldman Sachs Trust consisted of 91 portfolios (90 of which offered shares to the public); Goldman Sachs Variable Insurance Trust consisted of 14 portfolios; Goldman Sachs Trust II consisted of 17 portfolios (16 of which offered shares to the public); Goldman Sachs BDC, Inc., Goldman Sachs Private Middle Market Credit LLC, Goldman Sachs MLP Income Opportunities Fund, Goldman Sachs MLP and Energy Renaissance Fund, Goldman Sachs Private Markets Fund 2018 LLC, Goldman Sachs Private Markets Fund 2018 (A) LLC and Goldman Sachs Private Markets Fund 2018 (B) LLC each consisted of one portfolio; and Goldman Sachs ETF Trust consisted of 19 portfolios (12 of which offered shares to the public). Goldman Sachs Private Middle Market Credit LLC, Goldman Sachs Private Markets Fund 2018 LLC, Goldman Sachs Private Markets Fund 2018 (A) LLC and Goldman Sachs Private Markets Fund 2018 (B) LLC do not offer shares to the public. |
| 4 | This column includes only directorships of companies required to report to the Securities and Exchange Commission under the Securities Exchange Act of 1934 (i.e., “public companies”) or other investment companies registered under the Act. |
Additional information about the Trustees is available in the Funds’ Statement of Additional Information, which can be obtained from Goldman Sachs free of charge by calling this toll-free number (in the United States of America): 1-800-526-7384.
82
GOLDMAN SACHS VARIABLE INSURANCE TRUST FUNDS
Trustees and Officers (Unaudited) (continued)
Officers of the Trust*
| | | | | | |
| | | |
| Name, Address and Age1 | | Position(s) Held with the Trust | | Term of
Office and
Length of
Time Served2 | | Principal Occupation(s) During Past 5 Years |
James A. McNamara 200 West Street New York, NY 10282 Age: 55 | | Trustee and President | | Since 2007 | | Managing Director, Goldman Sachs (January 2000-Present); Director of Institutional Fund Sales, GSAM (April 1998-December 2000); and Senior Vice President and Manager, Dreyfus Institutional Service Corporation (January 1993-April 1998). President and Trustee — Goldman Sachs Trust; Goldman Sachs Variable Insurance Trust; Goldman Sachs Trust II; Goldman Sachs MLP Income Opportunities Fund; Goldman Sachs MLP and Energy Renaissance Fund; Goldman Sachs ETF Trust; Goldman Sachs Private Markets Fund 2018 LLC; Goldman Sachs Private Markets Fund 2018 (A) LLC; and Goldman Sachs Private Markets Fund 2018 (B) LLC. |
Caroline L. Kraus 200 West Street New York, NY 10282 Age: 40 | | Secretary | | Since 2012 | | Managing Director, Goldman Sachs (January 2016-Present); Vice President, Goldman Sachs (August 2006-December 2015); Associate General Counsel, Goldman Sachs (2012-Present); Assistant General Counsel, Goldman Sachs (August 2006-December 2011); and Associate, Weil, Gotshal & Manges, LLP (2002-2006). Secretary — Goldman Sachs Trust (previously Assistant Secretary (2012)); Goldman Sachs Variable Insurance Trust (previously Assistant Secretary (2012)); Goldman Sachs Trust II; Goldman Sachs BDC, Inc.; Goldman Sachs Private Middle Market Credit LLC; Goldman Sachs Middle Market Lending Corp.; Goldman Sachs MLP Income Opportunities Fund; Goldman Sachs MLP and Energy Renaissance Fund; Goldman Sachs ETF Trust; Goldman Sachs Private Markets Fund 2018 LLC; Goldman Sachs Private Markets Fund 2018 (A) LLC; and Goldman Sachs Private Markets Fund 2018 (B) LLC. |
Scott M. McHugh 200 West Street New York, NY 10282 Age: 46 | | Treasurer, Senior Vice President and Principal Financial Officer | | Since 2009 (Principal Financial Officer since 2013) | | Managing Director, Goldman Sachs (January 2016-Present); Vice President, Goldman Sachs (February 2007-December 2015); Assistant Treasurer of certain mutual funds administered by DWS Scudder (2005-2007); and Director (2005-2007), Vice President (2000-2005), and Assistant Vice President (1998-2000), Deutsche Asset Management or its predecessor (1998-2007). Treasurer, Senior Vice President and Principal Financial Officer — Goldman Sachs Trust; Goldman Sachs Variable Insurance Trust; Goldman Sachs Trust II; Goldman Sachs MLP Income Opportunities Fund; Goldman Sachs MLP and Energy Renaissance Fund; Goldman Sachs ETF Trust; Goldman Sachs Private Markets Fund 2018 LLC; Goldman Sachs Private Markets Fund 2018 (A) LLC; and Goldman Sachs Private Markets Fund 2018 (B) LLC. |
Joseph F. DiMaria 30 Hudson Street Jersey City, NJ 07302 Age: 49 | | Assistant Treasurer and Principal Accounting Officer | | Since 2016 (Principal Accounting Officer since 2017) | | Managing Director, Goldman Sachs (November 2015-Present) and Vice President — Mutual Fund Administration, Columbia Management Investment Advisers, LLC (May 2010-October 2015). Assistant Treasurer and Principal Accounting Officer — Goldman Sachs Trust; Goldman Sachs Variable Insurance Trust; Goldman Sachs Trust II; Goldman Sachs MLP Income Opportunities Fund; Goldman Sachs MLP and Energy Renaissance Fund; Goldman Sachs ETF Trust; Goldman Sachs Private Markets Fund 2018 LLC; Goldman Sachs Private Markets Fund 2018 (A) LLC; and Goldman Sachs Private Markets Fund 2018 (B) LLC. |
| | | | | | |
| * | Represents a partial list of officers of the Trust. Additional information about all the officers is available in the Funds’ Statement of Additional Information, which can be obtained from Goldman Sachs free of charge by calling this toll-free number (in the United States): 1-800-526-7384. |
| 1 | Information is provided as of December 31, 2017. |
| 2 | Officers hold office at the pleasure of the Board of Trustees or until their successors are duly elected and qualified. Each officer holds comparable positions with certain other companies of which Goldman Sachs, GSAM or an affiliate thereof is the investment adviser, administrator and/or distributor. |
83
GOLDMAN SACHS VARIABLE INSURANCE TRUST FUNDS
Goldman Sachs Variable Insurance Trust — Tax Information (Unaudited)
For the year ended December 31, 2017, 100% of the dividends paid from net investment company taxable income by the Equity Index Fund qualify for the dividends received deduction available to corporations.
Pursuant to Section 852 of the Internal Revenue Code, the Equity Index and Growth Opportunities Funds designate $7,299,201 and $16,872,540 respectively, or, if different, the maximum amount allowable, as capital gain dividends paid during the year ended December 31, 2017.
84
| | |
| TRUSTEES | | OFFICERS |
| Jessica Palmer, Chair | | James A. McNamara, President |
| Kathryn A. Cassidy | | Scott M. McHugh, Treasurer, Senior Vice |
| Diana M. Daniels | | President and Principal Financial Officer |
| Herbert J. Markley | | Joseph F. DiMaria, Assistant Treasurer and |
| James A. McNamara | | Principal Accounting Officer |
| Roy W. Templin | | Caroline L. Kraus, Secretary |
| Gregory G. Weaver | | |
GOLDMAN SACHS & CO. LLC
Distributor and Transfer Agent
GOLDMAN SACHS ASSET MANAGEMENT, L.P.
Investment Adviser
200 West Street, New York,
New York 10282
Visit our web site at www.GSAMFUNDS.com to obtain the most recent month-end returns.
The reports concerning the Funds included in this shareholder report may contain certain forward-looking statements about the factors that may affect the performance of the Funds in the future. These statements are based on Fund management’s predictions and expectations concerning certain future events and their expected impact on the Funds, such as performance of the economy as a whole and of specific industry sectors, changes in the levels of interest rates, the impact of developing world events, and other factors that may influence the future performance of the Funds. Management believes these forward-looking statements to be reasonable, although they are inherently uncertain and difficult to predict. Actual events may cause adjustments in portfolio management strategies from those currently expected to be employed.
A description of the policies and procedures that the Funds use to determine how to vote proxies relating to portfolio securities and information regarding how the Funds voted proxies relating to portfolio securities for the 12-month period ended December 31 is available (i) without charge, upon request by calling 1-800-621-2550; and (ii) on the Securities and Exchange Commission (“SEC”) web site at http://www.sec.gov.
The Funds file their complete schedule of portfolio holdings with the SEC for the first and third quarters of each fiscal year on Form N-Q. The Funds’ Form N-Qs are available on the SEC’s web site at http://www.sec.gov within 60 days after the Funds’ first and third fiscal quarters. The Funds’ Form N-Qs may be reviewed and copied at the SEC’s Public Reference Room in Washington, D.C. and information on the operation of the Public Reference Room may also be obtained by calling 1-800-SEC-0330. Form N-Qs may be obtained upon request and without charge by calling 1-800-621-2550.
Views and opinions expressed are for informational purposes only and do not constitute a recommendation by GSAM to buy, sell, or hold any security. Views and opinions are current as of the date of this presentation and may be subject to change, they should not be construed as investment advice.
Goldman Sachs & Co. LLC (“Goldman Sachs”) does not provide legal, tax or accounting advice. Any statement contained in this communication (including any attachments) concerning U.S. tax matters was not intended or written to be used, and cannot be used, for the purpose of avoiding penalties under the Internal Revenue Code, and was written to support the promotion or marketing of transactions or matters addressed. Clients of Goldman Sachs should obtain their own independent tax advice based on their particular circumstances.
The website links provided are for your convenience only and are not an endorsement or recommendation by GSAM of any of these websites or the products or services offered. GSAM is not responsible for the accuracy and validity of the content of these websites.
Fund holdings and allocations shown are as of December 31, 2017 and may not be representative of future investments. Fund holdings should not be relied on in making investment decisions and should not be construed as research or investment advice regarding particular securities. Current and future holdings are subject to risk.
References to indices, benchmarks or other measures of relative market performance over a specified period of time are provided for your information only and do not imply that the portfolio will achieve similar results. The index composition may not reflect the manner in which a portfolio is constructed. While an adviser seeks to design a portfolio which reflects appropriate risk and return features, portfolio characteristics may deviate from those of the benchmark.
The Global Industry Classification Standard (“GICS”) was developed by and is the exclusive property and a service mark of Morgan Stanley Capital International Inc. (“MSCI”) and Standard & Poor’s, a division of The McGraw-Hill Companies, Inc. (“S&P”) and is licensed for use by Goldman Sachs. Neither MSCI, S&P nor any other party involved in making or compiling the GICS or any GICS classifications makes any express or implied warranties or representations with respect to such standard or classification (or the results to be obtained by the use thereof), and all such parties hereby expressly disclaim all warranties of originality, accuracy, completeness, merchantability or fitness for a particular purpose with respect to any of such standard or classification. Without limiting any of the foregoing, in no event shall MSCI, S&P, any of their affiliates or any third party involved in making or compiling the GICS or any GICS classifications have any liability for any direct, indirect, special, punitive, consequential or any other damages (including lost profits) even if notified of the possibility of such damages.
The portfolio risk management process includes an effort to monitor and manage risk, but does not imply low risk.
Shares of the Goldman Sachs VIT Funds are offered to separate accounts of participating life insurance companies for the purpose of funding variable annuity contracts and variable life insurance policies. Shares of the Fund are not offered directly to the general public. The variable annuity contracts and variable life insurance policies are described in the separate prospectuses issued by participating insurance companies. You should refer to those prospectuses for information about surrender charges, mortality and expense risk fees and other charges that may be assessed by participating insurance companies under the variable annuity contracts or variable life insurance policies. Such fees or charges, if any, may affect the return you may realize with respect to your investments. Ask your representative for more complete information. Please consider a fund’s objectives, risks and charges and expenses, and read the prospectus carefully before investing. The prospectus contains this and other information about the Fund.
This material is not authorized for distribution to prospective investors unless preceded or accompanied by a current prospectus or summary prospectus, if applicable. Investors should consider the Fund’s objective, risks, and charges and expenses, and read the summary prospectus, if available, and/or the prospectus carefully before investing or sending money. The summary prospectus, if available, and the prospectus contain this and other information about the Fund and may be obtained from your authorized dealer or from Goldman Sachs & Co. LLC by calling 1-800-621-2550.
THIS MATERIAL IS FOR INFORMATIONAL PURPOSES ONLY AND IS PROVIDED SOLELY ON THE BASIS THAT IT WILL NOT CONSTITUTE INVESTMENT OR OTHER ADVICE OR A RECOMMENDATION RELATING TO ANY PERSON’S OR PLAN’S INVESTMENT OR OTHER DECISIONS, AND GOLDMAN SACHS IS NOT A FIDUCIARY OR ADVISOR WITH RESPECT TO ANY PERSON OR PLAN BY REASON OF PROVIDING THE MATERIAL OR CONTENT HEREIN INCLUDING UNDER THE EMPLOYEE RETIREMENT INCOME SECURITY ACT OF 1974 OR DEPARTMENT OF LABOR REGULATIONS. PLAN SPONSORS AND OTHER FIDUCIARIES SHOULD CONSIDER THEIR OWN CIRCUMSTANCES IN ASSESSING ANY POTENTIAL COURSE OF ACTION.
This report is prepared for the general information of contract owners and is not an offer of shares of the Goldman Sachs Variable Insurance Trust Funds.
© 2018 Goldman Sachs. All rights reserved.
VITMLTIAR-18/119296-OTU-698096/16.2k
Goldman
Sachs Variable Insurance Trust
Goldman Sachs
Small Cap Equity Insights Fund
Annual Report
December 31, 2017

GOLDMAN SACHS VARIABLE INSURANCE TRUST SMALL CAP EQUITY INSIGHTS FUND
INVESTMENT OBJECTIVE
The Fund seeks long-term growth of capital.
Portfolio Management Discussion and Analysis
Below, the Goldman Sachs Quantitative Investment Strategies Team discusses the Goldman Sachs Variable Insurance Trust — Goldman Sachs Small Cap Equity Insights Fund’s (the “Fund”) performance and positioning for the 12-month period ended December 31, 2017 (the “Reporting Period”).
How did the Fund perform during the Reporting Period?
During the Reporting Period, the Fund’s Institutional and Service Shares generated average annual total returns of 11.57% and 11.22%, respectively. These returns compare to the 14.65% average annual total return of the Fund’s benchmark, the Russell 2000® Index (with dividends reinvested) (the “Russell Index”) during the same time period.
What economic and market factors most influenced the equity markets as a whole during the Reporting Period?
Representing the U.S. equity market, the S&P 500® Index gained 21.83% during the Reporting Period. It was a banner year for U.S. equities, with the S&P 500® Index advancing for 12 consecutive months in 2017, a feat that had previously never been accomplished in a single calendar year. Overall, stocks were boosted by a combination of accelerating economic growth, rising corporate earnings and a general lack of negative financial headlines. U.S. equity market volatility was at historic lows.
U.S. equities rallied to new highs at the start of 2017 on prospects of deregulation, tax reform and infrastructure spending as well as on stronger economic data. In March 2017, the U.S. Federal Reserve (the “Fed”) raised interest rates for the third time since the 2008 global financial crisis, which was met with dovish market reaction. (Dovish tends to suggest lower interest rates; opposite of hawkish.) U.S. equities were virtually flat, albeit positive, in March 2017 and then continued to climb higher in April 2017 on strong earnings results and receding European political risk. Although the labor market remained strong, economic activity and inflation moderated during the second calendar quarter. In the third calendar quarter, U.S. economic activity and labor market data showed consistent strength, with a reversal of five consecutive downside inflation surprises. Progress on tax reform and strong economic activity data remained supportive for U.S. equities in October and November 2017. The Fed delivered the third rate hike of 2017 in December as had been widely expected, having done similarly in June 2017, and maintained its projections for three additional interest rate hikes in 2018. U.S. equities gained additional momentum toward the end of the Reporting Period from the passage of a tax reform bill that reduced the corporate tax rate from 35% to 21%. The fourth quarter of 2017 marked the ninth consecutive quarter of positive returns for the S&P 500® Index, its strongest quarterly advance in four years.
For the Reporting Period overall, information technology, materials and consumer discretionary were the best performing sectors in the S&P 500® Index, as measured by total return. The weakest performing sectors in the S&P 500® Index were telecommunication services and energy, the only two to post negative absolute returns, followed by real estate, which was comparatively weak but generated a positive return during the Reporting Period.
Within the U.S. equity market, there was significant disparity in performance not only among sectors but also among the various capitalization and style segments. While all capitalization segments posted positive returns, large-cap stocks, as measured by the Russell 1000® Index, performed best, followed by mid-cap stocks, as measured by the Russell Midcap® Index, and then at some distance by small-cap stocks, as measured by the Russell 2000® Index. From a style perspective, growth-oriented stocks significantly outpaced value-oriented stocks across the capitalization spectrum. (All as measured by the Russell indices.)
What key factors were responsible for the Fund’s performance during the Reporting Period?
During the Reporting Period, the Fund underperformed the Russell Index on a relative basis. Five of our quantitative model’s six investment themes added to relative performance. However, the Fund underperformed the Index largely because of certain individual stock positions.
What impact did the Fund’s investment themes have on performance during the Reporting Period?
As expected, and in keeping with our investment approach, our quantitative model and its six investment themes — Valuation, Profitability, Quality, Management, Momentum and Sentiment — had the greatest impact on relative performance. We use these themes to take a long-term view of market patterns and look for inefficiencies, selecting stocks for the Fund and overweighting or
1
GOLDMAN SACHS VARIABLE INSURANCE TRUST SMALL CAP EQUITY INSIGHTS FUND
underweighting the ones chosen by the model. Over time and by design, the performance of any one of the model’s investment themes tends to have a low correlation with the model’s other themes, demonstrating the diversification benefit of the Fund’s theme-driven quantitative model. The variance in performance supports our research indicating that the diversification provided by the Fund’s different investment themes is a significant investment advantage over the long term, even though the Fund may experience underperformance in the short term. Of course, diversification does not protect an investor from market risk nor does it ensure a profit.
During the Reporting Period, five of our six investment themes contributed positively to the Fund’s relative performance. The Momentum, Valuation, Quality, Profitability and Management themes contributed positively to relative performance. The Momentum theme seeks to predict drifts in stock prices caused by delayed investor reaction to company-specific information and information about related companies. Valuation attempts to capture potential mispricings of securities, typically by comparing a measure of the company’s intrinsic value to its market value. The Quality theme assesses both firm and financial quality. The Profitability theme assesses whether a company is earning more than its cost of capital. The Management theme assesses the characteristics, policies and strategic decisions of company management.
The Fund’s Sentiment theme detracted from the Fund’s relative performance. The Sentiment theme reflects selected investment views and decisions of individuals and financial intermediaries.
How did the Fund’s sector and industry allocations affect relative performance?
In constructing the Fund’s portfolio, we focus on picking stocks rather than making industry or sector bets. Consequently, the Fund is similar to its benchmark, the Russell Index, in terms of its sector allocation and style. We manage the Fund’s industry and sector exposure by including industry factors in our risk model and by explicitly penalizing industry and sector deviations from the benchmark index in optimization. Sector weights or changes in weights generally do not have a meaningful impact on relative performance.
Did stock selection help or hurt Fund performance during the Reporting Period?
We seek to outpace the Russell Index by overweighting stocks that we expect to outperform and underweighting those that we think may lag. We also build positions based on our thematic views. For example, the Fund aims to hold a basket of stocks with more favorable Momentum characteristics than the benchmark index. During the Reporting Period, certain individual stock positions detracted from relative performance. The Fund was hurt most by security selection in the industrials, consumer discretionary and information technology sectors. Conversely, security selection in the real estate and financials sectors bolstered relative returns. Relative allocation positioning in financials and energy also contributed positively to the Fund’s relative performance.
Which individual positions detracted from the Fund’s results during the Reporting Period?
Detracting most from the Fund’s results relative to its benchmark index were overweight positions in re-insurance company Maiden Holdings and charter air transportation provider Hawaiian Holdings and an underweight position in clinical-stage biopharmaceutical company Nektar Therapeutics. The Fund was overweight Maiden Holdings due to our positive view on Value. Our positive view on Value also led us to overweight Hawaiian Holdings. We chose to underweight Nektar Therapeutics because of our negative views on Momentum and Value.
Which individual stock positions contributed the most to the Fund’s relative returns during the Reporting Period?
The Fund benefited most from overweight positions in equipment manufacturer Rogers, research-based pharmaceutical company FibroGen and gaming facilities owner and operator Penn National Gaming. We chose to overweight Rogers because of our positive views on Sentiment and Quality. Our positive views on Quality and Value led us to overweight FibroGen. The Fund was overweight Penn National Gaming due to our positive views on Sentiment and Value.
How did the Fund use derivatives during the Reporting Period?
During the Reporting Period, we did not use derivatives as part of an active management strategy to add value to the Fund’s results. However, we used equity index futures contracts, on an opportunistic basis, to equitize the Fund’s excess cash holdings. In other words, we put the Fund’s excess cash holdings to work by using them as collateral for the purchase of stock futures. The use of these futures contracts did not have a material impact on the Fund’s performance during the Reporting Period.
Did you make any enhancements to your quantitative models during the Reporting Period?
We continuously look for ways to improve our investment process. During the Reporting Period, we made numerous enhancements to our models. As example, we made two enhancements to our Sentiment theme. The first enhancement introduced a signal in the
2
GOLDMAN SACHS VARIABLE INSURANCE TRUST SMALL CAP EQUITY INSIGHTS FUND
U.S. region, which looks at characteristics of a company’s Credit Default Swaps term structure to infer investor expectations regarding the health of that company. Secondly, we introduced an enhancement in the U.S. region that looks at the 10-K and 10-Q filings of companies as an indicator of stock price movements. We use natural language processing techniques to parse through quarterly filings in an effort to gauge various aspects of a company related to management sentiment, their outlook and their thoughts on upcoming risks.
During the fourth quarter of 2017, we introduced new signals within the Profitability theme that use various alternative data sources to identify companies benefiting from consumer spending. The first signal, introduced in the U.S. region, aims to forecast sales growth trends not just for the upcoming quarter but for multiple quarters ahead by looking for underlying trends. The second signal, also introduced in the U.S. region, analyzes profitability of retailers by assessing customer traffic in the retailer’s location. The third signal aims to predict the profitability of developed market companies outside the U.S. by mapping U.S. consumer spending data in various segments to non-U.S. companies engaged in these business segments, as our research has shown that consumer behavior across developed markets are correlated.
We also introduced new signals within our Momentum theme that help us create economic links between companies with similar businesses. The first signal, introduced in all regions, identifies companies linked by a common theme based on company descriptions. The second signal, introduced in the U.S. region, looks at searches made on the same day for regulatory filings of multiple companies to identify linked companies.
Additionally, we introduced an Environmental, Social and Governance (“ESG”) signal within our Management theme that helps us quantify reputational risk. The signal, introduced in all regions except Canada, looks at ESG risk events to form a view of the peak risk of the company from an ESG perspective.
What was the Fund’s sector positioning relative to its benchmark index at the end of the Reporting Period?
As of December 31, 2017, the Fund was overweight the energy, consumer discretionary, industrials and materials sectors relative to the Russell Index. The Fund was underweight health care, utilities, financials and consumer staples and was rather neutrally weighted in telecommunication services, real estate and information technology compared to the benchmark index on the same date.
Were there any changes to the Fund’s portfolio management team during the Reporting Period?
During the Reporting Period, one Vice President left the Equity Alpha team and two Vice Presidents joined the team. QIS employs a globally integrated team of more than 90 professionals, with an additional 75-plus professionals dedicated to trading, information technology and development of analytical tools.
What is your strategy going forward for the Fund?
Looking ahead, we continue to believe that less expensive stocks should outpace more expensive stocks, and stocks with good momentum are likely to outperform those with poor momentum. We intend to maintain our focus on seeking companies about which fundamental research analysts are becoming more positive as well as profitable companies with sustainable earnings and a track record of using their capital to enhance shareholder value. As such, we anticipate remaining fully invested with long-term performance likely to be the result of stock selection rather than sector or capitalization allocations.
We stand behind our investment philosophy that sound economic investment principles, coupled with a disciplined quantitative approach, can provide strong, uncorrelated returns over the long term. Our research agenda is robust, and we continue to enhance our existing models, add new proprietary forecasting signals and improve our trading execution as we seek to provide the most value to our shareholders.
3
GOLDMAN SACHS VARIABLE INSURANCE TRUST SMALL CAP EQUITY INSIGHTS FUND
Index Definitions
The Russell 2000® Index is an unmanaged index of common stock prices that measures the performance of the 2000 smallest companies in the Russell 3000® Index. The figures for the index do not include any deduction for fees, expenses or taxes. It is not possible to invest directly in an index.
The S&P 500® Index is the Standard & Poor’s 500 Composite Index of 500 stocks, an unmanaged index of common stock prices. The figures for the index do not include any deduction for fees, expenses or taxes. It is not possible to invest directly in an index.
The Russell Midcap® Index measures the performance of the 800 smallest companies in the Russell 1000® Index, which represents approximately 25% of the total market capitalization of the Russell 1000 Index. It is not possible to invest directly in an index.
The Russell 1000® Index measures the performance of the 1,000 largest companies in the Russell 3000® Index, which represents approximately 92% of the total market capitalization of the Russell 3000 Index. It is not possible to invest directly in an index.
4
FUND BASICS
Small Cap Equity Insights Fund
as of December 31, 2017
STANDARDIZED TOTAL RETURNS1
| | | | | | | | | | | | | | | | | | |
| For the period ended 12/31/17 | | One Year | | | Five Years | | | Ten Years | | | Since Inception | | | Inception Date |
| Institutional | | | 11.57 | % | | | 14.29 | % | | | 9.27 | % | | | 7.16 | % | | 2/13/98 |
| Service | | | 11.22 | | | | 14.00 | | | | 8.98 | | | | 8.05 | | | 8/31/07 |
| 1 | The Standardized Total Returns are average annual total returns as of the most recent calendar quarter-end. They assume reinvestment of all distributions at net asset value (“NAV”). Because Institutional Shares and Service Shares do not involve a sales charge, such a charge is not applied to their Standardized Total Returns. |
Total return figures in the above chart represent past performance and do not indicate future results, which will vary. The investment return and principal value of an investment will fluctuate and, therefore, an investor’s shares, when redeemed, may be worth more or less than their original cost. Current performance may be lower or higher than the total return figures in the above chart. Please visit www.GSAMFUNDS.com to obtain the most recent month-end returns. Performance reflects fee waivers and/or expense limitations in effect during the periods shown. In their absence, performance would be reduced.
EXPENSE RATIOS2
| | | | | | | | |
| | | Net Expense Ratio (Current) | | | Gross Expense Ratio (Before Waivers) | |
| Institutional | | | 0.81 | % | | | 1.04 | % |
| Service | | | 1.06 | | | | 1.29 | |
| 2 | The expense ratios of the Fund, both current (net of any fee waivers and/or expense limitations) and before waivers (gross of any fee waivers and/or expense limitations) are as set forth above according to the most recent publicly available Prospectuses for the Fund and may differ from the expense ratios disclosed in the Financial Highlights in this report. Pursuant to a contractual arrangement, the Fund’s fee waivers and/or expense limitations will remain in place through at least April 28, 2018, and prior to such date, the Investment Adviser may not terminate the arrangements without the approval of the Fund’s Board of Trustees. If these arrangements are discontinued in the future, the expense ratios may change without shareholder approval. |
TOP TEN HOLDINGS AS OF 12/31/173,4
| | | | | | |
| Holding | | % of Net Assets | | | Line of Business |
| Evercore, Inc. Class A | | | 0.8% | | | Diversified Financials |
| Entegris, Inc. | | | 0.8 | | | Semiconductors & Semiconductor Equipment |
| American Eagle Outfitters, Inc. | | | 0.8 | | | Retailing |
| Piper Jaffray Cos. | | | 0.8 | | | Diversified Financials |
| American Equity Investment Life Holding Co. | | | 0.7 | | | Insurance |
| Arch Coal, Inc. Class A | | | 0.7 | | | Energy |
| Sunstone Hotel Investors, Inc. (REIT) | | | 0.7 | | | Real Estate |
| First Industrial Realty Trust, Inc. (REIT) | | | 0.7 | | | Real Estate |
| Louisiana-Pacific Corp. | | | 0.7 | | | Materials |
| Peabody Energy Corp. | | | 0.7 | | | Energy |
| 3 | The top 10 holdings may not be representative of the Fund’s future investments. |
| 4 | The Fund’s overall top ten holdings differ from the table above due to the exclusion of the Goldman Sachs Financial Square Government Fund (a securities lending reinvestment vehicle) which represents 1.1% of the Fund’s net assets as of 12/31/2017. |
5
FUND BASICS
FUND VS. BENCHMARK SECTOR ALLOCATIONS4
As of December 31, 2017
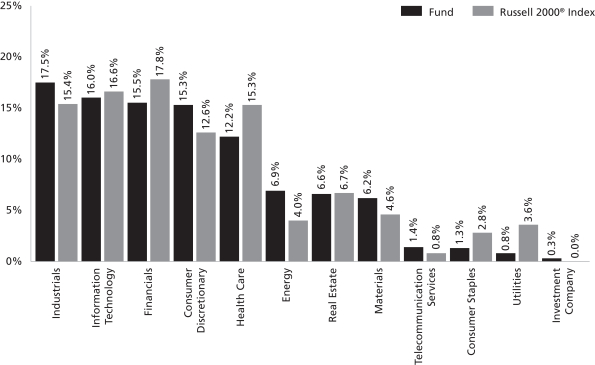
| 4 | The Fund is actively managed and, as such, its composition may differ over time. Consequently, the Fund’s overall sector allocations may differ from percentages contained in the graph above. The graph categorizes investments using Global Industry Classification Standard (“GICS”), however, the sector classifications used by the portfolio management team may differ from GICS. The percentage shown for each investment category reflects the value of investments in that category as a percentage of market value (excluding investments in the securities lending reinvestment vehicle, if any). Underlying sector allocations of exchange traded funds and investment companies held by the Fund are not reflected in the graph above. Investments in the securities lending reinvestment vehicle represented 1.1% of the Fund’s net assets at December 31, 2017. The graph depicts the Fund’s investments but may not represent the Fund’s market exposure due to the exclusion of certain derivatives, if any, as listed in the Additional Investment Information section of the Schedule of Investments. |
6
GOLDMAN SACHS VARIABLE INSURANCE TRUST SMALL CAP EQUITY INSIGHTS FUND
Performance Summary
December 31, 2017
The following graph shows the value, as of December 31, 2017, of a $10,000 investment made on January 1, 2008 in Institutional Shares at NAV. For comparative purposes, the performance of the Fund’s benchmark, the Russell 2000® Index (with distributions reinvested), is shown. This performance data represents past performance and should not be considered indicative of future performance, which will fluctuate with changes in market conditions. These performance fluctuations may cause an investor’s shares, when redeemed, to be worth more or less than their original cost. Performance reflects Fund level expenses but does not reflect fees and expenses associated with any variable annuity contract or variable life insurance policy that uses the Fund as an investment option for any contract or policy. Had performance reflected all of those fees and expenses, performance would have been reduced. Performance reflects applicable fee waivers and/or expense limitations in effect during the periods shown, and in their absence, performance would be reduced. Performance of Service Shares will vary from Institutional Shares due to differences in class specific fees. In addition to the Investment Adviser’s decisions regarding issuer/industry investment selection and allocation, other factors may affect Fund performance. These factors include, but are not limited to, Fund operating fees and expenses, portfolio turnover, and subscription and redemption cash flows affecting the Fund.
Small Cap Equity Insights Fund’s 10 Year Performance
Performance of a $10,000 investment, with distributions reinvested, from January 1, 2008 through December 31, 2017.
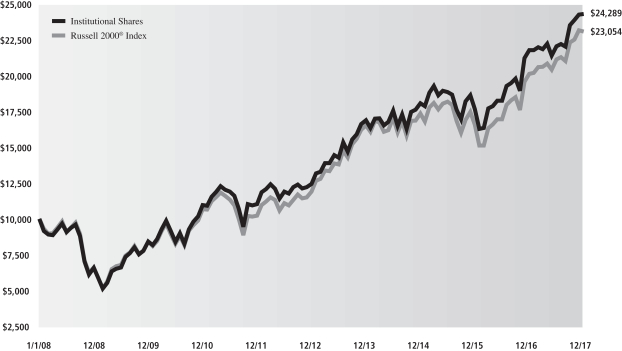
| | | | | | | | | | |
| Average Annual Total Return through December 31, 2017 | | One Year | | Five Years | | | Ten Years | | Since Inception |
Institutional (Commenced February 13, 1998) | | 11.57% | | | 14.29% | | | 9.27% | | 7.16% |
Service (Commenced August 31, 2007) | | 11.22% | | | 14.00% | | | 8.98% | | 8.05% |
7
GOLDMAN SACHS VARIABLE INSURANCE TRUST SMALL CAP EQUITY INSIGHTS FUND
Schedule of Investments
December 31, 2017
| | | | | | | | |
| Shares | | | Description | | Value | |
| | Common Stocks – 98.2% | |
| | Automobiles & Components – 1.9% | |
| | 5,574 | | | Cooper-Standard Holdings, Inc.* | | $ | 682,815 | |
| | 6,975 | | | Dana, Inc. | | | 223,270 | |
| | 4,790 | | | Dorman Products, Inc.* | | | 292,861 | |
| | 10,845 | | | Tenneco, Inc. | | | 634,866 | |
| | | | | | | | |
| | | | | | | 1,833,812 | |
| | |
| | Banks – 8.1% | |
| | 1,379 | | | BankFinancial Corp. | | | 21,154 | |
| | 637 | | | Banner Corp. | | | 35,111 | |
| | 12,466 | | | Beneficial Bancorp, Inc. | | | 205,066 | |
| | 4,242 | | | Cathay General Bancorp | | | 178,885 | |
| | 20,596 | | | Central Pacific Financial Corp. | | | 614,379 | |
| | 24,434 | | | CVB Financial Corp. | | | 575,665 | |
| | 11,165 | | | Dime Community Bancshares, Inc. | | | 233,907 | |
| | 1,007 | | | Eagle Bancorp, Inc.* | | | 58,305 | |
| | 4,753 | | | Federal Agricultural Mortgage Corp. Class C | | | 371,875 | |
| | 16,654 | | | First Busey Corp. | | | 498,621 | |
| | 1,730 | | | First Citizens BancShares, Inc. Class A | | | 697,190 | |
| | 712 | | | First Defiance Financial Corp. | | | 37,003 | |
| | 705 | | | First Financial Corp. | | | 31,972 | |
| | 3,885 | | | First Foundation, Inc.* | | | 72,028 | |
| | 4,361 | | | Fulton Financial Corp. | | | 78,062 | |
| | 13,334 | | | Hanmi Financial Corp. | | | 404,687 | |
| | 3,034 | | | Heartland Financial USA, Inc. | | | 162,774 | |
| | 9,099 | | | Hilltop Holdings, Inc. | | | 230,478 | |
| | 3,421 | | | Home Bancorp, Inc. | | | 147,856 | |
| | 2,432 | | | Home BancShares, Inc. | | | 56,544 | |
| | 16,087 | | | International Bancshares Corp. | | | 638,654 | |
| | 4,648 | | | Meridian Bancorp, Inc. | | | 95,749 | |
| | 1,589 | | | Meta Financial Group, Inc. | | | 147,221 | |
| | 654 | | | National Commerce Corp.* | | | 26,323 | |
| | 16,421 | | | OFG Bancorp | | | 154,357 | |
| | 1,379 | | | Seacoast Banking Corp. of Florida* | | | 34,765 | |
| | 9,133 | | | TriCo Bancshares | | | 345,775 | |
| | 20,737 | | | TrustCo Bank Corp. | | | 190,780 | |
| | 7,768 | | | UMB Financial Corp. | | | 558,674 | |
| | 10,635 | | | United Community Banks, Inc. | | | 299,269 | |
| | 6,489 | | | Walker & Dunlop, Inc.* | | | 308,227 | |
| | 5,043 | | | Wintrust Financial Corp. | | | 415,392 | |
| | | | | | | | |
| | | | | | | 7,926,748 | |
| | |
| | Capital Goods – 9.0% | |
| | 1,031 | | | Alamo Group, Inc. | | | 116,369 | |
| | 3,044 | | | Applied Industrial Technologies, Inc. | | | 207,296 | |
| | 6,240 | | | Argan, Inc. | | | 280,800 | |
| | 4,881 | | | Briggs & Stratton Corp. | | | 123,831 | |
| | 15,352 | | | Builders FirstSource, Inc.* | | | 334,520 | |
| | 1,611 | | | Caesarstone Ltd.* | | | 35,442 | |
| | 7,036 | | | Comfort Systems USA, Inc. | | | 307,121 | |
| | 21,669 | | | Continental Building Products, Inc.* | | | 609,982 | |
| | 5,898 | | | Curtiss-Wright Corp. | | | 718,671 | |
| | 2,753 | | | Ducommun, Inc.* | | | 78,323 | |
| | 8,831 | | | EMCOR Group, Inc. | | | 721,934 | |
| | 2,616 | | | EnerSys | | | 182,152 | |
| | 6,517 | | | Esterline Technologies Corp.* | | | 486,820 | |
| | |
| | Common Stocks – (continued) | |
| | Capital Goods – (continued) | |
| | 5,135 | | | GMS, Inc.* | | | 193,281 | |
| | 4,304 | | | Granite Construction, Inc. | | | 273,003 | |
| | 14,910 | | | H&E Equipment Services, Inc. | | | 606,092 | |
| | 13,740 | | | Hillenbrand, Inc. | | | 614,178 | |
| | 2,813 | | | Kadant, Inc. | | | 282,425 | |
| | 2,582 | | | Kennametal, Inc. | | | 124,995 | |
| | 4,579 | | | Masonite International Corp.* | | | 339,533 | |
| | 4,149 | | | Miller Industries, Inc. | | | 107,044 | |
| | 2,495 | | | PGT Innovations, Inc.* | | | 42,041 | |
| | 15,768 | | | Primoris Services Corp. | | | 428,732 | |
| | 13,537 | | | Rush Enterprises, Inc. Class A* | | | 687,815 | |
| | 4,554 | | | SPX FLOW, Inc.* | | | 216,543 | |
| | 8,033 | | | Titan Machinery, Inc.* | | | 170,059 | |
| | 287 | | | Trex Co., Inc.* | | | 31,108 | |
| | 8,867 | | | TriMas Corp.* | | | 237,192 | |
| | 14,828 | | | Wabash National Corp. | | | 321,768 | |
| | | | | | | | |
| | | | | | | 8,879,070 | |
| | |
| | Commercial & Professional Services – 6.2% | |
| | 2,195 | | | Barrett Business Services, Inc. | | | 141,556 | |
| | 18,106 | | | Brady Corp. Class A | | | 686,217 | |
| | 13,080 | | | CBIZ, Inc.* | | | 202,086 | |
| | 3,708 | | | CRA International, Inc. | | | 166,675 | |
| | 2,539 | | | Essendant, Inc. | | | 23,536 | |
| | 374 | | | Exponent, Inc. | | | 26,591 | |
| | 3,532 | | | Heidrick & Struggles International, Inc. | | | 86,711 | |
| | 2,832 | | | ICF International, Inc.* | | | 148,680 | |
| | 10,146 | | | Insperity, Inc. | | | 581,873 | |
| | 6,584 | | | Kelly Services, Inc. Class A | | | 179,546 | |
| | 32,194 | | | Kimball International, Inc. Class B | | | 601,062 | |
| | 4,290 | | | Korn/Ferry International | | | 177,520 | |
| | 3,560 | | | Matthews International Corp. Class A | | | 187,968 | |
| | 14,348 | | | McGrath RentCorp | | | 674,069 | |
| | 6,899 | | | MSA Safety, Inc. | | | 534,810 | |
| | 7,475 | | | On Assignment, Inc.* | | | 480,418 | |
| | 8,331 | | | Quad/Graphics, Inc. | | | 188,281 | |
| | 19,447 | | | RPX Corp. | | | 261,368 | |
| | 11,288 | | | TriNet Group, Inc.* | | | 500,510 | |
| | 3,176 | | | TrueBlue, Inc.* | | | 87,340 | |
| | 496 | | | UniFirst Corp. | | | 81,790 | |
| | 1,302 | | | WageWorks, Inc.* | | | 80,724 | |
| | | | | | | | |
| | | | | | | 6,099,331 | |
| | |
| | Consumer Durables & Apparel – 4.6% | |
| | 10,746 | | | Beazer Homes USA, Inc.* | | | 206,431 | |
| | 40,896 | | | Callaway Golf Co. | | | 569,681 | |
| | 15,337 | | | Crocs, Inc.* | | | 193,860 | |
| | 7,965 | | | Deckers Outdoor Corp.* | | | 639,191 | |
| | 22,809 | | | Fossil Group, Inc.*(a) | | | 177,226 | |
| | 12,232 | | | KB Home | | | 390,812 | |
| | 14,167 | | | Malibu Boats, Inc. Class A* | | | 421,185 | |
| | 11,317 | | | MCBC Holdings, Inc.* | | | 251,464 | |
| | 18,496 | | | MDC Holdings, Inc. | | | 589,652 | |
| | 1,649 | | | Oxford Industries, Inc. | | | 123,988 | |
| | 1,137 | | | Superior Uniform Group, Inc. | | | 30,369 | |
| | 8,420 | | | TopBuild Corp.* | | | 637,731 | |
| | |
| | |
| 8 | | The accompanying notes are an integral part of these financial statements. |
GOLDMAN SACHS VARIABLE INSURANCE TRUST SMALL CAP EQUITY INSIGHTS FUND
| | | | | | | | |
| Shares | | | Description | | Value | |
| | Common Stocks – (continued) | |
| | Consumer Durables & Apparel – (continued) | |
| | 6,365 | | | Unifi, Inc.* | | $ | 228,313 | |
| | 6,231 | | | Vista Outdoor, Inc.* | | | 90,786 | |
| | | | | | | | |
| | | | | | | 4,550,689 | |
| | |
| | Consumer Services – 4.2% | |
| | 8,848 | | | BJ’s Restaurants, Inc. | | | 322,067 | |
| | 13,311 | | | Boyd Gaming Corp. | | | 466,551 | |
| | 8,658 | | | Dave & Buster’s Entertainment, Inc.* | | | 477,662 | |
| | 785 | | | Grand Canyon Education, Inc.* | | | 70,281 | |
| | 22,063 | | | Houghton Mifflin Harcourt Co.* | | | 205,186 | |
| | 11,299 | | | International Speedway Corp. Class A | | | 450,265 | |
| | 21,290 | | | K12, Inc.* | | | 338,511 | |
| | 860 | | | Monarch Casino & Resort, Inc.* | | | 38,545 | |
| | 19,980 | | | Penn National Gaming, Inc.* | | | 625,973 | |
| | 4,638 | | | Ruth’s Hospitality Group, Inc. | | | 100,413 | |
| | 7,897 | | | Scientific Games Corp. Class A* | | | 405,116 | |
| | 12,582 | | | Texas Roadhouse, Inc. | | | 662,820 | |
| | | | | | | | |
| | | | | | | 4,163,390 | |
| | |
| | Diversified Financials – 4.3% | |
| | 13,701 | | | AG Mortgage Investment Trust, Inc. (REIT) | | | 260,456 | |
| | 20,925 | | | Enova International, Inc.* | | | 318,060 | |
| | 9,189 | | | Evercore, Inc. Class A(b) | | | 827,010 | |
| | 5,675 | | | Green Dot Corp. Class A* | | | 341,975 | |
| | 12,390 | | | Houlihan Lokey, Inc. | | | 562,878 | |
| | 22,443 | | | Investment Technology Group, Inc. | | | 432,028 | |
| | 22,999 | | | LendingClub Corp.* | | | 94,986 | |
| | 7,486 | | | Moelis & Co. Class A | | | 363,071 | |
| | 8,638 | | | Piper Jaffray Cos. | | | 745,027 | |
| | 4,472 | | | Westwood Holdings Group, Inc. | | | 296,091 | |
| | | | | | | | |
| | | | | | | 4,241,582 | |
| | |
| | Energy – 6.8% | |
| | 7,835 | | | Arch Coal, Inc. Class A | | | 729,909 | |
| | 1,700 | | | Archrock, Inc. | | | 17,850 | |
| | 763 | | | Bonanza Creek Energy, Inc.* | | | 21,051 | |
| | 8,716 | | | CVR Energy, Inc.(a) | | | 324,584 | |
| | 17,945 | | | Delek US Energy, Inc. | | | 626,998 | |
| | 67,843 | | | Denbury Resources, Inc.* | | | 149,933 | |
| | 181 | | | Dorian LPG Ltd.* | | | 1,488 | |
| | 5,785 | | | Energy XXI Gulf Coast, Inc.* | | | 33,206 | |
| | 18,024 | | | Exterran Corp.* | | | 566,675 | |
| | 50,318 | | | Fairmount Santrol Holdings, Inc.*(a) | | | 263,163 | |
| | 6,784 | | | Matrix Service Co.* | | | 120,755 | |
| | 90,457 | | | McDermott International, Inc.* | | | 595,207 | |
| | 5,566 | | | Newpark Resources, Inc.* | | | 47,868 | |
| | 12,215 | | | Oil States International, Inc.* | | | 345,684 | |
| | 8,236 | | | Pacific Ethanol, Inc.* | | | 37,474 | |
| | 10,385 | | | Par Pacific Holdings, Inc.* | | | 200,223 | |
| | 18,426 | | | Peabody Energy Corp.* | | | 725,432 | |
| | 30,808 | | | Pioneer Energy Services Corp.* | | | 93,964 | |
| | 17,318 | | | ProPetro Holding Corp.* | | | 349,131 | |
| | 5,058 | | | REX American Resources Corp.* | | | 418,752 | |
| | 1,963 | | | SEACOR Holdings, Inc.* | | | 90,730 | |
| | 16,676 | | | Smart Sand, Inc.* | | | 144,414 | |
| | |
| | Common Stocks – (continued) | |
| | Energy – (continued) | |
| | 4,934 | | | Stone Energy Corp.* | | | 158,677 | |
| | 19,521 | | | Superior Energy Services, Inc.* | | | 187,987 | |
| | 11,160 | | | Unit Corp.* | | | 245,520 | |
| | 4,280 | | | US Silica Holdings, Inc. | | | 139,357 | |
| | | | | | | | |
| | | | | | | 6,636,032 | |
| | |
| | Food & Staples Retailing – 0.1% | |
| | 6,160 | | | Smart & Final Stores, Inc.* | | | 52,668 | |
| | 3,685 | | | Village Super Market, Inc. Class A | | | 84,497 | |
| | | | | | | | |
| | | | | | | 137,165 | |
| | |
| | Food, Beverage & Tobacco – 0.6% | |
| | 6,740 | | | Dean Foods Co. | | | 77,914 | |
| | 482 | | | John B Sanfilippo & Son, Inc. | | | 30,486 | |
| | 838 | | | Lancaster Colony Corp. | | | 108,278 | |
| | 3,224 | | | National Beverage Corp. | | | 314,147 | |
| | 247 | | | Sanderson Farms, Inc. | | | 34,279 | |
| | | | | | | | |
| | | | | | | 565,104 | |
| | |
| | Health Care Equipment & Services – 3.8% | |
| | 6,784 | | | Aceto Corp. | | | 70,079 | |
| | 4,427 | | | Allscripts Healthcare Solutions, Inc.* | | | 64,413 | |
| | 705 | | | Amedisys, Inc.* | | | 37,160 | |
| | 4,803 | | | Anika Therapeutics, Inc.* | | | 258,930 | |
| | 174 | | | Atrion Corp. | | | 109,724 | |
| | 133 | | | Cantel Medical Corp. | | | 13,682 | |
| | 2,272 | | | CorVel Corp.* | | | 120,189 | |
| | 3,196 | | | Halyard Health, Inc.* | | | 147,591 | |
| | 5,213 | | | HealthStream, Inc.* | | | 120,733 | |
| | 1,786 | | | LHC Group, Inc.* | | | 109,392 | |
| | 6,765 | | | Magellan Health, Inc.* | | | 653,161 | |
| | 7,629 | | | Masimo Corp.* | | | 646,939 | |
| | 2,442 | | | Medidata Solutions, Inc.* | | | 154,749 | |
| | 8,417 | | | Molina Healthcare, Inc.* | | | 645,416 | |
| | 687 | | | National HealthCare Corp. | | | 41,866 | |
| | 4,237 | | | NxStage Medical, Inc.* | | | 102,662 | |
| | 5,814 | | | Quality Systems, Inc.* | | | 78,954 | |
| | 13,615 | | | Triple-S Management Corp. Class B* | | | 338,333 | |
| | 789 | | | Vocera Communications, Inc.* | | | 23,844 | |
| | | | | | | | |
| | | | | | | 3,737,817 | |
| | |
| | Household & Personal Products – 0.6% | |
| | 8,470 | | | Central Garden & Pet Co. Class A* | | | 319,404 | |
| | 2,121 | | | Inter Parfums, Inc. | | | 92,157 | |
| | 1,790 | | | Medifast, Inc. | | | 124,960 | |
| | | | | | | | |
| | | | | | | 536,521 | |
| | |
| | Insurance – 2.9% | |
| | 23,790 | | | American Equity Investment Life Holding Co. | | | 731,066 | |
| | 10,757 | | | Argo Group International Holdings Ltd. | | | 663,169 | |
| | 3,975 | | | FBL Financial Group, Inc. Class A | | | 276,859 | |
| | 52,008 | | | Genworth Financial, Inc. Class A* | | | 161,745 | |
| | 7,243 | | | Health Insurance Innovations, Inc. Class A*(a) | | | 180,713 | |
| | 2,207 | | | James River Group Holdings Ltd. | | | 88,302 | |
| | |
| | |
| The accompanying notes are an integral part of these financial statements. | | 9 |
GOLDMAN SACHS VARIABLE INSURANCE TRUST SMALL CAP EQUITY INSIGHTS FUND
Schedule of Investments (continued)
December 31, 2017
| | | | | | | | |
| Shares | | | Description | | Value | |
| | Common Stocks – (continued) | |
| | Insurance – (continued) | |
| | 17,173 | | | Maiden Holdings Ltd. | | $ | 113,342 | |
| | 13,723 | | | Stewart Information Services Corp. | | | 580,483 | |
| | 2,833 | | | Trupanion, Inc.*(a) | | | 82,922 | |
| | | | | | | | |
| | | | | | | 2,878,601 | |
| | |
| | Materials – 6.1% | |
| | 8,518 | | | Boise Cascade Co. | | | 339,868 | |
| | 13,802 | | | Carpenter Technology Corp. | | | 703,764 | |
| | 4,046 | | | Chase Corp. | | | 487,543 | |
| | 3,077 | | | Haynes International, Inc. | | | 98,618 | |
| | 8,073 | | | Ingevity Corp.* | | | 568,904 | |
| | 12,204 | | | Innophos Holdings, Inc. | | | 570,293 | |
| | 6,643 | | | KapStone Paper and Packaging Corp. | | | 150,730 | |
| | 7,774 | | | Kraton Corp.* | | | 374,474 | |
| | 27,626 | | | Louisiana-Pacific Corp.* | | | 725,459 | |
| | 8,926 | | | Materion Corp. | | | 433,804 | |
| | 8,866 | | | Minerals Technologies, Inc. | | | 610,424 | |
| | 20,910 | | | Schnitzer Steel Industries, Inc. Class A | | | 700,485 | |
| | 1,022 | | | Stepan Co. | | | 80,707 | |
| | 8,146 | | | SunCoke Energy, Inc.* | | | 97,670 | |
| | 1,963 | | | Worthington Industries, Inc. | | | 86,490 | |
| | | | | | | | |
| | | | | | | 6,029,233 | |
| | |
| | Media – 0.6% | |
| | 21,024 | | | Gannett Co., Inc. | | | 243,668 | |
| | 6,318 | | | MSG Networks, Inc. Class A* | | | 127,940 | |
| | 7,127 | | | New Media Investment Group, Inc. | | | 119,591 | |
| | 3,648 | | | tronc, Inc.* | | | 64,168 | |
| | | | | | | | |
| | | | | | | 555,367 | |
| | |
| | Pharmaceuticals, Biotechnology & Life Sciences – 8.2% | |
| | 8,323 | | | Acceleron Pharma, Inc.* | | | 353,228 | |
| | 23,244 | | | Akebia Therapeutics, Inc.* | | | 345,638 | |
| | 1,958 | | | Bluebird Bio, Inc.* | | | 348,720 | |
| | 3,715 | | | Calithera Biosciences, Inc.* | | | 31,020 | |
| | 6,114 | | | Cambrex Corp.* | | | 293,472 | |
| | 14,187 | | | Catalent, Inc.* | | | 582,802 | |
| | 7,671 | | | Catalyst Pharmaceuticals, Inc.* | | | 29,994 | |
| | 5,984 | | | ChemoCentryx, Inc.* | | | 35,605 | |
| | 1,841 | | | Concert Pharmaceuticals, Inc.* | | | 47,627 | |
| | 17,273 | | | CytomX Therapeutics, Inc.* | | | 364,633 | |
| | 2,405 | | | Enanta Pharmaceuticals, Inc.* | | | 141,125 | |
| | 2,567 | | | Epizyme, Inc.* | | | 32,216 | |
| | 3,672 | | | Exact Sciences Corp.* | | | 192,927 | |
| | 8,545 | | | FibroGen, Inc.* | | | 405,033 | |
| | 16,651 | | | Genomic Health, Inc.* | | | 569,464 | |
| | 3,000 | | | Global Blood Therapeutics, Inc.* | | | 118,050 | |
| | 27,024 | | | Halozyme Therapeutics, Inc.* | | | 547,506 | |
| | 6,145 | | | Ignyta, Inc.* | | | 164,071 | |
| | 13,273 | | | Innoviva, Inc.* | | | 188,344 | |
| | 790 | | | Intersect ENT, Inc.* | | | 25,596 | |
| | 536 | | | Ligand Pharmaceuticals, Inc.* | | | 73,394 | |
| | 3,926 | | | MiMedx Group, Inc.*(a) | | | 49,507 | |
| | 87,665 | | | PDL BioPharma, Inc.* | | | 240,202 | |
| | 15,607 | | | Phibro Animal Health Corp. Class A | | | 522,834 | |
| | 38,611 | | | Pieris Pharmaceuticals, Inc.* | | | 291,513 | |
| | |
| | Common Stocks – (continued) | |
| | Pharmaceuticals, Biotechnology & Life Sciences – (continued) | |
| | 3,570 | | | Portola Pharmaceuticals, Inc.* | | | 173,788 | |
| | 8,734 | | | PTC Therapeutics, Inc.* | | | 145,683 | |
| | 269 | | | Puma Biotechnology, Inc.* | | | 26,591 | |
| | 843 | | | REGENXBIO, Inc.* | | | 28,030 | |
| | 14,815 | | | Retrophin, Inc.* | | | 312,152 | |
| | 3,250 | | | Sage Therapeutics, Inc.* | | | 535,307 | |
| | 25,789 | | | Sangamo Therapeutics, Inc.* | | | 422,940 | |
| | 226 | | | Sarepta Therapeutics, Inc.* | | | 12,575 | |
| | 18,386 | | | Spectrum Pharmaceuticals, Inc.* | | | 348,415 | |
| | 2,595 | | | Supernus Pharmaceuticals, Inc.* | | | 103,411 | |
| | | | | | | | |
| | | | | | | 8,103,413 | |
| | |
| | Real Estate – 6.5% | |
| | 55,060 | | | DiamondRock Hospitality Co. (REIT) | | | 621,627 | |
| | 23,096 | | | First Industrial Realty Trust, Inc. (REIT)(b) | | | 726,831 | |
| | 6,984 | | | Hersha Hospitality Trust (REIT) | | | 121,522 | |
| | 14,942 | | | Kite Realty Group Trust (REIT) | | | 292,863 | |
| | 5,374 | | | PS Business Parks, Inc. (REIT) | | | 672,234 | |
| | 10,230 | | | QTS Realty Trust, Inc. Class A (REIT) | | | 554,057 | |
| | 19,822 | | | Rexford Industrial Realty, Inc. (REIT) | | | 578,010 | |
| | 245 | | | RMR Group, Inc. (The) Class A | | | 14,528 | |
| | 9,264 | | | Ryman Hospitality Properties, Inc. (REIT) | | | 639,401 | |
| | 3,535 | | | Summit Hotel Properties, Inc. (REIT) | | | 53,838 | |
| | 44,066 | | | Sunstone Hotel Investors, Inc. (REIT) | | | 728,411 | |
| | 6,287 | | | Terreno Realty Corp. (REIT) | | | 220,422 | |
| | 24,441 | | | Tier REIT, Inc. (REIT) | | | 498,352 | |
| | 4,378 | | | UMH Properties, Inc. (REIT) | | | 65,232 | |
| | 29,006 | | | Xenia Hotels & Resorts, Inc. (REIT) | | | 626,240 | |
| | | | | | | | |
| | | | | | | 6,413,568 | |
| | |
| | Retailing – 3.8% | |
| | 9,769 | | | Abercrombie & Fitch Co. Class A | | | 170,274 | |
| | 42,008 | | | American Eagle Outfitters, Inc. | | | 789,750 | |
| | 1,297 | | | America’s Car-Mart, Inc.* | | | 57,911 | |
| | 9,893 | | | Asbury Automotive Group, Inc.* | | | 633,152 | |
| | 14,711 | | | Chico’s FAS, Inc. | | | 129,751 | |
| | 29,790 | | | Express, Inc.* | | | 302,369 | |
| | 1,784 | | | Five Below, Inc.* | | | 118,315 | |
| | 14,739 | | | Groupon, Inc.* | | | 75,169 | |
| | 2,160 | | | Haverty Furniture Cos., Inc. | | | 48,924 | |
| | 15,575 | | | Liberty TripAdvisor Holdings, Inc. Class A* | | | 146,794 | |
| | 7,719 | | | Nutrisystem, Inc. | | | 406,019 | |
| | 21,089 | | | Pier 1 Imports, Inc. | | | 87,309 | |
| | 1,613 | | | Shoe Carnival, Inc. | | | 43,148 | |
| | 11,082 | | | Sleep Number Corp.* | | | 416,572 | |
| | 9,252 | | | Tailored Brands, Inc. | | | 201,971 | |
| | 4,114 | | | Zumiez, Inc.* | | | 85,674 | |
| | | | | | | | |
| | | | | | | 3,713,102 | |
| | |
| | Semiconductors & Semiconductor Equipment – 4.2% | |
| | 22,184 | | | Amkor Technology, Inc.* | | | 222,949 | |
| | 2,106 | | | Axcelis Technologies, Inc.* | | | 60,442 | |
| | 7,555 | | | Cabot Microelectronics Corp. | | | 710,774 | |
| | |
| | |
| 10 | | The accompanying notes are an integral part of these financial statements. |
GOLDMAN SACHS VARIABLE INSURANCE TRUST SMALL CAP EQUITY INSIGHTS FUND
| | | | | | | | |
| Shares | | | Description | | Value | |
| | Common Stocks – (continued) | |
| | Semiconductors & Semiconductor Equipment – (continued) | |
| | 3,318 | | | Cirrus Logic, Inc.* | | $ | 172,071 | |
| | 17,899 | | | Diodes, Inc.* | | | 513,164 | |
| | 26,758 | | | Entegris, Inc.(b) | | | 814,781 | |
| | 14,097 | | | FormFactor, Inc.* | | | 220,618 | |
| | 7,275 | | | MKS Instruments, Inc. | | | 687,488 | |
| | 39,422 | | | Photronics, Inc.* | | | 336,073 | |
| | 1,625 | | | Rudolph Technologies, Inc.* | | | 38,838 | |
| | 4,323 | | | Silicon Laboratories, Inc.* | | | 381,721 | |
| | | | | | | | |
| | | | | | | 4,158,919 | |
| | |
| | Software & Services – 7.7% | |
| | 7,478 | | | Appfolio, Inc. Class A* | | | 310,337 | |
| | 1,626 | | | Apptio, Inc. Class A* | | | 38,243 | |
| | 21,444 | | | Blucora, Inc.* | | | 473,912 | |
| | 12,869 | | | Bottomline Technologies de, Inc.* | | | 446,297 | |
| | 1,971 | | | Care.com, Inc.* | | | 35,557 | |
| | 3,768 | | | Cars.com, Inc.* | | | 108,669 | |
| | 1,016 | | | Cass Information Systems, Inc. | | | 59,141 | |
| | 23,773 | | | CommerceHub, Inc. Series C* | | | 489,486 | |
| | 3,172 | | | Convergys Corp. | | | 74,542 | |
| | 8,493 | | | Cornerstone OnDemand, Inc.* | | | 300,058 | |
| | 11,230 | | | CSG Systems International, Inc. | | | 492,099 | |
| | 6,501 | | | Envestnet, Inc.* | | | 324,075 | |
| | 16,697 | | | Etsy, Inc.* | | | 341,454 | |
| | 17,199 | | | Everi Holdings, Inc.* | | | 129,680 | |
| | 15,547 | | | EVERTEC, Inc. | | | 212,217 | |
| | 2,635 | | | Fair Isaac Corp. | | | 403,682 | |
| | 7,857 | | | Five9, Inc.* | | | 195,482 | |
| | 5,565 | | | Hortonworks, Inc.* | | | 111,912 | |
| | 2,410 | | | HubSpot, Inc.* | | | 213,044 | |
| | 10,499 | | | Imperva, Inc.* | | | 416,810 | |
| | 1,768 | | | MicroStrategy, Inc. Class A* | | | 232,138 | |
| | 12,391 | | | New Relic, Inc.* | | | 715,828 | |
| | 20,846 | | | NIC, Inc. | | | 346,044 | |
| | 1,849 | | | Paylocity Holding Corp.* | | | 87,199 | |
| | 1,064 | | | Perficient, Inc.* | | | 20,290 | |
| | 7,615 | | | Q2 Holdings, Inc.* | | | 280,613 | |
| | 3,988 | | | RingCentral, Inc. Class A* | | | 193,019 | |
| | 364 | | | Sykes Enterprises, Inc.* | | | 11,448 | |
| | 2,604 | | | TrueCar, Inc.* | | | 29,165 | |
| | 2,768 | | | Varonis Systems, Inc.* | | | 134,386 | |
| | 7,321 | | | Web.com Group, Inc.* | | | 159,598 | |
| | 4,409 | | | Yelp, Inc.* | | | 185,002 | |
| | | | | | | | |
| | | | | | | 7,571,427 | |
| | |
| | Technology Hardware & Equipment – 3.8% | |
| | 13,144 | | | AVX Corp. | | | 227,391 | |
| | 20,307 | | | Benchmark Electronics, Inc.* | | | 590,934 | |
| | 10,758 | | | Comtech Telecommunications Corp. | | | 237,967 | |
| | 13,001 | | | Electro Scientific Industries, Inc.* | | | 278,612 | |
| | 17,149 | | | Kimball Electronics, Inc.* | | | 312,969 | |
| | 17,045 | | | NetScout Systems, Inc.* | | | 519,020 | |
| | 3,191 | | | Rogers Corp.* | | | 516,687 | |
| | 8,233 | | | Sanmina Corp.* | | | 271,689 | |
| | |
| | Common Stocks – (continued) | |
| | Technology Hardware & Equipment – (continued) | |
| | 5,187 | | | TTM Technologies, Inc.* | | | 81,280 | |
| | 33,993 | | | Vishay Intertechnology, Inc.(b) | | | 705,355 | |
| | | | | | | | |
| | | | | | | 3,741,904 | |
| | |
| | Telecommunication Services – 1.4% | |
| | 6,636 | | | Boingo Wireless, Inc.* | | | 149,310 | |
| | 13,443 | | | Cogent Communications Holdings, Inc. | | | 608,968 | |
| | 11,813 | | | Consolidated Communications Holdings, Inc. | | | 144,000 | |
| | 1,486 | | | Spok Holdings, Inc. | | | 23,256 | |
| | 45,536 | | | Vonage Holdings Corp.* | | | 463,101 | |
| | | | | | | | |
| | | | | | | 1,388,635 | |
| | |
| | Transportation – 2.0% | |
| | 1,307 | | | Forward Air Corp. | | | 75,074 | |
| | 17,911 | | | Heartland Express, Inc. | | | 418,043 | |
| | 26,900 | | | Marten Transport Ltd. | | | 546,070 | |
| | 5,356 | | | Matson, Inc. | | | 159,823 | |
| | 368 | | | Saia, Inc.* | | | 26,036 | |
| | 18,070 | | | Werner Enterprises, Inc. | | | 698,405 | |
| | | | | | | | |
| | | | | | | 1,923,451 | |
| | |
| | Utilities – 0.8% | |
| | 1,561 | | | Black Hills Corp. | | | 93,832 | |
| | 376 | | | Northwest Natural Gas Co. | | | 22,428 | |
| | 8,320 | | | Portland General Electric Co. | | | 379,226 | |
| | 5,960 | | | Unitil Corp. | | | 271,895 | |
| | | | | | | | |
| | | | | | | 767,381 | |
| | |
| | TOTAL COMMON STOCKS | |
| | (Cost $83,030,226) | | $ | 96,552,262 | |
| | |
| | | | | | |
| Units | | Description | | Value | |
| Right*(c) – 0.0% | |
Pharmaceuticals, Biotechnology & Life Sciences – 0.0% | |
| 1,561 | | Dyax Corp., CVR | | $ | 4,683 | |
| (Cost $0) | | | | |
| |
| | | | | | |
| Shares | | Distribution
Rate | | Value | |
| Investment Company (d) – 0.3% | |
Goldman Sachs Financial Square Government Fund — Institutional Shares | |
| 264,823 | | 1.228% | | $ | 264,823 | |
| (Cost $264,823) | | | | |
| |
| TOTAL INVESTMENTS BEFORE SECURITIES LENDING REINVESTMENT VEHICLE | |
| (Cost $83,295,049) | | $ | 96,821,768 | |
| |
| | |
| The accompanying notes are an integral part of these financial statements. | | 11 |
GOLDMAN SACHS VARIABLE INSURANCE TRUST SMALL CAP EQUITY INSIGHTS FUND
Schedule of Investments (continued)
December 31, 2017
| | | | | | | | |
| Shares | | Distribution
Rate | | | Value | |
| Securities Lending Reinvestment Vehicle (d) – 1.1% | |
Goldman Sachs Financial Square Government Fund — Institutional Shares | |
| 1,053,265 | | | 1.228 | % | | $ | 1,053,265 | |
| (Cost $1,053,265) | |
| |
| TOTAL INVESTMENTS – 99.6% | |
| (Cost $84,348,314) | | | $ | 97,875,033 | |
| |
OTHER ASSETS IN EXCESS OF LIABILITIES – 0.4% | | | | 445,678 | |
| |
| NET ASSETS – 100.0% | | | $ | 98,320,711 | |
| |
| | |
| The percentage shown for each investment category reflects the value of investments in that category as a percentage of net assets. |
| * | | Non-income producing security. |
| (a) | | All or a portion of security is on loan. |
| (b) | | All or a portion of security is segregated as collateral for initial margin requirements on futures transactions. |
| (c) | | Significant unobservable inputs were used in the valuation of this portfolio security; i.e. Level 3. |
| (d) | | Represents an Affiliated Issuer. |
| | |
| Investment Abbreviations: |
| CVR | | —Contingent Value Rights |
| REIT | | —Real Estate Investment Trust |
ADDITIONAL INVESTMENT INFORMATION
FUTURES CONTRACTS — At December 31, 2017, the Fund had the following futures contracts:
| | | | | | | | | | | | | | | | |
| Description | | Number of
Contracts | | | Expiration
Date | | | Notional Amount | | | Unrealized
Appreciation/ (Depreciation) | |
Long position contracts: | | | | | | | | | | | | | | | | |
| Russell 2000 E-Mini Index | | | 8 | | | | 03/16/2018 | | | $ | 614,600 | | | $ | 4,406 | |
| | |
| 12 | | The accompanying notes are an integral part of these financial statements. |
GOLDMAN SACHS VARIABLE INSURANCE TRUST SMALL CAP EQUITY INSIGHTS FUND
Statement of Assets and Liabilities
December 31, 2017
| | | | |
| | | | |
| Assets: | |
Investments in unaffiliated issuers, at value (cost $83,030,226)(a) | | $ | 96,556,945 | |
Investments in affiliated issuers, at value (cost $264,823) | | | 264,823 | |
Investments in affiliated securities lending reinvestment vehicle, at value (cost $1,053,265) | | | 1,053,265 | |
Cash | | | 1,512,843 | |
Receivables: | | | | |
Dividends | | | 95,505 | |
Fund shares sold | | | 32,387 | |
Reimbursement from investment adviser | | | 32,448 | |
Securities lending income | | | 1,798 | |
Other assets | | | 338 | |
| Total assets | | | 99,550,352 | |
| | | | |
| | | | |
| Liabilities: | | | |
Variation margin on futures | | | 3,600 | |
Payables: | | | | |
Payable upon return of securities loaned | | | 1,053,265 | |
Management fees | | | 58,382 | |
Fund shares redeemed | | | 31,263 | |
Distribution and Service fees and Transfer Agency fees | | | 6,026 | |
Accrued expenses | | | 77,105 | |
| Total liabilities | | | 1,229,641 | |
| | | | |
| | | | |
| Net Assets: | | | |
Paid-in capital | | | 83,182,094 | |
Undistributed net investment income | | | 64,150 | |
Accumulated net realized gain | | | 1,543,342 | |
Net unrealized gain | | | 13,531,125 | |
| NET ASSETS | | $ | 98,320,711 | |
Net Assets: | | | | |
Institutional | | $ | 77,815,251 | |
Service | | | 20,505,460 | |
Total Net Assets | | $ | 98,320,711 | |
Shares outstanding $0.001 par value (unlimited shares authorized): | | | | |
Institutional | | | 5,697,537 | |
Service | | | 1,512,777 | |
Net asset value, offering and redemption price per share: | | | | |
Institutional | | | $13.66 | |
Service | | | 13.55 | |
(a) Includes loaned securities having a market value of $1,018,012.
| | |
| The accompanying notes are an integral part of these financial statements. | | 13 |
GOLDMAN SACHS VARIABLE INSURANCE TRUST SMALL CAP EQUITY INSIGHTS FUND
Statement of Operations
For the Fiscal Year Ended December 31, 2017
| | | | |
| | | | |
| Investment income: | |
Dividends — unaffiliated issuers (net of foreign taxes withheld of $933) | | $ | 1,235,666 | |
Securities lending income — affiliated issuer | | | 43,018 | |
Dividends — affiliated issuers | | | 5,892 | |
| Total investment income | | | 1,284,576 | |
| | | | |
| | | | |
| Expenses: | | | |
Management fees | | | 716,308 | |
Professional fees | | | 82,063 | |
Custody, accounting and administrative services | | | 69,229 | |
Distribution and Service fees — Service Shares | | | 49,370 | |
Printing and mailing costs | | | 40,353 | |
Transfer Agency fees(a) | | | 19,100 | |
Trustee fees | | | 17,816 | |
Other | | | 5,705 | |
| Total expenses | | | 999,944 | |
Less — expense reductions | | | (175,552 | ) |
| Net expenses | | | 824,392 | |
| NET INVESTMENT INCOME | | | 460,184 | |
| | | | |
| | | | |
| Realized and unrealized gain (loss): | | | |
Net realized gain from: | | | | |
Investments — unaffiliated issuers | | | 10,618,902 | |
Futures contracts | | | 162,635 | |
Net change in unrealized gain (loss) on: | | | | |
Investments — unaffiliated issuers | | | (859,117 | ) |
Futures contracts | | | 23,634 | |
| Net realized and unrealized gain | | | 9,946,054 | |
| NET INCREASE IN NET ASSETS RESULTING FROM OPERATIONS | | $ | 10,406,238 | |
(a) Institutional and Service Shares incurred Transfer Agency fees of $15,151 and $3,949, respectively.
| | |
| 14 | | The accompanying notes are an integral part of these financial statements. |
GOLDMAN SACHS VARIABLE INSURANCE TRUST SMALL CAP EQUITY INSIGHTS FUND
Statements of Changes in Net Assets
| | | | | | | | |
| | | For the
Fiscal Year Ended
December 31, 2017 | | | For the
Fiscal Year Ended
December 31, 2016 | |
| | | | | | | | |
| From operations: | |
Net investment income | | $ | 460,184 | | | $ | 585,304 | |
Net realized gain | | | 10,781,537 | | | | 3,248,759 | |
Net change in unrealized gain (loss) | | | (835,483 | ) | | | 15,333,955 | |
| Net increase in net assets resulting from operations | | | 10,406,238 | | | | 19,168,018 | |
| | | | | | | | |
| | | | | | | | |
| Distributions to shareholders: | | | | | | |
From net investment income | | | | | | | | |
Institutional Shares | | | (410,159 | ) | | | (805,471 | ) |
Service Shares | | | (60,003 | ) | | | (170,271 | ) |
From net realized gains | | | | | | | | |
Institutional Shares | | | (8,398,876 | ) | | | (1,921,693 | ) |
Service Shares | | | (2,238,763 | ) | | | (521,949 | ) |
| Total distributions to shareholders | | | (11,107,801 | ) | | | (3,419,384 | ) |
| | | | | | | | |
| | | | | | | | |
| From share transactions: | | | | | | |
Proceeds from sales of shares | | | 7,393,057 | | | | 13,916,746 | |
Reinvestment of distributions | | | 11,107,801 | | | | 3,419,383 | |
Cost of shares redeemed | | | (17,336,021 | ) | | | (27,985,318 | ) |
| Net increase (decrease) in net assets resulting from share transactions | | | 1,164,837 | | | | (10,649,189 | ) |
| TOTAL INCREASE | | | 463,274 | | | | 5,099,445 | |
| | | | | | | | |
| | | | | | | | |
| Net assets: | | | | | | |
| | |
Beginning of year | | | 97,857,437 | | | | 92,757,992 | |
End of year | | $ | 98,320,711 | | | $ | 97,857,437 | |
| Undistributed net investment income | | $ | 64,150 | | | $ | 75,109 | |
| | |
| The accompanying notes are an integral part of these financial statements. | | 15 |
GOLDMAN SACHS VARIABLE INSURANCE TRUST SMALL CAP EQUITY INSIGHTS FUND
Financial Highlights
Selected Data for a Share Outstanding Throughout Each Year
| | | | | | | | | | | | | | | | | | | | | | | | | | | | | | | | | | | | | | | | | | | | | | | | | | | | | | | | |
| | | | | | Income (loss) from
investment operations | | | Distributions to shareholders | | | | | | | | | | | | | | | | | | | | | | |
| Year - Share Class | | Net asset
value,
beginning
of year | | | Net
investment
income(a) | | | Net realized
and
unrealized
gain (loss) | | | Total from
investment
operations | | | From net
investment
income | | | From
net
realized
gains | | | Total
distributions | | | Net asset
value,
end of
year | | | Total
return(b) | | | Net assets,
end of
year
(in 000s) | | | Ratio of
net expenses
to average
net assets | | | Ratio of
total
expenses
to average
net assets | | | Ratio of
net investment
income
to average
net assets | | | Portfolio
turnover
rate(c) | |
FOR THE FISCAL YEARS ENDED DECEMBER 31, | |
2017 - Institutional | | $ | 13.79 | | | $ | 0.08 | | | $ | 1.53 | | | $ | 1.61 | | | $ | (0.08 | ) | | $ | (1.66 | ) | | $ | (1.74 | ) | | $ | 13.66 | | | | 11.57 | % | | $ | 77,815 | | | | 0.81 | % | | | 1.00 | % | | | 0.53 | % | | | 110 | % |
2017 - Service | | | 13.70 | | | | 0.04 | | | | 1.51 | | | | 1.55 | | | | (0.04 | ) | | | (1.66 | ) | | | (1.70 | ) | | | 13.55 | | | | 11.22 | | | | 20,505 | | | | 1.06 | | | | 1.25 | | | | 0.28 | | | | 110 | |
2016 - Institutional | | | 11.60 | | | | 0.11 | | | | 2.59 | | | | 2.70 | | | | (0.15 | ) | | | (0.36 | ) | | | (0.51 | ) | | | 13.79 | | | | 23.13 | | | | 77,421 | | | | 0.81 | | | | 1.04 | | | | 0.95 | | | | 119 | |
2016 - Service | | | 11.52 | | | | 0.08 | | | | 2.58 | | | | 2.66 | | | | (0.12 | ) | | | (0.36 | ) | | | (0.48 | ) | | | 13.70 | | | | 22.92 | | | | 20,437 | | | | 1.06 | | | | 1.29 | | | | 0.70 | | | | 119 | |
2015 - Institutional | | | 13.67 | | | | 0.08 | (d) | | | (0.37 | ) | | | (0.29 | ) | | | (0.04 | ) | | | (1.74 | ) | | | (1.78 | ) | | | 11.60 | | | | (2.13 | ) | | | 73,270 | | | | 0.81 | | | | 0.99 | | | | 0.59 | (d) | | | 124 | |
2015 - Service | | | 13.60 | | | | 0.05 | (d) | | | (0.39 | ) | | | (0.34 | ) | | | — | (e) | | | (1.74 | ) | | | (1.74 | ) | | | 11.52 | | | | (2.49 | ) | | | 19,488 | | | | 1.06 | | | | 1.24 | | | | 0.34 | (d) | | | 124 | |
2014 - Institutional | | | 15.07 | | | | 0.08 | | | | 0.90 | | | | 0.98 | | | | (0.12 | ) | | | (2.26 | ) | | | (2.38 | ) | | | 13.67 | | | | 6.93 | | | | 89,043 | | | | 0.83 | | | | 1.04 | | | | 0.53 | | | | 119 | |
2014 - Service | | | 15.00 | | | | 0.04 | | | | 0.90 | | | | 0.94 | | | | (0.08 | ) | | | (2.26 | ) | | | (2.34 | ) | | | 13.60 | | | | 6.69 | | | | 23,744 | | | | 1.08 | | | | 1.29 | | | | 0.28 | | | | 119 | |
2013 - Institutional | | | 12.71 | | | | 0.11 | | | | 4.37 | | | | 4.48 | | | | (0.16 | ) | | | (1.96 | ) | | | (2.12 | ) | | | 15.07 | | | | 35.62 | | | | 98,114 | | | | 0.82 | | | | 0.98 | | | | 0.77 | | | | 152 | |
2013 - Service | | | 12.65 | | | | 0.08 | | | | 4.34 | | | | 4.42 | | | | (0.11 | ) | | | (1.96 | ) | | | (2.07 | ) | | | 15.00 | | | | 35.38 | | | | 25,932 | | | | 1.07 | | | | 1.23 | | | | 0.52 | | | | 152 | |
| (a) | Calculated based on the average shares outstanding methodology. |
| (b) | Assumes investment at the net asset value at the beginning of the year, reinvestment of all distributions, and a complete redemption of the investment at the net asset value at the end of the year. |
| (c) | The Fund’s portfolio turnover rate is calculated in accordance with regulatory requirements, without regard to transactions involving short term investments and certain derivatives. If such transactions were included, the Fund’s portfolio turnover rate may be higher. |
| (d) | Reflects income recognized from special dividends which amounted to $0.02 per share and 0.15% of average net assets. |
| (e) | Amount is less than $0.005 per share. |
| | | | |
| The accompanying notes are an integral part of these financial statements. | | 16 | | |
GOLDMAN SACHS VARIABLE INSURANCE TRUST SMALL CAP EQUITY INSIGHTS FUND
Notes to Financial Statements
December 31, 2017
1. ORGANIZATION
Goldman Sachs Variable Insurance Trust (the “Trust” or “VIT”) is a Delaware statutory trust registered under the Investment Company Act of 1940, as amended (the “Act”), as an open-end management investment company. The Trust includes the Goldman Sachs Small Cap Equity Insights Fund (the “Fund”). The Fund is a diversified portfolio under the Act offering two classes of shares — Institutional and Service Shares. Shares of the Trust are offered to separate accounts of participating life insurance companies for the purpose of funding variable annuity contracts and variable life insurance policies.
Goldman Sachs Asset Management, L.P. (“GSAM”), an affiliate of Goldman Sachs & Co. LLC (formerly, Goldman, Sachs & Co.) (“Goldman Sachs”), serves as investment adviser to the Fund pursuant to a management agreement (the “Agreement”) with the Trust.
2. SIGNIFICANT ACCOUNTING POLICIES
The financial statements have been prepared in accordance with accounting principles generally accepted in the United States of America (“GAAP”) and require management to make estimates and assumptions that may affect the reported amounts and disclosures. Actual results may differ from those estimates and assumptions.
A. Investment Valuation — The Fund’s valuation policy is to value investments at fair value.
B. Investment Income and Investments — Investment income includes interest income, dividend income, and securities lending income. Interest income is accrued daily and adjusted for amortization of premiums and accretion of discounts. Dividend income is recognized on ex-dividend date or, for certain foreign securities, as soon as such information is obtained subsequent to the ex-dividend date. Investment transactions are reflected on trade date. Realized gains and losses are calculated using identified cost. Investment transactions are recorded on the following business day for daily net asset value (“NAV”) calculations. Investment income is recorded net of any foreign withholding taxes, less any amounts reclaimable. The Fund may file withholding tax reclaims in certain jurisdictions to recover a portion of amounts previously withheld. Any foreign capital gains tax is accrued daily based upon net unrealized gains, and is payable upon sale of such investments. Distributions received from the Fund’s investments in United States (“U.S.”) real estate investment trusts (“REITs”) may be characterized as ordinary income, net capital gain or a return of capital. A return of capital is recorded by the Fund as a reduction to the cost basis of the REIT.
For derivative contracts, realized gains and losses are recorded upon settlement of the contract.
C. Class Allocations and Expenses — Investment income, realized and unrealized gain (loss), if any, and non-class specific expenses of the Fund are allocated daily based upon the proportion of net assets of each class. Non-class specific expenses directly incurred by the Fund are charged to the Fund, while such expenses incurred by the Trust are allocated across the Fund on a straight-line and/or pro-rata basis depending upon the nature of the expenses. Class specific expenses, where applicable, are borne by the respective share classes and include Distribution and Service and Transfer Agency fees.
17
GOLDMAN SACHS VARIABLE INSURANCE TRUST SMALL CAP EQUITY INSIGHTS FUND
Notes to Financial Statements (continued)
December 31, 2017
2. SIGNIFICANT ACCOUNTING POLICIES (continued)
D. Federal Taxes and Distributions to Shareholders — It is the Fund’s policy to comply with the requirements of the Internal Revenue Code of 1986, as amended (the “Code”), applicable to regulated investment companies (mutual funds) and to distribute each year substantially all of its investment company taxable income and capital gains to its shareholders. Accordingly, the Fund is not required to make any provisions for the payment of federal income tax. Distributions to shareholders are recorded on the ex-dividend date. Income and capital gains distributions, if any, are declared and paid annually.
Net capital losses, if any, are carried forward to future fiscal years and may be used to the extent allowed by the Code to offset any future capital gains. Losses that are carried forward will retain their character as either short-term or long-term capital losses. Utilization of capital loss carryforwards will reduce the requirement of future capital gains distributions.
The characterization of distributions to shareholders for financial reporting purposes is determined in accordance with federal income tax rules, which may differ from GAAP. The source of the Fund’s distributions may be shown in the accompanying financial statements as either from net investment income, net realized gain or capital. Certain components of the Fund’s net assets on the Statement of Assets and Liabilities reflect permanent GAAP/tax differences based on the appropriate tax character.
3. INVESTMENTS AND FAIR VALUE MEASUREMENTS
U.S. GAAP defines the fair value of a financial instrument as the amount that would be received to sell an asset or paid to transfer a liability in an orderly transaction between market participants at the measurement date (i.e., the exit price); the Fund’s policy is to use the market approach. GAAP establishes a fair value hierarchy that prioritizes the inputs to valuation techniques used to measure fair value. The hierarchy gives the highest priority to unadjusted quoted prices in active markets for identical assets or liabilities (Level 1 measurements) and the lowest priority to unobservable inputs (Level 3 measurements). The levels used for classifying investments are not necessarily an indication of the risk associated with investing in these investments. The three levels of the fair value hierarchy are described below:
Level 1 — Unadjusted quoted prices in active markets that are accessible at the measurement date for identical, unrestricted assets or liabilities;
Level 2 — Quoted prices in markets that are not active or financial instruments for which significant inputs are observable (including, but not limited to, quoted prices for similar investments, interest rates, foreign exchange rates, volatility and credit spreads), either directly or indirectly;
Level 3 — Prices or valuations that require significant unobservable inputs (including GSAM’s assumptions in determining fair value measurement).
Changes in valuation techniques may result in transfers into or out of an assigned level within the hierarchy. In accordance with the Fund’s policy, transfers between different levels of the fair value hierarchy resulting from such changes are deemed to have occurred as of the beginning of the reporting period.
18
GOLDMAN SACHS VARIABLE INSURANCE TRUST SMALL CAP EQUITY INSIGHTS FUND
3. INVESTMENTS AND FAIR VALUE MEASUREMENTS (continued)
The Board of Trustees (“Trustees”) has approved Valuation Procedures that govern the valuation of the portfolio investments held by the Fund, including investments for which market quotations are not readily available. The Trustees have delegated to GSAM day-to-day responsibility for implementing and maintaining internal controls and procedures related to the valuation of the Fund’s investments. To assess the continuing appropriateness of pricing sources and methodologies, GSAM regularly performs price verification procedures and issues challenges as necessary to third party pricing vendors or brokers, and any differences are reviewed in accordance with the Valuation Procedures.
A. Level 1 and Level 2 Fair Value Investments — The valuation techniques and significant inputs used in determining the fair values for investments classified as Level 1 and Level 2 are as follows:
Equity Securities — Equity securities traded on a U.S. securities exchange or the NASDAQ system, or those located on certain foreign exchanges, including but not limited to the Americas, are valued daily at their last sale price or official closing price on the principal exchange or system on which they are traded. If there is no sale or official closing price or such price is believed by GSAM to not represent fair value, equity securities are valued at the last bid price for long positions and at the last ask price for short positions. To the extent these investments are actively traded, they are classified as Level 1 of the fair value hierarchy, otherwise they are generally classified as Level 2.
Unlisted equity securities for which market quotations are available are valued at the last sale price on the valuation date, or if no sale occurs, at the last bid price. Unlisted equities are generally classified as Level 2 (fair valued and single source broker securities may be treated differently).
Money Market Funds — Investments in the Goldman Sachs Financial Square Government Fund (“Underlying Fund”) are valued at the NAV of the Institutional Share class on the day of valuation. These investments are generally classified as Level 1 of the fair value hierarchy. For information regarding an Underlying Fund’s accounting policies and investment holdings, please see the Underlying Fund’s shareholder report.
Derivative Contracts — A derivative is an instrument whose value is derived from underlying assets, indices, reference rates or a combination of these factors. The Fund enters into derivative transactions to hedge against changes in interest rates, securities prices, and/or currency exchange rates, to increase total return, or to gain access to certain markets or attain exposure to other underliers.
Exchange-traded derivatives, including futures and options contracts, are valued at the last sale or settlement price and typically fall within Level 1 of the fair value hierarchy. Over-the-counter (“OTC”) and centrally cleared derivatives are valued using market transactions and other market evidence, including market-based inputs to models, calibration to market-clearing transactions, broker or dealer quotations, or other alternative pricing sources. Where models are used, the selection of a particular model to value OTC and centrally cleared derivatives depends upon the contractual terms of, and specific risks inherent in, the instrument, as well as the availability of pricing information in the market. Valuation models require a variety of inputs, including contractual terms, market prices, yield curves, credit curves, measures of volatility, voluntary and involuntary prepayment rates, loss severity rates and correlations of such inputs. For OTC and centrally cleared derivatives that trade in liquid markets, model inputs can generally be verified and model selection does not involve significant management judgment. OTC and centrally cleared derivatives are classified within Level 2 of the fair value hierarchy when significant inputs are corroborated by market evidence.
19
GOLDMAN SACHS VARIABLE INSURANCE TRUST SMALL CAP EQUITY INSIGHTS FUND
Notes to Financial Statements (continued)
December 31, 2017
3. INVESTMENTS AND FAIR VALUE MEASUREMENTS (continued)
i. Futures Contracts — Futures contracts are contracts to buy or sell a standardized quantity of a specified commodity or security and are valued based on exchanged settlement prices or independent market quotes. Futures contracts are valued at the last settlement price, or in the absence of a sale, the last bid price for long positions and at the last ask price for short positions, at the end of each day on the board of trade or exchange upon which they are traded. Upon entering into a futures contract, the Fund deposits cash or securities in an account on behalf of the broker in an amount sufficient to meet the initial margin requirement. Subsequent payments are made or received by the Fund equal to the daily change in the contract value and are recorded as variation margin receivable or payable with a corresponding offset to unrealized gains or losses. For financial reporting purposes, cash collateral that has been pledged to cover obligations of the Fund and cash collateral received, if any, is reported separately on the Statement of Assets and Liabilities as receivables/payables for collateral on certain derivative contracts. Non-cash collateral pledged by the Fund, if any, is noted in the Schedule of Investments.
B. Level 3 Fair Value Investments — To the extent that significant inputs to valuation models and other alternative pricing sources are unobservable, or if quotations are not readily available, or if GSAM believes that such quotations do not accurately reflect fair value, the fair value of the Fund’s investments may be determined under Valuation Procedures approved by the Trustees. GSAM, consistent with its procedures and applicable regulatory guidance, may make an adjustment to the most recent valuation prices of either domestic or foreign securities in light of significant events to reflect what it believes to be the fair value of the securities at the time of determining the Fund’s NAV. Significant events which could affect a large number of securities in a particular market may include, but are not limited to: significant fluctuations in U.S. or foreign markets; market dislocations; market disruptions; or unscheduled market closings. Significant events which could also affect a single issuer may include, but are not limited to: corporate actions such as reorganizations, mergers and buy-outs; ratings downgrades; and bankruptcies.
C. Fair Value Hierarchy — The following is a summary of the Fund’s investments and derivatives classified in the fair value hierarchy as of December 31, 2017:
| | | | | | | | | | | | |
| Investment Type | | Level 1 | | | Level 2 | | | Level 3 | |
| Assets | | | | | | | | | | | | |
| Common Stock and/or Other Equity Investments(a) | | | | | | | | | | | | |
Asia | | $ | 35,442 | | | $ | — | | | $ | — | |
North America | | | 96,516,820 | | | | — | | | | 4,683 | |
| Investment Company | | | 264,823 | | | | — | | | | — | |
| Securities Lending Reinvestment Vehicle | | | 1,053,265 | | | | — | | | | — | |
| Total | | $ | 97,870,350 | | | $ | — | | | $ | 4,683 | |
| | | |
| Derivative Type | | | | | | | | | |
| Assets(b) | | | | | | | | | | | | |
Futures Contracts | | $ | 4,406 | | | $ | — | | | $ | — | |
| (a) | Amounts are disclosed by continent to highlight the impact of time zone differences between local market close and the calculation of NAV. Security valuations are based on the principal exchange or system on which they are traded, which may differ from country of domicile noted in the table. |
| (b) | Amount shown represents unrealized gain (loss) at fiscal year end. |
For further information regarding security characteristics, see the Schedule of Investments.
20
GOLDMAN SACHS VARIABLE INSURANCE TRUST SMALL CAP EQUITY INSIGHTS FUND
4. INVESTMENTS IN DERIVATIVES
The following table sets forth, by certain risk types, the gross value of derivative contracts (not considered to be hedging instruments for accounting disclosure purposes) as of December 31, 2017. These instruments were used as part of the Fund’s investment strategies and to obtain and/or manage exposure related to the risks below. The values in the table below exclude the effects of cash collateral received or posted pursuant to these derivative contracts, and therefore are not representative of the Fund’s net exposure.
| | | | | | | | | | | | | | |
| Risk | | Statement of Assets and Liabilities | | Assets(a) | | | Statement of Assets and Liabilities | | | Liabilities | |
| Equity | | Variation margin on futures | | $ | 4,406 | | | | — | | | $ | — | |
| (a) | Includes unrealized gain (loss) on futures contracts described in the Additional Investment Information section of the Schedule of Investments. Only the variation margin as of December 31, 2017 is reported within the Statement of Assets and Liabilities. |
The following table sets forth, by certain risk types, the Fund’s gains (losses) related to these derivatives and their indicative volumes for the fiscal year ended December 31, 2017. These gains (losses) should be considered in the context that these derivative contracts may have been executed to create investment opportunities and/or economically hedge certain investments, and accordingly, certain gains (losses) on such derivative contracts may offset certain (losses) gains attributable to investments. These gains (losses) are included in “Net realized gain (loss)” or “Net change in unrealized gain (loss)” on the Statement of Operations:
| | | | | | | | | | | | | | |
| Risk | | Statement of Operations | | Net
Realized
Gain (Loss) | | | Net Change in
Unrealized
Gain (Loss) | | | Average
Number of
Contracts(a) | |
| Equity | | Net realized gain (loss) from futures contracts/Net change in unrealized gain (loss) on futures contracts | | $ | 162,635 | | | $ | 23,634 | | | | 22 | |
| (a) | Average number of contracts is based on the average of month end balances for the fiscal year ended December 31, 2017. |
5. AGREEMENTS AND AFFILIATED TRANSACTIONS
A. Management Agreement — Under the Agreement, GSAM manages the Fund, subject to the general supervision of the Trustees.
As compensation for the services rendered pursuant to the Agreement, the assumption of the expenses related thereto and administration of the Fund’s business affairs, including providing facilities, GSAM is entitled to a management fee, accrued daily and paid monthly, equal to an annual percentage rate of the Fund’s average daily net assets.
For the fiscal year ended December 31, 2017, contractual and effective net management fees with GSAM were at the following rates:
| | | | | | | | | | | | | | | | | | | | |
| Contractual Management Rate | | | | |
First
$2 billion | | Next
$3 billion | | | Next
$3 billion | | | Over
$8 billion | | | Effective
Rate | | | Effective Net
Management Rate^ | |
| 0.75% | | | 0.68 | % | | | 0.65 | % | | | 0.64 | % | | | 0.75 | % | | | 0.70 | %* |
| ^ | Effective Net Management Rate includes the impact of management fee waivers of affiliated Underlying Funds, if any. |
| * | GSAM agreed to waive a portion of its management fee in order to achieve a net management rate, as defined in the Fund’s most recent prospectus. This waiver will be effective through at least April 28, 2018, and prior to such date GSAM may not terminate the arrangement without approval of the Trustees. For the fiscal year ended December 31, 2017, GSAM waived $47,755, of its management fee. |
21
GOLDMAN SACHS VARIABLE INSURANCE TRUST SMALL CAP EQUITY INSIGHTS FUND
Notes to Financial Statements (continued)
December 31, 2017
5. AGREEMENTS AND AFFILIATED TRANSACTIONS (continued)
The Fund invests in Institutional Shares of the Goldman Sachs Financial Square Government Fund, which is an affiliated Underlying Fund. GSAM has agreed to waive a portion of its management fee payable by the Fund in an amount equal to the management fee it earns as an investment adviser to the affiliated Underlying Fund in which the Fund invests, except those management fees it earns from the Fund’s investments of cash collateral received in connection with securities lending transactions in the Goldman Sachs Financial Square Government Fund. For the fiscal year ended December 31, 2017, GSAM waived $1,293 of the Fund’s management fee.
B. Distribution and/or Service (12b-1) Plan — The Trust, on behalf of Service Shares of the Fund, has adopted a Distribution and Service Plan subject to Rule 12b-1 under the Act. Under the Distribution and Service Plan, Goldman Sachs, which serves as distributor, is entitled to a fee accrued daily and paid monthly, for distribution services and personal and account maintenance services, which may then be paid by Goldman Sachs to authorized dealers, equal to, on an annual basis, 0.25% of the Fund’s average daily net assets attributable to Service Shares.
C. Transfer Agency Agreement — Goldman Sachs also serves as the transfer agent of the Fund for a fee pursuant to the Transfer Agency Agreement. The fees charged for such transfer agency services are accrued daily and paid monthly at an annual rate of 0.02% of the average daily net assets of Institutional and Service Shares.
D. Other Expense Agreements and Affiliated Transactions — GSAM has agreed to limit certain “Other Expenses” of the Fund (excluding acquired fund fees and expenses, transfer agency fees and expenses, service fees and shareholder administration fees (as applicable), taxes, interest, brokerage fees, expenses of shareholder meetings, litigation and indemnification, and extraordinary expenses) to the extent such expenses exceed, on an annual basis, a percentage rate of the average daily net assets of the Fund. Such Other Expense reimbursements, if any, are accrued daily and paid monthly. In addition, the Fund is not obligated to reimburse GSAM for prior fiscal year expense reimbursements, if any. The Other Expense limitation as an annual percentage rate of average daily net assets for the Fund is 0.094%. The Other Expense limitation will remain in place through at least April 28, 2018, and prior to such date GSAM may not terminate the arrangement without the approval of the Trustees. For the fiscal year ended December 31, 2017, GSAM reimbursed $125,217 to the Fund. In addition, the Fund has entered into certain offset arrangements with the custodian and the transfer agent, which may result in a reduction of the Fund’s expenses and are received irrespective of the application of the “Other Expense” limitation described above. For the fiscal year ended December 31, 2017, custody fee credits were $1,287.
E. Line of Credit Facility — As of December 31, 2017, the Fund participated in a $1,100,000,000 committed, unsecured revolving line of credit facility (the “facility”) together with other funds of the Trust and certain registered investment companies having management agreements with GSAM or its affiliates. This facility is to be used for temporary emergency purposes, or to allow for an orderly liquidation of securities to meet redemption requests. The interest rate on borrowings is based on the federal funds rate. The facility also requires a fee to be paid by the Fund based on the amount of the commitment that has not been utilized. For the fiscal year ended December 31, 2017, the Fund did not have any borrowings under the facility.
22
GOLDMAN SACHS VARIABLE INSURANCE TRUST SMALL CAP EQUITY INSIGHTS FUND
5. AGREEMENTS AND AFFILIATED TRANSACTIONS (continued)
F. Other Transactions with Affiliates — The following table provides information about the Fund’s investment in the Goldman Sachs Financial Square Government Fund as of and for the fiscal year ended December 31, 2017:
| | | | | | | | | | | | | | | | | | | | | | |
Beginning
Value as of
December 31, 2016 | | | Purchases
at Cost | | | Proceeds
from Sales | | | Ending
Value as of
December 31, 2017 | | | Shares as of
December 31, 2017 | | | Dividend Income
from Affiliated
Investment Company | |
| | $1,221,911 | | | $ | 11,063,276 | | | $ | (12,020,364 | ) | | $ | 264,823 | | | | 264,823 | | | $ | 5,892 | |
6. PORTFOLIO SECURITIES TRANSACTIONS
The cost of purchases and proceeds from sales and maturities of long-term securities for the fiscal year ended December 31, 2017, were $103,544,456 and $111,966,944 respectively.
7. SECURITIES LENDING
Pursuant to exemptive relief granted by the Securities and Exchange Commission (“SEC”) and the terms and conditions contained therein, the Fund may lend its securities through a securities lending agent, Goldman Sachs Agency Lending (“GSAL”), a wholly-owned subsidiary of Goldman Sachs, to certain qualified borrowers including Goldman Sachs and affiliates. In accordance with the Fund’s securities lending procedures, the Fund receives cash collateral at least equal to the market value of the securities on loan. The market value of the loaned securities is determined at the close of business of the Fund, at their last sale price or official closing price on the principal exchange or system on which they are traded, and any additional required collateral is delivered to the Fund on the next business day. As with other extensions of credit, the Fund may experience delay in the recovery of its securities or incur a loss should the borrower of the securities breach its agreement with the Fund or become insolvent at a time when the collateral is insufficient to cover the cost of repurchasing securities on loan. Dividend income received from securities on loan may not be subject to withholding taxes and therefore withholding taxes paid may differ from the amounts listed in the Statement of Operations. Loans of securities are terminable at any time and as such 1) the remaining contractual maturities of the outstanding securities lending transactions are considered to be overnight and continuous and 2) the borrower, after notice, is required to return borrowed securities within the standard time period for settlement of securities transactions.
The Fund invests the cash collateral received in connection with securities lending transactions in the Goldman Sachs Financial Square Government Fund (“Government Money Market Fund”), an affiliated series of the Trust. The Government Money Market Fund is registered under the Act as an open end investment company, is subject to Rule 2a-7 under the Act, and is managed by GSAM, for which GSAM may receive a management fee of up to 0.205% on an annualized basis of the average daily net assets of the Government Money Market Fund.
In the event of a default by a borrower with respect to any loan, GSAL will exercise any and all remedies provided under the applicable borrower agreement to make the Fund whole. These remedies include purchasing replacement securities by applying the collateral held from the defaulting broker against the purchase cost of the replacement securities. If GSAL is unable to purchase replacement securities, GSAL will indemnify the Fund by paying the Fund an amount equal to the market value of the securities loaned minus the value of cash collateral received from the borrower for the loan, subject to an exclusion for any shortfalls resulting from a loss of value in such cash collateral due to reinvestment risk. The Fund’s loaned securities were all subject to enforceable Securities Lending Agreements and the value of the collateral was at least equal to the value of the cash received. The amounts of the Fund’s overnight and continuous agreements represent the gross amounts of recognized liabilities for securities lending transactions outstanding as of December 31, 2017 are disclosed as “Payable upon return of securities loaned” on the Statement of Assets and Liabilities, where applicable.
23
GOLDMAN SACHS VARIABLE INSURANCE TRUST SMALL CAP EQUITY INSIGHTS FUND
Notes to Financial Statements (continued)
December 31, 2017
7. SECURITIES LENDING (continued)
Both the Fund and GSAL received compensation relating to the lending of the Fund’s securities. The amounts earned, if any, by the Fund for the fiscal year ended December 31, 2017, are reported under Investment Income on the Statement of Operations.
The table below details securities lending activity with affiliates of Goldman Sachs:
| | | | | | | | |
For the Fiscal Year ended December 31, 2017 | |
Earnings of GSAL
Relating to
Securities
Loaned | | Amounts Received
by the Fund
from Lending to
Goldman Sachs | | | Amounts Payable to
Goldman Sachs
Upon Return of
Securities Loaned as of
December 31, 2017 | |
| $4,352 | | $ | 6,283 | | | $ | — | |
The following table provides information about the Fund’s investment in the Government Money Market Fund for the fiscal year ended December 31, 2017:
| | | | | | | | | | | | | | | | | | |
Beginning
Value as of
December 31, 2016 | | | Purchases
at Cost | | | Proceeds
from Sales | | | Ending
Value as of
December 31, 2017 | | | Shares as of
December 31, 2017 | |
| $ | 758,249 | | | $ | 13,476,162 | | | $ | (13,181,146 | ) | | $ | 1,053,265 | | | | — | |
8. TAX INFORMATION
The tax character of distributions paid during the fiscal years ended December 31, 2016 and December 31, 2017 was as follows:
| | | | | | | | |
| | | 2016 | | | 2017 | |
| Distributions paid from: | | | | | | | | |
Ordinary income | | $ | 1,002,797 | | | $ | 4,147,037 | |
Net long-term capital gains | | | 2,416,587 | | | | 6,960,764 | |
| Total taxable distributions | | $ | 3,419,384 | | | $ | 11,107,801 | |
As of December 31, 2017, the components of accumulated earnings (losses) on a tax-basis were as follows:
| | | | |
| Undistributed ordinary income — net | | $ | 620,938 | |
| Undistributed long-term capital gains | | | 1,037,290 | |
| Total undistributed earnings | | $ | 1,658,228 | |
| Timing differences (§ 857(b)(9) Deferred Dividend) | | $ | 16,568 | |
| Unrealized gains — net | | | 13,463,821 | |
| Total accumulated earnings | | $ | 15,138,617 | |
24
GOLDMAN SACHS VARIABLE INSURANCE TRUST SMALL CAP EQUITY INSIGHTS FUND
8. TAX INFORMATION (continued)
As of December 31, 2017, the Fund’s aggregate security unrealized gains and losses based on cost for U.S. federal income tax purposes were as follows:
| | | | |
| Tax cost | | $ | 84,415,618 | |
| Gross unrealized gain | | | 16,710,505 | |
| Gross unrealized loss | | | (3,246,684 | ) |
| Net unrealized gain | | $ | 13,463,821 | |
The difference between GAAP-basis and tax-basis unrealized gains (losses) is attributable primarily to wash sales, net mark to market gains (losses) on regulated futures contracts and differences in the tax treatment of underlying fund investments.
In order to present certain components of the Fund’s capital accounts on a tax-basis, the Fund has reclassified $981 from undistributed net investment income to accumulated net realized gain. This reclassification has no impact on the NAV of the Fund and results primarily from differences in the tax treatment of passive foreign investment company investments, real estate investment trust investments and underlying Fund investments.
GSAM has reviewed the Fund’s tax positions for all open tax years (the current and prior three years, as applicable) and has concluded that no provision for income tax is required in the Fund’s financial statements. Such open tax years remain subject to examination and adjustment by tax authorities.
9. OTHER RISKS
The Fund’s risks include, but are not limited to, the following:
Derivatives Risk — The Fund’s use of derivatives may result in loss. Derivative instruments, which may pose risks in addition to and greater than those associated with investing directly in securities, currencies or other instruments, may be illiquid or less liquid, volatile, difficult to price and leveraged so that small changes in the value of the underlying instruments may produce disproportionate losses to the Fund. Derivatives are also subject to counterparty risk, which is the risk that the other party in the transaction will not fulfill its contractual obligation. The use of derivatives is a highly specialized activity that involves investment techniques and risks different from those associated with investments in more traditional securities and instruments. Losses from derivatives can also result from a lack of correlation between changes in the value of derivative instruments and the portfolio assets (if any) being hedged.
Investments in Other Investment Companies Risk — As a shareholder of another investment company, including an exchange-traded fund (“ETF”), the Fund will indirectly bear its proportionate share of any net management fees and other expenses paid by such other investment companies, in addition to the fees and expenses regularly borne by the Fund. ETFs are subject to risks that do not apply to conventional mutual funds, including but not limited to the following: (i) the market price of the ETF’s shares may trade at a premium or a discount to their NAV; and (ii) an active trading market for an ETF’s shares may not develop or be maintained.
Large Shareholder Transactions Risk — The Fund may experience adverse effects when certain large shareholders, such as other funds, participating insurance companies, accounts and Goldman Sachs affiliates, purchase or redeem large amounts of shares of the Fund. Such large shareholder redemptions may cause the Fund to sell portfolio securities at times when it would not otherwise do so, which may negatively impact the Fund’s NAV and liquidity. These transactions may also accelerate the realization of taxable income to shareholders if such sales of investments resulted in gains, and may also increase transaction costs. In addition, a large redemption could result in the Fund’s current expenses being allocated over a smaller asset base, leading to an increase in the Fund’s expense ratio. Similarly, large Fund share purchases may adversely affect the Fund’s performance to the extent that the Fund is delayed in investing new cash and is required to maintain a larger cash position than it ordinarily would.
25
GOLDMAN SACHS VARIABLE INSURANCE TRUST SMALL CAP EQUITY INSIGHTS FUND
Notes to Financial Statements (continued)
December 31, 2017
9. OTHER RISKS (continued)
Liquidity Risk — The Fund may make investments that are illiquid or that may become less liquid in response to market developments or adverse investor perceptions. Illiquid investments may be more difficult to value. Liquidity risk may also refer to the risk that the Fund will not be able to pay redemption proceeds within the allowable time period because of unusual market conditions, an unusually high volume of redemption requests, or other reasons. To meet redemption requests, the Fund may be forced to sell investments at an unfavorable time and/or under unfavorable conditions.
Market and Credit Risks — In the normal course of business, the Fund trades financial instruments and enters into financial transactions where risk of potential loss exists due to changes in the market (market risk). Additionally, the Fund may also be exposed to credit risk in the event that an issuer or guarantor fails to perform or that an institution or entity with which the Fund has unsettled or open transactions defaults.
10. INDEMNIFICATIONS
Under the Trust’s organizational documents, its Trustees, officers, employees and agents are indemnified, to the extent permitted by the Act and state law, against certain liabilities that may arise out of performance of their duties to the Fund. Additionally, in the course of business, the Fund enters into contracts that contain a variety of indemnification clauses. The Fund’s maximum exposure under these arrangements is unknown, as this would involve future claims that may be made against the Fund that have not yet occurred. However, GSAM believes the risk of loss under these arrangements to be remote.
11. SUBSEQUENT EVENTS
Subsequent events after the Statement of Assets and Liabilities date have been evaluated, and GSAM has concluded that there is no impact requiring adjustment or disclosure in the financial statements.
12. SUMMARY OF SHARE TRANSACTIONS
Share activity is as follows:
| | | | | | | | | | | | | | | | |
| | | For the Fiscal Year Ended
December 31, 2017 | | | For the Fiscal Year Ended
December 31, 2016 | |
| | | Shares | | | Dollars | | | Shares | | | Dollars | |
| Institutional Shares | | | | | | | | | | | | | | | | |
| Shares sold | | | 449,078 | | | $ | 6,364,463 | | | | 1,055,485 | | | $ | 13,309,062 | |
| Reinvestment of distributions | | | 640,192 | | | | 8,809,035 | | | | 196,058 | | | | 2,727,164 | |
| Shares redeemed | | | (1,006,312 | ) | | | (14,236,742 | ) | | | (1,955,267 | ) | | | (24,207,664 | ) |
| | | | 82,958 | | | | 936,756 | | | | (703,724 | ) | | | (8,171,438 | ) |
| Service Shares | | | | | | | | | | | | | | | | |
| Shares sold | | | 73,489 | | | | 1,028,594 | | | | 52,803 | | | | 607,684 | |
| Reinvestment of distributions | | | 168,284 | | | | 2,298,766 | | | | 50,088 | | | | 692,219 | |
| Shares redeemed | | | (220,914 | ) | | | (3,099,279 | ) | | | (301,894 | ) | | | (3,777,654 | ) |
| | | | 20,859 | | | | 228,081 | | | | (199,003 | ) | | | (2,477,751 | ) |
| NET INCREASE (DECREASE) | | | 103,817 | | | $ | 1,164,837 | | | | (902,727 | ) | | $ | (10,649,189 | ) |
26
Report of Independent Registered Public Accounting Firm
To the Board of Trustees of
Goldman Sachs Variable Insurance Trust and Shareholders of the Goldman Sachs Small Cap Equity Insights Fund
Opinion on the Financial Statements
We have audited the accompanying statement of assets and liabilities, including the schedule of investments, of the Goldman Sachs Small Cap Equity Insights Fund (the “Fund”) as of December 31, 2017, the related statement of operations for the year ended December 31, 2017, the statements of changes in net assets for each of the two years in the period ended December 31, 2017, including the related notes, and the financial highlights for each of the five years in the period ended December 31, 2017 (collectively referred to as the “financial statements”). In our opinion, the financial statements present fairly, in all material respects, the financial position of the Fund as of December 31, 2017, the results of its operations for the year then ended, the changes in its net assets for each of the two years in the period ended December 31, 2017 and the financial highlights for each of the five years in the period ended December 31, 2017 in conformity with accounting principles generally accepted in the United States of America.
Basis for Opinion
These financial statements are the responsibility of the Fund’s management. Our responsibility is to express an opinion on the Fund’s financial statements based on our audits. We are a public accounting firm registered with the Public Company Accounting Oversight Board (United States) (“PCAOB”) and are required to be independent with respect to the Fund in accordance with the U.S. federal securities laws and the applicable rules and regulations of the Securities and Exchange Commission and the PCAOB.
We conducted our audits of these financial statements in accordance with the standards of the PCAOB. Those standards require that we plan and perform the audit to obtain reasonable assurance about whether the financial statements are free of material misstatement, whether due to error or fraud.
Our audits included performing procedures to assess the risks of material misstatement of the financial statements, whether due to error or fraud, and performing procedures that respond to those risks. Such procedures included examining, on a test basis, evidence regarding the amounts and disclosures in the financial statements. Our audits also included evaluating the accounting principles used and significant estimates made by management, as well as evaluating the overall presentation of the financial statements. Our procedures included confirmation of securities owned as of December 31, 2017 by correspondence with the custodian, transfer agent and brokers; when replies were not received from brokers, we performed other auditing procedures. We believe that our audits provide a reasonable basis for our opinion.
PricewaterhouseCoopers LLP
Boston, Massachusetts
February 14, 2018
We have served as the auditor of one or more investment companies in the Goldman Sachs Fund complex since 2000.
27
GOLDMAN SACHS VARIABLE INSURANCE TRUST SMALL CAP EQUITY INSIGHTS FUND
| | |
| Fund Expenses — Six Month Period Ended December 31, 2017 (Unaudited) | | |
As a shareholder of Institutional or Service Shares of the Fund, you incur ongoing costs, including management fees, distribution and/or service (12b-1) fees (with respect to Service Shares) and other Fund expenses. This example is intended to help you understand your ongoing costs (in dollars) of investing in the Institutional Shares and Service Shares of the Fund and to compare these costs with the ongoing costs of investing in other mutual funds.
The example is based on an investment of $1,000 invested at the beginning of the period and held for the entire period from July 1, 2017 through December 31, 2017, which represents a period of 184 days of a 365 day year.
Actual Expenses — The first line under each share class in the table below provides information about actual account values and actual expenses. You may use the information in this line, together with the amount you invested, to estimate the expenses that you paid over the period. Simply divide your account value by $1,000 (for example, an $8,600 account value divided by $1,000=8.6), then multiply the result by the number in the first line under the heading entitled “Expenses Paid” to estimate the expenses you paid on your account during this period.
Hypothetical Example for Comparison Purposes — The second line under each share class in the table below provides information about hypothetical account values and hypothetical expenses based on the Fund’s actual net expense ratio and an assumed rate of return of 5% per year before expenses, which is not the Fund’s actual return. The hypothetical account values and expenses may not be used to estimate the actual ending account balance or expenses you paid for the period. You may use this information to compare the ongoing costs of investing in the Fund and other funds. To do so, compare this 5% hypothetical example with the 5% hypothetical examples that appear in the shareholder reports of the other funds.
Please note that the expenses shown in the table are meant to highlight your ongoing costs only. As a shareholder of the Fund you do not incur any transaction costs, such as sales charges, redemption fees, or exchange fees, but shareholders of other funds may incur such costs. The second line of the table is useful in comparing ongoing costs only and will not help you determine the relative total costs of owning different funds whose shareholders may incur transaction costs.
| | | | | | | | | | | | |
| Share Class | | Beginning
Account Value
07/01/17 | | | Ending
Account Value
12/31/17 | | | Expenses Paid
for the
6 Months
Ended
12/31/17* | |
| Institutional | | | | | | | | | | | | |
| Actual | | $ | 1,000 | | | $ | 1,102.10 | | | $ | 4.50 | |
| Hypothetical 5% return | | | 1,000 | | | | 1,020.92 | + | | | 4.33 | |
| Service | | | | | | | | | | | | |
| Actual | | | 1,000 | | | | 1,100.20 | | | | 5.82 | |
| Hypothetical 5% return | | | 1,000 | | | | 1,019.66 | + | | | 5.60 | |
| | * | Expenses are calculated using the Fund’s annualized net expense ratio for each class, which represents the ongoing expenses as a percentage of net assets for the six months ended December 31, 2017. Expenses are calculated by multiplying the annualized net expense ratio by the average account value for the period; then multiplying the result by the number of days in the most recent fiscal half year; and then dividing that result by the number of days in the fiscal year. The annualized net expense ratios for the period were 0.85% and 1.10% for the Institutional and Service Shares, respectively. | |
| | + | Hypothetical expenses are based on the Fund’s actual annualized net expense ratios and an assumed rate of return of 5% per year before expenses. | |
28
GOLDMAN SACHS VARIABLE INSURANCE TRUST SMALL CAP EQUITY INSIGHTS FUND
Trustees and Officers (Unaudited)
Independent Trustees
| | | | | | | | | | |
| | | | | |
Name,
Address and Age1 | | Position(s) Held with the Trust | | Term of Office and
Length of
Time Served2 | | Principal Occupation(s) During Past 5 Years | | Number of
Portfolios in
Fund Complex
Overseen by
Trustee3 | | Other Directorships Held by Trustee4 |
Jessica Palmer Age: 68 | | Chair of the Board of Trustees | | 2018 (Trustee since 2007) | | Ms. Palmer is retired. She is Director, Emerson Center for the Arts and Culture (2011-Present); and was formerly a Consultant, Citigroup Human Resources Department (2007-2008); Managing Director, Citigroup Corporate and Investment Banking (previously, Salomon Smith Barney/Salomon Brothers) (1984-2006). Ms. Palmer was a Member of the Board of Trustees of Indian Mountain School (private elementary and secondary school) (2004-2009). Chair of the Board of Trustees — Goldman Sachs Trust and Goldman Sachs Variable Insurance Trust. | | 105 | | None |
Kathryn A. Cassidy Age: 63 | | Trustee | | Since 2015 | | Ms. Cassidy is retired. Formerly, she was Advisor to the Chairman (May 2014-December 2014); and Senior Vice President and Treasurer (2008-2014), General Electric Company & General Electric Capital Corporation (technology and financial services companies). Trustee — Goldman Sachs Trust and Goldman Sachs Variable Insurance Trust. | | 105 | | None |
Diana M. Daniels Age: 68 | | Trustee | | Since 2007 | | Ms. Daniels is retired. Formerly, she was Vice President, General Counsel and Secretary, The Washington Post Company (1991-2006). Ms. Daniels is a Trustee Emeritus and serves as a Presidential Councillor of Cornell University (2013-Present); former Member of the Legal Advisory Board, New York Stock Exchange (2003-2006) and of the Corporate Advisory Board, Standish Mellon Management Advisors (2006-2007). Trustee — Goldman Sachs Trust and Goldman Sachs Variable Insurance Trust. | | 105 | | None |
Herbert J. Markley Age: 67 | | Trustee | | Since 2013 | | Mr. Markley is retired. Formerly, he was Executive Vice President, Deere & Company (an agricultural and construction equipment manufacturer) (2007-2009); and President, Agricultural Division, Deere & Company (2001-2007). Previously, Mr. Markley served as an Advisory Board Member of Goldman Sachs Trust and Goldman Sachs Variable Insurance Trust (June 2013-October 2013). Trustee — Goldman Sachs Trust and Goldman Sachs Variable Insurance Trust. | | 105 | | None |
Roy W. Templin Age: 57 | | Trustee | | Since 2013 | | Mr. Templin is retired. He is Director, Armstrong World Industries, Inc. (a designer and manufacturer of ceiling, wall and suspension system solutions) (2016–Present); and was formerly Chairman of the Board of Directors, Con-Way Incorporated (a transportation, logistics and supply chain management service company) (2014-2015); Executive Vice President and Chief Financial Officer, Whirlpool Corporation (an appliance manufacturer and marketer) (2004-2012). Previously, Mr. Templin served as an Advisory Board Member of Goldman Sachs Trust and Goldman Sachs Variable Insurance Trust (June 2013-October 2013). Trustee — Goldman Sachs Trust and Goldman Sachs Variable Insurance Trust. | | 105 | | Armstrong World Industries, Inc. (a ceiling, wall and suspension systems solutions manufacturer) |
Gregory G. Weaver Age: 66 | | Trustee | | Since 2015 | | Mr. Weaver is retired. He is Director, Verizon Communications Inc. (2015-Present); and was formerly Chairman and Chief Executive Officer, Deloitte & Touche LLP (a professional services firm) (2001-2005 and 2012-2014); and Member of the Board of Directors, Deloitte & Touche LLP (2006-2012). Trustee — Goldman Sachs Trust and Goldman Sachs Variable Insurance Trust. | | 105 | | Verizon Communications Inc. |
| | | | | | | | | | |
29
GOLDMAN SACHS VARIABLE INSURANCE TRUST SMALL CAP EQUITY INSIGHTS FUND
Trustees and Officers (Unaudited) (continued)
Interested Trustee*
| | | | | | | | | | |
| | | | | |
Name,
Address and Age1 | | Position(s) Held with the Trust | | Term of Office and
Length of
Time Served2 | | Principal Occupation(s) During Past 5 Years | | Number of
Portfolios in
Fund Complex
Overseen by
Trustee3 | | Other Directorships Held by Trustee4 |
James A. McNamara Age: 55 | | President and Trustee | | Since 2007 | | Managing Director, Goldman Sachs (January 2000-Present); Director of Institutional Fund Sales, GSAM (April 1998-December 2000); and Senior Vice President and Manager, Dreyfus Institutional Service Corporation (January 1993- April 1998). President and Trustee — Goldman Sachs Trust; Goldman Sachs Variable Insurance Trust; Goldman Sachs Trust II; Goldman Sachs MLP Income Opportunities Fund; Goldman Sachs MLP and Energy Renaissance Fund; Goldman Sachs ETF Trust; Goldman Sachs Private Markets Fund 2018 LLC; Goldman Sachs Private Markets Fund 2018 (A) LLC; and Goldman Sachs Private Markets Fund 2018 (B) LLC. | | 146 | | None |
| | | | | | | | | | |
| * | Mr. McNamara is considered to be an “Interested Trustee” because he holds positions with Goldman Sachs and owns securities issued by The Goldman Sachs Group, Inc. Mr. McNamara holds comparable positions with certain other companies of which Goldman Sachs, GSAM or an affiliate thereof is the investment adviser, administrator and/or distributor. |
| 1 | Each Trustee may be contacted by writing to the Trustee, c/o Goldman Sachs, 200 West Street, New York, New York, 10282, Attn: Caroline Kraus. Information is provided as of December 31, 2017. |
| 2 | Subject to such policies as may be adopted by the Board from time-to-time, each Trustee holds office for an indefinite term, until the earliest of: (a) the election of his or her successor; (b) the date the Trustee resigns or is removed by the Board or shareholders, in accordance with the Trust’s Declaration of Trust; or (c) the termination of the Trust. The Board has adopted policies which provide that (a) no Trustee shall hold office for more than 15 years and (b) a Trustee shall retire as of December 31st of the calendar year in which he or she reaches his or her 74th birthday, unless a waiver of such requirement shall have been adopted by a majority of the other Trustees. These policies may be changed by the Trustees without shareholder vote. |
| 3 | The Goldman Sachs Fund Complex includes certain other companies listed above for each respective Trustee. As of December 31, 2017, Goldman Sachs Trust consisted of 91 portfolios (90 of which offered shares to the public); Goldman Sachs Variable Insurance Trust consisted of 14 portfolios; Goldman Sachs Trust II consisted of 17 portfolios (16 of which offered shares to the public); Goldman Sachs BDC, Inc., Goldman Sachs Private Middle Market Credit LLC, Goldman Sachs MLP Income Opportunities Fund, Goldman Sachs MLP and Energy Renaissance Fund, Goldman Sachs Private Markets Fund 2018 LLC, Goldman Sachs Private Markets Fund 2018 (A) LLC and Goldman Sachs Private Markets Fund 2018 (B) LLC each consisted of one portfolio; and Goldman Sachs ETF Trust consisted of 19 portfolios (12 of which offered shares to the public). Goldman Sachs Private Middle Market Credit LLC, Goldman Sachs Private Markets Fund 2018 LLC, Goldman Sachs Private Markets Fund 2018 (A) LLC and Goldman Sachs Private Markets Fund 2018 (B) LLC do not offer shares to the public. |
| 4 | This column includes only directorships of companies required to report to the Securities and Exchange Commission under the Securities Exchange Act of 1934 (i.e., “public companies”) or other investment companies registered under the Act. |
Additional information about the Trustees is available in the Fund’s Statement of Additional Information, which can be obtained from Goldman Sachs free of charge by calling this toll-free number (in the United States of America): 1-800-526-7384.
30
GOLDMAN SACHS VARIABLE INSURANCE TRUST SMALL CAP EQUITY INSIGHTS FUND
Trustees and Officers (Unaudited) (continued)
Officers of the Trust*
| | | | | | |
| | | |
| Name, Address and Age1 | | Position(s) Held with the Trust | | Term of
Office and
Length of
Time Served2 | | Principal Occupation(s) During Past 5 Years |
James A. McNamara 200 West Street New York, NY 10282 Age: 55 | | Trustee and President | | Since 2007 | | Managing Director, Goldman Sachs (January 2000-Present); Director of Institutional Fund Sales, GSAM (April 1998-December 2000); and Senior Vice President and Manager, Dreyfus Institutional Service Corporation (January 1993-April 1998). President and Trustee — Goldman Sachs Trust; Goldman Sachs Variable Insurance Trust; Goldman Sachs Trust II; Goldman Sachs MLP Income Opportunities Fund; Goldman Sachs MLP and Energy Renaissance Fund; Goldman Sachs ETF Trust; Goldman Sachs Private Markets Fund 2018 LLC; Goldman Sachs Private Markets Fund 2018 (A) LLC; and Goldman Sachs Private Markets Fund 2018 (B) LLC. |
Caroline L. Kraus 200 West Street New York, NY 10282 Age: 40 | | Secretary | | Since 2012 | | Managing Director, Goldman Sachs (January 2016-Present); Vice President, Goldman Sachs (August 2006-December 2015); Associate General Counsel, Goldman Sachs (2012-Present); Assistant General Counsel, Goldman Sachs (August 2006-December 2011); and Associate, Weil, Gotshal & Manges, LLP (2002-2006). Secretary — Goldman Sachs Trust (previously Assistant Secretary (2012)); Goldman Sachs Variable Insurance Trust (previously Assistant Secretary (2012)); Goldman Sachs Trust II; Goldman Sachs BDC, Inc.; Goldman Sachs Private Middle Market Credit LLC; Goldman Sachs Middle Market Lending Corp.; Goldman Sachs MLP Income Opportunities Fund; Goldman Sachs MLP and Energy Renaissance Fund; Goldman Sachs ETF Trust; Goldman Sachs Private Markets Fund 2018 LLC; Goldman Sachs Private Markets Fund 2018 (A) LLC; and Goldman Sachs Private Markets Fund 2018 (B) LLC. |
Scott M. McHugh 200 West Street New York, NY 10282 Age: 46 | | Treasurer, Senior Vice President and Principal Financial Officer | | Since 2009 (Principal Financial Officer since 2013) | | Managing Director, Goldman Sachs (January 2016-Present); Vice President, Goldman Sachs (February 2007-December 2015); Assistant Treasurer of certain mutual funds administered by DWS Scudder (2005-2007); and Director (2005-2007), Vice President (2000-2005), and Assistant Vice President (1998-2000), Deutsche Asset Management or its predecessor (1998-2007). Treasurer, Senior Vice President and Principal Financial Officer — Goldman Sachs Trust; Goldman Sachs Variable Insurance Trust; Goldman Sachs Trust II; Goldman Sachs MLP Income Opportunities Fund; Goldman Sachs MLP and Energy Renaissance Fund; Goldman Sachs ETF Trust; Goldman Sachs Private Markets Fund 2018 LLC; Goldman Sachs Private Markets Fund 2018 (A) LLC; and Goldman Sachs Private Markets Fund 2018 (B) LLC. |
Joseph F. DiMaria 30 Hudson Street Jersey City, NJ 07302 Age: 49 | | Assistant Treasurer and Principal Accounting Officer | | Since 2016 (Principal Accounting Officer since 2017) | | Managing Director, Goldman Sachs (November 2015-Present) and Vice President — Mutual Fund Administration, Columbia Management Investment Advisers, LLC (May 2010-October 2015). Assistant Treasurer and Principal Accounting Officer — Goldman Sachs Trust; Goldman Sachs Variable Insurance Trust; Goldman Sachs Trust II; Goldman Sachs MLP Income Opportunities Fund; Goldman Sachs MLP and Energy Renaissance Fund; Goldman Sachs ETF Trust; Goldman Sachs Private Markets Fund 2018 LLC; Goldman Sachs Private Markets Fund 2018 (A) LLC; and Goldman Sachs Private Markets Fund 2018 (B) LLC. |
| | | | | | |
| * | Represents a partial list of officers of the Trust. Additional information about all the officers is available in the Fund’s Statement of Additional Information, which can be obtained from Goldman Sachs free of charge by calling this toll-free number (in the United States): 1-800-526-7384. |
| 1 | Information is provided as of December 31, 2017. |
| 2 | Officers hold office at the pleasure of the Board of Trustees or until their successors are duly elected and qualified. Each officer holds comparable positions with certain other companies of which Goldman Sachs, GSAM or an affiliate thereof is the investment adviser, administrator and/or distributor. |
31
GOLDMAN SACHS VARIABLE INSURANCE TRUST SMALL CAP EQUITY INSIGHTS FUND
Goldman Sachs Variable Insurance Trust — Tax Information (Unaudited)
For the year ended December 31, 2017, 17.86% of the dividends paid from net investment company taxable income by the Small Cap Equity Insights Fund qualify for the dividends received deduction available to corporations.
Pursuant to Section 852 of the Internal Revenue Code, the Small Cap Equity Insights Fund designates $6,960,764 or, if different, the maximum amount allowable, as capital gain dividends paid during the fiscal year ended December 31, 2017.
32
| | |
| TRUSTEES | | OFFICERS |
Jessica Palmer, Chair Kathryn A. Cassidy Diana M. Daniels Herbert J. Markley James A. McNamara Roy W. Templin Gregory G. Weaver | | James A. McNamara, President Scott M. McHugh, Treasurer, Senior Vice President and Principal Financial Officer Joseph F. DiMaria, Assistant Treasurer and Principal Accounting Officer Caroline L. Kraus, Secretary |
GOLDMAN SACHS & CO. LLC
Distributor and Transfer Agent
GOLDMAN SACHS ASSET MANAGEMENT, L.P.
Investment Adviser
200 West Street, New York
New York 10282
Visit our web site at www.GSAMFUNDS.com to obtain the most recent month-end returns.
The reports concerning the Fund included in this shareholder report may contain certain forward-looking statements about the factors that may affect the performance of the Fund in the future. These statements are based on Fund management’s predictions and expectations concerning certain future events and their expected impact on the Fund, such as performance of the economy as a whole and of specific industry sectors, changes in the levels of interest rates, the impact of developing world events, and other factors that may influence the future performance of the Fund. Management believes these forward-looking statements to be reasonable, although they are inherently uncertain and difficult to predict. Actual events may cause adjustments in portfolio management strategies from those currently expected to be employed.
A description of the policies and procedures that the Fund uses to determine how to vote proxies relating to portfolio securities and information regarding how the Fund voted proxies relating to portfolio securities for the 12-month period ended December 31 is available (i) without charge, upon request by calling 1-800-621-2550; and (ii) on the Securities and Exchange Commission (“SEC”) web site at http://www.sec.gov.
The Fund files its complete schedule of portfolio holdings with the SEC for the first and third quarters of each fiscal year on Form N-Q. The Fund’s Form N-Qs are available on the SEC’s web site at http://www.sec.gov within 60 days after the Fund’s first and third fiscal quarters. The Fund’s Form N-Qs may be reviewed and copied at the SEC’s Public Reference Room in Washington, D.C. and information on the operation of the Public Reference Room may also be obtained by calling 1-800-SEC-0330. Form N-Qs may be obtained upon request and without charge by calling 1-800-621-2550.
Views and opinions expressed are for informational purposes only and do not constitute a recommendation by GSAM to buy, sell, or hold any security. Views and opinions are current as of the date of this presentation and may be subject to change, they should not be construed as investment advice.
Goldman Sachs & Co. LLC (“Goldman Sachs”) does not provide legal, tax or accounting advice. Any statement contained in this communication (including any attachments) concerning U.S. tax matters was not intended or written to be used, and cannot be used, for the purpose of avoiding penalties under the Internal Revenue Code, and was written to support the promotion or marketing of transaction or matter addressed. Clients of Goldman Sachs should obtain their own independent tax advice based on their particular circumstances.
The website links provided are for your convenience only and are not an endorsement or recommendation by GSAM of any of these websites or the products or services offered. GSAM is not responsible for the accuracy and validity of the content of these websites.
Fund holdings and allocations shown are as of December 31, 2017 and may not be representative of future investments. Fund holdings should not be relied on in making investment decisions and should not be construed as research or investment advice regarding particular securities. Current and future holdings are subject to risk.
References to indices, benchmarks or other measures of relative market performance over a specified period of time are provided for your information only and do not imply that the portfolio will achieve similar results. The index composition may not reflect the manner in which a portfolio is constructed. While an adviser seeks to design a portfolio which reflects appropriate risk and return features, portfolio characteristics may deviate from those of the benchmark.
The Global Industry Classification Standard (“GICS”) was developed by and is the exclusive property and a service mark of Morgan Stanley Capital International Inc. (“MSCI”) and Standard & Poor’s, a division of The McGraw-Hill Companies, Inc. (“S&P”) and is licensed for use by Goldman Sachs. Neither MSCI, S&P nor any other party involved in making or compiling the GICS or any GICS classifications makes any express or implied warranties or representations with respect to such standard or classification (or the results to be obtained by the use thereof), and all such parties hereby expressly disclaim all warranties of originality, accuracy, completeness, merchantability or fitness for a particular purpose with respect to any of such standard or classification. Without limiting any of the foregoing, in no event shall MSCI, S&P, any of their affiliates or any third party involved in making or compiling the GICS or any GICS classifications have any liability for any direct, indirect, special, punitive, consequential or any other damages (including lost profits) even if notified of the possibility of such damages.
The portfolio risk management process includes an effort to monitor and manage risk, but does not imply low risk.
Shares of the Goldman Sachs VIT Funds are offered to separate accounts of participating life insurance companies for the purpose of funding variable annuity contracts and variable life insurance policies. Shares of the Fund are not offered directly to the general public. The variable annuity contracts and variable life insurance policies are described in the separate prospectuses issued by participating insurance companies. You should refer to those prospectuses for information about surrender charges, mortality and expense risk fees and other charges that may be assessed by participating insurance companies under the variable annuity contracts or variable life insurance policies. Such fees or charges, if any, may affect the return you may realize with respect to your investments. Ask your representative for more complete information. Please consider a fund’s objectives, risks and charges and expenses, and read the prospectus carefully before investing. The prospectus contains this and other information about the Fund.
This material is not authorized for distribution to prospective investors unless preceded or accompanied by a current prospectus or summary prospectus, if applicable. Investors should consider the Fund’s objective, risks, and charges and expenses, and read the summary prospectus, if available, and/or the prospectus carefully before investing or sending money. The summary prospectus, if available, and the prospectus contain this and other information about the Fund and may be obtained from your authorized dealer or from Goldman Sachs & Co. LLC by calling 1-800-621-2550.
THIS MATERIAL IS FOR INFORMATIONAL PURPOSES ONLY AND IS PROVIDED SOLELY ON THE BASIS THAT IT WILL NOT CONSTITUTE INVESTMENT OR OTHER ADVICE OR A RECOMMENDATION RELATING TO ANY PERSON’S OR PLAN’S INVESTMENT OR OTHER DECISIONS, AND GOLDMAN SACHS IS NOT A FIDUCIARY OR ADVISOR WITH RESPECT TO ANY PERSON OR PLAN BY REASON OF PROVIDING THE MATERIAL OR CONTENT HEREIN INCLUDING UNDER THE EMPLOYEE RETIREMENT INCOME SECURITY ACT OF 1974 OR DEPARTMENT OF LABOR REGULATIONS. PLAN SPONSORS AND OTHER FIDUCIARIES SHOULD CONSIDER THEIR OWN CIRCUMSTANCES IN ASSESSING ANY POTENTIAL COURSE OF ACTION.
This report is prepared for the general information of contract owners and is not an offer of shares of the Goldman Sachs Variable Insurance Trust — Goldman Sachs Small Cap Equity Insights Fund.
© 2018 Goldman Sachs. All rights reserved.
VITSCAR-18/119287-OTU-698868/8.2k
Goldman
Sachs Variable Insurance Trust
Goldman Sachs
Strategic Growth Fund
Annual Report
December 31, 2017

GOLDMAN SACHS VARIABLE INSURANCE TRUST STRATEGIC GROWTH FUND
INVESTMENT OBJECTIVE
The Fund seeks long-term growth of capital.
Portfolio Management Discussion and Analysis
Below, the Goldman Sachs Growth Portfolio Management Team discusses the Goldman Sachs Variable Insurance Trust — Goldman Sachs Strategic Growth Fund’s (the “Fund”) performance and positioning for the 12-month period ended December 31, 2017 (the “Reporting Period”).
How did the Fund perform during the Reporting Period?
During the Reporting Period, the Fund’s Institutional and Service Shares generated average annual total returns of 30.66% and 30.36%, respectively. These returns compare to the 30.21% average annual total return of the Fund’s benchmark, the Russell 1000® Growth Index (with dividends reinvested) (the “Russell Index”), during the same time period.
What economic and market factors most influenced the equity markets as a whole during the Reporting Period?
Representing the U.S. equity market, the S&P 500® Index gained 21.83% during the Reporting Period. It was a banner year for U.S. equities, with the S&P 500® Index advancing for 12 consecutive months in 2017, a feat that had previously never been accomplished in a single calendar year. Overall, stocks were boosted by a combination of accelerating economic growth, rising corporate earnings and a general lack of negative financial headlines. U.S. equity market volatility was at historic lows.
U.S. equities rallied to new highs at the start of 2017 on prospects of deregulation, tax reform and infrastructure spending as well as on stronger economic data. In March 2017, the U.S. Federal Reserve (the “Fed”) raised interest rates for the third time since the 2008 global financial crisis, which was met with dovish market reaction. (Dovish tends to suggest lower interest rates; opposite of hawkish.) U.S. equities were virtually flat, albeit positive, in March 2017 and then continued to climb higher in April 2017 on strong earnings results and receding European political risk. Although the labor market remained strong, economic activity and inflation moderated during the second calendar quarter. In the third calendar quarter, U.S. economic activity and labor market data showed consistent strength, with a reversal of five consecutive downside inflation surprises. Progress on tax reform and strong economic activity data remained supportive for U.S. equities in October and November 2017. The Fed delivered the third rate hike of 2017 in December as had been widely expected, having done similarly in June 2017, and maintained its projections for three additional interest rate hikes in 2018. U.S. equities gained additional momentum toward the end of the Reporting Period from the passage of a tax reform bill that reduced the corporate tax rate from 35% to 21%. The fourth quarter of 2017 marked the ninth consecutive quarter of positive returns for the S&P 500® Index, its strongest quarterly advance in four years.
For the Reporting Period overall, information technology, materials and consumer discretionary were the best performing sectors in the S&P 500® Index, as measured by total return. The weakest performing sectors in the S&P 500® Index were telecommunication services and energy, the only two to post negative absolute returns, followed by real estate, which was comparatively weak but generated a positive return during the Reporting Period.
Within the U.S. equity market, there was significant disparity in performance not only among sectors but also among the various capitalization and style segments. While all capitalization segments posted positive returns, large-cap stocks, as measured by the Russell 1000® Index, performed best, followed by mid-cap stocks, as measured by the Russell Midcap® Index, and then at some distance by small-cap stocks, as measured by the Russell 2000® Index. From a style perspective, growth-oriented stocks significantly outpaced value-oriented stocks across the capitalization spectrum. (All as measured by the Russell indices.)
What key factors were responsible for the Fund’s performance during the Reporting Period?
The Fund outperformed the Russell Index during the Reporting Period attributable primarily to stock selection overall. Sector allocation as a whole detracted.
Which equity market sectors most significantly affected Fund performance?
Contributing most positively to the Fund’s relative results during the Reporting Period was effective stock selection in the information technology, industrials and consumer discretionary sectors. Partially offsetting these positive contributors was stock selection within financials and health care, which detracted from the Fund’s relative results during the Reporting Period. Having an overweighted allocation relative to the Russell Index in consumer staples, which significantly lagged the Russell Index during the
1
GOLDMAN SACHS VARIABLE INSURANCE TRUST STRATEGIC GROWTH FUND
Reporting Period, also hurt. Having an allocation to cash, albeit modest, during a Reporting Period when the Russell Index rallied, further dampened the Fund’s relative results.
What were some of the Fund’s best-performing individual stocks?
Among those stocks the Fund benefited most from relative to the Russell Index were positions in pharmaceuticals company Vertex Pharmaceuticals, international freight transportation company CSX and driver assistance systems designer and developer Mobileye.
Vertex Pharmaceuticals announced earnings in January 2017 that were better than market estimates on earnings per share and total revenue. Most of the stock’s movement, however, occurred in March 2017 when its price spiked on the company’s announcement about the successful clinical trial of one of its cystic fibrosis drugs. Its stock price spiked again in July 2017, as positive data from studies for a new cystic fibrosis drug were released. At the end of the Reporting Period, we thought Vertex Pharmaceuticals had strong underlying fundamentals and a promising product pipeline with significant short-term and long-term catalysts, at an attractive valuation. We further believed the company, led by what we viewed as a capable management team, would likely continue to see growth given its dominant market share and geographic expansionary efforts, which have thus far contributed to meaningful profitability.
Most of CSX’s strong performance came in the first half of 2017. After being added to the Fund’s portfolio during the fourth quarter of 2016, CSX saw its stock price spike in January 2017, as Canadian Pacific Chief Executive Officer (“CEO”) Hunter Harrison resigned and was reportedly seeking a senior management position at CSX. Later in the Reporting Period, this story proved true, as Harrison was hired as CSX’s CEO. When the news first broke, the market viewed the potential move positively given Harrison’s strong reputation. The company also reported first fiscal quarter results that beat market expectations on revenues and earnings per share. In December 2017, Hunter Harrison passed away just days after announcing a medical leave. Despite this unexpected development, we remained confident about the direction of the company. At the end of the Reporting Period, we believed CSX was well positioned to benefit from a possible inflationary environment given its cyclical business model and also from new tax reforms given its high tax rate through 2017. Overall, we were optimistic at the end of the Reporting Period about CSX’s growth outlook as well as about its operational improvement and strong free cash flow generation potential.
During the Reporting Period, Mobileye announced it had accepted a buyout offer from Intel. We had originally initiated the Fund’s position in Mobileye as we viewed the company as a leader in the autonomous driving and active safety space and one that enjoyed what we considered to be strong margins, a solid balance sheet and visible growth. We were encouraged by its acquisition news and exited the Fund’s position accordingly.
Which stocks detracted significantly from the Fund’s performance during the Reporting Period?
Detracting from the Fund’s results relative to the Russell Index were positions in oil well services company Schlumberger, beer producer Molson Coors Brewing and biopharmaceutical company Incyte.
Most of Schlumberger’s share price decline took place during the first half of the Reporting Period. During the first quarter of 2017, Schlumberger announced fourth quarter 2016 earnings that were ahead of consensus expectations. However, its shares were weak, as it expressed a slower than company expected recovery in international oilfield activity. Also, like many companies in the energy sector, Schlumberger’s stock price faced pressure amidst volatility in global oil prices. While we believed at the end of the Reporting Period that both activity and pricing trends may stabilize and improve over the long term and believed Schlumberger is a high quality company, we felt the risk/reward balance was less compelling than it had been and thus decided to exit the Fund’s position.
In February 2017, Molson Coors Brewing reported better than market expected earnings but softer scanner data through March 2017 continued to weigh on its shares. (Scanner data is retail purchase information (such as price, brand, product size, amount purchased) gathered at the point of purchase by an electronic device that reads a coded ticket on the product through the use of an electronic reader over which the product passes.) We saw the deceleration as mainly being driven by transitory factors, such as tough comparisons, weather and holiday timing. The company’s share price declined further in June 2017 following an investor meeting during which its management announced a downward revision to its margin guidance. While we believed there was potential for value creation from the company’s 2016 acquisition of the Miller joint venture, we felt the risk outweighed the reward and decided to exit the Fund’s position to allocate capital elsewhere. (On October 11, 2016, SABMiller sold its stake in MillerCoors for around $12 billion after the company was acquired by Anheuser-Busch InBev, making Molson Coors the 100% owner of MillerCoors. In effect, MillerCoors became the U.S. business unit of Molson Coors. In Canada, Molson Coors regained the right (from SABMiller) to make and market Miller Genuine Draft and Miller Lite.)
2
GOLDMAN SACHS VARIABLE INSURANCE TRUST STRATEGIC GROWTH FUND
After being a top contributor for much of 2017, Incyte’s stock experienced weakness in the latter part of the calendar year. Indeed, despite strong earnings announced at the end of October 2017, its stock experienced weakness as the near-term discussion on the company by many analysts was dominated by the upcoming data readout on the company’s melanoma drug, scheduled for the first quarter of 2018. Still, at the end of the Reporting Period, we continued to like the company and believed positive data points seen toward the end of 2017 positioned it well going into the data readout. In our view, Incyte has a strong internal research and development capability that has produced a deep pipeline as well as growing revenue potential that positions it well within its industry.
How did the Fund use derivatives and similar instruments during the Reporting Period?
During the Reporting Period, we did not use derivatives as part of an active management strategy.
Did the Fund make any significant purchases or sales during the Reporting Period?
Among the purchases initiated during the Reporting Period, we established a Fund position in Cisco Systems. Cisco Systems designs, manufactures and sells Internet protocol-based networking products and services related to the communications and information technology industries. In May 2017, its stock dropped sharply, as the company announced earnings that were better than market estimates on revenue and earnings per share but with guidance lower than market expectations. Following the share price decline, we believed Cisco Systems was attractively valued and took the opportunity to initiate a position in the Fund’s portfolio. We are positive on the company because of what we see as its proven and stable business model and strong balance sheet. Cisco Systems also has what we view as robust free cash flow, much of which it has used to return capital to shareholders through stock buybacks.
We initiated a Fund position in biopharmaceutical company Amgen. The company, which operates in the areas of oncology and bone, inflammatory and cardiovascular diseases, is one of the leaders in the biotechnology industry, and we are positive on its ability to continue to grow market share. We believe that with its new product cycles and existing growth franchises, the company should be able to offset any potential declines in its legacy business while continuing to grow both revenue and earnings. In our view, Amgen has robust free cash flow, a strong balance sheet and, at the time of purchase, was trading at an attractive valuation relative to its peers.
Conversely, in addition to those sales already mentioned, we sold the Fund’s position in Costco Wholesale. Though we continue to like Costco Wholesale’s ability to create shareholder value and feel it is a high quality company, we believe competition in the grocery sector has intensified and thus that the company’s risk/reward opportunity has become less compelling. We therefore decided to exit the position and allocate capital elsewhere.
We eliminated the Fund’s position in Walt Disney. While we continue to feel Walt Disney has a strong brand name with good fundamentals and a commitment to share buybacks, we are less positive on the company moving forward given increasing competition and cord-cutting headwinds. (Cord-cutting is the practice of canceling or forgoing a cable television subscription or landline telephone connection in favor of an alternative Internet-based or wireless service.) We therefore decided to exit the position and allocate the capital to other ideas with what we believed were more compelling risk/reward profiles.
Were there any notable changes in the Fund’s weightings during the Reporting Period?
In constructing the Fund’s portfolio, we focus on picking stocks rather than on making industry or sector bets. We seek to outpace the benchmark index by overweighting stocks that we expect to outperform and underweighting those that we think may lag. Consequently, changes in its sector weights are generally the direct result of individual stock selection or of stock appreciation or depreciation. That said, during the Reporting Period, the Fund’s exposure to health care and consumer staples increased compared to the Russell Index. The Fund’s allocations compared to the Russell Index in financials decreased. The Fund’s allocation to cash also decreased during the Reporting Period.
How was the Fund positioned relative to its benchmark index at the end of the Reporting Period?
At the end of December 2017, the Fund had overweighted positions relative to the Russell Index in the health care sector. On the same date, the Fund had underweighted positions compared to the Russell Index in materials and was rather neutrally weighted to the Russell Index in energy, consumer discretionary, industrials, consumer staples, financials, information technology and real estate. The Fund had no exposure to the utilities and telecommunication services sectors at the end of the Reporting Period.
What is the Fund’s tactical view and strategy for the months ahead?
At the end of the Reporting Period, we maintained a positive outlook for equities based on economic and earnings growth prospects. For the first year since 2010, consensus global economic growth and earnings per share growth forecasts were positive in
3
GOLDMAN SACHS VARIABLE INSURANCE TRUST STRATEGIC GROWTH FUND
all major global regions at the end of the Reporting Period. The U.S. economy continued to offer the strongest growth among developed countries, and there was significant investor and business optimism about the potentially pro-growth policies of the current Administration that could support further economic and earnings growth. However, such optimism may already be reflected in elevated equity valuations and U.S. equity indices reaching all-time highs. That said, we believe there remain pockets of opportunity beyond the benchmark indices.
We believe value-oriented sectors have the potential to perform well during spans of economic recovery like the one currently occurring. At the end of the Reporting Period, these value-oriented sectors were trading at a significant discount to growth sectors, having lagged during the Reporting Period. We also see substantial opportunities in smaller-cap companies in the U.S. In our view, these companies may be well positioned to benefit from domestically-oriented and pro-growth policies and could see a boost should there be any incremental progress on tax reform given their higher effective corporate tax rates compared to larger-cap companies. Additionally, operating margins at smaller companies in 2017 were far below prior peak levels and at a significant gap relative to those of larger cap companies. We believe this gap could narrow given the numerous catalysts that could disproportionately benefit smaller caps. Further, in our view, multiples, or price/earnings ratios, were more attractive than they might appear to some when taking into consideration the potential for an inflection in earnings growth.
We also believe the market has been overly pessimistic on retail real estate, whose performance significantly lagged other real estate investment trust (“REIT”) subsectors during the Reporting Period, as the market appears to have discounted retail REITs without regard for quality. Occupancy for shopping centers was at record highs in 2017. There were net openings during the calendar year, with the number of stores opened exceeding stores closed without building new facilities. Further, despite headlines, retail bankruptcies were at historically normal levels. We believe well-located assets with tenants playing toward “necessity based” or “experiential based” retail will likely remain resilient compared to poorly-located assets with “commodity” tenants offering products easily sold online, such as apparel.
Finally, at the end of the Reporting Period, we liked companies that invest in their future growth through capital expenditures and research and development, rather than those focusing on shareholder returns. While companies with high shareholder returns have historically performed better, those focused on investing for the future have performed better since 2016. We expect this trend to continue with solid economic growth.
Regardless of market direction, we remain committed to our core philosophy and process. We intend to maintain a long-term time horizon, rather than forecast the next quarter. We intend to continue to favor high quality growth businesses over breathtaking concepts. We intend to invest when we consider valuations to be attractive, rather than following the trend. These core beliefs have guided our team during the past 30 years; we believe they hold the answer for the next 30.
As always, we maintain our focus on seeking companies that we believe will generate long-term growth in today’s ever-changing market conditions.
4
GOLDMAN SACHS VARIABLE INSURANCE TRUST STRATEGIC GROWTH FUND
Index Definitions
The Russell 1000® Growth Index (with dividends reinvested) is an unmanaged market capitalization weighted index of the 1000 largest U.S. companies with higher price-to-book ratios and higher forecasted growth values. The figures for the index do not include any deduction for fees, expenses or taxes. It is not possible to invest directly in an index.
The Russell 2000® Index (with dividends reinvested) is an unmanaged index of common stock prices that measures the performance of the 2000 smallest companies in the Russell 3000® Index. The figures for the index do not include any deduction for fees, expenses or taxes. It is not possible to invest directly in an index.
The S&P 500® Index (with dividends reinvested) is the Standard & Poor’s composite index of 500 stocks, an unmanaged index of common stock prices. The figures for the index do not include any deduction for fees, expenses or taxes. It is not possible to invest directly in an index.
The Russell Midcap® Index measures the performance of the 800 smallest companies in the Russell 1000® Index, which represents approximately 25% of the total market capitalization of the Russell 1000 Index. It is not possible to invest directly in an index.
The Russell 1000® Index measures the performance of the 1,000 largest companies in the Russell 3000® Index, which represents approximately 92% of the total market capitalization of the Russell 3000® Index. It is not possible to invest directly in an index.
5
FUND BASICS
Strategic Growth Fund
as of December 31, 2017
STANDARDIZED TOTAL RETURNS1
| | | | | | | | | | | | | | | | | | |
| For the period ended 12/31/17 | | One Year | | | Five Years | | | Ten Years | | | Since Inception | | | Inception Date |
| Institutional | | | 30.66 | % | | | 15.69 | % | | | 8.71 | % | | | 6.24 | % | | 4/30/98 |
| Service | | | 30.36 | | | | 15.39 | | | | 8.44 | | | | 8.29 | | | 1/09/06 |
| 1 | The Standardized Total Returns are average annual total returns as of the most recent calendar quarter-end. They assume reinvestment of all distributions at net asset value (“NAV”). Because Institutional Shares and Service Shares do not involve a sales charge, such a charge is not applied to their Standardized Total Returns. |
Total return figures in the above chart represent past performance and do not indicate future results, which will vary. The investment return and principal value of an investment will fluctuate and, therefore, an investor’s shares, when redeemed, may be worth more or less than their original cost. Current performance may be lower or higher than the total return figures in the above chart. Please visit www.GSAMFUNDS.com to obtain the most recent month-end returns. Performance reflects fee waivers and/or expense limitations in effect during the periods shown. In their absence, performance would be reduced.
EXPENSE RATIOS2
| | | | | | | | |
| | | Net Expense Ratio (Current) | | | Gross Expense Ratio (Before Waivers) | |
| Institutional | | | 0.74 | % | | | 0.83 | % |
| Service | | | 0.99 | | | | 1.08 | |
| 2 | The expense ratios of the Fund, both current (net of any fee waivers and/or expense limitations) and before waivers (gross of any fee waivers and/or expense limitations) are as set forth above according to the most recent publicly available Prospectuses for the Fund and may differ from the expense ratios disclosed in the Financial Highlights in this report. Pursuant to a contractual arrangement, the Fund’s fee waivers and/or expense limitations will remain in place through at least April 28, 2018, and prior to such date, the Investment Adviser may not terminate the arrangements without the approval of the Fund’s Board of Trustees. If these arrangements are discontinued in the future, the expense ratios may change without shareholder approval. |
TOP TEN HOLDINGS AS OF 12/31/173
| | | | | | |
| Holding | | % of Net Assets | | | Line of Business |
| Apple, Inc. | | | 6.8% | | | Technology Hardware & Equipment |
| Microsoft Corp. | | | 5.2 | | | Software & Services |
| Facebook, Inc. Class A | | | 4.0 | | | Software & Services |
| Amazon.com, Inc. | | | 3.7 | | | Retailing |
| Alphabet, Inc. Class A | | | 3.2 | | | Software & Services |
| Mastercard, Inc. Class A | | | 2.7 | | | Software & Services |
| Alphabet, Inc. Class C | | | 2.4 | | | Software & Services |
| Comcast Corp. Class A | | | 2.3 | | | Media |
| McDonald’s Corp. | | | 2.0 | | | Consumer Services |
| Texas Instruments, Inc. | | | 2.0 | | | Semiconductors & Semiconductor Equipment |
| 3 | The top 10 holdings may not be representative of the Fund’s future investments. |
6
FUND BASICS
FUND vs. BENCHMARK SECTOR ALLOCATIONS4
As of December 31, 2017
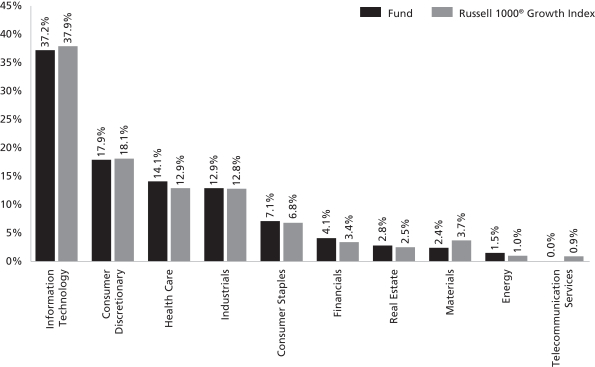
| 4 | The Fund is actively managed and, as such, its composition may differ over time. Consequently, the Fund’s overall sector allocations may differ from percentages contained in the graph above. The graph categorizes investments using Global Industry Classification Standard (“GICS”), however, the sector classifications used by the portfolio management team may differ from GICS. The percentage shown for each investment category reflects the value of investments in that category as a percentage of market value. Underlying sector allocations of exchange traded funds and investment companies held by the Fund are not reflected in the graph above. |
7
GOLDMAN SACHS VARIABLE INSURANCE TRUST STRATEGIC GROWTH FUND
Performance Summary
December 31, 2017
The following graph shows the value, as of December 31, 2017, of a $10,000 investment made on January 1, 2008 in Service Shares at NAV. For comparative purposes, the performance of the Fund’s benchmark, the Russell 1000® Growth Index (with distributions reinvested), is shown. This performance data represents past performance and should not be considered indicative of future performance, which will fluctuate with changes in market conditions. These performance fluctuations may cause an investor’s shares, when redeemed, to be worth more or less than their original cost. Performance reflects Fund level expenses but does not reflect fees and expenses associated with any variable annuity contract or variable life insurance policy that uses the Fund as an investment option for any contract or policy. Had performance reflected all of those fees and expenses, performance would have been reduced. Performance reflects applicable fee waivers and/or expense limitations in effect during the periods shown, and in their absence, performance would be reduced. Performance of Institutional Shares will vary from Service Shares due to differences in class specific fees. In addition to the Investment Adviser’s decisions regarding issuer/industry investment selection and allocation, other factors may affect Fund performance. These factors include, but are not limited to, Fund operating fees and expenses, portfolio turnover, and subscription and redemption cash flows affecting the Fund.
Strategic Growth Fund’s 10 Year Performance
Performance of a $10,000 investment, with distributions reinvested, from January 1, 2008 through December 31, 2017.
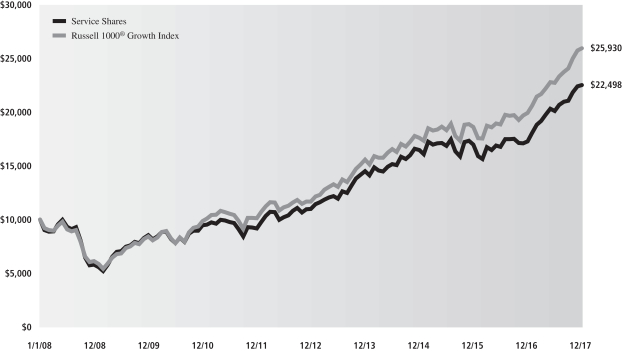
| | | | | | | | |
| Average Annual Total Return through December 31, 2017 | | One Year | | Five Years | | Ten Years | | Since Inception |
Institutional (Commenced April 30, 1998) | | 30.66% | | 15.69% | | 8.71% | | 6.24% |
Service (Commenced January 9, 2006) | | 30.36% | | 15.39% | | 8.44% | | 8.29% |
8
GOLDMAN SACHS VARIABLE INSURANCE TRUST STRATEGIC GROWTH FUND
Schedule of Investments
December 31, 2017
| | | | | | | | |
| Shares | | | Description | | Value | |
| | Common Stocks – 99.3% | |
| | Automobiles & Components – 1.1% | |
| | 50,787 | | | Aptiv plc | | $ | 4,308,261 | |
| | 35,556 | | | Delphi Technologies plc* | | | 1,865,623 | |
| | | | | | | | |
| | | | | | | 6,173,884 | |
| | |
| | Banks – 1.1% | | | | |
| | 94,963 | | | SunTrust Banks, Inc. | | | 6,133,660 | |
| | |
| | Capital Goods – 10.5% | | | | |
| | 20,994 | | | 3M Co. | | | 4,941,358 | |
| | 31,848 | | | Boeing Co. (The) | | | 9,392,294 | |
| | 53,691 | | | Fortive Corp. | | | 3,884,544 | |
| | 19,341 | | | General Dynamics Corp. | | | 3,934,926 | |
| | 65,527 | | | Honeywell International, Inc. | | | 10,049,221 | |
| | 43,328 | | | Middleby Corp. (The)* | | | 5,847,113 | |
| | 22,557 | | | Northrop Grumman Corp. | | | 6,922,969 | |
| | 25,148 | | | Roper Technologies, Inc. | | | 6,513,332 | |
| | 80,804 | | | Xylem, Inc. | | | 5,510,833 | |
| | | | | | | | |
| | | | | | | 56,996,590 | |
| | |
| | Consumer Durables & Apparel – 2.7% | | | | |
| | 162,500 | | | NIKE, Inc. Class B | | | 10,164,375 | |
| | 31,804 | | | PVH Corp. | | | 4,363,827 | |
| | | | | | | | |
| | | | | | | 14,528,202 | |
| | |
| | Consumer Services – 3.9% | | | | |
| | 79,285 | | | Dunkin’ Brands Group, Inc. | | | 5,111,504 | |
| | 71,379 | | | Las Vegas Sands Corp. | | | 4,960,127 | |
| | 63,339 | | | McDonald’s Corp. | | | 10,901,908 | |
| | | | | | | | |
| | | | | | | 20,973,539 | |
| | |
| | Diversified Financials – 3.0% | | | | |
| | 67,314 | | | Intercontinental Exchange, Inc. | | | 4,749,676 | |
| | 86,074 | | | Northern Trust Corp. | | | 8,597,932 | |
| | 16,617 | | | S&P Global, Inc. | | | 2,814,919 | |
| | | | | | | | |
| | | | | | | 16,162,527 | |
| | |
| | Energy – 1.5% | | | | |
| | 20,369 | | | Concho Resources, Inc.* | | | 3,059,831 | |
| | 41,318 | | | Diamondback Energy, Inc.* | | | 5,216,398 | |
| | | | | | | | |
| | | | | | | 8,276,229 | |
| | |
| | Food, Beverage & Tobacco – 4.8% | | | | |
| | 168,039 | | | Coca-Cola Co. (The) | | | 7,709,629 | |
| | 69,101 | | | Kraft Heinz Co. (The) | | | 5,373,294 | |
| | 121,763 | | | Monster Beverage Corp.* | | | 7,706,380 | |
| | 50,474 | | | Philip Morris International, Inc. | | | 5,332,578 | |
| | | | | | | | |
| | | | | | | 26,121,881 | |
| | |
| | Health Care Equipment & Services – 3.9% | | | | |
| | 21,217 | | | Aetna, Inc. | | | 3,827,335 | |
| | 215,565 | | | Boston Scientific Corp.* | | | 5,343,856 | |
| | 79,508 | | | Danaher Corp. | | | 7,379,933 | |
| | 41,005 | | | Edwards Lifesciences Corp.* | | | 4,621,673 | |
| | | | | | | | |
| | | | | | | 21,172,797 | |
| | |
| | Common Stocks – (continued) | |
| | Household & Personal Products – 2.2% | | | | |
| | 83,662 | | | Colgate-Palmolive Co. | | | 6,312,298 | |
| | 44,534 | | | Estee Lauder Cos., Inc. (The) Class A | | | 5,666,506 | |
| | | | | | | | |
| | | | | | | 11,978,804 | |
| | |
| | Materials – 2.3% | | | | |
| | 30,196 | | | Ecolab, Inc. | | | 4,051,700 | |
| | 15,455 | | | Sherwin-Williams Co. (The) | | | 6,337,168 | |
| | 88,486 | | | Valvoline, Inc. | | | 2,217,459 | |
| | | | | | | | |
| | | | | | | 12,606,327 | |
| | |
| | Media – 2.3% | | | | |
| | 312,225 | | | Comcast Corp. Class A | | | 12,504,611 | |
| | |
| | Pharmaceuticals, Biotechnology & Life Sciences – 10.1% | |
| | 52,708 | | | Agilent Technologies, Inc. | | | 3,529,855 | |
| | 35,422 | | | Amgen, Inc. | | | 6,159,886 | |
| | 119,262 | | | Eli Lilly & Co. | | | 10,072,869 | |
| | 28,141 | | | Illumina, Inc.* | | | 6,148,527 | |
| | 61,016 | | | Incyte Corp.* | | | 5,778,825 | |
| | 13,579 | | | Regeneron Pharmaceuticals, Inc.* | | | 5,105,161 | |
| | 37,298 | | | Shire plc ADR | | | 5,785,666 | |
| | 43,283 | | | Vertex Pharmaceuticals, Inc.* | | | 6,486,390 | |
| | 74,103 | | | Zoetis, Inc. | | | 5,338,380 | |
| | | | | | | | |
| | | | | | | 54,405,559 | |
| | |
| | Real Estate Investment Trusts – 2.8% | | | | |
| | 52,395 | | | American Tower Corp. | | | 7,475,195 | |
| | 17,197 | | | Equinix, Inc. | | | 7,794,024 | |
| | | | | | | | |
| | | | | | | 15,269,219 | |
| | |
| | Retailing – 7.7% | | | | |
| | 17,108 | | | Amazon.com, Inc.* | | | 20,007,293 | |
| | 21,753 | | | Home Depot, Inc. (The) | | | 4,122,846 | |
| | 26,212 | | | Netflix, Inc.* | | | 5,031,656 | |
| | 3,753 | | | Priceline Group, Inc. (The)* | | | 6,521,738 | |
| | 77,096 | | | Ross Stores, Inc. | | | 6,186,954 | |
| | | | | | | | |
| | | | | | | 41,870,487 | |
| | |
| | Semiconductors & Semiconductor Equipment – 3.8% | | | | |
| | 92,372 | | | Applied Materials, Inc. | | | 4,722,057 | |
| | 26,354 | | | NVIDIA Corp. | | | 5,099,499 | |
| | 103,003 | | | Texas Instruments, Inc. | | | 10,757,633 | |
| | | | | | | | |
| | | | | | | 20,579,189 | |
| | |
| | Software & Services – 24.4% | | | | |
| | 20,860 | | | Adobe Systems, Inc.* | | | 3,655,506 | |
| | 16,483 | | | Alphabet, Inc. Class A* | | | 17,363,192 | |
| | 12,641 | | | Alphabet, Inc. Class C* | | | 13,227,542 | |
| | 51,323 | | | Electronic Arts, Inc.* | | | 5,391,994 | |
| | 121,897 | | | Facebook, Inc. Class A* | | | 21,509,945 | |
| | 26,543 | | | Fiserv, Inc.* | | | 3,480,584 | |
| | 48,556 | | | Global Payments, Inc. | | | 4,867,254 | |
| | 39,620 | | | Intuit, Inc. | | | 6,251,244 | |
| | 95,722 | | | Mastercard, Inc. Class A | | | 14,488,482 | |
| | |
| | |
| The accompanying notes are an integral part of these financial statements. | | 9 |
GOLDMAN SACHS VARIABLE INSURANCE TRUST STRATEGIC GROWTH FUND
Schedule of Investments (continued)
December 31, 2017
| | | | | | | | |
| Shares | | | Description | | Value | |
| | Common Stocks – (continued) | |
| | Software & Services – (continued) | | | | |
| | 328,617 | | | Microsoft Corp. | | $ | 28,109,898 | |
| | 115,555 | | | Oracle Corp. | | | 5,463,440 | |
| | 78,392 | | | salesforce.com, Inc.* | | | 8,014,014 | |
| | | | | | | | |
| | | | | | | 131,823,095 | |
| | |
| | Technology Hardware & Equipment – 8.9% | | | | |
| | 47,794 | | | Amphenol Corp. Class A | | | 4,196,313 | |
| | 217,143 | | | Apple, Inc. | | | 36,747,110 | |
| | 181,662 | | | Cisco Systems, Inc. | | | 6,957,655 | |
| | | | | | | | |
| | | | | | | 47,901,078 | |
| | |
| | Transportation – 2.3% | | | | |
| | 123,997 | | | CSX Corp. | | | 6,821,075 | |
| | 22,190 | | | FedEx Corp. | | | 5,537,293 | |
| | | | | | | | |
| | | | | | | 12,358,368 | |
| | |
| | TOTAL COMMON STOCKS | |
| | (Cost $338,658,943) | | $ | 537,836,046 | |
| | |
| | | | | | | | |
| Shares | | | Distribution
Rate | | Value | |
| | Investment Company(a) – 0.0% | |
| Goldman Sachs Financial Square Government Fund —
Institutional Shares |
|
| | 722 | | | 1.228% | | $ | 722 | |
| | (Cost $722) | | | | |
| | |
| | TOTAL INVESTMENTS – 99.3% | |
| | (Cost $338,659,665) | | $ | 537,836,768 | |
| | |
| OTHER ASSETS IN EXCESS
OF LIABILITIES – 0.7% | | | 3,535,815 | |
| | |
| | NET ASSETS – 100.0% | | $ | 541,372,583 | |
| | |
| | |
| The percentage shown for each investment category reflects the value of investments in that category as a percentage of net assets. |
| * | | Non-income producing security. |
| (a) | | Represents an Affiliated Issuer. |
| | |
| Investment Abbreviation: |
| ADR | | —American Depositary Receipt |
| | |
| 10 | | The accompanying notes are an integral part of these financial statements. |
GOLDMAN SACHS VARIABLE INSURANCE TRUST STRATEGIC GROWTH FUND
Statement of Assets and Liabilities
December 31, 2017
| | | | |
| | | | |
Assets: | | | |
Investments in unaffiliated issuers, at value (cost $338,658,943) | | $ | 537,836,046 | |
Investments in affiliated issuers, at value (cost $722) | | | 722 | |
Cash | | | 4,005,209 | |
Receivables: | | | | |
Dividends | | | 201,623 | |
Reimbursement from investment adviser | | | 17,191 | |
Fund shares sold | | | 8,248 | |
Other assets | | | 189 | |
| Total assets | | | 542,069,228 | |
| | | | |
| | | | |
| Liabilities: | | | |
Payables: | | | | |
Management fees | | | 327,793 | |
Fund shares redeemed | | | 177,588 | |
Distribution and Service fees and Transfer Agency fees | | | 100,069 | |
Accrued expenses | | | 91,195 | |
| Total liabilities | | | 696,645 | |
| |
| | | | |
| Net Assets: | | | |
Paid-in capital | | | 333,493,589 | |
Undistributed net investment income | | | 210,851 | |
Accumulated net realized gain | | | 8,491,040 | |
Net unrealized gain | | | 199,177,103 | |
| NET ASSETS | | $ | 541,372,583 | |
Net Assets: | | | | |
Institutional | | $ | 115,693,298 | |
Service | | | 425,679,285 | |
Total Net Assets | | $ | 541,372,583 | |
Shares outstanding $0.001 par value (unlimited shares authorized): | | | | |
Institutional | | | 5,862,453 | |
Service | | | 21,625,499 | |
Net asset value, offering and redemption price per share: | | | | |
Institutional | | | $19.73 | |
Service | | | 19.68 | |
| | |
| The accompanying notes are an integral part of these financial statements. | | 11 |
GOLDMAN SACHS VARIABLE INSURANCE TRUST STRATEGIC GROWTH FUND
Statement of Operations
For the Fiscal Year Ended December 31, 2017
| | | | |
| | | | |
| Investment income: | |
Dividends — unaffiliated issuers | | $ | 6,357,169 | |
Securities lending income — unaffiliated issuer | | | 64,876 | |
Dividends — affiliated issuers | | | 4,649 | |
| Total investment income | | | 6,426,694 | |
| |
| | | | |
| Expenses: | | | |
Management fees | | | 3,890,329 | |
Distribution and Service fees — Service Shares | | | 1,023,474 | |
Transfer Agency fees(a) | | | 103,734 | |
Professional fees | | | 79,269 | |
Custody, accounting and administrative services | | | 64,089 | |
Printing and mailing costs | | | 60,804 | |
Trustee fees | | | 18,471 | |
Other | | | 25,040 | |
| Total expenses | | | 5,265,210 | |
Less — expense reductions | | | (320,574 | ) |
| Net expenses | | | 4,944,636 | |
| NET INVESTMENT INCOME | | | 1,482,058 | |
| |
| | | | |
| Realized and unrealized gain (loss): | | | |
Net realized gain from: | | | | |
Investments — unaffiliated issuers (including commissions recaptured of, $7,169 and) | | | 42,429,492 | |
Net change in unrealized gain on: | | | | |
Investments — unaffiliated issuers | | | 92,211,760 | |
| Net realized and unrealized gain | | | 134,641,252 | |
| NET INCREASE IN NET ASSETS RESULTING FROM OPERATIONS | | $ | 136,123,310 | |
(a) Institutional and Service Shares incurred Transfer Agency fees of $21,863 and $81,871, respectively.
| | |
| 12 | | The accompanying notes are an integral part of these financial statements. |
GOLDMAN SACHS VARIABLE INSURANCE TRUST STRATEGIC GROWTH FUND
Statements of Changes in Net Assets
| | | | | | | | |
| | | For the
Fiscal Year Ended
December 31, 2017 | | | For the
Fiscal Year Ended
December 31, 2016 | |
| | | | | | | | |
| From operations: | |
Net investment income | | $ | 1,482,058 | | | $ | 1,246,433 | |
Net realized gain (loss) | | | 42,429,492 | | | | (9,005,334 | ) |
Net change in unrealized gain | | | 92,211,760 | | | | 10,424,749 | |
| Net increase in net assets resulting from operations | | | 136,123,310 | | | | 2,665,848 | |
| |
| | | | | | | | |
| Distributions to shareholders: | | | | | | |
From net investment income | | | | | | | | |
Institutional Shares | | | (558,904 | ) | | | (612,091 | ) |
Service Shares | | | (1,043,857 | ) | | | (1,456,157 | ) |
From net realized gains | | | | | | | | |
Institutional Shares | | | (4,843,084 | ) | | | (9,912 | ) |
Service Shares | | | (17,928,563 | ) | | | (37,218 | ) |
| Total distributions to shareholders | | | (24,374,408 | ) | | | (2,115,378 | ) |
| | | | | | | | |
| | | | | | | | |
| From share transactions: | | | | | | |
Proceeds from sales of shares | | | 16,566,518 | | | | 159,844,337 | |
Reinvestment of distributions | | | 24,374,408 | | | | 2,115,378 | |
Cost of shares redeemed | | | (77,648,929 | ) | | | (166,944,892 | ) |
| Net decrease in net assets resulting from share transactions | | | (36,708,003 | ) | | | (4,985,177 | ) |
| TOTAL INCREASE (DECREASE) | | | 75,040,899 | | | | (4,434,707 | ) |
| | | | | | | | |
| | | | | | | | |
| Net assets: | |
| | |
Beginning of year | | | 466,331,684 | | | | 470,766,391 | |
End of year | | $ | 541,372,583 | | | $ | 466,331,684 | |
| Undistributed net investment income | | $ | 210,851 | | | $ | 338,876 | |
| | |
| The accompanying notes are an integral part of these financial statements. | | 13 |
GOLDMAN SACHS VARIABLE INSURANCE TRUST STRATEGIC GROWTH FUND
Financial Highlights
Selected Data for a Share Outstanding Throughout Each Year
| | | | | | | | | | | | | | | | | | | | | | | | | | | | | | | | | | | | | | | | | | | | | | | | | | | | | | | | |
| | | | | | Income (loss) from
investment operations | | | Distributions to shareholders | | | | | | | | | | | | | | | | | | | | | | |
| Year - Share Class | | Net asset
value,
beginning
of year | | | Net
investment
income(a) | | | Net
realized
and
unrealized
gain | | | Total from
investment
operations | | | From net
investment
income | | | From
net
realized
gains | | | Total
distributions | | | Net asset
value,
end of
year | | | Total
return(b) | | | Net assets,
end of
year
(in 000s) | | | Ratio of
net expenses
to average
net assets | | | Ratio of
total
expenses to average
net assets | | | Ratio of
net investment
income to average net assets | | | Portfolio
turnover
rate(c) | |
FOR THE FISCAL YEARS ENDED DECEMBER 31, | |
2017 - Institutional | | $ | 15.83 | | | $ | 0.09 | | | $ | 4.77 | | | $ | 4.86 | | | $ | (0.10 | ) | | $ | (0.86 | ) | | $ | (0.96 | ) | | $ | 19.73 | | | | 30.66 | % | | $ | 115,693 | | | | 0.76 | % | | | 0.82 | % | | | 0.48 | % | | | 37 | % |
2017 - Service | | | 15.79 | | | | 0.04 | | | | 4.76 | | | | 4.80 | | | | (0.05 | ) | | | (0.86 | ) | | | (0.91 | ) | | | 19.68 | | | | 30.36 | | | | 425,679 | | | | 1.01 | | | | 1.07 | | | | 0.23 | | | | 37 | |
2016 - Institutional | | | 15.62 | | | | 0.07 | | | | 0.24 | | | | 0.31 | | | | (0.10 | ) | | | — | (d) | | | (0.10 | ) | | | 15.83 | | | | 1.98 | | | | 98,090 | | | | 0.79 | | | | 0.84 | | | | 0.48 | | | | 72 | |
2016 - Service | | | 15.59 | | | | 0.03 | | | | 0.23 | | | | 0.26 | | | | (0.06 | ) | | | — | (d) | | | (0.06 | ) | | | 15.79 | | | | 1.69 | | | | 368,242 | | | | 1.04 | | | | 1.08 | | | | 0.22 | | | | 72 | |
2015 - Institutional | | | 16.16 | | | | 0.09 | (e) | | | 0.46 | | | | 0.55 | | | | (0.06 | ) | | | (1.03 | ) | | | (1.09 | ) | | | 15.62 | | | | 3.40 | | | | 109,801 | | | | 0.79 | | | | 0.83 | | | | 0.55 | (e) | | | 56 | |
2015 - Service | | | 16.13 | | | | 0.05 | (e) | | | 0.46 | | | | 0.51 | | | | (0.02 | ) | | | (1.03 | ) | | | (1.05 | ) | | | 15.59 | | | | 3.14 | | | | 360,966 | | | | 1.04 | | | | 1.08 | | | | 0.29 | (e) | | | 56 | |
2014 - Institutional | | | 17.64 | | | | 0.07 | | | | 2.24 | | | | 2.31 | | | | (0.07 | ) | | | (3.72 | ) | | | (3.79 | ) | | | 16.16 | | | | 13.64 | | | | 119,934 | | | | 0.79 | | | | 0.81 | | | | 0.37 | | | | 48 | |
2014 - Service | | | 17.61 | | | | 0.02 | | | | 2.24 | | | | 2.26 | | | | (0.02 | ) | | | (3.72 | ) | | | (3.74 | ) | | | 16.13 | | | | 13.38 | | | | 394,747 | | | | 1.04 | | | | 1.08 | | | | 0.12 | | | | 48 | |
2013 - Institutional | | | 13.86 | | | | 0.06 | | | | 4.42 | | | | 4.48 | | | | (0.07 | ) | | | (0.63 | ) | | | (0.70 | ) | | | 17.64 | | | | 32.42 | | | | 122,220 | | | | 0.80 | | | | 0.84 | | | | 0.35 | | | | 66 | |
2013 - Service | | | 13.85 | | | | 0.02 | | | | 4.40 | | | | 4.42 | | | | (0.03 | ) | | | (0.63 | ) | | | (0.66 | ) | | | 17.61 | | | | 32.00 | | | | 391,219 | | | | 1.05 | | | | 1.09 | | | | 0.10 | | | | 66 | |
| (a) | Calculated based on the average shares outstanding methodology. |
| (b) | Assumes investment at the net asset value at the beginning of the year, reinvestment of all distributions, and a complete redemption of the investment at the net asset value at the end of the year. |
| (c) | The Fund’s portfolio turnover rate is calculated in accordance with regulatory requirements, without regard to transactions involving short term investments. If such transactions were included, the Fund’s portfolio turnover rate may be higher. |
| (d) | Amount is less than $0.005 per share. |
| (e) | Reflects income recognized from special dividends which amounted to $0.03 per share and 0.20% of average net assets. |
| | | | |
| The accompanying notes are an integral part of these financial statements. | | 14 | | |
GOLDMAN SACHS VARIABLE INSURANCE TRUST STRATEGIC GROWTH FUND
Notes to Financial Statements
December 31, 2017
1. ORGANIZATION
Goldman Sachs Variable Insurance Trust (the “Trust” or “VIT”) is a Delaware statutory trust registered under the Investment Company Act of 1940, as amended (the “Act”), as an open-end management investment company. The Trust includes the Goldman Sachs Strategic Growth Fund (the “Fund”). The Fund is a diversified portfolio under the Act offering two classes of shares — Institutional and Service Shares. Shares of the Trust are offered to separate accounts of participating life insurance companies for the purpose of funding variable annuity contracts and variable life insurance policies.
Goldman Sachs Asset Management, L.P. (“GSAM”), an affiliate of Goldman Sachs & Co. LLC (formerly, Goldman, Sachs & Co.) (“Goldman Sachs”), serves as investment adviser to the Fund pursuant to a management agreement (the “Agreement”) with the Trust.
2. SIGNIFICANT ACCOUNTING POLICIES
The financial statements have been prepared in accordance with accounting principles generally accepted in the United States of America (“GAAP”) and require management to make estimates and assumptions that may affect the reported amounts and disclosures. Actual results may differ from those estimates and assumptions.
A. Investment Valuation — The Fund’s valuation policy is to value investments at fair value.
B. Investment Income and Investments — Investment income includes interest income, dividend income, and securities lending income. Interest income is accrued daily and adjusted for amortization of premiums and accretion of discounts. Dividend income is recognized on ex-dividend date or, for certain foreign securities, as soon as such information is obtained subsequent to the ex-dividend date. Investment transactions are reflected on trade date. Realized gains and losses are calculated using identified cost. Investment transactions are recorded on the following business day for daily net asset value (“NAV”) calculations. Distributions received from the Fund’s investments in United States (“U.S.”) real estate investment trusts (“REITs”) may be characterized as ordinary income, net capital gain or a return of capital. A return of capital is recorded by the Fund as a reduction to the cost basis of the REIT.
C. Class Allocations and Expenses — Investment income, realized and unrealized gain (loss), if any, and non-class specific expenses of the Fund are allocated daily based upon the proportion of net assets of each class. Non-class specific expenses directly incurred by the Fund are charged to the Fund, while such expenses incurred by the Trust are allocated across the Fund on a straight-line and/or pro-rata basis depending upon the nature of the expenses. Class specific expenses, where applicable, are borne by the respective share classes and include Distribution and Service and Transfer Agency fees.
D. Federal Taxes and Distributions to Shareholders — It is the Fund’s policy to comply with the requirements of the Internal Revenue Code of 1986, as amended (the “Code”), applicable to regulated investment companies (mutual funds) and to distribute each year substantially all of its investment company taxable income and capital gains to its shareholders. Accordingly, the Fund is not required to make any provisions for the payment of federal income tax. Distributions to shareholders are recorded on the ex-dividend date. Income and capital gains distributions, if any, are declared and paid annually.
Net capital losses, if any, are carried forward to future fiscal years and may be used to the extent allowed by the Code to offset any future capital gains. Losses that are carried forward will retain their character as either short-term or long-term capital losses. Utilization of capital loss carryforwards will reduce the requirement of future capital gains distributions.
15
GOLDMAN SACHS VARIABLE INSURANCE TRUST STRATEGIC GROWTH FUND
Notes to Financial Statements (continued)
December 31, 2017
2. SIGNIFICANT ACCOUNTING POLICIES (continued)
The characterization of distributions to shareholders for financial reporting purposes is determined in accordance with federal income tax rules, which may differ from GAAP. The source of the Fund’s distributions may be shown in the accompanying financial statements as either from net investment income, net realized gain or capital. Certain components of the Fund’s net assets on the Statement of Assets and Liabilities reflect permanent GAAP/tax differences based on the appropriate tax character.
E. Commission Recapture — GSAM, on behalf of certain Funds, may direct portfolio trades, subject to seeking best execution, to various brokers who have agreed to rebate a portion of the commissions generated. Such rebates are made directly to the Fund as cash payments and are included in net realized gain (loss) from investments on the Statement of Operations.
3. INVESTMENTS AND FAIR VALUE MEASUREMENTS
U.S. GAAP defines the fair value of a financial instrument as the amount that would be received to sell an asset or paid to transfer a liability in an orderly transaction between market participants at the measurement date (i.e., the exit price); the Fund’s policy is to use the market approach. GAAP establishes a fair value hierarchy that prioritizes the inputs to valuation techniques used to measure fair value. The hierarchy gives the highest priority to unadjusted quoted prices in active markets for identical assets or liabilities (Level 1 measurements) and the lowest priority to unobservable inputs (Level 3 measurements). The levels used for classifying investments are not necessarily an indication of the risk associated with investing in these investments. The three levels of the fair value hierarchy are described below:
Level 1 — Unadjusted quoted prices in active markets that are accessible at the measurement date for identical, unrestricted assets or liabilities;
Level 2 — Quoted prices in markets that are not active or financial instruments for which significant inputs are observable (including, but not limited to, quoted prices for similar investments, interest rates, foreign exchange rates, volatility and credit spreads), either directly or indirectly;
Level 3 — Prices or valuations that require significant unobservable inputs (including GSAM’s assumptions in determining fair value measurement).
Changes in valuation techniques may result in transfers into or out of an assigned level within the hierarchy. In accordance with the Fund’s policy, transfers between different levels of the fair value hierarchy resulting from such changes are deemed to have occurred as of the beginning of the reporting period.
The Board of Trustees (“Trustees”) has approved Valuation Procedures that govern the valuation of the portfolio investments held by the Fund, including investments for which market quotations are not readily available. The Trustees have delegated to GSAM day-to-day responsibility for implementing and maintaining internal controls and procedures related to the valuation of the Fund’s investments. To assess the continuing appropriateness of pricing sources and methodologies, GSAM regularly performs price verification procedures and issues challenges as necessary to third party pricing vendors or brokers, and any differences are reviewed in accordance with the Valuation Procedures.
A. Level 1 and Level 2 Fair Value Investments — The valuation techniques and significant inputs used in determining the fair values for investments classified as Level 1 and Level 2 are as follows:
Equity Securities — Equity securities traded on a U.S. securities exchange or the NASDAQ system, or those located on certain foreign exchanges, including but not limited to the Americas, are valued daily at their last sale price or official closing price on the principal exchange or system on which they are traded. If there is no sale or official closing price or such price is believed by GSAM to not represent fair value, equity securities are valued at the last bid price for long positions and at the last ask price for short positions. To the extent these investments are actively traded, they are classified as Level 1 of the fair value hierarchy, otherwise they are generally classified as Level 2.
16
GOLDMAN SACHS VARIABLE INSURANCE TRUST STRATEGIC GROWTH FUND
3. INVESTMENTS AND FAIR VALUE MEASUREMENTS (continued)
Unlisted equity securities for which market quotations are available are valued at the last sale price on the valuation date, or if no sale occurs, at the last bid price. Unlisted equities are generally classified as Level 2 (fair valued and single source broker securities may be treated differently).
Money Market Funds — Investments in the Goldman Sachs Financial Square Government Fund (“Underlying Fund”) are valued at the NAV of the Institutional Share class on the day of valuation. These investments are generally classified as Level 1 of the fair value hierarchy. For information regarding an Underlying Fund’s accounting policies and investment holdings, please see the Underlying Fund’s shareholder report.
B. Level 3 Fair Value Investments — To the extent that significant inputs to valuation models and other alternative pricing sources are unobservable, or if quotations are not readily available, or if GSAM believes that such quotations do not accurately reflect fair value, the fair value of the Fund’s investments may be determined under Valuation Procedures approved by the Trustees. GSAM, consistent with its procedures and applicable regulatory guidance, may make an adjustment to the most recent valuation prices of either domestic or foreign securities in light of significant events to reflect what it believes to be the fair value of the securities at the time of determining the Fund’s NAV. Significant events which could affect a large number of securities in a particular market may include, but are not limited to: significant fluctuations in U.S. or foreign markets; market dislocations; market disruptions; or unscheduled market closings. Significant events which could also affect a single issuer may include, but are not limited to: corporate actions such as reorganizations, mergers and buy-outs; ratings downgrades; and bankruptcies.
C. Fair Value Hierarchy — The following is a summary of the Fund’s investments classified in the fair value hierarchy as of December 31, 2017:
| | | | | | | | | | | | |
| Investment Type | | Level 1 | | | Level 2 | | | Level 3 | |
| Assets | | | | | | | | | | | | |
| Common Stock and/or Other Equity Investments(a) | | | | | | | | | | | | |
North America | | $ | 537,836,046 | | | $ | — | | | $ | — | |
| Investment Company | | | 722 | | | | — | | | | — | |
| Total | | $ | 537,836,768 | | | $ | — | | | $ | — | |
| (a) | Amounts are disclosed by continent to highlight the impact of time zone differences between local market close and the calculation of NAV. Security valuations are based on the principal exchange or system on which they are traded, which may differ from country of domicile noted in the table. |
For further information regarding security characteristics, see the Schedule of Investments.
4. AGREEMENTS AND AFFILIATED TRANSACTIONS
A. Management Agreement — Under the Agreement, GSAM manages the Fund, subject to the general supervision of the Trustees.
As compensation for the services rendered pursuant to the Agreement, the assumption of the expenses related thereto and administration of the Fund’s business affairs, including providing facilities, GSAM is entitled to a management fee, accrued daily and paid monthly, equal to an annual percentage rate of the Fund’s average daily net assets.
17
GOLDMAN SACHS VARIABLE INSURANCE TRUST STRATEGIC GROWTH FUND
Notes to Financial Statements (continued)
December 31, 2017
4. AGREEMENTS AND AFFILIATED TRANSACTIONS (continued)
For the fiscal year ended December 31, 2017, contractual and effective net management fees with GSAM were at the following rates:
| | | | | | | | | | | | | | | | | | | | | | | | | | |
| Contractual Management Rate | | | | |
First
$1 billion | | | Next
$1 billion | | | Next
$3 billion | | | Next
$3 billion | | | Over
$8 billion | | | Effective
Rate | | | Effective Net
Management Rate^ | |
| | 0.75% | | | | 0.68 | % | | | 0.65 | % | | | 0.64 | % | | | 0.63 | % | | | 0.75 | % | | | 0.71 | %* |
| ^ | Effective Net Management Rate includes the impact of management fee waivers of affiliated Underlying Funds, if any. |
| * | GSAM agreed to waive a portion of its management fee in order to achieve a net management rate, as defined in the Fund’s most recent prospectus. This waiver will be effective through at least April 28, 2018, and prior to such date GSAM may not terminate the arrangement without approval of the Trustees. For the fiscal year ended December 31, 2017, GSAM waived $207,486 of its management fee. |
The Fund invests in Institutional Shares of the Goldman Sachs Financial Square Government Fund, which is an affiliated Underlying Fund. GSAM has agreed to waive a portion of its management fee payable by the Fund in an amount equal to the management fee it earns as an investment adviser to the affiliated Underlying Fund in which the Fund invests, except those management fees it earns from the Fund’s investments of cash collateral received in connection with securities lending transactions in the Goldman Sachs Financial Square Government Fund. For the fiscal year ended December 31, 2017, GSAM waived $1,109 of the Fund’s management fee.
B. Distribution and/or Service (12b-1) Plan — The Trust, on behalf of Service Shares of the Fund, has adopted a Distribution and Service Plan subject to Rule 12b-1 under the Act. Under the Distribution and Service Plan, Goldman Sachs, which serves as distributor, is entitled to a fee accrued daily and paid monthly, for distribution services and personal and account maintenance services, which may then be paid by Goldman Sachs to authorized dealers, equal to, on an annual basis, 0.25% of the Fund’s average daily net assets attributable to Service Shares.
C. Transfer Agency Agreement — Goldman Sachs also serves as the transfer agent of the Fund for a fee pursuant to the Transfer Agency Agreement. The fees charged for such transfer agency services are accrued daily and paid monthly at an annual rate of 0.02% of the average daily net assets of Institutional and Service Shares.
D. Other Expense Agreements and Affiliated Transactions — GSAM has agreed to limit certain “Other Expenses” of the Fund (excluding acquired fund fees and expenses, transfer agency fees and expenses, service fees and shareholder administration fees (as applicable), taxes, interest, brokerage fees, expenses of shareholder meetings, litigation and indemnification, and extraordinary expenses) to the extent such expenses exceed, on an annual basis, a percentage rate of the average daily net assets of the Fund. Such Other Expense reimbursements, if any, are accrued daily and paid monthly. In addition, the Fund is not obligated to reimburse GSAM for prior fiscal year expense reimbursements, if any. The Other Expense limitation as an annual percentage rate of average daily net assets for the Fund is 0.014%. Prior to April 28, 2017, the Other Expense limitation was 0.114% for the Fund. The Other Expense limitation will remain in place through at least April 28, 2018, and prior to such date GSAM may not terminate the arrangement without the approval of the Trustees. For the fiscal year ended December 31, 2017, GSAM reimbursed $107,501 to the Fund. In addition, the Fund has entered into certain offset arrangements with the custodian and the transfer agent, which may result in a reduction of the Fund’s expenses and are received irrespective of the application of the “Other Expense” limitation described above. For the fiscal year ended December 31, 2017, custody fee credits were $4,478.
E. Line of Credit Facility — As of December 31, 2017, the Fund participated in a $1,100,000,000 committed, unsecured revolving line of credit facility (the “facility”) together with other funds of the Trust and certain registered investment companies having management agreements with GSAM or its affiliates. This facility is to be used for temporary emergency purposes, or to allow for an orderly liquidation of securities to meet redemption requests. The interest rate on borrowings is based on the federal funds rate. The facility also requires a fee to be paid by the Fund based on the amount of the commitment that has not been utilized. For the fiscal year ended December 31, 2017, the Fund did not have any borrowings under the facility.
18
GOLDMAN SACHS VARIABLE INSURANCE TRUST STRATEGIC GROWTH FUND
4. AGREEMENTS AND AFFILIATED TRANSACTIONS (continued)
F. Other Transactions with Affiliates —The following table provides information about the Fund’s investment in the Goldman Sachs Financial Square Government Fund as of and for the fiscal year ended December 31, 2017:
| | | | | | | | | | | | | | | | | | | | | | |
Beginning
Value as of
December 31, 2016 | | | Purchases
at Cost | | | Proceeds
from Sales | | | Ending
Value as of
December 31, 2017 | | | Shares as of
December 31, 2017 | | | Dividend Income
from Affiliated
Investment Company | |
| | $3,017,318 | | | $ | 25,052,052 | | | $ | (28,068,648 | ) | | $ | 722 | | | | 722 | | | $ | 4,649 | |
5. PORTFOLIO SECURITIES TRANSACTIONS
The cost of purchases and proceeds from sales and maturities of long-term securities for the fiscal year ended December 31, 2017, were $191,294,516 and $244,752,823, respectively.
6. SECURITIES LENDING
The Fund may lend its securities through a securities lending agent, the Bank of New York Mellon (“BNYM”), to certain qualified borrowers. In accordance with the Fund’s securities lending procedures, the Fund receives cash collateral at least equal to the market value of the securities on loan. The market value of the loaned securities is determined at the close of business of the Fund, at their last sale price or official closing price on the principal exchange or system on which they are traded, and any additional required collateral is delivered to the Fund on the next business day. As with other extensions of credit, the Fund may experience delay in the recovery of its securities or incur a loss should the borrower of the securities breach its agreement with the Fund or become insolvent at a time when the collateral is insufficient to cover the cost of repurchasing securities on loan. Dividend income received from securities on loan may not be subject to withholding taxes and therefore withholding taxes paid may differ from the amounts listed in the Statement of Operations. Loans of securities are terminable at any time and as such 1) the remaining contractual maturities of the outstanding securities lending transactions are considered to be overnight and continuous and 2) the borrower, after notice, is required to return borrowed securities within the standard time period for settlement of securities transactions.
The Fund invests the cash collateral received in connection with securities lending transactions in the Goldman Sachs Financial Square Government Fund (“Government Money Market Fund”), an affiliated series of the Trust. The Government Money Market Fund is registered under the Act as an open end investment company, is subject to Rule 2a-7 under the Act, and is managed by GSAM, for which GSAM may receive a management fee of up to 0.205% on an annualized basis of the average daily net assets of the Government Money Market Fund.
In the event of a default by a borrower with respect to any loan, BNYM may exercise any and all remedies provided under the applicable borrower agreement to make the Fund whole. These remedies include purchasing replacement securities by applying the collateral held from the defaulting broker against the purchase cost of the replacement securities. If BNYM is unable to purchase replacement securities, BNYM will indemnify the Fund by paying the Fund an amount equal to the market value of the securities loaned minus the value of cash collateral received from the borrower for the loan, subject to an exclusion for any shortfalls resulting from a loss of value in such cash collateral due to reinvestment risk. The Fund’s loaned securities were all subject to enforceable Securities Lending Agreements and the value of the collateral was at least equal to the value of the cash received. The amounts of the Fund’s overnight and continuous agreements represent the gross amounts of recognized liabilities for securities lending transactions outstanding as of December 31, 2017 are disclosed as “Payable upon return of securities loaned” on the Statement of Assets and Liabilities, where applicable. The Fund did not have securities on loan as of December 31, 2017.
19
GOLDMAN SACHS VARIABLE INSURANCE TRUST STRATEGIC GROWTH FUND
Notes to Financial Statements (continued)
December 31, 2017
6. SECURITIES LENDING (continued)
Both the Fund and BNYM received compensation relating to the lending of the Fund’s securities. The amounts earned, if any, by the Fund for the fiscal year ended December 31, 2017, are reported under Investment Income on the Statement of Operations.
The following table provides information about the Fund’s investment in the Government Money Market Fund for the fiscal year ended December 31, 2017:
| | | | | | | | | | | | | | | | | | |
Beginning
Value as of
December 31, 2016 | | | Purchases
at Cost | | | Proceeds
from Sales | | | Ending
Value as of
December 31, 2017 | | | Shares as of
December 31, 2017 | |
| $ | 1,612,600 | | | $ | 16,444,494 | | | $ | (18,057,094 | ) | | $ | — | | | | — | |
7. TAX INFORMATION
The tax character of distributions paid during the fiscal years ended December 31, 2016 and December 31, 2017 was as follows:
| | | | | | | | |
| | | 2016 | | | 2017 | |
| Distributions paid from: | | | | | | | | |
Ordinary income | | $ | 2,068,520 | | | $ | 1,602,761 | |
Net long-term capital gains | | | 46,858 | | | | 22,771,647 | |
| Total taxable distributions | | $ | 2,115,378 | | | $ | 24,374,408 | |
As of December 31, 2017, the components of accumulated earnings (losses) on a tax-basis were as follows:(1)
| | | | |
| Undistributed ordinary income — net | | $ | 192,498 | |
| Undistributed long-term capital gains | | | 9,463,546 | |
| Total undistributed earnings | | $ | 9,656,044 | |
| Unrealized gains — net | | | 198,222,950 | |
| Total accumulated gains — net | | $ | 207,878,994 | |
| (1) | The Fund utilized $7,500,559 of capital losses in the current fiscal year. |
As of December 31, 2017, the Fund’s aggregate security unrealized gains and losses based on cost for U.S. federal income tax purposes were as follows:
| | | | |
| Tax cost | | $ | 339,613,818 | |
| Gross unrealized gain | | | 201,697,664 | |
| Gross unrealized loss | | | (3,474,714 | ) |
| Net unrealized gain | | $ | 198,222,950 | |
The difference between GAAP-basis and tax-basis unrealized gains (losses) is attributable primarily to wash sales and differences in the tax treatment of underlying fund investments.
20
GOLDMAN SACHS VARIABLE INSURANCE TRUST STRATEGIC GROWTH FUND
7. TAX INFORMATION (continued)
In order to present certain components of the Fund’s capital accounts on a tax-basis, the Fund has reclassified $7,322 from undistributed net investment income into accumulated net realized gain. This reclassification has no impact on the NAV of the Fund and results primarily from differences in the tax treatment of underlying fund investments.
GSAM has reviewed the Fund’s tax positions for all open tax years (the current and prior three years, as applicable) and has concluded that no provision for income tax is required in the Fund’s financial statements. Such open tax years remain subject to examination and adjustment by tax authorities.
8. OTHER RISKS
The Fund’s risks include, but are not limited to, the following:
Investments in Other Investment Companies Risk — As a shareholder of another investment company, including an exchange-traded fund (“ETF”), the Fund will indirectly bear its proportionate share of any net management fees and other expenses paid by such other investment companies, in addition to the fees and expenses regularly borne by the Fund. ETFs are subject to risks that do not apply to conventional mutual funds, including but not limited to the following: (i) the market price of the ETF’s shares may trade at a premium or a discount to their NAV; and (ii) an active trading market for an ETF’s shares may not develop or be maintained.
Large Shareholder Transactions Risk — The Fund may experience adverse effects when certain large shareholders, such as other funds, participating insurance companies, accounts and Goldman Sachs affiliates, purchase or redeem large amounts of shares of the Fund. Such large shareholder redemptions may cause the Fund to sell portfolio securities at times when it would not otherwise do so, which may negatively impact the Fund’s NAV and liquidity. These transactions may also accelerate the realization of taxable income to shareholders if such sales of investments resulted in gains, and may also increase transaction costs. In addition, a large redemption could result in the Fund’s current expenses being allocated over a smaller asset base, leading to an increase in the Fund’s expense ratio. Similarly, large Fund share purchases may adversely affect the Fund’s performance to the extent that the Fund is delayed in investing new cash and is required to maintain a larger cash position than it ordinarily would.
Liquidity Risk — The Fund may make investments that are illiquid or that may become less liquid in response to market developments or adverse investor perceptions. Illiquid investments may be more difficult to value. Liquidity risk may also refer to the risk that the Fund will not be able to pay redemption proceeds within the allowable time period because of unusual market conditions, an unusually high volume of redemption requests, or other reasons. To meet redemption requests, the Fund may be forced to sell investments at an unfavorable time and/or under unfavorable conditions.
Market and Credit Risks — In the normal course of business, the Fund trades financial instruments and enters into financial transactions where risk of potential loss exists due to changes in the market (market risk). Additionally, the Fund may also be exposed to credit risk in the event that an issuer or guarantor fails to perform or that an institution or entity with which the Fund has unsettled or open transactions defaults.
9. INDEMNIFICATIONS
Under the Trust’s organizational documents, its Trustees, officers, employees and agents are indemnified, to the extent permitted by the Act and state law, against certain liabilities that may arise out of performance of their duties to the Fund. Additionally, in the course of business, the Fund enters into contracts that contain a variety of indemnification clauses. The Fund’s maximum exposure under these arrangements is unknown, as this would involve future claims that may be made against the Fund that have not yet occurred. However, GSAM believes the risk of loss under these arrangements to be remote.
21
GOLDMAN SACHS VARIABLE INSURANCE TRUST STRATEGIC GROWTH FUND
Notes to Financial Statements (continued)
December 31, 2017
10. SUBSEQUENT EVENTS
Subsequent events after the Statement of Assets and Liabilities date have been evaluated, and GSAM has concluded that there is no impact requiring adjustment or disclosure in the financial statements.
11. SUMMARY OF SHARE TRANSACTIONS
Share activity is as follows:
| | | | | | | | | | | | | | | | |
| | | For the Fiscal Year Ended
December 31, 2017 | | | For the Fiscal Year Ended
December 31, 2016 | |
| | | Shares | | | Dollars | | | Shares | | | Dollars | |
| Institutional Shares | | | | | | | | | | | | | | | | |
| Shares sold | | | 173,227 | | | $ | 3,153,417 | | | | 278,581 | | | $ | 4,331,231 | |
| Reinvestment of distributions | | | 271,457 | | | | 5,401,988 | | | | 39,022 | | | | 622,003 | |
| Shares redeemed | | | (779,284 | ) | | | (14,386,601 | ) | | | (1,150,547 | ) | | | (17,834,315 | ) |
| | | | (334,600 | ) | | | (5,831,196 | ) | | | (832,944 | ) | | | (12,881,081 | ) |
| Service Shares | | | | | | | | | | | | | | | | |
| Shares sold | | | 761,609 | | | | 13,413,101 | | | | 9,970,382 | | | | 155,513,106 | |
| Reinvestment of distributions | | | 955,308 | | | | 18,972,420 | | | | 93,923 | | | | 1,493,375 | |
| Shares redeemed | | | (3,410,382 | ) | | | (63,262,328 | ) | | | (9,905,667 | ) | | | (149,110,577 | ) |
| | | | (1,693,465 | ) | | | (30,876,807 | ) | | | 158,638 | | | | 7,895,904 | |
| NET DECREASE | | | (2,028,065 | ) | | $ | (36,708,003 | ) | | | (674,306 | ) | | $ | (4,985,177 | ) |
22
Report of Independent Registered Public Accounting Firm
To the Board of Trustees of
Goldman Sachs Variable Insurance Trust and Shareholders of the Goldman Sachs Strategic Growth Fund
Opinion on the Financial Statements
We have audited the accompanying statement of assets and liabilities, including the schedule of investments, of the Goldman Sachs Strategic Growth Fund (the “Fund”) as of December 31, 2017, the related statement of operations for the year ended December 31, 2017, the statements of changes in net assets for each of the two years in the period ended December 31, 2017, including the related notes, and the financial highlights for each of the five years in the period ended December 31, 2017 (collectively referred to as the “financial statements”). In our opinion, the financial statements present fairly, in all material respects, the financial position of the Fund as of December 31, 2017, the results of its operations for the year then ended, the changes in its net assets for each of the two years in the period ended December 31, 2017 and the financial highlights for each of the five years in the period ended December 31, 2017 in conformity with accounting principles generally accepted in the United States of America.
Basis for Opinion
These financial statements are the responsibility of the Fund’s management. Our responsibility is to express an opinion on the Fund’s financial statements based on our audits. We are a public accounting firm registered with the Public Company Accounting Oversight Board (United States) (“PCAOB”) and are required to be independent with respect to the Fund in accordance with the U.S. federal securities laws and the applicable rules and regulations of the Securities and Exchange Commission and the PCAOB.
We conducted our audits of these financial statements in accordance with the standards of the PCAOB. Those standards require that we plan and perform the audit to obtain reasonable assurance about whether the financial statements are free of material misstatement, whether due to error or fraud.
Our audits included performing procedures to assess the risks of material misstatement of the financial statements, whether due to error or fraud, and performing procedures that respond to those risks. Such procedures included examining, on a test basis, evidence regarding the amounts and disclosures in the financial statements. Our audits also included evaluating the accounting principles used and significant estimates made by management, as well as evaluating the overall presentation of the financial statements. Our procedures included confirmation of securities owned as of December 31, 2017 by correspondence with the custodian and transfer agent. We believe that our audits provide a reasonable basis for our opinion.
PricewaterhouseCoopers LLP
Boston, Massachusetts
February 14, 2018
We have served as the auditor of one or more investment companies in the Goldman Sachs Fund complex since 2000.
23
GOLDMAN SACHS VARIABLE INSURANCE TRUST STRATEGIC GROWTH FUND
| | |
| Fund Expenses — Six Month Period Ended December 31, 2017 (Unaudited) | | |
As a shareholder of Institutional or Service Shares of the Fund, you incur ongoing costs, including management fees, distribution and/or service (12b-1) fees (with respect to Service Shares) and other Fund expenses. This example is intended to help you understand your ongoing costs (in dollars) of investing in the Institutional Shares and Service Shares of the Fund and to compare these costs with the ongoing costs of investing in other mutual funds.
The example is based on an investment of $1,000 invested at the beginning of the period and held for the entire period from July 1, 2017 through December 31, 2017, which represents a period of 184 days of a 365 day year.
Actual Expenses — The first line under each share class in the table below provides information about actual account values and actual expenses. You may use the information in this line, together with the amount you invested, to estimate the expenses that you paid over the period. Simply divide your account value by $1,000 (for example, an $8,600 account value divided by $1,000=8.6), then multiply the result by the number in the first line under the heading entitled “Expenses Paid” to estimate the expenses you paid on your account during this period.
Hypothetical Example for Comparison Purposes — The second line under each share class in the table below provides information about hypothetical account values and hypothetical expenses based on the Fund’s actual net expense ratio and an assumed rate of return of 5% per year before expenses, which is not the Fund’s actual return. The hypothetical account values and expenses may not be used to estimate the actual ending account balance or expenses you paid for the period. You may use this information to compare the ongoing costs of investing in the Fund and other funds. To do so, compare this 5% hypothetical example with the 5% hypothetical examples that appear in the shareholder reports of the other funds.
Please note that the expenses shown in the table are meant to highlight your ongoing costs only. As a shareholder of the Fund you do not incur any transaction costs, such as sales charges, redemption fees, or exchange fees, but shareholders of other funds may incur such costs. The second line of the table is useful in comparing ongoing costs only and will not help you determine the relative total costs of owning different funds whose shareholders may incur transaction costs.
| | | | | | | | | | | | |
| Share Class | | Beginning
Account Value
07/01/17 | | | Ending
Account Value
12/31/17 | | | Expenses Paid
for the
6 Months
Ended
12/31/17* | |
| Institutional | | | | | | | | | | | | |
| Actual | | $ | 1,000 | | | $ | 1,121.10 | | | $ | 4.01 | |
| Hypothetical 5% return | | | 1,000 | | | | 1,021.42 | + | | | 3.82 | |
| Service | | | | | | | | | | | | |
| Actual | | | 1,000 | | | | 1,119.30 | | | | 5.34 | |
| Hypothetical 5% return | | | 1,000 | | | | 1,020.16 | + | | | 5.09 | |
| | * | Expenses are calculated using the Fund’s annualized net expense ratio for each class, which represents the ongoing expenses as a percentage of net assets for the six months ended December 31, 2017. Expenses are calculated by multiplying the annualized net expense ratio by the average account value for the period; then multiplying the result by the number of days in the most recent fiscal half year; and then dividing that result by the number of days in the fiscal year. The annualized net expense ratios for the period were 0.75% and 1.00% for the Institutional and Service Shares, respectively. | |
| | + | Hypothetical expenses are based on the Fund’s actual annualized net expense ratios and an assumed rate of return of 5% per year before expenses. | |
24
GOLDMAN SACHS VARIABLE INSURANCE TRUST STRATEGIC GROWTH FUND
Trustees and Officers (Unaudited)
Independent Trustees
| | | | | | | | | | |
| | | | | |
Name,
Address and Age1 | | Position(s) Held with the Trust | | Term of Office and
Length of
Time Served2 | | Principal Occupation(s) During Past 5 Years | | Number of
Portfolios in
Fund Complex
Overseen by
Trustee3 | | Other Directorships Held by Trustee4 |
Jessica Palmer Age: 68 | | Chair of the Board of Trustees | | 2018 (Trustee since 2007) | | Ms. Palmer is retired. She is Director, Emerson Center for the Arts and Culture (2011-Present); and was formerly a Consultant, Citigroup Human Resources Department (2007-2008); Managing Director, Citigroup Corporate and Investment Banking (previously, Salomon Smith Barney/Salomon Brothers) (1984-2006). Ms. Palmer was a Member of the Board of Trustees of Indian Mountain School (private elementary and secondary school) (2004-2009). Chair of the Board of Trustees — Goldman Sachs Trust and Goldman Sachs Variable Insurance Trust. | | 105 | | None |
Kathryn A. Cassidy Age: 63 | | Trustee | | Since 2015 | | Ms. Cassidy is retired. Formerly, she was Advisor to the Chairman (May 2014-December 2014); and Senior Vice President and Treasurer (2008-2014), General Electric Company & General Electric Capital Corporation (technology and financial services companies). Trustee — Goldman Sachs Trust and Goldman Sachs Variable Insurance Trust. | | 105 | | None |
Diana M. Daniels Age: 68 | | Trustee | | Since 2007 | | Ms. Daniels is retired. Formerly, she was Vice President, General Counsel and Secretary, The Washington Post Company (1991-2006). Ms. Daniels is a Trustee Emeritus and serves as a Presidential Councillor of Cornell University (2013-Present); former Member of the Legal Advisory Board, New York Stock Exchange (2003-2006) and of the Corporate Advisory Board, Standish Mellon Management Advisors (2006-2007). Trustee — Goldman Sachs Trust and Goldman Sachs Variable Insurance Trust. | | 105 | | None |
Herbert J. Markley Age: 67 | | Trustee | | Since 2013 | | Mr. Markley is retired. Formerly, he was Executive Vice President, Deere & Company (an agricultural and construction equipment manufacturer) (2007-2009); and President, Agricultural Division, Deere & Company (2001-2007). Previously, Mr. Markley served as an Advisory Board Member of Goldman Sachs Trust and Goldman Sachs Variable Insurance Trust (June 2013-October 2013). Trustee — Goldman Sachs Trust and Goldman Sachs Variable Insurance Trust. | | 105 | | None |
Roy W. Templin Age: 57 | | Trustee | | Since 2013 | | Mr. Templin is retired. He is Director, Armstrong World Industries, Inc. (a designer and manufacturer of ceiling, wall and suspension system solutions) (2016–Present); and was formerly Chairman of the Board of Directors, Con-Way Incorporated (a transportation, logistics and supply chain management service company) (2014-2015); Executive Vice President and Chief Financial Officer, Whirlpool Corporation (an appliance manufacturer and marketer) (2004-2012). Previously, Mr. Templin served as an Advisory Board Member of Goldman Sachs Trust and Goldman Sachs Variable Insurance Trust (June 2013-October 2013). Trustee — Goldman Sachs Trust and Goldman Sachs Variable Insurance Trust. | | 105 | | Armstrong World Industries, Inc. (a ceiling, wall and suspension systems solutions manufacturer) |
Gregory G. Weaver Age: 66 | | Trustee | | Since 2015 | | Mr. Weaver is retired. He is Director, Verizon Communications Inc. (2015-Present); and was formerly Chairman and Chief Executive Officer, Deloitte & Touche LLP (a professional services firm) (2001-2005 and 2012-2014); and Member of the Board of Directors, Deloitte & Touche LLP (2006-2012). Trustee — Goldman Sachs Trust and Goldman Sachs Variable Insurance Trust. | | 105 | | Verizon Communications Inc. |
| | | | | | | | | | |
25
GOLDMAN SACHS VARIABLE INSURANCE TRUST STRATEGIC GROWTH FUND
Trustees and Officers (Unaudited) (continued)
Interested Trustee*
| | | | | | | | | | |
| | | | | |
Name,
Address and Age1 | | Position(s) Held with the Trust | | Term of Office and
Length of
Time Served2 | | Principal Occupation(s) During Past 5 Years | | Number of
Portfolios in
Fund Complex
Overseen by
Trustee3 | | Other Directorships Held by Trustee4 |
James A. McNamara Age: 55 | | President and Trustee | | Since 2007 | | Managing Director, Goldman Sachs (January 2000-Present); Director of Institutional Fund Sales, GSAM (April 1998-December 2000); and Senior Vice President and Manager, Dreyfus Institutional Service Corporation (January 1993- April 1998). President and Trustee — Goldman Sachs Trust; Goldman Sachs Variable Insurance Trust; Goldman Sachs Trust II; Goldman Sachs MLP Income Opportunities Fund; Goldman Sachs MLP and Energy Renaissance Fund; Goldman Sachs ETF Trust; Goldman Sachs Private Markets Fund 2018 LLC; Goldman Sachs Private Markets Fund 2018 (A) LLC; and Goldman Sachs Private Markets Fund 2018 (B) LLC. | | 146 | | None |
| | | | | | | | | | |
| * | Mr. McNamara is considered to be an “Interested Trustee” because he holds positions with Goldman Sachs and owns securities issued by The Goldman Sachs Group, Inc. Mr. McNamara holds comparable positions with certain other companies of which Goldman Sachs, GSAM or an affiliate thereof is the investment adviser, administrator and/or distributor. |
| 1 | Each Trustee may be contacted by writing to the Trustee, c/o Goldman Sachs, 200 West Street, New York, New York, 10282, Attn: Caroline Kraus. Information is provided as of December 31, 2017. |
| 2 | Subject to such policies as may be adopted by the Board from time-to-time, each Trustee holds office for an indefinite term, until the earliest of: (a) the election of his or her successor; (b) the date the Trustee resigns or is removed by the Board or shareholders, in accordance with the Trust’s Declaration of Trust; or (c) the termination of the Trust. The Board has adopted policies which provide that (a) no Trustee shall hold office for more than 15 years and (b) a Trustee shall retire as of December 31st of the calendar year in which he or she reaches his or her 74th birthday, unless a waiver of such requirement shall have been adopted by a majority of the other Trustees. These policies may be changed by the Trustees without shareholder vote. |
| 3 | The Goldman Sachs Fund Complex includes certain other companies listed above for each respective Trustee. As of December 31, 2017, Goldman Sachs Trust consisted of 91 portfolios (90 of which offered shares to the public); Goldman Sachs Variable Insurance Trust consisted of 14 portfolios; Goldman Sachs Trust II consisted of 17 portfolios (16 of which offered shares to the public); Goldman Sachs BDC, Inc., Goldman Sachs Private Middle Market Credit LLC, Goldman Sachs MLP Income Opportunities Fund, Goldman Sachs MLP and Energy Renaissance Fund, Goldman Sachs Private Markets Fund 2018 LLC, Goldman Sachs Private Markets Fund 2018 (A) LLC and Goldman Sachs Private Markets Fund 2018 (B) LLC each consisted of one portfolio; and Goldman Sachs ETF Trust consisted of 19 portfolios (12 of which offered shares to the public). Goldman Sachs Private Middle Market Credit LLC, Goldman Sachs Private Markets Fund 2018 LLC, Goldman Sachs Private Markets Fund 2018 (A) LLC and Goldman Sachs Private Markets Fund 2018 (B) LLC do not offer shares to the public. |
| 4 | This column includes only directorships of companies required to report to the Securities and Exchange Commission under the Securities Exchange Act of 1934 (i.e., “public companies”) or other investment companies registered under the Act. |
Additional information about the Trustees is available in the Fund’s Statement of Additional Information, which can be obtained from Goldman Sachs free of charge by calling this toll-free number (in the United States of America): 1-800-526-7384.
26
GOLDMAN SACHS VARIABLE INSURANCE TRUST STRATEGIC GROWTH FUND
Trustees and Officers (Unaudited) (continued)
Officers of the Trust*
| | | | | | |
| | | |
| Name, Address and Age1 | | Position(s) Held with the Trust | | Term of
Office and
Length of
Time Served2 | | Principal Occupation(s) During Past 5 Years |
James A. McNamara 200 West Street New York, NY 10282 Age: 55 | | Trustee and President | | Since 2007 | | Managing Director, Goldman Sachs (January 2000-Present); Director of Institutional Fund Sales, GSAM (April 1998-December 2000); and Senior Vice President and Manager, Dreyfus Institutional Service Corporation (January 1993-April 1998). President and Trustee — Goldman Sachs Trust; Goldman Sachs Variable Insurance Trust; Goldman Sachs Trust II; Goldman Sachs MLP Income Opportunities Fund; Goldman Sachs MLP and Energy Renaissance Fund; Goldman Sachs ETF Trust; Goldman Sachs Private Markets Fund 2018 LLC; Goldman Sachs Private Markets Fund 2018 (A) LLC; and Goldman Sachs Private Markets Fund 2018 (B) LLC. |
Caroline L. Kraus 200 West Street New York, NY 10282 Age: 40 | | Secretary | | Since 2012 | | Managing Director, Goldman Sachs (January 2016-Present); Vice President, Goldman Sachs (August 2006-December 2015); Associate General Counsel, Goldman Sachs (2012-Present); Assistant General Counsel, Goldman Sachs (August 2006-December 2011); and Associate, Weil, Gotshal & Manges, LLP (2002-2006). Secretary — Goldman Sachs Trust (previously Assistant Secretary (2012)); Goldman Sachs Variable Insurance Trust (previously Assistant Secretary (2012)); Goldman Sachs Trust II; Goldman Sachs BDC, Inc.; Goldman Sachs Private Middle Market Credit LLC; Goldman Sachs Middle Market Lending Corp.; Goldman Sachs MLP Income Opportunities Fund; Goldman Sachs MLP and Energy Renaissance Fund; Goldman Sachs ETF Trust; Goldman Sachs Private Markets Fund 2018 LLC; Goldman Sachs Private Markets Fund 2018 (A) LLC; and Goldman Sachs Private Markets Fund 2018 (B) LLC. |
Scott M. McHugh 200 West Street New York, NY 10282 Age: 46 | | Treasurer, Senior Vice President and Principal Financial Officer | | Since 2009 (Principal Financial Officer since 2013) | | Managing Director, Goldman Sachs (January 2016-Present); Vice President, Goldman Sachs (February 2007-December 2015); Assistant Treasurer of certain mutual funds administered by DWS Scudder (2005-2007); and Director (2005-2007), Vice President (2000-2005), and Assistant Vice President (1998-2000), Deutsche Asset Management or its predecessor (1998-2007). Treasurer, Senior Vice President and Principal Financial Officer — Goldman Sachs Trust; Goldman Sachs Variable Insurance Trust; Goldman Sachs Trust II; Goldman Sachs MLP Income Opportunities Fund; Goldman Sachs MLP and Energy Renaissance Fund; Goldman Sachs ETF Trust; Goldman Sachs Private Markets Fund 2018 LLC; Goldman Sachs Private Markets Fund 2018 (A) LLC; and Goldman Sachs Private Markets Fund 2018 (B) LLC. |
Joseph F. DiMaria 30 Hudson Street Jersey City, NJ 07302 Age: 49 | | Assistant Treasurer and Principal Accounting Officer | | Since 2016 (Principal Accounting Officer since 2017) | | Managing Director, Goldman Sachs (November 2015-Present) and Vice President — Mutual Fund Administration, Columbia Management Investment Advisers, LLC (May 2010-October 2015). Assistant Treasurer and Principal Accounting Officer — Goldman Sachs Trust; Goldman Sachs Variable Insurance Trust; Goldman Sachs Trust II; Goldman Sachs MLP Income Opportunities Fund; Goldman Sachs MLP and Energy Renaissance Fund; Goldman Sachs ETF Trust; Goldman Sachs Private Markets Fund 2018 LLC; Goldman Sachs Private Markets Fund 2018 (A) LLC; and Goldman Sachs Private Markets Fund 2018 (B) LLC. |
| | | | | | |
| * | Represents a partial list of officers of the Trust. Additional information about all the officers is available in the Fund’s Statement of Additional Information, which can be obtained from Goldman Sachs free of charge by calling this toll-free number (in the United States): 1-800-526-7384. |
| 1 | Information is provided as of December 31, 2017. |
| 2 | Officers hold office at the pleasure of the Board of Trustees or until their successors are duly elected and qualified. Each officer holds comparable positions with certain other companies of which Goldman Sachs, GSAM or an affiliate thereof is the investment adviser, administrator and/or distributor. |
27
GOLDMAN SACHS VARIABLE INSURANCE TRUST STRATEGIC GROWTH FUND
Goldman Sachs Variable Insurance Trust — Tax Information (Unaudited)
For the year ended December 31, 2017, 100% of the dividends paid from net investment company taxable income by the Strategic Growth Fund qualify for the dividends received deduction available to corporations.
Pursuant to Section 852 of the Internal Revenue Code, the Strategic Growth Fund designates $22,771,647 or, if different, the maximum amount allowable, as capital gain dividends paid during the fiscal year ended December 31, 2017.
28
| | |
| TRUSTEES | | OFFICERS |
| Jessica Palmer, Chair | | James A. McNamara, President |
| Kathryn A. Cassidy | | Scott M. McHugh, Treasurer, Senior Vice |
| Diana M. Daniels | | President and Principal Financial Officer |
| Herbert J. Markley | | Joseph F. DiMaria, Assistant Treasurer |
| James A. McNamara | | and Principal Accounting Officer |
| Roy W. Templin | | Caroline L. Kraus, Secretary |
| Gregory G. Weaver | | |
GOLDMAN SACHS & CO. LLC
Distributor and Transfer Agent
GOLDMAN SACHS ASSET MANAGEMENT, L.P.
Investment Adviser
200 West Street, New York
New York 10282
Visit our web site at www.GSAMFUNDS.com to obtain the most recent month-end returns.
The reports concerning the Fund included in this shareholder report may contain certain forward-looking statements about the factors that may affect the performance of the Fund in the future. These statements are based on Fund management’s predictions and expectations concerning certain future events and their expected impact on the Fund, such as performance of the economy as a whole and of specific industry sectors, changes in the levels of interest rates, the impact of developing world events, and other factors that may influence the future performance of the Fund. Management believes these forward-looking statements to be reasonable, although they are inherently uncertain and difficult to predict. Actual events may cause adjustments in portfolio management strategies from those currently expected to be employed.
A description of the policies and procedures that the Fund uses to determine how to vote proxies relating to portfolio securities and information regarding how the Fund voted proxies relating to portfolio securities for the 12-month period ended December 31 is available (i) without charge, upon request by calling 1-800-621-2550; and (ii) on the Securities and Exchange Commission (“SEC”) web site at http://www.sec.gov.
The Fund files its complete schedule of portfolio holdings with the SEC for the first and third quarters of each fiscal year on Form N-Q. The Fund’s Form N-Qs are available on the SEC’s web site at http://www.sec.gov within 60 days after the Fund’s first and third fiscal quarters. The Fund’s Form N-Qs may be reviewed and copied at the SEC’s Public Reference Room in Washington, D.C. and information on the operation of the Public Reference Room may also be obtained by calling 1-800-SEC-0330. Form N-Qs may be obtained upon request and without charge by calling 1-800-621-2550.
Views and opinions expressed are for informational purposes only and do not constitute a recommendation by GSAM to buy, sell, or hold any security. Views and opinions are current as of the date of this presentation and may be subject to change, they should not be construed as investment advice.
Goldman Sachs & Co. LLC (“Goldman Sachs”) does not provide legal, tax or accounting advice. Any statement contained in this communication (including any attachments) concerning U.S. tax matters was not intended or written to be used, and cannot be used, for the purpose of avoiding penalties under the Internal Revenue Code, and was written to support the promotion or marketing of transaction or matter addressed. Clients of Goldman Sachs should obtain their own independent tax advice based on their particular circumstances.
The website links provided are for your convenience only and are not an endorsement or recommendation by GSAM of any of these websites or the products or services offered. GSAM is not responsible for the accuracy and validity of the content of these websites.
Fund holdings and allocations shown are as of December 31, 2017 and may not be representative of future investments. Fund holdings should not be relied on in making investment decisions and should not be construed as research or investment advice regarding particular securities. Current and future holdings are subject to risk.
References to indices, benchmarks or other measures of relative market performance over a specified period of time are provided for your information only and do not imply that the portfolio will achieve similar results. The index composition may not reflect the manner in which a portfolio is constructed. While an adviser seeks to design a portfolio which reflects appropriate risk and return features, portfolio characteristics may deviate from those of the benchmark.
The Global Industry Classification Standard (“GICS”) was developed by and is the exclusive property and a service mark of Morgan Stanley Capital International Inc. (“MSCI”) and Standard & Poor’s, a division of The McGraw-Hill Companies, Inc. (“S&P”) and is licensed for use by Goldman Sachs. Neither MSCI, S&P nor any other party involved in making or compiling the GICS or any GICS classifications makes any express or implied warranties or representations with respect to such standard or classification (or the results to be obtained by the use thereof), and all such parties hereby expressly disclaim all warranties of originality, accuracy, completeness, merchantability or fitness for a particular purpose with respect to any of such standard or classification. Without limiting any of the foregoing, in no event shall MSCI, S&P, any of their affiliates or any third party involved in making or compiling the GICS or any GICS classifications have any liability for any direct, indirect, special, punitive, consequential or any other damages (including lost profits) even if notified of the possibility of such damages.
The portfolio risk management process includes an effort to monitor and manage risk, but does not imply low risk.
Shares of the Goldman Sachs VIT Funds are offered to separate accounts of participating life insurance companies for the purpose of funding variable annuity contracts and variable life insurance policies. Shares of the Fund are not offered directly to the general public. The variable annuity contracts and variable life insurance policies are described in the separate prospectuses issued by participating insurance companies. You should refer to those prospectuses for information about surrender charges, mortality and expense risk fees and other charges that may be assessed by participating insurance companies under the variable annuity contracts or variable life insurance policies. Such fees or charges, if any, may affect the return you may realize with respect to your investments. Ask your representative for more complete information. Please consider a fund’s objectives, risks and charges and expenses, and read the prospectus carefully before investing. The prospectus contains this and other information about the Fund.
This material is not authorized for distribution to prospective investors unless preceded or accompanied by a current prospectus or summary prospectus, if applicable. Investors should consider the Fund’s objective, risks, and charges and expenses, and read the summary prospectus, if available, and/or the prospectus carefully before investing or sending money. The summary prospectus, if available, and the prospectus contain this and other information about the Fund and may be obtained from your authorized dealer or from Goldman Sachs & Co. LLC by calling 1-800-621-2550.
THIS MATERIAL IS FOR INFORMATIONAL PURPOSES ONLY AND IS PROVIDED SOLELY ON THE BASIS THAT IT WILL NOT CONSTITUTE INVESTMENT OR OTHER ADVICE OR A RECOMMENDATION RELATING TO ANY PERSON’S OR PLAN’S INVESTMENT OR OTHER DECISIONS, AND GOLDMAN SACHS IS NOT A FIDUCIARY OR ADVISOR WITH RESPECT TO ANY PERSON OR PLAN BY REASON OF PROVIDING THE MATERIAL OR CONTENT HEREIN INCLUDING UNDER THE EMPLOYEE RETIREMENT INCOME SECURITY ACT OF 1974 OR DEPARTMENT OF LABOR REGULATIONS. PLAN SPONSORS AND OTHER FIDUCIARIES SHOULD CONSIDER THEIR OWN CIRCUMSTANCES IN ASSESSING ANY POTENTIAL COURSE OF ACTION.
This report is prepared for the general information of contract owners and is not an offer of shares of the Goldman Sachs Variable Insurance Trust — Goldman Sachs Strategic Growth Fund.
©2018 Goldman Sachs. All rights reserved.
VITGRWAR-18/119286-OTU-698870/30.3
Goldman
Sachs Variable Insurance Trust
Goldman Sachs
Strategic Income Fund
Annual Report
December 31, 2017

GOLDMAN SACHS VARIABLE INSURANCE TRUST STRATEGIC INCOME FUND
INVESTMENT OBJECTIVE
The Fund seeks total return comprised of income and capital appreciation.
Portfolio Management Discussion and Analysis
Below, the Goldman Sachs Fixed Income Portfolio Management Team discusses the Goldman Sachs Variable Insurance Trust — Goldman Sachs Strategic Income Fund’s (the “Fund”) performance and positioning for the 12-month period ended December 31, 2017 (the “Reporting Period”).
How did the Fund perform during the Reporting Period?
During the Reporting Period, the Fund’s Institutional, Service and Advisor Shares generated average annual total returns of -2.04%, -2.13% and -2.32%, respectively. These returns compare to the 1.11% average annual total return of the Fund’s benchmark, the ICE® BofAML® U.S. Dollar Three-Month LIBOR Constant Maturity Index (the “LIBOR Index”), during the same period.
We note that the Fund’s benchmark being the LIBOR Index is a means of emphasizing that the Fund has an unconstrained strategy. That said, this Fund employs a benchmark agnostic strategy and thus comparisons to a benchmark index are not particularly relevant.
What economic and market factors most influenced the Fund during the Reporting Period?
When the Reporting Period began in the first quarter of 2017, government bond sectors sold off and spread (or non-government bond) sectors generally posted gains. Investors focused on the prospect of pro-growth policies from the U.S. Administration, which helped boost business and consumer sentiment to near record levels, and also on the positive impact of earlier fiscal stimulus in China. Global purchasing managers’ indices (“PMI”) pointed to solid expansion across the largest global economies, the U.S. in particular. In Europe, economic data strengthened and political risk remained contained, as markets weathered the official start of Brexit negotiations. (Brexit refers to the U.K.’s efforts to exit the European Union.) The far right lost to centrists in the Netherlands’ election. In France, polls reflected a relatively low chance of victory for the far-right candidate in its then-upcoming presidential vote. Monetary policy presented few surprises during the first calendar quarter, as the European Central Bank (“ECB”), Bank of Japan (“BoJ”) and Bank of England (“BoE”) kept their respective monetary policies unchanged. In March 2017, the ECB raised its economic growth and inflation forecast. The same month, U.S. Federal Reserve (the “Fed”) policymakers hiked interest rates. Minutes from the meeting suggested the Fed might start reducing its balance sheet near the end of 2017. The U.S. dollar weakened versus many global currencies during the first calendar quarter.
Spread sectors generally recorded positive returns during the second quarter of 2017, though with mixed results relative to government bond sectors. Political developments led to temporary bouts of volatility early in the quarter, driving weakness in Brazilian, U.S. and U.K. fixed income assets as well as a credit rating downgrade of South Africa’s sovereign debt. Political risks receded in May 2017 on the centrist candidate’s victory in the French presidential election, which was supportive of French and European peripheral bonds broadly. On the economic front, U.S. core inflation weakened for the third consecutive month in May 2017, casting uncertainty over the pace of Fed monetary tightening. Nonetheless, comments included in minutes from the Fed’s May and June 2017 policy meetings suggested an announcement about how and when the Fed would begin reducing the size of its balance sheet would be made sooner than the markets had previously anticipated. In Europe, economic data continued to surprise to the upside. At its June 2017 policy meeting, the ECB provided an optimistic assessment of the risks to economic growth, but revised downward its medium-term inflation forecasts. The ECB, BoJ and BoE left their respective monetary policies unchanged during the second calendar quarter, while the Fed raised interest rates for the second time in 2017 at its June policy meeting. As the quarter came to an end, a string of comments from global central bankers triggered a hawkish market reaction. (Hawkish suggests higher interest rates.) Global interest rates rose as the market anticipated a faster than expected pace of monetary policy tightening by the BoE, ECB and Bank of Canada (“BoC”). During the second quarter of 2017, the U.S. dollar weakened versus many global currencies.
In the third quarter of 2017, spread sectors broadly advanced, outperforming government bond sectors. The Fed kept its monetary policy unchanged but unveiled its plans for balance sheet normalization. (Balance sheet normalization refers to the steps the Fed takes to reverse quantitative easing and remove the substantial monetary accommodation it has provided to the economy since the
1
GOLDMAN SACHS VARIABLE INSURANCE TRUST STRATEGIC INCOME FUND
financial crisis began in 2007.) This prompted a hawkish market reaction, with the U.S. dollar appreciating and yields on U.S. government bonds rising. However, the U.S. Treasury yield curve only steepened modestly due to geopolitical uncertainty and mixed U.S. economic data, including weak inflation readings. The central banks of other developed countries also set the stage for less accommodative monetary policy. The BoE noted “a majority” of its policymakers were in favor of tightening policy “over the coming months,” while the BoC surprised the markets with two consecutive rate hikes. The market’s expectations for a BoE rate hike in November 2017, along with a constructive tone for Brexit negotiations, drove the British pound higher versus the U.S. dollar. The U.S. dollar also continued to weaken relative to many other global currencies during the third calendar quarter.
During the fourth calendar quarter, spread sector performance was broadly positive, supported by ongoing strength in the global macro environment and contained market, macro and political volatility. Passage of U.S. tax legislation and solid corporate earnings were particularly supportive of U.S. corporate credit. In October 2017, the ECB announced it would reduce its monthly asset purchases from €60 billion to €30 billion for nine months beginning in January 2018, mainly by purchasing fewer sovereign government bonds. The ECB also said its policy rates would remain low for “an extended period of time, and well past the horizon of the net asset purchases.” During the same month, the BoE reversed an emergency interest rate cut, made in August 2016 following the Brexit referendum, and signaled that future monetary policy tightening would be limited, gradual and dependent on the economic reaction to the U.K.’s eventual departure from the European Union. In December 2017, the Fed delivered its third short-term rate hike of 2017. The Fed’s dot plot, which shows rate projections of the members of the Fed’s Open Market Committee, indicated that three rate increases were on tap for 2018 and potentially two in 2019. The U.S. dollar weakened further versus many global currencies during the fourth quarter of 2017.
For the Reporting Period overall, sovereign emerging markets debt and high yield corporate bonds outperformed U.S. Treasuries. Investment grade corporate bonds also outpaced U.S. Treasuries. In addition, commercial mortgage-backed securities, agency securities, asset-backed securities and mortgage-backed securities outperformed U.S. Treasuries, though more modestly. The U.S. Treasury yield curve flattened during the Reporting Period, as yields on maturities of seven years and shorter rose and yields on maturities of 10 years and longer fell. The yield on the bellwether 10-year U.S. Treasury edged down approximately five basis points to end the Reporting Period at 2.40%. (A basis point is 1/100th of a percentage point. Yield curve is a spectrum of maturities. A flattening yield curve is one wherein the differential in yields between longer-term and shorter-term maturities narrows.)
What key factors were responsible for the Fund’s performance during the Reporting Period?
During the Reporting Period, our country strategy detracted from performance. More specifically, the Fund was hurt by relative value positions in the interest rates of various countries, including a long position in Canadian short-term interest rates versus a short position in U.S. interest rates, as the BoC unexpectedly hiked interest rates in July and September 2017. In addition, the Fund was hampered by long positions in European and Australian interest rates versus a short position in U.S. interest rates.
Our currency strategy contributed positively to returns. The Fund benefited from selection of emerging markets currencies, including its long positions in the Polish zloty, Czech koruna and Mexican peso. Among developed markets currencies, long positions in the Swedish krona and Norwegian krone also performed well. In addition, our government/swaps and cross-sector strategies generated positive returns. In our cross-sector strategy, we invest Fund assets across a variety of fixed income sectors, including some that may not be included in the LIBOR Index.
Our combined tactical duration and yield curve positioning strategy did not have a meaningful impact on performance. Duration is a measure of sensitivity to changes in interest rates.
What fixed income market sectors most significantly affected Fund performance?
Issue selection among municipal bonds and emerging markets debt detracted most from the Fund’s returns during the Reporting Period. The Fund’s exposure to Puerto Rican municipal debt drove underperformance, as debt restructuring negotiations made little progress and the impact of multiple hurricanes lessened the expected recovery value of the commonwealth’s municipal bonds. In emerging markets debt, the Fund’s exposure to Venezuelan bonds, primarily those issued by Petroleos de Venezuela, performed negatively. In our view, Venezuelan bonds were undervalued relative to potential recovery scenarios, though we recognized there was a high degree of uncertainty about the time frame for the market to recognize their value. In addition, during the Reporting Period, credit default swaps the Fund held as protection against the potential of an outsized negative credit event in China detracted from returns as that country’s economic growth improved. An underweight position in corporate credit further hurt performance as corporate bonds performed well.
2
GOLDMAN SACHS VARIABLE INSURANCE TRUST STRATEGIC INCOME FUND
On the positive side, the Fund was helped within the government/swaps sector by its steepening position on the front, or short-term, end of the U.S. Treasury yield curve. (A steepening yield curve is one wherein the differential in yields between longer-term and shorter-term maturities widens; opposite of flattening.) In its cross-sector strategy, the Fund benefited from holdings within the securitized sector, specifically its positions in high quality collateralized loan obligations and Federal Family Education Loan Program (“FFELP”) student loans.
Did the Fund’s duration and yield curve positioning strategy help or hurt its results during the Reporting Period?
The Fund’s combined tactical duration and yield curve positioning did not have a material impact on performance. For most of the Reporting Period, the Fund held a short duration position on the U.S. Treasury yield curve. Although this positioning hurt results in the first half of the Reporting Period, these losses were offset by positive returns in the second half of the Reporting Period, especially during the fourth quarter of 2017.
How did the Fund use derivatives and similar instruments during the Reporting Period?
We used derivatives and similar instruments for the efficient management of the Fund. These derivatives and similar instruments allowed us to manage interest rate, credit and currency risks more effectively by allowing us both to hedge and to apply active investment views with greater versatility and to afford greater risk management precision than we would otherwise be able to implement.
During the Reporting Period, we used interest rate and bond exchange traded futures contracts to implement duration and country strategies within the Fund, especially in the U.S. and Eurozone markets. Currency transactions were carried out using primarily over-the-counter (“OTC”) spot and forward foreign exchange contracts as well as by purchasing OTC options. Currency transactions were used as we sought both to enhance returns and to hedge the Fund’s portfolio against currency exchange rate fluctuations. In addition, the Fund employed credit default swaps to manage exposure to fluctuations in credit spreads (or the differential in yields between Treasury securities and non-Treasury securities that are identical in all respects except for quality rating). Credit default swaps were also used to manage the Fund’s exposure to the risk of a credit event in China and to express our views on corporate credit. Interest rate swaps were employed to manage exposure to fluctuations in interest rates. Forward sales contracts were employed to implement long and short views within our currency strategy. Inflation-linked swaps were used to express our views on inflation.
During the Reporting Period, our currency strategy, which is implemented through forward sales contracts, added to performance. The credit default swaps we employed to express our views on corporate credit detracted from performance. The Fund’s use of interest rate futures, specifically Treasury futures, contributed positively during the Reporting Period. The use of other derivatives and similar instruments did not have a meaningful impact on performance.
Were there any notable changes in the Fund’s weightings during the Reporting Period?
The Fund is a broadly diversified, multi-sector portfolio designed to provide total return opportunities from across the fixed income spectrum, including government, securitized, corporate credit and emerging market fixed income sectors. During the Reporting Period, the Fund’s positioning was relatively consistent, with a cautious stance on corporate credit (implemented via credit default swaps) and allocations to the securitized sector, particularly high quality collateralized loan obligations and FFELP student loans, as we sought to generate income. In terms of duration, the Fund held a short duration position on the U.S. Treasury yield curve during the Reporting Period overall in anticipation of Fed interest rate hikes and the continued strength in U.S. economic data. Within our country strategy, we focused on the theme of monetary policy divergence. Because we saw the potential for Fed rate increases, the Fund held short positions in U.S. interest rates during the Reporting Period. It had long positions in U.K. and Canadian interest rates, as we anticipated dovish monetary policy from those countries’ central banks. (Dovish suggests lower interest rates.) Regarding our currency strategy, we had a positive view on the emerging markets during the second half of the Reporting Period, a view we expressed by increasing the Fund’s holdings of emerging European currencies.
How was the Fund positioned at the end of the Reporting Period?
At the end of the Reporting Period, the Fund was positioned based on our view that global monetary policy divergence and the strong performance of emerging markets currencies would continue into 2018. In our view, this should be supportive of relative value strategies that seek to take advantage of potential dislocations in the global economic environment. Although we plan to maintain the Fund’s cautious stance on corporate credit, we expect to shift the Fund toward a more neutral stance overall, with fewer hedges within investment grade corporate bonds. We also intend to move toward a more neutral position in emerging markets debt. At the end of the Reporting Period, we were considering an increase in the Fund’s allocation to high quality securitized credit, such as FFELP student loans.
3
GOLDMAN SACHS VARIABLE INSURANCE TRUST STRATEGIC INCOME FUND
What is the Fund’s tactical view and strategy for the months ahead?
At the end of the Reporting Period, we believed the global economic expansion was likely to continue in 2018. This view was supported, in our opinion, by solid household consumption due to labor market strength, improvement in business investment and continuing accommodative monetary policy conditions. Forward-looking economic activity indicators, such as PMI surveys remained comfortably in what we consider expansionary territory for most countries, with notable strength in manufacturing data. That being said, global economic growth appeared to have reached a pace that is unlikely to be sustainable, in our view. We believe risks are broadly skewed to the downside, though the reasons vary across regions—ranging from the risk of the U.S. economy potentially overheating, which could encourage more abrupt Fed tightening, to less monetary and fiscal support in Europe and less growth-friendly policies in China. Accordingly, we expect global economic growth to pull back somewhat from the above-trend levels seen at the end of the Reporting Period, which we believe will be accompanied by higher fixed income market volatility. We consider the emerging markets, aside from China, a potential bright spot. Therefore, we expect the economies of emerging countries to outperform during 2018, we believe, which should widen the gap between their economic growth and that of developed market countries broadly.
Despite solid economic growth momentum, inflationary pressures remained subdued during the Reporting Period. In 2018, we expect inflation to trend toward central bank targets as output gaps near or move further into positive territory and as unemployment continues to approach or stay below estimates of the non-accelerating inflation rate of unemployment (i.e., a level of unemployment below which inflation rises).
Regionally, we expect the U.S. to continue to take the lead in unwinding the accommodative monetary policy put in place by many of the world’s central banks after the 2008-2009 financial crisis. We think the Fed will raise interest rates three times in 2018, in line with projections provided at its December 2017 policy meeting, while continuing to trim its balance sheet. We also see scope for several other developed markets central banks, including the BoC and Reserve Bank of New Zealand, to tighten monetary policy in 2018, due to domestic economic strength. In contrast, we continue to expect prolonged monetary policy accommodation in Europe and Japan, where core inflation lacks upward momentum.
NOTE: On December 13, 2017, the Board of Trustees of the Goldman Sachs Variable Insurance Trust approved a proposal to liquidate the Fund. The liquidation is expected to occur on or about April 27, 2018. On or after December 29, 2017, the Fund shall cease its business and may depart from its stated investment objective and policies as it prepares to liquidate and distribute its assets to shareholders.
4
GOLDMAN SACHS VARIABLE INSURANCE TRUST STRATEGIC INCOME FUND
Index Definitions
The ICE® BofAML® U.S. Dollar Three-Month LIBOR Constant Maturity Index is based on the assumed purchase of a synthetic instrument having three months to maturity and with a coupon equal to the closing quote for three-month LIBOR. That issue is sold the following day (priced at a yield equal to the current day closing three-month LIBOR rate) and is rolled into a new three-month instrument. The index, therefore, will always have a constant maturity equal to exactly three months.
5
FUND BASICS
Strategic Income Fund
as of December 31, 2017
STANDARDIZED TOTAL RETURNS1
| | | | | | | | | | | | | | |
| For the period ended 12/31/17 | | One Year | | | Three Years | | | Since Inception | | | Inception Date |
| Institutional | | | -2.04 | % | | | -0.89 | % | | | -0.85 | % | | 4/14/14 |
| Service | | | -2.13 | | | | -1.13 | | | | -1.10 | | | 4/14/14 |
| Advisor | | | -2.32 | | | | -1.29 | | | | -1.25 | | | 4/14/14 |
| 1 | The Standardized Total Returns are average annual total returns as of the most recent calendar quarter-end. They assume reinvestment of all distributions at net asset value (“NAV”). Because Institutional, Service and Advisor Shares do not involve a sales charge, such a charge is not applied to their Standardized Total Returns. |
Total return figures in the above chart represent past performance and do not indicate future results, which will vary. The investment return and principal value of an investment will fluctuate and, therefore, an investor’s shares, when redeemed, may be worth more or less than their original cost. Current performance may be lower or higher than the total return figures in the above chart. Please visit www.GSAMFUNDS.com to obtain the most recent month-end returns. Performance reflects fee waivers and/or expense limitations in effect during the periods shown. In their absence, performance would be reduced.
EXPENSE RATIOS2
| | | | | | | | |
| | | Net Expense Ratio (Current) | | | Gross Expense Ratio (Before Waivers) | |
| Institutional | | | 0.88 | % | | | 1.93 | % |
| Service | | | 1.13 | | | | 2.18 | |
| Advisor | | | 1.28 | | | | 2.33 | |
| 2 | The expense ratios of the Fund, both current (net of any fee waivers and/or expense limitations) and before waivers (gross of any fee waivers and/or expense limitations) are as set forth above according to the most recent publicly available Prospectuses for the Fund and may differ from the expense ratios disclosed in the Financial Highlights in this report. Pursuant to a contractual arrangement, the Fund’s fee waivers and/or expense limitations will remain in place through at least April 28, 2018, and prior to such date, the Investment Adviser may not terminate the arrangements without the approval of the Fund’s Board of Trustees. If these arrangements are discontinued in the future, the expense ratios may change without shareholder approval. |
6
FUND BASICS
FUND COMPOSITION3

| 3 | The percentage shown for each investment category reflects the value of investments in that category as a percentage of net assets. Underlying sector allocations of exchange traded funds and investment companies held by the Fund are not reflected in the graph above. Figures in the graph may not sum to 100% due to the exclusion of other assets and liabilities. The graph depicts the Fund’s investments but may not represent the Fund’s market exposure due to the exclusion of certain derivatives, if any, as listed in the Additional Investment Information section of the Schedule of Investments. |
| 4 | “Mortgage-Backed Securities” are guaranteed by the Government National Mortgage Association (“GNMA”), Federal National Mortgage Association (“FNMA”) or Federal Home Loan Mortgage Corp. (“FHLMC”). GNMA instruments are backed by the full faith and credit of the United States Government. |
| 5 | “U.S. Government Agency Securities” include agency securities offered by companies such as the Federal Home Loan Bank (“FHLB”), which operate under a government charter. While they are required to report to a government regulator, their assets are not explicitly guaranteed by the government, and they otherwise operate like any other publicly traded company. |
7
GOLDMAN SACHS VARIABLE INSURANCE TRUST STRATEGIC INCOME FUND
Performance Summary
December 31, 2017
The following graph shows the value, as of December 31, 2017, of a $10,000 investment made on April 14, 2014 (commencement of the Fund’s operations) in Advisor Shares at NAV. For comparative purposes, the performance of the Fund’s benchmark, the ICE BofAML® U.S. Dollar Three-Month LIBOR Constant Maturity Index, is shown. This performance data represents past performance and should not be considered indicative of future performance, which will fluctuate with changes in market conditions. These performance fluctuations may cause an investor’s shares, when redeemed, to be worth more or less than their original cost. Performance reflects Fund level expenses but does not reflect fees and expenses associated with any variable annuity contract or variable life insurance policy that uses the Fund as an investment option for any contract or policy. Had performance reflected all of those fees and expenses, performance would have been reduced. Performance reflects applicable fee waivers and/or expense limitations in effect during the periods shown, and in their absence, performance would be reduced. Performance of Institutional and Service Shares will vary from Advisor Shares due to differences in class specific fees. In addition to the Investment Adviser’s decisions regarding issuer/industry investment selection and allocation, other factors may affect Fund performance. These factors include, but are not limited to, Fund operating fees and expenses, portfolio turnover, and subscription and redemption cash flows affecting the Fund.
Strategic Income Fund’s Lifetime Performance
Performance of a $10,000 investment, with distributions reinvested, from April 14, 2014 through December 31, 2017.
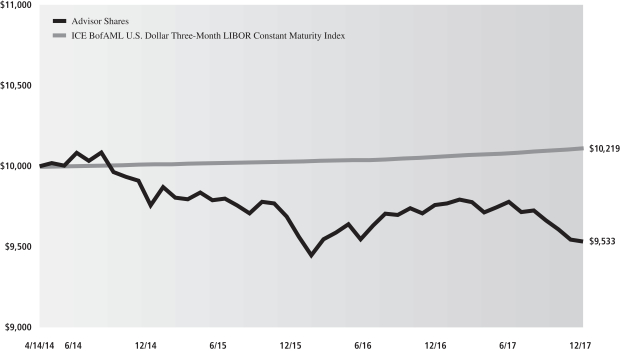
| | | | | | |
| Average Annual Total Return through December 31, 2017 | | One Year | | Three Years | | Since Inception |
Institutional (Commenced April 14, 2014) | | -2.04% | | -0.89% | | -0.85% |
Service (Commenced April 14, 2014) | | -2.13% | | -1.13% | | -1.10% |
Advisor (Commenced April 14, 2014) | | -2.32% | | -1.29% | | -1.25% |
8
GOLDMAN SACHS VARIABLE INSURANCE TRUST STRATEGIC INCOME FUND
Schedule of Investments
December 31, 2017
| | | | | | | | |
Shares | | | Description | | Value | |
| | Common Stock – 0.3% | |
| | Energy – 0.3% | |
| | 5,866 | | | Blue Ridge Mountain Resources, Inc.* | | $ | 48,394 | |
| | (Cost $58,500) | | | | |
| | |
| | | | | | | | | | | | |
Principal
Amount | | | Interest
Rate | | Maturity
Date | | | Value | |
| | Corporate Bonds – 7.8% | |
| | Consumer Services(a) – 0.4% | |
| | MGM Resorts International | |
| $ | 50,000 | | | 8.625% | | | 02/01/2019 | | | $ | 53,000 | |
| | |
| | Electric(a) – 0.3% | |
| | Dynegy, Inc. | |
| | 38,000 | | | 6.750 | | | 11/01/2019 | | | | 39,140 | |
| | |
| | Energy – 2.8% | |
| | Carrizo Oil & Gas, Inc.(a) | |
| | 38,000 | | | 7.500 | | | 09/15/2020 | | | | 38,760 | |
| | Petrobras Global Finance BV | |
| | 50,000 | | | 7.375 | | | 01/17/2027 | | | | 55,000 | |
| | 35,000 | | | 5.999(c) | | | 01/27/2028 | | | | 35,087 | |
| | Petroleos de Venezuela SA(b) | |
| | 890,000 | | | 6.000 | | | 10/28/2022 | | | | 162,425 | |
| | Plains All American Pipeline LP(a) | |
| | 50,000 | | | 3.600 | | | 11/01/2024 | | | | 48,693 | |
| | Targa Resources Partners LP(a) | |
| | 25,000 | | | 4.125 | | | 11/15/2019 | | | | 25,219 | |
| | Whiting Petroleum Corp.(a) | |
| | 50,000 | | | 5.000 | | | 03/15/2019 | | | | 51,275 | |
| | | | | | | | | | | | |
| | | | | | | | | | | 416,459 | |
| | |
| | Healthcare(a)(c) – 0.4% | |
| | Valeant Pharmaceuticals International, Inc. | |
| | 50,000 | | | 6.500 | | | 03/15/2022 | | | | 52,500 | |
| | |
| | Materials – 0.3% | |
| | Freeport-McMoRan, Inc. | |
| | 50,000 | | | 2.375 | | | 03/15/2018 | | | | 50,000 | |
| | |
| | Noncaptive-Financial – 1.0% | |
| | CURO Financial Technologies Corp.(a)(c) | |
| | 50,000 | | | 12.000 | | | 03/01/2022 | | | | 55,000 | |
| | Nationstar Mortgage LLC(a) | |
| | 50,000 | | | 6.500 | | | 08/01/2018 | | | | 50,000 | |
| | Park Aerospace Holdings Ltd.(c) | |
| | 50,000 | | | 5.250 | | | 08/15/2022 | | | | 49,551 | |
| | | | | | | | | | | | |
| | | | | | | | | | | 154,551 | |
| | |
| | Pipelines(a) – 0.7% | |
| | DCP Midstream Operating LP | |
| | 25,000 | | | 2.700 | | | 04/01/2019 | | | | 24,906 | |
| | Enterprise Products Operating LLC Series A(d) | |
| | 75,000 | | | (3 Mo. LIBOR
+ 3.71%), 5.084 | | | 08/01/2066 | | | | 75,000 | |
| | | | | | | | | | | | |
| | | | | | | | | | | 99,906 | |
| | |
| | Corporate Bonds – (continued) | |
| | Wireless Telecommunications – 1.9% | |
| | Frontier Communications Corp. | |
| $ | 25,000 | | | 8.125% | | | 10/01/2018 | | | $ | 24,812 | |
| | Intelsat Jackson Holdings SA(a) | |
| | 50,000 | | | 7.500 | | | 04/01/2021 | | | | 45,500 | |
| | Sprint Communications, Inc. | |
| | 50,000 | | | 9.000(c) | | | 11/15/2018 | | | | 52,630 | |
| | 50,000 | | | 7.000 | | | 08/15/2020 | | | | 53,000 | |
| | Telecom Italia Capital SA(a) | |
| | 50,000 | | | 7.721 | | | 06/04/2038 | | | | 64,312 | |
| | Windstream Services LLC(a)(c) | |
| | 49,000 | | | 8.625 | | | 10/31/2025 | | | | 47,163 | |
| | | | | | | | | | | | |
| | | | | | | | | | | 287,417 | |
| | |
| | TOTAL CORPORATE BONDS | | | | | |
| | (Cost $1,269,013) | | | $ | 1,152,973 | |
| | |
| | |
| | Mortgage-Backed Security – 0.9% | |
| | FNMA | |
| $ | 113,438 | | | 6.000% | | | 09/01/2036 | | | $ | 128,248 | |
| | (Cost $126,994) | | | | | |
| | |
| | |
| | Collateralized Mortgage Obligations – 13.3% | |
| | Adjustable Rate Non-Agency(a)(d) – 4.3% | |
| | Alternative Loan Trust Series 2005-51, Class 2A1 | |
| $ | 40,047 | | | 1.801% | | | 11/20/2035 | | | $ | 37,368 | |
| | Alternative Loan Trust Series 2006-HY11, Class A1 | |
| | 43,458 | | | 1.672 | | | 06/25/2036 | | | | 39,972 | |
| | Alternative Loan Trust Series 2006-OA6, Class 1A2 | |
| | 259,902 | | | 1.762 | | | 07/25/2046 | | | | 243,614 | |
| | HomeBanc Mortgage Trust Series 2006-1, Class 3A2 | |
| | 103,720 | | | 3.275 | | | 04/25/2037 | | | | 89,838 | |
| IndyMac INDA Mortgage Loan Trust
Series 2006-AR2, Class 1A1 |
|
| | 38,795 | | | 3.622 | | | 09/25/2036 | | | | 35,861 | |
| | Lehman XS Trust Series 2005-7N, Class 1A1A | |
| | 39,210 | | | 1.822 | | | 12/25/2035 | | | | 38,220 | |
| | Lehman XS Trust Series 2006-14N, Class 1A1A | |
| | 138,836 | | | 1.742 | | | 09/25/2046 | | | | 125,793 | |
| | | | | | | | | | | | |
| | | | | | | | | | | 610,666 | |
| | |
| | Interest Only(e) – 4.8% | |
| | FHLMC REMIC Series 4314, Class SE(a) | |
| | 836,508 | | | 4.573 | | | 03/15/2044 | | | | 137,399 | |
| | FHLMC REMIC Series 4583, Class ST(a) | |
| | 791,003 | | | 4.523 | | | 05/15/2046 | | | | 142,957 | |
| | FNMA REMIC Series 2011-124, Class SC | |
| | 368,771 | | | 4.998 | | | 12/25/2041 | | | | 62,076 | |
| | FNMA REMIC Series 2013-130, Class SN | |
| | 613,325 | | | 5.098 | | | 10/25/2042 | | | | 105,344 | |
| | GNMA REMIC Series 2010-101, Class S(a) | |
| | 557,750 | | | 4.499 | | | 08/20/2040 | | | | 85,760 | |
| | |
| | |
| The accompanying notes are an integral part of these financial statements. | | 9 |
GOLDMAN SACHS VARIABLE INSURANCE TRUST STRATEGIC INCOME FUND
Schedule of Investments (continued)
December 31, 2017
| | | | | | | | | | | | |
Principal
Amount | | | Interest
Rate | | Maturity
Date | | | Value | |
| | Collateralized Mortgage Obligations – (continued) | |
| | Interest Only(e) – (continued) | |
| | GNMA REMIC Series 2010-31, Class SA(a) | |
| $ | 96,878 | | | 4.249% | | | 03/20/2040 | | | $ | 13,827 | |
| | GNMA REMIC Series 2013-152, Class SG(a) | |
| | 79,544 | | | 4.649 | | | 06/20/2043 | | | | 12,484 | |
| | GNMA REMIC Series 2013-181, Class SA(a) | |
| | 337,136 | | | 4.599 | | | 11/20/2043 | | | | 53,285 | |
| | GNMA REMIC Series 2015-110, Class MS(a) | |
| | 354,153 | | | 4.209 | | | 08/20/2045 | | | | 48,556 | |
| | GNMA REMIC Series 2015-159, Class HS(a) | |
| | 261,193 | | | 4.699 | | | 11/20/2045 | | | | 40,889 | |
| | | | | | | | | | | | |
| | | | | | | | | | | 702,577 | |
| | |
| | Regular Floater(d) – 4.2% | |
| | Alternative Loan Trust Series 2005-36, Class 2A1A(a) | |
| | 56,249 | | | 1.862 | | | 08/25/2035 | | | | 48,777 | |
| Banc of America Alternative Loan Trust
Series 2005-4, Class CB1(a) |
|
| | 161,195 | | | 1.952 | | | 05/25/2035 | | | | 137,719 | |
| Mortgage Repurchase Agreement Financing Trust
Series 2017-1, Class A1(a)(c) |
|
| | 150,000 | | | 2.282 | | | 07/10/2019 | | | | 150,011 | |
| Mortgage Repurchase Agreement Financing Trust
Series 2017-2, Class A1(c) |
|
| | 300,000 | | | 1.779 | | | 08/12/2019 | | | | 300,000 | |
| | | | | | | | | | | | |
| | | | | | | | | | | 636,507 | |
| | |
| | TOTAL COLLATERALIZED MORTGAGE OBLIGATIONS | |
| | (Cost $1,914,650) | | | $ | 1,949,750 | |
| | |
| | | | | | | | | | | | |
| | Asset-Backed Securities – 36.7% | |
| | Airlines(a) – 0.3% | |
| | Continental Airlines Pass-Through Trust Series 2012-3, Class C | |
| $ | 50,000 | | | 6.125% | | | 04/29/2018 | | | $ | 50,434 | |
| | |
| | Collateralized Loan Obligations(c)(d) – 17.7% | |
| | Anchorage Capital CLO 4 Ltd. Series 2014-4A, Class A1AR(a) | |
| | 250,000 | | | 2.518 | | | 07/28/2026 | | | | 250,588 | |
| | Apidos CLO X Series 2012-10A, Class A(a) | |
| | 109,184 | | | 2.798 | | | 10/30/2022 | | | | 109,291 | |
| | Crown Point CLO III Ltd. Series 2015-3A, Class A1AR(a) | |
| | 200,000 | | | 2.269 | | | 12/31/2027 | | | | 199,804 | |
| | Halcyon Loan Advisors Funding Ltd. Series 2015-2A, Class A(a) | |
| | 250,000 | | | 2.757 | | | 07/25/2027 | | | | 250,159 | |
| | OCP CLO Ltd. Series 2015-8A, Class A1R(a) | |
| | 250,000 | | | 2.203 | | | 04/17/2027 | | | | 250,006 | |
| | OCP CLO Ltd. Series 2016-12A, Class A1(a) | |
| | 150,000 | | | 2.924 | | | 10/18/2028 | | | | 151,099 | |
| Octagon Investment Partners 24 Ltd. Series 2015-1A,
Class A1R(a) |
|
| | 250,000 | | | 2.341 | | | 05/21/2027 | | | | 250,613 | |
| | OFSI Fund VI Ltd. Series 2014-6A, Class A1(a) | |
| | 200,000 | | | 2.389 | | | 03/20/2025 | | | | 199,921 | |
| | Regatta IV Funding Ltd. Series 2014-1A, Class A1R(a) | |
| | 250,000 | | | 2.387 | | | 07/25/2026 | | | | 250,490 | |
| | |
| | Asset-Backed Securities – (continued) | |
| | Collateralized Loan Obligations(c)(d) – (continued) | |
| | Trinitas CLO II Ltd. Series 2014-2A, Class A1R(a) | |
| $ | 200,000 | | | 2.539% | | | 07/15/2026 | | | $ | 200,393 | |
| | Trinitas CLO III Ltd. Series 2015-3A, Class A2(a) | |
| | 150,000 | | | 2.869 | | | 07/15/2027 | | | | 150,146 | |
| | Voya CLO Ltd. Series 2014-4A, Class A1R | |
| | 250,000 | | | 2.309 | | | 10/14/2026 | | | | 250,496 | |
| | Wasatch Ltd. Series 2006-1A, Class A1B | |
| | 90,493 | | | 1.653 | | | 11/14/2022 | | | | 90,454 | |
| | | | | | | | | | | | |
| | | | | | | | | | | 2,603,460 | |
| | |
| | Home Equity(a) – 2.2% | |
| Credit-Based Asset Servicing & Securitization LLC
Series 2005-CB8, Class AF2(f) |
|
| | 3,177 | | | 3.834 | | | 12/25/2035 | | | | 3,194 | |
| Credit-Based Asset Servicing & Securitization LLC
Series 2005-CB8, Class AF3(f) |
|
| | 25,000 | | | 3.834 | | | 12/25/2035 | | | | 25,334 | |
| | Lehman XS Trust Series 2007-3, Class 1BA2(d) | |
| | 34,811 | | | 2.161 | | | 03/25/2037 | | | | 30,643 | |
| Morgan Stanley Mortgage Loan Trust
Series 2006-16AX, Class 1A(d) |
|
| | 136,622 | | | 1.722 | | | 11/25/2036 | | | | 54,880 | |
| | Saxon Asset Securities Trust Series 2007-2, Class A2C(d) | |
| | 75,226 | | | 1.792 | | | 05/25/2047 | | | | 60,610 | |
| Structured Asset Securities Corp. Mortgage Loan Trust
Series 2005-NC2, Class M4(d) |
|
| | 100,000 | | | 2.022 | | | 05/25/2035 | | | | 100,477 | |
| | VOLT XXV LLC Series 2015-NPL8, Class A1(c)(f) | |
| | 40,591 | | | 3.500 | | | 06/26/2045 | | | | 40,592 | |
| | | | | | | | | | | | |
| | | | | | | | | | | 315,730 | |
| | |
| | Student Loans(a)(d) – 16.5% | |
| | Academic Loan Funding Trust Series 2012-1A, Class A2(c) | |
| | 150,000 | | | 2.428 | | | 12/27/2044 | | | | 149,822 | |
| | Access Group, Inc. Series 2015-1, Class A(c) | |
| | 60,356 | | | 2.252 | | | 07/25/2056 | | | | 60,429 | |
| | ECMC Group Student Loan Trust Series 2016-1A, Class A(c) | |
| | 112,647 | | | 2.902 | | | 07/26/2066 | | | | 113,688 | |
| | EFS Volunteer No. 2 LLC Series 2012-1, Class A2(c) | |
| | 250,000 | | | 2.902 | | | 03/25/2036 | | | | 256,752 | |
| Montana Higher Education Student Assistance Corp.
Series 2012-1, Class A3 |
|
| | 100,000 | | | 2.333 | | | 07/20/2043 | | | | 101,494 | |
| | Navient Student Loan Trust Series 2016-5A, Class A(c) | |
| | 251,135 | | | 2.802 | | | 06/25/2065 | | | | 257,157 | |
| | Navient Student Loan Trust Series 2016-7A, Class A(c) | |
| | 132,543 | | | 2.702 | | | 03/25/2066 | | | | 135,620 | |
| | Navient Student Loan Trust Series 2017-5A, Class A(c) | |
| | 242,758 | | | 2.352 | | | 07/26/2066 | | | | 243,595 | |
| | Nelnet Student Loan Trust Series 2006-1, Class A6(c) | |
| | 150,000 | | | 1.904 | | | 08/23/2036 | | | | 146,540 | |
| | Northstar Education Finance, Inc. Series 2007-1, Class A1 | |
| | 85,492 | | | 1.478 | | | 04/28/2030 | | | | 85,006 | |
| | PHEAA Student Loan Trust Series 2016-1A, Class A(c) | |
| | 156,463 | | | 2.702 | | | 09/25/2065 | | | | 158,854 | |
| | |
| | |
| 10 | | The accompanying notes are an integral part of these financial statements. |
GOLDMAN SACHS VARIABLE INSURANCE TRUST STRATEGIC INCOME FUND
| | | | | | | | | | | | |
Principal
Amount | | | Interest
Rate | | Maturity
Date | | | Value | |
| | Asset-Backed Securities – (continued) | |
| | Student Loans(a)(d) – (continued) | |
| | Scholar Funding Trust Series 2010-A, Class A(c) | |
| $ | 44,553 | | | 2.128% | | | 10/28/2041 | | | $ | 44,229 | |
| | SLM Student Loan Trust Series 2003-14, Class A5 | |
| | 12,113 | | | 1.597 | | | 01/25/2023 | | | | 12,117 | |
| | SLM Student Loan Trust Series 2003-7A, Class A5A(c) | |
| | 139,774 | | | 2.788 | | | 12/15/2033 | | | | 139,772 | |
| | SLM Student Loan Trust Series 2005-5, Class A5 | |
| | 100,000 | | | 2.117 | | | 10/25/2040 | | | | 99,360 | |
| | SLM Student Loan Trust Series 2008-3, Class A3 | |
| | 66,888 | | | 2.367 | | | 10/25/2021 | | | | 66,873 | |
| | SLM Student Loan Trust Series 2008-6, Class A4 | |
| | 100,000 | | | 2.467 | | | 07/25/2023 | | | | 101,254 | |
| | SLM Student Loan Trust Series 2012-3, Class A | |
| | 110,325 | | | 1.978 | | | 12/27/2038 | | | | 110,948 | |
| | SunTrust Student Loan Trust Series 2006-1A, Class A4(c) | |
| | 154,915 | | | 1.568 | | | 10/28/2037 | | | | 146,170 | |
| | | | | | | | | | | | |
| | | | | | | | | | | 2,429,680 | |
| | |
| | TOTAL ASSET-BACKED SECURITIES | | | | | |
| | (Cost $5,329,755) | | | $ | 5,399,304 | |
| | |
| | | | | | | | | | | | |
| | Foreign Government Securities – 8.8% | |
| | Argentina Government International Bond | |
| EUR | 210,000 | | | 3.375% | | | 01/15/2023 | | | $ | 256,998 | |
| $ | 200,000 | | | 7.125(c) | | | 06/28/2117 | | | | 206,550 | |
| | Brazilian Government International Bond | |
| BRL | 202,000 | | | 0.000(g) | | | 10/01/2019 | | | | 53,410 | |
| | 32,000 | | | 10.000 | | | 01/01/2027 | | | | 9,536 | |
| | Dominican Republic International Bond | |
| $ | 100,000 | | | 5.500 | | | 01/27/2025 | | | | 105,625 | |
| | Ecuador Government International Bond | |
| | 200,000 | | | 9.650 | | | 12/13/2026 | | | | 229,687 | |
| | Indonesia Government International Note(c) | |
| | 200,000 | | | 3.850 | | | 07/18/2027 | | | | 205,250 | |
| | Mexico Government International Bond | |
| MXN | 223,400 | | | 7.750 | | | 11/23/2034 | | | | 11,354 | |
| | 207,100 | | | 8.500 | | | 11/18/2038 | | | | 11,280 | |
| | 8,200 | | | 8.000 | | | 11/07/2047 | | | | 426 | |
| | Republic of South Africa | |
| ZAR | 250,000 | | | 8.000 | | | 01/31/2030 | | | | 18,426 | |
| | 660,000 | | | 7.000 | | | 02/28/2031 | | | | 44,254 | |
| | 60,000 | | | 8.250 | | | 03/31/2032 | | | | 4,421 | |
| | 230,000 | | | 8.875 | | | 02/28/2035 | | | | 17,491 | |
| | 440,000 | | | 6.250 | | | 03/31/2036 | | | | 25,573 | |
| | 640,000 | | | 9.000 | | | 01/31/2040 | | | | 48,107 | |
| | 150,000 | | | 6.500 | | | 02/28/2041 | | | | 8,538 | |
| | 600,000 | | | 8.750 | | | 01/31/2044 | | | | 43,627 | |
| | |
| | TOTAL FOREIGN GOVERNMENT SECURITIES | |
| | (Cost $1,196,597) | | | $ | 1,300,553 | |
| | |
| | | | | | | | | | | | |
| | Municipal Bonds – 1.2% | |
| | Illinois – 0.4% | |
| | Illinois State GO Bonds for Build America Bonds Series 2010-5 | |
| $ | 25,000 | | | 7.350% | | | 07/01/2035 | | | $ | 28,904 | |
| | Illinois State GO Bonds Pension Funding Series 2003 | |
| | 35,000 | | | 5.100 | | | 06/01/2033 | | | | 34,942 | |
| | | | | | | | | | | | |
| | | | | | | | | | | 63,846 | |
| | |
| | Puerto Rico(a) – 0.8% | |
| Puerto Rico Commonwealth Aqueduct & Sewer Authority RB
Senior Lien Series 2012 A |
|
| | 10,000 | | | 5.500 | | | 07/01/2028 | | | | 6,162 | |
| | 5,000 | | | 5.000 | | | 07/01/2033 | | | | 3,081 | |
| | 5,000 | | | 5.125 | | | 07/01/2037 | | | | 3,081 | |
| | 10,000 | | | 5.750 | | | 07/01/2037 | | | | 6,163 | |
| | Puerto Rico Commonwealth GO Bonds Series 2014 A(b) | |
| | 100,000 | | | 8.000 | | | 07/01/2035 | | | | 23,750 | |
| Puerto Rico Commonwealth GO Refunding for Public
Improvement Series 2008 A(b) |
|
| | 20,000 | | | 5.500 | | | 07/01/2032 | | | | 4,500 | |
| Puerto Rico Sales Tax Financing Corp. RB First
Subseries 2009 A(b) |
|
| | 15,000 | | | 5.500 | | | 08/01/2028 | | | | 1,463 | |
| | 25,000 | | | 6.000 | | | 08/01/2042 | | | | 2,437 | |
| Puerto Rico Sales Tax Financing Corp. RB First
Subseries 2010 A(b) |
|
| | 15,000 | | | 5.500 | | | 08/01/2037 | | | | 1,462 | |
| | 155,000 | | | 5.375 | | | 08/01/2039 | | | | 15,113 | |
| | 85,000 | | | 5.500 | | | 08/01/2042 | | | | 8,288 | |
| Puerto Rico Sales Tax Financing Corp. RB First
Subseries 2010 C(b) |
|
| | 10,000 | | | 5.375 | | | 08/01/2038 | | | | 975 | |
| | 55,000 | | | 6.000 | | | 08/01/2039 | | | | 5,362 | |
| | 105,000 | | | 5.250 | | | 08/01/2041 | | | | 10,238 | |
| Puerto Rico Sales Tax Financing Corp. RB First
Subseries 2011 A-1(b) |
|
| | 170,000 | | | 5.000 | | | 08/01/2043 | | | | 16,575 | |
| Puerto Rico Sales Tax Financing Corp. RB for Capital
Appreciation First Subseries 2009 A(b) |
|
| | 15,000 | | | 6.750 | | | 08/01/2032 | | | | 1,463 | |
| | | | | | | | | | | | |
| | | | | | | | | | | 110,113 | |
| | |
| | TOTAL MUNICIPAL BONDS | | | | | |
| | (Cost $536,654) | | | $ | 173,959 | |
| | |
| | | | | | | | | | | | |
| | Loan Participations(a)(b)(d)(h) – 1.0% | |
| | Energy – 0.3% | |
| | American Energy—Marcellus, LLC (i) | |
| $ | 23,614 | | | (1 Mo. LIBOR
+ 4.25%), 5.710% | | | 08/04/2020 | | | $ | 17,435 | |
| | Murray Energy Corp. | |
| | 24,801 | | | (3 Mo. LIBOR
+ 7.25%), 8.943 | | | 04/16/2020 | | | | 21,763 | |
| | | | | | | | | | | | |
| | | | | | | | | | | 39,198 | |
| | |
| | |
| The accompanying notes are an integral part of these financial statements. | | 11 |
GOLDMAN SACHS VARIABLE INSURANCE TRUST STRATEGIC INCOME FUND
Schedule of Investments (continued)
December 31, 2017
| | | | | | | | | | | | |
Principal
Amount | | | Interest
Rate | | Maturity
Date | | | Value | |
| | Loan Participations(a)(b)(d)(h) – (continued) | |
| | Media – 0.4% | |
| | Charter Communications Operating LLC | |
| $ | 49,740 | | | (6 Mo. LIBOR
+ 2.00%), 3.570% | | | 01/03/2021 | | | $ | 49,772 | |
| | Checkout Holding Corp. | |
| | 25,000 | | | (1 Mo. LIBOR
+ 6.75%), 8.319 | | | 04/11/2022 | | | | 10,378 | |
| | | | | | | | | | | | |
| | | | | | | | | | | 60,150 | |
| | |
| | Noncaptive-Financial – 0.2% | |
| | Avolon | | | | | | | | | | | |
| | 24,875 | | | (1 Mo. LIBOR
+ 2.25%), 3.751 | | | 03/21/2022 | | | | 24,675 | |
| | |
| | Wireless Telecommunications – 0.1% | |
| | Windstream Corp. | |
| | 22,340 | | | 1 Mo. LIBOR +
4.00%), 5.500 | | | 03/29/2021 | | | | 20,920 | |
| | |
| | TOTAL LOAN PARTICIPATIONS | | | | | |
| | (Cost $164,882) | | | $ | 144,943 | |
| | |
| | | | | | | | | | | | |
| | U.S. Treasury Obligations – 14.0% | |
| | U.S. Treasury Bonds | |
| $ | 250,000 | | | 3.000% | | | 05/15/2045 | | | $ | 262,600 | |
| | 130,000 | | | 2.875 | | | 08/15/2045 | | | | 133,364 | |
| | U.S. Treasury Inflation Linked Bonds (TIPS) | |
| | 30,655 | | | 0.875 | | | 02/15/2047 | | | | 31,891 | |
| | U.S. Treasury Inflation Linked Notes (TIPS) | |
| | 102,904 | | | 0.125 | | | 07/15/2026 | | | | 100,596 | |
| | 100,836 | | | 0.375 | | | 07/15/2027 | | | | 100,350 | |
| | U.S. Treasury Notes | |
| | 1,350,000 | | | 2.125 | | | 07/31/2024 | | | | 1,334,219 | |
| | 100,000 | | | 2.375 | | | 08/15/2024 | | | | 100,337 | |
| | |
| | TOTAL U.S. TREASURY OBLIGATIONS | | | | | |
| | (Cost $2,071,338) | | | $ | 2,063,357 | |
| | |
| | | | | | | | |
| Shares | | | Distribution
Rate | | Value | |
| | Investment Company(j) – 3.8% | |
| Goldman Sachs Financial Square Government Fund –
Institutional Shares |
|
| | 562,373 | | | 1.228% | | $ | 562,373 | |
| | (Cost $562,373) | |
| | |
| | | | | | | | | | | | | | |
| Shares | | | Interest
Rate | | | Maturity
Date | | | Value | |
| | Short-Term Investment(g) – 2.7% | | | | | |
| | U.S. Treasury Obligation – 2.7% | | | | | |
| | U.S. Treasury Bill | | | | | |
| | 400,000 | | | | 0.000% | | | | 05/24/2018 | | | $ | 397,712 | |
| | (Cost $397,787) | | | | | | | | | | | | | |
| | |
| | TOTAL INVESTMENTS – 90.5% | | | | | |
| | (Cost $13,628,543) | | | $ | 13,321,566 | |
| | |
| OTHER ASSETS IN EXCESS OF
LIABILITIES – 9.5% |
| | | 1,392,025 | |
| | |
| | NET ASSETS – 100.0% | | | $ | 14,713,591 | |
| | |
| | |
| The percentage shown for each investment category reflects the value of investments in that category as a percentage of net assets. |
| * | | Non-income producing security. |
| (a) | | Securities with “Call” features. Maturity dates disclosed are the final maturity dates. |
| (b) | | Security is currently in default. |
| (c) | | Exempt from registration under Rule 144A of the Securities Act of 1933. Under procedures approved by the Board of Trustees, such securities may be deemed liquid by the Investment Adviser and may be resold, normally to qualified institutional buyers in transactions exempt from registration. Total market value of Rule 144A securities amounts to $5,650,422, which represents approximately 38.4% of net assets as of December 31, 2017. The liquidity determination is unaudited. |
| (d) | | Variable rate security. Except for floating rate notes (for which final maturity is disclosed), maturity date disclosed is the next interest reset date. Interest rate disclosed is that which is in effect on December 31, 2017. |
| (e) | | Inverse floating rate security. Interest rate disclosed is that which is in effect on December 31, 2017. |
| (f) | | Step Bond. Coupon rate is fixed for an initial period then it resets at a specified date and rate. |
| (g) | | Issued with a zero coupon. Income is recognized through the accretion of discount. |
| (h) | | Bank Loans often require prepayments from excess cash flows or permit the borrower to repay at its election. The degree to which borrowers repay, whether as a contractual requirement or at their election, cannot be predicted with accuracy. As a result, the actual remaining maturity may be substantially less than the stated maturities shown. The stated interest rate represents the weighted average interest rate of all contracts within the loan facility on December 31, 2017. Bank Loans typically have rates of interest which are predetermined either daily, monthly, quarterly or semi-annually by reference to a base lending rate, plus a premium. These base lending rates are primarily the London Interbank Offered Rate (“LIBOR”) and secondarily the prime rate offered by one or more major United States banks (the “Prime Rate”) and the certificate of deposit (“CD”) rate or other base lending rates used by commercial lenders. |
| (i) | | Significant unobservable inputs were used in the valuation of this portfolio security; i.e. Level 3. |
| (j) | | Represents an Affiliated Issuer. |
| | |
| 12 | | The accompanying notes are an integral part of these financial statements. |
GOLDMAN SACHS VARIABLE INSURANCE TRUST STRATEGIC INCOME FUND
| | |
| Investment Abbreviations: |
| BA | | —Banker Acceptance Rate |
| BBR | | —Bank Bill Reference Rate |
| CDI | | —Average One-Day Interbank Deposit |
| EURIBOR | | —Euro Interbank Offered Rate |
| FHLMC | | —Federal Home Loan Mortgage Corp. |
| FNMA | | —Federal National Mortgage Association |
| GNMA | | —Government National Mortgage Association |
| GO | | —General Obligation |
| HICPXT | | —Harmonised Index of Consumer Prices excluding Tobacco |
| LIBOR | | —London Interbank Offered Rate |
| Mo. | | —Month |
| NIBOR | | —Norwegian Interbank Offered Rate |
| RB | | —Revenue Bond |
| REMIC | | —Real Estate Mortgage Investment Conduit |
| STIBOR | | —Stockholm Interbank Offered Rate |
| TIIE | | —Interbank Equilibrium Interest Rate |
| TIPS | | —Treasury Inflation-Protected Securities |
| UK-RPI | | —United Kingdom Retail Price Index |
| WIBOR | | —Warsaw Interbank Offered Rate |
|
| Currency Abbreviations: |
| ARS | | —Argentina peso |
| AUD | | —Australian Dollar |
| BRL | | —Brazilian Real |
| CAD | | —Canadian Dollar |
| CHF | | —Swiss Franc |
| CLP | | —Chilean Peso |
| CNH | | —Chinese Renminbi |
| CZK | | —Czech Koruna |
| EUR | | —Euro |
| GBP | | —British Pound |
| HKD | | —Hong Kong Dollar |
| HUF | | —Hungarian Forint |
| IDR | | —Indonesian Rupiah |
| INR | | —Indian Rupee |
| JPY | | —Japanese Yen |
| KRW | | —South Korean Won |
| MXN | | —Mexican Peso |
| NOK | | —Norwegian Krone |
| NZD | | —New Zealand Dollar |
| PEN | | —Peru nuevo sol |
| PHP | | —Philippines peso |
| PLN | | —Polish Zloty |
| RUB | | —Russian Ruble |
| SEK | | —Swedish Krona |
| SGD | | —Singapore Dollar |
| THB | | —Thailand Baht |
| TRY | | —Turkish Lira |
| TWD | | —Taiwan Dollar |
| USD | | —United States Dollar |
| ZAR | | —South African Rand |
| | |
| The accompanying notes are an integral part of these financial statements. | | 13 |
GOLDMAN SACHS VARIABLE INSURANCE TRUST STRATEGIC INCOME FUND
Schedule of Investments (continued)
December 31, 2017
ADDITIONAL INVESTMENT INFORMATION
FORWARD FOREIGN CURRENCY EXCHANGE CONTRACTS — At December 31, 2017, the Fund had the following forward foreign currency exchange contracts:
FORWARD FOREIGN CURRENCY EXCHANGE CONTRACTS WITH UNREALIZED GAIN
| | | | | | | | | | | | | | | | | | | | |
| Counterparty | | Currency
Purchased | | | Currency Sold | | | Current
Value | | | Settlement
Date | | | Unrealized
Gain | |
Morgan Stanley Co., Inc. | | ARS | 337,997 | | | USD | 17,994 | | | $ | 18,147 | | | | 01/02/2018 | | | $ | 154 | |
| | ARS | 570,065 | | | USD | 30,000 | | | | 30,075 | | | | 02/02/2018 | | | | 75 | |
| | AUD | 198,000 | | | NZD | 217,724 | | | | 154,466 | | | | 03/21/2018 | | | | 315 | |
| | AUD | 680,472 | | | USD | 521,333 | | | | 530,939 | | | | 01/16/2018 | | | | 9,606 | |
| | AUD | 578,492 | | | USD | 438,917 | | | | 451,301 | | | | 03/21/2018 | | | | 12,385 | |
| | BRL | 468,609 | | | USD | 139,892 | | | | 140,749 | | | | 02/02/2018 | | | | 857 | |
| | CAD | 713,407 | | | USD | 559,935 | | | | 567,699 | | | | 01/17/2018 | | | | 7,764 | |
| | CAD | 882,855 | | | USD | 689,683 | | | | 703,063 | | | | 03/21/2018 | | | | 13,381 | |
| | CHF | 315,269 | | | EUR | 269,409 | | | | 325,348 | | | | 03/21/2018 | | | | 589 | |
| | CHF | 14,049 | | | USD | 14,291 | | | | 14,498 | | | | 03/21/2018 | | | | 208 | |
| | CLP | 22,677,515 | | | USD | 35,000 | | | | 36,850 | | | | 01/04/2018 | | | | 1,850 | |
| | CLP | 89,520,312 | | | USD | 137,535 | | | | 145,466 | | | | 01/05/2018 | | | | 7,931 | |
| | CLP | 68,571,277 | | | USD | 104,918 | | | | 111,425 | | | | 01/11/2018 | | | | 6,507 | |
| | CLP | 59,446,936 | | | USD | 91,204 | | | | 96,599 | | | | 01/16/2018 | | | | 5,394 | |
| | CLP | 22,677,515 | | | USD | 36,777 | | | | 36,850 | | | | 01/22/2018 | | | | 73 | |
| | CLP | 30,372,000 | | | USD | 46,511 | | | | 49,340 | | | | 02/22/2018 | | | | 2,828 | |
| | CNH | 1,380,988 | | | USD | 207,656 | | | | 211,109 | | | | 03/21/2018 | | | | 3,454 | |
| | CZK | 5,859,083 | | | EUR | 219,685 | | | | 275,154 | | | | 01/03/2018 | | | | 11,564 | |
| | CZK | 5,859,083 | | | EUR | 228,424 | | | | 276,209 | | | | 03/21/2018 | | | | 855 | |
| | EUR | 237,428 | | | CHF | 276,094 | | | | 286,208 | | | | 03/21/2018 | | | | 1,288 | |
| | EUR | 518,306 | | | GBP | 456,660 | | | | 624,792 | | | | 03/21/2018 | | | | 6,647 | |
| | EUR | 92,433 | | | JPY | 12,361,122 | | | | 111,432 | | | | 03/22/2018 | | | | 1,284 | |
| | EUR | 89,384 | | | NOK | 880,295 | | | | 107,748 | | | | 03/21/2018 | | | | 301 | |
| | EUR | 24,999 | | | SEK | 245,900 | | | | 30,136 | | | | 03/21/2018 | | | | 17 | |
| | EUR | 550,683 | | | USD | 657,809 | | | | 663,821 | | | | 03/21/2018 | | | | 6,013 | |
| | GBP | 433,064 | | | USD | 583,405 | | | | 586,205 | | | | 03/21/2018 | | | | 2,800 | |
| | HKD | 3,299,190 | | | USD | 422,648 | | | | 422,925 | | | | 03/21/2018 | | | | 277 | |
| | HUF | 202,230,055 | | | EUR | 648,753 | | | | 783,896 | | | | 03/21/2018 | | | | 1,857 | |
| | IDR | 2,986,851,528 | | | USD | 219,812 | | | | 220,711 | | | | 01/11/2018 | | | | 898 | |
| | IDR | 3,660,648,642 | | | USD | 268,016 | | | | 270,485 | | | | 01/12/2018 | | | | 2,469 | |
| | IDR | 4,248,913,000 | | | USD | 312,589 | | | | 313,871 | | | | 01/16/2018 | | | | 1,283 | |
| | IDR | 319,211,757 | | | USD | 23,442 | | | | 23,576 | | | | 01/19/2018 | | | | 134 | |
| | IDR | 800,453,000 | | | USD | 59,000 | | | | 59,065 | | | | 02/02/2018 | | | | 65 | |
| | IDR | 5,210,874,372 | | | USD | 380,972 | | | | 384,052 | | | | 02/20/2018 | | | | 3,079 | |
| | INR | 11,843,283 | | | USD | 183,400 | | | | 185,546 | | | | 01/08/2018 | | | | 2,147 | |
| | INR | 7,374,200 | | | USD | 111,272 | | | | 115,504 | | | | 01/12/2018 | | | | 4,233 | |
| | INR | 13,551,932 | | | USD | 207,725 | | | | 211,977 | | | | 01/25/2018 | | | | 4,252 | |
| | INR | 37,716,558 | | | USD | 577,771 | | | | 589,460 | | | | 02/02/2018 | | | | 11,688 | |
| | INR | 13,391,991 | | | USD | 205,406 | | | | 209,015 | | | | 02/15/2018 | | | | 3,611 | |
| | INR | 2,462,455 | | | USD | 38,252 | | | | 38,389 | | | | 02/26/2018 | | | | 137 | |
| | |
| 14 | | The accompanying notes are an integral part of these financial statements. |
GOLDMAN SACHS VARIABLE INSURANCE TRUST STRATEGIC INCOME FUND
ADDITIONAL INVESTMENT INFORMATION (continued)
FORWARD FOREIGN CURRENCY EXCHANGE CONTRACTS WITH UNREALIZED GAIN (continued)
| | | | | | | | | | | | | | | | | | | | |
| Counterparty | | Currency
Purchased | | | Currency
Sold | | | Current
Value | | | Settlement
Date | | | Unrealized
Gain | |
Morgan Stanley Co., Inc. (continued) | | JPY | 18,418,346 | | | USD | 162,575 | | | $ | 163,539 | | | | 01/12/2018 | | | $ | 964 | |
| | JPY | 95,631,474 | | | USD | 848,811 | | | | 852,152 | | | | 03/22/2018 | | | | 3,341 | |
| | KRW | 176,416,927 | | | USD | 162,006 | | | | 165,336 | | | | 01/16/2018 | | | | 3,330 | |
| | NOK | 2,127,611 | | | EUR | 214,706 | | | | 259,689 | | | | 03/21/2018 | | | | 873 | |
| | NZD | 1,723,953 | | | USD | 1,189,518 | | | | 1,220,583 | | | | 03/21/2018 | | | | 31,064 | |
| | PHP | 2,815,697 | | | USD | 56,180 | | | | 56,404 | | | | 01/03/2018 | | | | 225 | |
| | PHP | 761,550 | | | USD | 15,000 | | | | 15,255 | | | | 01/05/2018 | | | | 255 | |
| | PHP | 2,289,793 | | | USD | 45,092 | | | | 45,862 | | | | 01/08/2018 | | | | 770 | |
| | PHP | 5,887,492 | | | USD | 114,176 | | | | 117,882 | | | | 01/26/2018 | | | | 3,706 | |
| | PHP | 224,245 | | | USD | 4,428 | | | | 4,486 | | | | 02/22/2018 | | | | 58 | |
| | PHP | 5,887,492 | | | USD | 116,700 | | | | 117,613 | | | | 03/22/2018 | | | | 914 | |
| | PLN | 3,810,577 | | | EUR | 900,440 | | | | 1,094,995 | | | | 03/21/2018 | | | | 9,561 | |
| | RUB | 45,500,930 | | | USD | 767,175 | | | | 783,426 | | | | 02/12/2018 | | | | 16,252 | |
| | SEK | 24,240,109 | | | EUR | 2,440,077 | | | | 2,968,957 | | | | 03/21/2018 | | | | 27,567 | |
| | THB | 1,585,080 | | | USD | 48,000 | | | | 48,661 | | | | 01/19/2018 | | | | 661 | |
| | TRY | 990,706 | | | USD | 241,491 | | | | 255,489 | | | | 03/21/2018 | | | | 13,998 | |
| | TWD | 1,749,280 | | | USD | 58,512 | | | | 58,782 | | | | 01/02/2018 | | | | 270 | |
| | TWD | 4,412,299 | | | USD | 146,788 | | | | 149,214 | | | | 01/23/2018 | | | | 2,425 | |
| | TWD | 7,492,350 | | | USD | 251,000 | | | | 253,452 | | | | 01/26/2018 | | | | 2,452 | |
| | TWD | 4,085,580 | | | USD | 137,068 | | | | 138,742 | | | | 03/08/2018 | | | | 1,674 | |
| | USD | 18,290 | | | ARS | 337,997 | | | | 18,148 | | | | 01/02/2018 | | | | 142 | |
| | USD | 32,514 | | | AUD | 41,629 | | | | 32,477 | | | | 03/21/2018 | | | | 37 | |
| | USD | 135,732 | | | BRL | 449,100 | | | | 135,388 | | | | 01/03/2018 | | | | 343 | |
| | USD | 359,806 | | | BRL | 1,178,238 | | | | 353,890 | | | | 02/02/2018 | | | | 5,916 | |
| | USD | 29,997 | | | CAD | 37,578 | | | | 29,926 | | | | 03/21/2018 | | | | 71 | |
| | USD | 145,585 | | | CLP | 89,520,312 | | | | 145,467 | | | | 01/05/2018 | | | | 118 | |
| | USD | 59,981 | | | CLP | 36,876,421 | | | | 59,923 | | | | 01/22/2018 | | | | 59 | |
| | USD | 29,992 | | | CLP | 18,439,655 | | | | 29,962 | | | | 02/05/2018 | | | | 30 | |
| | USD | 24,136 | | | EUR | 20,010 | | | | 24,121 | | | | 03/21/2018 | | | | 15 | |
| | USD | 44,102 | | | GBP | 32,551 | | | | 44,063 | | | | 03/21/2018 | | | | 39 | |
| | USD | 855,191 | | | HKD | 6,626,502 | | | | 849,549 | | | | 03/27/2018 | | | | 5,642 | |
| | USD | 197,000 | | | HKD | 1,526,257 | | | | 195,831 | | | | 05/11/2018 | | | | 1,169 | |
| | USD | 239,000 | | | HKD | 1,853,804 | | | | 238,352 | | | | 09/19/2018 | | | | 648 | |
| | USD | 970,630 | | | JPY | 108,319,669 | | | | 965,216 | | | | 03/22/2018 | | | | 5,414 | |
| | USD | 31,167 | | | MXN | 581,990 | | | | 29,461 | | | | 01/26/2018 | | | | 1,706 | |
| | USD | 423,151 | | | MXN | 8,210,239 | | | | 411,803 | | | | 03/21/2018 | | | | 11,349 | |
| | USD | 89,434 | | | NZD | 126,005 | | | | 89,214 | | | | 03/21/2018 | | | | 221 | |
| | USD | 11,994 | | | TWD | 354,049 | | | | 11,986 | | | | 02/02/2018 | | | | 8 | |
| | ZAR | 3,198,153 | | | USD | 228,759 | | | | 257,856 | | | | 01/18/2018 | | | | 29,097 | |
| | | ZAR | 6,756,827 | | | USD | 493,894 | | | | 539,809 | | | | 03/22/2018 | | | | 45,914 | |
| TOTAL | | | | | | | | | | | | | | | | | | $ | 368,568 | |
| | |
| The accompanying notes are an integral part of these financial statements. | | 15 |
GOLDMAN SACHS VARIABLE INSURANCE TRUST STRATEGIC INCOME FUND
Schedule of Investments (continued)
December 31, 2017
ADDITIONAL INVESTMENT INFORMATION (continued)
FORWARD FOREIGN CURRENCY EXCHANGE CONTRACTS WITH UNREALIZED LOSS
| | | | | | | | | | | | | | | | | | | | |
| Counterparty | | Currency
Purchased | | | Currency
Sold | | | Current
Value | | | Settlement
Date | | | Unrealized
Loss | |
Morgan Stanley Co., Inc. | | ARS | 337,997 | | | USD | 19,044 | | | $ | 18,147 | | | | 01/02/2018 | | | $ | (896 | ) |
| | ARS | 1,707,957 | | | USD | 93,269 | | | | 91,437 | | | | 01/08/2018 | | | | (1,834 | ) |
| | ARS | 1,490,616 | | | USD | 81,448 | | | | 79,151 | | | | 01/22/2018 | | | | (2,297 | ) |
| | ARS | 457,496 | | | USD | 25,174 | | | | 24,193 | | | | 01/29/2018 | | | | (981 | ) |
| | ARS | 631,817 | | | USD | 33,912 | | | | 33,372 | | | | 01/31/2018 | | | | (540 | ) |
| | ARS | 1,043,816 | | | USD | 55,988 | | | | 55,101 | | | | 02/01/2018 | | | | (888 | ) |
| | ARS | 1,231,116 | | | USD | 65,800 | | | | 64,721 | | | | 02/09/2018 | | | | (1,079 | ) |
| | ARS | 4,184,947 | | | USD | 223,602 | | | | 219,341 | | | | 02/15/2018 | | | | (4,259 | ) |
| | ARS | 1,470,935 | | | USD | 78,934 | | | | 76,900 | | | | 02/20/2018 | | | | (2,034 | ) |
| | ARS | 774,067 | | | USD | 41,273 | | | | 40,447 | | | | 02/21/2018 | | | | (825 | ) |
| | ARS | 1,620,667 | | | USD | 87,154 | | | | 84,427 | | | | 02/27/2018 | | | | (2,728 | ) |
| | ARS | 764,223 | | | USD | 41,702 | | | | 39,791 | | | | 02/28/2018 | | | | (1,910 | ) |
| | ARS | 1,848,283 | | | USD | 100,368 | | | | 95,564 | | | | 03/14/2018 | | | | (4,804 | ) |
| | ARS | 765,295 | | | USD | 40,445 | | | | 39,549 | | | | 03/15/2018 | | | | (896 | ) |
| | ARS | 529,718 | | | USD | 28,248 | | | | 27,280 | | | | 03/22/2018 | | | | (969 | ) |
| | ARS | 318,921 | | | USD | 16,839 | | | | 16,383 | | | | 03/27/2018 | | | | (455 | ) |
| | BRL | 676,614 | | | USD | 204,564 | | | | 203,978 | | | | 01/03/2018 | | | | (587 | ) |
| | BRL | 3,469,300 | | | USD | 1,068,901 | | | | 1,042,019 | | | | 02/02/2018 | | | | (26,882 | ) |
| | CHF | 169,046 | | | EUR | 144,865 | | | | 174,450 | | | | 03/21/2018 | | | | (178 | ) |
| | CLP | 89,520,312 | | | USD | 145,618 | | | | 145,467 | | | | 01/22/2018 | | | | (151 | ) |
| | CZK | 5,829,197 | | | EUR | 229,100 | | | | 274,801 | | | | 03/21/2018 | | | | (1,368 | ) |
| | EUR | 355,960 | | | CHF | 416,507 | | | | 429,093 | | | | 03/21/2018 | | | | (731 | ) |
| | EUR | 228,424 | | | CZK | 5,859,083 | | | | 274,075 | | | | 01/03/2018 | | | | (1,078 | ) |
| | EUR | 278,361 | | | HUF | 86,869,730 | | | | 335,550 | | | | 03/21/2018 | | | | (1,180 | ) |
| | EUR | 295,452 | | | NOK | 2,934,705 | | | | 356,152 | | | | 03/21/2018 | | | | (2,048 | ) |
| | EUR | 29,000 | | | NZD | 50,121 | | | | 34,958 | | | | 03/21/2018 | | | | (528 | ) |
| | EUR | 216,871 | | | PLN | 915,531 | | | | 261,427 | | | | 03/21/2018 | | | | (1,658 | ) |
| | EUR | 483,255 | | | SEK | 4,793,359 | | | | 582,540 | | | | 03/21/2018 | | | | (4,557 | ) |
| | GBP | 172,652 | | | EUR | 195,526 | | | | 233,704 | | | | 03/21/2018 | | | | (1,992 | ) |
| | GBP | 27,777 | | | USD | 37,650 | | | | 37,599 | | | | 03/21/2018 | | | | (51 | ) |
| | HKD | 1,495,142 | | | USD | 192,000 | | | | 191,684 | | | | 03/27/2018 | | | | (316 | ) |
| | JPY | 11,270,560 | | | EUR | 83,932 | | | | 100,430 | | | | 03/22/2018 | | | | (754 | ) |
| | JPY | 56,419,059 | | | USD | 504,832 | | | | 502,740 | | | | 03/22/2018 | | | | (2,092 | ) |
| | MXN | 7,534,130 | | | USD | 392,835 | | | | 377,890 | | | | 03/21/2018 | | | | (14,946 | ) |
| | NOK | 14,654,140 | | | EUR | 1,492,780 | | | | 1,788,637 | | | | 03/21/2018 | | | | (10,835 | ) |
| | NOK | 150,268 | | | SEK | 151,120 | | | | 18,341 | | | | 03/21/2018 | | | | (168 | ) |
| | PEN | 617,507 | | | USD | 190,577 | | | | 190,325 | | | | 01/16/2018 | | | | (252 | ) |
| | PHP | 1,407,848 | | | USD | 28,168 | | | | 28,163 | | | | 02/22/2018 | | | | (6 | ) |
| | USD | 17,994 | | | ARS | 337,997 | | | | 18,148 | | | | 01/02/2018 | | | | (154 | ) |
| | USD | 508,570 | | | AUD | 663,844 | | | | 517,965 | | | | 01/16/2018 | | | | (9,395 | ) |
| | USD | 502,762 | | | AUD | 656,931 | | | | 512,494 | | | | 03/21/2018 | | | | (9,732 | ) |
| | USD | 68,352 | | | BRL | 227,514 | | | | 68,588 | | | | 01/03/2018 | | | | (236 | ) |
| | USD | 341,959 | | | BRL | 1,139,307 | | | | 342,195 | | | | 02/02/2018 | | | | (236 | ) |
| | |
| 16 | | The accompanying notes are an integral part of these financial statements. |
GOLDMAN SACHS VARIABLE INSURANCE TRUST STRATEGIC INCOME FUND
ADDITIONAL INVESTMENT INFORMATION (continued)
FORWARD FOREIGN CURRENCY EXCHANGE CONTRACTS WITH UNREALIZED LOSS (continued)
| | | | | | | | | | | | | | | | | | | | |
| Counterparty | | Currency
Purchased | | | Currency
Sold | | | Current
Value | | | Settlement
Date | | | Unrealized
Loss | |
Morgan Stanley Co., Inc. (continued) | | USD | 594,615 | | | CAD | 757,524 | | | $ | 602,807 | | | | 01/17/2018 | | | $ | (8,192 | ) |
| | USD | 627,537 | | | CAD | 797,625 | | | | 635,190 | | | | 03/21/2018 | | | | (7,653 | ) |
| | USD | 153,688 | | | CHF | 150,681 | | | | 155,498 | | | | 03/21/2018 | | | | (1,810 | ) |
| | USD | 36,766 | | | CLP | 22,677,515 | | | | 36,850 | | | | 01/04/2018 | | | | (84 | ) |
| | USD | 101,258 | | | CLP | 64,556,129 | | | | 104,901 | | | | 01/16/2018 | | | | (3,643 | ) |
| | USD | 145,897 | | | CLP | 90,670,418 | | | | 147,336 | | | | 01/22/2018 | | | | (1,439 | ) |
| | USD | 103,760 | | | CNH | 691,071 | | | | 105,642 | | | | 03/21/2018 | | | | (1,882 | ) |
| | USD | 10,446 | | | EUR | 8,740 | | | | 10,486 | | | | 01/03/2018 | | | | (40 | ) |
| | USD | 249,094 | | | EUR | 208,746 | | | | 250,906 | | | | 01/31/2018 | | | | (1,812 | ) |
| | USD | 806,329 | | | EUR | 678,668 | | | | 818,102 | | | | 03/21/2018 | | | | (11,773 | ) |
| | USD | 120,357 | | | GBP | 89,231 | | | | 120,784 | | | | 03/21/2018 | | | | (428 | ) |
| | USD | 404,602 | | | IDR | 5,508,656,230 | | | | 405,999 | | | | 02/20/2018 | | | | (1,397 | ) |
| | USD | 221,088 | | | INR | 14,261,279 | | | | 223,428 | | | | 01/08/2018 | | | | (2,340 | ) |
| | USD | 50,119 | | | INR | 3,247,717 | | | | 50,757 | | | | 02/02/2018 | | | | (638 | ) |
| | USD | 15,477 | | | INR | 1,003,821 | | | | 15,667 | | | | 02/15/2018 | | | | (190 | ) |
| | USD | 143,299 | | | INR | 9,226,306 | | | | 143,835 | | | | 02/26/2018 | | | | (536 | ) |
| | USD | 160,963 | | | JPY | 18,234,928 | | | | 161,910 | | | | 01/12/2018 | | | | (947 | ) |
| | USD | 1,665,214 | | | JPY | 187,869,304 | | | | 1,674,067 | | | | 03/22/2018 | | | | (8,853 | ) |
| | USD | 198,671 | | | KRW | 216,839,820 | | | | 203,219 | | | | 01/16/2018 | | | | (4,548 | ) |
| | USD | 35,001 | | | KRW | 37,927,105 | | | | 35,547 | | | | 01/22/2018 | | | | (546 | ) |
| | USD | 485,984 | | | NZD | 697,795 | | | | 494,051 | | | | 03/21/2018 | | | | (8,066 | ) |
| | USD | 54,993 | | | PEN | 181,420 | | | | 55,916 | | | | 01/16/2018 | | | | (923 | ) |
| | USD | 13,404 | | | PEN | 44,069 | | | | 13,581 | | | | 01/19/2018 | | | | (177 | ) |
| | USD | 28,185 | | | PHP | 1,407,848 | | | | 28,202 | | | | 01/03/2018 | | | | (17 | ) |
| | USD | 117,048 | | | PHP | 5,887,492 | | | | 117,883 | | | | 01/26/2018 | | | | (835 | ) |
| | USD | 95,907 | | | PHP | 4,937,525 | | | | 98,821 | | | | 02/09/2018 | | | | (2,914 | ) |
| | USD | 69,583 | | | PHP | 3,543,166 | | | | 70,878 | | | | 02/22/2018 | | | | (1,295 | ) |
| | USD | 323,370 | | | RUB | 18,981,353 | | | | 326,816 | | | | 02/12/2018 | | | | (3,446 | ) |
| | USD | 153,381 | | | SGD | 205,948 | | | | 154,169 | | | | 03/21/2018 | | | | (788 | ) |
| | USD | 244,090 | | | TRY | 972,162 | | | | 250,705 | | | | 03/21/2018 | | | | (6,616 | ) |
| | USD | 58,486 | | | TWD | 1,749,280 | | | | 58,783 | | | | 01/02/2018 | | | | (297 | ) |
| | USD | 645,503 | | | TWD | 19,376,816 | | | | 655,277 | | | | 01/23/2018 | | | | (9,774 | ) |
| | USD | 75,038 | | | TWD | 2,224,507 | | | | 75,305 | | | | 02/02/2018 | | | | (267 | ) |
| | USD | 375,985 | | | TWD | 11,307,756 | | | | 383,002 | | | | 02/08/2018 | | | | (7,017 | ) |
| | USD | 531,052 | | | TWD | 15,958,630 | | | | 541,216 | | | | 02/22/2018 | | | | (10,164 | ) |
| | USD | 248,657 | | | TWD | 7,425,026 | | | | 252,147 | | | | 03/08/2018 | | | | (3,490 | ) |
| | USD | 399,764 | | | ZAR | 5,790,817 | | | | 466,894 | | | | 01/18/2018 | | | | (67,130 | ) |
| | | USD | 213,883 | | | ZAR | 2,886,200 | | | | 230,580 | | | | 03/22/2018 | | | | (16,696 | ) |
| TOTAL | | | | | | | | | | | | | | | | | | $ | (318,169 | ) |
| | |
| The accompanying notes are an integral part of these financial statements. | | 17 |
GOLDMAN SACHS VARIABLE INSURANCE TRUST STRATEGIC INCOME FUND
Schedule of Investments (continued)
December 31, 2017
ADDITIONAL INVESTMENT INFORMATION (continued)
FUTURES CONTRACTS — At December 31, 2017, the Fund had the following futures contracts:
| | | | | | | | | | | | | | | | |
| Description | | Number of Contracts | | | Expiration
Date | | | Notional Amount | | | Unrealized Appreciation/ (Depreciation) | |
Long position contracts: | |
U.S. Treasury 10 Year Note | | | 21 | | | | 03/20/2018 | | | $ | 2,604,984 | | | $ | 6,512 | |
Short position contracts: | | | | | | | | | | | | | | | | |
| U.S. Treasury 10 Year Ultra Note | | | (1 | ) | | | 03/20/2018 | | | | (133,563 | ) | | | 729 | |
| U.S. Treasury 2 Year Note | | | (12 | ) | | | 03/29/2018 | | | | (2,569,313 | ) | | | 4,929 | |
| U.S. Treasury 5 Year Note | | | (56 | ) | | | 03/29/2018 | | | | (6,505,187 | ) | | | 32,121 | |
| U.S. Treasury Long Bond | | | (7 | ) | | | 03/20/2018 | | | | (1,071,000 | ) | | | 4,635 | |
U.S. Treasury Ultra Bond | | | (1 | ) | | | 03/20/2018 | | | | (167,656 | ) | | | 1,094 | |
| Total | | | | | | | | | | | | | | $ | 43,508 | |
| Total Futures Contracts | | | $ | 50,020 | |
SWAP CONTRACTS — At December 31, 2017, the Fund had the following swap contracts:
CENTRALLY CLEARED CREDIT DEFAULT SWAP CONTRACTS
| | | | | | | | | | | | | | | | | | | | | | | | | | | | |
Reference Obligation/Index | | Financing
Rate Received
(Paid) by the Fund | | | Credit
Spread on December 31, 2017(a) | | | Termination Date | | | Notional
Amount (000’s) | | | Value | | | Upfront Premium
(Received) Paid | | | Unrealized
Appreciation/
(Depreciation) | |
Protection Purchased(b): | | | | | |
| CDX North America High Yield Index | | | (5.000 | )% | | | 3.077 | % | | | 12/20/2022 | | | USD | 1,425 | | | $ | (119,613 | ) | | $ | (100,396 | ) | | $ | (19,217 | ) |
| CDX North America Investment Grade Index | | | (1.000 | ) | | | 0.491 | | | | 12/20/2022 | | | | 1,600 | | | | (38,586 | ) | | | (34,384 | ) | | | (4,202 | ) |
| iTraxx Europe Index | | | (1.000 | ) | | | 0.370 | | | | 06/20/2022 | | | EUR | 1,420 | | | | (48,483 | ) | | | (34,007 | ) | | | (14,476 | ) |
| Markit CDX Emerging Markets Index | | | (1.000 | ) | | | 1.051 | | | | 06/20/2022 | | | USD | 150 | | | | 270 | | | | 1,075 | | | | (805 | ) |
| Markit CDX Emerging Markets Index | | | (1.000 | ) | | | 1.194 | | | | 12/20/2022 | | | | 2,765 | | | | 23,127 | | | | 106,201 | | | | (83,074 | ) |
Protection Sold(c): | | | | | |
CDX North America Investment Grade Index | | | 1.000 | | | | 0.474 | (c) | | | 06/20/2022 | | | | 225 | | | | 5,078 | | | | 4,652 | | | | 426 | |
| TOTAL | | | | | | | | | | | | | | | | | | $ | (178,207 | ) | | $ | (56,859 | ) | | $ | (121,348 | ) |
| (a) | Credit spread on the referenced obligation, together with the period of expiration, are indicators of payment/performance risk. The likelihood of a credit event occurring which would require a fund or its counterparty to make a payment or otherwise be required to perform under the swap contract is generally greater as the credit spread and term of the swap contract increase. |
| (b) | Payments made quarterly. |
| (c) | Payments received quarterly. |
| | |
| 18 | | The accompanying notes are an integral part of these financial statements. |
GOLDMAN SACHS VARIABLE INSURANCE TRUST STRATEGIC INCOME FUND
ADDITIONAL INVESTMENT INFORMATION (continued)
OVER THE COUNTER CREDIT DEFAULT SWAP CONTRACTS
| | | | | | | | | | | | | | | | | | | | | | | | | | | | | | | | |
Reference
Obligation/Index(a) | | Financing Rate Received (Paid) by
the Fund | | | Credit Spread on
December 31,
2017(b) | | | Counterparty | | | Termination Date | | | Notional
Amount (000’s) | | | Value | | | Upfront Premium (Received)
Paid | | | Unrealized
Appreciation/
(Depreciation) | |
Protection Purchased: | | | | | |
| People’s Republic of China, 4.250%, 10/28/27 | | | (1.000 | )% | | | 0.149 | % | | | Bank of America, N.A. | | | | 06/20/2019 | | | USD | 210 | | | $ | (2,682 | ) | | $ | (393 | ) | | $ | (2,289 | ) |
| People’s Republic of China, 7.500%, 10/28/27 | | | (1.000 | ) | | | 0.266 | | | | | | | | 12/20/2020 | | | | 170 | | | | (3,674 | ) | | | 598 | | | | (4,272 | ) |
| People’s Republic of China, 7.500%, 10/28/27 | | | (1.000 | ) | | | 0.331 | | | | Barclays Bank PLC | | | | 06/20/2021 | | | | 120 | | | | (2,738 | ) | | | 579 | | | | (3,317 | ) |
| People’s Republic of China, 7.500%, 10/28/27 | | | (1.000 | ) | | | 0.331 | | | | Deutsche Bank AG | | | | 06/20/2021 | | | | 170 | | | | (3,880 | ) | | | (29 | ) | | | (3,851 | ) |
| People’s Republic of China, 7.500%, 10/28/27 | | | (1.000 | ) | | | 0.380 | | | | | | | | 12/20/2021 | | | | 50 | | | | (1,200 | ) | | | 79 | | | | (1,279 | ) |
| People’s Republic of China, 4.250%, 10/28/27 | | | (1.000 | ) | | | 0.149 | | | | JPMorgan Chase Bank NA | | | | 06/20/2019 | | | | 50 | | | | (638 | ) | | | (101 | ) | | | (537 | ) |
| People’s Republic of China, 7.500%, 10/28/27 | | | (1.000 | ) | | | 0.266 | | | | | | | | 12/20/2020 | | | | 1,220 | | | | (26,369 | ) | | | 6,498 | | | | (32,867 | ) |
| People’s Republic of China, 7.500%, 10/28/27 | | | (1.000 | ) | | | 0.331 | | | | | | | | 06/20/2021 | | | | 140 | | | | (3,194 | ) | | | 388 | | | | (3,582 | ) |
| People’s Republic of China, 7.500%, 10/28/27 | | | (1.000 | ) | | | 0.331 | | | | UBS AG | | | | 06/20/2021 | | | | 220 | | | | (5,019 | ) | | | 733 | | | | (5,752 | ) |
| TOTAL | | | | | | | | | | | | | | | | | | | | | | $ | (49,394 | ) | | $ | 8,352 | | | $ | (57,746 | ) |
| (a) | Payments made quarterly. |
| (b) | Credit spread on the referenced obligation, together with the period of expiration, are indicators of payment/performance risk. The likelihood of a credit event occurring which would require a fund or its counterparty to make a payment or otherwise be required to perform under the swap contract is generally greater as the credit spread and term of the swap contract increase. |
CENTRALLY CLEARED INTEREST RATE SWAP CONTRACTS
| | | | | | | | | | | | | | | | | | | | |
Payments Made by the Fund | | Payments Received by the Fund | | Termination Date | | Notional
Amount (000’s) | | | Value | | | Upfront Premium (Received) Paid | | | Unrealized
Appreciation/
(Depreciation) | |
| 3 Month STIBOR(a) | | 0.050% | | 06/15/2018 | | SEK | 16,750 | | | $ | 6,262 | | | $ | 4,236 | | | $ | 2,026 | |
| 3 Month STIBOR(a) | | (0.330) | | 09/15/2018 | | | 9,970 | | | | 155 | | | | 36 | | | | 119 | |
| 6 Month WIBOR(b) | | 3.048 | | 06/17/2019 | | PLN | 90 | | | | 815 | | | | 207 | | | | 608 | |
| 3.045%(c) | | 6 Month WIBOR | | 06/17/2019 | | | 90 | | | | (814 | ) | | | 0 | | | | (814 | ) |
| 3 Month STIBOR(a) | | (0.100) | | 06/29/2019 | | SEK | 15,720 | (d) | | | 1,619 | | | | (462 | ) | | | 2,081 | |
| 2.000(a) | | 3 Month BBR | | 03/21/2020 | | AUD | 1,500 | (d) | | | 1,460 | | | | (911 | ) | | | 2,371 | |
| 3 Month BA(b) | | 1.250 | | 03/21/2020 | | CAD | 2,510 | (d) | | | (34,967 | ) | | | (25,915 | ) | | | (9,052 | ) |
| 6 Month LIBOR(b) | | 0.750 | | 03/21/2020 | | GBP | 3,070 | (d) | | | (7,127 | ) | | | (13,042 | ) | | | 5,915 | |
| 2.250(b) | | 3 Month BBR | | 03/21/2020 | | NZD | 2,990 | (d) | | | 1,776 | | | | (139 | ) | | | 1,915 | |
| 3 Month LIBOR(a) | | 1.750 | | 03/21/2020 | | USD | 970 | (d) | | | (7,475 | ) | | | (6,385 | ) | | | (1,090 | ) |
| 3 Month LIBOR(a) | | 1.855 | | 08/06/2020 | | | 4,570 | (d) | | | (34,116 | ) | | | (18,221 | ) | | | (15,895 | ) |
| 3 Month LIBOR(a) | | 2.139 | | 11/20/2020 | | | 2,840 | (d) | | | (8,114 | ) | | | (2,513 | ) | | | (5,601 | ) |
| 6 Month EURIBOR(b) | | 0.350 | | 12/16/2021 | | EUR | 300 | (d) | | | (924 | ) | | | 103 | | | | (1,027 | ) |
| 0.500(c) | | 3 Month STIBOR | | 12/16/2021 | | SEK | 2,160 | (d) | | | 1,160 | | | | 272 | | | | 888 | |
| 1 Month TIIE(e) | | 6.750 | | 12/14/2022 | | MXN | 10 | | | | (24 | ) | | | (13 | ) | | | (11 | ) |
| 2.510(c) | | 6 Month WIBOR | | 12/20/2022 | | PLN | 1,660 | | | | (431 | ) | | | (46 | ) | | | (385 | ) |
| | |
| The accompanying notes are an integral part of these financial statements. | | 19 |
GOLDMAN SACHS VARIABLE INSURANCE TRUST STRATEGIC INCOME FUND
Schedule of Investments (continued)
December 31, 2017
ADDITIONAL INVESTMENT INFORMATION (continued)
CENTRALLY CLEARED INTEREST RATE SWAP CONTRACTS (continued)
| | | | | | | | | | | | | | | | | | | | | | | | |
Payments Made by the Fund | | Payments Received by the Fund | | | Termination Date | | | Notional
Amount (000’s) | | | Value | | | Upfront Premium (Received) Paid | | | Unrealized
Appreciation/
(Depreciation) | |
| 1 Month TIIE(e) | | | 7.500% | | | | 03/15/2023 | | | MXN | 5,975 | (d) | | $ | (4,882 | ) | | $ | (3,355 | ) | | $ | (1,527 | ) |
| 3 Month BA(b) | | | 1.500 | | | | 03/21/2023 | | | CAD | 510 | (d) | | | (15,225 | ) | | | (12,433 | ) | | | (2,792 | ) |
| 0.250%(c) | | | 6 Month EURIBOR | | | | 03/21/2023 | | | EUR | 1,610 | (d) | | | 11,761 | | | | 1,519 | | | | 10,242 | |
| 6 Month LIBOR(b) | | | 1.000 | | | | 03/21/2023 | | | GBP | 80 | (d) | | | (359 | ) | | | (747 | ) | | | 388 | |
| 1.500(c) | | | 6 Month NIBOR | | | | 03/21/2023 | | | NOK | 5,590 | (d) | | | 3,102 | | | | (1,236 | ) | | | 4,338 | |
| 2.550(c) | | | 6 Month WIBOR | | | | 03/21/2023 | | | PLN | 2,130 | (d) | | | 310 | | | | 796 | | | | (486 | ) |
| 3 Month STIBOR(a) | | | 0.500 | | | | 03/21/2023 | | | SEK | 1,320 | (d) | | | (601 | ) | | | 359 | | | | (960 | ) |
| 3 Month LIBOR(a) | | | 2.000 | | | | 03/21/2023 | | | USD | 150 | (d) | | | (1,961 | ) | | | (1,647 | ) | | | (314 | ) |
| 2.143(b) | | | 3 Month LIBOR | | | | 07/03/2023 | | | | 380 | (d) | | | 3,073 | | | | (631 | ) | | | 3,704 | |
| 2.275(b) | | | 3 Month LIBOR | | | | 11/20/2023 | | | | 1,230 | (d) | | | 4,386 | | | | 1,062 | | | | 3,324 | |
| 6 Month LIBOR(b) | | | 1.200 | | | | 11/21/2023 | | | GBP | 550 | (d) | | | 1,233 | | | | (315 | ) | | | 1,548 | |
| 6 Month EURIBOR(b) | | | 1.330 | | | | 01/12/2027 | | | EUR | 370 | (d) | | | 775 | | | | (3,230 | ) | | | 4,005 | |
| 6 Month LIBOR(b) | | | 1.600 | | | | 03/16/2027 | | | GBP | 1,700 | (d) | | | 13,163 | | | | (3,485 | ) | | | 16,648 | |
| 1.500(c) | | | 6 Month EURIBOR | | | | 08/31/2027 | | | EUR | 290 | (d) | | | (1,484 | ) | | | (489 | ) | | | (995 | ) |
| 3 Month LIBOR(a) | | | 2.400 | | | | 08/31/2027 | | | USD | 300 | (d) | | | (1,822 | ) | | | (369 | ) | | | (1,453 | ) |
| 6 Month EURIBOR(b) | | | 1.600 | | | | 10/25/2027 | | | EUR | 490 | (d) | | | 4,522 | | | | 1,769 | | | | 2,753 | |
| 2.000(c) | | | 3 Month STIBOR | | | | 10/25/2027 | | | SEK | 4,680 | (d) | | | (2,279 | ) | | | (1,078 | ) | | | (1,201 | ) |
| 2.000(c) | | | 3 Month STIBOR | | | | 11/02/2027 | | | | 3,000 | (d) | | | (1,393 | ) | | | (12 | ) | | | (1,381 | ) |
| 2.750(b) | | | 6 Month BBR | | | | 03/21/2028 | | | AUD | 530 | (d) | | | 3,010 | | | | 2,123 | | | | 887 | |
| 3 Month BA(b) | | | 1.750 | | | | 03/21/2028 | | | CAD | 1,320 | (d) | | | (63,609 | ) | | | (54,962 | ) | | | (8,647 | ) |
| 6 Month EURIBOR(b) | | | 1.000 | | | | 03/21/2028 | | | EUR | 940 | (d) | | | 7,820 | | | | 14,651 | | | | (6,831 | ) |
| 1.250(b) | | | 6 Month LIBOR | | | | 03/21/2028 | | | GBP | 620 | (d) | | | 3,973 | | | | 9,011 | | | | (5,038 | ) |
| 0.250(b) | | | 6 Month LIBOR | | | | 03/21/2028 | | | JPY | 32,160 | (d) | | | 2,661 | | | | 2,053 | | | | 608 | |
| 3 Month LIBOR(a) | | | 2.250 | | | | 03/21/2028 | | | USD | 270 | (d) | | | (4,058 | ) | | | (3,208 | ) | | | (850 | ) |
| 3 Month LIBOR(a) | | | 2.378 | | | | 07/03/2028 | | | | 1,420 | (d) | | | (8,412 | ) | | | 23 | | | | (8,435 | ) |
| 2.346(b) | | | 3 Month LIBOR | | | | 08/06/2028 | | | | 1,220 | (d) | | | 11,435 | | | | (1,052 | ) | | | 12,487 | |
| 1.400(b) | | | 6 Month LIBOR | | | | 11/21/2028 | | | GBP | 330 | (d) | | | (1,274 | ) | | | 801 | | | | (2,075 | ) |
| 1.940(b) | | | 6 Month LIBOR | | | | 01/11/2032 | | | | 280 | (d) | | | (4,102 | ) | | | (1,122 | ) | | | (2,980 | ) |
| 1.500(b) | | | 6 Month LIBOR | | | | 03/21/2033 | | | | 500 | (d) | | | (7,041 | ) | | | (2,011 | ) | | | (5,030 | ) |
| 1.750(b) | | | 6 Month LIBOR | | | | 03/17/2037 | | | | 1,180 | (d) | | | (10,606 | ) | | | (19 | ) | | | (10,587 | ) |
| 2.560(b) | | | 3 Month LIBOR | | | | 07/03/2048 | | | USD | 590 | (d) | | | (991 | ) | | | 21 | | | | (1,012 | ) |
| TOTAL | | | | | | | | | | | | | | $ | (139,620 | ) | | $ | (120,006 | ) | | $ | (19,614 | ) |
| (a) | Payments made quarterly. |
| (b) | Payments made semi-annually. |
| (c) | Payments made annually. |
| (d) | Represents forward starting interest rate swaps whose effective dates of commencement of accruals and cash flows occur subsequent to December 31, 2017. |
| (e) | Payments made monthly. |
OVER THE COUNTER INTEREST RATE SWAP CONTRACTS
| | | | | | | | | | | | | | | | | | | | | | | | |
Payments Made by the Fund | | Payments
Received by
the Fund | | | Counterparty | | | Termination
Date | | | Notional
Amount (000’s) | | | Value | | | Unrealized
Appreciation/
(Depreciation)(a) | |
1 Day CDI(b) | | | 11.980 | % | | | Bank of America, N.A. | | | | 01/04/2021 | | | BRL | 226 | | | $ | 7,829 | | | $ | 7,829 | |
| (a) | There are no upfront payments on the swap contracts listed above, therefore the unrealized gains (losses) on the swap contracts are equal to their value. |
| (b) | Payments made at maturity. |
| | |
| 20 | | The accompanying notes are an integral part of these financial statements. |
GOLDMAN SACHS VARIABLE INSURANCE TRUST STRATEGIC INCOME FUND
ADDITIONAL INVESTMENT INFORMATION (continued)
CENTRALLY CLEARED INFLATION-LINKED SWAP CONTRACTS OUTSTANDING:
| | | | | | | | | | | | | | | | | | | | | | | | |
Payments Made by the Fund(a) | | Payments Received by the Fund | | | Termination Date | | | Notional Amount (000’s) | | | Value | | | Upfront Premium (Received) Paid | | | Unrealized
Appreciation/
(Depreciation) | |
| 1 Month UK-RPI | | | 3.370 | % | | | 07/15/2022 | | | GBP | 330 | | | $ | 591 | | | $ | 13 | | | $ | 578 | |
1 Month HICPXT | | | 1.600 | | | | 08/15/2032 | | | EUR | 410 | | | | (9,460 | ) | | | 10 | | | | (9,470 | ) |
| TOTAL | | | | | | | | | | | | | | $ | (8,869 | ) | | $ | 23 | | | $ | (8,892 | ) |
| (a) | Payments made at the termination date. |
PURCHASED OPTIONS CONTRACTS — At December 31, 2017, the Fund had the following purchased options:
| | | | | | | | | | | | | | | | | | | | | | | | | | | | | | |
| Description | | Counterparty | | Exercise Price | | | Expiration
Date | | | Number of
Contracts | | | Notional Amount | | | Market Value | | | Premiums Paid (Received) by the Fund | | | Unrealized Appreciation/ (Depreciation) | |
Purchased option contracts: | | | | | | | | | |
Puts | | | | | | | | | |
Mid-Curve 1-Year Eurodollar | | Credit Suisse Securities LLC | | 98.00 | USD | | | | 06/15/2018 | | | USD | 4 | | | | 1,000,000 | | | $ | 3,075 | | | $ | 1,109 | | | $ | 1,966 | |
| | |
| The accompanying notes are an integral part of these financial statements. | | 21 |
GOLDMAN SACHS VARIABLE INSURANCE TRUST STRATEGIC INCOME FUND
Statement of Assets and Liabilities
December 31, 2017
| | | | |
| | | | |
| Assets: | |
Investments in unaffiliated issuers, at value (cost $13,066,170) | | $ | 12,759,193 | |
Investments in affiliated issuers, at value (cost $562,373) | | | 562,373 | |
Purchased Options, at value (premiums paid $1,109) | | | 3,075 | |
Cash | | | 273,994 | |
Foreign currencies, at value (cost $106,578) | | | 106,766 | |
Receivables: | | | | |
Collateral on certain derivative contracts(a) | | | 1,032,899 | |
Investments sold | | | 328,352 | |
Interest and dividends | | | 78,049 | |
Reimbursement from investment adviser | | | 21,029 | |
Upfront payments made on swap contracts | | | 8,875 | |
Fund shares sold | | | 2,291 | |
Unrealized gain on forward foreign currency exchange contracts | | | 368,568 | |
Unrealized gain on swap contracts | | | 7,829 | |
Other assets | | | 352 | |
| Total assets | | | 15,553,645 | |
| | | | |
| | | | |
| Liabilities: | | | |
Unrealized loss on forward foreign currency exchange contracts | | | 318,169 | |
Unrealized loss on swap contracts | | | 57,746 | |
Variation margin on futures | | | 3,857 | |
Variation margin on swaps | | | 823 | |
Payables: | | | | |
Investments purchased | | | 327,892 | |
Management fees | | | 8,268 | |
Distribution and Service fees and Transfer Agency fees | | | 3,630 | |
Fund shares redeemed | | | 2,620 | |
Upfront payments received on swap contracts | | | 523 | |
Accrued expenses | | | 116,526 | |
| Total liabilities | | | 840,054 | |
| | | | |
| | | | |
| Net Assets: | | | |
Paid-in capital | | | 17,595,380 | |
Distributions in excess of net investment income | | | (198,579 | ) |
Accumulated net realized loss | | | (2,281,534 | ) |
Net unrealized loss | | | (401,676 | ) |
| NET ASSETS | | $ | 14,713,591 | |
Net Assets: | | | | |
Institutional | | $ | 4,784,621 | |
Service | | | 9,567 | |
Advisor | | | 9,919,403 | |
Total Net Assets | | $ | 14,713,591 | |
Shares outstanding $0.001 par value (unlimited shares authorized): | | | | |
Institutional | | | 539,180 | |
Service | | | 1,079 | |
Advisor | | | 1,121,737 | |
Net asset value, offering and redemption price per share: | | | | |
Institutional | | | $8.87 | |
Service | | | 8.87 | |
Advisor | | | 8.84 | |
| (a) | Includes amounts segregated for initial margin and/or collateral on forward foreign currency exchange contract transactions, futures transactions and swaps transactions of $730,000, $49,706 and $253,193, respectively. |
| | |
| 22 | | The accompanying notes are an integral part of these financial statements. |
GOLDMAN SACHS VARIABLE INSURANCE TRUST STRATEGIC INCOME FUND
Statement of Operations
For the Fiscal Year Ended December 31, 2017
| | | | |
| | | | |
| Investment income: | |
Interest | | $ | 614,861 | |
Dividends — affiliated issuers | | | 15,840 | |
| Total investment income | | | 630,701 | |
| | | | |
| | | | |
| Expenses: | | | |
Management fees | | | 144,904 | |
Professional fees | | | 133,434 | |
Custody, accounting and administrative services | | | 77,488 | |
Distribution and Service fees(a) | | | 39,992 | |
Printing and mailing costs | | | 37,400 | |
Trustee fees | | | 17,697 | |
Transfer Agency fees(a) | | | 4,831 | |
Other | | | 3,057 | |
| Total expenses | | | 458,803 | |
Less — expense reductions | | | (212,378 | ) |
| Net expenses | | | 246,425 | |
| NET INVESTMENT INCOME | | | 384,276 | |
| | | | |
| | | | |
| Realized and unrealized gain (loss): | | | |
Net realized gain (loss) from: | | | | |
Investments — unaffiliated issuers | | | 71,894 | |
Futures contracts | | | (1,176 | ) |
Purchased options | | | 3,596 | |
Swap contracts | | | (620,928 | ) |
Forward foreign currency exchange contracts | | | 75,943 | |
Foreign currency transactions | | | 15,927 | |
Net change in unrealized gain (loss) on: | | | | |
Investments — unaffiliated issuers | | | (71,043 | ) |
Futures contracts | | | (30,422 | ) |
Purchased options | | | 1,966 | |
Swap contracts | | | (13,451 | ) |
Forward foreign currency exchange contracts | | | (274,962 | ) |
Foreign currency translation | | | (93 | ) |
| Net realized and unrealized loss | | | (842,749 | ) |
| NET DECREASE IN NET ASSETS RESULTING FROM OPERATIONS | | $ | (458,473 | ) |
(a) Class specific Distribution and Service, and Transfer Agency fees were as follows:
| | | | | | | | | | | | | | | | | | |
Distribution and
Service Fees | | | Transfer Agency Fees | |
Service | | | Advisor | | | Institutional | | | Service | | | Advisor | |
| $ | 26 | | | $ | 39,966 | | | $ | 2,830 | | | $ | 3 | | | $ | 1,998 | |
| | |
| The accompanying notes are an integral part of these financial statements. | | 23 |
GOLDMAN SACHS VARIABLE INSURANCE TRUST STRATEGIC INCOME FUND
Statements of Changes in Net Assets
| | | | | | | | |
| | | For the
Fiscal Year Ended
December 31, 2017 | | | For the
Fiscal Year Ended
December 31, 2016 | |
| | | | | | | | |
| From operations: | |
Net investment income | | $ | 384,276 | | | $ | 432,220 | |
Net realized loss | | | (454,744 | ) | | | (995,929 | ) |
Net change in unrealized gain (loss) | | | (388,005 | ) | | | 830,504 | |
| Net increase (decrease) in net assets resulting from operations | | | (458,473 | ) | | | 266,795 | |
| | | | | | | | |
| | | | | | | | |
| Distributions to shareholders: | | | | | | |
From net investment income | | | | | | | | |
Institutional Shares | | | (47,180 | ) | | | (512,567 | ) |
Service Shares | | | (14 | ) | | | (206 | ) |
Advisor Shares | | | (7,022 | ) | | | (173,760 | ) |
Return of capital | | | | | | | | |
Institutional Shares | | | (100,101 | ) | | | — | |
Service Shares | | | (69 | ) | | | — | |
Advisor Shares | | | (71,056 | ) | | | — | |
| Total distributions to shareholders | | | (225,442 | ) | | | (686,533 | ) |
| | | | | | | | |
| | | | | | | | |
| From share transactions: | | | | | | |
Proceeds from sales of shares | | | 9,019,560 | | | | 6,037,854 | |
Reinvestment of distributions | | | 225,415 | | | | 686,533 | |
Cost of shares redeemed | | | (22,118,048 | ) | | | (11,746,277 | ) |
| Net decrease in net assets resulting from share transactions | | | (12,873,073 | ) | | | (5,021,890 | ) |
| TOTAL DECREASE | | | (13,556,988 | ) | | | (5,441,628 | ) |
| | | | | | | | |
| | | | | | | | |
| Net assets: | | | | | | |
| | |
Beginning of year | | | 28,270,579 | | | | 33,712,207 | |
End of year | | $ | 14,713,591 | | | $ | 28,270,579 | |
| Distributions in excess of net investment income | | $ | (198,579 | ) | | $ | (359,829 | ) |
| | |
| 24 | | The accompanying notes are an integral part of these financial statements. |
GOLDMAN SACHS VARIABLE INSURANCE TRUST STRATEGIC INCOME FUND
Financial Highlights
Selected Data for a Share Outstanding Throughout Each Period
| | | | | | | | | | | | | | | | | | | | | | | | | | | | | | | | | | | | | | | | | | | | | | | | | | | | | | | | |
| | | | | | Income (loss) from
investment operations | | | Distributions to shareholders | | | | | | | | | | | | | | | | | | | | | | |
| Year - Share Class | | Net asset
value,
beginning
of period | | | Net
investment
income(a) | | | Net realized and unrealized loss | | | Total from
investment
operations | | | From
net
investment
income | | | From
return
of
capital | | | Total
distributions | | | Net asset
value,
end of
period | | | Total
return(b) | | | Net assets,
end of
period
(in 000s) | | | Ratio of
net expenses
to average
net assets | | | Ratio of
total
expenses
to average
net assets | | | Ratio of
net investment
income to average net assets | | | Portfolio turnover rate(c) | |
FOR THE FISCAL YEARS ENDED DECEMBER 31, | |
2017 - Institutional | | $ | 9.15 | | | $ | 0.16 | | | $ | (0.34 | ) | | $ | (0.18 | ) | | $ | (0.04 | ) | | $ | (0.06 | ) | | $ | (0.10 | ) | | $ | 8.87 | | | | (2.04 | )% | | $ | 4,785 | | | | 0.85 | % | | | 1.72 | % | | | 1.77 | % | | | 179 | % |
2017 - Service | | | 9.14 | | | | 0.13 | | | | (0.32 | ) | | | (0.19 | ) | | | (0.02 | ) | | | (0.06 | ) | | | (0.08 | ) | | | 8.87 | | | | (2.13 | ) | | | 10 | | | | 1.14 | | | | 2.03 | | | | 1.45 | | | | 179 | |
2017 - Advisor | | | 9.12 | | | | 0.12 | | | | (0.33 | ) | | | (0.21 | ) | | | (0.01 | ) | | | (0.06 | ) | | | (0.07 | ) | | | 8.84 | | | | (2.32 | ) | | | 9,919 | | | | 1.26 | | | | 2.15 | | | | 1.33 | | | | 179 | |
2016 - Institutional | | | 9.25 | | | | 0.14 | | | | (0.02 | ) | | | 0.12 | | | | (0.22 | ) | | | — | | | | (0.22 | ) | | | 9.15 | | | | 1.21 | | | | 18,892 | | | | 0.85 | | | | 1.88 | | | | 1.52 | | | | 142 | |
2016 - Service | | | 9.25 | | | | 0.11 | | | | (0.03 | ) | | | 0.08 | | | | (0.19 | ) | | | — | | | | (0.19 | ) | | | 9.14 | | | | 0.93 | | | | 10 | | | | 1.13 | | | | 2.20 | | | | 1.22 | | | | 142 | |
2016 - Advisor | | | 9.23 | | | | 0.10 | | | | (0.02 | ) | | | 0.08 | | | | (0.19 | ) | | | — | | | | (0.19 | ) | | | 9.12 | | | | 0.74 | | | | 9,368 | | | | 1.25 | | | | 2.38 | | | | 1.07 | | | | 142 | |
2015 - Institutional | | | 9.70 | | | | 0.16 | | | | (0.34 | ) | | | (0.18 | ) | | | (0.27 | ) | | | — | | | | (0.27 | ) | | | 9.25 | | | | (1.81 | ) | | | 28,036 | | | | 0.86 | | | | 1.82 | | | | 1.71 | | | | 176 | |
2015 - Service | | | 9.70 | | | | 0.14 | | | | (0.35 | ) | | | (0.21 | ) | | | (0.24 | ) | | | — | | | | (0.24 | ) | | | 9.25 | | | | (2.16 | ) | | | 10 | | | | 1.14 | | | | 2.09 | | | | 1.44 | | | | 176 | |
2015 - Advisor | | | 9.69 | | | | 0.13 | | | | (0.36 | ) | | | (0.23 | ) | | | (0.23 | ) | | | — | | | | (0.23 | ) | | | 9.23 | | | | (2.25 | ) | | | 5,666 | | | | 1.26 | | | | 2.26 | | | | 1.35 | | | | 176 | |
| | | | | | | | | | | | | | | | | | | | | | | | | | | | | | | | | | | | | | | | | | | | | | | | | | | | | | | | |
FOR THE PERIOD ENDED DECEMBER 31, | |
2014 - Institutional (Commenced April 14, 2014) | | | 10.00 | | | | 0.09 | | | | (0.14 | ) | | | (0.05 | ) | | | (0.25 | ) | | | — | | | | (0.25 | ) | | | 9.70 | | | | (0.51 | ) | | | 18,180 | | | | 0.86 | (d) | | | 2.77 | (d) | | | 1.23 | (d) | | | 157 | |
2014 - Service (Commenced April 14, 2014) | | | 10.00 | | | | 0.07 | | | | (0.14 | ) | | | (0.07 | ) | | | (0.23 | ) | | | — | | | | (0.23 | ) | | | 9.70 | | | | (0.70 | ) | | | 10 | | | | 1.13 | (d) | | | 3.05 | (d) | | | 0.96 | (d) | | | 157 | |
2014 - Advisor (Commenced April 14, 2014) | | | 10.00 | | | | 0.09 | | | | (0.17 | ) | | | (0.08 | ) | | | (0.23 | ) | | | — | | | | (0.23 | ) | | | 9.69 | | | | (0.79 | ) | | | 1,173 | | | | 1.26 | (d) | | | 2.64 | (d) | | | 1.30 | (d) | | | 157 | |
| (a) | Calculated based on the average shares outstanding methodology. |
| (b) | Assumes investment at the net asset value at the beginning of the period, reinvestment of all distributions, and a complete redemption of the investment at the net asset value at the end of the period. Total returns for periods less than one full year are not annualized. |
| (c) | The Fund’s portfolio turnover rate is calculated in accordance with regulatory requirements, without regard to transactions involving short term investments and certain derivatives. If such transactions were included, the Fund’s portfolio turnover rate may be higher. |
| | | | |
| The accompanying notes are an integral part of these financial statements. | | 25 | | |
GOLDMAN SACHS VARIABLE INSURANCE TRUST STRATEGIC INCOME FUND
Notes to Financial Statements
December 31, 2017
1. ORGANIZATION
Goldman Sachs Variable Insurance Trust (the “Trust” or “VIT”) is a Delaware statutory trust registered under the Investment Company Act of 1940, as amended (the “Act”), as an open-end management investment company. The Trust includes the Goldman Sachs Strategic Income Fund (the “Fund”). The Fund is a diversified portfolio under the Act offering three classes of shares — Institutional, Service and Advisor Shares. Shares of the Trust are offered to separate accounts of participating life insurance companies for the purpose of funding variable annuity contracts and variable life insurance policies.
Goldman Sachs Asset Management, L.P. (“GSAM”), an affiliate of Goldman Sachs & Co. LLC (formerly, Goldman, Sachs & Co.) (“Goldman Sachs”), serves as investment adviser to the Fund pursuant to a management agreement (the “Agreement”) with the Trust.
2. SIGNIFICANT ACCOUNTING POLICIES
The financial statements have been prepared in accordance with accounting principles generally accepted in the United States of America (“GAAP”) and require management to make estimates and assumptions that may affect the reported amounts and disclosures. Actual results may differ from those estimates and assumptions.
A. Investment Valuation — The Fund’s valuation policy is to value investments at fair value.
B. Investment Income and Investments — Investment income includes interest income, dividend income, and securities lending income. Interest income is accrued daily and adjusted for amortization of premiums and accretion of discounts. Dividend income is recognized on ex-dividend date or, for certain foreign securities, as soon as such information is obtained subsequent to the ex-dividend date. Investment transactions are reflected on trade date. Realized gains and losses are calculated using identified cost. Investment transactions are recorded on the following business day for daily net asset value (“NAV”) calculations.
For derivative contracts, realized gains and losses are recorded upon settlement of the contract. Upfront payments, if any, are made or received upon entering into a swap agreement and are reflected in the Statement of Assets and Liabilities. Upfront payments are recognized over the contract’s term/event as realized gains or losses, with the exception of forward starting interest rate swaps whose realized gains or losses are recognized from the effective start date. For securities with paydown provisions, principal payments received are treated as a proportionate reduction to the cost basis of the securities, and excess or shortfall amounts are recorded as income. For treasury inflation protected securities (“TIPS”), adjustments to principal due to inflation/deflation are reflected as increases/decreases to interest income with a corresponding adjustment to cost.
C. Class Allocations and Expenses — Investment income, realized and unrealized gain (loss), if any, and non-class specific expenses of the Fund are allocated daily based upon the proportion of net assets of each class. Non-class specific expenses directly incurred by the Fund are charged to the Fund, while such expenses incurred by the Trust are allocated across the Fund on a straight-line and/or pro-rata basis depending upon the nature of the expenses. Class specific expenses, where applicable, are borne by the respective share classes and include Distribution and Service and Transfer Agency fees.
D. Federal Taxes and Distributions to Shareholders — It is the Fund’s policy to comply with the requirements of the Internal Revenue Code of 1986, as amended (the “Code”), applicable to regulated investment companies (mutual funds) and to distribute each year substantially all of its investment company taxable income and capital gains to its shareholders. Accordingly, the Fund is not required to make any provisions for the payment of federal income tax. Distributions to shareholders are recorded on the ex-dividend date. Income distributions are declared and paid quarterly and capital gains distributions, if any, are declared and paid annually.
Net capital losses, if any, are carried forward to future fiscal years and may be used to the extent allowed by the Code to offset any future capital gains. Losses that are carried forward will retain their character as either short-term or long-term capital losses. Utilization of capital loss carryforwards will reduce the requirement of future capital gains distributions.
26
GOLDMAN SACHS VARIABLE INSURANCE TRUST STRATEGIC INCOME FUND
2. SIGNIFICANT ACCOUNTING POLICIES (continued)
The characterization of distributions to shareholders for financial reporting purposes is determined in accordance with federal income tax rules, which may differ from GAAP. The source of the Fund’s distributions may be shown in the accompanying financial statements as either from net investment income, net realized gain or capital. Certain components of the Fund’s net assets on the Statement of Assets and Liabilities reflect permanent GAAP/tax differences based on the appropriate tax character.
E. Foreign Currency Translation — The accounting records and reporting currency of the Fund are maintained in United States (“U.S.”) dollars. Assets and liabilities denominated in foreign currencies are translated into U.S. dollars using the current exchange rates at the close of each business day. The effect of changes in foreign currency exchange rates on investments is included within net realized and unrealized gain (loss) on investments. Changes in the value of other assets and liabilities as a result of fluctuations in foreign exchange rates are included in the Statement of Operations within net change in unrealized gain (loss) on foreign currency translation. Transactions denominated in foreign currencies are translated into U.S. dollars on the date the transaction occurred, the effects of which are included within net realized gain (loss) on foreign currency transactions.
3. INVESTMENTS AND FAIR VALUE MEASUREMENTS
U.S. GAAP defines the fair value of a financial instrument as the amount that would be received to sell an asset or paid to transfer a liability in an orderly transaction between market participants at the measurement date (i.e., the exit price); the Fund’s policy is to use the market approach. GAAP establishes a fair value hierarchy that prioritizes the inputs to valuation techniques used to measure fair value. The hierarchy gives the highest priority to unadjusted quoted prices in active markets for identical assets or liabilities (Level 1 measurements) and the lowest priority to unobservable inputs (Level 3 measurements). The levels used for classifying investments are not necessarily an indication of the risk associated with investing in these investments. The three levels of the fair value hierarchy are described below:
Level 1 — Unadjusted quoted prices in active markets that are accessible at the measurement date for identical, unrestricted assets or liabilities;
Level 2 — Quoted prices in markets that are not active or financial instruments for which significant inputs are observable (including, but not limited to, quoted prices for similar investments, interest rates, foreign exchange rates, volatility and credit spreads), either directly or indirectly;
Level 3 — Prices or valuations that require significant unobservable inputs (including GSAM’s assumptions in determining fair value measurement).
Changes in valuation techniques may result in transfers into or out of an assigned level within the hierarchy. In accordance with the Fund’s policy, transfers between different levels of the fair value hierarchy resulting from such changes are deemed to have occurred as of the beginning of the reporting period.
The Board of Trustees (“Trustees”) has approved Valuation Procedures that govern the valuation of the portfolio investments held by the Fund, including investments for which market quotations are not readily available. The Trustees have delegated to GSAM day-to-day responsibility for implementing and maintaining internal controls and procedures related to the valuation of the Fund’s investments. To assess the continuing appropriateness of pricing sources and methodologies, GSAM regularly performs price verification procedures and issues challenges as necessary to third party pricing vendors or brokers, and any differences are reviewed in accordance with the Valuation Procedures.
A. Level 1 and Level 2 Fair Value Investments — The valuation techniques and significant inputs used in determining the fair values for investments classified as Level 1 and Level 2 are as follows:
Equity Securities — Equity securities traded on a U.S. securities exchange or the NASDAQ system, or those located on certain foreign exchanges, including but not limited to the Americas, are valued daily at their last sale price or official closing price on the principal exchange or system on which they are traded. If there is no sale or official closing price or such price is believed by
27
GOLDMAN SACHS VARIABLE INSURANCE TRUST STRATEGIC INCOME FUND
Notes to Financial Statements (continued)
December 31, 2017
3. INVESTMENTS AND FAIR VALUE MEASUREMENTS (continued)
GSAM to not represent fair value, equity securities are valued at the last bid price for long positions and at the last ask price for short positions. To the extent these investments are actively traded, they are classified as Level 1 of the fair value hierarchy, otherwise they are generally classified as Level 2.
Unlisted equity securities for which market quotations are available are valued at the last sale price on the valuation date, or if no sale occurs, at the last bid price. Unlisted equities are generally classified as Level 2 (fair valued and single source broker securities may be treated differently).
Money Market Funds — Investments in the Goldman Sachs Financial Square Government Fund (“Underlying Fund”) are valued at the NAV of the Institutional Share class on the day of valuation. These investments are generally classified as Level 1 of the fair value hierarchy. For information regarding an Underlying Fund’s accounting policies and investment holdings, please see the Underlying Fund’s shareholder report.
Debt Securities — Debt securities for which market quotations are readily available are valued daily on the basis of quotations supplied by dealers or an independent pricing service approved by the Trustees. The pricing services may use valuation models or matrix pricing, which consider: (i) yield or price with respect to bonds that are considered comparable in characteristics such as rating, interest rate and maturity date or (ii) quotations from securities dealers to determine current value. With the exception of treasury securities of G8 countries, which are generally classified as Level 1, these investments are generally classified as Level 2 of the fair value hierarchy.
i. Bank Loans — Bank loans (“Loans”) are interests in amounts owed by corporate, governmental, or other borrowers to lenders or lending syndicates. Loans are arranged through private negotiations between the borrower and one or more financial institutions (“Lenders”). The Fund’s investments in Loans are in the form of either participations in Loans (“Participations”) or assignments of all or a portion of Loans from third parties (“Assignments”). With respect to Participations, the Fund has the right to receive payments of principal, interest and any fees to which it is entitled from the Lender selling the Participations and only upon receipt by the Lender of the payments from the borrower. The Fund generally has no right to enforce compliance by the borrower with the terms of the loan agreement with respect to Participations. Conversely, assignments result in the Fund having a direct contractual relationship with the borrower, and the Fund may be permitted to enforce compliance by the borrower with the terms of the loan agreement.
ii. Inverse Floaters — The interest rate on inverse floating rate securities (“inverse floaters”) resets in the opposite direction from the market rate of interest to which the inverse floaters are indexed. An inverse floater may be considered to be leveraged to the extent that its interest rate varies by a magnitude that exceeds the magnitude of the change in the index rate of interest. The higher the degree of leverage of an inverse floater, the greater the volatility of its market value.
iii. Mortgage-Backed and Asset-Backed Securities — Mortgage-backed securities represent direct or indirect participations in, or are collateralized by and payable from, mortgage loans secured by residential and/or commercial real estate property. Asset-backed securities include securities whose principal and interest payments are collateralized by pools of other assets or receivables. The value of certain mortgage-backed and asset-backed securities (including adjustable rate mortgage loans) may be particularly sensitive to changes in prevailing interest rates. The value of these securities may also fluctuate in response to the market’s perception of the creditworthiness of the issuers.
Asset-backed securities may present credit risks that are not presented by mortgage-backed securities because they generally do not have the benefit of a security interest in collateral that is comparable to mortgage assets. Some asset-backed securities may only have a subordinated claim on collateral.
Stripped mortgage-backed securities are usually structured with two different classes: one that receives substantially all interest payments (interest-only, or “IO” and/or high coupon rate with relatively low principal amount, or “IOette”), and the other that receives substantially all principal payments (principal-only, or “PO”) from a pool of mortgage loans. Little to no principal will be received at the maturity of an IO; as a result, periodic adjustments are recorded to reduce the cost of the security until maturity. These adjustments are included in interest income.
28
GOLDMAN SACHS VARIABLE INSURANCE TRUST STRATEGIC INCOME FUND
3. INVESTMENTS AND FAIR VALUE MEASUREMENTS (continued)
iv. Treasury Inflation Protected Securities — TIPS are treasury securities in which the principal amount is adjusted daily to keep pace with inflation, as measured by the U.S. Consumer Pricing Index for Urban Consumers. The repayment of the original bond principal upon maturity is guaranteed by the full faith and credit of the U.S. Government.
v. When-Issued Securities and Forward Commitments — When-issued securities, including TBA (“To Be Announced”) securities, are securities that are authorized but not yet issued in the market and purchased in order to secure what is considered to be an advantageous price or yield to the Fund. A forward commitment involves entering into a contract to purchase or sell securities, typically on an extended settlement basis, for a fixed price at a future date. The purchase of securities on a when-issued or forward commitment basis involves a risk of loss if the value of the security to be purchased declines before the settlement date. Conversely, the sale of securities on a forward commitment basis involves the risk that the value of the securities sold may increase before the settlement date. Although the Fund will generally purchase securities on a when-issued or forward commitment basis with the intention of acquiring the securities for its portfolio, the Fund may dispose of when-issued securities or forward commitments prior to settlement, which may result in a realized gain or loss.
Derivative Contracts — A derivative is an instrument whose value is derived from underlying assets, indices, reference rates or a combination of these factors. The Fund enters into derivative transactions to hedge against changes in interest rates, securities prices, and/or currency exchange rates, to increase total return, or to gain access to certain markets or attain exposure to other underliers.
Exchange-traded derivatives, including futures and options contracts, are valued at the last sale or settlement price and typically fall within Level 1 of the fair value hierarchy. Over-the-counter (“OTC”) and centrally cleared derivatives are valued using market transactions and other market evidence, including market-based inputs to models, calibration to market-clearing transactions, broker or dealer quotations, or other alternative pricing sources. Where models are used, the selection of a particular model to value OTC and centrally cleared derivatives depends upon the contractual terms of, and specific risks inherent in, the instrument, as well as the availability of pricing information in the market. Valuation models require a variety of inputs, including contractual terms, market prices, yield curves, credit curves, measures of volatility, voluntary and involuntary prepayment rates, loss severity rates and correlations of such inputs. For OTC and centrally cleared derivatives that trade in liquid markets, model inputs can generally be verified and model selection does not involve significant management judgment. OTC and centrally cleared derivatives are classified within Level 2 of the fair value hierarchy when significant inputs are corroborated by market evidence.
i. Forward Contracts — A forward contract is a contract between two parties to buy or sell an asset at a specified price on a future date. A forward contract settlement can occur on a cash or delivery basis. Forward contracts are marked-to-market daily using independent vendor prices, and the change in value, if any, is recorded as an unrealized gain or loss. Cash and certain investments may be used to collateralize forward contracts.
A forward foreign currency exchange contract is a forward contract in which the Fund agrees to receive or deliver a fixed quantity of one currency for another, at a pre-determined price at a future date. All forward foreign currency exchange contracts are marked-to-market daily at the applicable forward rate. Non-deliverable forward foreign currency exchange contracts are settled with the counterparty in cash without the delivery of foreign currency.
ii. Futures Contracts — Futures contracts are contracts to buy or sell a standardized quantity of a specified commodity or security and are valued based on exchanged settlement prices or independent market quotes. Futures contracts are valued at the last settlement price, or in the absence of a sale, the last bid price for long positions and at the last ask price for short positions, at the end of each day on the board of trade or exchange upon which they are traded. Upon entering into a futures contract, the Fund deposits cash or securities in an account on behalf of the broker in an amount sufficient to meet the initial margin requirement. Subsequent payments are made or received by the Fund equal to the daily change in the contract value and are recorded as variation margin receivable or payable with a corresponding offset to unrealized gains or losses. For financial reporting purposes, cash collateral that has been pledged to cover obligations of the Fund and cash collateral received, if, any, is reported separately on the Statement of Assets and Liabilities as receivables/payables for collateral on certain derivative contracts. Non-cash collateral pledged by the Fund, if any, is noted in the Schedule of Investments.
29
GOLDMAN SACHS VARIABLE INSURANCE TRUST STRATEGIC INCOME FUND
Notes to Financial Statements (continued)
December 31, 2017
3. INVESTMENTS AND FAIR VALUE MEASUREMENTS (continued)
iii. Options — When the Fund writes call or put options, an amount equal to the premium received is recorded as a liability and is subsequently marked-to-market to reflect the current value of the option written.
Upon the purchase of a call option or a put option by the Fund, the premium paid is recorded as an investment and subsequently marked-to-market to reflect the current value of the option. Certain options may be purchased with premiums to be determined on a future date. The premiums for these options are based upon implied volatility parameters at specified terms.
iv. Swap Contracts — Bilateral swap contracts are agreements in which the Fund and a counterparty agree to exchange periodic payments on a specified notional amount or make a net payment upon termination. Bilateral swap transactions are privately negotiated in the OTC market and payments are settled through direct payments between the Fund and the counterparty. By contrast, certain swap transactions are subject to mandatory central clearing. These swaps are executed through a derivatives clearing member (“DCM”), acting in an agency capacity, and submitted to a central counterparty (“CCP”) (“centrally cleared swaps”), in which case all payments are settled with the CCP through the DCM. Swaps are marked-to-market daily using pricing vendor quotations, counterparty or clearinghouse prices or model prices, and the change in value, if any, is recorded as an unrealized gain or loss. Upon entering into a swap contract, the Fund is required to satisfy an initial margin requirement by delivering cash or securities to the counterparty (or in some cases, segregated in a triparty account on behalf of the counterparty), which can be adjusted by any mark-to-market gains or losses pursuant to bilateral or centrally cleared arrangements. For centrally cleared swaps the daily change in valuation, if any, is recorded as a receivable or payable for variation margin.
An interest rate swap is an agreement that obligates two parties to exchange a series of cash flows at specified intervals, based upon or calculated by reference to changes in interest rates on a specified notional principal amount. The payment flows are usually netted against each other, with the difference being paid by one party to the other.
A credit default swap is an agreement that involves one party (the buyer of protection) making a stream of payments to another party (the seller of protection) in exchange for the right to receive protection on a reference security or obligation, including a group of assets or exposure to the performance of an index. The Fund’s investment in credit default swaps may involve greater risks than if the Fund had invested in the referenced obligation directly. Credit events are contract specific but may include bankruptcy, failure to pay, restructuring and obligation acceleration. If the Fund buys protection through a credit default swap and no credit event occurs, its payments are limited to the periodic payments previously made to the counterparty. Upon the occurrence of a specified credit event, the Fund, as a buyer of credit protection, is entitled to receive an amount equal to the notional amount of the swap and deliver to the seller the defaulted reference obligation in a physically settled trade. The Fund may also receive a net settlement amount in the form of cash or securities equal to the notional amount of the swap reduced by the recovery value of the reference obligation in a cash settled trade.
As a seller of protection, the Fund generally receives a payment stream throughout the term of the swap, provided that there is no credit event. In addition, if the Fund sells protection through a credit default swap, the Fund could suffer a loss because the value of the referenced obligation and the premium payments received may be less than the notional amount of the swap paid to the buyer of protection. Upon the occurrence of a specified credit event, the Fund, as a seller of credit protection, may be required to take possession of the defaulted reference obligation and pay the buyer an amount equal to the notional amount of the swap in a physically settled trade. The Fund may also pay a net settlement amount in the form of cash or securities equal to the notional amount of the swap reduced by the recovery value of the reference obligation in a cash settled trade. Recovery values are at times established through the credit event auction process in which market participants are ensured that a transparent price has been set for the defaulted security or obligation. In addition, the Fund is entitled to a return of any assets, which have been pledged as collateral to the counterparty upon settlement.
The maximum potential amount of future payments (undiscounted) that the Fund as seller of protection could be required to make under a credit default swap would be an amount equal to the notional amount of the agreement. These potential amounts would be partially offset by any recovery values of the respective referenced obligations or net amounts received
30
GOLDMAN SACHS VARIABLE INSURANCE TRUST STRATEGIC INCOME FUND
3. INVESTMENTS AND FAIR VALUE MEASUREMENTS (continued)
from a settlement of a credit default swap for the same reference security or obligation where the Fund bought credit protection.
B. Level 3 Fair Value Investments — To the extent that significant inputs to valuation models and other alternative pricing sources are unobservable, or if quotations are not readily available, or if GSAM believes that such quotations do not accurately reflect fair value, the fair value of the Fund’s investments may be determined under Valuation Procedures approved by the Trustees. GSAM, consistent with its procedures and applicable regulatory guidance, may make an adjustment to the most recent valuation prices of either domestic or foreign securities in light of significant events to reflect what it believes to be the fair value of the securities at the time of determining the Fund’s NAV. Significant events which could affect a large number of securities in a particular market may include, but are not limited to: significant fluctuations in U.S. or foreign markets; market dislocations; market disruptions; or unscheduled market closings. Significant events which could also affect a single issuer may include, but are not limited to: corporate actions such as reorganizations, mergers and buy-outs; ratings downgrades; and bankruptcies. To the extent investments are valued using single source broker quotations obtained directly from the broker or passed through from third party pricing vendors, such investments are classified as Level 3 investments.
GSAM did not develop the unobservable inputs for the valuation of Level 3 Assets and Liabilities.
C. Fair Value Hierarchy — The following is a summary of the Fund’s investments and derivatives classified in the fair value hierarchy as of December 31, 2017:
| | | | | | | | | | | | |
| | | |
| Investment Type | | Level 1 | | | Level 2 | | | Level 3 | |
| Assets | | | | | | | | |
| Common Stock and/or Other Equity Investments(a) | | | | | | | | |
North America | | $ | — | | | $ | 48,394 | | | $ | — | |
| Fixed Income | | | | | | | | |
Corporate Bonds | | | — | | | | 1,152,973 | | | | — | |
Mortgage-Backed Security | | | — | | | | 128,248 | | | | — | |
Collateralized Mortgage Obligations | | | — | | | | 1,949,750 | | | | — | |
U.S. Treasury Obligations and/or Other U.S. Government Agency Securities | | | 2,063,357 | | | | — | | | | — | |
Asset-Backed Securities | | | — | | | | 5,399,304 | | | | — | |
Foreign Government Securities | | | — | | | | 1,300,553 | | | | — | |
Municipal Bonds | | | — | | | | 173,959 | | | | — | |
Loan Participations | | | — | | | | 127,508 | | | | 17,435 | |
| Investment Company | | | 562,373 | | | | — | | | | — | |
| Short-Term Investment | | | 397,712 | | | | — | | | | — | |
| Total | | $ | 3,023,442 | | | $ | 10,280,689 | | | $ | 17,435 | |
| | |
| Derivative Type | | | | | | |
| Assets | | | | | | | | |
| Forward Foreign Currency Exchange Contracts(b) | | $ | — | | | $ | 368,568 | | | $ | — | |
| Futures Contracts(b) | | | 50,020 | | | | — | | | | — | |
| Purchased Option Contracts | | | 3,075 | | | | — | | | | — | |
| Credit Default Swaps Contracts(b) | | | — | | | | 426 | | | | — | |
| Inflation-linked Swap Contracts(b) | | | — | | | | 578 | | | | — | |
| Interest Rate Swaps Contracts(b) | | | — | | | | 84,684 | | | | — | |
| Total | | $ | 53,095 | | | $ | 454,256 | | | $ | — | |
31
GOLDMAN SACHS VARIABLE INSURANCE TRUST STRATEGIC INCOME FUND
Notes to Financial Statements (continued)
December 31, 2017
3. INVESTMENTS AND FAIR VALUE MEASUREMENTS (continued)
| | | | | | | | | | | | |
| | | |
| Derivative Type | | Level 1 | | | Level 2 | | | Level 3 | |
| Liabilities(b) | | | | | | | | |
| Forward Foreign Currency Exchange Contracts | | $ | — | | | $ | (318,169 | ) | | $ | — | |
| Credit Default Swaps Contracts | | | — | | | | (179,520 | ) | | | — | |
| Inflation-linked Swap Contracts | | | — | | | | (9,470 | ) | | | — | |
| Interest Rate Swaps Contracts | | | — | | | | (96,469 | ) | | | — | |
| Total | | $ | — | | | $ | (603,628 | ) | | $ | — | |
| (a) | Amounts are disclosed by continent to highlight the impact of time zone differences between local market close and the calculation of NAV. Security valuations are based on the principal exchange or system on which they are traded, which may differ from country of domicile noted in the table. |
| (b) | Amount shown represents unrealized gain (loss) at fiscal year end. |
For further information regarding security characteristics, see the Schedule of Investments.
4. INVESTMENTS IN DERIVATIVES
The following table sets forth, by certain risk types, the gross value of derivative contracts (not considered to be hedging instruments for accounting disclosure purposes) as of December 31, 2017. These instruments were used as part of the Fund’s investment strategies and to obtain and/or manage exposure related to the risks below. The values in the table below exclude the effects of cash collateral received or posted pursuant to these derivative contracts, and therefore are not representative of the Fund’s net exposure.
| | | | | | | | | | | | | | |
| Risk | | | | Statement of Assets and Liabilities | | Assets | | | Statement of Assets and Liabilities | | Liabilities | |
| Credit | | | | Variation margin on swaps | | $ | 426 | (a) | | Payable for unrealized loss on swap contracts and variation margin on swaps | | $ | (179,520 | )(a)(b) |
| Currency | | | | Receivable for unrealized gain on forward foreign currency exchange contracts | | | 368,568 | | | Payable for unrealized loss on forward foreign currency exchange contracts | | | (318,169 | ) |
| Interest Rate | | | | Receivable for unrealized gain on purchased option contracts at value, and variation margin on futures and swaps | | | 138,357 | (a) | | Variation margin on swaps | | | (105,939 | )(a) |
| Total | | | | | | $ | 507,351 | | | | | $ | (603,628 | ) |
| (a) | Includes unrealized gain (loss) on futures contracts and centrally cleared swap contracts described in the Additional Investment Information section of the Schedule of Investments. Only the variation margin as of December 31,2017 is reported within the Statement of Assets and Liabilities. |
| (b) | Aggregate of amounts represents the payments to be made pursuant to bilateral agreements should counterparties exercise their “right to terminate” provisions based on, among others, the Fund’s performance, its failure to pay on its obligations or failure to pledge collateral. The amounts do not include incremental charges directly associated with the close-out of the agreements. They also do not reflect the fair value of any assets pledged as collateral which, through the daily margining process, substantially offsets the aforementioned amounts and for which the Fund is entitled to a full return. |
The following table sets forth, by certain risk types, the Fund’s gains (losses) related to these derivatives and their indicative volumes for the fiscal year ended December 31, 2017. These gains (losses) should be considered in the context that these derivative contracts may have been executed to create investment opportunities and/or economically hedge certain investments, and
32
GOLDMAN SACHS VARIABLE INSURANCE TRUST STRATEGIC INCOME FUND
4. INVESTMENTS IN DERIVATIVES (continued)
accordingly, certain gains (losses) on such derivative contracts may offset certain (losses) gains attributable to investments. These gains (losses) are included in “Net realized gain (loss)” or “Net change in unrealized gain (loss)” on the Statement of Operations:
| | | | | | | | | | | | | | |
| Risk | | Statement of Operations | | Net
Realized
Gain (Loss) | | | Net Change in
Unrealized
Gain (Loss) | | | Average
Number of
Contracts(a) | |
| Credit | | Net realized gain (loss) from swap contracts/Net change in unrealized gain (loss) on swap contracts | | $ | (317,866 | ) | | $ | (123,106 | ) | | | 29 | |
| Currency | | Net realized gain (loss) from forward foreign currency exchange contracts/Net change in unrealized gain (loss) on forward foreign currency exchange contracts | | | 75,943 | | | | (274,962 | ) | | | 780 | |
| Interest Rate | | Net realized gain (loss) from purchased options, futures contracts and swap contracts/Net change in unrealized gain (loss) on purchased options, futures contracts and swaps contracts | | | (300,642 | ) | | | 81,199 | | | | 280 | |
| Total | | | | $ | (542,565 | ) | | $ | (316,869 | ) | | | 1,089 | |
| (a) | Average number of contracts is based on the average of month end balances for the fiscal yaer ended December 31, 2017. |
In order to better define its contractual rights and to secure rights that will help the Fund mitigate its counterparty risk, the Fund may enter into an International Swaps and Derivatives Association, Inc. Master Agreement (“ISDA Master Agreement”) or similar agreement with its derivatives counterparties. An ISDA Master Agreement is a bilateral agreement between the Fund and a counterparty that governs OTC derivatives (including forward foreign currency exchange contracts, and certain options and swaps), and typically contains, among other things, collateral posting terms and netting provisions in the event of a default and/or termination event. The provisions of the ISDA Master Agreement typically permit a single net payment in the event of a default (close-out netting) or similar event, including the bankruptcy or insolvency of the counterparty.
Collateral and margin requirements differ between exchange traded derivatives and OTC derivatives. Margin requirements are established by the broker or clearing house for exchange-traded and centrally cleared derivatives (financial futures contracts, options and centrally cleared swaps) pursuant to governing agreements for those instrument types. Brokers can ask for margin in excess of the minimum in certain circumstances. Collateral terms are contract-specific for OTC derivatives. For derivatives traded under an ISDA Master Agreement, the collateral requirements are typically calculated by netting the marked to market amount for each transaction under such agreement and comparing that amount to the value of any collateral currently pledged by the Fund and the counterparty. Additionally, the Fund may be required to post initial margin to the counterparty, the terms of which would be outlined in the confirmation of the OTC transaction.
For financial reporting purposes, cash collateral that has been pledged to cover obligations of the Fund and cash collateral received from the counterparty, if any, is reported separately on the Statement of Assets and Liabilities as receivables/payables for collateral on certain derivative contracts. Non-cash collateral pledged by the Fund, if any, is noted in the Schedule of Investments. Generally, the amount of collateral due from or to a counterparty must exceed a minimum transfer amount threshold before a transfer is required to be made. To the extent amounts due to the Fund from its counterparties are not fully collateralized, contractually or otherwise, the Fund bears the risk of loss from counterparty nonperformance. The Fund attempts to mitigate counterparty risk by only entering into agreements with counterparties that the Investment Adviser believes to be of good standing and by monitoring the financial stability of those counterparties.
Additionally, the netting of assets and liabilities and the offsetting of collateral pledged or received are based on contractual netting/set-off provisions in the ISDA Master Agreement or similar agreements. However, in the event of a default or insolvency of a counterparty, a court could determine that such rights are not enforceable due to the restrictions or prohibitions against the right of setoff that may be imposed in accordance with a particular jurisdiction’s bankruptcy or insolvency laws.
33
GOLDMAN SACHS VARIABLE INSURANCE TRUST STRATEGIC INCOME FUND
Notes to Financial Statements (continued)
December 31, 2017
4. INVESTMENTS IN DERIVATIVES (continued)
The following table sets forth the Fund’s net exposure for derivative instruments that are subject to enforceable master netting arrangements or similar agreements as of December 31, 2017.
| | | | | | | | | | | | | | | | | | | | | | | | | | | | |
| | | Derivative Assets (1) | | | Derivative Liabilities (1) | | | | | | | | | | |
| Counterparty | | Forwards | | | Swaps | | | Forwards | | | Swaps | | | Net Derivative
Assets (Liabilities) | | | Collateral (Received)
Pledged(1) | | | Net Amount(2) | |
| Bank of America, N.A. | | $ | — | | | $ | 7,829 | | | $ | — | | | $ | (6,561 | ) | | $ | 1,268 | | | $ | — | | | $ | 1,268 | |
| Barclays Bank PLC | | | — | | | | — | | | | — | | | | (3,317 | ) | | | (3,317 | ) | | | — | | | | (3,317 | ) |
| Deutsche Bank AG | | | — | | | | — | | | | — | | | | (5,130 | ) | | | (5,130 | ) | | | — | | | | (5,130 | ) |
| JPMorgan Chase Bank NA | | | — | | | | — | | | | — | | | | (36,986 | ) | | | (36,986 | ) | | | — | | | | (36,986 | ) |
| Morgan Stanley Co., Inc. | | | 368,568 | | | | — | | | | (318,169 | ) | | | — | | | | 50,399 | | | | 318,169 | | | | 368,568 | |
| UBS AG | | | — | | | | — | | | | — | | | | (5,752 | ) | | | (5,752 | ) | | | — | | | | (5,752 | ) |
| Total | | $ | 368,568 | | | $ | 7,829 | | | $ | (318,169 | ) | | $ | (57,746 | ) | | $ | 482 | | | $ | 318,169 | | | $ | 318,651 | |
| (1) | Gross amounts available for offset but not netted in the Statement of Assets and Liabilities. |
| (2) | Net amount represents the net amount due (to) from counterparty in the event of a default based on the contractual set-off rights under the agreement. |
5. AGREEMENTS AND AFFILIATED TRANSACTIONS
A. Management Agreement — Under the Agreement, GSAM manages the Fund, subject to the general supervision of the Trustees.
As compensation for the services rendered pursuant to the Agreement, the assumption of the expenses related thereto and administration of the Fund’s business affairs, including providing facilities, GSAM is entitled to a management fee, accrued daily and paid monthly, equal to an annual percentage rate of the Fund’s average daily net assets.
For the fiscal year ended December 31, 2017, contractual and effective net management fees with GSAM were at the following rates:
| | | | | | | | | | | | | | | | | | | | | | | | |
| Contractual Management Rate | | | | |
First $1 billion | | Next
$1 billion | | | Next
$3 billion | | | Next
$3 billion | | | Over
$8 billion | | | Effective
Rate | | | Effective Net
Management Rate^ | |
| 0.60% | | | 0.54 | % | | | 0.51 | % | | | 0.50 | % | | | 0.49 | % | | | 0.60 | % | | | 0.58 | % |
| ^ | Effective Net Management Rate includes the impact of management fee waivers of affiliated Underlying Funds, if any. |
The Fund invests in Institutional Shares of the Goldman Sachs Financial Square Government Fund, which is an affiliated Underlying Fund. GSAM has agreed to waive a portion of its management fee payable by the Fund in an amount equal to the management fee it earns as an investment adviser to the affiliated Underlying Fund in which the Fund invests. For the fiscal year ended December 31, 2017, GSAM waived $3,918 of the Fund’s management fee.
B. Distribution and/or Service (12b-1) Plans — The Trust, on behalf of Service Shares of the Fund, has adopted a Distribution and Service Plan subject to Rule 12b-1 under the Act. Under the Distribution and Service Plan, Goldman Sachs, which serves as distributor (the “Distributor”), is entitled to a fee accrued daily and paid monthly, for distribution services and personal and account maintenance services, which may then be paid by Goldman Sachs to authorized dealers, equal to, on an annual basis, 0.25% of the Fund’s average daily net assets attributable to Service Shares.
The Trust, on behalf of Advisor Shares of the Fund, has adopted a Distribution Plan subject to Rule 12b-1 under the Act. Under the Distribution Plan, Goldman Sachs as Distributor is entitled to a fee accrued daily and paid monthly for distribution services, which may then be paid by Goldman Sachs to authorized dealers, equal to, on an annual basis, 0.15% of the Fund’s average daily net assets attributable to Advisor Shares.
34
GOLDMAN SACHS VARIABLE INSURANCE TRUST STRATEGIC INCOME FUND
5. AGREEMENTS AND AFFILIATED TRANSACTIONS (continued)
C. Service Plans — The Trust, on behalf of Advisor Shares of the Fund, has adopted a Service Plan to allow Advisor Shares to compensate service organizations (including Goldman Sachs) for providing varying levels of personal and account maintenance and administration services to their customers who are beneficial owners of such shares. The Service Plan provides for compensation to the service organizations equal to 0.25% of the average daily net assets attributable to Advisor Shares of the Fund.
D. Transfer Agency Agreement — Goldman Sachs also serves as the transfer agent of the Fund for a fee pursuant to the Transfer Agency Agreement. The fees charged for such transfer agency services are accrued daily and paid monthly at an annual rate of 0.02% of the average daily net assets of Institutional, Service and Advisor Shares.
E. Other Expense Agreements and Affiliated Transactions — GSAM has agreed to limit certain “Other Expenses” of the Fund (excluding acquired fund fees and expenses, transfer agency fees and expenses, service fees and shareholder administration fees (as applicable), taxes, interest, brokerage fees, expenses of shareholder meetings, litigation and indemnification, and extraordinary expenses) to the extent such expenses exceed, on an annual basis, a percentage rate of the average daily net assets of the Fund. Such Other Expense reimbursements, if any, are accrued daily and paid monthly. In addition, the Fund is not obligated to reimburse GSAM for prior fiscal year expense reimbursements, if any. The Other Expense limitation as an annual percentage rate of average daily net assets for the Fund is 0.254%. The Other Expense limitation will remain in place through at least April 28, 2018, and prior to such date GSAM may not terminate the arrangement without the approval of the Trustees. For the fiscal year ended December 31, 2017, GSAM reimbursed $207,739 to the Fund. In addition, the Fund has entered into certain offset arrangements with the custodian and the transfer agent, which may result in a reduction of the Fund’s expenses and are received irrespective of the application of the “Other Expense” limitation described above. For the fiscal year ended December 31, 2017, custody fee credits were $721.
F. Line of Credit Facility — As of December 31, 2017, the Fund participated in a $1,100,000,000 committed, unsecured revolving line of credit facility (the “facility”) together with other funds of the Trust and certain registered investment companies having management agreements with GSAM or its affiliates. This facility is to be used for temporary emergency purposes, or to allow for an orderly liquidation of securities to meet redemption requests. The interest rate on borrowings is based on the federal funds rate. The facility also requires a fee to be paid by the Fund based on the amount of the commitment that has not been utilized. For the fiscal year ended December 31, 2017, the Fund did not have any borrowings under the facility.
G. Other Transactions with Affiliates — The following table provides information about the Fund’s investment in the Goldman Sachs Financial Square Government Fund as of and for the fiscal year ended December 31, 2017:
| | | | | | | | | | | | | | | | | | | | | | | | | | | | |
Beginning Value as of December 31, 2016 | | Purchases at Cost | | Proceeds from Sales | | Ending Value as of December 31, 2017 | | Shares as of
December 31, 2017 | | Dividend Income
from Affilaited
Investment
Company |
| | $ | 143,083 | | | | $ | 48,054,298 | | | | $ | (47,635,008 | ) | | | $ | 562,373 | | | | | 562,373 | | | | $ | 15,840 | |
As of December 31, 2017, The Goldman Sachs Group, Inc. was the beneficial owner of approximately 44% of Institutional Class Shares and 100% of the Service Class Shares of the Fund.
35
GOLDMAN SACHS VARIABLE INSURANCE TRUST STRATEGIC INCOME FUND
Notes to Financial Statements (continued)
December 31, 2017
6. PORTFOLIO SECURITIES TRANSACTIONS
The cost of purchases and proceeds from sales and maturities of long-term securities for the fiscal year ended December 31, 2017, were as follows:
| | | | | | | | | | | | | | | | | | |
Purchases of U.S. Government and Agency Obligations | | Purchases (Excluding U.S. Government and Agency Obligations) | | Sales and Maturities of U.S. Government and Agency Obligations | | Sales and Maturities (Excluding U.S. Government and Agency Obligations) |
| | $ | 25,560,917 | | | | $ | 9,213,630 | | | | $ | 30,826,474 | | | | $ | 9,343,291 | |
7. TAX INFORMATION
The tax character of distributions paid during the fiscal years ended December 31, 2016 and December 31, 2017 was as follows:
| | | | | | | | |
| | | 2016 | | | 2017 | |
| Distributions paid from ordinary income | | $ | 686,533 | | | $ | 54,216 | |
| Return of capital distribution | | | — | | | | 171,226 | |
| Total | | $ | — | | | $ | 225,442 | |
As of December 31, 2017, the components of accumulated earnings (losses) on a tax-basis were as follows:
| | | | |
| Undistributed ordinary income — net | | $ | — | |
| Capital loss carryforwards: | | | | |
Perpetual short-term | | | (1,781,348 | ) |
Perpetual long-term | | | (411,316 | ) |
| Total capital loss carryforwards | | $ | (2,192,664 | ) |
| Timing differences (Straddle Deferral, Post October Loss Deferrals and CY Swap Accrual) | | | (49,412 | ) |
| Unrealized losses — net | | | (639,713 | ) |
| Total accumulated losses — net | | $ | (2,881,789 | ) |
As of December 31, 2017, the Fund’s aggregate security unrealized gains and losses based on cost for U.S. federal income tax purposes were as follows:
| | | | |
| Tax cost | | $ | 13,866,580 | |
| Gross unrealized gain | | | 823,178 | |
| Gross unrealized loss | | | (1,462,891 | ) |
| Net unrealized loss | | $ | (639,713 | ) |
The difference between GAAP-basis and tax-basis unrealized gains (losses) is attributable primarily to wash sales, net mark to market gains (losses) on regulated futures contracts, net marked to market gains (losses) on foreign currency contracts and option contracts, and differences in the tax treatment of swap transactions.
In order to present certain components of the Fund’s capital accounts on a tax-basis, the Fund has reclassified $186,835 of undistributed net investment loss into accumulated investment gain (loss) and $(18,025) to paid-in capital. These reclassifications
36
GOLDMAN SACHS VARIABLE INSURANCE TRUST STRATEGIC INCOME FUND
7. TAX INFORMATION (continued)
have no impact on the NAV of the Fund and result primarily from net operating losses, differences in the tax treatment of swap transactions, foreign currency transactions, and paydown gains and losses.
GSAM has reviewed the Fund’s tax positions for all open tax years (the current and prior three years, as applicable) and has concluded that no provision for income tax is required in the Fund’s financial statements. Such open tax years remain subject to examination and adjustment by tax authorities.
8. OTHER RISKS
The Fund’s risks include, but are not limited to, the following:
Derivatives Risk — The Fund’s use of derivatives may result in loss. Derivative instruments, which may pose risks in addition to and greater than those associated with investing directly in securities, currencies or other instruments, may be illiquid or less liquid, volatile, difficult to price and leveraged so that small changes in the value of the underlying instruments may produce disproportionate losses to the Fund. Derivatives are also subject to counterparty risk, which is the risk that the other party in the transaction will not fulfill its contractual obligation. The use of derivatives is a highly specialized activity that involves investment techniques and risks different from those associated with investments in more traditional securities and instruments. Losses from derivatives can also result from a lack of correlation between changes in the value of derivative instruments and the portfolio assets (if any) being hedged.
Foreign and Emerging Countries Risk — Investing in foreign markets may involve special risks and considerations not typically associated with investing in the U.S. Foreign securities may be subject to risk of loss because of more or less foreign government regulation, less public information and less economic, political and social stability in the countries in which the Fund invests. The imposition of exchange controls (including repatriation restrictions), confiscations, trade restrictions (including tariffs) and other government restrictions by the U.S. or other governments, or from problems in share registration, settlement or custody, may also result in losses. Foreign risk also involves the risk of negative foreign currency rate fluctuations, which may cause the value of securities denominated in such foreign currency (or other instruments through which the Fund has exposure to foreign currencies) to decline in value. Currency exchange rates may fluctuate significantly over short periods of time. To the extent that the Fund also invests in securities of issuers located in emerging markets, these risks may be more pronounced.
Foreign Custody Risk — If the Fund invests in foreign securities, the Fund may hold such securities and cash with foreign banks, agents, and securities depositories appointed by the Fund’s custodian (each a “Foreign Custodian”). Some foreign custodians may be recently organized or new to the foreign custody business. In some countries, Foreign Custodians may be subject to little or no regulatory oversight over, or independent evaluation of, their operations. Further, the laws of certain countries may place limitations on the Fund’s ability to recover its assets if a Foreign Custodian enters bankruptcy. Investments in emerging markets may be subject to even greater custody risks than investments in more developed markets. Custody services in emerging market countries are very often undeveloped and may be considerably less well regulated than in more developed countries, and thus may not afford the same level of investor protection as would apply in developed countries.
Interest Rate Risk — When interest rates increase, fixed income securities or instruments held by the Fund will generally decline in value. Long-term fixed income securities or instruments will normally have more price volatility because of this risk than short-term fixed income securities or instruments. The risks associated with increasing rates are heightened given that interest rates are near historic lows, but may be expected to increase in the future with unpredictable effects on the markets and the Fund’s investments. Fluctuations in interest rates may also affect the liquidity of fixed income securities and instruments held by the Fund.
Investments in Other Investment Companies Risk — As a shareholder of another investment company, including an exchange-traded fund (“ETF”), the Fund will indirectly bear its proportionate share of any net management fees and other expenses paid by such other investment companies, in addition to the fees and expenses regularly borne by the Fund. ETFs are subject to risks that do not apply to conventional mutual funds, including but not limited to the following: (i) the market price of the ETF’s shares may trade at a premium or a discount to their NAV; and (ii) an active trading market for an ETF’s shares may not develop or be maintained.
37
GOLDMAN SACHS VARIABLE INSURANCE TRUST STRATEGIC INCOME FUND
Notes to Financial Statements (continued)
December 31, 2017
8. OTHER RISKS (continued)
Large Shareholder Transactions Risk — The Fund may experience adverse effects when certain large shareholders, such as other funds, participating insurance companies, accounts and Goldman Sachs affiliates, purchase or redeem large amounts of shares of the Fund. Such large shareholder redemptions may cause the Fund to sell portfolio securities at times when it would not otherwise do so, which may negatively impact the Fund’s NAV and liquidity. These transactions may also accelerate the realization of taxable income to shareholders if such sales of investments resulted in gains, and may also increase transaction costs. In addition, a large redemption could result in the Fund’s current expenses being allocated over a smaller asset base, leading to an increase in the Fund’s expense ratio. Similarly, large Fund share purchases may adversely affect the Fund’s performance to the extent that the Fund is delayed in investing new cash and is required to maintain a larger cash position than it ordinarily would.
Leverage Risk — Leverage creates exposure to potential gains and losses in excess of the initial amount invested. Borrowing and the use of derivatives may result in leverage and may make the Fund more volatile. When the Fund uses leverage, the sum of the Fund’s investment exposure may significantly exceed the amount of assets invested in the Fund, although these exposures may vary over time. Relatively small market movements may result in large changes in the value of a leveraged investment. The Fund will identify liquid assets on its books or otherwise cover transactions that may give rise to such risk, to the extent required by applicable law. The use of leverage may cause the Fund to liquidate portfolio positions to satisfy its obligations or to meet segregation requirements when it may not be advantageous to do so. The use of leverage by the Fund can substantially increase the adverse impact to which the Fund’s investment portfolio may be subject.
Liquidity Risk — The Fund may make investments that are illiquid or that may become less liquid in response to market developments or adverse investor perceptions. Illiquid investments may be more difficult to value. Liquidity risk may also refer to the risk that the Fund will not be able to pay redemption proceeds within the allowable time period because of unusual market conditions, an unusually high volume of redemption requests, or other reasons. To meet redemption requests, the Fund may be forced to sell investments at an unfavorable time and/or under unfavorable conditions. Liquidity risk may be the result of, among other things, the reduced number and capacity of traditional market participants to make a market in fixed income securities or the lack of an active market. The potential for liquidity risk may be magnified by a rising interest rate environment or other circumstances where investor redemptions from fixed income mutual funds may be higher than normal, potentially causing increased supply in the market due to selling activity.
Loan-Related Investments Risk — In addition to risks generally associated with debt investments, loan-related investments such as loan participations and assignments are subject to other risks. Although a loan obligation may be fully collateralized at the time of acquisition, the collateral may decline in value, be relatively illiquid, or lose all or substantially all of its value subsequent to investment. Many loan investments are subject to legal or contractual restrictions on resale and may be relatively illiquid and difficult to value. There is less readily available, reliable information about most loan investments than is the case for many other types of securities. Substantial increases in interest rates may cause an increase in loan obligation defaults. With respect to loan participations, the Fund may not always have direct recourse against a borrower if the borrower fails to pay scheduled principal and/or interest; may be subject to greater delays, expenses and risks than if the Fund had purchased a direct obligation of the borrower; and may be regarded as the creditor of the agent lender (rather than the borrower), subjecting the Fund to the creditworthiness of that lender as well. Investors in loans, such as the Fund, may not be entitled to rely on the anti-fraud protections of the federal securities laws, although they may be entitled to certain contractual remedies. The market for loan obligations may be subject to irregular trading activity, wide bid/ask spreads and extended trade settlement periods. Because transactions in many loans are subject to extended trade settlement periods, the Fund may not receive the proceeds from the sale of a loan for a period after the sale. As a result, sale proceeds related to the sale of loans may not be available to make additional investments or to meet the Fund’s redemption obligations for a period after the sale of the loans, and, as a result, the Fund may have to sell other investments or engage in borrowing transactions, such as borrowing from its credit facility, if necessary to raise cash to meet its obligations.
Senior Loans hold the most senior position in the capital structure of a business entity, and are typically secured with specific collateral, but are nevertheless usually rated below investment grade. Because Second Lien Loans are subordinated or unsecured and thus lower in priority of payment to Senior Loans, they are subject to the additional risk that the cash flow of the borrower and property securing the loan or debt, if any, may be insufficient to meet scheduled payments after giving effect to the senior secured obligations of the borrower. Second Lien Loans generally have greater price volatility than Senior Loans and may be less liquid.
38
GOLDMAN SACHS VARIABLE INSURANCE TRUST STRATEGIC INCOME FUND
8. OTHER RISKS (continued)
Market and Credit Risks — In the normal course of business, the Fund trades financial instruments and enters into financial transactions where risk of potential loss exists due to changes in the market (market risk). Additionally, the Fund may also be exposed to credit risk in the event that an issuer or guarantor fails to perform or that an institution or entity with which the Fund has unsettled or open transactions defaults.
9. INDEMNIFICATIONS
Under the Trust’s organizational documents, its Trustees, officers, employees and agents are indemnified, to the extent permitted by the Act and state law, against certain liabilities that may arise out of performance of their duties to the Fund. Additionally, in the course of business, the Fund enters into contracts that contain a variety of indemnification clauses. The Fund’s maximum exposure under these arrangements is unknown, as this would involve future claims that may be made against the Fund that have not yet occurred. However, GSAM believes the risk of loss under these arrangements to be remote.
10. OTHER MATTERS
At a Board Meeting held on December 13th, the Board of Trustees approved liquidation of the Goldman Sachs VIT Strategic Income Fund. The fund will liquidate on or about April 27, 2018. For additional information please refer to the prospectus supplement filed on December 22, 2017.
11. SUBSEQUENT EVENTS
Subsequent events after the Statement of Assets and Liabilities date have been evaluated, and GSAM has concluded that there is no impact requiring adjustment or disclosure in the financial statements.
12. SUMMARY OF SHARE TRANSACTIONS
Share activity is as follows:
| | | | | | | | | | | | | | | | |
| | | For the Fiscal Year Ended
December 31, 2017 | | | For the Fiscal Year Ended
December 31, 2016 | |
| | | Shares | | | Dollars | | | Shares | | | Dollars | |
| Institutional Shares | | | | | | | | | | | | | | | | |
| Shares sold | | | 588,473 | | | $ | 5,232,018 | | | | 70,360 | | | $ | 639,958 | |
| Reinvestment of distributions | | | 16,231 | | | | 147,281 | | | | 56,312 | | | | 512,567 | |
| Shares redeemed | | | (2,131,099 | ) | | | (19,118,775 | ) | | | (1,090,570 | ) | | | (9,938,886 | ) |
| | | | (1,526,395 | ) | | | (13,739,476 | ) | | | (963,898 | ) | | | (8,786,361 | ) |
| Service Shares | | | | | | | | | | | | | | | | |
| Reinvestment of distributions | | | 6 | | | | 56 | | | | 23 | | | | 206 | |
| | | | 6 | | | | 56 | | | | 23 | | | | 206 | |
| Advisor Shares | | | | | | | | | | | | | | | | |
| Shares sold | | | 418,282 | | | | 3,787,542 | | | | 592,401 | | | | 5,397,896 | |
| Reinvestment of distributions | | | 8,618 | | | | 78,078 | | | | 19,125 | | | | 173,760 | |
| Shares redeemed | | | (332,217 | ) | | | (2,999,273 | ) | | | (198,105 | ) | | | (1,807,391 | ) |
| | | | 94,683 | | | | 866,347 | | | | 413,421 | | | | 3,764,265 | |
| NET DECREASE | | | (1,431,706 | ) | | $ | (12,873,073 | ) | | | (550,454 | ) | | $ | (5,021,890 | ) |
39
Report of Independent Registered Public Accounting Firm
To the Board of Trustees of
Goldman Sachs Variable Insurance Trust and Shareholders of the Goldman Sachs Strategic Income Fund
Opinion on the Financial Statements
We have audited the accompanying statement of assets and liabilities, including the schedule of investments, of the Goldman Sachs Strategic Income Fund (the “Fund”) as of December 31, 2017, the related statement of operations for the year ended December 31, 2017, the statements of changes in net assets for each of the two years in the period ended December 31, 2017, including the related notes, and the financial highlights for each of the periods indicated therein (collectively referred to as the “financial statements”). In our opinion, the financial statements present fairly, in all material respects, the financial position of the Fund as of December 31, 2017, the results of its operations for the year then ended, the changes in its net assets for each of the two years in the period ended December 31, 2017 and the financial highlights for each of the periods indicated therein in conformity with accounting principles generally accepted in the United States of America.
Basis for Opinion
These financial statements are the responsibility of the Fund’s management. Our responsibility is to express an opinion on the Fund’s financial statements based on our audits. We are a public accounting firm registered with the Public Company Accounting Oversight Board (United States) (“PCAOB”) and are required to be independent with respect to the Fund in accordance with the U.S. federal securities laws and the applicable rules and regulations of the Securities and Exchange Commission and the PCAOB.
We conducted our audits of these financial statements in accordance with the standards of the PCAOB. Those standards require that we plan and perform the audit to obtain reasonable assurance about whether the financial statements are free of material misstatement, whether due to error or fraud.
Our audits included performing procedures to assess the risks of material misstatement of the financial statements, whether due to error or fraud, and performing procedures that respond to those risks. Such procedures included examining, on a test basis, evidence regarding the amounts and disclosures in the financial statements. Our audits also included evaluating the accounting principles used and significant estimates made by management, as well as evaluating the overall presentation of the financial statements. Our procedures included confirmation of securities owned as of December 31, 2017 by correspondence with the custodian, transfer agent and brokers; when replies were not received from brokers, we performed other auditing procedures. We believe that our audits provide a reasonable basis for our opinion.
PricewaterhouseCoopers LLP
Boston, Massachusetts
February 14, 2018
We have served as the auditor of one or more investment companies in the Goldman Sachs Fund complex since 2000.
40
GOLDMAN SACHS VARIABLE INSURANCE TRUST STRATEGIC INCOME FUND
| | |
| Fund Expenses — Six Month Period Ended December 31, 2017 (Unaudited) | | |
As a shareholder of Institutional, Service or Advisor Shares of the Fund, you incur ongoing costs, including management fees, distribution and/or service (12b-1) fees (with respect to Service and Advisor Shares) and other Fund expenses. This example is intended to help you understand your ongoing costs (in dollars) of investing in the Institutional, Service and Advisor Shares of the Fund and to compare these costs with the ongoing costs of investing in other mutual funds.
The example is based on an investment of $1,000 invested at the beginning of the period and held for the entire period from July 1, 2017 through December 31, 2017, which represents a period of 184 days of a 365 day year.
Actual Expenses — The first line under each share class in the table below provides information about actual account values and actual expenses. You may use the information in this line, together with the amount you invested, to estimate the expenses that you paid over the period. Simply divide your account value by $1,000 (for example, an $8,600 account value divided by $1,000=8.6), then multiply the result by the number in the first line under the heading entitled “Expenses Paid” to estimate the expenses you paid on your account during this period.
Hypothetical Example for Comparison Purposes — The second line under each share class in the table below provides information about hypothetical account values and hypothetical expenses based on the Fund’s actual net expense ratio and an assumed rate of return of 5% per year before expenses, which is not the Fund’s actual return. The hypothetical account values and expenses may not be used to estimate the actual ending account balance or expenses you paid for the period. You may use this information to compare the ongoing costs of investing in the Fund and other funds. To do so, compare this 5% hypothetical example with the 5% hypothetical examples that appear in the shareholder reports of the other funds.
Please note that the expenses shown in the table are meant to highlight your ongoing costs only. As a shareholder of the Fund you do not incur any transaction costs, such as sales charges, redemption fees, or exchange fees, but shareholders of other funds may incur such costs. The second line of the table is useful in comparing ongoing costs only and will not help you determine the relative total costs of owning different funds whose shareholders may incur transaction costs.
| | | | | | | | | | | | |
| Share Class | | Beginning
Account Value
07/01/17 | | | Ending
Account Value
12/31/17 | | | Expenses Paid
for the
6 Months
Ended
12/31/17* | |
| Institutional | | | | | | | | | | | | |
| Actual | | $ | 1,000 | | | $ | 977.00 | | | $ | 4.29 | |
| Hypothetical 5% return | | | 1,000 | | | | 1,020.87 | + | | | 4.38 | |
| Service | | | | | | | | | | | | |
| Actual | | | 1,000 | | | | 976.30 | | | | 5.68 | |
| Hypothetical 5% return | | | 1,000 | | | | 1,019.46 | + | | | 5.80 | |
| Advisor | | | | | | | | | | | | |
| Actual | | | 1,000 | | | | 974.80 | | | | 6.27 | |
| Hypothetical 5% return | | | 1,000 | | | | 1,018.85 | + | | | 6.41 | |
| | * | Expenses are calculated using the Fund’s annualized net expense ratio for each class, which represents the ongoing expenses as a percentage of net assets for the six months ended December 31, 2017. Expenses are calculated by multiplying the annualized net expense ratio by the average account value for the period; then multiplying the result by the number of days in the most recent fiscal half year; and then dividing that result by the number of days in the fiscal year. The annualized net expense ratios for the period were 0.86%, 1.14% and 1.26% for the Institutional, Service and Advisor Shares, respectively. | |
| | + | Hypothetical expenses are based on the Fund’s actual annualized net expense ratios and an assumed rate of return of 5% per year before expenses. | |
41
GOLDMAN SACHS VARIABLE INSURANCE TRUST STRATEGIC INCOME FUND
Trustees and Officers (Unaudited)
Independent Trustees
| | | | | | | | | | |
| | | | | |
Name,
Address and Age1 | | Position(s) Held with the Trust | | Term of Office and
Length of
Time Served2 | | Principal Occupation(s) During Past 5 Years | | Number of
Portfolios in
Fund Complex
Overseen by
Trustee3 | | Other Directorships Held by Trustee4 |
Jessica Palmer Age: 68 | | Chair of the Board of Trustees | | 2018 (Trustee since 2007) | | Ms. Palmer is retired. She is Director, Emerson Center for the Arts and Culture (2011-Present); and was formerly a Consultant, Citigroup Human Resources Department (2007-2008); Managing Director, Citigroup Corporate and Investment Banking (previously, Salomon Smith Barney/Salomon Brothers) (1984-2006). Ms. Palmer was a Member of the Board of Trustees of Indian Mountain School (private elementary and secondary school) (2004-2009). Chair of the Board of Trustees — Goldman Sachs Trust and Goldman Sachs Variable Insurance Trust. | | 105 | | None |
Kathryn A. Cassidy Age: 63 | | Trustee | | Since 2015 | | Ms. Cassidy is retired. Formerly, she was Advisor to the Chairman (May 2014-December 2014); and Senior Vice President and Treasurer (2008-2014), General Electric Company & General Electric Capital Corporation (technology and financial services companies). Trustee — Goldman Sachs Trust and Goldman Sachs Variable Insurance Trust. | | 105 | | None |
Diana M. Daniels Age: 68 | | Trustee | | Since 2007 | | Ms. Daniels is retired. Formerly, she was Vice President, General Counsel and Secretary, The Washington Post Company (1991-2006). Ms. Daniels is a Trustee Emeritus and serves as a Presidential Councillor of Cornell University (2013-Present); former Member of the Legal Advisory Board, New York Stock Exchange (2003-2006) and of the Corporate Advisory Board, Standish Mellon Management Advisors (2006-2007). Trustee — Goldman Sachs Trust and Goldman Sachs Variable Insurance Trust. | | 105 | | None |
Herbert J. Markley Age: 67 | | Trustee | | Since 2013 | | Mr. Markley is retired. Formerly, he was Executive Vice President, Deere & Company (an agricultural and construction equipment manufacturer) (2007-2009); and President, Agricultural Division, Deere & Company (2001-2007). Previously, Mr. Markley served as an Advisory Board Member of Goldman Sachs Trust and Goldman Sachs Variable Insurance Trust (June 2013-October 2013). Trustee — Goldman Sachs Trust and Goldman Sachs Variable Insurance Trust. | | 105 | | None |
Roy W. Templin Age: 57 | | Trustee | | Since 2013 | | Mr. Templin is retired. He is Director, Armstrong World Industries, Inc. (a designer and manufacturer of ceiling, wall and suspension system solutions) (2016-Present); and was formerly Chairman of the Board of Directors, Con-Way Incorporated (a transportation, logistics and supply chain management service company) (2014-2015); Executive Vice President and Chief Financial Officer, Whirlpool Corporation (an appliance manufacturer and marketer) (2004-2012). Previously, Mr. Templin served as an Advisory Board Member of Goldman Sachs Trust and Goldman Sachs Variable Insurance Trust (June 2013-October 2013). Trustee — Goldman Sachs Trust and Goldman Sachs Variable Insurance Trust. | | 105 | | Armstrong World Industries, Inc. (a ceiling, wall and suspension systems solutions manufacturer) |
Gregory G. Weaver Age: 66 | | Trustee | | Since 2015 | | Mr. Weaver is retired. He is Director, Verizon Communications Inc. (2015-Present); and was formerly Chairman and Chief Executive Officer, Deloitte & Touche LLP (a professional services firm) (2001-2005 and 2012-2014); and Member of the Board of Directors, Deloitte & Touche LLP (2006-2012). Trustee — Goldman Sachs Trust and Goldman Sachs Variable Insurance Trust. | | 105 | | Verizon Communications Inc. |
42
GOLDMAN SACHS VARIABLE INSURANCE TRUST STRATEGIC INCOME FUND
Trustees and Officers (Unaudited) (continued)
Interested Trustee*
| | | | | | | | | | |
| | | | | |
Name,
Address and Age1 | | Position(s) Held with the Trust | | Term of Office and
Length of
Time Served2 | | Principal Occupation(s) During Past 5 Years | | Number of
Portfolios in
Fund Complex
Overseen by
Trustee3 | | Other Directorships Held by Trustee4 |
James A. McNamara Age: 55 | | President and Trustee | | Since 2007 | | Managing Director, Goldman Sachs (January 2000-Present); Director of Institutional Fund Sales, GSAM (April 1998-December 2000); and Senior Vice President and Manager, Dreyfus Institutional Service Corporation (January 1993- April 1998). President and Trustee — Goldman Sachs Trust; Goldman Sachs Variable Insurance Trust; Goldman Sachs Trust II; Goldman Sachs MLP Income Opportunities Fund; Goldman Sachs MLP and Energy Renaissance Fund; Goldman Sachs ETF Trust; Goldman Sachs Private Markets Fund 2018 LLC; Goldman Sachs Private Markets Fund 2018 (A) LLC; and Goldman Sachs Private Markets Fund 2018 (B) LLC. | | 146 | | None |
| | | | | | | | | | |
| * | Mr. McNamara is considered to be an “Interested Trustee” because he holds positions with Goldman Sachs and owns securities issued by The Goldman Sachs Group, Inc. Mr. McNamara holds comparable positions with certain other companies of which Goldman Sachs, GSAM or an affiliate thereof is the investment adviser, administrator and/or distributor. |
| 1 | Each Trustee may be contacted by writing to the Trustee, c/o Goldman Sachs, 200 West Street, New York, New York, 10282, Attn: Caroline Kraus. Information is provided as of December 31, 2017. |
| 2 | Subject to such policies as may be adopted by the Board from time-to-time, each Trustee holds office for an indefinite term, until the earliest of: (a) the election of his or her successor; (b) the date the Trustee resigns or is removed by the Board or shareholders, in accordance with the Trust’s Declaration of Trust; or (c) the termination of the Trust. The Board has adopted policies which provide that (a) no Trustee shall hold office for more than 15 years and (b) a Trustee shall retire as of December 31st of the calendar year in which he or she reaches his or her 74th birthday, unless a waiver of such requirement shall have been adopted by a majority of the other Trustees. These policies may be changed by the Trustees without shareholder vote. |
| 3 | The Goldman Sachs Fund Complex includes certain other companies listed above for each respective Trustee. As of December 31, 2017, Goldman Sachs Trust consisted of 91 portfolios (90 of which offered shares to the public); Goldman Sachs Variable Insurance Trust consisted of 14 portfolios; Goldman Sachs Trust II consisted of 17 portfolios (16 of which offered shares to the public); Goldman Sachs BDC, Inc., Goldman Sachs Private Middle Market Credit LLC, Goldman Sachs MLP Income Opportunities Fund, Goldman Sachs MLP and Energy Renaissance Fund, Goldman Sachs Private Markets Fund 2018 LLC, Goldman Sachs Private Markets Fund 2018 (A) LLC and Goldman Sachs Private Markets Fund 2018 (B) LLC each consisted of one portfolio; and Goldman Sachs ETF Trust consisted of 19 portfolios (12 of which offered shares to the public). Goldman Sachs Private Middle Market Credit LLC, Goldman Sachs Private Markets Fund 2018 LLC, Goldman Sachs Private Markets Fund 2018 (A) LLC and Goldman Sachs Private Markets Fund 2018 (B) LLC do not offer shares to the public. |
| 4 | This column includes only directorships of companies required to report to the Securities and Exchange Commission under the Securities Exchange Act of 1934 (i.e., “public companies”) or other investment companies registered under the Act. |
Additional information about the Trustees is available in the Fund’s Statement of Additional Information, which can be obtained from Goldman Sachs free of charge by calling this toll-free number (in the United States of America): 1-800-526-7384.
43
GOLDMAN SACHS VARIABLE INSURANCE TRUST STRATEGIC INCOME FUND
Trustees and Officers (Unaudited) (continued)
Officers of the Trust*
| | | | | | |
| | | |
| Name, Address and Age1 | | Position(s) Held with the Trust | | Term of
Office and
Length of
Time Served2 | | Principal Occupation(s) During Past 5 Years |
James A. McNamara 200 West Street New York, NY 10282 Age: 55 | | Trustee and President | | Since 2007 | | Managing Director, Goldman Sachs (January 2000-Present); Director of Institutional Fund Sales, GSAM (April 1998-December 2000); and Senior Vice President and Manager, Dreyfus Institutional Service Corporation (January 1993-April 1998). President and Trustee — Goldman Sachs Trust; Goldman Sachs Variable Insurance Trust; Goldman Sachs Trust II; Goldman Sachs MLP Income Opportunities Fund; Goldman Sachs MLP and Energy Renaissance Fund; Goldman Sachs ETF Trust; Goldman Sachs Private Markets Fund 2018 LLC; Goldman Sachs Private Markets Fund 2018 (A) LLC; and Goldman Sachs Private Markets Fund 2018 (B) LLC. |
Caroline L. Kraus 200 West Street New York, NY 10282 Age: 40 | | Secretary | | Since 2012 | | Managing Director, Goldman Sachs (January 2016-Present); Vice President, Goldman Sachs (August 2006-December 2015); Associate General Counsel, Goldman Sachs (2012-Present); Assistant General Counsel, Goldman Sachs (August 2006-December 2011); and Associate, Weil, Gotshal & Manges, LLP (2002-2006). Secretary — Goldman Sachs Trust (previously Assistant Secretary (2012)); Goldman Sachs Variable Insurance Trust (previously Assistant Secretary (2012)); Goldman Sachs Trust II; Goldman Sachs BDC, Inc.; Goldman Sachs Private Middle Market Credit LLC; Goldman Sachs Middle Market Lending Corp.; Goldman Sachs MLP Income Opportunities Fund; Goldman Sachs MLP and Energy Renaissance Fund; Goldman Sachs ETF Trust; Goldman Sachs Private Markets Fund 2018 LLC; Goldman Sachs Private Markets Fund 2018 (A) LLC; and Goldman Sachs Private Markets Fund 2018 (B) LLC. |
Scott M. McHugh 200 West Street New York, NY 10282 Age: 46 | | Treasurer, Senior Vice President and Principal Financial Officer | | Since 2009 (Principal Financial Officer since 2013) | | Managing Director, Goldman Sachs (January 2016-Present); Vice President, Goldman Sachs (February 2007-December 2015); Assistant Treasurer of certain mutual funds administered by DWS Scudder (2005-2007); and Director (2005-2007), Vice President (2000-2005), and Assistant Vice President (1998-2000), Deutsche Asset Management or its predecessor (1998-2007). Treasurer, Senior Vice President and Principal Financial Officer — Goldman Sachs Trust; Goldman Sachs Variable Insurance Trust; Goldman Sachs Trust II; Goldman Sachs MLP Income Opportunities Fund; Goldman Sachs MLP and Energy Renaissance Fund; Goldman Sachs ETF Trust; Goldman Sachs Private Markets Fund 2018 LLC; Goldman Sachs Private Markets Fund 2018 (A) LLC; and Goldman Sachs Private Markets Fund 2018 (B) LLC. |
Joseph F. DiMaria 30 Hudson Street Jersey City, NJ 07302 Age: 49 | | Assistant Treasurer and Principal Accounting Officer | | Since 2016 (Principal Accounting Officer since 2017) | | Managing Director, Goldman Sachs (November 2015-Present) and Vice President — Mutual Fund Administration, Columbia Management Investment Advisers, LLC (May 2010-October 2015). Assistant Treasurer and Principal Accounting Officer — Goldman Sachs Trust; Goldman Sachs Variable Insurance Trust; Goldman Sachs Trust II; Goldman Sachs MLP Income Opportunities Fund; Goldman Sachs MLP and Energy Renaissance Fund; Goldman Sachs ETF Trust; Goldman Sachs Private Markets Fund 2018 LLC; Goldman Sachs Private Markets Fund 2018 (A) LLC; and Goldman Sachs Private Markets Fund 2018 (B) LLC. |
| | | | | | |
| * | Represents a partial list of officers of the Trust. Additional information about all the officers is available in the Fund’s Statement of Additional Information, which can be obtained from Goldman Sachs free of charge by calling this toll-free number (in the United States): 1-800-526-7384. |
| 1 | Information is provided as of December 31, 2017. |
| 2 | Officers hold office at the pleasure of the Board of Trustees or until their successors are duly elected and qualified. Each officer holds comparable positions with certain other companies of which Goldman Sachs, GSAM or an affiliate thereof is the investment adviser, administrator and/or distributor. |
44
| | |
| TRUSTEES | | OFFICERS |
Jessica Palmer, Chair Kathryn A. Cassidy Diana M. Daniels Herbert J. Markley James A. McNamara Roy W. Templin Gregory G. Weaver | | James A. McNamara, President Scott M. McHugh, Treasurer, Senior Vice President and Principal Financial Officer Joseph F. DiMaria, Assistant Treasurer and Principal Accounting Officer Caroline L. Kraus, Secretary |
GOLDMAN SACHS & CO. LLC
Distributor and Transfer Agent
GOLDMAN SACHS ASSET MANAGEMENT, L.P.
Investment Adviser
200 West Street, New York
New York 10282
Visit our web site at www.GSAMFUNDS.com to obtain the most recent month-end returns.
The reports concerning the Fund included in this shareholder report may contain certain forward-looking statements about the factors that may affect the performance of the Fund in the future. These statements are based on Fund management’s predictions and expectations concerning certain future events and their expected impact on the Fund, such as performance of the economy as a whole and of specific industry sectors, changes in the levels of interest rates, the impact of developing world events, and other factors that may influence the future performance of the Fund. Management believes these forward-looking statements to be reasonable, although they are inherently uncertain and difficult to predict. Actual events may cause adjustments in portfolio management strategies from those currently expected to be employed.
A description of the policies and procedures that the Fund uses to determine how to vote proxies relating to portfolio securities and information regarding how the Fund voted proxies relating to portfolio securities for the 12-month period ended December 31 is available (i) without charge, upon request by calling 1-800-621-2550; and (ii) on the Securities and Exchange Commission (“SEC”) web site at http://www.sec.gov.
The Fund files its complete schedule of portfolio holdings with the SEC for the first and third quarters of each fiscal year on Form N-Q. The Fund’s Form N-Qs are available on the SEC’s web site at http://www.sec.gov within 60 days after the Fund’s first and third fiscal quarters. The Fund’s Form N-Qs may be reviewed and copied at the SEC’s Public Reference Room in Washington, D.C. and information on the operation of the Public Reference Room may also be obtained by calling 1-800-SEC-0330. Form N-Qs may be obtained upon request and without charge by calling 1-800-621-2550.
Views and opinions expressed are for informational purposes only and do not constitute a recommendation by GSAM to buy, sell, or hold any security. Views and opinions are current as of the date of this presentation and may be subject to change, they should not be construed as investment advice.
Goldman Sachs & Co. LLC (“Goldman Sachs”) does not provide legal, tax or accounting advice. Any statement contained in this communication (including any attachments) concerning U.S. tax matters was not intended or written to be used, and cannot be used, for the purpose of avoiding penalties under the Internal Revenue Code, and was written to support the promotion or marketing of transaction or matter addressed. Clients of Goldman Sachs should obtain their own independent tax advice based on their particular circumstances.
The website links provided are for your convenience only and are not an endorsement or recommendation by GSAM of any of these websites or the products or services offered. GSAM is not responsible for the accuracy and validity of the content of these websites.
Fund holdings and allocations shown are as of December 31, 2017 and may not be representative of future investments. Fund holdings should not be relied on in making investment decisions and should not be construed as research or investment advice regarding particular securities. Current and future holdings are subject to risk.
References to indices, benchmarks or other measures of relative market performance over a specified period of time are provided for your information only and do not imply that the portfolio will achieve similar results. The index composition may not reflect the manner in which a portfolio is constructed. While an adviser seeks to design a portfolio which reflects appropriate risk and return features, portfolio characteristics may deviate from those of the benchmark.
The Global Industry Classification Standard (“GICS”) was developed by and is the exclusive property and a service mark of Morgan Stanley Capital International Inc. (“MSCI”) and Standard & Poor’s, a division of The McGraw-Hill Companies, Inc. (“S&P”) and is licensed for use by Goldman Sachs. Neither MSCI, S&P nor any other party involved in making or compiling the GICS or any GICS classifications makes any express or implied warranties or representations with respect to such standard or classification (or the results to be obtained by the use thereof), and all such parties hereby expressly disclaim all warranties of originality, accuracy, completeness, merchantability or fitness for a particular purpose with respect to any of such standard or classification. Without limiting any of the foregoing, in no event shall MSCI, S&P, any of their affiliates or any third party involved in making or compiling the GICS or any GICS classifications have any liability for any direct, indirect, special, punitive, consequential or any other damages (including lost profits) even if notified of the possibility of such damages.
The portfolio risk management process includes an effort to monitor and manage risk, but does not imply low risk.
Shares of the Goldman Sachs VIT Funds are offered to separate accounts of participating life insurance companies for the purpose of funding variable annuity contracts and variable life insurance policies. Shares of the Fund are not offered directly to the general public. The variable annuity contracts and variable life insurance policies are described in the separate prospectuses issued by participating insurance companies. You should refer to those prospectuses for information about surrender charges, mortality and expense risk fees and other charges that may be assessed by participating insurance companies under the variable annuity contracts or variable life insurance policies. Such fees or charges, if any, may affect the return you may realize with respect to your investments. Ask your representative for more complete information. Please consider a fund’s objectives, risks and charges and expenses, and read the prospectus carefully before investing. The prospectus contains this and other information about the Fund.
This material is not authorized for distribution to prospective investors unless preceded or accompanied by a current prospectus or summary prospectus, if applicable. Investors should consider the Fund’s objective, risks, and charges and expenses, and read the summary prospectus, if available, and/or the prospectus carefully before investing or sending money. The summary prospectus, if available, and the prospectus contain this and other information about the Fund and may be obtained from your authorized dealer or from Goldman Sachs & Co. LLC by calling 1-800-621-2550.
THIS MATERIAL IS FOR INFORMATIONAL PURPOSES ONLY AND IS PROVIDED SOLELY ON THE BASIS THAT IT WILL NOT CONSTITUTE INVESTMENT OR OTHER ADVICE OR A RECOMMENDATION RELATING TO ANY PERSON’S OR PLAN’S INVESTMENT OR OTHER DECISIONS, AND GOLDMAN SACHS IS NOT A FIDUCIARY OR ADVISOR WITH RESPECT TO ANY PERSON OR PLAN BY REASON OF PROVIDING THE MATERIAL OR CONTENT HEREIN INCLUDING UNDER THE EMPLOYEE RETIREMENT INCOME SECURITY ACT OF 1974 OR DEPARTMENT OF LABOR REGULATIONS. PLAN SPONSORS AND OTHER FIDUCIARIES SHOULD CONSIDER THEIR OWN CIRCUMSTANCES IN ASSESSING ANY POTENTIAL COURSE OF ACTION.
This report is prepared for the general information of contract owners and is not an offer of shares of the Goldman Sachs Variable Insurance Trust – Goldman Sachs Strategic Income Fund.
© 2018 Goldman Sachs. All rights reserved.
VITSTIAR-18/119290-OTU-698884-400
Goldman
Sachs Variable Insurance Trust
Goldman Sachs
Strategic International Equity Fund
Annual Report
December 31, 2017

GOLDMAN SACHS STRATEGIC INTERNATIONAL EQUITY FUND
INVESTMENT OBJECTIVE
The Fund seeks long-term growth of capital.
Portfolio Management Discussion and Analysis
Below, the Goldman Sachs International Equity Portfolio Management Team discusses the Goldman Sachs Variable Insurance Trust — Goldman Sachs Strategic International Equity Fund’s (the “Fund”) performance and positioning for the 12-month period ended December 31, 2017 (the “Reporting Period”).
How did the Fund perform during the Reporting Period?
During the Reporting Period, the Fund’s Institutional and Service Shares generated average annual total returns of 26.60% and 26.21%, respectively. These returns compare to the 25.03% average annual total return of the Fund’s benchmark, the MSCI Europe, Australasia, Far East (EAFE) Index (net, USD, unhedged) (the “MSCI EAFE Index”), during the same time period.
What economic and market factors most influenced the international equity markets as a whole during the Reporting Period?
International equities, as measured by the MSCI EAFE Index, posted a return of 25.03% in U.S. dollar terms for the Reporting Period as a whole.
International equities rallied at the start of 2017 on prospects of deregulation, tax reform and infrastructure spending in the U.S. as well as on stronger economic data. In March 2017, the U.S. Federal Reserve (the “Fed”) raised U.S. interest rates for the third time since the 2008 global financial crisis. However, a seemingly cautious stance on the future path of monetary tightening from Fed Chair Janet Yellen and the presence of a dissenter on the Fed committee led to a dovish market reaction and Japanese yen appreciation, despite the Bank of Japan maintaining its policy rate. (Dovish language tends to suggest lower interest rates; opposite of hawkish.) Meanwhile, the European Central Bank (“ECB”) kept its monetary policy unchanged at its March 2017 meeting but revised its economic growth and inflation forecasts upwards. Equity markets interpreted the positive economic assessment as hawkish, sparking concerns around the sequencing of the ECB’s policy steps — namely, whether interest rates might rise before quantitative easing ends.
International equities were buoyed during the second calendar quarter by receding political risk, as the centrist candidate defeated the nationalist candidate in the French presidential elections and successfully secured a parliamentary majority. Political risk also declined in Italy, as the anti-establishment party saw a setback in local elections, and consensus expectations for parliamentary elections in 2017 declined. Still, market optimism for pro-growth fiscal policy was dampened by political developments in the U.S. Reports of strong first quarter 2017 earnings results, with double-digit growth across all major developed market regions, were supportive for international equity markets. In the U.S., the labor market remained strong, but economic activity and inflation data appeared to be moderating. Nonetheless, the Fed proceeded to raise the target range for the federal funds rate by 25 basis points in June 2017. (A basis point is 1/100th of a percentage point.) Also in June 2017, European markets reacted hawkishly to ECB President Mario Draghi’s sanguine outlook for recovering inflation and cautious reference to tapering. Japanese equities saw a temporary pullback in the same month, as market sentiment deteriorated and as the Japanese yen strengthened immediately after the Fed interest rate hike, but quickly rebounded.
U.S. economic activity and labor market data showed rather consistent strength through the third calendar quarter. The Consumer Price Index, a measure of inflation, rose 0.4% in August 2017, reversing five consecutive months of downside inflation surprises and raising odds of further monetary tightening before calendar year-end. Markets also reacted hawkishly to the Fed’s minutes. Details regarding the U.S. Administration’s tax reform plan extended bullish, or optimistic, market moves and further boosted the U.S. dollar. Meanwhile, the ECB kept its monetary policy unchanged at its September 2017 meeting and revised downward its forecast for headline inflation for the second time this calendar year. ECB President Draghi maintained a dovish stance and deferred discussion around tapered asset purchases to its October 2017 meeting. Risk sentiment amid North Korean missile launches and escalating geopolitical tensions between the U.S. and North Korea drove the Japanese yen higher and its equities lower. Japanese equities subsequently rallied in September 2017 on rising U.S. bond yields, a weakening yen and reports that Prime Minister Abe had dissolved the Japanese Lower House and called a general election to be held in October 2017.
1
GOLDMAN SACHS STRATEGIC INTERNATIONAL EQUITY FUND
While there appeared to be increasing market expectation for hawkish leadership at the Fed when Ms. Yellen’s term ends in early February 2018, encouraging tax reform progress and ongoing strength in both U.S. and global economic activity data were supportive for international equity performance in October 2017. As expected, the ECB kept its interest rates unchanged but announced its plan to reduce its monthly asset purchases for nine months from January 2018. Elsewhere in Europe, headlines around Catalonia’s disputed independence referendum negatively affected risk sentiment. Japan’s Prime Minister Abe’s ruling coalition won a significant majority in the Japanese election, which reassured markets and signaled a continuation of current macro policies. Japanese equities rallied on election anticipation and following Abe’s landslide victory and were further buoyed by strong corporate earnings results and rather stable overseas markets.
In December, the Fed delivered the third interest rate hike of 2017 as had been widely expected and maintained its projections for three additional interest rate hikes in 2018. Internationally, equity market returns were relatively muted during December 2017, particularly amongst larger companies. The U.K., however, performed better than many other developed markets. Although the U.K. Prime Minister suffered a defeat in the House of Commons over the European Union Withdrawal Bill in December, the U.K. was judged by the European Union to have made sufficient progress on key issues to allow the next phase of Brexit negotiations — including discussions on trade — to begin. Elsewhere, the ECB upgraded its growth forecasts for the Eurozone’s economy, though optimism was tempered by lackluster inflation. The German and French equity markets declined for the month. The Bank of Japan’s quarterly Tankan survey of business sentiment showed that confidence improved, boosted by strengthening export activity, and the Japanese equity market eked out a modest gain for December 2017.
For the Reporting Period overall, information technology, materials and industrials were the best performing sectors in the MSCI EAFE Index on the basis of total return. The weakest performing sectors in the MSCI EAFE Index during the Reporting Period were telecommunication services, health care and utilities, though each still generated a double-digit gain.
From a country perspective, Austria was the best performing equity market in the MSCI EAFE Index by a wide margin during the Reporting Period, followed by Hong Kong, Singapore, Denmark and the Netherlands. Though all generated positive absolute gains, Israel was the weakest individual country constituent in the MSCI EAFE Index during the Reporting Period, followed at some distance by New Zealand, Ireland, Belgium and Australia.
What key factors were responsible for the Fund’s performance during the Reporting Period?
The Fund’s outperformance of the MSCI EAFE Index during the Reporting Period can be primarily attributed to individual stock selection.
What were some of the Fund’s best-performing individual stocks?
Among the greatest contributors to Fund performance relative to the MSCI EAFE Index during the Reporting Period were Swiss manufacturer AMS, Italian manufacturer Moncler and Japanese manufacturer Nidec.
AMS is a leading developer and manufacturer of high performance semiconductors, chips, sensors, power management and wireless solutions. During the Reporting Period, AMS saw strong revenue growth as it supplied Apple and Samsung with parts necessary for their phones. Further, in January 2017, AMS announced the completion of the transaction to acquire Heptagon, a high-end optical packaging and micro-optics leader. AMS’ management confirmed that it expected the full earn-out from the Heptagon transaction to be realized in 2017 as well as substantial contribution to profitability from the deal. Its stock performed well, and we opted to take advantage of the share price gain by selling the position at the end of February 2017 to lock in profits.
Shares of Moncler, an apparel manufacturer, outperformed the MSCI EAFE Index after reporting optimistic results with a strong bottom line fueled by better than company-expected sales in Europe, Asia and the U.S. Its first-half 2017 results reported sales, revenues and comparisons ahead of consensus expectations. Further, its 2017 outlook for its wholesale business improved with plans for new openings and positive feedback for its spring/summer collection. We trimmed the Fund’s position in Moncler during the Reporting Period but continued to like the company, as we believe it enjoys a superior growth outlook and better execution than most of its peers.
Nidec is a manufacturer of small precision motors and related products for the automotive, electronics and other industrial markets. It is the world’s largest manufacturer of small motors for hard disc drives (“HDD”) and optical drives. Its founder’s vision also steered the company to diversify into higher growth areas, such as automotive electrification and the Internet of Things. (The Internet of Things is the interconnection of uniquely identifiable embedded computing devices within the existing Internet infrastructure.) This diversification reinforced our view that an evolution away from HDD technologies should enable Nidec to maintain its strong earnings growth profile. Indeed, its stock performed particularly well in the third quarter of 2017 on the back of heightened expectation of its Advanced Driver Assistance Systems (“ADAS”) and Electric Vehicle (“EV”) related motors as well
2
GOLDMAN SACHS STRATEGIC INTERNATIONAL EQUITY FUND
as its faster than consensus expected progress of post-merger integration in its acquisition of Emerson Motor Drive. Furthermore, the company has been aggressively automating its production lines, and, as a result, its gross margin showed improvement. In October 2017, its management announced upward revisions to its full fiscal year 2017 guidance and dividend projections along with a record first-half fiscal year 2017 net sales and operating profit. At the end of the Reporting Period, we continued to like Nidec but trimmed the Fund’s position to take profits given the stock’s strong performance during the Reporting Period.
Which stocks detracted significantly from the Fund’s performance during the Reporting Period?
Among the biggest detractors from Fund performance relative to the MSCI EAFE Index during the Reporting Period were Japanese diversified real estate landlord and developer Mitsubishi Estate, U.S.-based biopharmaceutical company Shire and Japanese tobacco company Japan Tobacco.
Mitsubishi Estate focuses on prime Tokyo office space. After posting strong performance in the fourth quarter of 2016, the company saw its share price weaken in early 2017 as foreign exchange movements affected market expectations for Japan’s economic strength and inflation. However, Tokyo office market fundamentals remained strong, with vacancies at historically low levels. Its stock suffered again in August 2017 as the company posted quarterly results that were weaker than market expectations. At the end of the Reporting Period, the company expected its profits to rebound with deliveries and two major central condo projects. We continued to like the stock as it was trading, at the end of the Reporting Period, at what we believed was a discount, and because we saw earnings improvement and more capital gains in the latter quarters of the Reporting Period. Still, we trimmed the Fund’s position in Mitsubishi Estate during the Reporting Period.
Shire focuses on developing and marketing innovative medicines for patients with rare diseases. Early in the Reporting Period, the company’s share price reacted negatively to wider circulation of a previously disclosed settlement being finalized by the Department of Justice. Uncertainty surrounding drug pricing, alleged patent infringement issues with rival companies and earlier than consensus expected competition on its generic drugs additionally weighed on the stock. On a positive note, the company reported solid financial results during the Reporting Period, with sales and earnings ahead of market estimates. Our investment thesis for Shire remained unchanged during the Reporting Period, and we continued to believe at the end of the Reporting Period that drug pricing and tax reforms may not meaningfully affect Shire. We were also positive on the company’s acquisition of Baxalta, which could be supportive over the long term, as Baxalta, in our view, should improve Shire’s organic sales growth potential. Overall, we believe Shire remains a solid business with a strong pipeline and an experienced management team focused on addressing key issues. We trimmed the Fund’s position in Shire during the Reporting Period.
As electronic cigarettes have gained market share, Japan Tobacco’s underlying cigarette business was affected through declining sales. Japan Tobacco’s own progress with New Generation Products (“NGPs”), such as vaping, has been slow, reducing our confidence in the company’s future earnings profile. While we expect the Japanese tobacco market to be attractive going forward, near-term headwinds led us to revise our investment thesis, and we exited the Fund’s position in favor of companies we believed to have more attractive risk/reward profiles.
Which equity market sectors most significantly affected Fund performance?
Effective stock selection in the consumer staples, industrials and health care sectors contributed most positively to the Fund’s performance relative to the MSCI EAFE Index during the Reporting Period. Partially offsetting these positive contributors was weaker stock selection in the real estate, consumer discretionary and telecommunication services sectors, which detracted from the Fund’s performance relative to the MSCI EAFE Index during the Reporting Period. Having an allocation to cash during a Reporting Period when the MSCI EAFE Index rallied also dampened the Fund’s relative results.
Which countries or regions most affected the Fund’s performance during the Reporting Period?
Typically, the Fund’s individual stock holdings will significantly influence the Fund’s performance within a particular country or region relative to the MSCI EAFE Index. This effect may be even more pronounced in countries that represent only a modest proportion of the MSCI EAFE Index.
That said, strong stock selection and effective allocation positioning in Italy, Switzerland and Denmark contributed most positively to the Fund’s returns relative to the MSCI EAFE Index. The countries that detracted most from the Fund’s relative performance during the Reporting Period were France, Hong Kong and Belgium, where stock selection overall hurt. Having an underweighted allocation to the strongly performing Hong Kong market also detracted.
3
GOLDMAN SACHS STRATEGIC INTERNATIONAL EQUITY FUND
How did the Fund use derivatives and similar instruments during the Reporting Period?
During the Reporting Period, we did not use derivatives to hedge positions or as part of an active management strategy.
Did the Fund make any significant purchases or sales during the Reporting Period?
We initiated a Fund position in Davide Campari-Milano, a producer and distributor of alcoholic and non-alcoholic beverages headquartered in Italy. In our view, the company has a strong product offering with Aperol and its recent acquisition of Grand Marnier, two types of liquor. Davide Campari-Milano is comprised of a small but experienced management team focused on generating cash. The team has also completed several accretive acquisitions of “dusty”, or old-time, brands in which it sees long-term value. Moreover, we are encouraged by the company’s increased global presence versus that of the Italian market where it already dominates.
We established a Fund position in Compass Group, a leading provider of food and support services in the workplace, including corporations, schools, colleges, hospitals and at leisure and in remote environments. In our view, the company is an industry leader and is gaining market share in most regions in which it operates at a sustainable rate, with competitive advantages from increasing scale. Further, we believe the company has a flexible cost structure with industry-leading margins and high cash conversion. We are additionally confident in its management’s ability to effectively focus on organic growth, costs and returns.
Conversely, in addition to those sales already mentioned, we exited the Fund’s position in Banco Popular Espanol. Banco Popular Espanol’s shares performed poorly during the Reporting Period, partially attributable to increased regulatory pressure, which is creating a challenging environment for European banks. Moreover, in our view, the bank has a poor balance sheet given its inability to deal with existing non-performing loans and its weak capital position. Following its Chief Executive Officer’s resignation at the beginning of April 2017, we were less confident with the strategy of the company moving forward and thus decided to exit the position.
Were there any notable changes in the Fund’s weightings during the Reporting Period?
In constructing the Fund’s portfolio, we focus on picking stocks rather than on making regional, country, sector or industry bets. We seek to outpace the benchmark index by overweighting stocks that we expect to outperform and underweighting those that we think may lag. Consequently, changes in its sector or country weights are generally the direct result of individual stock selection or of stock appreciation or depreciation. That said, the Fund’s allocation relative to the MSCI EAFE Index in industrials increased, and its allocations relative to the MSCI EAFE Index in materials and information technology decreased during the Reporting Period. From a country perspective, the Fund’s allocations relative to the MSCI EAFE Index in the U.K., Italy and France increased, and its allocations relative to the MSCI EAFE Index in Spain, Sweden, Germany and Japan decreased. The Fund’s allocation to cash increased during the Reporting Period.
How was the Fund positioned relative to its benchmark index at the end of the Reporting Period?
At the end of December 2017, the Fund had greater weightings than the MSCI EAFE Index in the consumer staples, health care, utilities and industrials sectors. The Fund had underweighted allocations to the financials, materials, information technology and consumer discretionary sectors and was rather neutrally weighted to the MSCI EAFE Index in the telecommunication services, real estate and energy sectors at the end of the Reporting Period.
From a country perspective, the Fund had greater positions in the U.K., Italy, Ireland, Denmark, Belgium, France and Portugal relative to the MSCI EAFE Index at the end of December 2017. The Fund had less exposure to Japan, Australia, Hong Kong, Germany and the Netherlands than the MSCI EAFE Index and was rather neutrally weighted to the MSCI EAFE Index in the remaining constituents of the MSCI EAFE Index at the end of the Reporting Period.
As always, we remained focused on individual stock selection, with sector and country positioning being a secondary, but closely monitored, effect.
What is the Fund’s tactical view and strategy for the months ahead?
At the end of the Reporting Period, we maintained a positive outlook for international equities based on economic and earnings growth prospects. For the first year since 2010, consensus global economic growth and earnings per share growth forecasts were positive in all major global regions at the end of the Reporting Period. We believed the best opportunities in equities existed “beyond borders” outside the U.S., where we saw valuations as especially high.
Amongst international equities, we were especially positive on Japan at the end of the Reporting Period. We saw corporate fundamentals in Japan as having improved significantly over the last 20 years, as evidenced by high cash levels, low debt levels,
4
GOLDMAN SACHS STRATEGIC INTERNATIONAL EQUITY FUND
improving profit margins and a rising return on equity. Corporate governance reforms have also resulted, in our view, in more shareholder friendly actions. The Abe administration introduced a corporate governance code as a set of rules that corporations are expected to follow or provide an explanation on failure to do so, resulting, it appears to us, in more independent directors on company boards. Despite the improving fundamentals, we believe Japanese equity valuations remained attractive relative to other developed market equities, especially to U.S. equities.
As always, we maintain our focus on seeking companies that we believe will generate long-term growth in today’s ever-changing market conditions.
NOTE: At a meeting held on December 13, 2017, the Board of Trustees (the “Board”) of the Goldman Sachs Variable Insurance Trust approved certain changes to the Fund’s name and principal investment strategy. The Fund’s investment adviser, Goldman Sachs Asset Management, L.P., also proposed changes to the Fund’s portfolio managers in light of these changes. These changes will take effect on April 23, 2018. The Fund’s name will change to the Goldman Sachs International Equity Insights Fund. The Fund will invest, under normal circumstance, at least 80% of its net assets plus any borrowings for investment purposes (measured at the time of purchase) (“Net Assets”) in a broadly diversified portfolio of equity investments in non-U.S. issuers. The Fund intends to have investments economically tied to at least three countries, not including the United States, and may invest in the securities of issuers in emerging market countries. The Fund will seek broad representation of large-cap and mid-cap issuers across major countries and sectors of the international economy with some exposure to small-cap issuers. The Fund’s portfolio managers effective April 23, 2018 will be Len Ioffe, Osman Ali and Takashi Suwabe. Additionally, the Fund’s contractual management fee rate will be lowered from 0.85% to 0.81% of the Fund’s average daily net assets.
5
GOLDMAN SACHS VARIABLE INSURANCE TRUST STRATEGIC INTERNATIONAL EQUITY FUND
Index Definitions
The MSCI EAFE Index is a market capitalization-weighted composite of securities in 21 developed markets. The MSCI EAFE Index approximates the minimum possible dividend reinvestment. The dividend is reinvested after deduction for withholding tax, applying the rate to non-resident individuals who do not benefit from double taxation treaties. MSCI Barra uses withholding tax rates applicable to Luxembourg holding companies, as Luxembourg applies the highest rates. The MSCI EAFE Index is unmanaged and the figures for the Index do not include any deduction for fees or expenses. It is not possible to invest directly in an index.
6
FUND BASICS
Strategic International Equity Fund
as of December 31, 2017
STANDARDIZED TOTAL RETURNS1
| | | | | | | | | | | | | | | | | | |
| For the period ended 12/31/17 | | One Year | | | Five Years | | | Ten Years | | | Since Inception | | | Inception Date |
| Institutional | | | 26.60 | % | | | 7.40 | % | | | 1.23 | % | | | 4.19 | % | | 1/12/98 |
| Service | | | 26.21 | | | | 7.12 | | | | 0.98 | | | | 2.70 | | | 1/09/06 |
| 1 | The Standardized Total Returns are average annual total returns as of the most recent calendar quarter-end. They assume reinvestment of all distributions at net asset value (“NAV”). Because Institutional Shares and Service Shares do not involve a sales charge, such a charge is not applied to their Standardized Total Returns. |
Total return figures in the above chart represent past performance and do not indicate future results, which will vary. The investment return and principal value of an investment will fluctuate and, therefore, an investor’s shares, when redeemed, may be worth more or less than their original cost. Current performance may be lower or higher than the total return figures in the above chart. Please visit www.GSAMFUNDS.com to obtain the most recent month-end returns.
Performance reflects fee waivers and/or expense limitations in effect during the periods shown. In their absence, performance would be reduced.
EXPENSE RATIOS2
| | | | | | | | | | | | |
| | | Net Expense Ratio (Current) | | | Gross Expense Ratio (Before Waivers) | | | | |
| Institutional | | | 0.88 | % | | | 1.07 | % | | | | |
| Service | | | 1.13 | | | | 1.32 | | | | | |
| 2 | The expense ratios of the Fund, both current (net of any fee waivers and/or expense limitations) and before waivers (gross of any fee waivers and/or expense limitations) are as set forth above according to the most recent publicly available Prospectuses for the Fund and may differ from the expense ratios disclosed in the Financial Highlights in this report. Pursuant to a contractual arrangement, the Fund’s fee waivers and/or expense limitations will remain in place through at least April 28, 2018, and prior to such date, the Investment Adviser may not terminate the arrangements without the approval of the Fund’s Board of Trustees. If these arrangements are discontinued in the future, the expense ratios may change without shareholder approval. |
TOP TEN HOLDINGS AS OF 12/31/173
| | | | | | | | |
| Holding | | % of
Net Assets | | | Line of Business | | Country |
| Royal Dutch Shell plc Class A | | | 5.9% | | | Energy | | Netherlands |
| Novartis AG (Registered) | | | 2.9 | | | Pharmaceuticals, Biotechnology & Life Sciences | | Switzerland |
| Kerry Group plc Class A | | | 2.7 | | | Food, Beverage & Tobacco | | Ireland |
| Bayer AG (Registered) | | | 2.5 | | | Pharmaceuticals, Biotechnology & Life Sciences | | Germany |
| UBS Group AG (Registered) | | | 2.5 | | | Diversified Financials | | Switzerland |
| Anheuser-Busch InBev SA | | | 2.5 | | | Food, Beverage & Tobacco | | Belgium |
| Kao Corp. | | | 2.3 | | | Household & Personal Products | | Japan |
| Novo Nordisk A/S Class B | | | 2.2 | | | Pharmaceuticals, Biotechnology & Life Sciences | | Denmark |
| Enel SpA | | | 2.2 | | | Utilities | | Italy |
| Credit Suisse Group AG (Registered) | | | 2.1 | | | Diversified Financials | | Switzerland |
| 3 | The top 10 holdings may not be representative of the Fund’s future investments. |
7
FUND BASICS
FUND VS. BENCHMARK SECTOR ALLOCATIONS4
As of December 31, 2017
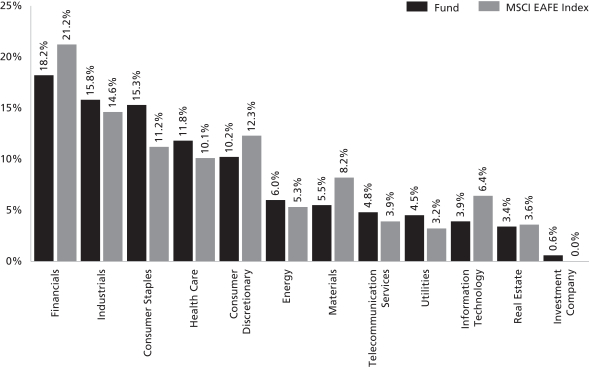
| 4 | The Fund is actively managed and, as such, its composition may differ over time. Consequently, the Fund’s overall sector allocations may differ from percentages contained in the graph above. The graph categorizes investments using Global Industry Classification Standard (“GICS”), however, the sector classifications used by the portfolio management team may differ from GICS. The percentage shown for each investment category reflects the value of investments in that category as a percentage of market value. Underlying sector allocations of exchange traded funds and investment companies held by the Fund are not reflected in the graph above. The graph depicts the Fund’s investments but may not represent the Fund’s market exposure due to the exclusion of certain derivatives, if any, as listed in the Additional Investment Information section of the Schedule of Investments. |
8
GOLDMAN SACHS VARIABLE INSURANCE TRUST STRATEGIC INTERNATIONAL EQUITY FUND
Performance Summary
December 31, 2017
The following graph shows the value, as of December 31, 2017, of a $10,000 investment made on January 1, 2008 in Service Shares at NAV. For comparative purposes, the performance of the Fund’s benchmark, the MSCI EAFE Index (Net, USD, Unhedged), is shown. This performance data represents past performance and should not be considered indicative of future performance, which will fluctuate with changes in market conditions. These performance fluctuations may cause an investor’s shares, when redeemed, to be worth more or less than their original cost. Performance reflects Fund level expenses but does not reflect fees and expenses associated with any variable annuity contract or variable life insurance policy that uses the Fund as an investment option for any contract or policy. Had performance reflected all of those fees and expenses, performance would have been reduced. Performance reflects applicable fee waivers and/or expense limitations in effect during the periods shown, and in their absence performance would be reduced. Performance of Institutional Shares will vary from Service Shares due to differences in class specific fees. In addition to the Investment Adviser’s decisions regarding issuer/industry/country investment selection and allocation, other factors may affect Fund performance. These factors include, but are not limited to, Fund operating fees and expenses, portfolio turnover, and subscription and redemption cash flows affecting the Fund.
Strategic International Equity Fund’s 10 Year Performance
Performance of a $10,000 investment, with distributions reinvested, from January 1, 2008 through December 31, 2017.

| | | | | | | | |
| Average Annual Total Return through December 31, 2017 | | One Year | | Five Years | | Ten Years | | Since Inception |
Institutional (Commenced January 12, 1998) | | 26.60% | | 7.40% | | 1.23% | | 4.19% |
Service (Commenced January 9, 2006) | | 26.21% | | 7.12% | | 0.98% | | 2.70% |
9
GOLDMAN SACHS VARIABLE INSURANCE TRUST STRATEGIC INTERNATIONAL EQUITY FUND
Schedule of Investments
December 31, 2017
| | | | | | | | |
| Shares | | | Description | | Value | |
| | Common Stocks – 97.7% | |
| | Australia – 2.3% | |
| | 113,320 | | | Australia & New Zealand Banking Group Ltd. (Banks) | | $ | 2,528,061 | |
| | 63,976 | | | BHP Billiton plc (Materials) | | | 1,293,617 | |
| | | | | | | | |
| | | | | | | 3,821,678 | |
| | |
| | Belgium – 2.4% | | | | |
| | 36,347 | | | Anheuser-Busch InBev SA (Food, Beverage & Tobacco) | | | 4,057,831 | |
| | |
| | China – 0.9% | | | | |
| | 476,000 | | | China Mengniu Dairy Co. Ltd. (Food, Beverage & Tobacco)* | | | 1,413,975 | |
| | |
| | Denmark – 3.2% | | | | |
| | 67,670 | | | Novo Nordisk A/S Class B (Pharmaceuticals, Biotechnology & Life Sciences) | | | 3,636,281 | |
| | 29,458 | | | Novozymes A/S Class B (Materials) | | | 1,681,679 | |
| | | | | | | | |
| | | | | | | 5,317,960 | |
| | |
| | Finland – 1.0% | | | | |
| | 359,117 | | | Nokia OYJ (Technology Hardware & Equipment) | | | 1,677,917 | |
| | |
| | France – 11.9% | | | | |
| | 22,413 | | | Air Liquide SA (Materials) | | | 2,817,635 | |
| | 31,219 | | | BNP Paribas SA (Banks) | | | 2,322,339 | |
| | 7,455 | | | Iliad SA (Telecommunication Services) | | | 1,786,340 | |
| | 73,767 | | | Klepierre SA (REIT) | | | 3,242,382 | |
| | 39,894 | | | Publicis Groupe SA (Media) | | | 2,704,305 | |
| | 53,258 | | | Rexel SA (Capital Goods) | | | 964,341 | |
| | 26,360 | | | Safran SA (Capital Goods) | | | 2,718,919 | |
| | 30,021 | | | Vinci SA (Capital Goods) | | | 3,064,894 | |
| | | | | | | | |
| | | | | | | 19,621,155 | |
| | |
| | Germany – 7.5% | | | | |
| | 33,370 | | | Bayer AG (Registered) (Pharmaceuticals, Biotechnology & Life Sciences) | | | 4,146,664 | |
| | 22,798 | | | Beiersdorf AG (Household & Personal Products) | | | 2,672,682 | |
| | 44,854 | | | GEA Group AG (Capital Goods) | | | 2,146,003 | |
| | 11,845 | | | HeidelbergCement AG (Materials) | | | 1,277,192 | |
| | 19,311 | | | SAP SE (Software & Services) | | | 2,160,425 | |
| | | | | | | | |
| | | | | | | 12,402,966 | |
| | |
| | Hong Kong – 1.0% | | | | |
| | 1,286,500 | | | HKBN Ltd. (Telecommunication Services) | | | 1,626,887 | |
| | |
| | Ireland – 4.0% | | | | |
| | 253,326 | | | Bank of Ireland Group plc (Banks) | | | 2,163,416 | |
| | 40,244 | | | Kerry Group plc Class A (Food, Beverage & Tobacco) | | | 4,514,812 | |
| | | | | | | | |
| | | | | | | 6,678,228 | |
| | |
| | Common Stocks – (continued) | |
| | Italy – 8.8% | | | | |
| | 323,916 | | | Davide Campari-Milano SpA (Food, Beverage & Tobacco) | | $ | 2,502,777 | |
| | 367,989 | | | Enav SpA (Transportation)(a) | | | 1,991,386 | |
| | 587,601 | | | Enel SpA (Utilities) | | | 3,613,319 | |
| | 70,432 | | | Moncler SpA (Consumer Durables & Apparel) | | | 2,201,532 | |
| | 2,248,732 | | | Telecom Italia SpA (Telecommunication Services)* | | | 1,942,001 | |
| | 124,765 | | | UniCredit SpA (Banks)* | | | 2,327,397 | |
| | | | | | | | |
| | | | | | | 14,578,412 | |
| | |
| | Japan – 16.4% | | | | |
| | 14,700 | | | Dentsu, Inc. (Media) | | | 621,590 | |
| | 16,700 | | | East Japan Railway Co. (Transportation) | | | 1,628,555 | |
| | 20,400 | | | Hoshizaki Corp. (Capital Goods) | | | 1,807,338 | |
| | 65,000 | | | Hoya Corp. (Health Care Equipment & Services) | | | 3,237,207 | |
| | 56,200 | | | Kao Corp. (Household & Personal Products) | | | 3,797,412 | |
| | 61,500 | | | KDDI Corp. (Telecommunication Services) | | | 1,527,631 | |
| | 128,300 | | | Mitsubishi Estate Co. Ltd. (Real Estate) | | | 2,227,678 | |
| | 24,100 | | | Nidec Corp. (Capital Goods) | | | 3,374,411 | |
| | 6,800 | | | Nintendo Co. Ltd. (Software & Services) | | | 2,448,657 | |
| | 125,000 | | | ORIX Corp. (Diversified Financials) | | | 2,107,610 | |
| | 61,800 | | | Sumitomo Mitsui Financial Group, Inc. (Banks) | | | 2,663,859 | |
| | 28,400 | | | Suzuki Motor Corp. (Automobiles & Components) | | | 1,643,896 | |
| | | | | | | | |
| | | | | | | 27,085,844 | |
| | |
| | Netherlands – 8.2% | | | | |
| | 40,241 | | | Aalberts Industries NV (Capital Goods) | | | 2,044,473 | |
| | 95,477 | | | ING Groep NV (Banks) | | | 1,752,646 | |
| | 292,787 | | | Royal Dutch Shell plc Class A (Energy) | | | 9,774,165 | |
| | | | | | | | |
| | | | | | | 13,571,284 | |
| | |
| | Singapore – 2.0% | | | | |
| | 176,785 | | | DBS Group Holdings Ltd. (Banks) | | | 3,269,865 | |
| | |
| | Spain – 1.2% | | | | |
| | 229,836 | | | EDP Renovaveis SA (Utilities) | | | 1,921,281 | |
| | |
| | Switzerland – 9.2% | | | | |
| | 195,640 | | | Credit Suisse Group AG (Registered) (Diversified Financials)* | | | 3,489,381 | |
| | 38,623 | | | Ferguson plc (Capital Goods) | | | 2,771,737 | |
| | |
| | |
| 10 | | The accompanying notes are an integral part of these financial statements. |
GOLDMAN SACHS VARIABLE INSURANCE TRUST STRATEGIC INTERNATIONAL EQUITY FUND
| | | | | | | | |
| Shares | | | Description | | Value | |
| | Common Stocks – (continued) | |
| | Switzerland – (continued) | |
| | 56,341 | | | Novartis AG (Registered) (Pharmaceuticals, Biotechnology & Life Sciences) | | $ | 4,741,236 | |
| | 224,925 | | | UBS Group AG (Registered) (Diversified Financials)* | | | 4,132,493 | |
| | | | | | | | |
| | | | | | | 15,134,847 | |
| | |
| | United Kingdom – 16.4% | |
| | 268,931 | | | Aviva plc (Insurance) | | | 1,834,195 | |
| | 49,524 | | | British American Tobacco plc (Food, Beverage & Tobacco) | | | 3,347,762 | |
| | 129,067 | | | BTG plc (Pharmaceuticals, Biotechnology & Life Sciences)* | | | 1,328,731 | |
| | 132,750 | | | Compass Group plc (Consumer Services) | | | 2,862,384 | |
| | 36,557 | | | InterContinental Hotels Group plc (Consumer Services) | | | 2,325,200 | |
| | 420,267 | | | Melrose Industries plc (Capital Goods) | | | 1,202,331 | |
| | 381,159 | | | Merlin Entertainments plc (Consumer Services)(a) | | | 1,867,308 | |
| | 168,735 | | | Pennon Group plc (Utilities) | | | 1,781,380 | |
| | 26,892 | | | Reckitt Benckiser Group plc (Household & Personal Products) | | | 2,508,848 | |
| | 463,458 | | | Rentokil Initial plc (Commercial & Professional Services) | | | 1,985,530 | |
| | 33,998 | | | Rio Tinto plc (Materials) | | | 1,783,453 | |
| | 235,865 | | | UBM plc (Media) | | | 2,374,642 | |
| | 261,472 | | | Virgin Money Holdings UK plc (Banks) | | | 1,001,561 | |
| | 294,483 | | | Vodafone Group plc (Telecommunication Services) | | | 930,859 | |
| | | | | | | | |
| | | | | | | 27,134,184 | |
| | |
| | United States – 1.3% | |
| | 41,433 | | | Shire plc (Pharmaceuticals, Biotechnology & Life Sciences) | | | 2,147,105 | |
| | |
| | TOTAL COMMON STOCKS | |
| | (Cost $135,353,557) | | $ | 161,461,419 | |
| | |
| Shares | | | Distribution Rate | | Value | |
| | Investment Company(b) – 0.6% | |
| Goldman Sachs Financial Square Government Fund –
Institutional Shares |
|
| | 952,535 | | | 1.228% | | $ | 952,535 | |
| | (Cost $952,535) | |
| | |
| | TOTAL INVESTMENTS – 98.3% | |
| | (Cost $136,306,092) | | $ | 162,413,954 | |
| | |
| OTHER ASSETS IN EXCESS OF
LIABILITIES – 1.7% | | | 2,876,036 | |
| | |
| | NET ASSETS – 100.0% | | $ | 165,289,990 | |
| | |
| | |
| The percentage shown for each investment category reflects the value of investments in that category as a percentage of net assets. |
| * | | Non-income producing security. |
| (a) | | Exempt from registration under Rule 144A of the Securities Act of 1933. Under procedures approved by the Board of Trustees, such securities may be deemed liquid by the Investment Adviser and may be resold, normally to qualified institutional buyers in transactions exempt from registration. Total market value of Rule 144A securities amounts to $3,858,694, which represents approximately 2.3% of net assets as of December 31, 2017. The liquidity determination is unaudited. |
| (b) | | Represents an Affiliated Issuer. |
| | |
| Investment Abbreviation: |
| REIT | | —Real Estate Investment Trust |
| | |
| The accompanying notes are an integral part of these financial statements. | | 11 |
GOLDMAN SACHS VARIABLE INSURANCE TRUST STRATEGIC INTERNATIONAL EQUITY FUND
Statement of Assets and Liabilities
December 31, 2017
| | | | |
| | | | |
| Assets: | | | |
Investments in unaffiliated issuers, at value (cost $135,353,557) | | $ | 161,461,419 | |
Investments in affiliated issuers, at value (cost $952,535) | | | 952,535 | |
Cash | | | 2,540,234 | |
Foreign currencies, at value (cost $66) | | | 64 | |
Receivables: | | | | |
Foreign tax reclaims | | | 422,527 | |
Dividends | | | 125,965 | |
Reimbursement from investment adviser | | | 21,935 | |
Fund shares sold | | | 10,235 | |
Other assets | | | 344 | |
| Total assets | | | 165,535,258 | |
| |
| | | | |
| Liabilities: | | | |
Payables: | | | | |
Management fees | | | 112,809 | |
Distribution and Service fees and Transfer Agency fees | | | 28,891 | |
Fund shares redeemed | | | 25,452 | |
Accrued expenses | | | 78,116 | |
| Total liabilities | | | 245,268 | |
| |
| | | | |
| Net Assets: | | | |
Paid-in capital | | | 144,315,979 | |
Distributions in excess of net investment income | | | (216,255 | ) |
Accumulated net realized loss | | | (4,918,852 | ) |
Net unrealized gain | | | 26,109,118 | |
| NET ASSETS | | $ | 165,289,990 | |
Net Assets: | | | | |
Institutional | | $ | 41,512,460 | |
Service | | | 123,777,530 | |
Total Net Assets | | $ | 165,289,990 | |
Shares outstanding $0.001 par value (unlimited shares authorized): | | | | |
Institutional | | | 3,814,720 | |
Service | | | 11,346,103 | |
Net asset value, offering and redemption price per share: | | | | |
Institutional | | | $10.88 | |
Service | | | 10.91 | |
| | |
| 12 | | The accompanying notes are an integral part of these financial statements. |
GOLDMAN SACHS VARIABLE INSURANCE TRUST STRATEGIC INTERNATIONAL EQUITY FUND
Statement of Operations
For the Fiscal Year Ended December 31, 2017
| | | | |
| | | | |
| Investment income: | |
Dividends — unaffiliated issuers (net of foreign taxes withheld of $320,962) | | $ | 3,992,090 | |
Securities lending income — affiliated issuer | | | 80,664 | |
Dividends — affiliated issuers | | | 3,275 | |
| Total investment income | | | 4,076,029 | |
| |
| | | | |
| Expenses: | | | |
Management fees | | | 1,353,593 | |
Distribution and Service fees — Service Shares | | | 297,996 | |
Professional fees | | | 92,486 | |
Custody, accounting and administrative services | | | 75,066 | |
Printing and mailing costs | | | 47,657 | |
Transfer Agency fees(a) | | | 31,847 | |
Trustee fees | | | 17,915 | |
Other | | | 14,210 | |
| Total expenses | | | 1,930,770 | |
Less — expense reductions | | | (242,212 | ) |
| Net expenses | | | 1,688,558 | |
| NET INVESTMENT INCOME | | | 2,387,471 | |
| |
| | | | |
| Realized and unrealized gain (loss): | | | |
Net realized gain (loss) from: | | | | |
Investments — unaffiliated issuers | | | (316,871 | ) |
Foreign currency transactions | | | 59,587 | |
Net change in unrealized gain on: | | | | |
Investments — unaffiliated issuers | | | 34,735,461 | |
Foreign currency translation | | | 45,495 | |
| Net realized and unrealized gain | | | 34,523,672 | |
| NET INCREASE IN NET ASSETS RESULTING FROM OPERATIONS | | $ | 36,911,143 | |
(a) Institutional and Service Shares incurred Transfer Agency fees of $8,009 and $23,838, respectively.
| | |
| The accompanying notes are an integral part of these financial statements. | | 13 |
GOLDMAN SACHS VARIABLE INSURANCE TRUST STRATEGIC INTERNATIONAL EQUITY FUND
Statements of Changes in Net Assets
| | | | | | | | |
| | | For the
Fiscal Year Ended
December 31, 2017 | | | For the
Fiscal Year Ended
December 31, 2016 | |
| | | | | | | | |
| From operations: | |
Net investment income | | $ | 2,387,471 | | | $ | 2,594,460 | |
Net realized loss | | | (257,284 | ) | | | (4,074,588 | ) |
Net change in unrealized gain (loss) | | | 34,780,956 | | | | (3,160,383 | ) |
| Net increase (decrease) in net assets resulting from operations | | | 36,911,143 | | | | (4,640,511 | ) |
| | | | | | | | |
| | | | | | | | |
| Distributions to shareholders: | | | | | | |
From net investment income | | | | | | | | |
Institutional Shares | | | (739,059 | ) | | | (781,242 | ) |
Service Shares | | | (1,909,638 | ) | | | (1,944,283 | ) |
| Total distributions to shareholders | | | (2,648,697 | ) | | | (2,725,525 | ) |
| | | | | | | | |
| | | | | | | | |
| From share transactions: | | | | | | |
Proceeds from sales of shares | | | 7,888,528 | | | | 10,750,740 | |
Reinvestment of distributions | | | 2,648,697 | | | | 2,725,525 | |
Cost of shares redeemed | | | (21,932,620 | ) | | | (22,234,915 | ) |
| Net decrease in net assets resulting from share transactions | | | (11,395,395 | ) | | | (8,758,650 | ) |
| TOTAL INCREASE (DECREASE) | | | 22,867,051 | | | | (16,124,686 | ) |
| | | | | | | | |
| | | | | | | | |
| Net assets: | | | | | | |
| | |
Beginning of year | | | 142,422,939 | | | | 158,547,625 | |
End of year | | $ | 165,289,990 | | | $ | 142,422,939 | |
| Distributions in excess of net investment income | | $ | (216,255 | ) | | $ | (18,227 | ) |
| | |
| 14 | | The accompanying notes are an integral part of these financial statements. |
GOLDMAN SACHS VARIABLE INSURANCE TRUST STRATEGIC INTERNATIONAL EQUITY FUND
Financial Highlights
Selected Data for a Share Outstanding Throughout Each Year
| | | | | | | | | | | | | | | | | | | | | | | | | | | | | | | | | | | | | | | | | | | | | | | | |
| | | | | | Income (loss) from
investment operations | | | | | | | | | | | | | | | | | | | | | | | | | |
| Year - Share Class | | Net asset
value,
beginning
of year | | | Net
investment
income(a) | | | Net
realized
and
unrealized
gain (loss) | | | Total from
investment
operations | | | Distributions to
shareholders
from net
investment
income | | | Net
asset
value,
end of
year | | | Total
return(b) | | | Net assets,
end of
year
(in 000s) | | | Ratio of
net expenses
to average
net assets | | | Ratio of
total
expenses
to average
net assets | | | Ratio of
net investment
income
to average net
assets | | | Portfolio
turnover
rate(c) | |
| | |
| FOR THE FISCAL YEARS ENDED DECEMBER 31, | |
2017 - Institutional | | $ | 8.75 | | | $ | 0.17 | | | $ | 2.16 | | | $ | 2.33 | | | $ | (0.20 | ) | | $ | 10.88 | | | | 26.60 | % | | $ | 41,512 | | | | 0.87 | % | | | 1.02 | % | | | 1.69 | % | | | 23 | % |
2017 - Service | | | 8.78 | | | | 0.14 | | | | 2.16 | | | | 2.30 | | | | (0.17 | ) | | | 10.91 | | | | 26.21 | | | | 123,778 | | | | 1.12 | | | | 1.27 | | | | 1.44 | | | | 23 | |
2016 - Institutional | | | 9.19 | | | | 0.17 | (d) | | | (0.42 | ) | | | (0.25 | ) | | | (0.19 | ) | | | 8.75 | | | | (2.72 | ) | | | 37,061 | | | | 0.89 | | | | 1.06 | | | | 1.94 | (d) | | | 39 | |
2016 - Service | | | 9.21 | | | | 0.15 | (d) | | | (0.42 | ) | | | (0.27 | ) | | | (0.16 | ) | | | 8.78 | | | | (2.86 | ) | | | 105,362 | | | | 1.14 | | | | 1.31 | | | | 1.68 | (d) | | | 39 | |
2015 - Institutional | | | 9.26 | | | | 0.14 | (e) | | | (0.04 | ) | | | 0.10 | | | | (0.17 | ) | | | 9.19 | | | | 1.05 | | | | 41,737 | | | | 0.89 | | | | 1.06 | | | | 1.42 | (e) | | | 58 | |
2015 - Service | | | 9.28 | | | | 0.12 | (e) | | | (0.05 | ) | | | 0.07 | | | | (0.14 | ) | | | 9.21 | | | | 0.77 | | | | 116,811 | | | | 1.14 | | | | 1.31 | | | | 1.18 | (e) | | | 58 | |
2014 - Institutional | | | 10.43 | | | | 0.39 | (f) | | | (1.18 | ) | | | (0.79 | ) | | | (0.38 | ) | | | 9.26 | | | | (7.54 | ) | | | 46,871 | | | | 0.99 | | | | 1.04 | | | | 3.75 | (f) | | | 74 | |
2014 - Service | | | 10.44 | | | | 0.36 | (f) | | | (1.17 | ) | | | (0.81 | ) | | | (0.35 | ) | | | 9.28 | | | | (7.70 | ) | | | 126,230 | | | | 1.24 | | | | 1.29 | | | | 3.47 | (f) | | | 74 | |
2013 - Institutional | | | 8.56 | | | | 0.16 | | | | 1.89 | | | | 2.05 | | | | (0.18 | ) | | | 10.43 | | | | 24.20 | | | | 59,187 | | | | 0.98 | | | | 1.05 | | | | 1.67 | | | | 95 | |
2013 - Service | | | 8.57 | | | | 0.13 | | | | 1.90 | | | | 2.03 | | | | (0.16 | ) | | | 10.44 | | | | 23.73 | | | | 152,513 | | | | 1.23 | | | | 1.30 | | | | 1.42 | | | | 95 | |
| (a) | Calculated based on the average shares outstanding methodology. |
| (b) | Assumes investment at the net asset value at the beginning of the year, reinvestment of all distributions, and a complete redemption of the investment at the net asset value at the end of the year. |
| (c) | The Fund’s portfolio turnover rate is calculated in accordance with regulatory requirements, without regard to transactions involving short term investments. If such transactions were included, the Fund’s portfolio turnover rate may be higher. |
| (d) | Reflects income recognized from corporate actions which amounted to $0.03 per share and 0.36% of average net assets. |
| (e) | Reflects income recognized from a corporate action which amounted to $0.02 per share and 0.17% of average net assets. |
| (f) | Reflects income recognized from a corporate action which amounted to $0.22 per share and 2.10% of average net assets. |
| | | | |
| The accompanying notes are an integral part of these financial statements. | | 15 | | |
GOLDMAN SACHS VARIABLE INSURANCE TRUST STRATEGIC INTERNATIONAL EQUITY FUND
Notes to Financial Statements
December 31, 2017
1. ORGANIZATION
Goldman Sachs Variable Insurance Trust (the “Trust” or “VIT”) is a Delaware statutory trust registered under the Investment Company Act of 1940, as amended (the “Act”), as an open-end management investment company. The Trust includes the Goldman Sachs Strategic International Equity Fund (the “Fund”). The Fund is a diversified portfolio under the Act offering two classes of shares — Institutional and Service Shares. Shares of the Trust are offered to separate accounts of participating life insurance companies for the purpose of funding variable annuity contracts and variable life insurance policies.
Goldman Sachs Asset Management, L.P. (“GSAM”), an affiliate of Goldman Sachs & Co. LLC (formerly, Goldman, Sachs & Co.) (“Goldman Sachs”), serves as investment adviser to the Fund pursuant to a management agreement (the “Agreement”) with the Trust. Prior to November 1, 2017, the Fund’s investment adviser was Goldman Sachs Asset Management International (“GSAMI”), an affiliate of Goldman Sachs.
2. SIGNIFICANT ACCOUNTING POLICIES
The financial statements have been prepared in accordance with accounting principles generally accepted in the United States of America (“GAAP”) and require management to make estimates and assumptions that may affect the reported amounts and disclosures. Actual results may differ from those estimates and assumptions.
A. Investment Valuation — The Fund’s valuation policy is to value investments at fair value.
B. Investment Income and Investments — Investment income includes interest income, dividend income, and securities lending income. Interest income is accrued daily and adjusted for amortization of premiums and accretion of discounts. Dividend income is recognized on ex-dividend date or, for certain foreign securities, as soon as such information is obtained subsequent to the ex-dividend date. Investment transactions are reflected on trade date. Realized gains and losses are calculated using identified cost. Investment transactions are recorded on the following business day for daily net asset value (“NAV”) calculations. Investment income is recorded net of any foreign withholding taxes, less any amounts reclaimable. The Fund may file withholding tax reclaims in certain jurisdictions to recover a portion of amounts previously withheld. Any foreign capital gains tax is accrued daily based upon net unrealized gains, and is payable upon sale of such investments.
C. Class Allocations and Expenses — Investment income, realized and unrealized gain (loss), if any, and non-class specific expenses of the Fund are allocated daily based upon the proportion of net assets of each class. Non-class specific expenses directly incurred by the Fund are charged to the Fund, while such expenses incurred by the Trust are allocated across the Fund on a straight-line and/or pro-rata basis depending upon the nature of the expenses. Class specific expenses, where applicable, are borne by the respective share classes and include Distribution and Service and Transfer Agency fees.
D. Federal Taxes and Distributions to Shareholders — It is the Fund’s policy to comply with the requirements of the Internal Revenue Code of 1986, as amended (the “Code”), applicable to regulated investment companies (mutual funds) and to distribute each year substantially all of its investment company taxable income and capital gains to its shareholders. Accordingly, the Fund is not required to make any provisions for the payment of federal income tax. Distributions to shareholders are recorded on the ex-dividend date. Income and capital gains distributions, if any, are declared and paid annually.
Net capital losses, if any, are carried forward to future fiscal years and may be used to the extent allowed by the Code to offset any future capital gains. Losses that are carried forward will retain their character as either short-term or long-term capital losses. Utilization of capital loss carryforwards will reduce the requirement of future capital gains distributions.
16
GOLDMAN SACHS VARIABLE INSURANCE TRUST STRATEGIC INTERNATIONAL EQUITY FUND
2. SIGNIFICANT ACCOUNTING POLICIES (continued)
The characterization of distributions to shareholders for financial reporting purposes is determined in accordance with federal income tax rules, which may differ from GAAP. The source of the Fund’s distributions may be shown in the accompanying financial statements as either from net investment income, net realized gain or capital. Certain components of the Fund’s net assets on the Statement of Assets and Liabilities reflect permanent GAAP/tax differences based on the appropriate tax character.
E. Foreign Currency Translation — The accounting records and reporting currency of the Fund are maintained in United States (“U.S.”) dollars. Assets and liabilities denominated in foreign currencies are translated into U.S. dollars using the current exchange rates at the close of each business day. The effect of changes in foreign currency exchange rates on investments is included within net realized and unrealized gain (loss) on investments. Changes in the value of other assets and liabilities as a result of fluctuations in foreign exchange rates are included in the Statement of Operations within net change in unrealized gain (loss) on foreign currency translation. Transactions denominated in foreign currencies are translated into U.S. dollars on the date the transaction occurred, the effects of which are included within net realized gain (loss) on foreign currency transactions.
3. INVESTMENTS AND FAIR VALUE MEASUREMENTS
U.S. GAAP defines the fair value of a financial instrument as the amount that would be received to sell an asset or paid to transfer a liability in an orderly transaction between market participants at the measurement date (i.e., the exit price); the Fund’s policy is to use the market approach. GAAP establishes a fair value hierarchy that prioritizes the inputs to valuation techniques used to measure fair value. The hierarchy gives the highest priority to unadjusted quoted prices in active markets for identical assets or liabilities (Level 1 measurements) and the lowest priority to unobservable inputs (Level 3 measurements). The levels used for classifying investments are not necessarily an indication of the risk associated with investing in these investments. The three levels of the fair value hierarchy are described below:
Level 1 — Unadjusted quoted prices in active markets that are accessible at the measurement date for identical, unrestricted assets or liabilities;
Level 2 — Quoted prices in markets that are not active or financial instruments for which significant inputs are observable (including, but not limited to, quoted prices for similar investments, interest rates, foreign exchange rates, volatility and credit spreads), either directly or indirectly;
Level 3 — Prices or valuations that require significant unobservable inputs (including GSAM’s assumptions in determining fair value measurement).
Changes in valuation techniques may result in transfers into or out of an assigned level within the hierarchy. In accordance with the Fund’s policy, transfers between different levels of the fair value hierarchy resulting from such changes are deemed to have occurred as of the beginning of the reporting period.
The Board of Trustees (“Trustees”) has approved Valuation Procedures that govern the valuation of the portfolio investments held by the Fund, including investments for which market quotations are not readily available. The Trustees have delegated to GSAM day-to-day responsibility for implementing and maintaining internal controls and procedures related to the valuation of the Fund’s investments. To assess the continuing appropriateness of pricing sources and methodologies, GSAM regularly performs price verification procedures and issues challenges as necessary to third party pricing vendors or brokers, and any differences are reviewed in accordance with the Valuation Procedures.
17
GOLDMAN SACHS VARIABLE INSURANCE TRUST STRATEGIC INTERNATIONAL EQUITY FUND
Notes to Financial Statements (continued)
December 31, 2017
3. INVESTMENTS AND FAIR VALUE MEASUREMENTS (continued)
A. Level 1 and Level 2 Fair Value Investments — The valuation techniques and significant inputs used in determining the fair values for investments classified as Level 1 and Level 2 are as follows:
Equity Securities — Equity securities traded on a U.S. securities exchange or the NASDAQ system, or those located on certain foreign exchanges, including but not limited to the Americas, are valued daily at their last sale price or official closing price on the principal exchange or system on which they are traded. If there is no sale or official closing price or such price is believed by GSAM to not represent fair value, equity securities are valued at the last bid price for long positions and at the last ask price for short positions. To the extent these investments are actively traded, they are classified as Level 1 of the fair value hierarchy, otherwise they are generally classified as Level 2.
Unlisted equity securities for which market quotations are available are valued at the last sale price on the valuation date, or if no sale occurs, at the last bid price. Unlisted equities are generally classified as Level 2 (fair valued and single source broker securities may be treated differently). Securities traded on certain foreign securities exchanges are valued daily at fair value determined by an independent fair value service (if available) under Valuation Procedures approved by the Trustees and consistent with applicable regulatory guidance. The independent fair value service takes into account multiple factors including, but not limited to, movements in the securities markets, certain depositary receipts, futures contracts and foreign currency exchange rates that have occurred subsequent to the close of the foreign securities exchange. These investments are generally classified as Level 2 of the fair value hierarchy.
Underlying Funds (including Money Market Funds) — Underlying Funds (“Underlying Funds”) include other investment companies and exchange-traded funds (“ETFs”). Investments in the Underlying Funds (except ETFs) are valued at the NAV per share of the Institutional Share class on the day of valuation. ETFs are valued daily at the last sale price or official closing price on the principal exchange or system on which the investment is traded. Because the Fund invests in Underlying Funds that fluctuate in value, the Fund’s shares will correspondingly fluctuate in value. To the extent these investments are actively traded, they are classified as Level 1 of the fair value hierarchy, otherwise they are generally classified as Level 2. For information regarding an Underlying Fund’s accounting policies and investment holdings, please see the Underlying Fund’s shareholder report.
B. Level 3 Fair Value Investments — To the extent that significant inputs to valuation models and other alternative pricing sources are unobservable, or if quotations are not readily available, or if GSAM believes that such quotations do not accurately reflect fair value, the fair value of the Fund’s investments may be determined under Valuation Procedures approved by the Trustees. GSAM, consistent with its procedures and applicable regulatory guidance, may make an adjustment to the most recent valuation prices of either domestic or foreign securities in light of significant events to reflect what it believes to be the fair value of the securities at the time of determining the Fund’s NAV. Significant events which could affect a large number of securities in a particular market may include, but are not limited to: significant fluctuations in U.S. or foreign markets; market dislocations; market disruptions; or unscheduled market closings. Significant events which could also affect a single issuer may include, but are not limited to: corporate actions such as reorganizations, mergers and buy-outs; ratings downgrades; and bankruptcies.
18
GOLDMAN SACHS VARIABLE INSURANCE TRUST STRATEGIC INTERNATIONAL EQUITY FUND
3. INVESTMENTS AND FAIR VALUE MEASUREMENTS (continued)
C. Fair Value Hierarchy — The following is a summary of the Fund’s investments classified in the fair value hierarchy as of December 31, 2017:
| | | | | | | | | | | | |
| Investment Type | | Level 1 | | | Level 2 | | | Level 3 | |
| Assets | | | | | | | | | | | | |
| Common Stock and/or Other Equity Investments(a) | | | | | | | | | | | | |
Asia | | $ | — | | | $ | 33,396,571 | | | $ | — | |
Australia and Oceania | | | — | | | | 3,821,678 | | | | — | |
Europe | | | — | | | | 122,096,065 | | | | — | |
North America | | | — | | | | 2,147,105 | | | | — | |
| Investment Company | | | 952,535 | | | | — | | | | — | |
| Total | | $ | 952,535 | | | $ | 161,461,419 | | | $ | — | |
| (a) | Amounts are disclosed by continent to highlight the impact of time zone differences between local market close and the calculation of NAV. Security valuations are based on the principal exchange or system on which they are traded, which may differ from country of domicile noted in the table. The Fund utilizes fair value model prices provided by an independent fair value service for certain international equity securities, resulting in a Level 2 classification. |
For further information regarding security characteristics, see the Schedule of Investments.
4. AGREEMENTS AND AFFILIATED TRANSACTIONS
A. Management Agreement — Under the Agreement, GSAM manages the Fund, subject to the general supervision of the Trustees.
As compensation for the services rendered pursuant to the Agreement, the assumption of the expenses related thereto and administration of the Fund’s business affairs, including providing facilities, GSAM is entitled to a management fee, accrued daily and paid monthly, equal to an annual percentage rate of the Fund’s average daily net assets.
For the fiscal year ended December 31, 2017, contractual and effective net management fees with GSAM were at the following rates:
| | | | | | | | | | | | | | | | | | | | | | | | | | |
| Contractual Management Rate | | | | |
First
$1 billion | | | Next
$1 billion | | | Next
$3 billion | | | Next
$3 billion | | | Over
$8 billion | | | Effective
Rate | | | Effective Net
Management Rate^ | |
| | 0.85% | | | | 0.77 | % | | | 0.73 | % | | | 0.72 | % | | | 0.71 | % | | | 0.85 | % | | | 0.81 | %* |
| ^ | Effective Net Management Rate includes the impact of management fee waivers of affiliated Underlying Funds, if any. |
| * | GSAM agreed to waive a portion of its management fee in order to achieve a net management rate, as defined in the Fund’s most recent prospectus. This waiver will be effective through at least April 28, 2018 and prior to such date GSAM may not terminate the arrangement without approval of the Trustees. For the fiscal year ended December 31, 2017, GSAM waived $63,699 of its management fee. |
19
GOLDMAN SACHS VARIABLE INSURANCE TRUST STRATEGIC INTERNATIONAL EQUITY FUND
Notes to Financial Statements (continued)
December 31, 2017
4. AGREEMENTS AND AFFILIATED TRANSACTIONS (continued)
The Fund invests in Institutional Shares of the Goldman Sachs Financial Square Government Fund, which is an affiliated Underlying Fund. GSAM has agreed to waive a portion of its management fee payable by the Fund in an amount equal to the management fee it earns as an investment adviser to the affiliated Underlying Fund in which the Fund invests, except those management fees it earns from the Fund’s investments of cash collateral received in connection with securities lending transactions in the Goldman Sachs Financial Square Government Fund. For the fiscal year ended December 31, 2017, GSAM waived $775 of the Fund’s management fee.
B. Distribution and/or Service (12b-1) Plan — The Trust, on behalf of Service Shares of the Fund, has adopted a Distribution and Service Plan subject to Rule 12b-1 under the Act. Under the Distribution and Service Plan, Goldman Sachs, which serves as distributor, is entitled to a fee accrued daily and paid monthly, for distribution services and personal and account maintenance services, which may then be paid by Goldman Sachs to authorized dealers, equal to, on an annual basis, 0.25% of the Fund’s average daily net assets attributable to Service Shares.
C. Transfer Agency Agreement — Goldman Sachs also serves as the transfer agent of the Fund for a fee pursuant to the Transfer Agency Agreement. The fees charged for such transfer agency services are accrued daily and paid monthly at an annual rate of 0.02% of the average daily net assets of Institutional and Service Shares.
D. Other Expense Agreements and Affiliated Transactions — GSAM has agreed to limit certain “Other Expenses” of the Fund (excluding acquired fund fees and expenses, transfer agency fees and expenses, service fees and shareholder administration fees (as applicable), taxes, interest, brokerage fees, expenses of shareholder meetings, litigation and indemnification, and extraordinary expenses) to the extent such expenses exceed, on an annual basis, a percentage rate of the average daily net assets of the Fund. Such Other Expense reimbursements, if any, are accrued daily and paid monthly. In addition, the Fund is not obligated to reimburse GSAM for prior fiscal year expense reimbursements, if any. The Other Expense limitation as an annual percentage rate of average daily net assets for the Fund is 0.044%. The Other Expense limitation will remain in place through at least April 28, 2018, and prior to such date GSAM may not terminate the arrangement without the approval of the Trustees. For the fiscal year ended December 31, 2017, GSAM reimbursed $176,325 to the Fund. In addition, the Fund has entered into certain offset arrangements with the custodian and the transfer agent, which may result in a reduction of the Fund’s expenses and are received irrespective of the application of the “Other Expense” limitation described above. For the fiscal year ended December 31, 2017, custody fee credits were $1,413.
E. Line of Credit Facility — As of December 31, 2017, the Fund participated in a $1,100,000,000 committed, unsecured revolving line of credit facility (the “facility”) together with other funds of the Trust and certain registered investment companies having management agreements with GSAM or its affiliates. This facility is to be used for temporary emergency purposes, or to allow for an orderly liquidation of securities to meet redemption requests. The interest rate on borrowings is based on the federal funds rate. The facility also requires a fee to be paid by the Fund based on the amount of the commitment that has not been utilized. For the fiscal year ended December 31, 2017, the Fund did not have any borrowings under the facility.
20
GOLDMAN SACHS VARIABLE INSURANCE TRUST STRATEGIC INTERNATIONAL EQUITY FUND
4. AGREEMENTS AND AFFILIATED TRANSACTIONS (continued)
F. Other Transactions with Affiliates — The following table provides information about the Fund’s investment in the Goldman Sachs Financial Square Government Fund as of and for the fiscal year ended December 31, 2017:
| | | | | | | | | | | | | | | | | | | | | | |
Beginning
Value as of
December 31, 2016 | | | Purchases
at Cost | | | Proceeds
from Sales | | | Ending
Value as of
December 31, 2017 | | | Shares as of
December 31, 2017 | | | Dividend
Income
from
Affiliated
Investment
Company | |
| $ | 10 | | | $ | 15,152,077 | | | $ | (14,199,552 | ) | | $ | 952,535 | | | | 952,535 | | | $ | 3,275 | |
5. PORTFOLIO SECURITIES TRANSACTIONS
The cost of purchases and proceeds from sales and maturities of long-term securities for the fiscal year ended December 31, 2017, were $35,345,924 and $49,370,135, respectively.
6. SECURITIES LENDING
Pursuant to exemptive relief granted by the Securities and Exchange Commission (“SEC”) and the terms and conditions contained therein, the Fund may lend its securities through a securities lending agent, Goldman Sachs Agency Lending (“GSAL”), a wholly-owned subsidiary of Goldman Sachs, to certain qualified borrowers including Goldman Sachs and affiliates. In accordance with the Fund’s securities lending procedures, the Fund receives cash collateral at least equal to the market value of the securities on loan. The market value of the loaned securities is determined at the close of business of the Fund, at their last sale price or official closing price on the principal exchange or system on which they are traded, and any additional required collateral is delivered to the Fund on the next business day. As with other extensions of credit, the Fund may experience delay in the recovery of its securities or incur a loss should the borrower of the securities breach its agreement with the Fund or become insolvent at a time when the collateral is insufficient to cover the cost of repurchasing securities on loan. Dividend income received from securities on loan may not be subject to withholding taxes and therefore withholding taxes paid may differ from the amounts listed in the Statement of Operations. Loans of securities are terminable at any time and as such 1) the remaining contractual maturities of the outstanding securities lending transactions are considered to be overnight and continuous and 2) the borrower, after notice, is required to return borrowed securities within the standard time period for settlement of securities transactions.
The Fund invests the cash collateral received in connection with securities lending transactions in the Goldman Sachs Financial Square Government Fund (“Government Money Market Fund”), an affiliated series of the Trust. The Government Money Market Fund is registered under the Act as an open end investment company, is subject to Rule 2a-7 under the Act, and is managed by GSAM, for which GSAM may receive a management fee of up to 0.205% on an annualized basis of the average daily net assets of the Government Money Market Fund.
In the event of a default by a borrower with respect to any loan, GSAL will exercise any and all remedies provided under the applicable borrower agreement to make the Fund whole. These remedies include purchasing replacement securities by applying the collateral held from the defaulting broker against the purchase cost of the replacement securities. If GSAL is unable to purchase replacement securities, GSAL will indemnify the Fund by paying the Fund an amount equal to the market value of the securities loaned minus the value of cash collateral received from the borrower for the loan, subject to an exclusion for any shortfalls resulting from a loss of value in such cash collateral due to reinvestment risk. The Fund’s loaned securities were all subject to enforceable Securities Lending Agreements and the value of the collateral was at least equal to the value of the cash received. The amounts of the Fund’s overnight and continuous agreements represent the gross amounts of recognized liabilities for securities lending transactions outstanding as of December 31, 2017 are disclosed as “Payable upon return of securities loaned” on the Statement of Assets and Liabilities, where applicable. The Fund did not have securities on loan as of December 31, 2017.
21
GOLDMAN SACHS VARIABLE INSURANCE TRUST STRATEGIC INTERNATIONAL EQUITY FUND
Notes to Financial Statements (continued)
December 31, 2017
6. SECURITIES LENDING (continued)
Both the Fund and GSAL received compensation relating to the lending of the Fund’s securities. The amounts earned, if any, by the Fund for the fiscal year ended December 31, 2017, are reported under Investment Income on the Statement of Operations.
The table below details securities lending activity with affiliates of Goldman Sachs:
| | | | | | | | | | |
| For the Fiscal Year ended December 31, 2017 | | | | |
Earnings of GSAL
Relating to
Securities
Loaned | | | Amounts Received
by the Fund
from Lending to
Goldman Sachs | | | Amounts Payable to
Goldman Sachs
Upon Return of
Securities Loaned as of
December 31, 2017 | |
| $ | 10,568 | | | $ | 8,995 | | | $ | — | |
The following table provides information about the Fund’s investment in the Government Money Market Fund for the fiscal year ended December 31, 2017:
| | | | | | | | | | | | | | | | | | |
Beginning
Value as of
December 31, 2016 | | | Purchases
at Cost | | | Proceeds
from Sales | | | Ending
Value as of
December 31, 2017 | | | Shares as of
December 31, 2017 | |
| $ | 764,701 | | | $ | 53,947,047 | | | $ | (54,711,748 | ) | | $ | — | | | $ | — | |
7. TAX INFORMATION
The tax character of distributions paid during the fiscal years ended December 31, 2016 and December 31, 2017 was as follows:
| | | | | | | | |
| | | 2016 | | | 2017 | |
| Distributions paid from ordinary income | | $ | 2,725,525 | | | $ | 2,648,697 | |
As of December 31, 2017, the components of accumulated earnings (losses) on a tax-basis were as follows:
| | | | |
| Undistributed ordinary income — net | | $ | 107,559 | |
| Capital loss carryforwards: | | | | |
Perpetual long-term(1) | | $ | (4,910,992 | ) |
| Timing differences (Qualified Late Year Loss Deferral) | | | (47,616 | ) |
| Unrealized gains — net | | | 25,825,060 | |
| Total accumulated gains — net | | $ | 20,974,011 | |
| (1) | The Fund had capital loss carryforwards of $63,558,058 which expired in the current fiscal year. |
22
GOLDMAN SACHS VARIABLE INSURANCE TRUST STRATEGIC INTERNATIONAL EQUITY FUND
7. TAX INFORMATION (continued)
As of December 31, 2017, the Fund’s aggregate security unrealized gains and losses based on cost for U.S. federal income tax purposes were as follows:
| | | | |
| Tax cost | | $ | 136,590,150 | |
| Gross unrealized gain | | | 32,083,210 | |
| Gross unrealized loss | | | (6,258,150 | ) |
| Net unrealized gain | | $ | 25,825,060 | |
The difference between GAAP-basis and tax-basis unrealized gains (losses) is attributable primarily to wash sales and differences in the tax treatment of passive foreign investment company investments.
In order to present certain components of the Fund’s capital accounts on a tax-basis, the Fund has reclassified $63,198 of undistributed net investment income and $63,494,860 of accumulated net realized gain from paid-in capital. This reclassification has no impact on the NAV of the Fund and results primarily from expired capital loss carryforwards and differences in the tax treatment of foreign currency transactions and passive foreign investment company investments.
GSAM has reviewed the Fund’s tax positions for all open tax years (the current and prior three years, as applicable) and has concluded that no provision for income tax is required in the Fund’s financial statements. Such open tax years remain subject to examination and adjustment by tax authorities.
8. OTHER RISKS
The Fund’s risks include, but are not limited to, the following:
Foreign and Emerging Countries Risk — Investing in foreign markets may involve special risks and considerations not typically associated with investing in the U.S. Foreign securities may be subject to risk of loss because of more or less foreign government regulation, less public information and less economic, political and social stability in the countries in which the Fund invests. The imposition of exchange controls (including repatriation restrictions), confiscations, trade restrictions (including tariffs) and other government restrictions by the U.S. or other governments, or from problems in share registration, settlement or custody, may also result in losses. Foreign risk also involves the risk of negative foreign currency rate fluctuations, which may cause the value of securities denominated in such foreign currency (or other instruments through which the Fund has exposure to foreign currencies) to decline in value. Currency exchange rates may fluctuate significantly over short periods of time. To the extent that the Fund also invests in securities of issuers located in emerging markets, these risks may be more pronounced.
Foreign Custody Risk — If the Fund invests in foreign securities, the Fund may hold such securities and cash with foreign banks, agents, and securities depositories appointed by the Fund’s custodian (each a “Foreign Custodian”). Some foreign custodians may be recently organized or new to the foreign custody business. In some countries, Foreign Custodians may be subject to little or no regulatory oversight over, or independent evaluation of, their operations. Further, the laws of certain countries may place limitations on the Fund’s ability to recover its assets if a Foreign Custodian enters bankruptcy. Investments in emerging markets may be subject to even greater custody risks than investments in more developed markets. Custody services in emerging market countries are very often undeveloped and may be considerably less well regulated than in more developed countries, and thus may not afford the same level of investor protection as would apply in developed countries.
23
GOLDMAN SACHS VARIABLE INSURANCE TRUST STRATEGIC INTERNATIONAL EQUITY FUND
Notes to Financial Statements (continued)
December 31, 2017
8. OTHER RISKS (continued)
Investments in Other Investment Companies Risk — As a shareholder of another investment company, including an exchange-traded fund (“ETF”), the Fund will indirectly bear its proportionate share of any net management fees and other expenses paid by such other investment companies, in addition to the fees and expenses regularly borne by the Fund. ETFs are subject to risks that do not apply to conventional mutual funds, including but not limited to the following: (i) the market price of the ETF’s shares may trade at a premium or a discount to their NAV; and (ii) an active trading market for an ETF’s shares may not develop or be maintained.
Large Shareholder Transactions Risk — The Fund may experience adverse effects when certain large shareholders, such as other funds, participating insurance companies, accounts and Goldman Sachs affiliates, purchase or redeem large amounts of shares of the Fund. Such large shareholder redemptions may cause the Fund to sell portfolio securities at times when it would not otherwise do so, which may negatively impact the Fund’s NAV and liquidity. These transactions may also accelerate the realization of taxable income to shareholders if such sales of investments resulted in gains, and may also increase transaction costs. In addition, a large redemption could result in the Fund’s current expenses being allocated over a smaller asset base, leading to an increase in the Fund’s expense ratio. Similarly, large Fund share purchases may adversely affect the Fund’s performance to the extent that the Fund is delayed in investing new cash and is required to maintain a larger cash position than it ordinarily would.
Liquidity Risk — The Fund may make investments that are illiquid or that may become less liquid in response to market developments or adverse investor perceptions. Illiquid investments may be more difficult to value. Liquidity risk may also refer to the risk that the Fund will not be able to pay redemption proceeds within the allowable time period because of unusual market conditions, an unusually high volume of redemption requests, or other reasons. To meet redemption requests, the Fund may be forced to sell investments at an unfavorable time and/or under unfavorable conditions.
Market and Credit Risks — In the normal course of business, the Fund trades financial instruments and enters into financial transactions where risk of potential loss exists due to changes in the market (market risk). Additionally, the Fund may also be exposed to credit risk in the event that an issuer or guarantor fails to perform or that an institution or entity with which the Fund has unsettled or open transactions defaults.
9. INDEMNIFICATIONS
Under the Trust’s organizational documents, its Trustees, officers, employees and agents are indemnified, to the extent permitted by the Act and state law, against certain liabilities that may arise out of performance of their duties to the Fund. Additionally, in the course of business, the Fund enters into contracts that contain a variety of indemnification clauses. The Fund’s maximum exposure under these arrangements is unknown, as this would involve future claims that may be made against the Fund that have not yet occurred. However, GSAM believes the risk of loss under these arrangements to be remote.
10. OTHER MATTERS
At a meeting held on December 13, 2017, the Board of Trustees of the Trust approved certain changes to the Fund’s name and principal investment strategy. GSAM also proposed changes to the Fund’s portfolio managers in light of these changes. The Fund’s name will change to the Goldman Sachs International Equity Insights Fund. These changes will take effect on April 23, 2018.
11. SUBSEQUENT EVENTS
Subsequent events after the Statement of Assets and Liabilities date have been evaluated, and GSAM has concluded that there is no impact requiring adjustment or disclosure in the financial statements.
24
GOLDMAN SACHS VARIABLE INSURANCE TRUST STRATEGIC INTERNATIONAL EQUITY FUND
12. SUMMARY OF SHARE TRANSACTIONS
Share activity is as follows:
| | | | | | | | | | | | | | | | |
| | | For the Fiscal Year Ended
December 31, 2017 | | | For the Fiscal Year Ended
December 31, 2016 | |
| | | Shares | | | Dollars | | | Shares | | | Dollars | |
| Institutional Shares | | | | | | | | | | | | | | | | |
| Shares sold | | | 116,273 | | | $ | 1,205,739 | | | | 110,254 | | | $ | 974,934 | |
| Reinvestment of distributions | | | 68,179 | | | | 739,059 | | | | 89,902 | | | | 781,242 | |
| Shares redeemed | | | (603,057 | ) | | | (6,124,918 | ) | | | (510,122 | ) | | | (4,546,751 | ) |
| | | | (418,605 | ) | | | (4,180,120 | ) | | | (309,966 | ) | | | (2,790,575 | ) |
| Service Shares | | | | | | | | | | | | | | | | |
| Shares sold | | | 729,786 | | | | 6,682,789 | | | | 1,080,345 | | | | 9,775,806 | |
| Reinvestment of distributions | | | 175,842 | | | | 1,909,638 | | | | 223,224 | | | | 1,944,283 | |
| Shares redeemed | | | (1,563,959 | ) | | | (15,807,702 | ) | | | (1,984,717 | ) | | | (17,688,164 | ) |
| | | | (658,331 | ) | | | (7,215,275 | ) | | | (681,148 | ) | | | (5,968,075 | ) |
| NET DECREASE | | | (1,076,936 | ) | | $ | (11,395,395 | ) | | | (991,114 | ) | | $ | (8,758,650 | ) |
25
Report of Independent Registered Public Accounting Firm
To the Board of Trustees of
Goldman Sachs Variable Insurance Trust and Shareholders of the Goldman Sachs Strategic International Equity Fund
Opinion on the Financial Statements
We have audited the accompanying statement of assets and liabilities, including the schedule of investments, of the Goldman Sachs Strategic International Equity Fund (the “Fund”) as of December 31, 2017, the related statement of operations for the year ended December 31, 2017, the statements of changes in net assets for each of the two years in the period ended December 31, 2017, including the related notes, and the financial highlights for each of the five years in the period ended December 31, 2017 (collectively referred to as the “financial statements”). In our opinion, the financial statements present fairly, in all material respects, the financial position of the Fund as of December 31, 2017, the results of its operations for the year then ended, the changes in its net assets for each of the two years in the period ended December 31, 2017 and the financial highlights for each of the five years in the period ended December 31, 2017 in conformity with accounting principles generally accepted in the United States of America.
Basis for Opinion
These financial statements are the responsibility of the Fund’s management. Our responsibility is to express an opinion on the Fund’s financial statements based on our audits. We are a public accounting firm registered with the Public Company Accounting Oversight Board (United States) (“PCAOB”) and are required to be independent with respect to the Fund in accordance with the U.S. federal securities laws and the applicable rules and regulations of the Securities and Exchange Commission and the PCAOB.
We conducted our audits of these financial statements in accordance with the standards of the PCAOB. Those standards require that we plan and perform the audit to obtain reasonable assurance about whether the financial statements are free of material misstatement, whether due to error or fraud.
Our audits included performing procedures to assess the risks of material misstatement of the financial statements, whether due to error or fraud, and performing procedures that respond to those risks. Such procedures included examining, on a test basis, evidence regarding the amounts and disclosures in the financial statements. Our audits also included evaluating the accounting principles used and significant estimates made by management, as well as evaluating the overall presentation of the financial statements. Our procedures included confirmation of securities owned as of December 31, 2017 by correspondence with the custodian and transfer agent. We believe that our audits provide a reasonable basis for our opinion.
PricewaterhouseCoopers LLP
Boston, Massachusetts
February 14, 2018
We have served as the auditor of one or more investment companies in the Goldman Sachs Fund complex since 2000.
26
GOLDMAN SACHS VARIABLE INSURANCE TRUST STRATEGIC INTERNATIONAL EQUITY FUND
|
| Fund Expenses — Six Month Period Ended December 31, 2017 (Unaudited) |
As a shareholder of Institutional or Service Shares of the Fund, you incur ongoing costs, including management fees, distribution and/or service (12b-1) fees (with respect to Service Shares) and other Fund expenses. This example is intended to help you understand your ongoing costs (in dollars) of investing in the Institutional Shares and Service Shares of the Fund and to compare these costs with the ongoing costs of investing in other mutual funds.
The example is based on an investment of $1,000 invested at the beginning of the period and held for the entire period from July 1, 2017 through December 31, 2017, which represents a period of 184 days of a 365 day year.
Actual Expenses — The first line under each share class in the table below provides information about actual account values and actual expenses. You may use the information in this line, together with the amount you invested, to estimate the expenses that you paid over the period. Simply divide your account value by $1,000 (for example, an $8,600 account value divided by $1,000=8.6), then multiply the result by the number in the first line under the heading entitled “Expenses Paid” to estimate the expenses you paid on your account during this period.
Hypothetical Example for Comparison Purposes — The second line under each share class in the table below provides information about hypothetical account values and hypothetical expenses based on the Fund’s actual net expense ratio and an assumed rate of return of 5% per year before expenses, which is not the Fund’s actual return. The hypothetical account values and expenses may not be used to estimate the actual ending account balance or expenses you paid for the period. You may use this information to compare the ongoing costs of investing in the Fund and other funds. To do so, compare this 5% hypothetical example with the 5% hypothetical examples that appear in the shareholder reports of the other funds.
Please note that the expenses shown in the table are meant to highlight your ongoing costs only. As a shareholder of the Fund you do not incur any transaction costs, such as sales charges, redemption fees, or exchange fees, but shareholders of other funds may incur such costs.The second line of the table is useful in comparing ongoing costs only and will not help you determine the relative total costs of owning different funds whose shareholders may incur transaction costs.
| | | | | | | | | | | | |
| Share Class | | Beginning
Account Value
07/01/17 | | | Ending
Account Value
12/31/17 | | | Expenses Paid
for the
6 Months
Ended
12/31/17* | |
| Institutional | | | | | | | | | | | | |
| Actual | | $ | 1,000 | | | $ | 1,093.60 | | | $ | 4.59 | |
| Hypothetical 5% return | | | 1,000 | | | | 1,020.82 | + | | | 4.43 | |
| Service | | | | | | | | | | | | |
| Actual | | | 1,000 | | | | 1,091.70 | | | | 5.90 | |
| Hypothetical 5% return | | | 1,000 | | | | 1,019.56 | + | | | 5.70 | |
| | * | Expenses are calculated using the Fund’s annualized net expense ratio for each class, which represents the ongoing expenses as a percentage of net assets for the six months ended December 31, 2017. Expenses are calculated by multiplying the annualized net expense ratio by the average account value for the period; then multiplying the result by the number of days in the most recent fiscal half year; and then dividing that result by the number of days in the fiscal year. The annualized net expense ratios for the period were 0.87% and 1.12% for the Institutional and Service Shares, respectively. | |
| | + | Hypothetical expenses are based on the Fund’s actual annualized net expense ratios and an assumed rate of return of 5% per year before expenses. | |
27
GOLDMAN SACHS VARIABLE INSURANCE TRUST STRATEGIC INTERNATIONAL EQUITY FUND
Trustees and Officers (Unaudited)
Independent Trustees
| | | | | | | | | | |
| | | | | |
Name,
Address and Age1 | | Position(s) Held with the Trust | | Term of Office and
Length of
Time Served2 | | Principal Occupation(s) During Past 5 Years | | Number of
Portfolios in
Fund Complex
Overseen by
Trustee3 | | Other Directorships Held by Trustee4 |
Jessica Palmer Age: 68 | | Chair of the Board of Trustees | | 2018 (Trustee since 2007) | | Ms. Palmer is retired. She is Director, Emerson Center for the Arts and Culture (2011-Present); and was formerly a Consultant, Citigroup Human Resources Department (2007-2008); Managing Director, Citigroup Corporate and Investment Banking (previously, Salomon Smith Barney/Salomon Brothers) (1984-2006). Ms. Palmer was a Member of the Board of Trustees of Indian Mountain School (private elementary and secondary school) (2004-2009). Chair of the Board of Trustees — Goldman Sachs Trust and Goldman Sachs Variable Insurance Trust. | | 105 | | None |
Kathryn A. Cassidy Age: 63 | | Trustee | | Since 2015 | | Ms. Cassidy is retired. Formerly, she was Advisor to the Chairman (May 2014-December 2014); and Senior Vice President and Treasurer (2008-2014), General Electric Company & General Electric Capital Corporation (technology and financial services companies). Trustee — Goldman Sachs Trust and Goldman Sachs Variable Insurance Trust. | | 105 | | None |
Diana M. Daniels Age: 68 | | Trustee | | Since 2007 | | Ms. Daniels is retired. Formerly, she was Vice President, General Counsel and Secretary, The Washington Post Company (1991-2006). Ms. Daniels is a Trustee Emeritus and serves as a Presidential Councillor of Cornell University (2013-Present); former Member of the Legal Advisory Board, New York Stock Exchange (2003-2006) and of the Corporate Advisory Board, Standish Mellon Management Advisors (2006-2007). Trustee — Goldman Sachs Trust and Goldman Sachs Variable Insurance Trust. | | 105 | | None |
Herbert J. Markley Age: 67 | | Trustee | | Since 2013 | | Mr. Markley is retired. Formerly, he was Executive Vice President, Deere & Company (an agricultural and construction equipment manufacturer) (2007-2009); and President, Agricultural Division, Deere & Company (2001-2007). Previously, Mr. Markley served as an Advisory Board Member of Goldman Sachs Trust and Goldman Sachs Variable Insurance Trust (June 2013-October 2013). Trustee — Goldman Sachs Trust and Goldman Sachs Variable Insurance Trust. | | 105 | | None |
Roy W. Templin Age: 57 | | Trustee | | Since 2013 | | Mr. Templin is retired. He is Director, Armstrong World Industries, Inc. (a designer and manufacturer of ceiling, wall and suspension system solutions) (2016–Present); and was formerly Chairman of the Board of Directors, Con-Way Incorporated (a transportation, logistics and supply chain management service company) (2014-2015); Executive Vice President and Chief Financial Officer, Whirlpool Corporation (an appliance manufacturer and marketer) (2004-2012). Previously, Mr. Templin served as an Advisory Board Member of Goldman Sachs Trust and Goldman Sachs Variable Insurance Trust (June 2013-October 2013). Trustee — Goldman Sachs Trust and Goldman Sachs Variable Insurance Trust. | | 105 | | Armstrong World Industries, Inc. (a ceiling, wall and suspension systems solutions manufacturer) |
| | | | | | | | | | |
28
GOLDMAN SACHS VARIABLE INSURANCE TRUST STRATEGIC INTERNATIONAL EQUITY FUND
Trustees and Officers (Unaudited) (continued)
Independent Trustees
| | | | | | | | | | |
| | | | | |
Name,
Address and Age1 | | Position(s) Held with the Trust | | Term of Office and
Length of
Time Served2 | | Principal Occupation(s) During Past 5 Years | | Number of
Portfolios in
Fund Complex
Overseen by
Trustee3 | | Other Directorships Held by Trustee4 |
Gregory G. Weaver Age: 66 | | Trustee | | Since 2015 | | Mr. Weaver is retired. He is Director, Verizon Communications Inc. (2015-Present); and was formerly Chairman and Chief Executive Officer, Deloitte & Touche LLP (a professional services firm) (2001-2005 and 2012-2014); and Member of the Board of Directors, Deloitte & Touche LLP (2006-2012). Trustee — Goldman Sachs Trust and Goldman Sachs Variable Insurance Trust. | | 105 | | Verizon Communications Inc. |
| | | | | | | | | | |
29
GOLDMAN SACHS VARIABLE INSURANCE TRUST STRATEGIC INTERNATIONAL EQUITY FUND
Trustees and Officers (Unaudited) (continued)
Interested Trustee*
| | | | | | | | | | |
| | | | | |
Name,
Address and Age1 | | Position(s) Held with the Trust | | Term of Office and
Length of
Time Served2 | | Principal Occupation(s) During Past 5 Years | | Number of
Portfolios in
Fund Complex
Overseen by
Trustee3 | | Other Directorships Held by Trustee4 |
James A. McNamara Age: 55 | | President and Trustee | | Since 2007 | | Managing Director, Goldman Sachs (January 2000-Present); Director of Institutional Fund Sales, GSAM (April 1998-December 2000); and Senior Vice President and Manager, Dreyfus Institutional Service Corporation (January 1993- April 1998). President and Trustee — Goldman Sachs Trust; Goldman Sachs Variable Insurance Trust; Goldman Sachs Trust II; Goldman Sachs MLP Income Opportunities Fund; Goldman Sachs MLP and Energy Renaissance Fund; Goldman Sachs ETF Trust; Goldman Sachs Private Markets Fund 2018 LLC; Goldman Sachs Private Markets Fund 2018 (A) LLC; and Goldman Sachs Private Markets Fund 2018 (B) LLC. | | 146 | | None |
| | | | | | | | | | |
| * | Mr. McNamara is considered to be an “Interested Trustee” because he holds positions with Goldman Sachs and owns securities issued by The Goldman Sachs Group, Inc. Mr. McNamara holds comparable positions with certain other companies of which Goldman Sachs, GSAM or an affiliate thereof is the investment adviser, administrator and/or distributor. |
| 1 | Each Trustee may be contacted by writing to the Trustee, c/o Goldman Sachs, 200 West Street, New York, New York, 10282, Attn: Caroline Kraus. Information is provided as of December 31, 2017. |
| 2 | Subject to such policies as may be adopted by the Board from time-to-time, each Trustee holds office for an indefinite term, until the earliest of: (a) the election of his or her successor; (b) the date the Trustee resigns or is removed by the Board or shareholders, in accordance with the Trust’s Declaration of Trust; or (c) the termination of the Trust. The Board has adopted policies which provide that (a) no Trustee shall hold office for more than 15 years and (b) a Trustee shall retire as of December 31st of the calendar year in which he or she reaches his or her 74th birthday, unless a waiver of such requirement shall have been adopted by a majority of the other Trustees. These policies may be changed by the Trustees without shareholder vote. |
| 3 | The Goldman Sachs Fund Complex includes certain other companies listed above for each respective Trustee. As of December 31, 2017,��Goldman Sachs Trust consisted of 91 portfolios (90 of which offered shares to the public); Goldman Sachs Variable Insurance Trust consisted of 14 portfolios; Goldman Sachs Trust II consisted of 17 portfolios (16 of which offered shares to the public); Goldman Sachs BDC, Inc., Goldman Sachs Private Middle Market Credit LLC, Goldman Sachs MLP Income Opportunities Fund, Goldman Sachs MLP and Energy Renaissance Fund, Goldman Sachs Private Markets Fund 2018 LLC, Goldman Sachs Private Markets Fund 2018 (A) LLC and Goldman Sachs Private Markets Fund 2018 (B) LLC each consisted of one portfolio; and Goldman Sachs ETF Trust consisted of 19 portfolios (12 of which offered shares to the public). Goldman Sachs Private Middle Market Credit LLC, Goldman Sachs Private Markets Fund 2018 LLC, Goldman Sachs Private Markets Fund 2018 (A) LLC and Goldman Sachs Private Markets Fund 2018 (B) LLC do not offer shares to the public. |
| 4 | This column includes only directorships of companies required to report to the Securities and Exchange Commission under the Securities Exchange Act of 1934 (i.e., “public companies”) or other investment companies registered under the Act. |
Additional information about the Trustees is available in the Fund’s Statement of Additional Information, which can be obtained from Goldman Sachs free of charge by calling this toll-free number (in the United States of America): 1-800-526-7384.
30
GOLDMAN SACHS VARIABLE INSURANCE TRUST STRATEGIC INTERNATIONAL EQUITY FUND
Trustees and Officers (Unaudited) (continued)
Officers of the Trust*
| | | | | | |
| | | |
| Name, Address and Age1 | | Position(s) Held with the Trust | | Term of
Office and
Length of
Time Served2 | | Principal Occupation(s) During Past 5 Years |
James A. McNamara 200 West Street New York, NY 10282 Age: 55 | | Trustee and President | | Since 2007 | | Managing Director, Goldman Sachs (January 2000-Present); Director of Institutional Fund Sales, GSAM (April 1998-December 2000); and Senior Vice President and Manager, Dreyfus Institutional Service Corporation (January 1993-April 1998). President and Trustee — Goldman Sachs Trust; Goldman Sachs Variable Insurance Trust; Goldman Sachs Trust II; Goldman Sachs MLP Income Opportunities Fund; Goldman Sachs MLP and Energy Renaissance Fund; Goldman Sachs ETF Trust; Goldman Sachs Private Markets Fund 2018 LLC; Goldman Sachs Private Markets Fund 2018 (A) LLC; and Goldman Sachs Private Markets Fund 2018 (B) LLC. |
Caroline L. Kraus 200 West Street New York, NY 10282 Age: 40 | | Secretary | | Since 2012 | | Managing Director, Goldman Sachs (January 2016-Present); Vice President, Goldman Sachs (August 2006-December 2015); Associate General Counsel, Goldman Sachs (2012-Present); Assistant General Counsel, Goldman Sachs (August 2006-December 2011); and Associate, Weil, Gotshal & Manges, LLP (2002-2006). Secretary — Goldman Sachs Trust (previously Assistant Secretary (2012)); Goldman Sachs Variable Insurance Trust (previously Assistant Secretary (2012)); Goldman Sachs Trust II; Goldman Sachs BDC, Inc.; Goldman Sachs Private Middle Market Credit LLC; Goldman Sachs Middle Market Lending Corp.; Goldman Sachs MLP Income Opportunities Fund; Goldman Sachs MLP and Energy Renaissance Fund; Goldman Sachs ETF Trust; Goldman Sachs Private Markets Fund 2018 LLC; Goldman Sachs Private Markets Fund 2018 (A) LLC; and Goldman Sachs Private Markets Fund 2018 (B) LLC. |
Scott M. McHugh 200 West Street New York, NY 10282 Age: 46 | | Treasurer, Senior Vice President and Principal Financial Officer | | Since 2009 (Principal Financial Officer since 2013) | | Managing Director, Goldman Sachs (January 2016-Present); Vice President, Goldman Sachs (February 2007-December 2015); Assistant Treasurer of certain mutual funds administered by DWS Scudder (2005-2007); and Director (2005-2007), Vice President (2000-2005), and Assistant Vice President (1998-2000), Deutsche Asset Management or its predecessor (1998-2007). Treasurer, Senior Vice President and Principal Financial Officer — Goldman Sachs Trust; Goldman Sachs Variable Insurance Trust; Goldman Sachs Trust II; Goldman Sachs MLP Income Opportunities Fund; Goldman Sachs MLP and Energy Renaissance Fund; Goldman Sachs ETF Trust; Goldman Sachs Private Markets Fund 2018 LLC; Goldman Sachs Private Markets Fund 2018 (A) LLC; and Goldman Sachs Private Markets Fund 2018 (B) LLC. |
Joseph F. DiMaria 30 Hudson Street Jersey City, NJ 07302 Age: 49 | | Assistant Treasurer and Principal Accounting Officer | | Since 2016 (Principal Accounting Officer since 2017) | | Managing Director, Goldman Sachs (November 2015-Present) and Vice President — Mutual Fund Administration, Columbia Management Investment Advisers, LLC (May 2010-October 2015). Assistant Treasurer and Principal Accounting Officer — Goldman Sachs Trust; Goldman Sachs Variable Insurance Trust; Goldman Sachs Trust II; Goldman Sachs MLP Income Opportunities Fund; Goldman Sachs MLP and Energy Renaissance Fund; Goldman Sachs ETF Trust; Goldman Sachs Private Markets Fund 2018 LLC; Goldman Sachs Private Markets Fund 2018 (A) LLC; and Goldman Sachs Private Markets Fund 2018 (B) LLC. |
| | | | | | |
| * | Represents a partial list of officers of the Trust. Additional information about all the officers is available in the Fund’s Statement of Additional Information, which can be obtained from Goldman Sachs free of charge by calling this toll-free number (in the United States): 1-800-526-7384. |
| 1 | Information is provided as of December 31, 2017. |
| 2 | Officers hold office at the pleasure of the Board of Trustees or until their successors are duly elected and qualified. Each officer holds comparable positions with certain other companies of which Goldman Sachs, GSAM or an affiliate thereof is the investment adviser, administrator and/or distributor. |
31
GOLDMAN SACHS VARIABLE INSURANCE TRUST STRATEGIC INTERNATIONAL EQUITY FUND
Goldman Sachs Variable Insurance Trust — Tax Information (Unaudited)
For the 2017 tax year, the Strategic International Equity Fund has elected to pass through a credit for taxes paid to foreign jurisdictions. The total amount of income received by the Strategic International Equity Fund from sources within foreign countries and possessions of the United States was $0.1508 per share, all of which is attributable to qualified passive income. The percentage of net investment income dividends paid by the Fund during the year ended December 31, 2017 from foreign sources was 79.41%. The total amount of foreign taxes paid by the Fund was $0.0189 per share.
32
| | |
| TRUSTEES | | OFFICERS |
Jessica Palmer, Chair | | James A. McNamara, President |
| Kathryn A. Cassidy | | Scott M. McHugh, Treasurer, Senior Vice |
| Diana M. Daniels | | President and Principal Financial Officer |
| Herbert J. Markley | | Joseph F. DiMaria, Assistant Treasurer and Principal Accounting Officer Caroline L. Kraus, Secretary |
| James A. McNamara | |
| Roy W. Templin | |
| Gregory G. Weaver | | |
GOLDMAN SACHS & CO. LLC
Distributor and Transfer Agent
GOLDMAN SACHS ASSET MANAGEMENT, L.P.
Investment Adviser
200 West Street, New York
New York 10282
Visit our web site at www.GSAMFUNDS.com to obtain the most recent month-end returns.
The reports concerning the Fund included in this shareholder report may contain certain forward-looking statements about the factors that may affect the performance of the Fund in the future. These statements are based on Fund management’s predictions and expectations concerning certain future events and their expected impact on the Fund, such as performance of the economy as a whole and of specific industry sectors, changes in the levels of interest rates, the impact of developing world events, and other factors that may influence the future performance of the Fund. Management believes these forward-looking statements to be reasonable, although they are inherently uncertain and difficult to predict. Actual events may cause adjustments in portfolio management strategies from those currently expected to be employed.
A description of the policies and procedures that the Fund uses to determine how to vote proxies relating to portfolio securities and information regarding how the Fund voted proxies relating to portfolio securities during the most recent 12-month period ended December 31 is available (i) without charge, upon request by calling 1-800-621-2550; and (ii) on the Securities and Exchange Commission (“SEC”) web site at http://www.sec.gov.
The Fund files its complete schedule of portfolio holdings with the SEC for the first and third quarters of each fiscal year on Form N-Q. The Fund’s Form N-Qs are available on the SEC’s web site at http://www.sec.gov within 60 days after the Fund’s first and third fiscal quarters. The Fund’s Form N-Qs may be reviewed and copied at the SEC’s Public Reference Room in Washington, D.C. and information on the operation of the Public Reference Room may also be obtained by calling 1-800-SEC-0330. Form N-Qs may be obtained upon request and without charge by calling 1-800-621-2550.
Views and opinions expressed are for informational purposes only and do not constitute a recommendation by GSAM to buy, sell, or hold any security. Views and opinions are current as of the date of this presentation and may be subject to change, they should not be construed as investment advice.
Goldman Sachs & Co. LLC (“Goldman Sachs”) does not provide legal, tax or accounting advice. Any statement contained in this communication (including any attachments) concerning U.S. tax matters was not intended or written to be used, and cannot be used, for the purpose of avoiding penalties under the Internal Revenue Code, and was written to support the promotion or marketing of transaction or matter addressed. Clients of Goldman Sachs should obtain their own independent tax advice based on their particular circumstances.
The website links provided are for your convenience only and are not an endorsement or recommendation by GSAM of any of these websites or the products or services offered. GSAM is not responsible for the accuracy and validity of the content of these websites.
Economic and market forecasts presented herein reflect our judgment as of the date of this presentation and are subject to change without notice. These forecasts do not take into account the specific investment objectives, restrictions, tax and financial situation or other needs of any specific client. Actual data will vary and may not be reflected here. These forecasts are subject to high levels of uncertainty that may affect actual performance. Accordingly, these forecasts should be viewed as merely representative of a broad range of possible outcomes. These forecasts are estimated, based on assumptions, and are subject to significant revision and may change materially as economic and market conditions change. Goldman Sachs has no obligation to provide updates or changes to these forecasts. Case studies and examples are for illustrative purposes only.
Fund holdings and allocations shown are as of December 31, 2017 and may not be representative of future investments. Fund holdings should not be relied on in making investment decisions and should not be construed as research or investment advice regarding particular securities. Current and future holdings are subject to risk.
References to indices, benchmarks or other measures of relative market performance over a specified period of time are provided for your information only and do not imply that the portfolio will achieve similar results. The index composition may not reflect the manner in which a portfolio is constructed. While an adviser seeks to design a portfolio which reflects appropriate risk and return features, portfolio characteristics may deviate from those of the benchmark.
The Global Industry Classification Standard (“GICS”) was developed by and is the exclusive property and a service mark of Morgan Stanley Capital International Inc. (“MSCI”) and Standard & Poor’s, a division of The McGraw-Hill Companies, Inc. (“S&P”) and is licensed for use by Goldman Sachs. Neither MSCI, S&P nor any other party involved in making or compiling the GICS or any GICS classifications makes any express or implied warranties or representations with respect to such standard or classification (or the results to be obtained by the use thereof), and all such parties hereby expressly disclaim all warranties of originality, accuracy, completeness, merchantability or fitness for a particular purpose with respect to any of such standard or classification. Without limiting any of the foregoing, in no event shall MSCI, S&P, any of their affiliates or any third party involved in making or compiling the GICS or any GICS classifications have any liability for any direct, indirect, special, punitive, consequential or any other damages (including lost profits) even if notified of the possibility of such damages.
The portfolio risk management process includes an effort to monitor and manage risk, but does not imply low risk.
Shares of the Goldman Sachs VIT Funds are offered to separate accounts of participating life insurance companies for the purpose of funding variable annuity contracts and variable life insurance policies. Shares of the Fund are not offered directly to the general public. The variable annuity contracts and variable life insurance policies are described in the separate prospectuses issued by participating insurance companies. You should refer to those prospectuses for information about surrender charges, mortality and expense risk fees and other charges that may be assessed by participating insurance companies under the variable annuity contracts or variable life insurance policies. Such fees or charges, if any, may affect the return you may realize with respect to your investments. Ask your representative for more complete information. Please consider a fund’s objectives, risks and charges and expenses, and read the prospectus carefully before investing. The prospectus contains this and other information about the Fund.
This material is not authorized for distribution to prospective investors unless preceded or accompanied by a current prospectus or summary prospectus, if applicable. Investors should consider the Fund’s objective, risks, and charges and expenses, and read the summary prospectus, if available, and/or the prospectus carefully before investing or sending money. The summary prospectus, if available, and the prospectus contain this and other information about the Fund and may be obtained from your authorized dealer or from Goldman Sachs & Co. LLC by calling 1-800-621-2550.
THIS MATERIAL IS FOR INFORMATIONAL PURPOSES ONLY AND IS PROVIDED SOLELY ON THE BASIS THAT IT WILL NOT CONSTITUTE INVESTMENT OR OTHER ADVICE OR A RECOMMENDATION RELATING TO ANY PERSON’S OR PLAN’S INVESTMENT OR OTHER DECISIONS, AND GOLDMAN SACHS IS NOT A FIDUCIARY OR ADVISOR WITH RESPECT TO ANY PERSON OR PLAN BY REASON OF PROVIDING THE MATERIAL OR CONTENT HEREIN INCLUDING UNDER THE EMPLOYEE RETIREMENT INCOME SECURITY ACT OF 1974 OR DEPARTMENT OF LABOR REGULATIONS. PLAN SPONSORS AND OTHER FIDUCIARIES SHOULD CONSIDER THEIR OWN CIRCUMSTANCES IN ASSESSING ANY POTENTIAL COURSE OF ACTION.
This report is prepared for the general information of contract owners and is not an offer of shares of the Goldman Sachs Variable Insurance Trust — Goldman Sachs Strategic International Equity Fund.
© 2018 Goldman Sachs. All rights reserved.
VITINTLAR-18/119282-OTU-698893
Goldman
Sachs Variable Insurance Trust
Goldman Sachs
U.S. Equity Insights Fund
Annual Report
December 31, 2017

GOLDMAN SACHS VARIABLE INSURANCE TRUST U.S. EQUITY INSIGHTS FUND
INVESTMENT OBJECTIVE
The Fund seeks long-term growth of capital and dividend income.
Portfolio Management Discussion and Analysis
Below, the Goldman Sachs Quantitative Investment Strategies (“QIS”) Team discusses the Goldman Sachs Variable Insurance Trust — Goldman Sachs U.S. Equity Insights Fund’s (the “Fund”) performance and positioning for the 12-month period ended December 31, 2017 (the “Reporting Period”).
How did the Fund perform during the Reporting Period?
During the Reporting Period, the Fund’s Institutional and Service Shares generated average annual total returns of 24.07% and 23.80%, respectively. These returns compare to the 21.83% average annual total return of the Fund’s benchmark, the Standard & Poor’s 500® Index (with dividends reinvested) (the “S&P 500® Index”) during the same time period.
What economic and market factors most influenced the equity markets as a whole during the Reporting Period?
Representing the U.S. equity market, the S&P 500® Index gained 21.83% during the Reporting Period. It was a banner year for U.S. equities, with the S&P 500® Index advancing for 12 consecutive months in 2017, a feat that had previously never been accomplished in a single calendar year. Overall, stocks were boosted by a combination of accelerating economic growth, rising corporate earnings and a general lack of negative financial headlines. U.S. equity market volatility was at historic lows.
U.S. equities rallied to new highs at the start of 2017 on prospects of deregulation, tax reform and infrastructure spending as well as on stronger economic data. In March 2017, the U.S. Federal Reserve (the “Fed”) raised interest rates for the third time since the 2008 global financial crisis, which was met with dovish market reaction. (Dovish tends to suggest lower interest rates; opposite of hawkish.) U.S. equities were virtually flat, albeit positive, in March 2017 and then continued to climb higher in April 2017 on strong earnings results and receding European political risk. Although the labor market remained strong, economic activity and inflation moderated during the second calendar quarter. In the third calendar quarter, U.S. economic activity and labor market data showed consistent strength, with a reversal of five consecutive downside inflation surprises. Progress on tax reform and strong economic activity data remained supportive for U.S. equities in October and November 2017. The Fed delivered the third rate hike of 2017 in December as had been widely expected, having done similarly in June 2017, and maintained its projections for three additional interest rate hikes in 2018. U.S. equities gained additional momentum toward the end of the Reporting Period from the passage of a tax reform bill that reduced the corporate tax rate from 35% to 21%. The fourth quarter of 2017 marked the ninth consecutive quarter of positive returns for the S&P 500® Index, its strongest quarterly advance in four years.
For the Reporting Period overall, information technology, materials and consumer discretionary were the best performing sectors in the S&P 500® Index, as measured by total return. The weakest performing sectors in the S&P 500® Index were telecommunication services and energy, the only two to post negative absolute returns, followed by real estate, which was comparatively weak but generated a positive return during the Reporting Period.
Within the U.S. equity market, there was significant disparity in performance not only among sectors but also among the various capitalization and style segments. While all capitalization segments posted positive returns, large-cap stocks, as measured by the Russell 1000® Index, performed best, followed by mid-cap stocks, as measured by the Russell Midcap® Index, and then at some distance by small-cap stocks, as measured by the Russell 2000® Index. From a style perspective, growth-oriented stocks significantly outpaced value-oriented stocks across the capitalization spectrum. (All as measured by the Russell indices.)
What key factors were responsible for the Fund’s performance during the Reporting Period?
During the Reporting Period, the Fund outperformed the S&P 500® Index largely due to stock selection driven by our quantitative model and five of our quantitative model’s six investment themes.
What impact did the Fund’s investment themes have on performance during the Reporting Period?
As expected, and in keeping with our investment approach, our quantitative model and its six investment themes — Valuation, Profitability, Quality, Management, Momentum and Sentiment — had the greatest impact on relative performance. We use these themes to take a long-term view of market patterns and look for inefficiencies, selecting stocks for the Fund and overweighting or underweighting the ones chosen by the model. Over time and by design, the performance of any one of the model’s investment
1
GOLDMAN SACHS VARIABLE INSURANCE TRUST U.S. EQUITY INSIGHTS FUND
themes tends to have a low correlation with the model’s other themes, demonstrating the diversification benefit of the Fund’s theme-driven quantitative model. The variance in performance supports our research indicating that the diversification provided by the Fund’s different investment themes has been a significant investment advantage over the long term, even though the Fund may experience underperformance in the short term. Of course, diversification does not protect an investor from market risk nor does it ensure a profit.
During the Reporting Period, five of our six investment themes contributed positively to relative returns. Momentum contributed most positively to relative performance, followed by Valuation and Quality. The Profitability and Management themes also contributed positively, albeit to a lesser extent. The Momentum theme seeks to predict drifts in stock prices caused by delayed investor reaction to company-specific information and information about related companies. The Valuation theme attempts to capture potential mispricings of securities, typically by comparing a measure of the company’s intrinsic value to its market value. The Quality theme assesses both firm and financial quality. The Profitability theme assesses whether a company is earning more than its cost of capital. The Management theme assesses the characteristics, policies and strategic decisions of company managements.
The Sentiment theme was the only one that detracted from the Fund’s relative returns during the Reporting Period. The Sentiment theme reflects selected investment views and decisions of individuals and financial intermediaries.
How did the Fund’s sector and industry allocations affect relative performance?
In constructing the Fund’s portfolio, we focus on picking stocks rather than making industry or sector bets. Consequently, the Fund is similar to its benchmark, the S&P 500® Index, in terms of its industry and sector allocation and style. We manage the Fund’s industry and sector exposure by including industry factors in our risk model and by explicitly penalizing industry and sector deviations from the benchmark index in optimization. Sector weights or changes in sector weights generally do not have a meaningful impact on relative performance.
Did stock selection help or hurt Fund performance during the Reporting Period?
We seek to outpace the S&P 500® Index by overweighting stocks that we expect to outperform and underweighting those that we think may lag. We also build positions based on our thematic views. For example, the Fund aims to hold a basket of stocks with more favorable Momentum characteristics than the benchmark index. During the Reporting Period, stock selection overall contributed positively to the Fund’s relative performance.
Effective stock selection in the energy, consumer discretionary and industrials sectors contributed most positively to the Fund’s results relative to the S&P 500® Index. Relative allocation positioning in energy, one of the two weakest sectors in the S&P 500® Index during the Reporting Period, also helped. Partially offsetting these positive contributors was stock selection in the information technology, consumer staples and utilities sectors, which detracted from the Fund’s results relative to the S&P 500® Index during the Reporting Period. Relative allocation positioning in utilities, which lagged the S&P 500® Index, also hurt.
Which individual stock positions contributed the most to the Fund’s relative returns during the Reporting Period?
The Fund benefited most from an underweight position in diversified industrial and financial services conglomerate General Electric and from overweight positions in aerospace and defense company Boeing and semiconductor company Applied Materials. We chose to underweight General Electric due to our negative view on Sentiment. The Fund was overweight Boeing given our positive view on Quality. The overweight in Applied Materials was established because of our positive views on Sentiment and Momentum.
Which individual positions detracted from the Fund’s results during the Reporting Period?
Detracting most from the Fund’s results relative to the S&P 500® Index were overweight positions in utilities company PG&E, advertising agencies and marketing services companies organization Interpublic Group of Cos. and beer producer Molson Coors Brewing. We chose to overweight PG&E due to our positive views on Value, Sentiment and Profitability. The Fund had an overweight position in Interpublic Group of Cos. based on our positive view on Sentiment. Our positive view on Sentiment also drove the Fund’s overweight in Molson Coors Brewing.
How did the Fund use derivatives during the Reporting Period?
During the Reporting Period, we did not use derivatives as part of an active management strategy to add value to the Fund’s results. However, we used equity index futures contracts, on an opportunistic basis, to equitize the Fund’s excess cash holdings. In other words, we put the Fund’s excess cash holdings to work by using them as collateral for the purchase of stock futures. The use of these futures contracts did not have a material impact on the Fund’s performance during the Reporting Period.
2
GOLDMAN SACHS VARIABLE INSURANCE TRUST U.S. EQUITY INSIGHTS FUND
Did you make any enhancements to your quantitative models during the Reporting Period?
We continuously look for ways to improve our investment process. During the Reporting Period, we made numerous enhancements to our models. As example, we made two enhancements to our Sentiment theme. The first enhancement introduced a signal in the U.S. region, which looks at characteristics of a company’s Credit Default Swaps term structure to infer investor expectations regarding the health of that company. Secondly, we introduced an enhancement in the U.S. region that looks at the 10-K and 10-Q filings of companies as an indicator of stock price movements. We use natural language processing techniques to parse through quarterly filings in an effort to gauge various aspects of a company related to management sentiment, their outlook and their thoughts on upcoming risks.
During the fourth quarter of 2017, we introduced new signals within the Profitability theme that use various alternative data sources to identify companies benefiting from consumer spending. The first signal, introduced in the U.S. region, aims to forecast sales growth trends not just for the upcoming quarter but for multiple quarters ahead by looking for underlying trends. The second signal, also introduced in the U.S. region, analyzes profitability of retailers by assessing customer traffic in the retailer’s location. The third signal aims to predict the profitability of developed market companies outside the U.S. by mapping U.S. consumer spending data in various segments to non-U.S. companies engaged in these business segments, as our research has shown that consumer behavior across developed markets are correlated.
We also introduced new signals within our Momentum theme that help us create economic links between companies with similar businesses. The first signal, introduced in all regions, identifies companies linked by a common theme based on company descriptions. The second signal, introduced in the U.S. region, looks at searches made on the same day for regulatory filings of multiple companies to identify linked companies.
Additionally, we introduced an Environmental, Social and Governance (“ESG”) signal within our Management theme that helps us quantify reputational risk. The signal, introduced in all regions except Canada, looks at ESG risk events to form a view of the peak risk of the company from an ESG perspective.
What was the Fund’s sector positioning relative to its benchmark index at the end of the Reporting Period?
As of December 31, 2017, the Fund was overweight the real estate, energy and health care sectors relative to the S&P 500® Index. The Fund was underweight consumer staples, telecommunication services, financials and industrials and was rather neutrally weighted in utilities, materials, information technology and consumer discretionary compared to the benchmark index on the same date.
Were there any changes to the Fund’s portfolio management team during the Reporting Period?
During the Reporting Period, one Vice President left the Equity Alpha team and two Vice Presidents joined the team. QIS employs a globally integrated team of more than 90 professionals, with an additional 75-plus professionals dedicated to trading, information technology and development of analytical tools.
What is your strategy going forward for the Fund?
Looking ahead, we continue to believe that less expensive stocks may outpace more expensive stocks, and stocks with good momentum are likely to outperform those with poor momentum. We intend to maintain our focus on seeking companies about which fundamental research analysts are becoming more positive as well as profitable companies with sustainable earnings and a track record of using their capital to enhance shareholder value. As such, we anticipate remaining fully invested with long-term performance likely to be the result of stock selection rather than sector or capitalization allocations.
We stand behind our investment philosophy that sound economic investment principles, coupled with a disciplined quantitative approach, can provide strong, uncorrelated returns over the long term. Our research agenda is robust, and we continue to enhance our existing models, add new proprietary forecasting signals and improve our trading execution as we seek to provide the most value to our shareholders.
3
GOLDMAN SACHS VARIABLE INSURANCE TRUST U.S. EQUITY INSIGHTS FUND
Index Definitions
S&P 500® Index is the Standard & Poor’s 500 Composite Index of 500 stocks, an unmanaged index of common stock prices. The figures for the index do not include any deduction for fees, expenses or taxes. It is not possible to invest directly in an index.
Russell 2000® Index is an unmanaged index of common stock prices that measures the performance of the 2000 smallest companies in the Russell 3000® Index. The figures for the index do not include any deduction for fees, expenses or taxes. It is not possible to invest directly in an index.
Russell Midcap® Index measures the performance of the 800 smallest companies in the Russell 1000® Index, which represents approximately 25% of the total market capitalization of the Russell 1000 Index. It is not possible to invest directly in an index.
Russell 1000® Index measures the performance of the 1,000 largest companies in the Russell 3000® Index, which represents approximately 92% of the total market capitalization of the Russell 3000 Index. It is not possible to invest directly in an index.
4
FUND BASICS
U.S. Equity Insights Fund
as of December 31, 2017
STANDARDIZED TOTAL RETURNS1
| | | | | | | | | | | | | | | | | | |
| For the period ended 12/31/17 | | One Year | | | Five Years | | | Ten Years | | | Since Inception | | | Inception Date |
| Institutional | | | 24.07 | % | | | 17.01 | % | | | 8.44 | % | | | 6.52 | % | | 02/13/98 |
| Service | | | 23.80 | | | | 16.77 | | | | 8.22 | | | | 7.46 | | | 01/09/06 |
| 1 | The Standardized Total Returns are average annual total returns as of the most recent calendar quarter-end. They assume reinvestment of all distributions at net asset value (“NAV”). Because Institutional and Service Shares do not involve a sales charge, such a charge is not applied to their Standardized Total Returns. |
Total return figures in the above chart represent past performance and do not indicate future results, which will vary. The investment return and principal value of an investment will fluctuate and, therefore, an investor’s shares, when redeemed, may be worth more or less than their original cost. Current performance may be lower or higher than the total return figures in the above chart. Please visit www.GSAMFUNDS.com to obtain the most recent month-end returns. Performance reflects fee waivers and/or expense limitations in effect during the periods shown. In their absence, performance would be reduced.
EXPENSE RATIOS2
| | | | | | | | |
| | | Net Expense Ratio (Current) | | | Gross Expense Ratio (Before Waivers) | |
| Institutional | | | 0.60 | % | | | 0.70 | % |
| Service | | | 0.81 | | | | 0.95 | |
| 2 | The expense ratios of the Fund, both current (net of any fee waivers and/or expense limitations) and before waivers (gross of any fee waivers and/or expense limitations) are as set forth above according to the most recent publicly available Prospectuses for the Fund and may differ from the expense ratios disclosed in the Financial Highlights in this report. Pursuant to a contractual arrangement, the Fund’s fee waivers and/or expense limitations will remain in place through at least April 28, 2018, and prior to such date, the Investment Adviser may not terminate the arrangements without the approval of the Fund’s Board of Trustees. If these arrangements are discontinued in the future, the expense ratios may change without shareholder approval. |
TOP TEN HOLDINGS AS OF 12/31/173
| | | | | | |
| Holding | | % of Net Assets | | | Line of Business |
| Apple, Inc. | | | 2.9% | | | Technology Hardware & Equipment |
| Chevron Corp. | | | 2.1 | | | Energy |
| Amazon.com, Inc. | | | 2.0 | | | Retailing |
| UnitedHealth Group, Inc. | | | 1.9 | | | Health Care Equipment & Services |
| Visa, Inc. Class A | | | 1.9 | | | Software & Services |
| Microsoft Corp. | | | 1.9 | | | Software & Services |
| Facebook, Inc. Class A | | | 1.9 | | | Software & Services |
| Boeing Co. (The) | | | 1.7 | | | Capital Goods |
| Wal-Mart Stores, Inc. | | | 1.6 | | | Food & Staples Retailing |
| International Business Machines Corp. | | | 1.5 | | | Software & Services |
| 3 | The top 10 holdings may not be representative of the Fund’s future investments. |
5
FUND BASICS
FUND vs. BENCHMARK SECTOR ALLOCATIONS4
As of December 31, 2017
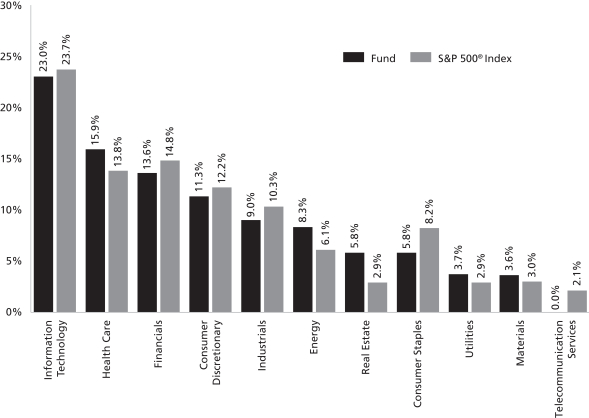
| 4 | The Fund is actively managed and, as such, its composition may differ over time. Consequently, the Fund’s overall sector allocations may differ from percentages contained in the graph above. The graph categorizes investments using Global Industry Classification Standard (“GICS”), however, the sector classifications used by the portfolio management team may differ from GICS. The percentage shown for each investment category reflects the value of investments in that category as a percentage of market value. The graph depicts the Fund’s investments but may not represent the Fund’s market exposure due to the exclusion of certain derivatives, if any, as listed in the Additional Investment Information section of the Schedule of Investments. |
6
GOLDMAN SACHS VARIABLE INSURANCE TRUST U.S. EQUITY INSIGHTS FUND
Performance Summary
December 31, 2017
The following graph shows the value, as of December 31, 2017, of a $10,000 investment made on January 1, 2008 in the Institutional Shares at NAV. For comparative purposes, the performance of the Fund’s benchmark, the S&P 500® Index, is shown. This performance data represents past performance and should not be considered indicative of future performance, which will fluctuate with changes in market conditions. These performance fluctuations may cause an investor’s shares, when redeemed, to be worth more or less than their original cost. Performance reflects Fund level expenses but does not reflect fees and expenses associated with any variable annuity contract or variable life insurance policy that uses the Fund as an investment option for any contract or policy. Had performance reflected all of those fees and expenses, performance would have been reduced. Performance reflects applicable fee waivers and/or expense limitations in effect during the periods shown, and in their absence, performance would be reduced. Performance of Service Shares will vary from Institutional Shares due to differences in class specific fees. In addition to the Investment Adviser’s decisions regarding issuer/industry investment selection and allocation, other factors may affect Fund performance. These factors include, but are not limited to, Fund operating fees and expenses, portfolio turnover, and subscription and redemption cash flows affecting the Fund.
U.S. Equity Insights Fund’s 10 Year Performance
Performance of a $10,000 investment, with distributions reinvested, from January 1, 2008 through December 31, 2017.
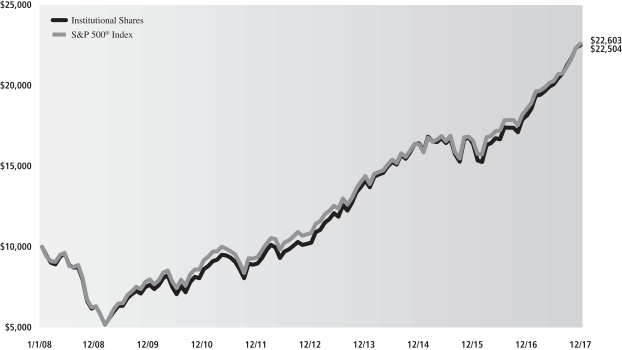
| | | | | | | | |
| Average Annual Total Return through December 31, 2017 | | One Year | | Five Years | | Ten Years | | Since Inception |
Institutional (Commenced February 13, 1998) | | 24.07% | | 17.01% | | 8.44% | | 6.52% |
Service (Commenced January 9, 2006) | | 23.80% | | 16.77% | | 8.22% | | 7.46% |
7
GOLDMAN SACHS VARIABLE INSURANCE TRUST U.S. EQUITY INSIGHTS FUND
Schedule of Investments
December 31, 2017
| | | | | | | | |
| Shares | | | Description | | Value | |
| | Common Stocks – 99.2% | |
| | Automobiles & Components – 1.9% | |
| | 22,508 | | | Aptiv plc | | $ | 1,909,354 | |
| | 18,826 | | | BorgWarner, Inc. | | | 961,820 | |
| | 80,390 | | | General Motors Co. | | | 3,295,186 | |
| | 10,586 | | | Gentex Corp. | | | 221,777 | |
| | 8,036 | | | Lear Corp. | | | 1,419,640 | |
| | | | | | | | |
| | | | | | | 7,807,777 | |
| | |
| | Banks – 6.4% | |
| | 35,983 | | | Bank of America Corp. | | | 1,062,218 | |
| | 112,286 | | | Citizens Financial Group, Inc. | | | 4,713,766 | |
| | 52,892 | | | Comerica, Inc. | | | 4,591,554 | |
| | 154,226 | | | Fifth Third Bancorp | | | 4,679,217 | |
| | 24,939 | | | JPMorgan Chase & Co. | | | 2,666,977 | |
| | 233,799 | | | KeyCorp | | | 4,715,726 | |
| | 89,733 | | | Regions Financial Corp. | | | 1,550,586 | |
| | 8,806 | | | SVB Financial Group* | | | 2,058,579 | |
| | 11,593 | | | Wells Fargo & Co. | | | 703,347 | |
| | | | | | | | |
| | | | | | | 26,741,970 | |
| | |
| | Capital Goods – 6.2% | |
| | 80,255 | | | Allison Transmission Holdings, Inc. | | | 3,456,583 | |
| | 43,329 | | | AMETEK, Inc. | | | 3,140,053 | |
| | 24,684 | | | Boeing Co. (The) | | | 7,279,559 | |
| | 39,249 | | | Caterpillar, Inc. | | | 6,184,857 | |
| | 5,444 | | | Fortune Brands Home & Security, Inc. | | | 372,587 | |
| | 103,614 | | | Masco Corp. | | | 4,552,799 | |
| | 3,711 | | | PACCAR, Inc. | | | 263,778 | |
| | 14,488 | | | Toro Co. (The) | | | 945,052 | |
| | | | | | | | |
| | | | | | | 26,195,268 | |
| | |
| | Commercial & Professional Services – 1.0% | |
| | 56,915 | | | IHS Markit Ltd.* | | | 2,569,712 | |
| | 29,088 | | | KAR Auction Services, Inc. | | | 1,469,235 | |
| | 3,451 | | | Waste Management, Inc. | | | 297,821 | |
| | | | | | | | |
| | | | | | | 4,336,768 | |
| | |
| | Consumer Durables & Apparel – 1.3% | |
| | 21,840 | | | DR Horton, Inc. | | | 1,115,369 | |
| | 6,710 | | | Lennar Corp. Class A | | | 424,340 | |
| | 134 | | | Lennar Corp. Class B | | | 6,925 | |
| | 126 | | | NVR, Inc.* | | | 442,036 | |
| | 108,321 | | | PulteGroup, Inc. | | | 3,601,673 | |
| | | | | | | | |
| | | | | | | 5,590,343 | |
| | |
| | Consumer Services – 2.4% | |
| | 16,494 | | | Hilton Worldwide Holdings, Inc. | | | 1,317,211 | |
| | 22,047 | | | International Game Technology plc | | | 584,466 | |
| | 51,970 | | | Las Vegas Sands Corp. | | | 3,611,395 | |
| | 3,461 | | | Marriott International, Inc. Class A | | | 469,762 | |
| | 84,437 | | | MGM Resorts International | | | 2,819,351 | |
| | 5,637 | | | Royal Caribbean Cruises Ltd. | | | 672,381 | |
| | 8,257 | | | Yum Brands, Inc. | | | 673,854 | |
| | | | | | | | |
| | | | | | | 10,148,420 | |
| | |
| | Common Stocks – (continued) | |
| | Diversified Financials – 4.3% | |
| | 146,804 | | | Ally Financial, Inc. | | $ | 4,280,805 | |
| | 2,747 | | | Ameriprise Financial, Inc. | | | 465,534 | |
| | 71,140 | | | Bank of New York Mellon Corp. (The) | | | 3,831,600 | |
| | 13,848 | | | Berkshire Hathaway, Inc. Class B* | | | 2,744,951 | |
| | 20,681 | | | Leucadia National Corp. | | | 547,840 | |
| | 15,181 | | | S&P Global, Inc. | | | 2,571,661 | |
| | 85,050 | | | Synchrony Financial | | | 3,283,781 | |
| | 9,958 | | | Voya Financial, Inc. | | | 492,622 | |
| | | | | | | | |
| | | | | | | 18,218,794 | |
| | |
| | Energy – 8.3% | |
| | 12,075 | | | Andeavor | | | 1,380,656 | |
| | 29,449 | | | Cabot Oil & Gas Corp. | | | 842,241 | |
| | 70,002 | | | Chevron Corp. | | | 8,763,550 | |
| | 5,801 | | | Cimarex Energy Co. | | | 707,780 | |
| | 15,058 | | | EOG Resources, Inc. | | | 1,624,909 | |
| | 30,586 | | | Exxon Mobil Corp. | | | 2,558,213 | |
| | 31,269 | | | HollyFrontier Corp. | | | 1,601,598 | |
| | 59,179 | | | Marathon Oil Corp. | | | 1,001,901 | |
| | 73,555 | | | Marathon Petroleum Corp. | | | 4,853,159 | |
| | 20,555 | | | National Oilwell Varco, Inc. | | | 740,391 | |
| | 8,041 | | | Newfield Exploration Co.* | | | 253,533 | |
| | 50,926 | | | Phillips 66 | | | 5,151,165 | |
| | 56,299 | | | Valero Energy Corp. | | | 5,174,441 | |
| | | | | | | | |
| | | | | | | 34,653,537 | |
| | |
| | Food & Staples Retailing – 1.8% | |
| | 10,441 | | | Walgreens Boots Alliance, Inc. | | | 758,226 | |
| | 70,003 | | | Wal-Mart Stores, Inc. | | | 6,912,796 | |
| | | | | | | | |
| | | | | | | 7,671,022 | |
| | |
| | Food, Beverage & Tobacco – 1.9% | |
| | 120,016 | | | Conagra Brands, Inc. | | | 4,521,003 | |
| | 4,854 | | | General Mills, Inc. | | | 287,793 | |
| | 3,639 | | | Hershey Co. (The) | | | 413,063 | |
| | 33,913 | | | Molson Coors Brewing Co. Class B | | | 2,783,240 | |
| | | | | | | | |
| | | | | | | 8,005,099 | |
| | |
| | Health Care Equipment & Services – 8.6% | |
| | 23,340 | | | Anthem, Inc. | | | 5,251,733 | |
| | 26,780 | | | Baxter International, Inc. | | | 1,731,059 | |
| | 71,942 | | | Boston Scientific Corp.* | | | 1,783,442 | |
| | 22,384 | | | Centene Corp.* | | | 2,258,098 | |
| | 22,477 | | | Cigna Corp. | | | 4,564,854 | |
| | 2,672 | | | Cooper Cos., Inc. (The) | | | 582,175 | |
| | 55,396 | | | Danaher Corp. | | | 5,141,857 | |
| | 19,923 | | | Humana, Inc. | | | 4,942,299 | |
| | 7,500 | | | Medtronic plc | | | 605,625 | |
| | 36,995 | | | UnitedHealth Group, Inc. | | | 8,155,918 | |
| | 5,942 | | | WellCare Health Plans, Inc.* | | | 1,194,996 | |
| | | | | | | | |
| | | | | | | 36,212,056 | |
| | |
| | Household & Personal Products – 2.0% | |
| | 72,162 | | | Colgate-Palmolive Co. | | | 5,444,623 | |
| | 22,043 | | | Kimberly-Clark Corp. | | | 2,659,709 | |
| | |
| | |
| 8 | | The accompanying notes are an integral part of these financial statements. |
GOLDMAN SACHS VARIABLE INSURANCE TRUST U.S. EQUITY INSIGHTS FUND
| | | | | | | | |
| Shares | | | Description | | Value | |
| | Common Stocks – (continued) | |
| | Household & Personal Products – (continued) | |
| | 3,481 | | | Procter & Gamble Co. (The) | | $ | 319,834 | |
| | | | | | | | |
| | | | | | | 8,424,166 | |
| | |
| | Insurance – 2.8% | |
| | 47,647 | | | Allstate Corp. (The) | | | 4,989,117 | |
| | 21,760 | | | Aon plc | | | 2,915,840 | |
| | 6,894 | | | Assured Guaranty Ltd. | | | 233,500 | |
| | 5,281 | | | Athene Holding Ltd. Class A* | | | 273,081 | |
| | 27,082 | | | Principal Financial Group, Inc. | | | 1,910,906 | |
| | 21,807 | | | Progressive Corp. (The) | | | 1,228,170 | |
| | | | | | | | |
| | | | | | | 11,550,614 | |
| | |
| | Materials – 3.5% | |
| | 7,444 | | | Eastman Chemical Co. | | | 689,612 | |
| | 11,760 | | | Freeport-McMoRan, Inc.* | | | 222,969 | |
| | 80,329 | | | Graphic Packaging Holding Co. | | | 1,241,083 | |
| | 44,969 | | | LyondellBasell Industries NV Class A | | | 4,960,980 | |
| | 9,234 | | | PPG Industries, Inc. | | | 1,078,716 | |
| | 23,183 | | | Sealed Air Corp. | | | 1,142,922 | |
| | 39,000 | | | Steel Dynamics, Inc. | | | 1,682,070 | |
| | 9,437 | | | Westlake Chemical Corp. | | | 1,005,324 | |
| | 45,180 | | | WestRock Co. | | | 2,855,828 | |
| | | | | | | | |
| | | | | | | 14,879,504 | |
| | |
| | Media – 0.3% | |
| | 23,779 | | | Comcast Corp. Class A | | | 952,349 | |
| | 12,358 | | | News Corp. Class A | | | 200,323 | |
| | | | | | | | |
| | | | | | | 1,152,672 | |
| | |
| | Pharmaceuticals, Biotechnology & Life Sciences – 7.2% | |
| | 20,561 | | | AbbVie, Inc. | | | 1,988,454 | |
| | 8,995 | | | Alexion Pharmaceuticals, Inc.* | | | 1,075,712 | |
| | 31,049 | | | Allergan plc | | | 5,078,996 | |
| | 33,729 | | | Amgen, Inc. | | | 5,865,473 | |
| | 16,307 | | | Biogen, Inc.* | | | 5,194,921 | |
| | 35,955 | | | Celgene Corp.* | | | 3,752,264 | |
| | 20,747 | | | Exelixis, Inc.* | | | 630,709 | |
| | 1,374 | | | Jazz Pharmaceuticals plc* | | | 185,009 | |
| | 20,381 | | | Johnson & Johnson | | | 2,847,633 | |
| | 3,402 | | | Mettler-Toledo International, Inc.* | | | 2,107,607 | |
| | 9,827 | | | Vertex Pharmaceuticals, Inc.* | | | 1,472,674 | |
| | | | | | | | |
| | | | | | | 30,199,452 | |
| | |
| | Real Estate – 5.8% | |
| | 138,499 | | | American Homes 4 Rent Class A (REIT) | | | 3,024,818 | |
| | 37,216 | | | American Tower Corp. (REIT) | | | 5,309,607 | |
| | 19,136 | | | CBRE Group, Inc. Class A* | | | 828,780 | |
| | 7,322 | | | Equinix, Inc. (REIT) | | | 3,318,477 | |
| | 2,770 | | | Equity LifeStyle Properties, Inc. (REIT) | | | 246,585 | |
| | 5,663 | | | Gaming and Leisure Properties, Inc. (REIT) | | | 209,531 | |
| | 219,816 | | | Host Hotels & Resorts, Inc. (REIT) | | | 4,363,348 | |
| | 2,436 | | | Jones Lang LaSalle, Inc. | | | 362,793 | |
| | 20,317 | | | Kimco Realty Corp. (REIT) | | | 368,754 | |
| | |
| | Common Stocks – (continued) | |
| | Real Estate – (continued) | |
| | 21,069 | | | Prologis, Inc. (REIT) | | | 1,359,161 | |
| | 46,280 | | | Realogy Holdings Corp. | | | 1,226,420 | |
| | 23,017 | | | SBA Communications Corp. (REIT)* | | | 3,760,057 | |
| | | | | | | | |
| | | | | | | 24,378,331 | |
| | |
| | Retailing – 5.3% | |
| | 7,306 | | | Amazon.com, Inc.* | | | 8,544,148 | |
| | 28,121 | | | Best Buy Co., Inc. | | | 1,925,445 | |
| | 1,736 | | | Expedia, Inc. | | | 207,921 | |
| | 53,937 | | | Lowe’s Cos., Inc. | | | 5,012,905 | |
| | 7,838 | | | Netflix, Inc.* | | | 1,504,582 | |
| | 4,742 | | | Pool Corp. | | | 614,800 | |
| | 861 | | | Priceline Group, Inc. (The)* | | | 1,496,194 | |
| | 36,184 | | | Ross Stores, Inc. | | | 2,903,766 | |
| | | | | | | | |
| | | | | | | 22,209,761 | |
| | |
| | Semiconductors & Semiconductor Equipment – 3.0% | |
| | 86,596 | | | Applied Materials, Inc. | | | 4,426,788 | |
| | 7,103 | | | Broadcom Ltd. | | | 1,824,761 | |
| | 5,325 | | | Lam Research Corp. | | | 980,173 | |
| | 24,991 | | | Maxim Integrated Products, Inc. | | | 1,306,529 | |
| | 97,752 | | | Micron Technology, Inc.* | | | 4,019,562 | |
| | | | | | | | |
| | | | | | | 12,557,813 | |
| | |
| | Software & Services – 14.7% | |
| | 32,919 | | | Adobe Systems, Inc.* | | | 5,768,726 | |
| | 3,068 | | | Alliance Data Systems Corp. | | | 777,677 | |
| | 5,995 | | | Alphabet, Inc. Class A* | | | 6,315,133 | |
| | 5,827 | | | Alphabet, Inc. Class C* | | | 6,097,373 | |
| | 65,021 | | | Cadence Design Systems, Inc.* | | | 2,719,178 | |
| | 15,418 | | | Citrix Systems, Inc.* | | | 1,356,784 | |
| | 9,804 | | | Conduent, Inc.* | | | 158,433 | |
| | 457 | | | CoStar Group, Inc.* | | | 135,706 | |
| | 22,076 | | | Electronic Arts, Inc.* | | | 2,319,305 | |
| | 44,121 | | | Facebook, Inc. Class A* | | | 7,785,592 | |
| | 41,452 | | | International Business Machines Corp. | | | 6,359,566 | |
| | 30,548 | | | Intuit, Inc. | | | 4,819,863 | |
| | 93,838 | | | Microsoft Corp. | | | 8,026,903 | |
| | 4,775 | | | PayPal Holdings, Inc.* | | | 351,535 | |
| | 4,139 | | | Sabre Corp. | | | 84,849 | |
| | 6,104 | | | Total System Services, Inc. | | | 482,765 | |
| | 71,220 | | | Visa, Inc. Class A | | | 8,120,504 | |
| | | | | | | | |
| | | | | | | 61,679,892 | |
| | |
| | Technology Hardware & Equipment – 5.1% | |
| | 70,914 | | | Apple, Inc. | | | 12,000,776 | |
| | 17,495 | | | F5 Networks, Inc.* | | | 2,295,694 | |
| | 33,706 | | | Flex Ltd.* | | | 606,371 | |
| | 52,453 | | | HP, Inc. | | | 1,102,037 | |
| | 44,221 | | | Jabil, Inc. | | | 1,160,801 | |
| | 55,788 | | | Western Digital Corp. | | | 4,436,820 | |
| | | | | | | | |
| | | | | | | 21,602,499 | |
| | |
| | Telecommunication Services – 0.0% | |
| | 1,647 | | | AT&T, Inc. | | | 64,035 | |
| | |
| | |
| The accompanying notes are an integral part of these financial statements. | | 9 |
GOLDMAN SACHS VARIABLE INSURANCE TRUST U.S. EQUITY INSIGHTS FUND
Schedule of Investments (continued)
December 31, 2017
| | | | | | | | |
| Shares | | | Description | | Value | |
| | Common Stocks – (continued) | |
| | Transportation – 1.7% | |
| | 92,995 | | | CSX Corp. | | $ | 5,115,655 | |
| | 8,840 | | | Kansas City Southern | | | 930,145 | |
| | 3,366 | | | Old Dominion Freight Line, Inc. | | | 442,797 | |
| | 6,437 | | | Ryder System, Inc. | | | 541,802 | |
| | | | | | | | |
| | | | | | | 7,030,399 | |
| | |
| | Utilities – 3.7% | |
| | 303,885 | | | AES Corp. | | | 3,291,075 | |
| | 34,641 | | | CMS Energy Corp. | | | 1,638,519 | |
| | 60,572 | | | Exelon Corp. | | | 2,387,142 | |
| | 30,692 | | | MDU Resources Group, Inc. | | | 825,001 | |
| | 79,391 | | | PG&E Corp. | | | 3,559,099 | |
| | 94,393 | | | SCANA Corp. | | | 3,754,954 | |
| | 2,585 | | | Vistra Energy Corp.* | | | 47,357 | |
| | | | | | | | |
| | | | | | | 15,503,147 | |
| | |
| | TOTAL INVESTMENTS – 99.2% | | | | |
| | (Cost $349,815,140) | | $ | 416,813,339 | |
| | |
| OTHER ASSETS IN EXCESS OF
LIABILITIES – 0.8% | | | 3,348,839 | |
| | |
| | NET ASSETS – 100.0% | | $ | 420,162,178 | |
| | |
| | |
| The percentage shown for each investment category reflects the value of investments in that category as a percentage of net assets. |
| * | | Non-income producing security. |
| | |
| Investment Abbreviation: |
| REIT | | —Real Estate Investment Trust |
ADDITIONAL INVESTMENT INFORMATION
FUTURES CONTRACTS — At December 31, 2017, the Fund had the following futures contracts:
| | | | | | | | | | | | | | |
| Description | | Number of
Contracts | | | Expiration
Date | | Notional Amount | | | Unrealized Appreciation/ (Depreciation) | |
Long position contracts: | |
| S&P 500 E-Mini Index | | | 7 | | | 03/16/2018 | | $ | 936,600 | | | $ | 4,030 | |
| | |
| 10 | | The accompanying notes are an integral part of these financial statements. |
GOLDMAN SACHS VARIABLE INSURANCE TRUST U.S. EQUITY INSIGHTS FUND
Statement of Assets and Liabilities
December 31, 2017
| | | | |
| | | | |
| Assets: | | | |
Investments in unaffiliated issuers, at value (cost $349,815,140) | | $ | 416,813,339 | |
Cash | | | 3,469,212 | |
Receivables: | | | | |
Dividends | | | 418,930 | |
Collateral on certain derivative contracts | | | 34,650 | |
Reimbursement from investment adviser | | | 25,566 | |
Fund shares sold | | | 24,461 | |
Other assets | | | 278 | |
| Total assets | | | 420,786,436 | |
| |
| | | | |
| Liabilities: | | | |
Variation margin on futures | | | 27,614 | |
Payables: | | | | |
Fund shares redeemed | | | 282,066 | |
Management fees | | | 207,177 | |
Distribution and Service fees and Transfer Agency fees | | | 32,466 | |
Accrued expenses | | | 74,935 | |
| Total liabilities | | | 624,258 | |
| |
| | | | |
| Net Assets: | | | |
Paid-in capital | | | 345,094,514 | |
Undistributed net investment income | | | 475,295 | |
Accumulated net realized gain | | | 7,590,140 | |
Net unrealized gain | | | 67,002,229 | |
| NET ASSETS | | $ | 420,162,178 | |
Net Assets: | | | | |
Institutional | | $ | 277,951,875 | |
Service | | | 142,210,303 | |
Total Net Assets | | $ | 420,162,178 | |
Shares outstanding $0.001 par value (unlimited shares authorized): | | | | |
Institutional | | | 14,317,601 | |
Service | | | 7,298,477 | |
Net asset value, offering and redemption price per share: | | | | |
Institutional | | | $19.41 | |
Service | | | 19.48 | |
| | |
| The accompanying notes are an integral part of these financial statements. | | 11 |
GOLDMAN SACHS VARIABLE INSURANCE TRUST U.S. EQUITY INSIGHTS FUND
Statement of Operations
For the Fiscal Year Ended December 31, 2017
| | | | |
| | | | |
| Investment income: | |
Dividends — unaffiliated issuers (net of foreign taxes withheld of $5,210) | | $ | 8,112,221 | |
Dividends — affiliated issuers | | | 12,052 | |
Securities lending income — affiliated issuer | | | 8,711 | |
| Total investment income | | | 8,132,984 | |
| |
| | | | |
| Expenses: | | | |
Management fees | | | 2,474,050 | |
Distribution and Service fees — Service Shares | | | 328,896 | |
Professional fees | | | 82,029 | |
Transfer Agency fees(a) | | | 79,801 | |
Custody, accounting and administrative services | | | 68,749 | |
Printing and mailing costs | | | 65,185 | |
Trustee fees | | | 18,290 | |
Other | | | 14,537 | |
| Total expenses | | | 3,131,537 | |
Less — expense reductions | | | (400,841 | ) |
| Net expenses | | | 2,730,696 | |
| NET INVESTMENT INCOME | | | 5,402,288 | |
| |
| | | | |
| Realized and unrealized gain: | | | |
Net realized gain from: | | | | |
Investments — unaffiliated issuers | | | 44,217,635 | |
Futures contracts | | | 514,631 | |
Net change in unrealized gain on: | | | | |
Investments — unaffiliated issuers | | | 35,418,250 | |
Futures contracts | | | 33,601 | |
| Net realized and unrealized gain | | | 80,184,117 | |
| NET INCREASE IN NET ASSETS RESULTING FROM OPERATIONS | | $ | 85,586,405 | |
(a) Institutional and Service Shares incurred Transfer Agency fees of $53,492 and $26,309, respectively.
| | |
| 12 | | The accompanying notes are an integral part of these financial statements. |
GOLDMAN SACHS VARIABLE INSURANCE TRUST U.S. EQUITY INSIGHTS FUND
Statements of Changes in Net Assets
| | | | | | | | |
| | | For the Fiscal Year Ended
December 31, 2017 | | | For the Fiscal Year Ended
December 31, 2016 | |
| | | | | | | | |
| From operations: | |
Net investment income | | $ | 5,402,288 | | | $ | 4,419,244 | |
Net realized gain | | | 44,732,266 | | | | 19,576,686 | |
Net change in unrealized gain | | | 35,451,851 | | | | 13,561,997 | |
| Net increase in net assets resulting from operations | | | 85,586,405 | | | | 37,557,927 | |
| |
| | | | | | | | |
| Distributions to shareholders: | | | | | | |
From net investment income | | | | | | | | |
Institutional Shares | | | (3,615,437 | ) | | | (3,237,561 | ) |
Service Shares | | | (1,564,680 | ) | | | (1,277,330 | ) |
From net realized gains | | | | | | | | |
Institutional Shares | | | (28,296,886 | ) | | | (8,734,468 | ) |
Service Shares | | | (14,401,688 | ) | | | (4,117,588 | ) |
| Total distributions to shareholders | | | (47,878,691 | ) | | | (17,366,947 | ) |
| |
| | | | | | | | |
| From share transactions: | | | | | | |
Proceeds from sales of shares | | | 22,663,929 | | | | 15,918,402 | |
Reinvestment of distributions | | | 47,878,691 | | | | 17,366,947 | |
Cost of shares redeemed | | | (64,040,172 | ) | | | (69,293,004 | ) |
| Net increase (decrease) in net assets resulting from share transactions | | | 6,502,448 | | | | (36,007,655 | ) |
| TOTAL INCREASE (DECREASE) | | | 44,210,162 | | | | (15,816,675 | ) |
| |
| | | | | | | | |
| Net assets: | | | | | | |
| | |
Beginning of year | | | 375,952,016 | | | | 391,768,691 | |
End of year | | $ | 420,162,178 | | | $ | 375,952,016 | |
| Undistributed net investment income | | $ | 475,295 | | | $ | 344,199 | |
| | |
| The accompanying notes are an integral part of these financial statements. | | 13 |
GOLDMAN SACHS VARIABLE INSURANCE TRUST U.S. EQUITY INSIGHTS FUND
Financial Highlights
Selected Data for a Share Outstanding Throughout Each Year
| | | | | | | | | | | | | | | | | | | | | | | | | | | | | | | | | | | | | | | | | | | | | | | | | | | | | | | | |
| | | | | | Income (loss) from
investment operations | | | Distributions to shareholders | | | | | | | | | | | | | | | | | | | | | | |
| Year - Share Class | | Net asset
value,
beginning
of year | | | Net
investment
income(a) | | | Net
realized
and
unrealized
gain (loss) | | | Total from
investment
operations | | | From net
investment
income | | | From
net
realized
gains | | | Total
distributions | | | Net asset
value,
end of
year | | | Total
return(b) | | | Net assets,
end of
year
(in 000s) | | | Ratio of
net expenses
to average
net assets | | | Ratio of
total
expenses
to average
net assets | | | Ratio of
net investment
income
to average
net assets | | | Portfolio
turnover
rate(c) | |
| | |
| FOR THE FISCAL YEARS ENDED DECEMBER 31, | |
2017 - Institutional | | $ | 17.65 | | | $ | 0.28 | | | $ | 3.98 | | | $ | 4.26 | | | $ | (0.28 | ) | | $ | (2.22 | ) | | $ | (2.50 | ) | | $ | 19.41 | | | | 24.07 | % | | $ | 277,952 | | | | 0.62 | % | | | 0.70 | % | | | 1.42 | % | | | 184 | % |
2017 - Service | | | 17.71 | | | | 0.24 | | | | 3.99 | | | | 4.23 | | | | (0.24 | ) | | | (2.22 | ) | | | (2.46 | ) | | | 19.48 | | | | 23.80 | | | | 142,210 | | | | 0.82 | | | | 0.95 | | | | 1.21 | | | | 184 | |
2016 - Institutional | | | 16.71 | | | | 0.22 | | | | 1.58 | | | | 1.80 | | | | (0.23 | ) | | | (0.63 | ) | | | (0.86 | ) | | | 17.65 | | | | 10.70 | | | | 255,565 | | | | 0.64 | | | | 0.70 | | | | 1.25 | | | | 204 | |
2016 - Service | | | 16.77 | | | | 0.18 | | | | 1.59 | | | | 1.77 | | | | (0.20 | ) | | | (0.63 | ) | | | (0.83 | ) | | | 17.71 | | | | 10.44 | | | | 120,387 | | | | 0.85 | | | | 0.95 | | | | 1.04 | | | | 204 | |
2015 - Institutional | | | 18.12 | | | | 0.23 | | | | (0.27 | ) | | | (0.04 | ) | | | (0.25 | ) | | | (1.12 | ) | | | (1.37 | ) | | | 16.71 | | | | (0.20 | ) | | | 269,238 | | | | 0.64 | | | | 0.71 | | | | 1.29 | | | | 200 | |
2015 - Service | | | 18.17 | | | | 0.20 | | | | (0.28 | ) | | | (0.08 | ) | | | (0.20 | ) | | | (1.12 | ) | | | (1.32 | ) | | | 16.77 | | | | (0.41 | ) | | | 122,531 | | | | 0.85 | | | | 0.96 | | | | 1.08 | | | | 200 | |
2014 - Institutional | | | 16.52 | | | | 0.21 | | | | 2.47 | | | | 2.68 | | | | (0.26 | ) | | | (0.82 | ) | | | (1.08 | ) | | | 18.12 | | | | 16.37 | | | | 312,370 | | | | 0.65 | | | | 0.71 | | | | 1.21 | | | | 214 | |
2014 - Service | | | 16.55 | | | | 0.18 | | | | 2.47 | | | | 2.65 | | | | (0.21 | ) | | | (0.82 | ) | | | (1.03 | ) | | | 18.17 | | | | 16.18 | | | | 138,725 | | | | 0.86 | | | | 0.96 | | | | 1.01 | | | | 214 | |
2013 - Institutional | | | 12.14 | | | | 0.20 | | | | 4.35 | | | | 4.55 | | | | (0.17 | ) | | | — | | | | (0.17 | ) | | | 16.52 | | | | 37.52 | | | | 307,589 | | | | 0.65 | | | | 0.71 | | | | 1.36 | | | | 207 | |
2013 - Service | | | 12.16 | | | | 0.17 | | | | 4.35 | | | | 4.52 | | | | (0.13 | ) | | | — | | | | (0.13 | ) | | | 16.55 | | | | 37.23 | | | | 125,748 | | | | 0.86 | | | | 0.96 | | | | 1.15 | | | | 207 | |
| (a) | Calculated based on the average shares outstanding methodology. |
| (b) | Assumes investment at the net asset value at the beginning of the year, reinvestment of all distributions, and a complete redemption of the investment at the net asset value at the end of the year. |
| (c) | The Fund’s portfolio turnover rate is calculated in accordance with regulatory requirements, without regard to transactions involving short term investments and certain derivatives. If such transactions were included, the Fund’s portfolio turnover rate may be higher. |
| | | | |
| The accompanying notes are an integral part of these financial statements. | | 14 | | |
GOLDMAN SACHS VARIABLE INSURANCE TRUST U.S. EQUITY INSIGHTS FUND
Notes to Financial Statements
December 31, 2017
1. ORGANIZATION
Goldman Sachs Variable Insurance Trust (the “Trust” or “VIT”) is a Delaware statutory trust registered under the Investment Company Act of 1940, as amended (the “Act”), as an open-end management investment company. The Trust includes the Goldman Sachs U.S. Equity Insights Fund (the “Fund”). The Fund is a diversified portfolio under the Act offering two classes of shares — Institutional and Service Shares. Shares of the Trust are offered to separate accounts of participating life insurance companies for the purpose of funding variable annuity contracts and variable life insurance policies.
Goldman Sachs Asset Management, L.P. (“GSAM”), an affiliate of Goldman Sachs & Co. LLC (formerly, Goldman, Sachs & Co.) (“Goldman Sachs”), serves as investment adviser to the Fund pursuant to a management agreement (the “Agreement”) with the Trust.
2. SIGNIFICANT ACCOUNTING POLICIES
The financial statements have been prepared in accordance with accounting principles generally accepted in the United States of America (“GAAP”) and require management to make estimates and assumptions that may affect the reported amounts and disclosures. Actual results may differ from those estimates and assumptions.
A. Investment Valuation — The Fund’s valuation policy is to value investments at fair value.
B. Investment Income and Investments — Investment income includes interest income, dividend income, and securities lending income. Interest income is accrued daily and adjusted for amortization of premiums and accretion of discounts. Dividend income is recognized on ex-dividend date or, for certain foreign securities, as soon as such information is obtained subsequent to the ex-dividend date. Investment transactions are reflected on trade date. Realized gains and losses are calculated using identified cost. Investment transactions are recorded on the following business day for daily net asset value (“NAV”) calculations. Investment income is recorded net of any foreign withholding taxes, less any amounts reclaimable. The Fund may file withholding tax reclaims in certain jurisdictions to recover a portion of amounts previously withheld. Any foreign capital gains tax is accrued daily based upon net unrealized gains, and is payable upon sale of such investments. Distributions received from the Fund’s investments in United States (“U.S.”) real estate investment trusts (“REITs”) may be characterized as ordinary income, net capital gain or a return of capital. A return of capital is recorded by the Fund as a reduction to the cost basis of the REIT.
For derivative contracts, realized gains and losses are recorded upon settlement of the contract.
C. Class Allocations and Expenses — Investment income, realized and unrealized gain (loss), if any, and non-class specific expenses of the Fund are allocated daily based upon the proportion of net assets of each class. Non-class specific expenses directly incurred by the Fund are charged to the Fund, while such expenses incurred by the Trust are allocated across the Fund on a straight-line and/or pro-rata basis depending upon the nature of the expenses. Class specific expenses, where applicable, are borne by the respective share classes and include Distribution and Service and Transfer Agency fees.
D. Federal Taxes and Distributions to Shareholders — It is the Fund’s policy to comply with the requirements of the Internal Revenue Code of 1986, as amended (the “Code”), applicable to regulated investment companies (mutual funds) and to distribute each year substantially all of its investment company taxable income and capital gains to its shareholders. Accordingly, the Fund is not required to make any provisions for the payment of federal income tax. Distributions to shareholders are recorded on the ex-dividend date. Income and capital gains distributions, if any, are declared and paid annually.
Net capital losses, if any, are carried forward to future fiscal years and may be used to the extent allowed by the Code to offset any future capital gains. Losses that are carried forward will retain their character as either short-term or long-term capital losses. Utilization of capital loss carryforwards will reduce the requirement of future capital gains distributions.
The characterization of distributions to shareholders for financial reporting purposes is determined in accordance with federal income tax rules, which may differ from GAAP. The source of the Fund’s distributions may be shown in the accompanying financial statements as either from net investment income, net realized gain or capital. Certain components of the Fund’s net assets on the Statement of Assets and Liabilities reflect permanent GAAP/tax differences based on the appropriate tax character.
15
GOLDMAN SACHS VARIABLE INSURANCE TRUST U.S. EQUITY INSIGHTS FUND
Notes to Financial Statements (continued)
December 31, 2017
3. INVESTMENTS AND FAIR VALUE MEASUREMENTS
U.S. GAAP defines the fair value of a financial instrument as the amount that would be received to sell an asset or paid to transfer a liability in an orderly transaction between market participants at the measurement date (i.e., the exit price); the Fund’s policy is to use the market approach. GAAP establishes a fair value hierarchy that prioritizes the inputs to valuation techniques used to measure fair value. The hierarchy gives the highest priority to unadjusted quoted prices in active markets for identical assets or liabilities (Level 1 measurements) and the lowest priority to unobservable inputs (Level 3 measurements). The levels used for classifying investments are not necessarily an indication of the risk associated with investing in these investments. The three levels of the fair value hierarchy are described below:
Level 1 — Unadjusted quoted prices in active markets that are accessible at the measurement date for identical, unrestricted assets or liabilities;
Level 2 — Quoted prices in markets that are not active or financial instruments for which significant inputs are observable (including, but not limited to, quoted prices for similar investments, interest rates, foreign exchange rates, volatility and credit spreads), either directly or indirectly;
Level 3 — Prices or valuations that require significant unobservable inputs (including GSAM’s assumptions in determining fair value measurement).
Changes in valuation techniques may result in transfers into or out of an assigned level within the hierarchy. In accordance with the Fund’s policy, transfers between different levels of the fair value hierarchy resulting from such changes are deemed to have occurred as of the beginning of the reporting period.
The Board of Trustees (“Trustees”) has approved Valuation Procedures that govern the valuation of the portfolio investments held by the Fund, including investments for which market quotations are not readily available. The Trustees have delegated to GSAM day-to-day responsibility for implementing and maintaining internal controls and procedures related to the valuation of the Fund’s investments. To assess the continuing appropriateness of pricing sources and methodologies, GSAM regularly performs price verification procedures and issues challenges as necessary to third party pricing vendors or brokers, and any differences are reviewed in accordance with the Valuation Procedures.
A. Level 1 and Level 2 Fair Value Investments — The valuation techniques and significant inputs used in determining the fair values for investments classified as Level 1 and Level 2 are as follows:
Equity Securities — Equity securities traded on a U.S. securities exchange or the NASDAQ system, or those located on certain foreign exchanges, including but not limited to the Americas, are valued daily at their last sale price or official closing price on the principal exchange or system on which they are traded. If there is no sale or official closing price or such price is believed by GSAM to not represent fair value, equity securities are valued at the last bid price for long positions and at the last ask price for short positions. To the extent these investments are actively traded, they are classified as Level 1 of the fair value hierarchy, otherwise they are generally classified as Level 2.
Unlisted equity securities for which market quotations are available are valued at the last sale price on the valuation date, or if no sale occurs, at the last bid price. Unlisted equities are generally classified as Level 2 (fair valued and single source broker securities may be treated differently).
Money Market Funds — Investments in the Goldman Sachs Financial Square Government Fund (“Underlying Fund”) are valued at the NAV of the Institutional Share class on the day of valuation. These investments are generally classified as Level 1 of the fair value hierarchy. For information regarding an Underlying Fund’s accounting policies and investment holdings, please see the Underlying Fund’s shareholder report.
Derivative Contracts — A derivative is an instrument whose value is derived from underlying assets, indices, reference rates or a combination of these factors. The Fund enters into derivative transactions to hedge against changes in interest rates, securities prices, and/or currency exchange rates, to increase total return, or to gain access to certain markets or attain exposure to other underliers.
16
GOLDMAN SACHS VARIABLE INSURANCE TRUST U.S. EQUITY INSIGHTS FUND
3. INVESTMENTS AND FAIR VALUE MEASUREMENTS (continued)
Exchange-traded derivatives, including futures and options contracts, are valued at the last sale or settlement price and typically fall within Level 1 of the fair value hierarchy. Over-the-counter (“OTC”) and centrally cleared derivatives are valued using market transactions and other market evidence, including market-based inputs to models, calibration to market-clearing transactions, broker or dealer quotations, or other alternative pricing sources. Where models are used, the selection of a particular model to value OTC and centrally cleared derivatives depends upon the contractual terms of, and specific risks inherent in, the instrument, as well as the availability of pricing information in the market. Valuation models require a variety of inputs, including contractual terms, market prices, yield curves, credit curves, measures of volatility, voluntary and involuntary prepayment rates, loss severity rates and correlations of such inputs. For OTC and centrally cleared derivatives that trade in liquid markets, model inputs can generally be verified and model selection does not involve significant management judgment. OTC and centrally cleared derivatives are classified within Level 2 of the fair value hierarchy when significant inputs are corroborated by market evidence.
i. Futures Contracts — Futures contracts are contracts to buy or sell a standardized quantity of a specified commodity or security and are valued based on exchanged settlement prices or independent market quotes. Futures contracts are valued at the last settlement price, or in the absence of a sale, the last bid price for long positions and at the last ask price for short positions, at the end of each day on the board of trade or exchange upon which they are traded. Upon entering into a futures contract, the Fund deposits cash or securities in an account on behalf of the broker in an amount sufficient to meet the initial margin requirement. Subsequent payments are made or received by the Fund equal to the daily change in the contract value and are recorded as variation margin receivable or payable with a corresponding offset to unrealized gains or losses. For financial reporting purposes, cash collateral that has been pledged to cover obligations of the Fund and cash collateral received, if any, is reported separately on the Statement of Assets and Liabilities as receivables/payables for collateral on certain derivative contracts. Non-cash collateral pledged by the Fund, if any, is noted in the Schedule of Investments.
B. Level 3 Fair Value Investments — To the extent that significant inputs to valuation models and other alternative pricing sources are unobservable, or if quotations are not readily available, or if GSAM believes that such quotations do not accurately reflect fair value, the fair value of the Fund’s investments may be determined under Valuation Procedures approved by the Trustees. GSAM, consistent with its procedures and applicable regulatory guidance, may make an adjustment to the most recent valuation prices of either domestic or foreign securities in light of significant events to reflect what it believes to be the fair value of the securities at the time of determining the Fund’s NAV. Significant events which could affect a large number of securities in a particular market may include, but are not limited to: significant fluctuations in U.S. or foreign markets; market dislocations; market disruptions; or unscheduled market closings. Significant events which could also affect a single issuer may include, but are not limited to: corporate actions such as reorganizations, mergers and buy-outs; ratings downgrades; and bankruptcies.
C. Fair Value Hierarchy — The following is a summary of the Fund’s investments and derivatives classified in the fair value hierarchy as of December 31, 2017:
| | | | | | | | | | | | |
| Investment Type | | Level 1 | | | Level 2 | | | Level 3 | |
| Assets | | | | | | | | | | | | |
| Common Stock(a) | | | | | | | | | | | | |
North America | | $ | 416,813,339 | | | $ | — | | | $ | — | |
| | | |
| Derivative Type | | | | | | | | | |
| Assets(b) | | | | | | | | | | | | |
| Futures Contracts | | $ | 4,030 | | | $ | — | | | $ | — | |
| (a) | Amounts are disclosed by continent to highlight the impact of time zone differences between local market close and the calculation of NAV. Security valuations are based on the principal exchange or system on which they are traded, which may differ from country of domicile noted in the table. |
| (b) | Amount shown represents unrealized gain (loss) at fiscal year end. |
For further information regarding security characteristics, see the Schedule of Investments.
17
GOLDMAN SACHS VARIABLE INSURANCE TRUST U.S. EQUITY INSIGHTS FUND
Notes to Financial Statements (continued)
December 31, 2017
4. INVESTMENTS IN DERIVATIVES
The following table sets forth, by certain risk types, the gross value of derivative contracts (not considered to be hedging instruments for accounting disclosure purposes) as of December 31, 2017. These instruments were used as part of the Fund’s investment strategies and to obtain and/or manage exposure related to the risks below. The values in the table below exclude the effects of cash collateral received or posted pursuant to these derivative contracts, and therefore are not representative of the Fund’s net exposure.
| | | | | | | | | | | | | | |
| Risk | | | | Statement of Assets and Liabilities | | Assets(a) | | | Statement of Assets and Liabilities | | Liabilities | |
| Equity | | | | Variation margin on futures | | $ | 4,030 | | | — | | $ | — | |
| (a) | Includes unrealized gain (loss) on futures contracts described in the Additional Investment Information section of the Schedule of Investments. Only the variation margin as of December 31, 2017 is reported within the Statement of Assets and Liabilities. |
The following table sets forth, by certain risk types, the Fund’s gains (losses) related to these derivatives and their indicative volumes for the fiscal year ended December 31, 2017. These gains (losses) should be considered in the context that these derivative contracts may have been executed to create investment opportunities and/or economically hedge certain investments, and accordingly, certain gains (losses) on such derivative contracts may offset certain (losses) gains attributable to investments. These gains (losses) are included in “Net realized gain (loss)” or “Net change in unrealized gain (loss)” on the Statement of Operations:
| | | | | | | | | | | | | | |
| Risk | | Statement of Operations | | Net Realized Gain (Loss) | | | Net Change in Unrealized Gain (Loss) | | | Average Number of Contracts(a) | |
| Equity | | Net realized gain (loss) from futures contracts/Net change in unrealized gain (loss) on futures contracts | | $ | 514,631 | | | $ | 33,601 | | | | 30 | |
| (a) | Average number of contracts is based on the average of month end balances for the fiscal year ended December 31, 2017. |
5. AGREEMENTS AND AFFILIATED TRANSACTIONS
A. Management Agreement — Under the Agreement, GSAM manages the Fund, subject to the general supervision of the Trustees.
As compensation for the services rendered pursuant to the Agreement, the assumption of the expenses related thereto and administration of the Fund’s business affairs, including providing facilities, GSAM is entitled to a management fee, accrued daily and paid monthly, equal to an annual percentage rate of the Fund’s average daily net assets.
For the fiscal year ended December 31, 2017, contractual and effective net management fees with GSAM were at the following rates:
| | | | | | | | | | | | | | | | | | | | | | | | | | |
| Contractual Management Rate | | | Effective Net Management Rate^ | |
First $1 billion | | | Next $1 billion | | | Next $3 billion | | | Next $3 billion | | | Over $8 billion | | | Effective
Rate | | |
| | 0.62% | | | | 0.59 | % | | | 0.56 | % | | | 0.55 | % | | | 0.54 | % | | | 0.62 | % | | | 0.59 | %* |
| ^ | Effective Net Management Rate includes the impact of management fee waivers of affiliated Underlying Funds, if any. |
| * | GSAM agreed to waive a portion of its management fee in order to achieve a net management rate, as defined in the Fund’s most recent prospectus. This waiver will be effective through at least April 28, 2018, and prior to such date GSAM may not terminate the arrangement without approval of the Trustees. For the fiscal year ended December 31, 2017, GSAM waived $109,764 of its management fee. |
The Fund invests in Institutional Shares of the Goldman Sachs Financial Square Government Fund, which is an affiliated Underlying Fund. GSAM has agreed to waive a portion of its management fee payable by the Fund in an amount equal to the management fee it earns as an investment adviser to the affiliated Underlying Fund in which the Fund invests, except those management fees it earns from the Fund’s investments of cash collateral received in connection with securities lending transactions in the Goldman Sachs Financial Square Government Fund. For the fiscal year ended December 31, 2017, GSAM waived $2,862 of the Fund’s management fee.
18
GOLDMAN SACHS VARIABLE INSURANCE TRUST U.S. EQUITY INSIGHTS FUND
5. AGREEMENTS AND AFFILIATED TRANSACTIONS (continued)
B. Distribution and/or Service (12b-1) Plan — The Trust, on behalf of Service Shares of the Fund, has adopted a Distribution and Service Plan subject to Rule 12b-1 under the Act. Under the Distribution and Service Plan, Goldman Sachs, which serves as distributor, is entitled to a fee accrued daily and paid monthly, for distribution services and personal and account maintenance services, which may then be paid by Goldman Sachs to authorized dealers, equal to, on an annual basis, 0.25% of the Fund’s average daily net assets attributable to Service Shares. Goldman Sachs has agreed to waive distribution and service fees so as not to exceed an annual rate of 0.21% of average daily net assets attributable to Service Shares. This distribution and service fee waiver will remain in place through at least April 28, 2018, and prior to such date Goldman Sachs may not terminate the arrangement without the approval of the Trustees. For the fiscal year ended December 31, 2017, Goldman Sachs waived $52,624 in distribution and service fees for the Fund’s Service Shares.
C. Transfer Agency Agreement — Goldman Sachs also serves as the transfer agent of the Fund for a fee pursuant to the Transfer Agency Agreement. The fees charged for such transfer agency services are accrued daily and paid monthly at an annual rate of 0.02% of the average daily net assets of Institutional and Service Shares.
D. Other Expense Agreements and Affiliated Transactions — GSAM has agreed to limit certain “Other Expenses” of the Fund (excluding acquired fund fees and expenses, transfer agency fees and expenses, service fees and shareholder administration fees (as applicable), taxes, interest, brokerage fees, expenses of shareholder meetings, litigation and indemnification, and extraordinary expenses) to the extent such expenses exceed, on an annual basis, a percentage rate of the average daily net assets of the Fund. Such Other Expense reimbursements, if any, are accrued daily and paid monthly. In addition, the Fund is not obligated to reimburse GSAM for prior fiscal year expense reimbursements, if any. The Other Expense limitation as an annual percentage rate of average daily net assets for the Fund is 0.004%. The Other Expense limitation will remain in place through at least April 28, 2018, and prior to such date GSAM may not terminate the arrangement without the approval of the Trustees. For the fiscal year ended December 31, 2017, GSAM reimbursed $230,686 to the Fund. In addition, the Fund has entered into certain offset arrangements with the custodian and the transfer agent, which may result in a reduction of the Fund’s expenses and are received irrespective of the application of the “Other Expense” limitation described above. For the fiscal year ended December 31, 2017, custody fee credits were $4,905.
E. Line of Credit Facility — As of December 31, 2017, the Fund participated in a $1,100,000,000 committed, unsecured revolving line of credit facility (the “facility”) together with other funds of the Trust and certain registered investment companies having management agreements with GSAM or its affiliates. This facility is to be used for temporary emergency purposes, or to allow for an orderly liquidation of securities to meet redemption requests. The interest rate on borrowings is based on the federal funds rate. The facility also requires a fee to be paid by the Fund based on the amount of the commitment that has not been utilized. For the fiscal year ended December 31, 2017, the Fund did not have any borrowings under the facility.
F. Other Transactions with Affiliates — The following table provides information about the Fund’s investment in the Goldman Sachs Financial Square Government Fund as of and for the fiscal year ended December 31, 2017:
| | | | | | | | | | | | | | | | | | | | | | |
Beginning
Value as of December 31, 2016 | | | Purchases
at Cost | | | Proceeds from Sales | | | Ending
Value as of December 31, 2017 | | | Shares as of December 31, 2017 | | | Dividend Income from Affiliated Investment Company | |
| $ | 1,470,057 | | | $ | 32,695,640 | | | $ | (34,165,697 | ) | | $ | — | | | | — | | | $ | 12,052 | |
6. PORTFOLIO SECURITIES TRANSACTIONS
The cost of purchases and proceeds from sales and maturities of long-term securities for the fiscal year ended December 31, 2017, were $720,344,376 and $751,918,232, respectively.
19
GOLDMAN SACHS VARIABLE INSURANCE TRUST U.S. EQUITY INSIGHTS FUND
Notes to Financial Statements (continued)
December 31, 2017
7. SECURITIES LENDING
Pursuant to exemptive relief granted by the Securities and Exchange Commission (“SEC”) and the terms and conditions contained therein, the Fund may lend its securities through a securities lending agent, Goldman Sachs Agency Lending (“GSAL”), a wholly-owned subsidiary of Goldman Sachs, to certain qualified borrowers including Goldman Sachs and affiliates. In accordance with the Fund’s securities lending procedures, the Fund receives cash collateral at least equal to the market value of the securities on loan. The market value of the loaned securities is determined at the close of business of the Fund, at their last sale price or official closing price on the principal exchange or system on which they are traded, and any additional required collateral is delivered to the Fund on the next business day. As with other extensions of credit, the Fund may experience delay in the recovery of its securities or incur a loss should the borrower of the securities breach its agreement with the Fund or become insolvent at a time when the collateral is insufficient to cover the cost of repurchasing securities on loan. Dividend income received from securities on loan may not be subject to withholding taxes and therefore withholding taxes paid may differ from the amounts listed in the Statement of Operations. Loans of securities are terminable at any time and as such 1) the remaining contractual maturities of the outstanding securities lending transactions are considered to be overnight and continuous and 2) the borrower, after notice, is required to return borrowed securities within the standard time period for settlement of securities transactions.
The Fund invests the cash collateral received in connection with securities lending transactions in the Goldman Sachs Financial Square Government Fund (“Government Money Market Fund”), an affiliated series of the Trust. The Government Money Market Fund is registered under the Act as an open end investment company, is subject to Rule 2a-7 under the Act, and is managed by GSAM, for which GSAM may receive a management fee of up to 0.205% on an annualized basis of the average daily net assets of the Government Money Market Fund.
In the event of a default by a borrower with respect to any loan, GSAL will exercise any and all remedies provided under the applicable borrower agreement to make the Fund whole. These remedies include purchasing replacement securities by applying the collateral held from the defaulting broker against the purchase cost of the replacement securities. If GSAL is unable to purchase replacement securities, GSAL will indemnify the Fund by paying the Fund an amount equal to the market value of the securities loaned minus the value of cash collateral received from the borrower for the loan, subject to an exclusion for any shortfalls resulting from a loss of value in such cash collateral due to reinvestment risk. The Fund’s loaned securities were all subject to enforceable Securities Lending Agreements and the value of the collateral was at least equal to the value of the cash received. The amounts of the Fund’s overnight and continuous agreements represent the gross amounts of recognized liabilities for securities lending transactions outstanding as of December 31, 2017 are disclosed as “Payable upon return of securities loaned” on the Statement of Assets and Liabilities, where applicable. The Fund did not have securities on loan as of December 31, 2017.
Both the Fund and GSAL received compensation relating to the lending of the Fund’s securities. The amounts earned, if any, by the Fund for the fiscal year ended December 31, 2017, are reported under Investment Income on the Statement of Operations.
The table below details securities lending activity with affiliates of Goldman Sachs:
| | | | | | | | | | |
| For the fiscal year ended December 31, 2017 | | | | |
Earnings of GSAL Relating to Securities Loaned | | | Amounts Received by the Fund from Lending to Goldman Sachs | | | Amounts Payable to Goldman Sachs Upon Return of Securities Loaned as of
12-31-17 | |
| $ | 91 | | | $ | — | | | $ | — | |
The following table provides information about the Fund’s investment in the Government Money Market Fund for the fiscal year ended December 31, 2017:
| | | | | | | | | | | | | | | | | | |
Beginning Value as of December 31, 2016 | | | Purchases at Cost | | | Proceeds from Sales | | | Ending
Value as of December 31, 2017 | | | Shares as of
December 31, 2017 | |
| | $— | | | $ | 5,701,075 | | | $ | (5,701,075 | ) | | $ | — | | | | — | |
20
GOLDMAN SACHS VARIABLE INSURANCE TRUST U.S. EQUITY INSIGHTS FUND
8. TAX INFORMATION
The tax character of distributions paid during the fiscal years ended December 31, 2016 and December 31, 2017 was as follows:
| | | | | | | | |
| | | 2016 | | | 2017 | |
| Distributions paid from: | | | | | | | | |
Ordinary income | | $ | 7,477,447 | | | $ | 38,065,317 | |
Net long-term capital gains | | | 9,889,500 | | | | 9,813,374 | |
| Total taxable distributions | | $ | 17,366,947 | | | $ | 47,878,691 | |
As of December 31, 2017, the components of accumulated earnings (losses) on a tax-basis were as follows:
| | | | |
| Undistributed ordinary income — net | | $ | 6,250,134 | |
| Undistributed long-term capital gains | | | 2,688,593 | |
| Total undistributed earnings | | $ | 8,938,727 | |
| Unrealized gains — net | | | 66,128,937 | |
| Total accumulated gains — net | | $ | 75,067,664 | |
As of December 31, 2017, the Fund’s aggregate security unrealized gains and losses based on cost for U.S. federal income tax purposes were as follows:
| | | | |
| Tax cost | | $ | 350,688,432 | |
| Gross unrealized gain | | | 71,175,786 | |
| Gross unrealized loss | | | (5,046,849 | ) |
| Net unrealized gain | | $ | 66,128,937 | |
The difference between GAAP-basis and tax-basis unrealized gains (losses) is attributable primarily to wash sales, net mark to market gains (losses) on regulated futures contracts and differences in the tax treatment of underlying fund investments.
In order to present certain components of the Fund’s capital accounts on a tax-basis, the Fund has reclassified $91,075 from undistributed net investment income to accumulated net realized gain (loss). This reclassification has no impact on the NAV of the Fund and results primarily from differences in the tax treatment of underlying fund investments.
GSAM has reviewed the Fund’s tax positions for all open tax years (the current and prior three years, as applicable) and has concluded that no provision for income tax is required in the Fund’s financial statements. Such open tax years remain subject to examination and adjustment by tax authorities.
9. OTHER RISKS
The Fund’s risks include, but are not limited to, the following:
Derivatives Risk — The Fund’s use of derivatives may result in loss. Derivative instruments, which may pose risks in addition to and greater than those associated with investing directly in securities, currencies or other instruments, may be illiquid or less liquid, volatile, difficult to price and leveraged so that small changes in the value of the underlying instruments may produce disproportionate losses to the Fund. Derivatives are also subject to counterparty risk, which is the risk that the other party in the transaction will not fulfill its contractual obligation. The use of derivatives is a highly specialized activity that involves investment
21
GOLDMAN SACHS VARIABLE INSURANCE TRUST U.S. EQUITY INSIGHTS FUND
Notes to Financial Statements (continued)
December 31, 2017
9. OTHER RISKS (continued)
techniques and risks different from those associated with investments in more traditional securities and instruments. Losses from derivatives can also result from a lack of correlation between changes in the value of derivative instruments and the portfolio assets (if any) being hedged.
Investments in Other Investment Companies Risk — As a shareholder of another investment company, including an exchange-traded fund (“ETF”), the Fund will indirectly bear its proportionate share of any net management fees and other expenses paid by such other investment companies, in addition to the fees and expenses regularly borne by the Fund. ETFs are subject to risks that do not apply to conventional mutual funds, including but not limited to the following: (i) the market price of the ETF’s shares may trade at a premium or a discount to their NAV; and (ii) an active trading market for an ETF’s shares may not develop or be maintained.
Large Shareholder Transactions Risk — The Fund may experience adverse effects when certain large shareholders, such as other funds, participating insurance companies, accounts and Goldman Sachs affiliates, purchase or redeem large amounts of shares of the Fund. Such large shareholder redemptions may cause the Fund to sell portfolio securities at times when it would not otherwise do so, which may negatively impact the Fund’s NAV and liquidity. These transactions may also accelerate the realization of taxable income to shareholders if such sales of investments resulted in gains, and may also increase transaction costs. In addition, a large redemption could result in the Fund’s current expenses being allocated over a smaller asset base, leading to an increase in the Fund’s expense ratio. Similarly, large Fund share purchases may adversely affect the Fund’s performance to the extent that the Fund is delayed in investing new cash and is required to maintain a larger cash position than it ordinarily would.
Liquidity Risk — The Fund may make investments that are illiquid or that may become less liquid in response to market developments or adverse investor perceptions. Illiquid investments may be more difficult to value. Liquidity risk may also refer to the risk that the Fund will not be able to pay redemption proceeds within the allowable time period because of unusual market conditions, an unusually high volume of redemption requests, or other reasons. To meet redemption requests, the Fund may be forced to sell investments at an unfavorable time and/or under unfavorable conditions.
Market and Credit Risks — In the normal course of business, the Fund trades financial instruments and enters into financial transactions where risk of potential loss exists due to changes in the market (market risk). Additionally, the Fund may also be exposed to credit risk in the event that an issuer or guarantor fails to perform or that an institution or entity with which the Fund has unsettled or open transactions defaults.
10. INDEMNIFICATIONS
Under the Trust’s organizational documents, its Trustees, officers, employees and agents are indemnified, to the extent permitted by the Act and state law, against certain liabilities that may arise out of performance of their duties to the Fund. Additionally, in the course of business, the Fund enters into contracts that contain a variety of indemnification clauses. The Fund’s maximum exposure under these arrangements is unknown, as this would involve future claims that may be made against the Fund that have not yet occurred. However, GSAM believes the risk of loss under these arrangements to be remote.
11. SUBSEQUENT EVENTS
Subsequent events after the Statement of Assets and Liabilities date have been evaluated, and GSAM has concluded that there is no impact requiring adjustment or disclosure in the financial statements.
22
GOLDMAN SACHS VARIABLE INSURANCE TRUST U.S. EQUITY INSIGHTS FUND
12. SUMMARY OF SHARE TRANSACTIONS
Share activity is as follows:
| | | | | | | | | | | | | | | | |
| | | For the Fiscal Year Ended
December 31, 2017 | | | For the Fiscal Year Ended
December 31, 2016 | |
| | | Shares | | | Dollars | | | Shares | | | Dollars | |
| Institutional Shares | | | | | | | | | | | | | | | | |
| Shares sold | | | 358,460 | | | $ | 6,845,622 | | | | 316,144 | | | $ | 5,403,266 | |
| Reinvestment of distributions | | | 1,635,690 | | | | 31,912,323 | | | | 671,831 | | | | 11,972,029 | |
| Shares redeemed | | | (2,153,338 | ) | | | (42,049,816 | ) | | | (2,619,254 | ) | | | (44,715,813 | ) |
| | | | (159,188 | ) | | | (3,291,871 | ) | | | (1,631,279 | ) | | | (27,340,518 | ) |
| Service Shares | | | | | | | | | | | | | | | | |
| Shares sold | | | 801,197 | | | | 15,818,307 | | | | 615,221 | | | | 10,515,136 | |
| Reinvestment of distributions | | | 815,443 | | | | 15,966,368 | | | | 301,729 | | | | 5,394,918 | |
| Shares redeemed | | | (1,114,105 | ) | | | (21,990,356 | ) | | | (1,427,118 | ) | | | (24,577,191 | ) |
| | | | 502,535 | | | | 9,794,319 | | | | (510,168 | ) | | | (8,667,137 | ) |
| NET INCREASE (DECREASE) | | | 343,347 | | | $ | 6,502,448 | | | | (2,141,447 | ) | | $ | (36,007,655 | ) |
23
Report of Independent Registered Public Accounting Firm
To the Board of Trustees of
Goldman Sachs Variable Insurance Trust and Shareholders of the Goldman Sachs U.S. Equity Insights Fund
Opinion on the Financial Statements
We have audited the accompanying statement of assets and liabilities, including the schedule of investments, of the Goldman Sachs U.S. Equity Insights Fund (the “Fund”) as of December 31, 2017, the related statement of operations for the year ended December 31, 2017, the statements of changes in net assets for each of the two years in the period ended December 31, 2017, including the related notes, and the financial highlights for each of the five years in the period ended December 31, 2017 (collectively referred to as the “financial statements”). In our opinion, the financial statements present fairly, in all material respects, the financial position of the Fund as of December 31, 2017, the results of its operations for the year then ended, the changes in its net assets for each of the two years in the period ended December 31, 2017 and the financial highlights for each of the five years in the period ended December 31, 2017 in conformity with accounting principles generally accepted in the United States of America.
Basis for Opinion
These financial statements are the responsibility of the Fund’s management. Our responsibility is to express an opinion on the Fund’s financial statements based on our audits. We are a public accounting firm registered with the Public Company Accounting Oversight Board (United States) (“PCAOB”) and are required to be independent with respect to the Fund in accordance with the U.S. federal securities laws and the applicable rules and regulations of the Securities and Exchange Commission and the PCAOB.
We conducted our audits of these financial statements in accordance with the standards of the PCAOB. Those standards require that we plan and perform the audit to obtain reasonable assurance about whether the financial statements are free of material misstatement, whether due to error or fraud.
Our audits included performing procedures to assess the risks of material misstatement of the financial statements, whether due to error or fraud, and performing procedures that respond to those risks. Such procedures included examining, on a test basis, evidence regarding the amounts and disclosures in the financial statements. Our audits also included evaluating the accounting principles used and significant estimates made by management, as well as evaluating the overall presentation of the financial statements. Our procedures included confirmation of securities owned as of December 31, 2017 by correspondence with the custodian and brokers; when replies were not received from brokers, we performed other auditing procedures. We believe that our audits provide a reasonable basis for our opinion.
PricewaterhouseCoopers LLP
Boston, Massachusetts
February 14, 2018
We have served as the auditor of one or more investment companies in the Goldman Sachs Fund complex since 2000.
24
GOLDMAN SACHS VARIABLE INSURANCE TRUST U.S. EQUITY INSIGHTS FUND
| | |
| Fund Expenses — Six Month Period Ended December 31, 2017 (Unaudited) | | |
As a shareholder of Institutional or Service Shares of the Fund, you incur ongoing costs, including management fees, distribution and/or service (12b-1) fees (with respect to Service Shares) and other Fund expenses. This example is intended to help you understand your ongoing costs (in dollars) of investing in the Institutional Shares and Service Shares of the Fund and to compare these costs with the ongoing costs of investing in other mutual funds.
The example is based on an investment of $1,000 invested at the beginning of the period and held for the entire period from July 1, 2017 through December 31, 2017, which represents a period of 184 days of a 365 day year.
Actual Expenses — The first line under each share class in the table below provides information about actual account values and actual expenses. You may use the information in this line, together with the amount you invested, to estimate the expenses that you paid over the period. Simply divide your account value by $1,000 (for example, an $8,600 account value divided by $1,000=8.6), then multiply the result by the number in the first line under the heading entitled “Expenses Paid” to estimate the expenses you paid on your account during this period.
Hypothetical Example for Comparison Purposes — The second line under each share class in the table below provides information about hypothetical account values and hypothetical expenses based on the Fund’s actual net expense ratio and an assumed rate of return of 5% per year before expenses, which is not the Fund’s actual return. The hypothetical account values and expenses may not be used to estimate the actual ending account balance or expenses you paid for the period. You may use this information to compare the ongoing costs of investing in the Fund and other funds. To do so, compare this 5% hypothetical example with the 5% hypothetical examples that appear in the shareholder reports of the other funds.
Please note that the expenses shown in the table are meant to highlight your ongoing costs only. As a shareholder of the Fund you do not incur any transaction costs, such as sales charges, redemption fees, or exchange fees, but shareholders of other funds may incur such costs. The second line of the table is useful in comparing ongoing costs only and will not help you determine the relative total costs of owning different funds whose shareholders may incur transaction costs.
| | | | | | | | | | | | |
| Share Class | | Beginning Account Value 07/01/17 | | | Ending Account Value 12/31/17 | | | Expenses Paid for the
6 Months
Ended
12/31/17* | |
| Institutional | | | | | | | | | | | | |
| Actual | | $ | 1,000 | | | $ | 1,120.70 | | | $ | 3.21 | |
| Hypothetical 5% return | | | 1,000 | | | | 1022.18 | + | | | 3.06 | |
| Service | | | | | | | | | | | | |
| Actual | | | 1,000 | | | | 1,119.20 | | | | 4.33 | |
| Hypothetical 5% return | | | 1,000 | | | | 1021.12 | + | | | 4.13 | |
| | * | Expenses are calculated using the Fund’s annualized net expense ratio for each class, which represents the ongoing expenses as a percentage of net assets for the six months ended December 31, 2017. Expenses are calculated by multiplying the annualized net expense ratio by the average account value for the period; then multiplying the result by the number of days in the most recent fiscal half year; and then dividing that result by the number of days in the fiscal year. The annualized net expense ratios for the period were 0.60% and 0.81% for Institutional and Service Shares, respectively. | |
| | + | Hypothetical expenses are based on the Fund’s actual annualized net expense ratios and an assumed rate of return of 5% per year before expenses. | |
25
GOLDMAN SACHS VARIABLE INSURANCE TRUST U.S. EQUITY INSIGHTS FUND
Trustees and Officers (Unaudited)
Independent Trustees
| | | | | | | | | | | | |
| | | | | |
Name,
Address and Age1 | | Position(s) Held with the Trust | | Term of Office and
Length of
Time Served2 | | Principal Occupation(s) During Past 5 Years | | Number of
Portfolios in
Fund Complex
Overseen by
Trustee3 | | | Other Directorships Held by Trustee4 |
Jessica Palmer Age: 68 | | Chair of the Board of Trustees | | 2018 (Trustee since 2007) | | Ms. Palmer is retired. She is Director, Emerson Center for the Arts and Culture (2011-Present); and was formerly a Consultant, Citigroup Human Resources Department (2007-2008); Managing Director, Citigroup Corporate and Investment Banking (previously, Salomon Smith Barney/Salomon Brothers) (1984-2006). Ms. Palmer was a Member of the Board of Trustees of Indian Mountain School (private elementary and secondary school) (2004-2009). Chair of the Board of Trustees — Goldman Sachs Trust and Goldman Sachs Variable Insurance Trust. | | | 105 | | | None |
Kathryn A. Cassidy Age: 63 | | Trustee | | Since 2015 | | Ms. Cassidy is retired. Formerly, she was Advisor to the Chairman (May 2014-December 2014); and Senior Vice President and Treasurer (2008-2014), General Electric Company & General Electric Capital Corporation (technology and financial services companies). Trustee — Goldman Sachs Trust and Goldman Sachs Variable Insurance Trust. | | | 105 | | | None |
Diana M. Daniels Age: 68 | | Trustee | | Since 2007 | | Ms. Daniels is retired. Formerly, she was Vice President, General Counsel and Secretary, The Washington Post Company (1991-2006). Ms. Daniels is a Trustee Emeritus and serves as a Presidential Councillor of Cornell University (2013-Present); former Member of the Legal Advisory Board, New York Stock Exchange (2003-2006) and of the Corporate Advisory Board, Standish Mellon Management Advisors (2006-2007). Trustee — Goldman Sachs Trust and Goldman Sachs Variable Insurance Trust. | | | 105 | | | None |
Herbert J. Markley Age: 67 | | Trustee | | Since 2013 | | Mr. Markley is retired. Formerly, he was Executive Vice President, Deere & Company (an agricultural and construction equipment manufacturer) (2007-2009); and President, Agricultural Division, Deere & Company (2001-2007). Previously, Mr. Markley served as an Advisory Board Member of Goldman Sachs Trust and Goldman Sachs Variable Insurance Trust (June 2013-October 2013). Trustee — Goldman Sachs Trust and Goldman Sachs Variable Insurance Trust. | | | 105 | | | None |
Roy W. Templin Age: 57 | | Trustee | | Since 2013 | | Mr. Templin is retired. He is Director, Armstrong World Industries, Inc. (a designer and manufacturer of ceiling, wall and suspension system solutions) (2016–Present); and was formerly Chairman of the Board of Directors, Con-Way Incorporated (a transportation, logistics and supply chain management service company) (2014-2015); Executive Vice President and Chief Financial Officer, Whirlpool Corporation (an appliance manufacturer and marketer) (2004-2012). Previously, Mr. Templin served as an Advisory Board Member of Goldman Sachs Trust and Goldman Sachs Variable Insurance Trust (June 2013-October 2013). Trustee — Goldman Sachs Trust and Goldman Sachs Variable Insurance Trust. | | | 105 | | | Armstrong World Industries, Inc. (a ceiling, wall and suspension systems solutions manufacturer) |
Gregory G. Weaver Age: 66 | | Trustee | | Since 2015 | | Mr. Weaver is retired. He is Director, Verizon Communications Inc. (2015-Present); and was formerly Chairman and Chief Executive Officer, Deloitte & Touche LLP (a professional services firm) (2001-2005 and 2012-2014); and Member of the Board of Directors, Deloitte & Touche LLP (2006-2012). Trustee — Goldman Sachs Trust and Goldman Sachs Variable Insurance Trust. | | | 105 | | | Verizon Communications Inc. |
| | | | | | | | | | | | |
26
GOLDMAN SACHS VARIABLE INSURANCE TRUST U.S. EQUITY INSIGHTS FUND
Trustees and Officers (Unaudited) (continued)
Interested Trustee*
| | | | | | | | | | | | |
| | | | | |
Name,
Address and Age1 | | Position(s) Held with the Trust | | Term of Office and
Length of
Time Served2 | | Principal Occupation(s) During Past 5 Years | | Number of
Portfolios in
Fund Complex
Overseen by
Trustee3 | | | Other Directorships Held by Trustee4 |
James A. McNamara Age: 55 | | President and Trustee | | Since 2007 | | Managing Director, Goldman Sachs (January 2000-Present); Director of Institutional Fund Sales, GSAM (April 1998-December 2000); and Senior Vice President and Manager, Dreyfus Institutional Service Corporation (January 1993- April 1998). President and Trustee — Goldman Sachs Trust; Goldman Sachs Variable Insurance Trust; Goldman Sachs Trust II; Goldman Sachs MLP Income Opportunities Fund; Goldman Sachs MLP and Energy Renaissance Fund; Goldman Sachs ETF Trust; Goldman Sachs Private Markets Fund 2018 LLC; Goldman Sachs Private Markets Fund 2018 (A) LLC; and Goldman Sachs Private Markets Fund 2018 (B) LLC. | | | 146 | | | None |
| | | | | | | | | | | | |
| * | Mr. McNamara is considered to be an “Interested Trustee” because he holds positions with Goldman Sachs and owns securities issued by The Goldman Sachs Group, Inc. Mr. McNamara holds comparable positions with certain other companies of which Goldman Sachs, GSAM or an affiliate thereof is the investment adviser, administrator and/or distributor. |
| 1 | Each Trustee may be contacted by writing to the Trustee, c/o Goldman Sachs, 200 West Street, New York, New York, 10282, Attn: Caroline Kraus. Information is provided as of December 31, 2017. |
| 2 | Subject to such policies as may be adopted by the Board from time-to-time, each Trustee holds office for an indefinite term, until the earliest of: (a) the election of his or her successor; (b) the date the Trustee resigns or is removed by the Board or shareholders, in accordance with the Trust’s Declaration of Trust; or (c) the termination of the Trust. The Board has adopted policies which provide that (a) no Trustee shall hold office for more than 15 years and (b) a Trustee shall retire as of December 31st of the calendar year in which he or she reaches his or her 74th birthday, unless a waiver of such requirement shall have been adopted by a majority of the other Trustees. These policies may be changed by the Trustees without shareholder vote. |
| 3 | The Goldman Sachs Fund Complex includes certain other companies listed above for each respective Trustee. As of December 31, 2017, Goldman Sachs Trust consisted of 91 portfolios (90 of which offered shares to the public); Goldman Sachs Variable Insurance Trust consisted of 14 portfolios; Goldman Sachs Trust II consisted of 17 portfolios (16 of which offered shares to the public); Goldman Sachs BDC, Inc., Goldman Sachs Private Middle Market Credit LLC, Goldman Sachs MLP Income Opportunities Fund, Goldman Sachs MLP and Energy Renaissance Fund, Goldman Sachs Private Markets Fund 2018 LLC, Goldman Sachs Private Markets Fund 2018 (A) LLC and Goldman Sachs Private Markets Fund 2018 (B) LLC each consisted of one portfolio; and Goldman Sachs ETF Trust consisted of 19 portfolios (12 of which offered shares to the public). Goldman Sachs Private Middle Market Credit LLC, Goldman Sachs Private Markets Fund 2018 LLC, Goldman Sachs Private Markets Fund 2018 (A) LLC and Goldman Sachs Private Markets Fund 2018 (B) LLC do not offer shares to the public. |
| 4 | This column includes only directorships of companies required to report to the Securities and Exchange Commission under the Securities Exchange Act of 1934 (i.e., “public companies”) or other investment companies registered under the Act. |
Additional information about the Trustees is available in the Fund’s Statement of Additional Information, which can be obtained from Goldman Sachs free of charge by calling this toll-free number (in the United States of America): 1-800-526-7384.
27
GOLDMAN SACHS VARIABLE INSURANCE TRUST U.S. EQUITY INSIGHTS FUND
Trustees and Officers (Unaudited) (continued)
Officers of the Trust*
| | | | | | |
| | | |
| Name, Address and Age1 | | Position(s) Held with the Trust | | Term of
Office and
Length of
Time Served2 | | Principal Occupation(s) During Past 5 Years |
James A. McNamara
200 West Street New York, NY 10282 Age: 55 | | Trustee and
President | | Since 2007 | | Managing Director, Goldman Sachs (January 2000-Present); Director of Institutional Fund Sales, GSAM (April 1998-December 2000); and Senior Vice President and Manager, Dreyfus Institutional Service Corporation (January 1993-April 1998). President and Trustee — Goldman Sachs Trust; Goldman Sachs Variable Insurance Trust; Goldman Sachs Trust II; Goldman Sachs MLP Income Opportunities Fund; Goldman Sachs MLP and Energy Renaissance Fund; Goldman Sachs ETF Trust; Goldman Sachs Private Markets Fund 2018 LLC; Goldman Sachs Private Markets Fund 2018 (A) LLC; and Goldman Sachs Private Markets Fund 2018 (B) LLC. |
Caroline L. Kraus
200 West Street New York, NY 10282 Age: 40 | | Secretary | | Since 2012 | | Managing Director, Goldman Sachs (January 2016-Present); Vice President, Goldman Sachs (August 2006-December 2015); Associate General Counsel, Goldman Sachs (2012-Present); Assistant General Counsel, Goldman Sachs (August 2006-December 2011); and Associate, Weil, Gotshal & Manges, LLP (2002-2006). Secretary — Goldman Sachs Trust (previously Assistant Secretary (2012)); Goldman Sachs Variable Insurance Trust (previously Assistant Secretary (2012)); Goldman Sachs Trust II; Goldman Sachs BDC, Inc.; Goldman Sachs Private Middle Market Credit LLC; Goldman Sachs Middle Market Lending Corp.; Goldman Sachs MLP Income Opportunities Fund; Goldman Sachs MLP and Energy Renaissance Fund; Goldman Sachs ETF Trust; Goldman Sachs Private Markets Fund 2018 LLC; Goldman Sachs Private Markets Fund 2018 (A) LLC; and Goldman Sachs Private Markets Fund 2018 (B) LLC. |
Scott M. McHugh
200 West Street New York, NY 10282 Age: 46 | | Treasurer, Senior
Vice President and
Principal Financial
Officer | | Since 2009
(Principal
Financial
Officer
since 2013) | | Managing Director, Goldman Sachs (January 2016-Present); Vice President, Goldman Sachs (February 2007-December 2015); Assistant Treasurer of certain mutual funds administered by DWS Scudder (2005-2007); and Director (2005-2007), Vice President (2000-2005), and Assistant Vice President (1998-2000), Deutsche Asset Management or its predecessor (1998-2007). Treasurer, Senior Vice President and Principal Financial Officer — Goldman Sachs Trust; Goldman Sachs Variable Insurance Trust; Goldman Sachs Trust II; Goldman Sachs MLP Income Opportunities Fund; Goldman Sachs MLP and Energy Renaissance Fund; Goldman Sachs ETF Trust; Goldman Sachs Private Markets Fund 2018 LLC; Goldman Sachs Private Markets Fund 2018 (A) LLC; and Goldman Sachs Private Markets Fund 2018 (B) LLC. |
Joseph F. DiMaria
30 Hudson Street Jersey City, NJ 07302 Age: 49 | | Assistant Treasurer
and Principal
Accounting Officer | | Since 2016
(Principal
Accounting
Officer
since 2017) | | Managing Director, Goldman Sachs (November 2015-Present) and Vice President — Mutual Fund Administration, Columbia Management Investment Advisers, LLC (May 2010-October 2015). Assistant Treasurer and Principal Accounting Officer — Goldman Sachs Trust; Goldman Sachs Variable Insurance Trust; Goldman Sachs Trust II; Goldman Sachs MLP Income Opportunities Fund; Goldman Sachs MLP and Energy Renaissance Fund; Goldman Sachs ETF Trust; Goldman Sachs Private Markets Fund 2018 LLC; Goldman Sachs Private Markets Fund 2018 (A) LLC; and Goldman Sachs Private Markets Fund 2018 (B) LLC. |
| | | | | | |
| * | Represents a partial list of officers of the Trust. Additional information about all the officers is available in the Fund’s Statement of Additional Information, which can be obtained from Goldman Sachs free of charge by calling this toll-free number (in the United States): 1-800-526-7384. |
| 1 | Information is provided as of December 31, 2017. |
| 2 | Officers hold office at the pleasure of the Board of Trustees or until their successors are duly elected and qualified. Each officer holds comparable positions with certain other companies of which Goldman Sachs, GSAM or an affiliate thereof is the investment adviser, administrator and/or distributor. |
28
GOLDMAN SACHS VARIABLE INSURANCE TRUST U.S. EQUITY INSIGHTS FUND
Goldman Sachs Variable Insurance Trust — Tax Information (Unaudited)
For the year ended December 31, 2017, 22.36% of the dividends paid from net investment company taxable income by the U.S. Equity Insights Fund qualify for the dividends received deduction available to corporations.
Pursuant to Section 852 of the Internal Revenue Code, the U.S. Equity Insights Fund designates $9,813,374, or, if different, the maximum amount allowable, as capital gain dividends paid during the year ended December 31, 2017.
29
| | |
| TRUSTEES | | OFFICERS |
| Jessica Palmer, Chair | | James A. McNamara, President |
| Kathryn A. Cassidy | | Scott M. McHugh, Treasurer, Senior Vice |
| Diana M. Daniels | | President and Principal Financial Officer |
| Herbert J. Markley | | Joseph F. DiMaria, Assistant Treasurer and Principal Accounting Officer Caroline L. Kraus, Secretary |
| James A. McNamara | |
| Roy W. Templin | |
| Gregory G. Weaver | | |
GOLDMAN SACHS & CO. LLC
Distributor and Transfer Agent
GOLDMAN SACHS ASSET MANAGEMENT, L.P.
Investment Adviser
200 West Street, New York
New York 10282
Visit our web site at www.GSAMFUNDS.com to obtain the most recent month-end returns.
The reports concerning the Fund included in this shareholder report may contain certain forward-looking statements about the factors that may affect the performance of the Fund in the future. These statements are based on Fund management’s predictions and expectations concerning certain future events and their expected impact on the Fund, such as performance of the economy as a whole and of specific industry sectors, changes in the levels of interest rates, the impact of developing world events, and other factors that may influence the future performance of the Fund. Management believes these forward-looking statements to be reasonable, although they are inherently uncertain and difficult to predict. Actual events may cause adjustments in portfolio management strategies from those currently expected to be employed.
A description of the policies and procedures that the Fund uses to determine how to vote proxies relating to portfolio securities and information regarding how the Fund voted proxies relating to portfolio securities for the 12-month period ended December 31 is available (i) without charge, upon request by calling 1-800-621-2550; and (ii) on the Securities and Exchange Commission (“SEC”) web site at http://www.sec.gov.
The Fund files its complete schedule of portfolio holdings with the SEC for the first and third quarters of each fiscal year on Form N-Q. The Fund’s Form N-Qs are available on the SEC’s web site at http://www.sec.gov within 60 days after the Fund’s first and third fiscal quarters. The Fund’s Form N-Qs may be reviewed and copied at the SEC’s Public Reference Room in Washington, D.C. and information on the operation of the Public Reference Room may also be obtained by calling 1-800-SEC-0330. Form N-Qs may be obtained upon request and without charge by calling 1-800-621-2550.
Views and opinions expressed are for informational purposes only and do not constitute a recommendation by GSAM to buy, sell, or hold any security. Views and opinions are current as of the date of this presentation and may be subject to change, they should not be construed as investment advice.
Goldman Sachs & Co. LLC (“Goldman Sachs”) does not provide legal, tax or accounting advice. Any statement contained in this communication (including any attachments) concerning U.S. tax matters was not intended or written to be used, and cannot be used, for the purpose of avoiding penalties under the Internal Revenue Code, and was written to support the promotion or marketing of transaction or matter addressed. Clients of Goldman Sachs should obtain their own independent tax advice based on their particular circumstances.
The website links provided are for your convenience only and are not an endorsement or recommendation by GSAM of any of these websites or the products or services offered. GSAM is not responsible for the accuracy and validity of the content of these websites.
Fund holdings and allocations shown are as of December 31, 2017 and may not be representative of future investments. Fund holdings should not be relied on in making investment decisions and should not be construed as research or investment advice regarding particular securities. Current and future holdings are subject to risk.
References to indices, benchmarks or other measures of relative market performance over a specified period of time are provided for your information only and do not imply that the portfolio will achieve similar results. The index composition may not reflect the manner in which a portfolio is constructed. While an adviser seeks to design a portfolio which reflects appropriate risk and return features, portfolio characteristics may deviate from those of the benchmark.
The Global Industry Classification Standard (“GICS”) was developed by and is the exclusive property and a service mark of Morgan Stanley Capital International Inc. (“MSCI”) and Standard & Poor’s, a division of The McGraw-Hill Companies, Inc. (“S&P”) and is licensed for use by Goldman Sachs. Neither MSCI, S&P nor any other party involved in making or compiling the GICS or any GICS classifications makes any express or implied warranties or representations with respect to such standard or classification (or the results to be obtained by the use thereof), and all such parties hereby expressly disclaim all warranties of originality, accuracy, completeness, merchantability or fitness for a particular purpose with respect to any of such standard or classification. Without limiting any of the foregoing, in no event shall MSCI, S&P, any of their affiliates or any third party involved in making or compiling the GICS or any GICS classifications have any liability for any direct, indirect, special, punitive, consequential or any other damages (including lost profits) even if notified of the possibility of such damages.
The portfolio risk management process includes an effort to monitor and manage risk, but does not imply low risk.
Shares of the Goldman Sachs VIT Funds are offered to separate accounts of participating life insurance companies for the purpose of funding variable annuity contracts and variable life insurance policies. Shares of the Fund are not offered directly to the general public. The variable annuity contracts and variable life insurance policies are described in the separate prospectuses issued by participating insurance companies. You should refer to those prospectuses for information about surrender charges, mortality and expense risk fees and other charges that may be assessed by participating insurance companies under the variable annuity contracts or variable life insurance policies. Such fees or charges, if any, may affect the return you may realize with respect to your investments. Ask your representative for more complete information. Please consider a fund’s objectives, risks and charges and expenses, and read the prospectus carefully before investing. The prospectus contains this and other information about the Fund.
This material is not authorized for distribution to prospective investors unless preceded or accompanied by a current prospectus or summary prospectus, if applicable. Investors should consider the Fund’s objective, risks, and charges and expenses, and read the summary prospectus, if available, and/or the prospectus carefully before investing or sending money. The summary prospectus, if available, and the prospectus contain this and other information about the Fund and may be obtained from your authorized dealer or from Goldman Sachs & Co. LLC by calling 1-800-621-2550.
THIS MATERIAL IS FOR INFORMATIONAL PURPOSES ONLY AND IS PROVIDED SOLELY ON THE BASIS THAT IT WILL NOT CONSTITUTE INVESTMENT OR OTHER ADVICE OR A RECOMMENDATION RELATING TO ANY PERSON’S OR PLAN’S INVESTMENT OR OTHER DECISIONS, AND GOLDMAN SACHS IS NOT A FIDUCIARY OR ADVISOR WITH RESPECT TO ANY PERSON OR PLAN BY REASON OF PROVIDING THE MATERIAL OR CONTENT HEREIN INCLUDING UNDER THE EMPLOYEE RETIREMENT INCOME SECURITY ACT OF 1974 OR DEPARTMENT OF LABOR REGULATIONS. PLAN SPONSORS AND OTHER FIDUCIARIES SHOULD CONSIDER THEIR OWN CIRCUMSTANCES IN ASSESSING ANY POTENTIAL COURSE OF ACTION.
This report is prepared for the general information of contract owners and is not an offer of shares of the Goldman Sachs Variable Insurance Trust — Goldman Sachs U.S. Equity Insights Fund.
© 2018 Goldman Sachs. All rights reserved.
VITUSAR-18/119279-OTU-698905/8K
| | (a) | As of the end of the period covered by this report, the registrant has adopted a code of ethics that applies to the registrant’s principal executive officer, principal financial officer, principal accounting officer or controller, or persons performing similar functions, regardless of whether these individuals are employed by the registrant or a third party (the “Code of Ethics”). |
| | (b) | During the period covered by this report, no amendments were made to the provisions of the Code of Ethics. |
| | (c) | During the period covered by this report, the registrant did not grant any waivers, including an implicit waiver, from any provision of the Code of Ethics. |
| | (d) | A copy of the Code of Ethics is available as provided in Item 12(a)(1) of this report. |
| ITEM 3. | AUDIT COMMITTEE FINANCIAL EXPERT. |
| | The registrant’s board of trustees has determined that the registrant has at least one “audit committee financial expert” (as defined in Item 3 of Form N-CSR) serving on its audit committee. Gregory G. Weaver is the “audit committee financial expert” and is “independent” (as each term is defined in Item 3 of Form N-CSR). |
| ITEM 4. | PRINCIPAL ACCOUNTANT FEES AND SERVICES. |
Item 4 — Principal Accountant Fees and Services for the Goldman Sachs Variable Insurance Trust (“GSVIT”):
Table 1 – Items 4(a) - 4(d)
| | | | | | | | | | |
| | | 2017 | | | 2016 | | | Description of Services Rendered |
Audit Fees: | | | | | | | | | | |
• PricewaterhouseCoopers (“PwC”) | | $ | 508,700 | | | $ | 466,305 | | | Financial statement audits. |
Audit-Related Fees | | | | | | | | | | |
PwC | | $ | — | | | $ | — | | | Other attest services. |
Tax Fees | | | | | | | | | | |
PwC | | $ | 116,271 | | | $ | 116,270 | | | Tax compliance services provided in connection with the preparation and review of the Registrant’s tax returns. |
Items 4(b)(c) & (d) Table 2. Non-Audit Services to the GSVIT’s * that were pre-approved by the GSVIT’s Audit Committee pursuant to Rule 2-01(c)(7)(ii) of Regulation S-X
| | | | | | | | | | |
| | | 2017 | | | 2016 | | | Description of Services Rendered |
Audit-Related Fees | | | | | | | | | | |
PwC | | $ | 1,860,429 | | | $ | 1,653,616 | | | Internal control review performed in accordance with Statement on Standards for Attestation Engagements No. 16 and Semi-Annual Updates related to withholding tax accrual for non-US Jurisdictions. These fees are borne by the Funds’ adviser. |
| * | These include the advisor (excluding sub-advisors) and any entity controlling, controlled by or under common control with the advisor that provides ongoing services to the registrant (hereinafter referred to as “service affiliates”). |
Item 4(e)(1) — Audit Committee Pre Approval Policies and Procedures
Pre-Approval of Audit and Non-Audit Services Provided to the Funds of the Goldman Sachs Variable Insurance Trust. The Audit and Non-Audit Services Pre-Approval Policy (the “Policy”) adopted by the Audit Committee of GSVIT sets forth the procedures and the conditions pursuant to which services performed by an independent auditor for GSVIT may be pre-approved. Services may be pre-approved specifically by the Audit Committee as a whole or, in certain circumstances, by the Audit Committee Chairman or the person designated as the Audit Committee Financial Expert. In addition, subject to specified cost limitations, certain services may be pre-approved under the provisions of the Policy. The Policy provides that the Audit Committee will consider whether the services provided by an independent auditor are consistent with the Securities and Exchange Commission’s rules on auditor independence. The Policy provides for periodic review and pre-approval by the Audit Committee of the services that may be provided by the independent auditor.
De Minimis Waiver. The pre-approval requirements of the Policy may be waived with respect to the provision of non-audit services that are permissible for an independent auditor to perform, provided (1) the aggregate amount of all such services provided constitutes no more than five percent of the total amount of revenues subject to pre-approval that was paid to the independent auditors during the fiscal year in which the services are provided; (2) such services were not recognized by GSVIT at the time of the engagement to be non-audit services; and (3) such services are promptly brought to the attention of the Audit Committee and approved prior to the completion of the audit by the Audit Committee or by one or more members of the Audit Committee to whom authority to grant such approvals has been delegated by the Audit Committee, pursuant to the pre-approval provisions of the Policy.
Pre-Approval of Non-Audit Services Provided to GSVIT’s Investment Advisers. The Policy provides that, in addition to requiring pre-approval of audit and non-audit services provided to GSVIT, the Audit Committee will pre-approve those non-audit services provided to GSVIT’s investment advisers (and entities controlling, controlled by or under common control with the investment advisers that provide ongoing services to GSVIT) where the engagement relates directly to the operations or financial reporting of GSVIT.
Item 4(e)(2) — 0% of the audit-related fees, tax fees and other fees listed in Table 1 were approved by GSVIT’s Audit Committee pursuant to the “de minimis” exception of Rule 2-01(c)(7)(i)(C) of Regulation S-X. In addition, 0% of the non-audit services to the GSVIT’s service affiliates listed in Table 2 were approved by GSVIT’s Audit Committee pursuant to the “de minimis” exception of Rule 2-01(c)(7)(i)(C) of Regulation S-X.
Item 4(f) — Not applicable.
Items 4(g) Aggregate Non-Audit Fees Disclosure
The aggregate non-audit fees billed to GSVIT for the twelve months ended December 31, 2017 and December 31, 2016 by PwC were approximately $116,271 and $116,270, respectively.
The aggregate non-audit fees billed to GSVIT’s adviser and service affiliates for non-audit services for the twelve months ended December 31, 2016 and December 31, 2015 by PwC were approximately $11.4 million and $14.4 million, respectively. The figures for these entities are not yet available for the twelve months ended December 31, 2017. With regard to the aggregate non-audit fees billed to GSVIT’s adviser and service affiliates, the 2016 and 2015 amounts include fees for non-audit services required to be pre-approved [see Table 2] and fees for non-audit services that did not require pre-approval since they did not directly relate to GSVIT’s operations or financial reporting.
Items 4(h) — GSVIT’s Audit Committee has considered whether the provision of non-audit services to GSVIT’s investment advisor and service affiliates that did not require pre-approval pursuant to paragraph (c)(7)(ii) of Rule 2-01 of Regulation S-X is compatible with maintaining the auditor’s independence.
| ITEM 5. | AUDIT COMMITTEE OF LISTED REGISTRANTS. |
Not applicable.
| ITEM 6. | SCHEDULE OF INVESTMENTS |
Schedule of Investments is included as part of the Reports to Shareholders filed under Item 1.
| ITEM 7. | DISCLOSURE OF PROXY VOTING POLICIES AND PROCEDURES FOR CLOSED-END MANAGEMENT INVESTMENT COMPANIES. |
Not applicable.
| ITEM 8. | PORTFOLIO MANAGERS OF CLOSED-END MANAGEMENT INVESTMENT COMPANIES |
Not applicable.
| ITEM 9. | PURCHASES OF EQUITY SECURITIES BY CLOSED-END MANAGEMENT INVESTMENT COMPANY AND AFFILIATED PURCHASERS |
Not applicable.
| ITEM 10. | SUBMISSION OF MATTERS TO A VOTE OF SECURITY HOLDERS. |
There have been no material changes to the procedures by which shareholders may recommend nominees to the registrant’s board of trustees.
| ITEM 11. | CONTROLS AND PROCEDURES. |
| | (a) | The registrant’s principal executive and principal financial officers or persons performing similar functions have concluded that the registrant’s disclosure controls and procedures (as defined in Rule 30a-3(c) under the Investment Company Act of 1940, as amended (the “1940 Act”)) are effective as of a date within 90 days of the filing date of this report that includes the disclosure required by this paragraph, based on the evaluation of these controls and procedures required by Rule 30a-3(b) under the 1940 Act and 15d-15(b) under the Securities Exchange Act of 1934, as amended. |
| | (b) | There were no changes in the registrant’s internal control over financial reporting (as defined in Rule 30a-3(d) under the 1940 Act) that occurred during the registrant’s second fiscal quarter of the period covered by this report that has materially affected, or is reasonably likely to materially affect the registrant’s internal control over financial reporting. |
| | | | |
| (a)(1) | | | | Goldman Sachs Variable Insurance Trust’s Code of Ethics for Principal Executive and Senior Financial Officers is incorporated by reference to Exhibit 12(a)(1) of the registrant’s Form N-CSR filed on February 27, 2015. |
| | |
| (a)(2) | | Exhibit 99.CERT | | Certifications pursuant to Section 302 of the Sarbanes-Oxley Act of 2002 filed herewith |
| | |
| | Exhibit 99.906CERT | | Certifications pursuant to Section 906 of the Sarbanes-Oxley Act of 2002 filed herewith |
SIGNATURES
Pursuant to the requirements of the Securities Exchange Act of 1934 and the Investment Company Act of 1940, the registrant has duly caused this report to be signed on its behalf by the undersigned, thereunto duly authorized.
Goldman Sachs Variable Insurance Trust
| | |
/s/ James A. McNamara |
By: James A. McNamara |
Chief Executive Officer of |
Goldman Sachs Variable Insurance Trust |
|
Date: February 22, 2018 |
Pursuant to the requirements of the Securities Exchange Act of 1934 and the Investment Company Act of 1940, the report has been signed below by the following persons on behalf of the registrant and in the capacities and on the dates indicated.
| | |
/s/ James A. McNamara |
By: James A. McNamara |
Chief Executive Officer of |
Goldman Sachs Variable Insurance Trust |
|
Date: February 22, 2018 |
|
/s/ Scott McHugh |
By: Scott McHugh |
Principal Financial Officer of |
Goldman Sachs Variable Insurance Trust |
|
Date: February 22, 2018 |