UNITED STATES
SECURITIES AND EXCHANGE COMMISSION
Washington, D.C. 20549
FORM N-CSR
CERTIFIED SHAREHOLDER REPORT OF REGISTERED
MANAGEMENT INVESTMENT COMPANIES
Investment Company Act file number 811-08361
Goldman Sachs Variable Insurance Trust
(Exact name of registrant as specified in charter)
71 South Wacker Drive, Chicago, Illinois 60606-6303
(Address of principal executive offices) (Zip code)
Caroline Kraus
Goldman Sachs & Co. LLC
200 West Street
New York, NY 10282
Copies to:
Geoffrey R.T. Kenyon, Esq.
Dechert LLP
One International Place, 40th Floor
100 Oliver Street
Boston, MA 02110-2605
(Name and address of agents for service)
Registrant’s telephone number, including area code: (312) 655-4400
Date of fiscal year end: December 31
Date of reporting period: December 31, 2020
| ITEM 1. | REPORTS TO STOCKHOLDERS. |
| | The Annual Reports to Shareholders are filed herewith. |
Goldman
Sachs Variable Insurance Trust
Goldman Sachs
Global Trends
Allocation Fund
Beginning on or after January 1, 2021, you may not receive paper copies of the Fund’s annual and semi-annual shareholder reports from the insurance company that offers your variable insurance contract or your financial intermediary, unless you specifically request paper copies of the reports from the insurance company or from your financial intermediary. Instead, the reports will be made available on a website, and you will be notified by mail each time a report is posted and provided with a website link to access the report.
If you already elected to receive shareholder reports electronically, you will not be affected by this change and you need not take any action. At any time, you may elect to receive reports and certain communications from the insurance company electronically by contacting your insurance company or your financial intermediary.
You may elect to receive all future shareholder reports in paper free of charge. You can inform the insurance company or your financial intermediary that you wish to receive paper copies of reports. Your election to receive reports in paper will apply to all Goldman Sachs Funds available under your contract and may apply to all funds held with your financial intermediary.

Annual Report
December 31, 2020
GOLDMAN SACHS VARIABLE INSURANCE TRUST GLOBAL TRENDS ALLOCATION FUND
INVESTMENT OBJECTIVE
The Fund seeks total return while seeking to provide volatility management.
Portfolio Management Discussion and Analysis
Below, the Goldman Sachs Quantitative Investment Strategies (“QIS”) Team discusses the Goldman Sachs Variable Insurance Trust — Goldman Sachs Global Trends Allocation Fund’s (the “Fund”) performance and positioning for the 12-month period ended December 31, 2020 (the “Reporting Period”).
How did the Fund perform during the Reporting Period?
During the Reporting Period, the Fund’s Institutional and Service Shares generated average annual total returns of 4.35% and 4.10%, respectively. These returns compare to the 12.65% average annual total return of the Fund’s blended benchmark, the Global Trends Allocation Composite Index (the “Index”), during the same time period. The components of the Fund’s blended benchmark, which is 60% the MSCI World Index (Net, USD, Hedged) and 40% the Bloomberg Barclays U.S. Treasury Composite Index (Total Return, Unhedged, USD), generated average annual total returns of 14.23% and 7.98%, respectively, during the same time period.
Importantly, during the Reporting Period, the Fund’s overall annualized volatility (which is measured versus the S&P 500® Index) was 9.71%, less than the S&P 500® Index’s annualized volatility of 24.84% during the same time period.
What economic and market factors most influenced the Fund during the Reporting Period?
During the Reporting Period, the performance of the capital markets and the Fund were influenced most by the spread of COVID-19, a contraction in global economic growth and historic financial stimulus by central banks and governments around the world.
Global equities broadly generated gains in 2020, despite steep declines in the first calendar quarter. In the U.S., the equity market fell significantly during the first quarter, selling off as the outbreak and subsequent spread of COVID-19 caused non-essential businesses to close. Economic conditions deteriorated, leading the U.S. government to respond with aggressive economic stimulus and the U.S. Federal Reserve (the “Fed”) to respond with unprecedented monetary policy stimulus. Exacerbating matters was crude oil prices that fell as supply increased and demand decreased. After hitting a low on March 23, 2020, the U.S. equity market then rose in the subsequent three quarters of 2020. In the second calendar quarter, U.S. equities appreciated despite a surge in COVID-19 cases in regional pockets of the country, causing local governments to pause reopening plans and revisit previous lockdown measures. Positive market sentiment was buoyed by better than consensus expected economic data. U.S. equities continued to rally in the third calendar quarter, supported by a sharp cyclical recovery in economic data and optimism around a potential COVID-19 vaccine. In the fourth quarter of 2020, U.S. stocks extended their broad-based rally on the prospect of an end to the global pandemic and its economic impact with the approval and distribution of COVID-19 vaccines. While uncertainty surrounding the November U.S. elections and other policy questions created the potential for higher market volatility, the victory of the Democratic candidate for President proved positive for equity markets in the latter part of the quarter.
In the international developed markets, COVID-19 wreaked havoc across countries, communities and industries alike, disrupting global supply chains, international trade and private consumption patterns across the world. During the first quarter of 2020, many developed equity markets — in economies large and small — went into a tailspin, enduring declines of 30% or more at the trough. Exacerbating matters was the failure of oil-producing nations to agree to production cuts, which resulted in increased supply amid pandemic-driven reduced demand, applying downward pressure on crude oil prices. In the second calendar quarter, developed markets equities gained on optimism around a global economic recovery as lockdown measures began to ease. In Europe, equities were supported by a larger than consensus expected stimulus boost from the European Central Bank’s (“ECB”) Pandemic Emergency Purchase Programme and the European Union’s proposed €750 billion COVID-19 recovery plan. During July and August 2020, developed markets equities advanced, buoyed by supportive industrial and labor data, optimism surrounding COVID-19 vaccine testing and ongoing policy support from governments and central banks. This was followed by a decline in September, with a spike in COVID-19 cases globally, a pullback in information technology sector performance, and the U.S. Fed’s perspective on further policy support. After declining for a second consecutive month in October 2020, developed equity markets then rallied in the last two months of the calendar year, with cyclical and value-oriented stocks outperforming growth-oriented names in a reversal of a long-standing trend. The announcement of promising data from three COVID-19 vaccine developers gave a further boost to investor sentiment and the prospects of a global economic recovery.
1
GOLDMAN SACHS VARIABLE INSURANCE TRUST GLOBAL TRENDS ALLOCATION FUND
In the emerging markets, equities sold off during the first quarter of 2020, as investors were overtaken by the fear of a global recession caused by the COVID-19 outbreak. Countries implemented lockdowns to try and flatten the curve of new infections, with largely all but essential businesses being forced to close. Aside from COVID-19, emerging markets equities also faced adverse effects from the start of an oil price dispute between Russia and Saudi Arabia, which caused global crude oil prices to drop approximately 25% in a single day. During the second calendar quarter, emerging markets equities rebounded significantly as markets saw improved economic conditions even as the COVID-19 pandemic persisted. Many governments bolstered their respective economic recoveries through large stimulus packages, and several emerging markets countries made progress in reopening their economies, as the strict lockdowns implemented earlier had helped in slowing the number of new cases. In the third calendar quarter, emerging markets equities appreciated overall, as investor optimism grew around the potential discovery and distribution of a viable vaccine against COVID-19. That said, they declined modestly in September 2020 following an uptick in global COVID-19 cases and increased uncertainty around the then-upcoming U.S. elections. During the fourth calendar quarter, emerging markets equities gained in the wake of the November U.S. election and as COVID-19 vaccines started being distributed across the world.
Regarding fixed income, spread, or non-government bond, sector performance was mixed during the Reporting Period overall. High yield corporate bonds and asset backed securities outperformed U.S. Treasury securities, followed at some distance by commercial mortgage-backed securities, investment grade corporate bonds and mortgage-backed securities. Sovereign emerging markets debt and agency securities underperformed Treasury securities. During the Reporting Period, U.S. Treasury yields fell along the curve, or spectrum of maturities. Yields on shorter-and intermediate-term maturities dropped more than long-term yields, resulting in the steepening of the U.S. Treasury yield curve. (Yield curve is a spectrum of interest rates based on maturities of varying lengths.) The yield on the bellwether 10-year U.S. Treasury dropped approximately 100 basis points to end the Reporting Period at 0.92%.
When the Reporting Period started in January 2020, macroeconomic data was generally positive but geopolitical uncertainty increased amid U.S.-Iran tensions. In the second half of the month, investor sentiment was challenged by concerns that Chinese and global economic growth could slow due to the outbreak in China of COVID-19. Although risk-off investor sentiment, or reduced risk appetite, eased in early February, it resurfaced later in the month on news of an uptick in COVID-19 cases outside of China. Investor sentiment quickly worsened in March, as governments around the world initiated shutdowns and quarantines to stem what had by then become a pandemic. Global central banks indicated their willingness to use monetary policy to address market volatility and economic conditions. In early March, the Fed reduced its targeted federal funds rate by 50 basis points to a range of between 1.00% and 1.25%, citing “evolving” risks to U.S. economic activity from COVID-19. (A basis point is 1/100th of a percentage point.) Then, on March 15th, the Fed slashed the target federal funds rate to near zero. Other G10 central banks, except for Sweden’s Riksbank, reduced their policy rates or held them at all-time lows. (Also known as Group of 10 nations, the G10 are actually 11 countries that participate in an agreement to provide the International Monetary Fund with additional funds to increase its lending ability. Members include Belgium, Canada, France, Germany, Italy, Japan, Netherlands, Sweden, Switzerland, the U.K. and the U.S.) Quantitative easing measures were resumed in the U.S., the U.K. and Sweden, expanded in Europe and Japan, and commenced in Australia, Canada and New Zealand. New policy measures were also launched, with the goal of easing stresses in corporate bond markets. Meanwhile, many governments began to make use of fiscal policy to stem supply-side shocks. Several announced large fiscal measures, which included direct support for health care efforts. Many of the measures also sought to provide income support to individuals, assistance to households, small businesses and larger companies, and loan guarantees. Finally, a sharp drop in crude oil prices during March 2020 added further to market volatility. Early in the month, a dispute between Russia and the Organization of the Petroleum Exporting Countries, also known as OPEC, led Saudi Arabia to lower the price at which it sold crude oil. In this environment, spread, or non-government bond, sectors, with the exception of mortgage-backed securities, recorded negative returns for the first calendar quarter overall.
During the second quarter of 2020, spread sectors produced positive returns, supported by improving economic data and accommodative monetary and fiscal policy. When the quarter began in April, the broad fixed income market continued to experience bouts of volatility based on economic developments, including data that showed sharp declines in global economic activity, and COVID-19-related headlines. In May, ongoing central bank liquidity, better economic data and market optimism around the reopening of economies sparked a significant rally in risk assets, including corporate credit. Investors appeared to be looking beyond risks such as deteriorating U.S.-China relations and civil unrest and nationwide protests in the U.S. At the start of June, renewed COVID-19 case growth in the U.S. and in various other developed economies increased risk-off sentiment. However, survey and economic activity data rebounded from April’s record low levels, boosting the performance of risk assets overall. Central banks continued to demonstrate their willingness to expand policy parameters to support labor markets and to use quantitative easing to facilitate fiscal expansion and underpin more segments of financial markets. In June, the ECB extended its
2
GOLDMAN SACHS VARIABLE INSURANCE TRUST GLOBAL TRENDS ALLOCATION FUND
quantitative easing program, while the Fed removed a requirement for issuers to “opt in” to its secondary market corporate credit facility.
In the third quarter of 2020, spread sectors continued to produce gains, supported by accommodative central bank monetary policies as well as agreement on a €750 billion European Union Recovery Fund, stronger than consensus expected second quarter corporate earnings and progress on COVID-19 vaccine development. However, the financial markets continued to experience episodes of risk-off sentiment, which were driven by headlines about rising COVID-19 cases, increasing U.S.-China tensions and limited progress in the U.S. Congress on a fourth fiscal stimulus package. Meanwhile, the Fed kept its monetary policy and forward guidance unchanged as it awaited details on further U.S. government fiscal stimulus and the path of the COVID-19. The Fed also extended its credit facilities, which had been set to expire in September, to the end of the 2020 calendar year, thereby elongating the policy tailwind for corporate credit markets. In the Eurozone, the European Union Recovery Fund reduced political tail risks. During August, Fed Chair Jerome Powell unveiled the conclusions of the Federal Open Market Committee’s monetary policy framework review. The main outcome was the adoption of flexible average inflation targeting. In other words, the Fed said it would aim for an inflation rate moderately above 2% following periods when inflation has run persistently below 2%, seeking an average of 2% over time. The U.S. central bank also adjusted how it would assess labor market performance, taking into account racial and income disparities. September 2020 saw the return of risk-off investor sentiment, as some of the factors that supported the improvement in economic conditions started to fade. Renewed COVID-19 case growth in Europe and reduced prospects of further U.S. fiscal support, alongside rising political uncertainty heading into the then-upcoming U.S. elections, all contributed to increased market volatility and investor risk aversion.
Early in the fourth quarter of 2020, steadily rising COVID-19 cases and renewed lockdowns dominated COVID-19-related news flow. However, later in the quarter, encouraging efficacy results for several COVID-19 vaccines helped lift market sentiment, and spread sectors recorded gains for the quarter overall. Risk sentiment was also bolstered by the removal of a few long-standing overhangs. Specifically, the U.S. elections were resolved, the U.K. and European Union agreed to a post-Brexit deal, and another round of fiscal stimulus was provided by the U.S. federal government. (Brexit refers to the U.K.’s exit from the European Union.) Global economic conditions remained weak, with the inflation picture relatively benign due to slack in economic output and employment. Central banks around the world maintained their commitment to accommodative monetary policy. In the U.S., the Fed did not extend the average maturity of its U.S. Treasury purchases at its December policy meeting, but it introduced dovish forward guidance, stating it would continue to increase its asset holdings “until substantial further progress has been made toward the Committee’s maximum employment and price stability goals.” (Dovish tends to suggest lower interest rates; opposite of hawkish.) Meanwhile, the U.S. Department of the Treasury decided to let several of the Fed’s emergency credit facilities expire at the end of 2020 and requested the Fed return unused funds. In Europe, the ECB announced a multi-pronged package of easing measures, in line with market expectations, extended the horizon for its Pandemic Emergency Purchase Programme and increased the level of its purchases.
What key factors were responsible for the Fund’s performance during the Reporting Period?
The Fund primarily seeks to achieve its investment objective by investing in a global portfolio of equity and fixed income asset classes. Under normal market conditions, the Fund expects to invest at least 40% of its assets in equity investments and at least 20% of its assets in fixed income investments. The percentage of the Fund’s portfolio exposed to any asset class or geographic region will vary from time to time as the weightings of the Fund change, and the Fund may not be invested in each asset class at all times.
As part of the Fund’s investment strategy, the Investment Adviser seeks to manage volatility and limit losses by allocating the Fund’s assets away from risky investments in distressed or volatile market environments. Volatility is a statistical measurement of the magnitude of up and down fluctuations in the value of a financial instrument or index. In distressed or volatile market environments, the Fund may also hold significant amounts of U.S. Treasury, short-term or other fixed income investments, including money market funds and repurchase agreements or cash, and at times may invest up to 100% of its assets in such investments.
The Fund continued dynamically allocating across global asset classes during the Reporting Period, using a momentum-based methodology, as it sought total return while also seeking to provide volatility management. Momentum investing seeks growth of capital by gaining exposure to asset classes that have exhibited trends in price performance over selected time periods. In managing the Fund, we use a methodology that evaluates historical three-, six- and nine-month returns, volatilities and correlations across a range of nine global asset classes. Represented by indices, these asset classes include, within the equities category, U.S. large-cap and small-cap, European, Japanese, emerging markets and U.K. stocks. Within the fixed income category, the Fund may allocate assets to the U.S., Europe and Japan. The analysis of these asset classes drives the aggregate allocations of the Fund over time. We believe market price momentum — either positive or negative — has significant predictive power.
3
GOLDMAN SACHS VARIABLE INSURANCE TRUST GLOBAL TRENDS ALLOCATION FUND
During the Reporting Period, the Fund’s allocation to U.S. Treasury securities contributed most positively to absolute returns. In addition, allocations to U.S. large-cap equities, emerging markets equities, U.S. small-cap stocks and Japanese equities added to results. Conversely, an allocation to U.K. equities and, to a lesser extent, an allocation to European equities detracted from the Fund’s absolute performance. The Fund’s allocations to German and Japanese government bonds did not have a material impact on results during the Reporting Period.
The Fund’s defensive cash positioning added significantly to relative performance during the first quarter of 2020 when global equities suffered steep declines. However, the sizeable allocation to cash, which was used to manage volatility, limited the Fund’s participation in the equity market rebound during the next three calendar quarters.
What was the Fund’s volatility during the Reporting Period?
As part of our investment approach, we seek to mitigate the Fund’s volatility. As mentioned earlier, for the Reporting Period overall, the Fund’s overall annualized volatility was 9.71%, less than the S&P 500® Index’s annualized volatility of 24.84%.
How was the Fund positioned during the Reporting Period?
During the Reporting Period, we tactically managed the Fund’s allocations across equity and fixed income markets based on the momentum and volatility of these asset classes. At the beginning of the Reporting Period, the Fund’s total assets were allocated 80% to equities, 20% to fixed income and 0% to cash. (Many of these positions were implemented through the use of exchanged-traded index future contracts.) Within the equity category, the Fund had allocations to five of six global equity asset classes. It did not have an allocation to U.S. small-cap equities at the beginning of the Reporting Period. As for fixed income, the Fund had an allocation to U.S. Treasury securities at the start of the Reporting Period. It did not have allocations to German government bonds or Japanese government bonds.
In January 2020, we increased the Fund’s allocation to U.S. Treasury securities. We reduced its allocations to U.S. large-cap equities, European equities and Japanese equities. In addition, we eliminated the Fund’s allocation to emerging markets equities.
In February 2020, we further increased the Fund’s allocation to U.S. Treasury securities. We mainly decreased its equity allocation to U.S. large-cap equities, but we added a small allocation to emerging markets equities. We established a small cash position.
During March 2020, we actively sought to manage volatility within the Fund’s equity allocations. Specifically, we reduced the Fund’s allocations to U.S. large-cap stocks, European stocks, U.K. stocks and Japanese stocks. We eliminated its allocation to emerging markets equities. In fixed income, we decreased the Fund’s allocation to U.S. Treasury securities. We also significantly increased the Fund’s cash position.
In April 2020, the Fund’s allocations remained relatively unchanged. However, we trimmed the Fund’s cash position and modestly increased its allocation to U.S. Treasury securities.
In May 2020, we meaningfully reduced the Fund’s cash position and increased its allocation to U.S. Treasury securities. We slightly increased its equity allocations, primarily its allocation to U.S. large-cap equities.
In June 2020, the Fund’s equity allocations continued to increase slightly, modestly adding to U.S. large-cap equity, European and Japanese equity allocations. We also added a small allocation to emerging markets equities. In fixed income, we reduced the Fund’s allocation to U.S. Treasury securities.
During July 2020, we further decreased the Fund’s cash position and generally increased its equity allocations, mainly its allocation to U.S. large-cap equities.
In August 2020, we increased the Fund’s equity allocations overall. In addition, we reduced its allocation to U.S. Treasury securities and its position in cash.
During September 2020, we continued to increase the Fund’s equity allocations. Within fixed income, we decreased the Fund’s allocation to U.S. Treasury securities.
In October 2020, the Fund’s equity allocations remained relatively unchanged, though we added a small allocation to U.S. small-cap stocks. Within fixed income, we reduced the Fund’s allocation to U.S. Treasury securities and added an allocation to German government bonds.
During November 2020, we further reduced the Fund’s allocation to U.S. Treasury securities and added an allocation to Japanese government bonds. Equity allocations stayed relatively unchanged overall, though we trimmed the Fund’s allocation to U.S. large-cap equities and increased its allocations to emerging markets equities and Japanese equities.
4
GOLDMAN SACHS VARIABLE INSURANCE TRUST GLOBAL TRENDS ALLOCATION FUND
During December 2020, we increased the Fund’s allocations to equities and U.S. large-cap equities in particular. Within fixed income, we eliminated the Fund’s allocations to U.S. Treasury securities and Japanese government bonds and increased its allocation to German government bonds. We also eliminated the Fund’s position in cash.
How did the Fund use derivatives and similar instruments during the Reporting Period?
During the Reporting Period, the Fund employed exchange-traded equity index futures to gain exposure to U.S. large-cap and small-cap stocks and to European, Japanese, U.K. and emerging markets equities. The use of these instruments had a negative impact overall on absolute returns. In addition, the Fund used bond futures to gain exposure to U.S., Japanese and German government bonds. On an absolute basis, the use of these instruments had a positive impact overall on the Fund’s performance.
Were there any changes to the Fund’s portfolio management team during the Reporting Period?
Effective November 18, 2020, Matthew Schwab no longer served as a portfolio manager of the Fund. At the end of the Reporting Period, the portfolio managers for the Fund were Federico Gilly and Oliver Bunn. By design, all investment decisions for the Fund are performed within a co-lead or team structure, with multiple subject matter experts. This strategic decision making has been the cornerstone of our approach and ensures continuity in the Fund.
What is the Fund’s tactical asset allocation view and strategy for the months ahead?
At the end of the Reporting Period, the Fund’s total assets were allocated 80% to equities, 20% to fixed income and 0% to cash. (Many of these positions were implemented through the use of exchanged-traded index future contracts.) Within the equity allocation, the Fund continued to have significant exposure to U.S. large-cap stocks and, to a lesser extent, to emerging markets, Japanese, U.K., European and U.S. small-cap equities. Within the fixed income allocation, the Fund had exposure to German government bonds. At the end of the Reporting Period, the Fund had no exposure to U.S. Treasury securities or Japanese government bonds.
Going forward, we intend to position the Fund to provide exposure to price momentum from among nine underlying asset classes, while dynamically managing the volatility, or risk, of the overall portfolio. In general, the Fund seeks to maintain a strategic allocation of 60% of its assets in equity investments and 40% of its assets in fixed income investments. The Fund may deviate from these strategic allocations in order to allocate a greater percentage to asset classes with strong momentum and to reduce its allocation to assets with weak momentum. When volatility increases, our goal is to preserve capital by proportionally increasing the Fund’s cash exposure and reducing its exposure to riskier asset classes. There is no guarantee the Fund’s dynamic management strategy will cause it to achieve its investment objective.
5
GOLDMAN SACHS VARIABLE INSURANCE TRUST GLOBAL TRENDS ALLOCATION FUND
Index Definitions
Bloomberg Barclays U.S. Treasury Composite Index measures U.S. dollar-denominated, fixed-rate, nominal debt issued by the U.S. Treasury. Treasury bills are excluded by the maturity constraint.
Global Trends Allocation Composite Index is comprised of 60% the MSCI World Index and 40% the Bloomberg Barclays U.S. Treasury Index.
MSCI World Index is a broad global equity index that represents large and mid-cap equity performance across 23 developed markets countries. It covers approximately 85% of the free float-adjusted market capitalization in each country.
S&P 500® Index is a U.S. stock market index based on the market capitalizations of 500 large companies having common stock listed on the New York Stock Exchange or NASDAQ. The S&P 500® Index components and their weightings are determined by S&P Dow Jones Indices.
It is not possible to invest directly in an unmanaged index.
6
FUND BASICS
Global Trends Allocation Fund
as of December 31, 2020
FUND COMPOSITION1
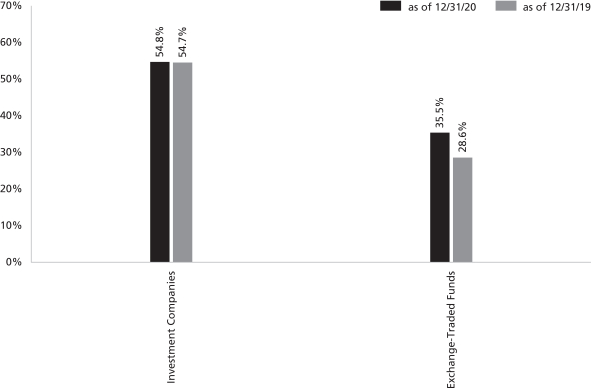
| 1 | The percentage shown for each investment category reflects the value of investments in that category as a percentage of net assets. Figures in the above graph may not sum to 100% due to the exclusion of other assets and liabilities. The underlying composition of exchange traded funds and investment companies held by the Fund are not reflected in the graph above. Consequently, the Fund’s overall composition may differ from the percentages contained in the graph above. The graph depicts the Fund’s investments but may not represent the Fund’s market exposure due to the exclusion of certain derivatives, if any, as listed in the Additional Investment Information section of the Schedule of Investments. |
For more information about your Fund, please refer to www.GSAMFUNDS.com. There, you can learn more about your Fund’s investment strategies, holdings, and performance.
7
GOLDMAN SACHS VARIABLE INSURANCE TRUST GLOBAL TRENDS ALLOCATION FUND
Performance Summary
December 31, 2020
The following graph shows the value, as of December 31, 2020, of a $10,000 investment made on April 16, 2012 (commencement of the Fund’s operations) in Service Shares at NAV. For comparative purposes, the performance of the Fund’s benchmark, the Global Trends Allocation Composite Index, (comprised of the Morgan Stanley Capital International (MSCI) World Index (Net, USD, Hedged) (60%) and the Bloomberg Barclays U.S. Treasury Composite Index (Total Return, USD, Unhedged) (40%)) is shown. Performance reflects applicable fee waivers and/or expense limitations in effect during the periods shown and in their absence, performance would be reduced. Returns do not reflect the deduction of taxes that a shareholder would pay on Fund distributions or the redemption of Fund shares. The returns set forth below represent past performance. Past performance does not guarantee future results. The Fund’s investment return and principal value will fluctuate so that an investor’s shares, when redeemed, may be worth more or less than their original cost. Current performance may be lower or higher than the performance quoted below. Please visit our web site at www.GSAMFUNDS.com to obtain the most recent month-end returns.
Global Trends Allocation Fund’s Lifetime Performance
Performance of a $10,000 investment, with distributions reinvested, from April 16, 2012 through December 31, 2020.

| | | | | | |
| Average Annual Total Return through December 31, 2020 | | One Year | | Five Years | | Since Inception |
Institutional (Commenced October 16, 2013) | | 4.35% | | 5.89% | | 4.28% |
Service (Commenced April 16, 2012) | | 4.10% | | 5.64% | | 4.90% |
8
GOLDMAN SACHS VARIABLE INSURANCE TRUST GLOBAL TRENDS ALLOCATION FUND
Schedule of Investments
December 31, 2020
| | | | | | | | |
| Shares | | |
Description | | Value | |
|
| Exchange-Traded Funds – 35.5% | |
| | 564,100 | | | iShares Core MSCI Emerging Markets ETF | | $ | 34,996,764 | |
| | 116,665 | | | iShares Core S&P 500 ETF | | | 43,794,874 | |
| | 117,600 | | | Vanguard S&P 500 ETF | | | 40,417,944 | |
| | |
| | TOTAL EXCHANGE-TRADED FUNDS | |
| | (Cost $87,176,554) | | $ | 119,209,582 | |
| | |
| | | | | | | | |
| Shares | | | Dividend Rate | | Value | |
|
| Investment Companies(a) – 54.8% | |
| Goldman Sachs Financial Square Government Fund —
Institutional Shares |
|
| | 100,915,798 | | | 0.026% | | $ | 100,915,798 | |
| Goldman Sachs Financial Square Treasury Instruments Fund —
Institutional Shares |
|
| | 16,674,108 | | | 0.006 | | | 16,674,108 | |
| Goldman Sachs Financial Square Treasury Obligations Fund —
Institutional Shares |
|
| | 33,348,216 | | | 0.026 | | | 33,348,216 | |
| | |
| Goldman Sachs Financial Square Treasury Solutions Fund —
Institutional Shares |
|
| | 33,348,216 | | | 0.006% | | | 33,348,216 | |
| | |
| | TOTAL INVESTMENT COMPANIES | |
| | (Cost $184,286,338) | | $ | 184,286,338 | |
| | |
| | TOTAL INVESTMENTS – 90.3% | |
| | (Cost $271,462,892) | | $ | 303,495,920 | |
| | |
| OTHER ASSETS IN EXCESS OF
LIABILITIES – 9.7% | | | 32,577,444 | |
| | |
| | NET ASSETS – 100.0% | | $ | 336,073,364 | |
| | |
| | |
| The percentage shown for each investment category reflects the value of investments in that category as a percentage of net assets. |
| |
| (a) | | Represents an Affiliated Issuer. |
ADDITIONAL INVESTMENT INFORMATION
FUTURES CONTRACTS — At December 31, 2020, the Fund had the following futures contracts:
| | | | | | | | | | | | | | | | |
| Description | | Number of
Contracts | | | Expiration
Date | | | Notional
Amount | | | Unrealized
Appreciation/
(Depreciation) | |
| | | | |
Long position contracts: | | | | | | | | | | | | | | | | |
| EURO STOXX 50 Index | | | 380 | | | | 03/19/2021 | | | $ | 16,480,059 | | | $ | 103,480 | |
| Euro-Bund | | | 202 | | | | 03/08/2021 | | | | 43,836,809 | | | | 87,763 | |
| FTSE 100 Index | | | 193 | | | | 03/19/2021 | | | | 16,944,146 | | | | (115,121 | ) |
| Japan 10 Year Bond | | | 15 | | | | 03/15/2021 | | | | 22,058,012 | | | | (27,154 | ) |
| Russell 2000 E-Mini Index | | | 117 | | | | 03/19/2021 | | | | 11,552,580 | | | | 319,941 | |
| S&P 500 E-Mini Index | | | 123 | | | | 03/19/2021 | | | | 23,055,120 | | | | 666,518 | |
| TOPIX Index | | | 194 | | | | 03/11/2021 | | | | 33,903,733 | | | | 908,923 | |
U.S. Treasury 10 Year Note | | | 356 | | | | 03/22/2021 | | | | 49,139,125 | | | | 61,656 | |
| |
| Total Futures Contracts | | | $ | 2,006,006 | |
| | |
| The accompanying notes are an integral part of these financial statements. | | 9 |
GOLDMAN SACHS VARIABLE INSURANCE TRUST GLOBAL TRENDS ALLOCATION FUND
Statement of Assets and Liabilities
December 31, 2020
| | | | |
| | | | |
| Assets: | | | |
Investments in affiliated issuers, at value (cost $184,286,338) | | $ | 184,286,338 | |
Investments in unaffiliated issuers, at value (cost $87,176,554) | | | 119,209,582 | |
Cash | | | 20,870,719 | |
Foreign currencies, at value (cost $3,868,937) | | | 3,898,700 | |
Receivables: | | | | |
Collateral on certain derivative contracts | | | 8,204,742 | |
Fund shares sold | | | 54,098 | |
Reimbursement from investment adviser | | | 32,405 | |
Dividends | | | 3,083 | |
Securities lending income | | | 171 | |
Other assets | | | 1,260 | |
| |
| Total assets | | | 336,561,098 | |
| | | | |
| | | | |
| Liabilities: | | | |
Variation margin on futures | | | 77,201 | |
Payables: | | | | |
Management fees | | | 163,649 | |
Distribution and Service fees and Transfer Agency fees | | | 76,421 | |
Fund shares redeemed | | | 66,325 | |
Accrued expenses | | | 104,138 | |
| |
| Total liabilities | | | 487,734 | |
| | | | |
| | | | |
| Net Assets: | | | |
Paid-in capital | | | 301,978,010 | |
Total distributable earnings (loss) | | | 34,095,354 | |
| |
| NET ASSETS | | $ | 336,073,364 | |
Net Assets: | | | | |
Institutional | | $ | 289,022 | |
Service | | | 335,784,342 | |
| |
Total Net Assets | | $ | 336,073,364 | |
Shares outstanding $0.001 par value (unlimited shares authorized): | | | | |
Institutional | | | 22,921 | |
Service | | | 26,668,629 | |
Net asset value, offering and redemption price per share: | | | | |
Institutional | | $ | 12.61 | |
Service | | | 12.59 | |
| | |
| 10 | | The accompanying notes are an integral part of these financial statements. |
GOLDMAN SACHS VARIABLE INSURANCE TRUST GLOBAL TRENDS ALLOCATION FUND
Statement of Operations
For the Fiscal Year Ended December 31, 2020
| | | | |
| | | | |
| Investment income: | | | |
Dividends — unaffiliated issuers | | $ | 1,604,321 | |
Dividends — affiliated issuers | | | 719,146 | |
Interest | | | 21,259 | |
Securities lending income — affiliated issuer | | | 205 | |
| |
| Total investment income | | | 2,344,931 | |
| | | | |
| | | | |
| Expenses: | | | |
Management fees | | | 2,565,307 | |
Distribution and Service (12b-1) fees | | | 811,131 | |
Professional fees | | | 134,629 | |
Transfer Agency fees(a) | | | 64,939 | |
Custody, accounting and administrative services | | | 63,732 | |
Printing and mailing costs | | | 49,016 | |
Trustee fees | | | 20,996 | |
Other | | | 22,074 | |
| |
| Total expenses | | | 3,731,824 | |
| |
Less — expense reductions | | | (987,236 | ) |
| |
| Net expenses | | | 2,744,588 | |
| |
| NET INVESTMENT LOSS | | | (399,657 | ) |
| | | | |
| | | | |
| Realized and unrealized gain (loss): | | | |
Net realized gain (loss) from: | | | | |
Investments — unaffiliated issuers | | | 7,411,369 | |
Futures contracts | | | (3,651,027 | ) |
Foreign currency transactions | | | 634,341 | |
Net change in unrealized gain on: | | | | |
Investments — unaffiliated issuers | | | 5,834,188 | |
Futures contracts | | | 2,600,582 | |
Foreign currency translation | | | 135,150 | |
| |
| Net realized and unrealized gain | | | 12,964,603 | |
| |
| NET INCREASE IN NET ASSETS RESULTING FROM OPERATIONS | | $ | 12,564,946 | |
(a) Institutional and Service Shares incurred Transfer Agency fees of $54 and $64,885, respectively.
| | |
| The accompanying notes are an integral part of these financial statements. | | 11 |
GOLDMAN SACHS VARIABLE INSURANCE TRUST GLOBAL TRENDS ALLOCATION FUND
Statements of Changes in Net Assets
| | | | | | | | |
| | | For the
Fiscal Year Ended
December 31, 2020 | | | For the
Fiscal Year Ended
December 31, 2019 | |
| | | | | | | | |
| From operations: | | | | | | |
Net investment income (loss) | | $ | (399,657 | ) | | $ | 3,172,465 | |
Net realized gain | | | 4,394,683 | | | | 22,215,858 | |
Net change in unrealized gain | | | 8,569,920 | | | | 14,993,095 | |
| | |
| Net increase in net assets resulting from operations | | | 12,564,946 | | | | 40,381,418 | |
| | | | | | | | |
| | | | | | | | |
| Distributions to shareholders: | | | | | | |
From distributable earnings: | | | | | | | | |
Institutional Shares | | | (5,497 | ) | | | (16,100 | ) |
Service Shares | | | (5,648,001 | ) | | | (19,290,888 | ) |
| | |
| Total distributions to shareholders | | | (5,653,498 | ) | | | (19,306,988 | ) |
| |
| | | | | | | | |
| From share transactions: | | | | | | |
Proceeds from sales of shares | | | 18,343,800 | | | | 25,165,924 | |
Reinvestment of distributions | | | 5,653,498 | | | | 19,306,988 | |
Cost of shares redeemed | | | (40,330,893 | ) | | | (116,140,276 | ) |
| | |
| Net decrease in net assets resulting from share transactions | | | (16,333,595 | ) | | | (71,667,364 | ) |
| | |
| TOTAL DECREASE | | | (9,422,147 | ) | | | (50,592,934 | ) |
| |
| | | | | | | | |
| Net Assets: | | | | | | |
| | |
Beginning of year | | | 345,495,511 | | | | 396,088,445 | |
| End of year | | $ | 336,073,364 | | | $ | 345,495,511 | |
| | |
| 12 | | The accompanying notes are an integral part of these financial statements. |
GOLDMAN SACHS VARIABLE INSURANCE TRUST GLOBAL TRENDS ALLOCATION FUND
Financial Highlights
Selected Data for a Share Outstanding Throughout Each Year
| | | | | | | | | | | | | | | | | | | | |
| | | Goldman Sachs Global Trends Allocation Fund | |
| | | Institutional Shares | |
| | | Year Ended December 31, | |
| | 2020 | | | 2019 | | | 2018 | | | 2017 | | | 2016 | |
| | | | | | | | | | | | | | | | | | | | |
| Per Share Data | | | | | | | | | | | | | | | |
| | | | | |
Net asset value, beginning of year | | $ | 12.32 | | | $ | 11.65 | | | $ | 12.46 | | | $ | 11.33 | | | $ | 10.89 | |
| | | | | |
Net investment income (loss)(a) | | | 0.02 | | | | 0.15 | | | | 0.14 | | | | 0.06 | | | | (0.03 | ) |
| | | | | |
Net realized and unrealized gain (loss) | | | 0.52 | | | | 1.28 | | | | (0.64 | ) | | | 1.46 | | | | 0.52 | |
| | | | | |
Total from investment operations | | | 0.54 | | | | 1.43 | | | | (0.50 | ) | | | 1.52 | | | | 0.49 | |
| | | | | |
Distributions to shareholders from net investment income | | | (0.07 | ) | | | (0.22 | ) | | | (0.12 | ) | | | (0.07 | ) | | | (0.05 | ) |
| | | | | |
Distributions to shareholders from net realized gains | | | (0.18 | ) | | | (0.54 | ) | | | (0.19 | ) | | | (0.32 | ) | | | — | |
| | | | | |
Total distributions | | | (0.25 | ) | | | (0.76 | ) | | | (0.31 | ) | | | (0.39 | ) | | | (0.05 | ) |
| | | | | |
Net asset value, end of year | | $ | 12.61 | | | $ | 12.32 | | | $ | 11.65 | | | $ | 12.46 | | | $ | 11.33 | |
| | | | | |
Total return(b) | | | 4.35 | % | | | 12.29 | % | | | (4.08 | )% | | | 13.36 | % | | | 4.49 | % |
| | | | | |
Net assets, end of year (in 000s) | | $ | 289 | | | $ | 277 | | | $ | 247 | | | $ | 30 | | | $ | 27 | |
| | | | | |
Ratio of net expenses to average net assets | | | 0.60 | % | | | 0.59 | % | | | 0.51 | % | | | 0.68 | % | | | 0.74 | % |
| | | | | |
Ratio of total expenses to average net assets | | | 0.90 | % | | | 0.89 | % | | | 0.86 | % | | | 0.86 | % | | | 0.89 | % |
| | | | | |
Ratio of net investment income (loss) to average net assets | | | 0.13 | % | | | 1.18 | % | | | 1.13 | % | | | 0.46 | % | | | (0.25 | )% |
| | | | | |
Portfolio turnover rate(c) | | | 168 | % | | | 61 | % | | | 60 | % | | | 64 | % | | | 260 | % |
| (a) | Calculated based on the average shares outstanding methodology. |
| (b) | Assumes investment at the net asset value at the beginning of the year, reinvestment of all distributions, a complete redemption of the investment at the net asset value at the end of the year and no sales or redemption charges (if any). Total returns would be reduced if a sales or redemption charge was taken into account. Returns do not reflect the impact of taxes to shareholders relating to Fund distributions or the redemption of Fund shares. |
| (c) | The Fund’s portfolio turnover rate is calculated in accordance with regulatory requirements, without regard to transactions involving short term investments and certain derivatives. If such transactions were included, the Fund’s portfolio turnover rate may be higher. |
| | |
| The accompanying notes are an integral part of these financial statements. | | 13 |
GOLDMAN SACHS VARIABLE INSURANCE TRUST GLOBAL TRENDS ALLOCATION FUND
Financial Highlights (continued)
Selected Data for a Share Outstanding Throughout Each Year
| | | | | | | | | | | | | | | | | | | | |
| | | Goldman Sachs Global Trends Allocation Fund | |
| | | Service Shares | |
| | | Year Ended December 31, | |
| | 2020 | | | 2019 | | | 2018 | | | 2017 | | | 2016 | |
| | | | | | | | | | | | | | | | | | | | |
| Per Share Data | | | | | | | | | | | | | | | |
| | | | | |
Net asset value, beginning of year | | $ | 12.30 | | | $ | 11.64 | | | $ | 12.45 | | | $ | 11.32 | | | $ | 10.88 | |
| | | | | |
Net investment income (loss)(a) | | | (0.01 | ) | | | 0.11 | | | | 0.08 | | | | 0.03 | | | | 0.02 | |
| | | | | |
Net realized and unrealized gain (loss) | | | 0.51 | | | | 1.28 | | | | (0.62 | ) | | | 1.46 | | | | 0.45 | |
| | | | | |
Total from investment operations | | | 0.50 | | | | 1.39 | | | | (0.54 | ) | | | 1.49 | | | | 0.47 | |
| | | | | |
Distributions to shareholders from net investment income | | | (0.03 | ) | | | (0.19 | ) | | | (0.08 | ) | | | (0.04 | ) | | | (0.03 | ) |
| | | | | |
Distributions to shareholders from net realized gains | | | (0.18 | ) | | | (0.54 | ) | | | (0.19 | ) | | | (0.32 | ) | | | — | |
| | | | | |
Total distributions | | | (0.21 | ) | | | (0.73 | ) | | | (0.27 | ) | | | (0.36 | ) | | | (0.03 | ) |
| | | | | |
Net asset value, end of year | | $ | 12.59 | | | $ | 12.30 | | | $ | 11.64 | | | $ | 12.45 | | | $ | 11.32 | |
| | | | | |
Total return(b) | | | 4.10 | % | | | 11.94 | % | | | (4.34 | )% | | | 13.11 | % | | | 4.33 | % |
| | | | | |
Net assets, end of year (in 000s) | | $ | 335,784 | | | $ | 345,219 | | | $ | 395,842 | | | $ | 406,867 | | | $ | 353,615 | |
| | | | | |
Ratio of net expenses to average net assets | | | 0.85 | % | | | 0.84 | % | | | 0.81 | % | | | 0.93 | % | | | 1.00 | % |
| | | | | |
Ratio of total expenses to average net assets | | | 1.15 | % | | | 1.14 | % | | | 1.11 | % | | | 1.11 | % | | | 1.13 | % |
| | | | | |
Ratio of net investment income (loss) to average net assets | | | (0.12 | )% | | | 0.91 | % | | | 0.63 | % | | | 0.21 | % | | | 0.20 | % |
| | | | | |
Portfolio turnover rate(c) | | | 168 | % | | | 61 | % | | | 60 | % | | | 64 | % | | | 260 | % |
| (a) | Calculated based on the average shares outstanding methodology. |
| (b) | Assumes investment at the net asset value at the beginning of the year, reinvestment of all distributions, a complete redemption of the investment at the net asset value at the end of the year and no sales or redemption charges (if any). Total returns would be reduced if a sales or redemption charge was taken into account. Returns do not reflect the impact of taxes to shareholders relating to Fund distributions or the redemption of Fund shares. |
| (c) | The Fund’s portfolio turnover rate is calculated in accordance with regulatory requirements, without regard to transactions involving short term investments and certain derivatives. If such transactions were included, the Fund’s portfolio turnover rate may be higher. |
| | |
| 14 | | The accompanying notes are an integral part of these financial statements. |
GOLDMAN SACHS VARIABLE INSURANCE TRUST GLOBAL TRENDS ALLOCATION FUND
Notes to Financial Statements
December 31, 2020
1. ORGANIZATION
Goldman Sachs Variable Insurance Trust (the “Trust” or “VIT”) is a Delaware statutory trust registered under the Investment Company Act of 1940, as amended (the “Act”), as an open-end management investment company. The Trust includes the Goldman Sachs Global Trends Allocation Fund (the “Fund”). The Fund is a diversified portfolio under the Act offering two classes of shares — Institutional and Service Shares. Shares of the Trust are offered to separate accounts of participating life insurance companies for the purpose of funding variable annuity contracts and variable life insurance policies.
Goldman Sachs Asset Management, L.P. (“GSAM”), an affiliate of Goldman Sachs & Co. LLC (“Goldman Sachs”), serves as investment adviser to the Fund pursuant to a management agreement (the “Agreement”) with the Trust.
2. SIGNIFICANT ACCOUNTING POLICIES
The financial statements have been prepared in accordance with accounting principles generally accepted in the United States of America (“GAAP”) and require management to make estimates and assumptions that may affect the reported amounts and disclosures. Actual results may differ from those estimates and assumptions. The Fund is an investment company under GAAP and follows the accounting and reporting guidance applicable to investment companies.
A. Investment Valuation — The Fund’s valuation policy is to value investments at fair value.
B. Investment Income and Investments — Investment income includes interest income, dividend income, and securities lending income, if any. Interest income is accrued daily and adjusted for amortization of premiums and accretion of discounts. Dividend income is recognized on ex-dividend date or, for certain foreign securities, as soon as such information is obtained subsequent to the ex-dividend date. Non-cash dividends, if any, are recorded at the fair market value of the securities received. Investment transactions are reflected on trade date. Realized gains and losses are calculated using identified cost. Investment transactions are recorded on the following business day for daily net asset value (“NAV”) calculations. Investment income is recorded net of any foreign withholding taxes, less any amounts reclaimable. The Fund may file withholding tax reclaims in certain jurisdictions to recover a portion of amounts previously withheld. Any foreign capital gains tax is accrued daily based upon net unrealized gains, and is payable upon sale of such investments.
For derivative contracts, realized gains and losses are recorded upon settlement of the contract.
C. Class Allocations and Expenses — Investment income, realized and unrealized gain (loss), if any, and non-class specific expenses of the Fund are allocated daily based upon the proportion of net assets of each class. Non-class specific expenses directly incurred by the Fund are charged to the Fund, while such expenses incurred by the Trust are allocated across the Fund on a straight-line and/or pro-rata basis depending upon the nature of the expenses. Class specific expenses, where applicable, are borne by the respective share classes and include Distribution and Service and Transfer Agency fees.
D. Federal Taxes and Distributions to Shareholders — It is the Fund’s policy to comply with the requirements of the Internal Revenue Code of 1986, as amended (the “Code”), applicable to regulated investment companies and to distribute each year substantially all of its investment company taxable income and capital gains to its shareholders. Accordingly, the Fund is not required to make any provisions for the payment of federal income tax. Distributions to shareholders are recorded on the ex-dividend date. Income and capital gains distributions, if any, are declared and paid at least annually.
Net capital losses, if any, are carried forward to future fiscal years and may be used to the extent allowed by the Code to offset any future capital gains. Losses that are carried forward will retain their character as either short-term or long-term capital losses. Utilization of capital loss carryforwards will reduce the requirement of future capital gains distributions.
The characterization of distributions to shareholders for financial reporting purposes is determined in accordance with federal income tax rules, which may differ from GAAP. The source of the Fund’s distributions may be shown in the accompanying financial statements as either from distributable earnings or capital. Certain components of the Fund’s net assets on the Statement of Assets and Liabilities reflect permanent GAAP/tax differences based on the appropriate tax character.
15
GOLDMAN SACHS VARIABLE INSURANCE TRUST GLOBAL TRENDS ALLOCATION FUND
Notes to Financial Statements (continued)
December 31, 2020
2. SIGNIFICANT ACCOUNTING POLICIES (continued)
E. Foreign Currency Translation — The accounting records and reporting currency of the Fund are maintained in United States (“U.S.”) dollars. Assets and liabilities denominated in foreign currencies are translated into U.S. dollars using the current exchange rates at the close of each business day. The effect of changes in foreign currency exchange rates on investments is included within net realized and unrealized gain (loss) on investments. Changes in the value of other assets and liabilities as a result of fluctuations in foreign exchange rates are included in the Statement of Operations within net change in unrealized gain (loss) on foreign currency translation. Transactions denominated in foreign currencies are translated into U.S. dollars on the date the transaction occurred, the effects of which are included within net realized gain (loss) on foreign currency transactions.
3. INVESTMENTS AND FAIR VALUE MEASUREMENTS
U.S. GAAP defines the fair value of a financial instrument as the amount that would be received to sell an asset or paid to transfer a liability in an orderly transaction between market participants at the measurement date (i.e., the exit price); the Fund’s policy is to use the market approach. GAAP establishes a fair value hierarchy that prioritizes the inputs to valuation techniques used to measure fair value. The hierarchy gives the highest priority to unadjusted quoted prices in active markets for identical assets or liabilities (Level 1 measurements) and the lowest priority to unobservable inputs (Level 3 measurements). The level in the fair value hierarchy within which the fair value measurement in its entirety falls shall be determined based on the lowest level input that is significant to the fair value measurement in its entirety. The levels used for classifying investments are not necessarily an indication of the risk associated with investing in these investments. The three levels of the fair value hierarchy are described below:
Level 1 — Unadjusted quoted prices in active markets that are accessible at the measurement date for identical, unrestricted assets or liabilities;
Level 2 — Quoted prices in markets that are not active or financial instruments for which significant inputs are observable (including, but not limited to, quoted prices for similar investments, interest rates, foreign exchange rates, volatility and credit spreads), either directly or indirectly;
Level 3 — Prices or valuations that require significant unobservable inputs (including GSAM’s assumptions in determining fair value measurement).
The Board of Trustees (“Trustees”) has approved Valuation Procedures that govern the valuation of the portfolio investments held by the Fund, including investments for which market quotations are not readily available. The Trustees have delegated to GSAM day-to-day responsibility for implementing and maintaining internal controls and procedures related to the valuation of the Fund’s investments. To assess the continuing appropriateness of pricing sources and methodologies, GSAM regularly performs price verification procedures and issues challenges as necessary to third party pricing vendors or brokers, and any differences are reviewed in accordance with the Valuation Procedures.
A. Level 1 and Level 2 Fair Value Investments — The valuation techniques and significant inputs used in determining the fair values for investments classified as Level 1 and Level 2 are as follows:
Equity Securities — Equity securities traded on a U.S. securities exchange or the NASDAQ system, or those located on certain foreign exchanges, including but not limited to the Americas, are valued daily at their last sale price or official closing price on the principal exchange or system on which they are traded. If there is no sale or official closing price or such price is believed by GSAM to not represent fair value, equity securities will be valued at the valid closing bid price for long positions and at the valid closing ask price for short positions (i.e. where there is sufficient volume, during normal exchange trading hours). If no valid bid/ask price is available, the equity security will be valued pursuant to the Valuation Procedures approved by the Trustees and consistent with applicable regulatory guidance. To the extent these investments are actively traded, they are classified as Level 1 of the fair value hierarchy, otherwise they are generally classified as Level 2. Certain equity securities containing unique attributes may be classified as Level 2.
Unlisted equity securities for which market quotations are available are valued at the last sale price on the valuation date, or if
16
GOLDMAN SACHS VARIABLE INSURANCE TRUST GLOBAL TRENDS ALLOCATION FUND
3. INVESTMENTS AND FAIR VALUE MEASUREMENTS (continued)
no sale occurs, at the last bid price for long positions or the last ask price for short positions, and are generally classified as Level 2. Securities traded on certain foreign securities exchanges are valued daily at fair value determined by an independent fair value service (if available) under Fair Valuation Procedures approved by the Trustees and consistent with applicable regulatory guidance. The independent fair value service takes into account multiple factors including, but not limited to, movements in the securities markets, certain depositary receipts, futures contracts and foreign currency exchange rates that have occurred subsequent to the close of the foreign securities exchange. These investments are generally classified as Level 2 of the fair value hierarchy.
Underlying Funds (including Money Market Funds) — Underlying funds (“Underlying Funds”) include other investment companies and exchange-traded funds (“ETFs”). Investments in the Underlying Funds (except ETFs) are valued at the NAV per share on the day of valuation. ETFs are valued daily at the last sale price or official closing price on the principal exchange or system on which the investment is traded. Because the Fund invests in Underlying Funds that fluctuate in value, the Fund’s shares will correspondingly fluctuate in value. To the extent these investments are actively traded, they are classified as Level 1 of the fair value hierarchy, otherwise they are generally classified as Level 2. For information regarding an Underlying Fund’s accounting policies and investment holdings, please see the Underlying Fund’s shareholder report.
Derivative Contracts — A derivative is an instrument whose value is derived from underlying assets, indices, reference rates or a combination of these factors. The Fund enters into derivative transactions to hedge against changes in interest rates, securities prices, and/or currency exchange rates, to increase total return, or to gain access to certain markets or attain exposure to other underliers. For financial reporting purposes, cash collateral that has been pledged to cover obligations of the Fund and cash collateral received, if any, is reported separately on the Statement of Assets and Liabilities as receivables/payables for collateral on certain derivatives contracts. Non-cash collateral pledged by the Fund, if any, is noted in the Schedule of Investments.
Exchange-traded derivatives, including futures and options contracts, are generally valued at the last sale or settlement price on the exchange where they are principally traded. Exchange-traded options without settlement prices are generally valued at the midpoint of the bid and ask prices on the exchange where they are principally traded (or, in the absence of two-way trading, at the last bid price for long positions and the last ask price for short positions). Exchange-traded derivatives typically fall within Level 1 of the fair value hierarchy. Over-the-counter (“OTC”) and centrally cleared derivatives are valued using market transactions and other market evidence, including market-based inputs to models, calibration to market-clearing transactions, broker or dealer quotations, or other alternative pricing sources. Where models are used, the selection of a particular model to value OTC and centrally cleared derivatives depends upon the contractual terms of, and specific risks inherent in, the instrument, as well as the availability of pricing information in the market. Valuation models require a variety of inputs, including contractual terms, market prices, yield curves, credit curves, measures of volatility, voluntary and involuntary prepayment rates, loss severity rates and correlations of such inputs. For OTC and centrally cleared derivatives that trade in liquid markets, model inputs can generally be verified and model selection does not involve significant management judgment. OTC and centrally cleared derivatives are classified within Level 2 of the fair value hierarchy when significant inputs are corroborated by market evidence.
i. Futures Contracts — Futures contracts are contracts to buy or sell a standardized quantity of a specified commodity or security. Upon entering into a futures contract, the Fund deposits cash or securities in an account on behalf of the broker in an amount sufficient to meet the initial margin requirement. Subsequent payments are made or received by the Fund equal to the daily change in the contract value and are recorded as variation margin receivable or payable with a corresponding offset to unrealized gains or losses.
B. Level 3 Fair Value Investments — To the extent that significant inputs to valuation models and other alternative pricing sources are unobservable, or if quotations are not readily available, or if GSAM believes that such quotations do not accurately reflect fair value, the fair value of the Fund’s investments may be determined under Valuation Procedures approved by the Trustees. GSAM, consistent with its procedures and applicable regulatory guidance, may make an adjustment to the most recent valuation prices of either domestic or foreign securities in light of significant events to reflect what it believes to be the fair value of the securities at the time of determining the Fund’s NAV. To the extent investments are valued using single source broker quotations obtained directly from the broker or passed through from third party pricing vendors, such investments are classified as Level 3 investments.
17
GOLDMAN SACHS VARIABLE INSURANCE TRUST GLOBAL TRENDS ALLOCATION FUND
Notes to Financial Statements (continued)
December 31, 2020
3. INVESTMENTS AND FAIR VALUE MEASUREMENTS (continued)
C. Fair Value Hierarchy — The following is a summary of the Fund’s investments and derivatives classified in the fair value hierarchy as of December 31, 2020:
| | | | | | | | | | | | |
| Investment Type | | Level 1 | | | Level 2 | | | Level 3 | |
| | | |
| Assets | | | | | | | | | | | | |
| Exchange Traded Funds | | $ | 119,209,582 | | | $ | — | | | $ | — | |
| Investment Companies | | | 184,286,338 | | | | — | | | | — | |
| | | |
| Total | | $ | 303,495,920 | | | $ | — | | | $ | — | |
| | | |
| Derivative Type | | | | | | | | | |
| | | |
| Assets(a) | | | | | | | | | | | | |
| Futures Contracts | | $ | 2,148,281 | | | $ | — | | | $ | — | |
| | | |
| Liabilities(a) | | | | | | | | | | | | |
| Futures Contracts | | $ | (142,275 | ) | | $ | — | | | $ | — | |
| (a) | Amount shown represents unrealized gain (loss) at fiscal year end. |
For further information regarding security characteristics, see the Schedule of Investments.
4. INVESTMENTS IN DERIVATIVES
The following table sets forth, by certain risk types, the gross value of derivative contracts (not considered to be hedging instruments for accounting disclosure purposes) as of December 31, 2020. These instruments were used as part of the Fund’s investment strategies and to obtain and/or manage exposure related to the risks below. The values in the table below exclude the effects of cash collateral received or posted pursuant to these derivative contracts, and therefore are not representative of the Fund’s net exposure.
| | | | | | | | | | | | | | |
| Risk | | | | Statement of Assets and Liabilities | | Assets(a) | | | Statement of Assets and Liabilities | | Liabilities(a) | |
| Equity | | | | Variation margin on futures contracts | | $ | 1,998,862 | | | Variation margin on futures contracts | | $ | (115,121 | ) |
| Interest Rate | | | | Variation margin on futures contracts | | | 149,419 | | | Variation margin on futures contracts | | | (27,154 | ) |
| | | | | |
| Total | | | | | | $ | 2,148,281 | | | | | $ | (142,275 | ) |
| (a) | Includes unrealized gain (loss) on futures contracts described in the Additional Investment Information section of the Schedule of Investments. Only the variation margin as of December 31, 2020 is reported within the Statement of Assets and Liabilities. |
The following table sets forth, by certain risk types, the Fund’s gains (losses) related to these derivatives and their indicative volumes for the fiscal year ended December 31, 2020. These gains (losses) should be considered in the context that these derivative contracts may have been executed to create investment opportunities and/or economically hedge certain investments, and
18
GOLDMAN SACHS VARIABLE INSURANCE TRUST GLOBAL TRENDS ALLOCATION FUND
4. INVESTMENTS IN DERIVATIVES (continued)
accordingly, certain gains (losses) on such derivative contracts may offset certain (losses) gains attributable to investments. These gains (losses) are included in “Net realized gain (loss)” or “Net change in unrealized gain (loss)” on the Statement of Operations:
| | | | | | | | | | | | | | |
| Risk | | Statement of Operations | | Net Realized
Gain (Loss) | | | Net Change in
Unrealized
Gain (Loss) | | | Average
Number of
Contracts(a) | |
| Equity | | Net realized gain (loss) from futures contracts/Net change in unrealized gain (loss) on futures contracts | | $ | (11,889,492 | ) | | $ | 1,267,478 | | | | 860 | |
| Interest Rate | | Net realized gain (loss) from futures contracts/Net change in unrealized gain (loss) on futures contracts | | | 8,238,465 | | | | 1,333,104 | | | | 910 | |
| | | | |
| Total | | | | $ | (3,651,027 | ) | | $ | 2,600,582 | | | | 1,770 | |
| (a) | Average number of contracts is based on the average of month end balances for the fiscal year ended December 31, 2020. |
5. AGREEMENTS AND AFFILIATED TRANSACTIONS
A. Management Agreement — Under the Agreement, GSAM manages the Fund, subject to the general supervision of the Trustees.
As compensation for the services rendered pursuant to the Agreement, the assumption of the expenses related thereto and administration of the Fund’s business affairs, including providing facilities, GSAM is entitled to a management fee, accrued daily and paid monthly, equal to an annual percentage rate of the Fund’s average daily net assets.
For the fiscal year ended December 31, 2020, contractual and effective net management fees with GSAM were at the following rates:
| | | | | | | | | | | | | | | | | | | | | | | | |
| Contractual Management Rate | | | | | | | |
First
$1 billion | | Next
$1 billion | | | Next
$3 billion | | | Next
$3 billion | | | Over
$8 billion | | | Effective
Rate | | | Effective Net
Management
Rate^ | |
| 0.79% | | | 0.71 | % | | | 0.68 | % | | | 0.66 | % | | | 0.65 | % | | | 0.79 | % | | | 0.59 | %* |
| ^ | Effective Net Management Rate includes the impact of management fee waivers of affiliated Underlying Funds, if any. |
| * | GSAM agreed to waive a portion of its management fee in order to achieve a net management rate, as defined in the Fund’s most recent prospectus. This waiver will be effective through at least April 29, 2021, and prior to such date GSAM may not terminate the arrangement without approval of the Trustees. For the fiscal year ended December 31, 2020, GSAM waived $389,668 of its management fee. |
The Fund invests in Institutional Shares of the Goldman Sachs Financial Square Government, Goldman Sachs Financial Square Treasury Instruments, Goldman Sachs Financial Square Treasury Obligations, and Goldman Sachs Financial Square Treasury Solutions Funds, which are affiliated Underlying Funds. GSAM has agreed to waive a portion of its management fee payable by the Fund in an amount equal to the management fee it earns as an investment adviser to the affiliated Underlying Funds in which the Fund invests, except those management fees it earns from the Fund’s investments of cash collateral received in connection with securities lending transactions in the Goldman Sachs Financial Square Government Fund. For the fiscal year ended December 31, 2020, GSAM waived $274,248 of the Fund’s management fee.
B. Distribution and Service (12b-1) Plan — The Trust, on behalf of Service Shares of the Fund, has adopted a Distribution and Service Plan subject to Rule 12b-1 under the Act. Under the Distribution and Service Plan, Goldman Sachs, which serves as distributor, is entitled to a fee accrued daily and paid monthly, for distribution services and personal and account maintenance services, which may then be paid by Goldman Sachs to authorized dealers, equal to, on an annual basis, 0.25% of the Fund’s average daily net assets attributable to Service Shares.
19
GOLDMAN SACHS VARIABLE INSURANCE TRUST GLOBAL TRENDS ALLOCATION FUND
Notes to Financial Statements (continued)
December 31, 2020
5. AGREEMENTS AND AFFILIATED TRANSACTIONS (continued)
C. Transfer Agency Agreement — Goldman Sachs also serves as the transfer agent of the Fund for a fee pursuant to the Transfer Agency Agreement. The fees charged for such transfer agency services are accrued daily and paid monthly at an annual rate of 0.02% of the average daily net assets of Institutional and Service Shares.
D. Other Expense Agreements and Affiliated Transactions — GSAM has agreed to reduce or limit certain “Other Expenses” of the Fund (excluding acquired fund fees and expenses, transfer agency fees and expenses, service fees and shareholder administration fees (as applicable), taxes, interest, brokerage fees, expenses of shareholder meetings, litigation and indemnification, and extraordinary expenses) to the extent such expenses exceed, on an annual basis, a percentage rate of the average daily net assets of the Fund. Such Other Expense reimbursements, if any, are accrued daily and paid monthly. In addition, the Fund is not obligated to reimburse GSAM for prior fiscal year expense reimbursements, if any. The Other Expense limitation as an annual percentage rate of average daily net assets for the Fund is 0.004%. The Other Expense limitation will remain in place through at least April 29, 2021, and prior to such date GSAM may not terminate the arrangement without the approval of the Trustees. In addition, the Fund has entered into certain offset arrangements with the custodian and the transfer agent, which may result in a reduction of the Fund’s expenses and are received irrespective of the application of the “Other Expense” limitation described above.
For the fiscal year ended December 31, 2020, these expense reductions, including any fee waivers and Other Expense reimbursements, were as follows:
| | | | | | | | | | | | | | |
Management Fee
Waiver | | | Custody Fee
Credits | | | Other Expense
Reimbursement | | | Total Expense
Reductions | |
| | | |
| | $663,916 | | | $ | 45,862 | | | $ | 277,458 | | | $ | 987,236 | |
E. Line of Credit Facility — As of December 31, 2020, the Fund participated in a $700,000,000 committed, unsecured revolving line of credit facility (the “facility”) together with other funds of the Trust and certain registered investment companies having management agreements with GSAM or its affiliates. This facility is to be used for temporary emergency purposes, or to allow for an orderly liquidation of securities to meet redemption requests. The interest rate on borrowings is based on the federal funds rate. The facility also requires a fee to be paid by the Fund based on the amount of the commitment that has not been utilized. For the fiscal year ended December 31, 2020, the Fund did not have any borrowings under the facility. Prior to April 28, 2020, the facility was $580,000,000.
F. Other Transactions with Affiliates — The following table provides information about the Fund’s investments in the Goldman Sachs Financial Square Government, Goldman Sachs Financial Square Treasury Instruments, Goldman Sachs Financial Square Treasury Obligations, and Goldman Sachs Financial Square Treasury Solutions Funds as of and for the fiscal year ended December 31, 2020:
| | | | | | | | | | | | | | | | | | | | | | | | |
| Investment Companies | | Beginning
Value as of
December 31, 2019 | | | Purchases
at Cost | | | Proceeds
from Sales | | | Ending
Value as of
December 31, 2020 | | | Shares as of
December 31, 2020 | | | Dividend
Income | |
Goldman Sachs Financial Square Government Fund | | $ | 103,730,960 | | | $ | 38,906,052 | | | $ | (41,721,214 | ) | | $ | 100,915,798 | | | | 100,915,798 | | | $ | 406,387 | |
Goldman Sachs Financial Square Treasury Instruments Fund | | | — | | | | 17,303,021 | | | | (628,913 | ) | | | 16,674,108 | | | | 16,674,108 | | | | 8,554 | |
Goldman Sachs Financial Square Treasury Obligations Fund | | | 42,695,096 | | | | 3,135,230 | | | | (12,482,110 | ) | | | 33,348,216 | | | | 33,348,216 | | | | 147,182 | |
Goldman Sachs Financial Square Treasury Solutions Fund | | | 42,695,096 | | | | 3,135,230 | | | | (12,482,110 | ) | | | 33,348,216 | | | | 33,348,216 | | | | 157,023 | |
| | | | | | |
| Total | | $ | 189,121,152 | | | $ | 62,479,533 | | | $ | (67,314,347 | ) | | $ | 184,286,338 | | | | 184,286,338 | | | $ | 719,146 | |
20
GOLDMAN SACHS VARIABLE INSURANCE TRUST GLOBAL TRENDS ALLOCATION FUND
5. AGREEMENTS AND AFFILIATED TRANSACTIONS (continued)
As of December 31, 2020, The Goldman Sachs Group, Inc. was the beneficial owner of approximately 12% of the Institutional Shares of the Fund.
6. PORTFOLIO SECURITIES TRANSACTIONS
The cost of purchases and proceeds from sales and maturities of long-term securities for the fiscal year ended December 31, 2020, were $141,539,448 and $134,226,697, respectively.
7. SECURITIES LENDING
Pursuant to exemptive relief granted by the Securities and Exchange Commission (“SEC”) and the terms and conditions contained therein, the Fund may lend its securities through a securities lending agent, Goldman Sachs Agency Lending (“GSAL”), a wholly-owned subsidiary of Goldman Sachs, to certain qualified borrowers including Goldman Sachs and affiliates. In accordance with the Fund’s securities lending procedures, the Fund receives cash collateral at least equal to the market value of the securities on loan. The market value of the loaned securities is determined at the close of business of the Fund, at their last sale price or official closing price on the principal exchange or system on which they are traded, and any additional required collateral is delivered to the Fund on the next business day. As with other extensions of credit, the Fund may experience delay in the recovery of its securities or incur a loss should the borrower of the securities breach its agreement with the Fund or become insolvent at a time when the collateral is insufficient to cover the cost of repurchasing securities on loan. Dividend income received from securities on loan may not be subject to withholding taxes and therefore withholding taxes paid may differ from the amounts listed in the Statement of Operations. Loans of securities are terminable at any time and as such 1) the remaining contractual maturities of the outstanding securities lending transactions are considered to be overnight and continuous and 2) the borrower, after notice, is required to return borrowed securities within the standard time period for settlement of securities transactions.
The Fund invests the cash collateral received in connection with securities lending transactions in the Goldman Sachs Financial Square Government Fund (“Government Money Market Fund”), an affiliated series of the Goldman Sachs Trust. The Government Money Market Fund is registered under the Act as an open end investment company, is subject to Rule 2a-7 under the Act, and is managed by GSAM, for which GSAM may receive a management fee of up to 0.16% on an annualized basis of the average daily net assets of the Government Money Market Fund.
In the event of a default by a borrower with respect to any loan, GSAL will exercise any and all remedies provided under the applicable borrower agreement to make the Fund whole. These remedies include purchasing replacement securities by applying the collateral held from the defaulting broker against the purchase cost of the replacement securities. If GSAL is unable to purchase replacement securities, GSAL will indemnify the Fund by paying the Fund an amount equal to the market value of the securities loaned minus the value of cash collateral received from the borrower for the loan, subject to an exclusion for any shortfalls resulting from a loss of value in such cash collateral due to reinvestment risk. The Fund’s master netting agreements with certain borrowers provide the right, in the event of a default (including bankruptcy or insolvency), for the non-defaulting party to liquidate the collateral and calculate net exposure to the defaulting party or request additional collateral. However, in the event of a default by a borrower, a resolution authority could determine that such rights are not enforceable due to the restrictions or prohibitions against the right of set-off that may be imposed in accordance with a particular jurisdiction’s bankruptcy or insolvency laws. The Fund’s loaned securities were all subject to enforceable Securities Lending Agreements and the value of the collateral was at least equal to the value of the cash received. The amounts of the Fund’s overnight and continuous agreements, which represent the gross amounts of recognized liabilities for securities lending transactions outstanding as of December 31, 2020, are disclosed as “Payable upon return of securities loaned” on the Statement of Assets and Liabilities, where applicable. The Fund did not have securities on loan as of December 31, 2020.
Both the Fund and GSAL received compensation relating to the lending of the Fund’s securities. The amounts earned, if any, by the Fund for the fiscal year ended December 31, 2020, are reported under Investment Income on the Statement of Operations.
21
GOLDMAN SACHS VARIABLE INSURANCE TRUST GLOBAL TRENDS ALLOCATION FUND
Notes to Financial Statements (continued)
December 31, 2020
7. SECURITIES LENDING (continued)
The table below details securities lending activity with affiliates of Goldman Sachs:
| | | | | | | | | | |
| For the fiscal year ended December 31, 2020 | | | | |
Earnings of GSAL
Relating to
Securities
Loaned | | | Amount Received
by the Fund
from Lending to
Goldman Sachs | | | Amount Payable to
Goldman Sachs
Upon Return of
Securities Loaned as of
December 31, 2020 | |
| | |
| $ | 24 | | | $ | — | | | $ | — | |
The following table provides information about the Fund’s investment in the Government Money Market Fund for the fiscal year ended December 31, 2020:
| | | | | | | | | | | | | | |
Beginning Value
as of
December 31, 2019 | | | Purchases
at Cost | | | Proceeds
from Sales | | | Ending Value as of
December 31, 2020 | |
| | | |
| $ | — | | | $ | 27,475,550 | | | $ | (27,475,550 | ) | | $ | — | |
8. TAX INFORMATION
The tax character of distributions paid during the fiscal years ended December 31, 2019 and December 31, 2020 was as follows:
| | | | | | | | |
| | | 2019 | | | 2020 | |
| Distributions paid from: | | | | | | | | |
Ordinary income | | $ | 8,181,193 | | | $ | 4,050,503 | |
Net long-term capital gains | | | 11,125,795 | | | | 1,602,995 | |
| Total taxable distributions | | $ | 19,306,988 | | | $ | 5,653,498 | |
As of December 31, 2020, the components of accumulated earnings (losses) on a tax-basis were as follows:
| | | | |
| Undistributed ordinary income — net | | $ | 9,705,075 | |
| Undistributed long-term capital gains | | | 860,636 | |
| Total undistributed earnings | | $ | 10,565,711 | |
| Timing differences (Straddle loss deferral) | | | (7,053,130 | ) |
| Unrealized gains — net | | | 30,582,773 | |
| Total accumulated earnings — net | | $ | 34,095,354 | |
As of December 31, 2020, the Fund’s aggregate security unrealized gains and losses based on cost for U.S. federal income tax purposes were as follows:
| | | | | | | | |
| Tax cost | | | | | | $ | 275,089,168 | |
| Gross unrealized gain | | | | | | | 30,582,773 | |
| Gross unrealized loss | | | | | | | — | |
| Net unrealized gain | | | | | | $ | 30,582,773 | |
22
GOLDMAN SACHS VARIABLE INSURANCE TRUST GLOBAL TRENDS ALLOCATION FUND
8. TAX INFORMATION (continued)
The difference between GAAP-basis and tax-basis unrealized gains (losses) is attributable primarily to wash sales and net mark to market gains (losses) on regulated futures contracts.
GSAM has reviewed the Fund’s tax positions for all open tax years (the current and prior three years, as applicable) and has concluded that no provision for income tax is required in the Fund’s financial statements. Such open tax years remain subject to examination and adjustment by tax authorities.
9. OTHER RISKS
The Fund’s risks include, but are not limited to, the following:
Derivatives Risk — The Fund’s use of derivatives may result in loss. Derivative instruments, which may pose risks in addition to and greater than those associated with investing directly in securities, currencies or other instruments, may be illiquid or less liquid, volatile, difficult to price and leveraged so that small changes in the value of the underlying instruments may produce disproportionate losses to the Fund. Derivatives are also subject to counterparty risk, which is the risk that the other party in the transaction will not fulfill its contractual obligation. The use of derivatives is a highly specialized activity that involves investment techniques and risks different from those associated with investments in more traditional securities and instruments. Losses from derivatives can also result from a lack of correlation between changes in the value of derivative instruments and the portfolio assets (if any) being hedged.
Foreign and Emerging Countries Risk — Investing in foreign markets may involve special risks and considerations not typically associated with investing in the U.S. Foreign securities may be subject to risk of loss because of more or less foreign government regulation, less public information and less economic, political and social stability in the countries in which the Fund invests. The imposition of exchange controls (including repatriation restrictions), confiscation of assets and property, trade restrictions (including tariffs) and other government restrictions by the U.S. or other governments, or from problems in share registration, settlement or custody, may also result in losses. Foreign risk also involves the risk of negative foreign currency rate fluctuations, which may cause the value of securities denominated in such foreign currency (or other instruments through which the Fund has exposure to foreign currencies) to decline in value. Currency exchange rates may fluctuate significantly over short periods of time. To the extent that the Fund also invests in securities of issuers located in emerging markets, these risks may be more pronounced.
Interest Rate Risk — When interest rates increase, fixed income securities or instruments held by the Fund will generally decline in value. Long-term fixed income securities or instruments will normally have more price volatility because of this risk than short-term fixed income securities or instruments. The risks associated with changing interest rates may have unpredictable effects on the markets and the Fund’s investments. Fluctuations in interest rates may also affect the liquidity of fixed income securities and instruments held by the Fund.
Investments in Other Investment Companies Risk — As a shareholder of another investment company, including an ETF, the Fund will indirectly bear its proportionate share of any net management fees and other expenses paid by such other investment companies, in addition to the fees and expenses regularly borne by the Fund. ETFs are subject to risks that do not apply to conventional mutual funds, including but not limited to the following: (i) the market price of the ETF’s shares may trade at a premium or a discount to their NAV; and (ii) an active trading market for an ETF’s shares may not develop or be maintained.
Large Shareholder Transactions Risk — The Fund may experience adverse effects when certain large shareholders, such as other funds, participating insurance companies, accounts and Goldman Sachs affiliates, purchase or redeem large amounts of shares of the Fund. Such large shareholder redemptions, which may occur rapidly or unexpectedly, may cause the Fund to sell portfolio securities at times when it would not otherwise do so, which may negatively impact the Fund’s NAV and liquidity. These transactions may also accelerate the realization of taxable income to shareholders if such sales of investments resulted in gains, and may also increase transaction costs. In addition, a large redemption could result in the Fund’s current expenses being allocated over
23
GOLDMAN SACHS VARIABLE INSURANCE TRUST GLOBAL TRENDS ALLOCATION FUND
Notes to Financial Statements (continued)
December 31, 2020
9. OTHER RISKS (continued)
a smaller asset base, leading to an increase in the Fund’s expense ratio. Similarly, large Fund share purchases may adversely affect the Fund’s performance to the extent that the Fund is delayed in investing new cash or otherwise maintains a larger cash position than it ordinarily would.
Liquidity Risk — The Fund may make investments that are illiquid or that may become less liquid in response to market developments or adverse investor perceptions. Illiquid investments may be more difficult to value. Liquidity risk may also refer to the risk that the Fund will not be able to pay redemption proceeds within the allowable time period or without significant dilution to remaining investors’ interests because of unusual market conditions, an unusually high volume of redemption requests, or other reasons. To meet redemption requests, the Fund may be forced to sell investments at an unfavorable time and/or under unfavorable conditions. If the Fund is forced to sell securities at an unfavorable time and/or under unfavorable conditions, such sales may adversely affect the Fund’s NAV and dilute remaining investors’ interests. Liquidity risk may be the result of, among other things, the reduced number and capacity of traditional market participants to make a market in fixed income securities or the lack of an active market. The potential for liquidity risk may be magnified by a rising interest rate environment or other circumstances where investor redemptions from fixed income mutual funds may be higher than normal, potentially causing increased supply in the market due to selling activity. These risks may be more pronounced in connection with the Fund’s investments in securities of issuers located in emerging market countries. Redemptions by large shareholders may have a negative impact on the Fund’s liquidity.
Market and Credit Risks — In the normal course of business, the Fund trades financial instruments and enters into financial transactions where risk of potential loss exists due to changes in the market (market risk). The value of the securities in which the Fund invests may go up or down in response to the prospects of individual companies, particular sectors or governments and/or general economic conditions throughout the world due to increasingly interconnected global economies and financial markets. Events such as war, acts of terrorism, social unrest, natural disasters, the spread of infectious illness or other public health threats could also significantly impact the Fund and its investments. Additionally, the Fund may also be exposed to credit risk in the event that an issuer or guarantor fails to perform or that an institution or entity with which the Fund has unsettled or open transactions defaults.
10. INDEMNIFICATIONS
Under the Trust’s organizational documents, its Trustees, officers, employees and agents are indemnified, to the extent permitted by the Act and state law, against certain liabilities that may arise out of performance of their duties to the Fund. Additionally, in the course of business, the Fund enters into contracts that contain a variety of indemnification clauses. The Fund’s maximum exposure under these arrangements is unknown, as this would involve future claims that may be made against the Fund that have not yet occurred. However, GSAM believes the risk of loss under these arrangements to be remote.
11. OTHER MATTERS
On October 22, 2020, Goldman Sachs announced a settlement of matters involving 1Malaysia Development Bhd. (1MDB), a Malaysian sovereign wealth fund, with the United States Department of Justice as well as criminal and civil authorities in the UK, Singapore and Hong Kong. Further information regarding the 1MDB settlement can be found at https://www.goldmansachs.com/media-relations/press-releases/current/goldman-sachs-2020-10-22.html. The 1MDB settlement will not materially adversely affect GSAM’s ability to serve as investment manager.
24
GOLDMAN SACHS VARIABLE INSURANCE TRUST GLOBAL TRENDS ALLOCATION FUND
12. SUBSEQUENT EVENTS
Subsequent events after the Statement of Assets and Liabilities date have been evaluated, and GSAM has concluded that there is no impact requiring adjustment or disclosure in the financial statements.
13. SUMMARY OF SHARE TRANSACTIONS
Share activity is as follows:
| | | | | | | | | | | | | | | | |
| | | For the Fiscal Year Ended
December 31, 2020 | | | For the Fiscal Year Ended
December 31, 2019 | |
| | | Shares | | | Dollars | | | Shares | | | Dollars | |
| Institutional Shares | | | | | | | | | | | | | | | | |
| Reinvestment of distributions | | | 440 | | | | 5,497 | | | | 1,310 | | | | 16,100 | |
| | | | 440 | | | | 5,497 | | | | 1,310 | | | | 16,100 | |
| Service Shares | | | | | | | | | | | | | | | | |
| Shares sold | | | 1,538,326 | | | $ | 18,343,800 | | | | 2,045,866 | | | $ | 25,165,924 | |
| Reinvestment of distributions | | | 453,290 | | | | 5,648,001 | | | | 1,572,199 | | | | 19,290,888 | |
| Shares redeemed | | | (3,383,659 | ) | | | (40,330,893 | ) | | | (9,571,002 | ) | | | (116,140,276 | ) |
| | | | (1,392,043 | ) | | | (16,339,092 | ) | | | (5,952,937 | ) | | | (71,683,464 | ) |
| | | | |
| NET DECREASE | | | (1,391,603 | ) | | $ | (16,333,595 | ) | | | (5,951,627 | ) | | $ | (71,667,364 | ) |
25
Report of Independent Registered Public Accounting Firm
To the Board of Trustees of Goldman Sachs Variable Insurance Trust and Shareholders of Goldman Sachs Global Trends Allocation Fund
Opinion on the Financial Statements
We have audited the accompanying statement of assets and liabilities, including the schedule of investments, of Goldman Sachs Global Trends Allocation Fund (one of the funds constituting Goldman Sachs Variable Insurance Trust, referred to hereafter as the “Fund”) as of December 31, 2020, the related statement of operations for the year ended December 31, 2020, the statements of changes in net assets for each of the two years in the period ended December 31, 2020, including the related notes, and the financial highlights for each of the five years in the period ended December 31, 2020 (collectively referred to as the “financial statements”). In our opinion, the financial statements present fairly, in all material respects, the financial position of the Fund as of December 31, 2020, the results of its operations for the year then ended, the changes in its net assets for each of the two years in the period ended December 31, 2020 and the financial highlights for each of the five years in the period ended December 31, 2020 in conformity with accounting principles generally accepted in the United States of America.
Basis for Opinion
These financial statements are the responsibility of the Fund’s management. Our responsibility is to express an opinion on the Fund’s financial statements based on our audits. We are a public accounting firm registered with the Public Company Accounting Oversight Board (United States) (PCAOB) and are required to be independent with respect to the Fund in accordance with the U.S. federal securities laws and the applicable rules and regulations of the Securities and Exchange Commission and the PCAOB.
We conducted our audits of these financial statements in accordance with the standards of the PCAOB. Those standards require that we plan and perform the audit to obtain reasonable assurance about whether the financial statements are free of material misstatement, whether due to error or fraud.
Our audits included performing procedures to assess the risks of material misstatement of the financial statements, whether due to error or fraud, and performing procedures that respond to those risks. Such procedures included examining, on a test basis, evidence regarding the amounts and disclosures in the financial statements. Our audits also included evaluating the accounting principles used and significant estimates made by management, as well as evaluating the overall presentation of the financial statements. Our procedures included confirmation of securities owned as of December 31, 2020 by correspondence with the custodian, transfer agent and brokers. We believe that our audits provide a reasonable basis for our opinion.
/s/PricewaterhouseCoopers LLP
Boston, Massachusetts
February 17, 2021
We have served as the auditor of one or more investment companies in the Goldman Sachs fund complex since 2000.
26
GOLDMAN SACHS VARIABLE INSURANCE TRUST GLOBAL TRENDS ALLOCATION FUND
Voting Results of Special Meeting of Shareholders (Unaudited)
A Special Meeting (the “Meeting”) of the Goldman Sachs Variable Insurance Trust (“VIT”) was held on January 23, 2020 to consider and act upon the proposal below. The Fund has amortized its respective share of the proxy, shareholder meeting and other related costs and GSAM has agreed to reimburse the Fund to the extent such expenses exceed a specified percentage of the Fund’s net assets.
At the Meeting, Dwight L. Bush, Kathryn A. Cassidy, Joaquin Delgado and Gregory G. Weaver were elected to the Trust’s Board of Trustees. In electing trustees, the Trust’s shareholders voted as follows:
| | | | | | | | | | | | | | | | |
| | | | | |
Proposal 1. Election of Trustees | | For | | | Against | | | Withheld | | | Broker Non-Votes | |
| | | | | |
Dwight L. Bush | | | 745,493,677.130 | | | | 0 | | | | 17,848,840.639 | | | | 0 | |
| | | | | |
Kathryn A. Cassidy | | | 746,559,784.810 | | | | 0 | | | | 16,782,732.959 | | | | 0 | |
| | | | | |
Joaquin Delgado | | | 744,593,456.532 | | | | 0 | | | | 18,749,061.237 | | | | 0 | |
| | | | | |
Gregory G. Weaver | | | 746,707,039.321 | | | | 0 | | | | 16,635,478.448 | | | | 0 | |
27
GOLDMAN SACHS VARIABLE INSURANCE TRUST GLOBAL TRENDS ALLOCATION FUND
|
| Fund Expenses — Six Month Period Ended December 31, 2020 (Unaudited) |
As a shareholder of Institutional or Service Shares of the Fund, you incur ongoing costs, including management fees, distribution and/or service (12b-1) fees (with respect to Service Shares) and other Fund expenses. This example is intended to help you understand your ongoing costs (in dollars) of investing in Institutional Shares and Service Shares of the Fund and to compare these costs with the ongoing costs of investing in other mutual funds.
The example is based on an investment of $1,000 invested at the beginning of the period and held for the entire period from July 1, 2020 through December 31, 2020, which represents a period of 184 days of a 366 day year.
Actual Expenses — The first line under each share class in the table below provides information about actual account values and actual expenses. You may use the information in this line, together with the amount you invested, to estimate the expenses that you paid over the period. Simply divide your account value by $1,000 (for example, an $8,600 account value divided by $1,000=8.6), then multiply the result by the number in the first line under the heading entitled “Expenses Paid” to estimate the expenses you paid on your account during this period.
Hypothetical Example for Comparison Purposes — The second line under each share class in the table below provides information about hypothetical account values and hypothetical expenses based on the Fund’s actual net expense ratio and an assumed rate of return of 5% per year before expenses, which is not the Fund’s actual return. The hypothetical account values and expenses may not be used to estimate the actual ending account balance or expenses you paid for the period. You may use this information to compare the ongoing costs of investing in the Fund and other funds. To do so, compare this 5% hypothetical example with the 5% hypothetical examples that appear in the shareholder reports of the other funds.
Please note that the expenses shown in the table are meant to highlight your ongoing costs only. As a shareholder of the Fund, you do not incur any transaction costs, such as sales charges, redemption fees, or exchange fees, but shareholders of other funds may incur such costs. The second line of the table is useful in comparing ongoing costs only and will not help you determine the relative total costs of owning different funds whose shareholders may incur transaction costs.
| | | | | | | | | | | | |
| Share Class | | Beginning
Account Value
07/01/20 | | | Ending
Account Value
12/31/20 | | | Expenses Paid
for the
6 Months
Ended
12/31/20* | |
| Institutional | | | | | | | | | | | | |
| | | | |
| Actual | | $ | 1,000 | | | $ | 1,100.80 | | | $ | 3.22 | |
| Hypothetical 5% return | | | 1,000 | | | | 1,022.07 | + | | | 3.10 | |
| Service | | | | | | | | | | | | |
| | | | |
| Actual | | | 1,000 | | | | 1,099.20 | | | | 4.54 | |
| Hypothetical 5% return | | | 1,000 | | | | 1,020.81 | + | | | 4.37 | |
| | + | Hypothetical expenses are based on the Fund’s actual annualized net expense ratios and an assumed rate of return of 5% per year before expenses. | |
| | * | Expenses are calculated using the Fund’s annualized net expense ratio for each class, which represents the ongoing expenses as a percentage of net assets for the six months ended December 31, 2020. Expenses are calculated by multiplying the annualized net expense ratio by the average account value for the period; then multiplying the result by the number of days in the most recent fiscal half year; and then dividing that result by the number of days in the fiscal year. The annualized net expense ratios for the period were 0.61% and 0.86% for Institutional and Service Shares, respectively. | |
28
GOLDMAN SACHS VARIABLE INSURANCE TRUST GLOBAL TRENDS ALLOCATION FUND
Trustees and Officers (Unaudited)
Independent Trustees
| | | | | | | | | | |
| | | | | |
Name,
Address and Age1 | | Position(s) Held
with the Trust | | Term of Office and
Length of
Time Served2 | | Principal Occupation(s) During Past 5 Years | | Number of
Portfolios in
Fund Complex
Overseen by
Trustee3 | | Other Directorships Held by Trustee4 |
| | | | | |
Jessica Palmer Age: 71 | | Chair of the Board of Trustees | | Since 2018 (Trustee since 2007) | | Ms. Palmer is retired. She was formerly Consultant, Citigroup Human Resources Department (2007-2008); Managing Director, Citigroup Corporate and Investment Banking (previously, Salomon Smith Barney/Salomon Brothers) (1984-2006). Ms. Palmer was a Member of the Board of Trustees of Indian Mountain School (private elementary and secondary school) (2004-2009). Chair of the Board of Trustees — Goldman Sachs Variable Insurance Trust and Goldman Sachs Trust. | | 105 | | None |
| | | | | |
Dwight L. Bush Age: 63 | | Trustee | | Since 2020 | | Ambassador Bush is President and CEO of D.L. Bush & Associates (a financial advisory and private investment firm) (2002-2014 and 2017-present); and was formerly U.S. Ambassador to the Kingdom of Morocco (2014-2017) and a Member of the Board of Directors of Santander Bank, N.A. (2018-2019). Previously, Ambassador Bush served as an Advisory Board Member of Goldman Sachs Trust and Goldman Sachs Variable Insurance Trust (October 2019-January 2020). Trustee — Goldman Sachs Variable Insurance Trust and Goldman Sachs Trust. | | 105 | | None |
| | | | | |
Kathryn A. Cassidy Age: 66 | | Trustee | | Since 2015 | | Ms. Cassidy is retired. Formerly, she was Advisor to the Chairman (May 2014-December 2014); and Senior Vice President and Treasurer (2008-2014), General Electric Company & General Electric Capital Corporation (technology and financial services companies). Trustee — Goldman Sachs Variable Insurance Trust and Goldman Sachs Trust. | | 105 | | None |
| | | | | |
Diana M. Daniels Age: 71 | | Trustee | | Since 2007 | | Ms. Daniels is retired. Formerly, she was Vice President, General Counsel and Secretary, The Washington Post Company (1991-2006). Ms. Daniels is a Trustee Emeritus and serves as a Presidential Councillor of Cornell University (2013-Present); former Member of the Legal Advisory Board, New York Stock Exchange (2003-2006) and of the Corporate Advisory Board, Standish Mellon Management Advisors (2006-2007). Trustee — Goldman Sachs Variable Insurance Trust and Goldman Sachs Trust. | | 105 | | None |
| | | | | |
Joaquin Delgado Age: 60 | | Trustee | | Since 2020 | | Dr. Delgado is retired. He is Director, Hexion Inc. (a specialty chemical manufacturer) (2019-present); and Director, Stepan Company (a specialty chemical manufacturer) (2011-present); and was formerly Executive Vice President, Consumer Business Group of 3M Company (July 2016-July 2019); and Executive Vice President, Health Care Business Group of 3M Company (October 2012-July 2016). Previously, Dr. Delgado served as an Advisory Board Member of Goldman Sachs Trust and Goldman Sachs Variable Insurance Trust (October 2019-January 2020). Trustee — Goldman Sachs Variable Insurance Trust and Goldman Sachs Trust. | | 105 | | Stepan Company (a specialty chemical manufacturer) |
| | | | | | | | | | |
29
GOLDMAN SACHS VARIABLE INSURANCE TRUST GLOBAL TRENDS ALLOCATION FUND
Trustees and Officers (Unaudited) (continued)
Independent Trustees
| | | | | | | | | | |
Name,
Address and Age1 | | Position(s) Held
with the Trust | | Term of Office and
Length of
Time Served2 | | Principal Occupation(s) During Past 5 Years | | Number of
Portfolios in
Fund Complex
Overseen by
Trustee3 | | Other Directorships Held by Trustee4 |
| | | | | |
Roy W. Templin Age: 60 | | Trustee | | Since 2013 | | Mr. Templin is retired. He is Director, Armstrong World Industries, Inc. (a designer and manufacturer of ceiling, wall and suspension system solutions) (2016-Present); and was formerly Chairman of the Board of Directors, Con-Way Incorporated (a transportation, logistics and supply chain management service company) (2014-2015); Executive Vice President and Chief Financial Officer, Whirlpool Corporation (an appliance manufacturer and marketer) (2004-2012). Trustee — Goldman Sachs Variable Insurance Trust and Goldman Sachs Trust. | | 105 | | Armstrong World Industries, Inc. (a ceiling, wall and suspension systems solutions manufacturer) |
| | | | | |
Gregory G. Weaver Age: 69 | | Trustee | | Since 2015 | | Mr. Weaver is retired. He is Director, Verizon Communications Inc. (2015-Present); and was formerly Chairman and Chief Executive Officer, Deloitte & Touche LLP (a professional services firm) (2001-2005 and 2012-2014); and Member of the Board of Directors, Deloitte & Touche LLP (2006-2012). Trustee — Goldman Sachs Variable Insurance Trust and Goldman Sachs Trust. | | 105 | | Verizon Communications Inc. |
30
GOLDMAN SACHS VARIABLE INSURANCE TRUST GLOBAL TRENDS ALLOCATION FUND
Trustees and Officers (Unaudited) (continued)
Interested Trustee*
| | | | | | | | | | |
Name,
Address and Age1 | | Position(s) Held
with the Trust | | Term of Office and
Length of
Time Served2 | | Principal Occupation(s) During Past 5 Years | | Number of
Portfolios in
Fund Complex
Overseen by
Trustee3 | | Other Directorships Held by Trustee4 |
| | | | | |
James A. McNamara Age: 58 | | Trustee and President | | Since 2007 | | Advisory Director, Goldman Sachs (January 2018-Present); Managing Director, Goldman Sachs (January 2000-December 2017); Director of Institutional Fund Sales, GSAM (April 1998-December 2000); and Senior Vice President and Manager, Dreyfus Institutional Service Corporation (January 1993-April 1998). President and Trustee — Goldman Sachs Variable Insurance Trust; Goldman Sachs Trust; Goldman Sachs Trust II; Goldman Sachs MLP and Energy Renaissance Fund; Goldman Sachs ETF Trust; Goldman Sachs Credit Income Fund; and Goldman Sachs Real Estate Diversified Income Fund. | | 158 | | None |
| | | | | | | | | | |
| * | Mr. McNamara is considered to be an “Interested Trustee” because he holds positions with Goldman Sachs and owns securities issued by The Goldman Sachs Group, Inc. Mr. McNamara holds comparable positions with certain other companies of which Goldman Sachs, GSAM or an affiliate thereof is the investment adviser, administrator and/or distributor. |
| 1 | Each Trustee may be contacted by writing to the Trustee, c/o Goldman Sachs, 200 West Street, New York, New York, 10282, Attn: Caroline Kraus. Information is provided as of December 31, 2020. |
| 2 | Subject to such policies as may be adopted by the Board from time-to-time, each Trustee holds office for an indefinite term, until the earliest of: (a) the election of his or her successor; (b) the date the Trustee resigns or is removed by the Board or shareholders, in accordance with the Trust’s Declaration of Trust; or (c) the termination of the Trust. The Board has adopted policies which provide that each Independent Trustee shall retire as of December 31st of the calendar year in which he or she reaches (a) his or her 75th birthday or (b) the 15th anniversary of the date he or she became a Trustee, whichever is earlier, unless a waiver of such requirements shall have been adopted by a majority of the other Trustees. These policies may be changed by the Trustees without shareholder vote. |
| 3 | The Goldman Sachs Fund Complex includes certain other companies listed above for each respective Trustee. As of December 31, 2020, Goldman Sachs Variable Insurance Trust consisted of 13 portfolios; Goldman Sachs Trust consisted of 92 portfolios (90 of which offered shares to the public); Goldman Sachs Trust II consisted of 19 portfolios (17 of which offered shares to the public); Goldman Sachs ETF Trust consisted of 31 portfolios (20 of which offered shares to the public); and Goldman Sachs MLP and Energy Renaissance Fund, Goldman Sachs Credit Income Fund and Goldman Sachs Real Estate Diversified Income Fund each consisted of one portfolio. Goldman Sachs Credit Income Fund did not offer shares to the public. |
| 4 | This column includes only directorships of companies required to report to the Securities and Exchange Commission under the Securities Exchange Act of 1934 (i.e., “public companies”) or other investment companies registered under the Act. |
Additional information about the Trustees is available in the Fund’s Statement of Additional Information, which can be obtained from Goldman Sachs free of charge by calling this toll-free number (in the United States of America): 1-800-526-7384.
31
GOLDMAN SACHS VARIABLE INSURANCE TRUST GLOBAL TRENDS ALLOCATION FUND
Trustees and Officers (Unaudited) (continued)
Officers of the Trust*
| | | | | | |
| | | |
| Name, Address and Age1 | | Position(s) Held with the Trust | | Term of
Office and
Length of
Time Served2 | | Principal Occupation(s) During Past 5 Years |
| | | |
James A. McNamara 200 West Street New York, NY 10282 Age: 58 | | Trustee and President | | Since 2007 | | Advisory Director, Goldman Sachs (January 2018-Present); Managing Director, Goldman Sachs (January 2000-December 2017); Director of Institutional Fund Sales, GSAM (April 1998-December 2000); and Senior Vice President and Manager, Dreyfus Institutional Service Corporation (January 1993-April 1998). President and Trustee — Goldman Sachs Variable Insurance Trust; Goldman Sachs Trust; Goldman Sachs Trust II; Goldman Sachs MLP and Energy Renaissance Fund; Goldman Sachs ETF Trust; Goldman Sachs Credit Income Fund; and Goldman Sachs Real Estate Diversified Income Fund. |
| | | |
Caroline L. Kraus 200 West Street New York, NY 10282 Age: 43 | | Secretary | | Since 2012 | | Managing Director, Goldman Sachs (January 2016-Present); Vice President, Goldman Sachs (August 2006-December 2015); Senior Counsel, Goldman Sachs (January 2020-Present); Associate General Counsel, Goldman Sachs (2012-December 2019); Assistant General Counsel, Goldman Sachs (August 2006-December 2011); and Associate, Weil, Gotshal & Manges, LLP (2002-2006). Secretary — Goldman Sachs Variable Insurance Trust (previously Assistant Secretary (2012)); Goldman Sachs Trust (previously Assistant Secretary (2012)); Goldman Sachs Trust II; Goldman Sachs BDC, Inc.; Goldman Sachs Private Middle Market Credit LLC; Goldman Sachs Private Middle Market Credit II LLC; Goldman Sachs Middle Market Lending Corp.; Goldman Sachs MLP and Energy Renaissance Fund; Goldman Sachs ETF Trust; Goldman Sachs Credit Income Fund; and Goldman Sachs Real Estate Diversified Income Fund. |
| | | |
Joseph F. DiMaria 30 Hudson Street Jersey City, NJ 07302 Age: 52 | | Treasurer, Principal Financial Officer and Principal Accounting Officer | | Since 2017 (Treasurer and Principal Financial Officer since 2019) | | Managing Director, Goldman Sachs (November 2015-Present) and Vice President — Mutual Fund Administration, Columbia Management Investment Advisers, LLC (May 2010-October 2015). Treasurer, Principal Financial Officer and Principal Accounting Officer — Goldman Sachs Variable Insurance Trust (previously Assistant Treasurer (2016)); Goldman Sachs Trust (previously Assistant Treasurer (2016)); Goldman Sachs Trust II (previously Assistant Treasurer (2017)); Goldman Sachs MLP and Energy Renaissance Fund (previously Assistant Treasurer (2017)); Goldman Sachs ETF Trust (previously Assistant Treasurer (2017)); Goldman Sachs Credit Income Fund; and Goldman Sachs Real Estate Diversified Income Fund. |
| * | Represents a partial list of officers of the Trust. Additional information about all the officers is available in the Fund’s Statement of Additional Information, which can be obtained from Goldman Sachs free of charge by calling this toll-free number (in the United States): 1-800-526-7384. |
| 1 | Information is provided as of December 31, 2020. |
| 2 | Officers hold office at the pleasure of the Board of Trustees or until their successors are duly elected and qualified. Each officer holds comparable positions with certain other companies of which Goldman Sachs, GSAM or an affiliate thereof is the investment adviser, administrator and/or distributor. |
Goldman Sachs Variable Insurance Trust — Tax Information (Unaudited)
For the year ended December 31, 2020, 7.98% of the dividends paid from net investment company taxable income by the Global Trends Allocation Fund qualify for the dividends received deduction available to corporations.
Pursuant to Section 852 of the Internal Revenue Code, the Global Trends Allocation Fund designates $1,602,995 or, if different, the maximum amount allowable, as capital gain dividends paid during the fiscal year ended December 31, 2020.
32
| | |
| TRUSTEES | | OFFICERS |
| Jessica Palmer, Chair | | James A. McNamara, President |
| Dwight L. Bush | | Joseph F. DiMaria, Principal Financial Officer, |
| Kathryn A. Cassidy | | Principal Accounting Officer and Treasurer |
| Diana M. Daniels | | Caroline L. Kraus, Secretary |
| Joaquin Delgado | | |
| James A. McNamara | | |
| Roy W. Templin | | |
| Gregory G. Weaver | | |
GOLDMAN SACHS & CO. LLC
Distributor and Transfer Agent
GOLDMAN SACHS ASSET MANAGEMENT, L.P.
Investment Adviser
200 West Street, New York
New York 10282
Visit our web site at www.GSAMFUNDS.com to obtain the most recent month-end returns.
The reports concerning the Fund included in this shareholder report may contain certain forward-looking statements about the factors that may affect the performance of the Fund in the future. These statements are based on Fund management’s predictions and expectations concerning certain future events and their expected impact on the Fund, such as performance of the economy as a whole and of specific industry sectors, changes in the levels of interest rates, the impact of developing world events, and other factors that may influence the future performance of the Fund. Management believes these forward-looking statements to be reasonable, although they are inherently uncertain and difficult to predict. Actual events may cause adjustments in portfolio management strategies from those currently expected to be employed.
A description of the policies and procedures that the Fund uses to determine how to vote proxies relating to portfolio securities and information regarding how the Fund voted proxies relating to portfolio securities for the 12-month period ended December 31, 2019 is available (i) without charge, upon request by calling 1-800-621-2550; and (ii) on the Securities and Exchange Commission (“SEC”) web site at http://www.sec.gov.
The Fund will file its portfolio holdings information for each month in a fiscal quarter within 60 days after the end of the relevant fiscal quarter on Form N-PORT. Portfolio holdings information for the third month of each fiscal quarter will be made available on the SEC’s web site at http://www.sec.gov. Portfolio holdings information may be obtained upon request and without charge by calling 1-800-526-7384 (for Retail Shareholders) or 1-800-621-2550 (for Institutional Shareholders).
Views and opinions expressed are for informational purposes only and do not constitute a recommendation by GSAM to buy, sell, or hold any security. Views and opinions are current as of the date of this presentation and may be subject to change, they should not be construed as investment advice.
Goldman Sachs & Co. LLC (“Goldman Sachs”) does not provide legal, tax or accounting advice. Any statement contained in this communication (including any attachments) concerning U.S. tax matters was not intended or written to be used, and cannot be used, for the purpose of avoiding penalties under the Internal Revenue Code, and was written to support the promotion or marketing of transaction or matter addressed. Clients of Goldman Sachs should obtain their own independent tax advice based on their particular circumstances.
The website links provided are for your convenience only and are not an endorsement or recommendation by GSAM of any of these websites or the products or services offered. GSAM is not responsible for the accuracy and validity of the content of these websites.
Fund holdings and allocations shown are as of December 31, 2020 and may not be representative of future investments. Fund holdings should not be relied on in making investment decisions and should not be construed as research or investment advice regarding particular securities. Current and future holdings are subject to risk.
References to indices, benchmarks or other measures of relative market performance over a specified period of time are provided for your information only and do not imply that the portfolio will achieve similar results. The index composition may not reflect the manner in which a portfolio is constructed. While an adviser seeks to design a portfolio which reflects appropriate risk and return features, portfolio characteristics may deviate from those of the benchmark.
The portfolio risk management process includes an effort to monitor and manage risk, but does not imply low risk.
Shares of the Goldman Sachs VIT Funds are offered to separate accounts of participating life insurance companies for the purpose of funding variable annuity contracts and variable life insurance policies. Shares of the Fund are not offered directly to the general public. The variable annuity contracts and variable life insurance policies are described in the separate prospectuses issued by participating insurance companies. You should refer to those prospectuses for information about surrender charges, mortality and expense risk fees and other charges that may be assessed by participating insurance companies under the variable annuity contracts or variable life insurance policies. Such fees or charges, if any, may affect the return you may realize with respect to your investments. Ask your representative for more complete information. Please consider a fund’s objectives, risks and charges and expenses, and read the prospectus carefully before investing. The prospectus contains this and other information about the Fund.
This material is not authorized for distribution to prospective investors unless preceded or accompanied by a current prospectus or summary prospectus, if applicable. Investors should consider the Fund’s objective, risks, and charges and expenses, and read the summary prospectus, if available, and/or the prospectus carefully before investing or sending money. The summary prospectus, if available, and the prospectus contain this and other information about the Fund and may be obtained from your authorized dealer or from Goldman Sachs & Co. LLC by calling 1-800-621-2550.
This report is prepared for the general information of contract owners and is not an offer of shares of the Goldman Sachs Variable Insurance Trust — Goldman Sachs Global Trends Allocation Fund.
© 2021 Goldman Sachs. All rights reserved.
VITNAVAR-21/229738-OTU-02/2021
Goldman
Sachs Variable Insurance Trust
Goldman Sachs
Large Cap Value Fund
Beginning on or after January 1, 2021, you may not receive paper copies of the Fund’s annual and semi-annual shareholder reports from the insurance company that offers your variable insurance contract or your financial intermediary, unless you specifically request paper copies of the reports from the insurance company or from your financial intermediary. Instead, the reports will be made available on a website, and you will be notified by mail each time a report is posted and provided with a website link to access the report.
If you already elected to receive shareholder reports electronically, you will not be affected by this change and you need not take any action. At any time, you may elect to receive reports and certain communications from the insurance company electronically by contacting your insurance company or your financial intermediary.
You may elect to receive all future shareholder reports in paper free of charge. You can inform the insurance company or your financial intermediary that you wish to receive paper copies of reports. Your election to receive reports in paper will apply to all Goldman Sachs Funds available under your contract and may apply to all funds held with your financial intermediary.
Annual Report
December 31, 2020

GOLDMAN SACHS VARIABLE INSURANCE TRUST LARGE CAP VALUE FUND
INVESTMENT OBJECTIVE
The Fund seeks long-term capital appreciation.
Portfolio Management Discussion and Analysis
Below, the Goldman Sachs Value Portfolio Management Team discusses the Goldman Sachs Variable Insurance Trust — Goldman Sachs Large Cap Value Fund’s (the “Fund”) performance and positioning for the 12-month period ended December 31, 2020 (the “Reporting Period”).
How did the Fund perform during the Reporting Period?
During the Reporting Period, the Fund’s Institutional and Service Shares generated average annual total returns of 3.97% and 3.73%, respectively. These returns compare to the 2.79% average annual total return of the Fund’s benchmark, the Russell 1000® Value Index (with dividends reinvested) (the “Russell Index”) during the same time period.
What economic and market factors most influenced the equity markets as a whole during the Reporting Period?
Representing the U.S. equity market, the S&P 500® Index returned 18.34% during the Reporting Period.
The U.S. equity market fell significantly in the first quarter of 2020, selling off as the outbreak and subsequent spread of COVID-19 caused non-essential businesses to close. Jobless claims increased to 6.6 million, and nonfarm payrolls decreased by 701,000 for the month of March, leading the U.S. government to respond with aggressive economic stimulus and the U.S. Federal Reserve (the “Fed”) to respond with unprecedented monetary policy stimulus, including lowering its targeted federal funds rate to zero and re-introducing and expanding its quantitative easing programs. Exacerbating matters was oil prices that fell as supply increased and demand decreased.
After hitting a low on March 23, 2020, the U.S. equity market then rose in the subsequent three quarters of 2020. In the second calendar quarter, the U.S. equity market appreciated despite a surge in COVID-19 cases in regional pockets of the country, causing local governments to pause reopening plans and revisit previous lockdown measures. Positive market sentiment was buoyed by better than consensus expected economic data, such as nonfarm payrolls increasing 7.3 million during May and June 2020, driving the unemployment rate down to 11.1% from 14.7% in April. The U.S. equity markets continued to rally in the third quarter of 2020 despite ongoing pressure from the pandemic. Market strength was supported by a sharp cyclical recovery in economic data, with the Institute for Supply Management’s Manufacturing Purchasing Managers’ Index increasing to 56.0 in August, which is firmly in expansionary territory. Optimism around a potential COVID-19 vaccine also helped support equity markets during the quarter. Still, risks to the market persisted given political uncertainty ahead of the November 2020 U.S. elections, lower levels of Gross Domestic Product, heightened unemployment, questions around how quickly and effectively a vaccine could be distributed, and debates about the extent of a new stimulus package from the federal government. In the fourth quarter of 2020, U.S. stocks extended a broad-based recovery from their steep first quarter declines. Markets rallied on the prospect of an end to the global pandemic and its economic impact with approval and distribution of COVID-19 vaccines. While uncertainty surrounding the then-upcoming U.S. elections and other policy questions created the potential for higher market volatility, the Democratic victory of Joe Biden proved positive for equity markets over the near term. Also, after a historically sharp but short recession during the spring of 2020, many major economies, including that of the U.S., in our view, entered an early-cycle phase of recovery. Employment conditions improved, as temporary job losses were regained in some segments of the economy, and U.S. manufacturing activity recovered. Despite this improvement, reminders of a COVID-19 ceiling for industries hit hardest by the restrictions caused by the pandemic persisted.
For the Reporting Period overall, eight of the 11 sectors in the S&P 500® Index posted positive absolute returns, with seven of those eight generating double-digit gains. Information technology, consumer discretionary and communication services were the best performing sectors in the S&P 500® Index, as measured by total return, while the weakest performing sectors in the S&P 500® Index during the Reporting Period were energy, real estate and financials.
Within the U.S. equity market, all capitalization segments posted double-digit positive returns, led by large-cap stocks, as measured by the Russell 1000® Index, followed closely by small-cap stocks, as measured by the Russell 2000® Index, and then by mid-cap stocks, as measured by the Russell Midcap® Index. From a style perspective, growth-oriented stocks significantly outpaced value-oriented stocks across the capitalization spectrum. (All as measured by the FTSE Russell indices.)
1
GOLDMAN SACHS VARIABLE INSURANCE TRUST LARGE CAP VALUE FUND
What key factors were responsible for the Fund’s performance during the Reporting Period?
The Fund posted solid absolute gains that outperformed the Russell Index during the Reporting Period. Stock selection overall contributed positively, while sector allocation as a whole detracted, albeit modestly, from the Fund’s performance relative to the Russell Index during the Reporting Period.
Which equity market sectors most significantly affected Fund performance?
Stock selection in the information technology, communication services and energy sectors contributed most positively to the Fund’s relative results during the Reporting Period. Having an underweight to energy, the weakest performing sector in the Russell Index during the Reporting Period, also helped. Only partially offsetting these positive contributors was stock selection in the health care, financials and materials sectors, which detracted. Allocation positioning in each of these three sectors further dampened relative results. Having a position in cash, albeit a modest one, during a Reporting Period when the Russell Index rallied, hurt as well.
What were some of the Fund’s best-performing individual stocks?
Relative to the Russell Index, the Fund benefited most from positions in Deere & Co., Citrix Systems and Aptiv.
Agricultural equipment manufacturer Deere & Co. began to see a share price increase on largely positive earnings reports during the time in which the broad agriculture equipment recovery began. Its management also announced the company would be undergoing a reorganization to better focus on customer solutions across the agricultural cycle, which was well received by investors. At the end of the Reporting Period, we continued to hold conviction in the company moving forward, as we believe it is well positioned to rebound from the inventory shortages and other headwinds caused by the COVID-19-driven shutdown. Also, in our view, demand for the company’s products remains solid from higher than historically normal investments in agricultural equipment.
Shares of software provider Citrix Systems were supported by successive positive earnings surprises early in the Reporting Period. These results were a function, in our view, of Citrix Systems benefiting from the exponential uptick in companies’ remote working contingency plans due to the spread of COVID-19. Given the strong performance in the stock, we elected to exit the Fund’s position in the company and reallocate the capital to what we saw as other compelling risk/reward opportunities.
Technology-based auto parts company Aptiv saw its share price appreciate as a result of recovering global vehicle production in the second half of the Reporting Period. At the end of the Reporting Period, we remained optimistic on Aptiv given what we viewed as its exposure to fast-growing industry themes of electrification, active safety and autonomous mobility.
Which stocks detracted significantly from the Fund’s performance during the Reporting Period?
Among those companies detracting most from the Fund’s results relative to the Russell Index were positions in Wells Fargo & Co., Citigroup and PVH.
Financial services company Wells Fargo & Co.’s stock lagged the Russell Index along with the broader financials sector, as interest rates remained suppressed with no guidance for rate increases. The Fed also announced that bank dividends would be capped in the third quarter of 2020, dampening the outlook in this industry. The stock fell under further pressure as a result of its mandated asset cap, which prevented Wells Fargo & Co. from expanding its balance sheet to counter the lower rate environment. Overall, at the end of the Reporting Period, we remained optimistic on Wells Fargo & Co. given our positive view of its management team, potential for margin expansion and a possible catalyst for the stock if the Fed were to lift its asset cap on the bank.
Similarly, financial services company Citigroup’s shares lagged the Russell Index along with the broader financials sector, as interest rates remained suppressed with no guidance for rate increases and as the Fed announced that bank dividends would be capped in the third quarter of 2020. Citigroup’s stock also came under pressure as a result of regulatory action. Given concerns of headline risk surrounding the regulatory action, we decided to exit the Fund’s position in Citigroup in favor of what we believed to be better risk/reward prospects elsewhere.
Store closures as a result of the COVID-19 pandemic contributed to a decline in the share price of retail apparel company PVH. Given our concerns of a lasting impact from the store closures, coupled with an accelerated shift toward e-commerce, we decided to exit the Fund’s position in PVH in favor of what we viewed as better risk/reward opportunities elsewhere.
How did the Fund use derivatives and similar instruments during the Reporting Period?
During the Reporting Period, we did not use derivatives as part of an active management strategy.
2
GOLDMAN SACHS VARIABLE INSURANCE TRUST LARGE CAP VALUE FUND
Did the Fund make any significant purchases or sales during the Reporting Period?
During the Reporting Period, we initiated a Fund position in medical device company Medtronic. We established the Fund position given our belief that there may be a cyclical recovery in the medical device industry as elective medical procedures, delayed as a result of the COVID-19 pandemic, see pent-up demand as restrictions ease.
We established a Fund position in beverage producer The Coca-Cola Co. during the Reporting Period. We are optimistic on Coca-Cola’s prospects in an economic recovery, as the away-from-home channel sales improve. We also believe the company has long-term durable growth potential resulting from its global duopoly, sole focus on beverages, low private label penetration and strong pricing.
Conversely, in addition to those sales already mentioned, we eliminated the Fund’s position in Bank of America. We exited the position early in 2020 in an effort to trim some of the Fund’s exposure to more interest rate-sensitive companies.
Were there any notable changes in the Fund’s weightings during the Reporting Period?
In constructing the Fund’s portfolio, we focus on picking stocks rather than on making industry or sector bets. We seek to outpace the benchmark index by overweighting stocks that we expect to outperform and underweighting those that we think may lag. Consequently, changes in its sector weights are generally the direct result of individual stock selection or of stock appreciation or depreciation. That said, during the Reporting Period, the Fund’s exposure compared to the Russell Index to information technology, consumer discretionary, utilities and real estate increased. The Fund’s allocations compared to the Russell Index in financials, industrials and health care decreased.
How was the Fund positioned relative to its benchmark index at the end of the Reporting Period?
At the end of December 2020, the Fund had overweighted positions relative to the Russell Index in the information technology, utilities, consumer discretionary and communication services sectors. On the same date, the Fund had underweighted positions compared to the Russell Index in health care, financials and industrials and was rather neutrally weighted to the Russell Index in the consumer staples, materials, real estate and energy sectors.
Were there any changes to the Fund’s portfolio management team during the Reporting Period?
There were no changes to the Fund’s portfolio management team during the Reporting Period.
What is the Fund’s tactical view and strategy for the months ahead?
The U.S. equity markets rebounded from pandemic-induced lows in the first quarter of 2020 to round out the calendar year with multiple tailwinds from pent-up demand to significant cash reserves. As the markets anticipated an economic recovery alongside the rollout of the COVID-19 vaccines, we remained vigilant at the end of the Reporting Period in navigating through optimistic market sentiment given the potential for volatility. While we see a path to an uptick in global economic activity to support further market upside, we simultaneously caution that the economy remains in the infancy of its recovery, and uneven progress suggests that full macroeconomic normalization may well remain dependent on the trajectory of COVID-19 recovery, successful global vaccine distribution and inoculation, and ongoing fiscal and monetary policy. As the economic expansion widens, we expected, at the end of the Reporting Period, the U.S. equity market rally to continue but with broader sector participation. Within this recovery period, we believe it is crucial to stay true to our quality-first investment approach, seeking to invest in businesses with healthy balance sheets, relatively stable free cash flow generation, and differentiated business models aligned to secular advantages.
Indeed, regardless of market direction, we remain committed to our core philosophy and process. We intend to maintain a long-term time horizon, rather than forecast the next quarter. As always, we maintain our focus on undervalued companies that we believe have comparatively greater control of their own destiny, such as innovators with differentiated products, companies with low cost structures or companies that have been investing in their own businesses and may be poised to gain market share.
3
GOLDMAN SACHS VARIABLE INSURANCE TRUST LARGE CAP VALUE FUND
Index Definitions
The Russell 1000® Value Index is an unmanaged market capitalization weighted index of the 1000 largest U.S. companies with lower price-to-book ratios and lower forecasted growth values. The figures for the index do not include any deduction for fees, expenses or taxes.
The Russell 2000® Index is an unmanaged index of common stock prices that measures the performance of the 2000 smallest companies in the Russell 3000® Index. The figures for the index do not include any deduction for fees, expenses or taxes.
The S&P 500® Index is the Standard & Poor’s composite index of 500 stocks, an unmanaged index of common stock prices. The figures for the index do not include any deduction for fees, expenses or taxes.
The Russell Midcap® Index measures the performance of the 800 smallest companies in the Russell 1000® Index, which represent approximately 25% of the total market capitalization of the Russell 1000® Index.
The Russell 1000® Index measures the performance of the 1,000 largest companies in the Russell 3000® Index, which represent approximately 92% of the total market capitalization of the Russell 3000® Index.
It is not possible to invest directly in an index.
4
FUND BASICS
Large Cap Value Fund
as of December 31, 2020
TOP TEN HOLDINGS AS OF 12/31/201
| | | | | | |
| | |
| Holding | | % of Net Assets | | | Line of Business |
Walt Disney Co. (The) | | | 3.7% | | | Media & Entertainment |
JPMorgan Chase & Co. | | | 3.4 | | | Banks |
Verizon Communications, Inc. | | | 2.5 | | | Telecommunication Services |
NextEra Energy, Inc. | | | 2.3 | | | Utilities |
Wells Fargo & Co. | | | 2.1 | | | Banks |
Comcast Corp. Class A | | | 2.1 | | | Media & Entertainment |
General Electric Co. | | | 2.0 | | | Capital Goods |
Johnson & Johnson | | | 1.9 | | | Pharmaceuticals, Biotechnology & Life Sciences |
Chevron Corp. | | | 1.9 | | | Energy |
Alphabet, Inc. Class A | | | 1.9 | | | Media & Entertainment |
| 1 | The top 10 holdings may not be representative of the Fund’s future investments. |
FUND VS. BENCHMARK SECTOR ALLOCATIONS2
As of December 31, 2020
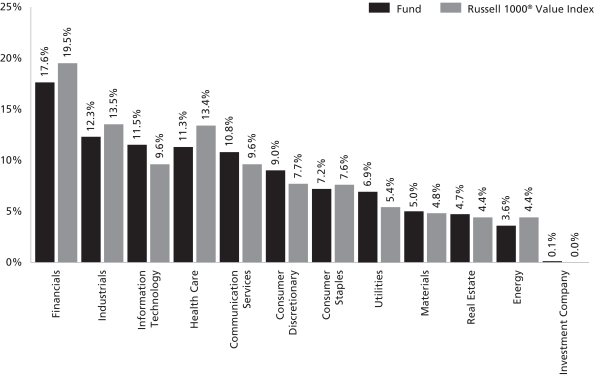
| 2 | The Fund is actively managed and, as such, its composition may differ over time. Consequently, the Fund’s overall sector allocations may differ from percentages contained in the graph above. The graph categorizes investments using Global Industry Classification Standard (“GICS”); however, the sector classifications used by the portfolio management team may differ from GICS. The percentage shown for each investment category reflects the value of investments in that category as a percentage of market value. Underlying sector allocations of exchange traded funds and investment companies held by the Fund are not reflected in the graph above. |
For more information about your Fund, please refer to www.GSAMFUNDS.com. There, you can learn more about your Fund’s investment strategies, holdings, and performance.
5
GOLDMAN SACHS VARIABLE INSURANCE TRUST LARGE CAP VALUE FUND
Performance Summary
December 31, 2020
The following graph shows the value, as of December 31, 2020, of a $10,000 investment made on January 1, 2011 in Service Shares at NAV. For comparative purposes, the performance of the Fund’s benchmark, the Russell 1000® Value Index (with distributions reinvested), is shown. Performance reflects applicable fee waivers and/or expense limitations in effect during the periods shown and in their absence, performance would be reduced. Returns do not reflect the deduction of taxes that a shareholder would pay on Fund distributions or the redemption of Fund shares. The returns set forth below represent past performance. Past performance does not guarantee future results. The Fund’s investment return and principal value will fluctuate so that an investor’s shares, when redeemed, may be worth more or less than their original cost. Current performance may be lower or higher than the performance quoted below. Please visit our web site at www.GSAMFUNDS.com to obtain the most recent month-end returns.
Large Cap Value Fund’s 10 Year Performance
Performance of a $10,000 investment, with distributions reinvested, from January 1, 2011 through December 31, 2020.
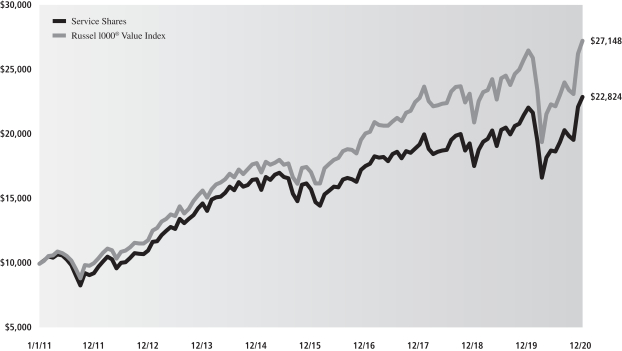
| | | | | | |
| Average Annual Total Return through December 31, 2020 | | One Year | | Five Years | | Ten Years |
Institutional | | 3.97% | | 7.99% | | 8.87% |
Service | | 3.73% | | 7.71% | | 8.60% |
6
GOLDMAN SACHS VARIABLE INSURANCE TRUST LARGE CAP VALUE FUND
Schedule of Investments
December 31, 2020
| | | | | | | | |
| Shares | | | Description | | Value | |
|
| Common Stocks – 100.0% | |
| Automobiles & Components – 2.2% | |
| | 50,395 | | | Aptiv plc | | $ | 6,565,965 | |
| | 87,321 | | | General Motors Co. | | | 3,636,046 | |
| | | | | | | | |
| | | | | | | 10,202,011 | |
| | |
| Banks – 8.5% | | | |
| | 124,718 | | | JPMorgan Chase & Co. | | | 15,847,916 | |
| | 51,082 | | | M&T Bank Corp. | | | 6,502,739 | |
| | 150,057 | | | Truist Financial Corp. | | | 7,192,232 | |
| | 318,702 | | | Wells Fargo & Co. | | | 9,618,426 | |
| | | | | | | | |
| | | | | | | 39,161,313 | |
| | |
| Capital Goods – 7.8% | | | |
| | 24,012 | | | Deere & Co. | | | 6,460,428 | |
| | 871,902 | | | General Electric Co. | | | 9,416,542 | |
| | 36,010 | | | Honeywell International, Inc. | | | 7,659,327 | |
| | 28,261 | | | Illinois Tool Works, Inc. | | | 5,761,853 | |
| | 23,812 | | | L3Harris Technologies, Inc. | | | 4,500,944 | |
| | 12,650 | | | Stanley Black & Decker, Inc. | | | 2,258,784 | |
| | | | | | | | |
| | | | | | | 36,057,878 | |
| | |
| Commercial & Professional Services – 0.7% | |
| | 32,844 | | | Waste Connections, Inc. | | | 3,368,809 | |
| | |
| Consumer Durables & Apparel – 0.9% | | | |
| | 51,256 | | | Brunswick Corp. | | | 3,907,757 | |
| | |
| Consumer Services – 3.8% | | | |
| | 53,065 | | | Hilton Worldwide Holdings, Inc. | | | 5,904,012 | |
| | 52,097 | | | Las Vegas Sands Corp. | | | 3,104,981 | |
| | 38,608 | | | McDonald’s Corp. | | | 8,284,505 | |
| | | | | | | | |
| | | | | | | 17,293,498 | |
| | |
| Diversified Financials – 5.7% | | | |
| | 60,558 | | | American Express Co. | | | 7,322,068 | |
| | 27,535 | | | Berkshire Hathaway, Inc. Class B* | | | 6,384,541 | |
| | 11,393 | | | BlackRock, Inc. | | | 8,220,505 | |
| | 37,305 | | | Intercontinental Exchange, Inc. | | | 4,300,893 | |
| | | | | | | | |
| | | | | | | 26,228,007 | |
| | |
| Energy – 3.6% | | | |
| | 50,833 | | | Cheniere Energy, Inc.* | | | 3,051,505 | |
| | 104,085 | | | Chevron Corp. | | | 8,789,978 | |
| | 113,652 | | | ConocoPhillips | | | 4,544,944 | |
| | | | | | | | |
| | | | | | | 16,386,427 | |
| | |
| Food & Staples Retailing – 1.8% | | | |
| | 58,898 | | | Walmart, Inc. | | | 8,490,147 | |
| | |
| Food, Beverage & Tobacco – 3.9% | | | |
| | 137,267 | | | Coca-Cola Co. (The) | | | 7,527,722 | |
| | 24,615 | | | Constellation Brands, Inc. Class A | | | 5,391,916 | |
| | 83,268 | | | Mondelez International, Inc. Class A | | | 4,868,680 | |
| | | | | | | | |
| | | | | | | 17,788,318 | |
| | |
| Health Care Equipment & Services – 6.2% | | | |
| | 140,275 | | | Boston Scientific Corp.* | | | 5,042,886 | |
| | 63,289 | | | CVS Health Corp. | | | 4,322,639 | |
| | 10,312 | | | Humana, Inc. | | | 4,230,704 | |
| | |
|
| Common Stocks – (continued) | |
| Health Care Equipment & Services – (continued) | | | |
| | 66,556 | | | Medtronic plc | | | 7,796,370 | |
| | 45,573 | | | Zimmer Biomet Holdings, Inc. | | | 7,022,344 | |
| | | | | | | | |
| | | | | | | 28,414,943 | |
| | |
| Household & Personal Products – 1.5% | | | |
| | 48,958 | | | Procter & Gamble Co. (The) | | | 6,812,016 | |
| | |
| Insurance – 3.4% | | | |
| | 46,028 | | | Allstate Corp. (The) | | | 5,059,858 | |
| | 56,562 | | | American Financial Group, Inc. | �� | | 4,955,962 | |
| | 37,261 | | | Chubb Ltd. | | | 5,735,213 | |
| | | | | | | | |
| | | | | | | 15,751,033 | |
| | |
| Materials – 5.0% | | | |
| | 27,105 | | | Ecolab, Inc. | | | 5,864,438 | |
| | 30,098 | | | Linde plc | | | 7,931,124 | |
| | 15,493 | | | Martin Marietta Materials, Inc. | | | 4,399,547 | |
| | 36,370 | | | Packaging Corp. of America | | | 5,015,787 | |
| | | | | | | | |
| | | | | | | 23,210,896 | |
| | |
| Media & Entertainment – 8.3% | | | |
| | 4,903 | | | Alphabet, Inc. Class A* | | | 8,593,194 | |
| | 181,562 | | | Comcast Corp. Class A | | | 9,513,849 | |
| | 22,075 | | | Electronic Arts, Inc. | | | 3,169,970 | |
| | 93,385 | | | Walt Disney Co. (The)* | | | 16,919,495 | |
| | | | | | | | |
| | | | | | | 38,196,508 | |
| | |
| Pharmaceuticals, Biotechnology & Life Sciences – 5.1% | |
| | 2,987 | | | Biogen, Inc.* | | | 731,397 | |
| | 10,843 | | | BioMarin Pharmaceutical, Inc.* | | | 950,823 | |
| | 108,210 | | | Bristol-Myers Squibb Co. | | | 6,712,266 | |
| | 24,881 | | | Eli Lilly and Co. | | | 4,200,908 | |
| | 24,811 | | | Genmab A/S ADR* | | | 1,008,815 | |
| | 56,450 | | | Johnson & Johnson | | | 8,884,101 | |
| | 5,897 | | | Sarepta Therapeutics, Inc.* | | | 1,005,380 | |
| | | | | | | | |
| | | | | | | 23,493,690 | |
| | |
| Real Estate Investment Trusts – 4.7% | | | |
| | 24,520 | | | Alexandria Real Estate Equities, Inc. | | | 4,369,954 | |
| | 27,314 | | | AvalonBay Communities, Inc. | | | 4,381,985 | |
| | 43,633 | | | Extra Space Storage, Inc. | | | 5,055,319 | |
| | 42,066 | | | Prologis, Inc. | | | 4,192,298 | |
| | 54,705 | | | Welltower, Inc. | | | 3,535,037 | |
| | | | | | | | |
| | | | | | | 21,534,593 | |
| | |
| Retailing – 2.2% | | | |
| | 29,202 | | | Lowe’s Cos., Inc. | | | 4,687,213 | |
| | 5,486 | | | O’Reilly Automotive, Inc.* | | | 2,482,799 | |
| | 22,443 | | | Ross Stores, Inc. | | | 2,756,225 | |
| | | | | | | | |
| | | | | | | 9,926,237 | |
| | |
| Semiconductors & Semiconductor Equipment – 4.5% | |
| | 48,665 | | | Intel Corp. | | | 2,424,490 | |
| | 68,402 | | | Marvell Technology Group Ltd. | | | 3,251,831 | |
| | 34,807 | | | NXP Semiconductors NV | | | 5,534,661 | |
| | 29,108 | | | QUALCOMM, Inc. | | | 4,434,313 | |
| | 30,800 | | | Texas Instruments, Inc. | | | 5,055,204 | |
| | | | | | | | |
| | | | | | | 20,700,499 | |
| | |
| | |
| The accompanying notes are an integral part of these financial statements. | | 7 |
GOLDMAN SACHS VARIABLE INSURANCE TRUST LARGE CAP VALUE FUND
Schedule of Investments (continued)
December 31, 2020
| | | | | | | | |
| Shares | | | Description | | Value | |
|
| Common Stocks – (continued) | |
| Software & Services – 5.7% | | | |
| | 66,261 | | | Cognizant Technology Solutions Corp. Class A | | $ | 5,430,089 | |
| | 38,686 | | | Fidelity National Information Services, Inc. | | | 5,472,521 | |
| | 39,487 | | | International Business Machines Corp. | | | 4,970,624 | |
| | 6,226 | | | Intuit, Inc. | | | 2,364,946 | |
| | 10,597 | | | Microsoft Corp. | | | 2,356,985 | |
| | 14,316 | | | Splunk, Inc.* | | | 2,432,145 | |
| | 13,828 | | | Visa, Inc. Class A | | | 3,024,598 | |
| | | | | | | | |
| | | | | | | 26,051,908 | |
| | |
| Technology Hardware & Equipment – 1.3% | | | |
| | 85,089 | | | Cisco Systems, Inc. | | | 3,807,732 | |
| | 98,527 | | | Juniper Networks, Inc. | | | 2,217,843 | |
| | | | | | | | |
| | | | | | | 6,025,575 | |
| | |
| Telecommunication Services – 2.5% | | | |
| | 192,647 | | | Verizon Communications, Inc. | | | 11,318,011 | |
| | |
| Transportation – 3.8% | | | |
| | 23,686 | | | Norfolk Southern Corp. | | | 5,628,031 | |
| | 39,070 | | | Union Pacific Corp. | | | 8,135,155 | |
| | 85,463 | | | United Airlines Holdings, Inc.* | | | 3,696,275 | |
| | | | | | | | |
| | | | | | | 17,459,461 | |
| | |
| Utilities – 6.9% | | | |
| | 56,116 | | | Ameren Corp. | | | 4,380,415 | |
| | 30,687 | | | American Water Works Co., Inc. | | | 4,709,534 | |
| | 29,070 | | | Atmos Energy Corp. | | | 2,774,150 | |
| | 65,249 | | | CMS Energy Corp. | | | 3,980,842 | |
| | 137,759 | | | NextEra Energy, Inc. | | | 10,628,107 | |
| | 80,844 | | | Xcel Energy, Inc. | | | 5,389,869 | |
| | | | | | | | |
| | | | | | | 31,862,917 | |
| | |
| | TOTAL COMMON STOCKS | | | | |
| | (Cost $363,078,166) | | $ | 459,642,452 | |
| | |
| | | | | | | | |
| Shares | | Dividend
Rate | | | Value | |
|
| Investment Company(a) – 0.1% | |
Goldman Sachs Financial Square Government Fund —
Institutional Shares | |
| 396,415 | | | 0.026 | % | | $ | 396,415 | |
| (Cost $396,415) | | | | | |
| |
| TOTAL INVESTMENTS – 100.1% | |
| (Cost $363,474,581) | | | $ | 460,038,867 | |
| |
LIABILITIES IN EXCESS OF OTHER ASSETS – (0.1)% | | | | (398,840 | ) |
| |
| NET ASSETS – 100.0% | | | $ | 459,640,027 | |
| |
| | |
| The percentage shown for each investment category reflects the value of investments in that category as a percentage of net assets. |
| |
| * | | Security is currently in default and/or non-income producing. |
| |
| (a) | | Represents an Affiliated Issuer. |
| | |
| |
| Investment Abbreviation: |
| ADR | | —American Depositary Receipt |
| | |
| 8 | | The accompanying notes are an integral part of these financial statements. |
GOLDMAN SACHS VARIABLE INSURANCE TRUST LARGE CAP VALUE FUND
Statement of Assets and Liabilities
December 31, 2020
| | | | |
| | | | |
| Assets: | | | |
Investments in unaffiliated issuers, at value (cost $363,078,166) | | $ | 459,642,452 | |
Investments in affiliated issuers, at value (cost $396,415) | | | 396,415 | |
Cash | | | 719,722 | |
Receivables: | | | | |
Dividends | | | 450,353 | |
Fund shares sold | | | 135,885 | |
Reimbursement from investment adviser | | | 26,889 | |
Other assets | | | 1,309 | |
| |
| Total assets | | | 461,373,025 | |
| | | | |
| | | | |
| Liabilities: | | | |
Payables: | | | | |
Fund shares redeemed | | | 1,199,910 | |
Management fees | | | 262,462 | |
Distribution and Service fees and Transfer Agency fees | | | 65,650 | |
Accrued expenses | | | 204,976 | |
| |
| Total liabilities | | | 1,732,998 | |
| | | | |
| | | | |
| Net Assets: | | | |
Paid-in capital | | | 370,344,927 | |
Total distributable earnings (loss) | | | 89,295,100 | |
| |
| NET ASSETS | | $ | 459,640,027 | |
Net Assets: | | | | |
Institutional | | $ | 160,076,361 | |
Service | | | 299,563,666 | |
| |
Total Net Assets | | $ | 459,640,027 | |
Shares outstanding $0.001 par value (unlimited shares authorized): | | | | |
Institutional | | | 17,263,213 | |
Service | | | 32,300,151 | |
Net asset value, offering and redemption price per share: | | | | |
Institutional | | | $9.27 | |
Service | | | 9.27 | |
| | |
| The accompanying notes are an integral part of these financial statements. | | 9 |
GOLDMAN SACHS VARIABLE INSURANCE TRUST LARGE CAP VALUE FUND
Statement of Operations
For the Fiscal Year Ended December 31, 2020
| | | | |
| | | | |
| Investment income: | | | |
Dividends — unaffiliated issuers (net of foreign taxes withheld of $8,085) | | $ | 8,954,891 | |
Dividends — affiliated issuers | | | 14,978 | |
| Securities lending income — unaffiliated issuer | | | 6,051 | |
Interest | | | 1,051 | |
| |
| Total investment income | | | 8,976,971 | |
| | | | |
| | | | |
| Expenses: | | | |
Management fees | | | 3,007,574 | |
Distribution and Service (12b-1) fees | | | 680,420 | |
Professional fees | | | 104,390 | |
Transfer Agency fees(a) | | | 83,536 | |
Printing and mailing costs | | | 80,938 | |
Custody, accounting and administrative services | | | 74,368 | |
Trustee fees | | | 21,129 | |
Other | | | 19,142 | |
| |
| Total expenses | | | 4,071,497 | |
| |
Less — expense reductions | | | (481,720 | ) |
| |
| Net expenses | | | 3,589,777 | |
| |
| NET INVESTMENT INCOME | | | 5,387,194 | |
| | | | |
| | | | |
| Realized and unrealized gain (loss): | | | |
Net realized loss from investments — unaffiliated issuers | | | (6,988,415 | ) |
Net change in unrealized gain on investments — unaffiliated issuers | | | 20,107,747 | |
| |
| Net realized and unrealized gain | | | 13,119,332 | |
| |
| NET INCREASE IN NET ASSETS RESULTING FROM OPERATIONS | | $ | 18,506,526 | |
(a) Institutional and Service Shares incurred Transfer Agency fees of $29,107 and $54,429, respectively.
| | |
| 10 | | The accompanying notes are an integral part of these financial statements. |
GOLDMAN SACHS VARIABLE INSURANCE TRUST LARGE CAP VALUE FUND
Statements of Changes in Net Assets
| | | | | | | | |
| | | For the
Fiscal Year Ended
December 31, 2020 | | | For the
Fiscal Year Ended
December 31, 2019 | |
| | | | | | | | |
| From operations: | |
Net investment income | | $ | 5,387,194 | | | $ | 6,004,286 | |
Net realized gain (loss) | | | (6,988,415 | ) | | | 20,966,506 | |
Net change in unrealized gain | | | 20,107,747 | | | | 78,158,001 | |
| | |
| Net increase in net assets resulting from operations | | | 18,506,526 | | | | 105,128,793 | |
| |
| | | | | | | | |
| Distributions to shareholders: | | | | | | |
From distributable earnings: | | | | | | | | |
Institutional Shares | | | (4,769,206 | ) | | | (7,943,415 | ) |
Service Shares | | | (8,295,083 | ) | | | (14,094,598 | ) |
| | |
| Total distributions to shareholders | | | (13,064,289 | ) | | | (22,038,013 | ) |
| |
| | | | | | | | |
| From share transactions: | | | | | | |
Proceeds from sales of shares | | | 34,531,693 | | | | 13,557,948 | |
Reinvestment of distributions | | | 13,064,288 | | | | 22,038,013 | |
Cost of shares redeemed | | | (63,270,455 | ) | | | (82,668,632 | ) |
| | |
| Net decrease in net assets resulting from share transactions | | | (15,674,474 | ) | | | (47,072,671 | ) |
| | |
| TOTAL INCREASE (DECREASE) | | | (10,232,237 | ) | | | 36,018,109 | |
| |
| | | | | | | | |
| Net Assets: | | | | | | |
| | |
Beginning of year | | | 469,872,264 | | | | 433,854,155 | |
| | |
End of year | | $ | 459,640,027 | | | $ | 469,872,264 | |
| | |
| The accompanying notes are an integral part of these financial statements. | | 11 |
GOLDMAN SACHS VARIABLE INSURANCE TRUST LARGE CAP VALUE FUND
Financial Highlights
Selected Data for a Share Outstanding Throughout Each Year
| | | | | | | | | | | | | | | | | | | | |
| | | Goldman Sachs Large Cap Value Fund | |
| | | Institutional Shares | |
| | | Year Ended December 31, | |
| | | 2020 | | | 2019 | | | 2018 | | | 2017 | | | 2016 | |
| | | | | | | | | | | | | | | | | | | | |
| Per Share Data | | | | | | | | | | | | | | | |
| | | | | |
Net asset value, beginning of year | | $ | 9.19 | | | $ | 7.67 | | | $ | 9.06 | | | $ | 10.16 | | | $ | 9.39 | |
| | | | | |
Net investment income(a) | | | 0.12 | | | | 0.13 | | | | 0.12 | | | | 0.16 | | | | 0.18 | |
| | | | | |
Net realized and unrealized gain (loss) | | | 0.24 | | | | 1.86 | | | | (0.88 | ) | | | 0.83 | | | | 0.91 | |
| | | | | |
Total from investment operations | | | 0.36 | | | | 1.99 | | | | (0.76 | ) | | | 0.99 | | | | 1.09 | |
| | | | | |
Distributions to shareholders from net investment income | | | (0.12 | ) | | | (0.14 | ) | | | (0.12 | ) | | | (0.18 | ) | | | (0.22 | ) |
| | | | | |
Distributions to shareholders from net realized gains | | | (0.16 | ) | | | (0.33 | ) | | | (0.51 | ) | | | (1.91 | ) | | | (0.10 | ) |
| | | | | |
Total distributions | | | (0.28 | ) | | | (0.47 | ) | | | (0.63 | ) | | | (2.09 | ) | | | (0.32 | ) |
| | | | | |
Net asset value, end of year | | $ | 9.27 | | | $ | 9.19 | | | $ | 7.67 | | | $ | 9.06 | | | $ | 10.16 | |
| | | | | |
Total return(b) | | | 3.97 | % | | | 25.93 | % | | | (8.46 | )% | | | 9.85 | % | | | 11.55 | % |
| | | | | |
Net assets, end of year (in 000s) | | $ | 160,076 | | | $ | 163,814 | | | $ | 150,963 | | | $ | 188,182 | | | $ | 243,875 | |
| | | | | |
Ratio of net expenses to average net assets | | | 0.71 | % | | | 0.73 | % | | | 0.71 | % | | | 0.72 | % | | | 0.74 | % |
| | | | | |
Ratio of total expenses to average net assets | | | 0.81 | % | | | 0.83 | % | | | 0.81 | % | | | 0.81 | % | | | 0.81 | % |
| | | | | |
Ratio of net investment income to average net assets | | | 1.44 | % | | | 1.46 | % | | | 1.32 | % | | | 1.50 | % | �� | | 1.91 | % |
| | | | | |
Portfolio turnover rate(c) | | | 58 | % | | | 58 | % | | | 125 | % | | | 127 | % | | | 130 | % |
| (a) | Calculated based on the average shares outstanding methodology. |
| (b) | Assumes investment at the net asset value at the beginning of the year, reinvestment of all distributions, a complete redemption of the investment at the net asset value at the end of the year and no sales or redemption charges (if any). Total returns would be reduced if a sales or redemption charge was taken into account. Returns do not reflect the impact of taxes to shareholders relating to Fund distributions or the redemption of Fund shares. |
| (c) | The Fund’s portfolio turnover rate is calculated in accordance with regulatory requirements, without regard to transactions involving short term investments. If such transactions were included, the Fund’s portfolio turnover rate may be higher. |
| | |
| 12 | | The accompanying notes are an integral part of these financial statements. |
GOLDMAN SACHS VARIABLE INSURANCE TRUST LARGE CAP VALUE FUND
Financial Highlights (continued)
Selected Data for a Share Outstanding Throughout Each Year
| | | | | | | | | | | | | | | | | | | | |
| | | Goldman Sachs Large Cap Value Fund | |
| | | Service Shares | |
| | | Year Ended December 31, | |
| | | 2020 | | | 2019 | | | 2018 | | | 2017 | | | 2016 | |
| | | | | | | | | | | | | | | | | | | | |
| Per Share Data | | | | | | | | | | | | | | | |
| | | | | |
Net asset value, beginning of year | | $ | 9.19 | | | $ | 7.67 | | | $ | 9.06 | | | $ | 10.16 | | | $ | 9.39 | |
| | | | | |
Net investment income(a) | | | 0.10 | | | | 0.11 | | | | 0.10 | | | | 0.13 | | | | 0.16 | |
| | | | | |
Net realized and unrealized gain (loss) | | | 0.24 | | | | 1.85 | | | | (0.88 | ) | | | 0.83 | | | | 0.90 | |
| | | | | |
Total from investment operations | | | 0.34 | | | | 1.96 | | | | (0.78 | ) | | | 0.96 | | | | 1.06 | |
| | | | | |
Distributions to shareholders from net investment income | | | (0.10 | ) | | | (0.11 | ) | | | (0.10 | ) | | | (0.15 | ) | | | (0.19 | ) |
| | | | | |
Distributions to shareholders from net realized gains | | | (0.16 | ) | | | (0.33 | ) | | | (0.51 | ) | | | (1.91 | ) | | | (0.10 | ) |
| | | | | |
Total distributions | | | (0.26 | ) | | | (0.44 | ) | | | (0.61 | ) | | | (2.06 | ) | | | (0.29 | ) |
| | | | | |
Net asset value, end of year | | $ | 9.27 | | | $ | 9.19 | | | $ | 7.67 | | | $ | 9.06 | | | $ | 10.16 | |
| | | | | |
Total return(b) | | | 3.73 | % | | | 25.61 | % | | | (8.72 | )% | | | 9.56 | % | | | 11.25 | % |
| | | | | |
Net assets, end of year (in 000s) | | $ | 299,564 | | | $ | 306,058 | | | $ | 282,891 | | | $ | 358,776 | | | $ | 531,553 | |
| | | | | |
Ratio of net expenses to average net assets | | | 0.94 | % | | | 0.98 | % | | | 0.96 | % | | | 0.97 | % | | | 0.99 | % |
| | | | | |
Ratio of total expenses to average net assets | | | 1.06 | % | | | 1.08 | % | | | 1.06 | % | | | 1.06 | % | | | 1.06 | % |
| | | | | |
Ratio of net investment income to average net assets | | | 1.21 | % | | | 1.21 | % | | | 1.07 | % | | | 1.26 | % | | | 1.66 | % |
| | | | | |
Portfolio turnover rate(c) | | | 58 | % | | | 58 | % | | | 125 | % | | | 127 | % | | | 130 | % |
| (a) | Calculated based on the average shares outstanding methodology. |
| (b) | Assumes investment at the net asset value at the beginning of the year, reinvestment of all distributions, a complete redemption of the investment at the net asset value at the end of the year and no sales or redemption charges (if any). Total returns would be reduced if a sales or redemption charge was taken into account. Returns do not reflect the impact of taxes to shareholders relating to Fund distributions or the redemption of Fund shares. |
| (c) | The Fund’s portfolio turnover rate is calculated in accordance with regulatory requirements, without regard to transactions involving short term investments. If such transactions were included, the Fund’s portfolio turnover rate may be higher. |
| | |
| The accompanying notes are an integral part of these financial statements. | | 13 |
GOLDMAN SACHS VARIABLE INSURANCE TRUST LARGE CAP VALUE FUND
Notes to Financial Statements
December 31, 2020
1. ORGANIZATION
Goldman Sachs Variable Insurance Trust (the “Trust” or “VIT”) is a Delaware statutory trust registered under the Investment Company Act of 1940, as amended (the “Act”), as an open-end management investment company. The Trust includes the Goldman Sachs Large Cap Value Fund (the “Fund”). The Fund is a diversified portfolio under the Act offering two classes of shares — Institutional and Service Shares. Shares of the Trust are offered to separate accounts of participating life insurance companies for the purpose of funding variable annuity contracts and variable life insurance policies.
Goldman Sachs Asset Management, L.P. (“GSAM”), an affiliate of Goldman Sachs & Co. LLC (“Goldman Sachs”), serves as investment adviser to the Fund pursuant to a management agreement (the “Agreement”) with the Trust.
2. SIGNIFICANT ACCOUNTING POLICIES
The financial statements have been prepared in accordance with accounting principles generally accepted in the United States of America (“GAAP”) and require management to make estimates and assumptions that may affect the reported amounts and disclosures. Actual results may differ from those estimates and assumptions. The Fund is an investment company under GAAP and follows the accounting and reporting guidance applicable to investment companies.
A. Investment Valuation — The Fund’s valuation policy is to value investments at fair value.
B. Investment Income and Investments — Investment income includes interest income, dividend income, and securities lending income, if any. Interest income is accrued daily and adjusted for amortization of premiums and accretion of discounts. Dividend income is recognized on ex-dividend date or, for certain foreign securities, as soon as such information is obtained subsequent to the ex-dividend date. Non-cash dividends, if any, are recorded at the fair market value of the securities received. Investment transactions are reflected on trade date. Realized gains and losses are calculated using identified cost. Investment transactions are recorded on the following business day for daily net asset value (“NAV”) calculations. Investment income is recorded net of any foreign withholding taxes, less any amounts reclaimable. The Fund may file withholding tax reclaims in certain jurisdictions to recover a portion of amounts previously withheld. Any foreign capital gains tax is accrued daily based upon net unrealized gains, and is payable upon sale of such investments. Distributions received from the Fund’s investments in United States (“U.S.”) real estate investment trusts (“REITs”) may be characterized as ordinary income, net capital gain and/or a return of capital. A return of capital is recorded by the Fund as a reduction to the cost basis of the REIT.
C. Class Allocations and Expenses — Investment income, realized and unrealized gain (loss), if any, and non-class specific expenses of the Fund are allocated daily based upon the proportion of net assets of each class. Non-class specific expenses directly incurred by the Fund are charged to the Fund, while such expenses incurred by the Trust are allocated across the Fund on a straight-line and/or pro-rata basis depending upon the nature of the expenses. Class specific expenses, where applicable, are borne by the respective share classes and include Distribution and Service and Transfer Agency fees.
D. Federal Taxes and Distributions to Shareholders — It is the Fund’s policy to comply with the requirements of the Internal Revenue Code of 1986, as amended (the “Code”), applicable to regulated investment companies and to distribute each year substantially all of its investment company taxable income and capital gains to its shareholders. Accordingly, the Fund is not required to make any provisions for the payment of federal income tax. Distributions to shareholders are recorded on the ex-dividend date. Income and capital gains distributions, if any, are declared and paid at least annually.
Net capital losses, if any, are carried forward to future fiscal years and may be used to the extent allowed by the Code to offset any future capital gains. Losses that are carried forward will retain their character as either short-term or long-term capital losses. Utilization of capital loss carryforwards will reduce the requirement of future capital gains distributions.
The characterization of distributions to shareholders for financial reporting purposes is determined in accordance with federal income tax rules, which may differ from GAAP. The source of the Fund’s distributions may be shown in the accompanying financial statements as either from distributable earnings or capital. Certain components of the Fund’s net assets on the Statement of Assets and Liabilities reflect permanent GAAP/tax differences based on the appropriate tax character.
14
GOLDMAN SACHS VARIABLE INSURANCE TRUST LARGE CAP VALUE FUND
3. INVESTMENTS AND FAIR VALUE MEASUREMENTS
U.S. GAAP defines the fair value of a financial instrument as the amount that would be received to sell an asset or paid to transfer a liability in an orderly transaction between market participants at the measurement date (i.e., the exit price); the Fund’s policy is to use the market approach. GAAP establishes a fair value hierarchy that prioritizes the inputs to valuation techniques used to measure fair value. The hierarchy gives the highest priority to unadjusted quoted prices in active markets for identical assets or liabilities (Level 1 measurements) and the lowest priority to unobservable inputs (Level 3 measurements). The level in the fair value hierarchy within which the fair value measurement in its entirety falls shall be determined based on the lowest level input that is significant to the fair value measurement in its entirety. The levels used for classifying investments are not necessarily an indication of the risk associated with investing in these investments. The three levels of the fair value hierarchy are described below:
Level 1 — Unadjusted quoted prices in active markets that are accessible at the measurement date for identical, unrestricted assets or liabilities;
Level 2 — Quoted prices in markets that are not active or financial instruments for which significant inputs are observable (including, but not limited to, quoted prices for similar investments, interest rates, foreign exchange rates, volatility and credit spreads), either directly or indirectly;
Level 3 — Prices or valuations that require significant unobservable inputs (including GSAM’s assumptions in determining fair value measurement).
The Board of Trustees (“Trustees”) has approved Valuation Procedures that govern the valuation of the portfolio investments held by the Fund, including investments for which market quotations are not readily available. The Trustees have delegated to GSAM day-to-day responsibility for implementing and maintaining internal controls and procedures related to the valuation of the Fund’s investments. To assess the continuing appropriateness of pricing sources and methodologies, GSAM regularly performs price verification procedures and issues challenges as necessary to third party pricing vendors or brokers, and any differences are reviewed in accordance with the Valuation Procedures.
A. Level 1 and Level 2 Fair Value Investments — The valuation techniques and significant inputs used in determining the fair values for investments classified as Level 1 and Level 2 are as follows:
Equity Securities — Equity securities traded on a U.S. securities exchange or the NASDAQ system, or those located on certain foreign exchanges, including but not limited to the Americas, are valued daily at their last sale price or official closing price on the principal exchange or system on which they are traded. If there is no sale or official closing price or such price is believed by GSAM to not represent fair value, equity securities will be valued at the valid closing bid price for long positions and at the valid closing ask price for short positions (i.e. where there is sufficient volume, during normal exchange trading hours). If no valid bid/ask price is available, the equity security will be valued pursuant to the Valuation Procedures approved by the Trustees and consistent with applicable regulatory guidance. To the extent these investments are actively traded, they are classified as Level 1 of the fair value hierarchy, otherwise they are generally classified as Level 2. Certain equity securities containing unique attributes may be classified as Level 2.
Unlisted equity securities for which market quotations are available are valued at the last sale price on the valuation date, or if no sale occurs, at the last bid price for long positions or the last ask price for short positions, and are generally classified as Level 2.
Money Market Funds — Investments in the Goldman Sachs Financial Square Government Fund (“Underlying Fund”) are valued at the NAV per share of the Institutional Share class on the day of valuation. These investments are generally classified as Level 1 of the fair value hierarchy. For information regarding the Underlying Fund’s accounting policies and investment holdings, please see the Underlying Fund’s shareholder report.
B. Level 3 Fair Value Investments — To the extent that significant inputs to valuation models and other alternative pricing sources are unobservable, or if quotations are not readily available, or if GSAM believes that such quotations do not accurately reflect fair value, the fair value of the Fund’s investments may be determined under Valuation Procedures approved by the Trustees. GSAM, consistent with its procedures and applicable regulatory guidance, may make an adjustment to the most recent valuation prices of either domestic or foreign securities in light of significant events to reflect what it believes to be the fair value of
15
GOLDMAN SACHS VARIABLE INSURANCE TRUST LARGE CAP VALUE FUND
Notes to Financial Statements (continued)
December 31, 2020
3. INVESTMENTS AND FAIR VALUE MEASUREMENTS (continued)
the securities at the time of determining the Fund’s NAV. To the extent investments are valued using single source broker quotations obtained directly from the broker or passed through from third party pricing vendors, such investments are classified as Level 3 investments.
C. Fair Value Hierarchy — The following is a summary of the Fund’s investments classified in the fair value hierarchy as of December 31, 2020:
| | | | | | | | | | | | |
| Investment Type | | Level 1 | | | Level 2 | | | Level 3 | |
| | | |
| Assets | | | | | | | | | | | | |
| Common Stock and/or Other Equity Investments(a) | | | | | | | | | | | | |
Europe | | $ | 14,474,600 | | | $ | — | | �� | $ | — | |
North America | | | 445,167,852 | | | | — | | | | — | |
| Investment Company | | | 396,415 | | | | — | | | | — | |
| | | |
| Total | | $ | 460,038,867 | | | $ | — | | | $ | — | |
| (a) | Amounts are disclosed by continent to highlight the impact of time zone differences between local market close and the calculation of NAV. Security valuations are based on the principal exchange or system on which they are traded, which may differ from country of domicile. |
For further information regarding security characteristics, see the Schedule of Investments.
4. AGREEMENTS AND AFFILIATED TRANSACTIONS
A. Management Agreement — Under the Agreement, GSAM manages the Fund, subject to the general supervision of the Trustees.
As compensation for the services rendered pursuant to the Agreement, the assumption of the expenses related thereto and administration of the Fund’s business affairs, including providing facilities, GSAM is entitled to a management fee, accrued daily and paid monthly, equal to an annual percentage rate of the Fund’s average daily net assets.
For the fiscal year ended December 31, 2020, contractual and effective net management fees with GSAM were at the following rates:
| | | | | | | | | | | | | | | | | | | | | | |
| Contractual Management Rate | | | | | | | |
First
$1 billion | | Next
$1 billion | | Next
$3 billion | | | Next
$3 billion | | | Over
$8 billion | | | Effective
Rate | | | Effective Net
Management
Rate^ | |
| | | | | | |
| 0.72% | | 0.65% | | | 0.62 | % | | | 0.60 | % | | | 0.59 | % | | | 0.72 | % | | | 0.68 | %* |
| ^ | Effective Net Management Rate includes the impact of management fee waivers of affiliated Underlying Funds, if any. |
| * | GSAM agreed to waive a portion of its management fee in order to achieve a net management rate, as defined in the Fund’s most recent prospectus. This waiver was effective on April 29, 2020 and will continue to be effective through at least April 29, 2021, and prior to such date GSAM may not terminate the arrangement without approval of the Trustees. For the fiscal year ended December 31, 2020, GSAM waived $153,607 of its management fee. |
The Fund invests in Institutional Shares of the Goldman Sachs Financial Square Government Fund, which is an affiliated Underlying Fund. GSAM has agreed to waive a portion of its management fee payable by the Fund in an amount equal to the management fee it earns as an investment adviser to the affiliated Underlying Fund in which the Fund invests, except those management fees it earns from the Fund’s investments of cash collateral received in connection with securities lending transactions in the Goldman Sachs Financial Square Government Fund. For the fiscal year ended December 31, 2020, GSAM waived $7,125 of the Fund’s management fee.
B. Distribution and Service (12b-1) Plan — The Trust, on behalf of Service Shares of the Fund, has adopted a Distribution and Service Plan subject to Rule 12b-1 under the Act. Under the Distribution and Service Plan, Goldman Sachs, which serves as
16
GOLDMAN SACHS VARIABLE INSURANCE TRUST LARGE CAP VALUE FUND
4. AGREEMENTS AND AFFILIATED TRANSACTIONS (continued)
distributor, is entitled to a fee accrued daily and paid monthly, for distribution services and personal and account maintenance services, which may then be paid by Goldman Sachs to authorized dealers, equal to, on an annual basis, 0.25% of the Fund’s average daily net assets attributable to Service Shares.
C. Transfer Agency Agreement — Goldman Sachs also serves as the transfer agent of the Fund for a fee pursuant to the Transfer Agency Agreement. The fees charged for such transfer agency services are accrued daily and paid monthly at an annual rate of 0.02% of the average daily net assets of Institutional and Service Shares. Effective April 29, 2020 Goldman Sachs has agreed to waive its transfer agent fee attributable to the Service Shares. This arrangement will remain in place through at least April 29, 2021, and prior to such date Goldman Sachs may not terminate the arrangement without approval of the Board of Trustees.
D. Other Expense Agreements and Affiliated Transactions — GSAM has agreed to reduce or limit certain “Other Expenses” of the Fund (excluding acquired fund fees and expenses, transfer agency fees and expenses, service fees and shareholder administration fees (as applicable), taxes, interest, brokerage fees, expenses of shareholder meetings, litigation and indemnification, and extraordinary expenses) to the extent such expenses exceed, on an annual basis, a percentage rate of the average daily net assets of the Fund. Such Other Expense reimbursements, if any, are accrued daily and paid monthly. In addition, the Fund is not obligated to reimburse GSAM for prior fiscal year expense reimbursements, if any. The Other Expense limitation as an annual percentage rate of average daily net assets for the Fund is 0.004%. The Other Expense limitation will remain in place through at least April 29, 2021, and prior to such date GSAM may not terminate the arrangement without the approval of the Trustees. In addition, the Fund has entered into certain offset arrangements with the custodian and the transfer agent, which may result in a reduction of the Fund’s expenses and are received irrespective of the application of the “Other Expense” limitation described above.
For the fiscal year ended December 31, 2020, these expense reductions, including any fee waivers and Other Expense reimbursements, were as follows:
| | | | | | | | | | | | | | | | | | |
Management
Fee Waiver | | | Custody Fee
Credits | | | Transfer Agency
Fees | | | Other Expense
Reimbursement | | | Total Expense
Reductions | |
| | | | |
| | $160,732 | | | $ | 793 | | | $ | 36,937 | | | $ | 283,258 | | | $ | 481,720 | |
E. Line of Credit Facility — As of December 31, 2020, the Fund participated in a $700,000,000 committed, unsecured revolving line of credit facility (the “facility”) together with other funds of the Trust and certain registered investment companies having management agreements with GSAM or its affiliates. This facility is to be used for temporary emergency purposes, or to allow for an orderly liquidation of securities to meet redemption requests. The interest rate on borrowings is based on the federal funds rate. The facility also requires a fee to be paid by the Fund based on the amount of the commitment that has not been utilized. For the fiscal year ended December 31, 2020, the Fund did not have any borrowings under the facility. Prior to April 28, 2020, the facility was $580,000,000.
F. Other Transactions with Affiliates — The following table provides information about the Fund’s investments in the Goldman Sachs Financial Square Government Fund as of and for the fiscal year ended December 31, 2020:
| | | | | | | | | | | | | | | | | | | | | | |
Beginning
Value as of
December 31, 2019 | | | Purchases
at Cost | | | Proceeds
from Sales | | | Ending
Value as of
December 31, 2020 | | | Shares as of
December 31, 2020 | | | Dividend Income
from Affiliated
Investment Company | |
| | | | | |
| | $771,927 | | | $ | 72,748,792 | | | $ | (73,124,304 | ) | | $ | 396,415 | | | | 396,415 | | | $ | 14,978 | |
5. PORTFOLIO SECURITIES TRANSACTIONS
The cost of purchases and proceeds from sales and maturities of long-term securities for the fiscal year ended December 31, 2020, were $238,059,153 and $260,584,250, respectively.
17
GOLDMAN SACHS VARIABLE INSURANCE TRUST LARGE CAP VALUE FUND
Notes to Financial Statements (continued)
December 31, 2020
6. SECURITIES LENDING
The Fund may lend its securities through a securities lending agent, the Bank of New York Mellon (“BNYM”), to certain qualified borrowers. In accordance with the Fund’s securities lending procedures, the Fund receives cash collateral at least equal to the market value of the securities on loan. The market value of the loaned securities is determined at the close of business of the Fund, at their last sale price or official closing price on the principal exchange or system on which they are traded, and any additional required collateral is delivered to the Fund on the next business day. As with other extensions of credit, the Fund may experience delay in the recovery of its securities or incur a loss should the borrower of the securities breach its agreement with the Fund or become insolvent at a time when the collateral is insufficient to cover the cost of repurchasing securities on loan. Dividend income received from securities on loan may not be subject to withholding taxes and therefore withholding taxes paid may differ from the amounts listed in the Statement of Operations. Loans of securities are terminable at any time and as such 1) the remaining contractual maturities of the outstanding securities lending transactions are considered to be overnight and continuous and 2) the borrower, after notice, is required to return borrowed securities within the standard time period for settlement of securities transactions.
The Fund invests the cash collateral received in connection with securities lending transactions in the Goldman Sachs Financial Square Government Fund (“Government Money Market Fund”), an affiliated series of the Goldman Sachs Trust. The Government Money Market Fund is registered under the Act as an open end investment company, is subject to Rule 2a-7 under the Act, and is managed by GSAM, for which GSAM may receive a management fee of up to 0.16% on an annualized basis of the average daily net assets of the Government Money Market Fund.
In the event of a default by a borrower with respect to any loan, BNYM may exercise any and all remedies provided under the applicable borrower agreement to make the Fund whole. These remedies include purchasing replacement securities by applying the collateral held from the defaulting broker against the purchase cost of the replacement securities. If BNYM is unable to purchase replacement securities, BNYM will indemnify the Fund by paying the Fund an amount equal to the market value of the securities loaned minus the value of cash collateral received from the borrower for the loan, subject to an exclusion for any shortfalls resulting from a loss of value in such cash collateral due to reinvestment risk. The Fund’s master netting agreements with certain borrowers provide the right, in the event of a default (including bankruptcy or insolvency), for the non-defaulting party to liquidate the collateral and calculate net exposure to the defaulting party or request additional collateral. However, in the event of a default by a borrower, a resolution authority could determine that such rights are not enforceable due to the restrictions or prohibitions against the right of set-off that may be imposed in accordance with a particular jurisdiction’s bankruptcy or insolvency laws. The Fund’s loaned securities were all subject to enforceable Securities Lending Agreements and the value of the collateral was at least equal to the value of the cash received. The amounts of the Fund’s overnight and continuous agreements, which represent the gross amounts of recognized liabilities for securities lending transactions outstanding as of December 31, 2020, are disclosed as “Payable upon return of securities loaned” on the Statement of Assets and Liabilities, where applicable. The Fund did not have securities on loan as of December 31, 2020.
Both the Fund and BNYM received compensation relating to the lending of the Fund’s securities. The amounts earned, if any, by the Fund for the fiscal year ended December 31, 2020, are reported under Investment Income on the Statement of Operations.
The following table provides information about the Fund’s investment in the Government Money Market Fund for the fiscal year ended December 31, 2020:
| | | | | | | | | | | | | | |
Beginning
Value as of
December 31, 2019 | | | Purchases
at Cost | | | Proceeds
from Sales | | | Ending
Value as of
December 31, 2020 | |
| | | |
| | $— | | | $ | 2,754,477 | | | $ | (2,754,477 | ) | | $ | — | |
18
GOLDMAN SACHS VARIABLE INSURANCE TRUST LARGE CAP VALUE FUND
7. TAX INFORMATION
The tax character of distributions paid during the fiscal years ended December 31, 2019 and December 31, 2020 was as follows:
| | | | | | | | |
| | | 2019 | | | 2020 | |
Distributions paid from: | | | | | | | | |
Ordinary income | | $ | 5,962,422 | | | $ | 5,259,550 | |
Net long-term capital gains | | | 16,075,591 | | | | 7,804,739 | |
| Total Taxable Distributions | | $ | 22,038,013 | | | $ | 13,064,289 | |
As of December 31, 2020, the components of accumulated earnings (losses) on a tax-basis were as follows:
| | | | |
| Undistributed ordinary income — net | | $ | 748,243 | |
Capital loss carryforwards: | | | | |
Perpetual short-term | | $ | (5,732,311 | ) |
| Timing differences (Real Estate Investment Trust) | | | 26,726 | |
| Unrealized gains — net | | | 94,252,442 | |
| Total accumulated earnings — net | | $ | 89,295,100 | |
As of December 31, 2020, the Fund’s aggregate security unrealized gains and losses based on cost for U.S. federal income tax purposes were as follows:
| | | | |
| Tax cost | | $ | 365,786,425 | |
| Gross unrealized gain | | | 105,893,120 | |
| Gross unrealized loss | | | (11,640,678 | ) |
| Net unrealized gain | | $ | 94,252,442 | |
The difference between GAAP-basis and tax-basis unrealized gains (losses) is attributable primarily to wash sales.
GSAM has reviewed the Fund’s tax positions for all open tax years (the current and prior three years, as applicable) and has concluded that no provision for income tax is required in the Fund’s financial statements. Such open tax years remain subject to examination and adjustment by tax authorities.
8. OTHER RISKS
The Fund’s risks include, but are not limited to, the following:
Investments in Other Investment Companies Risk — As a shareholder of another investment company, the Fund will indirectly bear its proportionate share of any net management fees and other expenses paid by such other investment companies, in addition to the fees and expenses regularly borne by the Fund.
Large Shareholder Transactions Risk — The Fund may experience adverse effects when certain large shareholders, such as other funds, participating insurance companies, accounts and Goldman Sachs affiliates, purchase or redeem large amounts of shares of the Fund. Such large shareholder redemptions, which may occur rapidly or unexpectedly, may cause the Fund to sell portfolio securities at times when it would not otherwise do so, which may negatively impact the Fund’s NAV and liquidity. These transactions may also accelerate the realization of taxable income to shareholders if such sales of investments resulted in gains, and may also increase transaction costs. In addition, a large redemption could result in the Fund’s current expenses being allocated over
19
GOLDMAN SACHS VARIABLE INSURANCE TRUST LARGE CAP VALUE FUND
Notes to Financial Statements (continued)
December 31, 2020
8. OTHER RISKS (continued)
a smaller asset base, leading to an increase in the Fund’s expense ratio. Similarly, large Fund share purchases may adversely affect the Fund’s performance to the extent that the Fund is delayed in investing new cash or otherwise maintains a larger cash position than it ordinarily would.
Liquidity Risk — The Fund may make investments that are illiquid or that may become less liquid in response to market developments or adverse investor perceptions. Illiquid investments may be more difficult to value. Liquidity risk may also refer to the risk that the Fund will not be able to pay redemption proceeds within the allowable time period or without significant dilution to remaining investors’ interests because of unusual market conditions, an unusually high volume of redemption requests, or other reasons. To meet redemption requests, the Fund may be forced to sell investments at an unfavorable time and/or under unfavorable conditions. If the Fund is forced to sell securities at an unfavorable time and/or under unfavorable conditions, such sales may adversely affect the Fund’s NAV and dilute remaining investors’ interests. These risks may be more pronounced in connection with the Fund’s investments in securities of issuers located in emerging market countries. Redemptions by large shareholders may have a negative impact on the Fund’s liquidity.
Market and Credit Risks — In the normal course of business, the Fund trades financial instruments and enters into financial transactions where risk of potential loss exists due to changes in the market (market risk). The value of the securities in which the Fund invests may go up or down in response to the prospects of individual companies, particular sectors or governments and/or general economic conditions throughout the world due to increasingly interconnected global economies and financial markets. Events such as war, acts of terrorism, social unrest, natural disasters, the spread of infectious illness or other public health threats could also significantly impact the Fund and its investments. Additionally, the Fund may also be exposed to credit risk in the event that an issuer or guarantor fails to perform or that an institution or entity with which the Fund has unsettled or open transactions defaults.
9. INDEMNIFICATIONS
Under the Trust’s organizational documents, its Trustees, officers, employees and agents are indemnified, to the extent permitted by the Act and state law, against certain liabilities that may arise out of performance of their duties to the Fund. Additionally, in the course of business, the Fund enters into contracts that contain a variety of indemnification clauses. The Fund’s maximum exposure under these arrangements is unknown, as this would involve future claims that may be made against the Fund that have not yet occurred. However, GSAM believes the risk of loss under these arrangements to be remote.
10. OTHER MATTERS
On October 22, 2020, Goldman Sachs announced a settlement of matters involving 1Malaysia Development Bhd. (1MDB), a Malaysian sovereign wealth fund, with the United States Department of Justice as well as criminal and civil authorities in the UK, Singapore and Hong Kong. Further information regarding the 1MDB settlement can be found at https://www.goldmansachs.com/media-relations/press-releases/current/goldman-sachs-2020-10-22.html. The 1MDB settlement will not materially adversely affect GSAM’s ability to serve as investment manager.
11. SUBSEQUENT EVENTS
Subsequent events after the Statement of Assets and Liabilities date have been evaluated, and GSAM has concluded that there is no impact requiring adjustment or disclosure in the financial statements.
20
GOLDMAN SACHS VARIABLE INSURANCE TRUST LARGE CAP VALUE FUND
12. SUMMARY OF SHARE TRANSACTIONS
Share activity is as follows:
| | | | | | | | | | | | | | | | |
| | | For the Fiscal Year Ended
December 31, 2020 | | | For the Fiscal Year Ended
December 31, 2019 | |
| | | Shares | | | Dollars | | | Shares | | | Dollars | |
| Institutional Shares | | | | | | | | | | | | | | | | |
| Shares sold | | | 1,674,921 | | | $ | 12,636,325 | | | | 624,452 | | | $ | 5,567,317 | |
| Reinvestment of distributions | | | 522,367 | | | | 4,769,205 | | | | 872,903 | | | | 7,943,415 | |
| Shares redeemed | | | (2,756,893 | ) | | | (22,865,975 | ) | | | (3,356,752 | ) | | | (29,321,564 | ) |
| | | | (559,605 | ) | | | (5,460,445 | ) | | | (1,859,397 | ) | | | (15,810,832 | ) |
| Service Shares | | | | | | | | | | | | | | | | |
| Shares sold | | | 2,896,787 | | | | 21,895,368 | | | | 940,302 | | | | 7,990,631 | |
| Reinvestment of distributions | | | 908,552 | | | | 8,295,083 | | | | 1,548,857 | | | | 14,094,598 | |
| Shares redeemed | | | (4,795,612 | ) | | | (40,404,480 | ) | | | (6,071,122 | ) | | | (53,347,068 | ) |
| | | | (990,273 | ) | | | (10,214,029 | ) | | | (3,581,963 | ) | | | (31,261,839 | ) |
| | | | |
| NET DECREASE | | | (1,549,878 | ) | | $ | (15,674,474 | ) | | | (5,441,360 | ) | | $ | (47,072,671 | ) |
21
Report of Independent Registered Public Accounting Firm
To the Board of Trustees of
Goldman Sachs Variable Insurance Trust and Shareholders of Goldman Sachs Large Cap Value Fund
Opinion on the Financial Statements
We have audited the accompanying statement of assets and liabilities, including the schedule of investments, of Goldman Sachs Large Cap Value Fund (one of the funds constituting Goldman Sachs Variable Insurance Trust, referred to hereafter as the “Fund”) as of December 31, 2020, the related statement of operations for the year ended December 31, 2020, the statements of changes in net assets for each of the two years in the period ended December 31, 2020, including the related notes, and the financial highlights for each of the five years in the period ended December 31, 2020 (collectively referred to as the “financial statements”). In our opinion, the financial statements present fairly, in all material respects, the financial position of the Fund as of December 31, 2020, the results of its operations for the year then ended, the changes in its net assets for each of the two years in the period ended December 31, 2020 and the financial highlights for each of the five years in the period ended December 31, 2020 in conformity with accounting principles generally accepted in the United States of America.
Basis for Opinion
These financial statements are the responsibility of the Fund’s management. Our responsibility is to express an opinion on the Fund’s financial statements based on our audits. We are a public accounting firm registered with the Public Company Accounting Oversight Board (United States) (PCAOB) and are required to be independent with respect to the Fund in accordance with the U.S. federal securities laws and the applicable rules and regulations of the Securities and Exchange Commission and the PCAOB.
We conducted our audits of these financial statements in accordance with the standards of the PCAOB. Those standards require that we plan and perform the audit to obtain reasonable assurance about whether the financial statements are free of material misstatement, whether due to error or fraud.
Our audits included performing procedures to assess the risks of material misstatement of the financial statements, whether due to error or fraud, and performing procedures that respond to those risks. Such procedures included examining, on a test basis, evidence regarding the amounts and disclosures in the financial statements. Our audits also included evaluating the accounting principles used and significant estimates made by management, as well as evaluating the overall presentation of the financial statements. Our procedures included confirmation of securities owned as of December 31, 2020 by correspondence with the custodian, transfer agent and brokers. We believe that our audits provide a reasonable basis for our opinion.
/s/ PricewaterhouseCoopers LLP
Boston, Massachusetts
February 17, 2021
We have served as the auditor of one or more investment companies in the Goldman Sachs fund complex since 2000.
22
GOLDMAN SACHS VARIABLE INSURANCE TRUST LARGE CAP VALUE FUND
Voting Results of Special Meeting of Shareholders (Unaudited)
A Special Meeting (the “Meeting”) of the Goldman Sachs Variable Insurance Trust (“VIT”) was held on January 23, 2020 to consider and act upon the proposal below. The Fund has amortized its respective share of the proxy, shareholder meeting and other related costs and GSAM has agreed to reimburse the Fund to the extent such expenses exceed a specified percentage of the Fund’s net assets.
At the Meeting, Dwight L. Bush, Kathryn A. Cassidy, Joaquin Delgado and Gregory G. Weaver were elected to the Trust’s Board of Trustees. In electing trustees, the Trust’s shareholders voted as follows:
| | | | | | | | | | | | | | | | |
| | | | | |
Proposal 1. Election of Trustees | | For | | | Against | | | Withheld | | | Broker Non-Votes | |
| | | | | |
Dwight L. Bush | | | 745,493,677.130 | | | | 0 | | | | 17,848,840.639 | | | | 0 | |
| | | | | |
Kathryn A. Cassidy | | | 746,559,784.810 | | | | 0 | | | | 16,782,732.959 | | | | 0 | |
| | | | | |
Joaquin Delgado | | | 744,593,456.532 | | | | 0 | | | | 18,749,061.237 | | | | 0 | |
| | | | | |
Gregory G. Weaver | | | 746,707,039.321 | | | | 0 | | | | 16,635,478.448 | | | | 0 | |
23
GOLDMAN SACHS VARIABLE INSURANCE TRUST LARGE CAP VALUE FUND
| | |
| Fund Expenses — Six Month Period Ended December 31, 2020 (Unaudited) | | |
As a shareholder of Institutional or Service Shares of the Fund, you incur ongoing costs, including management fees, distribution and/or service (12b-1) fees (with respect to Service Shares) and other Fund expenses. This example is intended to help you understand your ongoing costs (in dollars) of investing in Institutional Shares and Service Shares of the Fund and to compare these costs with the ongoing costs of investing in other mutual funds.
The example is based on an investment of $1,000 invested at the beginning of the period and held for the entire period from July 1, 2020 through December 31, 2020, which represents a period of 184 days of a 366 day year.
Actual Expenses — The first line under each share class in the table below provides information about actual account values and actual expenses. You may use the information in this line, together with the amount you invested, to estimate the expenses that you paid over the period. Simply divide your account value by $1,000 (for example, an $8,600 account value divided by $1,000=8.6), then multiply the result by the number in the first line under the heading entitled “Expenses Paid” to estimate the expenses you paid on your account during this period.
Hypothetical Example for Comparison Purposes — The second line under each share class in the table below provides information about hypothetical account values and hypothetical expenses based on the Fund’s actual net expense ratio and an assumed rate of return of 5% per year before expenses, which is not the Fund’s actual return. The hypothetical account values and expenses may not be used to estimate the actual ending account balance or expenses you paid for the period. You may use this information to compare the ongoing costs of investing in the Fund and other funds. To do so, compare this 5% hypothetical example with the 5% hypothetical examples that appear in the shareholder reports of the other funds.
Please note that the expenses shown in the table are meant to highlight your ongoing costs only. As a shareholder of the Fund, you do not incur any transaction costs, such as sales charges, redemption fees, or exchange fees, but shareholders of other funds may incur such costs. The second line of the table is useful in comparing ongoing costs only and will not help you determine the relative total costs of owning different funds whose shareholders may incur transaction costs.
| | | | | | | | | | | | |
| Share Class | | Beginning
Account Value
07/01/20 | | | Ending
Account Value
12/31/20 | | | Expenses Paid
for the
6 Months
Ended
12/31/20* | |
| Institutional | | | | | | | | | | | | |
| | | | |
| Actual | | $ | 1,000 | | | $ | 1,226.70 | | | $ | 3.92 | |
| Hypothetical 5% return | | | 1,000 | | | | 1,021.62 | + | | | 3.56 | |
| Service | | | | | | | | | | | | |
| | | | |
| Actual | | | 1,000 | | | | 1,225.50 | | | | 5.20 | |
| Hypothetical 5% return | | | 1,000 | | | | 1,020.46 | + | | | 4.72 | |
| | + | Hypothetical expenses are based on the Fund’s actual annualized net expense ratios and an assumed rate of return of 5% per year before expenses. | |
| | * | Expenses are calculated using the Fund’s annualized net expense ratio for each class, which represents the ongoing expenses as a percentage of net assets for the six months ended December 31, 2020. Expenses are calculated by multiplying the annualized net expense ratio by the average account value for the period; then multiplying the result by the number of days in the most recent fiscal half year; and then dividing that result by the number of days in the fiscal year. The annualized net expense ratios for the period were 0.70% and 0.93% for Institutional and Service Shares, respectively. | |
24
GOLDMAN SACHS VARIABLE INSURANCE TRUST LARGE CAP VALUE FUND
Trustees and Officers (Unaudited)
Independent Trustees
| | | | | | | | | | | | |
| | | | | |
Name,
Address and Age1 | | Position(s) Held
with the Trust | | Term of Office and
Length of
Time Served2 | | Principal Occupation(s) During Past 5 Years | | Number of
Portfolios in
Fund Complex
Overseen by
Trustee3 | | | Other Directorships Held by Trustee4 |
Jessica Palmer Age: 71 | | Chair of the Board of Trustees | | Since 2018 (Trustee since 2007) | | Ms. Palmer is retired. She was formerly Consultant, Citigroup Human Resources Department (2007-2008); Managing Director, Citigroup Corporate and Investment Banking (previously, Salomon Smith Barney/Salomon Brothers) (1984-2006). Ms. Palmer was a Member of the Board of Trustees of Indian Mountain School (private elementary and secondary school) (2004-2009). Chair of the Board of Trustees — Goldman Sachs Variable Insurance Trust and Goldman Sachs Trust. | | | 105 | | | None |
Dwight L. Bush Age: 63 | | Trustee | | Since 2020 | | Ambassador Bush is President and CEO of D.L. Bush & Associates (a financial advisory and private investment firm) (2002-2014 and 2017-present); and was formerly U.S. Ambassador to the Kingdom of Morocco (2014-2017) and a Member of the Board of Directors of Santander Bank, N.A. (2018-2019). Previously, Ambassador Bush served as an Advisory Board Member of Goldman Sachs Trust and Goldman Sachs Variable Insurance Trust (October 2019-January 2020). Trustee — Goldman Sachs Variable Insurance Trust and Goldman Sachs Trust. | | | 105 | | | None |
Kathryn A. Cassidy Age: 66 | | Trustee | | Since 2015 | | Ms. Cassidy is retired. Formerly, she was Advisor to the Chairman (May 2014-December 2014); and Senior Vice President and Treasurer (2008-2014), General Electric Company & General Electric Capital Corporation (technology and financial services companies). Trustee — Goldman Sachs Variable Insurance Trust and Goldman Sachs Trust. | | | 105 | | | None |
Diana M. Daniels Age: 71 | | Trustee | | Since 2007 | | Ms. Daniels is retired. Formerly, she was Vice President, General Counsel and Secretary, The Washington Post Company (1991-2006). Ms. Daniels is a Trustee Emeritus and serves as a Presidential Councillor of Cornell University (2013-Present); former Member of the Legal Advisory Board, New York Stock Exchange (2003-2006) and of the Corporate Advisory Board, Standish Mellon Management Advisors (2006-2007). Trustee — Goldman Sachs Variable Insurance Trust and Goldman Sachs Trust. | | | 105 | | | None |
Joaquin Delgado Age: 60 | | Trustee | | Since 2020 | | Dr. Delgado is retired. He is Director, Hexion Inc. (a specialty chemical manufacturer) (2019-present); and Director, Stepan Company (a specialty chemical manufacturer) (2011-present); and was formerly Executive Vice President, Consumer Business Group of 3M Company (July 2016-July 2019); and Executive Vice President, Health Care Business Group of 3M Company (October 2012-July 2016). Previously, Dr. Delgado served as an Advisory Board Member of Goldman Sachs Trust and Goldman Sachs Variable Insurance Trust (October 2019-January 2020). Trustee — Goldman Sachs Variable Insurance Trust and Goldman Sachs Trust. | | | 105 | | | Stepan Company (a specialty chemical manufacturer) |
| | | | | | | | | | | | |
25
GOLDMAN SACHS VARIABLE INSURANCE TRUST LARGE CAP VALUE FUND
Trustees and Officers (Unaudited) (continued)
Independent Trustees
| | | | | | | | | | | | |
| | | | | |
Name,
Address and Age1 | | Position(s) Held
with the Trust | | Term of Office and
Length of
Time Served2 | | Principal Occupation(s) During Past 5 Years | | Number of
Portfolios in
Fund Complex
Overseen by
Trustee3 | | | Other Directorships Held by Trustee4 |
Roy W. Templin Age: 60 | | Trustee | | Since 2013 | | Mr. Templin is retired. He is Director, Armstrong World Industries, Inc. (a designer and manufacturer of ceiling, wall and suspension system solutions) (2016-Present); and was formerly Chairman of the Board of Directors, Con-Way Incorporated (a transportation, logistics and supply chain management service company) (2014-2015); Executive Vice President and Chief Financial Officer, Whirlpool Corporation (an appliance manufacturer and marketer) (2004-2012). Trustee — Goldman Sachs Variable Insurance Trust and Goldman Sachs Trust. | | | 105 | | | Armstrong World Industries, Inc. (a ceiling, wall and suspension systems solutions manufacturer) |
Gregory G. Weaver Age: 69 | | Trustee | | Since 2015 | | Mr. Weaver is retired. He is Director, Verizon Communications Inc. (2015-Present); and was formerly Chairman and Chief Executive Officer, Deloitte & Touche LLP (a professional services firm) (2001-2005 and 2012-2014); and Member of the Board of Directors, Deloitte & Touche LLP (2006-2012). Trustee — Goldman Sachs Variable Insurance Trust and Goldman Sachs Trust. | | | 105 | | | Verizon Communications Inc. |
26
GOLDMAN SACHS VARIABLE INSURANCE TRUST LARGE CAP VALUE FUND
Trustees and Officers (Unaudited) (continued)
Interested Trustee*
| | | | | | | | | | | | |
| | | | | |
Name,
Address and Age1 | | Position(s) Held
with the Trust | | Term of Office and
Length of
Time Served2 | | Principal Occupation(s) During Past 5 Years | | Number of
Portfolios in
Fund Complex
Overseen by
Trustee3 | | | Other Directorships Held by Trustee4 |
James A. McNamara Age: 58 | | Trustee and President | | Since 2007 | | Advisory Director, Goldman Sachs (January 2018-Present); Managing Director, Goldman Sachs (January 2000-December 2017); Director of Institutional Fund Sales, GSAM (April 1998-December 2000); and Senior Vice President and Manager, Dreyfus Institutional Service Corporation (January 1993-April 1998). President and Trustee — Goldman Sachs Variable Insurance Trust; Goldman Sachs Trust; Goldman Sachs Trust II; Goldman Sachs MLP and Energy Renaissance Fund; Goldman Sachs ETF Trust; Goldman Sachs Credit Income Fund; and Goldman Sachs Real Estate Diversified Income Fund. | | | 158 | | | None |
| | | | | | | | | | | | |
| * | Mr. McNamara is considered to be an “Interested Trustee” because he holds positions with Goldman Sachs and owns securities issued by The Goldman Sachs Group, Inc. Mr. McNamara holds comparable positions with certain other companies of which Goldman Sachs, GSAM or an affiliate thereof is the investment adviser, administrator and/or distributor. |
| 1 | Each Trustee may be contacted by writing to the Trustee, c/o Goldman Sachs, 200 West Street, New York, New York, 10282, Attn: Caroline Kraus. Information is provided as of December 31, 2020. |
| 2 | Subject to such policies as may be adopted by the Board from time-to-time, each Trustee holds office for an indefinite term, until the earliest of: (a) the election of his or her successor; (b) the date the Trustee resigns or is removed by the Board or shareholders, in accordance with the Trust’s Declaration of Trust; or (c) the termination of the Trust. The Board has adopted policies which provide that each Independent Trustee shall retire as of December 31st of the calendar year in which he or she reaches (a) his or her 75th birthday or (b) the 15th anniversary of the date he or she became a Trustee, whichever is earlier, unless a waiver of such requirements shall have been adopted by a majority of the other Trustees. These policies may be changed by the Trustees without shareholder vote. |
| 3 | The Goldman Sachs Fund Complex includes certain other companies listed above for each respective Trustee. As of December 31, 2020, Goldman Sachs Variable Insurance Trust consisted of 13 portfolios; Goldman Sachs Trust consisted of 92 portfolios (90 of which offered shares to the public); Goldman Sachs Trust II consisted of 19 portfolios (17 of which offered shares to the public); Goldman Sachs ETF Trust consisted of 31 portfolios (20 of which offered shares to the public); and Goldman Sachs MLP and Energy Renaissance Fund, Goldman Sachs Credit Income Fund and Goldman Sachs Real Estate Diversified Income Fund each consisted of one portfolio. Goldman Sachs Credit Income Fund did not offer shares to the public. |
| 4 | This column includes only directorships of companies required to report to the Securities and Exchange Commission under the Securities Exchange Act of 1934 (i.e., “public companies”) or other investment companies registered under the Act. |
Additional information about the Trustees is available in the Fund’s Statement of Additional Information, which can be obtained from Goldman Sachs free of charge by calling this toll-free number (in the United States of America): 1-800-526-7384.
27
GOLDMAN SACHS VARIABLE INSURANCE TRUST LARGE CAP VALUE FUND
Trustees and Officers (Unaudited) (continued)
Officers of the Trust*
| | | | | | |
| | | |
| Name, Address and Age1 | | Position(s) Held with the Trust | | Term of
Office and
Length of
Time Served2 | | Principal Occupation(s) During Past 5 Years |
James A. McNamara
200 West Street New York, NY 10282 Age: 58 | | Trustee and
President | | Since 2007 | | Advisory Director, Goldman Sachs (January 2018-Present); Managing Director, Goldman Sachs (January 2000-December 2017); Director of Institutional Fund Sales, GSAM (April 1998-December 2000); and Senior Vice President and Manager, Dreyfus Institutional Service Corporation (January 1993-April 1998). President and Trustee — Goldman Sachs Variable Insurance Trust; Goldman Sachs Trust; Goldman Sachs Trust II; Goldman Sachs MLP and Energy Renaissance Fund; Goldman Sachs ETF Trust; Goldman Sachs Credit Income Fund; and Goldman Sachs Real Estate Diversified Income Fund. |
Caroline L. Kraus
200 West Street New York, NY 10282 Age: 43 | | Secretary | | Since 2012 | | Managing Director, Goldman Sachs (January 2016-Present); Vice President, Goldman Sachs (August 2006-December 2015); Senior Counsel, Goldman Sachs (January 2020-Present); Associate General Counsel, Goldman Sachs (2012-December 2019); Assistant General Counsel, Goldman Sachs (August 2006-December 2011); and Associate, Weil, Gotshal & Manges, LLP (2002-2006). Secretary — Goldman Sachs Variable Insurance Trust (previously Assistant Secretary (2012)); Goldman Sachs Trust (previously Assistant Secretary (2012)); Goldman Sachs Trust II; Goldman Sachs BDC, Inc.; Goldman Sachs Private Middle Market Credit LLC; Goldman Sachs Private Middle Market Credit II LLC; Goldman Sachs Middle Market Lending Corp.; Goldman Sachs MLP and Energy Renaissance Fund; Goldman Sachs ETF Trust; Goldman Sachs Credit Income Fund; and Goldman Sachs Real Estate Diversified Income Fund. |
Joseph F. DiMaria
30 Hudson Street Jersey City, NJ 07302 Age: 52 | | Treasurer, Principal
Financial Officer
and Principal
Accounting Officer | | Since 2017
(Treasurer
and Principal
Financial
Officer
since 2019) | | Managing Director, Goldman Sachs (November 2015-Present) and Vice President — Mutual Fund Administration, Columbia Management Investment Advisers, LLC (May 2010-October 2015). Treasurer, Principal Financial Officer and Principal Accounting Officer — Goldman Sachs Variable Insurance Trust (previously Assistant Treasurer (2016)); Goldman Sachs Trust (previously Assistant Treasurer (2016)); Goldman Sachs Trust II (previously Assistant Treasurer (2017)); Goldman Sachs MLP and Energy Renaissance Fund (previously Assistant Treasurer (2017)); Goldman Sachs ETF Trust (previously Assistant Treasurer (2017)); Goldman Sachs Credit Income Fund; and Goldman Sachs Real Estate Diversified Income Fund. |
| * | Represents a partial list of officers of the Trust. Additional information about all the officers is available in the Fund’s Statement of Additional Information, which can be obtained from Goldman Sachs free of charge by calling this toll-free number (in the United States): 1-800-526-7384. |
| 1 | Information is provided as of December 31, 2020. |
| 2 | Officers hold office at the pleasure of the Board of Trustees or until their successors are duly elected and qualified. Each officer holds comparable positions with certain other companies of which Goldman Sachs, GSAM or an affiliate thereof is the investment adviser, administrator and/or distributor. |
Goldman Sachs Variable Insurance Trust — Tax Information (Unaudited)
For the year ended December 31, 2020, 100% of the dividends paid from net investment company taxable income by the Large Cap Value Fund qualify for the dividends received deduction available to corporations.
Pursuant to Section 852 of the Internal Revenue Code, the Large Cap Value Fund designates $7,804,739 or, if different, the maximum amount allowable, as capital gain dividends paid during the fiscal year ended December 31, 2020.
28
| | |
| TRUSTEES | | OFFICERS James A. McNamara, President Joseph F. DiMaria, Principal Financial Officer, Principal Accounting Officer and Treasurer Caroline L. Kraus, Secretary |
| Jessica Palmer, Chair |
| Dwight L. Bush |
| Kathryn A. Cassidy |
| Diana M. Daniels |
| Joaquin Delgado |
| James A. McNamara |
| Roy W. Templin | | |
| Gregory G. Weaver | | |
GOLDMAN SACHS & CO. LLC
Distributor and Transfer Agent
GOLDMAN SACHS ASSET MANAGEMENT, L.P.
Investment Adviser
200 West Street, New York
New York 10282
Visit our web site at www.GSAMFUNDS.com to obtain the most recent month-end returns.
The reports concerning the Fund included in this shareholder report may contain certain forward-looking statements about the factors that may affect the performance of the Fund in the future. These statements are based on Fund management’s predictions and expectations concerning certain future events and their expected impact on the Fund, such as performance of the economy as a whole and of specific industry sectors, changes in the levels of interest rates, the impact of developing world events, and other factors that may influence the future performance of the Fund. Management believes these forward-looking statements to be reasonable, although they are inherently uncertain and difficult to predict. Actual events may cause adjustments in portfolio management strategies from those currently expected to be employed.
A description of the policies and procedures that the Fund uses to determine how to vote proxies relating to portfolio securities and information regarding how the Fund voted proxies relating to portfolio securities for the 12-month period ended December 31, is available (i) without charge, upon request by calling 1-800-621-2550; and (ii) on the Securities and Exchange Commission (“SEC”) web site at http://www.sec.gov.
The Fund will file its portfolio holdings information for each month in a fiscal quarter within 60 days after the end of the relevant fiscal quarter on Form N-PORT. Portfolio holdings information for the third month of each fiscal quarter will be made available on the SEC’s web site at http://www.sec.gov. Portfolio holdings information may be obtained upon request and without charge by calling 1-800-526-7384 (for Retail Shareholders) or 1-800-621-2550 (for Institutional Shareholders).
Views and opinions expressed are for informational purposes only and do not constitute a recommendation by GSAM to buy, sell, or hold any security. Views and opinions are current as of the date of this presentation and may be subject to change, they should not be construed as investment advice.
Goldman Sachs & Co. LLC (“Goldman Sachs”) does not provide legal, tax or accounting advice. Any statement contained in this communication (including any attachments) concerning U.S. tax matters was not intended or written to be used, and cannot be used, for the purpose of avoiding penalties under the Internal Revenue Code, and was written to support the promotion or marketing of transaction or matter addressed. Clients of Goldman Sachs should obtain their own independent tax advice based on their particular circumstances.
The website links provided are for your convenience only and are not an endorsement or recommendation by GSAM of any of these websites or the products or services offered. GSAM is not responsible for the accuracy and validity of the content of these websites.
Fund holdings and allocations shown are as of December 31, 2020 and may not be representative of future investments. Fund holdings should not be relied on in making investment decisions and should not be construed as research or investment advice regarding particular securities. Current and future holdings are subject to risk.
References to indices, benchmarks or other measures of relative market performance over a specified period of time are provided for your information only and do not imply that the portfolio will achieve similar results. The index composition may not reflect the manner in which a portfolio is constructed. While an adviser seeks to design a portfolio which reflects appropriate risk and return features, portfolio characteristics may deviate from those of the benchmark.
The Global Industry Classification Standard (“GICS”) was developed by and is the exclusive property and a service mark of Morgan Stanley Capital International Inc. (“MSCI”) and Standard & Poor’s, a division of The McGraw-Hill Companies, Inc. (“S&P”) and is licensed for use by Goldman Sachs. Neither MSCI, S&P nor any other party involved in making or compiling the GICS or any GICS classifications makes any express or implied warranties or representations with respect to such standard or classification (or the results to be obtained by the use thereof), and all such parties hereby expressly disclaim all warranties of originality, accuracy, completeness, merchantability or fitness for a particular purpose with respect to any of such standard or classification. Without limiting any of the foregoing, in no event shall MSCI, S&P, any of their affiliates or any third party involved in making or compiling the GICS or any GICS classifications have any liability for any direct, indirect, special, punitive, consequential or any other damages (including lost profits) even if notified of the possibility of such damages.
The portfolio risk management process includes an effort to monitor and manage risk, but does not imply low risk.
Shares of the Goldman Sachs VIT Funds are offered to separate accounts of participating life insurance companies for the purpose of funding variable annuity contracts and variable life insurance policies. Shares of the Fund are not offered directly to the general public. The variable annuity contracts and variable life insurance policies are described in the separate prospectuses issued by participating insurance companies. You should refer to those prospectuses for information about surrender charges, mortality and expense risk fees and other charges that may be assessed by participating insurance companies under the variable annuity contracts or variable life insurance policies. Such fees or charges, if any, may affect the return you may realize with respect to your investments. Ask your representative for more complete information. Please consider a fund’s objectives, risks and charges and expenses, and read the prospectus carefully before investing. The prospectus contains this and other information about the Fund.
This material is not authorized for distribution to prospective investors unless preceded or accompanied by a current prospectus or summary prospectus, if applicable. Investors should consider the Fund’s objective, risks, and charges and expenses, and read the summary prospectus, if available, and/or the prospectus carefully before investing or sending money. The summary prospectus, if available, and the prospectus contain this and other information about the Fund and may be obtained from your authorized dealer or from Goldman Sachs & Co. LLC by calling 1-800-621-2550.
This report is prepared for the general information of contract owners and is not an offer of shares of the Goldman Sachs Variable Insurance Trust — Goldman Sachs Large Cap Value Fund.
© 2021 Goldman Sachs. All rights reserved.
VITLCVAR-21 229744-OTU-1350837
Goldman
Sachs Variable Insurance Trust
Goldman Sachs
Mid Cap Value Fund
Beginning on or after January 1, 2021, you may not receive paper copies of the Fund’s annual and semi-annual shareholder reports from the insurance company that offers your variable insurance contract or your financial intermediary, unless you specifically request paper copies of the reports from the insurance company or from your financial intermediary. Instead, the reports will be made available on a website, and you will be notified by mail each time a report is posted and provided with a website link to access the report.
If you already elected to receive shareholder reports electronically, you will not be affected by this change and you need not take any action. At any time, you may elect to receive reports and certain communications from the insurance company electronically by contacting your insurance company or your financial intermediary.
You may elect to receive all future shareholder reports in paper free of charge. You can inform the insurance company or your financial intermediary that you wish to receive paper copies of reports. Your election to receive reports in paper will apply to all Goldman Sachs Funds available under your contract and may apply to all funds held with your financial intermediary.
Annual Report
December 31, 2020

GOLDMAN SACHS VARIABLE INSURANCE TRUST MID CAP VALUE FUND
INVESTMENT OBJECTIVE
The Fund seeks long-term capital appreciation.
Portfolio Management Discussion and Analysis
Below, the Goldman Sachs Value Portfolio Management Team discusses the Goldman Sachs Variable Insurance Trust — Goldman Sachs Mid Cap Value Fund’s (the “Fund”) performance and positioning for the 12-month period ended December 31, 2020 (the “Reporting Period”).
How did the Fund perform during the Reporting Period?
During the Reporting Period, the Fund’s Institutional and Service Shares generated average annual total returns of 8.38% and 8.17%, respectively. These returns compare to the 4.95% average annual total return of the Fund’s benchmark, the Russell Midcap® Value Index (with dividends reinvested) (the “Russell Index”), during the same time period.
What economic and market factors most influenced the equity markets as a whole during the Reporting Period?
Representing the U.S. equity market, the S&P 500® Index returned 18.34% during the Reporting Period.
The U.S. equity market fell significantly in the first quarter of 2020, selling off as the outbreak and subsequent spread of COVID-19 caused non-essential businesses to close. Jobless claims increased to 6.6 million, and nonfarm payrolls decreased by 701,000 for the month of March, leading the U.S. government to respond with aggressive economic stimulus and the U.S. Federal Reserve (the “Fed”) to respond with unprecedented monetary policy stimulus, including lowering its targeted federal funds rate to zero and re-introducing and expanding its quantitative easing programs. Exacerbating matters was oil prices that fell as supply increased and demand decreased.
After hitting a low on March 23, 2020, the U.S. equity market then rose in the subsequent three quarters of 2020. In the second calendar quarter, the U.S. equity market appreciated despite a surge in COVID-19 cases in regional pockets of the country, causing local governments to pause reopening plans and revisit previous lockdown measures. Positive market sentiment was buoyed by better than consensus expected economic data, such as nonfarm payrolls increasing 7.3 million during May and June 2020, driving the unemployment rate down to 11.1% from 14.7% in April. The U.S. equity markets continued to rally in the third quarter of 2020 despite ongoing pressure from the pandemic. Market strength was supported by a sharp cyclical recovery in economic data, with the Institute for Supply Management’s Manufacturing Purchasing Managers’ Index increasing to 56.0 in August, which is firmly in expansionary territory. Optimism around a potential COVID-19 vaccine also helped support equity markets during the quarter. Still, risks to the market persisted given political uncertainty ahead of the November 2020 U.S. elections, lower levels of Gross Domestic Product, heightened unemployment, questions around how quickly and effectively a vaccine could be distributed, and debates about the extent of a new stimulus package from the federal government. In the fourth quarter of 2020, U.S. stocks extended a broad-based recovery from their steep first quarter declines. Markets rallied on the prospect of an end to the global pandemic and its economic impact with approval and distribution of COVID-19 vaccines. While uncertainty surrounding the then-upcoming U.S. elections and other policy questions created the potential for higher market volatility, the Democratic victory of Joe Biden proved positive for equity markets over the near term. Also, after a historically sharp but short recession during the spring of 2020, many major economies, including that of the U.S., in our view, entered an early-cycle phase of recovery. Employment conditions improved, as temporary job losses were regained in some segments of the economy, and U.S. manufacturing activity recovered. Despite this improvement, reminders of a COVID-19 ceiling for industries hit hardest by the restrictions caused by the pandemic persisted.
For the Reporting Period overall, eight of the 11 sectors in the S&P 500® Index posted positive absolute returns, with seven of those eight generating double-digit gains. Information technology, consumer discretionary and communication services were the best performing sectors in the S&P 500® Index, as measured by total return, while the weakest performing sectors in the S&P 500® Index during the Reporting Period were energy, real estate and financials.
Within the U.S. equity market, all capitalization segments posted double-digit positive returns, led by large-cap stocks, as measured by the Russell 1000® Index, followed closely by small-cap stocks, as measured by the Russell 2000® Index, and then by mid-cap stocks, as measured by the Russell Midcap® Index. From a style perspective, growth-oriented stocks significantly outpaced value-oriented stocks across the capitalization spectrum. (All as measured by the FTSE Russell indices.)
1
GOLDMAN SACHS VARIABLE INSURANCE TRUST MID CAP VALUE FUND
What key factors were responsible for the Fund’s performance during the Reporting Period?
The Fund posted solid absolute gains that outperformed the Russell Index during the Reporting Period due primarily to stock selection overall. Sector allocation as a whole also contributed positively to the Fund’s performance relative to the Russell Index during the Reporting Period.
Which equity market sectors most significantly affected Fund performance?
Contributing most positively to the Fund’s relative results during the Reporting Period was effective stock selection in the utilities, information technology and consumer staples sectors. Only one sector detracted from the Fund’s relative results during the Reporting Period — financials, wherein stock selection proved especially challenging.
What were some of the Fund’s best-performing individual stocks?
The Fund benefited most relative to the Russell Index from positions in RH, Marvell Technology Group and Match Group.
A new purchase for the Fund during the Reporting Period, high-end home furnishings company RH saw its share price perform well throughout the Reporting Period, as the pandemic caused more people to work from home, which, in turn, led to greater investments in home improvement projects. RH’s higher-end clientele also proved resilient during the Reporting Period. At the end of the Reporting Period, we remained optimistic about RH given what we view as de-urbanization trends and heightened levels of investment in homes. We were also positive on the company management’s goals to continue investing in the business throughout 2021, potentially driving international growth.
Marvell Technology Group is a semiconductor company. After a slight drop in its share price due to the COVID-19-driven global economic shutdown, Marvell Technology Group benefited from solid trends in fifth-generation (“5G”) technology deployment, strong design win momentum and storage gains within the cloud. At the end of the Reporting Period, we continued to like Marvell Technology Group given what we view as its long-term secular growth trends as well as the possibility for share buybacks following an extended period of deleveraging. We also believe the company’s exposure to China could help mitigate any geopolitical tensions better than some of its peers.
Online dating services company Match Group was a new purchase for the Fund during the Reporting Period. Its shares benefited from a series of earnings reports during the Reporting Period that featured solid revenue and subscription growth. As in-person dating was limited due to the COVID-19 pandemic, virtual dating services saw an increase in demand. At the end of the Reporting Period, we remained confident in the company’s increased subscription base in both Tinder and non-Tinder applications and in its expanded product pipeline to drive near-term growth.
Which stocks detracted significantly from the Fund’s performance during the Reporting Period?
Detracting from the Fund’s results relative to the Russell Index were positions in MFA Financials, L Brands and Ryman Hospitality Properties.
MFA Financial is a mortgage real estate investment trust (“REIT”). Prior to the outbreak of the COVID-19 pandemic, the Fund was overweight residential mortgage credit within the mortgage REIT universe given what we saw as the health of the consumer and of home prices. However, during just a few trading days in late March 2020, investors fled to perceived safety and sold out of companies holding non-government-backed securities. The significant drop in value of these securities, especially the speed of the dislocation, threatened mortgage REITs and their ability to meet margin calls. (A margin call occurs when the value of an investor’s margin account falls below the broker’s required amount. An investor’s margin account contains securities bought with borrowed money.) Given our belief that the margin calls had created a situation wherein value was permanently impaired, we sold the Fund’s position in MFA Financial.
Shares of retail apparel company L Brands declined as the COVID-19 pandemic forced stores to close. While we were optimistic about its management’s efforts to maintain liquidity during the pandemic, we ultimately decided to exit the position in April 2020 in favor of what we considered to be better risk/reward prospects elsewhere.
Ryman Hospitality Properties is a REIT that specializes in group-oriented and destination hotel assets in urban and resort markets. Its shares came under significant pressure in March 2020 after the company was forced to shut down its hotels due to COVID-19. As of June 2020, the company started reopening its major hotels and indicated that its management was encouraged by the level of bookings for the summer. However, we decided to exit the position in November 2020, as we believed its risk/reward profile looked less attractive following an approximately 190% total return in its stock following its 2020 low on March 18, 2020.
2
GOLDMAN SACHS VARIABLE INSURANCE TRUST MID CAP VALUE FUND
How did the Fund use derivatives and similar instruments during the Reporting Period?
During the Reporting Period, we did not use derivatives as part of an active management strategy.
Did the Fund make any significant purchases or sales during the Reporting Period?
In addition to the purchases already mentioned, we initiated a Fund position in SVB Financial Group, a west coast bank focused primarily on lending to technology-based companies. We believe SVB Financial Group is an attractive investment opportunity given its long-standing relationships in the technology, health sciences, private equity and venture capital industries. We view these relationships as beneficial to potentially driving outsized loan and deposit growth relative to its peers. Additionally, we are optimistic that SVB Financial Group has altered its risk profile to be less exposed to early stage companies.
We established a Fund position in United Airlines during the Reporting Period. We are optimistic about United Airlines’ management team given its actions to improve liquidity during the COVID-19 pandemic, which allowed the company to invest in its business more than some of its peers thus far. We also believe United Airlines may well be a significant beneficiary of COVID-19 vaccines given pent-up demand for travel.
Conversely, in addition to those sales mentioned earlier, we exited the Fund’s position in Royal Caribbean Cruises during the Reporting Period. Its shares declined sharply in tandem with the broader U.S. equity market sell-off, as the spread of COVID-19 intensified and forced travelers to shelter in place. Based on our belief that cruise lines will likely have an extended recovery timeline relative to other travel-related companies, we decided to sell the position.
We eliminated the Fund’s position in Agilent Technologies, a life sciences, diagnostics and applied chemicals company. While we continue to like the company’s long-term prospects, following significant strong performance of its stock relative to its peers, we decided to exit the position in favor of what we saw as better risk/reward opportunities elsewhere.
Were there any notable changes in the Fund’s weightings during the Reporting Period?
In constructing the Fund’s portfolio, we focus on picking stocks rather than on making industry or sector bets. We seek to outpace the benchmark index by overweighting stocks that we expect to outperform and underweighting those that we think may lag. Consequently, changes in its sector weights are generally the direct result of individual stock selection or of stock appreciation or depreciation. That said, during the Reporting Period, the Fund’s exposure to financials, consumer discretionary, real estate and utilities increased and its exposure to industrials, information technology and materials decreased compared to the Russell Index. The Fund’s position in cash also decreased during the Reporting Period.
How was the Fund positioned relative to its benchmark index at the end of the Reporting Period?
At the end of December 2020, the Fund had overweighted positions relative to the Russell Index in consumer staples. On the same date, the Fund had underweighted positions compared to the Russell Index in industrials, and energy and was rather neutrally weighted to the Russell Index in financials, real estate, consumer discretionary, information technology, utilities, health care, materials and communication services.
Were there any changes to the Fund’s portfolio management team during the Reporting Period?
There were no changes to the Fund’s portfolio management team during the Reporting Period.
What is the Fund’s tactical view and strategy for the months ahead?
The U.S. equity markets rebounded from pandemic-induced lows in the first quarter of 2020 to round out the calendar year with multiple tailwinds from pent-up demand to significant cash reserves. As the markets anticipated an economic recovery alongside the rollout of the COVID-19 vaccines, we remained vigilant at the end of the Reporting Period in navigating through optimistic market sentiment given the potential for volatility. While we see a path to an uptick in global economic activity to support further market upside, we simultaneously caution that the economy remains in the infancy of its recovery, and uneven progress suggests that full macroeconomic normalization may well remain dependent on the trajectory of COVID-19 recovery, successful global vaccine distribution and inoculation, and ongoing fiscal and monetary policy. As the economic expansion widens, we expected, at the end of the Reporting Period, the U.S. equity market rally to continue but with broader sector participation. Within this recovery period, we believe it is crucial to stay true to our quality-first investment approach, seeking to invest in businesses with healthy balance sheets, relatively stable free cash flow generation, and differentiated business models aligned to secular advantages.
Indeed, regardless of market direction, we remain committed to our core philosophy and process. We intend to maintain a long-term time horizon, rather than forecast the next quarter. As always, we maintain our focus on undervalued companies that we believe have comparatively greater control of their own destiny, such as innovators with differentiated products, companies with low cost structures or companies that have been investing in their own businesses and may be poised to gain market share.
3
GOLDMAN SACHS VARIABLE INSURANCE TRUST MID CAP VALUE FUND
Index Definitions
The Russell Midcap Value® Index is an unmanaged index of common stock prices that measures the performance of those Russell Midcap companies with lower price-to-book ratios and lower forecasted growth values. The index figures do not reflect any deduction for fees, expenses or taxes.
The Russell 2000® Index is an unmanaged index of common stock prices that measures the performance of the 2000 smallest companies in the Russell 3000® Index. The figures for the index do not include any deduction for fees, expenses or taxes.
The S&P 500® Index is the Standard & Poor’s composite index of 500 stocks, an unmanaged index of common stock prices. The figures for the index do not include any deduction for fees, expenses or taxes.
The Russell Midcap® Index measures the performance of the 800 smallest companies in the Russell 1000® Index, which represent approximately 25% of the total market capitalization of the Russell 1000® Index.
The Russell 1000® Index measures the performance of the 1,000 largest companies in the Russell 3000® Index, which represent approximately 92% of the total market capitalization of the Russell 3000® Index.
It is not possible to invest directly in an index.
4
FUND BASICS
Mid Cap Value Fund
as of December 31, 2020
TOP TEN HOLDINGS AS OF 12/31/201
| | | | | | |
| | |
| Holding | | % of Net Assets | | | Line of Business |
| Zimmer Biomet Holdings, Inc. | | | 2.0% | | | Health Care Equipment & Services |
| AMETEK, Inc. | | | 1.9 | | | Capital Goods |
| Marvell Technology Group Ltd. | | | 1.8 | | | Semiconductors & Semiconductor Equipment |
| ITT, Inc. | | | 1.7 | | | Capital Goods |
| Corteva, Inc. | | | 1.6 | | | Materials |
| SVB Financial Group | | | 1.6 | | | Banks |
| Aptiv plc | | | 1.6 | | | Automobiles & Components |
| United Airlines Holdings, Inc. | | | 1.5 | | | Transportation |
| Discover Financial Services | | | 1.4 | | | Diversified Financials |
| M&T Bank Corp. | | | 1.4 | | | Banks |
| 1 | The top 10 holdings may not be representative of the Fund’s future investments. |
FUND vs. BENCHMARK SECTOR ALLOCATIONS2
As of December 31, 2020
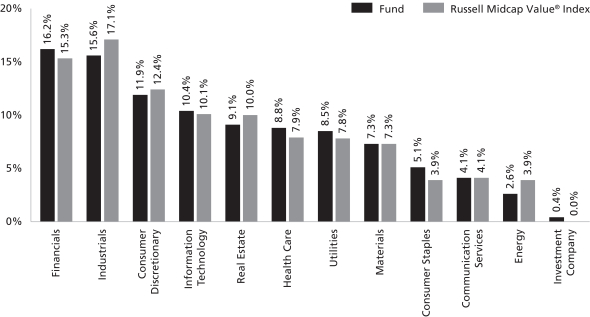
| 2 | The Fund is actively managed and, as such, its composition may differ over time. Consequently, the Fund’s overall sector allocations may differ from percentages contained in the graph above. The graph categorizes investments using Global Industry Classification Standard (“GICS”); however, the sector classifications used by the portfolio management team may differ from GICS. The percentage shown for each investment category reflects the value of investments in that category as a percentage of market value (excluding investments in the securities lending reinvestment vehicle, if any). Underlying sector allocations of exchange traded funds and investment companies held by the Fund are not reflected in the graph above. Investments in the securities lending reinvestment vehicle represented 0.3% of the Fund’s net assets at December 31, 2020. |
For more information about your Fund, please refer to www.GSAMFUNDS.com. There, you can learn more about your Fund’s investment strategies, holdings, and performance.
5
GOLDMAN SACHS VARIABLE INSURANCE TRUST MID CAP VALUE FUND
Performance Summary
December 31, 2020
The following graph shows the value, as of December 31, 2020, of a $10,000 investment made on January 1, 2011 in Institutional Shares at NAV. For comparative purposes, the performance of the Fund’s benchmark, the Russell Midcap Value® Index (with distributions reinvested), is shown. Performance reflects applicable fee waivers and/or expense limitations in effect during the periods shown and in their absence, performance would be reduced. Returns do not reflect the deduction of taxes that a shareholder would pay on Fund distributions or the redemption of Fund shares. The returns set forth below represent past performance. Past performance does not guarantee future results. The Fund’s investment return and principal value will fluctuate so that an investor’s shares, when redeemed, may be worth more or less than their original cost. Current performance may be lower or higher than the performance quoted below. Please visit our web site at www.GSAMFUNDS.com to obtain the most recent month-end returns.
Mid Cap Value Fund’s 10 Year Performance
Performance of a $10,000 investment, with distributions reinvested, from January 1, 2011 through December 31, 2020.
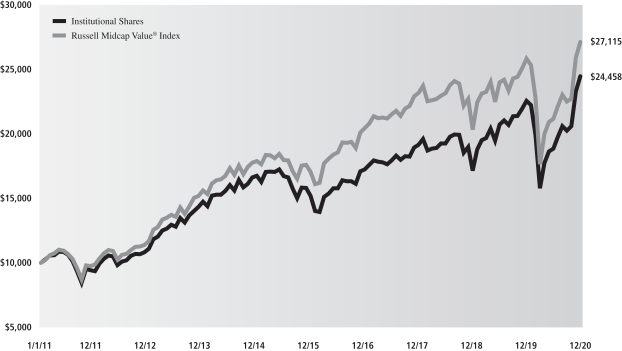
| | | | | | |
| Average Annual Total Return through December 31, 2020 | | One Year | | Five Years | | Ten Years |
Institutional | | 8.38% | | 9.98% | | 9.35% |
Service | | 8.17% | | 9.73% | | 9.08% |
6
GOLDMAN SACHS VARIABLE INSURANCE TRUST MID CAP VALUE FUND
Schedule of Investments
December 31, 2020
| | | | | | | | |
| Shares | | | Description | | Value | |
|
| Common Stocks – 99.6% | |
| Automobiles & Components – 1.6% | |
| | 58,239 | | | Aptiv plc | | $ | 7,587,959 | |
| | |
| Banks – 6.4% | |
| | 103,858 | | | East West Bancorp, Inc. | | | 5,266,639 | |
| | 19,740 | | | First Republic Bank | | | 2,900,398 | |
| | 54,293 | | | M&T Bank Corp. | | | 6,911,499 | |
| | 87,007 | | | Pinnacle Financial Partners, Inc. | | | 5,603,251 | |
| | 18,327 | | | Signature Bank | | | 2,479,460 | |
| | 20,275 | | | SVB Financial Group* | | | 7,863,253 | |
| | | | | | | | |
| | | | | | | 31,024,500 | |
| | |
| Capital Goods – 12.8% | |
| | 77,940 | | | AMETEK, Inc. | | | 9,426,064 | |
| | 27,616 | | | Cummins, Inc. | | | 6,271,594 | |
| | 88,161 | | | Fastenal Co. | | | 4,304,902 | |
| | 92,574 | | | Fortive Corp. | | | 6,556,091 | |
| | 82,571 | | | Graco, Inc. | | | 5,974,012 | |
| | 19,265 | | | IDEX Corp. | | | 3,837,588 | |
| | 106,778 | | | ITT, Inc. | | | 8,224,041 | |
| | 14,204 | | | L3Harris Technologies, Inc. | | | 2,684,840 | |
| | 22,497 | | | Rockwell Automation, Inc. | | | 5,642,472 | |
| | 12,606 | | | Stanley Black & Decker, Inc. | | | 2,250,927 | |
| | 26,115 | | | Trane Technologies plc | | | 3,790,853 | |
| | 5,676 | | | TransDigm Group, Inc.* | | | 3,512,593 | |
| | | | | | | | |
| | | | | | | 62,475,977 | |
| | |
| Consumer Durables & Apparel – 2.5% | |
| | 64,701 | | | Brunswick Corp. | | | 4,932,805 | |
| | 69,154 | | | Capri Holdings Ltd.* | | | 2,904,468 | |
| | 57,714 | | | Lennar Corp. Class A | | | 4,399,538 | |
| | | | | | | | |
| | | | | | | 12,236,811 | |
| | |
| Consumer Services – 3.0% | |
| | 78,825 | | | Wyndham Hotels & Resorts, Inc. | | | 4,685,358 | |
| | 48,914 | | | Wynn Resorts Ltd. | | | 5,518,967 | |
| | 39,450 | | | Yum! Brands, Inc. | | | 4,282,692 | |
| | | | | | | | |
| | | | | | | 14,487,017 | |
| | |
| Diversified Financials – 4.7% | |
| | 91,574 | | | Ally Financial, Inc. | | | 3,265,529 | |
| | 88,726 | | | Bank of New York Mellon Corp. (The) | | | 3,765,531 | |
| | 77,757 | | | Discover Financial Services | | | 7,039,341 | |
| | 24,951 | | | Evercore, Inc. Class A | | | 2,735,628 | |
| | 37,470 | | | Raymond James Financial, Inc. | | | 3,584,755 | |
| | 42,462 | | | Voya Financial, Inc. | | | 2,497,190 | |
| | | | | | | | |
| | | | | | | 22,887,974 | |
| | |
| Energy – 2.6% | |
| | 79,534 | | | Cheniere Energy, Inc.* | | | 4,774,426 | |
| | 69,411 | | | Hess Corp. | | | 3,664,207 | |
| | 298,311 | | | Parsley Energy, Inc. Class A | | | 4,236,016 | |
| | | | | | | | |
| | | | | | | 12,674,649 | |
| | |
|
| Common Stocks – (continued) | |
| Food & Staples Retailing – 0.6% | |
| | 60,761 | | | Performance Food Group Co.* | | | 2,892,831 | |
| | |
| Food, Beverage & Tobacco – 4.5% | |
| | 114,248 | | | Coca-Cola European Partners plc | | | 5,692,978 | |
| | 25,545 | | | Constellation Brands, Inc. Class A | | | 5,595,632 | |
| | 34,613 | | | McCormick & Co., Inc. (Non-Voting) | | | 3,309,003 | |
| | 185,980 | | | Nomad Foods Ltd.* | | | 4,727,612 | |
| | 120,801 | | | Utz Brands, Inc. | | | 2,664,870 | |
| | | | | | | | |
| | | | | | | 21,990,095 | |
| | |
| Health Care Equipment & Services – 5.6% | |
| | 36,988 | | | Centene Corp.* | | | 2,220,390 | |
| | 209,259 | | | Change Healthcare, Inc.* | | | 3,902,680 | |
| | 13,033 | | | Cooper Cos., Inc. (The) | | | 4,735,150 | |
| | 43,724 | | | Hologic, Inc.* | | | 3,184,419 | |
| | 27,797 | | | Quest Diagnostics, Inc. | | | 3,312,568 | |
| | 64,377 | | | Zimmer Biomet Holdings, Inc. | | | 9,919,852 | |
| | | | | | | | |
| | | | | | | 27,275,059 | |
| | |
| Insurance – 5.1% | |
| | 4,226 | | | Alleghany Corp. | | | 2,551,194 | |
| | 46,505 | | | American Financial Group, Inc. | | | 4,074,768 | |
| | 31,725 | | | Arthur J Gallagher & Co. | | | 3,924,700 | |
| | 62,092 | | | Brown & Brown, Inc. | | | 2,943,782 | |
| | 32,506 | | | Globe Life, Inc. | | | 3,086,770 | |
| | 5,312 | | | Markel Corp.* | | | 5,488,889 | |
| | 25,701 | | | Reinsurance Group of America, Inc. | | | 2,978,746 | |
| | | | | | | | |
| | | | | | | 25,048,849 | |
| | |
| Materials – 7.3% | |
| | 50,293 | | | Ashland Global Holdings, Inc. | | | 3,983,206 | |
| | 71,897 | | | Ball Corp. | | | 6,699,362 | |
| | 205,907 | | | Corteva, Inc. | | | 7,972,719 | |
| | 253,964 | | | Freeport-McMoRan, Inc. | | | 6,608,143 | |
| | 15,816 | | | Martin Marietta Materials, Inc. | | | 4,491,270 | |
| | 43,618 | | | Packaging Corp. of America | | | 6,015,358 | |
| | | | | | | | |
| | | | | | | 35,770,058 | |
| | |
| Media & Entertainment – 4.1% | |
| | 24,516 | | | Liberty Broadband Corp. Class C* | | | 3,882,599 | |
| | 63,003 | | | Liberty Media Corp.-Liberty Formula One Class C* | | | 2,683,928 | |
| | 99,808 | | | Liberty Media Corp.-Liberty SiriusXM Class A* | | | 4,310,707 | |
| | 56,079 | | | Live Nation Entertainment, Inc.* | | | 4,120,685 | |
| | 32,188 | | | Match Group, Inc.* | | | 4,866,504 | |
| | | | | | | | |
| | | | | | | 19,864,423 | |
| | |
| | |
| The accompanying notes are an integral part of these financial statements. | | 7 |
GOLDMAN SACHS VARIABLE INSURANCE TRUST MID CAP VALUE FUND
Schedule of Investments (continued)
December 31, 2020
| | | | | | | | |
| Shares | | | Description | | Value | |
|
| Common Stocks – (continued) | |
| Pharmaceuticals, Biotechnology & Life Sciences – 3.2% | |
| | 62,168 | | | Catalent, Inc.* | | $ | 6,469,824 | |
| | 38,282 | | | Certara, Inc.*(a) | | | 1,290,869 | |
| | 19,627 | | | Neurocrine Biosciences, Inc.* | | | 1,881,248 | |
| | 30,505 | | | PerkinElmer, Inc. | | | 4,377,467 | |
| | 8,540 | | | Sarepta Therapeutics, Inc.* | | | 1,455,985 | |
| | | | | | | | |
| | | | | | | 15,475,393 | |
| | |
| Real Estate Investment Trusts – 9.1% | |
| | 25,843 | | | Alexandria Real Estate Equities, Inc. | | | 4,605,739 | |
| | 25,219 | | | AvalonBay Communities, Inc. | | | 4,045,884 | |
| | 31,640 | | | Camden Property Trust | | | 3,161,469 | |
| | 39,408 | | | CyrusOne, Inc. | | | 2,882,695 | |
| | 51,806 | | | Duke Realty Corp. | | | 2,070,686 | |
| | 55,595 | | | Equity LifeStyle Properties, Inc. | | | 3,522,499 | |
| | 12,622 | | | Essex Property Trust, Inc. | | | 2,996,715 | |
| | 144,726 | | | Healthpeak Properties, Inc. | | | 4,375,067 | |
| | 48,181 | | | Highwoods Properties, Inc. | | | 1,909,413 | |
| | 108,621 | | | Invitation Homes, Inc. | | | 3,226,044 | |
| | 18,795 | | | Life Storage, Inc. | | | 2,243,935 | |
| | 104,403 | | | MGM Growth Properties LLC Class A | | | 3,267,814 | |
| | 90,364 | | | Welltower, Inc. | | | 5,839,322 | |
| | | | | | | | |
| | | | | | | 44,147,282 | |
| | |
| Retailing – 4.8% | |
| | 28,757 | | | Advance Auto Parts, Inc. | | | 4,529,515 | |
| | 13,459 | | | Burlington Stores, Inc.* | | | 3,520,201 | |
| | 31,998 | | | Dollar Tree, Inc.* | | | 3,457,064 | |
| | 47,390 | | | Expedia Group, Inc. | | | 6,274,436 | |
| | 50,157 | | | National Vision Holdings, Inc.* | | | 2,271,611 | |
| | 7,070 | | | RH* | | | 3,163,966 | |
| | | | | | | | |
| | | | | | | 23,216,793 | |
| | |
| Semiconductors & Semiconductor Equipment – 4.6% | |
| | 29,930 | | | Cree, Inc.* | | | 3,169,587 | |
| | 188,006 | | | Marvell Technology Group Ltd. | | | 8,937,805 | |
| | 29,261 | | | Microchip Technology, Inc. | | | 4,041,237 | |
| | 18,448 | | | MKS Instruments, Inc. | | | 2,775,501 | |
| | 109,090 | | | ON Semiconductor Corp.* | | | 3,570,516 | |
| | | | | | | | |
| | | | | | | 22,494,646 | |
| | |
| Software & Services – 1.9% | |
| | 27,615 | | | Akamai Technologies, Inc.* | | | 2,899,299 | |
| | 18,605 | | | Splunk, Inc.* | | | 3,160,803 | |
| | 15,033 | | | WEX, Inc.* | | | 3,059,667 | |
| | | | | | | | |
| | | | | | | 9,119,769 | |
| | |
| Technology Hardware & Equipment – 3.9% | |
| | 127,527 | | | Juniper Networks, Inc. | | | 2,870,633 | |
| | 22,112 | | | Motorola Solutions, Inc. | | | 3,760,367 | |
|
| Common Stocks – (continued) | |
| Technology Hardware & Equipment – (continued) | |
| | 90,359 | | | National Instruments Corp. | | | 3,970,375 | |
| | 350,303 | | | Viavi Solutions, Inc.* | | | 5,245,787 | |
| | 100,233 | | | Vontier Corp.* | | | 3,347,782 | |
| | | | | | | | |
| | | | | | | 19,194,944 | |
| | |
| Transportation – 2.8% | |
| | 31,951 | | | Old Dominion Freight Line, Inc. | | | 6,236,196 | |
| | 166,892 | | | United Airlines Holdings, Inc.* | | | 7,218,079 | |
| | | | | | | | |
| | | | | | | 13,454,275 | |
| | |
| Utilities – 8.5% | |
| | 108,180 | | | AES Corp. (The) | | | 2,542,230 | |
| | 71,520 | | | Ameren Corp. | | | 5,582,851 | |
| | 32,850 | | | American Water Works Co., Inc. | | | 5,041,489 | |
| | 41,802 | | | Atmos Energy Corp. | | | 3,989,165 | |
| | 79,150 | | | CMS Energy Corp. | | | 4,828,942 | |
| | 45,232 | | | Eversource Energy | | | 3,913,020 | |
| | 52,711 | | | NextEra Energy Partners LP | | | 3,534,273 | |
| | 68,637 | | | Public Service Enterprise Group, Inc. | | | 4,001,537 | |
| | 24,591 | | | Sempra Energy | | | 3,133,139 | |
| | 73,394 | | | Xcel Energy, Inc. | | | 4,893,178 | |
| | | | | | | | |
| | | | | | | 41,459,824 | |
| | |
| TOTAL COMMON STOCKS
(Cost $367,795,112) | | $ | 484,779,128 | |
| | |
| | | | | | | | |
| Shares | | Dividend Rate | | | Value | |
|
| Investment Company(b) – 0.4% | |
Goldman Sachs Financial Square Government Fund — Institutional Shares | |
| 1,803,152 | | | 0.026 | % | | $ | 1,803,152 | |
| (Cost $1,803,152) | | | | | |
| |
| TOTAL INVESTMENTS BEFORE SECURITIES LENDING REINVESTMENT VEHICLE | |
| (Cost $369,598,264) | | | $ | 486,582,280 | |
| |
| | | | | | | | |
|
| Securities Lending Reinvestment Vehicle(b) – 0.3% | |
Goldman Sachs Financial Square Government Fund — Institutional Shares | |
| 1,354,889 | | | 0.026 | % | | $ | 1,354,889 | |
| (Cost $1,354,889) | | | | | |
| |
| TOTAL INVESTMENTS – 100.3% | |
| (Cost $370,953,153) | | | $ | 487,937,169 | |
| |
LIABILITIES IN EXCESS OF OTHER ASSETS – (0.3)% | | | | (1,652,154 | ) |
| |
| NET ASSETS – 100.0% | | | $ | 486,285,015 | |
| |
| | |
| 8 | | The accompanying notes are an integral part of these financial statements. |
GOLDMAN SACHS VARIABLE INSURANCE TRUST MID CAP VALUE FUND
| | |
| The percentage shown for each investment category reflects the value of investments in that category as a percentage of net assets. |
| |
| * | | Security is currently in default and/or non-income producing. |
| |
| (a) | | All or a portion of security is on loan. |
| |
| (b) | | Represents an Affiliated Issuer. |
| | |
| The accompanying notes are an integral part of these financial statements. | | 9 |
GOLDMAN SACHS VARIABLE INSURANCE TRUST MID CAP VALUE FUND
Statement of Assets and Liabilities
December 31, 2020
| | | | |
| | | | |
| Assets: | | | |
Investments in unaffiliated issuers, at value (cost $367,795,112)(a) | | $ | 484,779,128 | |
Investments in affiliated issuers, at value (cost $1,803,152) | | | 1,803,152 | |
Investments in affiliated securities lending reinvestment vehicle, at value (cost $1,354,889) | | | 1,354,889 | |
Cash | | | 293,462 | |
Receivables: | | | | |
Dividends | | | 380,926 | |
Fund shares sold | | | 43,332 | |
Reimbursement from investment adviser | | | 17,997 | |
Securities lending income | | | 106 | |
Other assets | | | 1,307 | |
| |
| Total assets | | | 488,674,299 | |
| | | | |
| | | | |
| Liabilities: | | | |
Payables: | | | | |
Payable upon return of securities loaned | | | 1,354,889 | |
Fund shares redeemed | | | 397,518 | |
Management fees | | | 312,390 | |
Distribution and Service fees and Transfer Agency fees | | | 41,443 | |
Accrued expenses | | | 283,044 | |
| |
| Total liabilities | | | 2,389,284 | |
| | | | |
| | | | |
| Net Assets: | | | |
Paid-in capital | | | 381,287,338 | |
Total distributable earnings (loss) | | | 104,997,677 | |
| |
| NET ASSETS | | $ | 486,285,015 | |
Net Assets: | | | | |
Institutional | | $ | 327,375,858 | |
Service | | | 158,909,157 | |
| |
Total Net Assets | | $ | 486,285,015 | |
Shares outstanding $0.001 par value (unlimited shares authorized): | | | | |
Institutional | | | 18,996,424 | |
Service | | | 9,140,031 | |
Net asset value, offering and redemption price per share: | | | | |
Institutional | | | $17.23 | |
Service | | | 17.39 | |
(a) Includes loaned securities having a market value of $1,324,949.
| | |
| 10 | | The accompanying notes are an integral part of these financial statements. |
GOLDMAN SACHS VARIABLE INSURANCE TRUST MID CAP VALUE FUND
Statement of Operations
For the Fiscal Year Ended December 31, 2020
| | | | |
| | | | |
| Investment income: | | | |
Dividends — unaffiliated issuers (net of foreign taxes withheld of $2,517) | | $ | 5,877,771 | |
Securities lending income — unaffiliated issuer | | | 153,577 | |
Dividends — affiliated issuers | | | 34,447 | |
Interest | | | 1,085 | |
| |
| Total investment income | | | 6,066,880 | |
| | | | |
| | | | |
| Expenses: | | | |
Management fees | | | 3,099,830 | |
Distribution and Service (12b-1) fees | | | 287,742 | |
Printing and mailing costs | | | 181,821 | |
Professional fees | | | 104,389 | |
Custody, accounting and administrative services | | | 90,267 | |
Transfer Agency fees(a) | | | 80,508 | |
Trustee fees | | | 21,088 | |
Other | | | 19,575 | |
| |
| Total expenses | | | 3,885,220 | |
| |
Less — expense reductions | | | (209,962 | ) |
| |
| Net expenses | | | 3,675,258 | |
| |
| NET INVESTMENT INCOME | | | 2,391,622 | |
| | | | |
| | | | |
| Realized and unrealized gain (loss): | | | |
Net realized loss from investments — unaffiliated issuers | | | (9,440,981 | ) |
Net change in unrealized gain on investments — unaffiliated issuers | | | 27,741,103 | |
| |
| Net realized and unrealized gain | | | 18,300,122 | |
| |
| NET INCREASE IN NET ASSETS RESULTING FROM OPERATIONS | | $ | 20,691,744 | |
(a) Institutional and Service Shares incurred Transfer Agency fees of $57,491 and $23,017, respectively.
| | |
| The accompanying notes are an integral part of these financial statements. | | 11 |
GOLDMAN SACHS VARIABLE INSURANCE TRUST MID CAP VALUE FUND
Statements of Changes in Net Assets
| | | | | | | | |
| | | For the Fiscal Year Ended December 31, 2020 | | | For the Fiscal Year Ended December 31, 2019 | |
| | | | | | | | |
| From operations: | |
Net investment income | | $ | 2,391,622 | | | $ | 3,829,536 | |
Net realized gain (loss) | | | (9,440,981 | ) | | | 29,143,957 | |
Net change in unrealized gain | | | 27,741,103 | | | | 90,823,666 | |
| | |
| Net increase in net assets resulting from operations | | | 20,691,744 | | | | 123,797,159 | |
| | | | | | | | |
| | | | | | | | |
| Distributions to shareholders: | | | | | | |
From distributable earnings: | | | | | | | | |
Institutional Shares | | | (6,463,230 | ) | | | (14,329,359 | ) |
Service Shares | | | (2,864,537 | ) | | | (7,060,194 | ) |
| | |
| Total distributions to shareholders | | | (9,327,767 | ) | | | (21,389,553 | ) |
| | | | | | | | |
| | | | | | | | |
| From share transactions: | | | | | | |
Proceeds from sales of shares | | | 104,182,481 | | | | 97,337,044 | |
Reinvestment of distributions | | | 9,327,767 | | | | 21,389,553 | |
Cost of shares redeemed | | | (148,714,253 | ) | | | (87,900,619 | ) |
| | |
| Net increase (decrease) in net assets resulting from share transactions | | | (35,204,005 | ) | | | 30,825,978 | |
| | |
| TOTAL INCREASE (DECREASE) | | | (23,840,028 | ) | | | 133,233,584 | |
| | | | | | | | |
| | | | | | | | |
| Net Assets: | | | | | | |
| | |
Beginning of year | | | 510,125,043 | | | | 376,891,459 | |
| | |
End of year | | $ | 486,285,015 | | | $ | 510,125,043 | |
| | |
| 12 | | The accompanying notes are an integral part of these financial statements. |
GOLDMAN SACHS VARIABLE INSURANCE TRUST MID CAP VALUE FUND
Financial Highlights
Selected Data for a Share Outstanding Throughout Each Year
| | | | | | | | | | | | | | | | | | | | |
| | | Goldman Sachs Mid Cap Value Fund | |
| | | Institutional Shares | |
| | | Year Ended December 31, | |
| | | 2020 | | | 2019 | | | 2018 | | | 2017 | | | 2016 | |
| | | | | | | | | | | | | | | | | | | | |
| Per Share Data | | | | | | | | | | | | | | | |
| | | | | |
Net asset value, beginning of year | | $ | 16.22 | | | $ | 12.89 | | | $ | 16.93 | | | $ | 16.23 | | | $ | 14.49 | |
| | | | | |
Net investment income(a) | | | 0.10 | | | | 0.13 | | | | 0.13 | | | | 0.12 | | | | 0.16 | |
| | | | | |
Net realized and unrealized gain (loss) | | | 1.26 | | | | 3.93 | | | | (1.86 | ) | | | 1.68 | | | | 1.80 | |
| | | | | |
Total from investment operations | | | 1.36 | | | | 4.06 | | | | (1.73 | ) | | | 1.80 | | | | 1.96 | |
| | | | | |
Distributions to shareholders from net investment income | | | (0.10 | ) | | | (0.13 | ) | | | (0.23 | ) | | | (0.13 | ) | | | (0.21 | ) |
| | | | | |
Distributions to shareholders from net realized gains | | | (0.25 | ) | | | (0.60 | ) | | | (2.08 | ) | | | (0.97 | ) | | | (0.01 | ) |
| | | | | |
Total distributions | | | (0.35 | ) | | | (0.73 | ) | | | (2.31 | ) | | | (1.10 | ) | | | (0.22 | ) |
| | | | | |
Net asset value, end of year | | $ | 17.23 | | | $ | 16.22 | | | $ | 12.89 | | | $ | 16.93 | | | $ | 16.23 | |
| | | | | |
Total return(b) | | | 8.38 | % | | | 31.53 | % | | | (10.46 | )% | | | 11.07 | % | | | 13.49 | % |
| | | | | |
Net assets, end of year (in 000s) | | $ | 327,376 | | | $ | 335,229 | | | $ | 300,056 | | | $ | 388,709 | | | $ | 437,085 | |
| | | | | |
Ratio of net expenses to average net assets | | | 0.84 | % | | | 0.87 | % | | | 0.84 | % | | | 0.84 | % | | | 0.84 | % |
| | | | | |
Ratio of total expenses to average net assets | | | 0.90 | % | | | 0.90 | % | | | 0.86 | % | | | 0.87 | % | | | 0.87 | % |
| | | | | |
Ratio of net investment income to average net assets | | | 0.68 | % | | | 0.85 | % | | | 0.75 | % | | | 0.71 | % | | | 1.08 | % |
| | | | | |
Portfolio turnover rate(c) | | | 111 | % | | | 89 | % | | | 109 | % | | | 134 | % | | | 149 | % |
| (a) | Calculated based on the average shares outstanding methodology. |
| (b) | Assumes investment at the net asset value at the beginning of the year, reinvestment of all distributions, a complete redemption of the investment at the net asset value at the end of the year and no sales or redemption charges (if any). Total returns would be reduced if a sales or redemption charge was taken into account. Returns do not reflect the impact of taxes to shareholders relating to Fund distributions or the redemption of Fund shares. |
| (c) | The Fund’s portfolio turnover rate is calculated in accordance with regulatory requirements, without regard to transactions involving short term investments. If such transactions were included, the Fund’s portfolio turnover rate may be higher. |
| | |
| The accompanying notes are an integral part of these financial statements. | | 13 |
GOLDMAN SACHS VARIABLE INSURANCE TRUST MID CAP VALUE FUND
Financial Highlights (continued)
Selected Data for a Share Outstanding Throughout Each Year
| | | | | | | | | | | | | | | | | | | | |
| | | Goldman Sachs Mid Cap Value Fund | |
| | | Service Shares | |
| | | Year Ended December 31, | |
| | | 2020 | | | 2019 | | | 2018 | | | 2017 | | | 2016 | |
| | | | | | | | | | | | | | | | | | | | |
| Per Share Data | | | | | | | | | | | | | | | |
| | | | | |
Net asset value, beginning of year | | $ | 16.37 | | | $ | 13.01 | | | $ | 16.95 | | | $ | 16.25 | | | $ | 14.51 | |
| | | | | |
Net investment income(a) | | | 0.06 | | | | 0.10 | | | | 0.07 | | | | 0.08 | | | | 0.12 | |
| | | | | |
Net realized and unrealized gain (loss) | | | 1.28 | | | | 3.95 | | | | (1.84 | ) | | | 1.68 | | | | 1.81 | |
| | | | | |
Total from investment operations | | | 1.34 | | | | 4.05 | | | | (1.77 | ) | | | 1.76 | | | | 1.93 | |
| | | | | |
Distributions to shareholders from net investment income | | | (0.07 | ) | | | (0.09 | ) | | | (0.09 | ) | | | (0.09 | ) | | | (0.18 | ) |
| | | | | |
Distributions to shareholders from net realized gains | | | (0.25 | ) | | | (0.60 | ) | | | (2.08 | ) | | | (0.97 | ) | | | (0.01 | ) |
| | | | | |
Total distributions | | | (0.32 | ) | | | (0.69 | ) | | | (2.17 | ) | | | (1.06 | ) | | | (0.19 | ) |
| | | | | |
Net asset value, end of year | | $ | 17.39 | | | $ | 16.37 | | | $ | 13.01 | | | $ | 16.95 | | | $ | 16.25 | |
| | | | | |
Total return(b) | | | 8.17 | % | | | 31.17 | % | | | (10.70 | )% | | | 10.85 | % | | | 13.24 | % |
| | | | | |
Net assets, end of year (in 000s) | | $ | 158,909 | | | $ | 174,896 | | | $ | 76,835 | | | $ | 381,172 | | | $ | 371,366 | |
| | | | | |
Ratio of net expenses to average net assets | | | 1.09 | % | | | 1.12 | % | | | 1.09 | % | | | 1.09 | % | | | 1.09 | % |
| | | | | |
Ratio of total expenses to average net assets | | | 1.14 | % | | | 1.16 | % | | | 1.11 | % | | | 1.12 | % | | | 1.12 | % |
| | | | | |
Ratio of net investment income to average net assets | | | 0.39 | % | | | 0.66 | % | | | 0.42 | % | | | 0.47 | % | | | 0.78 | % |
| | | | | |
Portfolio turnover rate(c) | | | 111 | % | | | 89 | % | | | 109 | % | | | 134 | % | | | 149 | % |
| (a) | Calculated based on the average shares outstanding methodology. |
| (b) | Assumes investment at the net asset value at the beginning of the year, reinvestment of all distributions, a complete redemption of the investment at the net asset value at the end of the year and no sales or redemption charges (if any). Total returns would be reduced if a sales or redemption charge was taken into account. Returns do not reflect the impact of taxes to shareholders relating to Fund distributions or the redemption of Fund shares. |
| (c) | The Fund’s portfolio turnover rate is calculated in accordance with regulatory requirements, without regard to transactions involving short term investments. If such transactions were included, the Fund’s portfolio turnover rate may be higher. |
| | |
| 14 | | The accompanying notes are an integral part of these financial statements. |
GOLDMAN SACHS VARIABLE INSURANCE TRUST MID CAP VALUE FUND
Notes to Financial Statements
December 31, 2020
1. ORGANIZATION
Goldman Sachs Variable Insurance Trust (the “Trust” or “VIT”) is a Delaware statutory trust registered under the Investment Company Act of 1940, as amended (the “Act”), as an open-end management investment company. The Trust includes the Goldman Sachs Mid Cap Value Fund (the “Fund”). The Fund is a diversified portfolio under the Act offering two classes of shares — Institutional and Service Shares. Shares of the Trust are offered to separate accounts of participating life insurance companies for the purpose of funding variable annuity contracts and variable life insurance policies.
Goldman Sachs Asset Management, L.P. (“GSAM”), an affiliate of Goldman Sachs & Co. LLC (“Goldman Sachs”), serves as investment adviser to the Fund pursuant to a management agreement (the “Agreement”) with the Trust.
2. SIGNIFICANT ACCOUNTING POLICIES
The financial statements have been prepared in accordance with accounting principles generally accepted in the United States of America (“GAAP”) and require management to make estimates and assumptions that may affect the reported amounts and disclosures. Actual results may differ from those estimates and assumptions. The Fund is an investment company under GAAP and follows the accounting and reporting guidance applicable to investment companies.
A. Investment Valuation — The Fund’s valuation policy is to value investments at fair value.
B. Investment Income and Investments — Investment income includes interest income, dividend income, and securities lending income, if any. Interest income is accrued daily and adjusted for amortization of premiums and accretion of discounts. Dividend income is recognized on ex-dividend date or, for certain foreign securities, as soon as such information is obtained subsequent to the ex-dividend date. Non-cash dividends, if any, are recorded at the fair market value of the securities received. Investment transactions are reflected on trade date. Realized gains and losses are calculated using identified cost. Investment transactions are recorded on the following business day for daily net asset value (“NAV”) calculations. Investment income is recorded net of any foreign withholding taxes, less any amounts reclaimable. The Fund may file withholding tax reclaims in certain jurisdictions to recover a portion of amounts previously withheld. Any foreign capital gains tax is accrued daily based upon net unrealized gains, and is payable upon sale of such investments. Distributions received from the Fund’s investments in United States (“U.S.”) real estate investment trusts (“REITs”) may be characterized as ordinary income, net capital gain and/or a return of capital. A return of capital is recorded by the Fund as a reduction to the cost basis of the REIT. Distributions from master limited partnerships (“MLPs”) are generally recorded based on the characterization reported on the MLP’s tax return. The Fund records its pro-rata share of the income/loss and capital gains/losses, allocated from the underlying partnerships and adjusts the cost basis of the underlying partnerships accordingly.
C. Class Allocations and Expenses — Investment income, realized and unrealized gain (loss), if any, and non-class specific expenses of the Fund are allocated daily based upon the proportion of net assets of each class. Non-class specific expenses directly incurred by the Fund are charged to the Fund, while such expenses incurred by the Trust are allocated across the Fund on a straight-line and/or pro-rata basis depending upon the nature of the expenses. Class specific expenses, where applicable, are borne by the respective share classes and include Distribution and Service and Transfer Agency fees.
D. Federal Taxes and Distributions to Shareholders — It is the Fund’s policy to comply with the requirements of the Internal Revenue Code of 1986, as amended (the “Code”), applicable to regulated investment companies and to distribute each year substantially all of its investment company taxable income and capital gains to its shareholders. Accordingly, the Fund is not required to make any provisions for the payment of federal income tax. Distributions to shareholders are recorded on the ex-dividend date. Income and capital gains distributions, if any, are declared and paid at least annually.
Net capital losses, if any, are carried forward to future fiscal years and may be used to the extent allowed by the Code to offset any future capital gains. Losses that are carried forward will retain their character as either short-term or long-term capital losses. Utilization of capital loss carryforwards will reduce the requirement of future capital gains distributions.
15
GOLDMAN SACHS VARIABLE INSURANCE TRUST MID CAP VALUE FUND
Notes to Financial Statements (continued)
December 31, 2020
2. SIGNIFICANT ACCOUNTING POLICIES (continued)
The characterization of distributions to shareholders for financial reporting purposes is determined in accordance with federal income tax rules, which may differ from GAAP. The source of the Fund’s distributions may be shown in the accompanying financial statements as either from distributable earnings or capital. Certain components of the Fund’s net assets on the Statement of Assets and Liabilities reflect permanent GAAP/tax differences based on the appropriate tax character.
3. INVESTMENTS AND FAIR VALUE MEASUREMENTS
U.S. GAAP defines the fair value of a financial instrument as the amount that would be received to sell an asset or paid to transfer a liability in an orderly transaction between market participants at the measurement date (i.e., the exit price); the Fund’s policy is to use the market approach. GAAP establishes a fair value hierarchy that prioritizes the inputs to valuation techniques used to measure fair value. The hierarchy gives the highest priority to unadjusted quoted prices in active markets for identical assets or liabilities (Level 1 measurements) and the lowest priority to unobservable inputs (Level 3 measurements). The level in the fair value hierarchy within which the fair value measurement in its entirety falls shall be determined based on the lowest level input that is significant to the fair value measurement in its entirety. The levels used for classifying investments are not necessarily an indication of the risk associated with investing in these investments. The three levels of the fair value hierarchy are described below:
Level 1 — Unadjusted quoted prices in active markets that are accessible at the measurement date for identical, unrestricted assets or liabilities;
Level 2 — Quoted prices in markets that are not active or financial instruments for which significant inputs are observable (including, but not limited to, quoted prices for similar investments, interest rates, foreign exchange rates, volatility and credit spreads), either directly or indirectly;
Level 3 — Prices or valuations that require significant unobservable inputs (including GSAM’s assumptions in determining fair value measurement).
The Board of Trustees (“Trustees”) has approved Valuation Procedures that govern the valuation of the portfolio investments held by the Fund, including investments for which market quotations are not readily available. The Trustees have delegated to GSAM day-to-day responsibility for implementing and maintaining internal controls and procedures related to the valuation of the Fund’s investments. To assess the continuing appropriateness of pricing sources and methodologies, GSAM regularly performs price verification procedures and issues challenges as necessary to third party pricing vendors or brokers, and any differences are reviewed in accordance with the Valuation Procedures.
A. Level 1 and Level 2 Fair Value Investments — The valuation techniques and significant inputs used in determining the fair values for investments classified as Level 1 and Level 2 are as follows:
Equity Securities — Equity securities traded on a U.S. securities exchange or the NASDAQ system, or those located on certain foreign exchanges, including but not limited to the Americas, are valued daily at their last sale price or official closing price on the principal exchange or system on which they are traded. If there is no sale or official closing price or such price is believed by GSAM to not represent fair value, equity securities will be valued at the valid closing bid price for long positions and at the valid closing ask price for short positions (i.e. where there is sufficient volume, during normal exchange trading hours). If no valid bid/ask price is available, the equity security will be valued pursuant to the Valuation Procedures approved by the Trustees and consistent with applicable regulatory guidance. To the extent these investments are actively traded, they are classified as Level 1 of the fair value hierarchy, otherwise they are generally classified as Level 2. Certain equity securities containing unique attributes may be classified as Level 2.
Unlisted equity securities for which market quotations are available are valued at the last sale price on the valuation date, or if no sale occurs, at the last bid price for long positions or the last ask price for short positions, and are generally classified as Level 2.
Money Market Funds — Investments in the Goldman Sachs Financial Square Government Fund (“Underlying Fund”) are valued at the NAV per share of the Institutional Share class on the day of valuation. These investments are generally classified as
16
GOLDMAN SACHS VARIABLE INSURANCE TRUST MID CAP VALUE FUND
3. INVESTMENTS AND FAIR VALUE MEASUREMENTS (continued)
Level 1 of the fair value hierarchy. For information regarding the Underlying Fund’s accounting policies and investment holdings, please see the Underlying Fund’s shareholder report.
B. Level 3 Fair Value Investments — To the extent that significant inputs to valuation models and other alternative pricing sources are unobservable, or if quotations are not readily available, or if GSAM believes that such quotations do not accurately reflect fair value, the fair value of the Fund’s investments may be determined under Valuation Procedures approved by the Trustees. GSAM, consistent with its procedures and applicable regulatory guidance, may make an adjustment to the most recent valuation prices of either domestic or foreign securities in light of significant events to reflect what it believes to be the fair value of the securities at the time of determining the Fund’s NAV. To the extent investments are valued using single source broker quotations obtained directly from the broker or passed through from third party pricing vendors, such investments are classified as Level 3 investments.
C. Fair Value Hierarchy — The following is a summary of the Fund’s investments classified in the fair value hierarchy as of December 31, 2020:
| | | | | | | | | | | | |
| Investment Type | | Level 1 | | | Level 2 | | | Level 3 | |
| | | |
| Assets | | | | | | | | | | | | |
| Common Stock and/or Other Equity Investments(a) | | | | | | | | | | | | |
Europe | | $ | 10,420,590 | | | $ | — | | | $ | — | |
North America | | | 474,358,538 | | | | — | | | | — | |
| Investment Company | | | 1,803,152 | | | | — | | | | — | |
| Securities Lending Reinvestment Vehicle | | | 1,354,889 | | | | — | | | | — | |
| | | |
| Total | | $ | 487,937,169 | | | $ | — | | | $ | — | |
| (a) | Amounts are disclosed by continent to highlight the impact of time zone differences between local market close and the calculation of NAV. Security valuations are based on the principal exchange or system on which they are traded, which may differ from country of domicile. |
For further information regarding security characteristics, see the Schedule of Investments.
4. AGREEMENTS AND AFFILIATED TRANSACTIONS
A. Management Agreement — Under the Agreement, GSAM manages the Fund, subject to the general supervision of the Trustees.
As compensation for the services rendered pursuant to the Agreement, the assumption of the expenses related thereto and administration of the Fund’s business affairs, including providing facilities, GSAM is entitled to a management fee, accrued daily and paid monthly, equal to an annual percentage rate of the Fund’s average daily net assets.
For the fiscal year ended December 31, 2020, contractual and effective net management fees with GSAM were at the following rates:
| | | | | | | | | | | | | | | | | | | | | | |
| Contractual Management Rate | | | | | | Effective Net
Management
Rate^ | |
First
$2 billion | | | Next
$3 billion | | | Next
$3 billion | | | Over
$8 billion | | | Effective
Rate | |
| | | | | |
| | 0.77% | | | | 0.69 | % | | | 0.66 | % | | | 0.65 | % | | | 0.77 | % | | | 0.77 | % |
| ^ | Effective Net Management Rate includes the impact of management fee waivers of affiliated Underlying Funds, if any. |
The Fund invests in Institutional Shares of the Goldman Sachs Financial Square Government Fund, which is an affiliated Underlying Fund. GSAM has agreed to waive a portion of its management fee payable by the Fund in an amount equal to the
17
GOLDMAN SACHS VARIABLE INSURANCE TRUST MID CAP VALUE FUND
Notes to Financial Statements (continued)
December 31, 2020
4. AGREEMENTS AND AFFILIATED TRANSACTIONS (continued)
management fee it earns as an investment adviser to the affiliated Underlying Fund in which the Fund invests, except those management fees it earns from the Fund’s investments of cash collateral received in connection with securities lending transactions in the Goldman Sachs Financial Square Government Fund. For the fiscal year ended December 31, 2020, GSAM waived $9,491 of the Fund’s management fee.
B. Distribution and Service (12b-1) Plan — The Trust, on behalf of Service Shares of the Fund, has adopted a Distribution and Service Plan subject to Rule 12b-1 under the Act. Under the Distribution and Service Plan, Goldman Sachs, which serves as distributor, is entitled to a fee accrued daily and paid monthly, for distribution services and personal and account maintenance services, which may then be paid by Goldman Sachs to authorized dealers, equal to, on an annual basis, 0.25% of the Fund’s average daily net assets attributable to Service Shares.
C. Transfer Agency Agreement — Goldman Sachs also serves as the transfer agent of the Fund for a fee pursuant to the Transfer Agency Agreement. The fees charged for such transfer agency services are accrued daily and paid monthly at an annual rate of 0.02% of the average daily net assets of Institutional and Service Shares.
D. Other Expense Agreements and Affiliated Transactions — GSAM has agreed to reduce or limit certain “Other Expenses” of the Fund (excluding acquired fund fees and expenses, transfer agency fees and expenses, service fees and shareholder administration fees (as applicable), taxes, interest, brokerage fees, expenses of shareholder meetings, litigation and indemnification, and extraordinary expenses) to the extent such expenses exceed, on an annual basis, a percentage rate of the average daily net assets of the Fund. Such Other Expense reimbursements, if any, are accrued daily and paid monthly. In addition, the Fund is not obligated to reimburse GSAM for prior fiscal year expense reimbursements, if any. The Other Expense limitation as an annual percentage rate of average daily net assets for the Fund is 0.054%. The Other Expense limitation will remain in place through at least April 29, 2021, and prior to such date GSAM may not terminate the arrangement without the approval of the Trustees. In addition, the Fund has entered into certain offset arrangements with the custodian and the transfer agent, which may result in a reduction of the Fund’s expenses and are received irrespective of the application of the “Other Expense” limitation described above.
For the fiscal year ended December 31, 2020, these expense reductions, including any fee waivers and Other Expense reimbursements, were as follows:
| | | | | | | | | | | | | | |
Management Fee Waiver | | | Custody Fee Credits | | | Other Expense Reimbursement | | | Total Expense Reductions | |
| | | |
| $ | 9,491 | | | $ | 735 | | | $ | 199,736 | | | $ | 209,962 | |
E. Line of Credit Facility — As of December 31, 2020, the Fund participated in a $700,000,000 committed, unsecured revolving line of credit facility (the “facility”) together with other funds of the Trust and certain registered investment companies having management agreements with GSAM or its affiliates. This facility is to be used for temporary emergency purposes, or to allow for an orderly liquidation of securities to meet redemption requests. The interest rate on borrowings is based on the federal funds rate. The facility also requires a fee to be paid by the Fund based on the amount of the commitment that has not been utilized. For the fiscal year ended December 31, 2020, the Fund did not have any borrowings under the facility. Prior to April 28, 2020, the facility was $580,000,000.
F. Other Transactions with Affiliates — For the fiscal year ended December 31, 2020, Goldman Sachs earned $431 in brokerage commissions from portfolio transactions.
18
GOLDMAN SACHS VARIABLE INSURANCE TRUST MID CAP VALUE FUND
4. AGREEMENTS AND AFFILIATED TRANSACTIONS (continued)
The following table provides information about the Fund’s investments in the Goldman Sachs Financial Square Government Fund as of and for the fiscal year ended December 31, 2020:
| | | | | | | | | | | | | | | | | | | | | | |
Beginning Value as of December 31, 2019 | | | Purchases at Cost | | | Proceeds from
Sales | | | Ending Value as of December 31, 2020 | | | Shares as of
December 31, 2020 | | | Dividend Income
from Affiliated
Investment Company | |
| | | | | |
| | $12,703,956 | | | $ | 153,030,045 | | | $ | (163,930,849 | ) | | $ | 1,803,152 | | | | 1,803,152 | | | $ | 34,447 | |
5. PORTFOLIO SECURITIES TRANSACTIONS
The cost of purchases and proceeds from sales and maturities of long-term securities for the fiscal year ended December 31, 2020, were $445,079,480 and $472,372,983, respectively.
6. SECURITIES LENDING
The Fund may lend its securities through a securities lending agent, the Bank of New York Mellon (“BNYM”), to certain qualified borrowers. In accordance with the Fund’s securities lending procedures, the Fund receives cash collateral at least equal to the market value of the securities on loan. The market value of the loaned securities is determined at the close of business of the Fund, at their last sale price or official closing price on the principal exchange or system on which they are traded, and any additional required collateral is delivered to the Fund on the next business day. As with other extensions of credit, the Fund may experience delay in the recovery of its securities or incur a loss should the borrower of the securities breach its agreement with the Fund or become insolvent at a time when the collateral is insufficient to cover the cost of repurchasing securities on loan. Dividend income received from securities on loan may not be subject to withholding taxes and therefore withholding taxes paid may differ from the amounts listed in the Statement of Operations. Loans of securities are terminable at any time and as such 1) the remaining contractual maturities of the outstanding securities lending transactions are considered to be overnight and continuous and 2) the borrower, after notice, is required to return borrowed securities within the standard time period for settlement of securities transactions.
The Fund invests the cash collateral received in connection with securities lending transactions in the Goldman Sachs Financial Square Government Fund (“Government Money Market Fund”), an affiliated series of the Goldman Sachs Trust. The Government Money Market Fund is registered under the Act as an open end investment company, is subject to Rule 2a-7 under the Act, and is managed by GSAM, for which GSAM may receive a management fee of up to 0.16% on an annualized basis of the average daily net assets of the Government Money Market Fund.
In the event of a default by a borrower with respect to any loan, BNYM may exercise any and all remedies provided under the applicable borrower agreement to make the Fund whole. These remedies include purchasing replacement securities by applying the collateral held from the defaulting broker against the purchase cost of the replacement securities. If BNYM is unable to purchase replacement securities, BNYM will indemnify the Fund by paying the Fund an amount equal to the market value of the securities loaned minus the value of cash collateral received from the borrower for the loan, subject to an exclusion for any shortfalls resulting from a loss of value in such cash collateral due to reinvestment risk. The Fund’s master netting agreements with certain borrowers provide the right, in the event of a default (including bankruptcy or insolvency), for the non-defaulting party to liquidate the collateral and calculate net exposure to the defaulting party or request additional collateral. However, in the event of a default by a borrower, a resolution authority could determine that such rights are not enforceable due to the restrictions or prohibitions against the right of set-off that may be imposed in accordance with a particular jurisdiction’s bankruptcy or insolvency laws. The Fund’s loaned securities were all subject to enforceable Securities Lending Agreements and the value of the collateral was at least equal to the value of the cash received. The amounts of the Fund’s overnight and continuous agreements, which represent the gross amounts of recognized liabilities for securities lending transactions outstanding as of December 31, 2020, are disclosed as “Payable upon return of securities loaned” on the Statement of Assets and Liabilities, where applicable.
19
GOLDMAN SACHS VARIABLE INSURANCE TRUST MID CAP VALUE FUND
Notes to Financial Statements (continued)
December 31, 2020
6. SECURITIES LENDING (continued)
Both the Fund and BNYM received compensation relating to the lending of the Fund’s securities. The amounts earned, if any, by the Fund for the fiscal year ended December 31, 2020, are reported under Investment Income on the Statement of Operations.
The following table provides information about the Fund’s investment in the Government Money Market Fund for the fiscal year ended December 31, 2020:
| | | | | | | | | | | | | | |
Market Value
December 31, 2019 | | | Purchases at
Cost | | | Proceeds from
Sales | | | Market Value
December 31, 2020 | |
| | | |
| | $408,161 | | | $ | 27,836,347 | | | $ | (26,889,619 | ) | | $ | 1,354,889 | |
7. TAX INFORMATION
The tax character of distributions paid during the fiscal years ended December 31, 2019 and December 31, 2020 was as follows:
| | | | | | | | |
| | | 2019 | | | 2020 | |
| Distributions paid from: | | | | | | | | |
Ordinary income | | $ | 10,465,638 | | | $ | 5,574,669 | |
Net long-term capital gains | | | 10,923,915 | | | | 3,753,098 | |
| | |
| Total Taxable Distributions | | | $21,389,553 | | | $ | 9,327,767 | |
As of December 31, 2020, the components of accumulated earnings (losses) on a tax-basis were as follows:
| | | | |
| Undistributed ordinary income — net | | $ | 394,274 | |
| Capital loss carryforwards: | | | | |
Perpetual short-term | | $ | (2,823,748 | ) |
| Timing differences (Real Estate Investment Trusts) | | $ | 83,947 | |
| Unrealized gains — net | | | 107,343,204 | |
| Total accumulated earnings — net | | $ | 104,997,677 | |
As of December 31, 2020, the Fund’s aggregate security unrealized gains and losses based on cost for U.S. federal income tax purposes were as follows:
| | | | |
| Tax cost | | $ | 380,593,965 | |
| Gross unrealized gain | | | 109,149,144 | |
| Gross unrealized loss | | | (1,805,940 | ) |
| Net unrealized gain | | $ | 107,343,204 | |
The difference between GAAP-basis and tax-basis unrealized gains (losses) is attributable primarily to wash sales.
GSAM has reviewed the Fund’s tax positions for all open tax years (the current and prior three years, as applicable) and has concluded that no provision for income tax is required in the Fund’s financial statements. Such open tax years remain subject to examination and adjustment by tax authorities.
20
GOLDMAN SACHS VARIABLE INSURANCE TRUST MID CAP VALUE FUND
8. OTHER RISKS
The Fund’s risks include, but are not limited to, the following:
Investments in Other Investment Companies Risk — As a shareholder of another investment company, the Fund will indirectly bear its proportionate share of any net management fees and other expenses paid by such other investment companies, in addition to the fees and expenses regularly borne by the Fund.
Large Shareholder Transactions Risk — The Fund may experience adverse effects when certain large shareholders, such as other funds, participating insurance companies, accounts and Goldman Sachs affiliates, purchase or redeem large amounts of shares of the Fund. Such large shareholder redemptions, which may occur rapidly or unexpectedly, may cause the Fund to sell portfolio securities at times when it would not otherwise do so, which may negatively impact the Fund’s NAV and liquidity. These transactions may also accelerate the realization of taxable income to shareholders if such sales of investments resulted in gains, and may also increase transaction costs. In addition, a large redemption could result in the Fund’s current expenses being allocated over a smaller asset base, leading to an increase in the Fund’s expense ratio. Similarly, large Fund share purchases may adversely affect the Fund’s performance to the extent that the Fund is delayed in investing new cash or otherwise maintains a larger cash position than it ordinarily would.
Liquidity Risk — The Fund may make investments that are illiquid or that may become less liquid in response to market developments or adverse investor perceptions. Illiquid investments may be more difficult to value. Liquidity risk may also refer to the risk that the Fund will not be able to pay redemption proceeds within the allowable time period or without significant dilution to remaining investors’ interests because of unusual market conditions, an unusually high volume of redemption requests, or other reasons. To meet redemption requests, the Fund may be forced to sell investments at an unfavorable time and/or under unfavorable conditions. If the Fund is forced to sell securities at an unfavorable time and/or under unfavorable conditions, such sales may adversely affect the Fund’s NAV and dilute remaining investors’ interests. These risks may be more pronounced in connection with the Fund’s investments in securities of issuers located in emerging market countries. Redemptions by large shareholders may have a negative impact on the Fund’s liquidity.
Market and Credit Risks — In the normal course of business, the Fund trades financial instruments and enters into financial transactions where risk of potential loss exists due to changes in the market (market risk). The value of the securities in which the Fund invests may go up or down in response to the prospects of individual companies, particular sectors or governments and/or general economic conditions throughout the world due to increasingly interconnected global economies and financial markets. Events such as war, acts of terrorism, social unrest, natural disasters, the spread of infectious illness or other public health threats could also significantly impact the Fund and its investments. Additionally, the Fund may also be exposed to credit risk in the event that an issuer or guarantor fails to perform or that an institution or entity with which the Fund has unsettled or open transactions defaults.
Master Limited Partnership Risk — Investments in securities of MLPs involve risks that differ from investments in common stock, including risks related to limited control and limited rights to vote on matters affecting the MLP, risks related to potential conflicts of interest between the MLP and the MLP’s general partner, cash flow risks, dilution risks, limited liquidity and risks related to the general partner’s right to require unit-holders to sell their common units at an undesirable time or price.
9. INDEMNIFICATIONS
Under the Trust’s organizational documents, its Trustees, officers, employees and agents are indemnified, to the extent permitted by the Act and state law, against certain liabilities that may arise out of performance of their duties to the Fund. Additionally, in the course of business, the Fund enters into contracts that contain a variety of indemnification clauses. The Fund’s maximum exposure under these arrangements is unknown, as this would involve future claims that may be made against the Fund that have not yet occurred. However, GSAM believes the risk of loss under these arrangements to be remote.
21
GOLDMAN SACHS VARIABLE INSURANCE TRUST MID CAP VALUE FUND
Notes to Financial Statements (continued)
December 31, 2020
10. OTHER MATTERS
On October 22, 2020, Goldman Sachs announced a settlement of matters involving 1Malaysia Development Bhd. (1MDB), a Malaysian sovereign wealth fund, with the United States Department of Justice as well as criminal and civil authorities in the UK, Singapore and Hong Kong. Further information regarding the 1MDB settlement can be found at https://www.goldmansachs.com/media-relations/press-releases/current/goldman-sachs-2020-10-22.html. The 1MDB settlement will not materially adversely affect GSAM’s ability to serve as investment manager.
11. SUBSEQUENT EVENTS
Subsequent events after the Statement of Assets and Liabilities date have been evaluated, and GSAM has concluded that there is no impact requiring adjustment or disclosure in the financial statements.
12. SUMMARY OF SHARE TRANSACTIONS
Share activity is as follows:
| | | | | | | | | | | | | | | | |
| | | For the Fiscal Year Ended
December 31, 2020 | | | For the Fiscal Year Ended
December 31, 2019 | |
| | | Shares | | | Dollars | | | Shares | | | Dollars | |
| Institutional Shares | | | | | | | | | | | | | | | | |
| Shares sold | | | 1,072,386 | | | $ | 14,111,808 | | | | 556,218 | | | $ | 8,465,749 | |
| Reinvestment of distributions | | | 384,030 | | | | 6,463,230 | | | | 897,830 | | | | 14,329,359 | |
| Shares redeemed | | | (3,123,869 | ) | | | (45,649,614 | ) | | | (4,061,392 | ) | | | (62,310,021 | ) |
| | | | (1,667,453 | ) | | | (25,074,576 | ) | | | (2,607,344 | ) | | | (39,514,913 | ) |
| Service Shares | | | | | | | | | | | | | | | | |
| Shares sold | | | 6,051,187 | | | | 90,070,673 | | | | 6,000,838 | | | | 88,871,295 | |
| Reinvestment of distributions | | | 168,701 | | | | 2,864,537 | | | | 438,249 | | | | 7,060,194 | |
| Shares redeemed | | | (7,760,547 | ) | | | (103,064,639 | ) | | | (1,663,012 | ) | | | (25,590,598 | ) |
| | | | (1,540,659 | ) | | | (10,129,429 | ) | | | 4,776,075 | | | | 70,340,891 | |
| | | | |
| NET INCREASE (DECREASE) | | | (3,208,112 | ) | | $ | (35,204,005 | ) | | | 2,168,731 | | | | $30,825,978 | |
22
Report of Independent Registered Public Accounting Firm
To the Board of Trustees of
Goldman Sachs Variable Insurance Trust and Shareholders of Goldman Sachs Mid Cap Value Fund
Opinion on the Financial Statements
We have audited the accompanying statement of assets and liabilities, including the schedule of investments, of Goldman Sachs Mid Cap Value Fund (one of the funds constituting Goldman Sachs Variable Insurance Trust, referred to hereafter as the “Fund”) as of December 31, 2020, the related statement of operations for the year ended December 31, 2020, the statements of changes in net assets for each of the two years in the period ended December 31, 2020, including the related notes, and the financial highlights for each of the five years in the period ended December 31, 2020 (collectively referred to as the “financial statements”). In our opinion, the financial statements present fairly, in all material respects, the financial position of the Fund as of December 31, 2020, the results of its operations for the year then ended, the changes in its net assets for each of the two years in the period ended December 31, 2020 and the financial highlights for each of the five years in the period ended December 31, 2020 in conformity with accounting principles generally accepted in the United States of America.
Basis for Opinion
These financial statements are the responsibility of the Fund’s management. Our responsibility is to express an opinion on the Fund’s financial statements based on our audits. We are a public accounting firm registered with the Public Company Accounting Oversight Board (United States) (PCAOB) and are required to be independent with respect to the Fund in accordance with the U.S. federal securities laws and the applicable rules and regulations of the Securities and Exchange Commission and the PCAOB.
We conducted our audits of these financial statements in accordance with the standards of the PCAOB. Those standards require that we plan and perform the audit to obtain reasonable assurance about whether the financial statements are free of material misstatement, whether due to error or fraud.
Our audits included performing procedures to assess the risks of material misstatement of the financial statements, whether due to error or fraud, and performing procedures that respond to those risks. Such procedures included examining, on a test basis, evidence regarding the amounts and disclosures in the financial statements. Our audits also included evaluating the accounting principles used and significant estimates made by management, as well as evaluating the overall presentation of the financial statements. Our procedures included confirmation of securities owned as of December 31, 2020 by correspondence with the custodian, transfer agent and brokers. We believe that our audits provide a reasonable basis for our opinion.
/s/PricewaterhouseCoopers LLP
Boston, Massachusetts
February 17, 2021
We have served as the auditor of one or more investment companies in the Goldman Sachs fund complex since 2000.
23
GOLDMAN SACHS VARIABLE INSURANCE TRUST MID CAP VALUE FUND
Voting Results of Special Meeting of Shareholders (Unaudited)
A Special Meeting (the “Meeting”) of the Goldman Sachs Variable Insurance Trust (“VIT”) was held on January 23, 2020 to consider and act upon the proposal below. The Fund has amortized its respective share of the proxy, shareholder meeting and other related costs and GSAM has agreed to reimburse the Fund to the extent such expenses exceed a specified percentage of the Fund’s net assets.
At the Meeting, Dwight L. Bush, Kathryn A. Cassidy, Joaquin Delgado and Gregory G. Weaver were elected to the Trust’s Board of Trustees. In electing trustees, the Trust’s shareholders voted as follows:
| | | | | | | | | | | | | | | | |
| | | | | |
Proposal 1. Election of Trustees | | For | | | Against | | | Withheld | | | Broker Non-Votes | |
| | | | | |
Dwight L. Bush | | | 745,493,677.130 | | | | 0 | | | | 17,848,840.639 | | | | 0 | |
| | | | | |
Kathryn A. Cassidy | | | 746,559,784.810 | | | | 0 | | | | 16,782,732.959 | | | | 0 | |
| | | | | |
Joaquin Delgado | | | 744,593,456.532 | | | | 0 | | | | 18,749,061.237 | | | | 0 | |
| | | | | |
Gregory G. Weaver | | | 746,707,039.321 | | | | 0 | | | | 16,635,478.448 | | | | 0 | |
24
GOLDMAN SACHS VARIABLE INSURANCE TRUST MID CAP VALUE FUND
| | |
| Fund Expenses — Six Month Period Ended December 31, 2020 (Unaudited) | | |
As a shareholder of Institutional or Service Shares of the Fund, you incur ongoing costs, including management fees, distribution and/or service (12b-1) fees (with respect to Service Shares) and other Fund expenses. This example is intended to help you understand your ongoing costs (in dollars) of investing in Institutional Shares and Service Shares of the Fund and to compare these costs with the ongoing costs of investing in other mutual funds.
The example is based on an investment of $1,000 invested at the beginning of the period and held for the entire period from July 1, 2020 through December 31, 2020, which represents a period of 184 days of a 366 day year.
Actual Expenses — The first line under each share class in the table below provides information about actual account values and actual expenses. You may use the information in this line, together with the amount you invested, to estimate the expenses that you paid over the period. Simply divide your account value by $1,000 (for example, an $8,600 account value divided by $1,000=8.6), then multiply the result by the number in the first line under the heading entitled “Expenses Paid” to estimate the expenses you paid on your account during this period.
Hypothetical Example for Comparison Purposes —The second line under each share class in the table below provides information about hypothetical account values and hypothetical expenses based on the Fund’s actual net expense ratio and an assumed rate of return of 5% per year before expenses, which is not the Fund’s actual return. The hypothetical account values and expenses may not be used to estimate the actual ending account balance or expenses you paid for the period. You may use this information to compare the ongoing costs of investing in the Fund and other funds. To do so, compare this 5% hypothetical example with the 5% hypothetical examples that appear in the shareholder reports of the other funds.
Please note that the expenses shown in the table are meant to highlight your ongoing costs only. As a shareholder of the Fund you do not incur any transaction costs, such as sales charges, redemption fees, or exchange fees, but shareholders of other funds may incur such costs. The second line of the table is useful in comparing ongoing costs only and will not help you determine the relative total costs of owning different funds whose shareholders may incur transaction costs.
| | | | | | | | | | | | |
| Share Class | | Beginning Account Value 07/01/20 | | | Ending Account Value 12/31/20 | | | Expenses Paid
for the 6 Months Ended 12/31/20* | |
| Institutional | | | | | | | | | | | | |
| | | | |
| Actual | | $ | 1,000 | | | $ | 1,297.60 | | | $ | 4.85 | |
| Hypothetical 5% return | | | 1,000 | | | | 1,020.91 | + | | | 4.27 | |
| Service | | | | | | | | | | | | |
| | | | |
| Actual | | | 1,000 | | | | 1,296.60 | | | | 6.29 | |
| Hypothetical 5% return | | | 1,000 | | | | 1,019.66 | + | | | 5.53 | |
| | + | Hypothetical expenses are based on the Fund’s actual annualized net expense ratios and an assumed rate of return of 5% per year before expenses. | |
| | * | Expenses are calculated using the Fund’s annualized net expense ratio for each class, which represents the ongoing expenses as a percentage of net assets for the six months ended December 31, 2020. Expenses are calculated by multiplying the annualized net expense ratio by the average account value for the period; then multiplying the result by the number of days in the most recent fiscal half year; and then dividing that result by the number of days in the fiscal year. The annualized net expense ratios for the period were 0.84% and 1.09% for Institutional and Service Shares, respectively. | |
25
GOLDMAN SACHS VARIABLE INSURANCE TRUST MID CAP VALUE FUND
Trustees and Officers (Unaudited)
Independent Trustees
| | | | | | | | | | |
| | | | | |
Name,
Address and Age1 | | Position(s) Held
with the Trust | | Term of Office and
Length of
Time Served2 | | Principal Occupation(s) During Past 5 Years | | Number of
Portfolios in
Fund Complex
Overseen by
Trustee3 | | Other Directorships Held by Trustee4 |
| | | | | |
Jessica Palmer Age: 71 | | Chair of the Board of Trustees | | Since 2018 (Trustee since 2007) | | Ms. Palmer is retired. She was formerly Consultant, Citigroup Human Resources Department (2007-2008); Managing Director, Citigroup Corporate and Investment Banking (previously, Salomon Smith Barney/Salomon Brothers) (1984-2006). Ms. Palmer was a Member of the Board of Trustees of Indian Mountain School (private elementary and secondary school) (2004-2009). Chair of the Board of Trustees — Goldman Sachs Variable Insurance Trust and Goldman Sachs Trust. | | 105 | | None |
| | | | | |
Dwight L. Bush Age: 63 | | Trustee | | Since 2020 | | Ambassador Bush is President and CEO of D.L. Bush & Associates (a financial advisory and private investment firm) (2002-2014 and 2017-present); and was formerly U.S. Ambassador to the Kingdom of Morocco (2014-2017) and a Member of the Board of Directors of Santander Bank, N.A. (2018-2019). Previously, Ambassador Bush served as an Advisory Board Member of Goldman Sachs Trust and Goldman Sachs Variable Insurance Trust (October 2019-January 2020). Trustee — Goldman Sachs Variable Insurance Trust and Goldman Sachs Trust. | | 105 | | None |
| | | | | |
Kathryn A. Cassidy Age: 66 | | Trustee | | Since 2015 | | Ms. Cassidy is retired. Formerly, she was Advisor to the Chairman (May 2014-December 2014); and Senior Vice President and Treasurer (2008-2014), General Electric Company & General Electric Capital Corporation (technology and financial services companies). Trustee — Goldman Sachs Variable Insurance Trust and Goldman Sachs Trust. | | 105 | | None |
| | | | | |
Diana M. Daniels Age: 71 | | Trustee | | Since 2007 | | Ms. Daniels is retired. Formerly, she was Vice President, General Counsel and Secretary, The Washington Post Company (1991-2006). Ms. Daniels is a Trustee Emeritus and serves as a Presidential Councillor of Cornell University (2013-Present); former Member of the Legal Advisory Board, New York Stock Exchange (2003-2006) and of the Corporate Advisory Board, Standish Mellon Management Advisors (2006-2007). Trustee — Goldman Sachs Variable Insurance Trust and Goldman Sachs Trust. | | 105 | | None |
| | | | | |
Joaquin Delgado Age: 60 | | Trustee | | Since 2020 | | Dr. Delgado is retired. He is Director, Hexion Inc. (a specialty chemical manufacturer) (2019-present); and Director, Stepan Company (a specialty chemical manufacturer) (2011-present); and was formerly Executive Vice President, Consumer Business Group of 3M Company (July 2016-July 2019); and Executive Vice President, Health Care Business Group of 3M Company (October 2012-July 2016). Previously, Dr. Delgado served as an Advisory Board Member of Goldman Sachs Trust and Goldman Sachs Variable Insurance Trust (October 2019-January 2020). Trustee — Goldman Sachs Variable Insurance Trust and Goldman Sachs Trust. | | 105 | | Stepan Company (a specialty chemical manufacturer) |
| | | | | | | | | | |
26
GOLDMAN SACHS VARIABLE INSURANCE TRUST MID CAP VALUE FUND
Trustees and Officers (Unaudited) (continued)
Independent Trustees
| | | | | | | | | | |
Name,
Address and Age1 | | Position(s) Held
with the Trust | | Term of Office and
Length of
Time Served2 | | Principal Occupation(s) During Past 5 Years | | Number of
Portfolios in
Fund Complex
Overseen by
Trustee3 | | Other Directorships Held by Trustee4 |
| | | | | |
Roy W. Templin Age: 60 | | Trustee | | Since 2013 | | Mr. Templin is retired. He is Director, Armstrong World Industries, Inc. (a designer and manufacturer of ceiling, wall and suspension system solutions) (2016-Present); and was formerly Chairman of the Board of Directors, Con-Way Incorporated (a transportation, logistics and supply chain management service company) (2014-2015); Executive Vice President and Chief Financial Officer, Whirlpool Corporation (an appliance manufacturer and marketer) (2004-2012). Trustee — Goldman Sachs Variable Insurance Trust and Goldman Sachs Trust. | | 105 | | Armstrong World Industries, Inc. (a ceiling, wall and suspension systems solutions manufacturer) |
| | | | | |
Gregory G. Weaver Age: 69 | | Trustee | | Since 2015 | | Mr. Weaver is retired. He is Director, Verizon Communications Inc. (2015-Present); and was formerly Chairman and Chief Executive Officer, Deloitte & Touche LLP (a professional services firm) (2001-2005 and 2012-2014); and Member of the Board of Directors, Deloitte & Touche LLP (2006-2012). Trustee — Goldman Sachs Variable Insurance Trust and Goldman Sachs Trust. | | 105 | | Verizon Communications Inc. |
27
GOLDMAN SACHS VARIABLE INSURANCE TRUST MID CAP VALUE FUND
Trustees and Officers (Unaudited) (continued)
Interested Trustee*
| | | | | | | | | | |
Name,
Address and Age1 | | Position(s) Held
with the Trust | | Term of Office and
Length of
Time Served2 | | Principal Occupation(s) During Past 5 Years | | Number of
Portfolios in
Fund Complex
Overseen by
Trustee3 | | Other Directorships Held by Trustee4 |
| | | | | |
James A. McNamara Age: 58 | | Trustee and President | | Since 2007 | | Advisory Director, Goldman Sachs (January 2018-Present); Managing Director, Goldman Sachs (January 2000-December 2017); Director of Institutional Fund Sales, GSAM (April 1998-December 2000); and Senior Vice President and Manager, Dreyfus Institutional Service Corporation (January 1993-April 1998). President and Trustee — Goldman Sachs Variable Insurance Trust; Goldman Sachs Trust; Goldman Sachs Trust II; Goldman Sachs MLP and Energy Renaissance Fund; Goldman Sachs ETF Trust; Goldman Sachs Credit Income Fund; and Goldman Sachs Real Estate Diversified Income Fund. | | 158 | | None |
| | | | | | | | | | |
| * | Mr. McNamara is considered to be an “Interested Trustee” because he holds positions with Goldman Sachs and owns securities issued by The Goldman Sachs Group, Inc. Mr. McNamara holds comparable positions with certain other companies of which Goldman Sachs, GSAM or an affiliate thereof is the investment adviser, administrator and/or distributor. |
| 1 | Each Trustee may be contacted by writing to the Trustee, c/o Goldman Sachs, 200 West Street, New York, New York, 10282, Attn: Caroline Kraus. Information is provided as of December 31, 2020. |
| 2 | Subject to such policies as may be adopted by the Board from time-to-time, each Trustee holds office for an indefinite term, until the earliest of: (a) the election of his or her successor; (b) the date the Trustee resigns or is removed by the Board or shareholders, in accordance with the Trust’s Declaration of Trust; or (c) the termination of the Trust. The Board has adopted policies which provide that each Independent Trustee shall retire as of December 31st of the calendar year in which he or she reaches (a) his or her 75th birthday or (b) the 15th anniversary of the date he or she became a Trustee, whichever is earlier, unless a waiver of such requirements shall have been adopted by a majority of the other Trustees. These policies may be changed by the Trustees without shareholder vote. |
| 3 | The Goldman Sachs Fund Complex includes certain other companies listed above for each respective Trustee. As of December 31, 2020, Goldman Sachs Variable Insurance Trust consisted of 13 portfolios; Goldman Sachs Trust consisted of 92 portfolios (90 of which offered shares to the public); Goldman Sachs Trust II consisted of 19 portfolios (17 of which offered shares to the public); Goldman Sachs ETF Trust consisted of 31 portfolios (20 of which offered shares to the public); and Goldman Sachs MLP and Energy Renaissance Fund, Goldman Sachs Credit Income Fund and Goldman Sachs Real Estate Diversified Income Fund each consisted of one portfolio. Goldman Sachs Credit Income Fund did not offer shares to the public. |
| 4 | This column includes only directorships of companies required to report to the Securities and Exchange Commission under the Securities Exchange Act of 1934 (i.e., “public companies”) or other investment companies registered under the Act. |
Additional information about the Trustees is available in the Fund’s Statement of Additional Information, which can be obtained from Goldman Sachs free of charge by calling this toll-free number (in the United States of America): 1-800-526-7384.
28
GOLDMAN SACHS VARIABLE INSURANCE TRUST MID CAP VALUE FUND
Trustees and Officers (Unaudited) (continued)
Officers of the Trust*
| | | | | | |
| | | |
| Name, Address and Age1 | | Position(s) Held with the Trust | | Term of
Office and
Length of
Time Served2 | | Principal Occupation(s) During Past 5 Years |
| | | |
James A. McNamara 200 West Street New York, NY 10282 Age: 58 | | Trustee and President | | Since 2007 | | Advisory Director, Goldman Sachs (January 2018-Present); Managing Director, Goldman Sachs (January 2000-December 2017); Director of Institutional Fund Sales, GSAM (April 1998-December 2000); and Senior Vice President and Manager, Dreyfus Institutional Service Corporation (January 1993-April 1998). President and Trustee — Goldman Sachs Variable Insurance Trust; Goldman Sachs Trust; Goldman Sachs Trust II; Goldman Sachs MLP and Energy Renaissance Fund; Goldman Sachs ETF Trust; Goldman Sachs Credit Income Fund; and Goldman Sachs Real Estate Diversified Income Fund. |
| | | |
Caroline L. Kraus 200 West Street New York, NY 10282 Age: 43 | | Secretary | | Since 2012 | | Managing Director, Goldman Sachs (January 2016-Present); Vice President, Goldman Sachs (August 2006-December 2015); Senior Counsel, Goldman Sachs (January 2020-Present); Associate General Counsel, Goldman Sachs (2012-December 2019); Assistant General Counsel, Goldman Sachs (August 2006-December 2011); and Associate, Weil, Gotshal & Manges, LLP (2002-2006). Secretary — Goldman Sachs Variable Insurance Trust (previously Assistant Secretary (2012)); Goldman Sachs Trust (previously Assistant Secretary (2012)); Goldman Sachs Trust II; Goldman Sachs BDC, Inc.; Goldman Sachs Private Middle Market Credit LLC; Goldman Sachs Private Middle Market Credit II LLC; Goldman Sachs Middle Market Lending Corp.; Goldman Sachs MLP and Energy Renaissance Fund; Goldman Sachs ETF Trust; Goldman Sachs Credit Income Fund; and Goldman Sachs Real Estate Diversified Income Fund. |
| | | |
Joseph F. DiMaria 30 Hudson Street Jersey City, NJ 07302 Age: 52 | | Treasurer, Principal Financial Officer and Principal Accounting Officer | | Since 2017 (Treasurer and Principal Financial Officer since 2019) | | Managing Director, Goldman Sachs (November 2015-Present) and Vice President — Mutual Fund Administration, Columbia Management Investment Advisers, LLC (May 2010-October 2015). Treasurer, Principal Financial Officer and Principal Accounting Officer — Goldman Sachs Variable Insurance Trust (previously Assistant Treasurer (2016)); Goldman Sachs Trust (previously Assistant Treasurer (2016)); Goldman Sachs Trust II (previously Assistant Treasurer (2017)); Goldman Sachs MLP and Energy Renaissance Fund (previously Assistant Treasurer (2017)); Goldman Sachs ETF Trust (previously Assistant Treasurer (2017)); Goldman Sachs Credit Income Fund; and Goldman Sachs Real Estate Diversified Income Fund. |
| * | Represents a partial list of officers of the Trust. Additional information about all the officers is available in the Fund’s Statement of Additional Information, which can be obtained from Goldman Sachs free of charge by calling this toll-free number (in the United States): 1-800-526-7384. |
| 1 | Information is provided as of December 31, 2020. |
| 2 | Officers hold office at the pleasure of the Board of Trustees or until their successors are duly elected and qualified. Each officer holds comparable positions with certain other companies of which Goldman Sachs, GSAM or an affiliate thereof is the investment adviser, administrator and/or distributor. |
Goldman Sachs Variable Insurance Trust — Tax Information (Unaudited)
For the year ended December 31, 2020, 75.30% of the dividends paid from net investment company taxable income by the Mid Cap Value Fund qualify for the dividends received deduction available to corporations.
Pursuant to Section 852 of the Internal Revenue Code, the Mid Cap Value Fund designates $3,753,098 or, if different, the maximum amount allowable, as capital gain dividends paid during the fiscal year ended December 31, 2020.
29
| | |
| TRUSTEES | | OFFICERS |
Jessica Palmer, Chair Dwight L. Bush Kathryn A. Cassidy Diana M. Daniels Joaquin Delgado James A. McNamara Roy W. Templin Gregory G. Weaver | | James A. McNamara, President Joseph F. DiMaria, Principal Financial Officer, Principal Accounting Officer and Treasurer Caroline L. Kraus, Secretary |
GOLDMAN SACHS & CO. LLC
Distributor and Transfer Agent
GOLDMAN SACHS ASSET MANAGEMENT, L.P.
Investment Adviser
200 West Street, New York
New York 10282
Visit our web site at www.GSAMFUNDS.com to obtain the most recent month-end returns.
The reports concerning the Fund included in this shareholder report may contain certain forward-looking statements about the factors that may affect the performance of the Fund in the future. These statements are based on Fund management’s predictions and expectations concerning certain future events and their expected impact on the Fund, such as performance of the economy as a whole and of specific industry sectors, changes in the levels of interest rates, the impact of developing world events, and other factors that may influence the future performance of the Fund. Management believes these forward-looking statements to be reasonable, although they are inherently uncertain and difficult to predict. Actual events may cause adjustments in portfolio management strategies from those currently expected to be employed.
A description of the policies and procedures that the Fund uses to determine how to vote proxies relating to portfolio securities and information regarding how the Fund voted proxies relating to portfolio securities for the 12-month period ended December 31 is available (i) without charge, upon request by calling 1-800-621-2550; and (ii) on the Securities and Exchange Commission (“SEC”) web site at http://www.sec.gov.
The Fund will file its portfolio holdings information for each month in a fiscal quarter within 60 days after the end of the relevant fiscal quarter on Form N-PORT. Portfolio holdings information for the third month of each fiscal quarter will be made available on the SEC’s web site at http://www.sec.gov. Portfolio holdings information may be obtained upon request and without charge by calling 1-800-526-7384 (for Retail Shareholders) or 1-800-621-2550 (for Institutional Shareholders).
Views and opinions expressed are for informational purposes only and do not constitute a recommendation by GSAM to buy, sell, or hold any security. Views and opinions are current as of the date of this presentation and may be subject to change, they should not be construed as investment advice.
Goldman Sachs & Co. LLC (“Goldman Sachs”) does not provide legal, tax or accounting advice. Any statement contained in this communication (including any attachments) concerning U.S. tax matters was not intended or written to be used, and cannot be used, for the purpose of avoiding penalties under the Internal Revenue Code, and was written to support the promotion or marketing of transaction or matter addressed. Clients of Goldman Sachs should obtain their own independent tax advice based on their particular circumstances.
The website links provided are for your convenience only and are not an endorsement or recommendation by GSAM of any of these websites or the products or services offered. GSAM is not responsible for the accuracy and validity of the content of these websites.
Fund holdings and allocations shown are as of December 31, 2020 and may not be representative of future investments. Fund holdings should not be relied on in making investment decisions and should not be construed as research or investment advice regarding particular securities. Current and future holdings are subject to risk.
References to indices, benchmarks or other measures of relative market performance over a specified period of time are provided for your information only and do not imply that the portfolio will achieve similar results. The index composition may not reflect the manner in which a portfolio is constructed. While an adviser seeks to design a portfolio which reflects appropriate risk and return features, portfolio characteristics may deviate from those of the benchmark.
The Global Industry Classification Standard (“GICS”) was developed by and is the exclusive property and a service mark of Morgan Stanley Capital International Inc. (“MSCI”) and Standard & Poor’s, a division of The McGraw-Hill Companies, Inc. (“S&P”) and is licensed for use by Goldman Sachs. Neither MSCI, S&P nor any other party involved in making or compiling the GICS or any GICS classifications makes any express or implied warranties or representations with respect to such standard or classification (or the results to be obtained by the use thereof), and all such parties hereby expressly disclaim all warranties of originality, accuracy, completeness, merchantability or fitness for a particular purpose with respect to any of such standard or classification. Without limiting any of the foregoing, in no event shall MSCI, S&P, any of their affiliates or any third party involved in making or compiling the GICS or any GICS classifications have any liability for any direct, indirect, special, punitive, consequential or any other damages (including lost profits) even if notified of the possibility of such damages.
The portfolio risk management process includes an effort to monitor and manage risk, but does not imply low risk.
Shares of the Goldman Sachs VIT Funds are offered to separate accounts of participating life insurance companies for the purpose of funding variable annuity contracts and variable life insurance policies. Shares of the Fund are not offered directly to the general public. The variable annuity contracts and variable life insurance policies are described in the separate prospectuses issued by participating insurance companies. You should refer to those prospectuses for information about surrender charges, mortality and expense risk fees and other charges that may be assessed by participating insurance companies under the variable annuity contracts or variable life insurance policies. Such fees or charges, if any, may affect the return you may realize with respect to your investments. Ask your representative for more complete information. Please consider a fund’s objectives, risks and charges and expenses, and read the prospectus carefully before investing. The prospectus contains this and other information about the Fund.
This material is not authorized for distribution to prospective investors unless preceded or accompanied by a current prospectus or summary prospectus, if applicable. Investors should consider the Fund’s objective, risks, and charges and expenses, and read the summary prospectus, if available, and/or the prospectus carefully before investing or sending money. The summary prospectus, if available, and the prospectus contain this and other information about the Fund and may be obtained from your authorized dealer or from Goldman Sachs & Co. LLC by calling 1-800-621-2550.
This report is prepared for the general information of contract owners and is not an offer of shares of the Goldman Sachs Variable Insurance Trust — Goldman Sachs Mid Cap Value Fund.
© 2021 Goldman Sachs. All rights reserved.
VITMCVAR-21/229745-OTU-1350839
Goldman
Sachs Variable Insurance Trust
Goldman Sachs Government
Money Market Fund
Beginning on or after January 1, 2021, you may not receive paper copies of the Fund’s annual and semi-annual shareholder reports from the insurance company that offers your variable insurance contract or your financial intermediary, unless you specifically request paper copies of the reports from the insurance company or from your financial intermediary. Instead, the reports will be made available on a website, and you will be notified by mail each time a report is posted and provided with a website link to access the report.
If you already elected to receive shareholder reports electronically, you will not be affected by this change and you need not take any action. At any time, you may elect to receive reports and certain communications from the insurance company electronically by contacting your insurance company or your financial intermediary.
You may elect to receive all future shareholder reports in paper free of charge. You can inform the insurance company or your financial intermediary that you wish to receive paper copies of reports. Your election to receive reports in paper will apply to all Goldman Sachs Funds available under your contract and may apply to all funds held with your financial intermediary.
Annual Report
December 31, 2020

You could lose money by investing in the Fund. Although the Fund seeks to preserve the value of your investment at $1.00 per share, it cannot guarantee it will do so. An investment in the Fund is not a deposit of the bank and is not insured or guaranteed by the Federal Deposit Insurance Corporation or any other government agency. The Fund’s sponsor has no legal obligation to provide financial support to the Fund, and you should not expect that the sponsor will provide financial support to the Fund at any time.
GOLDMAN SACHS VARIABLE INSURANCE TRUST GOVERNMENT MONEY MARKET FUND
INVESTMENT OBJECTIVE
The Fund seeks to maximize current income to the extent consistent with the preservation of capital and the maintenance of liquidity by investing exclusively in high quality money market instruments.
Portfolio Management Discussion and Analysis
Below, the Goldman Sachs Money Market Portfolio Management Team discusses the Goldman Sachs Variable Insurance Trust — Goldman Sachs Government Money Market Fund’s (the “Fund”) performance and positioning for the 12-month period ended December 31, 2020 (the “Reporting Period”).
How did the Fund perform during the Reporting Period?
The Fund’s Institutional Shares’ standardized 7-day current yield was 0.00% and their standardized 7-day effective yield was 0.00% as of December 31, 2020. The Institutional Shares’ one-month simple average yield was 0.01% as of December 31, 2020. The Institutional Shares’ 7-day distribution yield as of December 31, 2020 was 0.01%.
The Fund’s Service Shares’ standardized 7-day current yield was 0.00% and their standardized 7-day effective yield was 0.00% as of December 31, 2020. The Service Shares’ one-month simple average yield was 0.01% as of December 31, 2020. The Service Shares’ 7-day distribution yield as of December 31, 2020 was 0.01%.
The yields represent past performance. Past performance does not guarantee future results. Current performance may be lower or higher than the performance quoted above.
Yields will fluctuate as market conditions change. The yield quotations more closely reflect the current earnings of the Fund than total return quotations.
What economic and market factors most influenced the money markets as a whole during the Reporting Period?
The Reporting Period was one wherein money market yields moved lower, with the money markets most influenced by U.S. Federal Reserve (“Fed”) policy and the outlook for the U.S. economy.
As the Reporting Period began in January 2020, the targeted federal funds (“fed funds”) rate stood in a range of between 1.50% and 1.75%. While the median projection of the Fed’s Open Market Committee had indicated that policymakers expected to keep the fed funds rate on hold until 2021, the spread of COVID-19 in early 2020 caused a sharp decline in U.S. economic activity and a corresponding surge in job layoffs. Conditions had deteriorated in the financial markets during February and March, leading the Fed to begin purchases of U.S. Treasury securities and agency mortgage-backed securities, as it sought to ensure smooth market functioning. In March, over the course of two meetings, Fed officials lowered the fed funds rate to a range of between 0% and 0.25%. Policymakers also signaled the monetary policy backdrop was likely to remain accommodative and short-term interest rates would likely stay low for the foreseeable future. In addition, Fed officials adopted a flexible form of average inflation targeting wherein they would aim for an inflation rate moderately above 2% following periods when inflation has run persistently below 2%, seeking an average of 2% over time. The Fed also began offering large-scale overnight and term repurchase agreement operations, established temporary U.S. dollar liquidity arrangements with other central banks and established a temporary repurchase agreement facility for foreign and international monetary authorities.
Positive news about COVID-19 vaccines benefited the medium-term outlook for U.S. economic activity and growth as well as the labor market. However, it was unclear to what extent stronger economic growth and a smaller output gap would translate to higher price inflation.
The fed funds rate remained unchanged through the remainder of the Reporting Period. In this environment, the yields of money market funds generally remained stable and close to zero. Investments in U.S. taxable and tax-exempt money market funds declined during the Reporting Period. Much of the decrease could be attributed to an improvement in investor risk sentiment. Investors rotated into riskier asset classes as uncertainties surrounding the outcome of the November U.S. election and the effectiveness of COVID-19 vaccines eased.
During the Reporting Period overall, the money market yield curve, or spectrum of maturities, steepened, as U.S. Treasury yields fell significantly across the maturity curve, but shorter-term interest rates dropped more than their longer-term counterparts,
1
GOLDMAN SACHS VARIABLE INSURANCE TRUST GOVERNMENT MONEY MARKET FUND
reflecting the economic stress caused by the COVID-19 pandemic as well as the Fed’s easing of monetary policy. (Yield curve is a spectrum of interest rates based on maturities of varying lengths. A steepening yield curve is one wherein the differential in yields between longer-term and shorter-term maturities widens; opposite of a flattening yield curve.)
What key factors were responsible for the Fund’s performance during the Reporting Period?
The Fund’s yields fell during the Reporting Period due primarily to the economic and market factors discussed above. The Fund remained highly liquid throughout.
The story of the Reporting Period was dominated by the COVID-19 pandemic and the subsequent fiscal and monetary response of governments around the world. Uncertainty and volatility drove investors into safe, liquid assets, such as government money market funds, thereby increasing demand for these mutual funds. The market’s expectation that interest rates would remain low and monetary conditions would remain accommodative motivated our Fund positioning along the yield curve and in specific securities, both of which contributed positively to its overall performance. Duration management and duration positioning play a key role in our management philosophy. That said, it should be noted that regardless of interest rate conditions, we manage the Fund consistently. Our investment approach has always been tri-fold — to seek preservation of capital, daily liquidity and maximization of yield potential. We manage interest and credit risk daily. Whether interest rates are historically low, high or in-between, we intend to continue to use our actively managed approach to provide the best possible return within the framework of the Fund’s guidelines and objectives.
How did you manage the Fund’s weighted average maturity during the Reporting Period?
On December 31, 2019, the Fund’s weighted average maturity was 37 days. During the first quarter of 2020, we targeted a weighted average maturity for the Fund in a 12 to 47 day range. During the second quarter of 2020, we maintained a weighted average maturity for the Fund in a 44 to 48 day range.
During the third quarter of 2020, we targeted a weighted average maturity for the Fund in a 48 to 53 day range. During the fourth quarter of 2020, we maintained a weighted average maturity for the Fund in a 50 to 58 day range, moving up to a weighted average maturity of 58 days by the end of December 2020.
Throughout the Reporting Period, we focused on U.S. government repurchase agreements, U.S. Treasuries, U.S. government agency securities, and, to a lesser extent, U.S. Treasury repurchase agreement and variable rate demand notes when and where we saw what we considered to be attractive opportunities.
The weighted average maturity of a money market fund is a measure of its price sensitivity to changes in interest rates. Also known as effective maturity, weighted average maturity measures the weighted average of the maturity date of bonds held by the Fund taking into consideration any available maturity shortening features.
How did you manage the Fund’s weighted average life during the Reporting Period?
During the Reporting Period, we managed the weighted average life of the Fund between 91 days and 120 days. The weighted average life of the Fund was 93 days as of December 31, 2020. The weighted average life of a money market fund is a measure of a money market fund’s price sensitivity to changes in liquidity and/or credit risk.
Under amendments to SEC Rule 2a-7 that became effective in May 2010, the maximum allowable weighted average life of a money market fund is 120 days. While one of the goals of the SEC’s money market fund rule is to reinforce conservative investment practices across the money market fund industry, our security selection process has long emphasized conservative investment choices.
How was the Fund invested during the Reporting Period?
The Fund had investments in U.S. government repurchase agreements, U.S. Treasury securities, U.S. government agency securities, and, to a lesser extent, U.S. Treasury repurchase agreements and variable rate demand notes during the Reporting Period.
Throughout, we stayed true to our investment discipline, favoring liquidity and high quality credits over added yield. The primary focal points for our team are consistently managing interest rate risk and credit risk. We were able to navigate interest rate risk by adjusting the Fund’s weighted average maturity longer or shorter as market conditions shifted and to mitigate potential credit risk by buying high quality, creditworthy names, strategies which added to the Fund’s performance during the Reporting Period. Throughout the Reporting Period, we managed the Fund’s allocations to different sub-sectors of the money market depending on their relative value. We also adapted a flexible approach to our duration management and positioning so that we could take advantage of opportunities wherever they may arise.
2
GOLDMAN SACHS VARIABLE INSURANCE TRUST GOVERNMENT MONEY MARKET FUND
Did you make any changes in the Fund’s portfolio during the Reporting Period?
As indicated earlier, we made adjustments to the Fund’s weighted average maturity, weighted average life and specific security type composition allocations based on then-current market conditions, our near-term view, and anticipated and actual Fed monetary policy statements. During the Reporting Period, we generally increased the Fund’s exposure to U.S. Treasury securities and U.S. Treasury repurchase agreements and reduced its exposure to U.S. government repurchase agreements and U.S. government agency securities.
What is the Fund’s tactical view and strategy for the months ahead?
At the end of the Reporting Period, we believed that interest rates would remain low in the near term and that the Fed was ready to respond to market conditions as the U.S. and its economy recover from the COVID-19 pandemic. In our view, news of the efficacy of COVID-19 vaccine candidates and the beginning of actual inoculations boded well for the medium-term economic outlook, but we considered the near-term picture less certain given the backdrop of rapidly rising COVID-19 infections and increased restrictions at the end of the Reporting Period. We believed the resurgence of COVID-19 cases and efforts to curb its spread could weigh on economic activity in the short term. Regarding fiscal policy, the Congress’ additional fiscal stimulus at the end of the Reporting Period and the pending swearing in of a new President were positive developments, though there were still major segments of the economy that remained under significant pressure, and the road ahead would still likely be bumpy.
Looking ahead, our strategy continues to be flexibly guided by shifting market conditions, positioning the Fund and its duration to seek to take advantage of anticipated interest rate movements or lack thereof. As always, we intend to continue to use our actively managed approach to seek the best possible return within the framework of the Fund’s investment guidelines and objectives. In addition, we will continue to manage interest, liquidity and credit risk daily.
We will, of course, continue to closely monitor economic data, Fed policy, and any shifts in the money market yield curve, as we strive to strategically navigate the interest rate environment.
3
FUND BASICS
FUND COMPOSITION†
Security Type
(Percentage of Net Assets)
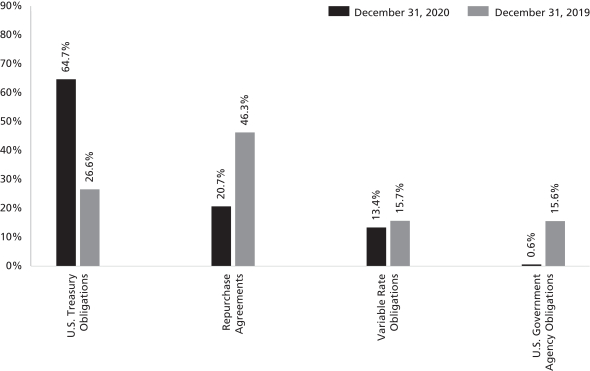
| † | The Fund is actively managed and, as such, its portfolio composition may differ over time. The percentage shown for each investment category reflects the value (based on amortized cost) of investments in that category as a percentage of net assets. Figures in the above chart may not sum to 100% due to the exclusion of other assets and liabilities. |
For more information about your Fund, please refer to www.GSAMFUNDS.com. There, you can learn more about your Fund’s investment strategies, holdings, and performance.
4
GOLDMAN SACHS VARIABLE INSURANCE TRUST GOVERNMENT MONEY MARKET FUND
Schedule of Investments
December 31, 2020
| | | | | | | | | | | | | | |
Principal
Amount | | | Interest
Rate | | | Maturity
Date | | | Amortized
Cost | |
|
| U.S. Government Agency Obligations – 0.6% | |
| | Federal Home Loan Bank | |
| $ | 7,500,000 | | | | 0.530 | % | | | 03/15/21 | | | $ | 7,492,092 | |
| | | | | | | | | | | | | | |
|
| U.S. Treasury Obligations – 64.7% | |
| | U.S. Cash Management Bills | |
| $ | 5,500,000 | | | | 0.112 | % | | | 01/05/21 | | | $ | 5,499,933 | |
| | 7,200,000 | | | | 0.122 | | | | 01/19/21 | | | | 7,199,568 | |
| | 2,500,000 | | | | 0.114 | | | | 01/26/21 | | | | 2,499,800 | |
| | 15,000,000 | | | | 0.076 | | | | 02/09/21 | | | | 14,998,781 | |
| | 20,000,000 | | | | 0.107 | | | | 03/09/21 | | | | 19,996,092 | |
| | 1,413,000 | | | | 0.112 | | | | 03/16/21 | | | | 1,412,753 | |
| | 15,000,000 | | | | 0.112 | | | | 03/16/21 | | | | 14,996,608 | |
| | 3,500,000 | | | | 0.086 | | | | 03/23/21 | | | | 3,499,331 | |
| | 1,700,000 | | | | 0.114 | | | | 03/23/21 | | | | 1,699,572 | |
| | 1,700,000 | | | | 0.115 | | | | 03/23/21 | | | | 1,699,568 | |
| | 500,000 | | | | 0.119 | | | | 03/23/21 | | | | 499,868 | |
| | 20,100,000 | | | | 0.122 | | | | 03/23/21 | | | | 20,094,573 | |
| | 3,000,000 | | | | 0.086 | | | | 03/30/21 | | | | 2,999,377 | |
| | 8,000,000 | | | | 0.117 | | | | 03/30/21 | | | | 7,997,751 | |
| | 2,000,000 | | | | 0.086 | | | | 04/06/21 | | | | 1,999,551 | |
| | 12,000,000 | | | | 0.107 | | | | 04/06/21 | | | | 11,996,675 | |
| | 1,500,000 | | | | 0.091 | | | | 04/13/21 | | | | 1,499,618 | |
| | 13,000,000 | | | | 0.107 | | | | 04/13/21 | | | | 12,996,133 | |
| | 6,000,000 | | | | 0.101 | | | | 04/20/21 | | | | 5,998,183 | |
| | 4,310,000 | | | | 0.091 | | | | 05/04/21 | | | | 4,308,675 | |
| | 12,500,000 | | | | 0.091 | | | | 05/11/21 | | | | 12,495,938 | |
| | 9,400,000 | | | | 0.091 | | | | 05/18/21 | | | | 9,396,781 | |
| | 9,400,000 | | | | 0.091 | | | | 05/25/21 | | | | 9,396,616 | |
| | 3,500,000 | | | | 0.096 | | | | 06/01/21 | | | | 3,498,605 | |
| | United States Treasury Bills | |
| | 300,000 | | | | 0.102 | | | | 01/07/21 | | | | 299,995 | |
| | 200,000 | | | | 0.112 | | | | 01/07/21 | | | | 199,996 | |
| | 25,000,000 | | | | 0.122 | | | | 01/07/21 | | | | 24,999,500 | |
| | 1,425,000 | | | | 0.102 | | | | 01/12/21 | | | | 1,424,952 | |
| | 2,700,000 | | | | 0.102 | | | | 01/14/21 | | | | 2,699,903 | |
| | 400,000 | | | | 0.117 | | | | 01/14/21 | | | | 399,983 | |
| | 11,200,000 | | | | 0.148 | | | | 01/14/21 | | | | 11,199,414 | |
| | 15,400,000 | | | | 0.071 | | | | 01/21/21 | | | | 15,399,401 | |
| | 300,000 | | | | 0.102 | | | | 01/21/21 | | | | 299,983 | |
| | 100,000 | | | | 0.112 | | | | 01/21/21 | | | | 99,994 | |
| | 3,270,000 | | | | 0.132 | | | | 01/21/21 | | | | 3,269,764 | |
| | 10,000,000 | | | | 0.076 | | | | 01/28/21 | | | | 9,999,438 | |
| | 16,500,000 | | | | 0.132 | | | | 01/28/21 | | | | 16,498,391 | |
| | 20,000,000 | | | | 0.076 | | | | 02/02/21 | | | | 19,998,667 | |
| | 1,400,000 | | | | 0.112 | | | | 02/02/21 | | | | 1,399,863 | |
| | 11,800,000 | | | | 0.107 | | | | 02/04/21 | | | | 11,798,830 | |
| | 5,250,000 | | | | 0.112 | | | | 02/11/21 | | | | 5,249,342 | |
| | 11,830,000 | | | | 0.122 | | | | 02/11/21 | | | | 11,828,383 | |
| | 17,500,000 | | | | 0.097 | | | | 02/16/21 | | | | 17,497,876 | |
| | 9,400,000 | | | | 0.122 | | | | 02/18/21 | | | | 9,398,496 | |
| | 25,000,000 | | | | 0.092 | | | | 02/23/21 | | | | 24,996,688 | |
| | 7,000,000 | | | | 0.102 | | | | 02/23/21 | | | | 6,998,969 | |
| | 4,600,000 | | | | 0.573 | | | | 02/25/21 | | | | 4,599,157 | |
| | 6,000,000 | | | | 0.096 | | | | 03/02/21 | | | | 5,999,050 | |
| | |
|
| U.S. Treasury Obligations – (continued) | |
| | United States Treasury Bills – (continued) | |
| 2,475,500 | | | | 0.086 | | | | 03/04/21 | | | | 2,475,138 | |
| | 10,000,000 | | | | 0.177 | | | | 03/04/21 | | | | 9,998,192 | |
| | 15,000,000 | | | | 0.177 | | | | 03/04/21 | | | | 14,997,029 | |
| | 13,000,000 | | | | 0.101 | | | | 03/11/21 | | | | 12,997,508 | |
| | 15,000,000 | | | | 0.127 | | | | 03/11/21 | | | | 14,996,406 | |
| | 4,570,000 | | | | 0.122 | | | | 03/18/21 | | | | 4,569,083 | |
| | 7,000,000 | | | | 0.091 | | | | 03/25/21 | | | | 6,998,548 | |
| | 13,900,000 | | | | 0.107 | | | | 03/25/21 | | | | 13,896,635 | |
| | 10,000,000 | | | | 0.091 | | | | 04/01/21 | | | | 9,997,750 | |
| | 41,000,000 | | | | 0.107 | | | | 04/01/21 | | | | 40,989,238 | |
| | 800,000 | | | | 0.107 | | | | 04/08/21 | | | | 799,774 | |
| | 1,000,000 | | | | 0.109 | | | | 04/08/21 | | | | 999,710 | |
| | 22,000,000 | | | | 0.112 | | | | 04/08/21 | | | | 21,993,479 | |
| | 5,000,000 | | | | 0.086 | | | | 04/15/21 | | | | 4,998,772 | |
| | 3,500,000 | | | | 0.117 | | | | 04/15/21 | | | | 3,498,837 | |
| | 9,300,000 | | | | 0.091 | | | | 04/22/21 | | | | 9,297,419 | |
| | 10,000,000 | | | | 0.117 | | | | 04/22/21 | | | | 9,996,454 | |
| | 3,614,000 | | | | 0.112 | | | | 04/29/21 | | | | 3,612,697 | |
| | 25,000,000 | | | | 0.112 | | | | 05/06/21 | | | | 24,990,451 | |
| | 25,700,000 | | | | 0.112 | | | | 05/13/21 | | | | 25,689,634 | |
| | 20,000,000 | | | | 0.101 | | | | 05/20/21 | | | | 19,992,278 | |
| | 10,000,000 | | | | 0.091 | | | | 05/27/21 | | | | 9,996,350 | |
| | 16,500,000 | | | | 0.091 | | | | 06/03/21 | | | | 16,493,689 | |
| | 15,000,000 | | | | 0.091 | | | | 06/10/21 | | | | 14,994,000 | |
| | 10,000,000 | | | | 0.086 | | | | 06/17/21 | | | | 9,996,057 | |
| | 20,000,000 | | | | 0.091 | | | | 06/24/21 | | | | 19,991,300 | |
| | 15,000,000 | | | | 0.101 | | | | 07/01/21 | | | | 14,992,458 | |
| | United States Treasury Inflation Indexed Note | |
| | 2,618,726 | | | | 1.125 | | | | 01/15/21 | | | | 2,619,724 | |
| | United States Treasury Notes | |
| | 600,000 | | | | 1.375 | | | | 01/31/21 | | | | 600,001 | |
| | 200,000 | | | | 2.125 | | | | 01/31/21 | | | | 200,237 | |
| | 900,000 | | | | 2.250 | | | | 02/15/21 | | | | 901,484 | |
| | 900,000 | | | | 3.625 | | | | 02/15/21 | | | | 902,992 | |
| | 7,900,000 | | | | 2.500 | | | | 02/28/21 | | | | 7,916,959 | |
| | 1,700,000 | | | | 2.375 | | | | 03/15/21 | | | | 1,703,368 | |
| | 340,000 | | | | 1.125 | | | | 06/30/21 | | | | 341,730 | |
| | 500,000 | | | | 2.125 | (a) | | | 06/30/21 | | | | 504,961 | |
| | 3,100,000 | | | | 2.625 | | | | 07/15/21 | | | | 3,142,041 | |
| | 700,000 | | | | 1.125 | | | | 07/31/21 | | | | 704,155 | |
| | 1,300,000 | | | | 1.125 | | | | 08/31/21 | | | | 1,308,767 | |
| | 300,000 | | | | 1.500 | | | | 08/31/21 | | | | 302,766 | |
| | 700,000 | | | | 2.000 | | | | 08/31/21 | | | | 708,800 | |
| | |
| | TOTAL U.S. TREASURY OBLIGATIONS | | | $ | 751,343,256 | |
| | |
| | | | | | | | | | | | | | |
|
| Variable Rate Obligations(b) – 13.4% | |
| | Federal Farm Credit Bank (1 Mo. LIBOR - 0.05%) | |
| $ | 1,300,000 | | | | 0.109 | % | | | 01/13/21 | | | $ | 1,299,998 | |
| | Federal Farm Credit Bank (1 Mo. LIBOR + 0.03%) | |
| | 3,100,000 | | | | 0.189 | | | | 09/15/21 | | | | 3,099,956 | |
| | Federal Farm Credit Bank (1 Mo. LIBOR + 0.09%) | |
| | 500,000 | | | | 0.244 | | | | 09/13/21 | | | | 500,000 | |
| | |
| | |
| The accompanying notes are an integral part of these financial statements. | | 5 |
GOLDMAN SACHS VARIABLE INSURANCE TRUST GOVERNMENT MONEY MARKET FUND
Schedule of Investments (continued)
December 31, 2020
| | | | | | | | | | | | | | |
Principal
Amount | | | Interest
Rate | | | Maturity
Date | | | Amortized
Cost | |
|
| Variable Rate Obligations(b) – (continued) | |
| | Federal Farm Credit Bank (1 Mo. LIBOR + 0.10%) | |
| $ | 1,100,000 | | | | 0.246 | % | | | 09/09/21 | | | $ | 1,100,000 | |
| | 1,000,000 | | | | 0.245 | | | | 12/23/21 | | | | 1,000,000 | |
| | Federal Farm Credit Bank (1 Mo. LIBOR + 0.13%) | |
| | 600,000 | | | | 0.283 | | | | 11/05/21 | | | | 600,000 | |
| | Federal Farm Credit Bank (3 Mo. LIBOR - 0.07%) | |
| | 700,000 | | | | 0.168 | | | | 07/02/21 | | | | 700,000 | |
| | Federal Farm Credit Bank (3 Mo. U.S. T-Bill MMY + 0.15%) | |
| | 200,000 | | | | 0.240 | | | | 04/23/21 | | | | 200,000 | |
| | Federal Farm Credit Bank (FEDL01 + 0.12%) | |
| | 1,200,000 | | | | 0.205 | | | | 02/14/22 | | | | 1,200,000 | |
| | Federal Farm Credit Bank (FEDL01 + 0.15%) | |
| | 1,600,000 | | | | 0.235 | | | | 01/21/21 | | | | 1,599,998 | |
| | Federal Farm Credit Bank (FEDL01 + 0.17%) | |
| | 1,900,000 | | | | 0.260 | | | | 01/13/22 | | | | 1,899,852 | |
| | Federal Farm Credit Bank (FEDL01 + 0.20%) | |
| | 2,100,000 | | | | 0.290 | | | | 11/29/21 | | | | 2,099,983 | |
| | Federal Farm Credit Bank (FEDL01 + 0.21%) | |
| | 1,300,000 | | | | 0.300 | | | | 12/13/21 | | | | 1,299,902 | |
| | Federal Farm Credit Bank (Prime Rate - 2.87%) | |
| | 500,000 | | | | 0.380 | | | | 02/07/22 | | | | 499,945 | |
| | Federal Farm Credit Bank (Prime Rate - 2.94%) | |
| | 800,000 | | | | 0.310 | | | | 02/26/21 | | | | 800,000 | |
| | 800,000 | | | | 0.310 | | | | 11/08/21 | | | | 800,000 | |
| | Federal Farm Credit Bank (Prime Rate - 2.95%) | |
| | 2,700,000 | | | | 0.300 | | | | 03/15/21 | | | | 2,700,000 | |
| | Federal Farm Credit Bank (Prime Rate - 2.96%) | |
| | 2,200,000 | | | | 0.290 | | | | 03/29/21 | | | | 2,200,000 | |
| | 1,100,000 | | | | 0.290 | | | | 12/13/21 | | | | 1,099,948 | |
| | Federal Farm Credit Bank (Prime Rate - 2.97%) | |
| | 1,700,000 | | | | 0.285 | | | | 04/08/21 | | | | 1,700,000 | |
| | Federal Farm Credit Bank (Prime Rate - 2.98%) | |
| | 1,300,000 | | | | 0.275 | | | | 02/26/21 | | | | 1,300,000 | |
| | Federal Farm Credit Bank (Prime Rate - 3.01%) | |
| | 1,800,000 | | | | 0.240 | | | | 02/25/21 | | | | 1,799,987 | |
| | Federal Farm Credit Bank (Prime Rate - 3.02%) | |
| | 1,800,000 | | | | 0.234 | | | | 01/13/22 | | | | 1,800,000 | |
| | Federal Farm Credit Bank (Prime Rate - 3.10%) | |
| | 1,600,000 | | | | 0.150 | | | | 12/02/22 | | | | 1,600,000 | |
| | Federal Farm Credit Bank (Prime Rate - 3.11%) | |
| | 1,200,000 | | | | 0.140 | | | | 11/21/22 | | | | 1,199,908 | |
| | Federal Farm Credit Bank (SOFR + 0.12%) | |
| | 800,000 | | | | 0.210 | | | | 03/18/21 | | | | 800,000 | |
| | Federal Farm Credit Bank (SOFR + 0.13%) | |
| | 500,000 | | | | 0.220 | | | | 02/11/22 | | | | 500,000 | |
| | Federal Farm Credit Bank (SOFR + 0.18%) | |
| | 2,800,000 | | | | 0.270 | | | | 01/14/22 | | | | 2,797,337 | |
| | Federal Home Loan Bank (1 Mo. LIBOR + 0.02%) | |
| | 700,000 | | | | 0.158 | | | | 03/24/21 | | | | 700,000 | |
| | Federal Home Loan Bank (1 Mo. LIBOR + 0.04%) | |
| | 700,000 | | | | 0.183 | | | | 06/24/21 | | | | 700,000 | |
| | Federal Home Loan Bank (3 Mo. LIBOR - 0.07%) | |
| | 6,500,000 | | | | 0.168 | | | | 04/01/21 | | | | 6,500,000 | |
| | Federal Home Loan Bank (3 Mo. LIBOR - 0.08%) | |
| | 3,300,000 | | | | 0.164 | | | | 03/19/21 | | | | 3,300,000 | |
| | |
|
| Variable Rate Obligations(b) – (continued) | |
| | Federal Home Loan Bank (3 Mo. LIBOR - 0.09%) | |
| 2,700,000 | | | | 0.152 | | | | 07/06/21 | | | | 2,700,000 | |
| | Federal Home Loan Bank (3 Mo. LIBOR - 0.11%) | |
| | 1,400,000 | | | | 0.120 | | | | 04/08/21 | | | | 1,400,000 | |
| | 500,000 | | | | 0.120 | | | | 04/09/21 | | | | 500,000 | |
| | Federal Home Loan Bank (SOFR + 0.17%) | |
| | 4,200,000 | | | | 0.260 | | | | 07/21/22 | | | | 4,200,000 | |
| | Federal Home Loan Bank (SOFR + 0.35%) | |
| | 10,000,000 | | | | 0.440 | | | | 09/23/21 | | | | 10,000,000 | |
| | Federal Home Loan Mortgage Corp. (SOFR + 0.29%) | |
| | 10,000,000 | | | | 0.380 | | | | 10/01/21 | | | | 10,000,000 | |
| | Federal Home Loan Mortgage Corp. (SOFR + 0.30%) | |
| | 21,400,000 | | | | 0.390 | | | | 09/24/21 | | | | 21,400,000 | |
| | Federal Home Loan Mortgage Corp. (SOFR + 0.31%) | |
| | 2,000,000 | | | | 0.400 | | | | 01/03/22 | | | | 2,000,000 | |
| | Federal Home Loan Mortgage Corp. (SOFR + 0.32%) | |
| | 5,000,000 | | | | 0.410 | | | | 09/27/21 | | | | 5,000,000 | |
| | 3,500,000 | | | | 0.410 | | | | 09/30/21 | | | | 3,500,000 | |
| | Federal National Mortgage Association (SOFR + 0.10%) | |
| | 700,000 | | | | 0.190 | | | | 12/03/21 | | | | 698,373 | |
| | Federal National Mortgage Association (SOFR + 0.29%) | |
| | 3,300,000 | | | | 0.390 | | | | 10/04/21 | | | | 3,300,000 | |
| | Federal National Mortgage Association (SOFR + 0.30%) | |
| | 6,500,000 | | | | 0.390 | | | | 09/24/21 | | | | 6,500,000 | |
| | Federal National Mortgage Association (SOFR + 0.34%) | |
| | 10,500,000 | | | | 0.430 | | | | 10/20/21 | | | | 10,500,000 | |
| | 9,275,000 | | | | 0.430 | | | | 12/30/21 | | | | 9,275,000 | |
| | 7,000,000 | | | | 0.430 | | | | 01/21/22 | | | | 7,000,000 | |
| | Federal National Mortgage Association (SOFR + 0.35%) | |
| | 2,000,000 | | | | 0.440 | | | | 10/15/21 | | | | 2,000,000 | |
| | Federal National Mortgage Association (SOFR + 0.36%) | |
| | 1,000,000 | | | | 0.450 | | | | 01/20/22 | | | | 1,000,000 | |
| U.S. International Development Finance Corp. (3 Mo. U.S. T-Bill
+ 0.00%) |
|
| | 1,000,000 | | | | 0.130 | | | | 01/07/21 | | | | 1,000,000 | |
| | 1,611,031 | | | | 0.130 | | | | 01/07/21 | | | | 1,611,031 | |
| | 2,298,136 | | | | 0.130 | | | | 01/07/21 | | | | 2,298,136 | |
| | |
| | TOTAL VARIABLE RATE OBLIGATIONS | | | $ | 155,279,354 | |
| | |
| TOTAL INVESTMENTS BEFORE
REPURCHASE AGREEMENTS |
| | $ | 914,114,702 | |
| | |
| | | | | | | | | | | | | | |
|
| Repurchase Agreements(c) – 20.7% | |
| | Bank of Montreal | |
| $ | 2,000,000 | | | | 0.100 | %(d) | | | 01/07/21 | | | $ | 2,000,000 | |
| | Maturity Value: $2,000,522 | |
| | Settlement Date: 12/15/20 | |
| Collateralized by Federal Home Loan Bank, 2.750%, due
03/13/26, Federal National Mortgage Association, 2.500% to
3.500%, due 05/01/48 to 09/01/50, a U.S. Treasury Bill,
0.000%, due 01/07/21 and a U.S. Treasury Note, 2.375%, due
04/30/26. The aggregate market value of the collateral,
including accrued interest, was $2,040,950. |
|
| | 2,000,000 | | | | 0.110 | (d) | | | 01/07/21 | | | | 2,000,000 | |
| | |
| | |
| 6 | | The accompanying notes are an integral part of these financial statements. |
GOLDMAN SACHS VARIABLE INSURANCE TRUST GOVERNMENT MONEY MARKET FUND
| | | | | | | | | | | | | | |
Principal
Amount | | | Interest
Rate | | | Maturity
Date | | | Amortized
Cost | |
|
| Repurchase Agreements(c) – (continued) | |
| | Bank of Montreal – (continued) | |
| | Maturity Value: $2,000,550 | |
| | Settlement Date: 12/18/20 | |
| Collateralized by Federal Home Loan Mortgage Corp., 2.000% to
3.000%, due 11/01/50 and Federal National Mortgage
Association, 2.500% to 3.000%, due 09/01/50 to 01/01/51. The
aggregate market value of the collateral, including accrued
interest, was $2,060,000. |
|
| $ | 2,500,000 | | | | 0.110 | %(d) | | | 01/07/21 | | | $ | 2,500,000 | |
| | Maturity Value: $2,500,703 | |
| | Settlement Date: 11/18/20 | |
| Collateralized by U.S. Treasury Bills, 0.000%, due 01/07/21 to
01/14/21, U.S. Treasury Notes, 0.250% to 2.375%, due
06/30/25 to 04/30/26 and U.S. Treasury Principal-Only Stripped
Securities, 0.000%, due 02/15/44 to 08/15/49. The aggregate
market value of the collateral, including accrued interest, was
$2,550,084. |
|
| | 3,000,000 | | | | 0.120 | | | | 01/07/21 | | | | 3,000,000 | |
| | Maturity Value: $3,000,590 | |
| | Settlement Date: 11/09/20 | |
| Collateralized by a U.S. Treasury Bill, 0.000%, due 01/14/21 and
U.S. Treasury Bonds, 2.250% to 2.500%, due 05/15/46 to
08/15/46. The aggregate market value of the collateral,
including accrued interest, was $3,059,938. |
|
| | 3,000,000 | | | | 0.130 | (d) | | | 01/07/21 | | | | 3,000,000 | |
| | Maturity Value: $3,001,972 | |
| | Settlement Date: 11/02/20 | |
| Collateralized by U.S. Treasury Bonds, 2.250% to 4.375%, due
05/15/40 to 08/15/46, U.S. Treasury Inflation-Indexed Bonds,
0.250% to 1.000%, due 02/15/47 to 02/15/50, a U.S. Treasury
Interest-Only Stripped Security, 0.000%, due 02/15/29 and U.S.
Treasury Notes, 0.500% to 2.250%, due 04/30/24 to 05/31/27.
The aggregate market value of the collateral, including accrued
interest, was $3,060,110. |
|
| | 1,000,000 | | | | 0.140 | (d) | | | 01/07/21 | | | | 1,000,000 | |
| | Maturity Value: $1,000,692 | |
| | Settlement Date: 09/14/20 | |
| Collateralized by Federal National Mortgage Association, 3.000%
to 3.500%, due 12/01/49 to 01/01/51, Government National
Mortgage Association, 4.000%, due 06/20/50, U.S. Treasury
Bills, 0.000%, due 01/07/21 to 01/14/21 and a U.S. Treasury
Note, 2.375%, due 04/30/26. The aggregate market value of the
collateral, including accrued interest, was $1,020,101. |
|
| | |
| | BNP Paribas | |
| | 10,000,000 | | | | 0.100 | (d) | | | 01/07/21 | | | | 10,000,000 | |
| | Maturity Value: $10,001,361 | |
| | Settlement Date: 12/01/20 | |
| Collateralized by a U.S. Treasury Floating Rate Note, 0.249%,
due 01/31/22 and a U.S. Treasury Interest-Only Stripped
Security, 0.000%, due 08/15/28. The aggregate market value of
the collateral, including accrued interest, was $10,200,000. |
|
| | 3,000,000 | | | | 0.110 | (d) | | | 01/07/21 | | | | 3,000,000 | |
| | |
|
| Repurchase Agreements(c) – (continued) | |
| | BNP Paribas – (continued) | |
| | Maturity Value: $3,000,834 | |
| | Settlement Date: 10/16/20 | |
| Collateralized by U.S. Treasury Bonds, 2.750% to 4.250%, due
05/15/39 to 11/15/42 and a U.S. Treasury Floating Rate Note,
0.249%, due 01/31/22. The aggregate market value of the
collateral, including accrued interest, was $3,060,086. |
|
| 3,000,000 | | | | 0.110 | %(d) | | | 01/07/21 | | | | 3,000,000 | |
| | Maturity Value: $3,000,843 | |
| | Settlement Date: 10/19/20 | |
| Collateralized by a U.S. Treasury Floating Rate Note, 0.249%,
due 01/31/22 and a U.S. Treasury Principal-Only Stripped
Security, 0.000%, due 08/15/46. The aggregate market value of
the collateral, including accrued interest, was $3,060,021. |
|
| | 3,000,000 | | | | 0.110 | (d) | | | 01/07/21 | | | | 3,000,000 | |
| | Maturity Value: $3,001,393 | |
| | Settlement Date: 10/28/20 | |
| Collateralized by a U.S. Treasury Bill, 0.000%, due 01/14/21, a
U.S. Treasury Bond, 6.250%, due 08/15/23, a U.S. Treasury
Floating Rate Note, 0.249%, due 01/31/22, U.S. Treasury
Interest-Only Stripped Securities, 0.000%, due 05/15/30 to
11/15/45 and a U.S. Treasury Note, 2.000%, due 11/30/22. The
aggregate market value of the collateral, including accrued
interest, was $3,060,000. |
|
| | 5,000,000 | | | | 0.110 | (d) | | | 01/07/21 | | | | 5,000,000 | |
| | Maturity Value: $5,001,390 | |
| | Settlement Date: 10/23/20 | |
| Collateralized by Federal Farm Credit Bank, 1.950% to 3.540%,
due 01/25/38 to 08/13/40, Federal National Mortgage
Association, 2.500% to 4.000%, due 08/01/50 to 01/01/51, a
U.S. Treasury Bill, 0.000%, due 04/29/21, a U.S. Treasury
Bond, 4.500%, due 02/15/36, a U.S. Treasury Inflation-Indexed
Note, 0.125%, due 10/15/24, U.S. Treasury Interest-Only
Stripped Securities, 0.000%, due 11/15/25 to 05/15/43, U.S.
Treasury Notes, 1.500% to 2.250%, due 01/31/22 to 08/31/24
and U.S. Treasury Principal-Only Stripped Securities, 0.000%,
due 11/15/44 to 02/15/48. The aggregate market value of the
collateral, including accrued interest, was $5,100,026. |
|
| | 10,000,000 | | | | 0.110 | (d) | | | 01/07/21 | | | | 10,000,000 | |
| | Maturity Value: $10,002,781 | |
| | Settlement Date: 10/09/20 | |
| Collateralized by U.S. Treasury Bonds, 7.625% to 7.875%, due
02/15/21 to 02/15/25, a U.S. Treasury Floating Rate Note,
0.249%, due 01/31/22, U.S. Treasury Interest-Only Stripped
Securities, 0.000%, due 05/15/47 to 11/15/47 and a U.S.
Treasury Note, 1.625%, due 04/30/23. The aggregate market
value of the collateral, including accrued interest, was
$10,199,999. |
|
| | 10,000,000 | | | | 0.110 | (d) | | | 01/07/21 | | | | 10,000,000 | |
| | |
| | |
| The accompanying notes are an integral part of these financial statements. | | 7 |
GOLDMAN SACHS VARIABLE INSURANCE TRUST GOVERNMENT MONEY MARKET FUND
Schedule of Investments (continued)
December 31, 2020
| | | | | | | | | | | | | | |
Principal
Amount | | | Interest
Rate | | | Maturity
Date | | | Amortized
Cost | |
|
| Repurchase Agreements(c) – (continued) | |
| | BNP Paribas – (continued) | |
| | Maturity Value: $10,002,811 | |
| | Settlement Date: 10/19/20 | |
| Collateralized by Federal Farm Credit Bank, 1.950%, due
08/13/40, Federal Home Loan Mortgage Corp., 3.000% to
6.500%, due 03/01/23 to 09/01/49, Federal National Mortgage
Association, 2.500% to 8.000%, due 02/01/23 to 08/01/58,
Government National Mortgage Association, 2.500% to
6.500%, due 10/15/36 to 11/20/50, a U.S. Treasury Inflation-
Indexed Bond, 2.500%, due 01/15/29, U.S. Treasury Interest-
Only Stripped Securities, 0.000%, due 11/15/25 to 11/15/45,
U.S. Treasury Notes, 0.125% to 2.875%, due 07/15/21 to
04/30/25 and U.S. Treasury Principal-Only Stripped Securities,
0.000%, due 02/15/44 to 11/15/49. The aggregate market value
of the collateral, including accrued interest, was $10,200,223. |
|
| $ | 10,000,000 | | | | 0.110 | %(d) | | | 01/07/21 | | | $ | 10,000,000 | |
| | Maturity Value: $10,005,561 | |
| | Settlement Date: 10/27/20 | |
| Collateralized by U.S. Treasury Bonds, 6.250% to 8.125%, due
05/15/21 to 08/15/23, a U.S. Treasury Floating Rate Note,
0.249%, due 01/31/22, a U.S. Treasury Inflation-Indexed Bond,
0.750%, due 02/15/45, U.S. Treasury Interest-Only Stripped
Securities, 0.000%, due 11/15/32 to 05/15/47, a U.S. Treasury
Note, 2.625%, due 06/15/21 and U.S. Treasury Principal-Only
Stripped Securities, 0.000%, due 08/15/43 to 02/15/49. The
aggregate market value of the collateral, including accrued
interest, was $10,200,016. |
|
| | 20,000,000 | | | | 0.120 | (d) | | | 01/07/21 | | | | 20,000,000 | |
| | Maturity Value: $20,006,067 | |
| | Settlement Date: 10/09/20 | |
| Collateralized by Federal Farm Credit Bank, 2.990%, due
07/18/34, Federal Home Loan Mortgage Corp., 0.000% to
5.000%, due 12/11/25 to 11/01/46, Federal Home Loan
Mortgage Corp. Stripped Security, 0.000%, due 03/15/28,
Federal National Mortgage Association, 2.500% to 5.500%, due
11/01/25 to 05/01/50, Federal National Mortgage Association
Stripped Security, 0.000%, due 05/15/22, Government National
Mortgage Association, 2.500% to 9.500%, due 02/20/25 to
11/20/50, U.S. Treasury Bonds, 2.250% to 7.875%, due
02/15/21 to 08/15/49, a U.S. Treasury Inflation-Indexed Bond,
1.000%, due 02/15/48, U.S. Treasury Inflation-Indexed Notes,
0.125% to 0.625%, due 04/15/22 to 04/15/23, U.S. Treasury
Notes, 0.125% to 2.750%, due 01/31/22 to 05/31/23 and U.S.
Treasury Principal-Only Stripped Securities, 0.000%, due
08/15/46 to 08/15/48. The aggregate market value of the
collateral, including accrued interest, was $20,404,326. |
|
| | |
| | Canadian Imperial Bank of Commerce | |
| | 3,500,000 | | | | 0.110 | (d) | | | 01/05/21 | | | | 3,500,000 | |
| | Maturity Value: $3,500,642 | |
| | Settlement Date: 11/06/20 | |
| Collateralized by U.S. Treasury Bonds, 2.000% to 3.625%, due
02/15/44 to 02/15/50, a U.S. Treasury Inflation-Indexed Bond,
0.250%, due 02/15/50, a U.S. Treasury Inflation-Indexed Note,
0.500%, due 01/15/28 and U.S. Treasury Notes, 0.125% to
2.750%, due 02/15/22 to 05/15/30. The aggregate market value
of the collateral, including accrued interest, was $3,570,032. |
|
| | 1,000,000 | | | | 0.110 | (d) | | | 01/07/21 | | | | 1,000,000 | |
| | |
|
| Repurchase Agreements(c) – (continued) | |
| | Canadian Imperial Bank of Commerce – (continued) | |
| | Maturity Value: $1,000,275 | |
| | Settlement Date: 10/21/20 | |
| Collateralized by Federal National Mortgage Association, 2.000%
to 4.000%, due 11/01/40 to 10/01/50 and Government National
Mortgage Association, 4.000%, due 01/15/41. The aggregate
market value of the collateral, including accrued interest, was
$1,030,152. |
|
| $ | 1,000,000 | | | | 0.110 | %(d) | | | 01/07/21 | | | $ | 1,000,000 | |
| | Maturity Value: $1,000,477 | |
| | Settlement Date: 10/28/20 | |
| Collateralized by Federal National Mortgage Association, 2.000%
to 4.000%, due 11/01/40 to 10/01/50 and Government National
Mortgage Association, 4.000%, due 01/15/41. The aggregate
market value of the collateral, including accrued interest, was
$1,030,262. |
|
| | 2,000,000 | | | | 0.110 | (d) | | | 01/07/21 | | | | 2,000,000 | |
| | Maturity Value: $2,000,550 | |
| | Settlement Date: 10/21/20 | |
| Collateralized by Federal Home Loan Mortgage Corp., 3.500%,
due 01/01/50, Federal National Mortgage Association, 2.000%
to 4.000%, due 12/01/41 to 10/01/50 and Government National
Mortgage Association, 4.000%, due 01/15/41. The aggregate
market value of the collateral, including accrued interest, was
$2,060,000. |
|
| | 5,000,000 | | | | 0.110 | (d) | | | 01/07/21 | | | | 5,000,000 | |
| | Maturity Value: $5,002,383 | |
| | Settlement Date: 10/28/20 | |
| Collateralized by Federal Home Loan Mortgage Corp., 2.500%,
due 12/01/50, Federal National Mortgage Association, 2.000%
to 4.500%, due 10/01/28 to 10/01/50 and a U.S. Treasury Note,
1.375%, due 01/31/25. The aggregate market value of the
collateral, including accrued interest, was $5,149,990. |
|
| | 2,000,000 | | | | 0.120 | (d) | | | 01/07/21 | | | | 2,000,000 | |
| | Maturity Value: $2,000,600 | |
| | Settlement Date: 10/14/20 | |
| Collateralized by Federal National Mortgage Association, 2.000%
to 4.000%, due 03/01/47 to 10/01/50 and Government National
Mortgage Association, 4.000%, due 01/15/41. The aggregate
market value of the collateral, including accrued interest, was
$2,060,215. |
|
| | |
| | Joint Repurchase Agreement III | |
| | 92,000,000 | | | | 0.080 | | | | 01/04/21 | | | | 92,000,000 | |
| | Maturity Value: $92,000,818 | |
| | |
| | Royal Bank of Canada | |
| | 8,000,000 | | | | 0.090 | (d) | | | 01/07/21 | | | | 8,000,000 | |
| | Maturity Value: $8,000,620 | |
| | Settlement Date: 12/15/20 | |
| Collateralized by Federal Home Loan Mortgage Corp., 4.500%,
due 11/01/48 to 01/01/49 and Federal National Mortgage
Association, 3.500% to 5.000%, due 01/01/35 to 01/01/58. The
aggregate market value of the collateral, including accrued
interest, was $8,160,000. |
|
| | 20,000,000 | | | | 0.090 | (d) | | | 01/07/21 | | | | 20,000,000 | |
| | |
| | |
| 8 | | The accompanying notes are an integral part of these financial statements. |
GOLDMAN SACHS VARIABLE INSURANCE TRUST GOVERNMENT MONEY MARKET FUND
| | | | | | | | | | | | | | |
Principal
Amount | | | Interest
Rate | | | Maturity
Date | | | Amortized
Cost | |
|
| Repurchase Agreements(c) – (continued) | |
| | Royal Bank of Canada – (continued) | |
| | Maturity Value: $20,001,550 | |
| | Settlement Date: 12/14/20 | |
| Collateralized by Federal Home Loan Mortgage Corp., 2.000% to
4.500%, due 04/01/47 to 10/01/50 and Federal National
Mortgage Association, 2.000% to 5.000%, due 03/01/33 to
04/01/59. The aggregate market value of the collateral,
including accrued interest, was $20,400,001. |
|
| $ | 18,000,000 | | | | 0.110 | %(d) | | | 01/07/21 | | | $ | 18,000,000 | |
| | Maturity Value: $18,003,080 | |
| | Settlement Date: 11/19/20 | |
| Collateralized by Federal Home Loan Mortgage Corp., 4.000% to
4.500%, due 04/01/47 to 01/01/49 and Federal National
Mortgage Association, 3.500% to 5.500%, due 06/01/38 to
10/01/46. The aggregate market value of the collateral,
including accrued interest, was $18,360,000. |
|
| | |
| | TOTAL REPURCHASE AGREEMENTS | | | $ | 240,000,000 | |
| | |
| | TOTAL INVESTMENTS – 99.4% | | | $ | 1,154,114,702 | |
| | |
| OTHER ASSETS IN EXCESS OF
LIABILITIES – 0.6% |
| | | 7,517,686 | |
| | | | | | |
| | NET ASSETS – 100.0% | | | $ | 1,161,632,388 | |
| | | | | | |
| | |
| The percentage shown for each investment category reflects the value of investments in that category as a percentage of net assets. |
| |
| (a) | | All or a portion represents a forward commitment. |
| |
| (b) | | Variable or floating rate security. Except for floating rate notes (for which final maturity is disclosed), maturity date disclosed is the next interest reset date. Interest rate disclosed is that which is in effect on December 31, 2020. |
| |
| (c) | | Unless noted, all repurchase agreements were entered into on December 31, 2020. Additional information on Joint Repurchase Agreement Account III appears in the Additional Investment Information section. |
| |
| (d) | | The instrument is subject to a demand feature. |
|
| Interest rates represent either the stated coupon rate, annualized yield on date of purchase for discounted securities, or, for floating rate securities, the current reset rate, which is based upon current interest rate indices. |
|
| Maturity dates represent either the final legal maturity date on the security, the demand date for puttable securities, the date of the next interest rate reset for variable rate securities, or the prerefunded date for those types of securities. |
| | |
| |
| Investment Abbreviations: |
| FEDL01 | | —US Federal Funds Effective Rate |
| LIBOR | | —London Interbank Offered Rates |
| MMY | | —Money Market Yield |
| Prime | | —Federal Reserve Bank Prime Loan Rate US |
| SOFR | | —Secured Overnight Financing Rate |
| T-Bill | | —Treasury Bill |
ADDITIONAL INVESTMENT INFORMATION
JOINT REPURCHASE AGREEMENT ACCOUNT III — At December 31, 2020, the Fund had undivided interests in the Joint Repurchase Agreement Account III, with a maturity date of January 4, 2021, as follows:
| | | | | | | | | | | | | |
| Principal Amount | | Maturity Value | | Collateral Value |
| | | $92,000,000 | | | | $ | 92,000,818 | | | | $ | 94,706,396 | |
REPURCHASE AGREEMENTS — At December 31, 2020, the Principal Amounts of the Fund’s interest in the Joint Repurchase Agreement Account III were as follows:
| | | | | | | | |
| Counterparty | | Interest Rate | | | Principal Amount | |
ABN Amro Bank N.V. | | | 0.080 | % | | $ | 25,760,000 | |
Bank of America, N.A. | | | 0.080 | | | | 18,400,000 | |
Bank of Nova Scotia (The) | | | 0.080 | | | | 36,800,000 | |
BofA Securities, Inc. | | | 0.080 | | | | 11,040,000 | |
| | |
| TOTAL | | | | | | $ | 92,000,000 | |
| | |
| The accompanying notes are an integral part of these financial statements. | | 9 |
GOLDMAN SACHS VARIABLE INSURANCE TRUST GOVERNMENT MONEY MARKET FUND
Schedule of Investments (continued)
December 31, 2020
ADDITIONAL INVESTMENT INFORMATION (continued)
At December 31, 2020, the Joint Repurchase Agreement Account III was fully collateralized by:
| | | | | | |
| Issuer | | Interest Rates | | | Maturity Dates |
| Federal Home Loan Mortgage Corp. | | | 2.000 to 5.500 | % | | 10/01/26 to 12/01/50 |
| Federal National Mortgage Association | | | 2.000 to 5.500 | | | 08/01/25 to 12/01/50 |
| Government National Mortgage Association | | | 2.500 | | | 07/20/50 |
| U.S. Treasury Notes | | | 0.625 to 2.000 | | | 05/31/24 to 08/15/30 |
| | |
| 10 | | The accompanying notes are an integral part of these financial statements. |
GOLDMAN SACHS VARIABLE INSURANCE TRUST GOVERNMENT MONEY MARKET FUND
Statement of Assets and Liabilities
December 31, 2020
| | | | |
| | | | |
| Assets: | | | |
Investments based on amortized cost | | $ | 914,114,702 | |
Repurchase agreements based on amortized cost | | | 240,000,000 | |
Cash | | | 46,411 | |
Receivables: | | | | |
Fund shares sold | | | 8,695,262 | |
Interest | | | 249,042 | |
Reimbursement from investment advisor | | | 63,841 | |
| |
| Total assets | | | 1,163,169,258 | |
| | | | |
| | | | |
| Liabilities: | | | |
Payables: | | | | |
Fund shares redeemed | | | 771,859 | |
Investments purchased | | | 505,078 | |
Management fees | | | 153,872 | |
Dividend distribution | | | 858 | |
Distribution and Service fees and Transfer Agency fees | | | 26 | |
Accrued expenses | | | 105,177 | |
| |
| Total liabilities | | | 1,536,870 | |
| | | | |
| | | | |
| Net Assets: | | | |
Paid-in capital | | | 1,161,621,168 | |
Total distributable earnings | | | 11,220 | |
| |
| NET ASSETS | | $ | 1,161,632,388 | |
| |
Net asset value, offering and redemption price per share | | $ | 1.00 | |
Net Assets: | | | | |
Institutional Shares | | $ | 582,216,421 | |
Service Shares | | | 579,415,967 | |
| |
Total Net Assets | | $ | 1,161,632,388 | |
Shares outstanding $0.001 par value (unlimited number of shares authorized): | | | | |
Institutional Shares | | | 582,210,761 | |
Service Shares | | | 579,410,388 | |
| | |
| The accompanying notes are an integral part of these financial statements. | | 11 |
GOLDMAN SACHS VARIABLE INSURANCE TRUST GOVERNMENT MONEY MARKET FUND
Statement of Operations
For the Year Ended December 31, 2020
| | | | |
| | | | |
| Investment Income: | | | |
| |
Interest income | | $ | 5,567,083 | |
| | | | |
| | | | |
| Expenses: | | | |
Management fees | | | 1,696,715 | |
Distribution and Service fees — Service Shares | | | 1,305,250 | |
Transfer Agency fees(a) | | | 212,089 | |
Professional fees | | | 135,363 | |
Printing and mailing fees | | | 66,351 | |
Custody, accounting and administrative services | | | 56,771 | |
Trustee fees | | | 24,195 | |
| |
Other | | | 23,124 | |
| |
| Total expenses | | | 3,519,858 | |
| |
Less — expense reductions | | | (810,541 | ) |
| |
| Net expenses | | | 2,709,317 | |
| |
| NET INVESTMENT INCOME | | $ | 2,857,766 | |
| |
| Net realized gain from investment transactions | | | 154,527 | |
| |
| NET INCREASE IN NET ASSETS RESULTING FROM OPERATIONS | | $ | 3,012,293 | |
(a) Institutional Shares and Service Shares incurred Transfer Agency fees of $107,669 and $104,420, respectively.
| | |
| 12 | | The accompanying notes are an integral part of these financial statements. |
GOLDMAN SACHS VARIABLE INSURANCE TRUST GOVERNMENT MONEY MARKET FUND
Statements of Changes in Net Assets
| | | | | | | | |
| | | For the
Fiscal Year Ended
December 31, 2020 | | | For the
Fiscal Year Ended
December 31, 2019 | |
| | | | | | | | |
| From operations: | | | | | | |
Net investment income | | $ | 2,857,766 | | | $ | 13,604,822 | |
Net realized gain from investment transactions | | | 154,527 | | | | 327,167 | |
| | |
| Net increase in net assets resulting from operations | | | 3,012,293 | | | | 13,931,989 | |
| | | | | | | | |
| | | | | | | | |
| Distributions to shareholders: | | | | | | |
From distributable earnings: | | | | | | | | |
Institutional Shares | | | (1,973,720 | ) | | | (7,303,914 | ) |
Service Shares | | | (1,094,236 | ) | | | (6,545,777 | ) |
| | |
| Total distributions to shareholders | | | (3,067,956 | ) | | | (13,849,691 | ) |
| | | | | | | | |
| | | | | | | | |
| From share transactions (at $1.00 per share): | | | | | | |
Proceeds from sales of shares | | | 1,674,758,015 | | | | 736,413,904 | |
Reinvestment of distributions | | | 3,064,523 | | | | 13,849,691 | |
Cost of shares redeemed | | | (1,230,029,220 | ) | | | (816,550,622 | ) |
| | |
| Net increase (decrease) in net assets resulting from share transactions | | | 447,793,318 | | | | (66,287,027 | ) |
| | |
| TOTAL INCREASE (DECREASE) | | | 447,737,655 | | | | (66,204,729 | ) |
| | | | | | | | |
| | | | | | | | |
| Net assets: | | | | | | |
| | |
Beginning of year | | | 713,894,733 | | | | 780,099,462 | |
| | |
End of year | | $ | 1,161,632,388 | | | $ | 713,894,733 | |
| | |
| The accompanying notes are an integral part of these financial statements. | | 13 |
GOLDMAN SACHS VARIABLE INSURANCE TRUST GOVERNMENT MONEY MARKET FUND
Financial Highlights
Selected Data for a Share Outstanding Throughout Each Year
| | | | | | | | | | | | | | | | | | | | |
| | | Goldman Sachs Government Money Market Fund | |
| | | Institutional Shares | |
| | | Year Ended December 31, | |
| | | 2020 | | | 2019 | | | 2018 | | | 2017 | | | 2016 | |
| | | | | | | | | | | | | | | | | | | | |
| Per Share Data: | | | | | | | | | | | | | | | |
| | | | | |
Net asset value, beginning of year | | $ | 1.00 | | | $ | 1.00 | | | $ | 1.00 | | | $ | 1.00 | | | $ | 1.00 | |
| | | | | |
Net investment income(a) | | | 0.004 | | | | 0.021 | | | | 0.017 | | | | 0.008 | | | | 0.003 | |
| | | | | |
Distributions to shareholders from net investment income(b) | | | (0.004 | ) | | | (0.021 | ) | | | (0.017 | ) | | | (0.008 | ) | | | (0.003 | ) |
| | | | | |
Net asset value, end of year | | $ | 1.00 | | | $ | 1.00 | | | $ | 1.00 | | | $ | 1.00 | | | $ | 1.00 | |
| | | | | |
Total return(c) | | | 0.43 | % | | | 2.11 | % | | | 1.74 | % | | | 0.76 | % | | | 0.29 | % |
| | | | | |
Net assets, end of year (in 000’s) | | $ | 582,216 | | | $ | 363,783 | | | $ | 411,447 | | | $ | 302,507 | | | $ | 206,987 | |
| | | | | |
Ratio of net expenses to average net assets | | | 0.18 | % | | | 0.18 | % | | | 0.18 | % | | | 0.18 | % | | | 0.19 | % |
| | | | | |
Ratio of total expenses to average net assets | | | 0.20 | % | | | 0.21 | % | | | 0.23 | % | | | 0.27 | % | | | 0.30 | % |
| | | | | |
Ratio of net investment income to average net assets | | | 0.35 | % | | | 2.06 | % | | | 1.73 | % | | | 0.76 | % | | | 0.31 | % |
| (a) | Calculated based on the average shares outstanding methodology. |
| (b) | Distributions may not coincide with the current year net investment income or net realized gains as distributions may be paid from current or prior year earnings. |
| (c) | Assumes reinvestment of all distributions. |
| | |
| 14 | | The accompanying notes are an integral part of these financial statements. |
GOLDMAN SACHS VARIABLE INSURANCE TRUST GOVERNMENT MONEY MARKET FUND
Financial Highlights (continued)
Selected Data for a Share Outstanding Throughout Each Year
| | | | | | | | | | | | | | | | | | | | |
| | | Goldman Sachs Government Money Market Fund | |
| | | Service Shares | |
| | | Year Ended December 31, | |
| | | 2020 | | | 2019 | | | 2018 | | | 2017 | | | 2016 | |
| | | | | | | | | | | | | | | | | | | | |
| Per Share Data: | | | | | | | | | | | | | | | |
| | | | | |
Net asset value, beginning of year | | $ | 1.00 | | | $ | 1.00 | | | $ | 1.00 | | | $ | 1.00 | | | $ | 1.00 | |
| | | | | |
Net investment income(a) | | | 0.003 | | | | 0.018 | | | | 0.015 | | | | 0.005 | | | | — | (b) |
| | | | | |
Distributions to shareholders from net investment income(c) | | | (0.003 | ) | | | (0.018 | ) | | | (0.015 | ) | | | (0.005 | ) | | | — | (b) |
| | | | | |
Net asset value, end of year | | $ | 1.00 | | | $ | 1.00 | | | $ | 1.00 | | | $ | 1.00 | | | $ | 1.00 | |
| | | | | |
Total return(d) | | | 0.27 | % | | | 1.86 | % | | | 1.48 | % | | | 0.51 | % | | | 0.04 | % |
| | | | | |
Net assets, end of year (in 000’s) | | $ | 579,416 | | | $ | 350,112 | | | $ | 368,652 | | | $ | 354,248 | | | $ | 375,580 | |
| | | | | |
Ratio of net expenses to average net assets | | | 0.33 | % | | | 0.43 | % | | | 0.43 | % | | | 0.43 | % | | | 0.44 | % |
| | | | | |
Ratio of total expenses to average net assets | | | 0.45 | % | | | 0.46 | % | | | 0.48 | % | | | 0.52 | % | | | 0.55 | % |
| | | | | |
Ratio of net investment income to average net assets | | | 0.19 | % | | | 1.81 | % | | | 1.48 | % | | | 0.51 | % | | | 0.03 | % |
| (a) | Calculated based on the average shares outstanding methodology. |
| (b) | Amount is less than $0.0005 per share. |
| (c) | Distributions may not coincide with the current year net investment income or net realized gains as distributions may be paid from current or prior year earnings. |
| (d) | Assumes reinvestment of all distributions. |
| | |
| The accompanying notes are an integral part of these financial statements. | | 15 |
GOLDMAN SACHS VARIABLE INSURANCE TRUST GOVERNMENT MONEY MARKET FUND
Notes to Financial Statements
December 31, 2020
1. ORGANIZATION
Goldman Sachs Variable Insurance Trust (the “Trust” or “VIT”) is a Delaware statutory trust registered under the Investment Company Act of 1940, as amended (the “Act”), as an open-end management investment company. The Trust includes the Goldman Sachs Government Money Market Fund (the “Fund”). The Fund is a diversified portfolio under the Act offering two classes of shares — Institutional Shares and Service Shares. Shares of the Trust are offered to separate accounts of participating life insurance companies for the purpose of funding variable annuity contracts and variable life insurance policies.
Goldman Sachs Asset Management, L.P. (“GSAM”), an affiliate of Goldman Sachs & Co. LLC (“Goldman Sachs”), serves as investment adviser to the Fund pursuant to a management agreement (the “Agreement”) with the Trust.
2. SIGNIFICANT ACCOUNTING POLICIES
The financial statements have been prepared in accordance with accounting principles generally accepted in the United States of America (“GAAP”) and require management to make estimates and assumptions that may affect the reported amounts and disclosures. Actual results may differ from those estimates and assumptions. The Fund is an investment company under GAAP and follows the accounting and reporting guidance applicable to investment companies.
A. Investment Valuation — The investment valuation policy of the Fund is to use the amortized-cost method permitted by Rule 2a-7 under the Act for valuing portfolio securities. The amortized-cost method of valuation involves valuing a security at its cost and thereafter applying a constant accretion or amortization to maturity of any discount or premium. Normally, a security’s amortized cost will approximate its market value. Under procedures and tolerances approved by the Board of Trustees (“Trustees”), GSAM evaluates daily the difference between the Fund’s net asset value (“NAV”) per share using the amortized costs of its portfolio securities and the Fund’s NAV per share using market-based values of its portfolio securities. The market-based value of a portfolio security is determined, where readily available, on the basis of market quotations provided by pricing services or securities dealers, or, where accurate market quotations are not readily available, on the basis of the security’s fair value as determined in accordance with Valuation Procedures approved by the Trustees. The pricing services may use valuation models or matrix pricing, which may consider (among other things): (i) yield or price with respect to debt securities that are considered comparable in characteristics such as rating, interest rate and maturity date or (ii) quotations from securities dealers to determine current value.
B. Investment Income and Investments — Interest income is accrued daily and adjusted for amortization of premiums and accretion of discounts. Investment transactions are reflected on trade date. Realized gains and losses are calculated using identified cost.
C. Class Allocations and Expenses — Investment income, realized and unrealized gain (loss), if any, and non-class specific expenses of the Fund are allocated daily based upon the proportion of net assets of each class. Class specific expenses, where applicable, are borne by the respective share classes and include Distribution and Service and Transfer Agency fees. Non-class specific expenses directly incurred by the Fund are charged to the Fund, while such expenses incurred by the Trust are allocated across the Fund on a straight-line and/or pro-rata basis depending upon the nature of the expenses.
D. Federal Taxes and Distributions to Shareholders — It is the Fund’s policy to comply with the requirements of the Internal Revenue Code of 1986, as amended (the “Code”), applicable to regulated investment companies (mutual funds) and to distribute each year substantially all of its investment company taxable and tax-exempt income and capital gains to its shareholders. Accordingly, the Fund is not required to make any provisions for the payment of federal income tax. Distributions to shareholders are declared and recorded daily and paid monthly by the Fund and may include short-term capital gains. Long-term capital gain distributions, if any, are declared and paid annually. The Fund may defer or accelerate the timing of the distribution of short-term capital gains (or any portion thereof).
The characterization of distributions to shareholders for financial reporting purposes is determined in accordance with federal income tax rules, which may differ from GAAP. The source of the Fund’s distributions may be shown in the accompanying financial statements as either from distributable earnings or capital. Certain components of the Fund’s net assets on the Statement of Assets and Liabilities reflect permanent GAAP/tax differences based on the appropriate tax character.
16
GOLDMAN SACHS VARIABLE INSURANCE TRUST GOVERNMENT MONEY MARKET FUND
2. SIGNIFICANT ACCOUNTING POLICIES (continued)
The tax character of distributions paid during the fiscal years ended December 31, 2020 and December 31, 2019 were as follows:
| | | | | | | | |
| | | 2020 | | | 2019 | |
| Distributions paid from: | | | | | | | | |
| Ordinary income | | $ | 3,067,901 | | | $ | 13,849,636 | |
| Net long-term capital gains | | | 55 | | | | 55 | |
| | |
| Total taxable distributions | | $ | 3,067,956 | | | $ | 13,849,691 | |
As of December 31, 2020, the components of accumulated earnings on a tax basis were as follows:
| | | | |
| Undistributed (Distributions in excess of) ordinary income — net | | $ | 12,094 | |
| Timing differences (Distribution Payable) | | $ | (858 | ) |
| Unrealized gains (losses) — net | | $ | (16 | ) |
| Total accumulated earnings (losses) — net | | $ | 11,220 | |
The amortized cost for the Fund stated in the accompanying Statement of Assets and Liabilities also represents aggregate cost for U.S. federal income tax purposes.
The difference between GAAP-basis and tax basis unrealized gains (losses) is attributable primarily to wash sales.
GSAM has reviewed the Fund’s tax positions for all open tax years (the current and prior three years, as applicable) and had concluded that no provision for income tax is required in the Fund’s financial statements. Such open tax years remain subject to examination and adjustment by tax authorities.
E. Forward Commitments — A forward commitment involves entering into a contract to purchase or sell securities, typically on an extended settlement basis, for a fixed price at a future date. The purchase of securities on a forward commitment basis involves a risk of loss if the value of the security to be purchased declines before the settlement date. Conversely, the sale of securities on a forward commitment basis involves the risk that the value of the securities sold may increase before the settlement date. Although the Fund will generally purchase securities on a forward commitment basis with the intention of acquiring the securities for its portfolio, the Fund may dispose of forward commitments prior to settlement which may result in a realized gain or loss.
F. Repurchase Agreements — Repurchase agreements involve the purchase of securities subject to the seller’s agreement to repurchase the securities at a mutually agreed upon date and price, under the terms of a Master Repurchase Agreement (“MRA”). During the term of a repurchase agreement, the value of the underlying securities held as collateral on behalf of the Fund, including accrued interest, is required to exceed the value of the repurchase agreement, including accrued interest. The gross value of repurchase agreements is included in the Statement of Assets and Liabilities for financial reporting purposes. The underlying securities for all repurchase agreements are held at the Fund’s custodian or designated sub-custodians under tri-party repurchase agreements.
An MRA governs transactions between the Fund and select counterparties. An MRA contains provisions for, among other things, initiation of the transaction, income payments, events of default, and maintenance of securities for repurchase agreements. An MRA also permits offsetting with collateral to create one single net payment in the event of default or similar events, including the bankruptcy or insolvency of a counterparty.
If the seller defaults, the Fund could suffer a loss to the extent that the proceeds from the sale of the underlying securities and other collateral held by the Fund are less than the repurchase price and the Fund’s costs associated with delay and enforcement of the repurchase agreement. In addition, in the event of default or insolvency of the seller, a court could determine that the Fund’s interest in the collateral is not enforceable, resulting in additional losses to the Fund.
17
GOLDMAN SACHS VARIABLE INSURANCE TRUST GOVERNMENT MONEY MARKET FUND
Notes to Financial Statements (continued)
December 31, 2020
2. SIGNIFICANT ACCOUNTING POLICIES (continued)
Pursuant to exemptive relief granted by the Securities and Exchange Commission (“SEC”) and terms and conditions contained therein, the Fund, together with other funds of the Trust and registered investment companies having management agreements with GSAM or its affiliates, may transfer uninvested cash into joint accounts, the daily aggregate balance of which is invested in one or more repurchase agreements. Under these joint accounts, the Fund maintains pro-rata credit exposure to the underlying repurchase agreements’ counterparties. With the exception of certain transaction fees, the Fund is not subject to any expenses in relation to these investments.
3. INVESTMENTS AND FAIR VALUE MEASUREMENTS
U.S. GAAP defines the fair value of a financial instrument as the amount that would be received to sell an asset or paid to transfer a liability in an orderly transaction between market participants at the measurement date (i.e., the exit price); the Fund’s policy is to use the market approach. GAAP establishes a fair value hierarchy that prioritizes the inputs to valuation techniques used to measure fair value. The hierarchy gives the highest priority to unadjusted quoted prices in active markets for identical assets or liabilities (Level 1 measurements) and the lowest priority to unobservable inputs (Level 3 measurements). The level in the fair value hierarchy within which the fair value measurement in its entirety falls shall be determined based on the lowest level input that is significant to the fair value measurement in its entirety. The levels used for classifying investments are not necessarily an indication of the risk associated with investing in these investments. The three levels of the fair value hierarchy are described below:
Level 1 — Unadjusted quoted prices in active markets that are accessible at the measurement date for identical, unrestricted assets or liabilities;
Level 2 — Quoted prices in markets that are not active or financial instruments for which significant inputs are observable (including, but not limited to, quoted prices for similar investments, interest rates, foreign exchange rates, volatility and credit spreads), either directly or indirectly;
Level 3 — Prices or valuations that require significant unobservable inputs (including GSAM’s assumptions in determining fair value measurement).
The Trustees have approved Valuation Procedures that govern the valuation of the portfolio investments held by the Fund, including investments for which market quotations are not readily available. The Trustees have delegated to GSAM day-to-day responsibility for implementing and maintaining internal controls and procedures related to the valuation (including both the amortized cost and market-based methods of valuation) of the Fund’s investments. To assess the continuing appropriateness of pricing sources and methodologies related to the market-based method of valuation, GSAM regularly performs price verification procedures and issues challenges as necessary to third party pricing vendors or brokers, and any differences are reviewed in accordance with the Valuation Procedures.
As of December 31, 2020, all investments and repurchase agreements are classified as Level 2 of the fair value hierarchy. Please refer to the Schedule of Investments for further detail.
4. AGREEMENTS AND AFFILIATED TRANSACTIONS
A. Management Agreement — Under the Agreement, GSAM manages the Fund, subject to the general supervision of the Trustees.
As compensation for the services rendered pursuant to the Agreement, the assumption of the expenses related thereto and administration of the Fund’s business affairs, including providing facilities, GSAM is entitled to a management fee, accrued daily and paid monthly, equal to an annual percentage rate of the Fund’s average daily net assets.
B. Distribution and Service (12b-1) Plan — The Trust, on behalf of the Service Shares of the Fund, has adopted a Distribution and Service Plan subject to Rule 12b-1 under the Act. Under the Distribution and Service Plan, Goldman Sachs, which serves as distributor (the “Distributor”), is entitled to a fee accrued daily and paid monthly, for distribution services and personal and account
18
GOLDMAN SACHS VARIABLE INSURANCE TRUST GOVERNMENT MONEY MARKET FUND
4. AGREEMENTS AND AFFILIATED TRANSACTIONS (continued)
maintenance services, which may then be paid by Goldman Sachs to authorized dealers, equal to, on an annual basis, 0.25% of the Fund’s average daily net assets attributable to Service Shares.
C. Transfer Agency Agreement — Goldman Sachs also serves as the transfer agent of the Fund for a fee pursuant to a Transfer Agency Agreement. The fee charged for such transfer agency services is accrued daily and paid monthly at an annual rate of 0.02% of the Fund’s average daily net assets of Institutional Shares and Service Shares.
D. Other Expense Agreements — GSAM has agreed to limit certain “Other Expenses” of the Fund (excluding transfer agency fees and expenses, taxes, interest, brokerage fees, expenses of shareholder meetings, litigation and indemnification, and extraordinary expenses) to the extent that such expenses exceed, on an annual basis, 0.004% of the average daily net assets of the Fund. Such Other Expense reimbursements, if any, are accrued daily and paid monthly. In addition, the Fund is not obligated to reimburse GSAM for prior fiscal year expense reimbursements, if any. This Other Expense limitation will remain in place through at least April 29, 2021, and prior to such date GSAM may not terminate the arrangement without the approval of the Trustees. In addition, the Fund has entered into certain offset arrangements with the custodian and the transfer agent, which may result in a reduction of the Fund’s expenses and are received irrespective of the application of the “Other Expense” limitation described above. For the year ended December 31, 2020, these expense reductions, including any fee waiver and Other Expense reimbursements, were as follows:
| | | | | | | | | | | | | | | | | | |
Management
Fee Waivers | | | Distribution,
Administration,
Service and/or
Shareholder
Administration
Plans Fee Waivers | | | Transfer Agency
Waiver | | | Other
Expense
Reimbursements | | | Total
Expense Reductions | |
| | | | |
| $ | 6,367 | | | $ | 502,813 | | | $ | 46,842 | | | $ | 254,519 | | | $ | 810,541 | |
E. Contractual and Net Fund Expenses — The investment adviser may contractually agree to waive or reimburse certain fees and expenses until a specified date. The investment adviser or transfer agent may also voluntarily waive certain fees and expenses, and such voluntary waivers may be discontinued or modified at any time without notice. The following table outlines such fees (net of waivers) and Other Expenses (net of reimbursements and custodian and transfer agency fee credit reductions) in order to determine the Fund’s net annualized expenses for the fiscal year. The Fund is not obligated to reimburse Goldman Sachs for prior fiscal year fee waivers, if any.
| | | | | | | | | | | | | | | | |
| | | Institutional Shares | | | Service Shares | |
| Fee/Expense Type | | Contractual rate,
if any | | | Ratio of net expenses to
average net assets
for the fiscal year ended
December 31, 2020 | | | Contractual rate,
if any | | | Ratio of net expenses to
average net assets
for the fiscal year ended
December 31, 2020 | |
| Management Fee | | | 0.16 | % | | | 0.16 | % | | | 0.16 | % | | | 0.16 | % |
| Distribution and Service Fees | | | N/A | | | | N/A | | | | 0.25 | | | | 0.15 | |
| Transfer Agency Fees | | | 0.02 | | | | 0.02 | | | | 0.02 | | | | 0.02 | |
| Other Expenses | | | — | | | | 0.00 | (a) | | | — | | | | 0.00 | (a) |
| Net Expenses | | | | | | | 0.18 | % | | | | | | | 0.33 | % |
| (a) | Amount is less than 0.005% of average net assets. |
| N/A | — Fees not applicable to respective share class. |
F. Other Transactions with Affiliates — The Fund may purchase securities from, or sell securities to, an affiliated fund provided the affiliation is solely due to having a common investment adviser, common officers, or common Trustees.
19
GOLDMAN SACHS VARIABLE INSURANCE TRUST GOVERNMENT MONEY MARKET FUND
Notes to Financial Statements (continued)
December 31, 2020
4. AGREEMENTS AND AFFILIATED TRANSACTIONS (continued)
G. Line of Credit Facility — As of December 31, 2020, the Fund participated in a $700,000,000 committed, unsecured revolving line of credit facility (the “facility”) together with other funds of the Trust and registered investment companies having management agreements with GSAM or its affiliates. This facility is to be used for temporary emergency purposes, or to allow for an orderly liquidation of securities to meet redemption requests. The interest rate on borrowings is based on the federal funds rate.The facility also requires a fee to be paid by the Fund based on the amount of the commitment that has not been utilized. For the fiscal year ended December 31, 2020, the Fund did not have any borrowings under the facility. Prior to April 28, 2020, the facility was $580,000,000.
5. OTHER RISKS
The Fund’s risks include, but are not limited to, the following:
Floating and Variable Rate Obligations Risk — Floating rate and variable rate obligations are debt instruments issued by companies or other entities with interest rates that reset periodically (typically, daily. monthly, quarterly, or semiannually) in response to changes in the market rate of interest on which the interest rate is based. For floating and variable rate obligations, there may be a lag between an actual change in the underlying interest rate benchmark and the reset time for an interest payment of such an obligation, which could harm or benefit a Fund, depending on the interest rate environment or other circumstances. In a rising interest rate environment, for example, a floating or variable rate obligation that does not reset immediately would prevent a Fund from taking full advantage of rising interest rates in a timely manner. However, in a declining interest rate environment, a Fund may benefit from a lag due to an obligation’s interest rate payment not being immediately impacted by a decline in interest rates.
In 2017, the United Kingdom’s Financial Conduct Authority (“FCA”) warned that LIBOR may cease to be available or appropriate for use by 2021. The unavailability or replacement of LIBOR may affect the value, liquidity or return on certain Fund investments and may result in costs incurred in connection with closing out positions and entering into new trades. Any pricing adjustments to a Fund’s investments resulting from a substitute reference rate may also adversely affect the Fund’s performance and/or NAV.
Large Shareholder Transactions Risk — The Fund may experience adverse effects when certain large shareholders, such as other funds, participating insurance companies, accounts and Goldman Sachs affiliates, purchase or redeem large amounts of shares of the Fund. Such large shareholder redemptions, which may occur rapidly or unexpectedly, may cause the Fund to sell portfolio securities at times when it would not otherwise do so, which may negatively impact the Fund’s NAV and liquidity. These transactions may also accelerate the realization of taxable income to shareholders if such sales of investments resulted in gains, and may also increase transaction costs. In addition, a large redemption could result in the Fund’s current expenses being allocated over a smaller asset base, leading to an increase in the Fund’s expense ratio. Similarly, large Fund share purchases may adversely affect the Fund’s performance to the extent that the Fund is delayed in investing new cash or otherwise maintains a larger cash position than it ordinarily would.
Interest Rate Risk — When interest rates increase, the Fund’s yield will tend to be lower than prevailing market rates, and the market value of its securities or instruments may also be adversely affected. A low interest rate environment poses additional risks to the Fund, because low yields on the Fund’s portfolio holdings may have an adverse impact on the Fund’s ability to provide a positive yield to its shareholders, pay expenses out of Fund assets, or, at times, maintain a stable $1.00 share price. The risks associated with changing interest rates may have unpredictable effects on the markets and the Fund’s investments. Fluctuations in interest rates may also affect the liquidity of fixed income securities and instruments held by the Fund.
Market and Credit Risks — In the normal course of business, the Fund trades financial instruments and enter into financial transactions where risk of potential loss exists due to changes in the market (market risk). The value of the securities in which the Fund invests may go up or down in response to the prospects of individual companies, particular sectors or governments and/or general economic conditions throughout the world due to increasingly interconnected global economies and financial markets. Events such as war, acts of terrorism, social unrest, natural disasters, the spread of infectious illness or other public health threats
20
GOLDMAN SACHS VARIABLE INSURANCE TRUST GOVERNMENT MONEY MARKET FUND
5. OTHER RISKS (continued)
could also significantly impact the Fund and its investments. Additionally, the Fund may also be exposed to credit risk in the event that an issuer or guarantor fails to perform or that an institution or entity with which the Fund has unsettled or open transactions defaults.
6. INDEMNIFICATIONS
Under the Trust’s organizational documents, its Trustees, officers, employees and agents are indemnified, to the extent permitted by the Act and state law, against certain liabilities that may arise out of performance of their duties to the Fund. Additionally, in the course of business, the Fund enters into contracts that contain a variety of indemnification clauses. The Fund’s maximum exposure under these arrangements is unknown, as this would involve future claims that may be made against the Fund that have not yet occurred. However, GSAM believes the risk of loss under these arrangements to be remote.
7. OTHER MATTERS
New Accounting Standards — In March 2020, the FASB issued Accounting Standard Update (“ASU”) No. 2020-04, “Reference Rate Reform (Topic 848): Facilitation of the Effects of Reference Rate Reform on Financial Reporting.” This ASU provides optional exceptions for applying GAAP to contract modifications, hedging relationships and other transactions affected reference rate reform if certain criteria are met. ASU 2020-04 is elective and is effective on March 12, 2020 through December 31, 2022. As of the financial reporting period, GSAM is currently evaluating the impact, if any, of applying ASU 2020-04.
Other — On October 22, 2020, Goldman Sachs announced a settlement of matters involving 1Malaysia Development Bhd. (1MDB), a Malaysian sovereign wealth fund, with the United States Department of Justice as well as criminal and civil authorities in the UK, Singapore and Hong Kong. Further information regarding the 1MDB settlement can be found at https://www.goldmansachs.com/media-relations/press-releases/current/goldman-sachs-2020-10-22.html. The 1MDB settlement will not materially adversely affect GSAM’s ability to serve as investment manager.
8. SUBSEQUENT EVENTS
Subsequent events after the Statement of Assets and Liabilities date have been evaluated and GSAM has concluded that there is no impact requiring adjustment or disclosure in the financial statements.
21
GOLDMAN SACHS VARIABLE INSURANCE TRUST GOVERNMENT MONEY MARKET FUND
Notes to Financial Statements (continued)
December 31, 2020
9. SUMMARY OF SHARE TRANSACTIONS
Share activity is as follows:
| | | | | | | | |
| | | For the Fiscal Year Ended
December 31, 2020 | | | For the Fiscal Year Ended
December 31, 2019 | |
| Institutional Shares* | | | | | | | | |
| Shares sold | | | 1,110,386,804 | | | | 559,032,693 | |
| Reinvestment of distributions | | | 1,972,393 | | | | 7,303,819 | |
| Shares redeemed | | | (893,897,149 | ) | | | (614,043,249 | ) |
| | | | 218,462,048 | | | | (47,706,737 | ) |
| Service Shares* | | | | | | | | |
| Shares sold | | | 564,371,211 | | | | 177,381,211 | |
| Reinvestment of distributions | | | 1,092,130 | | | | 6,545,872 | |
| Shares redeemed | | | (336,132,071 | ) | | | (202,507,373 | ) |
| | | | 229,331,270 | | | | (18,580,290 | ) |
| | |
| NET INCREASE (DECREASE) IN SHARES | | | 447,793,318 | | | | (66,287,027 | ) |
| * | Valued at $1.00 per share. |
22
Report of Independent Registered Public Accounting Firm
To the Board of Trustees of Goldman Sachs Variable Insurance Trust and Shareholders of Goldman Sachs Government Money Market Fund
Opinion on the Financial Statements
We have audited the accompanying statement of assets and liabilities, including the schedule of investments, of Goldman Sachs Government Money Market Fund (one of the funds constituting Goldman Sachs Variable Insurance Trust, referred to hereafter as the “Fund”) as of December 31, 2020, the related statement of operations for the year ended December 31, 2020, the statements of changes in net assets for each of the two years in the period ended December 31, 2020, including the related notes, and the financial highlights for each of the five years in the period ended December 31, 2020 (collectively referred to as the “financial statements”). In our opinion, the financial statements present fairly, in all material respects, the financial position of the Fund as of December 31, 2020, the results of its operations for the year then ended, the changes in its net assets for each of the two years in the period ended December 31, 2020 and the financial highlights for each of the five years in the period ended December 31, 2020 in conformity with accounting principles generally accepted in the United States of America.
Basis for Opinion
These financial statements are the responsibility of the Fund’s management. Our responsibility is to express an opinion on the Fund’s financial statements based on our audits. We are a public accounting firm registered with the Public Company Accounting Oversight Board (United States) (PCAOB) and are required to be independent with respect to the Fund in accordance with the U.S. federal securities laws and the applicable rules and regulations of the Securities and Exchange Commission and the PCAOB.
We conducted our audits of these financial statements in accordance with the standards of the PCAOB. Those standards require that we plan and perform the audit to obtain reasonable assurance about whether the financial statements are free of material misstatement, whether due to error or fraud.
Our audits included performing procedures to assess the risks of material misstatement of the financial statements, whether due to error or fraud, and performing procedures that respond to those risks. Such procedures included examining, on a test basis, evidence regarding the amounts and disclosures in the financial statements. Our audits also included evaluating the accounting principles used and significant estimates made by management, as well as evaluating the overall presentation of the financial statements. Our procedures included confirmation of securities owned as of December 31, 2020 by correspondence with the custodian, transfer agent and brokers. We believe that our audits provide a reasonable basis for our opinion.
/s/PricewaterhouseCoopers LLP
Boston, Massachusetts
February 17, 2021
We have served as the auditor of one or more investment companies in the Goldman Sachs fund complex since 2000.
23
GOLDMAN SACHS VARIABLE INSURANCE TRUST GOVERNMENT MONEY MARKET FUND
Voting Results of Special Meeting of Shareholders (Unaudited)
A Special Meeting (the “Meeting”) of the Goldman Sachs Variable Insurance Trust (“VIT”) was held on January 23, 2020 to consider and act upon the proposal below. The Fund will amortize its respective share of the proxy, shareholder meeting and other related costs and GSAM has agreed to reimburse the Fund to the extent such expenses exceed a specified percentage of the Fund’s net assets.
At the Meeting, Dwight L. Bush, Kathryn A. Cassidy, Joaquin Delgado and Gregory G. Weaver were elected to the Trust’s Board of Trustees. In electing the trustees, the Trust’s shareholders voted as follows:
| | | | | | | | | | | | | | | | |
| | | | | |
Proposal 1. Election of Trustees | | For | | | Against | | | Withheld | | | Broker Non-Votes | |
| | | | | |
Dwight L. Bush | | | 745,493,677.130 | | | | 0 | | | | 17,848,840.639 | | | | 0 | |
| | | | | |
Kathryn A. Cassidy | | | 746,559,784.810 | | | | 0 | | | | 16,782,732.959 | | | | 0 | |
| | | | | |
Joaquin Delgado | | | 744,593,456.532 | | | | 0 | | | | 18,749,061.237 | | | | 0 | |
| | | | | |
Gregory G. Weaver | | | 746,707,039.321 | | | | 0 | | | | 16,635,478.448 | | | | 0 | |
24
GOLDMAN SACHS VARIABLE INSURANCE TRUST GOVERNMENT MONEY MARKET FUND
| | |
| Fund Expenses — Six Month Period Ended December 31, 2020 (Unaudited) | | |
As a shareholder of Institutional Shares and Service Shares of the Fund, you incur ongoing costs, including management fees; distribution and service (12b-1) fees (with respect to Service Shares); and other Fund expenses. This example is intended to help you understand your ongoing costs (in dollars) of investing in the Fund and to compare these costs with the ongoing costs of investing in other mutual funds.
The example is based on an investment of $1,000 invested at the beginning of the period and held for the entire period from July 1, 2020 through December 31, 2020, which represents a period of 184 days of a 366 day year.
Actual Expenses — The first line in the table below provides information about actual account values and actual expenses. You may use the information in this line, together with the amount you invested, to estimate the expenses that you paid over the period. Simply divide your account value by $1,000 (for example, an $8,600 account value divided by $1,000=8.6), then multiply the result by the number in the first line under the heading entitled “Expenses Paid” to estimate the expenses you paid on your account during this period.
Hypothetical Example for Comparison Purposes — The second line in the table below provides information about hypothetical account values and hypothetical expenses based on the Fund’s actual net expense ratio and an assumed rate of return of 5% per year before expenses, which is not the Fund’s actual return. The hypothetical account values and expenses may not be used to estimate the actual ending account balance or expenses you paid for the period. You may use this information to compare the ongoing costs of investing in the Fund and other funds. To do so, compare this 5% hypothetical example with the 5% hypothetical examples that appear in the shareholder reports of the other funds.
Please note that the expenses shown in the table are meant to highlight your ongoing costs only and do not reflect any transactional costs, such as sales charges, redemption fees, or exchange fees. Therefore, the second line of the table is useful in comparing ongoing costs only and will not help you determine the relative total costs of owning different funds. In addition, if these transactional costs were included, your costs would have been higher.
| | | | | | | | | | | | |
| Share Class | | Beginning
Account Value
7/1/20 | | | Ending
Account Value
12/31/20 | | | Expenses Paid
for the 6 Months
Ended 12/31/20* | |
| Institutional Shares | | | | | | | | | | | | |
| | | | |
| Actual | | $ | 1,000.00 | | | $ | 1,003.88 | | | $ | 0.86 | |
| Hypothetical 5% return | | $ | 1,000.00 | | | $ | 1,024.28 | + | | $ | 0.87 | |
| Service Shares | | | | | | | | | | | | |
| | | | |
| Actual | | $ | 1,000.00 | | | $ | 1,002.64 | | | $ | 1.21 | |
| Hypothetical 5% return | | $ | 1,000.00 | | | $ | 1,023.93 | + | | $ | 1.22 | |
| | + | Hypothetical expenses are based on the Fund’s actual annualized net expense ratio and an assumed rate of return of 5% per year before expenses. | |
| | * | Expenses are calculated using the Fund’s annualized net expense ratio for each class, which represents the ongoing expenses as a percentage of net assets for the six months ended December 31, 2020. Expenses are calculated by multiplying the annualized net expense ratio by the average account value for the period; then multiplying the result by the number of days in the most recent fiscal half year (or, since inception, if shorter); and then dividing that result by the number of days in the period. The annualized net expense ratios for the period were 0.17% and 0.24% for Institutional Shares and Service Shares, respectively. | |
25
GOLDMAN SACHS VARIABLE INSURANCE TRUST GOVERNMENT MONEY MARKET FUND
Trustees and Officers (Unaudited)
Independent Trustees
| | | | | | | | | | | | |
| | | | | |
Name,
Address and Age1 | | Position(s) Held
with the Trust | | Term of
Office and
Length of
Time Served2 | | Principal Occupation(s) During Past 5 Years | | Number of
Portfolios in
Fund Complex
Overseen by
Trustee3 | | | Other
Directorships
Held by Trustee4 |
Jessica Palmer Age: 71 | | Chair of the Board of Trustees | | Since 2018 (Trustee since 2007) | | Ms. Palmer is retired. She was formerly Consultant, Citigroup Human Resources Department (2007-2008); Managing Director, Citigroup Corporate and Investment Banking (previously, Salomon Smith Barney/Salomon Brothers) (1984-2006). Ms. Palmer was a Member of the Board of Trustees of Indian Mountain School (private elementary and secondary school) (2004-2009). Chair of the Board of Trustees — Goldman Sachs Trust and Goldman Sachs Variable Insurance Trust. | | | 105 | | | None |
Dwight L. Bush Age: 63 | | Trustee | | Since 2020 | | Ambassador Bush is President and CEO of D.L. Bush & Associates (a financial advisory and private investment firm) (2002-2014 and 2017- present); and was formerly U.S. Ambassador to the Kingdom of Morocco (2014-2017) and a Member of the Board of Directors of Santander Bank, N.A. (2018-2019). Previously, Ambassador Bush served as an Advisory Board Member of Goldman Sachs Trust and Goldman Sachs Variable Insurance Trust (October 2019-January 2020). Trustee — Goldman Sachs Trust and Goldman Sachs Variable Insurance Trust. | | | 105 | | | None |
Kathryn A. Cassidy Age: 66 | | Trustee | | Since 2015 | | Ms. Cassidy is retired. Formerly, she was Advisor to the Chairman (May 2014-December 2014); and Senior Vice President and Treasurer (2008-2014), General Electric Company & General Electric Capital Corporation (technology and financial services companies). Trustee — Goldman Sachs Trust and Goldman Sachs Variable Insurance Trust. | | | 105 | | | None |
Diana M. Daniels Age: 71 | | Trustee | | Since 2007 | | Ms. Daniels is retired. Formerly, she was Vice President, General Counsel and Secretary, The Washington Post Company (1991-2006). Ms. Daniels is a Trustee Emeritus and serves as a Presidential Councillor of Cornell University (2013-Present); former Member of the Legal Advisory Board, New York Stock Exchange (2003-2006) and of the Corporate Advisory Board, Standish Mellon Management Advisors (2006-2007). Trustee — Goldman Sachs Trust and Goldman Sachs Variable Insurance Trust. | | | 105 | | | None |
Joaquin Delgado Age: 60 | | Trustee | | Since 2020 | | Dr. Delgado is retired. He is Director, Hexion Inc. (a specialty chemical manufacturer) (2019- present); and Director, Stepan Company (a specialty chemical manufacturer) (2011-present); and was formerly Executive Vice President, Consumer Business Group of 3M Company (July 2016-July 2019); and Executive Vice President, Health Care Business Group of 3M Company (October 2012-July 2016). Previously, Dr. Delgado served as an Advisory Board Member of Goldman Sachs Trust and Goldman Sachs Variable Insurance Trust (October 2019-January 2020). Trustee — Goldman Sachs Trust and Goldman Sachs Variable Insurance Trust. | | | 105 | | | Stepan Company (a specialty chemical manufacturer) |
| | | | | | | | | | | | |
26
GOLDMAN SACHS VARIABLE INSURANCE TRUST GOVERNMENT MONEY MARKET FUND
Trustees and Officers (Unaudited) (continued)
Independent Trustees
| | | | | | | | | | | | |
| | | | | |
Name,
Address and Age1 | | Position(s) Held
with the Trust | | Term of
Office and
Length of
Time Served2 | | Principal Occupation(s) During Past 5 Years | | Number of
Portfolios in
Fund Complex
Overseen by
Trustee3 | | | Other
Directorships
Held by Trustee4 |
Roy W. Templin Age: 60 | | Trustee | | Since 2013 | | Mr. Templin is retired. He is Director, Armstrong World Industries, Inc. (a designer and manufacturer of ceiling, wall and suspension system solutions) (2016-Present); and was formerly Chairman of the Board of Directors, Con- Way Incorporated (a transportation, logistics and supply chain management service company) (2014-2015); Executive Vice President and Chief Financial Officer, Whirlpool Corporation (an appliance manufacturer and marketer) (2004-2012). Trustee — Goldman Sachs Trust and Goldman Sachs Variable Insurance Trust. | | | 105 | | | Armstrong World Industries, Inc. (a ceiling, wall and suspension systems solutions manufacturer) |
Gregory G. Weaver Age: 69 | | Trustee | | Since 2015 | | Mr. Weaver is retired. He is Director, Verizon Communications Inc. (2015-Present); and was formerly Chairman and Chief Executive Officer, Deloitte & Touche LLP (a professional services firm) (2001-2005 and 2012-2014); and Member of the Board of Directors, Deloitte & Touche LLP (2006-2012). Trustee — Goldman Sachs Trust and Goldman Sachs Variable Insurance Trust. | | | 105 | | | Verizon Communications Inc. |
| | | | | | | | | | | | |
Interested Trustee*
| | | | | | | | | | | | |
| | | | | |
Name,
Address and Age1 | | Position(s) Held
with the Trust | | Term of
Office and
Length of
Time Served2 | | Principal Occupation(s) During Past 5 Years | | Number of
Portfolios in
Fund Complex
Overseen by
Trustee3 | | | Other
Directorships
Held by Trustee4 |
James A. McNamara Age: 58 | | President and Trustee | | Since 2007 | | Advisory Director, Goldman Sachs (January 2018 — Present); Managing Director, Goldman Sachs (January 2000-December 2017); Director of Institutional Fund Sales, GSAM (April 1998- December 2000); and Senior Vice President and Manager, Dreyfus Institutional Service Corporation (January 1993-April 1998). President and Trustee — Goldman Sachs Trust; Goldman Sachs Variable Insurance Trust; Goldman Sachs Trust II; Goldman Sachs MLP and Energy Renaissance Fund; Goldman Sachs ETF Trust; Goldman Sachs Credit Income Fund; and Goldman Sachs Real Estate Diversified Income Fund. | | | 164 | | | None |
| | | | | | | | | | | | |
| * | Mr. McNamara is considered to be an “Interested Trustee” because he holds positions with Goldman Sachs and owns securities issued by The Goldman Sachs Group, Inc. Mr. McNamara holds comparable positions with certain other companies of which Goldman Sachs, GSAM or an affiliate thereof is the investment adviser, administrator and/or distributor. |
| 1 | Each Trustee may be contacted by writing to the Trustee, c/o Goldman Sachs, 200 West Street, New York, New York, 10282, Attn: Caroline Kraus. Information is provided as of December 31, 2020. |
| 2 | Subject to such policies as may be adopted by the Board from time-to-time, each Trustee holds office for an indefinite term, until the earliest of: (a) the election of his or her successor; (b) the date the Trustee resigns or is removed by the Board or shareholders, in accordance with the Trust’s Declaration of Trust; or (c) the termination of the Trust. The Board has adopted policies which provide that each Independent Trustee shall retire as of December 31st of the calendar year in which he or she reaches (a) his or her 75th birthday or (b) the 15th anniversary of the date he or she became a Trustee, whichever is earlier, unless a waiver of such requirements shall have been adopted by a majority of the other Trustees. These policies may be changed by the Trustees without shareholder vote. |
| 3 | The Goldman Sachs Fund Complex includes certain other companies listed above for each respective Trustee. As of December 31, 2020, Goldman Sachs Trust consisted of 92 portfolios (90 of which offered shares to the public); Goldman Sachs Variable Insurance Trust consisted of 13 portfolios; Goldman Sachs Trust II consisted of 19 portfolios (17 of which offered shares to the public); Goldman Sachs ETF Trust consisted of 42 portfolios (24 of which offered shares to the public); and Goldman Sachs MLP and Energy Renaissance Fund, Goldman Sachs Credit Income Fund and Goldman Sachs Real Estate Diversified Income Fund each consisted of one portfolio. Goldman Sachs Credit Income Fund did not offer shares to the public. |
| 4 | This column includes only directorships of companies required to report to the Securities and Exchange Commission under the Securities Exchange Act of 1934 (i.e., “public companies”) or other investment companies registered under the Act. |
Additional information about the Trustees is available in the Funds’ Statement of Additional Information, which can be obtained from Goldman Sachs free of charge by calling this toll-free number (in the United States of America): 1-800-526-7384.
27
GOLDMAN SACHS VARIABLE INSURANCE TRUST GOVERNMENT MONEY MARKET FUND
Trustees and Officers (Unaudited) (continued)
Officers of the Trust*
| | | | | | |
| | | |
| Name, Address and Age1 | | Positions Held
with the Trust | | Term of
Office and
Length of
Time Served2 | | Principal Occupation(s) During Past 5 Years |
James A. McNamara
200 West Street
New York, NY 10282Age: 58 | | Trustee and President | | Since 2014 | | Advisory Director, Goldman Sachs (January 2018-Present); Managing Director, Goldman Sachs (January 2000-December 2017); Director of Institutional Fund Sales, GSAM (April 1998-December 2000); and Senior Vice President and Manager, Dreyfus Institutional Service Corporation (January 1993-April 1998). President and Trustee — Goldman Sachs Trust; Goldman Sachs Variable Insurance Trust; Goldman Sachs Trust II; Goldman Sachs MLP and Energy Renaissance Fund; Goldman Sachs ETF Trust; Goldman Sachs Credit Income Fund; and Goldman Sachs Real Estate Diversified Income Fund. |
Caroline L. Kraus
200 West Street
New York, NY 10282 Age: 43 | | Secretary | | Since 2014 | | Managing Director, Goldman Sachs (January 2016-Present); Vice President, Goldman Sachs (August 2006-December 2015); Senior Counsel, Goldman Sachs (January 2020–Present); Associate General Counsel, Goldman Sachs (2012-December 2019); Assistant General Counsel, Goldman Sachs (August 2006-December 2011); and Associate, Weil, Gotshal & Manges, LLP (2002-2006). Secretary — Goldman Sachs Trust (previously Assistant Secretary (2012)); Goldman Sachs Variable Insurance Trust (previously Assistant Secretary (2012)); Goldman Sachs Trust II; Goldman Sachs BDC, Inc.; Goldman Sachs Private Middle Market Credit LLC; Goldman Sachs Private Middle Market Credit II LLC; Goldman Sachs Middle Market Lending Corp.; Goldman Sachs MLP and Energy Renaissance Fund; Goldman Sachs ETF Trust; Goldman Sachs ETF Trust; Goldman Sachs Credit Income Fund; and Goldman Sachs Real Estate Diversified Income Fund. |
Joseph F. DiMaria
30 Hudson Street
Jersey City, NJ 07302
Age: 52 | | Treasurer, Principal
Financial Officer and
Principal Accounting
Officer | | Since 2017
(Treasurer
and
Principal
Financial
Officer
since 2019) | | Managing Director, Goldman Sachs (November 2015-Present) and Vice President — Mutual Fund Administration, Columbia Management Investment Advisers, LLC (May 2010- October 2015). Treasurer, Principal Financial Officer and Principal Accounting Officer — Goldman Sachs Trust (previously Assistant Treasurer (2016)); Goldman Sachs Variable Insurance Trust (previously Assistant Treasurer (2016)); Goldman Sachs Trust II (previously Assistant Treasurer (2017)); Goldman Sachs MLP and Energy Renaissance Fund (previously Assistant Treasurer (2017)); Goldman Sachs ETF Trust (previously Assistant Treasurer (2017)); Goldman Sachs Credit Income Fund; and Goldman Sachs Real Estate Diversified Income Fund. |
| | | | | | |
| * | Represents a partial list of officers of the Trust. Additional information about all the officers is available in the Funds’ Statement of Additional Information, which can be obtained from Goldman Sachs free of charge by calling this toll-free number (in the United States): 1-800-526-7384. |
| 1 | Information is provided as of December 31, 2020. |
| 2 | Officers hold office at the pleasure of the Board of Trustees or until their successors are duly elected and qualified. Each officer holds comparable positions with certain other companies of which Goldman Sachs, GSAM or an affiliate thereof is the investment adviser, administrator and/or distributor. |
Goldman Sachs Variable Insurance Trust — Tax Information (Unaudited)
Pursuant to Section 852 of the Internal Revenue Code, the Government Money Market Fund designates $55 or, if different, the maximum amount allowable, as capital gain dividends paid during the fiscal year ended December 31, 2020.
For the year ended December 31, 2020, the Government Money Market Fund designates 95.53% of the dividends paid from net investment company taxable income as section 163(j) Interest Dividends.
28
| | |
TRUSTEES Jessica Palmer, Chair Dwight L. Bush Kathryn A. Cassidy Diana M. Daniels Joaquin Delgado James A. McNamara Roy W. Templin Gregory G. Weaver | | OFFICERS James A. McNamara, President Joseph F. DiMaria, Principal Financial Officer, Principal Accounting Officer and Treasurer Caroline L. Kraus, Secretary |
GOLDMAN SACHS & CO. LLC
Distributor and Transfer Agent
GOLDMAN SACHS ASSET MANAGEMENT, L.P.
Investment Adviser
200 West Street, New York
New York 10282
Visit our web site at www.GSAMFUNDS.com to obtain the most recent month-end returns.
The reports concerning the Fund included in this shareholder report may contain certain forward-looking statements about the factors that may affect the performance of the Fund in the future. These statements are based on Fund management’s predictions and expectations concerning certain future events and their expected impact on the Fund, such as performance of the economy as a whole and of specific industry sectors, changes in the levels of interest rates, the impact of developing world events, and other factors that may influence the future performance of the Fund. Management believes these forward-looking statements to be reasonable, although they are inherently uncertain and difficult to predict. Actual events may cause adjustments in portfolio management strategies from those currently expected to be employed.
A description of the policies and procedures that the Fund uses to determine how to vote proxies relating to portfolio securities and information regarding how the Fund voted proxies relating to portfolio securities during the most recent 12-month period ended December 31 is available (i) without charge, upon request by calling 1-800-621-2550; and (ii) on the Securities and Exchange Commission (“SEC”) Web site at http://www.sec.gov.
Views and opinions expressed are for informational purposes only and do not constitute a recommendation by GSAM to buy, sell, or hold any security. Views and opinions are current as of the date of this presentation and may be subject to change, they should not be construed as investment advice.
Goldman Sachs & Co. LLC (“Goldman Sachs”) does not provide legal, tax or accounting advice. Any statement contained in this communication (including any attachments) concerning U.S. tax matters was not intended or written to be used, and cannot be used, for the purpose of avoiding penalties under the Internal Revenue Code, and was written to support the promotion or marketing of transaction or matter addressed. Clients of Goldman Sachs should obtain their own independent tax advice based on their particular circumstances.
The web site links provided are for your convenience only and are not an endorsement or recommendation by GSAM of any of these web sites or the products or services offered. GSAM is not responsible for the accuracy and validity of the content of these web sites.
Fund holdings and allocations shown are as of December 31, 2020 and may not be representative of future investments. Fund holdings should not be relied on in making investment decisions and should not be construed as research or investment advice regarding particular securities. Current and future holdings are subject to risk.
The portfolio risk management process includes an effort to monitor and manage risk, but does not imply low risk.
Shares of the Goldman Sachs VIT Funds are offered to separate accounts of participating life insurance companies for the purpose of funding variable annuity contracts and variable life insurance policies. Shares of the Fund are not offered directly to the general public. The variable annuity contracts and variable life insurance policies are described in the separate prospectuses issued by participating insurance companies. You should refer to those prospectuses for information about surrender charges, mortality and expense risk fees and other charges that may be assessed by participating insurance companies under the variable annuity contracts or variable life insurance policies. Such fees or charges, if any, may affect the return you may realize with respect to your investments. Ask your representative for more complete information. Please consider a fund’s objectives, risks and charges and expenses, and read the prospectus carefully before investing. The prospectus contains this and other information about the Fund.
This material is not authorized for distribution to prospective investors unless preceded or accompanied by a current prospectus or summary prospectus, if applicable. Investors should consider the Fund’s objective, risks, and charges and expenses, and read the summary prospectus, if available, and/or the prospectus carefully before investing or sending money. The summary prospectus, if available, and the prospectus contain this and other information about the Fund and may be obtained from your authorized dealer or from Goldman Sachs & Co. LLC by calling 1-800-621-2550.
This report is prepared for the general information of contract owners and is not an offer of shares of the Goldman Sachs Variable Insurance Trust — Goldman Sachs Government Money Market Fund.
© 2021 Goldman Sachs. All rights reserved.
VITMMAR-21/229739-OTU-1350836
Goldman
Sachs Variable Insurance Trust
Goldman Sachs
Multi-Strategy
Alternatives Portfolio
Beginning on or after January 1, 2021, you may not receive paper copies of the Portfolio’s annual and semi-annual shareholder reports from the insurance company that offers your variable insurance contract or your financial intermediary, unless you specifically request paper copies of the reports from the insurance company or from your financial intermediary. Instead, the reports will be made available on a website, and you will be notified by mail each time a report is posted and provided with a website link to access the report.
If you already elected to receive shareholder reports electronically, you will not be affected by this change and you need not take any action. At any time, you may elect to receive reports and certain communications from the insurance company electronically by contacting your insurance company or your financial intermediary.
You may elect to receive all future shareholder reports in paper free of charge. You can inform the insurance company or your financial intermediary that you wish to receive paper copies of reports. Your election to receive reports in paper will apply to all Goldman Sachs Funds available under your contract and may apply to all funds held with your financial intermediary.

Annual Report
December 31, 2020
GOLDMAN SACHS VARIABLE INSURANCE TRUST MULTI-STRATEGY ALTERNATIVES PORTFOLIO
INVESTMENT OBJECTIVE
The Portfolio seeks long-term growth of capital.
Portfolio Management Discussion and Analysis
Below, the Goldman Sachs Multi-Asset Solutions (“MAS”) Team discusses the Goldman Sachs Variable Insurance Trust — Goldman Sachs Multi-Strategy Alternatives Portfolio’s (the “Portfolio”) performance and positioning for the 12-month period ended December 31, 2020 (the “Reporting Period”).
How did the Portfolio perform during the Reporting Period?
During the Reporting Period, the Portfolio’s Institutional, Service and Advisor Shares generated average annual total returns of 7.05%, 6.70% and 6.56%, respectively. These returns compare to the 1.08% average annual total return of the Portfolio’s benchmark, the ICE BofAML U.S. Dollar Three-Month LIBOR Constant Maturity Index (the “LIBOR Index”), during the same period.
Please note that the Portfolio’s benchmark being the LIBOR Index is a means of emphasizing that the Portfolio has an unconstrained strategy. That said, this Portfolio employs a benchmark agnostic strategy and thus comparisons to a benchmark index are not particularly relevant.
What economic and market factors most influenced the Portfolio during the Reporting Period?
The capital markets and the Portfolio were most influenced during the Reporting Period by the spread of COVID-19, a contraction in global economic growth and historic financial stimulus by central banks and governments around the world.
When the Reporting Period began in January 2020, investors generally held a stable pro-growth outlook for the U.S. and global economies. However, in February, twin shocks — the COVID-19 pandemic and collapsing crude oil prices — forced them to recalibrate their risk tolerance. A historic level of market volatility, including the quickest transition from an equity bull market to an equity bear market in modern financial market times, further clouded the near-term investing outlook. (A bull market is a market in which securities prices are rising. A bear market is a condition in which securities prices fall 20% or more from recent highs amid widespread pessimism and negative investor sentiment.) As fear spread through the financial markets, risk assets broadly sold off. Global equities, as represented by the MSCI ACWI Investable Market Index, fell 21.0% during the first calendar quarter. Developed markets equities, as represented by the MSCI World Index, were down 19.7%, and emerging markets equities, as represented by the MSCI Emerging Markets Index, were down 23.6%. Within developed markets, U.S. equities, as measured by the S&P 500 ® Index, dropped 19.6%. As for fixed income, the 10-year U.S. Treasury yield plummeted. In response to the economic and financial challenges wrought by the spread of COVID-19, central banks and governments around the world enacted unprecedented levels of monetary and fiscal stimulus. In the U.S., more than $2 trillion of fiscal support, combined with the return of the U.S. Federal Reserve’s (“Fed”) zero interest rate policy, sought to help the country weather the human and economic maelstrom while simultaneously laying the foundation for economic recovery once COVID-19 risks recede.
The fastest quarterly decline in the global equity market since the fourth quarter of 2008 was followed in the second quarter of 2020 by the fastest recovery since the fourth quarter of 1984. In our view the recovery was mainly catalyzed by three factors. First, unprecedented monetary easing and fiscal stimulus globally provided a backstop for risk assets and eased liquidity concerns. The Fed was somewhat more dovish than market expected at its June meeting. (Dovish tends to suggest lower interest rates; opposite of hawkish.) Meanwhile, the European Union announced a €750 billion recovery fund, taking a step closer towards the fiscal integration of the Eurozone. China and Japan also delivered meaningful fiscal action. Second, starting mid-April 2020, the growth rate of new COVID-19 cases showed signs of flattening in hotspots such as the U.S., Europe and China, with daily growth rates falling to low single digits and recovery rates starting to rise. As a result, authorities relaxed lockdown restrictions, gradually re-opened parts of their economies, announced social distancing norms and increased testing. The narrative shifted from COVID-19 infections to therapeutics and vaccines. Third, certain economic indicators started to recover. These included global purchasing manager indices, which inched up; U.S. non-farm payrolls, which provided consecutive positive surprises; and consumer and business sentiment that appeared to be bottoming. Global equities, as represented by the MSCI ACWI Investable Market Index, rose 19.3%. U.S. equities, as measured by the S&P 500® Index, rose 20.5%. Developed markets equities, as represented by the MSCI World Index, and emerging markets equities, as represented by the MSCI Emerging Markets Index, were up approximately 18.7% and 18.2%, respectively. As for fixed income, the 10-year U.S. Treasury yield edged down slightly in its smallest quarterly change on record.
1
GOLDMAN SACHS VARIABLE INSURANCE TRUST MULTI-STRATEGY ALTERNATIVES PORTFOLIO
At the start of the third quarter of 2020, the key theme in the marketplace was the reopening of the U.S. and global economies. Initial concerns centered on whether a rushed reopening would bring a new wave of COVID-19 infections that might cause a relapse and renewed shutdown of the economy. Steadily over the course of the summer, even as positive test results accumulated, the severe consequences of COVID-19, such as hospitalizations and the tally of patients on ventilators, remained well below prior peak levels. This reality, combined with growing optimism about an eventual approval of a COVID-19 vaccine, acted as a tailwind to equities broadly, continuing their positive momentum from the second quarter of 2020. Toward the end of the third calendar quarter, investors increasingly focused on unsuccessful partisan negotiations to reach a compromise on additional fiscal support for the U.S. economy as well as on the then-upcoming U.S. Presidential and Congressional elections in November. U.S. economic data remained sufficiently healthy, allowing investors to look beyond near-term elections and fiscal concerns. Against this backdrop, developed markets equities, as measured by the MSCI World Index, and emerging market equities, as measured by the MSCI Emerging Markets Index, rose 6.8% and 8.6%, respectively. Within developed markets equities, U.S. stocks, as represented by the S&P 500® Index, led the rally, registering a gain of 8.9%. In fixed income, the 10-year U.S. Treasury yield rose slightly.
During the fourth quarter of 2020, global economic activity remained resilient in spite of renewed worries about rising COVID–19 cases, delays in additional U.S. fiscal stimulus, and general market uncertainty surrounding the possibility of a contested U.S. Presidential election. Although an increase in COVID-19 cases, especially in Europe and the U.S., drove heightened financial market volatility, the announcement that the Pfizer and Moderna vaccines had better than consensus expected efficacy appeared to be a huge relief for policymakers and market participants. Investor confidence was further bolstered by the strong economic data from Asia, and from China in particular. In addition, major global central banks appeared to reassure market participants by committing to accommodative monetary policies. In the U.S., the Fed introduced forward guidance for its asset purchases, stating it would continue to increase its U.S. Treasury and mortgage-backed securities holdings until substantial further progress was made towards its maximum employment and price stability goals. Similarly, the European Central Bank committed to continued support for its economy by expanding and extending its Pandemic Emergency Purchase Programme. Overall, this favorable mix of recovering global economies, positive news flow on COVID-19 vaccines, and strong forward guidance from the major central banks was supportive of risk assets, particularly equities, in the fourth calendar quarter. Global equities, as represented by the MSCI ACWI Investable Market Index, rose 15.7%. U.S. equities, as measured by the S&P 500® Index, rose 12.15%. Developed markets equities, as represented by the MSCI World Index, and emerging markets equities, as represented by the MSCI Emerging Markets Index, were up approximately 13.9% and 19.7%, respectively. As for fixed income, the 10-year U.S. Treasury yield rose during the fourth quarter of 2020 but remained well below its highs seen near the beginning of the calendar year.
What key factors were responsible for the Portfolio’s performance during the Reporting Period?
The Portfolio’s performance is driven by three sources of return: long-term strategic asset allocation to market exposures, medium-term and short-term dynamic allocations, and excess returns from investments in underlying funds in which the Portfolio invests (“Underlying Funds”). Long-term strategic asset allocation is the process by which the Portfolio’s assets are allocated across underlying asset classes and strategies in a way that considers the risks of each underlying asset class and strategy. Medium-term dynamic allocation is the process by which we adjust the portfolio for changes in the business or economic cycle, while short-term dynamic allocation is the implementation of tactical market views with the goal of improving the Portfolio’s risk-adjusted return. The risk-adjusted return on an investment takes into account the risk associated with that investment relative to other potential investments. Excess returns from investments in Underlying Funds is by how much the Underlying Funds outperform or underperform their respective benchmark indices.
During the Reporting Period, the Portfolio generated positive absolute returns, largely because of strategic asset allocation. Short-term dynamic allocation also added to the Portfolio’s performance, though this was partially offset by the medium-term dynamic allocation, which detracted from the Portfolio’s results. Security selection within the Underlying Funds contributed positively to the Portfolio’s returns.
Strategic asset allocation added to the Portfolio’s performance during the Reporting Period. Within equities, the Portfolio was helped by a strategic allocation to emerging markets stocks, which posted positive returns. Emerging markets equities recovered strongly from their March 2020 lows, benefiting from renewed investor hopes for a global economic recovery and increased global trade activity. Conversely, the Portfolio was hurt by its strategic allocation to U.S. real estate securities, which suffered amid slowing demand, potential tenant bankruptcies and a deteriorating financial environment. In fixed income, all of the Portfolio’s strategic allocations generated positive returns. The primary driver of these gains was our long U.S. interest rate options strategy, through which we seek to profit if interest rates fall, remain constant or rise less than anticipated. This strategy bolstered performance, as U.S. Treasury yields fell during the Reporting Period. (Our long U.S. interest rate options strategy is a macroeconomic hedge that buys put options on short-term interest rates. A put option is an option contract giving the owner the right, but not the obligation, to sell a specified amount of an underlying asset at a specified price within a specified time.) In
2
GOLDMAN SACHS VARIABLE INSURANCE TRUST MULTI-STRATEGY ALTERNATIVES PORTFOLIO
addition, the Portfolio benefited from our strategic allocations to high yield corporate bonds, high yield bank loans and emerging markets debt, as risk assets recorded gains for the Reporting Period overall. Regarding liquid alternatives strategies, all but two of the Portfolio’s strategic allocations produced positive returns. A strategic allocation to the Goldman Sachs Managed Futures Strategy Fund added most to the Portfolio’s performance, followed by strategic allocations to the Goldman Sachs Long Short Credit Strategies Fund and the Goldman Sachs Absolute Return Tracker Fund. However, a strategic allocation to the Goldman Sachs Alternative Premia Fund, which posted negative returns, and our volatility selling strategy detracted from the Portfolio’s performance during the Reporting Period. (Our volatility selling strategy seeks to benefit from changes in the level of market implied volatility (i.e., expectations of future volatility) in equity markets.)
Medium-term dynamic allocation detracted from the Portfolio’s performance. During the Reporting Period, the Portfolio held four medium-term views. The first was that the Portfolio should hold a long position in U.S. large-cap equities and a short position in emerging markets equities, which had a negative impact overall on the Portfolio’s returns. This medium-term dynamic view was already in place when the Reporting Period began in January 2020, and we increased the Portfolio’s short position in emerging markets equities during March and April to reduce portfolio risk in event of a global economic recession. During June, as investors appeared to grow more optimistic about global economic conditions, we reduced the Portfolio’s short position in emerging markets equities. The second medium-term dynamic view was that the Portfolio should have decreased exposure to our long U.S. interest rate options strategy and increased exposure to 10-year U.S. Treasury futures. In April, after U.S. Treasury yields had fallen to record lows during the first quarter of 2020, we generated positive returns for the Portfolio by selling some of its holdings of U.S. interest rate options. However, these gains were modestly offset by losses in 10-year U.S. Treasury futures. Our third medium-term dynamic view, which was that the Portfolio hold a short position in high yield corporate bonds, detracted from returns during the Reporting Period overall. Although this short position bolstered performance early in the Reporting Period, it hurt returns as high yield corporate bonds generated strong gains during the fourth quarter of 2020. Our fourth medium-term dynamic view was that the Portfolio should hold a short position in the Goldman Sachs Alternative Premia Fund and a long position in the Goldman Sachs Absolute Return Tracker Fund. Overall, this positioning had a positive impact on the Portfolio’s performance during the Reporting Period.
Short-term dynamic allocation added to the Portfolio’s performance during the Reporting Period. The MAS Team expresses its short-term dynamic views through an allocation to the Goldman Sachs Tactical Tilt Overlay Fund (the “Underlying Tactical Fund”), which generated positive returns during the Reporting Period.
Overall, security selection within the Underlying Funds contributed positively to the Portfolio’s performance. The primary contributor was the Goldman Sachs Strategic Income Fund, which outperformed its benchmark index during the Reporting Period. The Goldman Sachs Emerging Markets Debt Fund, the Goldman Sachs Emerging Markets Equity Insights Fund and the Goldman Sachs Managed Futures Strategy Fund also outperformed their respective benchmark indices. Conversely, the Goldman Sachs Absolute Return Tracker Fund was the primary detractor, underperforming its benchmark index. The Goldman Sachs High Yield Fund also underperformed its respective benchmark index during the Reporting Period.
How was the Portfolio positioned at the beginning of the Reporting Period?
At the beginning of the Reporting Period, the Portfolio was positioned, in terms of its total net assets, with 64.5% in liquid alternative strategies, 28.1% in real assets/satellite asset classes and 7.4% in cash. Liquid alternatives strategies generally include, but are not limited to, momentum or trend trading strategies (investment decisions based on trends in asset prices over time), hedge fund beta (long term total returns consistent with investment results that approximate the return and risk patterns of a diversified universe of hedge funds), managed risk investment strategies (which seek to manage extreme risk scenarios by implementing daily and monthly risk targets across a diversified mix of asset classes), emerging markets debt and unconstrained fixed income strategies (which have the ability to move across various fixed income sectors). Real assets generally include, but are not limited to, commodities, global real estate securities, infrastructure and master limited partnerships. The strategic asset allocation of the Portfolio reflects a risk-based allocation approach to increase diversification across the Portfolio. The Portfolio had 6.4% of its total net assets invested in tactical exposures at the beginning of the Reporting Period. This above sector breakout is inclusive of derivative exposure across all asset classes.
How did you manage the Portfolio’s allocations during the Reporting Period?
During the Reporting Period, we made no changes to the Portfolio’s strategic allocation. We consider the Portfolio’s strategic asset allocation and underlying active security selection strategies the largest drivers of risk and performance.
Within the medium-term dynamic allocation, we sought to adjust the Portfolio’s exposure for what we considered to be medium-term changes to the business or economic cycle. In April 2020, we decreased the Portfolio’s exposure to our long U.S. interest rate
3
GOLDMAN SACHS VARIABLE INSURANCE TRUST MULTI-STRATEGY ALTERNATIVES PORTFOLIO
options strategy. At the same time, we added 10-year U.S. Treasury futures to help maintain the Portfolio’s duration position. (Duration is a measure of the Portfolio’s sensitivity to changes in interest rates.) In addition, during March and April, we increased the Portfolio’s short position in emerging markets equities within our medium-term dynamic view that the Portfolio hold a long position in U.S. equities and a short position in emerging markets equities. In June, we reduced the size of the Portfolio’s short position in emerging markets equities.
How was the Portfolio positioned at the end of the Reporting Period?
At the end of the Reporting Period, the Portfolio was positioned, in terms of its total net assets, with 63.6% in liquid alternative strategies, 32.0% in real assets/satellite asset classes and 4.4% in cash. The Portfolio had 11.8% of its total net assets invested in tactical exposures. This above sector breakout is inclusive of derivative exposure across all asset classes.
How did the Portfolio use derivatives and similar instruments during the Reporting Period?
During the Reporting Period, derivatives were used primarily to express our views across developed and emerging markets equities. More specifically, the Portfolio employed equity index futures to effect long exposures in U.S. large-cap equities (positive impact on performance) and emerging markets equities (negative impact). Within fixed income during the Reporting Period, the Portfolio used interest rate futures, specifically U.S. Treasury futures, to express views on the U.S. Treasury yield curve (neutral impact). Finally, the Portfolio used interest rate options in a macroeconomic hedge that seeks to profit if interest rates fall, remain constant or rise less than anticipated (positive impact).
Additionally, some of the Underlying Funds used derivatives during the Reporting Period to apply their active investment views with greater versatility and potentially to afford greater risk management precision. As market conditions warranted during the Reporting Period, some of these Underlying Funds engaged in forward foreign currency exchange contracts, financial futures contracts, options, swap contracts and structured securities to attempt to enhance portfolio return and for hedging purposes.
What is the Portfolio’s tactical view and strategy for the months ahead?
At the end of the Reporting Period, we believed high efficacy rates for COVID-19 vaccines and expectations for a broad vaccination rollout in North America and Europe by mid-2021 were likely to fuel a sustained and expanding rebound in global economic activity. Overall, we anticipated above-trend economic growth in the medium term, driven by pent-up demand, ongoing and significant fiscal and monetary policy support, high savings rates and extensive rebuilding of inventories.
At the asset class level, we believe that while on an absolute basis, equity valuations were high at the end of the Reporting Period, they were attractive in relative terms, and we expected them to remain so in the near term. As for fixed income, we believed low interest rates were likely to persist. In our view, short-term yields will likely remain anchored by central bank monetary policy, which should, in turn, limit a rise in longer-term yields. At the end of the Reporting Period, we anticipated that ongoing policy support from governments and central banks, as well as low financing costs, could keep credit spreads relatively tight. (Credit spreads are yield differentials between corporate bonds and U.S. Treasury securities of comparable maturity.)
4
GOLDMAN SACHS VARIABLE INSURANCE TRUST MULTI-STRATEGY ALTERNATIVES PORTFOLIO
Index Definitions
ICE BofAML U.S. Dollar Three-Month LIBOR Constant Maturity Index is based on the assumed purchase of a synthetic instrument having three months to maturity and with a coupon equal to the closing quote for three-month LIBOR. That issue is sold the following day (priced at a yield equal to the current day closing three-month LIBOR rate) and is rolled into a new three-month instrument. The index, therefore, will always have a constant maturity equal to exactly three months.
MSCI ACWI Investable Market Index captures large, mid and small cap representation across 23 developed markets and 27 emerging markets countries.
MSCI World Index is a broad global equity index that represents large and mid-cap equity performance across 27 developed markets countries. It covers approximately 85% of the free float-adjusted market capitalization in each country.
MSCI Emerging Markets Index captures large-cap and mid-cap representation across 26 emerging markets countries. The index covers approximately 85% of the free float-adjusted market capitalization in each country.
S&P 500® Index is a U.S. stock market index based on the market capitalizations of 500 large companies having common stock listed on the New York Stock Exchange or NASDAQ. The S&P 500® Index components and their weightings are determined by S&P Dow Jones Indices.
It is not possible to invest directly in an unmanaged index.
5
FUND BASICS
Multi-Strategy Alternatives Portfolio
as of December 31, 2020
OVERALL UNDERLYING FUND AND ETF WEIGHTINGS1
Percentage of Net Assets
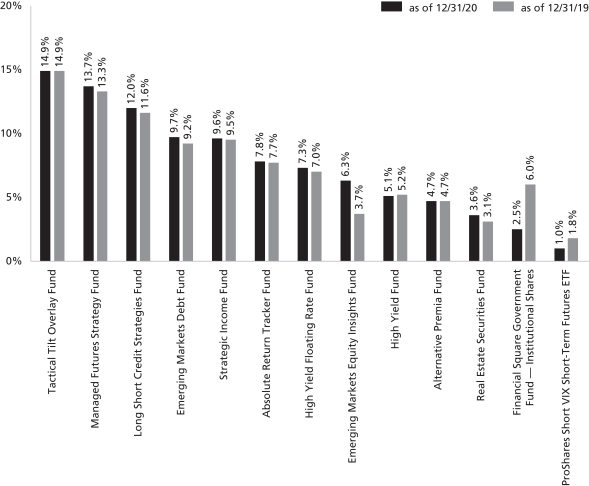
| 1 | The Portfolio is actively managed and, as such, its composition may differ over time. The percentage shown for each Underlying Fund and exchange traded fund (“ETF”) reflects the value of that Underlying Fund or ETF as a percentage of net assets of the Portfolio. Figures in the graph above may not sum to 100% due to rounding and/or exclusion of other assets and liabilities. Underlying sector allocations of exchange traded funds and investment companies held by the Portfolio are not reflected in the graph above. Investments in the securities lending reinvestment vehicle have been excluded from the graph and represented 0.7% of the Portfolio’s net assets at December 31, 2020. The graph depicts the Portfolio’s investments but may not represent the Portfolio’s market exposure due to the exclusion of certain derivatives, if any, as listed in the Additional Investment Information section of the Schedule of Investments. |
For more information about your Fund, please refer to www.GSAMFUNDS.com. There, you can learn more about your Fund’s investment strategies, holdings, and performance.
6
GOLDMAN SACHS VARIABLE INSURANCE TRUST MULTI-STRATEGY ALTERNATIVES PORTFOLIO
Performance Summary
December 31, 2020
The following graph shows the value, as of December 31, 2020, of a $10,000 investment made on April 25, 2014 (commencement of the Portfolio’s operations) in Advisor Shares at NAV. For comparative purposes, the performance of the Portfolio’s benchmark, the ICE BofAML U.S. Dollar Three-Month LIBOR Constant Maturity Index, is shown. Performance reflects applicable fee waivers and/or expense limitations in effect during the periods shown and in their absence, performance would be reduced. Returns do not reflect the deduction of taxes that a shareholder would pay on Portfolio distributions or the redemption of Portfolio shares. The returns set forth below represent past performance. Past performance does not guarantee future results. The Portfolio’s investment return and principal value will fluctuate so that an investor’s shares, when redeemed, may be worth more or less than their original cost. Current performance may be lower or higher than the performance quoted below. Please visit our web site at www.GSAMFUNDS.com to obtain the most recent month-end returns.
Multi-Strategy Alternatives Portfolio’s Lifetime Performance
Performance of a $10,000 investment, with distributions reinvested, from April 25, 2014 through December 31, 2020.
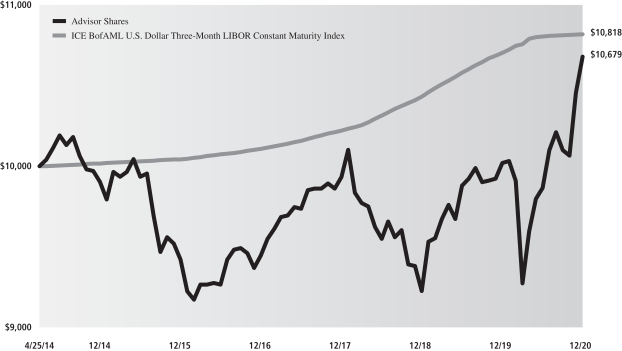
| | | | | | | | |
| Average Annual Total Return through December 31, 2020 | | One Year | | Five Years | | Since Inception | |
Institutional (Commenced April 25, 2014) | | 7.05% | | 2.95% | | | 1.39% | |
Service (Commenced April 25, 2014) | | 6.70% | | 2.69% | | | 1.14% | |
Advisor (Commenced April 25, 2014) | | 6.56% | | 2.54% | | | 0.99% | |
7
GOLDMAN SACHS VARIABLE INSURANCE TRUST MULTI-STRATEGY ALTERNATIVES PORTFOLIO
Schedule of Investments
December 31, 2020
| | | | | | | | |
| Shares | | |
Description | | Value | |
|
| Underlying Funds (Class R6 Shares)(a) – 94.7% | |
| Equity – 32.6% | |
| | 349,394 | | | Goldman Sachs Tactical Tilt Overlay Fund | | $ | 3,375,146 | |
| | 176,522 | | | Goldman Sachs Absolute Return Tracker Fund | | | 1,768,751 | |
| | 123,205 | | | Goldman Sachs Emerging Markets Equity Insights Fund | | | 1,440,267 | |
| | 70,784 | | | Goldman Sachs Real Estate Securities Fund | | | 818,261 | |
| | | | | | | | |
| | | | | | | 7,402,425 | |
| | |
| Fixed Income – 62.1% | | | |
| | 298,192 | | | Goldman Sachs Managed Futures Strategy Fund | | | 3,113,123 | |
| | 305,477 | | | Goldman Sachs Long Short Credit Strategies Fund | | | 2,734,018 | |
| | 170,883 | | | Goldman Sachs Emerging Markets Debt Fund | | | 2,194,144 | |
| | 223,524 | | | Goldman Sachs Strategic Income Fund | | | 2,179,357 | |
| | 178,422 | | | Goldman Sachs High Yield Floating Rate Fund | | | 1,655,754 | |
| | 178,886 | | | Goldman Sachs High Yield Fund | | | 1,160,971 | |
| | 153,516 | | | Goldman Sachs Alternative Premia Fund | | | 1,059,257 | |
| | | | | | | | |
| | | | | | | 14,096,624 | |
| | |
| | TOTAL UNDERLYING FUNDS (CLASS R6 SHARES) | |
| | (Cost $21,353,893) | | $ | 21,499,049 | |
| | |
| | | | | | | | |
|
| Exchange Traded Fund(b) – 1.0% | |
| | 5,295 | | | ProShares Short VIX Short-Term Futures ETF | | $ | 219,425 | |
| | (Cost $251,189) | | | | |
| | |
| Shares | | | Dividend
Rate | | Value | |
|
| Investment Company(a) – 2.5% | |
| Goldman Sachs Financial Square Government Fund —
Institutional Shares |
|
| | 564,202 | | | 0.026% | | $ | 564,202 | |
| | (Cost $564,202) | | | | |
| | |
| TOTAL INVESTMENTS BEFORE SECURITIES LENDING
REINVESTMENT VEHICLE |
|
| | (Cost $22,169,284) | | $ | 22,282,676 | |
| | |
| | | | | | | | |
|
| Securities Lending Reinvestment Vehicle(a) – 0.7% | |
| Goldman Sachs Financial Square Government Fund —
Institutional Shares |
|
| | 153,000 | | | 0.026% | | $ | 153,000 | |
| | (Cost $153,000) | | | | |
| | |
| | TOTAL INVESTMENTS – 98.9% | |
| | (Cost $22,322,284) | | $ | 22,435,676 | |
| | |
| OTHER ASSETS IN EXCESS OF
LIABILITIES – 1.1% | | | 253,985 | |
| | |
| | NET ASSETS – 100.0% | | $ | 22,689,661 | |
| | |
| | |
| The percentage shown for each investment category reflects the value of investments in that category as a percentage of net assets. |
| |
| (a) | | Represents an Affiliated Issuer. |
| |
| (b) | | All or a portion of security is on loan. |
| | |
| |
| Currency Abbreviation: |
| USD | | —United States Dollar |
|
ADDITIONAL INVESTMENT INFORMATION |
FUTURES CONTRACTS — At December 31, 2020, the Portfolio had the following futures contracts:
| | | | | | | | | | | | | | | | |
| Description | | Number of
Contracts | | | Expiration
Date | | | Notional
Amount | | | Unrealized
Appreciation/
(Depreciation) | |
|
Long position contracts: | |
| S&P 500 E-Mini Index | | | 4 | | | | 03/19/2021 | | | $ | 749,760 | | | $ | 18,791 | |
U.S. Treasury 10 Year Note | | | 17 | | | | 03/22/2021 | | | | 2,346,531 | | | | 828 | |
| | | | |
| Total Futures Contracts | | | | | | | | | | | | | | $ | 19,619 | |
| | |
| 8 | | The accompanying notes are an integral part of these financial statements. |
GOLDMAN SACHS VARIABLE INSURANCE TRUST MULTI-STRATEGY ALTERNATIVES PORTFOLIO
ADDITIONAL INVESTMENT INFORMATION (continued)
PURCHASED OPTIONS CONTRACTS — At December 31, 2020, the Portfolio had the following purchased options contracts:
EXCHANGE TRADED INTEREST RATE OPTIONS
| | | | | | | | | | | | | | | | | | | | | | | | | | | | | | |
| Description | | | | | Exercise Price | | | Expiration
Date | | Number of
Contracts | | | Notional
Amount | | | Value | | | Premiums
Paid
(Received)
by the
Portfolio | | | Unrealized
Appreciation/
Depreciation | |
| | | | | | | |
Purchased options contracts: | | | | | | | | | | | | | | | | | | | | | | | | | | | |
| | | | | | | | |
Calls | | | | | | | | | | | | | | | | | | | | | | | | | | | | | | |
| 3 Month Eurodollar | | | | | | | 98.25 USD | | | 03/15/2021 | | | 7 | | | $ | 1,750,000 | | | $ | 27,650 | | | $ | 7,804 | | | $ | 19,846 | |
| | | | | | | 98.25 USD | | | 06/14/2021 | | | 7 | | | | 1,750,000 | | | | 27,738 | | | | 7,891 | | | | 19,847 | |
| | | | | | | | 98.25 USD | | | 09/13/2021 | | | 6 | | | | 1,500,000 | | | | 23,700 | | | | 7,064 | | | | 16,636 | |
| | | | | | |
| Total purchased options contracts | | | | | | 20 | | | | | | | $ | 79,088 | | | $ | 22,759 | | | $ | 56,329 | |
| | |
| The accompanying notes are an integral part of these financial statements. | | 9 |
GOLDMAN SACHS VARIABLE INSURANCE TRUST MULTI-STRATEGY ALTERNATIVES PORTFOLIO
Statement of Assets and Liabilities
December 31, 2020
| | | | |
| | | | |
| Assets: | |
Investments in affiliated Underlying Funds, at value (cost $21,918,095) | | $ | 22,063,251 | |
Investments in unaffiliated Funds, at value (cost $251,189)(a) | | | 219,425 | |
Investments in affiliated securities lending reinvestment vehicle, at value (cost $153,000) | | | 153,000 | |
Purchased Options, at value (premiums paid $22,759) | | | 79,088 | |
Cash | | | 356,545 | |
Receivables: | | | | |
Portfolio shares sold | | | 54,948 | |
Reimbursement from investment adviser | | | 25,290 | |
Dividends | | | 21,950 | |
Securities lending income | | | 29 | |
Variation margin on futures | | | 6,175 | |
Other assets | | | 329 | |
| |
| Total assets | | | 22,980,030 | |
| | | | |
| | | | |
| Liabilities: | | | |
Payables: | | | | |
Payable upon return of securities loaned | | | 153,000 | |
Portfolio shares redeemed | | | 26,181 | |
Investments purchased | | | 23,169 | |
Distribution and Service fees and Transfer Agency fees | | | 7,048 | |
Accrued expenses | | | 80,971 | |
| |
| Total liabilities | | | 290,369 | |
| | | | |
| | | | |
| Net Assets: | | | |
Paid-in capital | | | 22,910,081 | |
Total distributable earnings (loss) | | | (220,420 | ) |
| |
| NET ASSETS | | $ | 22,689,661 | |
Net Assets: | | | | |
Institutional | | $ | 1,519,932 | |
Service | | | 3,472,201 | |
Advisor | | | 17,697,528 | |
| |
Total Net Assets | | $ | 22,689,661 | |
Shares outstanding $0.001 par value (unlimited shares authorized): | | | | |
Institutional | | | 160,723 | |
Service | | | 367,371 | |
Advisor | | | 1,878,309 | |
Net asset value, offering and redemption price per share: | | | | |
Institutional | | | $9.46 | |
Service | | | 9.45 | |
Advisor | | | 9.42 | |
| (a) | Includes loaned securities having a market value of $149,148. |
| | |
| 10 | | The accompanying notes are an integral part of these financial statements. |
GOLDMAN SACHS VARIABLE INSURANCE TRUST MULTI-STRATEGY ALTERNATIVES PORTFOLIO
Statement of Operations
For the Fiscal Year Ended December 31, 2020
| | | | |
| | | | |
| Investment income: | | | |
Dividends from affiliated Underlying Funds | | $ | 610,121 | |
Securities lending income — unaffiliated issuer | | | 772 | |
Interest | | | 268 | |
| |
| Total investment income | | | 611,161 | |
| | | | |
| | | | |
| Expenses: | | | |
Professional fees | | | 87,411 | |
Printing and mailing costs | | | 71,273 | |
Custody, accounting and administrative services | | | 66,520 | |
Service fees — Advisor Shares | | | 41,475 | |
Distribution and Service (12b-1) fees(a) | | | 32,572 | |
Management fees | | | 31,529 | |
Trustee fees | | | 20,494 | |
Transfer Agency fees(a) | | | 4,203 | |
Other | | | 11,844 | |
| |
| Total expenses | | | 367,321 | |
| |
Less — expense reductions | | | (248,923 | ) |
| |
| Net expenses | | | 118,398 | |
| |
| NET INVESTMENT INCOME | | | 492,763 | |
| | | | |
| | | | |
| Realized and unrealized gain (loss): | | | |
Net realized gain (loss) from: | | | | |
Investments in affiliated Underlying Funds | | | (47,408 | ) |
Futures contracts | | | 43,570 | |
Purchased options | | | 391,974 | |
Capital gain distributions from affiliated Underlying Funds | | | 113,269 | |
Net change in unrealized gain (loss) on: | | | | |
Investments in affiliated Underlying Funds | | | 569,546 | |
Investments in unaffiliated Funds | | | (125,968 | ) |
Futures contracts | | | (4,914 | ) |
Purchased options | | | 86,701 | |
Foreign currency translation | | | (4,584 | ) |
| |
| Net realized and unrealized gain | | | 1,022,186 | |
| |
| NET INCREASE IN NET ASSETS RESULTING FROM OPERATIONS | | $ | 1,514,949 | |
| (a) | Class specific Distribution and/or Service, and Transfer Agency fees were as follows: |
| | | | | | | | | | | | | | | | | | |
Distribution and/or
Service (12b-1) Fees | | | Transfer Agency Fees | |
Service | | | Advisor | | | Institutional | | | Service | | | Advisor | |
| $ | 7,687 | | | $ | 24,885 | | | $ | 271 | | | $ | 615 | | | $ | 3,317 | |
| | |
| The accompanying notes are an integral part of these financial statements. | | 11 |
GOLDMAN SACHS VARIABLE INSURANCE TRUST MULTI-STRATEGY ALTERNATIVES PORTFOLIO
Statements of Changes in Net Assets
| | | | | | | | |
| | | For the
Fiscal Year Ended
December 31, 2020 | | | For the
Fiscal Year Ended
December 31, 2019 | |
| | | | | | | | |
| From operations: | | | | | | |
Net investment income | | $ | 492,763 | | | $ | 471,222 | |
Net realized gain | | | 501,405 | | | | 161,997 | |
Net change in unrealized gain | | | 520,781 | | | | 717,645 | |
| | |
| Net increase in net assets resulting from operations | | | 1,514,949 | | | | 1,350,864 | |
| | | | | | | | |
| | | | | | | | |
| Distributions to shareholders: | | | | | | |
From distributable earnings: | | | | | | | | |
Institutional Shares | | | (30,659 | ) | | | (37,340 | ) |
Service Shares | | | (63,162 | ) | | | (77,108 | ) |
Advisor Shares | | | (298,027 | ) | | | (385,701 | ) |
| | |
| Total distributions to shareholders | | | (391,848 | ) | | | (500,149 | ) |
| | | | | | | | |
| | | | | | | | |
| From share transactions: | | | | | | |
Proceeds from sales of shares | | | 7,433,283 | | | | 5,866,621 | |
Reinvestment of distributions | | | 391,848 | | | | 500,149 | |
Cost of shares redeemed | | | (5,834,245 | ) | | | (2,657,936 | ) |
| | |
| Net increase in net assets resulting from share transactions | | | 1,990,886 | | | | 3,708,834 | |
| | |
| TOTAL INCREASE | | | 3,113,987 | | | | 4,559,549 | |
| | | | | | | | |
| | | | | | | | |
| Net Assets: | | | | | | |
| | |
Beginning of year | | | 19,575,674 | | | | 15,016,125 | |
| | |
End of year | | $ | 22,689,661 | | | $ | 19,575,674 | |
| | |
| 12 | | The accompanying notes are an integral part of these financial statements. |
GOLDMAN SACHS VARIABLE INSURANCE TRUST MULTI-STRATEGY ALTERNATIVES PORTFOLIO
Financial Highlights
Selected Data for a Share Outstanding Throughout Each Year
| | | | | | | | | | | | | | | | | | | | |
| | | Goldman Sachs Multi-Strategy Alternatives Portfolio | |
| | | Institutional Shares | |
| | | Year Ended December 31, | |
| | | 2020 | | | 2019 | | | 2018 | | | 2017 | | | 2016 | |
| | | | | | | | | | | | | | | | | | | | |
| Per Share Data | | | | | | | | | | | | | | | |
| | | | | |
Net asset value, beginning of year | | $ | 9.02 | | | $ | 8.51 | | | $ | 9.39 | | | $ | 9.10 | | | $ | 9.15 | |
| | | | | |
Net investment income(a)(b) | | | 0.25 | | | | 0.30 | | | | 0.24 | | | | 0.21 | | | | 0.11 | |
| | | | | |
Net realized and unrealized gain (loss) | | | 0.39 | | | | 0.48 | | | | (0.87 | ) | | | 0.30 | | | | (0.06 | ) |
| | | | | |
Total from investment operations | | | 0.64 | | | | 0.78 | | | | (0.63 | ) | | | 0.51 | | | | 0.05 | |
| | | | | |
Distributions to shareholders from net investment income | | | (0.20 | ) | | | (0.27 | ) | | | (0.25 | ) | | | (0.22 | ) | | | (0.10 | ) |
| | | | | |
Net asset value, end of year | | $ | 9.46 | | | $ | 9.02 | | | $ | 8.51 | | | $ | 9.39 | | | $ | 9.10 | |
| | | | | |
Total return(c) | | | 7.05 | % | | | 9.11 | % | | | (6.74 | )% | | | 5.60 | % | | | 0.52 | % |
| | | | | |
Net assets, end of year (in 000s) | | $ | 1,520 | | | $ | 1,309 | | | $ | 745 | | | $ | 453 | | | $ | 309 | |
| | | | | |
Ratio of net expenses to average net assets(d) | | | 0.21 | % | | | 0.25 | % | | | 0.22 | % | | | 0.21 | % | | | 0.24 | % |
| | | | | |
Ratio of total expenses to average net assets(d) | | | 1.39 | % | | | 1.60 | % | | | 1.57 | % | | | 1.47 | % | | | 2.37 | % |
| | | | | |
Ratio of net investment income to average net assets(b) | | | 2.73 | % | | | 3.30 | % | | | 2.62 | % | | | 2.20 | % | | | 1.17 | % |
| | | | | |
Portfolio turnover rate(e) | | | 5 | % | | | 26 | % | | | 61 | % | | | 53 | % | | | 44 | % |
| (a) | Calculated based on the average shares outstanding methodology. |
| (b) | Recognition of net investment income by the Portfolio is affected by the timing of declaration of dividends by the Underlying Funds in which the Portfolio invests. |
| (c) | Assumes investment at the net asset value at the beginning of the year, reinvestment of all distributions, a complete redemption of the investment at the net asset value at the end of the year and no sales or redemption charges (if any). Total returns would be reduced if a sales or redemption charge was taken into account. Returns do not reflect the impact of taxes to shareholders relating to Portfolio distributions or the redemption of Portfolio shares. |
| (d) | Expense ratios exclude the expenses of the Underlying Funds in which the Portfolio invests. |
| (e) | The portfolio turnover rate is calculated in accordance with regulatory requirements, without regard to transactions involving short term investments and certain derivatives. If such transactions were included, the portfolio turnover rate may be higher. |
| | |
| The accompanying notes are an integral part of these financial statements. | | 13 |
GOLDMAN SACHS VARIABLE INSURANCE TRUST MULTI-STRATEGY ALTERNATIVES PORTFOLIO
Financial Highlights (continued)
Selected Data for a Share Outstanding Throughout Each Year
| | | | | | | | | | | | | | | | | | | | |
| | | Goldman Sachs Multi-Strategy Alternatives Portfolio | |
| | | Service Shares | |
| | | Year Ended December 31, | |
| | | 2020 | | | 2019 | | | 2018 | | | 2017 | | | 2016 | |
| | | | | | | | | | | | | | | | | | | | |
| Per Share Data | | | | | | | | | | | | | | | |
| | | | | |
Net asset value, beginning of year | | $ | 9.02 | | | $ | 8.52 | | | $ | 9.41 | | | $ | 9.13 | | | $ | 9.14 | |
| | | | | |
Net investment income(a)(b) | | | 0.23 | | | | 0.32 | | | | 0.28 | | | | 0.27 | | | | 0.08 | |
| | | | | |
Net realized and unrealized gain (loss) | | | 0.38 | | | | 0.43 | | | | (0.93 | ) | | | 0.22 | | | | (0.05 | ) |
| | | | | |
Total from investment operations | | | 0.61 | | | | 0.75 | | | | (0.65 | ) | | | 0.49 | | | | 0.03 | |
| | | | | |
Distributions to shareholders from net investment income | | | (0.18 | ) | | | (0.25 | ) | | | (0.24 | ) | | | (0.21 | ) | | | (0.04 | ) |
| | | | | |
Net asset value, end of year | | $ | 9.45 | | | $ | 9.02 | | | $ | 8.52 | | | $ | 9.41 | | | $ | 9.13 | |
| | | | | |
Total return(c) | | | 6.70 | % | | | 8.82 | % | | | (6.93 | )% | | | 5.37 | % | | | 0.28 | % |
| | | | | |
Net assets, end of year (in 000s) | | $ | 3,472 | | | $ | 2,857 | | | $ | 811 | | | $ | 105 | | | $ | 34 | |
| | | | | |
Ratio of net expenses to average net assets(d) | | | 0.46 | % | | | 0.51 | % | | | 0.47 | % | | | 0.46 | % | | | 0.46 | % |
| | | | | |
Ratio of total expenses to average net assets(d) | | | 1.65 | % | | | 1.86 | % | | | 1.95 | % | | | 1.73 | % | | | 1.97 | % |
| | | | | |
Ratio of net investment income to average net assets(b) | | | 2.51 | % | | | 3.54 | % | | | 3.08 | % | | | 2.88 | % | | | 0.92 | % |
| | | | | |
Portfolio turnover rate(e) | | | 5 | % | | | 26 | % | | | 61 | % | | | 53 | % | | | 44 | % |
| (a) | Calculated based on the average shares outstanding methodology. |
| (b) | Recognition of net investment income by the Portfolio is affected by the timing of declaration of dividends by the Underlying Funds in which the Portfolio invests. |
| (c) | Assumes investment at the net asset value at the beginning of the year, reinvestment of all distributions, a complete redemption of the investment at the net asset value at the end of the year and no sales or redemption charges (if any). Total returns would be reduced if a sales or redemption charge was taken into account. Returns do not reflect the impact of taxes to shareholders relating to Portfolio distributions or the redemption of Portfolio shares. |
| (d) | Expense ratios exclude the expenses of the Underlying Funds in which the Portfolio invests. |
| (e) | The portfolio turnover rate is calculated in accordance with regulatory requirements, without regard to transactions involving short term investments and certain derivatives. If such transactions were included, the portfolio turnover rate may be higher. |
| | |
| 14 | | The accompanying notes are an integral part of these financial statements. |
GOLDMAN SACHS VARIABLE INSURANCE TRUST MULTI-STRATEGY ALTERNATIVES PORTFOLIO
Financial Highlights (continued)
Selected Data for a Share Outstanding Throughout Each Year
| | | | | | | | | | | | | | | | | | | | |
| | | Goldman Sachs Multi-Strategy Alternatives Portfolio | |
| | | Advisor Shares | |
| | | Year Ended December 31, | |
| | | 2020 | | | 2019 | | | 2018 | | | 2017 | | | 2016 | |
| | | | | | | | | | | | | | | | | | | | |
| Per Share Data | | | | | | | | | | | | | | | |
| | | | | |
Net asset value, beginning of year | | $ | 8.99 | | | $ | 8.49 | | | $ | 9.36 | | | $ | 9.08 | | | $ | 9.12 | |
| | | | | |
Net investment income(a)(b) | | | 0.20 | | | | 0.24 | | | | 0.17 | | | | 0.17 | | | | 0.10 | |
| | | | | |
Net realized and unrealized gain (loss) | | | 0.39 | | | | 0.49 | | | | (0.83 | ) | | | 0.30 | | | | (0.07 | ) |
| | | | | |
Total from investment operations | | | 0.59 | | | | 0.73 | | | | (0.66 | ) | | | 0.47 | | | | 0.03 | |
| | | | | |
Distributions to shareholders from net investment income | | | (0.16 | ) | | | (0.23 | ) | | | (0.21 | ) | | | (0.19 | ) | | | (0.07 | ) |
| | | | | |
Net asset value, end of year | | $ | 9.42 | | | $ | 8.99 | | | $ | 8.49 | | | $ | 9.36 | | | $ | 9.08 | |
| | | | | |
Total return(c) | | | 6.56 | % | | | 8.60 | % | | | (7.09 | )% | | | 5.14 | % | | | 0.27 | % |
| | | | | |
Net assets, end of year (in 000s) | | $ | 17,698 | | | $ | 15,410 | | | $ | 13,460 | | | $ | 15,512 | | | $ | 10,778 | |
| | | | | |
Ratio of net expenses to average net assets(d) | | | 0.61 | % | | | 0.64 | % | | | 0.62 | % | | | 0.61 | % | | | 0.61 | % |
| | | | | |
Ratio of total expenses to average net assets(d) | | | 1.79 | % | | | 2.01 | % | | | 1.93 | % | | | 1.88 | % | | | 2.58 | % |
| | | | | |
Ratio of net investment income to average net assets(b) | | | 2.28 | % | | | 2.61 | % | | | 1.92 | % | | | 1.78 | % | | | 1.06 | % |
| | | | | |
Portfolio turnover rate(e) | | | 5 | % | | | 26 | % | | | 61 | % | | | 53 | % | | | 44 | % |
| (a) | Calculated based on the average shares outstanding methodology. |
| (b) | Recognition of net investment income by the Portfolio is affected by the timing of declaration of dividends by the Underlying Funds in which the Portfolio invests. |
| (c) | Assumes investment at the net asset value at the beginning of the year, reinvestment of all distributions, a complete redemption of the investment at the net asset value at the end of the year and no sales or redemption charges (if any). Total returns would be reduced if a sales or redemption charge was taken into account. Returns do not reflect the impact of taxes to shareholders relating to Portfolio distributions or the redemption of Portfolio shares. |
| (d) | Expense ratios exclude the expenses of the Underlying Funds in which the Portfolio invests. |
| (e) | The portfolio turnover rate is calculated in accordance with regulatory requirements, without regard to transactions involving short term investments and certain derivatives. If such transactions were included, the portfolio turnover rate may be higher. |
| | |
| The accompanying notes are an integral part of these financial statements. | | 15 |
GOLDMAN SACHS VARIABLE INSURANCE TRUST MULTI-STRATEGY ALTERNATIVES PORTFOLIO
Notes to Financial Statements
December 31, 2020
1. ORGANIZATION
Goldman Sachs Variable Insurance Trust (the “Trust” or “VIT”) is a Delaware statutory trust registered under the Investment Company Act of 1940, as amended (the “Act”), as an open-end management investment company. The Trust includes the Goldman Sachs Multi-Strategy Alternatives Portfolio (the “Portfolio”). The Portfolio is a diversified portfolio under the Act offering three classes of shares — Institutional, Service and Advisor Shares. Shares of the Trust are offered to separate accounts of participating life insurance companies for the purpose of funding variable annuity contracts and variable life insurance policies.
Goldman Sachs Asset Management, L.P. (“GSAM”), an affiliate of Goldman Sachs & Co. LLC (“Goldman Sachs”), serves as investment adviser to the Portfolio pursuant to a management agreement (the “Agreement”) with the Trust.
The Portfolio invests primarily in a combination of domestic and international equity and fixed income underlying funds (“Underlying Funds”) which are registered under the Act, for which GSAM acts as investment adviser. Additionally, this Portfolio may invest a portion of its assets directly in other securities and instruments, including unaffiliated exchange traded funds (“Unaffiliated Funds”).
2. SIGNIFICANT ACCOUNTING POLICIES
The financial statements have been prepared in accordance with accounting principles generally accepted in the United States of America (“GAAP”) and require management to make estimates and assumptions that may affect the reported amounts and disclosures. Actual results may differ from those estimates and assumptions. The Portfolio is an investment company under GAAP and follows the accounting and reporting guidance applicable to investment companies.
A. Investment Valuation — The valuation policy of the Portfolio and Underlying Funds is to value investments at fair value.
B. Investment Income and Investments — Investment income includes interest income, dividend income, and securities lending income, if any. Interest income is accrued daily and adjusted for amortization of premiums and accretion of discounts. Dividend income is recognized on ex-dividend date or, for certain foreign securities, as soon as such information is obtained subsequent to the ex-dividend date. Non-cash dividends, if any, are recorded at the fair market value of the securities received. Investment transactions are reflected on trade date. Realized gains and losses are calculated using identified cost. Investment transactions are recorded on the following business day for daily net asset value (“NAV”) calculations. Income distributions are recognized as capital gains or income in the financial statements in accordance with the character that is distributed. Distributions received from the Portfolio’s investments in the Goldman Sachs Real Estate Securities Fund (the “Underlying Fund invested in U.S. real estate investment trusts or REITs”) may be characterized as ordinary income, net capital gain and/or a return of capital. A return of capital is recorded by the Portfolio as a reduction to the cost basis of the Underlying Fund invested in REITs.
For derivative contracts, realized gains and losses are recorded upon settlement of the contract.
C. Class Allocations and Expenses — Investment income, realized and unrealized gain (loss), if any, and non-class specific expenses of the Portfolio are allocated daily based upon the proportion of net assets of each class. Non-class specific expenses directly incurred by the Portfolio are charged to the Portfolio, while such expenses incurred by the Trust are allocated across the applicable Portfolios on a straight-line and/or pro-rata basis depending upon the nature of the expenses. Class specific expenses, where applicable, are borne by the respective share classes and include Distribution and Service and Transfer Agency fees. Expenses included in the accompanying financial statements reflect the expenses of each Portfolio and do not include any expenses associated with the Underlying Funds. Because the Underlying Funds have varied expense and fee levels and the Portfolio may own different proportions of the Underlying Funds at different times, the amount of fees and expenses incurred indirectly by the Portfolio will vary.
D. Federal Taxes and Distributions to Shareholders — It is the Portfolio’s policy to comply with the requirements of the Internal Revenue Code of 1986, as amended (the “Code”), applicable to regulated investment companies and to distribute each year substantially all of its investment company taxable income and capital gains to its shareholders. Accordingly, the Portfolio is not
16
GOLDMAN SACHS VARIABLE INSURANCE TRUST MULTI-STRATEGY ALTERNATIVES PORTFOLIO
2. SIGNIFICANT ACCOUNTING POLICIES (continued)
required to make any provisions for the payment of federal income tax. Distributions to shareholders are recorded on the ex-dividend date. Income and capital gains distributions, if any, are declared and paid at least annually.
Net capital losses, if any, are carried forward to future fiscal years and may be used to the extent allowed by the Code to offset any future capital gains. Losses that are carried forward will retain their character as either short-term or long-term capital losses. Utilization of capital loss carryforwards will reduce the requirement of future capital gains distributions.
The characterization of distributions to shareholders for financial reporting purposes is determined in accordance with federal income tax rules, which may differ from GAAP. The source of the Portfolio’s distributions may be shown in the accompanying financial statements as either from distributable earnings or capital. Certain components of the Portfolio’s net assets on the Statement of Assets and Liabilities reflect permanent GAAP/tax differences based on the appropriate tax character.
3. INVESTMENTS AND FAIR VALUE MEASUREMENTS
U.S. GAAP defines the fair value of a financial instrument as the amount that would be received to sell an asset or paid to transfer a liability in an orderly transaction between market participants at the measurement date (i.e., the exit price); the Portfolio’s policy is to use the market approach. GAAP establishes a fair value hierarchy that prioritizes the inputs to valuation techniques used to measure fair value. The hierarchy gives the highest priority to unadjusted quoted prices in active markets for identical assets or liabilities (Level 1 measurements) and the lowest priority to unobservable inputs (Level 3 measurements). The level in the fair value hierarchy within which the fair value measurement in its entirety falls shall be determined based on the lowest level input that is significant to the fair value measurement in its entirety. The levels used for classifying investments are not necessarily an indication of the risk associated with investing in these investments. The three levels of the fair value hierarchy are described below:
Level 1 — Unadjusted quoted prices in active markets that are accessible at the measurement date for identical, unrestricted assets or liabilities;
Level 2 — Quoted prices in markets that are not active or financial instruments for which significant inputs are observable (including, but not limited to, quoted prices for similar investments, interest rates, foreign exchange rates, volatility and credit spreads), either directly or indirectly;
Level 3 — Prices or valuations that require significant unobservable inputs (including GSAM’s assumptions in determining fair value measurement).
The Board of Trustees (“Trustees”) has approved Valuation Procedures that govern the valuation of the portfolio investments held by the Portfolio, including investments for which market quotations are not readily available. The Trustees have delegated to GSAM day-to-day responsibility for implementing and maintaining internal controls and procedures related to the valuation of the Portfolio’s investments. To assess the continuing appropriateness of pricing sources and methodologies, GSAM regularly performs price verification procedures and issues challenges as necessary to third party pricing vendors or brokers, and any differences are reviewed in accordance with the Valuation Procedures.
A. Level 1 and Level 2 Fair Value Investments — The valuation techniques and significant inputs used in determining the fair values for investments classified as Level 1 and Level 2 are as follows:
Underlying Funds (including Money Market Funds) — Underlying funds include other investment companies and exchange-traded funds (“ETFs”). Investments in the Underlying Funds (except ETFs) are valued at the NAV per share on the day of valuation. ETFs are valued daily at the last sale price or official closing price on the principal exchange or system on which the investment is traded. Because the Portfolio invests primarily in other mutual funds that fluctuate in value, the Portfolio’s shares will correspondingly fluctuate in value. These investments are generally classified as Level 1 of the fair value hierarchy. For information regarding an Underlying Fund’s accounting policies and investment holdings, please see the Underlying Fund’s shareholder report.
17
GOLDMAN SACHS VARIABLE INSURANCE TRUST MULTI-STRATEGY ALTERNATIVES PORTFOLIO
Notes to Financial Statements (continued)
December 31, 2020
3. INVESTMENTS AND FAIR VALUE MEASUREMENTS (continued)
Derivative Contracts — A derivative is an instrument whose value is derived from underlying assets, indices, reference rates or a combination of these factors. The Portfolio enters into derivative transactions to hedge against changes in interest rates, securities prices, and/or currency exchange rates, to increase total return, or to gain access to certain markets or attain exposure to other underliers. For financial reporting purposes, cash collateral that has been pledged to cover obligations of the Portfolio and cash collateral received, if any, is reported separately on the Statement of Assets and Liabilities as receivables/payables for collateral on certain derivatives contracts. Non-cash collateral pledged by the Portfolio, if any, is noted in the Schedule of Investments.
Exchange-traded derivatives, including futures and options contracts, are generally valued at the last sale or settlement price on the exchange where they are principally traded. Exchange-traded options without settlement prices are generally valued at the midpoint of the bid and ask prices on the exchange where they are principally traded (or, in the absence of two-way trading, at the last bid price for long positions and the last ask price for short positions). Exchange-traded derivatives typically fall within Level 1 of the fair value hierarchy. Over-the-counter (“OTC”) and centrally cleared derivatives are valued using market transactions and other market evidence, including market-based inputs to models, calibration to market-clearing transactions, broker or dealer quotations, or other alternative pricing sources. Where models are used, the selection of a particular model to value OTC and centrally cleared derivatives depends upon the contractual terms of, and specific risks inherent in, the instrument, as well as the availability of pricing information in the market. Valuation models require a variety of inputs, including contractual terms, market prices, yield curves, credit curves, measures of volatility, voluntary and involuntary prepayment rates, loss severity rates and correlations of such inputs. For OTC and centrally cleared derivatives that trade in liquid markets, model inputs can generally be verified and model selection does not involve significant management judgment. OTC and centrally cleared derivatives are classified within Level 2 of the fair value hierarchy when significant inputs are corroborated by market evidence.
i. Futures Contracts — Futures contracts are contracts to buy or sell a standardized quantity of a specified commodity or security. Upon entering into a futures contract, the Portfolio deposits cash or securities in an account on behalf of the broker in an amount sufficient to meet the initial margin requirement. Subsequent payments are made or received by the Portfolio equal to the daily change in the contract value and are recorded as variation margin receivable or payable with a corresponding offset to unrealized gains or losses.
ii. Options — When the Portfolio writes call or put options, an amount equal to the premium received is recorded as a liability and is subsequently marked-to-market to reflect the current value of the option written. Swaptions are options on swap contracts.
Upon the purchase of a call option or a put option by the Portfolio, the premium paid is recorded as an investment and subsequently marked-to-market to reflect the current value of the option. Certain options may be purchased with premiums to be determined on a future date. The premiums for these options are based upon implied volatility parameters at specified terms.
B. Level 3 Fair Value Investments — To the extent that significant inputs to valuation models and other alternative pricing sources are unobservable, or if quotations are not readily available, or if GSAM believes that such quotations do not accurately reflect fair value, the fair value of the Portfolio’s investments may be determined under Valuation Procedures approved by the Trustees. GSAM, consistent with its procedures and applicable regulatory guidance, may make an adjustment to the most recent valuation prices of either domestic or foreign securities in light of significant events to reflect what it believes to be the fair value of the securities at the time of determining the Portfolio’s NAV. To the extent investments are valued using single source broker quotations obtained directly from the broker or passed through from third party pricing vendors, such investments are classified as Level 3 investments.
18
GOLDMAN SACHS VARIABLE INSURANCE TRUST MULTI-STRATEGY ALTERNATIVES PORTFOLIO
3. INVESTMENTS AND FAIR VALUE MEASUREMENTS (continued)
C. Fair Value Hierarchy — The following is a summary of the Portfolio’s investments and derivatives classified in the fair value hierarchy as of December 31, 2020:
| | | | | | | | | | | | |
| Investment Type | | Level 1 | | | Level 2 | | | Level 3 | |
| | | |
| Assets | | | | | | | | | | | | |
| Equity Underlying Funds | | $ | 7,402,425 | | | $ | — | | | $ | — | |
| Fixed Income Underlying Funds | | | 14,096,624 | | | | — | | | | — | |
| Exchange Traded Fund | | | 219,425 | | | | — | | | | — | |
| Investment Company | | | 564,202 | | | | — | | | | — | |
| Securities Lending Reinvestment Vehicle | | | 153,000 | | | | — | | | | — | |
| | | |
| Total | | $ | 22,435,676 | | | $ | — | | | $ | — | |
| | | |
| Derivative Type | | | | | | | | | |
| | | |
| Assets | | | | | | | | | | | | |
| Futures Contracts(a) | | $ | 19,619 | | | $ | — | | | $ | — | |
| Purchased Options Contracts | | | 79,088 | | | | — | | | | — | |
| | | |
| Total | | $ | 98,707 | | | $ | — | | | $ | — | |
| (a) | Amount shown represents unrealized gain (loss) at fiscal year end. |
For further information regarding security characteristics, see the Schedule of Investments.
4. INVESTMENTS IN DERIVATIVES
The following table sets forth, by certain risk types, the gross value of derivative contracts (not considered to be hedging instruments for accounting disclosure purposes) as of December 31, 2020. These instruments were used as part of the Portfolio’s investment strategies and to obtain and/or manage exposure related to the risks below. The values in the table below exclude the effects of cash collateral received or posted pursuant to these derivative contracts, and therefore are not representative of the Portfolio’s net exposure.
| | | | | | | | | | | | | | |
| Risk | | | | Statement of Assets and Liabilities | | Assets(a) | | | Statement of Assets and Liabilities | | Liabilities | |
| Equity | | | | Variation margin on futures contracts | | $ | 18,791 | | | — | | $ | — | |
| Interest Rate | | | | Purchased options contracts, at value and variation margin on futures contracts | | | 79,916 | | | — | | | — | |
| | | | | |
| Total | | | | | | $ | 98,707 | | | | | $ | — | |
| (a) | Includes unrealized gain (loss) on futures contracts described in the Additional Investment Information section of the Schedule of Investments. Only the variation margin as of December 31, 2020 is reported within the Statement of Assets and Liabilities. |
19
GOLDMAN SACHS VARIABLE INSURANCE TRUST MULTI-STRATEGY ALTERNATIVES PORTFOLIO
Notes to Financial Statements (continued)
December 31, 2020
4. INVESTMENTS IN DERIVATIVES (continued)
The following table sets forth, by certain risk types, the Portfolio’s gains (losses) related to these derivatives and their indicative volumes for the fiscal year ended December 31, 2020. These gains (losses) should be considered in the context that these derivative contracts may have been executed to create investment opportunities and/or economically hedge certain investments, and accordingly, certain gains (losses) on such derivative contracts may offset certain (losses) gains attributable to investments. These gains (losses) are included in “Net realized gain (loss)” or “Net change in unrealized gain (loss)” on the Statement of Operations.
| | | | | | | | | | | | | | |
| Risk | | Statement of Operations | | Net
Realized
Gain (Loss) | | | Net Change in
Unrealized
Gain (Loss) | | | Average
Number of
Contracts(a) | |
| Equity | | Net realized gain (loss) from futures contracts/Net change in unrealized gain (loss) on futures contracts | | $ | 32,859 | | | $ | (5,742 | ) | | | 6 | |
| Interest Rate | | Net realized gain (loss) from futures contracts and purchased options/Net change in unrealized gain (loss) on futures contracts and purchased options | | | 402,685 | | | | 87,529 | | | | 68 | |
| | | | |
| Total | | | | $ | 435,544 | | | $ | 81,787 | | | | 74 | |
| (a) | Average number of contracts is based on the average of month end balances for the fiscal year ended December 31, 2020. |
5. AGREEMENTS AND AFFILIATED TRANSACTIONS
A. Management Agreement — Under the Agreement, GSAM manages the Portfolio, subject to the general supervision of the Trustees.
As compensation for the services rendered pursuant to the Agreement, the assumption of the expenses related thereto and administration of the Portfolio’s business affairs, including providing facilities, GSAM is entitled to a management fee, accrued daily and paid monthly, equal to an annual percentage rate of 0.15% of the Portfolio’s average daily net assets. GSAM has agreed to waive all of its management fee. The management fee waiver will remain in effect through at least April 29, 2021, and prior to such date, GSAM may not terminate the arrangement without the approval of the Board of Trustees. For the fiscal year ended December 31, 2020, GSAM waived $31,529 of its management fee.
The Portfolio invests in Institutional Shares of the Goldman Sachs Financial Square Government Fund, which is an affiliated Underlying Fund. GSAM has agreed to waive a portion of its management fee payable by the Portfolio in an amount equal to the management fee it earns as an investment adviser to the affiliated Underlying Fund in which the Portfolio invests, except those management fees it earns from the Portfolio’s investments of cash collateral received in connection with securities lending transactions in the Goldman Sachs Financial Square Government Fund. For the fiscal year ended December 31, 2020, GSAM waived $2,093 of the Portfolio’s management fee.
B. Distribution and/or Service (12b-1) Plans — The Trust, on behalf of Service Shares of the Portfolio, has adopted a Distribution and Service Plan subject to Rule 12b-1 under the Act. Under the Distribution and Service Plan, Goldman Sachs, which serves as distributor (the “Distributor”), is entitled to a fee accrued daily and paid monthly, for distribution services and personal and account maintenance services, which may then be paid by Goldman Sachs to authorized dealers, equal to, on an annual basis, 0.25% of the Portfolio’s average daily net assets attributable to Service Shares.
The Trust, on behalf of Advisor Shares of the Portfolio, has adopted a Distribution Plan subject to Rule 12b-1 under the Act. Under the Distribution Plan, Goldman Sachs as Distributor is entitled to a fee accrued daily and paid monthly for distribution services, which may then be paid by Goldman Sachs to authorized dealers, equal to, on an annual basis, 0.15% of the Portfolio’s average daily net assets attributable to Advisor Shares.
C. Service Plans — The Trust, on behalf of Advisor Shares of the Portfolio, has adopted a Service Plan to allow Advisor Shares to compensate service organizations (including Goldman Sachs) for providing varying levels of personal and account maintenance and administration services to their customers who are beneficial owners of such shares. The Service Plans each provide for
20
GOLDMAN SACHS VARIABLE INSURANCE TRUST MULTI-STRATEGY ALTERNATIVES PORTFOLIO
5. AGREEMENTS AND AFFILIATED TRANSACTIONS (continued)
compensation to the service organizations equal to 0.25% of the average daily net assets attributable to Advisor Shares of the Portfolio.
D. Transfer Agency Agreement — Goldman Sachs also serves as the transfer agent of the Portfolio for a fee pursuant to the Transfer Agency Agreement. The fees charged for such transfer agency services are accrued daily and paid monthly at an annual rate of 0.02% of the average daily net assets of Institutional, Service and Advisor Shares.
E. Other Expense Agreements and Affiliated Transactions — GSAM has agreed to reduce or limit certain “Other Expenses” of the Portfolio (excluding acquired fund fees and expenses, transfer agency fees and expenses, service fees and shareholder administration fees (as applicable), taxes, interest, brokerage fees, expenses of shareholder meetings, litigation and indemnification, and extraordinary expenses) to the extent such expenses exceed, on an annual basis, a percentage rate of the average daily net assets of the Portfolio. Such Other Expense reimbursements, if any, are accrued daily and paid monthly. In addition, the Portfolio is not obligated to reimburse GSAM for prior fiscal year expense reimbursements, if any. The Other Expense limitation as an annual percentage rate of average daily net assets for the Portfolio is 0.204%. The Other Expense limitation will remain in place through at least April 29, 2021, and prior to such date GSAM may not terminate the arrangement without the approval of the Trustees. In addition, the Portfolio has entered into certain offset arrangements with the custodian and the transfer agent, which may result in a reduction of the Portfolio’s expenses and are received irrespective of the application of the “Other Expense” limitation described above.
For the fiscal year ended December 31, 2020, these expense reductions, including any fee waivers and Other Expense reimbursements, were as follows:
| | | | | | | | | | | | | | |
Management Fee
Waiver | | | Custody Fee
Credits | | | Other Expense
Reimbursement | | | Total
Expense
Reductions | |
| | | |
| $ | 33,622 | | | $ | 644 | | | $ | 214,657 | | | $ | 248,923 | |
F. Line of Credit Facility — As of December 31, 2020, the Portfolio participated in a $700,000,000 committed, unsecured revolving line of credit facility (the “facility”) together with other funds of the Trust and certain registered investment companies having management agreements with GSAM or its affiliates. This facility is to be used for temporary emergency purposes, or to allow for an orderly liquidation of securities to meet redemption requests. The interest rate on borrowings is based on the federal funds rate. The facility also requires a fee to be paid by the Portfolio based on the amount of the commitment that has not been utilized. For the fiscal year ended December 31, 2020, the Portfolio did not have any borrowings under the facility. Prior to April 28, 2020, the facility was $580,000,000.
21
GOLDMAN SACHS VARIABLE INSURANCE TRUST MULTI-STRATEGY ALTERNATIVES PORTFOLIO
Notes to Financial Statements (continued)
December 31, 2020
5. AGREEMENTS AND AFFILIATED TRANSACTIONS (continued)
G. Other Transactions with Affiliates — The Portfolio invests primarily in Class R6 Shares of the Underlying Funds. These Underlying Funds are considered to be affiliated with the Portfolios. The tables below show the transactions in and earnings from investments in these Underlying Funds for the fiscal year ended December 31, 2020:
| | | | | | | | | | | | | | | | | | | | | | | | | | | | | | | | | | | | |
| Underlying Funds | | Beginning
Value as of
December 31,
2019 | | | Purchases at
Cost | | | Proceeds
from Sales | | | Net Realized
Gain (Loss)
from Affiliated
Investment
Company | | | Change in
Unrealized
Appreciation
(Depreciation) | | | Ending Value
as of
December 31,
2020 | | | Shares as of
December 31,
2020 | | | Dividend
Income
from
Affiliated
Investment
Company | | | Capital Gain
Distributions
from
Affiliated
Investment
Company | |
Goldman Sachs Absolute Return Tracker Fund | | $ | 1,499,908 | | | $ | 341,474 | | | $ | (150,000 | ) | | $ | 2,501 | | | $ | 74,868 | | | $ | 1,768,751 | | | | 176,522 | | | $ | 1,763 | | | $ | 9,709 | |
Goldman Sachs Alternative Premia Fund | | | 920,921 | | | | 297,071 | | | | — | | | | — | | | | (158,735 | ) | | | 1,059,257 | | | | 153,516 | | | | 77,071 | | | | — | |
Goldman Sachs Emerging Markets Debt Fund | | | 1,795,804 | | | | 315,263 | | | | — | | | | — | | | | 83,077 | | | | 2,194,144 | | | | 170,883 | | | | 57,537 | | | | — | |
Goldman Sachs Emerging Markets Equity Insights Fund | | | 724,055 | | | | 686,366 | | | | (180,000 | ) | | | (40,874 | ) | | | 250,720 | | | | 1,440,267 | | | | 123,205 | | | | 16,366 | | | | — | |
Goldman Sachs Financial Square Government Fund (Institutional Shares) | | | 1,173,715 | | | | 7,428,878 | | | | (8,038,391 | ) | | | — | | | | — | | | | 564,202 | | | | 564,202 | | | | 5,298 | | | | — | |
Goldman Sachs High Yield Floating Rate Fund | | | 1,362,346 | | | | 303,618 | | | | — | | | | — | | | | (10,210 | ) | | | 1,655,754 | | | | 178,422 | | | | 63,642 | | | | — | |
Goldman Sachs High Yield Fund | | | 1,025,629 | | | | 241,913 | | | | (120,000 | ) | | | (1,966 | ) | | | 15,395 | | | | 1,160,971 | | | | 178,886 | | | | 61,315 | | | | — | |
Goldman Sachs Long Short Credit Strategies Fund | | | 2,278,946 | | | | 376,214 | | | | — | | | | — | | | | 78,858 | | | | 2,734,018 | | | | 305,477 | | | | 91,438 | | | | — | |
Goldman Sachs Managed Futures Strategy Fund | | | 2,604,631 | | | | 483,699 | | | | (149,999 | ) | | | (7,069 | ) | | | 181,861 | | | | 3,113,123 | | | | 298,192 | | | | — | | | | 38,698 | |
Goldman Sachs Real Estate Securities Fund | | | 610,642 | | | | 298,550 | | | | — | | | | — | | | | (90,931 | ) | | | 818,261 | | | | 70,784 | | | | 8,689 | | | | 64,862 | |
Goldman Sachs Strategic Income Fund | | | 1,863,593 | | | | 206,285 | | | | — | | | | — | | | | 109,479 | | | | 2,179,357 | | | | 223,524 | | | | 65,226 | | | | — | |
Goldman Sachs Tactical Tilt Overlay Fund | | | 2,925,679 | | | | 448,776 | | | | — | | | | — | | | | 691 | | | | 3,375,146 | | | | 349,394 | | | | 161,776 | | | | — | |
| | | | | | | | | |
| Total | | $ | 18,785,869 | | | $ | 11,428,107 | | | $ | (8,638,390 | ) | | $ | (47,408 | ) | | $ | 535,073 | | | $ | 22,063,251 | | | | | | | $ | 610,121 | | | $ | 113,269 | |
22
GOLDMAN SACHS VARIABLE INSURANCE TRUST MULTI-STRATEGY ALTERNATIVES PORTFOLIO
6. PORTFOLIO SECURITIES TRANSACTIONS
The cost of purchases and proceeds from sales and maturities of long-term securities for the fiscal year ended December 31, 2020, were $3,999,224 and $938,072, respectively.
7. SECURITIES LENDING
The Portfolio may lend its securities through a securities lending agent, the Bank of New York Mellon (“BNYM”), to certain qualified borrowers. In accordance with the Portfolio’s securities lending procedures, the Portfolio receives cash collateral at least equal to the market value of the securities on loan. The market value of the loaned securities is determined at the close of business of the Portfolio, at their last sale price or official closing price on the principal exchange or system on which they are traded, and any additional required collateral is delivered to the Portfolio on the next business day. As with other extensions of credit, the Portfolio may experience delay in the recovery of its securities or incur a loss should the borrower of the securities breach its agreement with the Portfolio or become insolvent at a time when the collateral is insufficient to cover the cost of repurchasing securities on loan. Dividend income received from securities on loan may not be subject to withholding taxes and therefore withholding taxes paid may differ from the amounts listed in the Statement of Operations. Loans of securities are terminable at any time and as such 1) the remaining contractual maturities of the outstanding securities lending transactions are considered to be overnight and continuous and 2) the borrower, after notice, is required to return borrowed securities within the standard time period for settlement of securities transactions.
The Portfolio invests the cash collateral received in connection with securities lending transactions in the Goldman Sachs Financial Square Government Fund (“Government Money Market Fund”), an affiliated series of the Goldman Sachs Trust. The Government Money Market Fund is registered under the Act as an open end investment company, is subject to Rule 2a-7 under the Act, and is managed by GSAM, for which GSAM may receive a management fee of up to 0.16% on an annualized basis of the average daily net assets of the Government Money Market Fund.
In the event of a default by a borrower with respect to any loan, BNYM may exercise any and all remedies provided under the applicable borrower agreement to make the Portfolio whole. These remedies include purchasing replacement securities by applying the collateral held from the defaulting broker against the purchase cost of the replacement securities. If BNYM is unable to purchase replacement securities, BNYM will indemnify the Portfolio by paying the Portfolio an amount equal to the market value of the securities loaned minus the value of cash collateral received from the borrower for the loan, subject to an exclusion for any shortfalls resulting from a loss of value in such cash collateral due to reinvestment risk. The Portfolio’s master netting agreements with certain borrowers provide the right, in the event of a default (including bankruptcy or insolvency), for the non-defaulting party to liquidate the collateral and calculate net exposure to the defaulting party or request additional collateral. However, in the event of a default by a borrower, a resolution authority could determine that such rights are not enforceable due to the restrictions or prohibitions against the right of set-off that may be imposed in accordance with a particular jurisdiction’s bankruptcy or insolvency laws. The Portfolio’s loaned securities were all subject to enforceable Securities Lending Agreements and the value of the collateral was at least equal to the value of the cash received. The amounts of the Portfolio’s overnight and continuous agreements, which represent the gross amounts of recognized liabilities for securities lending transactions outstanding as of December 31, 2020, are disclosed as “Payable upon return of securities loaned” on the Statement of Assets and Liabilities, where applicable.
Both the Portfolio and BNYM received compensation relating to the lending of the Portfolio’s securities. The amounts earned, if any, by the Portfolio for the fiscal year ended December 31, 2020, are reported under Investment Income on the Statement of Operations.
The following table provides information about the Portfolio’s investment in the Government Money Market Fund for the fiscal year ended December 31, 2020:
| | | | | | | | | | | | | | |
Beginning
Value as of
December 31, 2019 | | | Purchases at
Cost | | | Proceeds
from Sales | | | Ending
Value as of
December 31, 2020 | |
| | | |
| $ | 300,150 | | | $ | 1,133,694 | | | $ | (1,280,844 | ) | | $ | 153,000 | |
23
GOLDMAN SACHS VARIABLE INSURANCE TRUST MULTI-STRATEGY ALTERNATIVES PORTFOLIO
Notes to Financial Statements (continued)
December 31, 2020
8. TAX INFORMATION
The tax character of distributions paid during the fiscal years ended December 31, 2019 and December 31, 2020 was as follows:
| | | | | | | | |
| | |
| | | 2019 | | | 2020 | |
| Distributions paid from ordinary income: | | $ | 500,149 | | | $ | 391,848 | |
As of December 31, 2020, the components of accumulated earnings (losses) on a tax-basis were as follows:
| | | | |
| Undistributed ordinary income — net | | $ | 178,850 | |
| Capital loss carryforwards(1): | | | | |
Perpetual Short-term | | $ | (247,553 | ) |
| Timing differences (Late year ordinary loss deferral) | | $ | (1 | ) |
| Unrealized losses — net | | | (151,716 | ) |
| Total accumulated losses — net | | $ | (220,420 | ) |
| (1) | The Portfolio utilized $575,966 of capital losses in the current year. |
As of December 31, 2020, the Portfolio’s aggregate security unrealized gains and losses based on cost for U.S. federal income tax purposes were as follows:
| | | | |
| Tax cost | | $ | 22,681,991 | |
| Gross unrealized gain | | | 717,995 | |
| Gross unrealized loss | | | (869,711 | ) |
| Net unrealized loss | | $ | (151,716 | ) |
The difference between GAAP-basis and tax-basis unrealized gains (losses) is attributable primarily to wash sales, net mark to market gains (losses) on regulated futures and options contracts and differences in the tax treatment of partnership investments.
GSAM has reviewed the Portfolio’s tax positions for all open tax years (the current and prior three years, as applicable) and has concluded that no provision for income tax is required in the Portfolio’s financial statements. Such open tax years remain subject to examination and adjustment by tax authorities.
9. OTHER RISKS
The Portfolio’s and Underlying Funds’ risks include, but are not limited to, the following:
Derivatives Risk — The Portfolio’s and Underlying Funds’ use of derivatives may result in loss. Derivative instruments, which may pose risks in addition to and greater than those associated with investing directly in securities, currencies or other instruments, may be illiquid or less liquid, volatile, difficult to price and leveraged so that small changes in the value of the underlying instruments may produce disproportionate losses to the Portfolio. Derivatives are also subject to counterparty risk, which is the risk that the other party in the transaction will not fulfill its contractual obligation. The use of derivatives is a highly specialized activity that involves investment techniques and risks different from those associated with investments in more traditional securities and instruments. Losses from derivatives can also result from a lack of correlation between changes in the value of derivative instruments and the portfolio assets (if any) being hedged.
24
GOLDMAN SACHS VARIABLE INSURANCE TRUST MULTI-STRATEGY ALTERNATIVES PORTFOLIO
9. OTHER RISKS (continued)
Interest Rate Risk — When interest rates increase, fixed income securities or instruments held by the Portfolio will generally decline in value. Long-term fixed income securities or instruments will normally have more price volatility because of this risk than short-term fixed income securities or instruments. The risks associated with changing interest rates may have unpredictable effects on the markets and the Portfolio’s investments. Fluctuations in interest rates may also affect the liquidity of fixed income securities and instruments held by the Portfolio.
Investments in the Underlying Funds — The investments of the Portfolio are concentrated in the Underlying Funds, and the Portfolio’s investment performance is directly related to the investment performance of the Underlying Funds it holds. The Portfolio is subject to the risk factors associated with the investments of the Underlying Funds in direct proportion to the amount of assets allocated to each. To the extent that the Portfolio has a relative concentration of its portfolio in a single Underlying Fund, the Portfolio may be more susceptible to adverse developments affecting that Underlying Fund, and may be more susceptible to losses because of these developments.
Investments in Other Investment Companies Risk — As a shareholder of another investment company, including an ETF, the Portfolio will indirectly bear its proportionate share of any net management fees and other expenses paid by such other investment companies, in addition to the fees and expenses regularly borne by the Portfolio. ETFs are subject to risks that do not apply to conventional mutual funds, including but not limited to the following: (i) the market price of the ETF’s shares may trade at a premium or a discount to their NAV; and (ii) an active trading market for an ETF’s shares may not develop or be maintained.
Large Shareholder Transactions Risk — The Portfolio or an Underlying Fund may experience adverse effects when certain large shareholders, such as other funds, participating insurance companies, accounts and Goldman Sachs affiliates, purchase or redeem large amounts of shares of the Portfolio or an Underlying Fund. Such large shareholder redemptions, which may occur rapidly or unexpectedly, may cause the Portfolio or an Underlying Fund to sell portfolio securities at times when it would not otherwise do so, which may negatively impact the Portfolio’s or an Underlying Fund’s NAV and liquidity. These transactions may also accelerate the realization of taxable income to shareholders if such sales of investments resulted in gains, and may also increase transaction costs. In addition, a large redemption could result in the Portfolio’s or an Underlying Fund’s current expenses being allocated over a smaller asset base, leading to an increase in the Portfolio’s or an Underlying Fund’s expense ratio. Similarly, large Portfolio or Underlying Fund share purchases may adversely affect the Portfolio’s or an Underlying Fund’s performance to the extent that the Portfolio or an Underlying Fund is delayed in investing new cash or otherwise maintains a larger cash position than it ordinarily would.
Liquidity Risk — The Portfolio or an Underlying Fund may make investments that are illiquid or that may become less liquid in response to market developments or adverse investor perceptions. Illiquid investments may be more difficult to value. Liquidity risk may also refer to the risk that the Portfolio or an Underlying Fund will not be able to pay redemption proceeds within the allowable time period or without significant dilution to remaining investors’ interests because of unusual market conditions, an unusually high volume of redemption requests, or other reasons. To meet redemption requests, the Portfolio or an Underlying Fund may be forced to sell investments at an unfavorable time and/or under unfavorable conditions. If the Portfolio or an Underlying Fund is forced to sell securities at an unfavorable time and/or under unfavorable conditions, such sales may adversely affect the Portfolio’s or Underlying Fund’s NAV and dilute remaining investors’ interests. Liquidity risk may be the result of, among other things, the reduced number and capacity of traditional market participants to make a market in fixed income securities or the lack of an active market. The potential for liquidity risk may be magnified by a rising interest rate environment or other circumstances where investor redemptions from fixed income mutual funds may be higher than normal, potentially causing increased supply in the market due to selling activity. These risks may be more pronounced in connection with the Portfolio’s investments in securities of issuers located in emerging market countries. Redemptions by large shareholders may have a negative impact on the Portfolio’s or Underlying Fund’s liquidity.
Market and Credit Risks — In the normal course of business, the Portfolio and an Underlying Fund trade financial instruments and enter into financial transactions where risk of potential loss exists due to changes in the market (market risk). The value of the
25
GOLDMAN SACHS VARIABLE INSURANCE TRUST MULTI-STRATEGY ALTERNATIVES PORTFOLIO
Notes to Financial Statements (continued)
December 31, 2020
9. OTHER RISKS (continued)
securities in which the Portfolio and/or an Underlying Fund invests may go up or down in response to the prospects of individual companies, particular sectors or governments and/or general economic conditions throughout the world due to increasingly interconnected global economies and financial markets. Events such as war, acts of terrorism, social unrest, natural disasters, the spread of infectious illness or other public health threats could also significantly impact the Portfolio and/or an Underlying Fund and their investments. Additionally, the Portfolio and/or an Underlying Fund may also be exposed to credit risk in the event that an issuer or guarantor fails to perform or that an institution or entity with which the Portfolio and the Underlying Fund have unsettled or open transactions defaults.
10. INDEMNIFICATIONS
Under the Trust’s organizational documents, its Trustees, officers, employees and agents are indemnified, to the extent permitted by the Act and state law, against certain liabilities that may arise out of performance of their duties to the Portfolio. Additionally, in the course of business, the Portfolio enters into contracts that contain a variety of indemnification clauses. The Portfolio’s maximum exposure under these arrangements is unknown, as this would involve future claims that may be made against the Portfolio that have not yet occurred. However, GSAM believes the risk of loss under these arrangements to be remote.
11. OTHER MATTERS
On October 22, 2020, Goldman Sachs announced a settlement of matters involving 1Malaysia Development Bhd. (1MDB), a Malaysian sovereign wealth fund, with the United States Department of Justice as well as criminal and civil authorities in the UK, Singapore and Hong Kong. Further information regarding the 1MDB settlement can be found at https://www.goldmansachs.com/media-relations/press-releases/current/goldman-sachs-2020-10-22.html. The 1MDB settlement will not materially adversely affect GSAM’s ability to serve as investment manager.
12. SUBSEQUENT EVENTS
Subsequent events after the Statement of Assets and Liabilities date have been evaluated, and GSAM has concluded that there is no impact requiring adjustment or disclosure in the financial statements.
26
GOLDMAN SACHS VARIABLE INSURANCE TRUST MULTI-STRATEGY ALTERNATIVES PORTFOLIO
13. SUMMARY OF SHARE TRANSACTIONS
Share activity is as follows:
| | | | | | | | | | | | | | | | |
| | | For the Fiscal Year Ended
December 31, 2020 | | | For the Fiscal Year Ended
December 31, 2019 | |
| | | Shares | | | Dollars | | | Shares | | | Dollars | |
| Institutional Shares | | | | | | | | | | | | | | | | |
| Shares sold | | | 44,537 | | | $ | 398,878 | | | | 62,887 | | | $ | 570,355 | |
| Reinvestment of distributions | | | 3,244 | | | | 30,659 | | | | 4,140 | | | | 37,340 | |
| Shares redeemed | | | (32,120 | ) | | | (288,931 | ) | | | (9,524 | ) | | | (86,531 | ) |
| | | | 15,661 | | | | 140,606 | | | | 57,503 | | | | 521,164 | |
| Service Shares | | | | | | | | | | | | | | | | |
| Shares sold | | | 123,578 | | | | 1,094,287 | | | | 238,728 | | | | 2,174,547 | |
| Reinvestment of distributions | | | 6,691 | | | | 63,162 | | | | 8,549 | | | | 77,108 | |
| Shares redeemed | | | (79,590 | ) | | | (709,770 | ) | | | (25,812 | ) | | | (233,897 | ) |
| | | | 50,679 | | | | 447,679 | | | | 221,465 | | | | 2,017,758 | |
| Advisor Shares | | | | | | | | | | | | | | | | |
| Shares sold | | | 670,463 | | | | 5,940,118 | | | | 347,196 | | | | 3,121,719 | |
| Reinvestment of distributions | | | 31,672 | | | | 298,027 | | | | 42,903 | | | | 385,701 | |
| Shares redeemed | | | (537,655 | ) | | | (4,835,544 | ) | | | (262,490 | ) | | | (2,337,508 | ) |
| | | | 164,480 | | | | 1,402,601 | | | | 127,609 | | | | 1,169,912 | |
| | | | |
| NET INCREASE | | | 230,820 | | | $ | 1,990,886 | | | | 406,577 | | | $ | 3,708,834 | |
27
Report of Independent Registered Public Accounting Firm
To the Board of Trustees of
Goldman Sachs Variable Insurance Trust and Shareholders of Goldman Sachs Multi-Strategy Alternatives Portfolio
Opinion on the Financial Statements
We have audited the accompanying statement of assets and liabilities, including the schedule of investments, of Goldman Sachs Multi-Strategy Alternatives Portfolio (one of the portfolios constituting Goldman Sachs Variable Insurance Trust, referred to hereafter as the “Portfolio”) as of December 31, 2020, the related statement of operations for the year ended December 31, 2020, the statements of changes in net assets for each of the two years in the period ended December 31, 2020, including the related notes, and the financial highlights for each of the five years in the period ended December 31, 2020 (collectively referred to as the “financial statements”). In our opinion, the financial statements present fairly, in all material respects, the financial position of the Portfolio as of December 31, 2020, the results of its operations for the year then ended, the changes in its net assets for each of the two years in the period ended December 31, 2020 and the financial highlights for each of the five years in the period ended December 31, 2020 in conformity with accounting principles generally accepted in the United States of America.
Basis for Opinion
These financial statements are the responsibility of the Portfolio’s management. Our responsibility is to express an opinion on the Portfolio’s financial statements based on our audits. We are a public accounting firm registered with the Public Company Accounting Oversight Board (United States) (PCAOB) and are required to be independent with respect to the Portfolio in accordance with the U.S. federal securities laws and the applicable rules and regulations of the Securities and Exchange Commission and the PCAOB.
We conducted our audits of these financial statements in accordance with the standards of the PCAOB. Those standards require that we plan and perform the audit to obtain reasonable assurance about whether the financial statements are free of material misstatement, whether due to error or fraud.
Our audits included performing procedures to assess the risks of material misstatement of the financial statements, whether due to error or fraud, and performing procedures that respond to those risks. Such procedures included examining, on a test basis, evidence regarding the amounts and disclosures in the financial statements. Our audits also included evaluating the accounting principles used and significant estimates made by management, as well as evaluating the overall presentation of the financial statements. Our procedures included confirmation of securities owned as of December 31, 2020 by correspondence with the custodian, transfer agent and brokers; when replies were not received from brokers, we performed other auditing procedures. We believe that our audits provide a reasonable basis for our opinion.
/s/PricewaterhouseCoopers LLP
Boston, Massachusetts
February 17, 2021
We have served as the auditor of one or more investment companies in the Goldman Sachs fund complex since 2000.
28
GOLDMAN SACHS VARIABLE INSURANCE TRUST MULTI-STRATEGY ALTERNATIVES PORTFOLIO
Voting Results of Special Meeting of Shareholders (Unaudited)
A Special Meeting (the “Meeting”) of the Goldman Sachs Variable Insurance Trust (“VIT”) was held on January 23, 2020 to consider and act upon the proposal below. The Portfolio has amortized its respective share of the proxy, shareholder meeting and other related costs and GSAM has agreed to reimburse the Portfolio to the extent such expenses exceed a specified percentage of the Portfolio’s net assets.
At the Meeting, Dwight L. Bush, Kathryn A. Cassidy, Joaquin Delgado and Gregory G. Weaver were elected to the Trust’s Board of Trustees. In electing trustees, the Trust’s shareholders voted as follows:
| | | | | | | | | | | | | | | | |
| | | | | |
Proposal 1. Election of Trustees | | For | | | Against | | | Withheld | | | Broker Non-Votes | |
| | | | | |
Dwight L. Bush | | | 745,493,677.130 | | | | 0 | | | | 17,848,840.639 | | | | 0 | |
| | | | | |
Kathryn A. Cassidy | | | 746,559,784.810 | | | | 0 | | | | 16,782,732.959 | | | | 0 | |
| | | | | |
Joaquin Delgado | | | 744,593,456.532 | | | | 0 | | | | 18,749,061.237 | | | | 0 | |
| | | | | |
Gregory G. Weaver | | | 746,707,039.321 | | | | 0 | | | | 16,635,478.448 | | | | 0 | |
29
GOLDMAN SACHS VARIABLE INSURANCE TRUST MULTI-STRATEGY ALTERNATIVES PORTFOLIO
| | |
| Portfolio Expenses — Six Month Period Ended December 31, 2020 (Unaudited) | | |
As a shareholder of Institutional, Service or Advisor Shares of the Portfolio, you incur ongoing costs, including management fees, distribution and/or service (12b-1) fees (with respect to Service and Advisor Shares) and other Portfolio expenses. This example is intended to help you understand your ongoing costs (in dollars) of investing in Institutional Shares, Service Shares and Advisor Shares of the Portfolio and to compare these costs with the ongoing costs of investing in other mutual funds.
The example is based on an investment of $1,000 invested at the beginning of the period and held for the entire period from July 1, 2020 through December 31, 2020, which represents a period of 184 days of a 366 day year.
Actual Expenses — The first line under each share class in the table below provides information about actual account values and actual expenses. You may use the information in this line, together with the amount you invested, to estimate the expenses that you paid over the period. Simply divide your account value by $1,000 (for example, an $8,600 account value divided by $1,000=8.6), then multiply the result by the number in the first line under the heading entitled “Expenses Paid” to estimate the expenses you paid on your account during this period.
Hypothetical Example for Comparison Purposes — The second line under each share class in the table below provides information about hypothetical account values and hypothetical expenses based on the Portfolio’s actual net expense ratio and an assumed rate of return of 5% per year before expenses, which is not the Portfolio’s actual return. The hypothetical account values and expenses may not be used to estimate the actual ending account balance or expenses you paid for the period. You may use this information to compare the ongoing costs of investing in the Portfolio and other funds. To do so, compare this 5% hypothetical example with the 5% hypothetical examples that appear in the shareholder reports of the other funds.
Please note that the expenses shown in the table are meant to highlight your ongoing costs only. As a shareholder of the Portfolio you do not incur any transaction costs, such as sales charges, redemption fees, or exchange fees, but shareholders of other funds may incur such costs. The second line of the table is useful in comparing ongoing costs only and will not help you determine the relative total costs of owning different funds whose shareholders may incur transaction costs.
| | | | | | | | | | | | |
| Share Class | | Beginning
Account Value
07/01/20 | | | Ending
Account Value
12/31/20 | | | Expenses Paid
for the
6 Months
Ended
12/31/20* | |
| Institutional | | | | | | | | | | | | |
| | | | |
| Actual | | $ | 1,000 | | | $ | 1,085.10 | | | $ | 1.15 | |
| Hypothetical 5% return | | | 1,000 | | | | 1,024.03 | + | | | 1.12 | |
| Service | | | | | | | | | | | | |
| | | | |
| Actual | | | 1,000 | | | | 1,082.80 | | | | 2.46 | |
| Hypothetical 5% return | | | 1,000 | | | | 1,022.77 | + | | | 2.39 | |
| Advisor | | | | | | | | | | | | |
| | | | |
| Actual | | | 1,000 | | | | 1,082.70 | | | | 3.25 | |
| Hypothetical 5% return | | | 1,000 | | | | 1,022.02 | + | | | 3.15 | |
| | + | Hypothetical expenses are based on the Portfolio’s actual annualized net expense ratios and an assumed rate of return of 5% per year before expenses. | |
| | * | Expenses are calculated using the Portfolio’s annualized net expense ratio for each class, which represents the ongoing expenses as a percentage of net assets for the six months ended December 31, 2020. Expenses are calculated by multiplying the annualized net expense ratio by the average account value for the period; then multiplying the result by the number of days in the most recent fiscal half year; and then dividing that result by the number of days in the fiscal year. The annualized net expense ratios for the period were 0.22%, 0.47% and 0.62% for Institutional, Service and Advisor Shares, respectively. | |
30
GOLDMAN SACHS VARIABLE INSURANCE TRUST MULTI-STRATEGY ALTERNATIVES PORTFOLIO
Trustees and Officers (Unaudited)
Independent Trustees
| | | | | | | | | | | | |
| | | | | |
Name,
Address and Age1 | | Position(s) Held
with the Trust | | Term of Office and
Length of
Time Served2 | | Principal Occupation(s) During Past 5 Years | | Number of
Portfolios in
Fund Complex
Overseen by
Trustee3 | | | Other Directorships Held by Trustee4 |
Jessica Palmer Age: 71 | | Chair of the Board of Trustees | | Since 2018 (Trustee since 2007) | | Ms. Palmer is retired. She was formerly Consultant, Citigroup Human Resources Department (2007-2008); Managing Director, Citigroup Corporate and Investment Banking (previously, Salomon Smith Barney/Salomon Brothers) (1984-2006). Ms. Palmer was a Member of the Board of Trustees of Indian Mountain School (private elementary and secondary school) (2004-2009). Chair of the Board of Trustees — Goldman Sachs Variable Insurance Trust and Goldman Sachs Trust. | | | 105 | | | None |
Dwight L. Bush Age: 63 | | Trustee | | Since 2020 | | Ambassador Bush is President and CEO of D.L. Bush & Associates (a financial advisory and private investment firm) (2002-2014 and 2017-present); and was formerly U.S. Ambassador to the Kingdom of Morocco (2014-2017) and a Member of the Board of Directors of Santander Bank, N.A. (2018-2019). Previously, Ambassador Bush served as an Advisory Board Member of Goldman Sachs Trust and Goldman Sachs Variable Insurance Trust (October 2019-January 2020). Trustee — Goldman Sachs Variable Insurance Trust and Goldman Sachs Trust. | | | 105 | | | None |
Kathryn A. Cassidy Age: 66 | | Trustee | | Since 2015 | | Ms. Cassidy is retired. Formerly, she was Advisor to the Chairman (May 2014-December 2014); and Senior Vice President and Treasurer (2008-2014), General Electric Company & General Electric Capital Corporation (technology and financial services companies). Trustee — Goldman Sachs Variable Insurance Trust and Goldman Sachs Trust. | | | 105 | | | None |
Diana M. Daniels Age: 71 | | Trustee | | Since 2007 | | Ms. Daniels is retired. Formerly, she was Vice President, General Counsel and Secretary, The Washington Post Company (1991-2006). Ms. Daniels is a Trustee Emeritus and serves as a Presidential Councillor of Cornell University (2013-Present); former Member of the Legal Advisory Board, New York Stock Exchange (2003-2006) and of the Corporate Advisory Board, Standish Mellon Management Advisors (2006-2007). Trustee — Goldman Sachs Variable Insurance Trust and Goldman Sachs Trust. | | | 105 | | | None |
Joaquin Delgado Age: 60 | | Trustee | | Since 2020 | | Dr. Delgado is retired. He is Director, Hexion Inc. (a specialty chemical manufacturer) (2019-present); and Director, Stepan Company (a specialty chemical manufacturer) (2011-present); and was formerly Executive Vice President, Consumer Business Group of 3M Company (July 2016-July 2019); and Executive Vice President, Health Care Business Group of 3M Company (October 2012-July 2016). Previously, Dr. Delgado served as an Advisory Board Member of Goldman Sachs Trust and Goldman Sachs Variable Insurance Trust (October 2019-January 2020). Trustee — Goldman Sachs Variable Insurance Trust and Goldman Sachs Trust. | | | 105 | | | Stepan Company (a specialty chemical manufacturer) |
| | | | | | | | | | | | |
31
GOLDMAN SACHS VARIABLE INSURANCE TRUST MULTI-STRATEGY ALTERNATIVES PORTFOLIO
Trustees and Officers (Unaudited) (continued)
Independent Trustees
| | | | | | | | | | | | |
| | | | | |
Name,
Address and Age1 | | Position(s) Held
with the Trust | | Term of Office and
Length of
Time Served2 | | Principal Occupation(s) During Past 5 Years | | Number of
Portfolios in
Fund Complex
Overseen by
Trustee3 | | | Other Directorships Held by Trustee4 |
Roy W. Templin Age: 60 | | Trustee | | Since 2013 | | Mr. Templin is retired. He is Director, Armstrong World Industries, Inc. (a designer and manufacturer of ceiling, wall and suspension system solutions) (2016-Present); and was formerly Chairman of the Board of Directors, Con-Way Incorporated (a transportation, logistics and supply chain management service company) (2014-2015); Executive Vice President and Chief Financial Officer, Whirlpool Corporation (an appliance manufacturer and marketer) (2004-2012). Trustee — Goldman Sachs Variable Insurance Trust and Goldman Sachs Trust. | | | 105 | | | Armstrong World Industries, Inc. (a ceiling, wall and suspension systems solutions manufacturer) |
Gregory G. Weaver Age: 69 | | Trustee | | Since 2015 | | Mr. Weaver is retired. He is Director, Verizon Communications Inc. (2015-Present); and was formerly Chairman and Chief Executive Officer, Deloitte & Touche LLP (a professional services firm) (2001-2005 and 2012-2014); and Member of the Board of Directors, Deloitte & Touche LLP (2006-2012). Trustee — Goldman Sachs Variable Insurance Trust and Goldman Sachs Trust. | | | 105 | | | Verizon Communications Inc. |
| | | | | | | | | | | | |
32
GOLDMAN SACHS VARIABLE INSURANCE TRUST MULTI-STRATEGY ALTERNATIVES PORTFOLIO
Trustees and Officers (Unaudited) (continued)
Interested Trustee*
| | | | | | | | | | | | |
| | | | | |
Name,
Address and Age1 | | Position(s) Held
with the Trust | | Term of Office and
Length of
Time Served2 | | Principal Occupation(s) During Past 5 Years | | Number of
Portfolios in
Fund Complex
Overseen by
Trustee3 | | | Other Directorships Held by Trustee4 |
James A. McNamara Age: 58 | | Trustee and President | | Since 2007 | | Advisory Director, Goldman Sachs (January 2018-Present); Managing Director, Goldman Sachs (January 2000-December 2017); Director of Institutional Fund Sales, GSAM (April 1998-December 2000); and Senior Vice President and Manager, Dreyfus Institutional Service Corporation (January 1993-April 1998). President and Trustee — Goldman Sachs Variable Insurance Trust; Goldman Sachs Trust; Goldman Sachs Trust II; Goldman Sachs MLP and Energy Renaissance Fund; Goldman Sachs ETF Trust; Goldman Sachs Credit Income Fund; and Goldman Sachs Real Estate Diversified Income Fund. | | | 158 | | | None |
| | | | | | | | | | | | |
| * | Mr. McNamara is considered to be an “Interested Trustee” because he holds positions with Goldman Sachs and owns securities issued by The Goldman Sachs Group, Inc. Mr. McNamara holds comparable positions with certain other companies of which Goldman Sachs, GSAM or an affiliate thereof is the investment adviser, administrator and/or distributor. |
| 1 | Each Trustee may be contacted by writing to the Trustee, c/o Goldman Sachs, 200 West Street, New York, New York, 10282, Attn: Caroline Kraus. Information is provided as of December 31, 2020. |
| 2 | Subject to such policies as may be adopted by the Board from time-to-time, each Trustee holds office for an indefinite term, until the earliest of: (a) the election of his or her successor; (b) the date the Trustee resigns or is removed by the Board or shareholders, in accordance with the Trust’s Declaration of Trust; or (c) the termination of the Trust. The Board has adopted policies which provide that each Independent Trustee shall retire as of December 31st of the calendar year in which he or she reaches (a) his or her 75th birthday or (b) the 15th anniversary of the date he or she became a Trustee, whichever is earlier, unless a waiver of such requirements shall have been adopted by a majority of the other Trustees. These policies may be changed by the Trustees without shareholder vote. |
| 3 | The Goldman Sachs Fund Complex includes certain other companies listed above for each respective Trustee. As of December 31, 2020, Goldman Sachs Variable Insurance Trust consisted of 13 portfolios; Goldman Sachs Trust consisted of 92 portfolios (90 of which offered shares to the public); Goldman Sachs Trust II consisted of 19 portfolios (17 of which offered shares to the public); Goldman Sachs ETF Trust consisted of 31 portfolios (20 of which offered shares to the public); and Goldman Sachs MLP and Energy Renaissance Fund, Goldman Sachs Credit Income Fund and Goldman Sachs Real Estate Diversified Income Fund each consisted of one portfolio. Goldman Sachs Credit Income Fund did not offer shares to the public. |
| 4 | This column includes only directorships of companies required to report to the Securities and Exchange Commission under the Securities Exchange Act of 1934 (i.e., “public companies”) or other investment companies registered under the Act. |
Additional information about the Trustees is available in the Portfolio’s Statement of Additional Information, which can be obtained from Goldman Sachs free of charge by calling this toll-free number (in the United States of America): 1-800-526-7384.
33
GOLDMAN SACHS VARIABLE INSURANCE TRUST MULTI-STRATEGY ALTERNATIVES PORTFOLIO
Trustees and Officers (Unaudited) (continued)
Officers of the Trust*
| | | | | | |
| | | |
| Name, Address and Age1 | | Position(s) Held with the Trust | | Term of
Office and
Length of
Time Served2 | | Principal Occupation(s) During Past 5 Years |
James A. McNamara
200 West Street New York, NY 10282 Age: 58 | | Trustee and
President | | Since 2007 | | Advisory Director, Goldman Sachs (January 2018-Present); Managing Director, Goldman Sachs (January 2000-December 2017); Director of Institutional Fund Sales, GSAM (April 1998-December 2000); and Senior Vice President and Manager, Dreyfus Institutional Service Corporation (January 1993-April 1998). President and Trustee — Goldman Sachs Variable Insurance Trust; Goldman Sachs Trust; Goldman Sachs Trust II; Goldman Sachs MLP and Energy Renaissance Fund; Goldman Sachs ETF Trust; Goldman Sachs Credit Income Fund; and Goldman Sachs Real Estate Diversified Income Fund. |
Caroline L. Kraus
200 West Street New York, NY 10282 Age: 43 | | Secretary | | Since 2012 | | Managing Director, Goldman Sachs (January 2016-Present); Vice President, Goldman Sachs (August 2006-December 2015); Senior Counsel, Goldman Sachs (January 2020-Present); Associate General Counsel, Goldman Sachs (2012-December 2019); Assistant General Counsel, Goldman Sachs (August 2006-December 2011); and Associate, Weil, Gotshal & Manges, LLP (2002-2006). Secretary — Goldman Sachs Variable Insurance Trust (previously Assistant Secretary (2012)); Goldman Sachs Trust (previously Assistant Secretary (2012)); Goldman Sachs Trust II; Goldman Sachs BDC, Inc.; Goldman Sachs Private Middle Market Credit LLC; Goldman Sachs Private Middle Market Credit II LLC; Goldman Sachs Middle Market Lending Corp.; Goldman Sachs MLP and Energy Renaissance Fund; Goldman Sachs ETF Trust; Goldman Sachs Credit Income Fund; and Goldman Sachs Real Estate Diversified Income Fund. |
Joseph F. DiMaria
30 Hudson Street Jersey City, NJ 07302 Age: 52 | | Treasurer, Principal
Financial Officer
and Principal
Accounting Officer | | Since 2017
(Treasurer
and Principal
Financial
Officer
since 2019) | | Managing Director, Goldman Sachs (November 2015-Present) and Vice President — Mutual Fund Administration, Columbia Management Investment Advisers, LLC (May 2010-October 2015). Treasurer, Principal Financial Officer and Principal Accounting Officer — Goldman Sachs Variable Insurance Trust (previously Assistant Treasurer (2016)); Goldman Sachs Trust (previously Assistant Treasurer (2016)); Goldman Sachs Trust II (previously Assistant Treasurer (2017)); Goldman Sachs MLP and Energy Renaissance Fund (previously Assistant Treasurer (2017)); Goldman Sachs ETF Trust (previously Assistant Treasurer (2017)); Goldman Sachs Credit Income Fund; and Goldman Sachs Real Estate Diversified Income Fund. |
| | | | | | |
| * | Represents a partial list of officers of the Trust. Additional information about all the officers is available in the Portfolio’s Statement of Additional Information, which can be obtained from Goldman Sachs free of charge by calling this toll-free number (in the United States): 1-800-526-7384. |
| 1 | Information is provided as of December 31, 2020. |
| 2 | Officers hold office at the pleasure of the Board of Trustees or until their successors are duly elected and qualified. Each officer holds comparable positions with certain other companies of which Goldman Sachs, GSAM or an affiliate thereof is the investment adviser, administrator and/or distributor. |
Goldman Sachs Variable Insurance Trust — Tax Information (Unaudited)
For the year ended December 31, 2020, 0.58% of the dividends paid from net investment company taxable income by the Multi-Strategy Alternatives Portfolio qualify for the dividends received deduction available to corporations.
For the year ended December 31, 2020, the Multi-Strategy Alternatives Portfolio has elected to pass through a credit for taxes paid to foreign jurisdictions. The total amount of income received by the Multi-Strategy Alternatives Portfolio from sources within foreign countries and possessions of the United States was $0.0082 per share, all of which is attributable to qualified passive income. The percentage of net investment income dividends paid by the Portfolio during the year ended December 31, 2020 from foreign sources was 2.95%. The total amount of foreign taxes paid by the Portfolio was $0.0015 per share.
34
| | |
| TRUSTEES | | OFFICERS |
Jessica Palmer, Chair Dwight L. Bush | | James A. McNamara, President Joseph F. DiMaria, Principal Financial Officer, |
| Kathryn A. Cassidy | | Principal Accounting Officer and Treasurer |
Diana M. Daniels Joaquin Delgado | | Caroline L. Kraus, Secretary |
| James A. McNamara | | |
| Roy W. Templin | | |
| Gregory G. Weaver | | |
GOLDMAN SACHS & CO. LLC
Distributor and Transfer Agent
GOLDMAN SACHS ASSET MANAGEMENT, L.P.
Investment Adviser
200 West Street, New York
New York 10282
Visit our web site at www.GSAMFUNDS.com to obtain the most recent month-end returns.
The reports concerning the Portfolio included in this shareholder report may contain certain forward-looking statements about the factors that may affect the performance of the Portfolio in the future. These statements are based on Portfolio management’s predictions and expectations concerning certain future events and their expected impact on the Portfolio, such as performance of the economy as a whole and of specific industry sectors, changes in the levels of interest rates, the impact of developing world events, and other factors that may influence the future performance of the Portfolio. Management believes these forward-looking statements to be reasonable, although they are inherently uncertain and difficult to predict. Actual events may cause adjustments in portfolio management strategies from those currently expected to be employed.
A description of the policies and procedures that the Portfolio uses to determine how to vote proxies relating to portfolio securities and information regarding how the Portfolio voted proxies relating to portfolio securities for the 12-month period ended December 31 is available (i) without charge, upon request by calling 1-800-621-2550; and (ii) on the Securities and Exchange Commission (“SEC”) web site at http://www.sec.gov.
The Portfolio will file its portfolio holdings information for each month in a fiscal quarter within 60 days after the end of the relevant fiscal quarter on Form N-PORT. Portfolio holdings information for the third month of each fiscal quarter will be made available on the SEC’s web site at http://www.sec.gov. Portfolio holdings information may be obtained upon request and without charge by calling 1-800-526-7384 (for Retail Shareholders) or 1-800-621-2550 (for Institutional Shareholders).
Views and opinions expressed are for informational purposes only and do not constitute a recommendation by GSAM to buy, sell, or hold any security. Views and opinions are current as of the date of this presentation and may be subject to change, they should not be construed as investment advice.
Goldman Sachs & Co. LLC (“Goldman Sachs”) does not provide legal, tax or accounting advice. Any statement contained in this communication (including any attachments) concerning U.S. tax matters was not intended or written to be used, and cannot be used, for the purpose of avoiding penalties under the Internal Revenue Code, and was written to support the promotion or marketing of transactions or matters addressed. Clients of Goldman Sachs should obtain their own independent tax advice based on their particular circumstances.
The website links provided are for your convenience only and are not an endorsement or recommendation by GSAM of any of these websites or the products or services offered. GSAM is not responsible for the accuracy and validity of the content of these websites.
Portfolio holdings and allocations shown are as of December 31, 2020 and may not be representative of future investments. Portfolio holdings should not be relied on in making investment decisions and should not be construed as research or investment advice regarding particular securities. Current and future holdings are subject to risk.
References to indices, benchmarks or other measures of relative market performance over a specified period of time are provided for your information only and do not imply that the portfolio will achieve similar results. The index composition may not reflect the manner in which a portfolio is constructed. While an adviser seeks to design a portfolio which reflects appropriate risk and return features, portfolio characteristics may deviate from those of the benchmark.
The Global Industry Classification Standard (“GICS”) was developed by and is the exclusive property and a service mark of Morgan Stanley Capital International Inc. (“MSCI”) and Standard & Poor’s, a division of The McGraw-Hill Companies, Inc. (“S&P”) and is licensed for use by Goldman Sachs. Neither MSCI, S&P nor any other party involved in making or compiling the GICS or any GICS classifications makes any express or implied warranties or representations with respect to such standard or classification (or the results to be obtained by the use thereof), and all such parties hereby expressly disclaim all warranties of originality, accuracy, completeness, merchantability or fitness for a particular purpose with respect to any of such standard or classification. Without limiting any of the foregoing, in no event shall MSCI, S&P, any of their affiliates or any third party involved in making or compiling the GICS or any GICS classifications have any liability for any direct, indirect, special, punitive, consequential or any other damages (including lost profits) even if notified of the possibility of such damages.
The portfolio risk management process includes an effort to monitor and manage risk, but does not imply low risk.
Diversification does not protect an investor from market risk and does not ensure a profit.
Shares of the Goldman Sachs VIT Funds are offered to separate accounts of participating life insurance companies for the purpose of funding variable annuity contracts and variable life insurance policies. Shares of the Portfolio are not offered directly to the general public. The variable annuity contracts and variable life insurance policies are described in the separate prospectuses issued by participating insurance companies. You should refer to those prospectuses for information about surrender charges, mortality and expense risk fees and other charges that may be assessed by participating insurance companies under the variable annuity contracts or variable life insurance policies. Such fees or charges, if any, may affect the return you may realize with respect to your investments. Ask your representative for more complete information. Please consider a fund’s objectives, risks and charges and expenses, and read the prospectus carefully before investing. The prospectus contains this and other information about the Portfolio.
This material is not authorized for distribution to prospective investors unless preceded or accompanied by a current prospectus or summary prospectus, if applicable. Investors should consider the Portfolio’s objective, risks, and charges and expenses, and read the summary prospectus, if available, and/or the prospectus carefully before investing or sending money. The summary prospectus, if available, and the prospectus contain this and other information about the Portfolio and may be obtained from your authorized dealer or from Goldman Sachs & Co. LLC by calling 1-800-621-2550.
This report is prepared for the general information of contract owners and is not an offer of shares of the Goldman Sachs Variable Insurance Trust — Goldman Sachs Multi-Strategy Alternatives Portfolio.
© 2021 Goldman Sachs. All rights reserved.
VITMSAAR-21 229748-OTU-1351313
Goldman
Sachs Variable Insurance Trust
Goldman Sachs Core Fixed Income Fund
Goldman Sachs Equity Index Fund
Goldman Sachs Growth Opportunities Fund
Goldman Sachs High Quality Floating Rate Fund
Beginning on or after January 1, 2021, you may not receive paper copies of the Funds’ annual and semi-annual shareholder reports from the insurance company that offers your variable insurance contract or your financial intermediary, unless you specifically request paper copies of the reports from the insurance company or from your financial intermediary. Instead, the reports will be made available on a website, and you will be notified by mail each time a report is posted and provided with a website link to access the report.
If you already elected to receive shareholder reports electronically, you will not be affected by this change and you need not take any action. At any time, you may elect to receive reports and certain communications from the insurance company electronically by contacting your insurance company or your financial intermediary.
You may elect to receive all future shareholder reports in paper free of charge. You can inform the insurance company or your financial intermediary that you wish to receive paper copies of reports. Your election to receive reports in paper will apply to all Goldman Sachs Funds available under your contract and may apply to all funds held with your financial intermediary.
Annual Report
December 31, 2020

MARKET REVIEW
Goldman Sachs Variable Insurance Trust Funds
Market Review
During the 12 months ended December 31, 2020 (the “Reporting Period”), the performance of the U.S. equity and fixed income markets were influenced most by the spread of COVID-19, a contraction in global economic growth and historic financial stimulus by central banks and governments around the world.
Equity Markets
In the first quarter of 2020, when the Reporting Period began, the U.S. equity market fell significantly, selling off as the outbreak and subsequent spread of COVID-19 caused non-essential businesses to close. Jobless claims increased to 6.6 million, and nonfarm payrolls decreased by 701,000 for the month of March, leading the U.S. government to respond with aggressive economic stimulus and the U.S. Federal Reserve (the “Fed”) to respond with unprecedented monetary policy stimulus, including lowering its targeted federal funds rate to zero and re-introducing and expanding its quantitative easing programs. Exacerbating matters was crude oil prices that fell as supply increased and demand decreased.
After hitting a low on March 23, 2020, the U.S. equity market then rose in the subsequent three quarters of 2020. In the second calendar quarter, U.S. equities appreciated despite a surge in COVID-19 cases in regional pockets of the country, causing local governments to pause reopening plans and revisit previous lockdown measures. Positive market sentiment was buoyed by better than consensus expected economic data, such as nonfarm payrolls increasing 7.3 million during May and June 2020, driving the unemployment rate down to 11.1% from 14.7% in April. The U.S. equity markets continued to rally in the third quarter of 2020 despite ongoing pressure from the pandemic. Market strength was supported by a sharp cyclical recovery in economic data, with the Institute for Supply Management’s Manufacturing Purchasing Managers’ Index increasing to 56.0 in August, which is firmly in expansionary territory. Optimism around a potential COVID-19 vaccine also helped support equity markets during the quarter. Still, risks to the market persisted given political uncertainty ahead of the then-upcoming 2020 U.S. elections, lower levels of Gross Domestic Product, heightened unemployment, questions around how quickly and effectively a COVID-19 vaccine could be distributed, and debates about the extent of a new stimulus package from the federal government. In the fourth quarter of 2020, U.S. stocks extended a broad-based recovery from their steep first quarter declines. Markets rallied on the prospect of an end to the global pandemic and its economic impact with the approval and distribution of COVID-19 vaccines. While uncertainty surrounding the then-upcoming U.S. elections and other policy questions created the potential for higher market volatility, the victory of the Democratic candidate for President proved positive for equity markets in the latter part of the fourth quarter. Also, after a historically sharp but short recession during the spring of 2020, many major economies, including that of the U.S., entered an early-cycle phase of recovery, in our view. Employment conditions improved, as temporary job losses were regained in some segments of the economy, and U.S. manufacturing activity recovered. Despite this improvement, reminders of a COVID-19 ceiling for industries hit hardest by pandemic restrictions persisted.
The S&P 500® Index returned 18.34% during the Reporting Period overall. Eight of its 11 sectors posted positive absolute returns, with seven of those eight generating double-digit gains. Information technology, consumer discretionary and communication services were the best performing sectors in the S&P 500® Index, as measured by total return, while the weakest performing sectors in the S&P 500® Index during the Reporting Period were energy, real estate and financials.
Within the U.S. equity market, all capitalization segments posted double-digit positive returns, led by large-cap stocks, as measured by the Russell 1000® Index, followed closely by small-cap stocks, as measured by the Russell 2000® Index, and then by mid-cap stocks, as measured by the Russell Midcap® Index. From a style perspective, growth-oriented stocks significantly outpaced value-oriented stocks across the capitalization spectrum. (All as measured by the FTSE Russell indices.)
Fixed Income Markets
When the Reporting Period started in January 2020, macroeconomic data was generally positive but geopolitical uncertainty increased amid U.S.-Iran tensions. In the second half of the month, investor sentiment was challenged by concerns that Chinese and global economic growth could slow due to the outbreak in China of COVID-19. Although risk-off investor sentiment, or reduced risk appetite, eased in early February, it resurfaced later in the month on news of an uptick in COVID-19 cases outside of China. Investor sentiment quickly worsened in March, as governments around the world initiated shutdowns and quarantines to stem what had by then become a pandemic. Global central banks indicated their willingness to use monetary policy to address market
1
MARKET REVIEW
volatility and economic conditions. In early March, the Fed cut the targeted federal funds rate by 50 basis points to a range of between 1.00% and 1.25%, citing “evolving” risks to U.S. economic activity from COVID-19. (A basis point is 1/100th of a percentage point.) Then, on March 15th, the Fed slashed the targeted federal funds rate to near zero. Other G10 central banks, except for Sweden’s Riksbank, reduced their policy rates or held them at all-time lows. (Also known as Group of 10 nations, the G10 are actually 11 countries that participate in an agreement to provide the International Monetary Fund with additional funds to increase its lending ability. Members include Belgium, Canada, France, Germany, Italy, Japan, Netherlands, Sweden, Switzerland, the U.K. and the U.S.) Quantitative easing measures were resumed in the U.S., the U.K. and Sweden, expanded in Europe and Japan, and commenced in Australia, Canada and New Zealand. New policy measures were also launched, with the goal of easing stresses in corporate bond markets. Meanwhile, many governments began to make use of fiscal policy to stem supply-side shocks. Several announced large fiscal measures, which included direct support for health care efforts. Many of the measures also sought to provide income support to individuals, assistance to households, small businesses and larger companies, and loan guarantees. Finally, a sharp drop in crude oil prices during March 2020 added further to market volatility. Early in the month, a dispute between Russia and the Organization of the Petroleum Exporting Countries, also known as OPEC, led Saudi Arabia to lower the price at which it sold crude oil. In this environment, spread, or non-government bond, sectors, with the exception of mortgage-backed securities, recorded negative returns for the first calendar quarter overall.
During the second quarter of 2020, spread sectors produced positive returns, supported by improving economic data and accommodative monetary and fiscal policy. When the quarter began in April, the broad fixed income market continued to experience bouts of volatility based on economic developments, including data that showed sharp declines in global economic activity, and COVID-19-related headlines. In May, ongoing central bank liquidity, better economic data, and market optimism around the reopening of economies sparked a significant rally in risk assets, including corporate credit. Investors appeared to be looking beyond risks such as deteriorating U.S.-China relations and civil unrest and nationwide protests in the U.S. At the start of June, renewed COVID-19 case growth in the U.S. and in various other developed economies increased risk-off sentiment. However, survey and economic activity data rebounded from April’s record low levels, boosting the performance of risk assets overall. Central banks continued to demonstrate their willingness to expand policy parameters to support labor markets and to use quantitative easing to facilitate fiscal expansion as well as to underpin more segments of financial markets. In June, the European Central Bank (“ECB”) expanded and extended its quantitative easing program, while the Fed removed a requirement for issuers to “opt-in” to its secondary market corporate credit facility.
In the third quarter of 2020, spread sectors continued to produce gains, supported by accommodative central bank monetary policies as well as by agreement on a €750 billion European Union Recovery Fund, stronger than consensus expected second quarter corporate earnings and progress on COVID-19 vaccine development. However, the financial markets continued to experience episodes of risk-off sentiment, driven by headlines about rising COVID-19 cases, increasing U.S.-China tensions, and limited progress in the U.S. Congress on a fourth fiscal stimulus package. Meanwhile, the Fed kept its monetary policy and forward guidance unchanged as it awaited details on further U.S. government fiscal stimulus and the path of COVID-19. The Fed also extended its credit facilities, which had been set to expire in September, to the end of the 2020 calendar year, thereby elongating the policy tailwind for corporate credit markets. In the Eurozone, the European Union Recovery Fund reduced political tail risks. During August, Fed Chair Jerome Powell unveiled the conclusions of the Federal Open Market Committee’s monetary policy framework review. The main outcome was the adoption of flexible average inflation targeting. In other words, the Fed said it would aim for an inflation rate moderately above 2% following periods when inflation has run persistently below 2%, seeking an average of 2% over time. The U.S. central bank also adjusted how it would assess labor market performance, taking into account racial and income disparities. September 2020 saw the return of risk-off investor sentiment, as some of the factors that supported the improvement in economic conditions started to fade. Renewed COVID-19 case growth in Europe and reduced prospects of further U.S. fiscal support, alongside rising political uncertainty heading in the then-upcoming U.S. elections, contributed to increased market volatility and investor risk aversion.
Early in the fourth quarter of 2020, steadily rising COVID-19 cases and renewed lockdowns dominated pandemic-related news flow. However, later in the quarter, encouraging efficacy results for several COVID-19 vaccines helped lift market sentiment, and spread sectors recorded gains for the quarter overall. Risk sentiment was also bolstered by the removal of a few long-standing
2
MARKET REVIEW
overhangs. Specifically, the U.S. elections were resolved; the U.K. and European Union agreed to a post-Brexit deal; and another round of fiscal stimulus was provided by the U.S. federal government. (Brexit refers to the U.K.’s exit from the European Union.) Global economic conditions remained weak, with the inflation picture relatively benign due to slack in economic output and employment. Central banks around the world maintained their commitment to accommodative monetary policy. In the U.S., the Fed did not extend the average maturity of its U.S. Treasury purchases at its December policy meeting, but it introduced dovish forward guidance, stating it would continue to increase its asset holdings “until substantial further progress has been made toward the Committee’s maximum employment and price stability goals.” (Dovish tends to suggest lower interest rates; opposite of hawkish.) Meanwhile, the U.S. Department of the Treasury decided to let several of the Fed’s emergency credit facilities expire at the end of 2020 and requested the Fed return unused funds. In Europe, the ECB announced a multi-pronged package of easing measures, in line with market expectations, extended the horizon for its pandemic emergency purchase program, and increased the level of its purchases.
For the Reporting Period overall, spread sector performance was mixed. High yield corporate bonds and asset backed securities outperformed U.S. Treasury securities, followed at some distance by commercial mortgage-backed securities, investment grade corporate bonds and mortgage-backed securities. Sovereign emerging markets debt and agency securities underperformed Treasury securities. During the Reporting Period, U.S. Treasury yields fell along the curve. Yields of shorter-and intermediate-term maturities dropped more than long-term yields, resulting in the steepening of the U.S. Treasury yield curve. (Yield curve is a spectrum of interest rates based on maturities of varying lengths.) The yield on the bellwether 10-year U.S. Treasury dropped approximately 100 basis points to end the Reporting Period at 0.92%.
Looking Ahead
Equity Markets
The U.S. equity markets rebounded from pandemic-induced lows in the first quarter of 2020 to round out the calendar year with multiple tailwinds from pent-up demand to significant cash reserves. As the markets anticipated an economic recovery alongside the rollout of the COVID-19 vaccines, we remained vigilant at the end of the Reporting Period in navigating through optimistic market sentiment given the potential for volatility. While we see a path to an uptick in global economic activity to support further market upside, we simultaneously caution that the economy remains in the infancy of its recovery, and uneven progress suggests that full macroeconomic normalization may well remain dependent on the trajectory of COVID-19 recovery, successful global vaccine distribution and inoculation, and ongoing fiscal and monetary policy. As the economic expansion widens, we expected, at the end of the Reporting Period, the U.S. equity market rally to continue but with broader sector participation. Within this recovery period, we believe it is crucial to stay true to our quality-first investment approach, seeking to invest in businesses with healthy balance sheets, relatively stable free cash flow generation, and differentiated business models aligned to secular advantages.
Fixed Income Markets
At the end of the Reporting Period, global economic conditions had improved but had not fully recovered from the COVID-19-induced downturn. In our view, continued spread of the pandemic is likely to slow economic growth during the winter months, with economic recoveries accelerating in the spring due to mass immunizations. We expect global central banks to keep policy rates low and to modulate their asset purchases as they seek to ease financial conditions. Government fiscal measures are likely to continue, we believe, until economic recoveries are on solid footing. In our view, growth supportive factors include accelerated COVID-19 vaccine timelines, pent-up consumer demand, easy macro policies and low evidence of economic “scarring.” Growth-limiting factors, in our opinion, include COVID-19 vaccine rollout delays, renewed case growth, subdued demand as households and businesses seek to shrink debt accumulated in 2020, and bankruptcies as forbearance draws to a close. In our view, additional risks include modest U.S. fiscal stimulus in 2021 or an early pivot away from policy support.
3
GOLDMAN SACHS VARIABLE INSURANCE TRUST CORE FIXED INCOME FUND
INVESTMENT OBJECTIVE
The Fund seeks a total return consisting of capital appreciation and income that exceeds the total return of the Bloomberg Barclays U.S. Aggregate Bond Index.
Portfolio Management Discussion and Analysis
Below, the Goldman Sachs Fixed Income Portfolio Management Team discusses the Goldman Sachs Variable Insurance Trust – Goldman Sachs Core Fixed Income Fund’s (the “Fund”) performance and positioning for the 12-month period ended December 31, 2020 (the “Reporting Period”).
How did the Fund perform during the Reporting Period?
During the Reporting Period, the Fund’s Institutional and Service Shares generated average annual total returns of 9.64% and 9.37%, respectively. This compares to the 7.49% average annual total return of the Fund’s benchmark, the Bloomberg Barclays U.S. Aggregate Bond Index (the “Bloomberg Barclays Index”), during the same time period.
What key factors were responsible for the Fund’s performance during the Reporting Period?
During the Reporting Period, the Fund’s top-down cross-sector strategy added most to the Fund’s relative returns. In our cross-sector strategy, we invest Fund assets across a variety of fixed income sectors, including some that may not be included in the Bloomberg Barclays Index. Our bottom-up individual issue selection further bolstered relative returns.
The Fund’s combined tactical duration and yield curve positioning contributed positively to relative performance during the Reporting Period. (Duration is a measure of the Fund’s sensitivity to changes in interest rates. Yield curve is a spectrum of interest rates based on maturities of varying lengths.)
Neither our top-down country strategy nor our top-down currency strategy had a material impact on the Fund’s relative returns during the Reporting Period.
Which fixed income market sectors most affected Fund performance during the Reporting Period?
During the Reporting Period, the Fund benefited from its corporate credit exposures. In March 2020, the Fund’s use of index credit default swaps (“CDX”) versus cash bonds added to relative performance, as credit spreads (yield differentials between corporate bonds and U.S. Treasury securities of similar maturity) widened on increasing market uncertainty about the economic impact of COVID-19. The Fund was also helped by its overweight position versus the Bloomberg Barclays Index in investment grade corporate bonds, with most of the outperformance occurring during the second half of the Reporting Period. Credit spreads began to tighten late in the second quarter of 2020 when a relaxation of COVID-19 containment measures, alongside monetary and fiscal policy support, helped the global economy sprint forward in the third quarter. Credit spreads tightened further in the fourth calendar quarter on encouraging COVID-19 vaccine progress, the resolution of the U.S. Presidential elections, better than consensus expected corporate earnings and continued policy support. In addition, our decision to hedge the Fund’s corporate credit exposure through a long position in U.S. interest rates and exposure to a basket of developed markets currencies added to relative returns during the first half of the Reporting Period when interest rates broadly fell amid risk-off investor sentiment, or reduced risk appetite. Finally, the Fund’s positioning in mortgage-backed securities bolstered relative performance. In particular, the Fund’s overweight in higher coupon mortgage-backed securities enhanced returns in the second half of the Reporting Period. During the summer of 2020, prepayment activity was concentrated in the middle of the coupon stack, as primary mortgage interest rates fell to historic lows. At the same time, prepayment speeds for higher coupon mortgage-backed securities decelerated, which was advantageous for the Fund’s positioning.
As for individual issue selection, the Fund’s investments in corporate credit, especially its overweight in short- to intermediate-term maturities, added to relative performance. In addition, the Fund benefited from an overweight in BBB-rated issues. Some of these gains were offset by the Fund’s selection of government bonds within its government/swaps strategy as well as by targeted trades within its cross-macro strategy, which detracted.
Did the Fund’s duration and yield curve positioning strategy help or hurt its results during the Reporting Period?
During the Reporting Period, the Fund’s combined duration and yield curve positioning added to performance. The positive results were driven by the Fund’s tactical duration positioning across a variety of yield curves, including the U.S. Treasury yield curve. We
4
GOLDMAN SACHS VARIABLE INSURANCE TRUST CORE FIXED INCOME FUND
tactically shifted the Fund’s exposure between the long-term and short-term ends of the U.S. Treasury yield curve from January to October 2020, at which time we focused the Fund’s exposure on the long-term end of the curve. In addition, the Fund benefited from its exposure to 10-year U.K. interest rates during the first calendar quarter.
How did the Fund use derivatives and similar instruments during the Reporting Period?
As market conditions warranted during the Reporting Period, currency transactions were carried out using primarily over-the-counter (“OTC”) forward foreign exchange contracts. Currency transactions were used as we sought both to enhance returns and to hedge the Fund’s portfolio against currency exchange rate fluctuations. OTC forward foreign exchange contracts had a negative impact on Fund performance during the Reporting Period. In addition, futures contracts were employed as warranted to facilitate specific duration, yield curve and country strategies. During the Reporting Period, futures contracts overall had a positive impact on the Fund’s results.
Swaptions (options on interest rate swap contracts), which were used to express our interest rate views and to hedge volatility and yield curve risks in the Fund, did not have a meaningful impact on the Fund’s performance during the Reporting Period. Interest rate swaps, which were used to manage exposure to fluctuations in interest rates, had a rather neutral impact on the Fund’s performance during the Reporting Period. Additionally, the Fund employed CDX as well as individual credit default swaps to implement specific credit-related investment strategies, including management of the Fund’s exposure to credit spreads, which collectively had a negative impact on the Fund’s results during the Reporting Period overall.
We employ derivatives and similar instruments for the efficient management of the Fund’s portfolio. Derivatives and similar instruments allow us to manage interest rate, credit and currency risks more effectively by allowing us both to hedge and to apply active investment views with greater versatility and to afford greater risk management precision than we would otherwise be able to implement.
Were there any notable changes in the Fund’s weightings during the Reporting Period?
During the Reporting Period, we increased the Fund’s overweight position relative to the Bloomberg Barclays Index in non-agency mortgage-backed securities because we believed that, despite continued COVID-19-related uncertainty, risk assets would be broadly supported by improving economic data and accommodative monetary and fiscal policy. We also increased the Fund’s overweight in asset backed securities (“ABS”), while marginally increasing its overweight in commercial mortgage-backed securities (“CMBS”). In addition, we significantly increased the Fund’s overweight versus the Bloomberg Barclays Index in agency mortgage-backed securities, including pass-through mortgage securities, because we expected spreads to tighten as the Fed continued its purchases, and mortgage loan origination seemed likely to slow in the fall of 2020. (Pass-through mortgage securities consist of a pool of residential mortgage loans in which homeowners’ monthly payments of principal, interest and prepayments pass from the mortgage servicer through a government agency or investment bank to investors.) Finally, we added modestly to the Fund’s overweight in investment grade corporate bonds during the Reporting Period, as we thought there was room for further spread compression due to accommodative central bank monetary and fiscal policies.
How was the Fund positioned relative to the Bloomberg Barclays Index at the end of the Reporting Period?
At the end of the Reporting Period, the Fund was overweight ABS and non-agency mortgage-backed securities compared to the Bloomberg Barclays Index. It was also overweight pass-through mortgage securities and corporate credit. The Fund was underweight U.S. government securities and quasi-government bonds relative to the Bloomberg Barclays Index. The Fund was relatively neutral versus the Bloomberg Barclays Index in CMBS at the end of the Reporting Period.
5
FUND BASICS
FUND COMPOSITION1
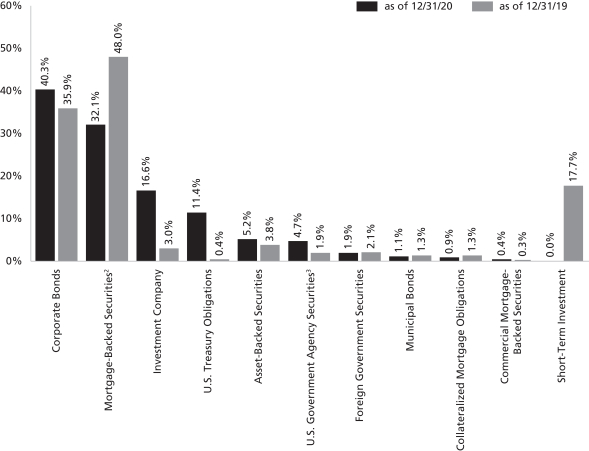
| 1 | The percentage shown for each investment category reflects the value of investments in that category as a percentage of net assets. Figures in the above graph may not sum to 100% due to the exclusion of other assets and liabilities. Short-Term Investments represent investments in commercial paper. Underlying sector allocations of investment companies held by the Fund are not reflected in the graph above. The graph depicts the Fund’s investments but may not represent the Fund’s market exposure due to the exclusion of certain derivatives, if any, as listed in the Additional Investment Information section of the Schedule of Investments. |
| 2 | “Mortgage-Backed Securities” are guaranteed by the Government National Mortgage Association (“GNMA”), the Federal Home Loan Mortgage Corp. (“FHLMC”) or Uniform Mortgage-Backed Securities (“UMBS”). GNMA instruments are backed by the full faith and credit of the United States Government. |
| 3 | “U.S. Government Agency Securities” include agency securities offered by companies such as Federal Home Loan Bank (“FHLB”), the Federal Home Loan Mortgage Corp. (“FHLMC”) and the Federal National Mortgage Association (“FNMA”), which operate under a government charter. While they are required to report to a government regulator, their assets are not explicitly guaranteed by the government and they otherwise operate like any other publicly traded company. |
For more information about your Fund, please refer to www.GSAMFUNDS.com. There, you can learn more about your Fund’s investment strategies, holdings, and performance.
6
GOLDMAN SACHS VARIABLE INSURANCE TRUST CORE FIXED INCOME FUND
Performance Summary
December 31, 2020
The following graph shows the value, as of December 31, 2020, of a $10,000 investment made on January 1, 2011 in Service Shares at NAV. For comparative purposes, the performance of the Fund’s benchmark, the Bloomberg Barclays U.S. Aggregate Bond Index, is shown. Performance reflects applicable fee waivers and/or expense limitations in effect during the periods shown and in their absence, performance would be reduced. Returns do not reflect the deduction of taxes that a shareholder would pay on Fund distributions or the redemption of Fund shares. The returns set forth below represent past performance. Past performance does not guarantee future results. The Fund’s investment return and principal value will fluctuate so that an investor’s shares, when redeemed, may be worth more or less than their original cost. Current performance may be lower or higher than the performance quoted below. Please visit our web site at www.GSAMFUNDS.com to obtain the most recent month-end returns.
Core Fixed Income Fund’s 10 Year Performance
Performance of a $10,000 investment, with distributions reinvested, from January 1, 2011 through December 31, 2020.
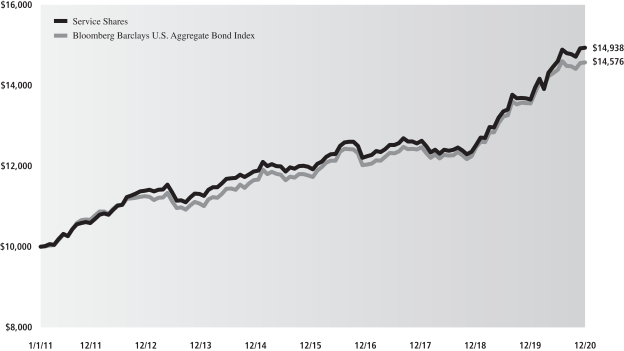
| | | | | | | | |
| Average Annual Total Return through December 31, 2020 | | One Year | | Five Years | | Ten Years | | Since Inception |
Institutional (Commenced April 30, 2013) | | 9.64% | | 4.87% | | N/A | | 3.68% |
Service | | 9.37% | | 4.60% | | 4.09% | | — |
7
GOLDMAN SACHS VARIABLE INSURANCE TRUST EQUITY INDEX FUND
INVESTMENT OBJECTIVE
The Fund seeks to achieve investment results that correspond to the aggregate price and yield performance of a benchmark index that measures the investment returns of large capitalization stocks.
Portfolio Management Discussion and Analysis
Below, SSgA Funds Management, Inc. (“SSgA”), the Fund’s Subadvisor, discusses the Goldman Sachs Variable Insurance Trust – Goldman Sachs Equity Index Fund’s (the “Fund”) performance and positioning for the 12-month period ended December 31, 2020 (the “Reporting Period”).
How did the Fund perform during the Reporting Period?
During the Reporting Period, the Fund’s Service Shares generated an average annual total return of 17.84%. This compares to the 18.34% average annual total return of the Fund’s benchmark, the Standard & Poor’s 500® Index (with dividends reinvested) (the “S&P 500® Index”), during the same time period.
During the Reporting Period, which sectors and which industries in the S&P 500® Index were the strongest contributors to the Fund’s performance?
Eight of the 11 sectors in the S&P 500® Index generated gains during the Reporting Period. In terms of total return, the sectors that made the strongest positive contributions to the S&P 500® Index and to the Fund were information technology, consumer discretionary and communication services. The largest sector by weighting in the S&P 500® Index at the end of the Reporting Period was information technology at a weighting of 27.59%. The industries with the strongest performance in terms of total return were technology hardware storage and peripherals; wireless telecommunication services; Internet and direct marketing retail; air freight and logistics; and metals and mining.
On the basis of impact (which takes both total returns and weightings into account), the strongest performing sectors were information technology, consumer discretionary and communication services. The strongest performing industries on the basis of impact were software; technology hardware storage and peripherals; Internet and direct marketing retail; semiconductors and semiconductor equipment; and interactive media and services.
Which sectors and industries in the S&P 500® Index were the weakest contributors to the Fund’s performance?
In terms of total return, during the Reporting Period, the weakest performing sectors were energy, financials and real estate. The industries with the weakest performance in terms of total return were diversified consumer services; energy equipment and services; oil, gas and consumable fuels; airlines; and aerospace and defense.
On the basis of impact, the sectors that made the weakest contributions to the S&P 500® Index and to the Fund were energy, financials and real estate. The industries with the weakest performance on the basis of impact were oil, gas and consumable fuels; banks; aerospace and defense; diversified telecommunication services; and equity real estate investment trusts.
Which individual stocks were the top detractors, and which were the greatest positive contributors?
On the basis of impact, the stocks that made the strongest contribution during the Reporting Period were Apple, Amazon.com, Microsoft, NVIDIA and Facebook. The weakest performers were Exxon Mobil, Wells Fargo & Co., AT&T, Boeing and JPMorgan Chase.
How did the Fund use derivatives and similar instruments during the Reporting Period?
During the Reporting Period, the Fund did not use derivatives as part of an active management strategy to add value to the Fund’s results. However, equity index futures were used to equitize the Fund’s cash holdings. In other words, we put the Fund’s cash holdings to work by using them as collateral for the purchase of equity index futures. We also used these equity index futures to provide liquidity for daily cash flow requirements. Equity index futures had a neutral impact on the Fund’s performance during the Reporting Period.
What changes were made to the makeup of the S&P 500® Index during the Reporting Period?
Twenty-one stocks were removed from the S&P 500® Index during the Reporting Period. Among them were E*TRADE Financial, H&R Block, Harley-Davidson, Kohl’s, Macy’s, Nordstrom and WellCare Health Plans. There were 21 stocks added to the S&P
8
GOLDMAN SACHS VARIABLE INSURANCE TRUST EQUITY INDEX FUND
500® Index during the Reporting Period, including Carrier Global, Domino’s Pizza, Etsy, Otis Worldwide, Paycom Software, Teradyne and Tesla.
The source of the data included in the above Portfolio Management Discussion and Analysis with respect to the Goldman Sachs Equity Index Fund is FactSet as of 12/31/2020.
Characteristics presented are calculated using the month end market value of holdings, except for beta and standard deviation, if shown, which use month end return values. Averages reflect the market weight of securities in the portfolio. Market data, prices, and dividend estimates for characteristics calculations provided by FactSet Research Systems, Inc. All other portfolio data provided by SSgA. Characteristics are as of the date indicated, are subject to change, and should not be relied upon as current thereafter.
Past performance is not a guarantee of future results.
Index returns are unmanaged and do not reflect the deduction of any fees or expenses. Index returns reflect all items of income, gain and loss and the reinvestment of dividends and other income.
SSgA may have or may seek investment management or other business relationships with companies discussed in this material or affiliates of those companies, such as their officers, directors and pension plans.
The views expressed in this material are the views of SSgA’s Global Equity Beta Solutions Team through the period ended December 31, 2020 and are subject to change based on market and other conditions. All information has been obtained from sources believed to be reliable, but its accuracy is not guaranteed. There is no representation or warranty as to the current accuracy, reliability or completeness of, nor liability for, decisions based on such information and it should not be relied on as such. This document contains certain statements that may be deemed forward-looking statements. Please note that any such statements are not guarantees of any future performance and actual results or developments may differ materially from those projected.
9
FUND BASICS
TOP TEN HOLDINGS AS OF 12/31/201
| | | | | | |
| | |
| Holding | | % of Net Assets | | | Line of Business |
| Apple, Inc. | | | 6.6% | | | Technology Hardware & Equipment |
| Microsoft Corp. | | | 5.3 | | | Software & Services |
| Amazon.com, Inc. | | | 4.4 | | | Retailing |
| Facebook, Inc. Class A | | | 2.1 | | | Media & Entertainment |
| Tesla, Inc. | | | 1.7 | | | Automobiles & Components |
| Alphabet, Inc. Class A | | | 1.7 | | | Media & Entertainment |
| Alphabet, Inc. Class C | | | 1.6 | | | Media & Entertainment |
| Berkshire Hathaway, Inc. Class B | | | 1.4 | | | Diversified Financials |
| Johnson & Johnson | | | 1.3 | | | Pharmaceuticals, Biotechnology & Life Sciences |
| JPMorgan Chase & Co. | | | 1.2 | | | Banks |
| 1 | The top 10 holdings may not be representative of the Fund’s future investments. |
FUND VS. BENCHMARK SECTOR ALLOCATIONS2
As of December 31, 2020
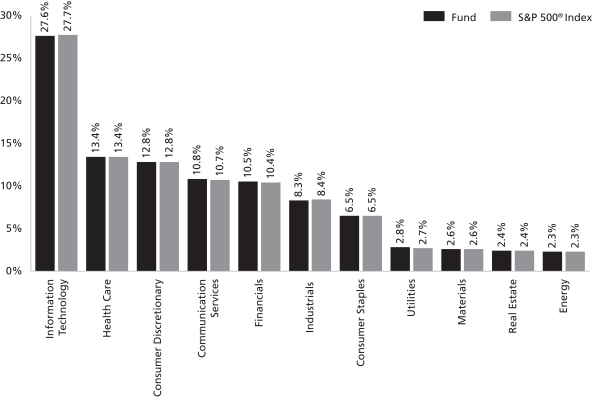
| 2 | The Fund is actively managed and, as such, its composition may differ over time. Consequently, the Fund’s overall sector allocations may differ from percentages contained in the graph above. The graph categorizes investments using Global Industry Classification Standard (“GICS”); however, the sector classifications used by the portfolio management team may differ from GICS. The percentage shown for each investment category reflects the value of investments in that category as a percentage of market value (excluding investments in the securities lending reinvestment vehicle, if any). Investments in the securities lending reinvestment vehicle represented 0.1% of the Fund’s net assets at December 31, 2020. The graph depicts the Fund’s investments but may not represent the Fund’s market exposure due to the exclusion of certain derivatives, if any, as listed in the Additional Investment Information section of the Schedule of Investments. |
For more information about your Fund, please refer to www.GSAMFUNDS.com. There, you can learn more about your Fund’s investment strategies, holdings, and performance.
10
GOLDMAN SACHS VARIABLE INSURANCE TRUST EQUITY INDEX FUND
Performance Summary
December 31, 2020
The following graph shows the value, as of December 31, 2020, of a $10,000 investment made in the Fund on January 1, 2011 at NAV. For comparative purposes, the performance of the Fund’s benchmark, the S&P 500 Index (with distributions reinvested), is shown. Performance reflects applicable fee waivers and/or expense limitations in effect during the periods shown and in their absence, performance would be reduced. Returns do not reflect the deduction of taxes that a shareholder would pay on Fund distributions or the redemption of Fund shares. The returns set forth below represent past performance. Past performance does not guarantee future results. The Fund’s investment return and principal value will fluctuate so that an investor’s shares, when redeemed, may be worth more or less than their original cost. Current performance may be lower or higher than the performance quoted below. Please visit our web site at www.GSAMFUNDS.com to obtain the most recent month-end returns.
Equity Index Fund’s 10 Year Performance
Performance of a $10,000 investment, with distributions reinvested, from January 1, 2011 through December 31, 2020.
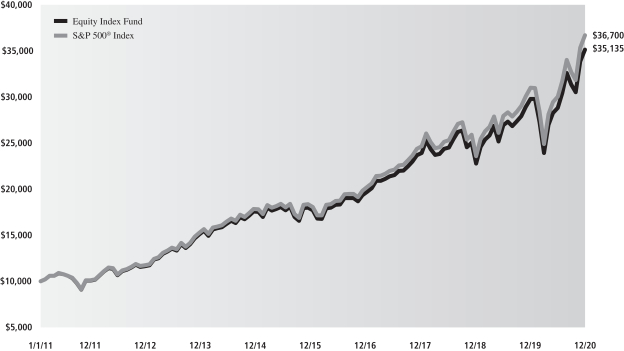
| | | | | | |
| Average Annual Total Return through December 31, 2020 | | One Year | | Five Years | | Ten Years |
Equity Index Fund | | 17.84% | | 14.66% | | 13.38% |
11
GOLDMAN SACHS VARIABLE INSURANCE TRUST GROWTH OPPORTUNITIES FUND
INVESTMENT OBJECTIVE
The Fund seeks long-term growth of capital.
Portfolio Management Discussion and Analysis
Below, the Goldman Sachs Growth Investment Team discusses the Goldman Sachs Variable Insurance Trust – Goldman Sachs Growth Opportunities Fund’s (the “Fund”) performance and positioning for the 12-month period ended December 31, 2020 (the “Reporting Period”).
How did the Fund perform during the Reporting Period?
During the Reporting Period, the Fund’s Institutional and Service Shares generated average annual total returns of 44.33% and 44.16%, respectively. These returns compare to the 35.47% average annual total return of the Fund’s benchmark, the Russell Midcap® Growth Index (with dividends reinvested) (the “Russell Index”), during the same time period.
What key factors were responsible for the Fund’s performance during the Reporting Period?
During the Reporting Period, the Fund generated positive absolute returns and outperformed the Russell Index. Both sector positioning and security selection added to relative returns.
Which equity market sectors helped and hurt Fund performance?
Our bottom-up approach focuses on security selection, and therefore, we do not make active sector-level investment decisions. The Fund’s sector positioning is a result of our stock selection. That said, on a sector level, stock selection in the information technology, consumer discretionary and financials sectors contributed most positively to relative performance. Stock selection in the health care, utilities and materials sectors detracted from relative returns during the Reporting Period.
Which individual stocks added to the Fund’s relative performance during the Reporting Period?
During the Reporting Period, the Fund was helped most relative to the Russell Index by its investments in DocuSign, Snap and HubSpot.
DocuSign was the Fund’s top relative performer during the Reporting Period. The cloud-based electronic signature solutions provider benefited from the shift to online business, with its revenues and billings growth both increasing. Furthermore, in May 2020, the company acquired Seal Software, a deal that should further operationalize DocuSign’s approach to record and contract management inside organizations, in our view. DocuSign’s shares continued to rally as demand for electronic signatures increased given that more people were working remotely because of the COVID-19 pandemic. With all the uncertainty surrounding COVID-19, investors favored perceived safe-haven software-as-a-service companies, such as DocuSign, that have sticky (i.e., loyal) customers and provide clear visibility on revenues. At the end of the Reporting Period, we continued to like the company as it is a beneficiary of the remote work environment, and we believed there may be a more permanent shift in the way people deal with documents. We also felt confident that DocuSign could continue to expand its customer base as more businesses go down the digitalization path, thereby increasing its recurring revenue.
Snap is a U.S. camera and social media company. Despite a volatile economic backdrop, the company experienced a quicker than consensus expected recovery in the second quarter of 2020 due to strong user and growth monetization. Additionally, the company’s improvements to its app infrastructure and its product innovation in recent years have supported growing user and advertiser bases, which should place Snap at a competitive advantage to its peers, in our view. The company may also have benefited from an increase in e-commerce holiday shopping during late 2020. At the end of the Reporting Period, we believed Snap would likely narrow its valuation gap relative to its peers through the increased monetization of its products. In our opinion, Snap had still not taken full advantage of its advertising opportunities and had a great runway for growth in the long term.
HubSpot, a cloud-based marketing and sales software platform, saw its share price appreciate during the second quarter of 2020 due to the online shift in demand for front office software, as business activity stabilized. Its stock continued to rally in the third calendar quarter based on the company’s development of a customer relationship management platform that couples an increasingly powerful enterprise back-end with an intuitive consumer-grade front-end. At the end of the Reporting Period, we remained positive about HubSpot’s large multi-year investment in user research and early signs of positive retention rates in new customers.
12
GOLDMAN SACHS VARIABLE INSURANCE TRUST GROWTH OPPORTUNITIES FUND
Which individual stocks detracted from the Fund’s performance during the Reporting Period?
Cheniere Energy, Envista Holdings and Akamai Technologies detracted most from the Fund’s relative returns during the Reporting Period.
Liquefied natural gas provider Cheniere Energy was the top detractor from the Fund’s relative performance during the Reporting Period. Its stock benefited from a solid first quarter 2020 earnings report at the end of April that demonstrated its better than consensus expected EBITDA (earnings before interest, taxes, depreciation and amortization) and solid execution in spite of weak liquefied natural gas spot prices. However, its shares came under pressure during the second quarter of 2020, largely because of a competitive natural gas market that led to short-term oversupply and a drop in natural gas prices to near a four-year low. Its company management expressed optimism about Cheniere Energy’s long-term positioning as demand recovers and indicated there was a longer-term opportunity in hydrogen, as the company’s assets could be leveraged in that supply chain. We viewed these comments positively. In our opinion, the company’s share price is likely to rebound from the lows it reached during the Reporting Period, and we anticipate opportunities driven by COVID-19 disruptions may arise in the near term.
Shares of manufacturer and marketer of dental products Envista Holdings declined in March 2020 after the company withdrew its full-year 2020 guidance due to uncertainty about the business impact of COVID-19. In addition, Envista Holdings’ first calendar quarter revenues were hurt by discontinued products as well as by low demand due to the global pandemic. Its stock’s performance improved following the announcement of second calendar quarter earnings, which increased as dental offices began to reopen. Its shares continued to appreciate in the third quarter amid several new product launches, an improved cost structure and the company’s exit from non-strategic businesses. Despite the ongoing uncertainty surrounding COVID-19, we remained positive at the end of the Reporting Period about Envista Holding’s ability to grow in a resilient dental market.
Akamai Technologies, a global content delivery network, cybersecurity and cloud service company, was hurt by the broad market downturn in February and March 2020 but regained some ground during the second half of 2020, benefiting from trends in health-related content delivery network traffic and a growing focus on cybersecurity. Although the company issued conservative fourth calendar quarter guidance, we believe its management team may have discounted the typical year-end seasonal growth in e-commerce, the impact of new gaming titles and the continued evolution and growth opportunities in cybersecurity. Going forward, Akamai Technologies’ vast network is likely to allow for faster content access for users, in our view. Additionally, we believe the company’s large scale can lead to lower costs and improved profitability, which along with proprietary services in edge computing and cybersecurity, may give Akamai Technologies a competitive advantage over its peers. (Edge computing brings computation and data storage closer to the location where it is needed to improve response times and save bandwidth.)
Did the Fund make any significant purchases or sales during the Reporting Period?
Among the positions established by the Fund during the Reporting Period was an investment in RingCentral, which provides global enterprise cloud communications and collaboration solutions. In our view, the company has solid opportunities to increase its base of large customers and to expand the number of services those customers buy. We believe RingCentral’s exclusive partnerships with service vendors and distributors should help it maintain and accelerate revenues in the near term.
We initiated a Fund position in DocuSign, mentioned earlier, during the Reporting Period. The company provides cloud-based electronic signature solutions that help companies and individuals securely collect information, automate data workflows and sign anything. We are confident that DocuSign is strongly positioned to capture the trend of paperless documentation as a market leader in that space. Furthermore, we consider its management team well suited to grow the business given its plan to focus more on transaction management.
Conversely, during the Reporting Period, we exited the Fund’s position in Teleflex, which produces single-use medical devices used by hospitals and health care providers. As most of its medical devices are used in elective surgeries and many of these surgeries have been postponed due to COVID-19, we decided to eliminate the Fund’s position in its stock and reallocate the capital to what we considered more attractive opportunities.
We sold the Fund’s investment in discount retailer Dollar General during the Reporting Period. Given the company’s strong historical performance during recessions and its defensive product mix, we believed it was well positioned to continue benefiting from ongoing economic uncertainty. However, we noted that it experienced a decline in store traffic due to increased competition, including from Family Dollar and Walmart. As a result, we decided to exit the Fund’s position in the stock.
Were there any notable changes in the Fund’s weightings during the Reporting Period?
Changes to the Fund’s sector weightings relative to the Russell Index are due to our stock selection. As a result of these decisions during the Reporting Period, the Fund moved from an overweight in the health care sector to a rather neutral position versus the
13
GOLDMAN SACHS VARIABLE INSURANCE TRUST GROWTH OPPORTUNITIES FUND
Russell Index. In addition, it shifted from a rather neutral position relative to the Russell Index in the consumer discretionary sector to an overweight position and from an underweight position in the financials sector to a rather neutral position.
How did the Fund use derivatives and similar instruments during the Reporting Period?
The Fund did not use derivatives or similar instruments within its investment process during the Reporting Period.
How was the Fund positioned relative to the Russell Index at the end of the Reporting Period?
As mentioned, the Fund’s sector positioning relative to the Russell Index is the result of our stock selection, as we take a pure bottom-up, research-intensive approach to investing. From that perspective, then, at the end of the Reporting Period, the Fund’s portfolio was broadly diversified with overweight positions compared to the Russell Index in the industrials, consumer discretionary, materials and energy sectors. The Fund had smaller weightings than the Russell Index in the information technology and communication services sectors. At the end of the Reporting Period, the Fund was relatively neutral compared to the Russell Index in the health care, consumer staples, real estate and financials sectors and had no exposure to the utilities sector.
14
FUND BASICS
TOP TEN HOLDINGS AS OF 12/31/201
| | | | | | |
| | |
| Holding | | % of Net Assets | | | Line of Business |
| RingCentral, Inc. Class A | | | 2.4% | | | Software & Services |
| Veeva Systems, Inc. Class A | | | 2.3 | | | Health Care Equipment & Services |
| Palo Alto Networks, Inc. | | | 2.3 | | | Software & Services |
| Cadence Design Systems, Inc. | | | 2.2 | | | Software & Services |
| Verisk Analytics, Inc. | | | 2.2 | | | Commercial & Professional Services |
| Match Group, Inc. | | | 2.1 | | | Media & Entertainment |
| Amphenol Corp. Class A | | | 2.0 | | | Technology Hardware & Equipment |
| HubSpot, Inc. | | | 2.0 | | | Software & Services |
| Ball Corp. | | | 1.9 | | | Materials |
| Lululemon Athletica, Inc. | | | 1.9 | | | Consumer Durables & Apparel |
| 1 | The top 10 holdings may not be representative of the Fund’s future investments. |
FUND VS. BENCHMARK SECTOR ALLOCATIONS2
As of December 31, 2020
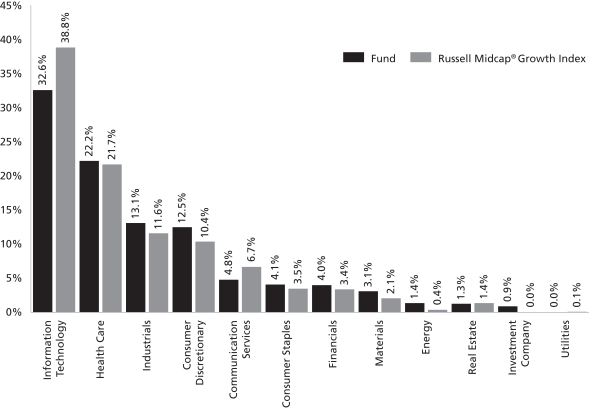
| 2 | The Fund is actively managed and, as such, its composition may differ over time. Consequently, the Fund’s overall sector allocations may differ from percentages contained in the graph above. The graph categorizes investments using Global Industry Classification Standard (“GICS”); however, the sector classifications used by the portfolio management team may differ from GICS. The percentage shown for each investment category reflects the value of investments in that category as a percentage of market value (excluding investments in the securities lending reinvestment vehicle, if any). Underlying sector allocations of exchange traded funds and investment companies held by the Fund are not reflected in the graph above. Investments in the securities lending reinvestment vehicle represented 1.7% of the Fund’s net assets at December 31, 2020. |
For more information about your Fund, please refer to www.GSAMFUNDS.com. There, you can learn more about your Fund’s investment strategies, holdings, and performance.
15
GOLDMAN SACHS VARIABLE INSURANCE TRUST GROWTH OPPORTUNITIES FUND
Performance Summary
December 31, 2020
The following graph shows the value, as of December 31, 2020, of a $10,000 investment made on January 1, 2011 in Service Shares at NAV. For comparative purposes, the performance of the Fund’s benchmark, the Russell Midcap Growth Index (with distributions reinvested), is shown. Performance reflects applicable fee waivers and/or expense limitations in effect during the periods shown and in their absence, performance would be reduced. Returns do not reflect the deduction of taxes that a shareholder would pay on Fund distributions or the redemption of Fund shares. The returns set forth below represent past performance. Past performance does not guarantee future results. The Fund’s investment return and principal value will fluctuate so that an investor’s shares, when redeemed, may be worth more or less than their original cost. Current performance may be lower or higher than the performance quoted below. Please visit our web site at www.GSAMFUNDS.com to obtain the most recent month-end returns.
Growth Opportunities Fund’s 10 Year Performance
Performance of a $10,000 investment, with distributions reinvested, from January 1, 2011 through December 31, 2020.
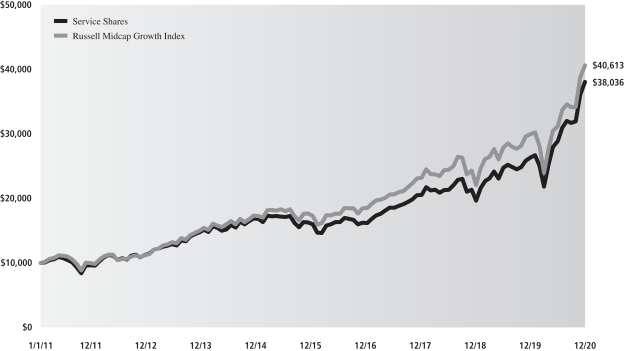
| | | | | | | | |
| Average Annual Total Return through December 31, 2020 | | One Year | | Five Years | | Ten Years | | Since Inception |
Institutional (Commenced April 30, 2013) | | 44.33% | | 19.17% | | N/A | | 15.58% |
Service | | 44.16% | | 18.93% | | 14.28% | | — |
16
GOLDMAN SACHS VARIABLE INSURANCE TRUST HIGH QUALITY FLOATING RATE FUND
Portfolio Management Discussion and Analysis
Below, the Goldman Sachs Fixed Income Portfolio Management Team discusses the Goldman Sachs High Quality Floating Rate Fund’s (the “Fund”) performance and positioning for the 12-month period ended December 31, 2020 (the “Reporting Period”).
How did the Fund perform during the Reporting Period?
During the Reporting Period, the Fund’s Institutional, Service and Advisor Shares generated average annual total returns of 0.86%, 0.58% and 0.38%, respectively. These returns compare to the 0.67% average annual total return of the Fund’s benchmark, the ICE BofAML Three-Month U.S. Treasury Bill Index (the “ICE BofAML Index”), during the Reporting Period.
We note that the Fund’s benchmark being the ICE BofAML Index is a means of emphasizing that the Fund has an unconstrained strategy. That said, this Fund employs a benchmark agnostic strategy and thus comparisons to a benchmark index are not particularly relevant.
What key factors had the greatest impact on the Fund’s performance during the Reporting Period?
During the Reporting Period, our top-down cross-sector strategy contributed positively to the Fund’s relative performance. In our cross-sector strategy, we invest Fund assets based on a discipline of valuing each fixed income sector in the context of all investment opportunities within the Fund’s universe. Individual issue selection also added to relative returns.
The Fund’s combined tactical duration and yield curve positioning detracted from results. (Duration is a measure of the Fund’s sensitivity to changes in interest rates. Yield curve is a spectrum of interest rates based on maturities of varying lengths.)
Which fixed income market sectors helped or hurt Fund performance during the Reporting Period?
The Fund benefited from our cross-sector strategy, specifically its exposure to collateralized loan obligations (“CLOs”) and asset backed securities (“ABS”). Exposure to the government/swaps sector also added to relative returns.
Individual issue selection contributed positively to the Fund’s relative performance during the Reporting Period. Within the securitized sector, selection of mortgage-backed securities bolstered results. This was offset somewhat by individual issue selection of ABS and CLOs, which detracted from returns. Within the government/swaps sector, individual issue selection of U.S. government securities and U.S. agency securities aided relative performance during the Reporting Period.
Did the Fund’s duration and yield curve positioning strategy help or hurt its results during the Reporting Period?
During the Reporting Period, the Fund’s combined tactical duration and yield curve positioning detracted from relative returns. The Fund was hurt most by its smaller exposure than that of the ICE BofAML Index to the three-month segment of the U.S. Treasury yield curve. Detracting further from performance was the Fund’s comparatively smaller exposure to the five-year, seven-year and 30-year segments of the U.S. Treasury yield curve. The Fund benefited overall from its exposure to the other segments of the U.S. Treasury yield curve during the Reporting Period.
Were there any notable changes in the Fund’s weightings during the Reporting Period?
During the Reporting Period, we decreased the Fund’s allocations to ABS and residential mortgage-backed securities. We increased its allocation to cash and to U.S. government securities. In addition, we transitioned the Fund from its position in very short maturities at the beginning of the Reporting Period to a more even distribution along the U.S. Treasury yield curve following the emergence of COVID-19 and in response to record low interest rates.
How did the Fund use derivatives and similar instruments during the Reporting Period?
As market conditions warranted, the Fund used U.S. Treasury futures, Secured Overnight Financing Rate (“SOFR”) futures and Fed Funds futures to hedge interest rate exposure and to facilitate duration management. During the Reporting Period, the use of futures overall had a negative impact on performance. The Fund also employed fixed and floating interest rate swaps, as well as basis rate swaps, to manage interest risk, which collectively had a modestly negative impact on performance during the Reporting Period.
17
INVESTMENT OBJECTIVE
The Fund seeks to provide a high level of current income, consistent with low volatility of principal.
GOLDMAN SACHS VARIABLE INSURANCE TRUST HIGH QUALITY FLOATING RATE FUND
How was the Fund positioned relative to the ICE BofAML Index at the end of the Reporting Period?
At the end of the Reporting Period, the Fund had only a modest allocation to U.S. government securities, which comprise 100% of the ICE BofAML Index. The Fund had positions in ABS, residential mortgage-backed securities, agency collateralized mortgage obligations, agency mortgage-backed securities and mortgage pass-through securities, none of which are represented in the ICE BofAML Index. (Pass-through mortgage securities consist of a pool of residential mortgage loans in which homeowners’ monthly payments of principal, interest and prepayments pass from the mortgage servicer through a government agency or investment bank to investors.) In addition, the Fund had an allocation to cash at the end of the Reporting Period.
18
FUND BASICS
FUND COMPOSITION1
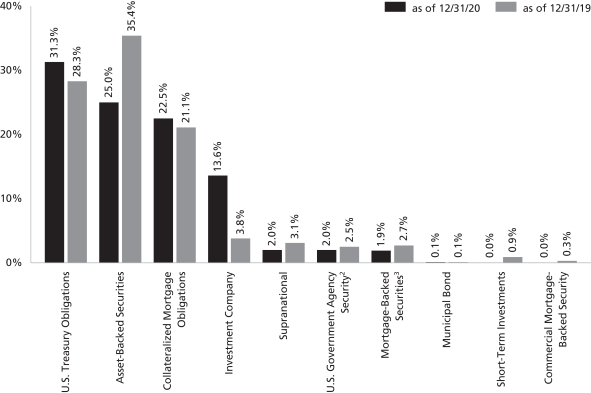
| 1 | The percentage shown for each investment category reflects the value of investments in that category as a percentage of net assets. Figures in the above graph may not sum to 100% due to the exclusion of other assets and liabilities. Short-Term Investments represent investments in commercial paper. Underlying sector allocations of investment companies held by the Fund are not reflected in the graph above. The graph depicts the Fund’s investments but may not represent the Fund’s market exposure due to the exclusion of certain derivatives, if any, as listed in the Additional Investment Information section of the Schedule of Investments. |
| 2 | “U.S. Government Agency Security” include agency securities offered by companies such as Federal Farm Credit Bank (“FFCB”) and the Federal National Mortgage Association (“FNMA”) which operate under a government charter. While they are required to report to a government regulator, their assets are not explicitly guaranteed by the government and they otherwise operate like any other publicly traded company. |
| 3 | Mortgage-backed securities guaranteed by the Government National Mortgage Association (“GNMA”), the Federal National Mortgage Association (“FNMA”) or the Federal Home Loan Mortgage Corp. (“FHLMC”). GNMA instruments are backed by the full faith and credit of the United States Government. |
For more information about your Fund, please refer to www.GSAMFUNDS.com. There, you can learn more about your Fund’s investment strategies, holdings, and performance.
19
GOLDMAN SACHS VARIABLE INSURANCE TRUST HIGH QUALITY FLOATING RATE FUND
Performance Summary
December 31, 2020
The following graph shows the value, as of December 31, 2020, of a $10,000 investment made on January 1, 2011 in Service Shares at NAV. For comparative purposes, the performance of the Fund’s benchmark, the ICE BofAML® Three-Month U.S. Treasury Bill Index, is shown. Performance reflects applicable fee waivers and/or expense limitations in effect during the periods shown and in their absence, performance would be reduced. Returns do not reflect the deduction of taxes that a shareholder would pay on Fund distributions or the redemption of Fund shares. The returns set forth below represent past performance. Past performance does not guarantee future results. The Fund’s investment return and principal value will fluctuate so that an investor’s shares, when redeemed, may be worth more or less than their original cost. Current performance may be lower or higher than the performance quoted below. Please visit our web site at www.GSAMFUNDS.com to obtain the most recent month-end returns.
High Quality Floating Rate Fund’s 10 Year Performance
Performance of a $10,000 investment, with distributions reinvested, from January 1, 2011 through December 31, 2020.
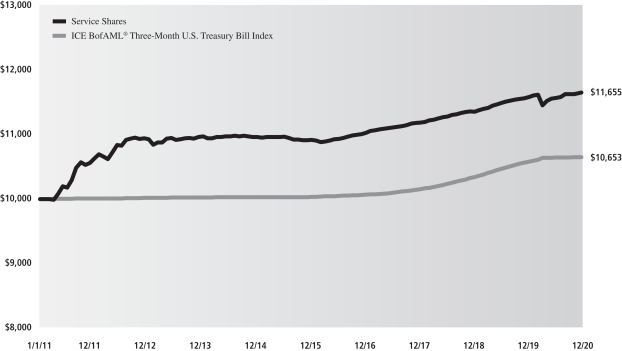
| | | | | | | | |
| Average Annual Total Return through December 31, 2020 | | One Year | | Five Years | | Ten Years | | Since Inception |
Institutional (Commenced April 30, 2013) | | 0.86% | | 1.57% | | N/A | | 1.09% |
Service | | 0.58% | | 1.31% | | 1.54% | | — |
Advisor (Commenced October 15, 2014) | | 0.38% | | 1.16% | | N/A | | 0.83% |
20
GOLDMAN SACHS VARIABLE INSURANCE TRUST FUNDS
Index Definitions
Bloomberg Barclays U.S. Aggregate Bond Index represents an unmanaged diversified portfolio of fixed income securities, including U.S. Treasuries, investment-grade corporate bonds and mortgage-backed and asset-backed securities.
ICE BofAML Three-Month U.S. Treasury Bill Index measures total return on cash, including price and interest income, based on short-term government Treasury Bills of about 90-day maturity, as reported by Bank of America Merrill Lynch.
Russell Midcap® Growth Index is an unmanaged index that measures the performance of those companies in the Russell Midcap® Index with higher price-to-book ratios and higher forecasted growth values.
Russell Midcap® Index measures the performance of the mid-cap segment of the U.S. equity universe. The Russell Midcap® Index is a subset of the Russell 1000® Index. The Russell Midcap® Index includes approximately 800 of the smallest securities based on a combination of their market cap and current index membership. The Russell Midcap® Index represents approximately 31% of the total market capitalization of the Russell 1000® Index companies. The Russell Midcap® Index is constructed to provide a comprehensive and unbiased barometer for the mid-cap segment. The Russell Midcap® Index is completely reconstituted annually to ensure larger stocks do not distort the performance and characteristics of the true mid-cap opportunity set.
Russell 1000® Index measures the performance of the large-cap segment of the U.S. equity universe. The Russell 1000® Index is a subset of the Russell 3000® Index and includes approximately 1000 of the largest securities based on a combination of their market cap and current index membership. The Russell 1000® Index represents approximately 92% of the U.S. market. The Russell 1000® Index is constructed to provide a comprehensive and unbiased barometer for the large-cap segment and is completely reconstituted annually to ensure new and growing equities are reflected.
Russell 2000® Index measures the performance of the small-cap segment of the U.S. equity universe. The Russell 2000® Index is a subset of the Russell 3000® Index representing approximately 10% of the total market capitalization of that index. The Russell 2000® Index includes approximately 2000 of the smallest securities based on a combination of their market cap and current index membership. The Russell 2000® Index is constructed to provide a comprehensive and unbiased small-cap barometer and is completely reconstituted annually to ensure larger stocks do not distort the performance and characteristics of the true small-cap opportunity set.
S&P 500® Index is a U.S. stock market index based on the market capitalizations of 500 large companies having common stock listed on the New York Stock Exchange or NASDAQ. The S&P 500® Index components and their weightings are determined by S&P Dow Jones Indices.
It is not possible to invest directly in an unmanaged index.
21
GOLDMAN SACHS VARIABLE INSURANCE TRUST CORE FIXED INCOME FUND
Schedule of Investments
December 31, 2020
| | | | | | | | | | | | |
Principal
Amount | | | Interest
Rate | | Maturity
Date | | | Value | |
|
| Corporate Bonds – 40.3% | |
| Automobiles & Components(a) – 0.1% | |
| | General Motors Co. | |
| $ | 50,000 | | | 5.400% | | | 10/02/2023 | | | $ | 56,158 | |
| | 25,000 | | | 4.000 | | | 04/01/2025 | | | | 27,713 | |
| | | | | | | | | | | | |
| | | | | | | | | | | 83,871 | |
| | |
| Banks – 10.2% | |
| | Ally Financial, Inc.(a) | |
| | 25,000 | | | 1.450 | | | 10/02/2023 | | | | 25,516 | |
| | American Express Co.(a) | |
| | 20,000 | | | 2.500 | | | 07/30/2024 | | | | 21,373 | |
| | 25,000 | | | 3.625 | | | 12/05/2024 | | | | 27,786 | |
| | American Express Co. Series C(a)(b) | |
| | 40,000 | | | (3 Mo. LIBOR + 3.29%),
3.502 | | | 03/15/2021 | | | | 39,350 | |
| | Avolon Holdings Funding Ltd.(a)(c) | |
| | 100,000 | | | 2.875 | | | 02/15/2025 | | | | 101,791 | |
| | 25,000 | | | 4.250 | | | 04/15/2026 | | | | 27,013 | |
| | Banco Santander SA | |
| | 200,000 | | | 2.746 | | | 05/28/2025 | | | | 213,780 | |
| | Bank of America Corp. | |
| | 75,000 | | | 4.125 | | | 01/22/2024 | | | | 83,254 | |
| | 65,000 | | | 4.200 | | | 08/26/2024 | | | | 72,769 | |
| | 45,000 | | | 3.248(a) | | | 10/21/2027 | | | | 50,369 | |
| | 75,000 | | | (3 Mo. LIBOR + 1.58%),
3.824(a)(b) | | | 01/20/2028 | | | | 86,093 | |
| | 25,000 | | | (3 Mo. LIBOR + 1.37%),
3.593(a)(b) | | | 07/21/2028 | | | | 28,406 | |
| | 85,000 | | | (3 Mo. LIBOR + 1.04%),
3.419(a)(b) | | | 12/20/2028 | | | | 95,975 | |
| | 50,000 | | | (3 Mo. LIBOR + 1.31%),
4.271(a)(b) | | | 07/23/2029 | | | | 59,472 | |
| | 50,000 | | | (3 Mo. LIBOR + 1.19%),
2.884(a)(b) | | | 10/22/2030 | | | | 54,688 | |
| | 425,000 | | | (SOFR + 2.15%),
2.592(a)(b) | | | 04/29/2031 | | | | 455,373 | |
| | 50,000 | | | (SOFR + 1.53%),
1.898(a)(b) | | | 07/23/2031 | | | | 50,570 | |
| | Bank of America Corp. Series L(a) | |
| | 25,000 | | | 4.183 | | | 11/25/2027 | | | | 29,008 | |
| | Barclays plc(a)(b) | |
| | 200,000 | | | (3 Mo. LIBOR + 2.45%),
2.852 | | | 05/07/2026 | | | | 214,806 | |
| | BNP Paribas SA(c) | |
| | 200,000 | | | 3.375 | | | 01/09/2025 | | | | 218,985 | |
| | Capital One Financial Corp. | |
| | 25,000 | | | 3.500 | | | 06/15/2023 | | | | 26,805 | |
| | 45,000 | | | 3.300(a) | | | 10/30/2024 | | | | 49,451 | |
| | Citigroup, Inc. | |
| | 220,000 | | | 3.400 | | | 05/01/2026 | | | | 248,200 | |
| | 150,000 | | | 4.450 | | | 09/29/2027 | | | | 177,056 | |
| | 25,000 | | | 4.125 | | | 07/25/2028 | | | | 29,219 | |
| | 75,000 | | | (SOFR + 1.42%),
2.976(a)(b) | | | 11/05/2030 | | | | 82,548 | |
| | |
|
| Corporate Bonds – (continued) | |
| Banks – (continued) | |
| | Citigroup, Inc. – (continued) | |
| 50,000 | | | (SOFR + 3.91%),
4.412%(a)(b) | | | 03/31/2031 | | | | 60,613 | |
| | Credit Suisse Group AG | |
| | 250,000 | | | 4.550 | | | 04/17/2026 | | | | 294,164 | |
| | Deutsche Bank AG(a)(b) | |
| | 150,000 | | | (SOFR + 2.16%),
2.222 | | | 09/18/2024 | | | | 154,223 | |
| | Discover Financial Services(a) | |
| | 75,000 | | | 3.750 | | | 03/04/2025 | | | | 82,590 | |
| | Fifth Third Bancorp(a) | |
| | 30,000 | | | 2.375 | | | 01/28/2025 | | | | 31,911 | |
| | Gazprom PJSC | |
| | 240,000 | | | 4.950 | | | 03/23/2027 | | | | 271,875 | |
| | GE Capital International Funding Co. Unlimited Co.(a) | |
| | 200,000 | | | 3.373 | | | 11/15/2025 | | | | 222,337 | |
| | General Motors Financial Co., Inc.(a) | |
| | 25,000 | | | 4.300 | | | 07/13/2025 | | | | 28,033 | |
| | HSBC Holdings plc(a)(b) | |
| | 200,000 | | | (SOFR + 1.54%),
1.645 | | | 04/18/2026 | | | | 204,662 | |
| | Huntington Bancshares, Inc.(a) | |
| | 50,000 | | | 4.000 | | | 05/15/2025 | | | | 56,618 | |
| | ING Groep NV(a)(b)(c) | |
| (US Treasury Yield Curve Rate T-Note
Constant Maturity 1 Yr. + 1.10%), |
|
| | 200,000 | | | 1.400 | | | 07/01/2026 | | | | 203,141 | |
| | Intercontinental Exchange, Inc.(a) | |
| | 50,000 | | | 3.000 | | | 06/15/2050 | | | | 52,876 | |
| | JPMorgan Chase & Co.(a) | |
| | 25,000 | | | (3 Mo. LIBOR + 0.73%),
3.559(b) | | | 04/23/2024 | | | | 26,771 | |
| | 25,000 | | | (3 Mo. LIBOR + 0.89%),
3.797(b) | | | 07/23/2024 | | | | 27,077 | |
| | 50,000 | | | (3 Mo. LIBOR + 1.00%),
4.023(b) | | | 12/05/2024 | | | | 55,107 | |
| | 125,000 | | | (SOFR + 1.16%),
2.301(b) | | | 10/15/2025 | | | | 132,696 | |
| | 100,000 | | | (3 Mo. LIBOR + 1.25%),
3.960(b) | | | 01/29/2027 | | | | 114,948 | |
| | 15,000 | | | 3.625 | | | 12/01/2027 | | | | 17,042 | |
| | 75,000 | | | (3 Mo. LIBOR + 1.34%),
3.782(b) | | | 02/01/2028 | | | | 86,137 | |
| | 45,000 | | | (3 Mo. LIBOR + 0.95%),
3.509(b) | | | 01/23/2029 | | | | 51,392 | |
| | 25,000 | | | (SOFR + 3.79%),
4.493(b) | | | 03/24/2031 | | | | 30,813 | |
| | 175,000 | | | (SOFR + 2.04%),
2.522(b) | | | 04/22/2031 | | | | 187,702 | |
| | 25,000 | | | (SOFR + 2.52%),
2.956(b) | | | 05/13/2031 | | | | 27,363 | |
| | JPMorgan Chase & Co. Series HH(a)(b) | |
| | 100,000 | | | (SOFR + 3.13%),
4.600 | | | 02/01/2025 | | | | 103,148 | |
| | |
| | |
| 22 | | The accompanying notes are an integral part of these financial statements. |
GOLDMAN SACHS VARIABLE INSURANCE TRUST CORE FIXED INCOME FUND
| | | | | | | | | | | | |
Principal
Amount | | | Interest
Rate | | Maturity
Date | | | Value | |
|
| Corporate Bonds – (continued) | |
| Banks – (continued) | |
| | JPMorgan Chase & Co. Series Z(a)(b) | |
| $ | 85,000 | | | (3 Mo. LIBOR + 3.80%),
4.014% | | | 02/01/2021 | | | $ | 84,958 | |
| | Morgan Stanley | |
| | 50,000 | | | (3 Mo. LIBOR + 1.40%),
1.615 (a)(b) | | | 10/24/2023 | | | | 50,933 | |
| | 25,000 | | | (3 Mo. LIBOR + 0.85%),
3.737(a)(b) | | | 04/24/2024 | | | | 26,895 | |
| | 225,000 | | | 3.700(a) | | | 10/23/2024 | | | | 250,491 | |
| | 75,000 | | | (SOFR + 1.15%),
2.720(a)(b) | | | 07/22/2025 | | | | 80,225 | |
| | 25,000 | | | 3.625(a) | | | 01/20/2027 | | | | 28,675 | |
| | 50,000 | | | 3.950 | | | 04/23/2027 | | | | 57,811 | |
| | 100,000 | | | (3 Mo. LIBOR + 1.63%),
4.431(a)(b) | | | 01/23/2030 | | | | 121,850 | |
| | 300,000 | | | (SOFR + 1.14%),
2.699(a)(b) | | | 01/22/2031 | | | | 326,249 | |
| | 50,000 | | | (SOFR + 3.12%),
3.622(a)(b) | | | 04/01/2031 | | | | 58,072 | |
| | 75,000 | | | (SOFR + 1.03%),
1.794(a)(b) | | | 02/13/2032 | | | | 75,434 | |
| | Morgan Stanley Series F(a) | |
| | 25,000 | | | 3.875 | | | 04/29/2024 | | | | 27,666 | |
| | Natwest Group plc | |
| | 200,000 | | | 3.875 | | | 09/12/2023 | | | | 216,885 | |
| | Nuveen LLC(a)(c) | |
| | 25,000 | | | 4.000 | | | 11/01/2028 | | | | 29,840 | |
| | Raymond James Financial, Inc.(a) | |
| | 25,000 | | | 4.650 | | | 04/01/2030 | | | | 30,684 | |
| | Santander UK plc | |
| | 200,000 | | | 2.875 | | | 06/18/2024 | | | | 214,158 | |
| | Standard Chartered plc(a)(b)(c) | |
| | 200,000 | | | (3 Mo. LIBOR + 1.15%),
4.247 | | | 01/20/2023 | | | | 207,289 | |
| | Wells Fargo & Co. | |
| | 25,000 | | | 3.750(a) | | | 01/24/2024 | | | | 27,290 | |
| | 175,000 | | | 3.000 | | | 10/23/2026 | | | | 193,871 | |
| | 50,000 | | | 4.300 | | | 07/22/2027 | | | | 58,648 | |
| | 25,000 | | | (3 Mo. LIBOR + 4.24%),
5.013(a)(b) | | | 04/04/2051 | | | | 35,470 | |
| | Westpac Banking Corp.(a)(b) | |
| | 25,000 | | | (5 Yr. Swap Rate + 2.24%),
4.322 | | | 11/23/2031 | | | | 28,520 | |
| | 25,000 | | | (US Treasury Yield Curve
Rate T-Note Constant
Maturity 5 Yr. + 2.00%),4.110 | | | 07/24/2034 | | | | 28,389 | |
| | | | | | | | | | | | |
| | | | | | | | | | | 7,353,198 | |
| | |
| Capital Goods(a) – 2.5% | |
| | Air Lease Corp. | |
| | 75,000 | | | 2.300 | | | 02/01/2025 | | | | 77,625 | |
| | 75,000 | | | 3.375 | | | 07/01/2025 | | | | 81,020 | |
| | 75,000 | | | 2.875 | | | 01/15/2026 | | | | 79,334 | |
| | 75,000 | | | 3.750 | | | 06/01/2026 | | | | 82,720 | |
| | |
|
| Corporate Bonds – (continued) | |
| Capital Goods(a) – (continued) | |
| | Boeing Co. (The) | |
| 50,000 | | | 3.450 | | | 11/01/2028 | | | | 53,749 | |
| | 25,000 | | | 5.150 | | | 05/01/2030 | | | | 30,262 | |
| | 25,000 | | | 3.250 | | | 02/01/2035 | | | | 25,522 | |
| | 100,000 | | | 5.805 | | | 05/01/2050 | | | | 137,542 | |
| | Carrier Global Corp. | |
| | 150,000 | | | 2.493 | | | 02/15/2027 | | | | 161,771 | |
| | 200,000 | | | 2.722 | | | 02/15/2030 | | | | 213,707 | |
| | General Electric Co. | |
| | 25,000 | | | 3.450 | | | 05/01/2027 | | | | 28,197 | |
| | 25,000 | | | 3.625 | | | 05/01/2030 | | | | 28,485 | |
| | 25,000 | | | 4.250 | | | 05/01/2040 | | | | 29,489 | |
| | 50,000 | | | 4.350 | | | 05/01/2050 | | | | 60,421 | |
| | Northrop Grumman Corp. | |
| | 50,000 | | | 2.930 | | | 01/15/2025 | | | | 54,394 | |
| | 75,000 | | | 3.250 | | | 01/15/2028 | | | | 84,843 | |
| | 25,000 | | | 4.750 | | | 06/01/2043 | | | | 33,426 | |
| | 50,000 | | | 5.250 | | | 05/01/2050 | | | | 74,141 | |
| | Otis Worldwide Corp. | |
| | 25,000 | | | 2.293 | | | 04/05/2027 | | | | 26,726 | |
| | 150,000 | | | 2.565 | | | 02/15/2030 | | | | 160,968 | |
| | Raytheon Technologies Corp. | |
| | 50,000 | | | 3.950 | | | 08/16/2025 | | | | 57,347 | |
| | 50,000 | | | 4.125 | | | 11/16/2028 | | | | 59,595 | |
| | 25,000 | | | 4.050 | | | 05/04/2047 | | | | 31,087 | |
| | Roper Technologies, Inc. | |
| | 50,000 | | | 4.200 | | | 09/15/2028 | | | | 59,662 | |
| | Stanley Black & Decker, Inc. | |
| | 50,000 | | | 4.250 | | | 11/15/2028 | | | | 60,721 | |
| | | | | | | | | | | | |
| | | | | | | | | | | 1,792,754 | |
| | |
| Commercial & Professional Services(a) – 0.7% | |
| | CoStar Group, Inc. (c) | |
| | 100,000 | | | 2.800 | | | 07/15/2030 | | | | 103,784 | |
| | IHS Markit Ltd. | |
| | 75,000 | | | 3.625 | | | 05/01/2024 | | | | 81,750 | |
| | 75,000 | | | 4.250 | | | 05/01/2029 | | | | 90,281 | |
| | Republic Services, Inc. | |
| | 75,000 | | | 2.500 | | | 08/15/2024 | | | | 80,028 | |
| | 100,000 | | | 1.750 | | | 02/15/2032 | | | | 100,218 | |
| | Waste Management, Inc. | |
| | 50,000 | | | 1.150 | | | 03/15/2028 | | | | 49,980 | |
| | | | | | | | | | | | |
| | | | | | | | | | | 506,041 | |
| | |
| Consumer Services(a) – 0.2% | |
| | McDonald’s Corp. | |
| | 25,000 | | | 4.200 | | | 04/01/2050 | | | | 32,010 | |
| | Starbucks Corp. | |
| | 75,000 | | | 3.800 | | | 08/15/2025 | | | | 85,318 | |
| | | | | | | | | | | | |
| | | | | | | | | | | 117,328 | |
| | |
| Electric – 2.4% | |
| | Alliant Energy Finance LLC(a)(c) | |
| | 25,000 | | | 3.750 | | | 06/15/2023 | | | | 26,796 | |
| | |
| | |
| The accompanying notes are an integral part of these financial statements. | | 23 |
GOLDMAN SACHS VARIABLE INSURANCE TRUST CORE FIXED INCOME FUND
Schedule of Investments (continued)
December 31, 2020
| | | | | | | | | | | | |
Principal
Amount | | | Interest
Rate | | Maturity
Date | | | Value | |
|
| Corporate Bonds – (continued) | |
| Electric – (continued) | |
| | American Electric Power Co., Inc.(a) | |
| $ | 50,000 | | | 2.300 % | | | 03/01/2030 | | | $ | 52,168 | |
| | Arizona Public Service Co.(a) | |
| | 45,000 | | | 2.950 | | | 09/15/2027 | | | | 49,526 | |
| | Avangrid, Inc.(a) | |
| | 25,000 | | | 3.200 | | | 04/15/2025 | | | | 27,391 | |
| | Berkshire Hathaway Energy Co.(a) | |
| | 25,000 | | | 3.250 | | | 04/15/2028 | | | | 28,492 | |
| | 50,000 | | | 3.700 | | | 07/15/2030 | | | | 59,188 | |
| | Dominion Energy, Inc. | |
| | 50,000 | | | 3.071 | | | 08/15/2024 | | | | 53,991 | |
| | Dominion Energy, Inc. Series C(a) | |
| | 25,000 | | | 3.375 | | | 04/01/2030 | | | | 28,464 | |
| | East Ohio Gas Co. (The)(a)(c) | |
| | 25,000 | | | 1.300 | | | 06/15/2025 | | | | 25,510 | |
| | 25,000 | | | 2.000 | | | 06/15/2030 | | | | 25,829 | |
| | Emera US Finance LP(a) | |
| | 45,000 | | | 2.700 | | | 06/15/2021 | | | | 45,354 | |
| | Entergy Corp.(a) | |
| | 45,000 | | | 2.950 | | | 09/01/2026 | | | | 49,634 | |
| | Exelon Corp.(a) | |
| | 45,000 | | | 3.497 | | | 06/01/2022 | | | | 46,803 | |
| | 50,000 | | | 4.050 | | | 04/15/2030 | | | | 59,164 | |
| | 25,000 | | | 4.700 | | | 04/15/2050 | | | | 33,096 | |
| | FirstEnergy Corp.(a) | |
| | 100,000 | | | 2.650 | | | 03/01/2030 | | | | 99,946 | |
| | FirstEnergy Corp. Series B(a) | |
| | 50,000 | | | 2.250 | | | 09/01/2030 | | | | 48,194 | |
| | Florida Power & Light Co.(a) | |
| | 68,000 | | | 4.125 | | | 02/01/2042 | | | | 86,415 | |
| | MidAmerican Energy Co.(a) | |
| | 25,000 | | | 3.650 | | | 04/15/2029 | | | | 29,708 | |
| | NiSource, Inc.(a) | |
| | 95,000 | | | 3.490 | | | 05/15/2027 | | | | 107,692 | |
| | 25,000 | | | 3.600 | | | 05/01/2030 | | | | 28,937 | |
| | NRG Energy, Inc.(a)(c) | |
| | 75,000 | | | 3.750 | | | 06/15/2024 | | | | 82,020 | |
| | Ohio Power Co. Series P(a) | |
| | 25,000 | | | 2.600 | | | 04/01/2030 | | | | 27,285 | |
| | Pacific Gas and Electric Co.(a) | |
| | 25,000 | | | 2.100 | | | 08/01/2027 | | | | 25,424 | |
| | 50,000 | | | 2.500 | | | 02/01/2031 | | | | 49,976 | |
| | 25,000 | | | 3.300 | | | 08/01/2040 | | | | 25,026 | |
| | 25,000 | | | 3.500 | | | 08/01/2050 | | | | 24,773 | |
| | Progress Energy, Inc.(a) | |
| | 120,000 | | | 7.000 | | | 10/30/2031 | | | | 171,799 | |
| | Southern California Edison Co. Series A(a) | |
| | 50,000 | | | 4.200 | | | 03/01/2029 | | | | 58,598 | |
| | Southern Co. (The)(a) | |
| | 60,000 | | | 3.250 | | | 07/01/2026 | | | | 67,271 | |
| | Virginia Electric and Power Co.(a) | |
| | 75,000 | | | 2.450 | | | 12/15/2050 | | | | 75,511 | |
| | |
|
| Corporate Bonds – (continued) | |
| Electric – (continued) | |
| | Vistra Operations Co. LLC(a)(c) | |
| 125,000 | | | 3.550 | | | 07/15/2024 | | | | 135,230 | |
| | | | | | | | | | | | |
| | | | | | | | | | | 1,755,211 | |
| | |
| Energy(a) – 1.9% | |
| | BP Capital Markets America, Inc. | |
| | 50,000 | | | 3.224 | | | 04/14/2024 | | | | 54,047 | |
| | Continental Resources, Inc. | |
| | 31,000 | | | 4.500 | | | 04/15/2023 | | | | 31,930 | |
| | Devon Energy Corp. | |
| | 29,000 | | | 5.850 | | | 12/15/2025 | | | | 34,074 | |
| | Energy Transfer Operating LP | |
| | 25,000 | | | 4.650 | | | 06/01/2021 | | | | 25,160 | |
| | 75,000 | | | 4.200 | | | 09/15/2023 | | | | 80,844 | |
| | 50,000 | | | 2.900 | | | 05/15/2025 | | | | 52,883 | |
| | 25,000 | | | 5.250 | | | 04/15/2029 | | | | 29,169 | |
| | 5,000 | | | 6.000 | | | 06/15/2048 | | | | 5,928 | |
| | Enterprise Products Operating LLC (b) | |
| | 40,000 | | | (3 Mo. LIBOR + 2.78%),
3.003 | | | 06/01/2067 | | | | 34,455 | |
| | EQM Midstream Partners LP | |
| | 25,000 | | | 4.750 | | | 07/15/2023 | | | | 26,125 | |
| | 25,000 | | | 5.500 | | | 07/15/2028 | | | | 27,250 | |
| | Marathon Petroleum Corp. | |
| | 75,000 | | | 4.500 | | | 05/01/2023 | | | | 81,461 | |
| | MPLX LP | |
| | 75,000 | | | 2.650 | | | 08/15/2030 | | | | 78,715 | |
| | 35,000 | | | 4.500 | | | 04/15/2038 | | | | 40,086 | |
| | 25,000 | | | 5.500 | | | 02/15/2049 | | | | 32,810 | |
| | Occidental Petroleum Corp. | |
| | 100,000 | | | 2.900 | | | 08/15/2024 | | | | 96,125 | |
| | Ovintiv Exploration, Inc. | |
| | 50,000 | | | 5.625 | | | 07/01/2024 | | | | 53,501 | |
| | Phillips 66 | |
| | 50,000 | | | 3.700 | | | 04/06/2023 | | | | 53,551 | |
| | 25,000 | | | 1.300 | | | 02/15/2026 | | | | 25,419 | |
| | Plains All American Pipeline LP | |
| | 15,000 | | | 3.650 | | | 06/01/2022 | | | | 15,454 | |
| | 35,000 | | | 3.850 | | | 10/15/2023 | | | | 37,373 | |
| | 25,000 | | | 3.800 | | | 09/15/2030 | | | | 26,774 | |
| | Sabine Pass Liquefaction LLC | |
| | 75,000 | | | 5.625 | | | 03/01/2025 | | | | 87,518 | |
| | 75,000 | | | 5.000 | | | 03/15/2027 | | | | 88,486 | |
| | Suncor Energy, Inc. | |
| | 25,000 | | | 2.800 | | | 05/15/2023 | | | | 26,309 | |
| | 50,000 | | | 3.100 | | | 05/15/2025 | | | | 54,768 | |
| | Valero Energy Corp. | |
| | 50,000 | | | 2.700 | | | 04/15/2023 | | | | 52,205 | |
| | Western Midstream Operating LP | |
| | 75,000 | | | 4.100 | | | 02/01/2025 | | | | 76,875 | |
| | 25,000 | | | 5.450 | | | 04/01/2044 | | | | 25,250 | |
| | 20,000 | | | 5.300 | | | 03/01/2048 | | | | 19,750 | |
| | | | | | | | | | | | |
| | | | | | | | | | | 1,374,295 | |
| | |
| | |
| 24 | | The accompanying notes are an integral part of these financial statements. |
GOLDMAN SACHS VARIABLE INSURANCE TRUST CORE FIXED INCOME FUND
| | | | | | | | | | | | |
Principal
Amount | | | Interest
Rate | | Maturity
Date | | | Value | |
|
| Corporate Bonds – (continued) | |
| Food & Beverage(a) – 2.0% | |
| | Anheuser-Busch Cos. LLC | |
| $ | 35,000 | | | 4.700 % | | | 02/01/2036 | | | $ | 44,363 | |
| | 210,000 | | | 4.900 | | | 02/01/2046 | | | | 273,125 | |
| | Anheuser-Busch InBev Worldwide, Inc. | |
| | 350,000 | | | 4.750 | | | 01/23/2029 | | | | 431,450 | |
| | 25,000 | | | 4.950 | | | 01/15/2042 | | | | 32,720 | |
| | 100,000 | | | 4.600 | | | 04/15/2048 | | | | 126,047 | |
| | 25,000 | | | 5.550 | | | 01/23/2049 | | | | 35,397 | |
| | 25,000 | | | 4.500 | | | 06/01/2050 | | | | 31,495 | |
| | Constellation Brands, Inc. | |
| | 50,000 | | | 4.400 | | | 11/15/2025 | | | | 58,149 | |
| | 25,000 | | | 3.700 | | | 12/06/2026 | | | | 28,629 | |
| | 50,000 | | | 3.600 | | | 02/15/2028 | | | | 57,041 | |
| | 25,000 | | | 3.150 | | | 08/01/2029 | | | | 27,823 | |
| | J M Smucker Co. (The) | |
| | 25,000 | | | 2.375 | | | 03/15/2030 | | | | 26,514 | |
| | Keurig Dr Pepper, Inc. | |
| | 50,000 | | | 4.057 | | | 05/25/2023 | | | | 54,310 | |
| | 25,000 | | | 5.085 | | | 05/25/2048 | | | | 35,020 | |
| | 25,000 | | | 3.800 | | | 05/01/2050 | | | | 29,846 | |
| | Mars, Inc.(c) | |
| | 25,000 | | | 2.700 | | | 04/01/2025 | | | | 27,048 | |
| | 25,000 | | | 3.200 | | | 04/01/2030 | | | | 28,694 | |
| | Tyson Foods, Inc. | |
| | 50,000 | | | 3.900 | | | 09/28/2023 | | | | 54,470 | |
| | | | | | | | | | | | |
| | | | | | | | | | | 1,402,141 | |
| | |
| Health Care Equipment & Services(a) – 1.6% | |
| | Banner Health | |
| | 75,000 | | | 2.338 | | | 01/01/2030 | | | | 79,942 | |
| | Becton Dickinson and Co. | |
| | 39,000 | | | 2.894 | | | 06/06/2022 | | | | 40,253 | |
| | 25,000 | | | 3.363 | | | 06/06/2024 | | | | 27,112 | |
| | 40,000 | | | 3.700 | | | 06/06/2027 | | | | 45,799 | |
| | 100,000 | | | 2.823 | | | 05/20/2030 | | | | 109,933 | |
| | Centene Corp. | |
| | 150,000 | | | 4.250 | | | 12/15/2027 | | | | 159,651 | |
| | Cigna Corp. | |
| | 50,000 | | | 2.400 | | | 03/15/2030 | | | | 53,144 | |
| | 150,000 | | | 3.400 | | | 03/15/2050 | | | | 168,133 | |
| | CVS Health Corp. | |
| | 25,000 | | | 2.625 | | | 08/15/2024 | | | | 26,781 | |
| | 50,000 | | | 3.875 | | | 07/20/2025 | | | | 56,609 | |
| | 25,000 | | | 5.125 | | | 07/20/2045 | | | | 33,501 | |
| | Dentsply Sirona, Inc. | |
| | 50,000 | | | 3.250 | | | 06/01/2030 | | | | 55,657 | |
| | Rush Obligated Group Series 2020 | |
| | 30,000 | | | 3.922 | | | 11/15/2029 | | | | 35,317 | |
| | Stanford Health Care Series 2020 | |
| | 40,000 | | | 3.310 | | | 08/15/2030 | | | | 45,555 | |
| | Stryker Corp. | |
| | 100,000 | | | 1.950 | | | 06/15/2030 | | | | 102,787 | |
| | Zimmer Biomet Holdings, Inc. | |
| | 100,000 | | | 3.550 | | | 03/20/2030 | | | | 113,416 | |
| | | | | | | | | | | | |
| | | | | | | | | | | 1,153,590 | |
| | |
|
| Corporate Bonds – (continued) | |
| Household & Personal Products(a) – 0.0% | |
| | Kimberly-Clark Corp. | |
| 25,000 | | | 3.100 | | | 03/26/2030 | | | | 28,747 | |
| | |
| Life Insurance(a) – 0.9% | |
| | American International Group, Inc. | |
| | 25,000 | | | 4.875 | | | 06/01/2022 | | | | 26,550 | |
| | 125,000 | | | 3.900 | | | 04/01/2026 | | | | 142,541 | |
| | 25,000 | | | 4.200 | | | 04/01/2028 | | | | 29,656 | |
| | 100,000 | | | 3.400 | | | 06/30/2030 | | | | 114,401 | |
| | Berkshire Hathaway Finance Corp. | |
| | 75,000 | | | 1.850 | | | 03/12/2030 | | | | 79,060 | |
| | Marsh & McLennan Cos., Inc. | |
| | 50,000 | | | 4.375 | | | 03/15/2029 | | | | 60,870 | |
| | Principal Financial Group, Inc. | |
| | 50,000 | | | 3.100 | | | 11/15/2026 | | | | 55,762 | |
| | 75,000 | | | 2.125 | | | 06/15/2030 | | | | 78,387 | |
| | Willis North America, Inc. | |
| | 25,000 | | | 2.950 | | | 09/15/2029 | | | | 27,310 | |
| | | | | | | | | | | | |
| | | | | | | | | | | 614,537 | |
| | |
| Materials(a) – 0.9% | |
| | Air Products and Chemicals, Inc. | |
| | 25,000 | | | 2.050 | | | 05/15/2030 | | | | 26,677 | |
| | Berry Global, Inc.(c) | |
| | 50,000 | | | 1.570 | | | 01/15/2026 | | | | 50,446 | |
| | DuPont de Nemours, Inc. | |
| | 25,000 | | | 4.205 | | | 11/15/2023 | | | | 27,597 | |
| | 50,000 | | | 4.493 | | | 11/15/2025 | | | | 58,393 | |
| | Ecolab, Inc. | |
| | 4,000 | | | 5.500 | | | 12/08/2041 | | | | 5,757 | |
| | Huntsman International LLC | |
| | 25,000 | | | 4.500 | | | 05/01/2029 | | | | 28,872 | |
| | Nutrition & Biosciences, Inc.(c) | |
| | 75,000 | | | 1.832 | | | 10/15/2027 | | | | 77,249 | |
| | 150,000 | | | 2.300 | | | 11/01/2030 | | | | 154,209 | |
| | 50,000 | | | 3.268 | | | 11/15/2040 | | | | 53,634 | |
| | Sherwin-Williams Co. (The) | |
| | 25,000 | | | 3.450 | | | 06/01/2027 | | | | 28,357 | |
| | 50,000 | | | 2.950 | | | 08/15/2029 | | | | 55,260 | |
| | Steel Dynamics, Inc. | |
| | 20,000 | | | 2.400 | | | 06/15/2025 | | | | 21,285 | |
| | 50,000 | | | 1.650 | | | 10/15/2027 | | | | 51,423 | |
| | | | | | | | | | | | |
| | | | | | | | | | | 639,159 | |
| | |
| Media & Entertainment(a) – 1.7% | |
| | Charter Communications Operating LLC | |
| | 320,000 | | | 4.908 | | | 07/23/2025 | | | | 372,038 | |
| | Comcast Corp. | |
| | 25,000 | | | 3.700 | | | 04/15/2024 | | | | 27,558 | |
| | 25,000 | | | 3.100 | | | 04/01/2025 | | | | 27,493 | |
| | 45,000 | | | 3.375 | | | 08/15/2025 | | | | 50,212 | |
| | 50,000 | | | 3.950 | | | 10/15/2025 | | | | 57,408 | |
| | 25,000 | | | 3.300 | | | 02/01/2027 | | | | 28,200 | |
| | 75,000 | | | 3.300 | | | 04/01/2027 | | | | 85,295 | |
| | 225,000 | | | 3.150 | | | 02/15/2028 | | | | 252,751 | |
| | |
| | |
| The accompanying notes are an integral part of these financial statements. | | 25 |
GOLDMAN SACHS VARIABLE INSURANCE TRUST CORE FIXED INCOME FUND
Schedule of Investments (continued)
December 31, 2020
| | | | | | | | | | | | |
Principal
Amount | | | Interest
Rate | | Maturity
Date | | | Value | |
|
| Corporate Bonds – (continued) | |
| Media & Entertainment(a) – (continued) | |
| | Comcast Corp. – (continued) | |
| $ | 125,000 | | | 4.150 % | | | 10/15/2028 | | | $ | 149,920 | |
| | 25,000 | | | 4.250 | | | 10/15/2030 | | | | 30,717 | |
| | 25,000 | | | 3.750 | | | 04/01/2040 | | | | 30,118 | |
| | 25,000 | | | 4.700 | | | 10/15/2048 | | | | 34,769 | |
| | Fox Corp. | |
| | 25,000 | | | 4.030 | | | 01/25/2024 | | | | 27,517 | |
| | 25,000 | | | 4.709 | | | 01/25/2029 | | | | 30,342 | |
| | Walt Disney Co. (The) | |
| | 25,000 | | | 3.700 | | | 09/15/2024 | | | | 27,754 | |
| | | | | | | | | | | | |
| | | | | | | | | | | 1,232,092 | |
| | |
| Metals and Mining(a) – 0.3% | |
| | Glencore Funding LLC(c) | |
| | 75,000 | | | 4.125 | | | 03/12/2024 | | | | 82,292 | |
| | 25,000 | | | 4.625 | | | 04/29/2024 | | | | 27,998 | |
| | Newcrest Finance Pty. Ltd.(c) | |
| | 25,000 | | | 3.250 | | | 05/13/2030 | | | | 27,712 | |
| | Newmont Corp. | |
| | 75,000 | | | 2.250 | | | 10/01/2030 | | | | 79,045 | |
| | Teck Resources Ltd. | |
| | 25,000 | | | 3.900 | | | 07/15/2030 | | | | 27,816 | |
| | | | | | | | | | | | |
| | | | | | | | | | | 244,863 | |
| | |
| Pharmaceuticals, Biotechnology & Life Sciences(a) – 2.3% | |
| | AbbVie, Inc. | |
| | 125,000 | | | 4.050 | | | 11/21/2039 | | | | 151,027 | |
| | 200,000 | | | 4.250 | | | 11/21/2049 | | | | 251,239 | |
| | Amgen, Inc. | |
| | 70,000 | | | 3.125 | | | 05/01/2025 | | | | 76,827 | |
| | Bayer US Finance II LLC (c) | |
| | 200,000 | | | 3.875 | | | 12/15/2023 | | | | 217,989 | |
| | Bristol-Myers Squibb Co. | |
| | 150,000 | | | 3.875 | | | 08/15/2025 | | | | 171,075 | |
| | 25,000 | | | 4.250 | | | 10/26/2049 | | | | 33,658 | |
| | DH Europe Finance II Sarl | |
| | 75,000 | | | 2.200 | | | 11/15/2024 | | | | 79,500 | |
| | 25,000 | | | 2.600 | | | 11/15/2029 | | | | 27,330 | |
| | 75,000 | | | 3.250 | | | 11/15/2039 | | | | 85,358 | |
| | Elanco Animal Health, Inc. | |
| | 50,000 | | | 4.912 | | | 08/27/2021 | | | | 50,999 | |
| | 25,000 | | | 5.272 | | | 08/28/2023 | | | | 27,278 | |
| | Pfizer, Inc. | |
| | 75,000 | | | 3.450 | | | 03/15/2029 | | | | 87,527 | |
| | 25,000 | | | 2.625 | | | 04/01/2030 | | | | 27,721 | |
| | Royalty Pharma plc(c) | |
| | 75,000 | | | 1.200 | | | 09/02/2025 | | | | 76,158 | |
| | Thermo Fisher Scientific, Inc. | |
| | 15,000 | | | 3.650 | | | 12/15/2025 | | | | 17,024 | |
| | 25,000 | | | 4.497 | | | 03/25/2030 | | | | 31,210 | |
| | Zoetis, Inc. | |
| | 45,000 | | | 3.000 | | | 09/12/2027 | | | | 50,326 | |
| | 150,000 | | | 2.000 | | | 05/15/2030 | | | | 155,226 | |
| | | | | | | | | | | | |
| | | | | | | | | | | 1,617,472 | |
| | |
|
| Corporate Bonds – (continued) | |
| Pipelines(a) – 0.2% | |
| | Sunoco Logistics Partners Operations LP | |
| 15,000 | | | 4.250 | | | 04/01/2024 | | | | 16,228 | |
| | Williams Cos., Inc. (The) | |
| | 25,000 | | | 3.600 | | | 03/15/2022 | | | | 25,807 | |
| | 25,000 | | | 3.900 | | | 01/15/2025 | | | | 27,762 | |
| | 35,000 | | | 4.000 | | | 09/15/2025 | | | | 39,709 | |
| | | | | | | | | | | | |
| | | | | | | | | | | 109,506 | |
| | |
| Property/Casualty Insurance(a) – 0.1% | |
| | Arch Capital Group US, Inc. | |
| | 36,000 | | | 5.144 | | | 11/01/2043 | | | | 48,820 | |
| | XLIT Ltd. | |
| | 45,000 | | | 4.450 | | | 03/31/2025 | | | | 51,379 | |
| | | | | | | | | | | | |
| | | | | | | | | | | 100,199 | |
| | |
| Real Estate Investment Trusts(a) – 2.4% | |
| | Alexandria Real Estate Equities, Inc. | |
| | 25,000 | | | 3.800 | | | 04/15/2026 | | | | 28,784 | |
| | 25,000 | | | 3.375 | | | 08/15/2031 | | | | 28,644 | |
| | American Campus Communities Operating Partnership LP | |
| | 95,000 | | | 4.125 | | | 07/01/2024 | | | | 103,470 | |
| | 25,000 | | | 3.875 | | | 01/30/2031 | | | | 28,015 | |
| | American Homes 4 Rent LP | |
| | 50,000 | | | 4.900 | | | 02/15/2029 | | | | 60,363 | |
| | American Tower Corp. | |
| | 75,000 | | | 3.375 | | | 05/15/2024 | | | | 81,639 | |
| | 100,000 | | | 2.400 | | | 03/15/2025 | | | | 106,500 | |
| | 75,000 | | | 2.100 | | | 06/15/2030 | | | | 76,985 | |
| | Boston Properties LP | |
| | 25,000 | | | 4.125 | | | 05/15/2021 | | | | 25,101 | |
| | Crown Castle International Corp. | |
| | 85,000 | | | 3.150 | | | 07/15/2023 | | | | 90,415 | |
| | 60,000 | | | 3.650 | | | 09/01/2027 | | | | 67,955 | |
| | 25,000 | | | 3.300 | | | 07/01/2030 | | | | 28,035 | |
| | CubeSmart LP | |
| | 45,000 | | | 4.000 | | | 11/15/2025 | | | | 50,795 | |
| | Duke Realty LP | |
| | 25,000 | | | 1.750 | | | 07/01/2030 | | | | 25,299 | |
| | Essex Portfolio LP | |
| | 50,000 | | | 3.000 | | | 01/15/2030 | | | | 55,265 | |
| | Healthcare Realty Trust, Inc. | |
| | 25,000 | | | 2.050 | | | 03/15/2031 | | | | 25,022 | |
| | Kilroy Realty LP | |
| | 25,000 | | | 4.750 | | | 12/15/2028 | | | | 29,433 | |
| | Mid-America Apartments LP | |
| | 50,000 | | | 1.700 | | | 02/15/2031 | | | | 49,972 | |
| | National Retail Properties, Inc. | |
| | 35,000 | | | 3.900 | | | 06/15/2024 | | | | 37,910 | |
| | 45,000 | | | 4.000 | | | 11/15/2025 | | | | 50,260 | |
| | Regency Centers LP | |
| | 100,000 | | | 2.950 | | | 09/15/2029 | | | | 106,628 | |
| | Spirit Realty LP | |
| | 75,000 | | | 3.400 | | | 01/15/2030 | | | | 81,323 | |
| | |
| | |
| 26 | | The accompanying notes are an integral part of these financial statements. |
GOLDMAN SACHS VARIABLE INSURANCE TRUST CORE FIXED INCOME FUND
| | | | | | | | | | | | | | |
Principal
Amount | | | Interest
Rate | | | Maturity
Date | | | Value | |
|
| Corporate Bonds – (continued) | |
| Real Estate Investment Trusts(a) – (continued) | |
| | UDR, Inc. | |
| $ | 25,000 | | | | 2.100 % | | | | 08/01/2032 | | | $ | 25,427 | |
| | 100,000 | | | | 1.900 | | | | 03/15/2033 | | | | 99,916 | |
| | Ventas Realty LP | |
| | 45,000 | | | | 3.500 | | | | 02/01/2025 | | | | 49,516 | |
| | VEREIT Operating Partnership LP | |
| | 50,000 | | | | 4.625 | | | | 11/01/2025 | | | | 57,615 | |
| | 25,000 | | | | 3.950 | | | | 08/15/2027 | | | | 28,388 | |
| | 25,000 | | | | 3.400 | | | | 01/15/2028 | | | | 27,591 | |
| | 50,000 | | | | 2.850 | | | | 12/15/2032 | | | | 52,225 | |
| | WP Carey, Inc. | |
| | 20,000 | | | | 4.600 | | | | 04/01/2024 | | | | 22,282 | |
| | 30,000 | | | | 4.000 | | | | 02/01/2025 | | | | 33,177 | |
| | 25,000 | | | | 3.850 | | | | 07/15/2029 | | | | 28,373 | |
| | 25,000 | | | | 2.400 | | | | 02/01/2031 | | | | 25,986 | |
| | | | | | | | | | | | | | |
| | | | | | | | | | | | | 1,688,309 | |
| | |
| Retailing(a) – 1.7% | |
| | Alimentation Couche-Tard, Inc.(c) | |
| | 45,000 | | | | 2.700 | | | | 07/26/2022 | | | | 46,462 | |
| | Amazon.com, Inc. | |
| | 335,000 | | | | 5.200 | | | | 12/03/2025 | | | | 407,340 | |
| | 45,000 | | | | 4.800 | | | | 12/05/2034 | | | | 61,894 | |
| | 15,000 | | | | 3.875 | | | | 08/22/2037 | | | | 18,676 | |
| | Booking Holdings, Inc. | |
| | 25,000 | | | | 4.100 | | | | 04/13/2025 | | | | 28,382 | |
| | Dollar Tree, Inc. | |
| | 50,000 | | | | 4.000 | | | | 05/15/2025 | | | | 56,438 | |
| | 50,000 | | | | 4.200 | | | | 05/15/2028 | | | | 59,476 | |
| | Expedia Group, Inc. | |
| | 50,000 | | | | 3.600(c) | | | | 12/15/2023 | | | | 53,352 | |
| | 25,000 | | | | 4.625(c) | | | | 08/01/2027 | | | | 27,881 | |
| | 35,000 | | | | 3.800 | | | | 02/15/2028 | | | | 37,413 | |
| | Home Depot, Inc. (The) | |
| | 25,000 | | | | 3.900 | | | | 12/06/2028 | | | | 30,073 | |
| | 25,000 | | | | 4.250 | | | | 04/01/2046 | | | | 33,203 | |
| | Lowe’s Cos., Inc. | |
| | 100,000 | | | | 1.700 | | | | 10/15/2030 | | | | 101,026 | |
| | 25,000 | | | | 3.000 | | | | 10/15/2050 | | | | 26,772 | |
| | Sysco Corp. | |
| | 25,000 | | | | 6.600 | | | | 04/01/2050 | | | | 38,324 | |
| | Tractor Supply Co. | |
| | 50,000 | | | | 1.750 | | | | 11/01/2030 | | | | 50,237 | |
| | Walgreens Boots Alliance, Inc. | |
| | 100,000 | | | | 4.100 | | | | 04/15/2050 | | | | 105,940 | |
| | | | | | | | | | | | | | |
| | | | | | | | | | | | | 1,182,889 | |
| | |
| Software & Services(a) – 1.4% | |
| | Adobe, Inc. | |
| | 50,000 | | | | 2.150 | | | | 02/01/2027 | | | | 53,765 | |
| | 75,000 | | | | 2.300 | | | | 02/01/2030 | | | | 80,998 | |
| | Amdocs Ltd. | |
| | 50,000 | | | | 2.538 | | | | 06/15/2030 | | | | 52,594 | |
| | |
|
| Corporate Bonds – (continued) | |
| Software & Services(a) – (continued) | |
| | Fiserv, Inc. | |
| 100,000 | | | | 2.750 | | | | 07/01/2024 | | | | 107,396 | |
| | 50,000 | | | | 3.200 | | | | 07/01/2026 | | | | 55,976 | |
| | 25,000 | | | | 4.200 | | | | 10/01/2028 | | | | 29,814 | |
| | Global Payments, Inc. | |
| | 50,000 | | | | 2.650 | | | | 02/15/2025 | | | | 53,563 | |
| | 25,000 | | | | 3.200 | | | | 08/15/2029 | | | | 27,753 | |
| | Intuit, Inc. | |
| | 25,000 | | | | 1.350 | | | | 07/15/2027 | | | | 25,554 | |
| | Mastercard, Inc. | |
| | 25,000 | | | | 3.300 | | | | 03/26/2027 | | | | 28,510 | |
| | Oracle Corp. | |
| | 25,000 | | | | 3.600 | | | | 04/01/2040 | | | | 29,310 | |
| | 50,000 | | | | 3.850 | | | | 04/01/2060 | | | | 61,115 | |
| | PayPal Holdings, Inc. | |
| | 150,000 | | | | 1.650 | | | | 06/01/2025 | | | | 156,883 | |
| | 125,000 | | | | 2.650 | | | | 10/01/2026 | | | | 137,332 | |
| | ServiceNow, Inc. | |
| | 125,000 | | | | 1.400 | | | | 09/01/2030 | | | | 121,900 | |
| | | | | | | | | | | | | | |
| | | | | | | | | | | | | 1,022,463 | |
| | |
| Technology(a) – 2.6% | |
| | Apple, Inc. | |
| | 325,000 | | | | 2.450 | | | | 08/04/2026 | | | | 354,140 | |
| | Applied Materials, Inc. | |
| | 25,000 | | | | 1.750 | | | | 06/01/2030 | | | | 25,923 | |
| | Broadcom Corp. | |
| | 50,000 | | | | 3.125 | | | | 01/15/2025 | | | | 54,043 | |
| | 200,000 | | | | 3.875 | | | | 01/15/2027 | | | | 224,736 | |
| | Broadcom, Inc. | |
| | 150,000 | | | | 4.700 | | | | 04/15/2025 | | | | 171,979 | |
| | 150,000 | | | | 4.250 | | | | 04/15/2026 | | | | 171,884 | |
| | 104,000 | | | | 3.459 | | | | 09/15/2026 | | | | 115,363 | |
| | Dell International LLC(c) | |
| | 70,000 | | | | 5.450 | | | | 06/15/2023 | | | | 77,425 | |
| | 75,000 | | | | 5.850 | | | | 07/15/2025 | | | | 89,776 | |
| | 100,000 | | | | 6.020 | | | | 06/15/2026 | | | | 122,018 | |
| | 25,000 | | | | 5.300 | | | | 10/01/2029 | | | | 30,630 | |
| | Hewlett Packard Enterprise Co. | |
| | 150,000 | | | | 4.450 | | | | 10/02/2023 | | | | 165,172 | |
| | 50,000 | | | | 4.650 | | | | 10/01/2024 | | | | 56,829 | |
| | 45,000 | | | | 4.900 | | | | 10/15/2025 | | | | 52,673 | |
| | 25,000 | | | | 6.350 | | | | 10/15/2045 | | | | 32,988 | |
| | Lam Research Corp. | |
| | 50,000 | | | | 1.900 | | | | 06/15/2030 | | | | 51,878 | |
| | Microchip Technology, Inc. | |
| | 25,000 | | | | 3.922 | | | | 06/01/2021 | | | | 25,302 | |
| | NXP BV(c) | |
| | 25,000 | | | | 3.400 | | | | 05/01/2030 | | | | 28,344 | |
| | | | | | | | | | | | | | |
| | | | | | | | | | | | | 1,851,103 | |
| | |
| Tobacco(a) – 0.3% | |
| | Altria Group, Inc. | |
| | 50,000 | | | | 3.800 | | | | 02/14/2024 | | | | 54,598 | |
| | |
| | |
| The accompanying notes are an integral part of these financial statements. | | 27 |
GOLDMAN SACHS VARIABLE INSURANCE TRUST CORE FIXED INCOME FUND
Schedule of Investments (continued)
December 31, 2020
| | | | | | | | | | | | | | |
Principal
Amount | | | Interest
Rate | | | Maturity
Date | | | Value | |
|
| Corporate Bonds – (continued) | |
| Tobacco(a) – (continued) | |
| | Archer-Daniels-Midland Co. | |
| $ | 25,000 | | | | 3.250 % | | | | 03/27/2030 | | | $ | 28,889 | |
| | BAT Capital Corp. | |
| | 25,000 | | | | 3.222 | | | | 08/15/2024 | | | | 27,066 | |
| | 100,000 | | | | 2.259 | | | | 03/25/2028 | | | | 103,364 | |
| | 25,000 | | | | 4.540 | | | | 08/15/2047 | | | | 27,730 | |
| | | | | | | | | | | | | | |
| | | | | | | | | | | | | 241,647 | |
| | |
| Transportation(a) – 0.3% | |
| | Avolon Holdings Funding Ltd.(c) | |
| | 25,000 | | | | 3.950 | | | | 07/01/2024 | | | | 26,405 | |
| | Burlington Northern Santa Fe LLC | |
| | 25,000 | | | | 4.050 | | | | 06/15/2048 | | | | 32,846 | |
| | Canadian Pacific Railway Co. | |
| | 25,000 | | | | 2.050 | | | | 03/05/2030 | | | | 26,217 | |
| | FedEx Corp. | |
| | 45,000 | | | | 3.400 | | | | 02/15/2028 | | | | 51,351 | |
| | 75,000 | | | | 5.250 | | | | 05/15/2050 | | | | 106,000 | |
| | | | | | | | | | | | | | |
| | | | | | | | | | | | | 242,819 | |
| | |
| Wireless Telecommunications(a) – 3.6% | |
| | American Tower Corp. | |
| | 45,000 | | | | 4.700 | | | | 03/15/2022 | | | | 47,293 | |
| | AT&T, Inc. | |
| | 300,000 | | | | 2.300 | | | | 06/01/2027 | | | | 319,727 | |
| | 150,000 | | | | 4.350 | | | | 03/01/2029 | | | | 178,820 | |
| | 75,000 | | | | 2.750 | | | | 06/01/2031 | | | | 80,092 | |
| | 128,000 | | | | 2.550(c) | | | | 12/01/2033 | | | | 131,591 | |
| | 25,000 | | | | 4.900 | | | | 08/15/2037 | | | | 31,248 | |
| | 75,000 | | | | 3.500 | | | | 06/01/2041 | | | | 80,505 | |
| | 25,000 | | | | 4.750 | | | | 05/15/2046 | | | | 30,925 | |
| | 25,000 | | | | 5.150 | | | | 11/15/2046 | | | | 32,249 | |
| | 25,000 | | | | 4.500 | | | | 03/09/2048 | | | | 29,790 | |
| | T-Mobile USA, Inc.(c) | |
| | 75,000 | | | | 3.500 | | | | 04/15/2025 | | | | 82,971 | |
| | 75,000 | | | | 1.500 | | | | 02/15/2026 | | | | 76,828 | |
| | 150,000 | | | | 3.750 | | | | 04/15/2027 | | | | 171,008 | |
| | 175,000 | | | | 2.050 | | | | 02/15/2028 | | | | 181,992 | |
| | 175,000 | | | | 3.875 | | | | 04/15/2030 | | | | 202,444 | |
| | 50,000 | | | | 3.000 | | | | 02/15/2041 | | | | 51,726 | |
| | Verizon Communications, Inc. | |
| | 25,000 | | | | 3.376 | | | | 02/15/2025 | | | | 27,763 | |
| | 25,000 | | | | 2.625 | | | | 08/15/2026 | | | | 27,375 | |
| | 145,000 | | | | 4.329 | | | | 09/21/2028 | | | | 174,335 | |
| | 200,000 | | | | 3.875 | | | | 02/08/2029 | | | | 235,175 | |
| | 50,000 | | | | 3.150 | | | | 03/22/2030 | | | | 56,039 | |
| | 100,000 | | | | 4.862 | | | | 08/21/2046 | | | | 134,206 | |
| | 9,000 | | | | 5.012 | | | | 04/15/2049 | | | | 12,462 | |
| | 90,000 | | | | 2.987(c) | | | | 10/30/2056 | | | | 90,466 | |
| | Vodafone Group plc | |
| | 75,000 | | | | 3.750 | | | | 01/16/2024 | | | | 81,972 | |
| | | | | | | | | | | | | | |
| | | | | | | | | | | | | 2,569,002 | |
| | |
| | TOTAL CORPORATE BONDS | |
| | (Cost $26,519,997) | | | $ | 28,923,236 | |
| | |
|
| Mortgage-Backed Securities – 32.1% | |
| FHLMC – 0.0% | |
| $ | 1,975 | | | | 4.500% | | | | 07/01/2024 | | | $ | 2,073 | |
| | 11,251 | | | | 4.500 | | | | 11/01/2024 | | | | 11,834 | |
| | 2,293 | | | | 4.500 | | | | 12/01/2024 | | | | 2,416 | |
| | 5,510 | | | | 7.500 | | | | 12/01/2029 | | | | 6,488 | |
| | 1,658 | | | | 5.000 | | | | 10/01/2033 | | | | 1,893 | |
| | 2,444 | | | | 5.000 | | | | 07/01/2035 | | | | 2,797 | |
| | 3,567 | | | | 5.000 | | | | 12/01/2035 | | | | 4,102 | |
| | 695 | | | | 5.000 | | | | 03/01/2038 | | | | 794 | |
| | 1,619 | | | | 5.000 | | | | 06/01/2041 | | | | 1,865 | |
| | | | | | | | | | | | | | |
| | | | | | | | | | | | | 34,262 | |
| | |
| GNMA – 20.3% | |
| | 941 | | | | 7.000 | | | | 10/15/2025 | | | | 957 | |
| | 4,573 | | | | 7.000 | | | | 11/15/2025 | | | | 4,841 | |
| | 549 | | | | 7.000 | | | | 02/15/2026 | | | | 560 | |
| | 2,163 | | | | 7.000 | | | | 04/15/2026 | | | | 2,296 | |
| | 2,282 | | | | 7.000 | | | | 03/15/2027 | | | | 2,452 | |
| | 12,203 | | | | 7.000 | | | | 11/15/2027 | | | | 12,607 | |
| | 5,671 | | | | 7.000 | | | | 02/15/2028 | | | | 6,103 | |
| | 1,365 | | | | 7.000 | | | | 03/15/2028 | | | | 1,405 | |
| | 761 | | | | 7.000 | | | | 04/15/2028 | | | | 783 | |
| | 100 | | | | 7.000 | | | | 05/15/2028 | | | | 110 | |
| | 2,226 | | | | 7.000 | | | | 06/15/2028 | | | | 2,425 | |
| | 3,332 | | | | 7.000 | | | | 07/15/2028 | | | | 3,637 | |
| | 8,786 | | | | 7.000 | | | | 09/15/2028 | | | | 9,537 | |
| | 76,588 | | | | 6.000 | | | | 08/20/2034 | | | | 89,065 | |
| | 64,845 | | | | 5.000 | | | | 06/15/2040 | | | | 72,420 | |
| | 326,974 | | | | 4.000 | | | | 08/20/2043 | | | | 359,854 | |
| | 142,906 | | | | 4.000 | | | | 10/20/2045 | | | | 156,472 | |
| | 110,922 | | | | 5.000 | | | | 08/20/2048 | | | | 121,600 | |
| | 342,703 | | | | 4.500 | | | | 09/20/2048 | | | | 370,333 | |
| | 405,245 | | | | 5.000 | | | | 10/20/2048 | | | | 444,130 | |
| | 395,330 | | | | 5.000 | | | | 11/20/2048 | | | | 432,646 | |
| | 147,111 | | | | 5.000 | | | | 12/20/2048 | | | | 160,997 | |
| | 877,038 | | | | 4.500 | | | | 01/20/2049 | | | | 946,583 | |
| | 116,570 | | | | 4.500 | | | | 03/20/2049 | | | | 125,777 | |
| | 783,240 | | | | 4.500 | | | | 10/20/2049 | | | | 843,517 | |
| | 915,485 | | | | 4.500 | | | | 03/20/2050 | | | | 979,853 | |
| | 6,000,000 | | | | 2.000 | | | | TBA-30yr | (d) | | | 6,276,479 | |
| | 1,000,000 | | | | 2.500 | | | | TBA-30yr | (d) | | | 1,058,697 | |
| | 1,000,000 | | | | 3.000 | | | | TBA-30yr | (d) | | | 1,045,595 | |
| | 1,000,000 | | | | 2.000 | | | | TBA-30yr | (d) | | | 1,044,400 | |
| | | | | | | | | | | | | | |
| | | | | | | | | | | | | 14,576,131 | |
| | |
| UMBS – 8.8% | |
| | 9,732 | | | | 5.500 | | | | 09/01/2023 | | | | 10,078 | |
| | 2,903 | | | | 5.500 | | | | 10/01/2023 | | | | 3,006 | |
| | 821 | | | | 4.500 | | | | 07/01/2024 | | | | 861 | |
| | 25,522 | | | | 4.500 | | | | 11/01/2024 | | | | 26,807 | |
| | 12,949 | | | | 4.500 | | | | 12/01/2024 | | | | 13,619 | |
| | 4,408 | | | | 9.000 | | | | 11/01/2025 | | | | 4,866 | |
| | 21,968 | | | | 7.000 | | | | 08/01/2026 | | | | 24,429 | |
| | 7,934 | | | | 8.000 | | | | 10/01/2029 | | | | 9,178 | |
| | 1,036 | | | | 8.500 | | | | 04/01/2030 | | | | 1,227 | |
| | 1,945 | | | | 8.000 | | | | 05/01/2030 | | | | 2,125 | |
| | |
| | |
| 28 | | The accompanying notes are an integral part of these financial statements. |
GOLDMAN SACHS VARIABLE INSURANCE TRUST CORE FIXED INCOME FUND
| | | | | | | | | | | | | | |
Principal
Amount | | | Interest
Rate | | | Maturity
Date | | | Value | |
|
| Mortgage-Backed Securities – (continued) | |
| UMBS – (continued) | |
| $ | 5,552 | | | | 8.000 % | | | | 08/01/2032 | | | $ | 6,599 | |
| | 7,034 | | | | 4.500 | | | | 08/01/2039 | | | | 7,894 | |
| | 31,382 | | | | 3.000 | | | | 01/01/2043 | | | | 34,393 | |
| | 137,608 | | | | 3.000 | | | | 03/01/2043 | | | | 150,932 | |
| | 192,220 | | | | 3.000 | | | | 04/01/2043 | | | | 210,832 | |
| | 138,804 | | | | 3.000 | | | | 05/01/2043 | | | | 152,244 | |
| | 421,865 | | | | 4.500 | | | | 04/01/2045 | | | | 481,668 | |
| | 48,338 | | | | 4.500 | | | | 05/01/2045 | | | | 55,220 | |
| | 276,824 | | | | 4.000 | | | | 02/01/2048 | | | | 302,567 | |
| | 351,653 | | | | 4.000 | | | | 03/01/2048 | | | | 384,356 | |
| | 29,358 | | | | 4.000 | | | | 07/01/2048 | | | | 32,169 | |
| | 929,789 | | | | 4.500 | | | | 07/01/2048 | | | | 1,007,259 | |
| | 404,388 | | | | 4.000 | | | | 08/01/2048 | | | | 441,488 | |
| | 332,845 | | | | 5.000 | | | | 11/01/2048 | | | | 379,420 | |
| | 1,000,000 | | | | 3.000 | | | | 09/01/2049 | | | | 1,079,326 | |
| | 1,391,140 | | | | 5.000 | | | | 10/01/2049 | | | | 1,534,941 | |
| | | | | | | | | | | | | | |
| | | | | | | | | | | | | 6,357,504 | |
| | |
| UMBS, 30 Year, Single Family(d) – 3.0% | |
| | UMBS, 30 Year, Single Family | |
| | 1,000,000 | | | | 3.000 | | | | TBA-30yr | | | | 1,047,694 | |
| | UMBS, 30 Year, Single Family, Class 360 | |
| | 1,000,000 | | | | 4.500 | | | | TBA-30yr | | | | 1,083,750 | |
| | | | | | | | | | | | | | |
| | | | | | | | | | | | | 2,131,444 | |
| | |
| | TOTAL MORTGAGE-BACKED SECURITIES | |
| | (Cost $22,709,305) | | | $ | 23,099,341 | |
| | |
| | |
|
| Collateralized Mortgage Obligations – 0.9% | |
| Adjustable Rate Non-Agency(a)(b) – 0.8% | |
| | Alternative Loan Trust Series 2005-38, Class A1 | |
| $ | 60,968 | | | | 2.109% | | | | 09/25/2035 | | | $ | 52,848 | |
| | FHLMC STACR REMIC Trust Series 2020-DNA3, Class M2(c) | |
| | 90,000 | | | | 3.150 | | | | 06/25/2050 | | | | 90,490 | |
| | FHLMC STACR REMIC Trust Series 2020-DNA5, Class M2(c) | |
| | 36,000 | | | | 2.882 | | | | 10/25/2050 | | | | 36,383 | |
| | Harben Finance plc Series 2017-1X, Class A | |
| GBP | 65,187 | | | | 0.851 | | | | 08/20/2056 | | | | 89,114 | |
| | Lehman XS Trust Series 2005-7N, Class 1A1A | |
| $ | 112,665 | | | | 0.685 | | | | 12/25/2035 | | | | 108,636 | |
| | London Wall Mortgage Capital plc Series 2017-FL1, Class A | |
| GBP | 37,639 | | | | 0.898 | | | | 11/15/2049 | | | | 51,415 | |
| | Stratton Mortgage Funding plc Series 2019-1, Class A | |
| | 86,735 | | | | 1.254 | | | | 05/25/2051 | | | | 118,810 | |
| Wells Fargo Mortgage-Backed Securities Trust Series 2019-3,
Class A1(c) |
|
| $ | 39,097 | | | | 3.500 | | | | 07/25/2049 | | | | 40,136 | |
| | | | | | | | | | | | | | |
| | | | | | | | | | | | | 587,832 | |
| | |
| Sequential Fixed Rate – 0.1% | |
| | FNMA REMIC Series 2012-111, Class B | |
| | 8,570 | | | | 7.000 | | | | 10/25/2042 | | | | 10,543 | |
| | |
|
| Collateralized Mortgage Obligations – (continued) | |
| Sequential Fixed Rate – (continued) | |
| | FNMA REMIC Series 2012-153, Class B | |
| 23,044 | | | | 7.000 | | | | 07/25/2042 | | | | 28,964 | |
| | | | | | | | | | | | | | |
| | | | | | | | | | | | | 39,507 | |
| | |
| | TOTAL COLLATERALIZED MORTGAGE OBLIGATIONS | |
| | (Cost $587,642) | | | $ | 627,339 | |
| | |
| | |
|
| Commercial Mortgage-Backed Securities(a) – 0.4% | |
| Sequential Fixed Rate – 0.4% | |
| | BANK Series 2019-BN21, Class A5 | |
| $ | 150,000 | | | | 2.851% | | | | 10/17/2052 | | | $ | 165,683 | |
| Cantor Commercial Real Estate Lending Series 2019-CF3,
Class A4 |
|
| | 100,000 | | | | 3.006 | | | | 01/15/2053 | | | | 111,374 | |
| | |
| | TOTAL COMMERCIAL MORTGAGE-BACKED SECURITIES | |
| | (Cost $259,772) | | | $ | 277,057 | |
| | |
| | |
|
| U.S. Government Agency Securities – 4.7% | |
| | FHLB | |
| $ | 100,000 | | | | 3.375% | | | | 12/08/2023 | | | $ | 109,227 | |
| | FHLMC | |
| | 1,140,000 | | | | 0.375 | | | | 09/23/2025 | | | | 1,138,024 | |
| | FNMA | |
| | 1,110,000 | | | | 0.500 | | | | 11/07/2025 | | | | 1,114,385 | |
| | 400,000 | | | | 1.875 | | | | 09/24/2026 | | | | 432,369 | |
| | 400,000 | | | | 6.250 | | | | 05/15/2029 | | | | 569,849 | |
| | |
| | TOTAL U.S. GOVERNMENT AGENCY SECURITIES | |
| | (Cost $3,240,556) | | | $ | 3,363,854 | |
| | |
| | |
|
| Asset-Backed Securities(a) – 5.2% | |
| Automobile – 0.1% | |
| | Ally Master Owner Trust Series 2018-1, Class A2 | |
| | 100,000 | | | | 2.700% | | | | 01/17/2023 | | | | 100,061 | |
| | |
| Collateralized Debt Obligations (b)(c) – 0.6% | |
| Arbor Realty Commercial Real Estate Notes Ltd.
Series 2018-FL1, Class A |
|
| | 200,000 | | | | 1.309 | | | | 06/15/2028 | | | | 197,885 | |
| | KREF Ltd. Series 2018-FL1, Class A | |
| | 150,000 | | | | 1.253 | | | | 06/15/2036 | | | | 149,724 | |
| Orix Credit Alliance Owner Trust Ltd. Series 2018-CRE1,
Class A |
|
| | 125,000 | | | | 1.339 | | | | 06/15/2036 | | | | 122,826 | |
| | | | | | | | | | | | | | |
| | | | | | | | | | | | | 470,435 | |
| | |
| Collateralized Loan Obligations(b)(c) – 4.4% | |
| | CBAM Ltd. Series 2018-5A, Class A | |
| | 525,000 | | | | 1.238 | | | | 04/17/2031 | | | | 522,276 | |
| | Crown City CLO I Series 2020-1A, Class A1 | |
| | 250,000 | | | | 2.357 | | | | 07/20/2030 | | | | 251,052 | |
| | |
| | |
| The accompanying notes are an integral part of these financial statements. | | 29 |
GOLDMAN SACHS VARIABLE INSURANCE TRUST CORE FIXED INCOME FUND
Schedule of Investments (continued)
December 31, 2020
| | | | | | | | | | | | | | |
Principal
Amount | | | Interest
Rate | | | Maturity
Date | | | Value | |
|
| Asset-Backed Securities(a) – (continued) | |
| Collateralized Loan Obligations(b)(c) – (continued) | |
| | Cutwater Ltd. Series 2014-1A, Class A1AR | |
| $ | 164,445 | | | | 1.487 % | | | | 07/15/2026 | | | $ | 164,203 | |
| | Elmwood CLO IV Ltd. Series 2020-1A, Class A | |
| | 600,000 | | | | 1.477 | | | | 04/15/2033 | | | | 600,697 | |
| | Halseypoint CLO 2 Ltd. Series 2020-2A, Class A1 | |
| | 300,000 | | | | 2.078 | | | | 07/20/2031 | | | | 300,932 | |
| | HalseyPoint CLO 3 Ltd. Series 2020-3A, Class A1A | |
| | 250,000 | | | | 1.629 | | | | 11/30/2032 | | | | 250,949 | |
| | Jamestown CLO XV Ltd. Series 2020-15A, Class A | |
| | 300,000 | | | | 1.577 | | | | 04/15/2033 | | | | 300,425 | |
| | Marble Point CLO XVII Ltd. Series 2020-1A, Class A | |
| | 500,000 | | | | 1.518 | | | | 04/20/2033 | | | | 500,390 | |
| | Venture 39 CLO Ltd. Series 2020-39A, Class A1 | |
| | 275,000 | | | | 1.517 | | | | 04/15/2033 | | | | 275,212 | |
| | | | | | | | | | | | | | |
| | | | | | | | | | | | | 3,166,136 | |
| | |
| Home Equity(b) – 0.1% | |
| | GMACM Home Equity Loan Trust Series 2007-HE3, Class 2A1 | |
| | 40,865 | | | | 7.000 | | | | 09/25/2037 | | | | 41,474 | |
| | |
| | TOTAL ASSET-BACKED SECURITIES | |
| | (Cost $3,776,047) | | | $ | 3,778,106 | |
| | |
| | |
|
| Foreign Government Securities – 1.9% | |
| | Republic of Colombia(a) | |
| $ | 200,000 | | | | 4.125% | | | | 05/15/2051 | | | $ | 222,200 | |
| | Republic of Peru(a) | |
| | 20,000 | | | | 2.780 | | | | 12/01/2060 | | | | 20,130 | |
| | 20,000 | | | | 3.230 | | | | 07/28/2121 | | | | 19,990 | |
| | Romania Government Bond | |
| EUR | 70,000 | | | | 2.875 | | | | 03/11/2029 | | | | 96,526 | |
| | 10,000 | | | | 2.124(c) | | | | 07/16/2031 | | | | 12,926 | |
| | 30,000 | | | | 2.625(c) | | | | 12/02/2040 | | | | 38,986 | |
| | 10,000 | | | | 4.625(c) | | | | 04/03/2049 | | | | 16,492 | |
| | State of Israel AID Bond(e) | |
| $ | 200,000 | | | | 5.500 | | | | 12/04/2023 | | | | 230,186 | |
| | 100,000 | | | | 5.500 | | | | 04/26/2024 | | | | 117,040 | |
| | United Arab Emirates Government Bond(c) | |
| | 220,000 | | | | 3.125 | | | | 10/11/2027 | | | | 246,056 | |
| | United Mexican States(a) | |
| EUR | 100,000 | | | | 1.625 | | | | 04/08/2026 | | | | 126,899 | |
| $ | 200,000 | | | | 3.250 | | | | 04/16/2030 | | | | 216,750 | |
| | |
| | TOTAL FOREIGN GOVERNMENT SECURITIES | |
| | (Cost $1,258,982) | | | $ | 1,364,181 | |
| | |
| | | | | | | | | | | | | | |
|
| Municipal Bonds – 1.1% | |
| California – 0.4% | |
| | California State Various Purpose GO Bonds Series 2010 | |
| $ | 105,000 | | | | 7.625% | | | | 03/01/2040 | | | $ | 182,231 | |
| | Fresno Unified School District GO Refunding Bonds Series 2020 | |
| | 35,000 | | | | 1.162 | | | | 08/01/2026 | | | | 35,207 | |
| | |
| | | | | | | | | | | | | | |
Principal
Amount | | | Interest
Rate | | | Maturity
Date | | | Value | |
|
| Municipal Bonds – (continued) | |
| California – (continued) | |
| San Jose Financing Authority RB for Civic Center Refunding
Project Series 2020 A |
|
| $ | 25,000 | | | | 1.812 % | | | | 06/01/2029 | | | $ | 25,102 | |
| | 25,000 | | | | 1.862 | | | | 06/01/2030 | | | | 24,975 | |
| | | | | | | | | | | | | | |
| | | | | | | | | | | | | 267,515 | |
| | |
| Florida – 0.1% | |
| | State Board of Administration Finance Corp. RB Series 2020 A | |
| | 70,000 | | | | 2.154 | | | | 07/01/2030 | | | | 73,656 | |
| | |
| Illinois – 0.2% | |
| | Illinois State GO Bonds for Build America Bonds Series 2010-5 | |
| | 100,000 | | | | 7.350 | | | | 07/01/2035 | | | | 119,226 | |
| | Illinois State GO Bonds Pension Funding Series 2003 | |
| | 25,000 | | | | 5.100 | | | | 06/01/2033 | | | | 26,905 | |
| | | | | | | | | | | | | | |
| | | | | | | | | | | | | 146,131 | |
| | |
| New York – 0.2% | |
| | City of New York GO Bonds Series 2021 D(f) | |
| | 65,000 | | | | 0.982 | | | | 08/01/2025 | | | | 65,331 | |
| | 80,000 | | | | 1.396 | | | | 08/01/2027 | | | | 80,790 | |
| | | | | | | | | | | | | | |
| | | | | | | | | | | | | 146,121 | |
| | |
| Ohio – 0.2% | |
| American Municipal Power, Inc. RB Build America Bond Series
2010 E RMKT |
|
| | 100,000 | | | | 6.270 | | | | 02/15/2050 | | | | 141,989 | |
| | |
| | TOTAL MUNICIPAL BONDS | |
| | (Cost $636,875) | | | $ | 775,412 | |
| | |
| | |
|
| U.S. Treasury Obligations – 11.4% | |
| | U.S. Treasury Bonds | |
| $ | 140,000 | | | | 3.375% | | | | 11/15/2048 | | | $ | 196,525 | |
| | 150,000 | | | | 2.000 | | | | 02/15/2050 | | | | 162,844 | |
| | 350,000 | | | | 1.625 | | | | 11/15/2050 | | | | 348,195 | |
| | U.S. Treasury Notes | |
| | 3,030,000 | | | | 2.375 | | | | 03/15/2022 | | | | 3,111,550 | |
| | 810,000 | | | | 2.250 | | | | 04/30/2024 | | | | 865,118 | |
| | 890,000 | | | | 0.375 | | | | 12/31/2025 | | | | 890,556 | |
| | 910,000 | | | | 0.625 | | | | 12/31/2027 | | | | 908,578 | |
| | 1,440,000 | | | | 3.125 | | | | 11/15/2028 | | | | 1,704,150 | |
| | |
| | TOTAL U.S. TREASURY OBLIGATIONS | |
| | (Cost $8,156,703) | | | $ | 8,187,516 | |
| | |
| | |
| 30 | | The accompanying notes are an integral part of these financial statements. |
GOLDMAN SACHS VARIABLE INSURANCE TRUST CORE FIXED INCOME FUND
| | | | | | | | |
| Shares | | | Dividend Rate | | Value | |
|
| Investment Company(g) – 16.6% | |
| Goldman Sachs Financial Square Government Fund —
Institutional Shares |
|
| | 11,891,553 | | | 0.026% | | $ | 11,891,553 | |
| | (Cost $11,891,553) | | | | |
| | |
| | TOTAL INVESTMENTS – 114.6% | |
| | (Cost $79,037,432) | | $ | 82,287,595 | |
| | |
| LIABILITIES IN EXCESS OF
OTHER ASSETS – (14.6)% | | | (10,462,793 | ) |
| | |
| | NET ASSETS – 100.0% | | $ | 71,824,802 | |
| | |
| | |
| The percentage shown for each investment category reflects the value of investments in that category as a percentage of net assets. |
| |
| (a) | | Securities with “Call” features. Maturity dates disclosed are the final maturity dates. |
| |
| (b) | | Variable rate security. Except for floating rate notes (for which final maturity is disclosed), maturity date disclosed is the next interest reset date. Interest rate disclosed is that which is in effect on December 31, 2020. |
| |
| (c) | | Exempt from registration under Rule 144A of the Securities Act of 1933. |
| |
| (d) | | TBA (To Be Announced) Securities are purchased on a forward commitment basis with an approximate principal amount and no defined maturity date. The actual principal and maturity date will be determined upon settlement when the specific mortgage pools are assigned. Total market value of TBA securities (excluding forward sales contracts, if any) amounts to $11,556,615 which represents approximately 16.1% of net assets as of December 31, 2020. |
| |
| (e) | | Guaranteed by the United States Government. Total market value of these securities amounts to $347,226, which represents 0.5% of net assets as of December 31, 2020. |
| |
| (f) | | When-issued security. |
| |
| (g) | | Represents an Affiliated Issuer. |
| | |
| |
| Investment Abbreviations: |
| BA | | —Banker Acceptance Rate |
| BBR | | —Bank Bill Reference Rate |
| EURIBOR | | —Euro Interbank Offered Rate |
| ESTR | | —Euro Short Term Rate |
| FHLB | | —Federal Home Loan Bank |
| FHLMC | | —Federal Home Loan Mortgage Corp. |
| FNMA | | —Federal National Mortgage Association |
| GNMA | | —Government National Mortgage Association |
| GO | | —General Obligation |
| LIBOR | | —London Interbank Offered Rate |
| Mo. | | —Month |
| NIBOR | | —Norwegian Interbank Offered Rate |
| RB | | —Revenue Bond |
| REMIC | | —Real Estate Mortgage Investment Conduit |
| RMKT | | —Remarketed |
| SOFR | | —Secured Overnight Financing Rate |
| STIBOR | | —Stockholm Interbank Offered Rate |
| T-Note | | —Treasury Note |
| UMBS | | —Uniform Mortgage-Backed Securities |
| Yr. | | —Year |
|
| Currency Abbreviations: |
| AUD | | —Australian Dollar |
| CAD | | —Canadian Dollar |
| CHF | | —Swiss Franc |
| EUR | | —Euro |
| GBP | | —British Pound |
| JPY | | —Japanese Yen |
| NOK | | —Norwegian Krone |
| NZD | | —New Zealand Dollar |
| SEK | | —Swedish Krona |
| USD | | —United States Dollar |
ADDITIONAL INVESTMENT INFORMATION
FORWARD FOREIGN CURRENCY EXCHANGE CONTRACTS — At December 31, 2020, the Fund had the following forward foreign currency exchange contracts:
FORWARD FOREIGN CURRENCY EXCHANGE CONTRACTS WITH UNREALIZED GAIN
| | | | | | | | | | | | | | | | |
| Counterparty | | Currency
Purchased | | | Currency
Sold | | | Settlement
Date | | | Unrealized
Gain | |
Morgan Stanley Co., Inc. | | AUD | 348,687 | | | USD | 266,351 | | | | 03/11/2021 | | | $ | 2,618 | |
| | AUD | 9,610 | | | USD | 7,185 | | | | 03/17/2021 | | | | 228 | |
| | CAD | 21,717 | | | USD | 16,995 | | | | 03/17/2021 | | | | 69 | |
| | EUR | 791,760 | | | USD | 935,189 | | | | 01/21/2021 | | | | 32,467 | |
| | EUR | 385,863 | | | USD | 468,455 | | | | 03/17/2021 | | | | 3,698 | |
| | GBP | 301,291 | | | USD | 388,312 | | | | 01/13/2021 | | | | 23,739 | |
| | JPY | 28,329,582 | | | USD | 272,577 | | | | 03/17/2021 | | | | 2,013 | |
| | |
| The accompanying notes are an integral part of these financial statements. | | 31 |
GOLDMAN SACHS VARIABLE INSURANCE TRUST CORE FIXED INCOME FUND
Schedule of Investments (continued)
December 31, 2020
ADDITIONAL INVESTMENT INFORMATION (continued)
FORWARD FOREIGN CURRENCY EXCHANGE CONTRACTS WITH UNREALIZED GAIN (continued)
| | | | | | | | | | | | | | | | |
| Counterparty | | Currency
Purchased | | | Currency
Sold | | | Settlement
Date | | | Unrealized
Gain | |
| | JPY | 11,613,101 | | | USD | 112,213 | | | | 03/18/2021 | | | $ | 351 | |
| | SEK | 1,653,000 | | | USD | 196,268 | | | | 02/26/2021 | | | | 4,756 | |
| | | USD | 145,487 | | | CAD | 184,715 | | | | 03/11/2021 | | | | 347 | |
| | | |
| TOTAL | | | | | | | | | | | $ | 70,286 | |
FORWARD FOREIGN CURRENCY EXCHANGE CONTRACTS WITH UNREALIZED LOSS
| | | | | | | | | | | | | | | | |
| Counterparty | | Currency
Purchased | | | Currency
Sold | | | Settlement
Date | | | Unrealized
Loss | |
Morgan Stanley Co., Inc. | | CAD | 258,925 | | | USD | 203,937 | | | | 03/11/2021 | | | $ | (486 | ) |
| | USD | 124,873 | | | AUD | 163,475 | | | | 03/11/2021 | | | | (1,228 | ) |
| | USD | 196,691 | | | AUD | 262,971 | | | | 03/17/2021 | | | | (6,167 | ) |
| | USD | 239,282 | | | CAD | 305,816 | | | | 03/17/2021 | | | | (1,018 | ) |
| | USD | 1,204,751 | | | EUR | 1,017,786 | | | | 01/21/2021 | | | | (39,144 | ) |
| | USD | 627,152 | | | GBP | 486,879 | | | | 01/13/2021 | | | | (38,712 | ) |
| | USD | 88,130 | | | JPY | 9,120,762 | | | | 03/18/2021 | | | | (276 | ) |
| | USD | 54,236 | | | NOK | 475,327 | | | | 03/01/2021 | | | | (1,192 | ) |
| | USD | 230,302 | | | NOK | 2,007,912 | | | | 03/17/2021 | | | | (3,820 | ) |
| | USD | 197,618 | | | NZD | 279,134 | | | | 03/17/2021 | | | | (3,282 | ) |
| | USD | 217,529 | | | SEK | 1,832,063 | | | | 02/26/2021 | | | | (5,271 | ) |
| | | USD | 254,481 | | | SEK | 2,149,780 | | | | 03/17/2021 | | | | (7,010 | ) |
| | | |
| TOTAL | | | | | | | | | | | $ | (107,606 | ) |
FUTURES CONTRACTS — At December 31, 2020, the Fund had the following futures contracts:
| | | | | | | | | | | | | | | | |
| Description | | Number of
Contracts | | | Expiration Date | | | Notional
Amount | | | Unrealized
Appreciation/
(Depreciation) | |
| |
Long position contracts: | | | | | |
| U.S. Treasury 2 Year Note | | | 22 | | | | 03/31/2021 | | | $ | 4,861,141 | | | $ | 4,024 | |
| U.S. Treasury 10 Year Note | | | 10 | | | | 03/22/2021 | | | | 1,380,312 | | | | 218 | |
| U.S. Treasury Long Bond | | | 25 | | | | 03/22/2021 | | | | 4,323,438 | | | | (40,348 | ) |
U.S. Treasury Ultra Bond | | | 24 | | | | 03/22/2021 | | | | 5,112,750 | | | | (64,413 | ) |
| | | | |
| Total | | | | | | | | | | | | | | $ | (100,519 | ) |
| |
Short position contracts: | | | | | |
| Euro-Buxl | | | (1) | | | | 03/08/2021 | | | $ | (275,164 | ) | | $ | (2,336 | ) |
| U.S. Treasury 5 Year Note | | | (26) | | | | 03/31/2021 | | | | (3,279,656 | ) | | | (2,326 | ) |
U.S. Treasury 10 Year Ultra Note | | | (25) | | | | 03/22/2021 | | | | (3,905,469 | ) | | | 15,082 | |
| | | | |
| Total | | | | | | | | | | | | | | $ | 10,420 | |
| |
| Total Futures Contracts | | | $ | (90,099 | ) |
| | |
| 32 | | The accompanying notes are an integral part of these financial statements. |
GOLDMAN SACHS VARIABLE INSURANCE TRUST CORE FIXED INCOME FUND
ADDITIONAL INVESTMENT INFORMATION (continued)
SWAP CONTRACTS — At December 31, 2020, the Fund had the following swap contracts:
CENTRALLY CLEARED CREDIT DEFAULT SWAP CONTRACTS
| | | | | | | | | | | | | | | | | | | | | | | | | | |
Reference
Obligation/Index(a) | | Financing
Rate
Received
(Paid) by
the Fund | | | Credit
Spread at
December 31,
2020(b) | | | Termination
Date | | Notional
Amount
(000’s) | | | Value | | | Upfront
Premium
(Received)
Paid | | | Unrealized
Appreciation/
(Depreciation) | |
| |
Protection Sold: | | | | |
| General Electric Co. | | | 1.000 | % | | | 0.754 | % | | 06/20/2024 | | | USD 125 | | | $ | 1,100 | | | $ | (1,478 | ) | | $ | 2,578 | |
| General Electric Co. | | | 1.000 | | | | 0.888 | | | 12/20/2024 | | | 50 | | | | 236 | | | | (637 | ) | | | 873 | |
| Markit CDX North America Investment Grade Index | | | 1.000 | | | | 0.418 | | | 06/20/2023 | | | 1,025 | | | | 15,065 | | | | 10,840 | | | | 4,225 | |
| Markit CDX North America Investment Grade Index | | | 1.000 | | | | 0.629 | | | 06/20/2025 | | | 3,500 | | | | 58,192 | | | | 53,313 | | | | 4,879 | |
| Markit CDX North America Investment Grade Index | | | 1.000 | | | | 0.500 | | | 12/20/2025 | | | 575 | | | | 14,261 | | | | 13,842 | | | | 419 | |
| Prudential Financial, Inc. | | | 1.000 | | | | 0.359 | | | 06/20/2024 | | | 75 | | | | 1,696 | | | | 879 | | | | 817 | |
| Republic of Chile | | | 1.000 | | | | 0.266 | | | 06/20/2024 | | | 20 | | | | 518 | | | | 428 | | | | 90 | |
| Republic of Colombia | | | 1.000 | | | | 0.554 | | | 06/20/2024 | | | 210 | | | | 3,318 | | | | 601 | | | | 2,717 | |
| Republic of Indonesia | | | 1.000 | | | | 0.449 | | | 06/20/2024 | | | 160 | | | | 3,109 | | | | 453 | | | | 2,656 | |
| Republic of Peru | | | 1.000 | | | | 0.357 | | | 06/20/2024 | | | 40 | | | | 909 | | | | 647 | | | | 262 | |
| Russian Federation | | | 1.000 | | | | 0.687 | | | 12/20/2024 | | | 30 | | | | 380 | | | | (208 | ) | | | 588 | |
| State of Qatar | | | 1.000 | | | | 0.237 | | | 06/20/2024 | | | 20 | | | | 539 | | | | 293 | | | | 246 | |
| State of Qatar | | | 1.000 | | | | 0.270 | | | 12/20/2024 | | | 10 | | | | 294 | | | | 171 | | | | 123 | |
| United Mexican States | | | 1.000 | | | | 0.497 | | | 06/20/2024 | | | 20 | | | | 356 | | | | (206 | ) | | | 562 | |
| | | | | | | |
| TOTAL | | | | | | | | | | | | | | | | $ | 99,973 | | | $ | 78,938 | | | $ | 21,035 | |
| (a) | Payments received quarterly. |
| (b) | Credit spread on the referenced obligation, together with the period of expiration, are indicators of payment/performance risk. The likelihood of a credit event occurring which would require a fund or its counterparty to make a payment or otherwise be required to perform under the swap contract is generally greater as the credit spread and term of the swap contract increase. |
OVER THE COUNTER CREDIT DEFAULT SWAP CONTRACTS
| | | | | | | | | | | | | | | | | | | | | | | | | | | | | | |
Reference
Obligation/Index(a) | | Financing
Rate
Received
(Paid) by
the Fund | | | Credit
Spread at
December 31,
2020(b) | | | Counterparty | | Termination
Date | | | Notional
Amount
(000’s) | | | Value | | | Upfront
Premium
(Received)
Paid | | | Unrealized
Appreciation/
(Depreciation) | |
| |
Protection Sold: | | | | | |
| Markit CMBX North American BBB- 11 | | | 3.000 | % | | | 4.300 | % | | Morgan Stanley Co., Inc. | | | 11/18/2054 | | | | USD 200 | | | $ | (15,701 | ) | | $ | (56,506 | ) | | $ | 40,805 | |
| Markit CMBX North American BBB- 8 | | | 3.000 | | | | 7.858 | | | | | | 10/17/2057 | | | | 100 | | | | (15,997 | ) | | | (27,343 | ) | | | 11,346 | |
| | | | | | | | |
| TOTAL | | | | | | | | | | | | | | | | | | | | $ | (31,698 | ) | | $ | (83,849 | ) | | $ | 52,151 | |
| (a) | Payments received monthly. |
| (b) | Credit spread on the referenced obligation, together with the period of expiration, are indicators of payment/performance risk. The likelihood of a credit event occurring which would require a fund or its counterparty to make a payment or otherwise be required to perform under the swap contract is generally greater as the credit spread and term of the swap contract increase. |
| | |
| The accompanying notes are an integral part of these financial statements. | | 33 |
GOLDMAN SACHS VARIABLE INSURANCE TRUST CORE FIXED INCOME FUND
Schedule of Investments (continued)
December 31, 2020
ADDITIONAL INVESTMENT INFORMATION (continued)
CENTRALLY CLEARED INTEREST RATE SWAP CONTRACTS
| | | | | | | | | | | | | | | | | | | | | | | | |
Payments Made by the Fund | | Payments Received by the Fund | | | Termination
Date | | | Notional
Amount
(000’s)(a) | | | Value | | | Upfront
Premium
(Received)
Paid | | | Unrealized
Appreciation/
(Depreciation) | |
| 3 Month BA(b) | | | 0.700% | | | | 11/18/2023 | | | CAD | 1,720 | | | $ | 1,526 | | | $ | 35 | | | $ | 1,491 | |
| 3 Month BA(b) | | | 0.750 | | | | 03/17/2024 | | | | 1,850 | | | | 5,178 | | | | 2,540 | | | | 2,638 | |
| 0.250%(b) | | | 3 Month LIBOR | | | | 03/17/2024 | | | USD | 1,440 | | | | 351 | | | | 1,527 | | | | (1,176 | ) |
| 3 Month BA(b) | | | 0.810 | | | | 09/30/2024 | | | CAD | 1,330 | | | | (690 | ) | | | 120 | | | | (810 | ) |
| 3 Month BA(b) | | | 0.960 | | | | 11/09/2024 | | | | 2,420 | | | | 3,398 | | | | 2,487 | | | | 911 | |
| 3 Month BA(b) | | | 0.813 | | | | 11/17/2024 | | | | 2,100 | | | | 2,464 | | | | (683 | ) | | | 3,147 | |
| 0.400(b) | | | 3 Month LIBOR | | | | 11/17/2024 | | | USD | 1,620 | | | | (2,455 | ) | | | 587 | | | | (3,042 | ) |
| 6 Month BBR(b) | | | 0.553 | | | | 05/16/2025 | | | AUD | 290 | | | | 907 | | | | (786 | ) | | | 1,693 | |
| (0.500)(c) | | | 1 Day ESTR | | | | 05/18/2025 | | | EUR | 220 | | | | (713 | ) | | | (592 | ) | | | (121 | ) |
| 6 Month BBR(b) | | | 0.500 | | | | 11/25/2025 | | | AUD | 1,630 | | | | (1,952 | ) | | | (1,332 | ) | | | (620 | ) |
| (0.500)(c) | | | 1 Day ESTR | | | | 03/17/2026 | | | EUR | 1,110 | | | | (5,174 | ) | | | (7,559 | ) | | | 2,385 | |
| 6 Month NIBOR(b) | | | 0.750 | | | | 03/17/2026 | | | NOK | 1,380 | | | | (1,838 | ) | | | (1,069 | ) | | | (769 | ) |
| 3 Month STIBOR(d) | | | 0.000 | | | | 03/17/2026 | | | SEK | 7,400 | | | | (6,812 | ) | | | (4,384 | ) | | | (2,428 | ) |
| 6 Month LIBOR(b) | | | (0.500) | | | | 03/17/2028 | | | CHF | 600 | | | | (3,646 | ) | | | (2,546 | ) | | | (1,100 | ) |
| (0.500)(c) | | | 1 Day ESTR | | | | 03/17/2028 | | | EUR | 470 | | | | (533 | ) | | | (1,918 | ) | | | 1,385 | |
| 6 Month BBR(b) | | | 0.920 | | | | 09/04/2028 | | | AUD | 1,950 | | | | (9,466 | ) | | | (1,735 | ) | | | (7,731 | ) |
| 6 Month EURIBOR(b) | | | 0.050 | | | | 05/21/2030 | | | EUR | 630 | | | | 7,494 | | | | 7,624 | | | | (130 | ) |
| 6 Month BBR(b) | | | 1.240 | | | | 10/28/2030 | | | AUD | 600 | | | | (7,374 | ) | | | (5,003 | ) | | | (2,371 | ) |
| 1.240(c) | | | 6 Month NIBOR | | | | 10/29/2030 | | | NOK | 5,050 | | | | 10,434 | | | | 4,055 | | | | 6,379 | |
| 6 Month BBR(b) | | | 1.250 | | | | 11/09/2030 | | | AUD | 850 | | | | (10,362 | ) | | | (8,402 | ) | | | (1,960 | ) |
| 1.430(b) | | | 3 Month BA | | | | 11/09/2030 | | | CAD | 480 | | | | (2,001 | ) | | | (1,830 | ) | | | (171 | ) |
| 1.190(b) | | | 3 Month LIBOR | | | | 11/10/2030 | | | USD | 600 | | | | 6,512 | | | | 4,188 | | | | 2,324 | |
| 0.144(b) | | | 6 Month LIBOR | | | | 11/13/2030 | | | JPY | 131,040 | | | | (1,458 | ) | | | (1,599 | ) | | | 141 | |
| 3 Month LIBOR(d) | | | 1.245 | | | | 11/24/2030 | | | USD | 490 | | | | (4,152 | ) | | | (629 | ) | | | (3,523 | ) |
| 1.543(b) | | | 3 Month LIBOR | | | | 11/25/2035 | | | | 550 | | | | 5,527 | | | | 264 | | | | 5,263 | |
| 0.260(c) | | | 6 Month EURIBOR | | | | 05/21/2040 | | | EUR | 300 | | | | 187 | | | | (1,847 | ) | | | 2,034 | |
| 0.000(c) | | | 6 Month EURIBOR | | | | 03/17/2051 | | | | 160 | | | | (1,638 | ) | | | (2,015 | ) | | | 377 | |
| | | | | | |
| TOTAL | | | | | | | | | | | | | | $ | (16,286 | ) | | $ | (20,502 | ) | | $ | 4,216 | |
| (a) | Represents forward starting interest rate swaps whose effective dates of commencement of accruals and cash flows occur subsequent to December 31, 2020. |
| (b) | Payments made semi-annually. |
| (c) | Payments made annually. |
| (d) | Payments made quarterly |
| | |
| 34 | | The accompanying notes are an integral part of these financial statements. |
GOLDMAN SACHS VARIABLE INSURANCE TRUST CORE FIXED INCOME FUND
ADDITIONAL INVESTMENT INFORMATION (continued)
PURCHASED & WRITTEN OPTIONS CONTRACTS — At December 31, 2020, the Fund had the following purchased & written options contracts:
OVER THE COUNTER INTEREST RATE SWAPTIONS
| | | | | | | | | | | | | | | | | | | | | | | | | | | | | | | | |
| Description | | Counterparty | | | Exercise
Rate | | | Expiration
Date | | | Number of
Contracts | | | Notional
Amount | | | Market
Value | | | Premiums
Paid (Received)
by Fund | | | Unrealized
Appreciation/
(Depreciation) | |
|
Purchased option contracts | |
|
Calls | |
| 3M IRS | | | JPMorgan Chase Bank NA | | | | 0.783 | % | | | 02/16/2021 | | | | 320,000 | | | $ | 320,000 | | | $ | 951 | | | $ | 1,596 | | | $ | (645 | ) |
3M IRS | | | Morgan Stanley Co., Inc. | | | | 0.610 | | | | 01/15/2021 | | | | 140,000 | | | | 140,000 | | | | 9 | | | | 763 | | | | (754 | ) |
| | | | | |
| Total Purchased option contracts | | | | 460,000 | | | | | | | $ | 960 | | | $ | 2,359 | | | $ | (1,399 | ) |
|
Written option contracts | |
|
Calls | |
| 6M IRS | | | Bank of America NA | | | | (0.293 | )% | | | 02/16/2021 | | | | (390,000 | ) | | $ | (390,000 | ) | | $ | (1,297 | ) | | $ | (1,468 | ) | | $ | 171 | |
| 6M IRS | | | JPMorgan Chase Bank NA | | | | (0.020 | ) | | | 03/10/2021 | | | | (80,000 | ) | | | (80,000 | ) | | | (2,448 | ) | | | (2,554 | ) | | | 106 | |
| 6M IRS | | | Morgan Stanley Co., Inc. | | | | (0.250 | ) | | | 01/14/2021 | | | | (220,000 | ) | | | (220,000 | ) | | | (679 | ) | | | (1,989 | ) | | | 1,310 | |
| 6M IRS | | | | | | | (0.390 | ) | | | 01/15/2021 | | | | (170,000 | ) | | | (170,000 | ) | | | (8 | ) | | | (692 | ) | | | 684 | |
| 6M IRS | | | | | | | 0.021 | | | | 03/02/2021 | | | | (80,000 | ) | | | (80,000 | ) | | | (3,005 | ) | | | (2,647 | ) | | | (358 | ) |
6M IRS | | | | | | | 0.000 | | | | 03/08/2021 | | | | (80,000 | ) | | | (80,000 | ) | | | (2,730 | ) | | | (2,663 | ) | | | (67 | ) |
| | | | | | | | |
| Total calls | | | | | | | | | | | | | | | (1,020,000 | ) | | | | | | $ | (10,167 | ) | | $ | (12,013 | ) | | $ | 1,846 | |
| | | | | | | | |
Puts | | | | | | | | | | | | | | | | | | | | | | | | | | | | | | | | |
6M IRS | | | Morgan Stanley Co., Inc. | | | | 0.000 | % | | | 01/14/2021 | | | | (220,000 | ) | | $ | (220,000 | ) | | $ | (6 | ) | | $ | (691 | ) | | $ | 685 | |
| | | | | |
| Total written option contracts | | | | (1,240,000 | ) | | | | | | $ | (10,173 | ) | | $ | (12,704 | ) | | $ | 2,531 | |
| | |
| The accompanying notes are an integral part of these financial statements. | | 35 |
GOLDMAN SACHS VARIABLE INSURANCE TRUST EQUITY INDEX FUND
Schedule of Investments
December 31, 2020
| | | | | | | | |
| Shares | | | Description | | Value | |
|
| Common Stocks – 99.2% | |
| Automobiles & Components – 2.1% | |
| | 1,602 | | | Aptiv plc | | $ | 208,724 | |
| | 1,476 | | | BorgWarner, Inc. | | | 57,033 | |
| | 22,959 | | | Ford Motor Co. | | | 201,810 | |
| | 7,290 | | | General Motors Co. | | | 303,556 | |
| | 4,414 | | | Tesla, Inc.* | | | 3,114,828 | |
| | | | | | | | |
| | | | | | | 3,885,951 | |
| | |
| Banks – 3.8% | |
| | 44,425 | | | Bank of America Corp. | | | 1,346,522 | |
| | 12,130 | | | Citigroup, Inc. | | | 747,936 | |
| | 2,545 | | | Citizens Financial Group, Inc. | | | 91,009 | |
| | 774 | | | Comerica, Inc. | | | 43,236 | |
| | 4,059 | | | Fifth Third Bancorp | | | 111,907 | |
| | 1,020 | | | First Republic Bank | | | 149,868 | |
| | 5,981 | | | Huntington Bancshares, Inc. | | | 75,540 | |
| | 17,736 | | | JPMorgan Chase & Co. | | | 2,253,713 | |
| | 5,526 | | | KeyCorp | | | 90,682 | |
| | 746 | | | M&T Bank Corp. | | | 94,966 | |
| | 2,606 | | | People’s United Financial, Inc. | | | 33,695 | |
| | 2,459 | | | PNC Financial Services Group, Inc. (The) | | | 366,391 | |
| | 5,672 | | | Regions Financial Corp. | | | 91,433 | |
| | 294 | | | SVB Financial Group* | | | 114,022 | |
| | 7,826 | | | Truist Financial Corp. | | | 375,100 | |
| | 7,918 | | | US Bancorp | | | 368,899 | |
| | 24,087 | | | Wells Fargo & Co. | | | 726,946 | |
| | 945 | | | Zions Bancorp NA | | | 41,051 | |
| | | | | | | | |
| | | | | | | 7,122,916 | |
| | |
| Capital Goods – 5.7% | |
| | 3,358 | | | 3M Co. | | | 586,945 | |
| | 835 | | | A O Smith Corp. | | | 45,775 | |
| | 564 | | | Allegion plc | | | 65,638 | |
| | 1,320 | | | AMETEK, Inc. | | | 159,641 | |
| | 3,091 | | | Boeing Co. (The) | | | 661,659 | |
| | 4,799 | | | Carrier Global Corp. | | | 181,018 | |
| | 3,162 | | | Caterpillar, Inc. | | | 575,547 | |
| | 878 | | | Cummins, Inc. | | | 199,394 | |
| | 1,822 | | | Deere & Co. | | | 490,209 | |
| | 820 | | | Dover Corp. | | | 103,525 | |
| | 2,354 | | | Eaton Corp. plc | | | 282,810 | |
| | 3,464 | | | Emerson Electric Co. | | | 278,402 | |
| | 3,383 | | | Fastenal Co. | | | 165,192 | |
| | 720 | | | Flowserve Corp. | | | 26,532 | |
| | 1,820 | | | Fortive Corp. | | | 128,892 | |
| | 837 | | | Fortune Brands Home & Security, Inc. | | | 71,748 | |
| | 1,334 | | | General Dynamics Corp. | | | 198,526 | |
| | 50,979 | | | General Electric Co. | | | 550,573 | |
| | 4,091 | | | Honeywell International, Inc. | | | 870,156 | |
| | 2,222 | | | Howmet Aerospace, Inc.* | | | 63,416 | |
| | 219 | | | Huntington Ingalls Industries, Inc. | | | 37,335 | |
| | 449 | | | IDEX Corp. | | | 89,441 | |
| | 1,671 | | | Illinois Tool Works, Inc. | | | 340,684 | |
| | 2,107 | | | Ingersoll Rand, Inc.* | | | 95,995 | |
| | 775 | | | Jacobs Engineering Group, Inc. | | | 84,444 | |
| | |
|
| Common Stocks – (continued) | |
| Capital Goods – (continued) | |
| | 4,174 | | | Johnson Controls International plc | | | 194,467 | |
| | 1,214 | | | L3Harris Technologies, Inc. | | | 229,470 | |
| | 1,432 | | | Lockheed Martin Corp. | | | 508,331 | |
| | 1,597 | | | Masco Corp. | | | 87,723 | |
| | 898 | | | Northrop Grumman Corp. | | | 273,639 | |
| | 2,408 | | | Otis Worldwide Corp. | | | 162,660 | |
| | 2,061 | | | PACCAR, Inc. | | | 177,823 | |
| | 753 | | | Parker-Hannifin Corp. | | | 205,125 | |
| | 945 | | | Pentair plc | | | 50,170 | |
| | 867 | | | Quanta Services, Inc. | | | 62,441 | |
| | 8,843 | | | Raytheon Technologies Corp. | | | 632,363 | |
| | 687 | | | Rockwell Automation, Inc. | | | 172,306 | |
| | 605 | | | Roper Technologies, Inc. | | | 260,809 | |
| | 334 | | | Snap-on, Inc. | | | 57,161 | |
| | 947 | | | Stanley Black & Decker, Inc. | | | 169,096 | |
| | 212 | | | Teledyne Technologies, Inc.* | | | 83,100 | |
| | 1,297 | | | Textron, Inc. | | | 62,684 | |
| | 1,385 | | | Trane Technologies plc | | | 201,047 | |
| | 307 | | | TransDigm Group, Inc.* | | | 189,987 | |
| | 426 | | | United Rentals, Inc.* | | | 98,794 | |
| | 1,007 | | | Westinghouse Air Brake Technologies Corp. | | | 73,712 | |
| | 265 | | | WW Grainger, Inc. | | | 108,210 | |
| | 1,023 | | | Xylem, Inc. | | | 104,131 | |
| | | | | | | | |
| | | | | | | 10,518,746 | |
| | |
| Commercial & Professional Services – 0.7% | |
| | 519 | | | Cintas Corp. | | | 183,446 | |
| | 1,203 | | | Copart, Inc.* | | | 153,082 | |
| | 716 | | | Equifax, Inc. | | | 138,073 | |
| | 2,145 | | | IHS Markit Ltd. | | | 192,685 | |
| | 2,234 | | | Nielsen Holdings plc | | | 46,624 | |
| | 1,195 | | | Republic Services, Inc. | | | 115,078 | |
| | 697 | | | Robert Half International, Inc. | | | 43,549 | |
| | 1,323 | | | Rollins, Inc. | | | 51,690 | |
| | 956 | | | Verisk Analytics, Inc. | | | 198,456 | |
| | 2,283 | | | Waste Management, Inc. | | | 269,234 | |
| | | | | | | | |
| | | | | | | 1,391,917 | |
| | |
| Consumer Durables & Apparel – 1.2% | |
| | 1,899 | | | DR Horton, Inc. | | | 130,879 | |
| | 846 | | | Garmin Ltd. | | | 101,232 | |
| | 2,220 | | | Hanesbrands, Inc. | | | 32,368 | |
| | 739 | | | Hasbro, Inc. | | | 69,126 | |
| | 759 | | | Leggett & Platt, Inc. | | | 33,624 | |
| | 1,646 | | | Lennar Corp. Class A | | | 125,475 | |
| | 373 | | | Mohawk Industries, Inc.* | | | 52,574 | |
| | 2,316 | | | Newell Brands, Inc. | | | 49,169 | |
| | 7,319 | | | NIKE, Inc. Class B | | | 1,035,419 | |
| | 21 | | | NVR, Inc.* | | | 85,677 | |
| | 1,535 | | | PulteGroup, Inc. | | | 66,189 | |
| | 425 | | | PVH Corp. | | | 39,903 | |
| | 305 | | | Ralph Lauren Corp. | | | 31,641 | |
| | 1,605 | | | Tapestry, Inc. | | | 49,883 | |
| | 1,254 | | | Under Armour, Inc. Class A* | | | 21,531 | |
| | |
| | |
| 36 | | The accompanying notes are an integral part of these financial statements. |
GOLDMAN SACHS VARIABLE INSURANCE TRUST EQUITY INDEX FUND
| | | | | | | | |
| Shares | | | Description | | Value | |
|
| Common Stocks – (continued) | |
| Consumer Durables & Apparel – (continued) | |
| | 1,232 | | | Under Armour, Inc. Class C* | | $ | 18,332 | |
| | 1,836 | | | VF Corp. | | | 156,813 | |
| | 377 | | | Whirlpool Corp. | | | 68,045 | |
| | | | | | | | |
| | | | | | | 2,167,880 | |
| | |
| Consumer Services – 1.7% | |
| | 4,349 | | | Carnival Corp. | | | 94,199 | |
| | 156 | | | Chipotle Mexican Grill, Inc.* | | | 216,327 | |
| | 753 | | | Darden Restaurants, Inc. | | | 89,697 | |
| | 229 | | | Domino’s Pizza, Inc. | | | 87,812 | |
| | 1,627 | | | Hilton Worldwide Holdings, Inc. | | | 181,020 | |
| | 1,934 | | | Las Vegas Sands Corp. | | | 115,266 | |
| | 1,566 | | | Marriott International, Inc. Class A | | | 206,587 | |
| | 4,345 | | | McDonald’s Corp. | | | 932,350 | |
| | 2,367 | | | MGM Resorts International | | | 74,584 | |
| | 1,370 | | | Norwegian Cruise Line Holdings Ltd.* | | | 34,839 | |
| | 1,024 | | | Royal Caribbean Cruises Ltd. | | | 76,483 | |
| | 6,838 | | | Starbucks Corp. | | | 731,529 | |
| | 596 | | | Wynn Resorts Ltd. | | | 67,247 | |
| | 1,776 | | | Yum! Brands, Inc. | | | 192,803 | |
| | | | | | | | |
| | | | | | | 3,100,743 | |
| | |
| Diversified Financials – 4.7% | |
| | 3,791 | | | American Express Co. | | | 458,370 | |
| | 701 | | | Ameriprise Financial, Inc. | | | 136,225 | |
| | 4,794 | | | Bank of New York Mellon Corp. (The) | | | 203,457 | |
| | 11,326 | | | Berkshire Hathaway, Inc. Class B* | | | 2,626,160 | |
| | 826 | | | BlackRock, Inc. | | | 595,992 | |
| | 2,701 | | | Capital One Financial Corp. | | | 266,994 | |
| | 600 | | | Cboe Global Markets, Inc. | | | 55,872 | |
| | 8,638 | | | Charles Schwab Corp. (The) | | | 458,159 | |
| | 2,074 | | | CME Group, Inc. | | | 377,572 | |
| | 1,808 | | | Discover Financial Services | | | 163,678 | |
| | 1,640 | | | Franklin Resources, Inc. | | | 40,984 | |
| | 2,001 | | | Goldman Sachs Group, Inc. (The)(a) | | | 527,684 | |
| | 3,258 | | | Intercontinental Exchange, Inc. | | | 375,615 | |
| | 2,323 | | | Invesco Ltd. | | | 40,490 | |
| | 223 | | | MarketAxess Holdings, Inc. | | | 127,235 | |
| | 935 | | | Moody’s Corp. | | | 271,374 | |
| | 8,316 | | | Morgan Stanley | | | 569,895 | |
| | 478 | | | MSCI, Inc. | | | 213,441 | |
| | 689 | | | Nasdaq, Inc. | | | 91,458 | |
| | 1,250 | | | Northern Trust Corp. | | | 116,425 | |
| | 701 | | | Raymond James Financial, Inc. | | | 67,065 | |
| | 1,399 | | | S&P Global, Inc. | | | 459,893 | |
| | 2,063 | | | State Street Corp. | | | 150,145 | |
| | 3,235 | | | Synchrony Financial | | | 112,287 | |
| | 1,299 | | | T. Rowe Price Group, Inc. | | | 196,656 | |
| | | | | | | | |
| | | | | | | 8,703,126 | |
| | |
| Energy – 2.3% | |
| | 2,202 | | | Apache Corp. | | | 31,246 | |
| | 3,974 | | | Baker Hughes Co. | | | 82,858 | |
| | 2,498 | | | Cabot Oil & Gas Corp. | | | 40,667 | |
| | 11,227 | | | Chevron Corp. | | | 948,120 | |
| | |
|
| Common Stocks – (continued) | |
| Energy – (continued) | |
| | 1,157 | | | Concho Resources, Inc. | | | 67,511 | |
| | 6,300 | | | ConocoPhillips | | | 251,937 | |
| | 2,477 | | | Devon Energy Corp. | | | 39,161 | |
| | 915 | | | Diamondback Energy, Inc. | | | 44,286 | |
| | 3,439 | | | EOG Resources, Inc. | | | 171,503 | |
| | 24,665 | | | Exxon Mobil Corp. | | | 1,016,691 | |
| | 5,330 | | | Halliburton Co. | | | 100,737 | |
| | 1,591 | | | Hess Corp. | | | 83,989 | |
| | 857 | | | HollyFrontier Corp. | | | 22,154 | |
| | 11,127 | | | Kinder Morgan, Inc. | | | 152,106 | |
| | 5,156 | | | Marathon Oil Corp. | | | 34,391 | |
| | 3,740 | | | Marathon Petroleum Corp. | | | 154,686 | |
| | 2,489 | | | National Oilwell Varco, Inc. | | | 34,174 | |
| | 4,860 | | | Occidental Petroleum Corp. | | | 84,127 | |
| | 2,537 | | | ONEOK, Inc. | | | 97,370 | |
| | 2,555 | | | Phillips 66 | | | 178,697 | |
| | 951 | | | Pioneer Natural Resources Co. | | | 108,309 | |
| | 8,134 | | | Schlumberger NV | | | 177,565 | |
| | 2,374 | | | TechnipFMC plc | | | 22,316 | |
| | 2,377 | | | Valero Energy Corp. | | | 134,467 | |
| | 6,972 | | | Williams Cos., Inc. (The) | | | 139,789 | |
| | | | | | | | |
| | | | | | | 4,218,857 | |
| | |
| Food & Staples Retailing – 1.4% | |
| | 2,573 | | | Costco Wholesale Corp. | | | 969,455 | |
| | 4,624 | | | Kroger Co. (The) | | | 146,858 | |
| | 3,006 | | | Sysco Corp. | | | 223,226 | |
| | 4,113 | | | Walgreens Boots Alliance, Inc. | | | 164,026 | |
| | 8,089 | | | Walmart, Inc. | | | 1,166,029 | |
| | | | | | | | |
| | | | | | | 2,669,594 | |
| | |
| Food, Beverage & Tobacco – 3.2% | |
| | 10,805 | | | Altria Group, Inc. | | | 443,005 | |
| | 3,198 | | | Archer-Daniels-Midland Co. | | | 161,211 | |
| | 1,055 | | | Brown-Forman Corp. Class B | | | 83,799 | |
| | 1,039 | | | Campbell Soup Co. | | | 50,236 | |
| | 22,567 | | | Coca-Cola Co. (The) | | | 1,237,574 | |
| | 2,861 | | | Conagra Brands, Inc. | | | 103,740 | |
| | 996 | | | Constellation Brands, Inc. Class A | | | 218,174 | |
| | 3,515 | | | General Mills, Inc. | | | 206,682 | |
| | 845 | | | Hershey Co. (The) | | | 128,719 | |
| | 1,579 | | | Hormel Foods Corp. | | | 73,597 | |
| | 642 | | | J M Smucker Co. (The) | | | 74,215 | |
| | 1,529 | | | Kellogg Co. | | | 95,150 | |
| | 3,869 | | | Kraft Heinz Co. (The) | | | 134,099 | |
| | 900 | | | Lamb Weston Holdings, Inc. | | | 70,866 | |
| | 1,464 | | | McCormick & Co., Inc. (Non-Voting) | | | 139,958 | |
| | 1,182 | | | Molson Coors Beverage Co. Class B | | | 53,415 | |
| | 8,304 | | | Mondelez International, Inc. Class A | | | 485,535 | |
| | 2,122 | | | Monster Beverage Corp.* | | | 196,242 | |
| | 8,063 | | | PepsiCo, Inc. | | | 1,195,743 | |
| | 9,076 | | | Philip Morris International, Inc. | | | 751,402 | |
| | 1,668 | | | Tyson Foods, Inc. Class A | | | 107,486 | |
| | | | | | | | |
| | | | | | | 6,010,848 | |
| | |
| | |
| The accompanying notes are an integral part of these financial statements. | | 37 |
GOLDMAN SACHS VARIABLE INSURANCE TRUST EQUITY INDEX FUND
Schedule of Investments (continued)
December 31, 2020
| | | | | | | | |
| Shares | | | Description | | Value | |
|
| Common Stocks – (continued) | |
| Health Care Equipment & Services – 6.5% | |
| | 10,340 | | | Abbott Laboratories | | $ | 1,132,127 | |
| | 261 | | | ABIOMED, Inc.* | | | 84,616 | |
| | 414 | | | Align Technology, Inc.* | | | 221,233 | |
| | 890 | | | AmerisourceBergen Corp. | | | 87,006 | |
| | 1,446 | | | Anthem, Inc. | | | 464,296 | |
| | 2,938 | | | Baxter International, Inc. | | | 235,745 | |
| | 1,685 | | | Becton Dickinson and Co. | | | 421,621 | |
| | 8,284 | | | Boston Scientific Corp.* | | | 297,810 | |
| | 1,761 | | | Cardinal Health, Inc. | | | 94,319 | |
| | 3,331 | | | Centene Corp.* | | | 199,960 | |
| | 1,758 | | | Cerner Corp. | | | 137,968 | |
| | 2,099 | | | Cigna Corp. | | | 436,970 | |
| | 287 | | | Cooper Cos., Inc. (The) | | | 104,273 | |
| | 7,615 | | | CVS Health Corp. | | | 520,104 | |
| | 3,685 | | | Danaher Corp. | | | 818,586 | |
| | 424 | | | DaVita, Inc.* | | | 49,778 | |
| | 1,297 | | | Dentsply Sirona, Inc. | | | 67,911 | |
| | 565 | | | DexCom, Inc.* | | | 208,892 | |
| | 3,613 | | | Edwards Lifesciences Corp.* | | | 329,614 | |
| | 1,521 | | | HCA Healthcare, Inc. | | | 250,144 | |
| | 846 | | | Henry Schein, Inc.* | | | 56,563 | |
| | 1,464 | | | Hologic, Inc.* | | | 106,623 | |
| | 767 | | | Humana, Inc. | | | 314,677 | |
| | 499 | | | IDEXX Laboratories, Inc.* | | | 249,435 | |
| | 681 | | | Intuitive Surgical, Inc.* | | | 557,126 | |
| | 574 | | | Laboratory Corp. of America Holdings* | | | 116,838 | |
| | 956 | | | McKesson Corp. | | | 166,267 | |
| | 7,848 | | | Medtronic plc | | | 919,315 | |
| | 784 | | | Quest Diagnostics, Inc. | | | 93,429 | |
| | 855 | | | ResMed, Inc. | | | 181,739 | |
| | 498 | | | STERIS plc | | | 94,391 | |
| | 1,900 | | | Stryker Corp. | | | 465,576 | |
| | 265 | | | Teleflex, Inc. | | | 109,066 | |
| | 5,520 | | | UnitedHealth Group, Inc. | | | 1,935,754 | |
| | 458 | | | Universal Health Services, Inc. Class B | | | 62,975 | |
| | 546 | | | Varian Medical Systems, Inc.* | | | 95,555 | |
| | 444 | | | West Pharmaceutical Services, Inc. | | | 125,790 | |
| | 1,230 | | | Zimmer Biomet Holdings, Inc. | | | 189,531 | |
| | | | | | | | |
| | | | | | | 12,003,623 | |
| | |
| Household & Personal Products – 1.8% | |
| | 1,456 | | | Church & Dwight Co., Inc. | | | 127,007 | |
| | 722 | | | Clorox Co. (The) | | | 145,786 | |
| | 4,981 | | | Colgate-Palmolive Co. | | | 425,925 | |
| | 1,314 | | | Estee Lauder Cos., Inc. (The) Class A | | | 349,774 | |
| | 1,966 | | | Kimberly-Clark Corp. | | | 265,076 | |
| | 14,426 | | | Procter & Gamble Co. (The) | | | 2,007,233 | |
| | | | | | | | |
| | | | | | | 3,320,801 | |
| | |
| Insurance – 1.8% | |
| | 3,759 | | | Aflac, Inc. | | | 167,163 | |
| | 1,753 | | | Allstate Corp. (The) | | | 192,707 | |
| | 5,081 | | | American International Group, Inc. | | | 192,367 | |
| | 1,324 | | | Aon plc Class A | | | 279,721 | |
| | |
|
| Common Stocks – (continued) | |
| Insurance – (continued) | |
| | 1,153 | | | Arthur J Gallagher & Co. | | | 142,638 | |
| | 365 | | | Assurant, Inc. | | | 49,720 | |
| | 2,622 | | | Chubb Ltd. | | | 403,578 | |
| | 871 | | | Cincinnati Financial Corp. | | | 76,099 | |
| | 227 | | | Everest Re Group Ltd. | | | 53,138 | |
| | 531 | | | Globe Life, Inc. | | | 50,424 | |
| | 2,094 | | | Hartford Financial Services Group, Inc. (The) | | | 102,564 | |
| | 1,127 | | | Lincoln National Corp. | | | 56,699 | |
| | 1,305 | | | Loews Corp. | | | 58,751 | |
| | 2,986 | | | Marsh & McLennan Cos., Inc. | | | 349,362 | |
| | 4,533 | | | MetLife, Inc. | | | 212,824 | |
| | 1,435 | | | Principal Financial Group, Inc. | | | 71,190 | |
| | 3,396 | | | Progressive Corp. (The) | | | 335,797 | |
| | 2,327 | | | Prudential Financial, Inc. | | | 181,669 | |
| | 1,496 | | | Travelers Cos., Inc. (The) | | | 209,994 | |
| | 1,272 | | | Unum Group | | | 29,180 | |
| | 869 | | | W R Berkley Corp. | | | 57,719 | |
| | 741 | | | Willis Towers Watson plc | | | 156,114 | |
| | | | | | | | |
| | | | | | | 3,429,418 | |
| | |
| Materials – 2.6% | |
| | 1,277 | | | Air Products and Chemicals, Inc. | | | 348,902 | |
| | 613 | | | Albemarle Corp. | | | 90,430 | |
| | 8,922 | | | Amcor plc | | | 105,012 | |
| | 481 | | | Avery Dennison Corp. | | | 74,608 | |
| | 1,883 | | | Ball Corp. | | | 175,458 | |
| | 709 | | | Celanese Corp. | | | 92,128 | |
| | 1,313 | | | CF Industries Holdings, Inc. | | | 50,826 | |
| | 4,287 | | | Corteva, Inc. | | | 165,993 | |
| | 4,272 | | | Dow, Inc. | | | 237,096 | |
| | 4,252 | | | DuPont de Nemours, Inc. | | | 302,360 | |
| | 827 | | | Eastman Chemical Co. | | | 82,932 | |
| | 1,440 | | | Ecolab, Inc. | | | 311,558 | |
| | 785 | | | FMC Corp. | | | 90,220 | |
| | 8,373 | | | Freeport-McMoRan, Inc. | | | 217,866 | |
| | 657 | | | International Flavors & Fragrances, Inc.(b) | | | 71,508 | |
| | 2,304 | | | International Paper Co. | | | 114,555 | |
| | 3,059 | | | Linde plc | | | 806,077 | |
| | 1,498 | | | LyondellBasell Industries NV Class A | | | 137,307 | |
| | 353 | | | Martin Marietta Materials, Inc. | | | 100,241 | |
| | 2,141 | | | Mosaic Co. (The) | | | 49,264 | |
| | 4,653 | | | Newmont Corp. | | | 278,668 | |
| | 1,754 | | | Nucor Corp. | | | 93,295 | |
| | 542 | | | Packaging Corp. of America | | | 74,747 | |
| | 1,355 | | | PPG Industries, Inc. | | | 195,418 | |
| | 908 | | | Sealed Air Corp. | | | 41,577 | |
| | 474 | | | Sherwin-Williams Co. (The) | | | 348,347 | |
| | 787 | | | Vulcan Materials Co. | | | 116,720 | |
| | 1,495 | | | Westrock Co. | | | 65,077 | |
| | | | | | | | |
| | | | | | | 4,838,190 | |
| | |
| Media & Entertainment – 9.0% | |
| | 4,472 | | | Activision Blizzard, Inc. | | | 415,225 | |
| | 1,750 | | | Alphabet, Inc. Class A* | | | 3,067,120 | |
| | |
| | |
| 38 | | The accompanying notes are an integral part of these financial statements. |
GOLDMAN SACHS VARIABLE INSURANCE TRUST EQUITY INDEX FUND
| | | | | | | | |
| Shares | | | Description | | Value | |
|
| Common Stocks – (continued) | |
| Media & Entertainment – (continued) | |
| | 1,690 | | | Alphabet, Inc. Class C* | | $ | 2,960,677 | |
| | 849 | | | Charter Communications, Inc. Class A* | | | 561,656 | |
| | 26,649 | | | Comcast Corp. Class A | | | 1,396,408 | |
| | 981 | | | Discovery, Inc. Class A* | | | 29,518 | |
| | 1,617 | | | Discovery, Inc. Class C* | | | 42,349 | |
| | 1,530 | | | DISH Network Corp. Class A* | | | 49,480 | |
| | 1,713 | | | Electronic Arts, Inc. | | | 245,987 | |
| | 13,995 | | | Facebook, Inc. Class A* | | | 3,822,874 | |
| | 2,022 | | | Fox Corp. Class A | | | 58,881 | |
| | 935 | | | Fox Corp. Class B | | | 27,003 | |
| | 2,371 | | | Interpublic Group of Cos., Inc. (The) | | | 55,766 | |
| | 839 | | | Live Nation Entertainment, Inc.* | | | 61,650 | |
| | 2,578 | | | Netflix, Inc.* | | | 1,394,002 | |
| | 2,320 | | | News Corp. Class A | | | 41,690 | |
| | 566 | | | News Corp. Class B | | | 10,058 | |
| | 1,207 | | | Omnicom Group, Inc. | | | 75,280 | |
| | 689 | | | Take-Two Interactive Software, Inc.* | | | 143,167 | |
| | 4,687 | | | Twitter, Inc.* | | | 253,801 | |
| | 3,303 | | | ViacomCBS, Inc. | | | 123,070 | |
| | 10,520 | | | Walt Disney Co. (The)* | | | 1,906,014 | |
| | | | | | | | |
| | | | | | | 16,741,676 | |
| | |
| Pharmaceuticals, Biotechnology & Life Sciences – 6.9% | |
| | 10,299 | | | AbbVie, Inc. | | | 1,103,538 | |
| | 1,766 | | | Agilent Technologies, Inc. | | | 209,253 | |
| | 1,257 | | | Alexion Pharmaceuticals, Inc.* | | | 196,394 | |
| | 3,393 | | | Amgen, Inc. | | | 780,118 | |
| | 889 | | | Biogen, Inc.* | | | 217,680 | |
| | 124 | | | Bio-Rad Laboratories, Inc. Class A* | | | 72,285 | |
| | 13,172 | | | Bristol-Myers Squibb Co. | | | 817,059 | |
| | 997 | | | Catalent, Inc.* | | | 103,758 | |
| | 4,627 | | | Eli Lilly and Co. | | | 781,223 | |
| | 7,284 | | | Gilead Sciences, Inc. | | | 424,366 | |
| | 846 | | | Illumina, Inc.* | | | 313,020 | |
| | 1,118 | | | Incyte Corp.* | | | 97,244 | |
| | 1,077 | | | IQVIA Holdings, Inc.* | | | 192,966 | |
| | 15,319 | | | Johnson & Johnson | | | 2,410,904 | |
| | 14,762 | | | Merck & Co., Inc. | | | 1,207,532 | |
| | 137 | | | Mettler-Toledo International, Inc.* | | | 156,136 | |
| | 633 | | | PerkinElmer, Inc. | | | 90,835 | |
| | 823 | | | Perrigo Co. plc | | | 36,805 | |
| | 32,434 | | | Pfizer, Inc. | | | 1,193,895 | |
| | 606 | | | Regeneron Pharmaceuticals, Inc.* | | | 292,765 | |
| | 2,312 | | | Thermo Fisher Scientific, Inc. | | | 1,076,883 | |
| | 1,509 | | | Vertex Pharmaceuticals, Inc.* | | | 356,637 | |
| | 7,020 | | | Viatris, Inc.* | | | 131,555 | |
| | 373 | | | Waters Corp.* | | | 92,288 | |
| | 2,762 | | | Zoetis, Inc. | | | 457,111 | |
| | | | | | | | |
| | | | | | | 12,812,250 | |
| | |
| Real Estate – 2.4% | |
| | 696 | | | Alexandria Real Estate Equities, Inc. (REIT) | | | 124,041 | |
| | 2,582 | | | American Tower Corp. (REIT) | | | 579,556 | |
| | 795 | | | AvalonBay Communities, Inc. (REIT) | | | 127,542 | |
| | |
|
| Common Stocks – (continued) | |
| Real Estate – (continued) | |
| | 829 | | | Boston Properties, Inc. (REIT) | | | 78,365 | |
| | 1,951 | | | CBRE Group, Inc. Class A* | | | 122,367 | |
| | 2,502 | | | Crown Castle International Corp. (REIT) | | | 398,293 | |
| | 1,597 | | | Digital Realty Trust, Inc. (REIT) | | | 222,798 | |
| | 2,097 | | | Duke Realty Corp. (REIT) | | | 83,817 | |
| | 523 | | | Equinix, Inc. (REIT) | | | 373,516 | |
| | 2,042 | | | Equity Residential (REIT) | | | 121,050 | |
| | 393 | | | Essex Property Trust, Inc. (REIT) | | | 93,306 | |
| | 729 | | | Extra Space Storage, Inc. (REIT) | | | 84,462 | |
| | 378 | | | Federal Realty Investment Trust (REIT) | | | 32,175 | |
| | 3,015 | | | Healthpeak Properties, Inc. (REIT) | | | 91,143 | |
| | 4,011 | | | Host Hotels & Resorts, Inc. (REIT) | | | 58,681 | |
| | 1,759 | | | Iron Mountain, Inc. (REIT) | | | 51,855 | |
| | 2,698 | | | Kimco Realty Corp. (REIT) | | | 40,497 | |
| | 646 | | | Mid-America Apartment Communities, Inc. (REIT) | | | 81,842 | |
| | 4,296 | | | Prologis, Inc. (REIT) | | | 428,139 | |
| | 876 | | | Public Storage (REIT) | | | 202,295 | |
| | 2,020 | | | Realty Income Corp. (REIT) | | | 125,583 | |
| | 891 | | | Regency Centers Corp. (REIT) | | | 40,621 | |
| | 637 | | | SBA Communications Corp. (REIT) | | | 179,717 | |
| | 1,826 | | | Simon Property Group, Inc. (REIT) | | | 155,721 | |
| | 470 | | | SL Green Realty Corp. (REIT) | | | 28,003 | |
| | 1,805 | | | UDR, Inc. (REIT) | | | 69,366 | |
| | 2,162 | | | Ventas, Inc. (REIT) | | | 106,025 | |
| | 862 | | | Vornado Realty Trust (REIT) | | | 32,187 | |
| | 2,434 | | | Welltower, Inc. (REIT) | | | 157,285 | |
| | 4,285 | | | Weyerhaeuser Co. (REIT) | | | 143,676 | |
| | | | | | | | |
| | | | | | | 4,433,924 | |
| | |
| Retailing – 7.7% | |
| | 380 | | | Advance Auto Parts, Inc. | | | 59,854 | |
| | 2,481 | | | Amazon.com, Inc.* | | | 8,080,443 | |
| | 133 | | | AutoZone, Inc.* | | | 157,663 | |
| | 1,367 | | | Best Buy Co., Inc. | | | 136,413 | |
| | 238 | | | Booking Holdings, Inc.* | | | 530,090 | |
| | 931 | | | CarMax, Inc.* | | | 87,942 | |
| | 1,420 | | | Dollar General Corp. | | | 298,626 | |
| | 1,394 | | | Dollar Tree, Inc.* | | | 150,608 | |
| | 3,892 | | | eBay, Inc. | | | 195,573 | |
| | 725 | | | Etsy, Inc.* | | | 128,985 | |
| | 814 | | | Expedia Group, Inc. | | | 107,774 | |
| | 1,099 | | | Gap, Inc. (The) | | | 22,189 | |
| | 813 | | | Genuine Parts Co. | | | 81,650 | |
| | 6,255 | | | Home Depot, Inc. (The) | | | 1,661,453 | |
| | 1,338 | | | L Brands, Inc. | | | 49,760 | |
| | 1,596 | | | LKQ Corp.* | | | 56,243 | |
| | 4,268 | | | Lowe’s Cos., Inc. | | | 685,057 | |
| | 418 | | | O’Reilly Automotive, Inc.* | | | 189,174 | |
| | 242 | | | Pool Corp. | | | 90,145 | |
| | 2,104 | | | Ross Stores, Inc. | | | 258,392 | |
| | 2,913 | | | Target Corp. | | | 514,232 | |
| | 627 | | | Tiffany & Co. | | | 82,419 | |
| | 6,970 | | | TJX Cos., Inc. (The) | | | 475,981 | |
| | 684 | | | Tractor Supply Co. | | | 96,157 | |
| | |
| | |
| The accompanying notes are an integral part of these financial statements. | | 39 |
GOLDMAN SACHS VARIABLE INSURANCE TRUST EQUITY INDEX FUND
Schedule of Investments (continued)
December 31, 2020
| | | | | | | | |
| Shares | | | Description | |
Value | |
|
| Common Stocks – (continued) | |
| Retailing – (continued) | |
| | 329 | | | Ulta Beauty, Inc.* | | $ | 94,476 | |
| | | | | | | | |
| | | | | | | 14,291,299 | |
| | |
| Semiconductors & Semiconductor Equipment – 5.1% | |
| | 6,974 | | | Advanced Micro Devices, Inc.* | | | 639,585 | |
| | 2,133 | | | Analog Devices, Inc. | | | 315,108 | |
| | 5,310 | | | Applied Materials, Inc. | | | 458,253 | |
| | 2,359 | | | Broadcom, Inc. | | | 1,032,888 | |
| | 23,912 | | | Intel Corp. | | | 1,191,296 | |
| | 893 | | | KLA Corp. | | | 231,206 | |
| | 837 | | | Lam Research Corp. | | | 395,290 | |
| | 1,529 | | | Maxim Integrated Products, Inc. | | | 135,546 | |
| | 1,506 | | | Microchip Technology, Inc. | | | 207,994 | |
| | 6,473 | | | Micron Technology, Inc.* | | | 486,640 | |
| | 3,601 | | | NVIDIA Corp. | | | 1,880,442 | |
| | 666 | | | Qorvo, Inc.* | | | 110,736 | |
| | 6,596 | | | QUALCOMM, Inc. | | | 1,004,835 | |
| | 953 | | | Skyworks Solutions, Inc. | | | 145,695 | |
| | 947 | | | Teradyne, Inc. | | | 113,536 | |
| | 5,351 | | | Texas Instruments, Inc. | | | 878,260 | |
| | 1,435 | | | Xilinx, Inc. | | | 203,440 | |
| | | | | | | | |
| | | | | | | 9,430,750 | |
| | |
| Software & Services – 14.0% | |
| | 3,694 | | | Accenture plc Class A | | | 964,910 | |
| | 2,786 | | | Adobe, Inc.* | | | 1,393,334 | |
| | 925 | | | Akamai Technologies, Inc.* | | | 97,116 | |
| | 494 | | | ANSYS, Inc.* | | | 179,717 | |
| | 1,291 | | | Autodesk, Inc.* | | | 394,194 | |
| | 2,492 | | | Automatic Data Processing, Inc. | | | 439,090 | |
| | 655 | | | Broadridge Financial Solutions, Inc. | | | 100,346 | |
| | 1,633 | | | Cadence Design Systems, Inc.* | | | 222,790 | |
| | 728 | | | Citrix Systems, Inc. | | | 94,713 | |
| | 3,092 | | | Cognizant Technology Solutions Corp. Class A | | | 253,389 | |
| | 1,390 | | | DXC Technology Co. | | | 35,793 | |
| | 3,610 | | | Fidelity National Information Services, Inc. | | | 510,671 | |
| | 3,218 | | | Fiserv, Inc.* | | | 366,401 | |
| | 489 | | | FleetCor Technologies, Inc.* | | | 133,414 | |
| | 766 | | | Fortinet, Inc.* | | | 113,774 | |
| | 524 | | | Gartner, Inc.* | | | 83,940 | |
| | 1,737 | | | Global Payments, Inc. | | | 374,185 | |
| | 5,189 | | | International Business Machines Corp. | | | 653,191 | |
| | 1,527 | | | Intuit, Inc. | | | 580,031 | |
| | 447 | | | Jack Henry & Associates, Inc. | | | 72,410 | |
| | 768 | | | Leidos Holdings, Inc. | | | 80,732 | |
| | 5,111 | | | Mastercard, Inc. Class A | | | 1,824,320 | |
| | 43,984 | | | Microsoft Corp. | | | 9,782,921 | |
| | 3,235 | | | NortonLifeLock, Inc. | | | 67,223 | |
| | 11,050 | | | Oracle Corp. | | | 714,825 | |
| | 1,891 | | | Paychex, Inc. | | | 176,203 | |
| | 286 | | | Paycom Software, Inc.* | | | 129,344 | |
| | 6,806 | | | PayPal Holdings, Inc.* | | | 1,593,965 | |
| | 5,339 | | | salesforce.com, Inc.* | | | 1,188,088 | |
| | 1,136 | | | ServiceNow, Inc.* | | | 625,288 | |
| | |
|
| Common Stocks – (continued) | |
| Software & Services – (continued) | |
| | 901 | | | Synopsys, Inc.* | | | 233,575 | |
| | 234 | | | Tyler Technologies, Inc.* | | | 102,146 | |
| | 594 | | | VeriSign, Inc.* | | | 128,542 | |
| | 9,866 | | | Visa, Inc. Class A | | | 2,157,990 | |
| | 2,511 | | | Western Union Co. (The) | | | 55,091 | |
| | | | | | | | |
| | | | | | | 25,923,662 | |
| | |
| Technology Hardware & Equipment – 8.3% | |
| | 1,722 | | | Amphenol Corp. Class A | | | 225,186 | |
| | 92,980 | | | Apple, Inc. | | | 12,337,516 | |
| | 317 | | | Arista Networks, Inc.* | | | 92,111 | |
| | 841 | | | CDW Corp. | | | 110,835 | |
| | 24,650 | | | Cisco Systems, Inc. | | | 1,103,088 | |
| | 4,544 | | | Corning, Inc. | | | 163,584 | |
| | 368 | | | F5 Networks, Inc.* | | | 64,746 | |
| | 802 | | | FLIR Systems, Inc. | | | 35,152 | |
| | 7,290 | | | Hewlett Packard Enterprise Co. | | | 86,386 | |
| | 7,888 | | | HP, Inc. | | | 193,966 | |
| | 209 | | | IPG Photonics Corp.* | | | 46,772 | |
| | 2,099 | | | Juniper Networks, Inc. | | | 47,248 | |
| | 1,102 | | | Keysight Technologies, Inc.* | | | 145,563 | |
| | 975 | | | Motorola Solutions, Inc. | | | 165,809 | |
| | 1,310 | | | NetApp, Inc. | | | 86,774 | |
| | 1,283 | | | Seagate Technology plc | | | 79,751 | |
| | 1,955 | | | TE Connectivity Ltd. | | | 236,692 | |
| | 728 | | | Vontier Corp.* | | | 24,315 | |
| | 1,757 | | | Western Digital Corp. | | | 97,320 | |
| | 850 | | | Xerox Holdings Corp. | | | 19,712 | |
| | 305 | | | Zebra Technologies Corp. Class A* | | | 117,221 | |
| | | | | | | | |
| | | | | | | 15,479,747 | |
| | |
| Telecommunication Services – 1.7% | |
| | 41,584 | | | AT&T, Inc. | | | 1,195,956 | |
| | 5,649 | | | CenturyLink, Inc. | | | 55,078 | |
| | 3,385 | | | T-Mobile US, Inc.* | | | 456,467 | |
| | 24,034 | | | Verizon Communications, Inc. | | | 1,411,997 | |
| | | | | | | | |
| | | | | | | 3,119,498 | |
| | |
| Transportation – 1.9% | |
| | 699 | | | Alaska Air Group, Inc. | | | 36,348 | |
| | 2,591 | | | American Airlines Group, Inc.(b) | | | 40,860 | |
| | 782 | | | CH Robinson Worldwide, Inc. | | | 73,406 | |
| | 4,436 | | | CSX Corp. | | | 402,567 | |
| | 3,380 | | | Delta Air Lines, Inc. | | | 135,910 | |
| | 1,022 | | | Expeditors International of Washington, Inc. | | | 97,202 | |
| | 1,395 | | | FedEx Corp. | | | 362,170 | |
| | 467 | | | JB Hunt Transport Services, Inc. | | | 63,816 | |
| | 533 | | | Kansas City Southern | | | 108,801 | |
| | 1,473 | | | Norfolk Southern Corp. | | | 350,000 | |
| | 568 | | | Old Dominion Freight Line, Inc. | | | 110,862 | |
| | 3,441 | | | Southwest Airlines Co. | | | 160,385 | |
| | 3,927 | | | Union Pacific��Corp. | | | 817,680 | |
| | 1,448 | | | United Airlines Holdings, Inc.* | | | 62,626 | |
| | 4,179 | | | United Parcel Service, Inc. Class B | | | 703,744 | |
| | | | | | | | |
| | | | | | | 3,526,377 | |
| | |
| | |
| 40 | | The accompanying notes are an integral part of these financial statements. |
GOLDMAN SACHS VARIABLE INSURANCE TRUST EQUITY INDEX FUND
| | | | | | | | |
| Shares | | |
Description | | Value | |
|
| Common Stocks – (continued) | |
| Utilities – 2.7% | |
| | 3,755 | | | AES Corp. (The) | | $ | 88,243 | |
| | 1,446 | | | Alliant Energy Corp. | | | 74,512 | |
| | 1,445 | | | Ameren Corp. | | | 112,797 | |
| | 2,870 | | | American Electric Power Co., Inc. | | | 238,985 | |
| | 1,079 | | | American Water Works Co., Inc. | | | 165,594 | |
| | 741 | | | Atmos Energy Corp. | | | 70,714 | |
| | 3,042 | | | CenterPoint Energy, Inc. | | | 65,829 | |
| | 1,628 | | | CMS Energy Corp. | | | 99,324 | |
| | 1,975 | | | Consolidated Edison, Inc. | | | 142,733 | |
| | 4,735 | | | Dominion Energy, Inc. | | | 356,072 | |
| | 1,108 | | | DTE Energy Co. | | | 134,522 | |
| | 4,257 | | | Duke Energy Corp. | | | 389,771 | |
| | 2,210 | | | Edison International | | | 138,832 | |
| | 1,137 | | | Entergy Corp. | | | 113,518 | |
| | 1,366 | | | Evergy, Inc. | | | 75,827 | |
| | 2,040 | | | Eversource Energy | | | 176,480 | |
| | 5,618 | | | Exelon Corp. | | | 237,192 | |
| | 3,078 | | | FirstEnergy Corp. | | | 94,218 | |
| | 11,420 | | | NextEra Energy, Inc. | | | 881,053 | |
| | 2,370 | | | NiSource, Inc. | | | 54,368 | |
| | 1,439 | | | NRG Energy, Inc. | | | 54,035 | |
| | 691 | | | Pinnacle West Capital Corp. | | | 55,245 | |
| | 4,377 | | | PPL Corp. | | | 123,431 | |
| | 2,953 | | | Public Service Enterprise Group, Inc. | | | 172,160 | |
| | 1,666 | | | Sempra Energy | | | 212,265 | |
| | 6,108 | | | Southern Co. (The) | | | 375,214 | |
| | 1,863 | | | WEC Energy Group, Inc. | | | 171,452 | |
| | 3,101 | | | Xcel Energy, Inc. | | | 206,744 | |
| | | | | | | | |
| | | | | | | 5,081,130 | |
| | |
| TOTAL INVESTMENTS BEFORE SECURITIES LENDING
REINVESTMENT VEHICLE |
|
| | (Cost $52,081,618) | | $ | 184,222,923 | |
| | |
| Shares | | | Dividend
Rate | | Value | |
|
| Securities Lending Reinvestment Vehicle(a) – 0.1% | |
| Goldman Sachs Financial Square Government Fund —
Institutional Shares |
|
| | 107,700 | | | 0.026% | | $ | 107,700 | |
| (Cost $107,700) | |
| | |
| | TOTAL INVESTMENTS – 99.3% | |
| | (Cost $52,189,318) | | $ | 184,330,623 | |
| | |
| OTHER ASSETS IN EXCESS OF
LIABILITIES – 0.7% | | | 1,372,276 | |
| | |
| | NET ASSETS – 100.0% | | $ | 185,702,899 | |
| | |
| | |
| The percentage shown for each investment category reflects the value of investments in that category as a percentage of net assets. |
| |
| * | | Security is currently in default and/or non-income producing. |
| |
| (a) | | Represents an Affiliated Issuer. |
| |
| (b) | | All or a portion of security is on loan. |
| | |
| |
| Investment Abbreviation: |
| REIT | | —Real Estate Investment Trust |
ADDITIONAL INVESTMENT INFORMATION
FUTURES CONTRACTS — At December 31, 2020, the Fund had the following futures contracts:
| | | | | | | | | | | | | | |
| Description | | Number of
Contracts | | | Expiration
Date | | Notional
Amount | | | Unrealized
Appreciation/
(Depreciation) | |
| | |
Long position contracts: | | | | | | | | |
| S&P 500 E-Mini Index | | | 9 | | | 03/19/2021 | | $ | 1,686,960 | | | $ | 41,949 | |
| | |
| The accompanying notes are an integral part of these financial statements. | | 41 |
xGOLDMAN SACHS VARIABLE INSURANCE TRUST GROWTH OPPORTUNITIES FUND
Schedule of Investments
December 31, 2020
| | | | | | | | |
| Shares | | | Description | |
Value | |
|
| Common Stocks – 99.3% | |
| Banks – 0.8% | |
| | 4,363 | | | First Republic Bank | | $ | 641,056 | |
| | |
| Capital Goods – 6.7% | |
| | 6,420 | | | AMETEK, Inc. | | | 776,435 | |
| | 21,597 | | | AZEK Co., Inc. (The)* | | | 830,405 | |
| | 1,615 | | | Cummins, Inc. | | | 366,766 | |
| | 5,449 | | | Graco, Inc. | | | 394,235 | |
| | 3,263 | | | HEICO Corp. | | | 432,021 | |
| | 7,678 | | | ITT, Inc. | | | 591,360 | |
| | 5,805 | | | Rockwell Automation, Inc. | | | 1,455,952 | |
| | 4,487 | | | Trane Technologies plc | | | 651,333 | |
| | | | | | | | |
| | | | | | | 5,498,507 | |
| | |
| Commercial & Professional Services – 5.3% | |
| | 1,545 | | | CoStar Group, Inc.* | | | 1,428,013 | |
| | 11,124 | | | TransUnion | | | 1,103,723 | |
| | 8,678 | | | Verisk Analytics, Inc. | | | 1,801,466 | |
| | | | | | | | |
| | | | | | | 4,333,202 | |
| | |
| Consumer Durables & Apparel – 1.9% | |
| | 4,588 | | | Lululemon Athletica, Inc.* | | | 1,596,762 | |
| | |
| Consumer Services – 2.9% | |
| | 7,644 | | | Chegg, Inc.* | | | 690,483 | |
| | 2,729 | | | Wingstop, Inc. | | | 361,729 | |
| | 7,823 | | | Wynn Resorts Ltd. | | | 882,669 | |
| | 3,784 | | | Yum! Brands, Inc. | | | 410,791 | |
| | | | | | | | |
| | | | | | | 2,345,672 | |
| | |
| Diversified Financials – 3.3% | |
| | 9,537 | | | Discover Financial Services | | | 863,384 | |
| | 2,228 | | | MarketAxess Holdings, Inc. | | | 1,271,208 | |
| | 1,206 | | | MSCI, Inc. | | | 538,515 | |
| | | | | | | | |
| | | | | | | 2,673,107 | |
| | |
| Energy – 1.4% | |
| | 19,506 | | | Cheniere Energy, Inc.* | | | 1,170,945 | |
| | |
| Food, Beverage & Tobacco – 2.8% | |
| | 12,586 | | | Coca-Cola European Partners plc | | | 627,160 | |
| | 11,288 | | | McCormick & Co., Inc. (Non-Voting) | | | 1,079,133 | |
| | 27,243 | | | Utz Brands, Inc. | | | 600,981 | |
| | | | | | | | |
| | | | | | | 2,307,274 | |
| | |
| Health Care Equipment & Services – 14.0% | |
| | 1,943 | | | Align Technology, Inc.* | | | 1,038,300 | |
| | 18,886 | | | American Well Corp. Class A*(a) | | | 478,382 | |
| | 22,945 | | | Boston Scientific Corp.* | | | 824,873 | |
| | 5,898 | | | Centene Corp.* | | | 354,057 | |
| | 9,333 | | | Guardant Health, Inc.* | | | 1,202,837 | |
| | 14,249 | | | Hologic, Inc.* | | | 1,037,755 | |
| | 2,439 | | | IDEXX Laboratories, Inc.* | | | 1,219,183 | |
| | 4,662 | | | Insulet Corp.* | | | 1,191,747 | |
| | 20,587 | | | OraSure Technologies, Inc.* | | | 217,913 | |
| | 6,891 | | | Veeva Systems, Inc. Class A* | | | 1,876,075 | |
| | 4,030 | | | West Pharmaceutical Services, Inc. | | | 1,141,739 | |
| | |
|
| Common Stocks – (continued) | |
| Health Care Equipment & Services – (continued) | |
| | 6,205 | | | Zimmer Biomet Holdings, Inc. | | | 956,129 | |
| | | | | | | | |
| | | | | | | 11,538,990 | |
| | |
| Household & Personal Products – 1.3% | |
| | 11,842 | | | Church & Dwight Co., Inc. | | | 1,032,978 | |
| | |
| Materials – 3.1% | |
| | 17,213 | | | Ball Corp. | | | 1,603,907 | |
| | 3,463 | | | Martin Marietta Materials, Inc. | | | 983,388 | |
| | | | | | | | |
| | | | | | | 2,587,295 | |
| | |
| Media & Entertainment – 4.8% | |
| | 8,775 | | | Live Nation Entertainment, Inc.* | | | 644,787 | |
| | 11,586 | | | Match Group, Inc.* | | | 1,751,687 | |
| | 14,840 | | | Pinterest, Inc. Class A* | | | 977,956 | |
| | 1,920 | | | Spotify Technology SA* | | | 604,147 | |
| | | | | | | | |
| | | | | | | 3,978,577 | |
| | |
| Pharmaceuticals, Biotechnology & Life Sciences – 8.3% | |
| | 9,583 | | | Agios Pharmaceuticals, Inc.* | | | 415,232 | |
| | 6,780 | | | BioMarin Pharmaceutical, Inc.* | | | 594,538 | |
| | 11,069 | | | Catalent, Inc.* | | | 1,151,951 | |
| | 6,463 | | | Certara, Inc.*(a) | | | 217,932 | |
| | 3,119 | | | Exact Sciences Corp.* | | | 413,236 | |
| | 8,115 | | | Genmab A/S ADR* | | | 329,956 | |
| | 1,081 | | | Mettler-Toledo International, Inc.* | | | 1,231,994 | |
| | 7,278 | | | Neurocrine Biosciences, Inc.* | | | 697,596 | |
| | 4,299 | | | PerkinElmer, Inc. | | | 616,907 | |
| | 2,372 | | | Sarepta Therapeutics, Inc.* | | | 404,402 | |
| | 4,130 | | | Seagen, Inc.* | | | 723,328 | |
| | | | | | | | |
| | | | | | | 6,797,072 | |
| | |
| Real Estate Investment Trusts – 1.3% | |
| | 7,950 | | | Equity LifeStyle Properties, Inc. | | | 503,712 | |
| | 6,781 | | | Simon Property Group, Inc. | | | 578,284 | |
| | | | | | | | |
| | | | | | | 1,081,996 | |
| | |
| Retailing – 7.7% | |
| | 4,777 | | | Burlington Stores, Inc.* | | | 1,249,424 | |
| | 6,755 | | | Etsy, Inc.* | | | 1,201,782 | |
| | 5,995 | | | Expedia Group, Inc. | | | 793,738 | |
| | 446 | | | MercadoLibre, Inc.* | | | 747,148 | |
| | 2,994 | | | O’Reilly Automotive, Inc.* | | | 1,354,995 | |
| | 3,489 | | | Ulta Beauty, Inc.* | | | 1,001,901 | |
| | | | | | | | |
| | | | | | | 6,348,988 | |
| | |
| Semiconductors & Semiconductor Equipment – 6.1% | |
| | 2,955 | | | Cree, Inc.* | | | 312,935 | |
| | 13,193 | | | Marvell Technology Group Ltd. | | | 627,195 | |
| | 6,120 | | | Microchip Technology, Inc. | | | 845,233 | |
| | 8,935 | | | MKS Instruments, Inc. | | | 1,344,271 | |
| | 2,835 | | | NXP Semiconductors NV | | | 450,793 | |
| | 4,860 | | | Teradyne, Inc. | | | 582,666 | |
| | 5,947 | | | Xilinx, Inc. | | | 843,106 | |
| | | | | | | | |
| | | | | | | 5,006,199 | |
| | |
| | |
| 42 | | The accompanying notes are an integral part of these financial statements. |
GOLDMAN SACHS VARIABLE INSURANCE TRUST GROWTH OPPORTUNITIES FUND
| | | | | | | | |
| Shares | | |
Description | | Value | |
|
| Common Stocks – (continued) | |
| Software & Services – 23.1% | |
| | 10,722 | | | Akamai Technologies, Inc.* | | $ | 1,125,703 | |
| | 10,418 | | | Anaplan, Inc.* | | | 748,533 | |
| | 3,214 | | | ANSYS, Inc.* | | | 1,169,253 | |
| | 3,517 | | | Avalara, Inc.* | | | 579,918 | |
| | 8,206 | | | Booz Allen Hamilton Holding Corp. | | | 715,399 | |
| | 4,195 | | | C3.ai, Inc. Class A*(a) | | | 582,056 | |
| | 13,479 | | | Cadence Design Systems, Inc.* | | | 1,838,940 | |
| | 2,754 | | | Coupa Software, Inc.* | | | 933,358 | |
| | 7,112 | | | DocuSign, Inc.* | | | 1,580,998 | |
| | 15,398 | | | Dynatrace, Inc.* | | | 666,271 | |
| | 4,157 | | | HubSpot, Inc.* | | | 1,648,001 | |
| | 1,585 | | | Okta, Inc.* | | | 403,002 | |
| | 5,227 | | | Palo Alto Networks, Inc.* | | | 1,857,624 | |
| | 1,418 | | | Paycom Software, Inc.* | | | 641,291 | |
| | 5,253 | | | RingCentral, Inc. Class A* | | | 1,990,729 | |
| | 8,021 | | | Splunk, Inc.* | | | 1,362,688 | |
| | 3,508 | | | Twilio, Inc. Class A* | | | 1,187,458 | |
| | | | | | | | |
| | | | | | | 19,031,222 | |
| | |
| Technology Hardware & Equipment – 3.4% | |
| | 12,624 | | | Amphenol Corp. Class A | | | 1,650,841 | |
| | 3,953 | | | Motorola Solutions, Inc. | | | 672,247 | |
| | 11,535 | | | National Instruments Corp. | | | 506,848 | |
| | | | | | | | |
| | | | | | | 2,829,936 | |
| | |
| Transportation – 1.1% | |
| | 4,646 | | | Old Dominion Freight Line, Inc. | | | 906,806 | |
| | |
| | TOTAL COMMON STOCKS | |
| | (Cost $53,659,596) | | $ | 81,706,584 | |
| | |
| Shares | | Dividend
Rate | | | Value | |
|
| Investment Company(b) – 0.9% | |
Goldman Sachs Financial Square Government Fund — Institutional Shares | |
| 739,866 | | | 0.026 | % | | $ | 739,866 | |
| (Cost $739,866) | | | | | |
| |
| TOTAL INVESTMENTS BEFORE SECURITIES LENDING REINVESTMENT VEHICLE | |
| (Cost $54,399,462) | | | $ | 82,446,450 | |
| |
| |
|
| Securities Lending Reinvestment Vehicle(b) – 1.7% | |
Goldman Sachs Financial Square Government Fund — Institutional Shares | |
| 1,380,662 | | | 0.026 | % | | $ | 1,380,662 | |
| (Cost $1,380,662) | |
| |
| TOTAL INVESTMENTS – 101.9% | |
| (Cost $55,780,124) | | | $ | 83,827,112 | |
| |
LIABILITIES IN EXCESS OF OTHER ASSETS – (1.9)% | | | | (1,541,335 | ) |
| |
| NET ASSETS – 100.0% | | | $ | 82,285,777 | |
| |
| | |
| The percentage shown for each investment category reflects the value of investments in that category as a percentage of net assets. |
| |
| * | | Security is currently in default and/or non-income producing. |
| |
| (a) | | All or a portion of security is on loan. |
| |
| (b) | | Represents an Affiliated Issuer. |
| | |
| |
| Investment Abbreviation: |
| ADR | | —American Depositary Receipt |
| | |
| The accompanying notes are an integral part of these financial statements. | | 43 |
GOLDMAN SACHS VARIABLE INSURANCE TRUST HIGH QUALITY FLOATING RATE FUND
Schedule of Investments
December 31, 2020
| | | | | | | | | | | | | | |
Principal
Amount | | | Interest
Rate | | | Maturity
Date | | | Value | |
|
| Mortgage-Backed Securities – 1.9% | |
| Adjustable Rate FHLMC(a) – 0.7% | |
| $ | 74,033 | | | | 3.472 | % | | | 05/01/2035 | | | $ | 78,125 | |
| | 16,168 | | | | 2.464 | | | | 09/01/2035 | | | | 17,034 | |
| | 98,579 | | | | 2.572 | | | | 12/01/2036 | | | | 103,795 | |
| | 108,459 | | | | 4.180 | | | | 04/01/2037 | | | | 114,444 | |
| | 122,497 | | | | 2.701 | | | | 01/01/2038 | | | | 129,108 | |
| | 105,127 | | | | 3.283 | | | | 01/01/2038 | | | | 111,266 | |
| | | | | | | | | | | | | | |
| | | | | | | | | | | | | 553,772 | |
| | |
| Adjustable Rate FNMA(a) – 0.9% | |
| | 35,318 | | | | 2.387 | | | | 05/01/2033 | | | | 36,723 | |
| | 67,825 | | | | 2.708 | | | | 05/01/2035 | | | | 71,366 | |
| | 180,607 | | | | 2.991 | | | | 06/01/2035 | | | | 189,286 | |
| | 217,091 | | | | 2.069 | | | | 11/01/2035 | | | | 227,140 | |
| | 39,553 | | | | 2.097 | | | | 12/01/2035 | | | | 41,530 | |
| | 105,104 | | | | 2.864 | | | | 03/01/2037 | | | | 110,936 | |
| | | | | | | | | | | | | | |
| | | | | | | | | | | | | 676,981 | |
| | |
| Adjustable Rate GNMA(a) – 0.2% | |
| | 116,569 | | | | 2.875 | | | | 04/20/2033 | | | | 120,227 | |
| | |
| Agency Multi-Family – 0.1% | |
| | FNMA | |
| | 32,760 | | | | 4.421 | | | | 06/01/2021 | | | | 32,799 | |
| | |
| | TOTAL MORTGAGE-BACKED SECURITIES | |
| | (Cost $1,398,035) | | | | | | | $ | 1,383,779 | |
| | |
| | | | | | | | | | | | | | |
|
| Collateralized Mortgage Obligations(a) – 22.5% | |
| Agency Multi-Family(b) – 2.1% | |
| FHLMC Multifamily Structured Pass-Through Certificates
REMIC Series J15L, Class AFL |
|
| $ | 169,863 | | | | 0.503 | % | | | 08/25/2025 | | | $ | 169,927 | |
| FHLMC Multifamily Structured Pass-Through Certificates
REMIC Series KF32, Class A |
|
| | 312,065 | | | | 0.523 | | | | 05/25/2024 | | | | 312,827 | |
| FHLMC Multifamily Structured Pass-Through Certificates
REMIC Series KF58, Class A |
|
| | 546,860 | | | | 0.653 | | | | 01/25/2026 | | | | 550,049 | |
| FHLMC Multifamily Structured Pass-Through Certificates
REMIC Series KF60, Class A |
|
| | 447,984 | | | | 0.643 | | | | 02/25/2026 | | | | 449,949 | |
| FHLMC Multifamily Structured Pass-Through Certificates
REMIC Series KS02, Class A |
|
| | 46,078 | | | | 0.533 | | | | 08/25/2023 | | | | 46,087 | |
| | | | | | | | | | | | | | |
| | | | | | | | | | | | | 1,528,839 | |
| | |
| Regular Floater – 20.4% | |
| | FHLMC REMIC Series 3049, Class FP | |
| | 133,166 | | | | 0.509 | | | | 10/15/2035 | | | | 134,055 | |
| | FHLMC REMIC Series 3208, Class FB | |
| | 74,009 | | | | 0.559 | | | | 08/15/2036 | | | | 74,529 | |
| | FHLMC REMIC Series 3208, Class FD | |
| | 110,274 | | | | 0.559 | | | | 08/15/2036 | | | | 111,049 | |
| | |
|
| Collateralized Mortgage Obligations(a) – (continued) | |
| Regular Floater – (continued) | |
| | FHLMC REMIC Series 3208, Class FG | |
| 444,054 | | | | 0.559 | | | | 08/15/2036 | | | | 447,175 | |
| | FHLMC REMIC Series 3307, Class FT | |
| | 700,690 | | | | 0.399 | | | | 07/15/2034 | | | | 701,732 | |
| | FHLMC REMIC Series 3311, Class KF | |
| | 1,297,737 | | | | 0.499 | | | | 05/15/2037 | | | | 1,305,730 | |
| | FHLMC REMIC Series 3371, Class FA(b) | |
| | 295,757 | | | | 0.759 | | | | 09/15/2037 | | | | 300,355 | |
| | FHLMC REMIC Series 4068, Class UF | |
| | 1,591,847 | | | | 0.659 | | | | 06/15/2042 | | | | 1,605,804 | |
| | FHLMC REMIC Series 4174, Class FB(b) | |
| | 298,983 | | | | 0.459 | | | | 05/15/2039 | | | | 298,981 | |
| | FHLMC REMIC Series 4320, Class FD | |
| | 244,357 | | | | 0.559 | | | | 07/15/2039 | | | | 246,432 | |
| | FHLMC REMIC Series 4477, Class FG | |
| | 260,460 | | | | 0.449 | | | | 10/15/2040 | | | | 259,395 | |
| | FHLMC REMIC Series 4508, Class CF | |
| | 230,012 | | | | 0.559 | | | | 09/15/2045 | | | | 231,877 | |
| | FHLMC REMIC Series 4631, Class GF | |
| | 1,363,692 | | | | 0.659 | | | | 11/15/2046 | | | | 1,376,349 | |
| | FHLMC REMIC Series 4637, Class QF | |
| | 857,695 | | | | 1.155 | | | | 04/15/2044 | | | | 840,671 | |
| | FNMA REMIC Series 2006-82, Class F | |
| | 83,003 | | | | 0.718 | | | | 09/25/2036 | | | | 83,994 | |
| | FNMA REMIC Series 2006-96, Class FA | |
| | 370,885 | | | | 0.448 | | | | 10/25/2036 | | | | 372,280 | |
| | FNMA REMIC Series 2007-33, Class HF | |
| | 64,261 | | | | 0.498 | | | | 04/25/2037 | | | | 64,565 | |
| | FNMA REMIC Series 2007-36, Class F | |
| | 104,068 | | | | 0.378 | | | | 04/25/2037 | | | | 104,218 | |
| | FNMA REMIC Series 2007-85, Class FC | |
| | 297,030 | | | | 0.688 | | | | 09/25/2037 | | | | 300,888 | |
| | FNMA REMIC Series 2008-8, Class FB | |
| | 243,825 | | | | 0.968 | | | | 02/25/2038 | | | | 247,894 | |
| | FNMA REMIC Series 2011-63, Class FG | |
| | 253,800 | | | | 0.598 | | | | 07/25/2041 | | | | 257,049 | |
| | FNMA REMIC Series 2012-35, Class QF | |
| | 818,803 | | | | 0.548 | | | | 04/25/2042 | | | | 825,101 | |
| | FNMA REMIC Series 2016-1, Class FT | |
| | 661,568 | | | | 0.498 | | | | 02/25/2046 | | | | 665,237 | |
| | FNMA REMIC Series 2017-45, Class FA | |
| | 406,317 | | | | 0.469 | | | | 06/25/2047 | | | | 404,606 | |
| | FNMA REMIC Series 2017-96, Class FC | |
| | 837,079 | | | | 0.548 | | | | 12/25/2057 | | | | 844,022 | |
| | FNMA REMIC Series 2018-60, Class FK | |
| | 2,433,465 | | | | 0.448 | | | | 08/25/2048 | | | | 2,441,942 | |
| | GNMA REMIC Series 2005-48, Class AF(b) | |
| | 362,838 | | | | 0.352 | | | | 06/20/2035 | | | | 363,115 | |
| | GNMA REMIC Series 2012-98, Class FA(b) | |
| | 324,894 | | | | 0.552 | | | | 08/20/2042 | | | | 327,086 | |
| | | | | | | | | | | | | | |
| | | | | | | | | | | | | 15,236,131 | |
| | |
| | TOTAL COLLATERALIZED MORTGAGE OBLIGATIONS | |
| | (Cost $16,698,528) | | | | | | | $ | 16,764,970 | |
| | |
| | |
| 44 | | The accompanying notes are an integral part of these financial statements. |
GOLDMAN SACHS VARIABLE INSURANCE TRUST HIGH QUALITY FLOATING RATE FUND
| | | | | | | | | | | | | | |
Principal
Amount | | | Interest
Rate | | | Maturity
Date | | | Value | |
|
| U.S. Government Agency Security(a) – 2.0% | |
| | FFCB | |
| $ | 1,500,000 | | |
| (SOFR + 0.17%),
0.260% |
| | | 03/15/2022 | | | $ | 1,501,516 | |
| | (Cost $1,500,000) | | | | | |
| | |
| | | | | | | | | | | | | | |
|
| Asset-Backed Securities(b) – 25.0% | |
| Automobile – 3.3% | |
| | Ally Master Owner Trust Series 2018-1, Class A2 | |
| $ | 800,000 | | | | 2.700 | % | | | 01/17/2023 | | | $ | 800,491 | |
| | Chesapeake Funding II LLC Series 2017-3A, Class A2(a)(c) | |
| | 44,226 | | | | 0.499 | | | | 08/15/2029 | | | | 44,227 | |
| Ford Credit Floorplan Master Owner Trust A Series 2020-1,
Class A2(a) |
|
| | 750,000 | | | | 0.659 | | | | 09/15/2025 | | | | 755,780 | |
| | Nissan Master Owner Trust Receivables Series 2019-A, Class A(a) | |
| | 850,000 | | | | 0.719 | | | | 02/15/2024 | | | | 854,078 | |
| | | | | | | | | | | | | | |
| | | | | | | | | | | | | 2,454,576 | |
| | |
| Collateralized Loan Obligations(a)(c) – 12.2% | |
| | 522 Funding CLO Ltd. Series 2019-4A, Class A | |
| | 500,000 | | | | 1.568 | | | | 04/20/2030 | | | | 500,032 | |
| | Avery Point VII CLO Ltd. Series 2015-7A, Class AR | |
| | 750,000 | | | | 1.377 | | | | 01/15/2028 | | | | 749,438 | |
| Benefit Street Partners CLO VII Ltd. Series 2015-VIIA,
Class A1AR |
|
| | 453,190 | | | | 0.998 | | | | 07/18/2027 | | | | 452,278 | |
| | Bowman Park CLO Ltd. Series 2014-1A, Class AR | |
| | 19,826 | | | | 1.393 | | | | 11/23/2025 | | | | 19,834 | |
| | California Street CLO XII Ltd. Series 2013-12A, Class AR | |
| | 84,798 | | | | 1.267 | | | | 10/15/2025 | | | | 84,800 | |
| | CBAM Ltd. Series 2018-5A, Class A | |
| | 1,100,000 | | | | 1.238 | | | | 04/17/2031 | | | | 1,094,293 | |
| | Cutwater Ltd. Series 2014-1A, Class A1AR | |
| | 104,647 | | | | 1.487 | | | | 07/15/2026 | | | | 104,493 | |
| | Dryden 49 Senior Loan Fund Series 2017-49A, Class A | |
| | 1,711,000 | | | | 1.428 | | | | 07/18/2030 | | | | 1,711,022 | |
| | Dryden 64 CLO Ltd. Series 2018-64A, Class A | |
| | 600,000 | | | | 1.188 | | | | 04/18/2031 | | | | 597,926 | |
| | LCM XX LP Series 20A, Class AR | |
| | 700,000 | | | | 1.258 | | | | 10/20/2027 | | | | 699,006 | |
| | Madison Park Funding XXX Ltd. Series 2018-30A, Class A | |
| | 1,100,000 | | | | 0.987 | | | | 04/15/2029 | | | | 1,090,125 | |
| | Parallel Ltd. Series 2015-1A, Class AR | |
| | 158,040 | | | | 1.068 | | | | 07/20/2027 | | | | 157,040 | |
| | Pikes Peak CLO 2 Series 2018-2A, Class A | |
| | 800,000 | | | | 1.508 | | | | 01/18/2032 | | | | 800,023 | |
| | THL Credit Wind River CLO Ltd. Series 2017-2A, Class A | |
| | 1,000,000 | | | | 1.448 | | | | 07/20/2030 | | | | 999,997 | |
| | Trinitas CLO II Ltd. Series 2014-2A, Class A1R | |
| | 24,047 | | | | 1.417 | | | | 07/15/2026 | | | | 24,047 | |
| | WhiteHorse IX Ltd. Series 2014-9A, Class AR | |
| | 57,512 | | | | 1.378 | | | | 07/17/2026 | | | | 57,489 | |
| | | | | | | | | | | | | | |
| | | | | | | | | | | | | 9,141,843 | |
| | |
|
| Asset-Backed Securities(b) – (continued) | |
| Credit Card(a) – 3.9% | |
| | Citibank Credit Card Issuance Trust Series 2017-A5, Class A5 | |
| 1,400,000 | | | | 0.764 | | | | 04/22/2026 | | | | 1,412,648 | |
| | Citibank Credit Card Issuance Trust Series 2017-A7, Class A7 | |
| | 500,000 | | | | 0.522 | | | | 08/08/2024 | | | | 502,002 | |
| | Evergreen Credit Card Trust Series 2019-1, Class A(c) | |
| | 1,000,000 | | | | 0.639 | | | | 01/15/2023 | | | | 1,000,051 | |
| | | | | | | | | | | | | | |
| | | | | | | | | | | | | 2,914,701 | |
| | |
| Student Loans(a) – 5.6% | |
| | Brazos Higher Education Authority, Inc. Series 2011-1, Class A2 | |
| | 527,250 | | | | 1.006 | | | | 02/25/2030 | | | | 528,863 | |
| | Edsouth Indenture No. 5 LLC Series 2014-1, Class A(c) | |
| | 135,360 | | | | 0.845 | | | | 02/25/2039 | | | | 134,347 | |
| | Educational Funding of the South, Inc. Series 2011-1, Class A2 | |
| | 264,661 | | | | 0.865 | | | | 04/25/2035 | | | | 263,061 | |
| | Higher Education Funding I Series 2014-1, Class A(c) | |
| | 876,542 | | | | 1.257 | | | | 05/25/2034 | | | | 878,234 | |
| | Illinois Student Assistance Commission Series 2010-1, Class A3 | |
| | 145,675 | | | | 1.115 | | | | 07/25/2045 | | | | 144,749 | |
| Kentucky Higher Education Student Loan Corp. Series 2015-1,
Class A1 |
|
| | 424,955 | | | | 0.905 | | | | 12/01/2031 | | | | 419,218 | |
| Montana Higher Education Student Assistance Corp.
Series 2012-1, Class A2 |
|
| | 327,488 | | | | 1.152 | | | | 05/20/2030 | | | | 327,827 | |
| Pennsylvania Higher Education Assistance Agency Series 2006-1,
Class A3 |
|
| | 343,704 | | | | 0.355 | | | | 10/25/2035 | | | | 335,746 | |
| | SLM Student Loan Trust Series 2005-5, Class A4 | |
| | 591,142 | | | | 0.355 | | | | 10/25/2028 | | | | 587,588 | |
| | SLM Student Loan Trust Series 2007-1, Class A5 | |
| | 253,864 | | | | 0.305 | | | | 01/26/2026 | | | | 253,728 | |
| | SLM Student Loan Trust Series 2008-5, Class A4 | |
| | 51,351 | | | | 1.915 | | | | 07/25/2023 | | | | 51,682 | |
| South Texas Higher Education Authority, Inc. Series 2012-1,
Class A2 |
|
| | 15,785 | | | | 1.075 | | | | 10/01/2024 | | | | 15,795 | |
| | Utah State Board of Regents Series 2015-1, Class A | |
| | 226,090 | | | | 0.745 | | | | 02/25/2043 | | | | 224,427 | |
| | | | | | | | | | | | | | |
| | | | | | | | | | | | | 4,165,265 | |
| | |
| | TOTAL ASSET-BACKED SECURITIES | |
| | (Cost $18,638,217) | | | | | | | $ | 18,676,385 | |
| | |
| | | | | | | | | | | | | | |
|
| Supranational(a) (c) – 2.0% | |
| | European Investment Bank | |
| $ | 1,530,000 | | |
| (SOFR + 0.29%),
0.350% |
| | | 06/10/2022 | | | $ | 1,532,864 | |
| | (Cost $1,530,000) | | | | | |
| | |
| | |
| The accompanying notes are an integral part of these financial statements. | | 45 |
GOLDMAN SACHS VARIABLE INSURANCE TRUST HIGH QUALITY FLOATING RATE FUND
Schedule of Investments (continued)
December 31, 2020
| | | | | | | | | | | | | | |
Principal
Amount | | | Interest
Rate | | | Maturity
Date | | | Value | |
|
| Municipal Bond(a)(b)(c) – 0.1% | |
| New York – 0.1% | |
| Freddie Mac Multifamily ML Certificates RB Pass Through
Series 2017 A |
|
| | (1 Mo. LIBOR + 0.50%), | |
| $ | 94,476 | | | | 0.645% | | | | 01/25/2033 | | | $ | 94,524 | |
| | (Cost $94,476) | | | | | |
| | |
| | | | | | | | | | | | | | |
|
| U.S. Treasury Obligations – 31.3% | |
| | U.S. Treasury Bonds | |
| $ | 220,000 | | | | 3.750% | | | | 11/15/2043 | | | $ | 316,422 | |
| | 170,000 | | | | 3.375 | | | | 05/15/2044 | | | | 232,316 | |
| | U.S. Treasury Inflation Linked Notes | |
| | 1,324,791 | | | | 0.125 | | | | 07/15/2022 | | | | 1,366,158 | |
| | U.S. Treasury Notes | |
| | (3 Mo. U.S. T-Bill MMY + 0.22%), | |
| | 13,400,000 | | | | 0.315(a) | | | | 07/31/2021 | | | | 13,416,358 | |
| | 310,000 | | | | 2.875 | | | | 10/15/2021 | | | | 316,648 | |
| | (3 Mo. U.S. T-Bill MMY + 0.15%), | |
| | 600,000 | | | | 0.249(a) | | | | 01/31/2022 | | | | 600,765 | |
| | 120,000 | | | | 1.875 | | | | 02/28/2022 | | | | 122,438 | |
| | (3 Mo. U.S. T-Bill MMY + 0.06%), | |
| | 5,500,000 | | | | 0.130(a) | | | | 10/31/2022 | | | | 5,499,137 | |
| | 20,000 | | | | 2.750 | | | | 04/30/2023 | | | | 21,208 | |
| | 920,000 | | | | 2.875 | | | | 10/31/2023 | | | | 990,437 | |
| | 140,000 | | | | 2.875 | | | | 05/31/2025 | | | | 155,772 | |
| | 10,000 | | | | 3.000 | | | | 09/30/2025 | | | | 11,253 | |
| | 250,000 | | | | 2.125 | | | | 05/31/2026 | | | | 272,832 | |
| | 20,000 | | | | 1.375 | | | | 08/31/2026 | | | | 21,033 | |
| | |
| | TOTAL U.S. TREASURY OBLIGATIONS | |
| | (Cost $23,103,889) | | | | | | | $ | 23,342,777 | |
| | |
| | | | | | | | |
| Shares | | | Dividend Rate | | Value | |
|
| Investment Company(d) – 13.6% | |
| Goldman Sachs Financial Square Government Fund —
Institutional Shares |
|
| | 10,161,321 | | | 0.026% | | $ | 10,161,321 | |
| | (Cost $10,161,321) | |
| | |
| | TOTAL INVESTMENTS – 98.4% | |
| | (Cost $73,124,466) | | | | | $ | 73,458,136 | |
| | |
| OTHER ASSETS IN EXCESS OF
LIABILITIES – 1.6% | | | 1,189,749 | |
| | |
| | NET ASSETS – 100.0% | | $ | 74,647,885 | |
| | |
| | |
| The percentage shown for each investment category reflects the value of investments in that category as a percentage of net assets. |
| |
| (a) | | Variable rate security. Except for floating rate notes (for which final maturity is disclosed), maturity date disclosed is the next interest reset date. Interest rate disclosed is that which is in effect on December 31, 2020. |
| |
| (b) | | Securities with “Call” features. Maturity dates disclosed are the final maturity dates. |
| |
| (c) | | Exempt from registration under Rule 144A of the Securities Act of 1933. |
| |
| (d) | | Represents an Affiliated Issuer. |
| | |
| |
| Investment Abbreviations: |
| FFCB | | —Federal Farm Credit Bank |
| FHLMC | | —Federal Home Loan Mortgage Corp. |
| FNMA | | —Federal National Mortgage Association |
| GNMA | | —Government National Mortgage Association |
| LIBOR | | —London Interbank Offered Rate |
| MMY | | —Money Market Yield |
| Mo. | | —Month |
| RB | | —Revenue Bond |
| REMIC | | —Real Estate Mortgage Investment Conduit |
| SOFR | | —Secured Overnight Financing Rate |
| T-Bill | | —Treasury Bill |
| U.S. | | —United States |
|
| Currency Abbreviation: |
| USD | | —United States Dollar |
| | |
| 46 | | The accompanying notes are an integral part of these financial statements. |
GOLDMAN SACHS VARIABLE INSURANCE TRUST HIGH QUALITY FLOATING RATE FUND
ADDITIONAL INVESTMENT INFORMATION
FUTURES CONTRACTS — At December 31, 2020, the Fund had the following futures contracts:
| | | | | | | | | | | | | | | | |
| Description | | Number of
Contracts | | | Expiration
Date | | | Notional
Amount | | | Unrealized
Appreciation/
(Depreciation) | |
| | | |
Long position contracts: | | | | | | | | | | | | | |
| U.S. Treasury 2 Year Note | | | 20 | | | | 03/31/2021 | | | $ | 4,419,219 | | | $ | 3,831 | |
U.S. Treasury 10 Year Ultra Note | | | 2 | | | | 03/22/2021 | | | | 312,438 | | | | (1,183 | ) |
| | | | |
| Total | | | | | | | | | | | | | | $ | 2,648 | |
| | | |
Short position contracts: | | | | | | | | | | | | | |
| U.S. Treasury 5 Year Note | | | (21) | | | | 03/31/2021 | | | $ | (2,648,953 | ) | | $ | (5,438 | ) |
| U.S. Treasury 10 Year Note | | | (1) | | | | 03/22/2021 | | | | (138,031 | ) | | | (76 | ) |
| U.S. Treasury Long Bond | | | (7) | | | | 03/22/2021 | | | | (1,210,562 | ) | | | 12,410 | |
U.S. Treasury Ultra Bond | | | (1) | | | | 03/22/2021 | | | | (213,031 | ) | | | 3,781 | |
| | | | |
| Total | | | | | | | | | | | | | | $ | 10,677 | |
| | | | |
| Total Futures Contracts | | | | | | | | | | | | | | $ | 13,325 | |
SWAP CONTRACTS — At December 31, 2020, the Fund had the following swap contracts:
CENTRALLY CLEARED INTEREST RATE SWAP CONTRACTS
| | | | | | | | | | | | | | | | | | | | | | | | |
Payments Made by
the Fund(a) | | Payments Received by the Fund | | | Termination
Date | | | Notional
Amount
(000’s)(b) | | | Value | | | Upfront
Premium
(Received)
Paid | | | Unrealized
Appreciation/
(Depreciation) | |
| 1 Month LIBOR | | | 3 Month LIBOR | | | | 07/25/2024 | | | | USD 2,180 | | | $ | (727 | ) | | $ | 745 | | | $ | (1,472 | ) |
| 1 Day SOFR | | | 3 Month LIBOR | | | | 11/10/2024 | | | | 1,290 | | | | (1,117 | ) | | | 1 | | | | (1,118 | ) |
| | | | | | |
| TOTAL | | | | | | | | | | | | | | $ | (1,844 | ) | | $ | 746 | | | $ | (2,590 | ) |
| (a) | Payments made quarterly. |
| (b) | Represents forward starting interest rate swaps whose effective dates of commencement of accruals and cash flows occur subsequent to December 31, 2020. |
| | |
| The accompanying notes are an integral part of these financial statements. | | 47 |
GOLDMAN SACHS VARIABLE INSURANCE TRUST FUNDS
Statements of Assets and Liabilities
December 31, 2020
| | | | | | | | | | | | | | | | |
| | | Core Fixed
Income Fund | | | Equity Index
Fund | | | Growth
Opportunities
Fund | | | High Quality
Floating Rate
Fund | |
| | | | | | | | | | | | | | | | |
| Assets: | | | | | | | | | | | | |
Investments in unaffiliated issuers, at value (cost $67,145,879, $51,863,073, $53,659,596 and $62,963,145)(a) | | $ | 70,396,042 | | | $ | 183,695,239 | | | $ | 81,706,584 | | | $ | 63,296,815 | |
Investments in affiliated issuers, at value (cost $11,891,553, $218,545, $739,866 and $10,161,321) | | | 11,891,553 | | | | 527,684 | | | | 739,866 | | | | 10,161,321 | |
Investments in affiliated securities lending reinvestment vehicle, at value (cost $0, $107,700, $1,380,662 and $0) | | | — | | | | 107,700 | | | | 1,380,662 | | | | — | |
Purchased Options, at value (premiums paid $2,359, $0, $0 and $0) | | | 960 | | | | — | | | | — | | | | — | |
Cash | | | 1,145,693 | | | | 1,108,075 | | | | 36,046 | | | | 1,193,135 | |
Foreign currencies, at value (cost $35,087, $0, $0 and $0) | | | 36,978 | | | | — | | | | — | | | | — | |
Receivables: | | | | | | | | | | | | | | | | |
Investments sold on an extended-settlement basis | | | 2,088,750 | | | | — | | | | — | | | | 3,307 | |
Collateral on certain derivative contracts(b) | | | 925,660 | | | | 99,000 | | | | — | | | | 53,151 | |
Interest and dividends | | | 351,685 | | | | 136,622 | | | | 27,071 | | | | 59,477 | |
Reimbursement from investment adviser | | | 38,956 | | | | 45,122 | | | | 25,754 | | | | 36,728 | |
Fund shares sold | | | 17,530 | | | | 114,348 | | | | 315 | | | | 549 | |
Investments sold | | | — | | | | 205,833 | | | | — | | | | — | |
Securities lending income | | | — | | | | 123 | | | | 788 | | | | — | |
Unrealized gain on forward foreign currency exchange contracts | | | 70,286 | | | | — | | | | — | | | | — | |
Unrealized gain on swap contracts | | | 52,151 | | | | — | | | | — | | | | — | |
Variation margin on futures | | | 11,069 | | | | 11,070 | | | | — | | | | 93 | |
Variation margin on swaps | | | 7,880 | | | | — | | | | — | | | | 47 | |
Other assets | | | 436 | | | | 695 | | | | 451 | | | | 454 | |
| | | | |
| Total assets | | | 87,035,629 | | | | 186,051,511 | | | | 83,917,537 | | | | 74,805,077 | |
| | | | | | | | | | | | | | | | |
| | | | | | | | | | | | | | | | |
| Liabilities: | | | | | | | | | | | | |
Unrealized loss on forward foreign currency exchange contracts | | | 107,606 | | | | — | | | | — | | | | — | |
Written options, at value (premiums received $12,704, $0, $0 and $0) | | | 10,173 | | | | — | | | | — | | | | — | |
Payables: | | | | | | | | | | | | | | | | |
Investments purchased on an extended-settlement basis | | | 14,807,934 | | | | — | | | | — | | | | — | |
Upfront payments received on swap contracts | | | 83,849 | | | | — | | | | — | | | | — | |
Management fees | | | 22,449 | | | | 32,580 | | | | 57,476 | | | | 18,259 | |
Fund shares redeemed | | | 13,101 | | | | 35,995 | | | | 68,487 | | | | 23,893 | |
Distribution and Service fees and Transfer Agency fees | | | 10,802 | | | | 41,888 | | | | 12,452 | | | | 15,429 | |
Payable upon return of securities loaned | | | — | | | | 107,700 | | | | 1,380,662 | | | | — | |
Accrued expenses | | | 154,913 | | | | 130,449 | | | | 112,683 | | | | 99,611 | |
| | | | |
| Total liabilities | | | 15,210,827 | | | | 348,612 | | | | 1,631,760 | | | | 157,192 | |
| | | | | | | | | | | | | | | | |
| | | | | | | | | | | | | | | | |
| Net Assets: | | | | | | | | | | | | |
Paid-in capital | | | 68,372,277 | | | | 54,142,235 | | | | 51,815,552 | | | | 76,044,042 | |
Total distributable earnings (loss) | | | 3,452,525 | | | | 131,560,664 | | | | 30,470,225 | | | | (1,396,157 | ) |
| | | | |
| NET ASSETS | | $ | 71,824,802 | | | $ | 185,702,899 | | | $ | 82,285,777 | | | $ | 74,647,885 | |
Net Assets: | | | | | | | | | | | | | | | | |
Institutional | | $ | 25,193,591 | | | $ | — | | | $ | 151,296 | | | $ | 5,112,785 | |
Service | | | 46,631,211 | | | | 185,702,899 | | | | 82,134,481 | | | | 65,831,838 | |
Advisor | | | — | | | | — | | | | — | | | | 3,703,262 | |
| | | | |
Total Net Assets | | $ | 71,824,802 | | | $ | 185,702,899 | | | $ | 82,285,777 | | | $ | 74,647,885 | |
Shares outstanding $0.001 par value (unlimited shares authorized): | | | | | | | | | | | | | | | | |
Institutional | | | 2,185,275 | | | | — | | | | 10,861 | | | | 493,203 | |
Service | | | 4,043,906 | | | | 9,767,284 | | | | 6,228,611 | | | | 6,367,045 | |
Advisor | | | — | | | | — | | | | — | | | | 357,982 | |
Net asset value, offering and redemption price per share: | | | | | | | | | | | | | | | | |
Institutional | | | $11.53 | | | | — | | | | $13.93 | | | | $10.37 | |
Service | | | 11.53 | | | | 19.01 | | | | 13.19 | | | | 10.34 | |
Advisor | | | — | | | | — | | | | — | | | | 10.34 | |
(a) Includes loaned securities having a market value of $103,152 and $1,349,212 for Equity Index and Growth Opportunities Funds, respectively.
(b) Segregated for initial margin and/or collateral on transactions as follows:
| | | | | | | | | | | | |
Fund | | Forwards | | | Futures | | | Swaps | |
| Core Fixed Income | | $ | 210,000 | | | $ | 323,131 | | | $ | 392,529 | |
| Equity Index | | | — | | | | 99,000 | | | | — | |
| High Quality Floating Rate | | | — | | | | 48,892 | | | | 4,259 | |
| | |
| 48 | | The accompanying notes are an integral part of these financial statements. |
GOLDMAN SACHS VARIABLE INSURANCE TRUST FUNDS
Statements of Operations
For the Fiscal Year Ended December 31, 2020
| | | | | | | | | | | | | | | | |
| | | Core Fixed
Income Fund | | | Equity Index
Fund | | | Growth
Opportunities
Fund | | | High Quality
Floating
Rate Fund | |
| | | | | | | | | | | | | | | | |
| Investment income: | | | | | | | | | | | | |
Interest | | $ | 1,257,492 | | | $ | 560 | | | $ | 167 | | | $ | 761,646 | |
Dividends — affiliated issuers | | | 9,369 | | | | 10,026 | | | | 5,655 | | | | 27,310 | |
Dividends — unaffiliated issuers (net of foreign taxes withheld of $0, $0, $334 and $0) | | | — | | | | 2,952,996 | | | | 353,495 | | | | — | |
Securities lending income — affiliated issuer | | | — | | | | 1,351 | | | | — | | | | — | |
Securities lending income — unaffiliated issuer | | | — | | | | — | | | | 1,975 | | | | — | |
| | | | |
| Total investment income | | | 1,266,861 | | | | 2,964,933 | | | | 361,292 | | | | 788,956 | |
| | | | | | | | | | | | | | | | |
| | | | | | | | | | | | | | | | |
| Expenses: | | | | | | | | | | | | |
Management fees | | | 248,369 | | | | 503,097 | | | | 618,788 | | | | 231,684 | |
Professional fees | | | 139,068 | | | | 103,536 | | | | 104,390 | | | | 129,942 | |
Distribution and Service (12b-1) fees(a) | | | 98,458 | | | | 419,248 | | | | 177,535 | | | | 169,614 | |
Custody, accounting and administrative services | | | 85,050 | | | | 69,175 | | | | 65,355 | | | | 67,895 | |
Printing and mailing costs | | | 56,463 | | | | 98,815 | | | | 41,481 | | | | 45,786 | |
Trustee fees | | | 20,566 | | | | 20,731 | | | | 20,573 | | | | 20,585 | |
Transfer Agency fees(a) | | | 12,417 | | | | 33,537 | | | | 14,224 | | | | 14,946 | |
Service fees — Advisor Shares | | | — | | | | — | | | | — | | | | 11,756 | |
Other | | | 16,733 | | | | 30,137 | | | | 12,864 | | | | 15,404 | |
| | | | |
| Total expenses | | | 677,124 | | | | 1,278,276 | | | | 1,055,210 | | | | 707,612 | |
| | | | |
Less — expense reductions | | | (326,119 | ) | | | (468,452 | ) | | | (335,743 | ) | | | (268,755 | ) |
| | | | |
| Net expenses | | | 351,005 | | | | 809,824 | | | | 719,467 | | | | 438,857 | |
| | | | |
| NET INVESTMENT INCOME (LOSS) | | | 915,856 | | | | 2,155,109 | | | | (358,175 | ) | | | 350,099 | |
| | | | | | | | | | | | | | | | |
| | | | | | | | | | | | | | | | |
| Realized and unrealized gain (loss): | | | | | | | | | | | | |
Net realized gain (loss) from: | | | | | | | | | | | | | | | | |
Investments — unaffiliated issuers | | | 1,433,421 | | | | 14,439,690 | | | | 15,934,579 | | | | (54,446 | ) |
Investments — affiliated issuers | | | — | | | | 23,619 | | | | — | | | | — | |
Futures contracts | | | 1,063,456 | | | | 269,217 | | | | — | | | | (222,411 | ) |
Purchased options | | | 13,009 | | | | — | | | | — | | | | — | |
Swap contracts | | | (96,090 | ) | | | — | | | | — | | | | (70,995 | ) |
Forward foreign currency exchange contracts | | | (50,901 | ) | | | — | | | | — | | | | — | |
Foreign currency transactions | | | 5,734 | | | | — | | | | — | | | | — | |
Written options | | | 19,463 | | | | — | | | | — | | | | — | |
Net change in unrealized gain (loss) on: | | | | | | | | | | | | | | | | |
Investments — affiliated issuers | | | — | | | | 43,322 | | | | — | | | | — | |
Investments — unaffiliated issuers | | | 2,020,181 | | | | 10,830,427 | | | | 10,213,950 | | | | 363,247 | |
Futures contracts | | | 76,327 | | | | 20,777 | | | | — | | | | (36,998 | ) |
Purchased options | | | 1,126 | | | | — | | | | — | | | | — | |
Swap contracts | | | 27,559 | | | | — | | | | — | | | | (2,581 | ) |
Forward foreign currency exchange contracts | | | 1,419 | | | | — | | | | — | | | | — | |
Foreign currency translation | | | 1,774 | | | | — | | | | — | | | | — | |
Written options | | | (112 | ) | | | — | | | | — | | | | — | |
| | | | |
| Net realized and unrealized gain (loss) | | | 4,516,366 | | | | 25,627,052 | | | | 26,148,529 | | | | (24,184 | ) |
| | | | |
| NET INCREASE IN NET ASSETS RESULTING FROM OPERATIONS | | $ | 5,432,222 | | | $ | 27,782,161 | | | $ | 25,790,354 | | | $ | 325,915 | |
(a) Class specific Distribution and/or Service, and Transfer Agency fees were as follows:
| | | | | | | | | | | | | | | | | | | | |
| | | Distribution and/or
(12b-1) Service Fees | | | Transfer Agency Fees | |
Fund | | Service | | | Advisor | | | Institutional | | | Service | | | Advisor | |
Core Fixed Income | | $ | 98,458 | | | | N/A | | | $ | 4,541 | | | $ | 7,876 | | | | N/A | |
Equity Index | | | 419,248 | | | | N/A | | | | N/A | | | | 33,537 | | | | N/A | |
Growth Opportunities | | | 177,535 | | | | N/A | | | | 22 | | | | 14,202 | | | | N/A | |
High Quality Floating Rate | | | 162,560 | | | $ | 7,054 | | | | 1,002 | | | | 13,004 | | | $ | 940 | |
| | |
| The accompanying notes are an integral part of these financial statements. | | 49 |
GOLDMAN SACHS VARIABLE INSURANCE TRUST FUNDS
Statements of Changes in Net Assets
| | | | | | | | | | | | | | | | |
| | | Core Fixed Income Fund | | | Equity Index Fund | |
| | | For the
Fiscal Year Ended
December 31, 2020 | | | For the
Fiscal Year Ended
December 31, 2019 | | | For the
Fiscal Year Ended
December 31, 2020 | | | For the
Fiscal Year Ended
December 31, 2019 | |
| | | | | | | | | | | | | | | | |
| From operations: | |
Net investment income | | $ | 915,856 | | | $ | 1,022,839 | | | $ | 2,155,109 | | | $ | 2,531,854 | |
Net realized gain | | | 2,388,092 | | | | 1,194,506 | | | | 14,732,526 | | | | 11,604,572 | |
Net change in unrealized gain | | | 2,128,274 | | | | 1,374,149 | | | | 10,894,526 | | | | 31,157,396 | |
| | | | |
| Net increase in net assets resulting from operations | | | 5,432,222 | | | | 3,591,494 | | | | 27,782,161 | | | | 45,293,822 | |
| | | | | | | | | | | | | | | | |
| | | | | | | | | | | | | | | | |
| Distributions to shareholders: | |
From distributable earnings: | | | | | | | | | | | | | | | | |
Institutional Shares | | | (731,170 | ) | | | (194,059 | ) | | | — | | | | — | |
Service Shares | | | (1,177,796 | ) | | | (941,156 | ) | | | (14,476,879 | ) | | | (13,028,301 | ) |
| | | | |
| Total distributions to shareholders | | | (1,908,966 | ) | | | (1,135,215 | ) | | | (14,476,879 | ) | | | (13,028,301 | ) |
| | | | | | | | | | | | | | | | |
| | | | | | | | | | | | | | | | |
| From share transactions: | |
Proceeds from sales of shares | | | 19,588,560 | | | | 16,196,196 | | | | 2,826,875 | | | | 2,326,474 | |
Reinvestment of distributions | | | 1,908,966 | | | | 1,135,215 | | | | 14,476,879 | | | | 13,028,301 | |
Cost of shares redeemed | | | (8,140,782 | ) | | | (3,916,341 | ) | | | (24,448,149 | ) | | | (23,176,553 | ) |
| | | | |
| Net increase (decrease) in net assets resulting from share transactions | | | 13,356,744 | | | | 13,415,070 | | | | (7,144,395 | ) | | | (7,821,778 | ) |
| | | | |
| TOTAL INCREASE | | | 16,880,000 | | | | 15,871,349 | | | | 6,160,887 | | | | 24,443,743 | |
| | | | | | | | | | | | | | | | |
| | | | | | | | | | | | | | | | |
| Net Assets: | |
| | | | |
Beginning of year | | | 54,944,802 | | | | 39,073,453 | | | | 179,542,012 | | | | 155,098,269 | |
| | | | |
End of year | | $ | 71,824,802 | | | $ | 54,944,802 | | | $ | 185,702,899 | | | $ | 179,542,012 | |
| | |
| 50 | | The accompanying notes are an integral part of these financial statements. |
GOLDMAN SACHS VARIABLE INSURANCE TRUST FUNDS
Statements of Changes in Net Assets (continued)
| | | | | | | | | | | | | | | | |
| | | Growth Opportunities Fund | | | High Quality Floating Rate Fund | |
| | | For the
Fiscal Year Ended
December 31, 2020 | | | For the
Fiscal Year Ended
December 31, 2019 | | | For the
Fiscal Year Ended
December 31, 2020 | | | For the
Fiscal Year Ended
December 31, 2019 | |
| | | | | | | | | | | | | | | | |
| From operations: | |
Net investment income (loss) | | $ | (358,175 | ) | | $ | (198,140 | ) | | $ | 350,099 | | | $ | 1,640,507 | |
Net realized gain (loss) | | | 15,934,579 | | | | 12,665,789 | | | | (347,852 | ) | | | (156,295 | ) |
Net change in unrealized gain | | | 10,213,950 | | | | 7,849,468 | | | | 323,668 | | | | 164,041 | |
| | | | |
| Net increase in net assets resulting from operations | | | 25,790,354 | | | | 20,317,117 | | | | 325,915 | | | | 1,648,253 | |
| | | | | | | | | | | | | | | | |
| | | | | | | | | | | | | | | | |
| Distributions to shareholders: | |
From distributable earnings: | | | | | | | | | | | | | | | | |
Institutional Shares | | | (23,510 | ) | | | (16,254 | ) | | | (41,958 | ) | | | (76,241 | ) |
Service Shares | | | (13,714,506 | ) | | | (14,062,222 | ) | | | (438,573 | ) | | | (1,495,755 | ) |
Advisor Shares | | | — | | | | — | | | | (28,527 | ) | | | (131,008 | ) |
| | | | |
| Total distributions to shareholders | | | (13,738,016 | ) | | | (14,078,476 | ) | | | (509,058 | ) | | | (1,703,004 | ) |
| | | | | | | | | | | | | | | | |
| | | | | | | | | | | | | | | | |
| From share transactions: | |
Proceeds from sales of shares | | | 8,075,423 | | | | 8,229,475 | | | | 12,272,089 | | | | 10,613,133 | |
Reinvestment of distributions | | | 13,738,016 | | | | 14,078,476 | | | | 509,058 | | | | 1,703,004 | |
Cost of shares redeemed | | | (25,079,859 | ) | | | (15,016,361 | ) | | | (19,254,992 | ) | | | (13,250,898 | ) |
| | | | |
| Net increase (decrease) in net assets resulting from share transactions | | | (3,266,420 | ) | | | 7,291,590 | | | | (6,473,845 | ) | | | (934,761 | ) |
| | | | |
| TOTAL INCREASE (DECREASE) | | | 8,785,918 | | | | 13,530,231 | | | | (6,656,988 | ) | | | (989,512 | ) |
| | | | | | | | | | | | | | | | |
| | | | | | | | | | | | | | | | |
| Net Assets: | |
| | | | |
Beginning of year | | | 73,499,859 | | | | 59,969,628 | | | | 81,304,873 | | | | 82,294,385 | |
| | | | |
End of year | | $ | 82,285,777 | | | $ | 73,499,859 | | | $ | 74,647,885 | | | $ | 81,304,873 | |
| | |
| The accompanying notes are an integral part of these financial statements. | | 51 |
GOLDMAN SACHS VARIABLE INSURANCE TRUST CORE FIXED INCOME FUND
Financial Highlights
Selected Data for a Share Outstanding Throughout Each Year
| | | | | | | | | | | | | | | | | | | | |
| | | Goldman Sachs Core Fixed Income Fund | |
| | | Institutional Shares | |
| | | Year Ended December 31, | |
| | | 2020 | | | 2019 | | | 2018 | | | 2017 | | | 2016 | |
| | | | | | | | | | | | | | | | | | | | |
| Per Share Data | | | | | | | | | | | | | | | |
| | | | | |
Net asset value, beginning of year | | $ | 10.85 | | | $ | 10.20 | | | $ | 10.66 | | | $ | 10.61 | | | $ | 10.53 | |
| | | | | |
Net investment income(a) | | | 0.18 | | | | 0.26 | | | | 0.29 | | | | 0.23 | | | | 0.24 | |
| | | | | |
Net realized and unrealized gain (loss) | | | 0.86 | | | | 0.69 | | | | (0.37 | ) | | | 0.13 | | | | 0.08 | |
| | | | | |
Total from investment operations | | | 1.04 | | | | 0.95 | | | | (0.08 | ) | | | 0.36 | | | | 0.32 | |
| | | | | |
Distributions to shareholders from net investment income | | | (0.26 | ) | | | (0.30 | ) | | | (0.38 | ) | | | (0.31 | ) | | | (0.24 | ) |
| | | | | |
Distributions to shareholders from net realized gains | | | (0.10 | ) | | | — | | | | — | | | | — | | | | — | |
| | | | | |
Total distributions | | | (0.36 | ) | | | (0.30 | ) | | | (0.38 | ) | | | (0.31 | ) | | | (0.24 | ) |
| | | | | |
Net asset value, end of year | | $ | 11.53 | | | $ | 10.85 | | | $ | 10.20 | | | $ | 10.66 | | | $ | 10.61 | |
| | | | | |
Total return(b) | | | 9.64 | % | | | 9.28 | % | | | (0.58 | )% | | | 3.40 | % | | | 2.98 | % |
| | | | | |
Net assets, end of year (in 000s) | | $ | 25,194 | | | $ | 17,421 | | | $ | 2,657 | | | $ | 241 | | | $ | 90 | |
| | | | | |
Ratio of net expenses to average net assets | | | 0.41 | % | | | 0.44 | % | | | 0.42 | % | | | 0.42 | % | | | 0.43 | % |
| | | | | |
Ratio of total expenses to average net assets | | | 0.93 | % | | | 1.08 | % | | | 1.06 | % | | | 0.65 | % | | | 0.65 | % |
| | | | | |
Ratio of net investment income to average net assets | | | 1.61 | % | | | 2.41 | % | | | 2.88 | % | �� | | 2.18 | % | | | 2.28 | % |
| | | | | |
Portfolio turnover rate(c) | | | 501 | % | | | 556 | % | | | 406 | % | | | 229 | % | | | 329 | % |
| (a) | Calculated based on the average shares outstanding methodology. |
| (b) | Assumes investment at the net asset value at the beginning of the year, reinvestment of all distributions, a complete redemption of the investment at the net asset value at the end of the year and no sales or redemption charges (if any). Total returns would be reduced if a sales or redemption charge was taken into account. Returns do not reflect the impact of taxes to shareholders relating to Fund distributions or the redemption of Fund shares. |
| (c) | The Fund’s portfolio turnover rate is calculated in accordance with regulatory requirements, without regard to transactions involving short term investments and certain derivatives. If such transactions were included, the Fund’s portfolio turnover rate may be higher. |
| | |
| 52 | | The accompanying notes are an integral part of these financial statements. |
GOLDMAN SACHS VARIABLE INSURANCE TRUST CORE FIXED INCOME FUND
Financial Highlights (continued)
Selected Data for a Share Outstanding Throughout Each Year
| | | | | | | | | | | | | | | | | | | | |
| | | Goldman Sachs Core Fixed Income Fund | |
| | | Service Shares | |
| | | Year Ended December 31, | |
| | | 2020 | | | 2019 | | | 2018 | | | 2017 | | | 2016 | |
| | | | | | | | | | | | | | | | | | | | |
| Per Share Data | | | | | | | | | | | | | | | |
| | | | | |
Net asset value, beginning of year | | $ | 10.85 | | | $ | 10.21 | | | $ | 10.65 | | | $ | 10.60 | | | $ | 10.53 | |
| | | | | |
Net investment income(a) | | | 0.16 | | | | 0.25 | | | | 0.25 | | | | 0.21 | | | | 0.22 | |
| | | | | |
Net realized and unrealized gain (loss) | | | 0.85 | | | | 0.66 | | | | (0.34 | ) | | | 0.12 | | | | 0.07 | |
| | | | | |
Total from investment operations | | | 1.01 | | | | 0.91 | | | | (0.09 | ) | | | 0.33 | | | | 0.29 | |
| | | | | |
Distributions to shareholders from net investment income | | | (0.23 | ) | | | (0.27 | ) | | | (0.35 | ) | | | (0.28 | ) | | | (0.22 | ) |
| | | | | |
Distributions to shareholders from net realized gains | | | (0.10 | ) | | | — | | | | — | | | | — | | | | — | |
| | | | | |
Total distributions | | | (0.33 | ) | | | (0.27 | ) | | | (0.35 | ) | | | (0.28 | ) | | | (0.22 | ) |
| | | | | |
Net asset value, end of year | | $ | 11.53 | | | $ | 10.85 | | | $ | 10.21 | | | $ | 10.65 | | | $ | 10.60 | |
| | | | | |
Total return(b) | | | 9.37 | % | | | 9.00 | % | | | (0.83 | )% | | | 3.14 | % | | | 2.70 | % |
| | | | | |
Net assets, end of year (in 000s) | | $ | 46,631 | | | $ | 37,524 | | | $ | 36,416 | | | $ | 108,948 | | | $ | 110,476 | |
| | | | | |
Ratio of net expenses to average net assets | | | 0.66 | % | | | 0.68 | % | | | 0.67 | % | | | 0.67 | % | | | 0.67 | % |
| | | | | |
Ratio of total expenses to average net assets | | | 1.18 | % | | | 1.35 | % | | | 1.18 | % | | | 0.90 | % | | | 0.91 | % |
| | | | | |
Ratio of net investment income to average net assets | | | 1.39 | % | | | 2.33 | % | | | 2.46 | % | | | 1.95 | % | | | 2.05 | % |
| | | | | |
Portfolio turnover rate(c) | | | 501 | % | | | 556 | % | | | 406 | % | | | 229 | % | | | 329 | % |
| (a) | Calculated based on the average shares outstanding methodology. |
| (b) | Assumes investment at the net asset value at the beginning of the year, reinvestment of all distributions, a complete redemption of the investment at the net asset value at the end of the year and no sales or redemption charges (if any). Total returns would be reduced if a sales or redemption charge was taken into account. Returns do not reflect the impact of taxes to shareholders relating to Fund distributions or the redemption of Fund shares. |
| (c) | The Fund’s portfolio turnover rate is calculated in accordance with regulatory requirements, without regard to transactions involving short term investments and certain derivatives. If such transactions were included, the Fund’s portfolio turnover rate may be higher. |
| | |
| The accompanying notes are an integral part of these financial statements. | | 53 |
GOLDMAN SACHS VARIABLE INSURANCE TRUST EQUITY INDEX FUND
Financial Highlights (continued)
Selected Data for a Share Outstanding Throughout Each Year
| | | | | | | | | | | | | | | | | | | | |
| | | Goldman Sachs Equity Index Fund | |
| | | Service Shares | |
| | | Year Ended December 31, | |
| | | 2020 | | | 2019 | | | 2018 | | | 2017 | | | 2016 | |
| | | | | | | | | | | | | | | | | | | | |
| Per Share Data | | | | | | | | | | | | | | | |
| | | | | |
Net asset value, beginning of year | | $ | 17.50 | | | $ | 14.43 | | | $ | 16.60 | | | $ | 14.49 | | | $ | 13.91 | |
| | | | | |
Net investment income(a) | | | 0.22 | | | | 0.25 | | | | 0.25 | | | | 0.24 | | | | 0.25 | |
| | | | | |
Net realized and unrealized gain (loss) | | | 2.89 | | | | 4.18 | | | | (1.04 | ) | | | 2.85 | | | | 1.35 | |
| | | | | |
Total from investment operations | | | 3.11 | | | | 4.43 | | | | (0.79 | ) | | | 3.09 | | | | 1.60 | |
| | | | | |
Distributions to shareholders from net investment income | | | (0.23 | ) | | | (0.26 | ) | | | (0.27 | ) | | | (0.26 | ) | | | (0.33 | ) |
| | | | | |
Distributions to shareholders from net realized gains | | | (1.37 | ) | | | (1.10 | ) | | | (1.11 | ) | | | (0.72 | ) | | | (0.69 | ) |
| | | | | |
Total distributions | | | (1.60 | ) | | | (1.36 | ) | | | (1.38 | ) | | | (0.98 | ) | | | (1.02 | ) |
| | | | | |
Net asset value, end of year | | $ | 19.01 | | | $ | 17.50 | | | $ | 14.43 | | | $ | 16.60 | | | $ | 14.49 | |
| | | | | |
Total return(b) | | | 17.84 | % | | | 30.85 | % | | | (4.87 | )% | | | 21.29 | % | | | 11.41 | % |
| | | | | |
Net assets, end of year (in 000s) | | $ | 185,703 | | | $ | 179,542 | | | $ | 155,098 | | | $ | 179,036 | | | $ | 165,551 | |
| | | | | |
Ratio of net expenses to average net assets | | | 0.48 | % | | | 0.50 | % | | | 0.48 | % | | | 0.48 | % | | | 0.48 | % |
| | | | | |
Ratio of total expenses to average net assets | | | 0.76 | % | | | 0.78 | % | | | 0.72 | % | | | 0.71 | % | | | 0.73 | % |
| | | | | |
Ratio of net investment income to average net assets | | | 1.28 | % | | | 1.48 | % | | | 1.48 | % | | | 1.53 | % | | | 1.73 | % |
| | | | | |
Portfolio turnover rate(c) | | | 4 | % | | | 3 | % | | | 4 | % | | | 2 | % | | | 3 | % |
| (a) | Calculated based on the average shares outstanding methodology. |
| (b) | Assumes investment at the net asset value at the beginning of the year, reinvestment of all distributions, a complete redemption of the investment at the net asset value at the end of the year and no sales or redemption charges (if any). Total returns would be reduced if a sales or redemption charge was taken into account. Returns do not reflect the impact of taxes to shareholders relating to Fund distributions or the redemption of Fund shares. |
| (c) | The Fund’s portfolio turnover rate is calculated in accordance with regulatory requirements, without regard to transactions involving short term investments and certain derivatives. If such transactions were included, the Fund’s portfolio turnover rate may be higher. |
| | |
| 54 | | The accompanying notes are an integral part of these financial statements. |
GOLDMAN SACHS VARIABLE INSURANCE TRUST GROWTH OPPORTUNITIES FUND
Financial Highlights (continued)
Selected Data for a Share Outstanding Throughout Each Year
| | | | | | | | | | | | | | | | | | | | |
| | | Goldman Sachs Growth Opportunities Fund | |
| | | Institutional Shares | |
| | | Year Ended December 31,* | |
| | | 2020 | | | 2019 | | | 2018 | | | 2017 | | | 2016 | |
| | | | | | | | | | | | | | | | | | | | |
| Per Share Data | | | | | | | | | | | | | | | |
| | | | | |
Net asset value, beginning of year | | $ | 11.50 | | | $ | 10.51 | | | $ | 31.13 | | | $ | 27.13 | | | $ | 26.86 | |
| | | | | |
Net investment loss(a) | | | (0.04 | ) | | | (0.01 | ) | | | (0.02 | ) | | | (0.04 | ) | | | (0.07 | ) |
| | | | | |
Net realized and unrealized gain (loss) | | | 5.06 | | | | 3.59 | | | | (1.30 | ) | | | 7.40 | | | | 0.52 | |
| | | | | |
Total from investment operations | | | 5.02 | | | | 3.58 | | | | (1.32 | ) | | | 7.36 | | | | 0.45 | |
| | | | | |
Distributions to shareholders from net realized gains | | | (2.59 | ) | | | (2.59 | ) | | | (19.30 | ) | | | (3.36 | ) | | | (0.18 | ) |
| | | | | |
Net asset value, end of year | | $ | 13.93 | | | $ | 11.50 | | | $ | 10.51 | | | $ | 31.13 | | | $ | 27.13 | |
| | | | | |
Total return(b) | | | 44.33 | % | | | 34.35 | % | | | (4.17 | )% | | | 27.14 | % | | | 1.71 | % |
| | | | | |
Net assets, end of year (in 000s) | | $ | 151 | | | $ | 94 | | | $ | 59 | | | $ | 52 | | | $ | 3,518 | |
| | | | | |
Ratio of net expenses to average net assets | | | 0.85 | % | | | 0.88 | % | | | 0.85 | % | | | 0.87 | % | | | 0.89 | % |
| | | | | |
Ratio of total expenses to average net assets | | | 1.23 | % | | | 1.26 | % | | | 1.20 | % | | | 1.14 | % | | | 1.16 | % |
| | | | | |
Ratio of net investment loss to average net assets | | | (0.34 | )% | | | (0.12 | )% | | | (0.08 | )% | | | (0.13 | )% | | | (0.26 | )% |
| | | | | |
Portfolio turnover rate(c) | | | 71 | % | | | 75 | % | | | 59 | % | | | 57 | % | | | 63 | % |
| * | All per share amounts representing data prior to May 17, 2019 have been restated to reflect a 4 to 1 reverse stock split which occurred on that date. |
| (a) | Calculated based on the average shares outstanding methodology. |
| (b) | Assumes investment at the net asset value at the beginning of the year, reinvestment of all distributions, a complete redemption of the investment at the net asset value at the end of the year and no sales or redemption charges (if any). Total returns would be reduced if a sales or redemption charge was taken into account. Returns do not reflect the impact of taxes to shareholders relating to Fund distributions or the redemption of Fund shares. |
| (c) | The Fund’s portfolio turnover rate is calculated in accordance with regulatory requirements, without regard to transactions involving short term investments. If such transactions were included, the Fund’s portfolio turnover rate may be higher. |
| | |
| The accompanying notes are an integral part of these financial statements. | | 55 |
GOLDMAN SACHS VARIABLE INSURANCE TRUST GROWTH OPPORTUNITIES FUND
Financial Highlights (continued)
Selected Data for a Share Outstanding Throughout Each Year
| | | | | | | | | | | | | | | | | | | | |
| | | Goldman Sachs Growth Opportunities Fund | |
| | | Service Shares | |
| | | Year Ended December 31,* | |
| | | 2020 | | | 2019 | | | 2018 | | | 2017 | | | 2016 | |
| | | | | | | | | | | | | | | | | | | | |
| Per Share Data | | | | | | | | | | | | | | | |
| | | | | |
Net asset value, beginning of year | | $ | 11.00 | | | $ | 10.15 | | | $ | 30.80 | | | $ | 26.92 | | | $ | 26.71 | |
| | | | | |
Net investment loss(a) | | | (0.06 | ) | | | (0.02 | ) | | | (0.07 | ) | | | (0.08 | ) | | | (0.10 | ) |
| | | | | |
Net realized and unrealized gain (loss) | | | 4.84 | | | | 3.46 | | | | (1.28 | ) | | | 7.32 | | | | 0.49 | |
| | | | | |
Total from investment operations | | | 4.78 | | | | 3.44 | | | | (1.35 | ) | | | 7.24 | | | | 0.39 | |
| | | | | |
Distributions to shareholders from net realized gains | | | (2.59 | ) | | | (2.59 | ) | | | (19.30 | ) | | | (3.36 | ) | | | (0.18 | ) |
| | | | | |
Net asset value, end of year | | $ | 13.19 | | | $ | 11.00 | | | $ | 10.15 | | | $ | 30.80 | | | $ | 26.92 | |
| | | | | |
Total return(b) | | | 44.16 | % | | | 34.06 | % | | | (4.34 | )% | | | 26.92 | % | | | 1.42 | % |
| | | | | |
Net assets, end of year (in 000s) | | $ | 82,134 | | | $ | 73,406 | | | $ | 59,910 | | | $ | 170,785 | | | $ | 155,924 | |
| | | | | |
Ratio of net expenses to average net assets | | | 1.01 | % | | | 1.04 | % | | | 1.01 | % | | | 1.02 | % | | | 1.05 | % |
| | | | | |
Ratio of total expenses to average net assets | | | 1.48 | % | | | 1.51 | % | | | 1.44 | % | | | 1.39 | % | | | 1.40 | % |
| | | | | |
Ratio of net investment loss to average net assets | | | (0.50 | )% | | | (0.28 | )% | | | (0.24 | )% | | | (0.26 | )% | | | (0.37 | )% |
| | | | | |
Portfolio turnover rate(c) | | | 71 | % | | | 75 | % | | | 59 | % | | | 57 | % | | | 63 | % |
| * | All per share amounts representing data prior to May 17, 2019 have been restated to reflect a 4 to 1 reverse stock split which occurred on that date. |
| (a) | Calculated based on the average shares outstanding methodology. |
| (b) | Assumes investment at the net asset value at the beginning of the year, reinvestment of all distributions, a complete redemption of the investment at the net asset value at the end of the year and no sales or redemption charges (if any). Total returns would be reduced if a sales or redemption charge was taken into account. Returns do not reflect the impact of taxes to shareholders relating to Fund distributions or the redemption of Fund shares. |
| (c) | The Fund’s portfolio turnover rate is calculated in accordance with regulatory requirements, without regard to transactions involving short term investments. If such transactions were included, the Fund’s portfolio turnover rate may be higher. |
| | |
| 56 | | The accompanying notes are an integral part of these financial statements. |
GOLDMAN SACHS VARIABLE INSURANCE TRUST HIGH QUALITY FLOATING RATE FUND
Financial Highlights (continued)
Selected Data for a Share Outstanding Throughout Each Year
| | | | | | | | | | | | | | | | | | | | |
| | | Goldman Sachs High Quality Floating Rate Fund | |
| | | Institutional Shares | |
| | | Year Ended December 31, | |
| | | 2020 | | | 2019 | | | 2018 | | | 2017 | | | 2016 | |
| | | | | | | | | | | | | | | | | | | | |
| Per Share Data | | | | | | | | | | | | | | | |
| | | | | |
Net asset value, beginning of year | | $ | 10.37 | | | $ | 10.38 | | | $ | 10.42 | | | $ | 10.41 | | | $ | 10.40 | |
| | | | | |
Net investment income(a) | | | 0.07 | | | | 0.22 | | | | 0.24 | | | | 0.14 | | | | 0.11 | |
| | | | | |
Net realized and unrealized gain (loss) | | | 0.02 | | | | 0.01 | | | | (0.06 | ) | | | 0.03 | | | | 0.03 | |
| | | | | |
Total from investment operations | | | 0.09 | | | | 0.23 | | | | 0.18 | | | | 0.17 | | | | 0.14 | |
| | | | | |
Distributions to shareholders from net investment income | | | (0.09 | ) | | | (0.24 | ) | | | (0.22 | ) | | | (0.16 | ) | | | (0.13 | ) |
| | | | | |
Net asset value, end of year | | $ | 10.37 | | | $ | 10.37 | | | $ | 10.38 | | | $ | 10.42 | | | $ | 10.41 | |
| | | | | |
Total return(b) | | | 0.86 | % | | | 2.27 | % | | | 1.75 | % | | | 1.62 | % | | | 1.35 | % |
| | | | | |
Net assets, end of year (in 000s) | | $ | 5,113 | | | $ | 4,877 | | | $ | 2,326 | | | $ | 57 | | | $ | 25 | |
| | | | | |
Ratio of net expenses to average net assets | | | 0.34 | % | | | 0.37 | % | | | 0.34 | % | | | 0.36 | % | | | 0.39 | % |
| | | | | |
Ratio of total expenses to average net assets | | | 0.71 | % | | | 0.66 | % | | | 0.63 | % | | | 0.72 | % | | | 0.78 | % |
| | | | | |
Ratio of net investment income to average net assets | | | 0.68 | % | | | 2.15 | % | | | 2.28 | % | | | 1.33 | % | | | 1.03 | % |
| | | | | |
Portfolio turnover rate(c) | | | 35 | % | | | 20 | % | | | 36 | % | | | 38 | % | | | 47 | % |
| (a) | Calculated based on the average shares outstanding methodology. |
| (b) | Assumes investment at the net asset value at the beginning of the year, reinvestment of all distributions, a complete redemption of the investment at the net asset value at the end of the year and no sales or redemption charges (if any). Total returns would be reduced if a sales or redemption charge was taken into account. Returns do not reflect the impact of taxes to shareholders relating to Fund distributions or the redemption of Fund shares. |
| (c) | The Fund’s portfolio turnover rate is calculated in accordance with regulatory requirements, without regard to transactions involving short term investments and certain derivatives. If such transactions were included, the Fund’s portfolio turnover rate may be higher. |
| | |
| The accompanying notes are an integral part of these financial statements. | | 57 |
GOLDMAN SACHS VARIABLE INSURANCE TRUST HIGH QUALITY FLOATING RATE FUND
Financial Highlights (continued)
Selected Data for a Share Outstanding Throughout Each Year
| | | | | | | | | | | | | | | | | | | | |
| | | Goldman Sachs High Quality Floating Rate Fund | |
| | | Service Shares | |
| | | Year Ended December 31, | |
| | | 2020 | | | 2019 | | | 2018 | | | 2017 | | | 2016 | |
| | | | | | | | | | | | | | | | | | | | |
| Per Share Data | | | | | | | | | | | | | | | |
| | | | | |
Net asset value, beginning of year | | $ | 10.35 | | | $ | 10.36 | | | $ | 10.40 | | | $ | 10.38 | | | $ | 10.38 | |
| | | | | |
Net investment income(a) | | | 0.05 | | | | 0.21 | | | | 0.19 | | | | 0.11 | | | | 0.08 | |
| | | | | |
Net realized and unrealized gain (loss) | | | 0.01 | | | | — | (b) | | | (0.03 | ) | | | 0.04 | | | | 0.02 | |
| | | | | |
Total from investment operations | | | 0.06 | | | | 0.21 | | | | 0.16 | | | | 0.15 | | | | 0.10 | |
| | | | | |
Distributions to shareholders from net investment income | | | (0.07 | ) | | | (0.22 | ) | | | (0.20 | ) | | | (0.13 | ) | | | (0.10 | ) |
| | | | | |
Net asset value, end of year | | $ | 10.34 | | | $ | 10.35 | | | $ | 10.36 | | | $ | 10.40 | | | $ | 10.38 | |
| | | | | |
Total return(c) | | | 0.58 | % | | | 2.01 | % | | | 1.50 | % | | | 1.47 | % | | | 1.00 | % |
| | | | | |
Net assets, end of year (in 000s) | | $ | 65,832 | | | $ | 69,964 | | | $ | 72,784 | | | $ | 66,548 | | | $ | 66,710 | |
| | | | | |
Ratio of net expenses to average net assets | | | 0.59 | % | | | 0.62 | % | | | 0.60 | % | | | 0.61 | % | | | 0.65 | % |
| | | | | |
Ratio of total expenses to average net assets | | | 0.95 | % | | | 0.90 | % | | | 0.91 | % | | | 0.97 | % | | | 1.04 | % |
| | | | | |
Ratio of net investment income to average net assets | | | 0.46 | % | | | 2.00 | % | | | 1.82 | % | | | 1.08 | % | | | 0.77 | % |
| | | | | |
Portfolio turnover rate(d) | | | 35 | % | | | 20 | % | | | 36 | % | | | 38 | % | | | 47 | % |
| (a) | Calculated based on the average shares outstanding methodology. |
| (b) | Amount is less than $0.005 per share. |
| (c) | Assumes investment at the net asset value at the beginning of the year, reinvestment of all distributions, a complete redemption of the investment at the net asset value at the end of the year and no sales or redemption charges (if any). Total returns would be reduced if a sales or redemption charge was taken into account. Returns do not reflect the impact of taxes to shareholders relating to Fund distributions or the redemption of Fund shares. |
| (d) | The Fund’s portfolio turnover rate is calculated in accordance with regulatory requirements, without regard to transactions involving short term investments and certain derivatives. If such transactions were included, the Fund’s portfolio turnover rate may be higher. |
| | |
| 58 | | The accompanying notes are an integral part of these financial statements. |
GOLDMAN SACHS VARIABLE INSURANCE TRUST HIGH QUALITY FLOATING RATE FUND
Financial Highlights (continued)
Selected Data for a Share Outstanding Throughout Each Year
| | | | | | | | | | | | | | | | | | | | |
| | | Goldman Sachs High Quality Floating Rate Fund | |
| | | Advisor Shares | |
| | | Year Ended December 31, | |
| | | 2020 | | | 2019 | | | 2018 | | | 2017 | | | 2016 | |
| | | | | | | | | | | | | | | | | | | | |
| Per Share Data | | | | | | | | | | | | | | | |
| | | | | |
Net asset value, beginning of year | | $ | 10.36 | | | $ | 10.37 | | | $ | 10.41 | | | $ | 10.40 | | | $ | 10.40 | |
| | | | | |
Net investment income(a) | | | 0.04 | | | | 0.19 | | | | 0.18 | | | | 0.10 | | | | 0.06 | |
| | | | | |
Net realized and unrealized gain (loss) | | | — | (b) | | | — | (b) | | | (0.04 | ) | | | 0.03 | | | | 0.03 | |
| | | | | |
Total from investment operations | | | 0.04 | | | | 0.19 | | | | 0.14 | | | | 0.13 | | | | 0.09 | |
| | | | | |
Distributions to shareholders from net investment income | | | (0.06 | ) | | | (0.20 | ) | | | (0.18 | ) | | | (0.12 | ) | | | (0.09 | ) |
| | | | | |
Net asset value, end of year | | $ | 10.34 | | | $ | 10.36 | | | $ | 10.37 | | | $ | 10.41 | | | $ | 10.40 | |
| | | | | |
Total return(c) | | | 0.38 | % | | | 1.85 | % | | | 1.37 | % | | | 1.26 | % | | | 0.96 | % |
| | | | | |
Net assets, end of year (in 000s) | | $ | 3,703 | | | $ | 6,464 | | | $ | 7,184 | | | $ | 4,726 | | | $ | 1,658 | |
| | | | | |
Ratio of net expenses to average net assets | | | 0.74 | % | | | 0.76 | % | | | 0.75 | % | | | 0.76 | % | | | 0.80 | % |
| | | | | |
Ratio of total expenses to average net assets | | | 1.09 | % | | | 1.05 | % | | | 1.05 | % | | | 1.12 | % | | | 1.18 | % |
| | | | | |
Ratio of net investment income to average net assets | | | 0.39 | % | | | 1.86 | % | | | 1.69 | % | | | 0.96 | % | | | 0.62 | % |
| | | | | |
Portfolio turnover rate(d) | | | 35 | % | | | 20 | % | | | 36 | % | | | 38 | % | | | 47 | % |
| (a) | Calculated based on the average shares outstanding methodology. |
| (b) | Amount is less than $0.005 per share. |
| (c) | Assumes investment at the net asset value at the beginning of the year, reinvestment of all distributions, a complete redemption of the investment at the net asset value at the end of the year and no sales or redemption charges (if any). Total returns would be reduced if a sales or redemption charge was taken into account. Returns do not reflect the impact of taxes to shareholders relating to Fund distributions or the redemption of Fund shares. |
| (d) | The Fund’s portfolio turnover rate is calculated in accordance with regulatory requirements, without regard to transactions involving short term investments and certain derivatives. If such transactions were included, the Fund’s portfolio turnover rate may be higher. |
| | |
| The accompanying notes are an integral part of these financial statements. | | 59 |
GOLDMAN SACHS VARIABLE INSURANCE TRUST FUNDS
Notes to Financial Statements
December 31, 2020
1. ORGANIZATION
Goldman Sachs Variable Insurance Trust (the “Trust” or “VIT”) is a Delaware statutory trust registered under the Investment Company Act of 1940, as amended (the “Act”), as an open-end management investment company. The following table lists those series of the Trust that are included in this report (collectively, the “Funds” or individually a “Fund”), along with their corresponding share classes and respective diversification status under the Act:
| | | | |
| Fund | | Share Classes Offered | | Diversified/ Non-diversified |
High Quality Floating Rate | | Institutional, Service and Advisor | | Diversified |
Core Fixed Income and Growth Opportunities | | Institutional and Service | | Diversified |
Equity Index | | Service | | Diversified |
Shares of the Trust are offered to a separate account of participating life insurance companies for the purpose of funding variable annuity contracts and variable life insurance policies.
Goldman Sachs Asset Management, L.P. (“GSAM”), an affiliate of Goldman Sachs & Co. LLC (“Goldman Sachs”), serves as investment adviser to the Funds pursuant to management agreements (the “Agreements”) with the Trust.
2. SIGNIFICANT ACCOUNTING POLICIES
The financial statements have been prepared in accordance with accounting principles generally accepted in the United States of America (“GAAP”) and require management to make estimates and assumptions that may affect the reported amounts and disclosures. Actual results may differ from those estimates and assumptions. Each Fund is an investment company under GAAP and follows the accounting and reporting guidance applicable to investment companies.
A. Investment Valuation — The Funds’ valuation policy is to value investments at fair value.
B. Investment Income and Investments — Investment income includes interest income, dividend income, and securities lending income, if any. Interest income is accrued daily and adjusted for amortization of premiums and accretion of discounts. Dividend income is recognized on ex-dividend date or, for certain foreign securities, as soon as such information is obtained subsequent to the ex-dividend date. Non-cash dividends, if any, are recorded at the fair market value of the securities received. Investment transactions are reflected on trade date. Realized gains and losses are calculated using identified cost. Investment transactions are recorded on the following business day for daily net asset value (“NAV”) calculations. Distributions received from the Funds’ investments in United States (“U.S.”) real estate investment trusts (“REITs”) may be characterized as ordinary income, net capital gain and/or a return of capital. A return of capital is recorded by the Funds as a reduction to the cost basis of the REIT.
For derivative contracts, realized gains and losses are recorded upon settlement of the contract. Upfront payments, if any, are made or received upon entering into a swap agreement and are reflected in the Statements of Assets and Liabilities. Upfront payments are recognized over the contract’s term/event as realized gains or losses, with the exception of forward starting swap contracts whose realized gains or losses are recognized from the effective start date. For securities with paydown provisions, principal payments received are treated as a proportionate reduction to the cost basis of the securities, and excess or shortfall amounts are recorded as income. For treasury inflation protected securities (“TIPS”), adjustments to principal due to inflation/deflation are reflected as increases/decreases to interest income with a corresponding adjustment to cost.
C. Class Allocations and Expenses — Investment income, realized and unrealized gain (loss), if any, and non-class specific expenses of each Fund are allocated daily based upon the proportion of net assets of each class. Non-class specific expenses directly incurred by a Fund are charged to that Fund, while such expenses incurred by the Trust are allocated across the applicable Funds on a straight-line and/or pro-rata basis depending upon the nature of the expenses. Class specific expenses, where applicable, are borne by the respective share classes and include Distribution and Service and Transfer Agency fees.
60
GOLDMAN SACHS VARIABLE INSURANCE TRUST FUNDS
2. SIGNIFICANT ACCOUNTING POLICIES (continued)
D. Federal Taxes and Distributions to Shareholders — It is each Fund’s policy to comply with the requirements of the Internal Revenue Code of 1986, as amended (the “Code”), applicable to regulated investment companies and to distribute each year substantially all of its investment company taxable income and capital gains to its shareholders. Accordingly, each Fund is not required to make any provisions for the payment of federal income tax. Distributions to shareholders are recorded on the ex-dividend date. Income and capital gains distributions, if any, are declared and paid according to the following schedule:
| | | | |
| Fund | | Income Distributions Declared/Paid | | Capital Gains Distributions
Declared/Paid |
Core Fixed Income and High Quality Floating Rate | | Quarterly | | Annually |
Equity Index and Growth Opportunities | | Annually | | Annually |
Net capital losses, if any, are carried forward to future fiscal years and may be used to the extent allowed by the Code to offset any future capital gains. Losses that are carried forward will retain their character as either short-term or long-term capital losses. Utilization of capital loss carryforwards will reduce the requirement of future capital gains distributions.
The characterization of distributions to shareholders for financial reporting purposes is determined in accordance with federal income tax rules, which may differ from GAAP. The source of each Fund’s distributions may be shown in the accompanying financial statements as either from distributable earnings or capital. Certain components of the Funds’ net assets on the Statements of Assets and Liabilities reflect permanent GAAP/tax differences based on the appropriate tax character.
E. Foreign Currency Translation — The accounting records and reporting currency of a Fund are maintained in U.S. dollars. Assets and liabilities denominated in foreign currencies are translated into U.S. dollars using the current exchange rates at the close of each business day. The effect of changes in foreign currency exchange rates on investments is included within net realized and unrealized gain (loss) on investments. Changes in the value of other assets and liabilities as a result of fluctuations in foreign exchange rates are included in the Statements of Operations within net change in unrealized gain (loss) on foreign currency translation. Transactions denominated in foreign currencies are translated into U.S. dollars on the date the transaction occurred, the effects of which are included within net realized gain (loss) on foreign currency transactions.
3. INVESTMENTS AND FAIR VALUE MEASUREMENTS
U.S. GAAP defines the fair value of a financial instrument as the amount that would be received to sell an asset or paid to transfer a liability in an orderly transaction between market participants at the measurement date (i.e., the exit price); the Funds’ policy is to use the market approach. GAAP establishes a fair value hierarchy that prioritizes the inputs to valuation techniques used to measure fair value. The hierarchy gives the highest priority to unadjusted quoted prices in active markets for identical assets or liabilities (Level 1 measurements) and the lowest priority to unobservable inputs (Level 3 measurements). The level in the fair value hierarchy within which the fair value measurement in its entirety falls shall be determined based on the lowest level input that is significant to the fair value measurement in its entirety. The levels used for classifying investments are not necessarily an indication of the risk associated with investing in these investments. The three levels of the fair value hierarchy are described below:
Level 1 — Unadjusted quoted prices in active markets that are accessible at the measurement date for identical, unrestricted assets or liabilities;
Level 2 — Quoted prices in markets that are not active or financial instruments for which significant inputs are observable (including, but not limited to, quoted prices for similar investments, interest rates, foreign exchange rates, volatility and credit spreads), either directly or indirectly;
Level 3 — Prices or valuations that require significant unobservable inputs (including GSAM’s assumptions in determining fair value measurement).
61
GOLDMAN SACHS VARIABLE INSURANCE TRUST FUNDS
Notes to Financial Statements (continued)
December 31, 2020
3. INVESTMENTS AND FAIR VALUE MEASUREMENTS (continued)
The Board of Trustees (“Trustees”) has approved Valuation Procedures that govern the valuation of the portfolio investments held by the Funds, including investments for which market quotations are not readily available. The Trustees have delegated to GSAM day-to-day responsibility for implementing and maintaining internal controls and procedures related to the valuation of the Funds’ investments. To assess the continuing appropriateness of pricing sources and methodologies, GSAM regularly performs price verification procedures and issues challenges as necessary to third party pricing vendors or brokers, and any differences are reviewed in accordance with the Valuation Procedures.
A. Level 1 and Level 2 Fair Value Investments — The valuation techniques and significant inputs used in determining the fair values for investments classified as Level 1 and Level 2 are as follows:
Equity Securities — Equity securities traded on a U.S. securities exchange or the NASDAQ system, or those located on certain foreign exchanges, including but not limited to the Americas, are valued daily at their last sale price or official closing price on the principal exchange or system on which they are traded. If there is no sale or official closing price or such price is believed by GSAM to not represent fair value, equity securities will be valued at the valid closing bid price for long positions and at the valid closing ask price for short positions (i.e. where there is sufficient volume, during normal exchange trading hours). If no valid bid/ask price is available, the equity security will be valued pursuant to the Valuation Procedures approved by the Trustees and consistent with applicable regulatory guidance. To the extent these investments are actively traded, they are classified as Level 1 of the fair value hierarchy, otherwise they are generally classified as Level 2. Certain equity securities containing unique attributes may be classified as Level 2.
Unlisted equity securities for which market quotations are available are valued at the last sale price on the valuation date, or if no sale occurs, at the last bid price for long positions or the last ask price for short positions, and are generally classified as Level 2.
Money Market Funds — Investments in the Goldman Sachs Financial Square Government Fund (“Underlying Fund”) are valued at the NAV per share of the Institutional Share class on the day of valuation. These investments are generally classified as Level 1 of the fair value hierarchy. For information regarding the Underlying Fund’s accounting policies and investment holdings, please see the Underlying Fund’s shareholder report.
Debt Securities — Debt securities for which market quotations are readily available are valued daily on the basis of quotations supplied by dealers or an independent pricing service approved by the Trustees. The pricing services may use valuation models or matrix pricing, which consider: (i) yield or price with respect to bonds that are considered comparable in characteristics such as rating, interest rate and maturity date or (ii) quotations from securities dealers to determine current value. With the exception of treasury securities of G7 countries, which are generally classified as Level 1, these investments are generally classified as Level 2 of the fair value hierarchy.
i. Commercial Paper — Commercial paper normally represents short-term unsecured promissory notes issued in bearer form by banks or bank holding companies, corporations, finance companies and other issuers. Commercial paper consists of direct U.S. dollar-denominated obligations of domestic or foreign issuers. Asset-backed commercial paper is issued by a special purpose entity that is organized to issue the commercial paper and to purchase trade receivables or other financial assets.
ii. Mortgage-Backed and Asset-Backed Securities — Mortgage-backed securities represent direct or indirect participations in, or are collateralized by and payable from, mortgage loans secured by residential and/or commercial real estate property. Asset-backed securities include securities whose principal and interest payments are collateralized by pools of other assets or receivables. The value of certain mortgage-backed and asset-backed securities (including adjustable rate mortgage loans) may be particularly sensitive to changes in prevailing interest rates. The value of these securities may also fluctuate in response to the market’s perception of the creditworthiness of the issuers.
Asset-backed securities may present credit risks that are not presented by mortgage-backed securities because they generally do not have the benefit of a security interest in collateral that is comparable to mortgage assets. Some asset-backed securities may only have a subordinated claim on collateral.
62
GOLDMAN SACHS VARIABLE INSURANCE TRUST FUNDS
3. INVESTMENTS AND FAIR VALUE MEASUREMENTS (continued)
Stripped mortgage-backed securities are usually structured with two different classes: one that receives substantially all interest payments (interest-only, or “IO” and/or high coupon rate with relatively low principal amount, or “IOette”), and the other that receives substantially all principal payments (principal-only, or “PO”) from a pool of mortgage loans. Little to no principal will be received at the maturity of an IO; as a result, periodic adjustments are recorded to reduce the cost of the security until maturity. These adjustments are included in interest income.
iii. Mortgage Dollar Rolls — Mortgage dollar rolls are transactions whereby a Fund sells mortgage-backed-securities and simultaneously contracts with the same counterparty to repurchase similar securities on a specified future date. During the settlement period, a Fund will not be entitled to accrue interest and receive principal payments on the securities sold. The Funds account for mortgage dollar roll transactions as purchases and sales and realize gains and losses on these transactions.
iv. Treasury Inflation Protected Securities — TIPS are treasury securities in which the principal amount is adjusted daily to keep pace with inflation, as measured by the U.S. Consumer Pricing Index for Urban Consumers. The repayment of the original bond principal upon maturity is guaranteed by the full faith and credit of the U.S. Government.
v. When-Issued Securities and Forward Commitments — When-issued securities, including TBA (“To Be Announced”) securities, are securities that are authorized but not yet issued in the market and purchased in order to secure what is considered to be an advantageous price or yield to a Fund. A forward commitment involves entering into a contract to purchase or sell securities, typically on an extended settlement basis, for a fixed price at a future date. The purchase of securities on a when-issued or forward commitment basis involves a risk of loss if the value of the security to be purchased declines before the settlement date. Conversely, the sale of securities on a forward commitment basis involves the risk that the value of the securities sold may increase before the settlement date. Although a Fund will generally purchase securities on a when-issued or forward commitment basis with the intention of acquiring the securities for its portfolio, the Fund may dispose of when-issued securities or forward commitments prior to settlement, which may result in a realized gain or loss. For financial reporting purposes, cash collateral that has been pledged to cover obligations of a Fund and cash collateral received, if any, is reported separately on the Statements of Assets and Liabilities as receivables/payables for collateral on other investments. Non-cash collateral pledged by a Fund, if any, is noted in the Schedules of Investments.
Derivative Contracts — A derivative is an instrument whose value is derived from underlying assets, indices, reference rates or a combination of these factors. A Fund enters into derivative transactions to hedge against changes in interest rates, securities prices, and/or currency exchange rates, to increase total return, or to gain access to certain markets or attain exposure to other underliers. For financial reporting purposes, cash collateral that has been pledged to cover obligations of a Fund and cash collateral received, if any, is reported separately on the Statements of Assets and Liabilities as receivables/payables for collateral on certain derivatives contracts. Non-cash collateral pledged by a Fund, if any, is noted in the Schedules of Investments.
Exchange-traded derivatives, including futures and options contracts, are generally valued at the last sale or settlement price on the exchange where they are principally traded. Exchange-traded options without settlement prices are generally valued at the midpoint of the bid and ask prices on the exchange where they are principally traded (or, in the absence of two-way trading, at the last bid price for long positions and the last ask price for short positions). Exchange-traded derivatives typically fall within Level 1 of the fair value hierarchy. Over-the-counter (“OTC”) and centrally cleared derivatives are valued using market transactions and other market evidence, including market-based inputs to models, calibration to market-clearing transactions, broker or dealer quotations, or other alternative pricing sources. Where models are used, the selection of a particular model to value OTC and centrally cleared derivatives depends upon the contractual terms of, and specific risks inherent in, the instrument, as well as the availability of pricing information in the market. Valuation models require a variety of inputs, including contractual terms, market prices, yield curves, credit curves, measures of volatility, voluntary and involuntary prepayment rates, loss severity rates and correlations of such inputs. For OTC and centrally cleared derivatives that trade in liquid markets, model inputs can generally be verified and model selection does not involve significant management judgment. OTC and centrally cleared derivatives are classified within Level 2 of the fair value hierarchy when significant inputs are corroborated by market evidence.
63
GOLDMAN SACHS VARIABLE INSURANCE TRUST FUNDS
Notes to Financial Statements (continued)
December 31, 2020
3. INVESTMENTS AND FAIR VALUE MEASUREMENTS (continued)
i. Forward Contracts — A forward contract is a contract between two parties to buy or sell an asset at a specified price on a future date. A forward contract settlement can occur on a cash or delivery basis. Forward contracts are marked-to-market daily using independent vendor prices, and the change in value, if any, is recorded as an unrealized gain or loss. Cash and certain investments may be used to collateralize forward contracts.
A forward foreign currency exchange contract is a forward contract in which a Fund agrees to receive or deliver a fixed quantity of one currency for another, at a pre-determined price at a future date. All forward foreign currency exchange contracts are marked to market daily by using the outright forward rates or interpolating based upon maturity dates, where available. Non-deliverable forward foreign currency exchange contracts are settled with the counterparty in cash without the delivery of foreign currency.
ii. Futures Contracts — Futures contracts are contracts to buy or sell a standardized quantity of a specified commodity or security. Upon entering into a futures contract, a Fund deposits cash or securities in an account on behalf of the broker in an amount sufficient to meet the initial margin requirement. Subsequent payments are made or received by a Fund equal to the daily change in the contract value and are recorded as variation margin receivable or payable with a corresponding offset to unrealized gains or losses.
iii. Options — When a Fund writes call or put options, an amount equal to the premium received is recorded as a liability and is subsequently marked-to-market to reflect the current value of the option written. Swaptions are options on swap contracts.
Upon the purchase of a call option or a put option by a Fund, the premium paid is recorded as an investment and subsequently marked-to-market to reflect the current value of the option. Certain options may be purchased with premiums to be determined on a future date. The premiums for these options are based upon implied volatility parameters at specified terms.
iv. Swap Contracts — Bilateral swap contracts are agreements in which a Fund and a counterparty agree to exchange periodic payments on a specified notional amount or make a net payment upon termination. Bilateral swap transactions are privately negotiated in the OTC market and payments are settled through direct payments between a Fund and the counterparty. By contrast, certain swap transactions are subject to mandatory central clearing. These swaps are executed through a derivatives clearing member (“DCM”), acting in an agency capacity, and submitted to a central counterparty (“CCP”) (“centrally cleared swaps”), in which case all payments are settled with the CCP through the DCM. Swaps are marked-to-market daily using pricing vendor quotations, counterparty or clearinghouse prices or model prices, and the change in value, if any, is recorded as an unrealized gain or loss. Upon entering into a swap contract, a Fund is required to satisfy an initial margin requirement by delivering cash or securities to the counterparty (or in some cases, segregated in a triparty account on behalf of the counterparty), which can be adjusted by any mark-to-market gains or losses pursuant to bilateral or centrally cleared arrangements. For centrally cleared swaps the daily change in valuation, if any, is recorded as a receivable or payable for variation margin.
An interest rate swap is an agreement that obligates two parties to exchange a series of cash flows at specified intervals, based upon or calculated by reference to changes in interest rates on a specified notional principal amount. The payment flows are usually netted against each other, with the difference being paid by one party to the other.
A credit default swap is an agreement that involves one party (the buyer of protection) making a stream of payments to another party (the seller of protection) in exchange for the right to receive protection on a reference security or obligation, including a group of assets or exposure to the performance of an index. A Fund’s investment in credit default swaps may involve greater risks than if the Fund had invested in the referenced obligation directly. Credit events are contract specific but may include bankruptcy, failure to pay, restructuring and obligation acceleration. If a Fund buys protection through a credit default swap and no credit event occurs, its payments are limited to the periodic payments previously made to the counterparty. Upon the occurrence of a specified credit event, a Fund, as a buyer of credit protection, is entitled to receive an amount equal to the notional amount of the swap and deliver to the seller the defaulted reference obligation in a physically settled trade. A Fund may also receive a net settlement amount in the form of cash or securities equal to the notional amount of the swap reduced by the recovery value of the reference obligation in a cash settled trade.
64
GOLDMAN SACHS VARIABLE INSURANCE TRUST FUNDS
3. INVESTMENTS AND FAIR VALUE MEASUREMENTS (continued)
As a seller of protection, a Fund generally receives a payment stream throughout the term of the swap, provided that there is no credit event. In addition, if a Fund sells protection through a credit default swap, a Fund could suffer a loss because the value of the referenced obligation and the premium payments received may be less than the notional amount of the swap paid to the buyer of protection. Upon the occurrence of a specified credit event, a Fund, as a seller of credit protection, may be required to take possession of the defaulted reference obligation and pay the buyer an amount equal to the notional amount of the swap in a physically settled trade. A Fund may also pay a net settlement amount in the form of cash or securities equal to the notional amount of the swap reduced by the recovery value of the reference obligation in a cash settled trade. Recovery values are at times established through the credit event auction process in which market participants are ensured that a transparent price has been set for the defaulted security or obligation. In addition, a Fund is entitled to a return of any assets, which have been pledged as collateral to the counterparty upon settlement.
The maximum potential amount of future payments (undiscounted) that a Fund as seller of protection could be required to make under a credit default swap would be an amount equal to the notional amount of the agreement. These potential amounts would be partially offset by any recovery values of the respective referenced obligations or net amounts received from a settlement of a credit default swap for the same reference security or obligation where a Fund bought credit protection.
B. Level 3 Fair Value Investments — To the extent that significant inputs to valuation models and other alternative pricing sources are unobservable, or if quotations are not readily available, or if GSAM believes that such quotations do not accurately reflect fair value, the fair value of a Fund’s investments may be determined under Valuation Procedures approved by the Trustees. GSAM, consistent with its procedures and applicable regulatory guidance, may make an adjustment to the most recent valuation prices of either domestic or foreign securities in light of significant events to reflect what it believes to be the fair value of the securities at the time of determining a Fund’s NAV. To the extent investments are valued using single source broker quotations obtained directly from the broker or passed through from third party pricing vendors, such investments are classified as Level 3 investments.
C. Fair Value Hierarchy — The following is a summary of the Funds’ investments and derivatives classified in the fair value hierarchy as of December 31, 2020:
| | | | | | | | | | | | |
| | | |
| CORE FIXED INCOME | | | | | | | | | |
| Investment Type | | Level 1 | | | Level 2 | | | Level 3 | |
| | | |
| Assets | | | | | | | | | | | | |
| Fixed Income | | | | | | | | | | | | |
Corporate Bonds | | $ | — | | | $ | 28,923,236 | | | $ | — | |
Mortgage-Backed Securities | | | — | | | | 23,099,341 | | | | — | |
Collateralized Mortgage Obligations | | | — | | | | 627,339 | | | | — | |
Commercial Mortgage-Backed Securities | | | — | | | | 277,057 | | | | — | |
U.S. Treasury Obligations and/or Other U.S. Government Agencies | | | 8,187,516 | | | | — | | | | — | |
Asset-Backed Securities | | | — | | | | 3,778,106 | | | | — | |
Foreign Government Securities | | | — | | | | 1,364,181 | | | | — | |
Municipal Bonds | | | — | | | | 775,412 | | | | — | |
U.S. Government Agency Securities | | | — | | | | 3,363,854 | | | | — | |
| Investment Company | | | 11,891,553 | | | | — | | | | — | |
| | | |
| Total | | $ | 20,079,069 | | | $ | 62,208,526 | | | $ | — | |
65
GOLDMAN SACHS VARIABLE INSURANCE TRUST FUNDS
Notes to Financial Statements (continued)
December 31, 2020
3. INVESTMENTS AND FAIR VALUE MEASUREMENTS (continued)
| | | | | | | | | | | | |
| | | |
| CORE FIXED INCOME (continued) | | | | | | | | | |
| Derivative Type | | Level 1 | | | Level 2 | | | Level 3 | |
| | | |
| Assets | | | | | | | | | | | | |
| Forward Foreign Currency Exchange Contracts(a) | | $ | — | | | $ | 70,286 | | | $ | — | |
| Futures Contracts(a) | | | 19,324 | | | | — | | | | — | |
| Credit Default Swap Contracts(a) | | | — | | | | 73,186 | | | | — | |
| Interest Rate Swap Contracts(a) | | | — | | | | 30,168 | | | | — | |
| Purchased Options Contracts | | | — | | | | 960 | | | | — | |
| | | |
| Total | | $ | 19,324 | | | $ | 174,600 | | | $ | — | |
| | | |
| Liabilities | | | | | | | | | | | | |
| Forward Foreign Currency Exchange Contracts(a) | | $ | — | | | $ | (107,606 | ) | | $ | — | |
| Futures Contracts(a) | | | (109,423 | ) | | | — | | | | — | |
| Interest Rate Swap Contracts(a) | | | — | | | | (25,952 | ) | | | — | |
| Written Options Contracts | | | — | | | | (10,173 | ) | | | — | |
| | | |
| Total | | $ | (109,423 | ) | | $ | (143,731 | ) | | $ | — | |
| | | |
| EQUITY INDEX | | | | | | | | | |
| Investment Type | | Level 1 | | | Level 2 | | | Level 3 | |
| | | |
| Assets | | | | | | | | | | | | |
| Common Stock and/or Other Equity Investments(b) | | | | | | | | | | | | |
Europe | | $ | 828,393 | | | $ | — | | | $ | — | |
North America | | | 183,394,530 | | | | — | | | | — | |
| Securities Lending Reinvestment Vehicle | | | 107,700 | | | | — | | | | — | |
| | | |
| Total | | $ | 184,330,623 | | | $ | — | | | $ | — | |
| | | |
| Derivative Type | | | | | | | | | |
| | | |
| Assets(a) | | | | | | | | | | | | |
| Futures Contracts | | $ | 41,949 | | | $ | — | | | $ | — | |
| | | |
| GROWTH OPPORTUNITIES | | | | | | | | | |
| Investment Type | | Level 1 | | | Level 2 | | | Level 3 | |
| | | |
| Assets | | | | | | | | | | | | |
| Common Stock and/or Other Equity Investments(b) | | | | | | | | | | | | |
Europe | | $ | 1,407,909 | | | $ | — | | | $ | — | |
North America | | | 79,551,527 | | | | — | | | | — | |
South America | | | 747,148 | | | | — | | | | — | |
| Investment Company | | | 739,866 | | | | — | | | | — | |
| Securities Lending Reinvestment Vehicle | | | 1,380,662 | | | | — | | | | — | |
| | | |
| Total | | $ | 83,827,112 | | | $ | — | | | $ | — | |
| (a) | Amount shown represents unrealized gain (loss) at fiscal year end. |
| (b) | Amounts are disclosed by continent to highlight the impact of time zone differences between local market close and the calculation of NAV. Security valuations are based on the principal exchange or system on which they are traded, which may differ from country of domicile. |
66
GOLDMAN SACHS VARIABLE INSURANCE TRUST FUNDS
3. INVESTMENTS AND FAIR VALUE MEASUREMENTS (continued)
| | | | | | | | | | | | |
| | | |
| HIGH QUALITY FLOATING RATE | | | | | | | | | |
| Investment Type | | Level 1 | | | Level 2 | | | Level 3 | |
| | | |
| Assets | | | | | | | | | | | | |
| Fixed Income | | | | | | | | | | | | |
U.S. Treasury Obligations and/or Other U.S. Government Agencies | | $ | 23,342,777 | | | $ | — | | | $ | — | |
Mortgage-Backed Securities | | | — | | | | 1,383,779 | | | | — | |
Collateralized Mortgage Obligations | | | — | | | | 16,764,970 | | | | — | |
Asset-Backed Securities | | | — | | | | 18,676,385 | | | | — | |
Municipal Bond | | | — | | | | 94,524 | | | | — | |
Supranational | | | — | | | | 1,532,864 | | | | — | |
U.S. Government Agency Security | | | — | | | | 1,501,516 | | | | — | |
| Investment Company | | | 10,161,321 | | | | — | | | | — | |
| | | |
| Total | | $ | 33,504,098 | | | $ | 39,954,038 | | | $ | — | |
| | | |
| Derivative Type | | | | | | | | | |
| | | |
| Assets(a) | | | | | | | | | | | | |
| Futures Contracts | | $ | 20,022 | | | $ | — | | | $ | — | |
| | | |
| Liabilities(a) | | | | | | | | | | | | |
| Futures Contracts | | $ | (6,697 | ) | | $ | — | | | $ | — | |
| Interest Rate Swap Contract | | | — | | | | (2,590 | ) | | | — | |
| | | |
| Total | | $ | (6,697 | ) | | $ | (2,590 | ) | | $ | — | |
| (a) | Amount shown represents unrealized gain (loss) at fiscal year end. |
For further information regarding security characteristics, see the Schedules of Investments.
4. INVESTMENTS IN DERIVATIVES
The following tables set forth, by certain risk types, the gross value of derivative contracts (not considered to be hedging instruments for accounting disclosure purposes) as of December 31, 2020. These instruments were used as part of the Funds’ investment strategies and to obtain and/or manage exposure related to the risks below. The values in the tables below exclude the effects of cash collateral received or posted pursuant to these derivative contracts, and therefore are not representative of the Funds’ net exposure.
67
GOLDMAN SACHS VARIABLE INSURANCE TRUST FUNDS
Notes to Financial Statements (continued)
December 31, 2020
4. INVESTMENTS IN DERIVATIVES (continued)
Core Fixed Income
| | | | | | | | | | | | | | |
| Risk | | | | Statements of Assets and Liabilities | | Assets | | | Statements of Assets and Liabilities | | Liabilities | |
| Interest Rate | | | | Purchased options at value, Variation margin on futures and swaps
contracts | | $ | 50,452 | (a) | | Written options at value, variation margin on futures and swaps contracts | | $ | (145,548) | (a) |
| Credit | | | | Receivable for unrealized gain on swap contracts and variation margin on swap contracts | | | 73,186 | (a) | | — | | | — | |
| Currency | | | | Receivables for unrealized gain on forward foreign currency exchange contracts | | | 70,286 | | | Payable for unrealized loss on forward foreign currency exchange contracts | | | (107,606) | |
| | | | | |
| Total | | | | | | $ | 193,924 | | | | | $ | (253,154) | |
| (a) | Includes unrealized gain (loss) on futures contracts and centrally cleared swap contracts described in the Additional Investment Information sections of the Schedules of Investments. Only the variation margin as of December 31, 2020 is reported within the Statements of Assets and Liabilities. |
| | | | | | | | | | | | | | |
| | | | | | | | | | | | | | |
| Fund | | Risk | | Statements of Assets and Liabilities | | Assets(a) | | | Statements of Assets and Liabilities | | Liabilities(a) | |
| Equity Index | | Equity | | Variation margin on futures contracts | | $ | 41,949 | | | — | | $ | — | |
| | | | | |
| High Quality Floating Rate | | Interest Rate | | Variation margin on futures contracts | | | 20,022 | | | Variation margin on futures contracts and swap contracts | | | (9,287 | ) |
| (a) | Includes unrealized gain (loss) on futures contracts and centrally cleared swap contracts described in the Additional Investment Information sections of the Schedules of Investments. Only the variation margin as of December 31, 2020 is reported within the Statements of Assets and Liabilities. |
The following tables set forth, by certain risk types, the Funds’ gains (losses) related to these derivatives and their indicative volumes for the fiscal year ended December 31, 2020. These gains (losses) should be considered in the context that these derivative contracts may have been executed to create investment opportunities and/or economically hedge certain investments, and accordingly, certain gains (losses) on such derivative contracts may offset certain (losses) gains attributable to investments. These gains (losses) are included in “Net realized gain (loss)” or “Net change in unrealized gain (loss)” on the Statements of Operations:
Core Fixed Income
| | | | | | | | | | | | | | |
| Risk | | Statements of Operations | | Net Realized
Gain (Loss) | | | Net Change in
Unrealized
Gain (Loss) | | | Average
Number of
Contracts(a) | |
| Interest Rate | | Net realized gain (loss) from futures contracts, purchased options, written options and swap contracts/Net change in unrealized gain (loss) on futures contracts, purchased option, written options and swap contracts | | $ | 1,094,284 | | | $ | 78,951 | | | | 142 | |
| Credit | | Net realized gain (loss) from swap contracts/Net change in unrealized gain (loss) on swap contracts | | | (94,446 | ) | | | 25,949 | | | | 14 | |
| Currency | | Net realized gain (loss) from forward foreign currency exchange contracts/Net change in unrealized gain (loss) on forward foreign currency exchange contracts | | | (50,901 | ) | | | 1,419 | | | | 95 | |
| | | | |
| Total | | | | $ | 948,937 | | | $ | 106,319 | | | | 251 | |
| (a) | Average number of contracts is based on the average of month end balances for the fiscal year ended December 31, 2020. |
68
GOLDMAN SACHS VARIABLE INSURANCE TRUST FUNDS
4. INVESTMENTS IN DERIVATIVES (continued)
Equity Index
| | | | | | | | | | | | | | |
| Risk | | Statements of Operations | | Net
Realized
Gain (Loss) | | | Net Change in
Unrealized
Gain (Loss) | | | Average
Number of
Contracts(a) | |
| | | | |
| Equity | | Net realized gain (loss) from futures contracts/Net change in unrealized gain (loss) on futures contracts | | $ | 269,217 | | | $ | 20,777 | | | | 9 | |
High Quality Floating Rate
| | | | | | | | | | | | | | |
| Risk | | Statements of Operations | | Net
Realized
Gain (Loss) | | | Net Change in
Unrealized
Gain (Loss) | | | Average
Number of
Contracts(a) | |
| | | | |
| Interest Rate | | Net realized gain (loss) from futures contracts and swap contracts/Net change in unrealized gain (loss) on futures contracts and swap contracts | | $ | (293,406 | ) | | $ | (39,579 | ) | | | 54 | |
| (a) | Average number of contracts is based on the average of month end balances for the fiscal year ended December 31, 2020. |
5. AGREEMENTS AND AFFILIATED TRANSACTIONS
A. Management Agreements — Under the Agreements, GSAM manages the Funds, subject to the general supervision of the Trustees.
As compensation for the services rendered pursuant to the Agreements, the assumption of the expenses related thereto and administration of the Funds’ business affairs, including providing facilities, GSAM is entitled to a management fee, accrued daily and paid monthly, equal to an annual percentage rate of each Fund’s average daily net assets.
For the fiscal year ended December 31, 2020, contractual and effective net management fees with GSAM were at the following rates:
| | | | | | | | | | | | | | | | | | | | | | | | | | | | |
| | | Contractual Management Rate | | | | | | Effective Net
Management
Rate^ | |
| Fund | | First
$1 billion | | | Next
$1 billion | | | Next
$3 billion | | | Next
$3 billion | | | Over
$8 billion | | | Effective
Rate | |
| Core Fixed Income | | | 0.40 | % | | | 0.36 | % | | | 0.34 | % | | | 0.33 | % | | | 0.32 | % | | | 0.40 | % | | | 0.39 | % |
| Growth Opportunities | | | 0.87 | | | | 0.87 | | | | 0.78 | | | | 0.74 | | | | 0.73 | | | | 0.87 | | | | 0.83 | * |
| High Quality Floating Rate | | | 0.31 | | | | 0.28 | | | | 0.27 | | | | 0.26 | | | | 0.25 | | | | 0.31 | | | | 0.29 | |
| ^ | Effective Net Management Rate includes the impact of management fee waivers of affiliated Underlying Funds, if any. The Effective Net Management Rate may not correlate to the Contractual Management Rate as a result of management fee waivers that may be in effect from time to time. |
| * | GSAM agreed to waive a portion of its management fee in order to achieve an effective net management rate of 0.83% as an annual percentage rate of the Fund’s average daily net assets. This waiver will remain in effect through at least April 29, 2021, and prior to such date GSAM may not terminate the arrangement without approval of the Trustees. |
The Core Fixed Income, Growth Opportunities and High Quality Floating Rate Funds invest in Institutional Shares of the Goldman Sachs Financial Square Government Fund, which is an affiliated Underlying Fund. GSAM has agreed to waive a portion of its management fee payable by the Funds in an amount equal to the management fee it earns as an investment adviser to the affiliated Underlying Fund in which the Funds invest, except those management fees it earns from the Growth Opportunities Fund’s investments of cash collateral received in connection with securities lending transactions in the Goldman Sachs Financial Square Government Fund. For the fiscal year ended December 31, 2020, GSAM waived $8,601, $1,466 and $11,451 of the Core Fixed Income, Growth Opportunities and High Quality Floating Rate Funds’ management fees, respectively.
The Agreement for the Equity Index Fund provides for a contractual management fee at an annual rate equal to 0.30 % of the Fund’s average daily net assets. For the fiscal year ended December 31, 2020, GSAM agreed to waive a portion of its management
69
GOLDMAN SACHS VARIABLE INSURANCE TRUST FUNDS
Notes to Financial Statements (continued)
December 31, 2020
5. AGREEMENTS AND AFFILIATED TRANSACTIONS (continued)
fee in order to achieve the following effective annual rates which will remain in effect through at least April 29, 2021 and prior to such date GSAM may not terminate the arrangement without the approval of the Trustees:
| | | | | | |
| Net Management Rate |
| Fund | | $0-$400 million | | Over $400 million | | Effective Rate |
| Equity Index | | 0.21% | | 0.20% | | 0.21% |
As authorized by the Agreement for the Equity Index Fund, GSAM has entered into a Sub-advisory Agreement with SSgA Funds Management, Inc. (“SSgA”) which serves as the sub-adviser to the Fund and provides the day-to-day advice regarding the Fund’s portfolio transactions. As compensation for its services, SSgA is entitled to a fee, accrued daily and paid monthly by GSAM, at the following annual rates of the Fund’s average daily net assets: 0.03% on the first $50 million, 0.02% on the next $200 million, 0.01% on the next $750 million and 0.008% over $1 billion. The effective Sub-advisory fee was 0.02% for the fiscal year ended December 31, 2020.
B. Distribution and/or Service (12b-1) Plans — The Trust, on behalf of Service Shares of the Funds, has adopted a Distribution and Service Plan subject to Rule 12b-1 under the Act. Under the Distribution and Service Plan, Goldman Sachs, which serves as distributor (the “Distributor”), is entitled to a fee accrued daily and paid monthly, for distribution services and personal and account maintenance services, which may then be paid by Goldman Sachs to authorized dealers, equal to, on an annual basis, 0.25% of the Fund’s average daily net assets attributable to Service Shares. For the fiscal year ended December 31, 2020 for the Growth Opportunities Fund, Goldman Sachs agreed to waive distribution and services fees so as not to exceed an annual rate of 0.16% of average daily net assets of the Fund. This distribution and service fee waiver will remain in place through at least April 29, 2021, and prior to such date Goldman Sachs may not terminate the arrangement without the approval of the Trustees.
The Trust, on behalf of Advisor Shares of the High Quality Floating Rate Fund, has adopted a Distribution Plan subject to Rule 12b-1 under the Act. Under the Distribution Plan, Goldman Sachs as Distributor is entitled to a fee accrued daily and paid monthly for distribution services, which may then be paid by Goldman Sachs to authorized dealers, equal to, on an annual basis, 0.15% of the Fund’s average daily net assets attributable to Advisor Shares.
C. Service Plan — The Trust, on behalf of Advisor Shares of the High Quality Floating Rate Fund, has adopted a Service Plan to allow Advisor Shares to compensate service organizations (including Goldman Sachs) for providing varying levels of personal and account maintenance and administration services to their customers who are beneficial owners of such shares. The Service Plan provides for compensation to the service organizations equal to 0.25% of the average daily net assets attributable to Advisor Shares of the Fund.
D. Transfer Agency Agreement — Goldman Sachs also serves as the transfer agent of the Funds for a fee pursuant to the Transfer Agency Agreement. The fees charged for such transfer agency services are accrued daily and paid monthly at an annual rate of 0.02% of the average daily net assets of Institutional, Service and Advisor Shares.
E. Other Expense Agreements and Affiliated Transactions — GSAM has agreed to reduce or limit certain “Other Expenses” of the Funds (excluding acquired fund fees and expenses, transfer agency fees and expenses, service fees and shareholder administration fees (as applicable), taxes, interest, brokerage fees, expenses of shareholder meetings, litigation and indemnification, and extraordinary expenses) to the extent such expenses exceed, on an annual basis, a percentage rate of the average daily net assets of each Fund. Such Other Expense reimbursements, if any, are accrued daily and paid monthly. In addition, the Funds are not obligated to reimburse GSAM for prior fiscal year expense reimbursements, if any. The Other Expense limitations as an annual percentage rate of average daily net assets for the Core Fixed Income, Equity Index, Growth Opportunities and High Quality Floating Rate Funds are 0.004%, 0.004%, 0.004% and 0.034%, respectively. These Other Expense limitations will remain in place through at least April 29, 2021, and prior to such date GSAM may not terminate the arrangements without the approval of the Trustees. In addition, the Funds have entered into certain offset arrangements with the custodian and the transfer agent, which may result in a reduction of the Funds’ expenses and are received irrespective of the application of the “Other Expense” limitations described above.
70
GOLDMAN SACHS VARIABLE INSURANCE TRUST FUNDS
5. AGREEMENTS AND AFFILIATED TRANSACTIONS (continued)
For the fiscal year ended December 31, 2020, these expense reductions, including any fee waivers and Other Expense reimbursements, were as follows:
| | | | | | | | | | | | | | | | | | | | |
| Fund | | Management
Fee Waiver | | | Distribution
and Service
Fee Waiver | | | Custody Fee
Credits | | | Other Expense
Reimbursement | | | Total Expense
Reductions | |
| Core Fixed Income | | $ | 8,601 | | | $ | — | | | $ | 2,123 | | | $ | 315,395 | | | $ | 326,119 | |
| Equity Index | | | 150,928 | | | | — | | | | 1,840 | | | | 315,684 | | | | 468,452 | |
| Growth Opportunities | | | 29,916 | | | | 63,912 | | | | 98 | | | | 241,817 | | | | 335,743 | |
| High Quality Floating Rate | | | 11,451 | | | | — | | | | 3,104 | | | | 254,200 | | | | 268,755 | |
F. Line of Credit Facility — As of December 31, 2020, the Funds participated in a $700,000,000 committed, unsecured revolving line of credit facility (the “facility”) together with other funds of the Trust and certain registered investment companies having management agreements with GSAM or its affiliates. This facility is to be used for temporary emergency purposes, or to allow for an orderly liquidation of securities to meet redemption requests. The interest rate on borrowings is based on the federal funds rate. The facility also requires a fee to be paid by the Funds based on the amount of the commitment that has not been utilized. For the fiscal year ended December 31, 2020, the Funds did not have any borrowings under the facility. Prior to April 28, 2020, the facility was $580,000,000.
G. Other Transactions with Affiliates — For the fiscal year ended December 31, 2020, Goldman Sachs earned $557 in brokerage commissions from portfolio transactions, including futures transactions executed with Goldman Sachs as the Futures Commission Merchant, on behalf of the Growth Opportunities Fund.
The following table provides information about the investment in shares of issuers of which a Fund is an affiliate as of and for the fiscal year ended December 31, 2020:
| | | | | | | | | | | | | | | | | | | | | | | | | | | | | | | | | | | | |
| Fund | | | Name of Affiliated Issuer | | Beginning
Value as of
December 31,
2019 | | | Purchases
at Cost | | | Proceeds
from Sales | | | Net
Realized
Gain
(Loss) | | | Change in
Unrealized
Appreciation
(Depreciation) | | | Ending
Value as of
December 31,
2020 | | | Shares as of
December 31,
2020 | | | Dividend
Income from
Affiliated
Issuer | |
| | | | | | | | | |
| | Equity Index | | | Goldman Sachs Group, Inc. (The) | | $ | 492,970 | | | $ | 38,388 | | | $ | (70,615 | ) | | $ | 23,619 | | | $ | 43,322 | | | $ | 527,684 | | | | 2,001 | | | $ | 10,026 | |
The following table provides information about the Funds’ investment in the Goldman Sachs Financial Square Government Fund as of and for the fiscal year ended December 31, 2020:
| | | | | | | | | | | | | | | | | | | | | | | | |
| Fund | | Beginning
Value as of
December 31,
2019 | | | Purchases
at Cost | | | Proceeds
from Sales | | | Ending
Value as of
December 31,
2020 | | | Shares as of
December 31,
2020 | | | Dividend
Income
from Affiliated
Investment
Company | |
| Core Fixed Income | | $ | 1,647,077 | | | $ | 47,578,099 | | | $ | (37,333,623 | ) | | $ | 11,891,553 | | | | 11,891,553 | | | $ | 9,369 | |
| Growth Opportunities | | | 998,484 | | | | 27,153,749 | | | | (27,412,367 | ) | | | 739,866 | | | | 739,866 | | | | 5,655 | |
| High Quality Floating Rate | | | 3,128,385 | | | | 44,359,017 | | | | (37,326,081 | ) | | | 10,161,321 | | | | 10,161,321 | | | | 27,310 | |
As of December 31, 2020, The Goldman Sachs Group, Inc. was the beneficial owner of approximately 50% of the Institutional Shares of the Growth Opportunities Fund.
71
GOLDMAN SACHS VARIABLE INSURANCE TRUST FUNDS
Notes to Financial Statements (continued)
December 31, 2020
6. PORTFOLIO SECURITIES TRANSACTIONS
The cost of purchases and proceeds from sales and maturities of long-term securities for the fiscal year ended December 31, 2020, were as follows:
| | | | | | | | | | | | | | | | | | | | |
| Fund | | | | | Purchases of U.S.
Government and
Agency Obligations | | | Purchases
(Excluding U.S.
Government and
Agency Obligations) | | | Sales and
Maturities of U.S.
Government and
Agency Obligations | | | Sales and
Maturities
(Excluding U.S.
Government and
Agency Obligations) | |
| Core Fixed Income | | | | | | $ | 433,940,857 | | | $ | 21,115,425 | | | $ | 417,746,883 | | | $ | 12,417,774 | |
| Equity Index | | | | | | | — | | | | 5,928,572 | | | | — | | | | 25,377,332 | |
| Growth Opportunities | | | | | | | — | | | | 50,245,797 | | | | — | | | | 67,039,042 | |
| High Quality Floating Rate | | | | | | | 17,272,962 | | | | 6,124,045 | | | | 18,173,140 | | | | 18,270,174 | |
7. SECURITIES LENDING
The Growth Opportunities Fund may lend its securities through a securities lending agent, the Bank of New York Mellon (“BNYM”), to certain qualified borrowers. Pursuant to exemptive relief granted by the Securities and Exchange Commission (“SEC”) and the terms and conditions contained therein, the Equity Index Fund may lend its securities through a securities lending agent, Goldman Sachs Agency Lending (“GSAL”), a wholly-owned subsidiary of Goldman Sachs, to certain qualified borrowers including Goldman Sachs and affiliates. In accordance with the Funds’ securities lending procedures, the Funds receive cash collateral at least equal to the market value of the securities on loan. The market value of the loaned securities is determined at the close of business of the Funds, at their last sale price or official closing price on the principal exchange or system on which they are traded, and any additional required collateral is delivered to the Funds on the next business day. As with other extensions of credit, the Funds may experience delay in the recovery of their securities or incur a loss should the borrower of the securities breach its agreement with the Funds or become insolvent at a time when the collateral is insufficient to cover the cost of repurchasing securities on loan. Dividend income received from securities on loan may not be subject to withholding taxes and therefore withholding taxes paid may differ from the amounts listed in the Statements of Operations. Loans of securities are terminable at any time and as such 1) the remaining contractual maturities of the outstanding securities lending transactions are considered to be overnight and continuous and 2) the borrower, after notice, is required to return borrowed securities within the standard time period for settlement of securities transactions.
The Equity Index and Growth Opportunities Funds invest the cash collateral received in connection with securities lending transactions in the Goldman Sachs Financial Square Government Fund (“Government Money Market Fund”), an affiliated series of the Goldman Sachs Trust. The Government Money Market Fund is registered under the Act as an open end investment company, is subject to Rule 2a-7 under the Act, and is managed by GSAM, for which GSAM may receive a management fee of up to 0.16% on an annualized basis of the average daily net assets of the Government Money Market Fund.
In the event of a default by a borrower with respect to any loan, GSAL will and BNYM may exercise any and all remedies provided under the applicable borrower agreement to make the Funds whole. These remedies include purchasing replacement securities by applying the collateral held from the defaulting broker against the purchase cost of the replacement securities. If GSAL or BNYM are unable to purchase replacement securities, GSAL and/or BNYM will indemnify the Funds by paying the Funds an amount equal to the market value of the securities loaned minus the value of cash collateral received from the borrower for the loan, subject to an exclusion for any shortfalls resulting from a loss of value in such cash collateral due to reinvestment risk. The Funds’ master netting agreements with certain borrowers provide the right, in the event of a default (including bankruptcy or insolvency), for the non-defaulting party to liquidate the collateral and calculate net exposure to the defaulting party or request additional collateral. However, in the event of a default by a borrower, a resolution authority could determine that such rights are not enforceable due to the restrictions or prohibitions against the right of set-off that may be imposed in accordance with a
72
GOLDMAN SACHS VARIABLE INSURANCE TRUST FUNDS
7. SECURITIES LENDING (continued)
particular jurisdiction’s bankruptcy or insolvency laws. The Funds’ loaned securities were all subject to enforceable Securities Lending Agreements and the value of the collateral was at least equal to the value of the cash received. The amounts of the Funds’ overnight and continuous agreements, which represent the gross amounts of recognized liabilities for securities lending transactions outstanding as of December 31, 2020, are disclosed as “Payable upon return of securities loaned” on the Statements of Assets and Liabilities, where applicable.
Each of the Equity Index and Growth Opportunities Funds and GSAL and BNYM received compensation relating to the lending of the Funds’ securities. The amounts earned, if any, by the Funds’ for the fiscal year ended December 31, 2020, are reported under Investment Income on the Statements of Operations.
The table below details securities lending activity with affiliates of Goldman Sachs:
| | | | | | | | | | | | |
| | | For the Fiscal Year ended December 31, 2020 | | | | |
| Fund | | Earnings of GSAL Relating
to Securities Loaned | | | Amount Received by
the Fund from Lending
to Goldman Sachs | | | Amount payable to
Goldman Sachs Upon
Return of Securities Loaned
as of December 31, 2020 | |
| Equity Index | | $ | 150 | | | $ | 508 | | | $ | 68,100 | |
The following table provides information about the Fund’s investment in the Government Money Market Fund for the fiscal year ended December 31, 2020:
| | | | | | | | | | | | | | | | | | |
| Fund | | | | Beginning
Value as of
December 31, 2019 | | | Purchases
at Cost | | | Proceeds
from Sales | | | Ending
Value as of
December 31, 2020 | |
| Equity Index | | | | $ | — | | | $ | 1,146,660 | | | $ | (1,038,960 | ) | | $ | 107,700 | |
| Growth Opportunities | | | | | 809,324 | | | | 7,816,381 | | | | (7,245,043 | ) | | | 1,380,662 | |
8. TAX INFORMATION
The tax character of distributions paid during the fiscal year ended December 31, 2020 was as follows:
| | | | | | | | | | | | | | | | |
| | | Core Fixed Income | | | Equity Index | | | Growth Opportunities | | | High Quality Floating Rate | |
| Distributions paid from: | | | | | | | | | | | | | | | | |
Ordinary income | | $ | 1,908,966 | | | $ | 2,165,597 | | | $ | 2,063,191 | | | $ | 509,058 | |
Net long-term capital gains | | | — | | | | 12,311,282 | | | | 11,674,825 | | | | — | |
| Total taxable distributions | | $ | 1,908,966 | | | $ | 14,476,879 | | | $ | 13,738,016 | | | $ | 509,058 | |
The tax character of distributions paid during the fiscal year ended December 31, 2019 was as follows:
| | | | | | | | | | | | | | | | |
| | | Core Fixed Income | | | Equity Index | | | Growth Opportunities | | | High Quality Floating Rate | |
| Distributions paid from: | | | | | | | | | | | | | | | | |
Ordinary income | | $ | 1,135,215 | | | $ | 2,490,452 | | | $ | 1,337,526 | | | $ | 1,703,004 | |
Net long-term capital gains | | | — | | | | 10,537,849 | | | | 12,740,950 | | | | — | |
| Total taxable distributions | | $ | 1,135,215 | | | $ | 13,028,301 | | | $ | 14,078,476 | | | $ | 1,703,004 | |
73
GOLDMAN SACHS VARIABLE INSURANCE TRUST FUNDS
Notes to Financial Statements (continued)
December 31, 2020
8. TAX INFORMATION (continued)
As of December 31, 2020, the components of accumulated earnings (losses) on a tax-basis were as follows:
| | | | | | | | | | | | | | | | |
| | | Core Fixed Income | | | Equity Index | | | Growth Opportunities | | | High Quality Floating Rate | |
| Undistributed ordinary income — net | | $ | 260,113 | | | $ | 440,601 | | | $ | 1,291,990 | | | $ | 56,359 | |
| Undistributed long-term capital gains | | | — | | | | 3,320,470 | | | | 1,585,783 | | | | — | |
| Total undistributed earnings | | $ | 260,113 | | | $ | 3,761,071 | | | $ | 2,877,773 | | | $ | 56,359 | |
| Capital loss carryforwards(1): | | | | | | | | | | | | | | | | |
Perpetual short-term | | $ | — | | | $ | — | | | $ | — | | | $ | (305,245 | ) |
Perpetual long-term | | | — | | | | — | | | | — | | | | (1,242,514 | ) |
| Total capital loss carryforwards | | $ | — | | | $ | — | | | $ | — | | | $ | (1,547,759 | ) |
| Timing differences (Real Estate Investment Trusts, late year ordinary loss deferral, post October loss deferral, and straddle loss deferrals) | | $ | (148,317 | ) | | $ | 4,735 | | | $ | 706 | | | $ | (242,255 | ) |
| Unrealized gains — net | | | 3,340,729 | | | | 127,794,858 | | | | 27,591,746 | | | | 337,498 | |
| Total accumulated earnings (losses) — net | | $ | 3,452,525 | | | $ | 131,560,664 | | | $ | 30,470,225 | | | $ | (1,396,157 | ) |
| (1) | The Core Fixed Income Fund utilized $1,169,955 of capital losses in the current year. |
As of December 31, 2020, the Funds’ aggregate security unrealized gains and losses based on cost for U.S. federal income tax purposes were as follows:
| | | | | | | | | | | | | | | | |
| | | Core Fixed Income | | | Equity Index | | | Growth Opportunities | | | High Quality Floating Rate | |
| Tax cost | | $ | 78,901,233 | | | $ | 56,516,934 | | | $ | 56,235,366 | | | $ | 73,131,373 | |
| Gross unrealized gain | | | 3,400,905 | | | | 130,264,820 | | | | 27,749,075 | | | | 429,137 | |
| Gross unrealized loss | | | (60,176 | ) | | | (2,469,962 | ) | | | (157,329 | ) | | | (91,639 | ) |
| Net unrealized security gain | | $ | 3,340,729 | | | $ | 127,794,858 | | | $ | 27,591,746 | | | $ | 337,498 | |
The difference between GAAP-basis and tax-basis unrealized gains (losses) is attributable primarily to wash sales, net mark to market gains (losses) on regulated futures and foreign currency contracts, and differences in the tax treatment of market discount accretion and premium amortization and swap transactions.
The Equity Index Fund reclassified $57,034 from paid in capital to distributable earnings for the year ending December 31, 2020. In order to present certain components of the Fund’s capital accounts on a tax-basis, certain reclassifications have been recorded to the Fund’s accounts. These reclassifications have no impact on the net asset value of the Fund and result primarily from differences in the tax treatment of underlying fund investments.
GSAM has reviewed the Funds’ tax positions for all open tax years (the current and prior three years, as applicable) and has concluded that no provision for income tax is required in the Funds’ financial statements. Such open tax years remain subject to examination and adjustment by tax authorities.
9. OTHER RISKS
The Funds’ risks include, but are not limited to, the following:
Derivatives Risk — The Funds’ use of derivatives may result in loss. Derivative instruments, which may pose risks in addition to and greater than those associated with investing directly in securities, currencies or other instruments, may be illiquid or less liquid,
74
GOLDMAN SACHS VARIABLE INSURANCE TRUST FUNDS
9. OTHER RISKS (continued)
volatile, difficult to price and leveraged so that small changes in the value of the underlying instruments may produce disproportionate losses to the Funds. Derivatives are also subject to counterparty risk, which is the risk that the other party in the transaction will not fulfill its contractual obligation. The use of derivatives is a highly specialized activity that involves investment techniques and risks different from those associated with investments in more traditional securities and instruments. Losses from derivatives can also result from a lack of correlation between changes in the value of derivative instruments and the portfolio assets (if any) being hedged.
Floating and Variable Rate Obligations Risk — Floating rate and variable rate obligations are debt instruments issued by companies or other entities with interest rates that reset periodically (typically, daily, monthly, quarterly, or semiannually) in response to changes in the market rate of interest on which the interest rate is based. For floating and variable rate obligations, there may be a lag between an actual change in the underlying interest rate benchmark and the reset time for an interest payment of such an obligation, which could harm or benefit a Fund, depending on the interest rate environment or other circumstances. In a rising interest rate environment, for example, a floating or variable rate obligation that does not reset immediately would prevent a Fund from taking full advantage of rising interest rates in a timely manner. However, in a declining interest rate environment, a Fund may benefit from a lag due to an obligation’s interest rate payment not being immediately impacted by a decline in interest rates. In 2017, the United Kingdom’s Financial Conduct Authority (“FCA”) warned that LIBOR may cease to be available or appropriate for use by 2021. The unavailability or replacement of LIBOR may affect the value, liquidity or return on certain Fund investments and may result in costs incurred in connection with closing out positions and entering into new trades. Any pricing adjustments to a Fund’s investments resulting from a substitute reference rate may also adversely affect the Fund’s performance and/or NAV.
Interest Rate Risk — When interest rates increase, fixed income securities or instruments held by a Fund will generally decline in value. Long-term fixed income securities or instruments will normally have more price volatility because of this risk than short-term fixed income securities or instruments. The risks associated with changing interest rates may have unpredictable effects on the markets and a Fund’s investments. Fluctuations in interest rates may also affect the liquidity of fixed income securities and instruments held by the Funds.
Investments in Other Investment Companies Risk — As a shareholder of another investment company, a Fund will indirectly bear its proportionate share of any net management fees and other expenses paid by such other investment companies, in addition to the fees and expenses regularly borne by the Fund.
Large Shareholder Transactions Risk — A Fund may experience adverse effects when certain large shareholders, such as other funds, participating insurance companies, accounts and Goldman Sachs affiliates, purchase or redeem large amounts of shares of the Fund. Such large shareholder redemptions, which may occur rapidly or unexpectedly, may cause a Fund to sell portfolio securities at times when it would not otherwise do so, which may negatively impact a Fund’s NAV and liquidity. These transactions may also accelerate the realization of taxable income to shareholders if such sales of investments resulted in gains, and may also increase transaction costs. In addition, a large redemption could result in a Fund’s current expenses being allocated over a smaller asset base, leading to an increase in the Fund’s expense ratio. Similarly, large Fund share purchases may adversely affect a Fund’s performance to the extent that the Fund is delayed in investing new cash or otherwise maintains a larger cash position than it ordinarily would.
Liquidity Risk — A Fund may make investments that are illiquid or that may become less liquid in response to market developments or adverse investor perceptions. Illiquid investments may be more difficult to value. Liquidity risk may also refer to the risk that a Fund will not be able to pay redemption proceeds within the allowable time period or without significant dilution to remaining investors’ interests because of unusual market conditions, an unusually high volume of redemption requests, or other reasons. To meet redemption requests, a Fund may be forced to sell investments at an unfavorable time and/or under unfavorable conditions. If a Fund is forced to sell securities at an unfavorable time and/or under unfavorable conditions, such sales may adversely affect the Fund’s NAV and dilute remaining investors’ interests. Liquidity risk may be the result of, among other things, the reduced number and capacity of traditional market participants to make a market in fixed income securities or the lack of an
75
GOLDMAN SACHS VARIABLE INSURANCE TRUST FUNDS
Notes to Financial Statements (continued)
December 31, 2020
9. OTHER RISKS (continued)
active market. The potential for liquidity risk may be magnified by a rising interest rate environment or other circumstances where investor redemptions from fixed income mutual funds may be higher than normal, potentially causing increased supply in the market due to selling activity. Redemptions by large shareholders may have a negative impact on a Fund’s liquidity.
Market and Credit Risks — In the normal course of business, a Fund trades financial instruments and enters into financial transactions where risk of potential loss exists due to changes in the market (market risk). The value of the securities in which a Fund invests may go up or down in response to the prospects of individual companies, particular sectors or governments and/or general economic conditions throughout the world due to increasingly interconnected global economies and financial markets. Events such as war, acts of terrorism, social unrest, natural disasters, the spread of infectious illness or other public health threats could also significantly impact a Fund and its investments. Additionally, a Fund may also be exposed to credit risk in the event that an issuer or guarantor fails to perform or that an institution or entity with which the Fund has unsettled or open transactions defaults.
10. OTHER MATTERS
New Accounting Standard — In March 2020, the FASB issued Accounting Standard Update (“ASU”) No. 2020-04, “Reference Rate Reform (Topic 848): Facilitation of the Effects of Reference Rate Reform on Financial Reporting.” This ASU provides optional exceptions for applying GAAP to contract modifications, hedging relationships and other transactions affected reference rate reform if certain criteria are met. ASU 2020-04 is elective and is effective on March 12, 2020 through December 31, 2022. As of the financial reporting period, GSAM is currently evaluating the impact, if any, of applying ASU 2020-04.
Other — On October 22, 2020, Goldman Sachs announced a settlement of matters involving 1Malaysia Development Bhd. (1MDB), a Malaysian sovereign wealth fund, with the United States Department of Justice as well as criminal and civil authorities in the UK, Singapore and Hong Kong. Further information regarding the 1MDB settlement can be found at https://www.goldmansachs.com/media-relations/press-releases/current/goldman-sachs-2020-10-22.html. The 1MDB settlement will not materially adversely affect GSAM’s ability to serve as investment manager.
11. SUBSEQUENT EVENTS
Subsequent events after the Statements of Assets and Liabilities date have been evaluated, and GSAM has concluded that there is no impact requiring adjustment or disclosure in the financial statements.
76
GOLDMAN SACHS VARIABLE INSURANCE TRUST FUNDS
12. SUMMARY OF SHARE TRANSACTIONS
Share activity is as follows:
| | | | | | | | | | | | | | | | |
| | | Core Fixed Income Fund | |
| | | For the Fiscal Year Ended
December 31, 2020 | | | For the Fiscal Year Ended
December 31, 2019 | |
| | | Shares | | | Dollars | | | Shares | | | Dollars | |
| Institutional Shares | | | | | | | | | | | | | | | | |
| Shares sold | | | 789,803 | | | $ | 8,886,982 | | | | 1,350,662 | | | $ | 14,627,404 | |
| Reinvestment of distributions | | | 64,349 | | | | 731,170 | | | | 18,000 | | | | 194,059 | |
| Shares redeemed | | | (274,628 | ) | | | (3,114,896 | ) | | | (23,271 | ) | | | (251,188 | ) |
| | | | 579,524 | | | | 6,503,256 | | | | 1,345,391 | | | | 14,570,275 | |
| Service Shares | | | | | | | | | | | | | | | | |
| Shares sold | | | 930,205 | | | | 10,701,578 | | | | 146,021 | | | | 1,568,792 | |
| Reinvestment of distributions | | | 103,826 | | | | 1,177,796 | | | | 88,008 | | | | 941,156 | |
| Shares redeemed | | | (447,526 | ) | | | (5,025,886 | ) | | �� | (344,474 | ) | | | (3,665,153 | ) |
| | | | 586,505 | | | | 6,853,488 | | | | (110,445 | ) | | | (1,155,205 | ) |
| | | | |
| NET INCREASE | | | 1,166,029 | | | $ | 13,356,744 | | | | 1,234,946 | | | $ | 13,415,070 | |
| | | | | | | | | | | | | | | | |
| | | Equity Index Fund | |
| | | For the Fiscal Year Ended
December 31, 2020 | | | For the Fiscal Year Ended
December 31, 2019 | |
| | | Shares | | | Dollars | | | Shares | | | Dollars | |
| Service Shares | | | | | | | | | | | | | | | | |
| Shares sold | | | 172,523 | | | $ | 2,826,875 | | | | 139,050 | | | $ | 2,326,474 | |
| Reinvestment of distributions | | | 772,925 | | | | 14,476,879 | | | | 753,952 | | | | 13,028,301 | |
| Shares redeemed | | | (1,436,368 | ) | | | (24,448,149 | ) | | | (1,382,180 | ) | | | (23,176,553 | ) |
| | | | |
| NET DECREASE | | | (490,920 | ) | | $ | (7,144,395 | ) | | | (489,178 | ) | | $ | (7,821,778 | ) |
77
GOLDMAN SACHS VARIABLE INSURANCE TRUST FUNDS
Notes to Financial Statements (continued)
December 31, 2020
12. SUMMARY OF SHARE TRANSACTIONS (continued)
| | | | | | | | | | | | | | | | |
| | | Growth Opportunities Fund | |
| | | For the Fiscal Year Ended
December 31, 2020 | | | For the Fiscal Year Ended
December 31, 2019 | |
| | | Shares | | | Dollars | | | Shares | | | Dollars | |
| Institutional Shares | | | | | | | | | | | | | | | | |
| Shares sold | | | 935 | | | $ | 11,972 | | | | 2,251 | | | $ | 13,422 | |
| Reinvestment of distributions | | | 1,747 | | | | 23,510 | | | | 1,428 | | | | 16,254 | |
| Stock split share adjustment | | | — | | | | — | | | | (18,018 | ) | | | — | |
| | | | 2,682 | | | | 35,482 | | | | (14,339 | ) | | | 29,676 | |
| Service Shares | | | | | | | | | | | | | | | | |
| Shares sold | | | 704,687 | | | | 8,063,451 | | | | 2,525,028 | | | | 8,216,053 | |
| Reinvestment of distributions | | | 1,075,647 | | | | 13,714,506 | | | | 1,291,297 | | | | 14,062,222 | |
| Shares redeemed | | | (2,222,571 | ) | | | (25,079,859 | ) | | | (2,980,276 | ) | | | (15,016,361 | ) |
| Stock split share adjustment | | | — | | | | — | | | | (17,764,276 | ) | | | — | |
| | | | (442,237 | ) | | | (3,301,902 | ) | | | (16,928,227 | ) | | | 7,261,914 | |
| | | | |
| NET INCREASE (DECREASE) | | | (439,555 | ) | | $ | (3,266,420 | ) | | | (16,942,566 | ) | | $ | 7,291,590 | |
| | | | | | | | | | | | | | | | |
| | | High Quality Floating Rate Fund | |
| | | For the Fiscal Year Ended
December 31, 2020 | | | For the Fiscal Year Ended
December 31, 2019 | |
| | | Shares | | | Dollars | | | Shares | | | Dollars | |
| Institutional Shares | | | | | | | | | | | | | | | | |
| Shares sold | | | 34,504 | | | $ | 355,000 | | | | 260,218 | | | $ | 2,698,458 | |
| Reinvestment of distributions | | | 4,100 | | | | 41,958 | | | | 7,359 | | | | 76,241 | |
| Shares redeemed | | | (15,562 | ) | | | (160,926 | ) | | | (21,509 | ) | | | (223,698 | ) |
| | | | 23,042 | | | | 236,032 | | | | 246,068 | | | | 2,551,001 | |
| Service Shares | | | | | | | | | | | | | | | | |
| Shares sold | | | 1,000,714 | | | | 10,317,983 | | | | 528,956 | | | | 5,487,026 | |
| Reinvestment of distributions | | | 42,991 | | | | 438,573 | | | | 144,657 | | | | 1,495,755 | |
| Shares redeemed | | | (1,434,565 | ) | | | (14,740,743 | ) | | | (940,217 | ) | | | (9,752,642 | ) |
| | | | (390,860 | ) | | | (3,984,187 | ) | | | (266,604 | ) | | | (2,769,861 | ) |
| Advisor Shares | | | | | | | | | | | | | | | | |
| Shares sold | | | 154,731 | | | | 1,599,106 | | | | 233,654 | | | | 2,427,649 | |
| Reinvestment of distributions | | | 2,796 | | | | 28,527 | | | | 12,653 | | | | 131,008 | |
| Shares redeemed | | | (423,220 | ) | | | (4,353,323 | ) | | | (315,266 | ) | | | (3,274,558 | ) |
| | | | (265,693 | ) | | | (2,725,690 | ) | | | (68,959 | ) | | | (715,901 | ) |
| | | | |
| NET DECREASE | | | (633,511 | ) | | $ | (6,473,845 | ) | | | (89,495 | ) | | $ | (934,761 | ) |
78
Report of Independent Registered Public Accounting Firm
To the Board of Trustees of Goldman Sachs Variable Insurance Trust and Shareholders of Goldman Sachs Core Fixed Income Fund, Goldman Sachs Equity Index Fund, Goldman Sachs Growth Opportunities Fund and Goldman Sachs High Quality Floating Rate Fund
Opinions on the Financial Statements
We have audited the accompanying statements of assets and liabilities, including the schedules of investments, of Goldman Sachs Core Fixed Income Fund, Goldman Sachs Equity Index Fund, Goldman Sachs Growth Opportunities Fund and Goldman Sachs High Quality Floating Rate Fund (four of the funds constituting Goldman Sachs Variable Insurance Trust, hereafter collectively referred to as the “Funds”) as of December 31, 2020, the related statements of operations for the year ended December 31, 2020, the statements of changes in net assets for each of the two years in the period ended December 31, 2020, including the related notes, and the financial highlights for each of the five years in the period ended December 31, 2020 (collectively referred to as the “financial statements”). In our opinion, the financial statements present fairly, in all material respects, the financial position of each of the Funds as of December 31, 2020, the results of each of their operations for the year then ended, the changes in each of their net assets for each of the two years in the period ended December 31, 2020 and each of the financial highlights for each of the five years in the period ended December 31, 2020 in conformity with accounting principles generally accepted in the United States of America.
Basis for Opinions
These financial statements are the responsibility of the Funds’ management. Our responsibility is to express an opinion on the Funds’ financial statements based on our audits. We are a public accounting firm registered with the Public Company Accounting Oversight Board (United States) (PCAOB) and are required to be independent with respect to the Funds in accordance with the U.S. federal securities laws and the applicable rules and regulations of the Securities and Exchange Commission and the PCAOB.
We conducted our audits of these financial statements in accordance with the standards of the PCAOB. Those standards require that we plan and perform the audit to obtain reasonable assurance about whether the financial statements are free of material misstatement, whether due to error or fraud.
Our audits included performing procedures to assess the risks of material misstatement of the financial statements, whether due to error or fraud, and performing procedures that respond to those risks. Such procedures included examining, on a test basis, evidence regarding the amounts and disclosures in the financial statements. Our audits also included evaluating the accounting principles used and significant estimates made by management, as well as evaluating the overall presentation of the financial statements. Our procedures included confirmation of securities owned as of December 31, 2020 by correspondence with the custodian, transfer agent and brokers; when replies were not received from brokers, we performed other auditing procedures. We believe that our audits provide a reasonable basis for our opinions.
/s/PricewaterhouseCoopers LLP
Boston, Massachusetts
February 17, 2021
We have served as the auditor of one or more investment companies in the Goldman Sachs fund complex since 2000.
79
GOLDMAN SACHS VARIABLE INSURANCE TRUST FUNDS
Voting Results of Special Meeting of Shareholders (Unaudited)
A Special Meeting (the “Meeting”) of the Goldman Sachs Variable Insurance Trust (“VIT”) was held on January 23, 2020 to consider and act upon the proposals below. The Funds have amortized their respective share of the proxy, shareholder meeting and other related costs and GSAM has agreed to reimburse each Fund to the extent such expenses exceed a specified percentage of the Fund’s net assets.
At the Meeting, Dwight L. Bush, Kathryn A. Cassidy, Joaquin Delgado and Gregory G. Weaver were elected to the Trust’s Board of Trustees. In electing trustees, the Trust’s shareholders voted as follows:
| | | | | | | | | | | | | | | | |
| | | | | |
Proposal 1. Election of Trustees | | For | | | Against | | | Withheld | | | Broker Non-Votes | |
| | | | | |
Dwight L. Bush | | | 745,493,677.130 | | | | 0 | | | | 17,848,840.639 | | | | 0 | |
| | | | | |
Kathryn A. Cassidy | | | 746,559,784.810 | | | | 0 | | | | 16,782,732.959 | | | | 0 | |
| | | | | |
Joaquin Delgado | | | 744,593,456.532 | | | | 0 | | | | 18,749,061.237 | | | | 0 | |
| | | | | |
Gregory G. Weaver | | | 746,707,039.321 | | | | 0 | | | | 16,635,478.448 | | | | 0 | |
80
GOLDMAN SACHS VARIABLE INSURANCE TRUST FUNDS
| | |
| Fund Expenses — Six Month Period Ended December 31, 2020 (Unaudited) | | |
As a shareholder of Institutional, Service or Advisor Shares of the Funds, you incur ongoing costs, including management fees, distribution and/or service (12b-1) fees (with respect to Service and Advisor Shares) and other Fund expenses. This example is intended to help you understand your ongoing costs (in dollars) of investing in the Institutional Shares, Service Shares and Advisor Shares of the Funds and to compare these costs with the ongoing costs of investing in other mutual funds.
The example is based on an investment of $1,000 invested at the beginning of the period and held for the entire period from July 1, 2020 through December 31, 2020, which represents a period of 184 days of a 366 day year.
Actual Expenses — The first line under each share class in the table below provides information about actual account values and actual expenses. You may use the information in this line, together with the amount you invested, to estimate the expenses that you paid over the period. Simply divide your account value by $1,000 (for example, an $8,600 account value divided by $1,000=8.6), then multiply the result by the number in the first line under the heading entitled “Expenses Paid” to estimate the expenses you paid on your account during this period.
Hypothetical Example for Comparison Purposes — The second line under each share class in the table below provides information about hypothetical account values and hypothetical expenses based on the Funds’ actual net expense ratio and an assumed rate of return of 5% per year before expenses, which is not the Funds’ actual return. The hypothetical account values and expenses may not be used to estimate the actual ending account balance or expenses you paid for the period. You may use this information to compare the ongoing costs of investing in the Funds and other funds. To do so, compare this 5% hypothetical example with the 5% hypothetical examples that appear in the shareholder reports of the other funds.
Please note that the expenses shown in the table are meant to highlight your ongoing costs only. As a shareholder of the Funds you do not incur any transaction costs, such as sales charges, redemption fees, or exchange fees, but shareholders of other funds may incur such costs. The second line of the table is useful in comparing ongoing costs only and will not help you determine the relative total costs of owning different funds whose shareholders may incur transaction costs.
| | | | | | | | | | | | | | | | | | | | | | | | | | | | | | | | | | | | | | | | | | | | | | | | |
| | | Core Fixed Income Fund | | | Equity Index Fund | | | Growth Opportunities Fund | | | High Quality Floating Rate Fund | |
| Share Class | | Beginning
Account
Value
07/01/20 | | | Ending
Account
Value
12/31/20 | | | Expenses
Paid for the
6 Months
Ended
12/31/20* | | | Beginning
Account
Value
07/01/20 | | | Ending
Account
Value
12/31/20 | | | Expenses
Paid for the
6 Months
Ended
12/31/20* | | | Beginning
Account
Value
07/01/20 | | | Ending
Account
Value
12/31/20 | | | Expenses
Paid for the
6 Months
Ended
12/31/20* | | | Beginning
Account
Value
07/01/20 | | | Ending
Account
Value
12/31/20 | | | Expenses
Paid for the
6 Months
Ended
12/31/20* | |
| Institutional | | | | | | | | | | | | | | | | | | | | | | | | | | | | | | | | | | | | | | | | | | | | | | | | |
| | | | | | | | | | | | | |
Actual | | $ | 1,000 | | | $ | 1,023.90 | | | $ | 2.03 | | | | N/A | | | | N/A | | | | N/A | | | $ | 1,000 | | | $ | 1,317.60 | | | $ | 4.95 | | | $ | 1,000 | | | $ | 1,008.70 | | | $ | 1.77 | |
Hypothetical 5% return | | | 1,000 | | | | 1,023.13 | + | | | 2.03 | | | | N/A | | | | N/A | | | | N/A | | | | 1,000 | | | | 1,020.86 | + | | | 4.32 | | | | 1,000 | | | | 1,023.38 | + | | | 1.78 | |
| Service | | | | | | | | | | | | | | | | | | | | | | | | | | | | | | | | | | | | | | | | | | | | | | | | |
| | | | | | | | | | | | | |
Actual | | | 1,000 | | | | 1,022.60 | | | | 3.30 | | | $ | 1,000 | | | $ | 1,219.40 | | | $ | 2.68 | | | | 1,000 | | | | 1,317.30 | | | | 5.88 | | | | 1,000 | | | | 1,007.10 | | | | 3.03 | |
Hypothetical 5% return | | | 1,000 | | | | 1,021.87 | + | | | 3.30 | | | | 1,000 | | | | 1,022.72 | + | | | 2.44 | | | | 1,000 | | | | 1,020.06 | + | | | 5.13 | | | | 1,000 | | | | 1,022.12 | + | | | 3.05 | |
| Advisor | | | | | | | | | | | | | | | | | | | | | | | | | | | | | | | | | | | | | | | | | | | | | | | | |
| | | | | | | | | | | | | |
Actual | | | N/A | | | | N/A | | | | N/A | | | | N/A | | | | N/A | | | | N/A | | | | N/A | | | | N/A | | | | N/A | | | | 1,000 | | | | 1,005.80 | | | | 3.78 | |
Hypothetical 5% return | | | N/A | | | | N/A | | | | N/A | | | | N/A | | | | N/A | | | | N/A | | | | N/A | | | | N/A | | | | N/A | | | | 1,000 | | | | 1,021.37 | + | | | 3.81 | |
| | + | Hypothetical expenses are based on each Fund’s actual annualized net expense ratios and an assumed rate of return of 5% per year before expenses. | |
| | * | Expenses are calculated using each Fund’s annualized net expense ratio for each class, which represents the ongoing expenses as a percentage of net assets for the six months ended December 31, 2020. Expenses are calculated by multiplying the annualized net expense ratio by the average account value for the period; then multiplying the result by the number of days in the most recent fiscal half year; and then dividing that result by the number of days in the fiscal year. The annualized net expense ratios for the period were as follows: | |
| | | | | | | | | | | | |
| | | |
| Fund | | Institutional | | | Service | | | Advisor | |
| Core Fixed Income | | | 0.40 | % | | | 0.65 | % | | | N/A | |
| Equity Index | | | N/A | | | | 0.48 | | | | N/A | |
| Growth Opportunities | | | 0.85 | | | | 1.01 | | | | N/A | |
| High Quality Floating Rate | | | 0.35 | | | | 0.60 | | | | 0.75 | % |
81
GOLDMAN SACHS VARIABLE INSURANCE TRUST FUNDS
Trustees and Officers (Unaudited)
Independent Trustees
| | | | | | | | | | | | |
| | | | | |
Name,
Address and Age1 | | Position(s) Held
with the Trust | | Term of Office and
Length of
Time Served2 | | Principal Occupation(s) During Past 5 Years | | Number of
Portfolios in
Fund Complex
Overseen by
Trustee3 | | | Other Directorships Held by Trustee4 |
Jessica Palmer Age: 71 | | Chair of the Board of Trustees | | Since 2018 (Trustee since 2007) | | Ms. Palmer is retired. She was formerly Consultant, Citigroup Human Resources Department (2007-2008); Managing Director, Citigroup Corporate and Investment Banking (previously, Salomon Smith Barney/Salomon Brothers) (1984-2006). Ms. Palmer was a Member of the Board of Trustees of Indian Mountain School (private elementary and secondary school) (2004-2009). Chair of the Board of Trustees — Goldman Sachs Variable Insurance Trust and Goldman Sachs Trust. | | | 105 | | | None |
Dwight L. Bush Age: 63 | | Trustee | | Since 2020 | | Ambassador Bush is President and CEO of D.L. Bush & Associates (a financial advisory and private investment firm) (2002-2014 and 2017-present); and was formerly U.S. Ambassador to the Kingdom of Morocco (2014-2017) and a Member of the Board of Directors of Santander Bank, N.A. (2018-2019). Previously, Ambassador Bush served as an Advisory Board Member of Goldman Sachs Trust and Goldman Sachs Variable Insurance Trust (October 2019-January 2020). Trustee — Goldman Sachs Variable Insurance Trust and Goldman Sachs Trust. | | | 105 | | | None |
Kathryn A. Cassidy Age: 66 | | Trustee | | Since 2015 | | Ms. Cassidy is retired. Formerly, she was Advisor to the Chairman (May 2014-December 2014); and Senior Vice President and Treasurer (2008-2014), General Electric Company & General Electric Capital Corporation (technology and financial services companies). Trustee — Goldman Sachs Variable Insurance Trust and Goldman Sachs Trust. | | | 105 | | | None |
Diana M. Daniels Age: 71 | | Trustee | | Since 2007 | | Ms. Daniels is retired. Formerly, she was Vice President, General Counsel and Secretary, The Washington Post Company (1991-2006). Ms. Daniels is a Trustee Emeritus and serves as a Presidential Councillor of Cornell University (2013-Present); former Member of the Legal Advisory Board, New York Stock Exchange (2003-2006) and of the Corporate Advisory Board, Standish Mellon Management Advisors (2006-2007). Trustee — Goldman Sachs Variable Insurance Trust and Goldman Sachs Trust. | | | 105 | | | None |
Joaquin Delgado Age: 60 | | Trustee | | Since 2020 | | Dr. Delgado is retired. He is Director, Hexion Inc. (a specialty chemical manufacturer) (2019-present); and Director, Stepan Company (a specialty chemical manufacturer) (2011-present); and was formerly Executive Vice President, Consumer Business Group of 3M Company (July 2016-July 2019); and Executive Vice President, Health Care Business Group of 3M Company (October 2012-July 2016). Previously, Dr. Delgado served as an Advisory Board Member of Goldman Sachs Trust and Goldman Sachs Variable Insurance Trust (October 2019-January 2020). Trustee — Goldman Sachs Variable Insurance Trust and Goldman Sachs Trust. | | | 105 | | | Stepan Company (a specialty chemical manufacturer) |
| | | | | | | | | | | | |
82
GOLDMAN SACHS VARIABLE INSURANCE TRUST FUNDS
Trustees and Officers (Unaudited) (continued)
Independent Trustees
| | | | | | | | | | | | |
Name,
Address and Age1 | | Position(s) Held
with the Trust | | Term of Office and
Length of
Time Served2 | | Principal Occupation(s) During Past 5 Years | | Number of
Portfolios in
Fund Complex
Overseen by
Trustee3 | | | Other Directorships Held by Trustee4 |
Roy W. Templin Age: 60 | | Trustee | | Since 2013 | | Mr. Templin is retired. He is Director, Armstrong World Industries, Inc. (a designer and manufacturer of ceiling, wall and suspension system solutions) (2016-Present); and was formerly Chairman of the Board of Directors, Con-Way Incorporated (a transportation, logistics and supply chain management service company) (2014-2015); Executive Vice President and Chief Financial Officer, Whirlpool Corporation (an appliance manufacturer and marketer) (2004-2012). Trustee — Goldman Sachs Variable Insurance Trust and Goldman Sachs Trust. | | | 105 | | | Armstrong World Industries, Inc. (a ceiling, wall and suspension systems solutions manufacturer) |
Gregory G. Weaver Age: 69 | | Trustee | | Since 2015 | | Mr. Weaver is retired. He is Director, Verizon Communications Inc. (2015-Present); and was formerly Chairman and Chief Executive Officer, Deloitte & Touche LLP (a professional services firm) (2001-2005 and 2012-2014); and Member of the Board of Directors, Deloitte & Touche LLP (2006-2012). Trustee — Goldman Sachs Variable Insurance Trust and Goldman Sachs Trust. | | | 105 | | | Verizon Communications Inc. |
83
GOLDMAN SACHS VARIABLE INSURANCE TRUST FUNDS
Trustees and Officers (Unaudited) (continued)
Interested Trustee*
| | | | | | | | | | | | |
Name,
Address and Age1 | | Position(s) Held
with the Trust | | Term of Office and
Length of
Time Served2 | | Principal Occupation(s) During Past 5 Years | | Number of
Portfolios in
Fund Complex
Overseen by
Trustee3 | | | Other Directorships Held by Trustee4 |
James A. McNamara Age: 58 | | Trustee and President | | Since 2007 | | Advisory Director, Goldman Sachs (January 2018-Present); Managing Director, Goldman Sachs (January 2000-December 2017); Director of Institutional Fund Sales, GSAM (April 1998-December 2000); and Senior Vice President and Manager, Dreyfus Institutional Service Corporation (January 1993-April 1998). President and Trustee — Goldman Sachs Variable Insurance Trust; Goldman Sachs Trust; Goldman Sachs Trust II; Goldman Sachs MLP and Energy Renaissance Fund; Goldman Sachs ETF Trust; Goldman Sachs Credit Income Fund; and Goldman Sachs Real Estate Diversified Income Fund. | | | 158 | | | None |
| | | | | | | | | | | | |
| * | Mr. McNamara is considered to be an “Interested Trustee” because he holds positions with Goldman Sachs and owns securities issued by The Goldman Sachs Group, Inc. Mr. McNamara holds comparable positions with certain other companies of which Goldman Sachs, GSAM or an affiliate thereof is the investment adviser, administrator and/or distributor. |
| 1 | Each Trustee may be contacted by writing to the Trustee, c/o Goldman Sachs, 200 West Street, New York, New York, 10282, Attn: Caroline Kraus. Information is provided as of December 31, 2020. |
| 2 | Subject to such policies as may be adopted by the Board from time-to-time, each Trustee holds office for an indefinite term, until the earliest of: (a) the election of his or her successor; (b) the date the Trustee resigns or is removed by the Board or shareholders, in accordance with the Trust’s Declaration of Trust; or (c) the termination of the Trust. The Board has adopted policies which provide that each Independent Trustee shall retire as of December 31st of the calendar year in which he or she reaches (a) his or her 75th birthday or (b) the 15th anniversary of the date he or she became a Trustee, whichever is earlier, unless a waiver of such requirements shall have been adopted by a majority of the other Trustees. These policies may be changed by the Trustees without shareholder vote. |
| 3 | The Goldman Sachs Fund Complex includes certain other companies listed above for each respective Trustee. As of December 31, 2020, Goldman Sachs Variable Insurance Trust consisted of 13 portfolios; Goldman Sachs Trust consisted of 92 portfolios (90 of which offered shares to the public); Goldman Sachs Trust II consisted of 19 portfolios (17 of which offered shares to the public); Goldman Sachs ETF Trust consisted of 31 portfolios (20 of which offered shares to the public); and Goldman Sachs MLP and Energy Renaissance Fund, Goldman Sachs Credit Income Fund and Goldman Sachs Real Estate Diversified Income Fund each consisted of one portfolio. Goldman Sachs Credit Income Fund did not offer shares to the public. |
| 4 | This column includes only directorships of companies required to report to the Securities and Exchange Commission under the Securities Exchange Act of 1934 (i.e., “public companies”) or other investment companies registered under the Act. |
Additional information about the Trustees is available in the Funds’ Statement of Additional Information, which can be obtained from Goldman Sachs free of charge by calling this toll-free number (in the United States of America): 1-800-526-7384.
84
GOLDMAN SACHS VARIABLE INSURANCE TRUST FUNDS
Trustees and Officers (Unaudited) (continued)
Officers of the Trust*
| | | | | | |
| | | |
| Name, Address and Age1 | | Position(s) Held with the Trust | | Term of
Office and
Length of
Time Served2 | | Principal Occupation(s) During Past 5 Years |
James A. McNamara
200 West Street New York, NY 10282 Age: 58 | | Trustee and
President | | Since 2007 | | Advisory Director, Goldman Sachs (January 2018-Present); Managing Director, Goldman Sachs (January 2000-December 2017); Director of Institutional Fund Sales, GSAM (April 1998-December 2000); and Senior Vice President and Manager, Dreyfus Institutional Service Corporation (January 1993-April 1998). President and Trustee — Goldman Sachs Variable Insurance Trust; Goldman Sachs Trust; Goldman Sachs Trust II; Goldman Sachs MLP and Energy Renaissance Fund; Goldman Sachs ETF Trust; Goldman Sachs Credit Income Fund; and Goldman Sachs Real Estate Diversified Income Fund. |
Caroline L. Kraus
200 West Street New York, NY 10282 Age: 43 | | Secretary | | Since 2012 | | Managing Director, Goldman Sachs (January 2016-Present); Vice President, Goldman Sachs (August 2006-December 2015); Senior Counsel, Goldman Sachs (January 2020-Present); Associate General Counsel, Goldman Sachs (2012-December 2019); Assistant General Counsel, Goldman Sachs (August 2006-December 2011); and Associate, Weil, Gotshal & Manges, LLP (2002-2006). Secretary — Goldman Sachs Variable Insurance Trust (previously Assistant Secretary (2012)); Goldman Sachs Trust (previously Assistant Secretary (2012)); Goldman Sachs Trust II; Goldman Sachs BDC, Inc.; Goldman Sachs Private Middle Market Credit LLC; Goldman Sachs Private Middle Market Credit II LLC; Goldman Sachs Middle Market Lending Corp.; Goldman Sachs MLP and Energy Renaissance Fund; Goldman Sachs ETF Trust; Goldman Sachs Credit Income Fund; and Goldman Sachs Real Estate Diversified Income Fund. |
Joseph F. DiMaria
30 Hudson Street Jersey City, NJ 07302 Age: 52 | | Treasurer, Principal
Financial Officer
and Principal
Accounting Officer | | Since 2017
(Treasurer
and Principal
Financial
Officer
since 2019) | | Managing Director, Goldman Sachs (November 2015-Present) and Vice President — Mutual Fund Administration, Columbia Management Investment Advisers, LLC (May 2010-October 2015). Treasurer, Principal Financial Officer and Principal Accounting Officer — Goldman Sachs Variable Insurance Trust (previously Assistant Treasurer (2016)); Goldman Sachs Trust (previously Assistant Treasurer (2016)); Goldman Sachs Trust II (previously Assistant Treasurer (2017)); Goldman Sachs MLP and Energy Renaissance Fund (previously Assistant Treasurer (2017)); Goldman Sachs ETF Trust (previously Assistant Treasurer (2017)); Goldman Sachs Credit Income Fund; and Goldman Sachs Real Estate Diversified Income Fund. |
| * | Represents a partial list of officers of the Trust. Additional information about all the officers is available in the Funds’ Statement of Additional Information, which can be obtained from Goldman Sachs free of charge by calling this toll-free number (in the United States): 1-800-526-7384. |
| 1 | Information is provided as of December 31, 2020. |
| 2 | Officers hold office at the pleasure of the Board of Trustees or until their successors are duly elected and qualified. Each officer holds comparable positions with certain other companies of which Goldman Sachs, GSAM or an affiliate thereof is the investment adviser, administrator and/or distributor. |
Goldman Sachs Variable Insurance Trust — Tax Information (Unaudited)
For the year ended December 31, 2020, 100% and 9.65% of the dividends paid from net investment company taxable income by the Equity Index and Growth Opportunities Funds qualify for the dividends received deduction available to corporations.
Pursuant to Section 852 of the Internal Revenue Code, the Equity Index and Growth Opportunities Funds designate $12,311,282 and $11,674,825 respectively, or, if different, the maximum amount allowable, as capital gain dividends paid during the year ended December 31, 2020.
For the year ended December 31, 2020, the Core Fixed Income and High Quality Floating Rate Funds designate 71.51% and 54.82% of the dividends paid from net investment company taxable income as section 163(j) Interest Dividends.
85
| | |
| TRUSTEES | | OFFICERS |
| Jessica Palmer, Chair | | James A. McNamara, President |
| Dwight L. Bush | | Joseph F. DiMaria, Principal Financial Officer, |
| Kathryn A. Cassidy | | Principal Accounting Officer and Treasurer |
| Diana M. Daniels | | Caroline L. Kraus, Secretary |
| Joaquin Delgado | | |
| James A. McNamara | | |
| Roy W. Templin | | |
| Gregory G. Weaver | | |
GOLDMAN SACHS & CO. LLC
Distributor and Transfer Agent
GOLDMAN SACHS ASSET MANAGEMENT, L.P.
Investment Adviser
200 West Street, New York,
New York 10282
Visit our web site at www.GSAMFUNDS.com to obtain the most recent month-end returns.
The reports concerning the Funds included in this shareholder report may contain certain forward-looking statements about the factors that may affect the performance of the Funds in the future. These statements are based on Fund management’s predictions and expectations concerning certain future events and their expected impact on the Funds, such as performance of the economy as a whole and of specific industry sectors, changes in the levels of interest rates, the impact of developing world events, and other factors that may influence the future performance of the Funds. Management believes these forward-looking statements to be reasonable, although they are inherently uncertain and difficult to predict. Actual events may cause adjustments in portfolio management strategies from those currently expected to be employed.
A description of the policies and procedures that the Funds use to determine how to vote proxies relating to portfolio securities and information regarding how the Funds voted proxies relating to portfolio securities for the 12-month period ended December 31 is available (i) without charge, upon request by calling 1-800-621-2550; and (ii) on the Securities and Exchange Commission (“SEC”) web site at http://www.sec.gov.
The Funds will file portfolio holdings information for each month in a fiscal quarter within 60 days after the end of the relevant fiscal quarter on Form N-PORT. Portfolio holdings information for the third month of each fiscal quarter will be made available on the SEC’s web site at http://www.sec.gov. Portfolio holdings information may be obtained upon request and without charge by calling 1-800-526-7384 (for Retail Shareholders) or 1-800-621-2550 (for Institutional Shareholders).
Views and opinions expressed are for informational purposes only and do not constitute a recommendation by GSAM to buy, sell, or hold any security. Views and opinions are current as of the date of this presentation and may be subject to change, they should not be construed as investment advice.
Goldman Sachs & Co. LLC (“Goldman Sachs”) does not provide legal, tax or accounting advice. Any statement contained in this communication (including any attachments) concerning U.S. tax matters was not intended or written to be used, and cannot be used, for the purpose of avoiding penalties under the Internal Revenue Code, and was written to support the promotion or marketing of transactions or matters addressed. Clients of Goldman Sachs should obtain their own independent tax advice based on their particular circumstances.
The website links provided are for your convenience only and are not an endorsement or recommendation by GSAM of any of these websites or the products or services offered. GSAM is not responsible for the accuracy and validity of the content of these websites.
Fund holdings and allocations shown are as of December 31, 2020 and may not be representative of future investments. Fund holdings should not be relied on in making investment decisions and should not be construed as research or investment advice regarding particular securities. Current and future holdings are subject to risk.
References to indices, benchmarks or other measures of relative market performance over a specified period of time are provided for your information only and do not imply that the portfolio will achieve similar results. The index composition may not reflect the manner in which a portfolio is constructed. While an adviser seeks to design a portfolio which reflects appropriate risk and return features, portfolio characteristics may deviate from those of the benchmark.
The Global Industry Classification Standard (“GICS”) was developed by and is the exclusive property and a service mark of Morgan Stanley Capital International Inc. (“MSCI”) and Standard & Poor’s, a division of The McGraw-Hill Companies, Inc. (“S&P”) and is licensed for use by Goldman Sachs. Neither MSCI, S&P nor any other party involved in making or compiling the GICS or any GICS classifications makes any express or implied warranties or representations with respect to such standard or classification (or the results to be obtained by the use thereof), and all such parties hereby expressly disclaim all warranties of originality, accuracy, completeness, merchantability or fitness for a particular purpose with respect to any of such standard or classification. Without limiting any of the foregoing, in no event shall MSCI, S&P, any of their affiliates or any third party involved in making or compiling the GICS or any GICS classifications have any liability for any direct, indirect, special, punitive, consequential or any other damages (including lost profits) even if notified of the possibility of such damages.
The portfolio risk management process includes an effort to monitor and manage risk, but does not imply low risk.
Shares of the Goldman Sachs VIT Funds are offered to separate accounts of participating life insurance companies for the purpose of funding variable annuity contracts and variable life insurance policies. Shares of the Funds are not offered directly to the general public. The variable annuity contracts and variable life insurance policies are described in the separate prospectuses issued by participating insurance companies. You should refer to those prospectuses for information about surrender charges, mortality and expense risk fees and other charges that may be assessed by participating insurance companies under the variable annuity contracts or variable life insurance policies. Such fees or charges, if any, may affect the return you may realize with respect to your investments. Ask your representative for more complete information. Please consider a fund’s objectives, risks and charges and expenses, and read the prospectus carefully before investing. The prospectus contains this and other information about the Funds.
This material is not authorized for distribution to prospective investors unless preceded or accompanied by a current prospectus or summary prospectus, if applicable. Investors should consider the Funds’ objective, risks, and charges and expenses, and read the summary prospectus, if available, and/or the prospectus carefully before investing or sending money. The summary prospectus, if available, and the prospectus contain this and other information about the Funds and may be obtained from your authorized dealer or from Goldman Sachs & Co. LLC by calling 1-800-621-2550.
This report is prepared for the general information of contract owners and is not an offer of shares of the Goldman Sachs Variable Insurance Trust Funds.
© 2021 Goldman Sachs. All rights reserved.
VITMLTIAR-21/229746-OTU-1350847
Goldman
Sachs Variable Insurance Trust
Goldman Sachs
Small Cap Equity Insights Fund
Beginning on or after January 1, 2021, you may not receive paper copies of the Fund’s annual and semi-annual shareholder reports from the insurance company that offers your variable insurance contract or your financial intermediary, unless you specifically request paper copies of the reports from the insurance company or from your financial intermediary. Instead, the reports will be made available on a website, and you will be notified by mail each time a report is posted and provided with a website link to access the report.
If you already elected to receive shareholder reports electronically, you will not be affected by this change and you need not take any action. At any time, you may elect to receive reports and certain communications from the insurance company electronically by contacting your insurance company or your financial intermediary.
You may elect to receive all future shareholder reports in paper free of charge. You can inform the insurance company or your financial intermediary that you wish to receive paper copies of reports. Your election to receive reports in paper will apply to all Goldman Sachs Funds available under your contract and may apply to all funds held with your financial intermediary.
Annual Report
December 31, 2020

GOLDMAN SACHS VARIABLE INSURANCE TRUST SMALL CAP EQUITY INSIGHTS FUND
INVESTMENT OBJECTIVE
The Fund seeks long-term growth of capital.
Portfolio Management Discussion and Analysis
Below, the Goldman Sachs Quantitative Investment Strategies Team discusses the Goldman Sachs Variable Insurance Trust — Goldman Sachs Small Cap Equity Insights Fund’s (the “Fund”) performance and positioning for the 12-month period ended December 31, 2020 (the “Reporting Period”).
How did the Fund perform during the Reporting Period?
During the Reporting Period, the Fund’s Institutional and Service Shares generated average annual total returns of 8.56% and 8.34%, respectively. These returns compare to the 19.90% average annual total return of the Fund’s benchmark, the Russell 2000® Index (with dividends reinvested) (the “Russell Index”) during the same time period.
What economic and market factors most influenced the equity markets as a whole during the Reporting Period?
Representing the U.S. equity market, the S&P 500® Index returned 18.34% during the Reporting Period.
The U.S. equity market fell significantly in the first quarter of 2020, selling off as the outbreak and subsequent spread of COVID-19 caused non-essential businesses to close. Jobless claims increased to 6.6 million, and nonfarm payrolls decreased by 701,000 for the month of March, leading the U.S. government to respond with aggressive economic stimulus and the U.S. Federal Reserve (the “Fed”) to respond with unprecedented monetary policy stimulus, including lowering its targeted federal funds rate to zero and re-introducing and expanding its quantitative easing programs. Exacerbating matters was oil prices that fell as supply increased and demand decreased.
After hitting a low on March 23, 2020, the U.S. equity market then rose in the subsequent three quarters of 2020. In the second calendar quarter, the U.S. equity market appreciated despite a surge in COVID-19 cases in regional pockets of the country, causing local governments to pause reopening plans and revisit previous lockdown measures. Positive market sentiment was buoyed by better than consensus expected economic data, such as nonfarm payrolls increasing 7.3 million during May and June 2020, driving the unemployment rate down to 11.1% from 14.7% in April. The U.S. equity markets continued to rally in the third quarter of 2020 despite ongoing pressure from the pandemic. Market strength was supported by a sharp cyclical recovery in economic data, with the Institute for Supply Management’s Manufacturing Purchasing Managers’ Index increasing to 56.0 in August, which is firmly in expansionary territory. Optimism around a potential COVID-19 vaccine also helped support equity markets during the quarter. Still, risks to the market persisted given political uncertainty ahead of the November 2020 U.S. elections, lower levels of Gross Domestic Product, heightened unemployment, questions around how quickly and effectively a vaccine could be distributed, and debates about the extent of a new stimulus package from the federal government. In the fourth quarter of 2020, U.S. stocks extended a broad-based recovery from their steep first quarter declines. Markets rallied on the prospect of an end to the global pandemic and its economic impact with approval and distribution of COVID-19 vaccines. While uncertainty surrounding the then-upcoming U.S. elections and other policy questions created the potential for higher market volatility, the Democratic victory of Joe Biden proved positive for equity markets over the near term. Also, after a historically sharp but short recession during the spring of 2020, many major economies, including that of the U.S., entered an early-cycle phase of recovery. Employment conditions improved, as temporary job losses were regained in some segments of the economy, and U.S. manufacturing activity recovered. Despite this improvement, reminders of a COVID-19 ceiling for industries hit hardest by the restrictions caused by the pandemic persisted.
For the Reporting Period overall, eight of the 11 sectors in the S&P 500® Index posted positive absolute returns, with seven of those eight generating double-digit gains. Information technology, consumer discretionary and communication services were the best performing sectors in the S&P 500® Index, as measured by total return, while the weakest performing sectors in the S&P 500® Index during the Reporting Period were energy, real estate and financials.
Within the U.S. equity market, all capitalization segments posted double-digit positive returns, led by large-cap stocks, as measured by the Russell 1000® Index, followed closely by small-cap stocks, as measured by the Russell 2000® Index, and then by mid-cap stocks, as measured by the Russell Midcap® Index. From a style perspective, growth-oriented stocks significantly outpaced value-oriented stocks across the capitalization spectrum. (All as measured by the FTSE Russell indices.)
1
GOLDMAN SACHS VARIABLE INSURANCE TRUST SMALL CAP EQUITY INSIGHTS FUND
What key factors were responsible for the Fund’s performance during the Reporting Period?
During the Reporting Period, the Fund posted solid absolute gains but underperformed the Russell Index on a relative basis. Three of our quantitative model’s four investment themes detracted from performance, while one contributed positively. Stock selection overall, driven by these investment themes, dampened relative returns.
What impact did the Fund’s investment themes have on performance during the Reporting Period?
The Fund uses a quantitative style of management, in combination with a qualitative overlay, that emphasizes fundamentally-based stock selection, careful portfolio construction and efficient implementation. The Fund’s investments are selected using fundamental research and a variety of quantitative techniques based on certain investment themes, namely Fundamental Mispricings, High Quality Business Models, Sentiment Analysis and Market Themes & Trends.
In keeping with our investment approach, we use our quantitative model and four investment themes to take a long-term view of market patterns and look for inefficiencies, selecting stocks for the Fund and overweighting or underweighting the ones chosen by the model. Over time and by design, the performance of any one of the model’s investment themes tends to have a low correlation with the model’s other themes, demonstrating the diversification benefit of the Fund’s theme-driven quantitative model. The variance in performance supports our research indicating that the diversification provided by the Fund’s different investment themes is a significant investment advantage over the long term, even though the Fund may experience underperformance in the short term. Of course, diversification does not protect an investor from market risk nor does it ensure a profit.
During the Reporting Period, three of our four investment themes detracted from the Fund’s relative performance — High Quality Business Models and Sentiment Analysis detracted most, followed at some distance by Fundamental Mispricings. The Market Themes & Trends investment theme contributed positively. High Quality Business Models seeks to identify companies that are generating high quality revenues with sustainable business models and aligned management incentives. Sentiment Analysis seeks to identify stocks experiencing improvements in their overall market sentiment. Fundamental Mispricing seeks to identify high quality businesses trading at a fair price, which we believe may lead to strong performance over the long run. Market Themes & Trends seeks to identify companies positively positioned to benefit from themes and trends in the market and macroeconomic environment.
How did the Fund’s sector and industry allocations affect relative performance?
In constructing the Fund’s portfolio, we focus on picking stocks rather than making sector or industry bets. Consequently, the Fund is similar to its benchmark, the Russell Index, in terms of its sector and industry allocations and style. Changes in its sector or industry weights generally do not have a meaningful impact on relative performance.
Did stock selection help or hurt Fund performance during the Reporting Period?
We seek to outpace the Russell Index by overweighting stocks that we expect to outperform and underweighting those that we think may lag. At the same time, we strive to maintain a risk profile similar to the Russell Index. The Fund’s investments are selected using fundamental research and a variety of quantitative techniques based on our investment themes. For example, the Fund aims to hold a basket of stocks with better Fundamental Mispricings characteristics than the benchmark index.
During the Reporting Period, stock selection overall hampered the Fund’s performance, with investments in the health care, industrials and consumer discretionary sectors detracting most from results relative to the Russell Index. Holdings in the financials, energy and communication services sectors contributed the most to the Fund’s relative returns.
Which individual positions detracted from the Fund’s results during the Reporting Period?
Detracting most from the Fund’s results relative to the Russell Index were an underweight in fuel cell systems manufacturer Plug Power and overweight positions in specialty biopharmaceutical company Emergent BioSolutions and banking services provider Central Pacific Financial. The underweight in Plug Power was established primarily as a result of our High Quality Business Models investment theme. Largely because of our Sentiment Analysis and Market Themes & Trends investment themes, the Fund was overweight Emergent BioSolutions. The Fund’s overweight in Central Pacific Financial was driven primarily by our Sentiment Analysis and Fundamental Mispricings investment themes.
Which individual stock positions contributed the most to the Fund’s relative returns during the Reporting Period?
The Fund benefited most from overweight positions in insurance agency Goosehead Insurance, biotechnology company Twist Bioscience and pet health insurance services provider Trupanion. The overweight in Goosehead Insurance was established predominantly due to our Fundamental Mispricings and Market Themes & Trends investment themes. The overweight in Twist
2
GOLDMAN SACHS VARIABLE INSURANCE TRUST SMALL CAP EQUITY INSIGHTS FUND
Bioscience was driven by our High Quality Business Models and Sentiment Analysis investment themes. The Fund was overweight Trupanion largely because of our Fundamental Mispricings and Market Themes & Trends investment themes.
How did the Fund use derivatives during the Reporting Period?
During the Reporting Period, we did not use derivatives as part of an active management strategy to add value to the Fund’s results. However, we used equity index futures contracts, on an opportunistic basis, to equitize the Fund’s excess cash holdings. In other words, we put the Fund’s excess cash holdings to work by using them as collateral for the purchase of stock futures. The use of these futures contracts did not have a material impact on the Fund’s performance during the Reporting Period.
Did you make any enhancements to your quantitative models during the Reporting Period?
We continuously look for ways to improve our investment process. During the Reporting Period, we made numerous enhancements to our models. As example, during the first half of the Reporting Period, we introduced a number of new signals within our High Quality Business Models investment theme. The first signal, introduced in our U.S. region, uses machine learning and natural language processing techniques to capture the linguistic complexity of a company’s earnings call transcript, as we believe that companies using simple language are expected to perform better over the long term. The second signal, also introduced in the U.S. region, uses machine learning techniques to gauge the management quality of a company by assessing employee satisfaction and firm culture through employee reviews and ratings for companies. We also introduced a new Fundamental Mispricings signal into all of our regional models. This signal seeks to test investors’ under-reaction to a company’s short-term deviation in its fundamentals by simultaneously looking at a set of key profitability metrics that could point to a company’s long-term growth prospects.
During the second half of the Reporting Period, within our Sentiment Analysis investment theme, we introduced a number of new signals in the U.S. region. The first signal uses granular market data to understand market microstructures, or how different cohorts of market participants may be transacting. The second is based on the quality of managements’ responses on earnings calls. This signal uses natural language processing techniques in order to capture the linguistic complexity of a company’s earnings call transcript, as we believe that companies that respond with fewer “non-answers” are expected to perform better over the long term. We also introduced new signals within our High Quality Business Models investment theme, particularly in the U.S. region. The first signal evaluates the overlap in tenure of a company’s C-Suite executives as well as other management positions, as we believe companies that exhibit less turnover in their senior- most management teams are likely to outperform in the long run. The second signal seeks to identify a company’s exposure to U.S. states based on search engine activity, as we believe that companies can be impacted by the economic conditions of regions beyond where their subsidiaries, offices or otherwise general businesses are physically located. We also introduced a strategic climate-aware tilt with longer-term return expectations within our portfolio construction process. This tilt is designed to reduce the Fund’s exposure to carbon transition risk using two proprietary measures of emissions intensity. We believe that the transition to a low-carbon economy is likely to become even more important in determining the attractiveness of companies in the future.
What was the Fund’s sector positioning relative to its benchmark index at the end of the Reporting Period?
As of December 31, 2020, the Fund was overweight the materials, communication services, real estate, information technology and financials sectors relative to the Russell Index. The Fund was underweight health care, industrials and utilities and was rather neutrally weighted in consumer discretionary, energy and consumer staples compared to the Russell Index on the same date.
Were there any changes to the Fund’s portfolio management team during the Reporting Period?
There were no changes to the Fund’s portfolio management team during the Reporting Period.
What is your strategy going forward for the Fund?
Looking ahead, we continue to believe that less expensive stocks should outpace more expensive stocks, and stocks with good momentum are likely to outperform those with poor momentum. We intend to maintain our focus on seeking companies about which fundamental research analysts are becoming more positive as well as profitable companies with sustainable earnings and a track record of using their capital to enhance shareholder value. As such, we anticipate remaining fully invested with long-term performance likely to be the result of stock selection rather than sector or capitalization allocations.
We stand behind our investment philosophy that sound economic investment principles, coupled with a disciplined quantitative approach, can provide strong, uncorrelated returns over the long term. Our research agenda is robust, and we continue to enhance our existing models, add new proprietary forecasting signals and improve our trading execution as we seek to provide the most value to our shareholders.
3
GOLDMAN SACHS VARIABLE INSURANCE TRUST SMALL CAP EQUITY INSIGHTS FUND
Index Definitions
The Russell 2000® Index is an unmanaged index of common stock prices that measures the performance of the 2000 smallest companies in the Russell 3000® Index. The figures for the index do not include any deduction for fees, expenses or taxes.
The S&P 500® Index is the Standard & Poor’s composite index of 500 stocks, an unmanaged index of common stock prices. The figures for the index do not include any deduction for fees, expenses or taxes.
The Russell Midcap® Index measures the performance of the 800 smallest companies in the Russell 1000® Index, which represents approximately 25% of the total market capitalization of the Russell 1000 Index.
The Russell 1000® Index measures the performance of the 1,000 largest companies in the Russell 3000® Index, which represents approximately 92% of the total market capitalization of the Russell 3000 Index.
It is not possible to invest directly in an index.
4
FUND BASICS
Small Cap Equity Insights Fund
as of December 31, 2020
TOP TEN HOLDINGS AS OF 12/31/201,2
| | | | | | |
| | |
| Holding | | % of Net Assets | | | Line of Business |
| Varonis Systems, Inc. | | | 0.8% | | | Software & Services |
| Louisiana-Pacific Corp. | | | 0.8 | | | Materials |
| Visteon Corp. | | | 0.8 | | | Automobiles & Components |
| Iridium Communications, Inc. | | | 0.8 | | | Telecommunication Services |
| Alcoa Corp. | | | 0.7 | | | Materials |
| Integer Holdings Corp. | | | 0.7 | | | Health Care Equipment & Services |
| Emergent BioSolutions, Inc. | | | 0.7 | | | Pharmaceuticals, Biotechnology & Life Sciences |
| Select Medical Holdings Corp. | | | 0.7 | | | Health Care Equipment & Services |
| Natera, Inc. | | | 0.7 | | | Pharmaceuticals, Biotechnology & Life Sciences |
| Terreno Realty Corp. (REIT) | | | 0.7 | | | Real Estate |
| 1 | The top 10 holdings may not be representative of the Fund’s future investments. |
| 2 | The Fund’s overall top ten holdings differ from the table above due to the exclusion of the Goldman Sachs Financial Square Government Fund (a short-term investment fund) which represents 1.0% of the Fund’s net assets as of December 31, 2020. |
5
FUND BASICS
FUND VS. BENCHMARK SECTOR ALLOCATIONS3
As of December 31, 2020
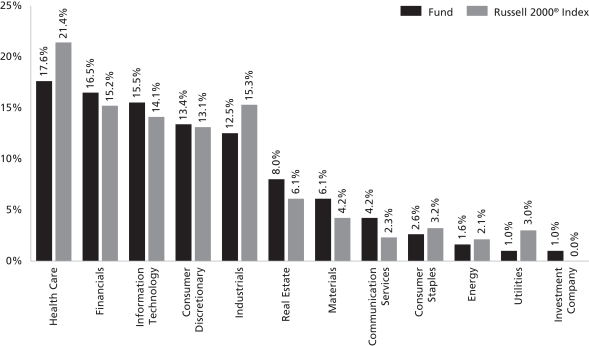
| 3 | The Fund is actively managed and, as such, its composition may differ over time. Consequently, the Fund’s overall sector allocations may differ from percentages contained in the graph above. The graph categorizes investments using Global Industry Classification Standard (“GICS”); however, the sector classifications used by the portfolio management team may differ from GICS. The percentage shown for each investment category reflects the value of investments in that category as a percentage of market value (excluding investments in the securities lending reinvestment vehicle, if any). Underlying sector allocations of exchange traded funds and investment companies held by the Fund are not reflected in the graph above. Investments in the securities lending reinvestment vehicle represented 0.6% of the Fund’s net assets at December 31, 2020. The graph depicts the Fund’s investments but may not represent the Fund’s market exposure due to the exclusion of certain derivatives, if any, as listed in the Additional Investment Information section of the Schedule of Investments. |
For more information about your Fund, please refer to www.GSAMFUNDS.com. There, you can learn more about your Fund’s investment strategies, holdings, and performance.
6
GOLDMAN SACHS VARIABLE INSURANCE TRUST SMALL CAP EQUITY INSIGHTS FUND
Performance Summary
December 31, 2020
The following graph shows the value, as of December 31, 2020, of a $10,000 investment made on January 1, 2011 in Institutional Shares at NAV. For comparative purposes, the performance of the Fund’s benchmark, the Russell 2000® Index (with distributions reinvested), is shown. Performance reflects applicable fee waivers and/or expense limitations in effect during the periods shown and in their absence, performance would be reduced. Returns do not reflect the deduction of taxes that a shareholder would pay on Fund distributions or the redemption of Fund shares. The returns set forth below represent past performance. Past performance does not guarantee future results. The Fund’s investment return and principal value will fluctuate so that an investor’s shares, when redeemed, may be worth more or less than their original cost. Current performance may be lower or higher than the performance quoted below. Please visit our web site at www.GSAMFUNDS.com to obtain the most recent month-end returns.
Small Cap Equity Insights Fund’s 10 Year Performance
Performance of a $10,000 investment, with distributions reinvested, from January 1, 2011 through December 31, 2020.
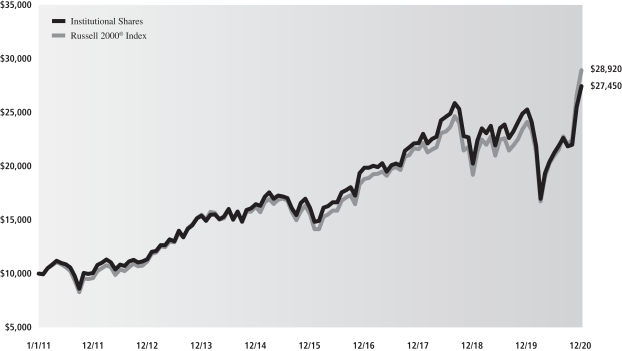
| | | | | | | | |
| Average Annual Total Return through December 31, 2020 | | One Year | | Five Years | | | Ten Years |
Institutional | | 8.56% | | | 11.22% | | | 10.62% |
Service | | 8.34% | | | 10.96% | | | 10.34% |
7
GOLDMAN SACHS VARIABLE INSURANCE TRUST SMALL CAP EQUITY INSIGHTS FUND
Schedule of Investments
December 31, 2020
| | | | | | | | |
Shares | | | Description | | Value | |
|
| Common Stocks – 97.6% | |
| Automobiles & Components – 1.9% | |
| | 20,799 | | | American Axle & Manufacturing Holdings, Inc.* | | $ | 173,464 | |
| | 427 | | | Cooper Tire & Rubber Co. | | | 17,293 | |
| | 48,999 | | | Goodyear Tire & Rubber Co. (The) | | | 534,579 | |
| | 10,328 | | | Standard Motor Products, Inc. | | | 417,871 | |
| | 6,303 | | | Visteon Corp.* | | | 791,153 | |
| | | | | | | | |
| | | | | | | 1,934,360 | |
| | |
| Banks – 8.4% | |
| | 4,389 | | | 1st Source Corp. | | | 176,877 | |
| | 6,734 | | | Amalgamated Bank Class A | | | 92,525 | |
| | 13,865 | | | Atlantic Capital Bancshares, Inc.* | | | 220,731 | |
| | 26,640 | | | Bancorp, Inc. (The)* | | | 363,636 | |
| | 637 | | | Banner Corp. | | | 29,678 | |
| | 32,493 | | | Boston Private Financial Holdings, Inc. | | | 274,566 | |
| | 22,571 | | | Cadence Bancorp | | | 370,616 | |
| | 857 | | | Camden National Corp. | | | 30,663 | |
| | 13,334 | | | Cathay General Bancorp | | | 429,221 | |
| | 15,777 | | | Central Pacific Financial Corp. | | | 299,921 | |
| | 385 | | | Century Bancorp, Inc. Class A | | | 29,784 | |
| | 3,514 | | | Community Bankers Trust Corp. | | | 23,719 | |
| | 30,843 | | | CVB Financial Corp. | | | 601,438 | |
| | 650 | | | Enterprise Bancorp, Inc. | | | 16,608 | |
| | 4,636 | | | Equity Bancshares, Inc. Class A* | | | 100,091 | |
| | 19,889 | | | First Bancorp/PR | | | 183,377 | |
| | 29,046 | | | First Commonwealth Financial Corp. | | | 317,763 | |
| | 17,684 | | | First Foundation, Inc. | | | 353,680 | |
| | 4,749 | | | First Internet Bancorp | | | 136,486 | |
| | 476 | | | First Mid Bancshares, Inc. | | | 16,022 | |
| | 6,143 | | | Flagstar Bancorp, Inc. | | | 250,389 | |
| | 1,693 | | | Glacier Bancorp, Inc. | | | 77,895 | |
| | 1,424 | | | Guaranty Bancshares, Inc. | | | 42,649 | |
| | 6,792 | | | Hanmi Financial Corp. | | | 77,021 | |
| | 8,183 | | | Heartland Financial USA, Inc. | | | 330,348 | |
| | 24,642 | | | Hilltop Holdings, Inc. | | | 677,901 | |
| | 9,789 | | | Hope Bancorp, Inc. | | | 106,798 | |
| | 17,471 | | | International Bancshares Corp. | | | 654,114 | |
| | 42,534 | | | Investors Bancorp, Inc. | | | 449,159 | |
| | 417 | | | Metropolitan Bank Holding Corp.* | | | 15,125 | |
| | 2,862 | | | National Bank Holdings Corp. Class A | | | 93,759 | |
| | 2,413 | | | Preferred Bank | | | 121,784 | |
| | 3,152 | | | Sierra Bancorp | | | 75,396 | |
| | 1,346 | | | Simmons First National Corp. Class A | | | 29,060 | |
| | 645 | | | Timberland Bancorp, Inc. | | | 15,648 | |
| | 13,227 | | | TriCo Bancshares | | | 466,649 | |
| | 7,935 | | | TriState Capital Holdings, Inc.* | | | 138,069 | |
| | 1,840 | | | Trustmark Corp. | | | 50,250 | |
| | 1,463 | | | United Bankshares, Inc. | | | 47,401 | |
| | 20,134 | | | Washington Federal, Inc. | | | 518,249 | |
| | 495 | | | Washington Trust Bancorp, Inc. | | | 22,176 | |
| | 4,752 | | | Westamerica Bancorp | | | 262,738 | |
| | | | | | | | |
| | | | | | | 8,589,980 | |
| | |
|
| Common Stocks – (continued) | |
| Capital Goods – 8.4% | |
| | 6,038 | | | Aegion Corp.* | | | 114,662 | |
| | 2,026 | | | Aerojet Rocketdyne Holdings, Inc.* | | | 107,074 | |
| | 1,869 | | | AeroVironment, Inc.* | | | 162,416 | |
| | 206 | | | Albany International Corp. Class A | | | 15,125 | |
| | 3,710 | | | Astronics Corp.* | | | 49,083 | |
| | 1,741 | | | Atkore International Group, Inc.* | | | 71,573 | |
| | 234 | | | Barnes Group, Inc. | | | 11,861 | |
| | 3,825 | | | Columbus McKinnon Corp. | | | 147,033 | |
| | 2,274 | | | EMCOR Group, Inc. | | | 207,980 | |
| | 2,471 | | | Encore Wire Corp. | | | 149,668 | |
| | 4,685 | | | Federal Signal Corp. | | | 155,401 | |
| | 8,356 | | | Franklin Electric Co., Inc. | | | 578,319 | |
| | 4,872 | | | GMS, Inc.* | | | 148,499 | |
| | 10,070 | | | Great Lakes Dredge & Dock Corp.* | | | 132,622 | |
| | 17,285 | | | H&E Equipment Services, Inc. | | | 515,266 | |
| | 1,227 | | | Herc Holdings, Inc.* | | | 81,485 | |
| | 4,371 | | | Masonite International Corp.* | | | 429,844 | |
| | 647 | | | Maxar Technologies, Inc. | | | 24,968 | |
| | 4,270 | | | Meritor, Inc.* | | | 119,176 | |
| | 4,149 | | | Miller Industries, Inc. | | | 157,745 | |
| | 1,513 | | | Moog, Inc. Class A | | | 119,981 | |
| | 40,089 | | | MRC Global, Inc.* | | | 265,790 | |
| | 4,280 | | | Mueller Industries, Inc. | | | 150,271 | |
| | 8,887 | | | NOW, Inc.* | | | 63,809 | |
| | 3,985 | | | Plug Power, Inc.* | | | 135,131 | |
| | 6,888 | | | Powell Industries, Inc. | | | 203,127 | |
| | 13,382 | | | Primoris Services Corp. | | | 369,477 | |
| | 11,116 | | | Quanex Building Products Corp. | | | 246,442 | |
| | 2,980 | | | RBC Bearings, Inc.* | | | 533,539 | |
| | 16,261 | | | Rexnord Corp. | | | 642,147 | |
| | 15,289 | | | Rush Enterprises, Inc. Class A | | | 633,270 | |
| | 9,014 | | | Sunrun, Inc.* | | | 625,391 | |
| | 2,330 | | | Titan Machinery, Inc.* | | | 45,552 | |
| | 4,818 | | | Triton International Ltd. | | | 233,721 | |
| | 5,762 | | | Tutor Perini Corp.* | | | 74,618 | |
| | 9,651 | | | UFP Industries, Inc. | | | 536,113 | |
| | 784 | | | Vectrus, Inc.* | | | 38,980 | |
| | 3,136 | | | Vicor Corp.* | | | 289,202 | |
| | 1,265 | | | Wabash National Corp. | | | 21,796 | |
| | | | | | | | |
| | | | | | | 8,608,157 | |
| | |
| Commercial & Professional Services – 1.9% | |
| | 3,358 | | | BrightView Holdings, Inc.* | | | 50,773 | |
| | 1,696 | | | Ennis, Inc. | | | 30,274 | |
| | 906 | | | Franklin Covey Co.* | | | 20,177 | |
| | 10,013 | | | HNI Corp. | | | 345,048 | |
| | 2,352 | | | Huron Consulting Group, Inc.* | | | 138,650 | |
| | 21,680 | | | KAR Auction Services, Inc. | | | 403,465 | |
| | 888 | | | Matthews International Corp. Class A | | | 26,107 | |
| | 8,321 | | | McGrath RentCorp | | | 558,339 | |
| | 10,342 | | | Steelcase, Inc. Class A | | | 140,134 | |
| | 1,861 | | | Team, Inc.* | | | 20,285 | |
| | 1,002 | | | UniFirst Corp. | | | 212,113 | |
| | | | | | | | |
| | | | | | | 1,945,365 | |
| | |
| | |
| 8 | | The accompanying notes are an integral part of these financial statements. |
GOLDMAN SACHS VARIABLE INSURANCE TRUST SMALL CAP EQUITY INSIGHTS FUND
| | | | | | | | |
Shares | | | Description | | Value | |
|
| Common Stocks – (continued) | |
| Consumer Durables & Apparel – 3.0% | |
| | 644 | | | Acushnet Holdings Corp. | | $ | 26,108 | |
| | 3,622 | | | Century Communities, Inc.* | | | 158,571 | |
| | 4,254 | | | Crocs, Inc.* | | | 266,556 | |
| | 10,839 | | | G-III Apparel Group Ltd.* | | | 257,318 | |
| | 2,375 | | | KB Home | | | 79,610 | |
| | 9,717 | | | M/I Homes, Inc.* | | | 430,366 | |
| | 1,781 | | | Meritage Homes Corp.* | | | 147,502 | |
| | 2,530 | | | Nautilus, Inc.* | | | 45,894 | |
| | 12,905 | | | Sonos, Inc.* | | | 301,848 | |
| | 4,160 | | | Sturm Ruger & Co., Inc. | | | 270,691 | |
| | 3,993 | | | Taylor Morrison Home Corp.* | | | 102,420 | |
| | 26,587 | | | TRI Pointe Group, Inc.* | | | 458,626 | |
| | 2,855 | | | Universal Electronics, Inc.* | | | 149,773 | |
| | 14,193 | | | Vista Outdoor, Inc.* | | | 337,226 | |
| | | | | | | | |
| | | | | | | 3,032,509 | |
| | |
| Consumer Services – 4.2% | |
| | 1,608 | | | Bally’s Corp.* | | | 80,770 | |
| | 5,529 | | | Caesars Entertainment, Inc.* | | | 410,639 | |
| | 545 | | | Chuy’s Holdings, Inc.* | | | 14,437 | |
| | 4,589 | | | Dine Brands Global, Inc. | | | 266,162 | |
| | 8,279 | | | El Pollo Loco Holdings, Inc.* | | | 149,850 | |
| | 4,972 | | | Fiesta Restaurant Group, Inc.* | | | 56,681 | |
| | 15,234 | | | International Game Technology plc | | | 258,064 | |
| | 1,660 | | | Marriott Vacations Worldwide Corp. | | | 227,785 | |
| | 2,493 | | | Monarch Casino & Resort, Inc.* | | | 152,622 | |
| | 528 | | | Nathan’s Famous, Inc. | | | 29,156 | |
| | 2,767 | | | Noodles & Co.* | | | 21,859 | |
| | 7,030 | | | Penn National Gaming, Inc.* | | | 607,181 | |
| | 24,168 | | | Red Rock Resorts, Inc. Class A | | | 605,167 | |
| | 4,723 | | | Stride, Inc.* | | | 100,269 | |
| | 8,386 | | | Texas Roadhouse, Inc. | | | 655,450 | |
| | 4,735 | | | Wingstop, Inc.(a) | | | 627,624 | |
| | | | | | | | |
| | | | | | | 4,263,716 | |
| | |
| Diversified Financials – 5.1% | |
| | 50,126 | | | Anworth Mortgage Asset Corp. (REIT) | | | 135,841 | |
| | 5,279 | | | ARMOUR Residential REIT, Inc. (REIT) | | | 56,960 | |
| | 3,638 | | | Artisan Partners Asset Management, Inc. Class A | | | 183,137 | |
| | 15,045 | | | Banco Latinoamericano de Comercio Exterior SA Class E | | | 238,162 | |
| | 15,611 | | | Capstead Mortgage Corp. (REIT) | | | 90,700 | |
| | 14,886 | | | Chimera Investment Corp. (REIT) | | | 152,581 | |
| | 8,115 | | | Cohen & Steers, Inc. | | | 602,945 | |
| | 11,984 | | | Cowen, Inc. Class A | | | 311,464 | |
| | 7,994 | | | Donnelley Financial Solutions, Inc.* | | | 135,658 | |
| | 934 | | | Encore Capital Group, Inc.* | | | 36,379 | |
| | 11,380 | | | Enova International, Inc.* | | | 281,883 | |
| | 17,629 | | | Federated Hermes, Inc. Class B | | | 509,302 | |
| | 631 | | | FirstCash, Inc. | | | 44,195 | |
| | 2,080 | | | Great Ajax Corp. (REIT) | | | 21,757 | |
| | 2,742 | | | Houlihan Lokey, Inc. | | | 184,345 | |
| | 15,805 | | | Ladder Capital Corp. (REIT) | | | 154,573 | |
| | |
|
| Common Stocks – (continued) | |
| Diversified Financials – (continued) | |
| | 48,563 | | | Navient Corp. | | | 476,889 | |
| | 8,657 | | | Oppenheimer Holdings, Inc. Class A | | | 272,090 | |
| | 31,410 | | | PennyMac Mortgage Investment Trust (REIT) | | | 552,502 | |
| | 8,008 | | | PJT Partners, Inc. Class A | | | 602,602 | |
| | 834 | | | Regional Management Corp. | | | 24,903 | |
| | 750 | | | Stifel Financial Corp. | | | 37,845 | |
| | 638 | | | Virtus Investment Partners, Inc. | | | 138,446 | |
| | | | | | | | |
| | | | | | | 5,245,159 | |
| | |
| Energy – 1.6% | |
| | 8,155 | | | Ardmore Shipping Corp. | | | 26,667 | |
| | 1,607 | | | Bonanza Creek Energy, Inc.* | | | 31,063 | |
| | 6,265 | | | Cactus, Inc. Class A | | | 163,329 | |
| | 2,454 | | | ChampionX Corp.* | | | 37,546 | |
| | 13,079 | | | Clean Energy Fuels Corp.* | | | 102,801 | |
| | 2,594 | | | Diamond S Shipping, Inc.* | | | 17,276 | |
| | 17,389 | | | Green Plains, Inc.* | | | 229,013 | |
| | 4,864 | | | Magnolia Oil & Gas Corp. Class A* | | | 34,340 | |
| | 15,525 | | | Matrix Service Co.* | | | 171,085 | |
| | 13,512 | | | Oil States International, Inc.* | | | 67,830 | |
| | 9,494 | | | Ovintiv, Inc. | | | 136,334 | |
| | 1,157 | | | PDC Energy, Inc.* | | | 23,753 | |
| | 8,474 | | | Scorpio Tankers, Inc. | | | 94,824 | |
| | 16,423 | | | SM Energy Co. | | | 100,509 | |
| | 11,542 | | | World Fuel Services Corp. | | | 359,649 | |
| | | | | | | | |
| | | | | | | 1,596,019 | |
| | |
| Food & Staples Retailing – 1.1% | |
| | 17,175 | | | BJ’s Wholesale Club Holdings, Inc.* | | | 640,284 | |
| | 6,520 | | | Ingles Markets, Inc. Class A | | | 278,143 | |
| | 979 | | | Natural Grocers by Vitamin Cottage, Inc. | | | 13,451 | |
| | 2,933 | | | SpartanNash Co. | | | 51,064 | |
| | 2,167 | | | Weis Markets, Inc. | | | 103,604 | |
| | | | | | | | |
| | | | | | | 1,086,546 | |
| | |
| Food, Beverage & Tobacco – 1.2% | |
| | 3,743 | | | Celsius Holdings, Inc.* | | | 188,310 | |
| | 8,566 | | | Darling Ingredients, Inc.* | | | 494,087 | |
| | 3,173 | | | John B Sanfilippo & Son, Inc. | | | 250,223 | |
| | 1,707 | | | Seneca Foods Corp. Class A* | | | 68,109 | |
| | 17,762 | | | Vector Group Ltd. | | | 206,927 | |
| | | | | | | | |
| | | | | | | 1,207,656 | |
| | |
| Health Care Equipment & Services – 5.3% | |
| | 1,496 | | | Addus HomeCare Corp.* | | | 175,167 | |
| | 560 | | | Cantel Medical Corp. | | | 44,162 | |
| | 22,958 | | | Community Health Systems, Inc.* | | | 170,578 | |
| | 961 | | | Computer Programs and Systems, Inc. | | | 25,793 | |
| | 3,290 | | | CONMED Corp. | | | 368,480 | |
| | 1,396 | | | Covetrus, Inc.* | | | 40,121 | |
| | 6,679 | | | Five Star Senior Living, Inc.* | | | 46,085 | |
| | 3,067 | | | GenMark Diagnostics, Inc.* | | | 44,778 | |
| | 3,603 | | | Hanger, Inc.* | | | 79,230 | |
| | |
| | |
| The accompanying notes are an integral part of these financial statements. | | 9 |
GOLDMAN SACHS VARIABLE INSURANCE TRUST SMALL CAP EQUITY INSIGHTS FUND
Schedule of Investments (continued)
December 31, 2020
| | | | | | | | |
Shares | | | Description | | Value | |
|
| Common Stocks – (continued) | |
| Health Care Equipment & Services – (continued) | |
| | 4,170 | | | InfuSystem Holdings, Inc.* | | $ | 78,313 | |
| | 8,035 | | | Inovalon Holdings, Inc. Class A* | | | 145,996 | |
| | 8,799 | | | Integer Holdings Corp.* | | | 714,391 | |
| | 3,838 | | | Invacare Corp. | | | 34,350 | |
| | 9,993 | | | Joint Corp. (The)* | | | 262,416 | |
| | 2,169 | | | LHC Group, Inc.* | | | 462,691 | |
| | 5,236 | | | Meridian Bioscience, Inc.* | | | 97,861 | |
| | 5,853 | | | Merit Medical Systems, Inc.* | | | 324,900 | |
| | 732 | | | National HealthCare Corp. | | | 48,612 | |
| | 15,051 | | | Natus Medical, Inc.* | | | 301,622 | |
| | 3,534 | | | NextGen Healthcare, Inc.* | | | 64,460 | |
| | 5,774 | | | Option Care Health, Inc.* | | | 90,305 | |
| | 1,448 | | | Owens & Minor, Inc. | | | 39,168 | |
| | 518 | | | Schrodinger, Inc.* | | | 41,015 | |
| | 25,559 | | | Select Medical Holdings Corp.* | | | 706,962 | |
| | 5,937 | | | Surmodics, Inc.* | | | 258,378 | |
| | 16,408 | | | Tenet Healthcare Corp.* | | | 655,172 | |
| | 802 | | | US Physical Therapy, Inc. | | | 96,441 | |
| | 127 | | | Utah Medical Products, Inc. | | | 10,706 | |
| | | | | | | | |
| | | | | | | 5,428,153 | |
| | |
| Household & Personal Products – 0.3% | |
| | 2,357 | | | Central Garden & Pet Co. Class A* | | | 85,630 | |
| | 1,209 | | | Medifast, Inc. | | | 237,375 | |
| | | | | | | | |
| | | | | | | 323,005 | |
| | |
| Insurance – 2.8% | |
| | 21,859 | | | American Equity Investment Life Holding Co. | | | 604,620 | |
| | 1,840 | | | AMERISAFE, Inc. | | | 105,671 | |
| | 3,459 | | | Argo Group International Holdings Ltd. | | | 151,158 | |
| | 888 | | | Enstar Group Ltd.* | | | 181,942 | |
| | 51,572 | | | Genworth Financial, Inc. Class A* | | | 194,942 | |
| | 1,720 | | | Goosehead Insurance, Inc. Class A | | | 214,587 | |
| | 144 | | | Investors Title Co. | | | 22,032 | |
| | 905 | | | James River Group Holdings Ltd. | | | 44,481 | |
| | 1,264 | | | Kinsale Capital Group, Inc. | | | 252,964 | |
| | 170 | | | National Western Life Group, Inc. Class A | | | 35,095 | |
| | 12,266 | | | Stewart Information Services Corp. | | | 593,184 | |
| | 3,674 | | | Trupanion, Inc.* | | | 439,815 | |
| | | | | | | | |
| | | | | | | 2,840,491 | |
| | |
| Materials – 6.0% | |
| | 33,141 | | | Alcoa Corp.* | | | 763,900 | |
| | 1,265 | | | Arconic Corp.* | | | 37,697 | |
| | 3,029 | | | Balchem Corp. | | | 349,001 | |
| | 12,462 | | | Boise Cascade Co. | | | 595,684 | |
| | 1,827 | | | Clearwater Paper Corp.* | | | 68,969 | |
| | 9,596 | | | Coeur Mining, Inc.* | | | 99,319 | |
| | 29,858 | | | Ferro Corp.* | | | 436,822 | |
| | 5,575 | | | Forterra, Inc.* | | | 95,862 | |
| | 8,502 | | | Glatfelter Corp. | | | 139,263 | |
| | 5,634 | | | Haynes International, Inc. | | | 134,315 | |
| | |
|
| Common Stocks – (continued) | |
| Materials – (continued) | |
| | 10,594 | | | Hecla Mining Co. | | | 68,649 | |
| | 7,212 | | | Ingevity Corp.* | | | 546,165 | |
| | 10,045 | | | Koppers Holdings, Inc.* | | | 313,002 | |
| | 6,326 | | | Kraton Corp.* | | | 175,799 | |
| | 21,518 | | | Louisiana-Pacific Corp. | | | 799,824 | |
| | 8,438 | | | Minerals Technologies, Inc. | | | 524,169 | |
| | 3,321 | | | Myers Industries, Inc. | | | 69,010 | |
| | 22,989 | | | O-I Glass, Inc. | | | 273,569 | |
| | 1,804 | | | Orion Engineered Carbons SA | | | 30,921 | |
| | 26,134 | | | Summit Materials, Inc. Class A* | | | 524,771 | |
| | 6,511 | | | TimkenSteel Corp.* | | | 30,406 | |
| | 1,430 | | | Tronox Holdings plc Class A | | | 20,907 | |
| | 1,229 | | | Worthington Industries, Inc. | | | 63,097 | |
| | | | | | | | |
| | | | | | | 6,161,121 | |
| | |
| Media & Entertainment – 2.5% | |
| | 1,389 | | | Cardlytics, Inc.* | | | 198,307 | |
| | 9,071 | | | Cargurus, Inc.* | | | 287,823 | |
| | 21,529 | | | Cars.com, Inc.* | | | 243,278 | |
| | 3,819 | | | EverQuote, Inc. Class A* | | | 142,640 | |
| | 6,985 | | | EW Scripps Co. (The) Class A | | | 106,801 | |
| | 3,687 | | | Gaia, Inc.* | | | 36,428 | |
| | 45,315 | | | Glu Mobile, Inc.* | | | 408,288 | |
| | 23,062 | | | Gray Television, Inc.* | | | 412,579 | |
| | 572 | | | Loral Space & Communications, Inc. | | | 12,006 | |
| | 6,958 | | | QuinStreet, Inc.* | | | 149,179 | |
| | 7,972 | | | TechTarget, Inc.* | | | 471,225 | |
| | 2,834 | | | TEGNA, Inc. | | | 39,534 | |
| | | | | | | | |
| | | | | | | 2,508,088 | |
| | |
| Pharmaceuticals, Biotechnology & Life Sciences – 12.0% | |
| | 325 | | | ALX Oncology Holdings, Inc.* | | | 28,015 | |
| | 17,913 | | | Amicus Therapeutics, Inc.* | | | 413,611 | |
| | 14,759 | | | Amneal Pharmaceuticals, Inc.* | | | 67,449 | |
| | 15,192 | | | Amphastar Pharmaceuticals, Inc.* | | | 305,511 | |
| | 6,571 | | | ANI Pharmaceuticals, Inc.* | | | 190,822 | |
| | 2,218 | | | Apellis Pharmaceuticals, Inc.* | | | 126,870 | |
| | 429 | | | Arcturus Therapeutics Holdings, Inc.* | | | 18,610 | |
| | 1,600 | | | Arrowhead Pharmaceuticals, Inc.* | | | 122,768 | |
| | 987 | | | Arvinas, Inc.* | | | 83,826 | |
| | 10,840 | | | Atara Biotherapeutics, Inc.* | | | 212,789 | |
| | 8,636 | | | Avid Bioservices, Inc.* | | | 99,659 | |
| | 53,362 | | | BioDelivery Sciences International, Inc.* | | | 224,120 | |
| | 673 | | | Blueprint Medicines Corp.* | | | 75,477 | |
| | 41,550 | | | Catalyst Pharmaceuticals, Inc.* | | | 138,777 | |
| | 2,125 | | | ChemoCentryx, Inc.* | | | 131,580 | |
| | 2,250 | | | Collegium Pharmaceutical, Inc.* | | | 45,067 | |
| | 1,079 | | | Cortexyme, Inc.*(b) | | | 29,975 | |
| | 10,917 | | | CytomX Therapeutics, Inc.* | | | 71,506 | |
| | 1,065 | | | Eagle Pharmaceuticals, Inc.* | | | 49,597 | |
| | 3,335 | | | Editas Medicine, Inc.* | | | 233,817 | |
| | 10,962 | | | Eiger BioPharmaceuticals, Inc.* | | | 134,723 | |
| | 7,891 | | | Emergent BioSolutions, Inc.* | | | 707,034 | |
| | 4,913 | | | Fate Therapeutics, Inc.* | | | 446,739 | |
| | |
| | |
| 10 | | The accompanying notes are an integral part of these financial statements. |
GOLDMAN SACHS VARIABLE INSURANCE TRUST SMALL CAP EQUITY INSIGHTS FUND
| | | | | | | | |
Shares | | | Description | | Value | |
|
| Common Stocks – (continued) | |
| Pharmaceuticals, Biotechnology & Life Sciences – (continued) | |
| | 987 | | | FibroGen, Inc.* | | $ | 36,608 | |
| | 5,181 | | | G1 Therapeutics, Inc.* | | | 93,206 | |
| | 1,388 | | | Harpoon Therapeutics, Inc.* | | | 23,055 | |
| | 9,171 | | | Harrow Health, Inc.* | | | 62,913 | |
| | 510 | | | IGM Biosciences, Inc.*(b) | | | 45,028 | |
| | 6,736 | | | Immunovant, Inc.* | | | 311,136 | |
| | 21,849 | | | Innoviva, Inc.* | | | 270,709 | |
| | 2,106 | | | Insmed, Inc.* | | | 70,109 | |
| | 4,812 | | | Intellia Therapeutics, Inc.* | | | 261,773 | |
| | 5,673 | | | Intercept Pharmaceuticals, Inc.* | | | 140,123 | |
| | 1,353 | | | Intersect ENT, Inc.* | | | 30,984 | |
| | 1,201 | | | Invitae Corp.* | | | 50,214 | |
| | 1,052 | | | iTeos Therapeutics, Inc.* | | | 35,579 | |
| | 27,698 | | | Kadmon Holdings, Inc.* | | | 114,947 | |
| | 9,437 | | | Kura Oncology, Inc.* | | | 308,212 | |
| | 9,236 | | | MEI Pharma, Inc.* | | | 24,383 | |
| | 16,675 | | | Minerva Neurosciences, Inc.* | | | 39,019 | |
| | 3,039 | | | Mirati Therapeutics, Inc.* | | | 667,486 | |
| | 643 | | | Morphic Holding, Inc.* | | | 21,573 | |
| | 16,594 | | | Myriad Genetics, Inc.* | | | 328,146 | |
| | 6,999 | | | Natera, Inc.* | | | 696,540 | |
| | 2,407 | | | NextCure, Inc.* | | | 26,236 | |
| | 1,756 | | | Novavax, Inc.* | | | 195,812 | |
| | 3,054 | | | Ocular Therapeutix, Inc.* | | | 63,218 | |
| | 1,865 | | | Odonate Therapeutics, Inc.* | | | 35,808 | |
| | 63,490 | | | OPKO Health, Inc.*(b) | | | 250,786 | |
| | 1,930 | | | Pacira BioSciences, Inc.* | | | 115,491 | |
| | 7,137 | | | Phibro Animal Health Corp. Class A | | | 138,601 | |
| | 1,891 | | | Precision BioSciences, Inc.* | | | 15,771 | |
| | 14,989 | | | Prestige Consumer Healthcare, Inc.* | | | 522,666 | |
| | 7,854 | | | Prothena Corp. plc* | | | 94,327 | |
| | 3,383 | | | REGENXBIO, Inc.* | | | 153,453 | |
| | 1,739 | | | Relay Therapeutics, Inc.* | | | 72,273 | |
| | 3,955 | | | REVOLUTION Medicines, Inc.* | | | 156,578 | |
| | 858 | | | Rocket Pharmaceuticals, Inc.* | | | 47,053 | |
| | 7,885 | | | Sangamo Therapeutics, Inc.* | | | 123,045 | |
| | 622 | | | Scholar Rock Holding Corp.* | | | 30,186 | |
| | 17,204 | | | Selecta Biosciences, Inc.*(b) | | | 52,128 | |
| | 14,286 | | | SIGA Technologies, Inc.* | | | 103,859 | |
| | 8,879 | | | Sorrento Therapeutics, Inc.*(b) | | | 60,599 | |
| | 2,059 | | | SpringWorks Therapeutics, Inc.* | | | 149,319 | |
| | 6,592 | | | Syros Pharmaceuticals, Inc.* | | | 71,523 | |
| | 2,617 | | | TG Therapeutics, Inc.* | | | 136,136 | |
| | 8,411 | | | Translate Bio, Inc.* | | | 155,015 | |
| | 3,517 | | | Twist Bioscience Corp.* | | | 496,917 | |
| | 2,294 | | | Ultragenyx Pharmaceutical, Inc.* | | | 317,558 | |
| | 7,509 | | | Veracyte, Inc.* | | | 367,490 | |
| | 13,916 | | | Xencor, Inc.* | | | 607,155 | |
| | 2,900 | | | Y-mAbs Therapeutics, Inc.* | | | 143,579 | |
| | | | | | | | |
| | | | | | | 12,292,667 | |
| | |
| Real Estate – 7.9% | |
| | 12,772 | | | American Assets Trust, Inc. (REIT) | | | 368,855 | |
| | 28,464 | | | CareTrust REIT, Inc. (REIT) | | | 631,332 | |
| | 31,630 | | | City Office REIT, Inc. (REIT) | | | 309,025 | |
| | |
|
| Common Stocks – (continued) | |
| Real Estate – (continued) | |
| | 6,053 | | | Community Healthcare Trust, Inc. (REIT) | | | 285,157 | |
| | 3,780 | | | EastGroup Properties, Inc. (REIT) | | | 521,867 | |
| | 16,839 | | | Four Corners Property Trust, Inc. (REIT) | | | 501,297 | |
| | 6,897 | | | Gladstone Commercial Corp. (REIT) | | | 124,146 | |
| | 17,433 | | | Independence Realty Trust, Inc. (REIT) | | | 234,125 | |
| | 7,149 | | | Industrial Logistics Properties Trust (REIT) | | | 166,500 | |
| | 31,636 | | | Lexington Realty Trust (REIT) | | | 335,974 | |
| | 15,907 | | | National Storage Affiliates Trust (REIT) | | | 573,129 | |
| | 12,696 | | | NexPoint Residential Trust, Inc. (REIT) | | | 537,168 | |
| | 26,108 | | | Physicians Realty Trust (REIT) | | | 464,722 | |
| | 9,834 | | | PotlatchDeltic Corp. (REIT) | | | 491,897 | |
| | 889 | | | RE/MAX Holdings, Inc. Class A | | | 32,297 | |
| | 7,901 | | | Redfin Corp.* | | | 542,246 | |
| | 22,128 | | | Retail Opportunity Investments Corp. (REIT) | | | 296,294 | |
| | 5,396 | | | Retail Properties of America, Inc. Class A (REIT) | | | 46,190 | |
| | 7,470 | | | Retail Value, Inc. (REIT) | | | 111,079 | |
| | 38,520 | | | Sabra Health Care REIT, Inc. (REIT) | | | 669,092 | |
| | 11,815 | | | Terreno Realty Corp. (REIT) | | | 691,296 | |
| | 431 | | | Universal Health Realty Income Trust (REIT) | | | 27,700 | |
| | 5,086 | | | Urban Edge Properties (REIT) | | | 65,813 | |
| | 2,529 | | | Whitestone REIT (REIT) | | | 20,156 | |
| | | | | | | | |
| | | | | | | 8,047,357 | |
| | |
| Retailing – 4.2% | |
| | 30,017 | | | Abercrombie & Fitch Co. Class A | | | 611,146 | |
| | 8,621 | | | At Home Group, Inc.* | | | 133,281 | |
| | 4,029 | | | Bed Bath & Beyond, Inc.(b) | | | 71,555 | |
| | 6,986 | | | Big Lots, Inc. | | | 299,909 | |
| | 2,767 | | | Caleres, Inc. | | | 43,303 | |
| | 12,995 | | | Camping World Holdings, Inc. Class A | | | 338,520 | |
| | 10,112 | | | Haverty Furniture Cos., Inc. | | | 279,799 | |
| | 801 | | | Lithia Motors, Inc. Class A | | | 234,429 | |
| | 4,353 | | | Lumber Liquidators Holdings, Inc.* | | | 133,811 | |
| | 4,267 | | | Magnite, Inc.* | | | 131,040 | |
| | 9,948 | | | MarineMax, Inc.* | | | 348,478 | |
| | 1,067 | | | RH* | | | 477,504 | |
| | 35,569 | | | Sportsman’s Warehouse Holdings, Inc.* | | | 624,236 | |
| | 1,923 | | | Stamps.com, Inc.* | | | 377,273 | |
| | 4,311 | | | Zumiez, Inc.* | | | 158,559 | |
| | | | | | | | |
| | | | | | | 4,262,843 | |
| | |
| Semiconductors & Semiconductor Equipment – 2.5% | |
| | 1,857 | | | Advanced Energy Industries, Inc.* | | | 180,073 | |
| | 4,237 | | | Ambarella, Inc.* | | | 389,041 | |
| | 15,717 | | | Axcelis Technologies, Inc.* | | | 457,679 | |
| | 2,251 | | | CEVA, Inc.* | | | 102,421 | |
| | |
| | |
| The accompanying notes are an integral part of these financial statements. | | 11 |
GOLDMAN SACHS VARIABLE INSURANCE TRUST SMALL CAP EQUITY INSIGHTS FUND
Schedule of Investments (continued)
December 31, 2020
| | | | | | | | |
Shares | | | Description | | Value | |
|
| Common Stocks – (continued) | |
| Semiconductors & Semiconductor Equipment – (continued) | |
| | 7,687 | | | MACOM Technology Solutions Holdings, Inc.* | | $ | 423,093 | |
| | 25,177 | | | NeoPhotonics Corp.* | | | 228,859 | |
| | 2,523 | | | Photronics, Inc.* | | | 28,157 | |
| | 16,826 | | | Rambus, Inc.* | | | 293,782 | |
| | 919 | | | SiTime Corp.* | | | 102,864 | |
| | 9,216 | | | Ultra Clean Holdings, Inc.* | | | 287,078 | |
| | 4,665 | | | Veeco Instruments, Inc.* | | | 80,984 | |
| | | | | | | | |
| | | | | | | 2,574,031 | |
| | |
| Software & Services – 7.3% | |
| | 1,217 | | | 8x8, Inc.* | | | 41,950 | |
| | 4,372 | | | A10 Networks, Inc.* | | | 43,108 | |
| | 1,165 | | | Agilysys, Inc.* | | | 44,713 | |
| | 1,035 | | | Appian Corp.*(b) | | | 167,763 | |
| | 392 | | | Blackline, Inc.* | | | 52,285 | |
| | 4,054 | | | Bottomline Technologies DE, Inc.* | | | 213,808 | |
| | 30,637 | | | Box, Inc. Class A* | | | 552,998 | |
| | 5,669 | | | Brightcove, Inc.* | | | 104,310 | |
| | 273 | | | Cerence, Inc.* | | | 27,431 | |
| | 18,208 | | | ChannelAdvisor Corp.* | | | 290,964 | |
| | 37,682 | | | Cloudera, Inc.* | | | 524,157 | |
| | 33,171 | | | Conduent, Inc.* | | | 159,221 | |
| | 4,114 | | | Digital Turbine, Inc.* | | | 232,688 | |
| | 4,836 | | | Domo, Inc. Class B* | | | 308,392 | |
| | 14,956 | | | EVERTEC, Inc. | | | 588,070 | |
| | 1,378 | | | Hackett Group, Inc. (The) | | | 19,829 | |
| | 3,580 | | | Model N, Inc.* | | | 127,734 | |
| | 11,417 | | | Perficient, Inc.* | | | 544,020 | |
| | 16,432 | | | Perspecta, Inc. | | | 395,683 | |
| | 1,683 | | | QAD, Inc. Class A | | | 106,332 | |
| | 15,601 | | | Sapiens International Corp. NV | | | 477,547 | |
| | 24,649 | | | SVMK, Inc.* | | | 629,782 | |
| | 8,517 | | | Sykes Enterprises, Inc.* | | | 320,835 | |
| | 2,323 | | | TTEC Holdings, Inc. | | | 169,416 | |
| | 2,601 | | | Upland Software, Inc.* | | | 119,360 | |
| | 5,241 | | | Varonis Systems, Inc.* | | | 857,480 | |
| | 2,353 | | | Verint Systems, Inc.* | | | 158,074 | |
| | 3,435 | | | Xperi Holding Corp. | | | 71,791 | |
| | 11,026 | | | Zuora, Inc. Class A* | | | 153,592 | |
| | | | | | | | |
| | | | | | | 7,503,333 | |
| | |
| Technology Hardware & Equipment – 5.3% | |
| | 2,257 | | | Avid Technology, Inc.* | | | 35,819 | |
| | 9,078 | | | Belden, Inc. | | | 380,368 | |
| | 9,978 | | | Benchmark Electronics, Inc. | | | 269,506 | |
| | 5,694 | | | Calix, Inc.* | | | 169,454 | |
| | 6,615 | | | CTS Corp. | | | 227,093 | |
| | 7,392 | | | Fabrinet* | | | 573,545 | |
| | 4,125 | | | Intevac, Inc.* | | | 29,741 | |
| | 30,818 | | | Knowles Corp.* | | | 567,976 | |
| | 13,040 | | | NETGEAR, Inc.* | | | 529,815 | |
| | 4,827 | | | Novanta, Inc.* | | | 570,648 | |
| | 1,643 | | | Plexus Corp.* | | | 128,499 | |
| | |
|
| Common Stocks – (continued) | |
| Technology Hardware & Equipment – (continued) | |
| | 624 | | | Rogers Corp.* | | | 96,901 | |
| | 1,508 | | | Super Micro Computer, Inc.* | | | 47,743 | |
| | 43,572 | | | TTM Technologies, Inc.* | | | 601,076 | |
| | 21,425 | | | Viavi Solutions, Inc.* | | | 320,839 | |
| | 31,179 | | | Vishay Intertechnology, Inc. | | | 645,717 | |
| | 7,269 | | | Vishay Precision Group, Inc.* | | | 228,828 | |
| | | | | | | | |
| | | | | | | 5,423,568 | |
| | |
| Telecommunication Services – 1.7% | |
| | 12,088 | | | Consolidated Communications Holdings, Inc.* | | | 59,110 | |
| | 19,521 | | | Iridium Communications, Inc.* | | | 767,663 | |
| | 16,337 | | | Ooma, Inc.* | | | 235,253 | |
| | 60,799 | | | ORBCOMM, Inc.* | | | 451,129 | |
| | 13,947 | | | Vonage Holdings Corp.* | | | 179,568 | |
| | | | | | | | |
| | | | | | | 1,692,723 | |
| | |
| Transportation – 2.0% | |
| | 2,561 | | | Avis Budget Group, Inc.* | | | 95,525 | |
| | 7,947 | | | Costamare, Inc. | | | 65,801 | |
| | 6,410 | | | Daseke, Inc.* | | | 37,242 | |
| | 11,644 | | | Echo Global Logistics, Inc.* | | �� | 312,292 | |
| | 29,295 | | | Marten Transport Ltd. | | | 504,753 | |
| | 5,898 | | | SEACOR Holdings, Inc.* | | | 244,472 | |
| | 5,553 | | | SkyWest, Inc. | | | 223,842 | |
| | 643 | | | Universal Logistics Holdings, Inc. | | | 13,239 | |
| | 13,289 | | | Werner Enterprises, Inc. | | | 521,195 | |
| | | | | | | | |
| | | | | | | 2,018,361 | |
| | |
| Utilities – 1.0% | |
| | 677 | | | Black Hills Corp. | | | 41,602 | |
| | 5,650 | | | Genie Energy Ltd. Class B | | | 40,736 | |
| | 2,717 | | | Northwest Natural Holding Co. | | | 124,955 | |
| | 10,665 | | | NorthWestern Corp. | | | 621,876 | |
| | 2,432 | | | Southwest Gas Holdings, Inc. | | | 147,744 | |
| | 716 | | | Spire, Inc. | | | 45,853 | |
| | | | | | | | |
| | | | | | | 1,022,766 | |
| | |
| | TOTAL COMMON STOCKS | |
| | (Cost $84,773,262) | | $ | 99,607,974 | |
| | |
| | |
| Shares | | | Dividend
Rate | | Value | |
|
| Investment Company(c) – 1.0% | |
| Goldman Sachs Financial Square Government Fund —
Institutional Shares |
|
| | 1,017,248 | | | 0.026% | | $ | 1,017,248 | |
| | (Cost $1,017,248) | |
| | |
| TOTAL INVESTMENTS BEFORE SECURITIES LENDING
REINVESTMENT VEHICLE |
|
| | (Cost $85,790,510) | | $ | 100,625,222 | |
| | |
| | |
| 12 | | The accompanying notes are an integral part of these financial statements. |
GOLDMAN SACHS VARIABLE INSURANCE TRUST SMALL CAP EQUITY INSIGHTS FUND
| | | | | | | | |
| Shares | | | Dividend
Rate | | Value | |
|
| Securities Lending Reinvestment Vehicle(c) – 0.6% | |
| Goldman Sachs Financial Square Government Fund —
Institutional Shares |
|
| | 639,178 | | | 0.026% | | $ | 639,178 | |
| | (Cost $639,178) | |
| | |
| | TOTAL INVESTMENTS – 99.2% | | | | |
| | (Cost $86,429,688) | | $ | 101,264,400 | |
| | |
| OTHER ASSETS IN EXCESS OF
LIABILITIES – 0.8% | | | 861,695 | |
| | |
| | NET ASSETS – 100.0% | | $ | 102,126,095 | |
| | |
| | |
| The percentage shown for each investment category reflects the value of investments in that category as a percentage of net assets. |
| |
| * | | Security is currently in default and/or non-income producing. |
| |
| (a) | | All or a portion of security is segregated as collateral for initial margin requirements on futures transactions. |
| |
| (b) | | All or a portion of security is on loan. |
| |
| (c) | | Represents an Affiliated Issuer. |
| | |
| |
| Investment Abbreviation: |
| REIT | | —Real Estate Investment Trust |
ADDITIONAL INVESTMENT INFORMATION
FUTURES CONTRACTS — At December 31, 2020, the Fund had the following futures contracts:
| | | | | | | | | | | | | | | | |
| Description | | Number of
Contracts | | | Expiration Date | | | Notional
Amount | | | Unrealized
Appreciation/
(Depreciation) | |
Long position contracts: | | | | | | | | | | | | | | | | |
| Russell 2000 E-Mini Index | | | 18 | | | | 03/19/2021 | | | $ | 1,777,320 | | | $ | 53,805 | |
| | |
| The accompanying notes are an integral part of these financial statements. | | 13 |
GOLDMAN SACHS VARIABLE INSURANCE TRUST SMALL CAP EQUITY INSIGHTS FUND
Statement of Assets and Liabilities
December 31, 2020
| | | | |
| | | | |
| Assets: | | | |
Investments in unaffiliated issuers, at value (cost $84,773,262)(a) | | $ | 99,607,974 | |
Investments in affiliated issuers, at value (cost $1,017,248) | | | 1,017,248 | |
Investments in affiliated securities lending reinvestment vehicle, at value (cost $639,178) | | | 639,178 | |
Cash | | | 1,648,725 | |
Receivables: | | | | |
Dividends | | | 84,931 | |
Reimbursement from investment adviser | | | 27,352 | |
Fund shares sold | | | 8,274 | |
Securities lending income | | | 1,249 | |
Other assets | | | 481 | |
| |
| Total assets | | | 103,035,412 | |
| | | | |
| | | | |
| Liabilities: | | | |
Variation margin on futures | | | 1,530 | |
Payables: | | | | |
Payable upon return of securities loaned | | | 639,178 | |
Fund shares redeemed | | | 100,492 | |
Management fees | | | 59,573 | |
Distribution and Service fees and Transfer Agency fees | | | 5,343 | |
Accrued expenses | | | 103,201 | |
| |
| Total liabilities | | | 909,317 | |
| | | | |
| | | | |
| Net Assets: | | | |
Paid-in capital | | | 84,403,547 | |
Total distributable earnings (loss) | | | 17,722,548 | |
| |
| NET ASSETS | | $ | 102,126,095 | |
Net Assets: | | | | |
Institutional | | $ | 84,887,170 | |
Service | | | 17,238,925 | |
| |
Total Net Assets | | $ | 102,126,095 | |
Shares outstanding $0.001 par value (unlimited shares authorized): | | | | |
Institutional | | | 6,281,308 | |
Service | | | 1,287,339 | |
Net asset value, offering and redemption price per share: | | | | |
Institutional | | | $13.51 | |
Service | | | 13.39 | |
(a) Includes loaned securities having a market value of $601,884.
| | |
| 14 | | The accompanying notes are an integral part of these financial statements. |
GOLDMAN SACHS VARIABLE INSURANCE TRUST SMALL CAP EQUITY INSIGHTS FUND
Statement of Operations
For the Fiscal Year Ended December 31, 2020
| | | | |
| | | | |
| Investment income: | | | |
Dividends — unaffiliated issuers (net of foreign taxes withheld of $2,177) | | $ | 1,030,144 | |
Securities lending income — affiliated issuer | | | 29,224 | |
Dividends — affiliated issuers | | | 531 | |
Interest | | | 215 | |
| |
| Total investment income | | | 1,060,114 | |
| | | | |
| | | | |
| Expenses: | | | |
Management fees | | | 582,184 | |
Professional fees | | | 105,543 | |
Custody, accounting and administrative services | | | 88,634 | |
Printing and mailing costs | | | 66,680 | |
Distribution and Service (12b-1) fees | | | 35,603 | |
Trustee fees | | | 20,590 | |
Transfer Agency fees(a) | | | 16,632 | |
Other | | | 14,570 | |
| |
| Total expenses | | | 930,436 | |
| |
Less — expense reductions | | | (221,195 | ) |
| |
| Net expenses | | | 709,241 | |
| |
| NET INVESTMENT INCOME | | | 350,873 | |
| | | | |
| | | | |
| Realized and unrealized gain: | | | |
Net realized gain from: | | | | |
Investments — unaffiliated issuers | | | 2,288,624 | |
Futures contracts | | | 453,767 | |
Net change in unrealized gain on: | | | | |
Investments — unaffiliated issuers | | | 5,269,352 | |
Futures contracts | | | 53,805 | |
| |
| Net realized and unrealized gain | | | 8,065,548 | |
| |
| NET INCREASE IN NET ASSETS RESULTING FROM OPERATIONS | | $ | 8,416,421 | |
| | | | |
(a) Institutional and Service Shares incurred Transfer Agency fees of $13,784 and $2,848, respectively.
| | |
| The accompanying notes are an integral part of these financial statements. | | 15 |
GOLDMAN SACHS VARIABLE INSURANCE TRUST SMALL CAP EQUITY INSIGHTS FUND
Statements of Changes in Net Assets
| | | | | | | | |
| | | For the
Fiscal Year Ended
December 31, 2020 | | | For the
Fiscal Year Ended
December 31, 2019 | |
| | | | | | | | |
| From operations: | | | | | | |
Net investment income | | $ | 350,873 | | | $ | 436,162 | |
Net realized gain | | | 2,742,391 | | | | 2,941,341 | |
Net change in unrealized gain | | | 5,323,157 | | | | 16,880,731 | |
| | |
| Net increase in net assets resulting from operations | | | 8,416,421 | | | | 20,258,234 | |
| | | | | | | | |
| | | | | | | | |
| Distributions to shareholders: | | | | | | |
From distributable earnings: | | | | | | | | |
Institutional Shares | | | (1,169,326 | ) | | | (1,999,868 | ) |
Service Shares | | | (210,446 | ) | | | (360,700 | ) |
| | |
| Total distributions to shareholders | | | (1,379,772 | ) | | | (2,360,568 | ) |
| | | | | | | | |
| | | | | | | | |
| From share transactions: | | | | | | |
Proceeds from sales of shares | | | 12,162,071 | | | | 10,139,106 | |
Reinvestment of distributions | | | 1,379,772 | | | | 2,360,567 | |
Cost of shares redeemed | | | (13,986,049 | ) | | | (20,351,399 | ) |
| | |
| Net decrease in net assets resulting from share transactions | | | (444,206 | ) | | | (7,851,726 | ) |
| | |
| TOTAL INCREASE | | | 6,592,443 | | | | 10,045,940 | |
| | | | | | | | |
| | | | | | | | |
| Net Assets: | | | | | | |
| | |
Beginning of year | | | 95,533,652 | | | | 85,487,712 | |
| | |
End of year | | $ | 102,126,095 | | | $ | 95,533,652 | |
| | |
| 16 | | The accompanying notes are an integral part of these financial statements. |
GOLDMAN SACHS VARIABLE INSURANCE TRUST SMALL CAP EQUITY INSIGHTS FUND
Financial Highlights
Selected Data for a Share Outstanding Throughout Each Year
| | | | | | | | | | | | | | | | | | | | |
| | | Goldman Sachs Small Cap Equity Insights Fund | |
| | | Institutional Shares | |
| | | Year Ended December 31, | |
| | | 2020 | | | 2019 | | | 2018 | | | 2017 | | | 2016 | |
| | | | | | | | | | | | | | | | | | | | |
| Per Share Data | | | | | | | | | | | | | | | |
| | | | | |
Net asset value, beginning of year | | $ | 12.62 | | | $ | 10.37 | | | $ | 13.66 | | | $ | 13.79 | | | $ | 11.60 | |
| | | | | |
Net investment income(a) | | | 0.05 | | | | 0.06 | | | | 0.07 | (b) | | | 0.08 | | | | 0.11 | |
| | | | | |
Net realized and unrealized gain (loss) | | | 1.03 | | | | 2.51 | | | | (1.21 | ) | | | 1.53 | | | | 2.59 | |
| | | | | |
Total from investment operations | | | 1.08 | | | | 2.57 | | | | (1.14 | ) | | | 1.61 | | | | 2.70 | |
| | | | | |
Distributions to shareholders from net investment income | | | (0.03 | ) | | | (0.06 | ) | | | (0.07 | ) | | | (0.08 | ) | | | (0.15 | ) |
| | | | | |
Distributions to shareholders from net realized gains | | | (0.16 | ) | | | (0.26 | ) | | | (2.08 | ) | | | (1.66 | ) | | | (0.36 | ) |
| | | | | |
Total distributions | | | (0.19 | ) | | | (0.32 | ) | | | (2.15 | ) | | | (1.74 | ) | | | (0.51 | ) |
| | | | | |
Net asset value, end of year | | $ | 13.51 | | | $ | 12.62 | | | $ | 10.37 | | | $ | 13.66 | | | $ | 13.79 | |
| | | | | |
Total return(c) | | | 8.56 | % | | | 24.84 | % | | | (8.62 | )% | | | 11.57 | % | | | 23.13 | % |
| | | | | |
Net assets, end of year (in 000s) | | $ | 84,887 | | | $ | 79,791 | | | $ | 68,951 | | | $ | 77,815 | | | $ | 77,421 | |
| | | | | |
Ratio of net expenses to average net assets | | | 0.81 | % | | | 0.86 | % | | | 0.81 | % | | | 0.81 | % | | | 0.81 | % |
| | | | | |
Ratio of total expenses to average net assets | | | 1.08 | % | | | 1.05 | % | | | 0.98 | % | | | 1.00 | % | | | 1.04 | % |
| | | | | |
Ratio of net investment income to average net assets | | | 0.46 | % | | | 0.51 | % | | | 0.46 | %(b) | | | 0.53 | % | | | 0.95 | % |
| | | | | |
Portfolio turnover rate(d) | | | 147 | % | | | 125 | % | | | 116 | % | | | 110 | % | | | 119 | % |
| (a) | Calculated based on the average shares outstanding methodology. |
| (b) | Reflects income recognized from special dividends which amounted to $0.02 per share and 0.17% of average net assets. |
| (c) | Assumes investment at the net asset value at the beginning of the year, reinvestment of all distributions, a complete redemption of the investment at the net asset value at the end of the year and no sales or redemption charges (if any). Total returns would be reduced if a sales or redemption charge was taken into account. Returns do not reflect the impact of taxes to shareholders relating to Fund distributions or the redemption of Fund shares. |
| (d) | The Fund’s portfolio turnover rate is calculated in accordance with regulatory requirements, without regard to transactions involving short term investments and certain derivatives. If such transactions were included, the Fund’s portfolio turnover rate may be higher. |
| | |
| The accompanying notes are an integral part of these financial statements. | | 17 |
GOLDMAN SACHS VARIABLE INSURANCE TRUST SMALL CAP EQUITY INSIGHTS FUND
Financial Highlights (continued)
Selected Data for a Share Outstanding Throughout Each Year
| | | | | | | | | | | | | | | | | | | | |
| | | Goldman Sachs Small Cap Equity Insights Fund | |
| | | Service Shares | |
| | | Year Ended December 31, | |
| | | 2020 | | | 2019 | | | 2018 | | | 2017 | | | 2016 | |
| | | | | | | | | | | | | | | | | | | | |
| Per Share Data | | | | | | | | | | | | | | | |
| | | | | |
Net asset value, beginning of year | | $ | 12.51 | | | $ | 10.28 | | | $ | 13.55 | | | $ | 13.70 | | | $ | 11.52 | |
| | | | | |
Net investment income(a) | | | 0.02 | | | | 0.03 | | | | 0.03 | (b) | | | 0.04 | | | | 0.08 | |
| | | | | |
Net realized and unrealized gain (loss) | | | 1.02 | | | | 2.49 | | | | (1.19 | ) | | | 1.51 | | | | 2.58 | |
| | | | | |
Total from investment operations | | | 1.04 | | | | 2.52 | | | | (1.16 | ) | | | 1.55 | | | | 2.66 | |
| | | | | |
Distributions to shareholders from net investment income | | | — | | | | (0.03 | ) | | | (0.03 | ) | | | (0.04 | ) | | | (0.12 | ) |
| | | | | |
Distributions to shareholders from net realized gains | | | (0.16 | ) | | | (0.26 | ) | | | (2.08 | ) | | | (1.66 | ) | | | (0.36 | ) |
| | | | | |
Total distributions | | | (0.16 | ) | | | (0.29 | ) | | | (2.11 | ) | | | (1.70 | ) | | | (0.48 | ) |
| | | | | |
Net asset value, end of year | | $ | 13.39 | | | $ | 12.51 | | | $ | 10.28 | | | $ | 13.55 | | | $ | 13.70 | |
| | | | | |
Total return(c) | | | 8.34 | % | | | 24.53 | % | | | (8.82 | )% | | | 11.22 | % | | | 22.92 | % |
| | | | | |
Net assets, end of year (in 000s) | | $ | 17,239 | | | $ | 15,742 | | | $ | 16,537 | | | $ | 20,505 | | | $ | 20,437 | |
| | | | | |
Ratio of net expenses to average net assets | | | 1.06 | % | | | 1.10 | % | | | 1.06 | % | | | 1.06 | % | | | 1.06 | % |
| | | | | |
Ratio of total expenses to average net assets | | | 1.33 | % | | | 1.30 | % | | | 1.23 | % | | | 1.25 | % | | | 1.29 | % |
| | | | | |
Ratio of net investment income to average net assets | | | 0.22 | % | | | 0.27 | % | | | 0.19 | %(b) | | | 0.28 | % | | | 0.70 | % |
| | | | | |
Portfolio turnover rate(d) | | | 147 | % | | | 125 | % | | | 116 | % | | | 110 | % | | | 119 | % |
| (a) | Calculated based on the average shares outstanding methodology. |
| (b) | Reflects income recognized from special dividends which amounted to $0.02 per share and 0.17% of average net assets. |
| (c) | Assumes investment at the net asset value at the beginning of the year, reinvestment of all distributions, a complete redemption of the investment at the net asset value at the end of the year and no sales or redemption charges (if any). Total returns would be reduced if a sales or redemption charge was taken into account. Returns do not reflect the impact of taxes to shareholders relating to Fund distributions or the redemption of Fund shares. |
| (d) | The Fund’s portfolio turnover rate is calculated in accordance with regulatory requirements, without regard to transactions involving short term investments and certain derivatives. If such transactions were included, the Fund’s portfolio turnover rate may be higher. |
| | |
| 18 | | The accompanying notes are an integral part of these financial statements. |
GOLDMAN SACHS VARIABLE INSURANCE TRUST SMALL CAP EQUITY INSIGHTS FUND
Notes to Financial Statements
December 31, 2020
1. ORGANIZATION
Goldman Sachs Variable Insurance Trust (the “Trust” or “VIT”) is a Delaware statutory trust registered under the Investment Company Act of 1940, as amended (the “Act”), as an open-end management investment company. The Trust includes the Goldman Sachs Small Cap Equity Insights Fund (the “Fund”). The Fund is a diversified portfolio under the Act offering two classes of shares — Institutional and Service Shares. Shares of the Trust are offered to separate accounts of participating life insurance companies for the purpose of funding variable annuity contracts and variable life insurance policies.
Goldman Sachs Asset Management, L.P. (“GSAM”), an affiliate of Goldman Sachs & Co. LLC (“Goldman Sachs”), serves as investment adviser to the Fund pursuant to a management agreement (the “Agreement”) with the Trust.
2. SIGNIFICANT ACCOUNTING POLICIES
The financial statements have been prepared in accordance with accounting principles generally accepted in the United States of America (“GAAP”) and require management to make estimates and assumptions that may affect the reported amounts and disclosures. Actual results may differ from those estimates and assumptions. The Fund is an investment company under GAAP and follows the accounting and reporting guidance applicable to investment companies.
A. Investment Valuation — The Fund’s valuation policy is to value investments at fair value.
B. Investment Income and Investments — Investment income includes interest income, dividend income, and securities lending income, if any. Interest income is accrued daily and adjusted for amortization of premiums and accretion of discounts. Dividend income is recognized on ex-dividend date or, for certain foreign securities, as soon as such information is obtained subsequent to the ex-dividend date. Non-cash dividends, if any, are recorded at the fair market value of the securities received. Investment transactions are reflected on trade date. Realized gains and losses are calculated using identified cost. Investment transactions are recorded on the following business day for daily net asset value (“NAV”) calculations. Investment income is recorded net of any foreign withholding taxes, less any amounts reclaimable. The Fund may file withholding tax reclaims in certain jurisdictions to recover a portion of amounts previously withheld. Any foreign capital gains tax is accrued daily based upon net unrealized gains, and is payable upon sale of such investments. Distributions received from the Fund’s investments in United States (“U.S.”) real estate investment trusts (“REITs”) may be characterized as ordinary income, net capital gain and/or a return of capital. A return of capital is recorded by the Fund as a reduction to the cost basis of the REIT.
For derivative contracts, realized gains and losses are recorded upon settlement of the contract.
C. Class Allocations and Expenses — Investment income, realized and unrealized gain (loss), if any, and non-class specific expenses of the Fund are allocated daily based upon the proportion of net assets of each class. Non-class specific expenses directly incurred by the Fund are charged to the Fund, while such expenses incurred by the Trust are allocated across the Fund on a straight-line and/or pro-rata basis depending upon the nature of the expenses. Class specific expenses, where applicable, are borne by the respective share classes and include Distribution and Service and Transfer Agency fees.
D. Federal Taxes and Distributions to Shareholders — It is the Fund’s policy to comply with the requirements of the Internal Revenue Code of 1986, as amended (the “Code”), applicable to regulated investment companies and to distribute each year substantially all of its investment company taxable income and capital gains to its shareholders. Accordingly, the Fund is not required to make any provisions for the payment of federal income tax. Distributions to shareholders are recorded on the ex-dividend date. Income and capital gains distributions, if any, are declared and paid at least annually.
Net capital losses, if any, are carried forward to future fiscal years and may be used to the extent allowed by the Code to offset any future capital gains. Losses that are carried forward will retain their character as either short-term or long-term capital losses. Utilization of capital loss carryforwards will reduce the requirement of future capital gains distributions.
The characterization of distributions to shareholders for financial reporting purposes is determined in accordance with federal income tax rules, which may differ from GAAP. The source of the Fund’s distributions may be shown in the accompanying financial statements as either from distributable earnings or capital. Certain components of the Fund’s net assets on the Statement of Assets and Liabilities reflect permanent GAAP/tax differences based on the appropriate tax character.
19
GOLDMAN SACHS VARIABLE INSURANCE TRUST SMALL CAP EQUITY INSIGHTS FUND
Notes to Financial Statements (continued)
December 31, 2020
3. INVESTMENTS AND FAIR VALUE MEASUREMENTS
U.S. GAAP defines the fair value of a financial instrument as the amount that would be received to sell an asset or paid to transfer a liability in an orderly transaction between market participants at the measurement date (i.e., the exit price); the Fund’s policy is to use the market approach. GAAP establishes a fair value hierarchy that prioritizes the inputs to valuation techniques used to measure fair value. The hierarchy gives the highest priority to unadjusted quoted prices in active markets for identical assets or liabilities (Level 1 measurements) and the lowest priority to unobservable inputs (Level 3 measurements). The level in the fair value hierarchy within which the fair value measurement in its entirety falls shall be determined based on the lowest level input that is significant to the fair value measurement in its entirety. The levels used for classifying investments are not necessarily an indication of the risk associated with investing in these investments. The three levels of the fair value hierarchy are described below:
Level 1 — Unadjusted quoted prices in active markets that are accessible at the measurement date for identical, unrestricted assets or liabilities;
Level 2 — Quoted prices in markets that are not active or financial instruments for which significant inputs are observable (including, but not limited to, quoted prices for similar investments, interest rates, foreign exchange rates, volatility and credit spreads), either directly or indirectly;
Level 3 — Prices or valuations that require significant unobservable inputs (including GSAM’s assumptions in determining fair value measurement).
The Board of Trustees (“Trustees”) has approved Valuation Procedures that govern the valuation of the portfolio investments held by the Fund, including investments for which market quotations are not readily available. The Trustees have delegated to GSAM day-to-day responsibility for implementing and maintaining internal controls and procedures related to the valuation of the Fund’s investments. To assess the continuing appropriateness of pricing sources and methodologies, GSAM regularly performs price verification procedures and issues challenges as necessary to third party pricing vendors or brokers, and any differences are reviewed in accordance with the Valuation Procedures.
A. Level 1 and Level 2 Fair Value Investments — The valuation techniques and significant inputs used in determining the fair values for investments classified as Level 1 and Level 2 are as follows:
Equity Securities — Equity securities traded on a U.S. securities exchange or the NASDAQ system, or those located on certain foreign exchanges, including but not limited to the Americas, are valued daily at their last sale price or official closing price on the principal exchange or system on which they are traded. If there is no sale or official closing price or such price is believed by GSAM to not represent fair value, equity securities will be valued at the valid closing bid price for long positions and at the valid closing ask price for short positions (i.e. where there is sufficient volume, during normal exchange trading hours). If no valid bid/ask price is available, the equity security will be valued pursuant to the Valuation Procedures approved by the Trustees and consistent with applicable regulatory guidance. To the extent these investments are actively traded, they are classified as Level 1 of the fair value hierarchy, otherwise they are generally classified as Level 2. Certain equity securities containing unique attributes may be classified as Level 2.
Unlisted equity securities for which market quotations are available are valued at the last sale price on the valuation date, or if no sale occurs, at the last bid price for long positions or the last ask price for short positions, and are generally classified as Level 2.
Money Market Funds — Investments in the Goldman Sachs Financial Square Government Fund (“Underlying Fund”) are valued at the NAV per share of the Institutional Share class on the day of valuation. These investments are generally classified as Level 1 of the fair value hierarchy. For information regarding the Underlying Fund’s accounting policies and investment holdings, please see the Underlying Fund’s shareholder report.
Derivative Contracts — A derivative is an instrument whose value is derived from underlying assets, indices, reference rates or a combination of these factors. The Fund enters into derivative transactions to hedge against changes in interest rates, securities prices, and/or currency exchange rates, to increase total return, or to gain access to certain markets or attain exposure to other underliers. For financial reporting purposes, cash collateral that has been pledged to cover obligations of the Fund and cash collateral received, if any, is reported separately on the Statement of Assets and Liabilities as receivables/payables for collateral on certain derivatives contracts. Non-cash collateral pledged by the Fund, if any, is noted in the Schedule of Investments.
20
GOLDMAN SACHS VARIABLE INSURANCE TRUST SMALL CAP EQUITY INSIGHTS FUND
3. INVESTMENTS AND FAIR VALUE MEASUREMENTS (continued)
Exchange-traded derivatives, including futures and options contracts, are generally valued at the last sale or settlement price on the exchange where they are principally traded. Exchange-traded options without settlement prices are generally valued at the midpoint of the bid and ask prices on the exchange where they are principally traded (or, in the absence of two-way trading, at the last bid price for long positions and the last ask price for short positions). Exchange-traded derivatives typically fall within Level 1 of the fair value hierarchy. Over-the-counter (“OTC”) and centrally cleared derivatives are valued using market transactions and other market evidence, including market-based inputs to models, calibration to market-clearing transactions, broker or dealer quotations, or other alternative pricing sources. Where models are used, the selection of a particular model to value OTC and centrally cleared derivatives depends upon the contractual terms of, and specific risks inherent in, the instrument, as well as the availability of pricing information in the market. Valuation models require a variety of inputs, including contractual terms, market prices, yield curves, credit curves, measures of volatility, voluntary and involuntary prepayment rates, loss severity rates and correlations of such inputs. For OTC and centrally cleared derivatives that trade in liquid markets, model inputs can generally be verified and model selection does not involve significant management judgment. OTC and centrally cleared derivatives are classified within Level 2 of the fair value hierarchy when significant inputs are corroborated by market evidence.
i. Futures Contracts — Futures contracts are contracts to buy or sell a standardized quantity of a specified commodity or security. Upon entering into a futures contract, the Fund deposits cash or securities in an account on behalf of the broker in an amount sufficient to meet the initial margin requirement. Subsequent payments are made or received by the Fund equal to the daily change in the contract value and are recorded as variation margin receivable or payable with a corresponding offset to unrealized gains or losses.
B. Level 3 Fair Value Investments — To the extent that significant inputs to valuation models and other alternative pricing sources are unobservable, or if quotations are not readily available, or if GSAM believes that such quotations do not accurately reflect fair value, the fair value of the Fund’s investments may be determined under Valuation Procedures approved by the Trustees. GSAM, consistent with its procedures and applicable regulatory guidance, may make an adjustment to the most recent valuation prices of either domestic or foreign securities in light of significant events to reflect what it believes to be the fair value of the securities at the time of determining the Fund’s NAV. To the extent investments are valued using single source broker quotations obtained directly from the broker or passed through from third party pricing vendors, such investments are classified as Level 3 investments.
C. Fair Value Hierarchy — The following is a summary of the Fund’s investments and derivatives classified in the fair value hierarchy as of December 31, 2020:
| | | | | | | | | | | | |
| Investment Type | | Level 1 | | | Level 2 | | | Level 3 | |
| | | |
| Assets | | | | | | | | | | | | |
| Common Stock and/or Other Equity Investments(a) | | | | | | | | | | | | |
Asia | | $ | 1,051,092 | | | $ | — | | | $ | — | |
Europe | | | 312,540 | | | | — | | | | — | |
North America | | | 98,244,342 | | | | — | | | | — | |
Investment Company | | | 1,017,248 | | | | — | | | | — | |
| Securities Lending Reinvestment Vehicle | | | 639,178 | | | | — | | | | — | |
| | | |
| Total | | $ | 101,264,400 | | | $ | — | | | $ | — | |
| | | |
| Derivative Type | | | | | | | | | |
| | | |
| Assets(b) | | | | | | | | | | | | |
| Futures Contracts | | $ | 53,805 | | | $ | — | | | $ | — | |
| (a) | Amounts are disclosed by continent to highlight the impact of time zone differences between local market close and the calculation of net asset value. Security valuations are based on the principal exchange or system on which they are traded, which may differ from country of domicile. |
| (b) | Amount shown represents unrealized gain (loss) at fiscal year end. |
For further information regarding security characteristics, see the Schedule of Investments.
21
GOLDMAN SACHS VARIABLE INSURANCE TRUST SMALL CAP EQUITY INSIGHTS FUND
Notes to Financial Statements (continued)
December 31, 2020
4. INVESTMENTS IN DERIVATIVES
The following table sets forth, by certain risk types, the gross value of derivative contracts (not considered to be hedging instruments for accounting disclosure purposes) as of December 31, 2020. These instruments were used as part of the Fund’s investment strategies and to obtain and/or manage exposure related to the risks below. The values in the table below exclude the effects of cash collateral received or posted pursuant to these derivative contracts, and therefore are not representative of the Fund’s net exposure.
| | | | | | | | | | | | | | |
| Risk | | | | Statement of Assets and Liabilities | | Assets(a) | | | Statement of Assets and Liabilities | | Liabilities | |
| | | | | |
| Equity | | | | Variation margin on futures contracts | | $ | 53,805 | | | — | | $ | — | |
| (a) | Includes unrealized gain (loss) on futures contracts described in the Additional Investment Information section of the Schedule of Investments. Only the variation margin as of December 31, 2020 is reported within the Statement of Assets and Liabilities. |
The following table sets forth, by certain risk types, the Fund’s gains (losses) related to these derivatives and their indicative volumes for the fiscal year ended December 31, 2020. These gains (losses) should be considered in the context that these derivative contracts may have been executed to create investment opportunities and/or economically hedge certain investments, and accordingly, certain gains (losses) on such derivative contracts may offset certain (losses) gains attributable to investments. These gains (losses) are included in “Net realized gain (loss)” or “Net change in unrealized gain (loss)” on the Statement of Operations:
| | | | | | | | | | | | | | |
| Risk | | Statement of Operations | | Net
Realized
Gain (Loss) | | | Net Change in
Unrealized
Gain (Loss) | | | Average
Number of
Contracts(a) | |
| | | | |
| Equity | | Net realized gain (loss) from futures contracts/Net change in unrealized gain (loss) on futures contracts | | $ | 453,767 | | | $ | 53,805 | | | | 13 | |
| (a) | Average number of contracts is based on the average of month end balances for the fiscal year ended December 31, 2020. |
5. AGREEMENTS AND AFFILIATED TRANSACTIONS
A. Management Agreement — Under the Agreement, GSAM manages the Fund, subject to the general supervision of the Trustees.
As compensation for the services rendered pursuant to the Agreement, the assumption of the expenses related thereto and administration of the Fund’s business affairs, including providing facilities, GSAM is entitled to a management fee, accrued daily and paid monthly, equal to an annual percentage rate of the Fund’s average daily net assets.
For the fiscal year ended December 31, 2020, contractual and effective net management fees with GSAM were at the following rates:
| | | | | | | | | | | | | | | | | | | | | | |
| Contractual Management Rate | | | | | | Effective Net
Management Rate^ | |
First
$2 billion | | | Next
$3 billion | | | Next
$3 billion | | | Over
$8 billion | | | Effective
Rate | |
| | | | | |
| | 0.70% | | | | 0.63 | % | | | 0.60 | % | | | 0.59 | % | | | 0.70 | % | | | 0.70 | % |
| ^ | Effective Net Management Rate includes the impact of management fee waivers of affiliated Underlying Funds, if any. |
The Fund invests in Institutional Shares of the Goldman Sachs Financial Square Government Fund, which is an affiliated Underlying Fund. GSAM has agreed to waive a portion of its management fee payable by the Fund in an amount equal to the management fee it earns as an investment adviser to the affiliated Underlying Fund in which the Fund invests, except those management fees it earns from the Fund’s investments of cash collateral received in connection with securities lending transactions in the Goldman Sachs Financial Square Government Fund. For the fiscal year ended December 31, 2020, GSAM waived $732 of the Fund’s management fee.
22
GOLDMAN SACHS VARIABLE INSURANCE TRUST SMALL CAP EQUITY INSIGHTS FUND
5. AGREEMENTS AND AFFILIATED TRANSACTIONS (continued)
B. Distribution and Service (12b-1) Plan — The Trust, on behalf of Service Shares of the Fund, has adopted a Distribution and Service Plan subject to Rule 12b-1 under the Act. Under the Distribution and Service Plan, Goldman Sachs, which serves as distributor, is entitled to a fee accrued daily and paid monthly, for distribution services and personal and account maintenance services, which may then be paid by Goldman Sachs to authorized dealers, equal to, on an annual basis, 0.25% of the Fund’s average daily net assets attributable to Service Shares.
C. Transfer Agency Agreement — Goldman Sachs also serves as the transfer agent of the Fund for a fee pursuant to the Transfer Agency Agreement. The fees charged for such transfer agency services are accrued daily and paid monthly at an annual rate of 0.02% of the average daily net assets of Institutional and Service Shares.
D. Other Expense Agreements and Affiliated Transactions — GSAM has agreed to reduce or limit certain “Other Expenses” of the Fund (excluding acquired fund fees and expenses, transfer agency fees and expenses, service fees and shareholder administration fees (as applicable), taxes, interest, brokerage fees, expenses of shareholder meetings, litigation and indemnification, and extraordinary expenses) to the extent such expenses exceed, on an annual basis, a percentage rate of the average daily net assets of the Fund. Such Other Expense reimbursements, if any, are accrued daily and paid monthly. In addition, the Fund is not obligated to reimburse GSAM for prior fiscal year expense reimbursements, if any. The Other Expense limitation as an annual percentage rate of average daily net assets for the Fund is 0.094%. The Other Expense limitation will remain in place through at least April 29, 2021, and prior to such date GSAM may not terminate the arrangement without the approval of the Trustees. In addition, the Fund has entered into certain offset arrangements with the custodian and the transfer agent, which may result in a reduction of the Fund’s expenses and are received irrespective of the application of the “Other Expense” limitation described above.
For the fiscal year ended December 31, 2020, these expense reductions, including any fee waivers and Other Expense reimbursements, were as follows:
| | | | | | | | | | | | | | |
Management
Fee Waiver | | | Custody
Fee
Credits | | | Other Expense
Reimbursement | | | Total
Expense
Reductions | |
| | | |
| | $732 | | | $ | 2,644 | | | $ | 217,819 | | | $ | 221,195 | |
E. Line of Credit Facility — As of December 31, 2020, the Fund participated in a $700,000,000 committed, unsecured revolving line of credit facility (the “facility”) together with other funds of the Trust and certain registered investment companies having management agreements with GSAM or its affiliates. This facility is to be used for temporary emergency purposes, or to allow for an orderly liquidation of securities to meet redemption requests. The interest rate on borrowings is based on the federal funds rate. The facility also requires a fee to be paid by the Fund based on the amount of the commitment that has not been utilized. For the fiscal year ended December 31, 2020, the Fund did not have any borrowings under the facility. Prior to April 28, 2020, the facility was $580,000,000.
F. Other Transactions with Affiliates — The following table provides information about the Fund’s investments in the Goldman Sachs Financial Square Government Fund as of and for the fiscal year ended December 31, 2020:
| | | | | | | | | | | | | | | | | | | | | | |
Beginning
Value as of
December 31, 2019 | | | Purchases
at Cost | | | Proceeds
from Sales | | | Ending
Value as of
December 31, 2020 | | | Shares as of
December 31, 2020 | | | Dividend Income
from Affiliated
Investment Company | |
| | | | | |
| | $— | | | $ | 10,212,962 | | | $ | (9,195,714 | ) | | $ | 1,017,248 | | | | 1,017,248 | | | $ | 531 | |
6. PORTFOLIO SECURITIES TRANSACTIONS
The cost of purchases and proceeds from sales and maturities of long-term securities for the fiscal year ended December 31, 2020, were $120,425,883 and $122,564,057, respectively.
23
GOLDMAN SACHS VARIABLE INSURANCE TRUST SMALL CAP EQUITY INSIGHTS FUND
Notes to Financial Statements (continued)
December 31, 2020
7. SECURITIES LENDING
Pursuant to exemptive relief granted by the Securities and Exchange Commission (“SEC”) and the terms and conditions contained therein, the Fund may lend its securities through a securities lending agent, Goldman Sachs Agency Lending (“GSAL”), a wholly-owned subsidiary of Goldman Sachs, to certain qualified borrowers including Goldman Sachs and affiliates. In accordance with the Fund’s securities lending procedures, the Fund receives cash collateral at least equal to the market value of the securities on loan. The market value of the loaned securities is determined at the close of business of the Fund, at their last sale price or official closing price on the principal exchange or system on which they are traded, and any additional required collateral is delivered to the Fund on the next business day. As with other extensions of credit, the Fund may experience delay in the recovery of its securities or incur a loss should the borrower of the securities breach its agreement with the Fund or become insolvent at a time when the collateral is insufficient to cover the cost of repurchasing securities on loan. Dividend income received from securities on loan may not be subject to withholding taxes and therefore withholding taxes paid may differ from the amounts listed in the Statement of Operations. Loans of securities are terminable at any time and as such 1) the remaining contractual maturities of the outstanding securities lending transactions are considered to be overnight and continuous and 2) the borrower, after notice, is required to return borrowed securities within the standard time period for settlement of securities transactions.
The Fund invests the cash collateral received in connection with securities lending transactions in the Goldman Sachs Financial Square Government Fund (“Government Money Market Fund”), an affiliated series of the Goldman Sachs Trust. The Government Money Market Fund is registered under the Act as an open end investment company, is subject to Rule 2a-7 under the Act, and is managed by GSAM, for which GSAM may receive a management fee of up to 0.16% on an annualized basis of the average daily net assets of the Government Money Market Fund.
In the event of a default by a borrower with respect to any loan, GSAL will exercise any and all remedies provided under the applicable borrower agreement to make the Fund whole. These remedies include purchasing replacement securities by applying the collateral held from the defaulting broker against the purchase cost of the replacement securities. If GSAL is unable to purchase replacement securities, GSAL will indemnify the Fund by paying the Fund an amount equal to the market value of the securities loaned minus the value of cash collateral received from the borrower for the loan, subject to an exclusion for any shortfalls resulting from a loss of value in such cash collateral due to reinvestment risk. The Fund’s master netting agreements with certain borrowers provide the right, in the event of a default (including bankruptcy or insolvency), for the non-defaulting party to liquidate the collateral and calculate net exposure to the defaulting party or request additional collateral. However, in the event of a default by a borrower, a resolution authority could determine that such rights are not enforceable due to the restrictions or prohibitions against the right of set-off that may be imposed in accordance with a particular jurisdiction’s bankruptcy or insolvency laws. The Fund’s loaned securities were all subject to enforceable Securities Lending Agreements and the value of the collateral was at least equal to the value of the cash received. The amounts of the Fund’s overnight and continuous agreements, which represent the gross amounts of recognized liabilities for securities lending transactions outstanding as of December 31, 2020, are disclosed as “Payable upon return of securities loaned” on the Statement of Assets and Liabilities, where applicable.
Both the Fund and GSAL received compensation relating to the lending of the Fund’s securities. The amounts earned, if any, by the Fund for the fiscal year ended December 31, 2020, are reported under Investment Income on the Statement of Operations.
The table below details securities lending activity with affiliates of Goldman Sachs:
| | | | |
| For the Fiscal Year ended December 31, 2020 | | Amount Payable to
Goldman Sachs
Upon Return of
Securities Loaned as of
December 31, 2020 |
Earnings of GSAL
Relating to
Securities
Loaned | | Amount Received
by the Fund
from Lending to
Goldman Sachs |
| | |
| $3,238 | | $4,311 | | $168,000 |
24
GOLDMAN SACHS VARIABLE INSURANCE TRUST SMALL CAP EQUITY INSIGHTS FUND
7. SECURITIES LENDING (continued)
The following table provides information about the Fund’s investment in the Government Money Market Fund for the fiscal year ended December 31, 2020:
| | | | | | | | | | | | |
Beginning
Value as of
December 31, 2019 | | | Purchases
at Cost | | | Proceeds
from Sales | | Ending
Value as of
December 31, 2020 | |
| | | |
| | $58,750 | | | $ | 12,158,445 | | | $(11,578,017) | | $ | 639,178 | |
8. TAX INFORMATION
The tax character of distributions paid during the fiscal years ended December 31, 2019 and December 31, 2020 was as follows:
| | | | | | | | |
| | | 2019 | | | 2020 | |
| Distributions paid from: | | | | | | | | |
Ordinary income | | $ | 425,753 | | | $ | 161,993 | |
Net long-term capital gains | | | 1,934,815 | | | | 1,217,779 | |
| Total taxable distributions | | $ | 2,360,568 | | | $ | 1,379,772 | |
As of December 31, 2020, the components of accumulated earnings (losses) on a tax-basis were as follows:
| | | | |
| Undistributed ordinary income — net | | $ | 1,718,111 | |
| Undistributed long-term capital gains | | | 1,286,767 | |
| Total undistributed earnings | | $ | 3,004,878 | |
| Timing differences (Real Estate Investment Trusts) | | $ | 52,295 | |
| Unrealized gains — net | | | 14,665,375 | |
| Total accumulated earnings — net | | $ | 17,722,548 | |
As of December 31, 2020, the Fund’s aggregate security unrealized gains and losses based on cost for U.S. federal income tax purposes were as follows:
| | | | |
| Tax cost | | $ | 86,652,830 | |
| Gross unrealized gain | | | 18,172,610 | |
| Gross unrealized loss | | | (3,507,235 | ) |
| Net unrealized gain | | $ | 14,665,375 | |
The difference between GAAP-basis and tax-basis unrealized gains (losses) is attributable primarily to wash sales, and net mark to market gains/(losses) on regulated futures contracts.
GSAM has reviewed the Fund’s tax positions for all open tax years (the current and prior three years, as applicable) and has concluded that no provision for income tax is required in the Fund’s financial statements. Such open tax years remain subject to examination and adjustment by tax authorities.
25
GOLDMAN SACHS VARIABLE INSURANCE TRUST SMALL CAP EQUITY INSIGHTS FUND
Notes to Financial Statements (continued)
December 31, 2020
9. OTHER RISKS
The Fund’s risks include, but are not limited to, the following:
Derivatives Risk — The Fund’s use of derivatives may result in loss. Derivative instruments, which may pose risks in addition to and greater than those associated with investing directly in securities, currencies or other instruments, may be illiquid or less liquid, volatile, difficult to price and leveraged so that small changes in the value of the underlying instruments may produce disproportionate losses to the Fund. Derivatives are also subject to counterparty risk, which is the risk that the other party in the transaction will not fulfill its contractual obligation. The use of derivatives is a highly specialized activity that involves investment techniques and risks different from those associated with investments in more traditional securities and instruments. Losses from derivatives can also result from a lack of correlation between changes in the value of derivative instruments and the portfolio assets (if any) being hedged.
Investments in Other Investment Companies Risk — As a shareholder of another investment company, the Fund will indirectly bear its proportionate share of any net management fees and other expenses paid by such other investment companies, in addition to the fees and expenses regularly borne by the Fund.
Large Shareholder Transactions Risk — The Fund may experience adverse effects when certain large shareholders, such as other funds, participating insurance companies, accounts and Goldman Sachs affiliates, purchase or redeem large amounts of shares of the Fund. Such large shareholder redemptions, which may occur rapidly or unexpectedly, may cause the Fund to sell portfolio securities at times when it would not otherwise do so, which may negatively impact the Fund’s NAV and liquidity. These transactions may also accelerate the realization of taxable income to shareholders if such sales of investments resulted in gains, and may also increase transaction costs. In addition, a large redemption could result in the Fund’s current expenses being allocated over a smaller asset base, leading to an increase in the Fund’s expense ratio. Similarly, large Fund share purchases may adversely affect the Fund’s performance to the extent that the Fund is delayed in investing new cash or otherwise maintains a larger cash position than it ordinarily would.
Liquidity Risk — The Fund may make investments that are illiquid or that may become less liquid in response to market developments or adverse investor perceptions. Illiquid investments may be more difficult to value. Liquidity risk may also refer to the risk that the Fund will not be able to pay redemption proceeds within the allowable time period or without significant dilution to remaining investors’ interests because of unusual market conditions, an unusually high volume of redemption requests, or other reasons. To meet redemption requests, the Fund may be forced to sell investments at an unfavorable time and/or under unfavorable conditions. If the Fund is forced to sell securities at an unfavorable time and/or under unfavorable conditions, such sales may adversely affect the Fund’s NAV and dilute remaining investors’ interests. These risks may be more pronounced in connection with the Fund’s investments in securities of issuers located in emerging market countries. Redemptions by large shareholders may have a negative impact on the Fund’s liquidity.
Market and Credit Risks — In the normal course of business, the Fund trades financial instruments and enters into financial transactions where risk of potential loss exists due to changes in the market (market risk). The value of the securities in which the Fund invests may go up or down in response to the prospects of individual companies, particular sectors or governments and/or general economic conditions throughout the world due to increasingly interconnected global economies and financial markets. Events such as war, acts of terrorism, social unrest, natural disasters, the spread of infectious illness or other public health threats could also significantly impact the Fund and its investments. Additionally, the Fund may also be exposed to credit risk in the event that an issuer or guarantor fails to perform or that an institution or entity with which the Fund has unsettled or open transactions defaults.
26
GOLDMAN SACHS VARIABLE INSURANCE TRUST SMALL CAP EQUITY INSIGHTS FUND
10. INDEMNIFICATIONS
Under the Trust’s organizational documents, its Trustees, officers, employees and agents are indemnified, to the extent permitted by the Act and state law, against certain liabilities that may arise out of performance of their duties to the Fund. Additionally, in the course of business, the Fund enters into contracts that contain a variety of indemnification clauses. The Fund’s maximum exposure under these arrangements is unknown, as this would involve future claims that may be made against the Fund that have not yet occurred. However, GSAM believes the risk of loss under these arrangements to be remote.
11. OTHER MATTERS
On October 22, 2020, Goldman Sachs announced a settlement of matters involving 1Malaysia Development Bhd. (1MDB), a Malaysian sovereign wealth fund, with the United States Department of Justice as well as criminal and civil authorities in the UK, Singapore and Hong Kong. Further information regarding the 1MDB settlement can be found at https://www.goldmansachs.com/media-relations/press-releases/current/goldman-sachs-2020-10-22.html. The 1MDB settlement will not materially adversely affect GSAM’s ability to serve as investment manager.
12. SUBSEQUENT EVENTS
Subsequent events after the Statement of Assets and Liabilities date have been evaluated, and GSAM has concluded that there is no impact requiring adjustment or disclosure in the financial statements.
13. SUMMARY OF SHARE TRANSACTIONS
Share activity is as follows:
| | | | | | | | | | | | | | | | |
| | | For the Fiscal Year Ended
December 31, 2020 | | | For the Fiscal Year Ended
December 31, 2019 | |
| | | Shares | | | Dollars | | | Shares | | | Dollars | |
| Institutional Shares | | | | | | | | | | | | | | | | |
| Shares sold | | | 936,953 | | | $ | 10,144,169 | | | | 757,715 | | | $ | 9,168,973 | |
| Reinvestment of distributions | | | 88,719 | | | | 1,169,326 | | | | 159,352 | | | | 1,999,867 | |
| Shares redeemed | | | (1,067,788 | ) | | | (11,796,332 | ) | | | (1,241,504 | ) | | | (14,923,018 | ) |
| | | | (42,116 | ) | | | (482,837 | ) | | | (324,437 | ) | | | (3,754,178 | ) |
| Service Shares | | | | | | | | | | | | | | | | |
| Shares sold | | | 204,098 | | | | 2,017,902 | | | | 82,662 | | | | 970,133 | |
| Reinvestment of distributions | | | 16,114 | | | | 210,446 | | | | 28,972 | | | | 360,700 | |
| Shares redeemed | | | (191,110 | ) | | | (2,189,717 | ) | | | (461,347 | ) | | | (5,428,381 | ) |
| | | | 29,102 | | | | 38,631 | | | | (349,713 | ) | | | (4,097,548 | ) |
| | | | |
| NET DECREASE | | | (13,014 | ) | | $ | (444,206) | | | | (674,150 | ) | | $ | (7,851,726 | ) |
27
Report of Independent Registered Public Accounting Firm
To the Board of Trustees of Goldman Sachs Variable Insurance Trust and Shareholders of Goldman Sachs Small Cap Equity Insights Fund
Opinion on the Financial Statements
We have audited the accompanying statement of assets and liabilities, including the schedule of investments, of Goldman Sachs Small Cap Equity Insights Fund (one of the funds constituting Goldman Sachs Variable Insurance Trust, referred to hereafter as the “Fund”) as of December 31, 2020, the related statement of operations for the year ended December 31, 2020, the statements of changes in net assets for each of the two years in the period ended December 31, 2020, including the related notes, and the financial highlights for each of the five years in the period ended December 31, 2020 (collectively referred to as the “financial statements”). In our opinion, the financial statements present fairly, in all material respects, the financial position of the Fund as of December 31, 2020, the results of its operations for the year then ended, the changes in its net assets for each of the two years in the period ended December 31, 2020 and the financial highlights for each of the five years in the period ended December 31, 2020 in conformity with accounting principles generally accepted in the United States of America.
Basis for Opinion
These financial statements are the responsibility of the Fund’s management. Our responsibility is to express an opinion on the Fund’s financial statements based on our audits. We are a public accounting firm registered with the Public Company Accounting Oversight Board (United States) (PCAOB) and are required to be independent with respect to the Fund in accordance with the U.S. federal securities laws and the applicable rules and regulations of the Securities and Exchange Commission and the PCAOB.
We conducted our audits of these financial statements in accordance with the standards of the PCAOB. Those standards require that we plan and perform the audit to obtain reasonable assurance about whether the financial statements are free of material misstatement, whether due to error or fraud.
Our audits included performing procedures to assess the risks of material misstatement of the financial statements, whether due to error or fraud, and performing procedures that respond to those risks. Such procedures included examining, on a test basis, evidence regarding the amounts and disclosures in the financial statements. Our audits also included evaluating the accounting principles used and significant estimates made by management, as well as evaluating the overall presentation of the financial statements. Our procedures included confirmation of securities owned as of December 31, 2020 by correspondence with the custodian, transfer agent and brokers. We believe that our audits provide a reasonable basis for our opinion.
/s/PricewaterhouseCoopers LLP
Boston, Massachusetts
February 17, 2021
We have served as the auditor of one or more investment companies in the Goldman Sachs fund complex since 2000.
28
GOLDMAN SACHS VARIABLE INSURANCE TRUST SMALL CAP EQUITY INSIGHTS FUND
Voting Results of Special Meeting of Shareholders (Unaudited)
A Special Meeting (the “Meeting”) of the Goldman Sachs Variable Insurance Trust (“VIT”) was held on January 23, 2020 to consider and act upon the proposal below. The Fund has amortized its respective share of the proxy, shareholder meeting and other related costs and GSAM has agreed to reimburse the Fund to the extent such expenses exceed a specified percentage of the Fund’s net assets.
At the Meeting, Dwight L. Bush, Kathryn A. Cassidy, Joaquin Delgado and Gregory G. Weaver were elected to the Trust’s Board of Trustees. In electing trustees, the Trust’s shareholders voted as follows:
| | | | | | | | | | | | | | | | |
| | | | | |
Proposal 1. Election of Trustees | | For | | | Against | | | Withheld | | | Broker Non-Votes | |
| | | | | |
Dwight L. Bush | | | 745,493,677.130 | | | | 0 | | | | 17,848,840.639 | | | | 0 | |
| | | | | |
Kathryn A. Cassidy | | | 746,559,784.810 | | | | 0 | | | | 16,782,732.959 | | | | 0 | |
| | | | | |
Joaquin Delgado | | | 744,593,456.532 | | | | 0 | | | | 18,749,061.237 | | | | 0 | |
| | | | | |
Gregory G. Weaver | | | 746,707,039.321 | | | | 0 | | | | 16,635,478.448 | | | | 0 | |
29
GOLDMAN SACHS VARIABLE INSURANCE TRUST SMALL CAP EQUITY INSIGHTS FUND
| | |
| Fund Expenses — Six Months Period Ended December 31, 2020 (Unaudited) | | |
As a shareholder of Institutional or Service Shares of the Fund, you incur ongoing costs, including management fees, distribution and/or service (12b-1) fees (with respect to Service Shares) and other Fund expenses. This example is intended to help you understand your ongoing costs (in dollars) of investing in Institutional Shares and Service Shares of the Fund and to compare these costs with the ongoing costs of investing in other mutual funds.
The example is based on an investment of $1,000 invested at the beginning of the period and held for the entire period from July 1, 2020 through December 31, 2020, which represents a period of 184 days of a 366 day year.
Actual Expenses — The first line under each share class in the table below provides information about actual account values and actual expenses. You may use the information in this line, together with the amount you invested, to estimate the expenses that you paid over the period. Simply divide your account value by $1,000 (for example, an $8,600 account value divided by $1,000=8.6), then multiply the result by the number in the first line under the heading entitled “Expenses Paid” to estimate the expenses you paid on your account during this period.
Hypothetical Example for Comparison Purposes — The second line under each share class in the table below provides information about hypothetical account values and hypothetical expenses based on the Fund’s actual net expense ratio and an assumed rate of return of 5% per year before expenses, which is not the Fund’s actual return. The hypothetical account values and expenses may not be used to estimate the actual ending account balance or expenses you paid for the period. You may use this information to compare the ongoing costs of investing in the Fund and other funds. To do so, compare this 5% hypothetical example with the 5% hypothetical examples that appear in the shareholder reports of the other funds.
Please note that the expenses shown in the table are meant to highlight your ongoing costs only. As a shareholder of the Fund you do not incur any transaction costs, such as sales charges, redemption fees, or exchange fees, but shareholders of other funds may incur such costs. The second line of the table is useful in comparing ongoing costs only and will not help you determine the relative total costs of owning different funds whose shareholders may incur transaction costs.
| | | | | | | | | | | | |
| Share Class | | Beginning
Account Value
07/01/20 | | | Ending
Account Value
12/31/20 | | | Expenses Paid for the
6 Months
Ended
12/31/20* | |
| Institutional | | | | | | | | | | | | |
| | | | |
| Actual | | $ | 1,000 | | | $ | 1,291.50 | | | $ | 4.67 | |
| Hypothetical 5% return | | | 1,000 | | | | 1,021.06 | + | | | 4.12 | |
| Service | | | | | | | | | | | | |
| | | | |
| Actual | | | 1,000 | | | | 1,289.90 | | | | 6.10 | |
| Hypothetical 5% return | | | 1,000 | | | | 1,019.81 | + | | | 5.38 | |
| | + | Hypothetical expenses are based on the Fund’s actual annualized net expense ratios and an assumed rate of return of 5% per year before expenses. | |
| | * | Expenses are calculated using the Fund’s annualized net expense ratio for each class, which represents the ongoing expenses as a percentage of net assets for the six months ended December 31, 2020. Expenses are calculated by multiplying the annualized net expense ratio by the average account value for the period; then multiplying the result by the number of days in the most recent fiscal half year; and then dividing that result by the number of days in the fiscal year. The annualized net expense ratios for the period were 0.81% and 1.06% for Institutional and Service Shares, respectively. | |
30
GOLDMAN SACHS VARIABLE INSURANCE TRUST SMALL CAP EQUITY INSIGHTS FUND
Trustees and Officers (Unaudited)
Independent Trustees
| | | | | | | | | | | | |
| | | | | |
Name,
Address and Age1 | | Position(s) Held
with the Trust | | Term of Office and
Length of
Time Served2 | | Principal Occupation(s) During Past 5 Years | | Number of
Portfolios in
Fund Complex
Overseen by
Trustee3 | | | Other Directorships Held by Trustee4 |
Jessica Palmer Age: 71 | | Chair of the Board of Trustees | | Since 2018 (Trustee since 2007) | | Ms. Palmer is retired. She was formerly Consultant, Citigroup Human Resources Department (2007-2008); Managing Director, Citigroup Corporate and Investment Banking (previously, Salomon Smith Barney/Salomon Brothers) (1984-2006). Ms. Palmer was a Member of the Board of Trustees of Indian Mountain School (private elementary and secondary school) (2004-2009). Chair of the Board of Trustees — Goldman Sachs Variable Insurance Trust and Goldman Sachs Trust. | | | 105 | | | None |
Dwight L. Bush Age: 63 | | Trustee | | Since 2020 | | Ambassador Bush is President and CEO of D.L. Bush & Associates (a financial advisory and private investment firm) (2002-2014 and 2017-present); and was formerly U.S. Ambassador to the Kingdom of Morocco (2014-2017) and a Member of the Board of Directors of Santander Bank, N.A. (2018-2019). Previously, Ambassador Bush served as an Advisory Board Member of Goldman Sachs Trust and Goldman Sachs Variable Insurance Trust (October 2019-January 2020). Trustee — Goldman Sachs Variable Insurance Trust and Goldman Sachs Trust. | | | 105 | | | None |
Kathryn A. Cassidy Age: 66 | | Trustee | | Since 2015 | | Ms. Cassidy is retired. Formerly, she was Advisor to the Chairman (May 2014-December 2014); and Senior Vice President and Treasurer (2008-2014), General Electric Company & General Electric Capital Corporation (technology and financial services companies). Trustee — Goldman Sachs Variable Insurance Trust and Goldman Sachs Trust. | | | 105 | | | None |
Diana M. Daniels Age: 71 | | Trustee | | Since 2007 | | Ms. Daniels is retired. Formerly, she was Vice President, General Counsel and Secretary, The Washington Post Company (1991-2006). Ms. Daniels is a Trustee Emeritus and serves as a Presidential Councillor of Cornell University (2013-Present); former Member of the Legal Advisory Board, New York Stock Exchange (2003-2006) and of the Corporate Advisory Board, Standish Mellon Management Advisors (2006-2007). Trustee — Goldman Sachs Variable Insurance Trust and Goldman Sachs Trust. | | | 105 | | | None |
Joaquin Delgado Age: 60 | | Trustee | | Since 2020 | | Dr. Delgado is retired. He is Director, Hexion Inc. (a specialty chemical manufacturer) (2019-present); and Director, Stepan Company (a specialty chemical manufacturer) (2011-present); and was formerly Executive Vice President, Consumer Business Group of 3M Company (July 2016-July 2019); and Executive Vice President, Health Care Business Group of 3M Company (October 2012-July 2016). Previously, Dr. Delgado served as an Advisory Board Member of Goldman Sachs Trust and Goldman Sachs Variable Insurance Trust (October 2019-January 2020). Trustee — Goldman Sachs Variable Insurance Trust and Goldman Sachs Trust. | | | 105 | | | Stepan Company (a specialty chemical manufacturer) |
| | | | | | | | | | | | |
31
GOLDMAN SACHS VARIABLE INSURANCE TRUST SMALL CAP EQUITY INSIGHTS FUND
Trustees and Officers (Unaudited) (continued)
Independent Trustees
| | | | | | | | | | | | |
Name,
Address and Age1 | | Position(s) Held
with the Trust | | Term of Office and
Length of
Time Served2 | | Principal Occupation(s) During Past 5 Years | | Number of
Portfolios in
Fund Complex
Overseen by
Trustee3 | | | Other Directorships Held by Trustee4 |
Roy W. Templin Age: 60 | | Trustee | | Since 2013 | | Mr. Templin is retired. He is Director, Armstrong World Industries, Inc. (a designer and manufacturer of ceiling, wall and suspension system solutions) (2016-Present); and was formerly Chairman of the Board of Directors, Con-Way Incorporated (a transportation, logistics and supply chain management service company) (2014-2015); Executive Vice President and Chief Financial Officer, Whirlpool Corporation (an appliance manufacturer and marketer) (2004-2012). Trustee — Goldman Sachs Variable Insurance Trust and Goldman Sachs Trust. | | | 105 | | | Armstrong World Industries, Inc. (a ceiling, wall and suspension systems solutions manufacturer) |
Gregory G. Weaver Age: 69 | | Trustee | | Since 2015 | | Mr. Weaver is retired. He is Director, Verizon Communications Inc. (2015-Present); and was formerly Chairman and Chief Executive Officer, Deloitte & Touche LLP (a professional services firm) (2001-2005 and 2012-2014); and Member of the Board of Directors, Deloitte & Touche LLP (2006-2012). Trustee — Goldman Sachs Variable Insurance Trust and Goldman Sachs Trust. | | | 105 | | | Verizon Communications Inc. |
32
GOLDMAN SACHS VARIABLE INSURANCE TRUST SMALL CAP EQUITY INSIGHTS FUND
Trustees and Officers (Unaudited) (continued)
Interested Trustee*
| | | | | | | | | | | | |
Name,
Address and Age1 | | Position(s) Held
with the Trust | | Term of Office and
Length of
Time Served2 | | Principal Occupation(s) During Past 5 Years | | Number of
Portfolios in
Fund Complex
Overseen by
Trustee3 | | | Other Directorships Held by Trustee4 |
James A. McNamara Age: 58 | | Trustee and President | | Since 2007 | | Advisory Director, Goldman Sachs (January 2018-Present); Managing Director, Goldman Sachs (January 2000-December 2017); Director of Institutional Fund Sales, GSAM (April 1998-December 2000); and Senior Vice President and Manager, Dreyfus Institutional Service Corporation (January 1993-April 1998). President and Trustee — Goldman Sachs Variable Insurance Trust; Goldman Sachs Trust; Goldman Sachs Trust II; Goldman Sachs MLP and Energy Renaissance Fund; Goldman Sachs ETF Trust; Goldman Sachs Credit Income Fund; and Goldman Sachs Real Estate Diversified Income Fund. | | | 158 | | | None |
| | | | | | | | | | | | |
| * | Mr. McNamara is considered to be an “Interested Trustee” because he holds positions with Goldman Sachs and owns securities issued by The Goldman Sachs Group, Inc. Mr. McNamara holds comparable positions with certain other companies of which Goldman Sachs, GSAM or an affiliate thereof is the investment adviser, administrator and/or distributor. |
| 1 | Each Trustee may be contacted by writing to the Trustee, c/o Goldman Sachs, 200 West Street, New York, New York, 10282, Attn: Caroline Kraus. Information is provided as of December 31, 2020. |
| 2 | Subject to such policies as may be adopted by the Board from time-to-time, each Trustee holds office for an indefinite term, until the earliest of: (a) the election of his or her successor; (b) the date the Trustee resigns or is removed by the Board or shareholders, in accordance with the Trust’s Declaration of Trust; or (c) the termination of the Trust. The Board has adopted policies which provide that each Independent Trustee shall retire as of December 31st of the calendar year in which he or she reaches (a) his or her 75th birthday or (b) the 15th anniversary of the date he or she became a Trustee, whichever is earlier, unless a waiver of such requirements shall have been adopted by a majority of the other Trustees. These policies may be changed by the Trustees without shareholder vote. |
| 3 | The Goldman Sachs Fund Complex includes certain other companies listed above for each respective Trustee. As of December 31, 2020, Goldman Sachs Variable Insurance Trust consisted of 13 portfolios; Goldman Sachs Trust consisted of 92 portfolios (90 of which offered shares to the public); Goldman Sachs Trust II consisted of 19 portfolios (17 of which offered shares to the public); Goldman Sachs ETF Trust consisted of 31 portfolios (20 of which offered shares to the public); and Goldman Sachs MLP and Energy Renaissance Fund, Goldman Sachs Credit Income Fund and Goldman Sachs Real Estate Diversified Income Fund each consisted of one portfolio. Goldman Sachs Credit Income Fund did not offer shares to the public. |
| 4 | This column includes only directorships of companies required to report to the Securities and Exchange Commission under the Securities Exchange Act of 1934 (i.e., “public companies”) or other investment companies registered under the Act. |
Additional information about the Trustees is available in the Fund’s Statement of Additional Information, which can be obtained from Goldman Sachs free of charge by calling this toll-free number (in the United States of America): 1-800-526-7384.
33
GOLDMAN SACHS VARIABLE INSURANCE TRUST SMALL CAP EQUITY INSIGHTS FUND
Trustees and Officers (Unaudited) (continued)
Officers of the Trust*
| | | | | | |
| | | |
| Name, Address and Age1 | | Position(s) Held with the Trust | | Term of
Office and
Length of
Time Served2 | | Principal Occupation(s) During Past 5 Years |
James A. McNamara
200 West Street New York, NY 10282 Age: 58 | | Trustee and
President | | Since 2007 | | Advisory Director, Goldman Sachs (January 2018-Present); Managing Director, Goldman Sachs (January 2000-December 2017); Director of Institutional Fund Sales, GSAM (April 1998-December 2000); and Senior Vice President and Manager, Dreyfus Institutional Service Corporation (January 1993-April 1998). President and Trustee — Goldman Sachs Variable Insurance Trust; Goldman Sachs Trust; Goldman Sachs Trust II; Goldman Sachs MLP and Energy Renaissance Fund; Goldman Sachs ETF Trust; Goldman Sachs Credit Income Fund; and Goldman Sachs Real Estate Diversified Income Fund. |
Caroline L. Kraus
200 West Street New York, NY 10282 Age: 43 | | Secretary | | Since 2012 | | Managing Director, Goldman Sachs (January 2016-Present); Vice President, Goldman Sachs (August 2006-December 2015); Senior Counsel, Goldman Sachs (January 2020-Present); Associate General Counsel, Goldman Sachs (2012-December 2019); Assistant General Counsel, Goldman Sachs (August 2006-December 2011); and Associate, Weil, Gotshal & Manges, LLP (2002-2006). Secretary — Goldman Sachs Variable Insurance Trust (previously Assistant Secretary (2012)); Goldman Sachs Trust (previously Assistant Secretary (2012)); Goldman Sachs Trust II; Goldman Sachs BDC, Inc.; Goldman Sachs Private Middle Market Credit LLC; Goldman Sachs Private Middle Market Credit II LLC; Goldman Sachs Middle Market Lending Corp.; Goldman Sachs MLP and Energy Renaissance Fund; Goldman Sachs ETF Trust; Goldman Sachs Credit Income Fund; and Goldman Sachs Real Estate Diversified Income Fund. |
Joseph F. DiMaria
30 Hudson Street Jersey City, NJ 07302 Age: 52 | | Treasurer, Principal
Financial Officer
and Principal
Accounting Officer | | Since 2017
(Treasurer
and Principal
Financial
Officer
since 2019) | | Managing Director, Goldman Sachs (November 2015-Present) and Vice President — Mutual Fund Administration, Columbia Management Investment Advisers, LLC (May 2010-October 2015). Treasurer, Principal Financial Officer and Principal Accounting Officer — Goldman Sachs Variable Insurance Trust (previously Assistant Treasurer (2016)); Goldman Sachs Trust (previously Assistant Treasurer (2016)); Goldman Sachs Trust II (previously Assistant Treasurer (2017)); Goldman Sachs MLP and Energy Renaissance Fund (previously Assistant Treasurer (2017)); Goldman Sachs ETF Trust (previously Assistant Treasurer (2017)); Goldman Sachs Credit Income Fund; and Goldman Sachs Real Estate Diversified Income Fund. |
| * | Represents a partial list of officers of the Trust. Additional information about all the officers is available in the Fund’s Statement of Additional Information, which can be obtained from Goldman Sachs free of charge by calling this toll-free number (in the United States): 1-800-526-7384. |
| 1 | Information is provided as of December 31, 2020. |
| 2 | Officers hold office at the pleasure of the Board of Trustees or until their successors are duly elected and qualified. Each officer holds comparable positions with certain other companies of which Goldman Sachs, GSAM or an affiliate thereof is the investment adviser, administrator and/or distributor. |
Goldman Sachs Variable Insurance Trust — Tax Information (Unaudited)
For the year ended December 31, 2020, 41.74% of the dividends paid from net investment company taxable income by the Small Cap Equity Insights Fund qualify for the dividends received deduction available to corporations.
Pursuant to Section 852 of the Internal Revenue Code, the Small Cap Equity Insights Fund designates $1,217,779 or, if different, the maximum amount allowable, as capital gain dividends paid during the fiscal year ended December 31, 2020.
34
| | |
| TRUSTEES | | OFFICERS |
Jessica Palmer, Chair Dwight L. Bush Kathryn A. Cassidy Diana M. Daniels Joaquin Delgado James A. McNamara Roy W. Templin Gregory G. Weaver | | James A. McNamara, President Joseph F. DiMaria, Principal Financial Officer, Principal Accounting Officer and Treasurer Caroline L. Kraus, Secretary |
GOLDMAN SACHS & CO. LLC
Distributor and Transfer Agent
GOLDMAN SACHS ASSET MANAGEMENT, L.P.
Investment Adviser
200 West Street, New York
New York 10282
Visit our web site at www.GSAMFUNDS.com to obtain the most recent month-end returns.
The reports concerning the Fund included in this shareholder report may contain certain forward-looking statements about the factors that may affect the performance of the Fund in the future. These statements are based on Fund management’s predictions and expectations concerning certain future events and their expected impact on the Fund, such as performance of the economy as a whole and of specific industry sectors, changes in the levels of interest rates, the impact of developing world events, and other factors that may influence the future performance of the Fund. Management believes these forward-looking statements to be reasonable, although they are inherently uncertain and difficult to predict. Actual events may cause adjustments in portfolio management strategies from those currently expected to be employed.
A description of the policies and procedures that the Fund uses to determine how to vote proxies relating to portfolio securities and information regarding how the Fund voted proxies relating to portfolio securities for the 12-month period ended December 31 is available (i) without charge, upon request by calling 1-800-621-2550; and (ii) on the Securities and Exchange Commission (“SEC”) web site at http://www.sec.gov.
The Fund will file its portfolio holdings information for each month in a fiscal quarter within 60 days after the end of the relevant fiscal quarter on Form N-PORT. Portfolio holdings information for the third month of each fiscal quarter will be made available on the SEC’s web site at http://www.sec.gov. Portfolio holdings information may be obtained upon request and without charge by calling 1-800-526-7384 (for Retail Shareholders) or 1-800-621-2550 (for Institutional Shareholders).
Views and opinions expressed are for informational purposes only and do not constitute a recommendation by GSAM to buy, sell, or hold any security. Views and opinions are current as of the date of this presentation and may be subject to change, they should not be construed as investment advice.
Goldman Sachs & Co. LLC (“Goldman Sachs”) does not provide legal, tax or accounting advice. Any statement contained in this communication (including any attachments) concerning U.S. tax matters was not intended or written to be used, and cannot be used, for the purpose of avoiding penalties under the Internal Revenue Code, and was written to support the promotion or marketing of transaction or matter addressed. Clients of Goldman Sachs should obtain their own independent tax advice based on their particular circumstances.
The website links provided are for your convenience only and are not an endorsement or recommendation by GSAM of any of these websites or the products or services offered. GSAM is not responsible for the accuracy and validity of the content of these websites.
Fund holdings and allocations shown are as of December 31, 2020 and may not be representative of future investments. Fund holdings should not be relied on in making investment decisions and should not be construed as research or investment advice regarding particular securities. Current and future holdings are subject to risk.
References to indices, benchmarks or other measures of relative market performance over a specified period of time are provided for your information only and do not imply that the portfolio will achieve similar results. The index composition may not reflect the manner in which a portfolio is constructed. While an adviser seeks to design a portfolio which reflects appropriate risk and return features, portfolio characteristics may deviate from those of the benchmark.
The Global Industry Classification Standard (“GICS”) was developed by and is the exclusive property and a service mark of Morgan Stanley Capital International Inc. (“MSCI”) and Standard & Poor’s, a division of The McGraw-Hill Companies, Inc. (“S&P”) and is licensed for use by Goldman Sachs. Neither MSCI, S&P nor any other party involved in making or compiling the GICS or any GICS classifications makes any express or implied warranties or representations with respect to such standard or classification (or the results to be obtained by the use thereof), and all such parties hereby expressly disclaim all warranties of originality, accuracy, completeness, merchantability or fitness for a particular purpose with respect to any of such standard or classification. Without limiting any of the foregoing, in no event shall MSCI, S&P, any of their affiliates or any third party involved in making or compiling the GICS or any GICS classifications have any liability for any direct, indirect, special, punitive, consequential or any other damages (including lost profits) even if notified of the possibility of such damages.
The portfolio risk management process includes an effort to monitor and manage risk, but does not imply low risk.
Shares of the Goldman Sachs VIT Funds are offered to separate accounts of participating life insurance companies for the purpose of funding variable annuity contracts and variable life insurance policies. Shares of the Fund are not offered directly to the general public. The variable annuity contracts and variable life insurance policies are described in the separate prospectuses issued by participating insurance companies. You should refer to those prospectuses for information about surrender charges, mortality and expense risk fees and other charges that may be assessed by participating insurance companies under the variable annuity contracts or variable life insurance policies. Such fees or charges, if any, may affect the return you may realize with respect to your investments. Ask your representative for more complete information. Please consider a fund’s objectives, risks and charges and expenses, and read the prospectus carefully before investing. The prospectus contains this and other information about the Fund.
This material is not authorized for distribution to prospective investors unless preceded or accompanied by a current prospectus or summary prospectus, if applicable. Investors should consider the Fund’s objective, risks, and charges and expenses, and read the summary prospectus, if available, and/or the prospectus carefully before investing or sending money. The summary prospectus, if available, and the prospectus contain this and other information about the Fund and may be obtained from your authorized dealer or from Goldman Sachs & Co. LLC by calling 1-800-621-2550.
This report is prepared for the general information of contract owners and is not an offer of shares of the Goldman Sachs Variable Insurance Trust — Goldman Sachs Small Cap Equity Insights Fund.
© 2021 Goldman Sachs. All rights reserved.
VITSCAR-21/229749-OTU-1350913
Goldman
Sachs Variable Insurance Trust
Goldman Sachs
Strategic Growth Fund
Beginning on or after January 1, 2021, you may not receive paper copies of the Fund’s annual and semi-annual shareholder reports from the insurance company that offers your variable insurance contract or your financial intermediary, unless you specifically request paper copies of the reports from the insurance company or from your financial intermediary. Instead, the reports will be made available on a website, and you will be notified by mail each time a report is posted and provided with a website link to access the report.
If you already elected to receive shareholder reports electronically, you will not be affected by this change and you need not take any action. At any time, you may elect to receive reports and certain communications from the insurance company electronically by contacting your insurance company or your financial intermediary.
You may elect to receive all future shareholder reports in paper free of charge. You can inform the insurance company or your financial intermediary that you wish to receive paper copies of reports. Your election to receive reports in paper will apply to all Goldman Sachs Funds available under your contract and may apply to all funds held with your financial intermediary.
Annual Report
December 31, 2020

GOLDMAN SACHS VARIABLE INSURANCE TRUST STRATEGIC GROWTH FUND
INVESTMENT OBJECTIVE
The Fund seeks long-term growth of capital.
Portfolio Management Discussion and Analysis
At a special meeting of the shareholders of the Goldman Sachs Variable Insurance Trust held on January 8, 2021, the Goldman Sachs Variable Insurance Trust-Goldman Sachs Strategic Growth Fund’s (the “Fund”) shareholders approved a proposal to change the Fund’s sub-classification under the Investment Company Act of 1940, as amended, from “diversified” to “non-diversified” and eliminated the related fundamental investment restriction. Accordingly, effective the same date, the Fund is “non-diversified” and may invest a greater portion of its assets in one or more issuers or in fewer issuers than “diversified” mutual funds. As a “non-diversified” fund, the Fund may be more susceptible to adverse developments affecting any single issuer held in its portfolio and may be more susceptible to greater losses because of these developments. There was no change in the Fund’s investment objective, benchmark or portfolio management team as a result of this shift in diversification status.
Below, the Goldman Sachs Fundamental Equity U.S. Equity Portfolio Management Team discusses the Fund’s performance and positioning for the 12-month period ended December 31, 2020 (the “Reporting Period”).
How did the Fund perform during the Reporting Period?
During the Reporting Period, the Fund’s Institutional and Service Shares generated average annual total returns of 40.37% and 39.98%, respectively. These returns compare to the 38.37% average annual total return of the Fund’s benchmark, the Russell 1000® Growth Index (with dividends reinvested) (the “Russell Index”), during the same time period.
What economic and market factors most influenced the equity markets as a whole during the Reporting Period?
Representing the U.S. equity market, the S&P 500® Index returned 18.34% during the Reporting Period.
The U.S. equity market fell significantly in the first quarter of 2020, selling off as the outbreak and subsequent spread of COVID-19 caused non-essential businesses to close. Jobless claims increased to 6.6 million, and nonfarm payrolls decreased by 701,000 for the month of March, leading the U.S. government to respond with aggressive economic stimulus and the U.S. Federal Reserve (the “Fed”) to respond with unprecedented monetary policy stimulus, including lowering its targeted federal funds rate to zero and re-introducing and expanding its quantitative easing programs. Exacerbating matters was oil prices that fell as supply increased and demand decreased.
After hitting a low on March 23, 2020, the U.S. equity market then rose in the subsequent three quarters of 2020. In the second calendar quarter, the U.S. equity market appreciated despite a surge in COVID-19 cases in regional pockets of the country, causing local governments to pause reopening plans and revisit previous lockdown measures. Positive market sentiment was buoyed by better than consensus expected economic data, such as nonfarm payrolls increasing 7.3 million during May and June 2020, driving the unemployment rate down to 11.1% from 14.7% in April. The U.S. equity markets continued to rally in the third quarter of 2020 despite ongoing pressure from the pandemic. Market strength was supported by a sharp cyclical recovery in economic data, with the Institute for Supply Management’s Manufacturing Purchasing Managers’ Index increasing to 56.0 in August, which is firmly in expansionary territory. Optimism around a potential COVID-19 vaccine also helped support equity markets during the quarter. Still, risks to the market persisted given political uncertainty ahead of the November 2020 U.S. elections, lower levels of Gross Domestic Product, heightened unemployment, questions around how quickly and effectively a vaccine could be distributed, and debates about the extent of a new stimulus package from the federal government. In the fourth quarter of 2020, U.S. stocks extended a broad-based recovery from their steep first quarter declines. Markets rallied on the prospect of an end to the global pandemic and its economic impact with approval and distribution of COVID-19 vaccines. While uncertainty surrounding the then-upcoming U.S. elections and other policy questions created the potential for higher market volatility, the Democratic victory of Joe Biden proved positive for equity markets over the near term. Also, after a historically sharp but short recession during the spring of 2020, many major economies, including that of the U.S., in our view, entered an early-cycle phase of recovery. Employment conditions improved, as temporary job losses were regained in some segments of the economy, and U.S. manufacturing activity recovered. Despite this improvement, reminders of a COVID-19 ceiling for industries hit hardest by the restrictions caused by the pandemic persisted.
1
GOLDMAN SACHS VARIABLE INSURANCE TRUST STRATEGIC GROWTH FUND
For the Reporting Period overall, eight of the 11 sectors in the S&P 500® Index posted positive absolute returns, with seven of those eight generating double-digit gains. Information technology, consumer discretionary and communication services were the best performing sectors in the S&P 500® Index, as measured by total return, while the weakest performing sectors in the S&P 500® Index during the Reporting Period were energy, real estate and financials.
Within the U.S. equity market, all capitalization segments posted double-digit positive returns, led by large-cap stocks, as measured by the Russell 1000® Index, followed closely by small-cap stocks, as measured by the Russell 2000® Index, and then by mid-cap stocks, as measured by the Russell Midcap® Index. From a style perspective, growth-oriented stocks significantly outpaced value-oriented stocks across the capitalization spectrum. (All as measured by the FTSE Russell indices.)
What key factors were responsible for the Fund’s performance during the Reporting Period?
The Fund generated robust double-digit absolute gains that outperformed the Russell Index on a relative basis during the Reporting Period. Stock selection overall contributed positively to the Fund’s relative results. Sector allocation as a whole detracted.
Which equity market sectors most significantly affected Fund performance?
Contributing most positively to the Fund’s relative results during the Reporting Period was effective stock selection in the information technology, health care and industrials sectors. Only two sectors detracted from the Fund’s relative results during the Reporting Period, attributable primarily to allocation positioning. Having an overweight to materials, which posted positive returns but lagged the Russell Index during the Reporting Period, and having an overweight to energy, which was the weakest performing sector in the Russell Index during the Reporting Period, dampened relative results. Having a position in cash, albeit modest, during a Reporting Period when the Russell Index rallied further muted the Fund’s relative results.
What were some of the Fund’s best-performing individual stocks?
Among those stocks the Fund benefited most from relative to the Russell Index were graphics processors, chipsets and multimedia software manufacturer NVIDIA, diagnostics imaging and therapeutics products manufacturer Immunomedics and digital telecommunications company QUALCOMM.
NVIDIA’s stock performed well after solid earnings reports and guidance in February 2020. NVIDIA’s earnings report showed strength in its artificial intelligence chips for the data center business, which drove a majority of its earnings’ upside. The company also raised revenue guidance despite headwinds from COVID-19. Its shares rallied again in mid-August, as investors responded positively to strong operating results, with the company’s data center segment showing up as a particular bright spot. In mid-September, the company announced it would be acquiring U.K. chipmaker ARM from SoftBank. This deal solidifies, in our view, NVIDIA’s competitive positioning over the long run, along with offering business line diversification. At the end of the Reporting Period, we were optimistic that robust data center growth would continue to drive NVIDIA’s operations going forward.
Shares of Immunomedics fell in the second quarter of 2020 after the company experienced COVID-19-related headwinds that were highlighted in its first calendar quarter earnings update. The company and its prized breast cancer drug were then acquired by biopharmaceutical company Gilead Sciences in September 2020 for more than $20 billion. We decided to capitalize on the transaction, taking profits, and to allocate the capital toward what we saw as more attractive risk/reward opportunities elsewhere.
QUALCOMM, a new purchase for the Fund during the Reporting Period, was a direct beneficiary of the global fifth-generation (“5G”) technology rollout given its owned patents and royalty streams. The company reported better than consensus expected third quarter 2020 earnings thanks to its differentiated solutions and increased sales volume. It also had undertaken an exposure to the auto industry, which was viewed favorably by investors. At the end of the Reporting Period, we maintained a positive view on QUALCOMM.
Which stocks detracted significantly from the Fund’s performance during the Reporting Period?
Detracting from the Fund’s results relative to the Russell Index were positions in information technology giant Apple, medical device manufacturer Boston Scientific and apparel retailer PVH.
The Fund’s underweight position in Apple detracted most from its relative results, as Apple’s stock appreciated significantly during the Reporting Period. At the end of the Reporting Period, we maintained a moderate underweight position in Apple, as we liked its business model and thought there would eventually be pent-up demand for iPhones, wearables and services, but we also believed its valuation may have been a bit stretched and there could be a lingering impact from retail closures in parts of its business.
Significant pressure on the health care sector in March and April 2020 was the primary reason Boston Scientific’s stock price declined during the Reporting Period. We maintained our positive outlook on the company, as its operational trends were showing signs of improvement, in our view. With the resumption of elective procedures and heavy investment into its product pipeline, its
2
GOLDMAN SACHS VARIABLE INSURANCE TRUST STRATEGIC GROWTH FUND
stock appreciated in the late summer, which we saw as a positive development. In addition, its opportunity for margin expansion led us to believe Boston Scientific’s stock may well rebound going into the new year.
Shares of PVH declined early in 2020 in tandem with the broader apparel sell-off, as the spread of COVID-19 forced stores to close operations. Overall, its sales subsequently recovered faster than the consensus expected, despite renewed lockdowns in certain parts of the U.S. and internationally. At the end of the Reporting Period, we believed the long-term story of PVH’s widely recognizable brands and international footprint should be poised to resume after the disruptions.
How did the Fund use derivatives and similar instruments during the Reporting Period?
During the Reporting Period, we did not use derivatives as part of an active management strategy.
Did the Fund make any significant purchases or sales during the Reporting Period?
In addition to the purchase of QUALCOMM, already mentioned, we established a Fund position in electric vehicle manufacturer Tesla during the Reporting Period. Its share price increased significantly in 2020 due to strong manufacturing metrics and positive investor sentiment. At the end of the Reporting Period, we continued to like the company and its prospects, but we were cautiously hesitant around the inherent risks and volatility that comes with the name. We believed Tesla’s execution had sustainably improved and the company may be able to continue to deliver as the demand environment normalizes longer term.
Conversely, in addition to the sale of Immunomedics, mentioned earlier, we eliminated the Fund’s position in research-based biopharmaceutical company AbbVie. While we still believed in its core business, we decided to sell the stock due to what we considered to be its high valuation and other more attractive risk/reward opportunities elsewhere.
We exited the Fund’s position in management and consulting firm Accenture during the Reporting Period. We remained bullish on the digital opportunity within the information technology services industry, but preferred different names within the industry at the time.
Were there any notable changes in the Fund’s weightings during the Reporting Period?
In constructing the Fund’s portfolio, we focus on picking stocks rather than on making industry or sector bets. We seek to outpace the benchmark index by overweighting stocks that we expect to outperform and underweighting those that we think may lag. Consequently, changes in its sector weights are generally the direct result of individual stock selection or of stock appreciation or depreciation. That said, during the Reporting Period, the Fund’s exposure to communication services and consumer discretionary increased compared to the Russell Index. The Fund’s allocations compared to the Russell Index in health care decreased, and its allocation to energy was eliminated.
How was the Fund positioned relative to its benchmark index at the end of the Reporting Period?
At the end of December 2020, the Fund had overweighted positions relative to the Russell Index in the communication services and materials sectors. On the same date, the Fund had underweighted positions compared to the Russell Index in information technology and industrials and was rather neutrally weighted to the Russell Index in consumer discretionary, health care, consumer staples, real estate and financials. The Fund had no exposure to the utilities and energy sectors at the end of the Reporting Period.
Were there any changes to the Fund’s portfolio management team during the Reporting Period?
There were no changes to the Fund’s portfolio management team during the Reporting Period.
What is the Fund’s tactical view and strategy for the months ahead?
The U.S. equity markets rebounded from pandemic-induced lows in the first quarter of 2020 to round out the calendar year with multiple tailwinds from pent-up demand to significant cash reserves. As the markets anticipated an economic recovery alongside the rollout of the COVID-19 vaccines, we remained vigilant at the end of the Reporting Period in navigating through optimistic market sentiment given the potential for volatility. While we see a path to an uptick in global economic activity to support further market upside, we simultaneously caution that the economy remains in the infancy of its recovery, and uneven progress suggests that full macroeconomic normalization may well remain dependent on the trajectory of COVID-19 recovery, successful global vaccine distribution and inoculation, and ongoing fiscal and monetary policy. As the economic expansion widens, we expected, at the end of the Reporting Period, the U.S. equity market rally to continue but with broader sector participation. Within this recovery period, we believe it is crucial to stay true to our quality-first investment approach, seeking to invest in businesses with healthy balance sheets, relatively stable free cash flow generation, and differentiated business models aligned to secular advantages.
Indeed, regardless of market direction, we remain committed to our core philosophy and process. We continue to re-evaluate our assumptions with increasing information, and we stay focused on the long-term investment horizon, rather than forecast the next quarter. As always, we maintain our focus on seeking companies that we believe will generate long-term growth in today’s ever-changing market conditions.
3
GOLDMAN SACHS VARIABLE INSURANCE TRUST STRATEGIC GROWTH FUND
Index Definitions
The Russell 1000® Growth Index is an unmanaged market capitalization weighted index of the 1000 largest U.S. companies with higher price-to-book ratios and higher forecasted growth values. The figures for the index do not include any deduction for fees, expenses or taxes.
The Russell 2000® Index is an unmanaged index of common stock prices that measures the performance of the 2000 smallest companies in the Russell 3000® Index. The figures for the index do not include any deduction for fees, expenses or taxes.
The S&P 500® Index is the Standard & Poor’s composite index of 500 stocks, an unmanaged index of common stock prices. The figures for the index do not include any deduction for fees, expenses or taxes.
The Russell Midcap® Index measures the performance of the 800 smallest companies in the Russell 1000® Index, which represent approximately 25% of the total market capitalization of the Russell 1000® Index.
The Russell 1000® Index measures the performance of the 1,000 largest companies in the Russell 3000® Index, which represent approximately 92% of the total market capitalization of the Russell 3000® Index.
It is not possible to invest directly in an index.
4
FUND BASICS
Strategic Growth Fund
as of December 31, 2020
TOP TEN HOLDINGS AS OF 12/31/201
| | | | | | |
| | |
| Holding | | % of Net Assets | | | Line of Business |
| Apple, Inc. | | | 8.0% | | | Technology Hardware & Equipment |
| Microsoft Corp. | | | 6.1 | | | Software & Services |
| Amazon.com, Inc. | | | 5.0 | | | Retailing |
| Facebook, Inc. Class A | | | 4.5 | | | Media & Entertainment |
| Visa, Inc. Class A | | | 3.6 | | | Software & Services |
| Alphabet, Inc. Class A | | | 3.4 | | | Media & Entertainment |
| Tesla, Inc. | | | 2.8 | | | Automobiles & Components |
| QUALCOMM, Inc. | | | 2.8 | | | Semiconductors & Semiconductor Equipment |
| NVIDIA Corp. | | | 2.7 | | | Semiconductors & Semiconductor Equipment |
| Mastercard, Inc. Class A | | | 2.6 | | | Software & Services |
| 1 | The top 10 holdings may not be representative of the Fund’s future investments. |
FUND vs. BENCHMARK SECTOR ALLOCATIONS2
As of December 31, 2020
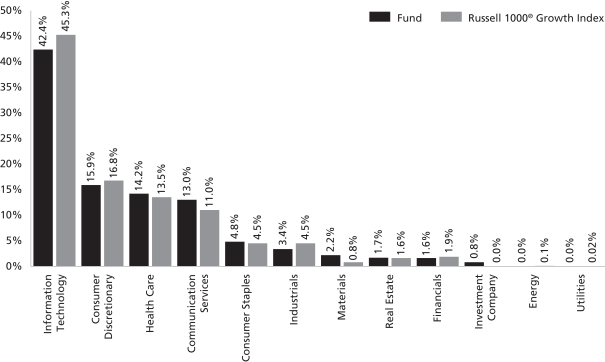
| 2 | The Fund is actively managed and, as such, its composition may differ over time. Consequently, the Fund’s overall sector allocations may differ from percentages contained in the graph above. The graph categorizes investments using Global Industry Classification Standard (“GICS”); however, the sector classifications used by the portfolio management team may differ from GICS. The percentage shown for each investment category reflects the value of investments in that category as a percentage of market value (excluding investments in the securities lending reinvestment vehicle, if any). Underlying sector allocations of exchange traded funds and investment companies held by the Fund are not reflected in the graph above. Investments in the securities lending reinvestment vehicle represented 1.0% of the Fund’s net assets at December 31, 2020. |
For more information about your Fund, please refer to www.GSAMFUNDS.com. There, you can learn more about your Fund’s investment strategies, holdings, and performance.
5
GOLDMAN SACHS VARIABLE INSURANCE TRUST STRATEGIC GROWTH FUND
Performance Summary
December 31, 2020
The following graph shows the value, as of December 31, 2020, of a $10,000 investment made on January 1, 2011 in Service Shares at NAV. For comparative purposes, the performance of the Fund’s benchmark, the Russell 1000® Growth Index (with distributions reinvested), is shown. Performance reflects applicable fee waivers and/or expense limitations in effect during the periods shown and in their absence, performance would be reduced. Returns do not reflect the deduction of taxes that a shareholder would pay on Fund distributions or the redemption of Fund shares. The returns set forth below represent past performance. Past performance does not guarantee future results. The Fund’s investment return and principal value will fluctuate so that an investor’s shares, when redeemed, may be worth more or less than their original cost. Current performance may be lower or higher than the performance quoted below. Please visit our web site at www.GSAMFUNDS.com to obtain the most recent month-end returns.
Strategic Growth Fund’s 10 Year Performance
Performance of a $10,000 investment, with distributions reinvested, from January 1, 2011 through December 31, 2020.
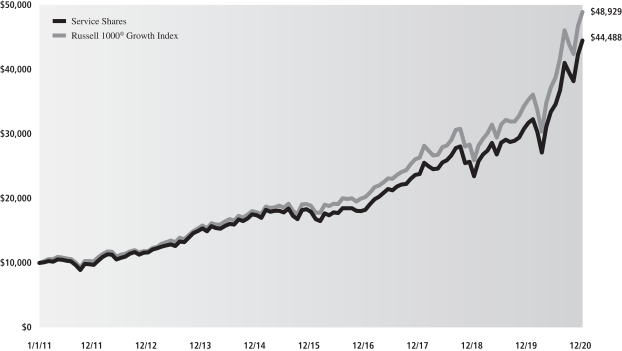
| | | | | | |
| Average Annual Total Return through December 31, 2020 | | One Year | | Five Years | | Ten Years |
Institutional | | 40.37% | | 20.19% | | 16.37% |
Service | | 39.98% | | 19.90% | | 16.08% |
6
GOLDMAN SACHS VARIABLE INSURANCE TRUST STRATEGIC GROWTH FUND
Schedule of Investments
December 31, 2020
| | | | | | | | |
Shares | | | Description | | Value | |
|
| Common Stocks – 99.1% | |
| Automobiles & Components – 3.5% | |
| | 21,937 | | | Aptiv plc | | $ | 2,858,172 | |
| | 16,831 | | | Tesla, Inc.* | | | 11,877,132 | |
| | | | | | | | |
| | | | | | | 14,735,304 | |
| | |
| Capital Goods – 1.3% | | | |
| | 11,625 | | | Boeing Co. (The) | | | 2,488,447 | |
| | 11,612 | | | Deere & Co. | | | 3,124,209 | |
| | | | | | | | |
| | | | | | | 5,612,656 | |
| | |
| Commercial & Professional Services – 0.8% | | | |
| | 16,358 | | | Verisk Analytics, Inc. | | | 3,395,757 | |
| | |
| Consumer Durables & Apparel – 2.9% | | | |
| | 8,335 | | | Lululemon Athletica, Inc.* | | | 2,900,830 | |
| | 53,482 | | | NIKE, Inc. Class B | | | 7,566,099 | |
| | 21,317 | | | PVH Corp. | | | 2,001,453 | |
| | | | | | | | |
| | | | | | | 12,468,382 | |
| | |
| Consumer Services – 2.0% | | | |
| | 24,503 | | | Chegg, Inc.* | | | 2,213,356 | |
| | 33,644 | | | Las Vegas Sands Corp. | | | 2,005,182 | |
| | 19,853 | | | McDonald’s Corp. | | | 4,260,057 | |
| | | | | | | | |
| | | | | | | 8,478,595 | |
| | |
| Diversified Financials – 1.6% | | | |
| | 71,983 | | | Charles Schwab Corp. (The) | | | 3,817,979 | |
| | 27,235 | | | Intercontinental Exchange, Inc. | | | 3,139,923 | |
| | | | | | | | |
| | | | | | | 6,957,902 | |
| | |
| Food & Staples Retailing – 0.8% | | | |
| | 22,635 | | | Walmart, Inc. | | | 3,262,835 | |
| | |
| Food, Beverage & Tobacco – 2.9% | | | |
| | 88,910 | | | Coca-Cola Co. (The) | | | 4,875,824 | |
| | 23,236 | | | McCormick & Co., Inc. (Non-Voting) | | | 2,221,362 | |
| | 36,864 | | | Mondelez International, Inc. Class A | | | 2,155,438 | |
| | 30,988 | | | Monster Beverage Corp.* | | | 2,865,770 | |
| | | | | | | | |
| | | | | | | 12,118,394 | |
| | |
| Health Care Equipment & Services – 7.0% | | | |
| | 70,925 | | | American Well Corp. Class A*(a) | | | 1,796,530 | |
| | 132,245 | | | Boston Scientific Corp.* | | | 4,754,208 | |
| | 16,625 | | | Danaher Corp. | | | 3,693,077 | |
| | 22,539 | | | Guardant Health, Inc.* | | | 2,904,826 | |
| | 9,391 | | | Humana, Inc. | | | 3,852,846 | |
| | 10,268 | | | Insulet Corp.* | | | 2,624,809 | |
| | 4,879 | | | Intuitive Surgical, Inc.* | | | 3,991,510 | |
| | 8,917 | | | Veeva Systems, Inc. Class A* | | | 2,427,653 | |
| | 13,093 | | | West Pharmaceutical Services, Inc. | | | 3,709,378 | |
| | | | | | | | |
| | | | | | | 29,754,837 | |
| | |
| Household & Personal Products – 1.1% | | | |
| | 17,254 | | | Estee Lauder Cos., Inc. (The) Class A | | | 4,592,842 | |
| | |
| Materials – 2.2% | |
| | 11,133 | | | Ecolab, Inc. | | | 2,408,736 | |
| | 8,883 | | | Linde plc | | | 2,340,759 | |
| | 6,012 | | | Martin Marietta Materials, Inc. | | | 1,707,228 | |
| | 3,863 | | | Sherwin-Williams Co. (The) | | | 2,838,957 | |
| | | | | | | | |
| | | | | | | 9,295,680 | |
| | |
| Media & Entertainment – 13.0% | | | |
| | 8,209 | | | Alphabet, Inc. Class A* | | | 14,387,422 | |
| | 5,027 | | | Alphabet, Inc. Class C* | | | 8,806,701 | |
| | 70,518 | | | Facebook, Inc. Class A* | | | 19,262,697 | |
| | 34,194 | | | Live Nation Entertainment, Inc.* | | | 2,512,575 | |
| | 16,088 | | | Netflix, Inc.* | | | 8,699,264 | |
| | 34,575 | | | Snap, Inc. Class A* | | | 1,731,170 | |
| | | | | | | | |
| | | | | | | 55,399,829 | |
| | |
| Pharmaceuticals, Biotechnology & Life Sciences – 7.2% | |
| | 15,782 | | | 10X Genomics, Inc. Class A* | | | 2,234,731 | |
| | 48,058 | | | Adaptive Biotechnologies Corp.* | | | 2,841,670 | |
| | 41,398 | | | AstraZeneca plc ADR | | | 2,069,486 | |
| | 23,192 | | | BioMarin Pharmaceutical, Inc.* | | | 2,033,707 | |
| | 63,412 | | | Bristol-Myers Squibb Co. | | | 3,933,446 | |
| | 32,625 | | | Eli Lilly and Co. | | | 5,508,405 | |
| | 54,955 | | | Genmab A/S ADR* | | | 2,234,470 | |
| | 11,354 | | | Illumina, Inc.* | | | 4,200,980 | |
| | 14,524 | | | Sarepta Therapeutics, Inc.* | | | 2,476,197 | |
| | 18,245 | | | Seagen, Inc.* | | | 3,195,429 | |
| | | | | | | | |
| | | | | | | 30,728,521 | |
| | |
| Real Estate Investment Trusts – 1.7% | | | |
| | 16,878 | | | American Tower Corp. | | | 3,788,436 | |
| | 4,728 | | | Equinix, Inc. | | | 3,376,643 | |
| | | | | | | | |
| | | | | | | 7,165,079 | |
| | |
| Retailing – 7.5% | | | |
| | 6,492 | | | Amazon.com, Inc.* | | | 21,143,989 | |
| | 15,790 | | | Etsy, Inc.* | | | 2,809,199 | |
| | 37,243 | | | Ross Stores, Inc. | | | 4,573,813 | |
| | 12,274 | | | Ulta Beauty, Inc.* | | | 3,524,602 | |
| | | | | | | | |
| | | | | | | 32,051,603 | |
| | |
| Semiconductors & Semiconductor Equipment – 7.2% | | | |
| | 58,499 | | | Marvell Technology Group Ltd. | | | 2,781,043 | |
| | 21,860 | | | NVIDIA Corp. | | | 11,415,292 | |
| | 29,786 | | | NXP Semiconductors NV | | | 4,736,272 | |
| | 77,160 | | | QUALCOMM, Inc. | | | 11,754,554 | |
| | | | | | | | |
| | | | | | | 30,687,161 | |
| | |
| Software & Services – 26.1% | | | |
| | 19,505 | | | Adobe, Inc.* | | | 9,754,841 | |
| | 11,040 | | | Atlassian Corp. plc Class A* | | | 2,581,925 | |
| | 22,024 | | | C3.ai, Inc. Class A*(a) | | | 3,055,830 | |
| | 36,499 | | | Fidelity National Information Services, Inc. | | | 5,163,148 | |
| | 8,544 | | | HubSpot, Inc.* | | | 3,387,183 | |
| | 31,431 | | | Mastercard, Inc. Class A | | | 11,218,981 | |
| | |
| | |
| The accompanying notes are an integral part of these financial statements. | | 7 |
GOLDMAN SACHS VARIABLE INSURANCE TRUST STRATEGIC GROWTH FUND
Schedule of Investments (continued)
December 31, 2020
| | | | | | | | |
Shares | | | Description | | Value | |
|
| Common Stocks – (continued) | |
| Software & Services – (continued) | | | |
| | 116,402 | | | Microsoft Corp. | | $ | 25,890,133 | |
| | 47,263 | | | PayPal Holdings, Inc.* | | | 11,068,995 | |
| | 12,946 | | | salesforce.com, Inc.* | | | 2,880,873 | |
| | 11,384 | | | ServiceNow, Inc.* | | | 6,266,095 | |
| | 7,372 | | | Snowflake, Inc. Class A* | | | 2,074,481 | |
| | 25,722 | | | Splunk, Inc.* | | | 4,369,911 | |
| | 69,285 | | | Visa, Inc. Class A | | | 15,154,708 | |
| | 34,787 | | | Workday, Inc. Class A* | | | 8,335,313 | |
| | | | | | | | |
| | | | | | | 111,202,417 | |
| | |
| Technology Hardware & Equipment – 9.0% | |
| | 33,574 | | | Amphenol Corp. Class A | | | 4,390,472 | |
| | 256,852 | | | Apple, Inc. | | | 34,081,692 | |
| | | | | | | | |
| | | | | | | 38,472,164 | |
| | |
| Transportation – 1.3% | |
| | 16,527 | | | CSX Corp. | | | 1,499,825 | |
| | 19,654 | | | Union Pacific Corp. | | | 4,092,356 | |
| | | | | | | | |
| | | | | | | 5,592,181 | |
| | |
| | TOTAL COMMON STOCKS | |
| | (Cost $188,897,580) | | $ | 421,972,139 | |
| | |
| | | | | | | | |
| Shares | | Dividend
Rate | | | Value | |
|
| Investment Company(b) – 0.8% | |
Goldman Sachs Financial Square Government Fund — Institutional Shares | |
| 3,315,576 | | | 0.026 | % | | $ | 3,315,576 | |
| (Cost $3,315,576) | | | | | |
| |
| TOTAL INVESTMENTS BEFORE SECURITIES LENDING REINVESTMENT VEHICLE | |
(Cost $192,213,156) | | | $ | 425,287,715 | |
| |
| | | | | | | | |
|
| Securities Lending Reinvestment Vehicle(b) – 1.0% | |
Goldman Sachs Financial Square Government Fund — Institutional Shares | |
| 4,259,666 | | | 0.026 | % | | $ | 4,259,666 | |
| (Cost $4,259,666) | |
| |
| TOTAL INVESTMENTS – 100.9% | |
| (Cost $196,472,822) | | | $ | 429,547,381 | |
| |
LIABILITIES IN EXCESS OF OTHER ASSETS – (0.9)% | | | | (3,903,376 | ) |
| |
| NET ASSETS – 100.0% | | | $ | 425,644,005 | |
| |
| | |
| The percentage shown for each investment category reflects the value of investments in that category as a percentage of net assets. |
| |
| * | | Security is currently in default and/or non-income producing. |
| |
| (a) | | All or a portion of security is on loan. |
| |
| (b) | | Represents an Affiliated Issuer. |
| | |
| |
| Investment Abbreviation: |
| ADR | | —American Depositary Receipt |
| | |
| 8 | | The accompanying notes are an integral part of these financial statements. |
GOLDMAN SACHS VARIABLE INSURANCE TRUST STRATEGIC GROWTH FUND
Statement of Assets and Liabilities
December 31, 2020
| | | | |
| | | | |
| Assets: | | | |
Investments in unaffiliated issuers, at value (cost $188,897,580)(a) | | $ | 421,972,139 | |
Investments in affiliated issuers, at value (cost $3,315,576) | | | 3,315,576 | |
Investments in affiliated securities lending reinvestment vehicle, at value (cost $4,259,666) | | | 4,259,666 | |
Cash | | | 516,264 | |
Receivables: | | | | |
Fund shares sold | | | 259,212 | |
Dividends | | | 129,073 | |
Reimbursement from investment adviser | | | 19,378 | |
Securities lending income | | | 3,331 | |
Other assets | | | 1,227 | |
| |
| Total assets | | | 430,475,866 | |
| |
| | | | |
| Liabilities: | | | |
Payables: | | | | |
Payable upon return of securities loaned | | | 4,259,666 | |
Management fees | | | 251,276 | |
Fund shares redeemed | | | 79,942 | |
Distribution and Service fees and Transfer Agency fees | | | 60,886 | |
Accrued expenses | | | 180,091 | |
| |
| Total liabilities | | | 4,831,861 | |
| |
| | | | |
| Net Assets: | | | |
Paid-in capital | | | 185,684,438 | |
Total distributable earnings (loss) | | | 239,959,567 | |
| |
| NET ASSETS | | $ | 425,644,005 | |
Net Assets: | | | | |
Institutional | | $ | 167,929,894 | |
Service | | | 257,714,111 | |
| |
Total Net Assets | | $ | 425,644,005 | |
Shares outstanding $0.001 par value (unlimited shares authorized): | | | | |
Institutional | | | 10,882,371 | |
Service | | | 16,722,583 | |
Net asset value, offering and redemption price per share: | | | | |
Institutional | | | $15.43 | |
Service | | | 15.41 | |
(a) Includes loaned securities having a market value of $4,156,911.
| | |
| The accompanying notes are an integral part of these financial statements. | | 9 |
GOLDMAN SACHS VARIABLE INSURANCE TRUST STRATEGIC GROWTH FUND
Statement of Operations
For the Fiscal Year Ended December 31, 2020
| | | | |
| | | | |
| Investment income: | |
Dividends — unaffiliated issuers (net of foreign taxes withheld of $6,418) | | $ | 2,684,494 | |
Securities lending income — unaffiliated issuer | | | 14,889 | |
Dividends — affiliated issuers | | | 8,271 | |
Interest | | | 824 | |
| |
| Total investment income | | | 2,708,478 | |
| |
| | | | |
| Expenses: | | | |
Management fees | | | 2,587,267 | |
Distribution and Service (12b -1) fees | | | 563,466 | |
Professional fees | | | 103,690 | |
Printing and mailing costs | | | 82,960 | |
Custody, accounting and administrative services | | | 80,084 | |
Transfer Agency fees(a) | | | 72,874 | |
Trustee fees | | | 21,062 | |
Other | | | 17,257 | |
| |
| Total expenses | | | 3,528,660 | |
| |
Less — expense reductions | | | (260,571 | ) |
| |
| Net expenses | | | 3,268,089 | |
| |
| NET INVESTMENT LOSS | | | (559,611 | ) |
| |
| | | | |
| Realized and unrealized gain: | | | |
Net realized gain from investments — unaffiliated issuers | | | 39,110,537 | |
Net change in unrealized gain on investments — unaffiliated issuers | | | 78,842,415 | |
| |
| Net realized and unrealized gain | | | 117,952,952 | |
| |
| NET INCREASE IN NET ASSETS RESULTING FROM OPERATIONS | | $ | 117,393,341 | |
(a) Institutional and Service Shares incurred Transfer Agency fees of $27,801 and $45,073, respectively.
| | |
| 10 | | The accompanying notes are an integral part of these financial statements. |
GOLDMAN SACHS VARIABLE INSURANCE TRUST STRATEGIC GROWTH FUND
Statements of Changes in Net Assets
| | | | | | | | |
| | | For the
Fiscal Year Ended
December 31, 2020 | | | For the
Fiscal Year Ended
December 31, 2019 | |
| | | | | | | | |
| From operations: | |
Net investment income (loss) | | $ | (559,611 | ) | | $ | 435,982 | |
Net realized gain | | | 39,110,537 | | | | 18,838,812 | |
Net change in unrealized gain | | | 78,842,415 | | | | 74,794,292 | |
| | |
| Net increase in net assets resulting from operations | | | 117,393,341 | | | | 94,069,086 | |
| |
| | | | | | | | |
| Distributions to shareholders: | | | | | | |
From distributable earnings: | | | | | | | | |
Institutional Shares | | | (12,680,432 | ) | | | (13,128,250 | ) |
Service Shares | | | (19,462,681 | ) | | | (24,038,886 | ) |
| | |
| Total distributions to shareholders | | | (32,143,113 | ) | | | (37,167,136 | ) |
| |
| | | | | | | | |
| From share transactions: | | | | | | |
Proceeds from sales of shares | | | 82,639,601 | | | | 99,931,813 | |
Reinvestment of distributions | | | 32,143,113 | | | | 37,167,136 | |
Cost of shares redeemed | | | (145,449,611 | ) | | | (64,553,057 | ) |
| | |
| Net increase (decrease) in net assets resulting from share transactions | | | (30,666,897 | ) | | | 72,545,892 | |
| | |
| TOTAL INCREASE | | | 54,583,331 | | | | 129,447,842 | |
| |
| | | | | | | | |
| Net Assets: | | | | | | |
| | |
Beginning of year | | | 371,060,674 | | | | 241,612,832 | |
| | |
End of year | | $ | 425,644,005 | | | $ | 371,060,674 | |
| | |
| The accompanying notes are an integral part of these financial statements. | | 11 |
GOLDMAN SACHS VARIABLE INSURANCE TRUST STRATEGIC GROWTH FUND
Financial Highlights
Selected Data for a Share Outstanding Throughout Each Year
| | | | | | | | | | | | | | | | | | | | |
| | | Goldman Sachs Strategic Growth Fund | |
| | | Institutional Shares | |
| | | Year Ended December 31, | |
| | 2020 | | | 2019 | | | 2018 | | | 2017 | | | 2016 | |
| | | | | | | | | | | | | | | | | | | | |
| Per Share Data | | | | | | | | | | | | | | | |
| | | | | |
Net asset value, beginning of year | | $ | 11.90 | | | $ | 9.78 | | | $ | 19.73 | | | $ | 15.83 | | | $ | 15.62 | |
| | | | | |
Net investment income (loss)(a) | | | — | (b) | | | 0.03 | | | | 0.06 | | | | 0.09 | | | | 0.07 | |
| | | | | |
Net realized and unrealized gain (loss) | | | 4.79 | | | | 3.43 | | | | (0.18 | ) | | | 4.77 | | | | 0.24 | |
| | | | | |
Total from investment operations | | | 4.79 | | | | 3.46 | | | | (0.12 | ) | | | 4.86 | | | | 0.31 | |
| | | | | |
Distributions to shareholders from net investment income | | | (0.01 | ) | | | (0.04 | ) | | | (0.10 | ) | | | (0.10 | ) | | | (0.10 | ) |
| | | | | |
Distributions to shareholders from net realized gains | | | (1.25 | ) | | | (1.30 | ) | | | (9.73 | ) | | | (0.86 | ) | | | — | (b) |
| | | | | |
Total distributions | | | (1.26 | ) | | | (1.34 | ) | | | (9.83 | ) | | | (0.96 | ) | | | (0.10 | ) |
| | | | | |
Net asset value, end of year | | $ | 15.43 | | | $ | 11.90 | | | $ | 9.78 | | | $ | 19.73 | | | $ | 15.83 | |
| | | | | |
Total return(c) | | | 40.37 | % | | | 35.53 | % | | | (1.04 | )% | | | 30.66 | % | | | 1.98 | % |
| | | | | |
Net assets, end of year (in 000s) | | $ | 167,930 | | | $ | 129,686 | | | $ | 102,199 | | | $ | 115,693 | | | $ | 98,090 | |
| | | | | |
Ratio of net expenses to average net assets | | | 0.74 | % | | | 0.77 | % | | | 0.74 | % | | | 0.76 | % | | | 0.79 | % |
| | | | | |
Ratio of total expenses to average net assets | | | 0.81 | % | | | 0.85 | % | | | 0.82 | % | | | 0.82 | % | | | 0.84 | % |
| | | | | |
Ratio of net investment income (loss) to average net assets | | | (0.01 | )% | | | 0.29 | % | | | 0.30 | % | | | 0.48 | % | | | 0.48 | % |
| | | | | |
Portfolio turnover rate(e) | | | 45 | % | | | 44 | % | | | 41 | % | | | 37 | % | | | 72 | % |
| (a) | Calculated based on the average shares outstanding methodology. |
| (b) | Amount is less than $0.005 per share. |
| (c) | Assumes investment at the net asset value at the beginning of the year, reinvestment of all distributions, a complete redemption of the investment at the net asset value at the end of the year and no sales or redemption charges (if any). Total returns would be reduced if a sales or redemption charge was taken into account. Returns do not reflect the impact of taxes to shareholders relating to Fund distributions or the redemption of Fund shares. |
| (d) | The Fund’s portfolio turnover rate is calculated in accordance with regulatory requirements, without regard to transactions involving short term investments. If such transactions were included, the Fund’s portfolio turnover rate may be higher. |
| | |
| 12 | | The accompanying notes are an integral part of these financial statements. |
GOLDMAN SACHS VARIABLE INSURANCE TRUST STRATEGIC GROWTH FUND
Financial Highlights (continued)
Selected Data for a Share Outstanding Throughout Each Year
| | | | | | | | | | | | | | | | | | | | |
| | | Goldman Sachs Strategic Growth Fund | |
| | | Service Shares | |
| | | Year Ended December 31, | |
| | 2020 | | | 2019 | | | 2018 | | | 2017 | | | 2016 | |
| | | | | | | | | | | | | | | | | | | | |
| Per Share Data | | | | | | | | | | | | | | | |
| | | | | |
Net asset value, beginning of year | | $ | 11.91 | | | $ | 9.78 | | | $ | 19.68 | | | $ | 15.79 | | | $ | 15.59 | |
| | | | | |
Net investment income (loss)(a) | | | (0.03 | ) | | | 0.01 | | | | 0.01 | | | | 0.04 | | | | 0.03 | |
| | | | | |
Net realized and unrealized gain (loss) | | | 4.78 | | | | 3.43 | | | | (0.18 | ) | | | 4.76 | | | | 0.23 | |
| | | | | |
Total from investment operations | | | 4.75 | | | | 3.44 | | | | (0.17 | ) | | | 4.80 | | | | 0.26 | |
| | | | | |
Distributions to shareholders from net investment income | | | — | | | | (0.01 | ) | | | — | | | | (0.05 | ) | | | (0.06 | ) |
| | | | | |
Distributions to shareholders from net realized gains | | | (1.25 | ) | | | (1.30 | ) | | | (9.73 | ) | | | (0.86 | ) | | | — | (b) |
| | | | | |
Total distributions | | | (1.25 | ) | | | (1.31 | ) | | | (9.73 | ) | | | (0.91 | ) | | | (0.06 | ) |
| | | | | |
Net asset value, end of year | | $ | 15.41 | | | $ | 11.91 | | | $ | 9.78 | | | $ | 19.68 | | | $ | 15.79 | |
| | | | | |
Total return(c) | | | 39.98 | % | | | 35.32 | % | | | (1.32 | )% | | | 30.36 | % | | | 1.69 | % |
| | | | | |
Net assets, end of year (in 000s) | | $ | 257,714 | | | $ | 241,375 | | | $ | 139,414 | | | $ | 425,679 | | | $ | 368,242 | |
| | | | | |
Ratio of net expenses to average net assets | | | 0.99 | % | | | 1.02 | % | | | 0.99 | % | | | 1.01 | % | | | 1.04 | % |
| | | | | |
Ratio of total expenses to average net assets | | | 1.06 | % | | | 1.10 | % | | | 1.07 | % | | | 1.07 | % | | | 1.08 | % |
| | | | | |
Ratio of net investment income (loss) to average net assets | | | (0.24 | )% | | | 0.04 | % | | | 0.04 | % | | | 0.23 | % | | | 0.22 | % |
| | | | | |
Portfolio turnover rate(d) | | | 45 | % | | | 44 | % | | | 41 | % | | | 37 | % | | | 72 | % |
| (a) | Calculated based on the average shares outstanding methodology. |
| (b) | Amount is less than $0.005 per share. |
| (c) | Assumes investment at the net asset value at the beginning of the year, reinvestment of all distributions, a complete redemption of the investment at the net asset value at the end of the year and no sales or redemption charges (if any). Total returns would be reduced if a sales or redemption charge was taken into account. Returns do not reflect the impact of taxes to shareholders relating to Fund distributions or the redemption of Fund shares. |
| (d) | The Fund’s portfolio turnover rate is calculated in accordance with regulatory requirements, without regard to transactions involving short term investments. If such transactions were included, the Fund’s portfolio turnover rate may be higher. |
| | |
| The accompanying notes are an integral part of these financial statements. | | 13 |
GOLDMAN SACHS VARIABLE INSURANCE TRUST STRATEGIC GROWTH FUND
Notes to Financial Statements
December 31, 2020
1. ORGANIZATION
Goldman Sachs Variable Insurance Trust (the “Trust” or “VIT”) is a Delaware statutory trust registered under the Investment Company Act of 1940, as amended (the “Act”), as an open-end management investment company. The Trust includes the Goldman Sachs Strategic Growth Fund (the “Fund”). The Fund is a diversified portfolio under the Act offering two classes of shares — Institutional and Service Shares. At a special meeting of shareholders on January 8, 2021, the Fund’s shareholders approved a proposal to change the Fund’s sub-classification under the Investment Company Act of 1940 from “diversified” to “non-diversified”. Shares of the Trust are offered to separate accounts of participating life insurance companies for the purpose of funding variable annuity contracts and variable life insurance policies.
Goldman Sachs Asset Management, L.P. (“GSAM”), an affiliate of Goldman Sachs & Co. LLC (“Goldman Sachs”), serves as investment adviser to the Fund pursuant to a management agreement (the “Agreement”) with the Trust.
2. SIGNIFICANT ACCOUNTING POLICIES
The financial statements have been prepared in accordance with accounting principles generally accepted in the United States of America (“GAAP”) and require management to make estimates and assumptions that may affect the reported amounts and disclosures. Actual results may differ from those estimates and assumptions. The Fund is an investment company under GAAP and follows the accounting and reporting guidance applicable to investment companies.
A. Investment Valuation — The Fund’s valuation policy is to value investments at fair value.
B. Investment Income and Investments — Investment income includes interest income, dividend income, and securities lending income, if any. Interest income is accrued daily and adjusted for amortization of premiums and accretion of discounts. Dividend income is recognized on ex-dividend date or, for certain foreign securities, as soon as such information is obtained subsequent to the ex-dividend date. Non-cash dividends, if any, are recorded at the fair market value of the securities received. Investment transactions are reflected on trade date. Realized gains and losses are calculated using identified cost. Investment transactions are recorded on the following business day for daily net asset value (“NAV”) calculations. Investment income is recorded net of any foreign withholding taxes, less any amounts reclaimable. The Fund may file withholding tax reclaims in certain jurisdictions to recover a portion of amounts previously withheld. Any foreign capital gains tax is accrued daily based upon net unrealized gains, and is payable upon sale of such investments. Distributions received from the Fund’s investments in United States (“U.S.”) real estate investment trusts (“REITs”) may be characterized as ordinary income, net capital gain and/or a return of capital. A return of capital is recorded by the Fund as a reduction to the cost basis of the REIT.
C. Class Allocations and Expenses — Investment income, realized and unrealized gain (loss), if any, and non-class specific expenses of the Fund are allocated daily based upon the proportion of net assets of each class. Non-class specific expenses directly incurred by the Fund are charged to the Fund, while such expenses incurred by the Trust are allocated across the Fund on a straight-line and/or pro-rata basis depending upon the nature of the expenses. Class specific expenses, where applicable, are borne by the respective share classes and include Distribution and Service and Transfer Agency fees.
D. Federal Taxes and Distributions to Shareholders — It is the Fund’s policy to comply with the requirements of the Internal Revenue Code of 1986, as amended (the “Code”), applicable to regulated investment companies and to distribute each year substantially all of its investment company taxable income and capital gains to its shareholders. Accordingly, the Fund is not required to make any provisions for the payment of federal income tax. Distributions to shareholders are recorded on the ex-dividend date. Income and capital gains distributions, if any, are declared and paid at least annually.
Net capital losses, if any, are carried forward to future fiscal years and may be used to the extent allowed by the Code to offset any future capital gains. Losses that are carried forward will retain their character as either short-term or long-term capital losses. Utilization of capital loss carryforwards will reduce the requirement of future capital gains distributions.
14
GOLDMAN SACHS VARIABLE INSURANCE TRUST STRATEGIC GROWTH FUND
2. SIGNIFICANT ACCOUNTING POLICIES (continued)
The characterization of distributions to shareholders for financial reporting purposes is determined in accordance with federal income tax rules, which may differ from GAAP. The source of the Fund’s distributions may be shown in the accompanying financial statements as either from distributable earnings or capital. Certain components of the Fund’s net assets on the Statement of Assets and Liabilities reflect permanent GAAP/tax differences based on the appropriate tax character.
3. INVESTMENTS AND FAIR VALUE MEASUREMENTS
U.S. GAAP defines the fair value of a financial instrument as the amount that would be received to sell an asset or paid to transfer a liability in an orderly transaction between market participants at the measurement date (i.e., the exit price); the Fund’s policy is to use the market approach. GAAP establishes a fair value hierarchy that prioritizes the inputs to valuation techniques used to measure fair value. The hierarchy gives the highest priority to unadjusted quoted prices in active markets for identical assets or liabilities (Level 1 measurements) and the lowest priority to unobservable inputs (Level 3 measurements). The level in the fair value hierarchy within which the fair value measurement in its entirety falls shall be determined based on the lowest level input that is significant to the fair value measurement in its entirety. The levels used for classifying investments are not necessarily an indication of the risk associated with investing in these investments. The three levels of the fair value hierarchy are described below:
Level 1 — Unadjusted quoted prices in active markets that are accessible at the measurement date for identical, unrestricted assets or liabilities;
Level 2 — Quoted prices in markets that are not active or financial instruments for which significant inputs are observable (including, but not limited to, quoted prices for similar investments, interest rates, foreign exchange rates, volatility and credit spreads), either directly or indirectly;
Level 3 — Prices or valuations that require significant unobservable inputs (including GSAM’s assumptions in determining fair value measurement).
The Board of Trustees (“Trustees”) has approved Valuation Procedures that govern the valuation of the portfolio investments held by the Fund, including investments for which market quotations are not readily available. The Trustees have delegated to GSAM day-to-day responsibility for implementing and maintaining internal controls and procedures related to the valuation of the Fund’s investments. To assess the continuing appropriateness of pricing sources and methodologies, GSAM regularly performs price verification procedures and issues challenges as necessary to third party pricing vendors or brokers, and any differences are reviewed in accordance with the Valuation Procedures.
A. Level 1 and Level 2 Fair Value Investments — The valuation techniques and significant inputs used in determining the fair values for investments classified as Level 1 and Level 2 are as follows:
Equity Securities — Equity securities traded on a U.S. securities exchange or the NASDAQ system, or those located on certain foreign exchanges, including but not limited to the Americas, are valued daily at their last sale price or official closing price on the principal exchange or system on which they are traded. If there is no sale or official closing price or such price is believed by GSAM to not represent fair value, equity securities will be valued at the valid closing bid price for long positions and at the valid closing ask price for short positions (i.e. where there is sufficient volume, during normal exchange trading hours). If no valid bid/ask price is available, the equity security will be valued pursuant to the Valuation Procedures approved by the Trustees and consistent with applicable regulatory guidance. To the extent these investments are actively traded, they are classified as Level 1 of the fair value hierarchy, otherwise they are generally classified as Level 2. Certain equity securities containing unique attributes may be classified as Level 2.
Unlisted equity securities for which market quotations are available are valued at the last sale price on the valuation date, or if no sale occurs, at the last bid price for long positions or the last ask price for short positions, and are generally classified as Level 2.
15
GOLDMAN SACHS VARIABLE INSURANCE TRUST STRATEGIC GROWTH FUND
Notes to Financial Statements (continued)
December 31, 2020
3. INVESTMENTS AND FAIR VALUE MEASUREMENTS (continued)
Money Market Funds — Investments in the Goldman Sachs Financial Square Government Fund (“Underlying Fund”) are valued at the NAV per share of the Institutional Share class on the day of valuation. These investments are generally classified as Level 1 of the fair value hierarchy. For information regarding the Underlying Fund’s accounting policies and investment holdings, please see the Underlying Fund’s shareholder report.
B. Level 3 Fair Value Investments — To the extent that significant inputs to valuation models and other alternative pricing sources are unobservable, or if quotations are not readily available, or if GSAM believes that such quotations do not accurately reflect fair value, the fair value of the Fund’s investments may be determined under Valuation Procedures approved by the Trustees. GSAM, consistent with its procedures and applicable regulatory guidance, may make an adjustment to the most recent valuation prices of either domestic or foreign securities in light of significant events to reflect what it believes to be the fair value of the securities at the time of determining the Fund’s NAV. To the extent investments are valued using single source broker quotations obtained directly from the broker or passed through from third party pricing vendors, such investments are classified as Level 3 investments.
C. Fair Value Hierarchy — The following is a summary of the Fund’s investments classified in the fair value hierarchy as of December 31, 2020:
| | | | | | | | | | | | |
| Investment Type | | Level 1 | | | Level 2 | | | Level 3 | |
| | | |
| Assets | | | | | | | | | | | | |
| Common Stock and/or Other Equity Investments(a) | | | | | | | | | | | | |
Europe | | $ | 11,380,987 | | | $ | — | | | $ | — | |
North America | | | 410,591,152 | | | | — | | | | — | |
Investment Company | | | 3,315,576 | | | | — | | | | — | |
| Securities Lending Reinvestment Vehicle | | | 4,259,666 | | | | — | | | | — | |
| | | |
| Total | | $ | 429,547,381 | | | $ | — | | | $ | — | |
| (a) | Amounts are disclosed by continent to highlight the impact of time zone differences between local market close and the calculation of NAV. Security valuations are based on the principal exchange or system on which they are traded, which may differ from country of domicile. |
For further information regarding security characteristics, see the Schedule of Investments.
4. AGREEMENTS AND AFFILIATED TRANSACTIONS
A. Management Agreement — Under the Agreement, GSAM manages the Fund, subject to the general supervision of the Trustees.
As compensation for the services rendered pursuant to the Agreement, the assumption of the expenses related thereto and administration of the Fund’s business affairs, including providing facilities, GSAM is entitled to a management fee, accrued daily and paid monthly, equal to an annual percentage rate of the Fund’s average daily net assets.
For the fiscal year ended December 31, 2020, contractual and effective net management fees with GSAM were at the following rates:
| | | | | | | | | | | | | | | | | | | | | | | | |
| Contractual Management Rate | | | | | | | |
First
$1 billion | | Next
$1 billion | | | Next
$3 billion | | | Next
$3 billion | | | Over
$8 billion | | | Effective
Rate | | | Effective Net
Management
Rate^ | |
| | | | | | |
| 0.71% | | | 0.64 | % | | | 0.61 | % | | | 0.59 | % | | | 0.58 | % | | | 0.71 | % | | | 0.71 | % |
| ^ | Effective Net Management Rate includes the impact of management fee waivers of affiliated Underlying Funds, if any. |
16
GOLDMAN SACHS VARIABLE INSURANCE TRUST STRATEGIC GROWTH FUND
4. AGREEMENTS AND AFFILIATED TRANSACTIONS (continued)
The Fund invests in Institutional Shares of the Goldman Sachs Financial Square Government Fund, which is an affiliated Underlying Fund. GSAM has agreed to waive a portion of its management fee payable by the Fund in an amount equal to the management fee it earns as an investment adviser to the affiliated Underlying Fund in which the Fund invests, except those management fees it earns from the Fund’s investments of cash collateral received in connection with securities lending transactions in the Goldman Sachs Financial Square Government Fund. For the fiscal year ended December 31, 2020, GSAM waived $5,449 of the Fund’s management fee.
B. Distribution and Service (12b-1) Plan — The Trust, on behalf of Service Shares of the Fund, has adopted a Distribution and Service Plan subject to Rule 12b-1 under the Act. Under the Distribution and Service Plan, Goldman Sachs, which serves as distributor, is entitled to a fee accrued daily and paid monthly, for distribution services and personal and account maintenance services, which may then be paid by Goldman Sachs to authorized dealers, equal to, on an annual basis, 0.25% of the Fund’s average daily net assets attributable to Service Shares.
C. Transfer Agency Agreement — Goldman Sachs also serves as the transfer agent of the Fund for a fee pursuant to the Transfer Agency Agreement. The fees charged for such transfer agency services are accrued daily and paid monthly at an annual rate of 0.02% of the average daily net assets of Institutional and Service Shares.
D. Other Expense Agreements and Affiliated Transactions — GSAM has agreed to reduce or limit certain “Other Expenses” of the Fund (excluding acquired fund fees and expenses, transfer agency fees and expenses, service fees and shareholder administration fees (as applicable), taxes, interest, brokerage fees, expenses of shareholder meetings, litigation and indemnification, and extraordinary expenses) to the extent such expenses exceed, on an annual basis, a percentage rate of the average daily net assets of the Fund. Such Other Expense reimbursements, if any, are accrued daily and paid monthly. In addition, the Fund is not obligated to reimburse GSAM for prior fiscal year expense reimbursements, if any. The Other Expense limitation as an annual percentage rate of average daily net assets for the Fund is 0.014%. The Other Expense limitation will remain in place through at least April 29, 2021, and prior to such date GSAM may not terminate the arrangement without the approval of the Trustees. In addition, the Fund has entered into certain offset arrangements with the custodian and the transfer agent, which may result in a reduction of the Fund’s expenses and are received irrespective of the application of the “Other Expense” limitation described above.
For the fiscal year ended December 31, 2020, these expense reductions, including any fee waivers and Other Expense reimbursements, were as follows:
| | | | | | | | | | | | |
Management
Fee Waiver | | Custody
Fee Credits | | | Other Expense
Reimbursement | | | Total Expense
Reductions | |
| $5,449 | | $ | 1,117 | | | $ | 254,005 | | | $ | 260,571 | |
E. Line of Credit Facility — As of December 31, 2020, the Fund participated in a $700,000,000 committed, unsecured revolving line of credit facility (the “facility”) together with other funds of the Trust and certain registered investment companies having management agreements with GSAM or its affiliates. This facility is to be used for temporary emergency purposes, or to allow for an orderly liquidation of securities to meet redemption requests. The interest rate on borrowings is based on the federal funds rate. The facility also requires a fee to be paid by the Fund based on the amount of the commitment that has not been utilized. For the fiscal year ended December 31, 2020, the Fund did not have any borrowings under the facility. Prior to April 28, 2020, the facility was $580,000,000.
F. Other Transactions with Affiliates — For the fiscal year ended December 31, 2020, Goldman Sachs earned $4,136 in brokerage commissions from portfolio transactions.
17
GOLDMAN SACHS VARIABLE INSURANCE TRUST STRATEGIC GROWTH FUND
Notes to Financial Statements (continued)
December 31, 2020
4. AGREEMENTS AND AFFILIATED TRANSACTIONS (continued)
The following table provides information about the Fund’s investments in the Goldman Sachs Financial Square Government Fund as of and for the fiscal year ended December 31, 2020:
| | | | | | | | | | | | | | | | | | | | |
Beginning
Value as of
December 31, 2019 | | Purchases
at Cost | | | Proceeds
from Sales | | | Ending
Value as
of December 31, 2020 | | | Shares as of
December 31, 2020 | | | Dividend Income
from Affiliated
Investment
Company | |
| $1,563,204 | | $ | 111,459,847 | | | $ | (109,707,475) | | | $ | 3,315,576 | | | | 3,315,576 | | | $ | 8,271 | |
5. PORTFOLIO SECURITIES TRANSACTIONS
The cost of purchases and proceeds from sales and maturities of long-term securities for the fiscal year ended December 31, 2020, were $163,819,002 and $229,465,443, respectively.
6. SECURITIES LENDING
The Fund may lend its securities through a securities lending agent, the Bank of New York Mellon (“BNYM”), to certain qualified borrowers. In accordance with the Fund’s securities lending procedures, the Fund receives cash collateral at least equal to the market value of the securities on loan. The market value of the loaned securities is determined at the close of business of the Fund, at their last sale price or official closing price on the principal exchange or system on which they are traded, and any additional required collateral is delivered to the Fund on the next business day. As with other extensions of credit, the Fund may experience delay in the recovery of its securities or incur a loss should the borrower of the securities breach its agreement with the Fund or become insolvent at a time when the collateral is insufficient to cover the cost of repurchasing securities on loan. Dividend income received from securities on loan may not be subject to withholding taxes and therefore withholding taxes paid may differ from the amounts listed in the Statement of Operations. Loans of securities are terminable at any time and as such 1) the remaining contractual maturities of the outstanding securities lending transactions are considered to be overnight and continuous and 2) the borrower, after notice, is required to return borrowed securities within the standard time period for settlement of securities transactions.
The Fund invests the cash collateral received in connection with securities lending transactions in the Goldman Sachs Financial Square Government Fund (“Government Money Market Fund”), an affiliated series of the Goldman Sachs Trust. The Government Money Market Fund is registered under the Act as an open end investment company, is subject to Rule 2a-7 under the Act, and is managed by GSAM, for which GSAM may receive a management fee of up to 0.16% on an annualized basis of the average daily net assets of the Government Money Market Fund.
In the event of a default by a borrower with respect to any loan, BNYM may exercise any and all remedies provided under the applicable borrower agreement to make the Fund whole. These remedies include purchasing replacement securities by applying the collateral held from the defaulting broker against the purchase cost of the replacement securities. If BNYM is unable to purchase replacement securities, BNYM will indemnify the Fund by paying the Fund an amount equal to the market value of the securities loaned minus the value of cash collateral received from the borrower for the loan, subject to an exclusion for any shortfalls resulting from a loss of value in such cash collateral due to reinvestment risk. The Fund’s master netting agreements with certain borrowers provide the right, in the event of a default (including bankruptcy or insolvency), for the non-defaulting party to liquidate the collateral and calculate net exposure to the defaulting party or request additional collateral. However, in the event of a default by a borrower, a resolution authority could determine that such rights are not enforceable due to the restrictions or prohibitions against the right of set-off that may be imposed in accordance with a particular jurisdiction’s bankruptcy or insolvency laws. The Fund’s loaned securities were all subject to enforceable Securities Lending Agreements and the value of the collateral was at least equal to
18
GOLDMAN SACHS VARIABLE INSURANCE TRUST STRATEGIC GROWTH FUND
6. SECURITIES LENDING (continued)
the value of the cash received. The amounts of the Fund’s overnight and continuous agreements, which represent the gross amounts of recognized liabilities for securities lending transactions outstanding as of December 31, 2020, are disclosed as “Payable upon return of securities loaned” on the Statement of Assets and Liabilities, where applicable.
Both the Fund and BNYM received compensation relating to the lending of the Fund’s securities. The amounts earned, if any, by the Fund for the fiscal year ended December 31, 2020, are reported under Investment Income on the Statement of Operations.
The following table provides information about the Fund’s investment in the Government Money Market Fund for the fiscal year ended December 31, 2020:
| | | | | | | | | | | | | | |
Beginning
Value as of
December 31, 2019 | | | Purchases
at Cost | | | Proceeds
from Sales | | | Ending
Value as of
December 31, 2020 | |
| | | |
| $ | 1,651,105 | | | $ | 31,755,402 | | | $ | (29,146,841 | ) | | $ | 4,259,666 | |
7. TAX INFORMATION
The tax character of distributions paid during the fiscal years ended December 31, 2019 and December 31, 2020 was as follows:
| | | | | | | | |
| | | 2019 | | | 2020 | |
| Distributions paid from: | | | | | | | | |
Ordinary income | | $ | 658,803 | | | $ | 6,087,164 | |
Net long-term capital gains | | | 36,508,333 | | | | 26,055,949 | |
| Total taxable distributions | | $ | 37,167,136 | | | $ | 32,143,113 | |
As of December 31, 2020, the components of accumulated earnings (losses) on a tax-basis were as follows:
| | | | |
| Undistributed ordinary income — net | | $ | 3,152,654 | |
| Undistributed long-term capital gains | | | 6,151,161 | |
| Total undistributed earnings | | $ | 9,303,815 | |
| Unrealized gains — net | | | 230,655,752 | |
| Total accumulated earnings — net | | $ | 239,959,567 | |
As of December 31, 2020, the Fund’s aggregate security unrealized gains and losses based on cost for U.S. federal income tax purposes were as follows:
| | | | |
| Tax cost | | $ | 198,891,628 | |
| Gross unrealized gain | | | 230,756,900 | |
| Gross unrealized loss | | | (101,148 | ) |
| Net unrealized gain | | $ | 230,655,752 | |
The difference between GAAP-basis and tax-basis unrealized gains (losses) is attributable primarily to wash sales.
19
GOLDMAN SACHS VARIABLE INSURANCE TRUST STRATEGIC GROWTH FUND
Notes to Financial Statements (continued)
December 31, 2020
7. TAX INFORMATION (continued)
GSAM has reviewed the Fund’s tax positions for all open tax years (the current and prior three years, as applicable) and has concluded that no provision for income tax is required in the Fund’s financial statements. Such open tax years remain subject to examination and adjustment by tax authorities.
8. OTHER RISKS
The Fund’s risks include, but are not limited to, the following:
Investments in Other Investment Companies Risk — As a shareholder of another investment company, the Fund will indirectly bear its proportionate share of any net management fees and other expenses paid by such other investment companies, in addition to the fees and expenses regularly borne by the Fund.
Large Shareholder Transactions Risk — The Fund may experience adverse effects when certain large shareholders, such as other funds, participating insurance companies, accounts and Goldman Sachs affiliates, purchase or redeem large amounts of shares of the Fund. Such large shareholder redemptions, which may occur rapidly or unexpectedly, may cause the Fund to sell portfolio securities at times when it would not otherwise do so, which may negatively impact the Fund’s NAV and liquidity. These transactions may also accelerate the realization of taxable income to shareholders if such sales of investments resulted in gains, and may also increase transaction costs. In addition, a large redemption could result in the Fund’s current expenses being allocated over a smaller asset base, leading to an increase in the Fund’s expense ratio. Similarly, large Fund share purchases may adversely affect the Fund’s performance to the extent that the Fund is delayed in investing new cash or otherwise maintains a larger cash position than it ordinarily would.
Liquidity Risk — The Fund may make investments that are illiquid or that may become less liquid in response to market developments or adverse investor perceptions. Illiquid investments may be more difficult to value. Liquidity risk may also refer to the risk that the Fund will not be able to pay redemption proceeds within the allowable time period or without significant dilution to remaining investors’ interests because of unusual market conditions, an unusually high volume of redemption requests, or other reasons. To meet redemption requests, the Fund may be forced to sell investments at an unfavorable time and/or under unfavorable conditions. If the Fund is forced to sell securities at an unfavorable time and/or under unfavorable conditions, such sales may adversely affect the Fund’s NAV and dilute remaining investors’ interests. These risks may be more pronounced in connection with the Fund’s investments in securities of issuers located in emerging market countries. Redemptions by large shareholders may have a negative impact on the Fund’s liquidity.
Market and Credit Risks — In the normal course of business, the Fund trades financial instruments and enters into financial transactions where risk of potential loss exists due to changes in the market (market risk). The value of the securities in which the Fund invests may go up or down in response to the prospects of individual companies, particular sectors or governments and/or general economic conditions throughout the world due to increasingly interconnected global economies and financial markets. Events such as war, acts of terrorism, social unrest, natural disasters, the spread of infectious illness or other public health threats could also significantly impact the Fund and its investments. Additionally, the Fund may also be exposed to credit risk in the event that an issuer or guarantor fails to perform or that an institution or entity with which the Fund has unsettled or open transactions defaults.
Non-Diversification Risk — The Fund is non-diversified, meaning that it is permitted to invest a larger percentage of its assets in fewer issuers than diversified mutual funds. Thus, the Fund may be more susceptible to adverse developments affecting any single issuer held in its portfolio, and may be more susceptible to greater losses because of these developments.
9. INDEMNIFICATIONS
Under the Trust’s organizational documents, its Trustees, officers, employees and agents are indemnified, to the extent permitted by the Act and state law, against certain liabilities that may arise out of performance of their duties to the Fund. Additionally, in the course of business, the Fund enters into contracts that contain a variety of indemnification clauses. The Fund’s maximum exposure under these arrangements is unknown, as this would involve future claims that may be made against the Fund that have not yet occurred. However, GSAM believes the risk of loss under these arrangements to be remote.
20
GOLDMAN SACHS VARIABLE INSURANCE TRUST STRATEGIC GROWTH FUND
10. OTHER MATTERS
On October 22, 2020, Goldman Sachs announced a settlement of matters involving 1Malaysia Development Bhd. (1MDB), a Malaysian sovereign wealth fund, with the United States Department of Justice as well as criminal and civil authorities in the UK, Singapore and Hong Kong. Further information regarding the 1MDB settlement can be found at https://www.goldmansachs.com/media-relations/press-releases/current/goldman-sachs-2020-10-22.html. The 1MDB settlement will not materially adversely affect GSAM’s ability to serve as investment manager.
11. SUBSEQUENT EVENTS
Subsequent events after the Statement of Assets and Liabilities date have been evaluated, and GSAM has concluded that there is no impact requiring adjustment or disclosure in the financial statements.
12. SUMMARY OF SHARE TRANSACTIONS
Share activity is as follows:
| | | | | | | | | | | | | | | | |
| | | For the Fiscal Year Ended
December 31, 2020 | | | For the Fiscal Year Ended
December 31, 2019 | |
| | | Shares | | | Dollars | | | Shares | | | Dollars | |
| Institutional Shares | | | | | | | | | | | | | | | | |
| Shares sold | | | 604,593 | | | $ | 7,949,713 | | | | 583,898 | | | $ | 7,062,304 | |
| Reinvestment of distributions | | | 843,114 | | | | 12,680,432 | | | | 1,118,249 | | | | 13,128,250 | |
| Shares redeemed | | | (1,460,048 | ) | | | (19,161,362 | ) | | | (1,261,183 | ) | | | (14,783,803 | ) |
| | | | (12,341 | ) | | | 1,468,783 | | | | 440,964 | | | | 5,406,751 | |
| Service Shares | | | | | | | | | | | | | | | | |
| Shares sold | | | 6,377,786 | | | | 74,689,888 | | | | 8,337,088 | | | | 92,869,509 | |
| Reinvestment of distributions | | | 1,295,784 | | | | 19,462,681 | | | | 2,045,863 | | | | 24,038,886 | |
| Shares redeemed | | | (11,218,495 | ) | | | (126,288,249 | ) | | | (4,367,583 | ) | | | (49,769,254 | ) |
| | | | (3,544,925 | ) | | | (32,135,680 | ) | | | 6,015,368 | | | | 67,139,141 | |
| | | | |
| NET INCREASE (DECREASE) | | | (3,557,266 | ) | | $ | (30,666,897 | ) | | | 6,456,332 | | | $ | 72,545,892 | |
21
Report of Independent Registered Public Accounting Firm
To the Board of Trustees of
Goldman Sachs Variable Insurance Trust and Shareholders of Goldman Sachs Strategic Growth Fund
Opinion on the Financial Statements
We have audited the accompanying statement of assets and liabilities, including the schedule of investments, of Goldman Sachs Strategic Growth Fund (one of the funds constituting Goldman Sachs Variable Insurance Trust, referred to hereafter as the “Fund”) as of December 31, 2020, the related statement of operations for the year ended December 31, 2020, the statements of changes in net assets for each of the two years in the period ended December 31, 2020, including the related notes, and the financial highlights for each of the five years in the period ended December 31, 2020 (collectively referred to as the “financial statements”). In our opinion, the financial statements present fairly, in all material respects, the financial position of the Fund as of December 31, 2020, the results of its operations for the year then ended, the changes in its net assets for each of the two years in the period ended December 31, 2020 and the financial highlights for each of the five years in the period ended December 31, 2020 in conformity with accounting principles generally accepted in the United States of America.
Basis for Opinion
These financial statements are the responsibility of the Fund’s management. Our responsibility is to express an opinion on the Fund’s financial statements based on our audits. We are a public accounting firm registered with the Public Company Accounting Oversight Board (United States) (PCAOB) and are required to be independent with respect to the Fund in accordance with the U.S. federal securities laws and the applicable rules and regulations of the Securities and Exchange Commission and the PCAOB.
We conducted our audits of these financial statements in accordance with the standards of the PCAOB. Those standards require that we plan and perform the audit to obtain reasonable assurance about whether the financial statements are free of material misstatement, whether due to error or fraud.
Our audits included performing procedures to assess the risks of material misstatement of the financial statements, whether due to error or fraud, and performing procedures that respond to those risks. Such procedures included examining, on a test basis, evidence regarding the amounts and disclosures in the financial statements. Our audits also included evaluating the accounting principles used and significant estimates made by management, as well as evaluating the overall presentation of the financial statements. Our procedures included confirmation of securities owned as of December 31, 2020 by correspondence with the custodian, transfer agent and brokers. We believe that our audits provide a reasonable basis for our opinion.
/s/PricewaterhouseCoopers LLP
Boston, Massachusetts
February 17, 2021
We have served as the auditor of one or more investment companies in the Goldman Sachs fund complex since 2000.
22
GOLDMAN SACHS VARIABLE INSURANCE TRUST STRATEGIC GROWTH FUND
Voting Results of Joint Special Meeting of Shareholders (Unaudited)
A Special Meeting (the “Meeting”) of the Goldman Sachs Variable Insurance Trust (“VIT”) was held on January 23, 2020 to consider and act upon the proposal below. The Fund has amortized its respective share of the proxy, shareholder meeting and other related costs and GSAM has agreed to reimburse the Fund to the extent such expenses exceed a specified percentage of the Fund’s net assets.
At the Meeting, Dwight L. Bush, Kathryn A. Cassidy, Joaquin Delgado and Gregory G. Weaver were elected to the Trust’s Board of Trustees. In electing trustees, the Trust’s shareholders voted as follows:
| | | | | | | | | | | | | | | | |
| | | | | |
Proposal 1. Election of Trustees | | For | | | Against | | | Withheld | | | Broker Non-Votes | |
| | | | | |
Dwight L. Bush | | | 745,493,677.130 | | | | 0 | | | | 17,848,840.639 | | | | 0 | |
| | | | | |
Kathryn A. Cassidy | | | 746,559,784.810 | | | | 0 | | | | 16,782,732.959 | | | | 0 | |
| | | | | |
Joaquin Delgado | | | 744,593,456.532 | | | | 0 | | | | 18,749,061.237 | | | | 0 | |
| | | | | |
Gregory G. Weaver | | | 746,707,039.321 | | | | 0 | | | | 16,635,478.448 | | | | 0 | |
Voting Results of Special Meeting of Shareholders (Unaudited)
A Special Meeting of the Goldman Sachs Variable Insurance Trust Strategic Growth Fund was held on January 8, 2021 to consider and act upon a proposal to approve a change to the Fund’s sub-classification under the Investment Company Act of 1940 from “diversified” to “non-diversified” and eliminate the Fund’s related fundamental investment restriction.
The shareholders voted as follows:
| | | | | | | | | | | | |
| Proposal 1 | | For | | | Against/Withhold | | | Abstain | |
| | | |
To approve a change to each respective Fund’s sub-classification under the Investment Company Act of 1940 from “diversified” to “non-diversified” and to eliminate any related fundamental investment restriction for the Fund. | | | 21,360,462.737 | | | | 1,890,396.988 | | | | 2,070,989.714 | |
| | | | | | | | | | | | |
23
GOLDMAN SACHS VARIABLE INSURANCE TRUST STRATEGIC GROWTH FUND
| | |
| Fund Expenses — Six Month Period Ended December 31, 2020 (Unaudited) | | |
As a shareholder of Institutional or Service Shares of the Fund, you incur ongoing costs, including management fees, distribution and/or service (12b-1) fees (with respect to Service Shares) and other Fund expenses. This example is intended to help you understand your ongoing costs (in dollars) of investing in Institutional Shares and Service Shares of the Fund and to compare these costs with the ongoing costs of investing in other mutual funds.
The example is based on an investment of $1,000 invested at the beginning of the period and held for the entire period from July 1, 2020 through December 31, 2020, which represents a period of 184 days of a 366 day year.
Actual Expenses — The first line under each share class in the table below provides information about actual account values and actual expenses. You may use the information in this line, together with the amount you invested, to estimate the expenses that you paid over the period. Simply divide your account value by $1,000 (for example, an $8,600 account value divided by $1,000=8.6), then multiply the result by the number in the first line under the heading entitled “Expenses Paid” to estimate the expenses you paid on your account during this period.
Hypothetical Example for Comparison Purposes — The second line under each share class in the table below provides information about hypothetical account values and hypothetical expenses based on the Fund’s actual net expense ratio and an assumed rate of return of 5% per year before expenses, which is not the Fund’s actual return. The hypothetical account values and expenses may not be used to estimate the actual ending account balance or expenses you paid for the period. You may use this information to compare the ongoing costs of investing in the Fund and other funds. To do so, compare this 5% hypothetical example with the 5% hypothetical examples that appear in the shareholder reports of the other funds.
Please note that the expenses shown in the table are meant to highlight your ongoing costs only. As a shareholder of the Fund you do not incur any transaction costs, such as sales charges, redemption fees, or exchange fees, but shareholders of other funds may incur such costs. The second line of the table is useful in comparing ongoing costs only and will not help you determine the relative total costs of owning different funds whose shareholders may incur transaction costs.
| | | | | | | | | | | | |
| Share Class | | Beginning
Account Value
07/01/20 | | | Ending
Account Value
12/31/20 | | | Expenses Paid for the
6 Months
Ended
12/31/20* | |
| Institutional | | | | | | | | | | | | |
| | | | |
| Actual | | $ | 1,000 | | | $ | 1,286.20 | | | $ | 4.25 | |
| Hypothetical 5% return | | | 1,000 | | | | 1,021.42+ | | | | 3.76 | |
| Service | | | | | | | | | | | | |
| | | | |
| Actual | | | 1,000 | | | | 1,284.60 | | | | 5.69 | |
| Hypothetical 5% return | | | 1,000 | | | | 1,020.16 | + | | | 5.03 | |
| | + | Hypothetical expenses are based on the Fund’s actual annualized net expense ratios and an assumed rate of return of 5% per year before expenses. | |
| | * | Expenses are calculated using the Fund’s annualized net expense ratio for each class, which represents the ongoing expenses as a percentage of net assets for the six months ended December 31, 2020. Expenses are calculated by multiplying the annualized net expense ratio by the average account value for the period; then multiplying the result by the number of days in the most recent fiscal half year; and then dividing that result by the number of days in the fiscal year. The annualized net expense ratios for the period were 0.74%, and 0.99% for Institutional and Service Shares, respectively. | |
24
GOLDMAN SACHS VARIABLE INSURANCE TRUST STRATEGIC GROWTH FUND
Trustees and Officers (Unaudited)
Independent Trustees
| | | | | | | | | | |
| | | | | |
Name,
Address and Age1 | | Position(s) Held
with the Trust | | Term of Office and
Length of
Time Served2 | | Principal Occupation(s) During Past 5 Years | | Number of
Portfolios in
Fund Complex
Overseen by
Trustee3 | | Other Directorships Held by Trustee4 |
| | | | | |
Jessica Palmer Age: 71 | | Chair of the Board of Trustees | | Since 2018 (Trustee since 2007) | | Ms. Palmer is retired. She was formerly Consultant, Citigroup Human Resources Department (2007-2008); Managing Director, Citigroup Corporate and Investment Banking (previously, Salomon Smith Barney/Salomon Brothers) (1984-2006). Ms. Palmer was a Member of the Board of Trustees of Indian Mountain School (private elementary and secondary school) (2004-2009). Chair of the Board of Trustees — Goldman Sachs Variable Insurance Trust and Goldman Sachs Trust. | | 105 | | None |
| | | | | |
Dwight L. Bush Age: 63 | | Trustee | | Since 2020 | | Ambassador Bush is President and CEO of D.L. Bush & Associates (a financial advisory and private investment firm) (2002-2014 and 2017-present); and was formerly U.S. Ambassador to the Kingdom of Morocco (2014-2017) and a Member of the Board of Directors of Santander Bank, N.A. (2018-2019). Previously, Ambassador Bush served as an Advisory Board Member of Goldman Sachs Trust and Goldman Sachs Variable Insurance Trust (October 2019-January 2020). Trustee — Goldman Sachs Variable Insurance Trust and Goldman Sachs Trust. | | 105 | | None |
| | | | | |
Kathryn A. Cassidy Age: 66 | | Trustee | | Since 2015 | | Ms. Cassidy is retired. Formerly, she was Advisor to the Chairman (May 2014-December 2014); and Senior Vice President and Treasurer (2008-2014), General Electric Company & General Electric Capital Corporation (technology and financial services companies). Trustee — Goldman Sachs Variable Insurance Trust and Goldman Sachs Trust. | | 105 | | None |
| | | | | |
Diana M. Daniels Age: 71 | | Trustee | | Since 2007 | | Ms. Daniels is retired. Formerly, she was Vice President, General Counsel and Secretary, The Washington Post Company (1991-2006). Ms. Daniels is a Trustee Emeritus and serves as a Presidential Councillor of Cornell University (2013-Present); former Member of the Legal Advisory Board, New York Stock Exchange (2003-2006) and of the Corporate Advisory Board, Standish Mellon Management Advisors (2006-2007). Trustee — Goldman Sachs Variable Insurance Trust and Goldman Sachs Trust. | | 105 | | None |
| | | | | |
Joaquin Delgado Age: 60 | | Trustee | | Since 2020 | | Dr. Delgado is retired. He is Director, Hexion Inc. (a specialty chemical manufacturer) (2019-present); and Director, Stepan Company (a specialty chemical manufacturer) (2011-present); and was formerly Executive Vice President, Consumer Business Group of 3M Company (July 2016-July 2019); and Executive Vice President, Health Care Business Group of 3M Company (October 2012-July 2016). Previously, Dr. Delgado served as an Advisory Board Member of Goldman Sachs Trust and Goldman Sachs Variable Insurance Trust (October 2019-January 2020). Trustee — Goldman Sachs Variable Insurance Trust and Goldman Sachs Trust. | | 105 | | Stepan Company (a specialty chemical manufacturer) |
| | | | | | | | | | |
25
GOLDMAN SACHS VARIABLE INSURANCE TRUST STRATEGIC GROWTH FUND
Trustees and Officers (Unaudited) (continued)
Independent Trustees
| | | | | | | | | | |
| | | | | |
Name,
Address and Age1 | | Position(s) Held
with the Trust | | Term of
Office and
Length of
Time Served2 | | Principal Occupation(s)
During Past 5 Years | | Number of
Portfolios in
Fund Complex
Overseen by
Trustee3 | | Other
Directorships
Held by Trustee4 |
| | | | | |
Roy W. Templin Age: 60 | | Trustee | | Since 2013 | | Mr. Templin is retired. He is Director, Armstrong World Industries, Inc. (a designer and manufacturer of ceiling, wall and suspension system solutions) (2016-Present); and was formerly Chairman of the Board of Directors, Con-Way Incorporated (a transportation, logistics and supply chain management service company) (2014-2015); Executive Vice President and Chief Financial Officer, Whirlpool Corporation (an appliance manufacturer and marketer) (2004-2012). Trustee — Goldman Sachs Variable Insurance Trust and Goldman Sachs Trust. | | 105 | | Armstrong World Industries, Inc. (a ceiling, wall and suspension systems solutions manufacturer) |
| | | | | |
Gregory G. Weaver Age: 69 | | Trustee | | Since 2015 | | Mr. Weaver is retired. He is Director, Verizon Communications Inc. (2015-Present); and was formerly Chairman and Chief Executive Officer, Deloitte & Touche LLP (a professional services firm) (2001-2005 and 2012-2014); and Member of the Board of Directors, Deloitte & Touche LLP (2006-2012). Trustee — Goldman Sachs Variable Insurance Trust and Goldman Sachs Trust. | | 105 | | Verizon Communications Inc. |
| | | | | | | | | | |
26
GOLDMAN SACHS VARIABLE INSURANCE TRUST STRATEGIC GROWTH FUND
Trustees and Officers (Unaudited) (continued)
Interested Trustee*
| | | | | | | | | | |
| | | | | |
Name,
Address and Age1 | | Position(s) Held
with the Trust | | Term of
Office and
Length of
Time Served2 | | Principal Occupation(s)
During Past 5 Years | | Number of
Portfolios in
Fund Complex
Overseen by
Trustee3 | | Other
Directorships
Held by Trustee4 |
| | | | | |
James A. McNamara Age: 58 | | Trustee and President | | Since 2007 | | Advisory Director, Goldman Sachs (January 2018-Present); Managing Director, Goldman Sachs (January 2000-December 2017); Director of Institutional Fund Sales, GSAM (April 1998-December 2000); and Senior Vice President and Manager, Dreyfus Institutional Service Corporation (January 1993-April 1998). President and Trustee — Goldman Sachs Variable Insurance Trust; Goldman Sachs Trust; Goldman Sachs Trust II; Goldman Sachs MLP and Energy Renaissance Fund; Goldman Sachs ETF Trust; Goldman Sachs Credit Income Fund; and Goldman Sachs Real Estate Diversified Income Fund. | | 158 | | None |
| | | | | | | | | | |
| * | Mr. McNamara is considered to be an “Interested Trustee” because he holds positions with Goldman Sachs and owns securities issued by The Goldman Sachs Group, Inc. Mr. McNamara holds comparable positions with certain other companies of which Goldman Sachs, GSAM or an affiliate thereof is the investment adviser, administrator and/or distributor. |
| 1 | Each Trustee may be contacted by writing to the Trustee, c/o Goldman Sachs, 200 West Street, New York, New York, 10282, Attn: Caroline Kraus. Information is provided as of December 31, 2020. |
| 2 | Subject to such policies as may be adopted by the Board from time-to-time, each Trustee holds office for an indefinite term, until the earliest of: (a) the election of his or her successor; (b) the date the Trustee resigns or is removed by the Board or shareholders, in accordance with the Trust’s Declaration of Trust; or (c) the termination of the Trust. The Board has adopted policies which provide that each Independent Trustee shall retire as of December 31st of the calendar year in which he or she reaches (a) his or her 75th birthday or (b) the 15th anniversary of the date he or she became a Trustee, whichever is earlier, unless a waiver of such requirements shall have been adopted by a majority of the other Trustees. These policies may be changed by the Trustees without shareholder vote. |
| 3 | The Goldman Sachs Fund Complex includes certain other companies listed above for each respective Trustee. As of December 31, 2020, Goldman Sachs Variable Insurance Trust consisted of 13 portfolios; Goldman Sachs Trust consisted of 92 portfolios (90 of which offered shares to the public); Goldman Sachs Trust II consisted of 19 portfolios (17 of which offered shares to the public); Goldman Sachs ETF Trust consisted of 31 portfolios (20 of which offered shares to the public); and Goldman Sachs MLP and Energy Renaissance Fund, Goldman Sachs Credit Income Fund and Goldman Sachs Real Estate Diversified Income Fund each consisted of one portfolio. Goldman Sachs Credit Income Fund did not offer shares to the public. |
| 4 | This column includes only directorships of companies required to report to the Securities and Exchange Commission under the Securities Exchange Act of 1934 (i.e., “public companies”) or other investment companies registered under the Act. |
Additional information about the Trustees is available in the Fund’s Statement of Additional Information, which can be obtained from Goldman Sachs free of charge by calling this toll-free number (in the United States of America): 1-800-526-7384.
27
GOLDMAN SACHS VARIABLE INSURANCE TRUST STRATEGIC GROWTH FUND
Trustees and Officers (Unaudited) (continued)
Officers of the Trust*
| | | | | | |
| | | |
| Name, Address and Age1 | | Position(s) Held with the Trust | | Term of
Office and
Length of
Time Served2 | | Principal Occupation(s) During Past 5 Years |
| | | |
James A. McNamara
200 West Street New York, NY 10282 Age: 58 | | Trustee and
President | | Since 2007 | | Advisory Director, Goldman Sachs (January 2018-Present); Managing Director, Goldman Sachs (January 2000-December 2017); Director of Institutional Fund Sales, GSAM (April 1998-December 2000); and Senior Vice President and Manager, Dreyfus Institutional Service Corporation (January 1993-April 1998). President and Trustee — Goldman Sachs Variable Insurance Trust; Goldman Sachs Trust; Goldman Sachs Trust II; Goldman Sachs MLP and Energy Renaissance Fund; Goldman Sachs ETF Trust; Goldman Sachs Credit Income Fund; and Goldman Sachs Real Estate Diversified Income Fund. |
| | | |
Caroline L. Kraus
200 West Street New York, NY 10282 Age: 43 | | Secretary | | Since 2012 | | Managing Director, Goldman Sachs (January 2016-Present); Vice President, Goldman Sachs (August 2006-December 2015); Senior Counsel, Goldman Sachs (January 2020-Present); Associate General Counsel, Goldman Sachs (2012-December 2019); Assistant General Counsel, Goldman Sachs (August 2006-December 2011); and Associate, Weil, Gotshal & Manges, LLP (2002-2006). Secretary — Goldman Sachs Variable Insurance Trust (previously Assistant Secretary (2012)); Goldman Sachs Trust (previously Assistant Secretary (2012)); Goldman Sachs Trust II; Goldman Sachs BDC, Inc.; Goldman Sachs Private Middle Market Credit LLC; Goldman Sachs Private Middle Market Credit II LLC; Goldman Sachs Middle Market Lending Corp.; Goldman Sachs MLP and Energy Renaissance Fund; Goldman Sachs ETF Trust; Goldman Sachs Credit Income Fund; and Goldman Sachs Real Estate Diversified Income Fund. |
| | | |
Joseph F. DiMaria
30 Hudson Street Jersey City, NJ 07302 Age: 52 | | Treasurer,
Principal
Financial
Officer and
Principal
Accounting
Officer | | Since 2017
(Treasurer
and Principal
Financial
Officer
since
2019) | | Managing Director, Goldman Sachs (November 2015-Present) and Vice President — Mutual Fund Administration, Columbia Management Investment Advisers, LLC (May 2010-October 2015). Treasurer, Principal Financial Officer and Principal Accounting Officer — Goldman Sachs Variable Insurance Trust (previously Assistant Treasurer (2016)); Goldman Sachs Trust (previously Assistant Treasurer (2016)); Goldman Sachs Trust II (previously Assistant Treasurer (2017)); Goldman Sachs MLP and Energy Renaissance Fund (previously Assistant Treasurer (2017)); Goldman Sachs ETF Trust (previously Assistant Treasurer (2017)); Goldman Sachs Credit Income Fund; and Goldman Sachs Real Estate Diversified Income Fund. |
| | | | | | |
| * | Represents a partial list of officers of the Trust. Additional information about all the officers is available in the Fund’s Statement of Additional Information, which can be obtained from Goldman Sachs free of charge by calling this toll-free number (in the United States): 1-800-526-7384. |
| 1 | Information is provided as of December 31, 2020. |
| 2 | Officers hold office at the pleasure of the Board of Trustees or until their successors are duly elected and qualified. Each officer holds comparable positions with certain other companies of which Goldman Sachs, GSAM or an affiliate thereof is the investment adviser, administrator and/or distributor. |
Goldman Sachs Variable Insurance Trust — Tax Information (Unaudited)
For the year ended December 31, 2020, 26.14% of the dividends paid from net investment company taxable income by the Strategic Growth Fund qualify for the dividends received deduction available to corporations.
Pursuant to Section 852 of the Internal Revenue Code, the Strategic Growth Fund designates $26,055,949 or, if different, the maximum amount allowable, as capital gain dividends paid during the fiscal year ended December 31, 2020.
28
| | |
| TRUSTEES | | OFFICERS James A. McNamara, President Joseph F. DiMaria, Principal Financial Officer, Principal Accounting Officer and Treasurer Caroline L. Kraus, Secretary |
| Jessica Palmer, Chair |
| Dwight L. Bush |
| Kathryn A. Cassidy |
| Diana M. Daniels |
| Joaquin Delgado | | |
| James A. McNamara | | |
| Roy W. Templin | | |
| Gregory G. Weaver | | |
GOLDMAN SACHS & CO. LLC
Distributor and Transfer Agent
GOLDMAN SACHS ASSET MANAGEMENT, L.P.
Investment Adviser
200 West Street, New York
New York 10282
Visit our web site at www.GSAMFUNDS.com to obtain the most recent month-end returns.
The reports concerning the Fund included in this shareholder report may contain certain forward-looking statements about the factors that may affect the performance of the Fund in the future. These statements are based on Fund management’s predictions and expectations concerning certain future events and their expected impact on the Fund, such as performance of the economy as a whole and of specific industry sectors, changes in the levels of interest rates, the impact of developing world events, and other factors that may influence the future performance of the Fund. Management believes these forward-looking statements to be reasonable, although they are inherently uncertain and difficult to predict. Actual events may cause adjustments in portfolio management strategies from those currently expected to be employed.
A description of the policies and procedures that the Fund uses to determine how to vote proxies relating to portfolio securities and information regarding how the Fund voted proxies relating to portfolio securities for the 12-month period ended December 31 is available (i) without charge, upon request by calling 1-800-621-2550; and (ii) on the Securities and Exchange Commission (“SEC”) web site at http://www.sec.gov.
The Fund will file its portfolio holdings information for each month in a fiscal quarter within 60 days after the end of the relevant fiscal quarter on Form N-PORT. Portfolio holdings information for the third month of each fiscal quarter will be made available on the SEC’s web site at http://www.sec.gov. Portfolio holdings information may be obtained upon request and without charge by calling 1-800-526-7384 (for Retail Shareholders) or 1-800-621-2550 (for Institutional Shareholders).
Views and opinions expressed are for informational purposes only and do not constitute a recommendation by GSAM to buy, sell, or hold any security. Views and opinions are current as of the date of this presentation and may be subject to change, they should not be construed as investment advice.
Goldman Sachs & Co. LLC (“Goldman Sachs”) does not provide legal, tax or accounting advice. Any statement contained in this communication (including any attachments) concerning U.S. tax matters was not intended or written to be used, and cannot be used, for the purpose of avoiding penalties under the Internal Revenue Code, and was written to support the promotion or marketing of transaction or matter addressed. Clients of Goldman Sachs should obtain their own independent tax advice based on their particular circumstances.
The website links provided are for your convenience only and are not an endorsement or recommendation by GSAM of any of these websites or the products or services offered. GSAM is not responsible for the accuracy and validity of the content of these websites.
Fund holdings and allocations shown are as of December 31, 2020 and may not be representative of future investments. Fund holdings should not be relied on in making investment decisions and should not be construed as research or investment advice regarding particular securities. Current and future holdings are subject to risk.
References to indices, benchmarks or other measures of relative market performance over a specified period of time are provided for your information only and do not imply that the portfolio will achieve similar results. The index composition may not reflect the manner in which a portfolio is constructed. While an adviser seeks to design a portfolio which reflects appropriate risk and return features, portfolio characteristics may deviate from those of the benchmark.
The Global Industry Classification Standard (“GICS”) was developed by and is the exclusive property and a service mark of Morgan Stanley Capital International Inc. (“MSCI”) and Standard & Poor’s, a division of The McGraw-Hill Companies, Inc. (“S&P”) and is licensed for use by Goldman Sachs. Neither MSCI, S&P nor any other party involved in making or compiling the GICS or any GICS classifications makes any express or implied warranties or representations with respect to such standard or classification (or the results to be obtained by the use thereof), and all such parties hereby expressly disclaim all warranties of originality, accuracy, completeness, merchantability or fitness for a particular purpose with respect to any of such standard or classification. Without limiting any of the foregoing, in no event shall MSCI, S&P, any of their affiliates or any third party involved in making or compiling the GICS or any GICS classifications have any liability for any direct, indirect, special, punitive, consequential or any other damages (including lost profits) even if notified of the possibility of such damages.
The portfolio risk management process includes an effort to monitor and manage risk, but does not imply low risk.
Shares of the Goldman Sachs VIT Funds are offered to separate accounts of participating life insurance companies for the purpose of funding variable annuity contracts and variable life insurance policies. Shares of the Fund are not offered directly to the general public. The variable annuity contracts and variable life insurance policies are described in the separate prospectuses issued by participating insurance companies. You should refer to those prospectuses for information about surrender charges, mortality and expense risk fees and other charges that may be assessed by participating insurance companies under the variable annuity contracts or variable life insurance policies. Such fees or charges, if any, may affect the return you may realize with respect to your investments. Ask your representative for more complete information. Please consider a fund’s objectives, risks and charges and expenses, and read the prospectus carefully before investing. The prospectus contains this and other information about the Fund.
This material is not authorized for distribution to prospective investors unless preceded or accompanied by a current prospectus or summary prospectus, if applicable. Investors should consider the Fund’s objective, risks, and charges and expenses, and read the summary prospectus, if available, and/or the prospectus carefully before investing or sending money. The summary prospectus, if available, and the prospectus contain this and other information about the Fund and may be obtained from your authorized dealer or from Goldman Sachs & Co. LLC by calling 1-800-621-2550.
This report is prepared for the general information of contract owners and is not an offer of shares of the Goldman Sachs Variable Insurance Trust — Goldman Sachs Strategic Growth Fund.
© 2021 Goldman Sachs. All rights reserved.
VITGRWAR-21 229751-OTU-1351857
Goldman
Sachs Variable Insurance Trust
Goldman Sachs
International Equity Insights Fund
Beginning on or after January 1, 2021, you may not receive paper copies of the Fund’s annual and semi-annual shareholder reports from the insurance company that offers your variable insurance contract or your financial intermediary, unless you specifically request paper copies of the reports from the insurance company or from your financial intermediary. Instead, the reports will be made available on a website, and you will be notified by mail each time a report is posted and provided with a website link to access the report.
If you already elected to receive shareholder reports electronically, you will not be affected by this change and you need not take any action. At any time, you may elect to receive reports and certain communications from the insurance company electronically by contacting your insurance company or your financial intermediary.
You may elect to receive all future shareholder reports in paper free of charge. You can inform the insurance company or your financial intermediary that you wish to receive paper copies of reports. Your election to receive reports in paper will apply to all Goldman Sachs Funds available under your contract and may apply to all funds held with your financial intermediary.
Annual Report
December 31, 2020

GOLDMAN SACHS VARIABLE INSURANCE TRUST INTERNATIONAL EQUITY INSIGHTS FUND
INVESTMENT OBJECTIVE
The Fund seeks long-term growth of capital.
Portfolio Management Discussion and Analysis
Below, the Goldman Sachs Quantitative Investment Strategies Team discuss the Goldman Sachs Variable Insurance Trust — Goldman Sachs International Equity Insights Fund’s (the “Fund”) performance and positioning for the 12-month period ended December 31, 2020 (the “Reporting Period”).
How did the Fund perform during the Reporting Period?
During the Reporting Period, the Fund’s Institutional and Service Shares generated average annual total returns of 6.79% and 6.53%, respectively. These returns compare to the 7.79% average annual total return of the Fund’s benchmark, the MSCI Europe, Australasia, Far East (EAFE) Standard Index (net, USD, unhedged) (the “MSCI EAFE Standard Index”), during the same time period.
What economic and market factors most influenced the international equity markets as a whole during the Reporting Period?
During the first quarter of 2020, COVID-19 wreaked havoc across countries, communities and industries alike, disrupting global supply chains, international trade and private consumption patterns across the world. While different countries took varied degrees of measures in an effort to combat the pandemic, containment through social distancing and lockdowns were the broader theme of the season. With more than 100 countries closing borders, the movement of people, tourism flows and virtually all economic activities came to a screeching halt. In turn, March 2020 was a historic month for all asset classes and for equities in particular, with all leading equity markets across the world experiencing one of the largest single-month declines since October 2008. Many international equity markets — in economies large and small — went into a tailspin, enduring declines of 30% or more at the trough. Exacerbating matters was the failure of oil-producing nations to agree to production cuts, which resulted in increased supply amid pandemic-driven reduced demand, applying downward pressure on oil prices.
During the second quarter of 2020, equity markets across the world gained on optimism around a global economic recovery as lockdown measures began to ease. Investors largely looked past not only first calendar quarter corporate earnings but also weak macroeconomic data, fears of a second wave of COVID-19 and a bleak U.S. economic outlook from the U.S. Federal Reserve (the “Fed”). The European equity markets were supported by a larger than consensus expected stimulus boost from the European Central Bank’s (“ECB”) Pandemic Emergency Purchase Programme (“PEPP”) and the European Union’s (“EU”) proposed €750 billion COVID-19 recovery plan. In June, the ECB increased its PEPP by another €600 billion and extended its purchases through June 2021. The ECB also began offering euro liquidity to non-Euro area central banks in response to the COVID-19 crisis. In the Euro area, June’s composite Purchasing Managers Index rebounded by 15.6 points to 47.5, consistent with the easing of lockdown measures and improvements in high-frequency activity data. Japanese equity markets rallied in April and May 2020, recovering from the downturn that had started in February 2020. Its market recovery was driven by a rebound in valuations, particularly in cyclical sectors that bore most of the brunt during the prior quarter’s sell-off.
International equity markets rallied in July and August 2020, buoyed by supportive industrial and labor data, optimism surrounding COVID-19 vaccine testing and ongoing policy support from governments and central banks. This was followed by a decline in September, with a spike in COVID-19 cases globally, a pullback in information technology sector performance, and the U.S. Fed’s perspective on further policy support. European equities ended the third calendar quarter flat. While major corporate earnings beats of consensus expectations provided some support, European stock markets were pressured by rising worries around a second wave of COVID-19, and the direction of Brexit negotiations remained a key concern. (Brexit is the popular term for the U.K.’s path out of the European Union.) In the Euro area, the flash composite Purchasing Managers Index reached a three-month low in September. The manufacturing sector, however, continued to see growth, led by Germany’s surge in output. The U.K. presented an Internal Market Bill to its parliament containing provisions that conflict with the EU-U.K. Withdrawal Agreement reached earlier in the year. But the U.K. and Japan finalized a free-trade agreement, the U.K.’s first major post-Brexit accord. The Japanese equity market slowed in September from its year-to-date high in August amidst increasing U.S.-China tensions and ongoing strength of the yen. However, the downside was limited by better than consensus expected Japanese Gross Domestic Product (“GDP”) numbers, lowering of COVID-19 alerts in Tokyo and easing of restrictions in Japan. Yoshihide Suga was elected as Japan’s Prime Minister in mid-September, becoming the country’s first new leader in nearly eight years. In September, the Bank of Japan upgraded its assessment of Japan’s economy, stating it had started to pick up after a difficult period caused by the COVID-19 pandemic.
1
GOLDMAN SACHS VARIABLE INSURANCE TRUST INTERNATIONAL EQUITY INSIGHTS FUND
After declining for a second consecutive month in October 2020, international equity markets then rallied in the last two months of the calendar year, with cyclical and value-oriented stocks outperforming growth-oriented names in a reversal of a long-standing trend. Equity markets recovered on resolution of the U.S. election results. The announcement of promising data from three COVID-19 vaccine developers gave further boost to investor sentiment and the prospects of a global economic recovery. Still, rising COVID-19 cases and renewed activity restrictions cast concerns on the near term, and policy uncertainties around more stimulus in the U.S., Fed facilities and the EU recovery fund also weighed on the outlook. While European equities faced some headwinds from increasing COVID-19 cases and heightened lockdown restrictions, spillover optimism from the U.S. elections boosted European stocks. However, the Euro area’s composite Purchasing Managers Index declined sharply from 50.0 in October to 45.1 in November. At a country level, France was a detractor, while Germany performed well, mirroring the pattern of the Euro area’s first wave of COVID-19 earlier in 2020. In the U.K., third quarter GDP rose by 15.5% quarter over quarter non-annualized, the sharpest quarterly expansion on record. The Japanese equity market rallied, driven by global cues, particularly around COVID-19 vaccines and U.S. Presidential election related news. The Japanese equity market closed 2020 at its highest level since November 1991.
For the Reporting Period overall, eight of the 11 sectors of the MSCI EAFE gained, with information technology leading the way, followed by communication services and materials. Energy was the weakest performer on the basis of total return during the Reporting Period, followed by real estate and financials.
From a country perspective, Denmark, Sweden, the Netherlands, Ireland and Finland were the strongest individual country constituents in the MSCI EAFE Standard Index on a relative basis during the Reporting Period. The U.K., Belgium, Singapore, Spain and Austria most significantly lagged the MSCI EAFE Standard Index on a relative basis during the Reporting Period.
What key factors were responsible for the Fund’s performance during the Reporting Period?
During the Reporting Period, the Fund posted solid absolute gains but underperformed the MSCI EAFE Standard Index, with two of our quantitative model’s four investment themes detracting from results. Stock selection overall, driven by these investment themes, diminished relative performance.
What impact did the Fund’s investment themes have on performance during the Reporting Period?
The Fund uses a quantitative style of management, in combination with a qualitative overlay, that emphasizes fundamentally-based stock selection, careful portfolio construction and efficient implementation. The Fund’s investments are selected using fundamental research and a variety of quantitative techniques based on certain investment themes, namely Fundamental Mispricings, High Quality Business Models, Sentiment Analysis and Market Themes & Trends.
In keeping with our investment approach, we use our quantitative model and four investment themes to take a long-term view of market patterns and look for inefficiencies, selecting stocks for the Fund and overweighting or underweighting the ones chosen by the model. Over time and by design, the performance of any one of the model’s investment themes tends to have a low correlation with the model’s other themes, demonstrating the diversification benefit of the Fund’s theme-driven quantitative model. The variance in performance supports our research indicating that the diversification provided by the Fund’s different investment themes is a significant investment advantage over the long term, even though the Fund may experience underperformance in the short term. Of course, diversification does not protect an investor from market risk nor does it ensure a profit.
During the Reporting Period, two of our four investment themes — Fundamental Mispricings and High Quality Business Models — detracted from the Fund’s relative performance. The other two investment themes — Market Themes & Trends and Sentiment Analysis contributed positively. Fundamental Mispricings seeks to identify high quality businesses trading at a fair price, which we believe may lead to strong performance over the long run. High Quality Business Models seeks to identify companies that are generating high quality revenues with sustainable business models and aligned management incentives. Market Themes & Trends seeks to identify companies positively positioned to benefit from themes and trends in the market and macroeconomic environment. Sentiment Analysis seeks to identify stocks experiencing improvements in their overall market sentiment.
How did the Fund’s sector and industry allocations affect relative performance during the Reporting Period?
In constructing the Fund’s portfolio, we focus on picking stocks rather than making sector or industry bets. Consequently, the Fund is similar to its benchmark, the MSCI EAFE Standard Index, in terms of its sector and industry allocations and style. Changes in its sector or industry weights generally do not have a meaningful impact on relative performance.
Did stock selection help or hurt Fund performance during the Reporting Period?
We seek to outpace the MSCI EAFE Standard Index by overweighting stocks that we expect to outperform and underweighting those that we think may lag. At the same time, we strive to maintain a risk profile similar to the MSCI EAFE Standard Index. The
2
GOLDMAN SACHS VARIABLE INSURANCE TRUST INTERNATIONAL EQUITY INSIGHTS FUND
Fund’s investments are selected using fundamental research and a variety of quantitative techniques based on our investment themes. For example, the Fund aims to hold a basket of stocks with better Fundamental Mispricings characteristics than the benchmark index.
During the Reporting Period, stock selection hampered the Fund’s performance, with investments in the consumer discretionary sector detracting most from results relative to the MSCI EAFE Standard Index, followed at some distance by investments in the industrials and utilities sectors. Holdings in the information technology, health care and financials sectors added most to the Fund’s relative returns.
Which individual positions detracted from the Fund’s results during the Reporting Period?
Detracting most from the Fund’s results relative to the MSCI EAFE Standard Index were overweight positions in Australia-based oil and gas exploration and production company Santos and Japan-based correspondence educational services provider Benesse Holdings and an underweight position in France-based diversified luxury goods producer LVMH Moet Hennessy Louis Vuitton. The overweights in Santos and Benesse Holdings were implemented primarily because of our Market Themes & Trends investment theme. The underweight in LVMH Moet Hennessy Louis Vuitton was based primarily on our Fundamental Mispricings investment theme.
Which individual stock positions contributed the most to the Fund’s relative returns during the Reporting Period?
The Fund benefited most from overweight positions in Australia-based iron ore producer Fortescue Metals Group, Netherlands-based semiconductor machinery manufacturer ASM International and Sweden-based smokeless tobacco products manufacturer Swedish Match. The overweight in Fortescue Metals Group Ltd. was fueled mainly by our High Quality Business Models and Market Themes & Trends investment themes. The overweight in ASM International NV was based primarily on our Market Themes & Trends and High Quality Business Models investment themes. Driven mostly by our Fundamental Mispricings investment theme, the Fund benefited from its overweight in Swedish Match.
What impact did country selection have on the Fund’s relative performance during the Reporting Period?
To construct the Fund’s portfolio, we focus on security selection rather than on making country bets. As a result, the Fund is similar to the MSCI EAFE Standard Index in terms of its country allocation. Changes in the Fund’s country weightings are generally the result of our stock picking.
Did you make any enhancements to your quantitative models during the Reporting Period?
We continuously look for ways to improve our investment process. During the Reporting Period, we made numerous enhancements to our models. As example, during the first half of the Reporting Period, we introduced a new Fundamental Mispricings signal into all of our regional models. This signal seeks to test investors’ under-reaction to a company’s short-term deviation in its fundamentals by simultaneously looking at a set of key profitability metrics that could point to a company’s long-term growth prospects. In our country selection model, we introduced a signal under our Momentum investment theme that seeks to identify which countries have strong business relationships and may grow together. The signal does so by using linkages inferred from company-level supply chain data. Additionally, we introduced another Momentum signal in our developed markets model that parses through news articles about central bank activity or statements, seeking information that may impact the attractiveness of markets.
During the second half of the Reporting Period, we introduced a new signal within our High Quality Business Models investment theme. The signal evaluates the overlap in tenure of a company’s C-Suite executives as well as other management positions, as we believe companies that exhibit less turnover in their senior-most management teams are likely to outperform in the long run. We also introduced a strategic climate-aware tilt with longer-term return expectations within our portfolio construction process. This tilt is designed to reduce the Fund’s exposure to carbon transition risk using two proprietary measures of emissions intensity. We believe that the transition to a low-carbon economy is likely to become even more important in determining the attractiveness of companies in the future.
How did the Fund use derivatives during the Reporting Period?
During the Reporting Period, we did not use derivatives as part of an active management strategy to add value to the Fund’s results. However, we used equity index futures contracts, on an opportunistic basis, to equitize the Fund’s excess cash holdings. In other words, we put the Fund’s excess cash holdings to work by using them as collateral for the purchase of stock futures. The use of these futures contracts did not have a material impact on the Fund’s performance during the second part of the Reporting Period.
3
GOLDMAN SACHS VARIABLE INSURANCE TRUST INTERNATIONAL EQUITY INSIGHTS FUND
What were the Fund’s sector and country weightings at the end of the Reporting Period?
As of December 31, 2020, the Fund was overweight the health care and communication services sectors relative to the MSCI EAFE Standard Index. The Fund was underweight utilities and consumer staples and was rather neutral to the MSCI EAFE Standard Index in industrials, materials, consumer discretionary, real estate, information technology, financials and energy on the same date.
In terms of countries, the Fund was overweight relative to the MSCI EAFE Standard Index in Japan, Switzerland and the Netherlands. Compared to the MSCI EAFE Standard Index, the Fund was underweight in France, the U.K. and Germany and was relatively neutral compared to the MSCI EAFE Standard Index in the remaining constituents of the MSCI EAFE Standard Index at the end of the Reporting Period.
Were there any changes to the Fund’s portfolio management team during the Reporting Period?
There were no changes to the Fund’s portfolio management team during the Reporting Period.
What is your strategy going forward for the Fund?
Looking ahead, we continue to believe that less expensive stocks should outpace more expensive stocks, and stocks with good momentum are likely to outperform those with poor momentum. We intend to maintain our focus on seeking companies about which fundamental research analysts are becoming more positive as well as profitable companies with sustainable earnings and a track record of using their capital to enhance shareholder value. As such, we anticipate remaining fully invested with long-term performance likely to be the result of stock selection rather than sector or capitalization allocations.
We stand behind our investment philosophy that sound economic investment principles, coupled with a disciplined quantitative approach, can provide strong, uncorrelated returns over the long term. Our research agenda is robust, and we continue to enhance our existing models, add new proprietary forecasting signals and improve our trading execution as we seek to provide the most value to our shareholders.
4
GOLDMAN SACHS VARIABLE INSURANCE TRUST INTERNATIONAL EQUITY INSIGHTS FUND
Index Definitions
The MSCI EAFE Standard Index is a market capitalization-weighted composite of securities in 21 developed markets. The MSCI EAFE Standard Index approximates the minimum possible dividend reinvestment. The dividend is reinvested after deduction for withholding tax, applying the rate to non-resident individuals who do not benefit from double taxation treaties. MSCI uses withholding tax rates applicable to Luxembourg holding companies, as Luxembourg applies the highest rates. The MSCI EAFE Standard Index is unmanaged and the figures for the Index do not include any deduction for fees or expenses.
It is not possible to invest directly in an index.
5
FUND BASICS
International Equity Insights Fund
as of December 31, 2020
TOP TEN HOLDINGS AS OF 12/31/201
| | | | | | | | |
| | | |
| Holding | | % of
Net Assets | | | Line of Business | | Country |
| Nestle SA (Registered) | | | 2.5% | | | Food, Beverage & Tobacco | | Switzerland |
| Roche Holding AG | | | 2.1 | | | Pharmaceuticals, Biotechnology & Life Sciences | | Switzerland |
| Toyota Motor Corp. | | | 1.7 | | | Automobiles & Components | | Japan |
| ASML Holding NV | | | 1.6 | | | Semiconductors & Semiconductor Equipment | | Netherlands |
| Allianz SE (Registered) | | | 1.3 | | | Insurance | | Germany |
| AIA Group Ltd. | | | 1.3 | | | Insurance | | Hong Kong |
| Novartis AG (Registered) | | | 1.3 | | | Pharmaceuticals, Biotechnology & Life Sciences | | Switzerland |
| Schneider Electric SE | | | 1.2 | | | Capital Goods | | France |
| Rio Tinto plc ADR | | | 1.2 | | | Materials | | Australia |
| Sanofi | | | 1.2 | | | Pharmaceuticals, Biotechnology & Life Sciences | | France |
| 1 | The top 10 holdings may not be representative of the Fund’s future investments. |
FUND VS. BENCHMARK SECTOR ALLOCATIONS2
As of December 31, 2020
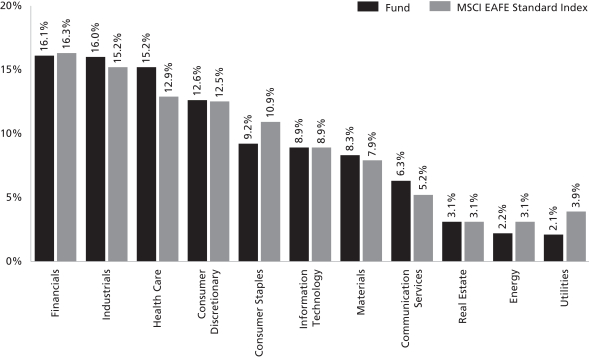
| 2 | The Fund is actively managed and, as such, its composition may differ over time. Consequently, the Fund’s overall sector allocations may differ from percentages contained in the graph above. The graph categorizes investments using Global Industry Classification Standard (“GICS”); however, the sector classifications used by the portfolio management team may differ from GICS. The percentage shown for each investment category reflects the value of investments in that category as a percentage of market value. The graph depicts the Fund’s investments but may not represent the Fund’s market exposure due to the exclusion of certain derivatives, if any, as listed in the Additional Investment Information section of the Schedule of Investments. |
For more information about your Fund, please refer to www.GSAMFUNDS.com. There, you can learn more about
your Fund’s investment strategies, holdings, and performance.
6
GOLDMAN SACHS VARIABLE INSURANCE TRUST INTERNATIONAL EQUITY INSIGHTS FUND
Performance Summary
December 31, 2020
The following graph shows the value, as of December 31, 2020, of a $10,000 investment made on January 1, 2011 in Institutional Shares at NAV. For comparative purposes, the performance of the Fund’s benchmark, the MSCI EAFE Standard Index (Net, USD, Unhedged), is shown. Performance reflects applicable fee waivers and/or expense limitations in effect during the periods shown and in their absence, performance would be reduced. Returns do not reflect the deduction of taxes that a shareholder would pay on Fund distributions or the redemption of Fund shares. The returns set forth below represent past performance. Past performance does not guarantee future results. The Fund’s investment return and principal value will fluctuate so that an investor’s shares, when redeemed, may be worth more or less than their original cost. Current performance may be lower or higher than the performance quoted below. Please visit our web site at www.GSAMFUNDS.com to obtain the most recent month-end returns.
International Equity Insights Fund’s 10 Year Performance
Performance of a $10,000 investment, with distributions reinvested, from January 1, 2011 through December 31, 2020.
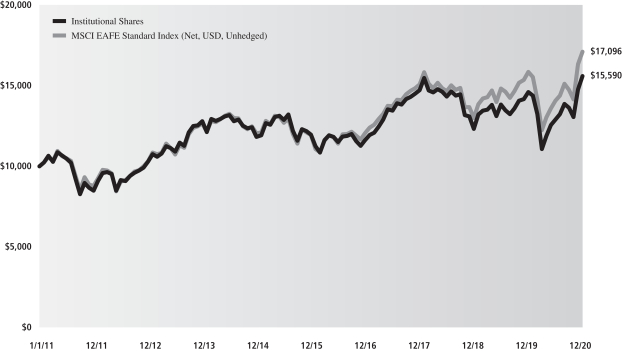
| | | | | | |
| Average Annual Total Return through December 31, 2020 | | One Year | | Five Years | | Ten Years |
Institutional | | 6.79% | | 5.45% | | 4.54% |
Service | | 6.53% | | 5.20% | | 4.28% |
7
GOLDMAN SACHS VARIABLE INSURANCE TRUST INTERNATIONAL EQUITY INSIGHTS FUND
Schedule of Investments
December 31, 2020
| | | | | | | | |
| Shares | | | Description | | Value | |
|
| Common Stocks – 97.7% | |
| Australia – 7.9% | |
| | 74,127 | | | Brambles Ltd. (Commercial & Professional Services) | | $ | 608,012 | |
| | 53,339 | | | Fortescue Metals Group Ltd. (Materials) | | | 963,430 | |
| | 9,689 | | | Glencore plc (Materials)* | | | 30,770 | |
| | 50,111 | | | Goodman Group (REIT) | | | 732,496 | |
| | 15,465 | | | JB Hi-Fi Ltd. (Retailing) | | | 580,634 | |
| | 14,219 | | | Mineral Resources Ltd. (Materials) | | | 411,114 | |
| | 45,798 | | | Origin Energy Ltd. (Energy) | | | 168,142 | |
| | 3,289 | | | Premier Investments Ltd. (Retailing) | | | 59,668 | |
| | 1,542 | | | REA Group Ltd. (Media & Entertainment) | | | 176,632 | |
| | 8,411 | | | Rio Tinto Ltd. (Materials) | | | 739,676 | |
| | 15,701 | | | Rio Tinto plc ADR (Materials) | | | 1,181,029 | |
| | 37,421 | | | Santos Ltd. (Energy) | | | 181,219 | |
| | 25,871 | | | Sonic Healthcare Ltd. (Health Care Equipment & Services) | | | 641,001 | |
| | 13,348 | | | Washington H Soul Pattinson & Co. Ltd. (Energy) | | | 310,500 | |
| | 19,158 | | | Wesfarmers Ltd. (Retailing) | | | 744,616 | |
| | 20,355 | | | Worley Ltd. (Energy) | | | 179,788 | |
| | | | | | | | |
| | | | | | | 7,708,727 | |
| | |
| Belgium – 1.2% | |
| | 10,897 | | | bpost SA (Transportation)* | | | 112,636 | |
| | 10,124 | | | KBC Group NV (Banks) | | | 708,489 | |
| | 10,368 | | | Warehouses De Pauw CVA (REIT) | | | 359,444 | |
| | | | | | | | |
| | | | | | | 1,180,569 | |
| | |
| China – 0.5% | |
| | 248,400 | | | Chow Tai Fook Jewellery Group Ltd. (Retailing) | | | 312,318 | |
| | 9,500 | | | ENN Energy Holdings Ltd. (Utilities) | | | 139,457 | |
| | | | | | | | |
| | | | | | | 451,775 | |
| | |
| Denmark – 2.9% | |
| | 86 | | | AP Moller – Maersk A/S Class A (Transportation) | | | 177,657 | |
| | 44 | | | AP Moller – Maersk A/S Class B (Transportation) | | | 97,911 | |
| | 3,279 | | | Carlsberg A/S Class B (Food, Beverage & Tobacco) | | | 525,665 | |
| | 3,978 | | | DSV PANALPINA A/S (Transportation) | | | 668,550 | |
| | 1,609 | | | GN Store Nord A/S (Health Care Equipment & Services) | | | 128,260 | |
| | 16,180 | | | Novo Nordisk A/S Class B (Pharmaceuticals, Biotechnology & Life Sciences) | | | 1,128,703 | |
| | 450 | | | Pandora A/S (Consumer Durables & Apparel) | | | 50,363 | |
| | 550 | | | Solar A/S Class B (Capital Goods) | | | 32,500 | |
| | | | | | | | |
| | | | | | | 2,809,609 | |
| | |
|
| Common Stocks – (continued) | |
| Finland – 0.6% | |
| | 24,623 | | | Kesko OYJ Class B (Food & Staples Retailing) | | | 631,989 | |
| | |
| France – 7.4% | |
| | 3,415 | | | Airbus SE (Capital Goods)* | | | 374,777 | |
| | 751 | | | Arkema SA (Materials) | | | 85,931 | |
| | 20,209 | | | BNP Paribas SA (Banks)* | | | 1,066,877 | |
| | 512 | | | Cie de Saint-Gobain (Capital Goods) | | | 23,548 | |
| | 5,483 | | | CNP Assurances (Insurance)* | | | 89,083 | |
| | 3,922 | | | Gecina SA (REIT) | | | 609,871 | |
| | 2,917 | | | IPSOS (Media & Entertainment) | | | 98,439 | |
| | 5,300 | | | Legrand SA (Capital Goods) | | | 474,120 | |
| | 39,707 | | | Rexel SA (Capital Goods)* | | | 626,709 | |
| | 802 | | | Safran SA (Capital Goods)* | | | 113,671 | |
| | 11,789 | | | Sanofi (Pharmaceuticals, Biotechnology & Life Sciences) | | | 1,142,625 | |
| | 1,642 | | | Sartorius Stedim Biotech (Pharmaceuticals, Biotechnology & Life Sciences) | | | 584,132 | |
| | 8,247 | | | Schneider Electric SE (Capital Goods) | | | 1,191,918 | |
| | 2,136 | | | Teleperformance (Commercial & Professional Services) | | | 709,112 | |
| | 458 | | | Trigano SA (Automobiles & Components) | | | 81,018 | |
| | | | | | | | |
| | | | | | | 7,271,831 | |
| | |
| Germany – 7.2% | |
| | 5,341 | | | Allianz SE (Registered) (Insurance) | | | 1,312,139 | |
| | 5,679 | | | Aurubis AG (Materials) | | | 443,181 | |
| | 6,199 | | | Bayerische Motoren Werke AG (Automobiles & Components) | | | 547,103 | |
| | 5,770 | | | Daimler AG (Registered) (Automobiles & Components) | | | 408,974 | |
| | 16,900 | | | Deutsche Post AG (Registered) (Transportation) | | | 837,155 | |
| | 1,853 | | | Fresenius Medical Care AG & Co. KGaA (Health Care Equipment & Services) | | | 154,517 | |
| | 4,787 | | | Fresenius SE & Co. KGaA (Health Care Equipment & Services) | | | 221,360 | |
| | 1,467 | | | Gerresheimer AG (Pharmaceuticals, Biotechnology & Life Sciences) | | | 158,199 | |
| | 2,376 | | | Hapag-Lloyd AG (Transportation)(a) | | | 266,753 | |
| | 3,371 | | | Henkel AG & Co. KGaA (Preference) (Household & Personal Products)(b) | | | 380,095 | |
| | 9,391 | | | Porsche Automobil Holding SE (Preference) (Automobiles & Components)(b) | | | 648,701 | |
| | 1,622 | | | Rheinmetall AG (Capital Goods) | | | 171,733 | |
| | 2,800 | | | SAF-Holland SE (Automobiles & Components)* | | | 38,239 | |
| | 57 | | | Sartorius AG (Preference) (Health Care Equipment & Services)(b) | | | 24,007 | |
| | 7,768 | | | Scout24 AG (Media & Entertainment)(a) | | | 634,753 | |
| | |
| | |
| 8 | | The accompanying notes are an integral part of these financial statements. |
GOLDMAN SACHS VARIABLE INSURANCE TRUST INTERNATIONAL EQUITY INSIGHTS FUND
| | | | | | | | |
| Shares | | | Description | | Value | |
|
| Common Stocks – (continued) | |
| Germany – (continued) | |
| | 4,501 | | | Volkswagen AG (Preference) (Automobiles & Components)(b) | | $ | 841,164 | |
| | | | | | | | |
| | | | | | | 7,088,073 | |
| | |
| Hong Kong – 3.2% | |
| | 106,000 | | | AIA Group Ltd. (Insurance) | | | 1,291,729 | |
| | 4,000 | | | CK Asset Holdings Ltd. (Real Estate) | | | 20,467 | |
| | 54,000 | | | CLP Holdings Ltd. (Utilities) | | | 499,319 | |
| | 48,400 | | | Man Wah Holdings Ltd. (Consumer Durables & Apparel) | | | 104,989 | |
| | 47,000 | | | Sun Hung Kai Properties Ltd. (Real Estate) | | | 601,082 | |
| | 45,000 | | | Techtronic Industries Co. Ltd. (Capital Goods) | | | 643,204 | |
| | | | | | | | |
| | | | | | | 3,160,790 | |
| | |
| Ireland – 0.1% | |
| | 2,958 | | | Smurfit Kappa Group plc (Materials) | | | 138,161 | |
| | |
| Israel – 0.1% | |
| | 2,710 | | | Plus500 Ltd. (Diversified Financials) | | | 53,689 | |
| | |
| Italy – 2.2% | |
| | 6,338 | | | Buzzi Unicem SpA (Materials) | | | 151,305 | |
| | 109,759 | | | Enel SpA (Utilities) | | | 1,116,769 | |
| | 1,743 | | | Ferrari NV (Automobiles & Components) | | | 404,274 | |
| | 14,823 | | | Prysmian SpA (Capital Goods) | | | 527,590 | |
| | | | | | | | |
| | | | | | | 2,199,938 | |
| | |
| Japan – 27.8% | |
| | 6,000 | | | AGC, Inc. (Capital Goods) | | | 209,814 | |
| | 10,200 | | | Aisin Seiki Co. Ltd. (Automobiles & Components) | | | 305,890 | |
| | 12,500 | | | Alps Alpine Co. Ltd. (Technology Hardware & Equipment) | | | 164,936 | |
| | 16,900 | | | Benesse Holdings, Inc. (Consumer Services) | | | 330,166 | |
| | 10,000 | | | Chubu Electric Power Co., Inc. (Utilities) | | | 120,680 | |
| | 6,100 | | | Daiwa House Industry Co. Ltd. (Real Estate) | | | 181,370 | |
| | 15,100 | | | DCM Holdings Co. Ltd. (Retailing) | | | 172,609 | |
| | 32,300 | | | DeNA Co. Ltd. (Media & Entertainment) | | | 574,971 | |
| | 19,600 | | | Dentsu Group, Inc. (Media & Entertainment) | | | 583,333 | |
| | 500 | | | Dowa Holdings Co. Ltd. (Materials) | | | 18,125 | |
| | 32,400 | | | ENEOS Holdings, Inc. (Energy) | | | 116,371 | |
| | 2,500 | | | FANUC Corp. (Capital Goods) | | | 617,123 | |
| | 4,900 | | | Fujitsu Ltd. (Software & Services) | | | 708,224 | |
| | 3,200 | | | GMO internet, Inc. (Software & Services) | | | 91,888 | |
| | 32,600 | | | Honda Motor Co. Ltd. (Automobiles & Components) | | | 919,851 | |
| | 6,900 | | | Hoya Corp. (Health Care Equipment & Services) | | | 955,614 | |
| | |
|
| Common Stocks – (continued) | |
| Japan – (continued) | |
| | 34,200 | | | Japan Tobacco, Inc. (Food, Beverage & Tobacco) | | | 697,241 | |
| | 2,100 | | | KDDI Corp. (Telecommunication Services) | | | 62,266 | |
| | 30,400 | | | Kirin Holdings Co. Ltd. (Food, Beverage & Tobacco) | | | 717,835 | |
| | 800 | | | Komeri Co. Ltd. (Retailing) | | | 22,618 | |
| | 12,500 | | | Konami Holdings Corp. (Media & Entertainment) | | | 703,328 | |
| | 12,000 | | | K’s Holdings Corp. (Retailing) | | | 167,205 | |
| | 10,600 | | | M3, Inc. (Health Care Equipment & Services) | | | 1,001,354 | |
| | 6,900 | | | Macnica Fuji Electronics Holdings, Inc. (Technology Hardware & Equipment) | | | 135,713 | |
| | 4,500 | | | Marubeni Corp. (Capital Goods) | | | 29,981 | |
| | 50,300 | | | Mitsubishi Electric Corp. (Capital Goods) | | | 760,217 | |
| | 159,300 | | | Mitsubishi UFJ Financial Group, Inc. (Banks) | | | 705,320 | |
| | 3,100 | | | Mixi, Inc. (Media & Entertainment) | | | 76,954 | |
| | 12,100 | | | NEC Corp. (Software & Services) | | | 649,887 | |
| | 15,500 | | | NGK Insulators Ltd. (Capital Goods) | | | 239,502 | |
| | 400 | | | Nippon Express Co. Ltd. (Transportation) | | | 26,907 | |
| | 18,600 | | | Nippon Telegraph & Telephone Corp. (Telecommunication Services) | | | 477,257 | |
| | 1,000 | | | Nitori Holdings Co. Ltd. (Retailing) | | | 209,101 | |
| | 9,100 | | | Nitto Denko Corp. (Materials) | | | 815,178 | |
| | 1,600 | | | Nomura Research Institute Ltd. (Software & Services) | | | 57,238 | |
| | 7,500 | | | Omron Corp. (Technology Hardware & Equipment) | | | 669,535 | |
| | 7,000 | | | Open House Co. Ltd. (Real Estate) | | | 257,516 | |
| | 51,900 | | | ORIX Corp. (Diversified Financials) | | | 798,436 | |
| | 600 | | | PeptiDream, Inc. (Pharmaceuticals, Biotechnology & Life Sciences)* | | | 30,520 | |
| | 33,600 | | | Ricoh Co. Ltd. (Technology Hardware & Equipment) | | | 220,950 | |
| | 6,700 | | | Rohm Co. Ltd. (Semiconductors & Semiconductor Equipment) | | | 649,503 | |
| | 22,500 | | | Sega Sammy Holdings, Inc. (Consumer Durables & Apparel) | | | 355,182 | |
| | 5,400 | | | Seiko Epson Corp. (Technology Hardware & Equipment) | | | 80,245 | |
| | 3,300 | | | Seino Holdings Co. Ltd. (Transportation) | | | 46,568 | |
| | 11,100 | | | Seven & i Holdings Co. Ltd. (Food & Staples Retailing) | | | 393,058 | |
| | 8,000 | | | Shionogi & Co. Ltd. (Pharmaceuticals, Biotechnology & Life Sciences) | | | 437,372 | |
| | 9,400 | | | SoftBank Group Corp. (Telecommunication Services) | | | 729,770 | |
| | 3,800 | | | Sony Corp. (Consumer Durables & Apparel) | | | 382,919 | |
| | |
| | |
| The accompanying notes are an integral part of these financial statements. | | 9 |
GOLDMAN SACHS VARIABLE INSURANCE TRUST INTERNATIONAL EQUITY INSIGHTS FUND
Schedule of Investments (continued)
December 31, 2020
| | | | | | | | |
| Shares | | | Description | | Value | |
|
| Common Stocks – (continued) | |
| Japan – (continued) | |
| | 24,800 | | | Subaru Corp. (Automobiles & Components) | | $ | 496,222 | |
| | 29,600 | | | Sumitomo Corp. (Capital Goods) | | | 392,287 | |
| | 14,900 | | | Sumitomo Electric Industries Ltd. (Automobiles & Components) | | | 197,437 | |
| | 20,700 | | | Sumitomo Mitsui Financial Group, Inc. (Banks) | | | 641,662 | |
| | 6,300 | | | Suntory Beverage & Food Ltd. (Food, Beverage & Tobacco) | | | 223,142 | |
| | 32,500 | | | T&D Holdings, Inc. (Insurance) | | | 384,438 | |
| | 1,700 | | | Taiheiyo Cement Corp. (Materials) | | | 42,583 | |
| | 25,300 | | | Takeda Pharmaceutical Co. Ltd. (Pharmaceuticals, Biotechnology & Life Sciences) | | | 915,591 | |
| | 300 | | | TDK Corp. (Technology Hardware & Equipment) | | | 45,265 | |
| | 34,100 | | | Teijin Ltd. (Materials) | | | 641,697 | |
| | 17,100 | | | TIS, Inc. (Software & Services) | | | 350,542 | |
| | 2,000 | | | Tokyo Electron Ltd. (Semiconductors & Semiconductor Equipment) | | | 747,126 | |
| | 1,400 | | | Tokyo Ohka Kogyo Co. Ltd. (Materials) | | | 98,349 | |
| | 3,400 | | | Tokyo Seimitsu Co. Ltd. (Semiconductors & Semiconductor Equipment) | | | 159,973 | |
| | 3,000 | | | Tosoh Corp. (Materials) | | | 46,872 | |
| | 5,200 | | | Toyo Seikan Group Holdings Ltd. (Materials) | | | 56,947 | |
| | 21,500 | | | Toyota Motor Corp. (Automobiles & Components) | | | 1,659,158 | |
| | 119,200 | | | Yamada Holdings Co. Ltd. (Retailing) | | | 633,312 | |
| | 4,900 | | | Yamato Holdings Co. Ltd. (Transportation) | | | 125,110 | |
| | 108,400 | | | Z Holdings Corp. (Media & Entertainment) | | | 655,954 | |
| | | | | | | | |
| | | | | | | 27,191,308 | |
| | |
| Luxembourg – 0.7% | |
| | 3,703 | | | APERAM SA (Materials) | | | 154,102 | |
| | 6,300 | | | Eurofins Scientific SE (Pharmaceuticals, Biotechnology & Life Sciences)* | | | 528,204 | |
| | | | | | | | |
| | | | | | | 682,306 | |
| | |
| Netherlands – 6.1% | |
| | 4,514 | | | Akzo Nobel NV (Materials) | | | 484,508 | |
| | 3,563 | | | ASM International NV (Semiconductors & Semiconductor Equipment) | | | 777,522 | |
| | 3,302 | | | ASML Holding NV (Semiconductors & Semiconductor Equipment) | | | 1,598,753 | |
| | 916 | | | BE Semiconductor Industries NV (Semiconductors & Semiconductor Equipment) | | | 55,007 | |
| | 834 | | | Flow Traders (Diversified Financials)(a) | | | 27,611 | |
| | |
|
| Common Stocks – (continued) | |
| Netherlands – (continued) | |
| | 26,833 | | | Koninklijke Ahold Delhaize NV (Food & Staples Retailing) | | | 756,995 | |
| | 524 | | | Koninklijke Philips NV (Health Care Equipment & Services)* | | | 28,227 | |
| | 10,863 | | | Randstad NV (Commercial & Professional Services)* | | | 703,191 | |
| | 21,944 | | | Royal Dutch Shell plc Class A (Energy) | | | 386,280 | |
| | 9,689 | | | Royal Dutch Shell plc Class B ADR (Energy) | | | 325,647 | |
| | 9,819 | | | Signify NV (Capital Goods)*(a) | | | 412,263 | |
| | 1,439 | | | Van Lanschot Kempen NV CVA (Banks) | | | 36,806 | |
| | 4,492 | | | Wolters Kluwer NV (Commercial & Professional Services) | | | 378,977 | |
| | | | | | | | |
| | | | | | | 5,971,787 | |
| | |
| New Zealand – 0.8% | |
| | 4,095 | | | Fisher & Paykel Healthcare Corp. Ltd. (Health Care Equipment & Services) | | | 97,251 | |
| | 6,244 | | | Xero Ltd. (Software & Services)* | | | 708,689 | |
| | | | | | | | |
| | | | | | | 805,940 | |
| | |
| Norway – 0.9% | |
| | 114,608 | | | Norsk Hydro ASA (Materials) | | | 533,395 | |
| | 14,968 | | | Orkla ASA (Food, Beverage & Tobacco) | | | 151,962 | |
| | 3,067 | | | Scatec ASA (Utilities)(a) | | | 122,141 | |
| | 13,410 | | | Wallenius Wilhelmsen ASA (Transportation) | | | 36,395 | |
| | | | | | | | |
| | | | | | | 843,893 | |
| | |
| Singapore – 1.2% | |
| | 38,459 | | | DBS Group Holdings Ltd. (Banks) | | | 728,826 | |
| | 24,200 | | | United Overseas Bank Ltd. (Banks) | | | 412,475 | |
| | | | | | | | |
| | | | | | | 1,141,301 | |
| | |
| South Africa – 0.9% | |
| | 25,588 | | | Anglo American plc (Materials) | | | 844,973 | |
| | |
| Spain – 2.3% | |
| | 99,647 | | | Banco Bilbao Vizcaya Argentaria SA (Banks) | | | 493,911 | |
| | 327,153 | | | Banco Santander SA (Banks) | | | 1,020,174 | |
| | 8,274 | | | Cellnex Telecom SA (Telecommunication Services)(a) | | | 496,878 | |
| | 7,079 | | | Grifols SA (Pharmaceuticals, Biotechnology & Life Sciences) | | | 206,682 | |
| | | | | | | | |
| | | | | | | 2,217,645 | |
| | |
| Sweden – 1.9% | |
| | 2,362 | | | Investor AB Class A (Diversified Financials) | | | 171,074 | |
| | 8,817 | | | Investor AB Class B (Diversified Financials) | | | 641,731 | |
| | 2,834 | | | Swedish Match AB (Food, Beverage & Tobacco) | | | 220,544 | |
| | |
| | |
| 10 | | The accompanying notes are an integral part of these financial statements. |
GOLDMAN SACHS VARIABLE INSURANCE TRUST INTERNATIONAL EQUITY INSIGHTS FUND
| | | | | | | | |
| Shares | | | Description | | Value | |
|
| Common Stocks – (continued) | |
| Sweden – (continued) | |
| | 33,905 | | | Volvo AB Class B (Capital Goods)* | | $ | 802,636 | |
| | | | | | | | |
| | | | | | | 1,835,985 | |
| | |
| Switzerland – 12.2% | |
| | 5,724 | | | ABB Ltd. (Registered) (Capital Goods) | | | 160,554 | |
| | 10,963 | | | Adecco Group AG (Registered) (Commercial & Professional Services) | | | 730,173 | |
| | 348 | | | Kuehne + Nagel International AG (Registered) (Transportation) | | | 78,968 | |
| | 1,214 | | | Lonza Group AG (Registered) (Pharmaceuticals, Biotechnology & Life Sciences) | | | 782,018 | |
| | 20,506 | | | Nestle SA (Registered) (Food, Beverage & Tobacco) | | | 2,424,041 | |
| | 13,523 | | | Novartis AG (Registered) (Pharmaceuticals, Biotechnology & Life Sciences) | | | 1,273,298 | |
| | 5,975 | | | Roche Holding AG (Pharmaceuticals, Biotechnology & Life Sciences) | | | 2,081,213 | |
| | 61 | | | Sika AG (Registered) (Materials) | | | 16,628 | |
| | 2,644 | | | Sonova Holding AG (Registered) (Health Care Equipment & Services)* | | | 687,687 | |
| | 8,843 | | | STMicroelectronics NV (Semiconductors & Semiconductor Equipment) | | | 329,909 | |
| | 467 | | | Swatch Group AG (The) (Consumer Durables & Apparel) | | | 126,951 | |
| | 1,537 | | | Swiss Life Holding AG (Registered) (Insurance)* | | | 716,965 | |
| | 1,194 | | | Tecan Group AG (Registered) (Pharmaceuticals, Biotechnology & Life Sciences) | | | 585,636 | |
| | 65,173 | | | UBS Group AG (Registered) (Diversified Financials) | | | 917,625 | |
| | 2,357 | | | Zurich Insurance Group AG (Insurance) | | | 993,290 | |
| | | | | | | | |
| | | | | | | 11,904,956 | |
| | |
| United Kingdom – 9.6% | |
| | 29,481 | | | 3i Group plc (Diversified Financials) | | | 466,299 | |
| | 4,918 | | | Associated British Foods plc (Food, Beverage & Tobacco)* | | | 151,842 | |
| | 8,042 | | | AstraZeneca plc ADR (Pharmaceuticals, Biotechnology & Life Sciences) | | | 402,020 | |
| | 162,324 | | | Aviva plc (Insurance) | | | 722,023 | |
| | 144,369 | | | Barclays plc (Banks) | | | 289,618 | |
| | 43,920 | | | boohoo Group plc (Retailing)* | | | 206,173 | |
| | 22,941 | | | BP plc ADR (Energy) | | | 470,749 | |
| | 8,965 | | | British American Tobacco plc (Food, Beverage & Tobacco) | | | 332,932 | |
| | 76,415 | | | BT Group plc (Telecommunication Services)* | | | 137,735 | |
| | 1,400 | | | Clarkson plc (Transportation) | | | 51,692 | |
| | |
|
| Common Stocks – (continued) | |
| United Kingdom – (continued) | |
| | 53,202 | | | CNH Industrial NV (Capital Goods)* | | | 668,771 | |
| | 2,460 | | | Diageo plc (Food, Beverage & Tobacco) | | | 97,339 | |
| | 5,061 | | | Dialog Semiconductor plc (Semiconductors & Semiconductor Equipment)* | | | 275,789 | |
| | 84,554 | | | Direct Line Insurance Group plc (Insurance) | | | 369,814 | |
| | 19,006 | | | Entain plc (Consumer Services) | | | 294,798 | |
| | 21,005 | | | Experian plc (Commercial & Professional Services) | | | 797,952 | |
| | 16,876 | | | Fiat Chrysler Automobiles NV (Automobiles & Components)* | | | 304,883 | |
| | 1,177 | | | Games Workshop Group plc (Consumer Durables & Apparel) | | | 180,224 | |
| | 9,348 | | | GlaxoSmithKline plc ADR (Pharmaceuticals, Biotechnology & Life Sciences) | | | 344,006 | |
| | 34,232 | | | Imperial Brands plc (Food, Beverage & Tobacco) | | | 718,002 | |
| | 438,726 | | | ITV plc (Media & Entertainment)* | | | 639,306 | |
| | 21,658 | | | JD Sports Fashion plc (Retailing)* | | | 254,444 | |
| | 93,987 | | | Legal & General Group plc (Insurance) | | | 342,527 | |
| | 115,113 | | | Melrose Industries plc (Capital Goods)* | | | 280,460 | |
| | 7,805 | | | Rentokil Initial plc (Commercial & Professional Services) | | | 54,418 | |
| | 15,019 | | | Segro plc (REIT) | | | 194,883 | |
| | 36,643 | | | Tate & Lyle plc (Food, Beverage & Tobacco) | | | 337,636 | |
| | | | | | | | |
| | | | | | | 9,386,335 | |
| | |
| | TOTAL INVESTMENTS – 97.7% | | | | |
| | (Cost $81,381,587) | | $ | 95,521,580 | |
| | |
| OTHER ASSETS IN EXCESS OF
LIABILITIES – 2.3% | | | 2,278,156 | |
| | |
| | NET ASSETS – 100.0% | | $ | 97,799,736 | |
| | |
| | |
| The percentage shown for each investment category reflects the value of investments in that category as a percentage of net assets. |
| |
| * | | Security is currently in default and/or non-income producing. |
| |
| (a) | | Exempt from registration under Rule 144A of the Securities Act of 1933. |
| |
| (b) | | Preference Shares are a special type of equity investment that shares in the earnings of the company, has limited voting rights, and receives a greater dividend than applicable Common Shares. |
| | |
| |
| Investment Abbreviations: |
| ADR | | —American Depositary Receipt |
| CVA | | —Dutch Certification |
| REIT | | —Real Estate Investment Trust |
| | |
| The accompanying notes are an integral part of these financial statements. | | 11 |
GOLDMAN SACHS VARIABLE INSURANCE TRUST INTERNATIONAL EQUITY INSIGHTS FUND
Schedule of Investments (continued)
December 31, 2020
ADDITIONAL INVESTMENT INFORMATION
FUTURES CONTRACTS — At December 31, 2020, the Fund had the following futures contracts:
| | | | | | | | | | | | | | | | |
| Description | | Number of
Contracts | | | Expiration
Date | | | Notional
Amount | | | Unrealized
Appreciation/
(Depreciation) | |
| Long position contracts: | | | | | | | | | | | | | |
| EURO STOXX 50 Index | | | 21 | | | | 03/19/2021 | | | $ | 910,740 | | | $ | 12,514 | |
| FTSE 100 Index | | | 4 | | | | 03/19/2021 | | | | 351,174 | | | | (1,907 | ) |
| MSCI Singapore Index | | | 1 | | | | 01/28/2021 | | | | 24,463 | | | | (68 | ) |
| SPI 200 Index | | | 1 | | | | 03/18/2021 | | | | 125,992 | | | | (644 | ) |
TOPIX Index | | | 3 | | | | 03/11/2021 | | | | 524,285 | | | | 15,460 | |
| | | | |
| Total Futures Contracts | | | | | | | | | | | | | | $ | 25,355 | |
| | |
| 12 | | The accompanying notes are an integral part of these financial statements. |
GOLDMAN SACHS VARIABLE INSURANCE TRUST INTERNATIONAL EQUITY INSIGHTS FUND
Statement of Assets and Liabilities
December 31, 2020
| | | | |
| | | | |
| Assets: | | | |
Investments in unaffiliated issuers, at value (cost $81,381,587) | | $ | 95,521,580 | |
Cash | | | 755,442 | |
Foreign currencies, at value (cost $1,327,356) | | | 1,357,805 | |
Receivables: | | | | |
Foreign tax reclaims | | | 357,186 | |
Collateral on certain derivative contracts | | | 180,339 | |
Dividends | | | 92,640 | |
Reimbursement from investment adviser | | | 40,106 | |
Fund shares sold | | | 854 | |
| |
Other assets | | | 496 | |
| |
| Total assets | | | 98,306,448 | |
| |
| | | | |
| Liabilities: | | | |
Variation margin on futures | | | 5,323 | |
Payables: | | | | |
Fund shares redeemed | | | 92,734 | |
Management fees | | | 66,064 | |
Distribution and Service fees and Transfer Agency fees | | | 11,575 | |
Accrued expenses | | | 331,016 | |
| |
| Total liabilities | | | 506,712 | |
| |
| | | | |
| Net Assets: | | | |
Paid-in capital | | | 95,431,486 | |
Total distributable earnings (loss) | | | 2,368,250 | |
| |
| NET ASSETS | | $ | 97,799,736 | |
Net Assets: | | | | |
Institutional | | $ | 50,114,278 | |
Service | | | 47,685,458 | |
| |
Total Net Assets | | $ | 97,799,736 | |
Shares outstanding $0.001 par value (unlimited shares authorized): | | | | |
Institutional | | | 5,814,238 | |
Service | | | 5,509,140 | |
Net asset value, offering and redemption price per share: | | | | |
Institutional | | | $8.62 | |
Service | | | 8.66 | |
| | |
| The accompanying notes are an integral part of these financial statements. | | 13 |
GOLDMAN SACHS VARIABLE INSURANCE TRUST INTERNATIONAL EQUITY INSIGHTS FUND
Statement of Operations
For the Fiscal Year Ended December 31, 2020
| | | | |
| | | | |
| Investment income: | | | |
Dividends — unaffiliated issuers (net of foreign taxes withheld of $193,411) | | $ | 1,844,032 | |
Income from non-cash dividends | | | 172,524 | |
Securities lending income — affiliated issuer | | | 4,257 | |
Dividends — affiliated issuers | | | 174 | |
| |
| Total investment income | | | 2,020,987 | |
| |
| | | | |
| Expenses: | | | |
Management fees | | | 670,183 | |
Professional fees | | | 165,575 | |
Custody, accounting and administrative services | | | 151,394 | |
Distribution and (12b-1) Service fees | | | 101,959 | |
Printing and mailing costs | | | 80,959 | |
Trustee fees | | | 20,595 | |
Transfer Agency fees(a) | | | 16,546 | |
Other | | | 23,222 | |
| |
| Total expenses | | | 1,230,433 | |
| |
Less — expense reductions | | | (406,711 | ) |
| |
| Net expenses | | | 823,722 | |
| |
| NET INVESTMENT INCOME | | | 1,197,265 | |
| |
| | | | |
| Realized and unrealized gain (loss): | | | |
Net realized gain (loss) from: | | | | |
Investments — unaffiliated issuers | | | (4,161,076 | ) |
Futures contracts | | | (63,592 | ) |
Foreign currency transactions | | | 18,145 | |
Net change in unrealized gain on: | | | | |
Investments — unaffiliated issuers | | | 8,116,044 | |
Futures contracts | | | 34,205 | |
Foreign currency translation | | | 32,961 | |
| |
| Net realized and unrealized gain | | | 3,976,687 | |
| |
| NET INCREASE IN NET ASSETS RESULTING FROM OPERATIONS | | $ | 5,173,952 | |
(a) Institutional and Service Shares incurred Transfer Agency fees of $8,390 and $8,156, respectively.
| | |
| 14 | | The accompanying notes are an integral part of these financial statements. |
GOLDMAN SACHS VARIABLE INSURANCE TRUST INTERNATIONAL EQUITY INSIGHTS FUND
Statements of Changes in Net Assets
| | | | | | | | |
| | | For the
Fiscal Year Ended
December 31, 2020 | | | For the
Fiscal Year Ended
December 31, 2019 | |
| | | | | | | | |
| From operations: | |
Net investment income | | $ | 1,197,265 | | | $ | 1,762,250 | |
Net realized loss | | | (4,206,523 | ) | | | (5,158,069 | ) |
Net change in unrealized gain | | | 8,183,210 | | | | 17,726,059 | |
| | |
| Net increase in net assets resulting from operations | | | 5,173,952 | | | | 14,330,240 | |
| |
| | | | | | | | |
| Distributions to shareholders: | | | | | | |
From distributable earnings: | | | | | | | | |
Institutional Shares | | | (717,721 | ) | | | (1,025,867 | ) |
Service Shares | | | (579,185 | ) | | | (1,031,832 | ) |
| | |
| Total distributions to shareholders | | | (1,296,906 | ) | | | (2,057,699 | ) |
| |
| | | | | | | | |
| From share transactions: | | | | | | |
Proceeds from sales of shares | | | 15,760,187 | | | | 16,601,906 | |
Reinvestment of distributions | | | 1,296,906 | | | | 2,057,699 | |
Cost of shares redeemed | | | (15,650,946 | ) | | | (20,167,663 | ) |
| | |
| Net increase (decrease) in net assets resulting from share transactions | | | 1,406,147 | | | | (1,508,058 | ) |
| | |
| TOTAL INCREASE | | | 5,283,193 | | | | 10,764,483 | |
| |
| | | | | | | | |
| Net Assets: | | | | | | |
| | |
Beginning of year | | | 92,516,543 | | | | 81,752,060 | |
| | |
End of year | | $ | 97,799,736 | | | $ | 92,516,543 | |
| | |
| The accompanying notes are an integral part of these financial statements. | | 15 |
GOLDMAN SACHS VARIABLE INSURANCE TRUST INTERNATIONAL EQUITY INSIGHTS FUND
Financial Highlights
Selected Data for a Share Outstanding Throughout Each Year
| | | | | | | | | | | | | | | | | | | | |
| | | Goldman Sachs International Equity Insights Fund | |
| | | Institutional Shares | |
| | | Year Ended December 31, | |
| | | 2020 | | | 2019 | | | 2018 | | | 2017 | | | 2016 | |
| | | | | | | | | | | | | | | | | | | | |
| Per Share Data | | | | | | | | | | | | | | | |
| | | | | |
Net asset value, beginning of year | | $ | 8.19 | | | $ | 7.08 | | | $ | 10.88 | | | $ | 8.75 | | | $ | 9.19 | |
| | | | | |
Net investment income(a) | | | 0.12 | | | | 0.17 | | | | 0.19 | | | | 0.17 | | | | 0.17 | (b) |
| | | | | |
Net realized and unrealized gain (loss) | | | 0.43 | | | | 1.14 | | | | (1.94 | ) | | | 2.16 | | | | (0.42 | ) |
| | | | | |
Total from investment operations | | | 0.55 | | | | 1.31 | | | | (1.75 | ) | | | 2.33 | | | | (0.25 | ) |
| | | | | |
Distributions to shareholders from net investment income | | | (0.12 | ) | | | (0.20 | ) | | | (0.21 | ) | | | (0.20 | ) | | | (0.19 | ) |
| | | | | |
Distributions to shareholders from net realized gains | | | — | | | | — | (c) | | | (1.84 | ) | | | — | | | | — | |
| | | | | |
Total distributions | | | (0.12 | ) | | | (0.20 | ) | | | (2.05 | ) | | | (0.20 | ) | | | (0.19 | ) |
| | | | | |
Net asset value, end of year | | $ | 8.62 | | | $ | 8.19 | | | $ | 7.08 | | | $ | 10.88 | | | $ | 8.75 | |
| | | | | |
Total return(d) | | | 6.79 | % | | | 18.45 | % | | | (16.28 | )% | | | 26.60 | % | | | (2.72 | )% |
| | | | | |
Net assets, end of year (in 000s) | | $ | 50,114 | | | $ | 43,632 | | | $ | 37,829 | | | $ | 41,512 | | | $ | 37,061 | |
| | | | | |
Ratio of net expenses to average net assets | | | 0.87 | % | | | 0.90 | % | | | 0.87 | % | | | 0.87 | % | | | 0.89 | % |
| | | | | |
Ratio of total expenses to average net assets | | | 1.37 | % | | | 1.31 | % | | | 1.23 | % | | | 1.02 | % | | | 1.06 | % |
| | | | | |
Ratio of net investment income to average net assets | | | 1.59 | % | | | 2.14 | % | | | 1.79 | % | | | 1.69 | % | | | 1.94 | %(b) |
| | | | | |
Portfolio turnover rate(e) | | | 175 | % | | | 146 | % | | | 156 | % | | | 23 | % | | | 39 | % |
| (a) | Calculated based on the average shares outstanding methodology. |
| (b) | Reflects income recognized from corporate actions which amounted to $0.03 per share and 0.36% of average net assets. |
| (c) | Amount is less than $0.005 per share. |
| (d) | Assumes investment at the net asset value at the beginning of the year, reinvestment of all distributions, a complete redemption of the investment at the net asset value at the end of the year and no sales or redemption charges (if any). Total returns would be reduced if a sales or redemption charge was taken into account. Returns do not reflect the impact of taxes to shareholders relating to Fund distributions or the redemption of Fund shares. |
| (e) | The Fund’s portfolio turnover rate is calculated in accordance with regulatory requirements, without regard to transactions involving short term investments and certain derivatives. If such transactions were included, the Fund’s portfolio turnover rate may be higher. |
| | |
| 16 | | The accompanying notes are an integral part of these financial statements. |
GOLDMAN SACHS VARIABLE INSURANCE TRUST INTERNATIONAL EQUITY INSIGHTS FUND
Financial Highlights (continued)
Selected Data for a Share Outstanding Throughout Each Year
| | | | | | | | | | | | | | | | | | | | |
| | | Goldman Sachs International Equity Insights Fund | |
| | | Service Shares | |
| | | Year Ended December 31, | |
| | | 2020 | | | 2019 | | | 2018 | | | 2017 | | | 2016 | |
| | | | | | | | | | | | | | | | | | | | |
| Per Share Data | | | | | | | | | | | | | | | |
| | | | | |
Net asset value, beginning of year | | $ | 8.23 | | | $ | 7.11 | | | $ | 10.91 | | | $ | 8.78 | | | $ | 9.21 | |
| | | | | |
Net investment income(a) | | | 0.10 | | | | 0.15 | | | | 0.14 | | | | 0.14 | | | | 0.15 | (b) |
| | | | | |
Net realized and unrealized gain (loss) | | | 0.44 | | | | 1.15 | | | | (1.93 | ) | | | 2.16 | | | | (0.42 | ) |
| | | | | |
Total from investment operations | | | 0.54 | | | | 1.30 | | | | (1.79 | ) | | | 2.30 | | | | (0.27 | ) |
| | | | | |
Distributions to shareholders from net investment income | | | (0.11 | ) | | | (0.18 | ) | | | (0.17 | ) | | | (0.17 | ) | | | (0.16 | ) |
| | | | | |
Distributions to shareholders from net realized gains | | | — | | | | — | (c) | | | (1.84 | ) | | | — | | | | — | |
| | | | | |
Total distributions | | | (0.11 | ) | | | (0.18 | ) | | | (2.01 | ) | | | (0.17 | ) | | | (0.16 | ) |
| | | | | |
Net asset value, end of year | | $ | 8.66 | | | $ | 8.23 | | | $ | 7.11 | | | $ | 10.91 | | | $ | 8.78 | |
| | | | | |
Total return(d) | | | 6.53 | % | | | 18.23 | % | | | (16.55 | )% | | | 26.21 | % | | | (2.86 | )% |
| | | | | |
Net assets, end of year (in 000s) | | $ | 47,685 | | | $ | 48,884 | | | $ | 43,923 | | | $ | 123,778 | | | $ | 105,362 | |
| | | | | |
Ratio of net expenses to average net assets | | | 1.12 | % | | | 1.15 | % | | | 1.12 | % | | | 1.12 | % | | | 1.14 | % |
| | | | | |
Ratio of total expenses to average net assets | | | 1.61 | % | | | 1.55 | % | | | 1.43 | % | | | 1.27 | % | | | 1.31 | % |
| | | | | |
Ratio of net investment income to average net assets | | | 1.30 | % | | | 1.89 | % | | | 1.30 | % | | | 1.44 | % | | | 1.68 | %(b) |
| | | | | |
Portfolio turnover rate(e) | | | 175 | % | | | 146 | % | | | 156 | % | | | 23 | % | | | 39 | % |
| (a) | Calculated based on the average shares outstanding methodology. |
| (b) | Reflects income recognized from corporate actions which amounted to $0.03 per share and 0.36% of average net assets. |
| (c) | Amount is less than $0.005 per share. |
| (d) | Assumes investment at the net asset value at the beginning of the year, reinvestment of all distributions, a complete redemption of the investment at the net asset value at the end of the year and no sales or redemption charges (if any). Total returns would be reduced if a sales or redemption charge was taken into account. Returns do not reflect the impact of taxes to shareholders relating to Fund distributions or the redemption of Fund shares. |
| (e) | The Fund’s portfolio turnover rate is calculated in accordance with regulatory requirements, without regard to transactions involving short term investments and certain derivatives. If such transactions were included, the Fund’s portfolio turnover rate may be higher. |
| | |
| The accompanying notes are an integral part of these financial statements. | | 17 |
GOLDMAN SACHS VARIABLE INSURANCE TRUST INTERNATIONAL EQUITY INSIGHTS FUND
Notes to Financial Statements
December 31, 2020
1. ORGANIZATION
Goldman Sachs Variable Insurance Trust (the “Trust” or “VIT”) is a Delaware statutory trust registered under the Investment Company Act of 1940, as amended (the “Act”), as an open-end management investment company. The Trust includes the Goldman Sachs International Equity Insights Fund (the “Fund”). The Fund is a diversified portfolio under the Act offering two classes of shares — Institutional and Service Shares. Shares of the Trust are offered to separate accounts of participating life insurance companies for the purpose of funding variable annuity contracts and variable life insurance policies.
Goldman Sachs Asset Management, L.P. (“GSAM”), an affiliate of Goldman Sachs & Co. LLC (“Goldman Sachs”), serves as investment adviser to the Fund pursuant to a management agreement (the “Agreement”) with the Trust.
2. SIGNIFICANT ACCOUNTING POLICIES
The financial statements have been prepared in accordance with accounting principles generally accepted in the United States of America (“GAAP”) and require management to make estimates and assumptions that may affect the reported amounts and disclosures. Actual results may differ from those estimates and assumptions. The Fund is an investment company under GAAP and follows the accounting and reporting guidance applicable to investment companies.
A. Investment Valuation — The Fund’s valuation policy is to value investments at fair value.
B. Investment Income and Investments — Investment income includes interest income, dividend income, and securities lending income, if any. Interest income is accrued daily and adjusted for amortization of premiums and accretion of discounts. Dividend income is recognized on ex-dividend date or, for certain foreign securities, as soon as such information is obtained subsequent to the ex-dividend date. Non-cash dividends, if any, are recorded at the fair market value of the securities received. Investment transactions are reflected on trade date. Realized gains and losses are calculated using identified cost. Investment transactions are recorded on the following business day for daily net asset value (“NAV”) calculations. Investment income is recorded net of any foreign withholding taxes, less any amounts reclaimable. The Fund may file withholding tax reclaims in certain jurisdictions to recover a portion of amounts previously withheld. Any foreign capital gains tax is accrued daily based upon net unrealized gains, and is payable upon sale of such investments.
For derivative contracts, realized gains and losses are recorded upon settlement of the contract.
C. Class Allocations and Expenses — Investment income, realized and unrealized gain (loss), if any, and non-class specific expenses of the Fund are allocated daily based upon the proportion of net assets of each class. Non-class specific expenses directly incurred by the Fund are charged to the Fund, while such expenses incurred by the Trust are allocated across the Fund on a straight-line and/or pro-rata basis depending upon the nature of the expenses. Class specific expenses, where applicable, are borne by the respective share classes and include Distribution and Service and Transfer Agency fees.
D. Federal Taxes and Distributions to Shareholders — It is the Fund’s policy to comply with the requirements of the Internal Revenue Code of 1986, as amended (the “Code”), applicable to regulated investment companies and to distribute each year substantially all of its investment company taxable income and capital gains to its shareholders. Accordingly, the Fund is not required to make any provisions for the payment of federal income tax. Distributions to shareholders are recorded on the ex-dividend date. Income and capital gains distributions, if any, are declared and paid at least annually.
Net capital losses, if any, are carried forward to future fiscal years and may be used to the extent allowed by the Code to offset any future capital gains. Losses that are carried forward will retain their character as either short-term or long-term capital losses. Utilization of capital loss carryforwards will reduce the requirement of future capital gains distributions.
The characterization of distributions to shareholders for financial reporting purposes is determined in accordance with federal income tax rules, which may differ from GAAP. The source of the Fund’s distributions may be shown in the accompanying financial statements as either from distributable earnings or capital. Certain components of the Fund’s net assets on the Statement of Assets and Liabilities reflect permanent GAAP/tax differences based on the appropriate tax character.
E. Foreign Currency Translation — The accounting records and reporting currency of the Fund are maintained in United States (“U.S.”) dollars. Assets and liabilities denominated in foreign currencies are translated into U.S. dollars using the current exchange
18
GOLDMAN SACHS VARIABLE INSURANCE TRUST INTERNATIONAL EQUITY INSIGHTS FUND
2. SIGNIFICANT ACCOUNTING POLICIES (continued)
rates at the close of each business day. The effect of changes in foreign currency exchange rates on investments is included within net realized and unrealized gain (loss) on investments. Changes in the value of other assets and liabilities as a result of fluctuations in foreign exchange rates are included in the Statement of Operations within net change in unrealized gain (loss) on foreign currency translation. Transactions denominated in foreign currencies are translated into U.S. dollars on the date the transaction occurred, the effects of which are included within net realized gain (loss) on foreign currency transactions.
3. INVESTMENTS AND FAIR VALUE MEASUREMENTS
U.S. GAAP defines the fair value of a financial instrument as the amount that would be received to sell an asset or paid to transfer a liability in an orderly transaction between market participants at the measurement date (i.e., the exit price); the Fund’s policy is to use the market approach. GAAP establishes a fair value hierarchy that prioritizes the inputs to valuation techniques used to measure fair value. The hierarchy gives the highest priority to unadjusted quoted prices in active markets for identical assets or liabilities (Level 1 measurements) and the lowest priority to unobservable inputs (Level 3 measurements). The level in the fair value hierarchy within which the fair value measurement in its entirety falls shall be determined based on the lowest level input that is significant to the fair value measurement in its entirety. The levels used for classifying investments are not necessarily an indication of the risk associated with investing in these investments. The three levels of the fair value hierarchy are described below:
Level 1 — Unadjusted quoted prices in active markets that are accessible at the measurement date for identical, unrestricted assets or liabilities;
Level 2 — Quoted prices in markets that are not active or financial instruments for which significant inputs are observable (including, but not limited to, quoted prices for similar investments, interest rates, foreign exchange rates, volatility and credit spreads), either directly or indirectly;
Level 3 — Prices or valuations that require significant unobservable inputs (including GSAM’s assumptions in determining fair value measurement).
The Board of Trustees (“Trustees”) has approved Valuation Procedures that govern the valuation of the portfolio investments held by the Fund, including investments for which market quotations are not readily available. The Trustees have delegated to GSAM day-to-day responsibility for implementing and maintaining internal controls and procedures related to the valuation of the Fund’s investments. To assess the continuing appropriateness of pricing sources and methodologies, GSAM regularly performs price verification procedures and issues challenges as necessary to third party pricing vendors or brokers, and any differences are reviewed in accordance with the Valuation Procedures.
A. Level 1 and Level 2 Fair Value Investments — The valuation techniques and significant inputs used in determining the fair values for investments classified as Level 1 and Level 2 are as follows:
Equity Securities — Equity securities traded on a U.S. securities exchange or the NASDAQ system, or those located on certain foreign exchanges, including but not limited to the Americas, are valued daily at their last sale price or official closing price on the principal exchange or system on which they are traded. If there is no sale or official closing price or such price is believed by GSAM to not represent fair value, equity securities will be valued at the valid closing bid price for long positions and at the valid closing ask price for short positions (i.e. where there is sufficient volume, during normal exchange trading hours). If no valid bid/ask price is available, the equity security will be valued pursuant to the Valuation Procedures approved by the Trustees and consistent with applicable regulatory guidance. To the extent these investments are actively traded, they are classified as Level 1 of the fair value hierarchy, otherwise they are generally classified as Level 2. Certain equity securities containing unique attributes may be classified as Level 2.
Unlisted equity securities for which market quotations are available are valued at the last sale price on the valuation date, or if no sale occurs, at the last bid price for long positions or the last ask price for short positions, and are generally classified as Level 2. Securities traded on certain foreign securities exchanges are valued daily at fair value determined by an independent fair value service (if available) under Fair Valuation Procedures approved by the Trustees and consistent with applicable regulatory guidance.
19
GOLDMAN SACHS VARIABLE INSURANCE TRUST INTERNATIONAL EQUITY INSIGHTS FUND
Notes to Financial Statements (continued)
December 31, 2020
3. INVESTMENTS AND FAIR VALUE MEASUREMENTS (continued)
The independent fair value service takes into account multiple factors including, but not limited to, movements in the securities markets, certain depositary receipts, futures contracts and foreign currency exchange rates that have occurred subsequent to the close of the foreign securities exchange. These investments are generally classified as Level 2 of the fair value hierarchy.
Money Market Funds — Investments in the Goldman Sachs Financial Square Government Fund (“Underlying Fund”) are valued at the NAV per share of the Institutional Share class on the day of valuation. These investments are generally classified as Level 1 of the fair value hierarchy. For information regarding the Underlying Fund’s accounting policies and investment holdings, please see the Underlying Fund’s shareholder report.
Derivative Contracts — A derivative is an instrument whose value is derived from underlying assets, indices, reference rates or a combination of these factors. The Fund enters into derivative transactions to hedge against changes in interest rates, securities prices, and/or currency exchange rates, to increase total return, or to gain access to certain markets or attain exposure to other underliers. For financial reporting purposes, cash collateral that has been pledged to cover obligations of the Fund and cash collateral received, if any, is reported separately on the Statement of Assets and Liabilities as receivables/payables for collateral on certain derivatives contracts. Non-cash collateral pledged by the Fund, if any, is noted in the Schedule of Investments.
Exchange-traded derivatives, including futures and options contracts, are generally valued at the last sale or settlement price on the exchange where they are principally traded. Exchange-traded options without settlement prices are generally valued at the midpoint of the bid and ask prices on the exchange where they are principally traded (or, in the absence of two-way trading, at the last bid price for long positions and the last ask price for short positions). Exchange-traded derivatives typically fall within Level 1 of the fair value hierarchy. Over-the-counter (“OTC”) and centrally cleared derivatives are valued using market transactions and other market evidence, including market-based inputs to models, calibration to market-clearing transactions, broker or dealer quotations, or other alternative pricing sources. Where models are used, the selection of a particular model to value OTC and centrally cleared derivatives depends upon the contractual terms of, and specific risks inherent in, the instrument, as well as the availability of pricing information in the market. Valuation models require a variety of inputs, including contractual terms, market prices, yield curves, credit curves, measures of volatility, voluntary and involuntary prepayment rates, loss severity rates and correlations of such inputs. For OTC and centrally cleared derivatives that trade in liquid markets, model inputs can generally be verified and model selection does not involve significant management judgment. OTC and centrally cleared derivatives are classified within Level 2 of the fair value hierarchy when significant inputs are corroborated by market evidence.
i. Futures Contracts — Futures contracts are contracts to buy or sell a standardized quantity of a specified commodity or security. Upon entering into a futures contract, the Fund deposits cash or securities in an account on behalf of the broker in an amount sufficient to meet the initial margin requirement. Subsequent payments are made or received by the Fund equal to the daily change in the contract value and are recorded as variation margin receivable or payable with a corresponding offset to unrealized gains or losses.
B. Level 3 Fair Value Investments — To the extent that significant inputs to valuation models and other alternative pricing sources are unobservable, or if quotations are not readily available, or if GSAM believes that such quotations do not accurately reflect fair value, the fair value of the Fund’s investments may be determined under Valuation Procedures approved by the Trustees. GSAM, consistent with its procedures and applicable regulatory guidance, may make an adjustment to the most recent valuation prices of either domestic or foreign securities in light of significant events to reflect what it believes to be the fair value of the securities at the time of determining the Fund’s NAV. To the extent investments are valued using single source broker quotations obtained directly from the broker or passed through from third party pricing vendors, such investments are classified as Level 3 investments.
20
GOLDMAN SACHS VARIABLE INSURANCE TRUST INTERNATIONAL EQUITY INSIGHTS FUND
3. INVESTMENTS AND FAIR VALUE MEASUREMENTS (continued)
C. Fair Value Hierarchy — The following is a summary of the Fund’s investments and derivatives classified in the fair value hierarchy as of December 31, 2020:
| | | | | | | | | | | | |
| Investment Type | | Level 1 | | | Level 2 | | | Level 3 | |
| | | |
| Assets | | | | | | | | | | | | |
| Common Stock and/or Other Equity Investments(a) | | | | | | | | | | | | |
Africa | | $ | — | | | $ | 844,973 | | | $ | — | |
Asia | | | — | | | | 31,998,863 | | | | — | |
Australia and Oceania | | | 1,181,029 | | | | 7,333,638 | | | | — | |
Europe | | | 3,524,949 | | | | 50,638,128 | | | | — | |
| | | |
| Total | | $ | 4,705,978 | | | $ | 90,815,602 | | | $ | — | |
| | | |
| Derivative Type | | | | | | | | | |
| | | |
| Assets(b) | | | | | | | | | | | | |
| Futures Contracts | | $ | 27,974 | | | $ | — | | | $ | — | |
| | | |
| Liabilities(a) | | | | | | | | | | | | |
| Futures Contracts | | $ | (2,619 | ) | | $ | — | | | $ | — | |
| (a) | Amounts are disclosed by continent to highlight the impact of time zone differences between local market close and the calculation of NAV. Security valuations are based on the principal exchange or system on which they are traded, which may differ from country of domicile. The Fund utilizes fair value model prices provided by an independent fair value service for certain international equity securities, resulting in a Level 2 classification. |
| (b) | Amount shown represents unrealized gain (loss) at fiscal year end. |
For further information regarding security characteristics, see the Schedule of Investments.
4. INVESTMENTS IN DERIVATIVES
The following table sets forth, by certain risk types, the gross value of derivative contracts (not considered to be hedging instruments for accounting disclosure purposes) as of December 31, 2020. These instruments were used as part of the Fund’s investment strategies and to obtain and/or manage exposure related to the risks below. The values in the table below exclude the effects of cash collateral received or posted pursuant to these derivative contracts, and therefore are not representative of the Fund’s net exposure.
| | | | | | | | | | | | | | |
| Risk | | | | Statement of Assets and Liabilities | | Assets(a) | | | Statement of Assets and Liabilities | | Liabilities(a) | |
| Equity | | | | Variation margin on futures contracts | | $ | 27,974 | | | Variation margin on futures contracts | | $ | (2,619 | ) |
| (a) | Includes unrealized gain (loss) on futures contracts described in the Additional Investment Information section of the Schedule of Investments. Only the variation margin as of December 31, 2020 is reported within the Statement of Assets and Liabilities. |
The following table sets forth, by certain risk types, the Fund’s gains (losses) related to these derivatives and their indicative volumes for the fiscal year ended December 31, 2020. These gains (losses) should be considered in the context that these derivative contracts may have been executed to create investment opportunities and/or economically hedge certain investments, and accordingly, certain gains (losses) on such derivative contracts may offset certain (losses) gains attributable to investments. These gains (losses) are included in “Net realized gain (loss)” or “Net change in unrealized gain (loss)” on the Statement of Operations:
| | | | | | | | | | | | | | |
| Risk | | Statement of Operations | | Net
Realized
Gain (Loss) | | | Net Change in
Unrealized
Gain (Loss) | | | Average
Number of
Contracts(a) | |
| Equity | | Net realized gain (loss) from futures contracts/Net change in unrealized gain (loss) on futures contracts | | $ | (63,592 | ) | | $ | 34,205 | | | | 18 | |
| (a) | Average number of contracts is based on the average of month end balances for the fiscal year ended December 31, 2020. |
21
GOLDMAN SACHS VARIABLE INSURANCE TRUST INTERNATIONAL EQUITY INSIGHTS FUND
Notes to Financial Statements (continued)
December 31, 2020
5. AGREEMENTS AND AFFILIATED TRANSACTIONS
A. Management Agreement — Under the Agreement, GSAM manages the Fund, subject to the general supervision of the Trustees.
As compensation for the services rendered pursuant to the Agreement, the assumption of the expenses related thereto and administration of the Fund’s business affairs, including providing facilities, GSAM is entitled to a management fee, accrued daily and paid monthly, equal to an annual percentage rate of the Fund’s average daily net assets.
For the fiscal year ended December 31, 2020, contractual and effective net management fees with GSAM were at the following rates:
| | | | | | | | | | | | | | | | | | | | | | | | |
| Contractual Management Rate | | | | | | Effective Net
Management Rate^ | |
First
$1 billion | | Next
$1 billion | | | Next
$3 billion | | | Next
$3 billion | | | Over
$8 billion | | | Effective
Rate | |
| 0.81% | | | 0.73 | % | | | 0.69 | % | | | 0.68 | % | | | 0.67 | % | | | 0.81 | % | | | 0.81 | % |
| ^ | Effective Net Management Rate includes the impact of management fee waivers of affiliated Underlying Funds, if any. |
The Fund invests in Institutional Shares of the Goldman Sachs Financial Square Government Fund, which is an affiliated Underlying Fund. GSAM has agreed to waive a portion of its management fee payable by the Fund in an amount equal to the management fee it earns as an investment adviser to the affiliated Underlying Fund in which the Fund invests, except those management fees it earns from the Fund’s investments of cash collateral received in connection with securities lending transactions in the Goldman Sachs Financial Square Government Fund. For the fiscal year ended December 31, 2020, GSAM waived $110 of the Fund’s management fee.
B. Distribution and Service (12b-1) Plan — The Trust, on behalf of Service Shares of the Fund, has adopted a Distribution and Service Plan subject to Rule 12b-1 under the Act. Under the Distribution and Service Plan, Goldman Sachs, which serves as distributor, is entitled to a fee accrued daily and paid monthly, for distribution services and personal and account maintenance services, which may then be paid by Goldman Sachs to authorized dealers, equal to, on an annual basis, 0.25% of the Fund’s average daily net assets attributable to Service Shares.
C. Transfer Agency Agreement — Goldman Sachs also serves as the transfer agent of the Fund for a fee pursuant to the Transfer Agency Agreement. The fees charged for such transfer agency services are accrued daily and paid monthly at an annual rate of 0.02% of the average daily net assets of Institutional and Service Shares.
D. Other Expense Agreements and Affiliated Transactions — GSAM has agreed to reduce or limit certain “Other Expenses” of the Fund (excluding acquired fund fees and expenses, transfer agency fees and expenses, service fees and shareholder administration fees (as applicable), taxes, interest, brokerage fees, expenses of shareholder meetings, litigation and indemnification, and extraordinary expenses) to the extent such expenses exceed, on an annual basis, a percentage rate of the average daily net assets of the Fund. Such Other Expense reimbursements, if any, are accrued daily and paid monthly. In addition, the Fund is not obligated to reimburse GSAM for prior fiscal year expense reimbursements, if any. The Other Expense limitation as an annual percentage rate of average daily net assets for the Fund is 0.044%. The Other Expense limitation will remain in place through at least April 29, 2021, and prior to such date GSAM may not terminate the arrangement without the approval of the Trustees. In addition, the Fund has entered into certain offset arrangements with the custodian and the transfer agent, which may result in a reduction of the Fund’s expenses and are received irrespective of the application of the “Other Expense” limitation described above.
For the fiscal year ended December 31, 2020, these expense reductions, including any fee waivers and Other Expense reimbursements, were as follows:
| | | | | | | | | | | | |
Management
Fee Waiver | | Custody Fee
Credits | | | Other Expense
Reimbursement | | | Total Expense
Reductions | |
| $110 | | $ | 1,266 | | | $ | 405,335 | | | $ | 406,711 | |
22
GOLDMAN SACHS VARIABLE INSURANCE TRUST INTERNATIONAL EQUITY INSIGHTS FUND
5. AGREEMENTS AND AFFILIATED TRANSACTIONS (continued)
E. Line of Credit Facility — As of December 31, 2020, the Fund participated in a $700,000,000 committed, unsecured revolving line of credit facility (the “facility”) together with other funds of the Trust and certain registered investment companies having management agreements with GSAM or its affiliates. This facility is to be used for temporary emergency purposes, or to allow for an orderly liquidation of securities to meet redemption requests. The interest rate on borrowings is based on the federal funds rate. The facility also requires a fee to be paid by the Fund based on the amount of the commitment that has not been utilized. For the fiscal year ended December 31, 2020, the Fund did not have any borrowings under the facility. Prior to April 28, 2020, the facility was $580,000,000.
F. Other Transactions with Affiliates — The following table provides information about the Fund’s investments in the Goldman Sachs Financial Square Government Fund as of and for the fiscal year ended December 31, 2020:
| | | | | | | | | | | | | | | | | | | | |
Beginning
Value as of
December 31, 2019 | | Purchases
at Cost | | | Proceeds
from Sales | | | Ending
Value as of
December 31, 2020 | | | Shares as of
December 31, 2020 | | | Dividend Income
from Affiliated
Investment
Company | |
| $— | | $ | 6,064,427 | | | $ | (6,064,427 | ) | | $ | — | | | | — | | | $ | 174 | |
6. PORTFOLIO SECURITIES TRANSACTIONS
The cost of purchases and proceeds from sales and maturities of long-term securities for the fiscal year ended December 31, 2020, were $142,499,071 and $141,446,778, respectively.
7. SECURITIES LENDING
Pursuant to exemptive relief granted by the Securities and Exchange Commission (“SEC”) and the terms and conditions contained therein, the Fund may lend its securities through a securities lending agent, Goldman Sachs Agency Lending (“GSAL”), a wholly-owned subsidiary of Goldman Sachs, to certain qualified borrowers including Goldman Sachs and affiliates. In accordance with the Fund’s securities lending procedures, the Fund receives cash collateral at least equal to the market value of the securities on loan. The market value of the loaned securities is determined at the close of business of the Fund, at their last sale price or official closing price on the principal exchange or system on which they are traded, and any additional required collateral is delivered to the Fund on the next business day. As with other extensions of credit, the Fund may experience delay in the recovery of its securities or incur a loss should the borrower of the securities breach its agreement with the Fund or become insolvent at a time when the collateral is insufficient to cover the cost of repurchasing securities on loan. Dividend income received from securities on loan may not be subject to withholding taxes and therefore withholding taxes paid may differ from the amounts listed in the Statement of Operations. Loans of securities are terminable at any time and as such 1) the remaining contractual maturities of the outstanding securities lending transactions are considered to be overnight and continuous and 2) the borrower, after notice, is required to return borrowed securities within the standard time period for settlement of securities transactions.
The Fund invests the cash collateral received in connection with securities lending transactions in the Goldman Sachs Financial Square Government Fund (“Government Money Market Fund”), an affiliated series of the Goldman Sachs Trust. The Government Money Market Fund is registered under the Act as an open end investment company, is subject to Rule 2a-7 under the Act, and is managed by GSAM, for which GSAM may receive a management fee of up to 0.16% on an annualized basis of the average daily net assets of the Government Money Market Fund.
In the event of a default by a borrower with respect to any loan, GSAL will exercise any and all remedies provided under the applicable borrower agreement to make the Fund whole. These remedies include purchasing replacement securities by applying the collateral held from the defaulting broker against the purchase cost of the replacement securities. If GSAL is unable to purchase replacement securities, GSAL will indemnify the Fund by paying the Fund an amount equal to the market value of the securities
23
GOLDMAN SACHS VARIABLE INSURANCE TRUST INTERNATIONAL EQUITY INSIGHTS FUND
Notes to Financial Statements (continued)
December 31, 2020
7. SECURITIES LENDING (continued)
loaned minus the value of cash collateral received from the borrower for the loan, subject to an exclusion for any shortfalls resulting from a loss of value in such cash collateral due to reinvestment risk. The Fund’s master netting agreements with certain borrowers provide the right, in the event of a default (including bankruptcy or insolvency), for the non-defaulting party to liquidate the collateral and calculate net exposure to the defaulting party or request additional collateral. However, in the event of a default by a borrower, a resolution authority could determine that such rights are not enforceable due to the restrictions or prohibitions against the right of set-off that may be imposed in accordance with a particular jurisdiction’s bankruptcy or insolvency laws. The Fund’s loaned securities were all subject to enforceable Securities Lending Agreements and the value of the collateral was at least equal to the value of the cash received. The amounts of the Fund’s overnight and continuous agreements, which represent the gross amounts of recognized liabilities for securities lending transactions outstanding as of December 31, 2020, are disclosed as “Payable upon return of securities loaned” on the Statement of Assets and Liabilities, where applicable. The Fund did not have securities on loan as of December 31, 2020.
Both the Fund and GSAL received compensation relating to the lending of the Fund’s securities. The amounts earned, if any, by the Fund for the fiscal year ended December 31, 2020, are reported under Investment Income on the Statement of Operations.
The table below details securities lending activity with affiliates of Goldman Sachs:
| | | | |
| For the fiscal year ended December 31, 2020 | | Amount Payable to Goldman Sachs
Upon Return of
Securities Loaned as of
December 31, 2020 |
Earnings of GSAL Relating to Securities Loaned | | Amount Received by the Fund from Lending to Goldman Sachs |
| | |
| $473 | | $5 | | $— |
The following table provides information about the Fund’s investment in the Government Money Market Fund for the fiscal year ended December 31, 2020:
| | | | | | | | | | | | | | |
Beginning
Value as of
December 31, 2019 | | | Purchases
at Cost | | | Proceeds
from Sales | | | Ending Value as of
December 31, 2020 | |
| | | |
| $ | — | | | $ | 5,730,795 | | | $ | (5,730,795 | ) | | $ | — | |
8. TAX INFORMATION
The tax character of distributions paid during the fiscal years ended December 31, 2019 and December 31, 2020 was as follows:
| | | | | | | | |
| | | 2019 | | | 2020 | |
| Distributions paid from: | | | | | | | | |
Ordinary income | | $ | 2,054,816 | | | $ | 1,296,906 | |
Net long-term capital gains | | | 2,883 | | | | — | |
| Total taxable distributions | | $ | 2,057,699 | | | $ | 1,296,906 | |
24
GOLDMAN SACHS VARIABLE INSURANCE TRUST INTERNATIONAL EQUITY INSIGHTS FUND
8. TAX INFORMATION (continued)
As of December 31, 2020, the components of accumulated earnings (losses) on a tax-basis were as follows:
| | | | |
| Undistributed ordinary income — net | | $ | 526,566 | |
| Capital loss carryforwards: | | | | |
Perpetual long-term | | $ | (2,522,288 | ) |
Perpetual short-term | | | (9,204,202 | ) |
| Total capital loss carryforwards | | | (11,726,490 | ) |
| Unrealized gains — net | | | 13,568,174 | |
| Total accumulated gains — net | | $ | 2,368,250 | |
As of December 31, 2020, the Fund’s aggregate security unrealized gains and losses based on cost for U.S. federal income tax purposes were as follows:
| | | | |
| Tax cost | | $ | 82,036,029 | |
| Gross unrealized gain | | | 15,086,408 | |
| Gross unrealized loss | | | (1,518,234 | ) |
| Net unrealized gain | | $ | 13,568,174 | |
The difference between GAAP-basis and tax-basis unrealized gains (losses) is attributable primarily to wash sales, net mark to market gains/(losses) on regulated futures contracts and differences in the tax treatment of passive foreign investment company investments.
GSAM has reviewed the Fund’s tax positions for all open tax years (the current and prior three years, as applicable) and has concluded that no provision for income tax is required in the Fund’s financial statements. Such open tax years remain subject to examination and adjustment by tax authorities.
9. OTHER RISKS
The Fund’s risks include, but are not limited to, the following:
Derivatives Risk — The Fund’s use of derivatives may result in loss. Derivative instruments, which may pose risks in addition to and greater than those associated with investing directly in securities, currencies or other instruments, may be illiquid or less liquid, volatile, difficult to price and leveraged so that small changes in the value of the underlying instruments may produce disproportionate losses to the Fund. Derivatives are also subject to counterparty risk, which is the risk that the other party in the transaction will not fulfill its contractual obligation. The use of derivatives is a highly specialized activity that involves investment techniques and risks different from those associated with investments in more traditional securities and instruments. Losses from derivatives can also result from a lack of correlation between changes in the value of derivative instruments and the portfolio assets (if any) being hedged.
Foreign and Emerging Countries Risk — Investing in foreign markets may involve special risks and considerations not typically associated with investing in the U.S. Foreign securities may be subject to risk of loss because of more or less foreign government regulation, less public information and less economic, political and social stability in the countries in which the Fund invests. The imposition of exchange controls (including repatriation restrictions), confiscation of assets and property, trade restrictions (including tariffs) and other government restrictions by the U.S. or other governments, or from problems in share registration, settlement or custody, may also result in losses. Foreign risk also involves the risk of negative foreign currency rate
25
GOLDMAN SACHS VARIABLE INSURANCE TRUST INTERNATIONAL EQUITY INSIGHTS FUND
Notes to Financial Statements (continued)
December 31, 2020
9. OTHER RISKS (continued)
fluctuations, which may cause the value of securities denominated in such foreign currency (or other instruments through which the Fund has exposure to foreign currencies) to decline in value. Currency exchange rates may fluctuate significantly over short periods of time. To the extent that the Fund also invests in securities of issuers located in emerging markets, these risks may be more pronounced.
Foreign Custody Risk — The Fund invests in foreign securities, and as such the Fund may hold such securities and cash with foreign banks, agents, and securities depositories appointed by the Fund’s custodian (each a “Foreign Custodian”). Some foreign custodians may be recently organized or new to the foreign custody business. In some countries, Foreign Custodians may be subject to little or no regulatory oversight over, or independent evaluation of, their operations. Further, the laws of certain countries may place limitations on the Fund’s ability to recover its assets if a Foreign Custodian enters bankruptcy. Investments in emerging markets may be subject to even greater custody risks than investments in more developed markets. Custody services in emerging market countries are very often undeveloped and may be considerably less well regulated than in more developed countries, and thus may not afford the same level of investor protection as would apply in developed countries.
Investments in Other Investment Companies Risk — As a shareholder of another investment company, the Fund will indirectly bear its proportionate share of any net management fees and other expenses paid by such other investment companies, in addition to the fees and expenses regularly borne by the Fund.
Large Shareholder Transactions Risk — The Fund may experience adverse effects when certain large shareholders, such as other funds, participating insurance companies, accounts and Goldman Sachs affiliates, purchase or redeem large amounts of shares of the Fund. Such large shareholder redemptions, which may occur rapidly or unexpectedly, may cause the Fund to sell portfolio securities at times when it would not otherwise do so, which may negatively impact the Fund’s NAV and liquidity. These transactions may also accelerate the realization of taxable income to shareholders if such sales of investments resulted in gains, and may also increase transaction costs. In addition, a large redemption could result in the Fund’s current expenses being allocated over a smaller asset base, leading to an increase in the Fund’s expense ratio. Similarly, large Fund share purchases may adversely affect the Fund’s performance to the extent that the Fund is delayed in investing new cash or otherwise maintains a larger cash position than it ordinarily would.
Liquidity Risk — The Fund may make investments that are illiquid or that may become less liquid in response to market developments or adverse investor perceptions. Illiquid investments may be more difficult to value. Liquidity risk may also refer to the risk that the Fund will not be able to pay redemption proceeds within the allowable time period or without significant dilution to remaining investors’ interests because of unusual market conditions, an unusually high volume of redemption requests, or other reasons. To meet redemption requests, the Fund may be forced to sell investments at an unfavorable time and/or under unfavorable conditions. If the Fund is forced to sell securities at an unfavorable time and/or under unfavorable conditions, such sales may adversely affect the Fund’s NAV and dilute remaining investors’ interests. These risks may be more pronounced in connection with the Fund’s investments in securities of issuers located in emerging market countries. Redemptions by large shareholders may have a negative impact on the Fund’s liquidity.
Market and Credit Risks — In the normal course of business, the Fund trades financial instruments and enters into financial transactions where risk of potential loss exists due to changes in the market (market risk). The value of the securities in which the Fund invests may go up or down in response to the prospects of individual companies, particular sectors or governments and/or general economic conditions throughout the world due to increasingly interconnected global economies and financial markets. Events such as war, acts of terrorism, social unrest, natural disasters, the spread of infectious illness or other public health threats could also significantly impact the Fund and its investments. Additionally, the Fund may also be exposed to credit risk in the event that an issuer or guarantor fails to perform or that an institution or entity with which the Fund has unsettled or open transactions defaults.
26
GOLDMAN SACHS VARIABLE INSURANCE TRUST INTERNATIONAL EQUITY INSIGHTS FUND
10. INDEMNIFICATIONS
Under the Trust’s organizational documents, its Trustees, officers, employees and agents are indemnified, to the extent permitted by the Act and state law, against certain liabilities that may arise out of performance of their duties to the Fund. Additionally, in the course of business, the Fund enters into contracts that contain a variety of indemnification clauses. The Fund’s maximum exposure under these arrangements is unknown, as this would involve future claims that may be made against the Fund that have not yet occurred. However, GSAM believes the risk of loss under these arrangements to be remote.
11. OTHER MATTERS
On October 22, 2020, Goldman Sachs announced a settlement of matters involving 1Malaysia Development Bhd. (1MDB), a Malaysian sovereign wealth fund, with the United States Department of Justice as well as criminal and civil authorities in the UK, Singapore and Hong Kong. Further information regarding the 1MDB settlement can be found at https://www.goldmansachs.com/media-relations/press-releases/current/goldman-sachs-2020-10-22.html. The 1MDB settlement will not materially adversely affect GSAM’s ability to serve as investment manager.
12. SUBSEQUENT EVENTS
Subsequent events after the Statement of Assets and Liabilities date have been evaluated, and GSAM has concluded that there is no impact requiring adjustment or disclosure in the financial statements.
13. SUMMARY OF SHARE TRANSACTIONS
Share activity is as follows:
| | | | | | | | | | | | | | | | |
| | | For the Fiscal Year Ended
December 31, 2020 | | | For the Fiscal Year Ended
December 31, 2019 | |
| | | Shares | | | Dollars | | | Shares | | | Dollars | |
| Institutional Shares | | | | | | | | | | | | | | | | |
| Shares sold | | | 1,077,909 | | | $ | 8,130,619 | | | | 558,464 | | | $ | 4,460,851 | |
| Reinvestment of distributions | | | 85,749 | | | | 717,721 | | | | 125,411 | | | | 1,025,867 | |
| Shares redeemed | | | (674,822 | ) | | | (4,959,840 | ) | | | (703,402 | ) | | | (5,506,238 | ) |
| | | | 488,836 | | | | 3,888,500 | | | | (19,527 | ) | | | (19,520 | ) |
| Service Shares | | | | | | | | | | | | | | | | |
| Shares sold | | | 1,003,024 | | | | 7,629,568 | | | | 1,537,107 | | | | 12,141,055 | |
| Reinvestment of distributions | | | 68,869 | | | | 579,185 | | | | 125,527 | | | | 1,031,832 | |
| Shares redeemed | | | (1,502,901 | ) | | | (10,691,106 | ) | | | (1,901,273 | ) | | | (14,661,425 | ) |
| | | | (431,008 | ) | | | (2,482,353 | ) | | | (238,639 | ) | | | (1,488,538 | ) |
| | | | |
| NET INCREASE (DECREASE) | | | 57,828 | | | $ | 1,406,147 | | | | (258,166 | ) | | $ | (1,508,058 | ) |
27
Report of Independent Registered Public Accounting Firm
To the Board of Trustees of Goldman Sachs Variable Insurance Trust and Shareholders of Goldman Sachs International Equity Insights Fund
Opinion on the Financial Statements
We have audited the accompanying statement of assets and liabilities, including the schedule of investments, of Goldman Sachs International Equity Insights Fund (one of the funds constituting Goldman Sachs Variable Insurance Trust, referred to hereafter as the “Fund”) as of December 31, 2020, the related statement of operations for the year ended December 31, 2020, the statements of changes in net assets for each of the two years in the period ended December 31, 2020, including the related notes, and the financial highlights for each of the five years in the period ended December 31, 2020 (collectively referred to as the “financial statements”). In our opinion, the financial statements present fairly, in all material respects, the financial position of the Fund as of December 31, 2020, the results of its operations for the year then ended, the changes in its net assets for each of the two years in the period ended December 31, 2020 and the financial highlights for each of the five years in the period ended December 31, 2020 in conformity with accounting principles generally accepted in the United States of America.
Basis for Opinion
These financial statements are the responsibility of the Fund’s management. Our responsibility is to express an opinion on the Fund’s financial statements based on our audits. We are a public accounting firm registered with the Public Company Accounting Oversight Board (United States) (PCAOB) and are required to be independent with respect to the Fund in accordance with the U.S. federal securities laws and the applicable rules and regulations of the Securities and Exchange Commission and the PCAOB.
We conducted our audits of these financial statements in accordance with the standards of the PCAOB. Those standards require that we plan and perform the audit to obtain reasonable assurance about whether the financial statements are free of material misstatement, whether due to error or fraud.
Our audits included performing procedures to assess the risks of material misstatement of the financial statements, whether due to error or fraud, and performing procedures that respond to those risks. Such procedures included examining, on a test basis, evidence regarding the amounts and disclosures in the financial statements. Our audits also included evaluating the accounting principles used and significant estimates made by management, as well as evaluating the overall presentation of the financial statements. Our procedures included confirmation of securities owned as of December 31, 2020 by correspondence with the custodian, transfer agent and brokers. We believe that our audits provide a reasonable basis for our opinion.
/s/PricewaterhouseCoopers LLP
Boston, Massachusetts
February 17, 2021
We have served as the auditor of one or more investment companies in the Goldman Sachs fund complex since 2000.
28
GOLDMAN SACHS VARIABLE INSURANCE TRUST INTERNATIONAL EQUITY INSIGHTS FUND
Voting Results of Special Meeting of Shareholders (Unaudited)
A Special Meeting (the “Meeting”) of the Goldman Sachs Variable Insurance Trust (“VIT”) was held on January 23, 2020 to consider and act upon the proposal below. The Fund has amortized its respective share of the proxy, shareholder meeting and other related costs and GSAM has agreed to reimburse the Fund to the extent such expenses exceed a specified percentage of the Fund’s net assets.
At the Meeting, Dwight L. Bush, Kathryn A. Cassidy, Joaquin Delgado and Gregory G. Weaver were elected to the Trust’s Board of Trustees. In electing trustees, the Trust’s shareholders voted as follows:
| | | | | | | | | | | | | | | | |
| | | | | |
Proposal 1. Election of Trustees | | For | | | Against | | | Withheld | | | Broker Non-Votes | |
| | | | | |
Dwight L. Bush | | | 745,493,677.130 | | | | 0 | | | | 17,848,840.639 | | | | 0 | |
| | | | | |
Kathryn A. Cassidy | | | 746,559,784.810 | | | | 0 | | | | 16,782,732.959 | | | | 0 | |
| | | | | |
Joaquin Delgado | | | 744,593,456.532 | | | | 0 | | | | 18,749,061.237 | | | | 0 | |
| | | | | |
Gregory G. Weaver | | | 746,707,039.321 | | | | 0 | | | | 16,635,478.448 | | | | 0 | |
29
GOLDMAN SACHS VARIABLE INSURANCE TRUST INTERNATIONAL EQUITY INSIGHTS FUND
| | |
| Fund Expenses — Six Month Period Ended December 31, 2020 (Unaudited) | | |
As a shareholder of Institutional or Service Shares of the Fund, you incur ongoing costs, including management fees, distribution and/or service (12b-1) fees (with respect to Service Shares) and other Fund expenses. This example is intended to help you understand your ongoing costs (in dollars) of investing in Institutional Shares and Service Shares of the Fund and to compare these costs with the ongoing costs of investing in other mutual funds.
The example is based on an investment of $1,000 invested at the beginning of the period and held for the entire period from July 1, 2020 through December 31, 2020, which represents a period of 184 days of a 366 day year.
Actual Expenses — The first line under each share class in the table below provides information about actual account values and actual expenses. You may use the information in this line, together with the amount you invested, to estimate the expenses that you paid over the period. Simply divide your account value by $1,000 (for example, an $8,600 account value divided by $1,000=8.6), then multiply the result by the number in the first line under the heading entitled “Expenses Paid” to estimate the expenses you paid on your account during this period.
Hypothetical Example for Comparison Purposes — The second line under each share class in the table below provides information about hypothetical account values and hypothetical expenses based on the Fund’s actual net expense ratio and an assumed rate of return of 5% per year before expenses, which is not the Fund’s actual return. The hypothetical account values and expenses may not be used to estimate the actual ending account balance or expenses you paid for the period. You may use this information to compare the ongoing costs of investing in the Fund and other funds. To do so, compare this 5% hypothetical example with the 5% hypothetical examples that appear in the shareholder reports of the other funds.
Please note that the expenses shown in the table are meant to highlight your ongoing costs only. As a shareholder of the Fund you do not incur any transaction costs, such as sales charges, redemption fees, or exchange fees, but shareholders of other funds may incur such costs. The second line of the table is useful in comparing ongoing costs only and will not help you determine the relative total costs of owning different funds whose shareholders may incur transaction costs.
| | | | | | | | | | | | |
| Share Class | | Beginning
Account Value
07/01/20 | | | Ending
Account Value
12/31/20 | | | Expenses Paid
for the
6 Months
Ended
12/31/20* | |
| Institutional | | | | | | | | | | | | |
| | | | |
| Actual | | $ | 1,000 | | | $ | 1,208.30 | | | $ | 4.83 | |
| Hypothetical 5% return | | | 1,000 | | | | 1,020.76 | + | | | 4.42 | |
| Service | | | | | | | | | | | | |
| | | | |
| Actual | | | 1,000 | | | | 1,206.10 | | | | 6.21 | |
| Hypothetical 5% return | | | 1,000 | | | | 1,019.51 | + | | | 5.69 | |
| | + | Hypothetical expenses are based on the Fund’s actual annualized net expense ratios and an assumed rate of return of 5% per year before expenses. | |
| | * | Expenses are calculated using the Fund’s annualized net expense ratio for each class, which represents the ongoing expenses as a percentage of net assets for the six months ended December 31, 2020. Expenses are calculated by multiplying the annualized net expense ratio by the average account value for the period; then multiplying the result by the number of days in the most recent fiscal half year; and then dividing that result by the number of days in the fiscal year. The annualized net expense ratios for the period were 0.87% and 1.12% for Institutional and Service Shares, respectively. | |
30
GOLDMAN SACHS VARIABLE INSURANCE TRUST INTERNATIONAL EQUITY INSIGHTS FUND
Trustees and Officers (Unaudited)
Independent Trustees
| | | | | | | | | | | | |
| | | | | |
Name,
Address and Age1 | | Position(s) Held
with the Trust | | Term of Office and
Length of
Time Served2 | | Principal Occupation(s) During Past 5 Years | | Number of
Portfolios in
Fund Complex
Overseen by
Trustee3 | | | Other Directorships Held by Trustee4 |
Jessica Palmer Age: 71 | | Chair of the Board of Trustees | | Since 2018 (Trustee since 2007) | | Ms. Palmer is retired. She was formerly Consultant, Citigroup Human Resources Department (2007-2008); Managing Director, Citigroup Corporate and Investment Banking (previously, Salomon Smith Barney/Salomon Brothers) (1984-2006). Ms. Palmer was a Member of the Board of Trustees of Indian Mountain School (private elementary and secondary school) (2004-2009). Chair of the Board of Trustees — Goldman Sachs Variable Insurance Trust and Goldman Sachs Trust. | | | 105 | | | None |
Dwight L. Bush Age: 63 | | Trustee | | Since 2020 | | Ambassador Bush is President and CEO of D.L. Bush & Associates (a financial advisory and private investment firm) (2002-2014 and 2017-present); and was formerly U.S. Ambassador to the Kingdom of Morocco (2014-2017) and a Member of the Board of Directors of Santander Bank, N.A. (2018-2019). Previously, Ambassador Bush served as an Advisory Board Member of Goldman Sachs Trust and Goldman Sachs Variable Insurance Trust (October 2019-January 2020). Trustee — Goldman Sachs Variable Insurance Trust and Goldman Sachs Trust. | | | 105 | | | None |
Kathryn A. Cassidy Age: 66 | | Trustee | | Since 2015 | | Ms. Cassidy is retired. Formerly, she was Advisor to the Chairman (May 2014-December 2014); and Senior Vice President and Treasurer (2008-2014), General Electric Company & General Electric Capital Corporation (technology and financial services companies). Trustee — Goldman Sachs Variable Insurance Trust and Goldman Sachs Trust. | | | 105 | | | None |
Diana M. Daniels Age: 71 | | Trustee | | Since 2007 | | Ms. Daniels is retired. Formerly, she was Vice President, General Counsel and Secretary, The Washington Post Company (1991-2006). Ms. Daniels is a Trustee Emeritus and serves as a Presidential Councillor of Cornell University (2013-Present); former Member of the Legal Advisory Board, New York Stock Exchange (2003-2006) and of the Corporate Advisory Board, Standish Mellon Management Advisors (2006-2007). Trustee — Goldman Sachs Variable Insurance Trust and Goldman Sachs Trust. | | | 105 | | | None |
Joaquin Delgado Age: 60 | | Trustee | | Since 2020 | | Dr. Delgado is retired. He is Director, Hexion Inc. (a specialty chemical manufacturer) (2019-present); and Director, Stepan Company (a specialty chemical manufacturer) (2011-present); and was formerly Executive Vice President, Consumer Business Group of 3M Company (July 2016-July 2019); and Executive Vice President, Health Care Business Group of 3M Company (October 2012-July 2016). Previously, Dr. Delgado served as an Advisory Board Member of Goldman Sachs Trust and Goldman Sachs Variable Insurance Trust (October 2019-January 2020). Trustee — Goldman Sachs Variable Insurance Trust and Goldman Sachs Trust. | | | 105 | | | Stepan Company (a specialty chemical manufacturer) |
| | | | | | | | | | | | |
31
GOLDMAN SACHS VARIABLE INSURANCE TRUST INTERNATIONAL EQUITY INSIGHTS FUND
Trustees and Officers (Unaudited) (continued)
Independent Trustees
| | | | | | | | | | | | |
Name,
Address and Age1 | | Position(s) Held
with the Trust | | Term of Office and
Length of
Time Served2 | | Principal Occupation(s) During Past 5 Years | | Number of
Portfolios in
Fund Complex
Overseen by
Trustee3 | | | Other Directorships Held by Trustee4 |
Roy W. Templin Age: 60 | | Trustee | | Since 2013 | | Mr. Templin is retired. He is Director, Armstrong World Industries, Inc. (a designer and manufacturer of ceiling, wall and suspension system solutions) (2016-Present); and was formerly Chairman of the Board of Directors, Con-Way Incorporated (a transportation, logistics and supply chain management service company) (2014-2015); Executive Vice President and Chief Financial Officer, Whirlpool Corporation (an appliance manufacturer and marketer) (2004-2012). Trustee — Goldman Sachs Variable Insurance Trust and Goldman Sachs Trust. | | | 105 | | | Armstrong World Industries, Inc. (a ceiling, wall and suspension systems solutions manufacturer) |
Gregory G. Weaver Age: 69 | | Trustee | | Since 2015 | | Mr. Weaver is retired. He is Director, Verizon Communications Inc. (2015-Present); and was formerly Chairman and Chief Executive Officer, Deloitte & Touche LLP (a professional services firm) (2001-2005 and 2012-2014); and Member of the Board of Directors, Deloitte & Touche LLP (2006-2012). Trustee — Goldman Sachs Variable Insurance Trust and Goldman Sachs Trust. | | | 105 | | | Verizon Communications Inc. |
32
GOLDMAN SACHS VARIABLE INSURANCE TRUST INTERNATIONAL EQUITY INSIGHTS FUND
Trustees and Officers (Unaudited) (continued)
Interested Trustee*
| | | | | | | | | | | | |
Name,
Address and Age1 | | Position(s) Held
with the Trust | | Term of Office and
Length of
Time Served2 | | Principal Occupation(s) During Past 5 Years | | Number of
Portfolios in
Fund Complex
Overseen by
Trustee3 | | | Other Directorships Held by Trustee4 |
James A. McNamara Age: 58 | | Trustee and President | | Since 2007 | | Advisory Director, Goldman Sachs (January 2018-Present); Managing Director, Goldman Sachs (January 2000-December 2017); Director of Institutional Fund Sales, GSAM (April 1998-December 2000); and Senior Vice President and Manager, Dreyfus Institutional Service Corporation (January 1993-April 1998). President and Trustee — Goldman Sachs Variable Insurance Trust; Goldman Sachs Trust; Goldman Sachs Trust II; Goldman Sachs MLP and Energy Renaissance Fund; Goldman Sachs ETF Trust; Goldman Sachs Credit Income Fund; and Goldman Sachs Real Estate Diversified Income Fund. | | | 158 | | | None |
| | | | | | | | | | | | |
| * | Mr. McNamara is considered to be an “Interested Trustee” because he holds positions with Goldman Sachs and owns securities issued by The Goldman Sachs Group, Inc. Mr. McNamara holds comparable positions with certain other companies of which Goldman Sachs, GSAM or an affiliate thereof is the investment adviser, administrator and/or distributor. |
| 1 | Each Trustee may be contacted by writing to the Trustee, c/o Goldman Sachs, 200 West Street, New York, New York, 10282, Attn: Caroline Kraus. Information is provided as of December 31, 2020. |
| 2 | Subject to such policies as may be adopted by the Board from time-to-time, each Trustee holds office for an indefinite term, until the earliest of: (a) the election of his or her successor; (b) the date the Trustee resigns or is removed by the Board or shareholders, in accordance with the Trust’s Declaration of Trust; or (c) the termination of the Trust. The Board has adopted policies which provide that each Independent Trustee shall retire as of December 31st of the calendar year in which he or she reaches (a) his or her 75th birthday or (b) the 15th anniversary of the date he or she became a Trustee, whichever is earlier, unless a waiver of such requirements shall have been adopted by a majority of the other Trustees. These policies may be changed by the Trustees without shareholder vote. |
| 3 | The Goldman Sachs Fund Complex includes certain other companies listed above for each respective Trustee. As of December 31, 2020, Goldman Sachs Variable Insurance Trust consisted of 13 portfolios; Goldman Sachs Trust consisted of 92 portfolios (90 of which offered shares to the public); Goldman Sachs Trust II consisted of 19 portfolios (17 of which offered shares to the public); Goldman Sachs ETF Trust consisted of 31 portfolios (20 of which offered shares to the public); and Goldman Sachs MLP and Energy Renaissance Fund, Goldman Sachs Credit Income Fund and Goldman Sachs Real Estate Diversified Income Fund each consisted of one portfolio. Goldman Sachs Credit Income Fund did not offer shares to the public. |
| 4 | This column includes only directorships of companies required to report to the Securities and Exchange Commission under the Securities Exchange Act of 1934 (i.e., “public companies”) or other investment companies registered under the Act. |
Additional information about the Trustees is available in the Fund’s Statement of Additional Information, which can be obtained from Goldman Sachs free of charge by calling this toll-free number (in the United States of America): 1-800-526-7384.
33
GOLDMAN SACHS VARIABLE INSURANCE TRUST INTERNATIONAL EQUITY INSIGHTS FUND
Trustees and Officers (Unaudited) (continued)
Officers of the Trust*
| | | | | | |
| | | |
| Name, Address and Age1 | | Position(s) Held with the Trust | | Term of
Office and
Length of
Time Served2 | | Principal Occupation(s) During Past 5 Years |
James A. McNamara
200 West Street New York, NY 10282 Age: 58 | | Trustee and
President | | Since 2007 | | Advisory Director, Goldman Sachs (January 2018-Present); Managing Director, Goldman Sachs (January 2000-December 2017); Director of Institutional Fund Sales, GSAM (April 1998-December 2000); and Senior Vice President and Manager, Dreyfus Institutional Service Corporation (January 1993-April 1998). President and Trustee — Goldman Sachs Variable Insurance Trust; Goldman Sachs Trust; Goldman Sachs Trust II; Goldman Sachs MLP and Energy Renaissance Fund; Goldman Sachs ETF Trust; Goldman Sachs Credit Income Fund; and Goldman Sachs Real Estate Diversified Income Fund. |
Caroline L. Kraus
200 West Street New York, NY 10282 Age: 43 | | Secretary | | Since 2012 | | Managing Director, Goldman Sachs (January 2016-Present); Vice President, Goldman Sachs (August 2006-December 2015); Senior Counsel, Goldman Sachs (January 2020-Present); Associate General Counsel, Goldman Sachs (2012-December 2019); Assistant General Counsel, Goldman Sachs (August 2006-December 2011); and Associate, Weil, Gotshal & Manges, LLP (2002-2006). Secretary — Goldman Sachs Variable Insurance Trust (previously Assistant Secretary (2012)); Goldman Sachs Trust (previously Assistant Secretary (2012)); Goldman Sachs Trust II; Goldman Sachs BDC, Inc.; Goldman Sachs Private Middle Market Credit LLC; Goldman Sachs Private Middle Market Credit II LLC; Goldman Sachs Middle Market Lending Corp.; Goldman Sachs MLP and Energy Renaissance Fund; Goldman Sachs ETF Trust; Goldman Sachs Credit Income Fund; and Goldman Sachs Real Estate Diversified Income Fund. |
Joseph F. DiMaria
30 Hudson Street Jersey City, NJ 07302 Age: 52 | | Treasurer, Principal
Financial Officer
and Principal
Accounting Officer | | Since 2017
(Treasurer
and Principal
Financial
Officer
since 2019) | | Managing Director, Goldman Sachs (November 2015-Present) and Vice President — Mutual Fund Administration, Columbia Management Investment Advisers, LLC (May 2010-October 2015). Treasurer, Principal Financial Officer and Principal Accounting Officer — Goldman Sachs Variable Insurance Trust (previously Assistant Treasurer (2016)); Goldman Sachs Trust (previously Assistant Treasurer (2016)); Goldman Sachs Trust II (previously Assistant Treasurer (2017)); Goldman Sachs MLP and Energy Renaissance Fund (previously Assistant Treasurer (2017)); Goldman Sachs ETF Trust (previously Assistant Treasurer (2017)); Goldman Sachs Credit Income Fund; and Goldman Sachs Real Estate Diversified Income Fund. |
| * | Represents a partial list of officers of the Trust. Additional information about all the officers is available in the Fund’s Statement of Additional Information, which can be obtained from Goldman Sachs free of charge by calling this toll-free number (in the United States): 1-800-526-7384. |
| 1 | Information is provided as of December 31, 2020. |
| 2 | Officers hold office at the pleasure of the Board of Trustees or until their successors are duly elected and qualified. Each officer holds comparable positions with certain other companies of which Goldman Sachs, GSAM or an affiliate thereof is the investment adviser, administrator and/or distributor. |
Goldman Sachs Variable Insurance Trust — Tax Information (Unaudited)
For the fiscal year end December 31, 2020, the International Equity Insights Fund has elected to pass through a credit for taxes paid to foreign jurisdictions. The total amount of income received by the International Equity Insights Fund from sources within foreign countries and possessions of the United States was $0.1357 per share, all of which is attributable to qualified passive income. The percentage of net investment income dividends paid by the Fund during the year December 31, 2020 from foreign sources was 82.04%. The total amount of foreign taxes paid by the Fund was $0.0166 per share.
34
| | |
| TRUSTEES | | OFFICERS |
| Jessica Palmer, Chair | | James A. McNamara, President |
| Dwight L. Bush | | Joseph F. DiMaria, Principal Financial Officer, |
| Kathryn A. Cassidy | | Principal Accounting Officer and Treasurer |
| Diana M. Daniels | | Caroline L. Kraus, Secretary |
| Joaquin Delgado | | |
| James A. McNamara | | |
| Roy W. Templin |
| Gregory G. Weaver |
GOLDMAN SACHS & CO. LLC
Distributor and Transfer Agent
GOLDMAN SACHS ASSET MANAGEMENT, L.P.
Investment Adviser
200 West Street, New York
New York 10282
Visit our web site at www.GSAMFUNDS.com to obtain the most recent month-end returns.
The reports concerning the Fund included in this shareholder report may contain certain forward-looking statements about the factors that may affect the performance of the Fund in the future. These statements are based on Fund management’s predictions and expectations concerning certain future events and their expected impact on the Fund, such as performance of the economy as a whole and of specific industry sectors, changes in the levels of interest rates, the impact of developing world events, and other factors that may influence the future performance of the Fund. Management believes these forward-looking statements to be reasonable, although they are inherently uncertain and difficult to predict. Actual events may cause adjustments in portfolio management strategies from those currently expected to be employed.
A description of the policies and procedures that the Fund uses to determine how to vote proxies relating to portfolio securities and information regarding how the Fund voted proxies relating to portfolio securities during the most recent 12-month period ended December 31 is available (i) without charge, upon request by calling 1-800-621-2550; and (ii) on the Securities and Exchange Commission (“SEC”) web site at http://www.sec.gov.
The Fund will file its portfolio holdings information for each month in a fiscal quarter within 60 days after the end of the relevant fiscal quarter on Form N-PORT. Portfolio holdings information for the third month of each fiscal quarter will be made available on the SEC’s web site at http://www.sec.gov. Portfolio holdings information may be obtained upon request and without charge by calling 1-800-526-7384 (for Retail Shareholders) or 1-800-621-2550 (for Institutional Shareholders).
Views and opinions expressed are for informational purposes only and do not constitute a recommendation by GSAM to buy, sell, or hold any security. Views and opinions are current as of the date of this presentation and may be subject to change, they should not be construed as investment advice.
Goldman Sachs & Co. LLC (“Goldman Sachs”) does not provide legal, tax or accounting advice. Any statement contained in this communication (including any attachments) concerning U.S. tax matters was not intended or written to be used, and cannot be used, for the purpose of avoiding penalties under the Internal Revenue Code, and was written to support the promotion or marketing of transaction or matter addressed. Clients of Goldman Sachs should obtain their own independent tax advice based on their particular circumstances.
The website links provided are for your convenience only and are not an endorsement or recommendation by GSAM of any of these websites or the products or services offered. GSAM is not responsible for the accuracy and validity of the content of these websites.
Economic and market forecasts presented herein reflect our judgment as of the date of this presentation and are subject to change without notice. These forecasts do not take into account the specific investment objectives, restrictions, tax and financial situation or other needs of any specific client. Actual data will vary and may not be reflected here. These forecasts are subject to high levels of uncertainty that may affect actual performance. Accordingly, these forecasts should be viewed as merely representative of a broad range of possible outcomes. These forecasts are estimated, based on assumptions, and are subject to significant revision and may change materially as economic and market conditions change. Goldman Sachs has no obligation to provide updates or changes to these forecasts. Case studies and examples are for illustrative purposes only.
Fund holdings and allocations shown are as of December 31, 2020 and may not be representative of future investments. Fund holdings should not be relied on in making investment decisions and should not be construed as research or investment advice regarding particular securities. Current and future holdings are subject to risk.
References to indices, benchmarks or other measures of relative market performance over a specified period of time are provided for your information only and do not imply that the portfolio will achieve similar results. The index composition may not reflect the manner in which a portfolio is constructed. While an adviser seeks to design a portfolio which reflects appropriate risk and return features, portfolio characteristics may deviate from those of the benchmark.
The Global Industry Classification Standard (“GICS”) was developed by and is the exclusive property and a service mark of Morgan Stanley Capital International Inc. (“MSCI”) and Standard & Poor’s, a division of The McGraw-Hill Companies, Inc. (“S&P”) and is licensed for use by Goldman Sachs. Neither MSCI, S&P nor any other party involved in making or compiling the GICS or any GICS classifications makes any express or implied warranties or representations with respect to such standard or classification (or the results to be obtained by the use thereof), and all such parties hereby expressly disclaim all warranties of originality, accuracy, completeness, merchantability or fitness for a particular purpose with respect to any of such standard or classification. Without limiting any of the foregoing, in no event shall MSCI, S&P, any of their affiliates or any third party involved in making or compiling the GICS or any GICS classifications have any liability for any direct, indirect, special, punitive, consequential or any other damages (including lost profits) even if notified of the possibility of such damages.
The portfolio risk management process includes an effort to monitor and manage risk, but does not imply low risk.
Shares of the Goldman Sachs VIT Funds are offered to separate accounts of participating life insurance companies for the purpose of funding variable annuity contracts and variable life insurance policies. Shares of the Fund are not offered directly to the general public. The variable annuity contracts and variable life insurance policies are described in the separate prospectuses issued by participating insurance companies. You should refer to those prospectuses for information about surrender charges, mortality and expense risk fees and other charges that may be assessed by participating insurance companies under the variable annuity contracts or variable life insurance policies. Such fees or charges, if any, may affect the return you may realize with respect to your investments. Ask your representative for more complete information. Please consider a fund’s objectives, risks and charges and expenses, and read the prospectus carefully before investing. The prospectus contains this and other information about the Fund.
This material is not authorized for distribution to prospective investors unless preceded or accompanied by a current prospectus or summary prospectus, if applicable. Investors should consider the Fund’s objective, risks, and charges and expenses, and read the summary prospectus, if available, and/or the prospectus carefully before investing or sending money. The summary prospectus, if available, and the prospectus contain this and other information about the Fund and may be obtained from your authorized dealer or from Goldman Sachs & Co. LLC by calling 1-800-621-2550
This report is prepared for the general information of contract owners and is not an offer of shares of the Goldman Sachs Variable Insurance Trust — Goldman Sachs International Equity Insights Fund.
© 2021 Goldman Sachs. All rights reserved.
VITINTLAR-21/229741-OTU-1350943
Goldman
Sachs Variable Insurance Trust
Goldman Sachs
U.S. Equity Insights Fund
Beginning on or after January 1, 2021, you may not receive paper copies of the Fund’s annual and semi-annual shareholder reports from the insurance company that offers your variable insurance contract or your financial intermediary, unless you specifically request paper copies of the reports from the insurance company or from your financial intermediary. Instead, the reports will be made available on a website, and you will be notified by mail each time a report is posted and provided with a website link to access the report.
If you already elected to receive shareholder reports electronically, you will not be affected by this change and you need not take any action. At any time, you may elect to receive reports and certain communications from the insurance company electronically by contacting your insurance company or your financial intermediary.
You may elect to receive all future shareholder reports in paper free of charge. You can inform the insurance company or your financial intermediary that you wish to receive paper copies of reports. Your election to receive reports in paper will apply to all Goldman Sachs Funds available under your contract and may apply to all funds held with your financial intermediary.
Annual Report
December 31, 2020

GOLDMAN SACHS VARIABLE INSURANCE TRUST U.S. EQUITY INSIGHTS FUND
INVESTMENT OBJECTIVE
The Fund seeks long-term growth of capital and dividend income.
Portfolio Management Discussion and Analysis
Below, the Goldman Sachs Quantitative Investment Strategies Team discusses the Goldman Sachs Variable Insurance Trust — Goldman Sachs U.S. Equity Insights Fund’s (the “Fund”) performance and positioning for the 12-month period ended December 31, 2020 (the “Reporting Period”).
How did the Fund perform during the Reporting Period?
During the Reporting Period, the Fund’s Institutional and Service Shares generated average annual total returns of 17.49% and 17.27%, respectively. These returns compare to the 18.34% average annual total return of the Fund’s benchmark, the Standard & Poor’s 500® Index (with dividends reinvested) (the “S&P 500® Index”) during the same time period.
What economic and market factors most influenced the equity markets as a whole during the Reporting Period?
Representing the U.S. equity market, the S&P 500® Index returned 18.34% during the Reporting Period.
The U.S. equity market fell significantly in the first quarter of 2020, selling off as the outbreak and subsequent spread of COVID-19 caused non-essential businesses to close. Jobless claims increased to 6.6 million, and nonfarm payrolls decreased by 701,000 for the month of March, leading the U.S. government to respond with aggressive economic stimulus and the U.S. Federal Reserve (the “Fed”) to respond with unprecedented monetary policy stimulus, including lowering its targeted federal funds rate to zero and re-introducing and expanding its quantitative easing programs. Exacerbating matters was oil prices that fell as supply increased and demand decreased.
After hitting a low on March 23, 2020, the U.S. equity market then rose in the subsequent three quarters of 2020. In the second calendar quarter, the U.S. equity market appreciated despite a surge in COVID-19 cases in regional pockets of the country, causing local governments to pause reopening plans and revisit previous lockdown measures. Positive market sentiment was buoyed by better than consensus expected economic data, such as nonfarm payrolls increasing 7.3 million during May and June 2020, driving the unemployment rate down to 11.1% from 14.7% in April. The U.S. equity markets continued to rally in the third quarter of 2020 despite ongoing pressure from the pandemic. Market strength was supported by a sharp cyclical recovery in economic data, with the Institute for Supply Management’s Manufacturing Purchasing Managers’ Index increasing to 56.0 in August, which is firmly in expansionary territory. Optimism around a potential COVID-19 vaccine also helped support equity markets during the quarter. Still, risks to the market persisted given political uncertainty ahead of the November 2020 U.S. elections, lower levels of Gross Domestic Product, heightened unemployment, questions around how quickly and effectively a vaccine could be distributed, and debates about the extent of a new stimulus package from the federal government. In the fourth quarter of 2020, U.S. stocks extended a broad-based recovery from their steep first quarter declines. Markets rallied on the prospect of an end to the global pandemic and its economic impact with approval and distribution of COVID-19 vaccines. While uncertainty surrounding the then-upcoming U.S. elections and other policy questions created the potential for higher market volatility, the Democratic victory of Joe Biden proved positive for equity markets over the near term. Also, after a historically sharp but short recession during the spring of 2020, many major economies, including that of the U.S., entered an early-cycle phase of recovery. Employment conditions improved, as temporary job losses were regained in some segments of the economy, and U.S. manufacturing activity recovered. Despite this improvement, reminders of a COVID-19 ceiling for industries hit hardest by the restrictions caused by the pandemic persisted.
For the Reporting Period overall, eight of the 11 sectors in the S&P 500® Index posted positive absolute returns, with seven of those eight generating double-digit gains. Information technology, consumer discretionary and communication services were the best performing sectors in the S&P 500® Index, as measured by total return, while the weakest performing sectors in the S&P 500® Index during the Reporting Period were energy, real estate and financials.
Within the U.S. equity market, all capitalization segments posted double-digit positive returns, led by large-cap stocks, as measured by the Russell 1000® Index, followed closely by small-cap stocks, as measured by the Russell 2000® Index, and then by mid-cap stocks, as measured by the Russell Midcap® Index. From a style perspective, growth-oriented stocks significantly outpaced value-oriented stocks across the capitalization spectrum. (All as measured by the FTSE Russell indices.)
1
GOLDMAN SACHS VARIABLE INSURANCE TRUST U.S. EQUITY INSIGHTS FUND
What key factors were responsible for the Fund’s performance during the Reporting Period?
During the Reporting Period, the Fund posted robust double-digit absolute gains but underperformed the S&P 500® Index, with two of our quantitative model’s four investment themes detracting from results. Stock selection overall, driven by these investment themes, diminished relative performance.
What impact did the Fund’s investment themes have on performance during the Reporting Period?
The Fund uses a quantitative style of management, in combination with a qualitative overlay, that emphasizes fundamentally-based stock selection, careful portfolio construction and efficient implementation. The Fund’s investments are selected using fundamental research and a variety of quantitative techniques based on certain investment themes, namely Fundamental Mispricings, High Quality Business Models, Sentiment Analysis and Market Themes & Trends.
In keeping with our investment approach, we use our quantitative model and four investment themes to take a long-term view of market patterns and look for inefficiencies, selecting stocks for the Fund and overweighting or underweighting the ones chosen by the model. Over time and by design, the performance of any one of the model’s investment themes tends to have a low correlation with the model’s other themes, demonstrating the diversification benefit of the Fund’s theme-driven quantitative model. The variance in performance supports our research indicating that the diversification provided by the Fund’s different investment themes is a significant investment advantage over the long term, even though the Fund may experience underperformance in the short term. Of course, diversification does not protect an investor from market risk nor does it ensure a profit.
During the Reporting Period, two of our investment themes — Sentiment Analysis and High Quality Business Models — detracted from the Fund’s relative performance. Sentiment Analysis seeks to identify stocks experiencing improvements in their overall market sentiment. High Quality Business Models seeks to identify companies that are generating high quality revenues with sustainable business models and aligned management incentives.
Market Themes & Trends and Fundamental Mispricings contributed positively to the Fund’s relative performance during the Reporting Period. Market Themes & Trends seeks to identify companies positively positioned to benefit from themes and trends in the market and macroeconomic environment. Fundamental Mispricing seeks to identify high quality businesses trading at a fair price, which we believe may lead to strong performance over the long run.
How did the Fund’s sector and industry allocations affect relative performance?
In constructing the Fund’s portfolio, we focus on picking stocks rather than making sector or industry bets. Consequently, the Fund is similar to its benchmark, the S&P 500® Index, in terms of its sector and industry allocations and style. Changes in its sector or industry weights generally do not have a meaningful impact on relative performance.
Did stock selection help or hurt Fund performance during the Reporting Period?
We seek to outpace the S&P 500® Index by overweighting stocks that we expect to outperform and underweighting those that we think may lag. At the same time, we strive to maintain a risk profile similar to the S&P 500® Index. The Fund’s investments are selected using fundamental research and a variety of quantitative techniques based on our investment themes. For example, the Fund aims to hold a basket of stocks with better Fundamental Mispricings characteristics than the benchmark index.
During the Reporting Period, stock selection hampered the Fund’s performance, with investments in the financials, industrials and real estate sectors detracting most from results relative to the S&P 500® Index. Stock selection in the information technology, energy and consumer discretionary sectors contributed most positively to the Fund’s results relative to the S&P 500® Index during the Reporting Period.
Which individual positions detracted from the Fund’s results during the Reporting Period?
Detracting most from the Fund’s results relative to the S&P 500® Index were overweight positions in oilfield services provider TechnipFMC, aircraft manufacturer Raytheon Technologies and banking services provider Zions Bancorporation. The Fund had an overweight position in TechnipFMC driven primarily by our Fundamental Mispricings investment theme. The Fund’s overweight in Raytheon was largely due to our Sentiment Analysis investment theme. The overweight in Zions Bancorporation was established primarily because of our Fundamental Mispricing investment theme.
Which individual stock positions contributed the most to the Fund’s relative returns during the Reporting Period?
The Fund benefited most from overweight positions in digital and mobile payments technology platform PayPal Holdings and e-commerce behemoth Amazon.com and from an underweight position in integrated energy company Exxon Mobil. The
2
GOLDMAN SACHS VARIABLE INSURANCE TRUST U.S. EQUITY INSIGHTS FUND
overweight in PayPal Holdings was established primarily because of our Sentiment Analysis and Market Themes & Trends investment themes. The Fund was overweight Amazon.com due mostly to our Sentiment Analysis investment theme. The Fund’s underweight in Exxon Mobil was driven mainly by our Sentiment Analysis investment theme.
How did the Fund use derivatives during the Reporting Period?
During the Reporting Period, we did not use derivatives as part of an active management strategy to add value to the Fund’s results.
Did you make any enhancements to your quantitative models during the Reporting Period?
We continuously look for ways to improve our investment process. During the Reporting Period, we made numerous enhancements to our models. As example, during the first half of the Reporting Period, we introduced a number of new signals within our High Quality Business Models investment theme. The first signal, introduced in our U.S. region, uses machine learning and natural language processing techniques to capture the linguistic complexity of a company’s earnings call transcript, as we believe that companies using simple language are expected to perform better over the long term. The second signal, also introduced in the U.S. region, uses machine learning techniques to gauge the management quality of a company by assessing employee satisfaction and firm culture through employee reviews and ratings for companies. We also introduced a new Fundamental Mispricings signal into all of our regional models. This signal seeks to test investors’ under-reaction to a company’s short-term deviation in its fundamentals by simultaneously looking at a set of key profitability metrics that could point to a company’s long-term growth prospects.
During the second half of the Reporting Period, within our Sentiment Analysis investment theme, we introduced a number of new signals in the U.S. region. The first signal uses granular market data to understand market microstructures. The second is based on the quality of managements’ responses on earnings calls. This signal uses natural language processing techniques in order to capture the linguistic complexity of a company’s earnings call transcript, as we believe that companies that respond with fewer “non-answers” are expected to perform better over the long term. We also introduced new signals within our High Quality Business Models investment theme, particularly in the U.S. region. The first signal evaluates the overlap in tenure of a company’s C-Suite executives as well as other management positions, as we believe companies that exhibit less turnover in their senior-most management teams are likely to outperform in the long run. The second signal seeks to identify a company’s exposure to U.S. states based on search engine activity, as we believe that companies can be impacted by the economic conditions of regions beyond where their subsidiaries, offices or otherwise general businesses are physically located. We also introduced a strategic climate-aware tilt with longer-term return expectations within our portfolio construction process. This tilt is designed to reduce the Fund’s exposure to carbon transition risk using two proprietary measures of emissions intensity. We believe that the transition to a low-carbon economy is likely to become even more important in determining the attractiveness of companies in the future.
What was the Fund’s sector positioning relative to its benchmark index at the end of the Reporting Period?
As of December 31, 2020, the Fund was overweight the health care and real estate sectors relative to the S&P 500® Index. The Fund was underweight information technology and utilities and was rather neutrally weighted in consumer staples, consumer discretionary, communication services, financials, materials, energy and industrials compared to the benchmark index on the same date.
Were there any changes to the Fund’s portfolio management team during the Reporting Period?
There were no changes to the Fund’s portfolio management team during the Reporting Period.
What is your strategy going forward for the Fund?
Looking ahead, we continue to believe that less expensive stocks should outpace more expensive stocks, and stocks with good momentum are likely to outperform those with poor momentum. We intend to maintain our focus on seeking companies about which fundamental research analysts are becoming more positive as well as profitable companies with sustainable earnings and a track record of using their capital to enhance shareholder value. As such, we anticipate remaining fully invested with long-term performance likely to be the result of stock selection rather than sector or capitalization allocations.
We stand behind our investment philosophy that sound economic investment principles, coupled with a disciplined quantitative approach, can provide strong, uncorrelated returns over the long term. Our research agenda is robust, and we continue to enhance our existing models, add new proprietary forecasting signals and improve our trading execution as we seek to provide the most value to our shareholders.
3
GOLDMAN SACHS VARIABLE INSURANCE TRUST U.S. EQUITY INSIGHTS FUND
Index Definitions
S&P 500® Index is the Standard & Poor’s composite index of 500 stocks, an unmanaged index of common stock prices. The figures for the index do not include any deduction for fees, expenses or taxes.
Russell 2000® Index is an unmanaged index of common stock prices that measures the performance of the 2000 smallest companies in the Russell 3000® Index. The figures for the index do not include any deduction for fees, expenses or taxes.
Russell Midcap® Index measures the performance of the 800 smallest companies in the Russell 1000® Index, which represents approximately 25% of the total market capitalization of the Russell 1000® Index.
Russell 1000® Index measures the performance of the 1,000 largest companies in the Russell 3000® Index, which represents approximately 92% of the total market capitalization of the Russell 3000® Index.
It is not possible to invest directly in an index.
4
FUND BASICS
U.S. Equity Insights Fund
as of December 31, 2020
TOP TEN HOLDINGS AS OF 12/31/201
| | | | | | |
| | |
| Holding | | % of Net Assets | | | Line of Business |
| Microsoft Corp. | | | 5.8% | | | Software & Services |
| Apple, Inc. | | | 5.7 | | | Technology Hardware & Equipment |
| Amazon.com, Inc. | | | 4.2 | | | Retailing |
| Facebook, Inc. Class A | | | 3.1 | | | Media & Entertainment |
| Alphabet, Inc. Class C | | | 2.6 | | | Media & Entertainment |
| PayPal Holdings, Inc. | | | 1.9 | | | Software & Services |
| Netflix, Inc. | | | 1.8 | | | Media & Entertainment |
| Alphabet, Inc. Class A | | | 1.8 | | | Media & Entertainment |
| Johnson & Johnson | | | 1.6 | | | Pharmaceuticals, Biotechnology & Life Sciences |
| Walmart, Inc. | | | 1.6 | | | Food & Staples Retailing |
| 1 | The top 10 holdings may not be representative of the Fund’s future investments. |
FUND vs. BENCHMARK SECTOR ALLOCATIONS2
As of December 31, 2020
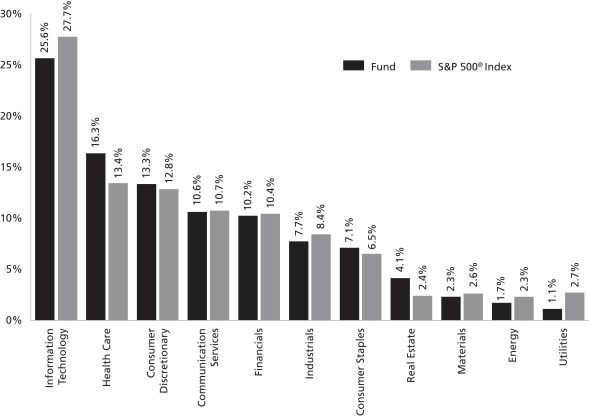
| 2 | The Fund is actively managed and, as such, its composition may differ over time. Consequently, the Fund’s overall sector allocations may differ from percentages contained in the graph above. The graph categorizes investments using Global Industry Classification Standard (“GICS”); however, the sector classifications used by the portfolio management team may differ from GICS. The percentage shown for each investment category reflects the value of investments in that category as a percentage of market value. |
For more information about your Fund, please refer to www.GSAMFUNDS.com. There, you can learn more about your Portfolio’s investment strategies, holdings, and performance.
5
GOLDMAN SACHS VARIABLE INSURANCE TRUST U.S. EQUITY INSIGHTS FUND
Performance Summary
December 31, 2020
The following graph shows the value, as of December 31, 2020, of a $10,000 investment made on January 1, 2011 in the Institutional Shares at NAV. For comparative purposes, the performance of the Fund’s benchmark, the S&P 500® Index, is shown. Performance reflects applicable fee waivers and/or expense limitations in effect during the periods shown and in their absence, performance would be reduced. Returns do not reflect the deduction of taxes that a shareholder would pay on Fund distributions or the redemption of Fund shares. The returns set forth below represent past performance. Past performance does not guarantee future results. The Fund’s investment return and principal value will fluctuate so that an investor’s shares, when redeemed, may be worth more or less than their original cost. Current performance may be lower or higher than the performance quoted below. Please visit our web site at www.GSAMFUNDS.com to obtain the most recent month-end returns.
U.S. Equity Insights Fund’s 10 Year Performance
Performance of a $10,000 investment, with distributions reinvested, from January 1, 2011 through December 31, 2020.
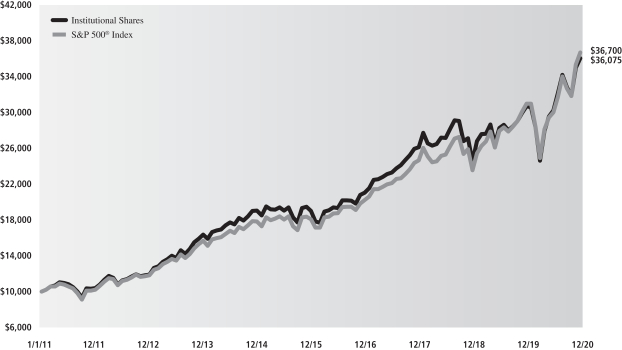
| | | | | | |
| Average Annual Total Return through December 31, 2020 | | One Year | | Five Years | | Ten Years |
Institutional | | 17.49% | | 13.64% | | 13.68% |
Service | | 17.27% | | 13.41% | | 13.45% |
6
GOLDMAN SACHS VARIABLE INSURANCE TRUST U.S. EQUITY INSIGHTS FUND
Schedule of Investments
December 31, 2020
| | | | | | | | |
| Shares | | | Description | | Value | |
|
| Common Stocks – 99.6% | |
| Automobiles & Components – 2.4% | |
| | 393,037 | | | Ford Motor Co. | | $ | 3,454,795 | |
| | 8,099 | | | General Motors Co. | | | 337,242 | |
| | 38,779 | | | Gentex Corp. | | | 1,315,772 | |
| | 3,466 | | | Tesla, Inc.* | | | 2,445,852 | |
| | | | | | | | |
| | | | 7,553,661 | |
| | |
| Banks – 1.4% | |
| | 14,995 | | | Bank of America Corp. | | | 454,498 | |
| | 1,283 | | | Citigroup, Inc. | | | 79,110 | |
| | 10,650 | | | First Republic Bank | | | 1,564,805 | |
| | 4,413 | | | JPMorgan Chase & Co. | | | 560,760 | |
| | 6,407 | | | Signature Bank | | | 866,803 | |
| | 389 | | | SVB Financial Group* | | | 150,866 | |
| | 22,411 | | | Wells Fargo & Co. | | | 676,364 | |
| | | | | | | | |
| | | | 4,353,206 | |
| | |
| Capital Goods – 5.9% | |
| | 4,812 | | | Allegion plc | | | 560,021 | |
| | 5,979 | | | AMETEK, Inc. | | | 723,100 | |
| | 12,427 | | | Caterpillar, Inc. | | | 2,261,963 | |
| | 822 | | | Dover Corp. | | | 103,777 | |
| | 1,395 | | | General Dynamics Corp. | | | 207,604 | |
| | 50,439 | | | General Electric Co. | | | 544,741 | |
| | 6,377 | | | Illinois Tool Works, Inc. | | | 1,300,143 | |
| | 24,445 | | | Johnson Controls International plc | | | 1,138,893 | |
| | 5,977 | | | Lennox International, Inc. | | | 1,637,519 | |
| | 37,299 | | | Masco Corp. | | | 2,048,834 | |
| | 13,620 | | | Otis Worldwide Corp. | | | 920,031 | |
| | 13,291 | | | PACCAR, Inc. | | | 1,146,747 | |
| | 11,450 | | | Parker-Hannifin Corp. | | | 3,119,094 | |
| | 23,577 | | | Raytheon Technologies Corp. | | | 1,685,991 | |
| | 2,549 | | | Teledyne Technologies, Inc.* | | | 999,157 | |
| | 2,335 | | | Trane Technologies plc | | | 338,949 | |
| | 568 | | | United Rentals, Inc.* | | | 131,725 | |
| | | | | | | | |
| | | | 18,868,289 | |
| | |
| Consumer Durables & Apparel – 1.0% | |
| | 20,352 | | | NIKE, Inc. Class B | | | 2,879,197 | |
| | 9,944 | | | Tapestry, Inc. | | | 309,060 | |
| | | | | | | | |
| | | | 3,188,257 | |
| | |
| Consumer Services – 1.6% | |
| | 1,751 | | | Chipotle Mexican Grill, Inc.* | | | 2,428,129 | |
| | 28,824 | | | Las Vegas Sands Corp. | | | 1,717,910 | |
| | 1,832 | | | Marriott International, Inc. Class A | | | 241,678 | |
| | 7,843 | | | Wynn Resorts Ltd. | | | 884,926 | |
| | | | | | | | |
| | | | 5,272,643 | |
| | |
| Diversified Financials – 6.0% | |
| | 11,278 | | | Ally Financial, Inc. | | | 402,174 | |
| | 5,666 | | | Berkshire Hathaway, Inc. Class B* | | | 1,313,775 | |
| | 20,405 | | | Capital One Financial Corp. | | | 2,017,034 | |
| | 20,343 | | | CME Group, Inc. | | | 3,703,443 | |
| | 10,147 | | | Jefferies Financial Group, Inc. | | | 249,616 | |
| | 2,795 | | | Moody’s Corp. | | | 811,221 | |
| | 1,059 | | | Raymond James Financial, Inc. | | | 101,315 | |
| | |
|
| Common Stocks – (continued) | |
| Diversified Financials – (continued) | |
| | 11,585 | | | S&P Global, Inc. | | | 3,808,337 | |
| | 53,790 | | | Starwood Property Trust, Inc. (REIT) | | | 1,038,147 | |
| | 103,962 | | | Synchrony Financial | | | 3,608,521 | |
| | 37,836 | | | Voya Financial, Inc. | | | 2,225,135 | |
| | | | | | | | |
| | | | 19,278,718 | |
| | |
| Energy – 1.7% | |
| | 29,948 | | | Chevron Corp. | | | 2,529,108 | |
| | 24,378 | | | EOG Resources, Inc. | | | 1,215,731 | |
| | 2,113 | | | Exxon Mobil Corp. | | | 87,098 | |
| | 3,728 | | | Hess Corp. | | | 196,801 | |
| | 15,510 | | | Kinder Morgan, Inc. | | | 212,022 | |
| | 1,302 | | | Pioneer Natural Resources Co. | | | 148,285 | |
| | 49,416 | | | Schlumberger NV | | | 1,078,751 | |
| | | | | | | | |
| | | | 5,467,796 | |
| | |
| Food & Staples Retailing – 3.1% | |
| | 13,117 | | | Costco Wholesale Corp. | | | 4,942,223 | |
| | 35,570 | | | Walmart, Inc. | | | 5,127,416 | |
| | | | | | | | |
| | | | 10,069,639 | |
| | |
| Food, Beverage & Tobacco – 2.5% | |
| | 122 | | | Boston Beer Co., Inc. (The) Class A* | | | 121,304 | |
| | 39,538 | | | Monster Beverage Corp.* | | | 3,656,474 | |
| | 50,370 | | | Philip Morris International, Inc. | | | 4,170,132 | |
| | | | | | | | |
| | | | 7,947,910 | |
| | |
| Health Care Equipment & Services – 6.9% | |
| | 1,015 | | | Align Technology, Inc.* | | | 542,396 | |
| | 8,197 | | | Anthem, Inc. | | | 2,631,975 | |
| | 2,168 | | | Cardinal Health, Inc. | | | 116,118 | |
| | 4,733 | | | Cigna Corp. | | | 985,316 | |
| | 4,090 | | | Cooper Cos., Inc. (The) | | | 1,485,979 | |
| | 5,831 | | | Danaher Corp. | | | 1,295,298 | |
| | 7,571 | | | Edwards Lifesciences Corp.* | | | 690,702 | |
| | 22,267 | | | HCA Healthcare, Inc. | | | 3,662,031 | |
| | 34,246 | | | Hologic, Inc.* | | | 2,494,136 | |
| | 3,603 | | | Humana, Inc. | | | 1,478,203 | |
| | 1,079 | | | Quidel Corp.* | | | 193,842 | |
| | 324 | | | UnitedHealth Group, Inc. | | | 113,620 | |
| | 21,825 | | | Universal Health Services, Inc. Class B | | | 3,000,938 | |
| | 12,086 | | | West Pharmaceutical Services, Inc. | | | 3,424,085 | |
| | | | | | | | |
| | | | 22,114,639 | |
| | |
| Household & Personal Products – 1.5% | |
| | 14,262 | | | Estee Lauder Cos., Inc. (The) Class A | | | 3,796,402 | |
| | 14,175 | | | Herbalife Nutrition Ltd.* | | | 681,109 | |
| | 2,186 | | | Procter & Gamble Co. (The) | | | 304,160 | |
| | | | | | | | |
| | | | 4,781,671 | |
| | |
| Insurance – 2.8% | | | |
| | 6,698 | | | American Financial Group, Inc. | | | 586,879 | |
| | 6,938 | | | Aon plc Class A | | | 1,465,791 | |
| | 25,242 | | | Arch Capital Group Ltd.* | | | 910,479 | |
| | 7,154 | | | Athene Holding Ltd. Class A* | | | 308,624 | |
| | |
| | |
| The accompanying notes are an integral part of these financial statements. | | 7 |
GOLDMAN SACHS VARIABLE INSURANCE TRUST U.S. EQUITY INSIGHTS FUND
Schedule of Investments (continued)
December 31, 2020
| | | | | | | | |
| Shares | | | Description | | Value | |
|
| Common Stocks – (continued) | |
| Insurance – (continued) | | | |
| | 23,035 | | | Chubb Ltd. | | $ | 3,545,547 | |
| | 14,856 | | | First American Financial Corp. | | | 767,015 | |
| | 6,778 | | | Globe Life, Inc. | | | 643,639 | |
| | 18,799 | | | Old Republic International Corp. | | | 370,528 | |
| | 808 | | | Primerica, Inc. | | | 108,215 | |
| | 2,063 | | | W R Berkley Corp. | | | 137,025 | |
| | | | | | | | |
| | | | 8,843,742 | |
| | |
| Materials – 2.3% | |
| | 77,681 | | | Axalta Coating Systems Ltd.* | | | 2,217,792 | |
| | 3,377 | | | Linde plc | | | 889,873 | |
| | 2,629 | | | RPM International, Inc. | | | 238,661 | |
| | 5,347 | | | Sherwin-Williams Co. (The) | | | 3,929,564 | |
| | | | | | | | |
| | | | 7,275,890 | |
| | |
| Media & Entertainment – 10.5% | |
| | 3,259 | | | Alphabet, Inc. Class A* | | | 5,711,854 | |
| | 4,697 | | | Alphabet, Inc. Class C* | | | 8,228,580 | |
| | 36,418 | | | Facebook, Inc. Class A* | | | 9,947,941 | |
| | 10,591 | | | Netflix, Inc.* | | | 5,726,871 | |
| | 31,811 | | | Omnicom Group, Inc. | | | 1,984,052 | |
| | 25,041 | | | Pinterest, Inc. Class A* | | | 1,650,202 | |
| | 1,892 | | | Roku, Inc.* | | | 628,182 | |
| | | | | | | | |
| | | | 33,877,682 | |
| | |
| Pharmaceuticals, Biotechnology & Life Sciences – 9.3% | |
| | 40,970 | | | AbbVie, Inc. | | | 4,389,935 | |
| | 1,856 | | | Biogen, Inc.* | | | 454,460 | |
| | 2,979 | | | Bristol-Myers Squibb Co. | | | 184,787 | |
| | 1,776 | | | IQVIA Holdings, Inc.* | | | 318,206 | |
| | 3,683 | | | Jazz Pharmaceuticals plc* | | | 607,879 | |
| | 33,405 | | | Johnson & Johnson | | | 5,257,279 | |
| | 20,273 | | | Merck & Co., Inc. | | | 1,658,331 | |
| | 3,095 | | | Mettler-Toledo International, Inc.* | | | 3,527,310 | |
| | 5,370 | | | PerkinElmer, Inc. | | | 770,595 | |
| | 1,004 | | | Seagen, Inc.* | | | 175,841 | |
| | 10,243 | | | Thermo Fisher Scientific, Inc. | | | 4,770,985 | |
| | 16,271 | | | Vertex Pharmaceuticals, Inc.* | | | 3,845,488 | |
| | 24,630 | | | Zoetis, Inc. | | | 4,076,265 | |
| | | | | | | | |
| | | | 30,037,361 | |
| | |
| Real Estate Investment Trusts – 4.1% | |
| | 10,091 | | | AvalonBay Communities, Inc. | | | 1,618,899 | |
| | 4,913 | | | Camden Property Trust | | | 490,907 | |
| | 24,071 | | | Equity LifeStyle Properties, Inc. | | | 1,525,138 | |
| | 2,567 | | | Extra Space Storage, Inc. | | | 297,413 | |
| | 9,778 | | | First Industrial Realty Trust, Inc. | | | 411,947 | |
| | 85,132 | | | Invitation Homes, Inc. | | | 2,528,420 | |
| | 9,021 | | | Mid-America Apartment Communities, Inc. | | | 1,142,870 | |
| | 29,542 | | | Prologis, Inc. | | | 2,944,156 | |
| | 3,099 | | | SBA Communications Corp. | | | 874,321 | |
| | 6,508 | | | Sun Communities, Inc. | | | 988,891 | |
| | 12,417 | | | VEREIT, Inc. | | | 469,246 | |
| | | | | | | | |
| | | | 13,292,208 | |
| | |
|
| Common Stocks – (continued) | |
| Retailing – 8.2% | |
| | 4,173 | | | Amazon.com, Inc.* | | $ | 13,591,169 | |
| | 79 | | | Booking Holdings, Inc.* | | | 175,954 | |
| | 35,475 | | | Dick’s Sporting Goods, Inc. | | | 1,994,050 | |
| | 2,728 | | | Etsy, Inc.* | | | 485,338 | |
| | 11,778 | | | Kohl’s Corp. | | | 479,247 | |
| | 17,984 | | | L Brands, Inc. | | | 668,825 | |
| | 2,208 | | | Lowe’s Cos., Inc. | | | 354,406 | |
| | 1,090 | | | Ross Stores, Inc. | | | 133,863 | |
| | 23,411 | | | Target Corp. | | | 4,132,744 | |
| | 55,405 | | | TJX Cos., Inc. (The) | | | 3,783,607 | |
| | 3,128 | | | Wayfair, Inc. Class A* | | | 706,334 | |
| | | | | | | | |
| | | | 26,505,537 | |
| | |
| Semiconductors & Semiconductor Equipment – 5.2% | |
| | 6,733 | | | Advanced Micro Devices, Inc.* | | | 617,483 | |
| | 47,102 | | | Applied Materials, Inc. | | | 4,064,903 | |
| | 2,864 | | | First Solar, Inc.* | | | 283,307 | |
| | 2,093 | | | KLA Corp. | | | 541,899 | |
| | 7,093 | | | Lam Research Corp. | | | 3,349,811 | |
| | 11,973 | | | Micron Technology, Inc.* | | | 900,130 | |
| | 551 | | | NVIDIA Corp. | | | 287,732 | |
| | 12,787 | | | NXP Semiconductors NV | | | 2,033,261 | |
| | 29,148 | | | Texas Instruments, Inc. | | | 4,784,061 | |
| | | | | | | | |
| | | | 16,862,587 | |
| | |
| Software & Services – 14.3% | |
| | 5,504 | | | Accenture plc Class A | | | 1,437,700 | |
| | 6,420 | | | Adobe, Inc.* | | | 3,210,770 | |
| | 27,805 | | | Fidelity National Information Services, Inc. | | | 3,933,295 | |
| | 3,841 | | | Fiserv, Inc.* | | | 437,336 | |
| | 3,891 | | | Global Payments, Inc. | | | 838,199 | |
| | 20,312 | | | International Business Machines Corp. | | | 2,556,875 | |
| | 245 | | | Intuit, Inc. | | | 93,063 | |
| | 84,354 | | | Microsoft Corp. | | | 18,762,017 | |
| | 25,723 | | | PayPal Holdings, Inc.* | | | 6,024,327 | |
| | 1,835 | | | Square, Inc. Class A* | | | 399,369 | |
| | 5,509 | | | VeriSign, Inc.* | | | 1,192,148 | |
| | 22,901 | | | Visa, Inc. Class A | | | 5,009,136 | |
| | 48,937 | | | Western Union Co. (The) | | | 1,073,678 | |
| | 2,851 | | | Zoom Video Communications, Inc. Class A* | | | 961,699 | |
| | | | | | | | |
| | | | 45,929,612 | |
| | |
| Technology Hardware & Equipment – 6.0% | |
| | 139,248 | | | Apple, Inc. | | | 18,476,817 | |
| | 1,627 | | | Arrow Electronics, Inc.* | | | 158,307 | |
| | 2,449 | | | Dell Technologies, Inc. Class C* | | | 179,487 | |
| | 2,004 | | | Dolby Laboratories, Inc. Class A | | | 194,649 | |
| | 5,537 | | | Western Digital Corp. | | | 306,694 | |
| | | | | | | | |
| | | | 19,315,954 | |
| | |
| Transportation – 1.8% | |
| | 1,704 | | | FedEx Corp. | | | 442,392 | |
| | 1,500 | | | Kansas City Southern | | | 306,195 | |
| | |
| | |
| 8 | | The accompanying notes are an integral part of these financial statements. |
GOLDMAN SACHS VARIABLE INSURANCE TRUST U.S. EQUITY INSIGHTS FUND
| | | | | | | | |
| Shares | | | Description | | Value | |
|
| Common Stocks – (continued) | |
| Transportation – (continued) | |
| | 11,015 | | | Old Dominion Freight Line, Inc. | | $ | 2,149,908 | |
| | 42,700 | | | Uber Technologies, Inc.* | | | 2,177,700 | |
| | 4,444 | | | United Parcel Service, Inc. Class B | | | 748,370 | |
| | | | | | | | |
| | | | 5,824,565 | |
| | |
| Utilities – 1.1% | |
| | 41,680 | | | AES Corp. (The) | | | 979,480 | |
| | 20,910 | | | Sempra Energy | | | 2,664,143 | |
| | | | | | | | |
| | | | 3,643,623 | |
| | |
| | TOTAL INVESTMENTS – 99.6% | |
| | (Cost $232,926,132) | | $ | 320,305,190 | |
| | |
| OTHER ASSETS IN EXCESS OF
LIABILITIES – 0.4% | | | 1,435,541 | |
| | |
| | NET ASSETS – 100.0% | | $ | 321,740,731 | |
| | |
| | |
| The percentage shown for each investment category reflects the value of investments in that category as a percentage of net assets. |
| |
| * | | Security is currently in default and/or non-income producing. |
| | |
| |
| Investment Abbreviation: |
| REIT | | —Real Estate Investment Trust |
| | |
| The accompanying notes are an integral part of these financial statements. | | 9 |
GOLDMAN SACHS VARIABLE INSURANCE TRUST U.S. EQUITY INSIGHTS FUND
Statement of Assets and Liabilities
December 31, 2020
| | | | |
| | | | |
| Assets: | | | |
Investments in unaffiliated issuers, at value (cost $232,926,132) | | $ | 320,305,190 | |
Cash | | | 1,621,960 | |
Receivables: | | | | |
Fund shares sold | | | 353,096 | |
Dividends | | | 316,458 | |
Reimbursement from investment adviser | | | 37,986 | |
Other assets | | | 1,019 | |
| |
| Total assets | | | 322,635,709 | |
| | | | |
| | | | |
| Liabilities: | | | |
Payables: | | | | |
Fund shares redeemed | | | 537,265 | |
Management fees | | | 145,821 | |
Distribution and Service fees and Transfer Agency fees | | | 15,073 | |
Accrued expenses | | | 196,819 | |
| |
| Total liabilities | | | 894,978 | |
| | | | |
| | | | |
| Net Assets: | | | |
Paid-in capital | | | 228,051,726 | |
Total distributable earnings (loss) | | | 93,689,005 | |
| |
| NET ASSETS | | $ | 321,740,731 | |
Net Assets: | | | | |
Institutional | | $ | 267,592,127 | |
Service | | | 54,148,604 | |
| |
Total Net Assets | | $ | 321,740,731 | |
Shares outstanding $0.001 par value (unlimited shares authorized): | | | | |
Institutional | | | 13,328,483 | |
Service | | | 2,679,910 | |
Net asset value, offering and redemption price per share: | | | | |
Institutional | | | $20.08 | |
Service | | | 20.21 | |
| | |
| 10 | | The accompanying notes are an integral part of these financial statements. |
GOLDMAN SACHS VARIABLE INSURANCE TRUST U.S. EQUITY INSIGHTS FUND
Statement of Operations
For the Fiscal Year Ended December 31, 2020
| | | | |
| | | | |
| Investment income: | | | |
Dividends — unaffiliated issuers (net of foreign taxes withheld of $7,360) | | $ | 4,157,222 | |
Securities lending income — affiliated issuer | | | 1,395 | |
Interest | | | 711 | |
Dividends — affiliated issuers | | | 3 | |
| |
| Total investment income | | | 4,159,331 | |
| | | | |
| | | | |
| Expenses: | | | |
Management fees | | | 1,831,171 | |
Distribution and Service (12b-1) fees | | | 128,470 | |
Professional fees | | | 109,717 | |
Printing and mailing costs | | | 98,489 | |
Custody, accounting and administrative services | | | 82,958 | |
Transfer Agency fees(a) | | | 59,065 | |
Trustee fees | | | 20,941 | |
Other | | | 16,618 | |
| |
| Total expenses | | | 2,347,429 | |
| |
Less — expense reductions | | | (579,282 | ) |
| |
| Net expenses | | | 1,768,147 | |
| |
| NET INVESTMENT INCOME | | | 2,391,184 | |
| | | | |
| | | | |
| Realized and unrealized gain: | | | |
Net realized gain from investments — unaffiliated issuers | | | 17,525,008 | |
| |
Net change in unrealized gain on investments — unaffiliated issuers | | | 28,349,314 | |
| |
| Net realized and unrealized gain | | | 45,874,322 | |
| |
| NET INCREASE IN NET ASSETS RESULTING FROM OPERATIONS | | $ | 48,265,506 | |
| (a) | Institutional and Service Shares incurred Transfer Agency fees of $48,788 and $10,277, respectively. |
| | |
| The accompanying notes are an integral part of these financial statements. | | 11 |
GOLDMAN SACHS VARIABLE INSURANCE TRUST U.S. EQUITY INSIGHTS FUND
Statements of Changes in Net Assets
| | | | | | | | |
| | | For the
Fiscal Year Ended
December 31, 2020 | | | For the
Fiscal Year Ended
December 31, 2019 | |
| | | | | | | | |
| From operations: | | | | | | |
Net investment income | | $ | 2,391,184 | | | $ | 3,688,941 | |
Net realized gain | | | 17,525,008 | | | | 13,673,416 | |
Net change in unrealized gain | | | 28,349,314 | | | | 50,991,594 | |
| | |
| Net increase in net assets resulting from operations | | | 48,265,506 | | | | 68,353,951 | |
| | | | | | | | |
| | | | | | | | |
| Distributions to shareholders: | |
From distributable earnings: | | | | | | | | |
Institutional Shares | | | (12,570,928 | ) | | | (12,098,854 | ) |
Service Shares | | | (2,480,325 | ) | | | (2,482,764 | ) |
| | |
| Total distributions to shareholders | | | (15,051,253 | ) | | | (14,581,618 | ) |
| | | | | | | | |
| | | | | | | | |
| From share transactions: | | | | | | |
Proceeds from sales of shares | | | 13,712,118 | | | | 11,649,993 | |
Reinvestment of distributions | | | 15,051,253 | | | | 14,581,618 | |
Cost of shares redeemed | | | (52,367,727 | ) | | | (56,634,042 | ) |
| | |
| Net decrease in net assets resulting from share transactions | | | (23,604,356 | ) | | | (30,402,431 | ) |
| | |
| TOTAL INCREASE | | | 9,609,897 | | | | 23,369,902 | |
| | | | | | | | |
| | | | | | | | |
| Net Assets: | | | | | | |
| | |
Beginning of year | | | 312,130,834 | | | | 288,760,932 | |
| | |
End of year | | $ | 321,740,731 | | | $ | 312,130,834 | |
| | |
| 12 | | The accompanying notes are an integral part of these financial statements. |
GOLDMAN SACHS VARIABLE INSURANCE TRUST U.S. EQUITY INSIGHTS FUND
Financial Highlights
Selected Data for a Share Outstanding Throughout Each Year
| | | | | | | | | | | | | | | | | | | | |
| | | Goldman Sachs U.S. Equity Insights Fund | |
| | | Institutional Shares | |
| | | Year Ended December 31, | |
| | | 2020 | | | 2019 | | | 2018 | | | 2017 | | | 2016 | |
| | | | | | | | | | | | | | | | | | | | |
| Per Share Data | | | | | | | | | | | | | | | |
| | | | | |
Net asset value, beginning of year | | $ | 17.93 | | | $ | 15.03 | | | $ | 19.41 | | | $ | 17.65 | | | $ | 16.71 | |
| | | | | |
Net investment income(a) | | | 0.15 | | | | 0.21 | | | | 0.22 | | | | 0.28 | | | | 0.22 | |
| | | | | |
Net realized and unrealized gain (loss) | | | 2.98 | | | | 3.57 | | | | (1.38 | ) | | | 3.98 | | | | 1.58 | |
| | | | | |
Total from investment operations | | | 3.13 | | | | 3.78 | | | | (1.16 | ) | | | 4.26 | | | | 1.80 | |
| | | | | |
Distributions to shareholders from net investment income | | | (0.16 | ) | | | (0.23 | ) | | | (0.25 | ) | | | (0.28 | ) | | | (0.23 | ) |
| | | | | |
Distributions to shareholders from net realized gains | | | (0.82 | ) | | | (0.65 | ) | | | (2.97 | ) | | | (2.22 | ) | | | (0.63 | ) |
| | | | | |
Total distributions | | | (0.98 | ) | | | (0.88 | ) | | | (3.22 | ) | | | (2.50 | ) | | | (0.86 | ) |
| | | | | |
Net asset value, end of year | | $ | 20.08 | | | $ | 17.93 | | | $ | 15.03 | | | $ | 19.41 | | | $ | 17.65 | |
| | | | | |
Total return(b) | | | 17.49 | % | | | 25.21 | % | | | (6.19 | )% | | | 24.07 | % | | | 10.70 | % |
| | | | | |
Net assets, end of year (in 000s) | | $ | 267,592 | | | $ | 256,930 | | | $ | 235,553 | | | $ | 277,952 | | | $ | 255,565 | |
| | | | | |
Ratio of net expenses to average net assets | | | 0.56 | % | | | 0.58 | % | | | 0.58 | % | | | 0.62 | % | | | 0.64 | % |
| | | | | |
Ratio of total expenses to average net assets | | | 0.75 | % | | | 0.76 | % | | | 0.73 | % | | | 0.70 | % | | | 0.70 | % |
| | | | | |
Ratio of net investment income to average net assets | | | 0.85 | % | | | 1.24 | % | | | 1.12 | % | | | 1.42 | % | | | 1.25 | % |
| | | | | |
Portfolio turnover rate(c) | | | 203 | % | | | 187 | % | | | 160 | % | | | 184 | % | | | 204 | % |
| (a) | Calculated based on the average shares outstanding methodology. |
| (b) | Assumes investment at the net asset value at the beginning of the year, reinvestment of all distributions, a complete redemption of the investment at the net asset value at the end of the year and no sales or redemption charges (if any). Total returns would be reduced if a sales or redemption charge was taken into account. Returns do not reflect the impact of taxes to shareholders relating to Fund distributions or the redemption of Fund shares. |
| (c) | The Fund’s portfolio turnover rate is calculated in accordance with regulatory requirements, without regard to transactions involving short term investments. If such transactions were included, the Fund’s portfolio turnover rate may be higher. |
| | |
| The accompanying notes are an integral part of these financial statements. | | 13 |
GOLDMAN SACHS VARIABLE INSURANCE TRUST U.S. EQUITY INSIGHTS FUND
Financial Highlights (continued)
Selected Data for a Share Outstanding Throughout Each Year
| | | | | | | | | | | | | | | | | | | | |
| | | Goldman Sachs U.S. Equity Insights Fund | |
| | | Service Shares | |
| | | Year Ended December 31, | |
| | | 2020 | | | 2019 | | | 2018 | | | 2017 | | | 2016 | |
| | | | | | | | | | | | | | | | | | | | |
| Per Share Data | | | | | | | | | | | | | | | |
| | | | | |
Net asset value, beginning of year | | $ | 18.04 | | | $ | 15.12 | | | $ | 19.48 | | | $ | 17.71 | | | $ | 16.77 | |
| | | | | |
Net investment income(a) | | | 0.12 | | | | 0.18 | | | | 0.18 | | | | 0.24 | | | | 0.18 | |
| | | | | |
Net realized and unrealized gain (loss) | | | 2.99 | | | | 3.58 | | | | (1.37 | ) | | | 3.99 | | | | 1.59 | |
| | | | | |
Total from investment operations | | | 3.11 | | | | 3.76 | | | | (1.19 | ) | | | 4.23 | | | | 1.77 | |
| | | | | |
Distributions to shareholders from net investment income | | | (0.12 | ) | | | (0.19 | ) | | | (0.20 | ) | | | (0.24 | ) | | | (0.20 | ) |
| | | | | |
Distributions to shareholders from net realized gains | | | (0.82 | ) | | | (0.65 | ) | | | (2.97 | ) | | | (2.22 | ) | | | (0.63 | ) |
| | | | | |
Total distributions | | | (0.94 | ) | | | (0.84 | ) | | | (3.17 | ) | | | (2.46 | ) | | | (0.83 | ) |
| | | | | |
Net asset value, end of year | | $ | 20.21 | | | $ | 18.04 | | | $ | 15.12 | | | $ | 19.48 | | | $ | 17.71 | |
| | | | | |
Total return(b) | | | 17.27 | % | | | 24.93 | % | | | (6.36 | )% | | | 23.80 | % | | | 10.44 | % |
| | | | | |
Net assets, end of year (in 000s) | | $ | 54,149 | | | $ | 55,201 | | | $ | 53,208 | | | $ | 142,210 | | | $ | 120,387 | |
| | | | | |
Ratio of net expenses to average net assets | | | 0.77 | % | | | 0.79 | % | | | 0.79 | % | | | 0.82 | % | | | 0.85 | % |
| | | | | |
Ratio of total expenses to average net assets | | | 1.00 | % | | | 1.01 | % | | | 0.97 | % | | | 0.95 | % | | | 0.95 | % |
| | | | | |
Ratio of net investment income to average net assets | | | 0.63 | % | | | 1.03 | % | | | 0.88 | % | | | 1.21 | % | | | 1.04 | % |
| | | | | |
Portfolio turnover rate(c) | | | 203 | % | | | 187 | % | | | 160 | % | | | 184 | % | | | 204 | % |
| (a) | Calculated based on the average shares outstanding methodology. |
| (b) | Assumes investment at the net asset value at the beginning of the year, reinvestment of all distributions, a complete redemption of the investment at the net asset value at the end of the year and no sales or redemption charges (if any). Total returns would be reduced if a sales or redemption charge was taken into account. Returns do not reflect the impact of taxes to shareholders relating to Fund distributions or the redemption of Fund shares. |
| (c) | The Fund’s portfolio turnover rate is calculated in accordance with regulatory requirements, without regard to transactions involving short term investments. If such transactions were included, the Fund’s portfolio turnover rate may be higher. |
| | |
| 14 | | The accompanying notes are an integral part of these financial statements. |
GOLDMAN SACHS VARIABLE INSURANCE TRUST U.S. EQUITY INSIGHTS FUND
Notes to Financial Statements
December 31, 2020
1. ORGANIZATION
Goldman Sachs Variable Insurance Trust (the “Trust” or “VIT”) is a Delaware statutory trust registered under the Investment Company Act of 1940, as amended (the “Act”), as an open-end management investment company. The Trust includes the Goldman Sachs U.S. Equity Insights Fund (the “Fund”). The Fund is a diversified portfolio under the Act offering two classes of shares — Institutional and Service Shares. Shares of the Trust are offered to separate accounts of participating life insurance companies for the purpose of funding variable annuity contracts and variable life insurance policies.
Goldman Sachs Asset Management, L.P. (“GSAM”), an affiliate of Goldman Sachs & Co. LLC (“Goldman Sachs”), serves as investment adviser to the Fund pursuant to a management agreement (the “Agreement”) with the Trust.
2. SIGNIFICANT ACCOUNTING POLICIES
The financial statements have been prepared in accordance with accounting principles generally accepted in the United States of America (“GAAP”) and require management to make estimates and assumptions that may affect the reported amounts and disclosures. Actual results may differ from those estimates and assumptions. The Fund is an investment company under GAAP and follows the accounting and reporting guidance applicable to investment companies.
A. Investment Valuation — The Fund’s valuation policy is to value investments at fair value.
B. Investment Income and Investments — Investment income includes interest income, dividend income, and securities lending income, if any. Interest income is accrued daily and adjusted for amortization of premiums and accretion of discounts. Dividend income is recognized on ex-dividend date or, for certain foreign securities, as soon as such information is obtained subsequent to the ex-dividend date. Non-cash dividends, if any, are recorded at the fair market value of the securities received. Investment transactions are reflected on trade date. Realized gains and losses are calculated using identified cost. Investment transactions are recorded on the following business day for daily net asset value (“NAV”) calculations. Investment income is recorded net of any foreign withholding taxes, less any amounts reclaimable. The Fund may file withholding tax reclaims in certain jurisdictions to recover a portion of amounts previously withheld. Any foreign capital gains tax is accrued daily based upon net unrealized gains, and is payable upon sale of such investments. Distributions received from the Fund’s investments in United States (“U.S.”) real estate investment trusts (“REITs”) may be characterized as ordinary income, net capital gain and/or a return of capital. A return of capital is recorded by the Fund as a reduction to the cost basis of the REIT.
C. Class Allocations and Expenses — Investment income, realized and unrealized gain (loss), if any, and non-class specific expenses of the Fund are allocated daily based upon the proportion of net assets of each class. Non-class specific expenses directly incurred by the Fund are charged to the Fund, while such expenses incurred by the Trust are allocated across the Fund on a straight-line and/or pro-rata basis depending upon the nature of the expenses. Class specific expenses, where applicable, are borne by the respective share classes and include Distribution and Service and Transfer Agency fees.
D. Federal Taxes and Distributions to Shareholders — It is the Fund’s policy to comply with the requirements of the Internal Revenue Code of 1986, as amended (the “Code”), applicable to regulated investment companies and to distribute each year substantially all of its investment company taxable income and capital gains to its shareholders. Accordingly, the Fund is not required to make any provisions for the payment of federal income tax. Distributions to shareholders are recorded on the ex-dividend date. Income and capital gains distributions, if any, are declared and paid at least annually.
Net capital losses, if any, are carried forward to future fiscal years and may be used to the extent allowed by the Code to offset any future capital gains. Losses that are carried forward will retain their character as either short-term or long-term capital losses. Utilization of capital loss carryforwards will reduce the requirement of future capital gains distributions.
The characterization of distributions to shareholders for financial reporting purposes is determined in accordance with federal income tax rules, which may differ from GAAP. The source of the Fund’s distributions may be shown in the accompanying financial statements as either from distributable earnings or capital. Certain components of the Fund’s net assets on the Statement of Assets and Liabilities reflect permanent GAAP/tax differences based on the appropriate tax character.
15
GOLDMAN SACHS VARIABLE INSURANCE TRUST U.S. EQUITY INSIGHTS FUND
Notes to Financial Statements (continued)
December 31, 2020
3. INVESTMENTS AND FAIR VALUE MEASUREMENTS
U.S. GAAP defines the fair value of a financial instrument as the amount that would be received to sell an asset or paid to transfer a liability in an orderly transaction between market participants at the measurement date (i.e., the exit price); the Fund’s policy is to use the market approach. GAAP establishes a fair value hierarchy that prioritizes the inputs to valuation techniques used to measure fair value. The hierarchy gives the highest priority to unadjusted quoted prices in active markets for identical assets or liabilities (Level 1 measurements) and the lowest priority to unobservable inputs (Level 3 measurements). The level in the fair value hierarchy within which the fair value measurement in its entirety falls shall be determined based on the lowest level input that is significant to the fair value measurement in its entirety. The levels used for classifying investments are not necessarily an indication of the risk associated with investing in these investments. The three levels of the fair value hierarchy are described below:
Level 1 — Unadjusted quoted prices in active markets that are accessible at the measurement date for identical, unrestricted assets or liabilities;
Level 2 — Quoted prices in markets that are not active or financial instruments for which significant inputs are observable (including, but not limited to, quoted prices for similar investments, interest rates, foreign exchange rates, volatility and credit spreads), either directly or indirectly;
Level 3 — Prices or valuations that require significant unobservable inputs (including GSAM’s assumptions in determining fair value measurement).
The Board of Trustees (“Trustees”) has approved Valuation Procedures that govern the valuation of the portfolio investments held by the Fund, including investments for which market quotations are not readily available. The Trustees have delegated to GSAM day-to-day responsibility for implementing and maintaining internal controls and procedures related to the valuation of the Fund’s investments. To assess the continuing appropriateness of pricing sources and methodologies, GSAM regularly performs price verification procedures and issues challenges as necessary to third party pricing vendors or brokers, and any differences are reviewed in accordance with the Valuation Procedures.
A. Level 1 and Level 2 Fair Value Investments — The valuation techniques and significant inputs used in determining the fair values for investments classified as Level 1 and Level 2 are as follows:
Equity Securities — Equity securities traded on a U.S. securities exchange or the NASDAQ system, or those located on certain foreign exchanges, including but not limited to the Americas, are valued daily at their last sale price or official closing price on the principal exchange or system on which they are traded. If there is no sale or official closing price or such price is believed by GSAM to not represent fair value, equity securities will be valued at the valid closing bid price for long positions and at the valid closing ask price for short positions (i.e. where there is sufficient volume, during normal exchange trading hours). If no valid bid/ask price is available, the equity security will be valued pursuant to the Valuation Procedures approved by the Trustees and consistent with applicable regulatory guidance. To the extent these investments are actively traded, they are classified as Level 1 of the fair value hierarchy, otherwise they are generally classified as Level 2. Certain equity securities containing unique attributes may be classified as Level 2.
Unlisted equity securities for which market quotations are available are valued at the last sale price on the valuation date, or if no sale occurs, at the last bid price for long positions or the last ask price for short positions, and are generally classified as Level 2.
Securities traded on certain foreign securities exchanges are valued daily at fair value determined by an independent fair value service (if available) under Fair Valuation Procedures approved by the Trustees and consistent with applicable regulatory guidance. The independent fair value service takes into account multiple factors including, but not limited to, movements in the securities markets, certain depositary receipts, futures contracts and foreign currency exchange rates that have occurred subsequent to the close of the foreign securities exchange. These investments are generally classified as Level 2 of the fair value hierarchy.
Money Market Funds — Investments in the Goldman Sachs Financial Square Government Fund (“Underlying Fund”) are valued at the NAV per share of the Institutional Share class on the day of valuation. These investments are generally classified as Level 1 of the fair value hierarchy. For information regarding the Underlying Fund’s accounting policies and investment holdings, please see the Underlying Fund’s shareholder report.
16
GOLDMAN SACHS VARIABLE INSURANCE TRUST U.S. EQUITY INSIGHTS FUND
3. INVESTMENTS AND FAIR VALUE MEASUREMENTS (continued)
B. Level 3 Fair Value Investments — To the extent that significant inputs to valuation models and other alternative pricing sources are unobservable, or if quotations are not readily available, or if GSAM believes that such quotations do not accurately reflect fair value, the fair value of the Fund’s investments may be determined under Valuation Procedures approved by the Trustees. GSAM, consistent with its procedures and applicable regulatory guidance, may make an adjustment to the most recent valuation prices of either domestic or foreign securities in light of significant events to reflect what it believes to be the fair value of the securities at the time of determining the Fund’s NAV. To the extent investments are valued using single source broker quotations obtained directly from the broker or passed through from third party pricing vendors, such investments are classified as Level 3 investments.
C. Fair Value Hierarchy — The following is a summary of the Fund’s investments classified in the fair value hierarchy as of December 31, 2020:
| | | | | | | | | | | | |
| Investment Type | | Level 1 | | | Level 2 | | | Level 3 | |
| | | |
| Assets | | | | | | | | | | | | |
| Common Stock and/or Other Equity Investments(a) | | | | | | | | | | | | |
Europe | | $ | 2,923,134 | | | $ | — | | | $ | — | |
North America | | | 317,382,056 | | | | — | | | | — | |
| | | |
| Total | | $ | 320,305,190 | | | $ | — | | | $ | — | |
| (a) | Amounts are disclosed by continent to highlight the impact of time zone differences between local market close and the calculation of NAV. Security valuations are based on the principal exchange or system on which they are traded, which may differ from country of domicile. |
For further information regarding security characteristics, see the Schedule of Investments.
4. AGREEMENTS AND AFFILIATED TRANSACTIONS
A. Management Agreement — Under the Agreement, GSAM manages the Fund, subject to the general supervision of the Trustees.
As compensation for the services rendered pursuant to the Agreement, the assumption of the expenses related thereto and administration of the Fund’s business affairs, including providing facilities, GSAM is entitled to a management fee, accrued daily and paid monthly, equal to an annual percentage rate of the Fund’s average daily net assets.
For the fiscal year ended December 31, 2020, contractual and effective net management fees with GSAM were at the following rates:
| | | | | | | | | | | | | | | | | | | | | | | | | | |
| Contractual Management Rate | | | | | | Effective Net
Management Rate^ | |
First
$1 billion | | | Next
$1 billion | | | Next
$3 billion | | | Next
$3 billion | | | Over
$8 billion | | | Effective
Rate | |
| | 0.62 | % | | | 0.59 | % | | | 0.56 | % | | | 0.55 | % | | | 0.54 | % | | | 0.62 | % | | | 0.54 | %* |
| ^ | Effective Net Management Rate includes the impact of management fee waivers of affiliated Underlying Funds, if any. |
| * | GSAM agreed to waive a portion of its management fee in order to achieve a net management rate, as defined in the Fund’s most recent prospectus. This waiver will be effective through at least April 29, 2021, and prior to such date GSAM may not terminate the arrangement without approval of the Trustees. For the fiscal year ended December 31, 2020, GSAM waived $236,281 of its management fee. |
The Fund invests in Institutional Shares of the Goldman Sachs Financial Square Government Fund, which is an affiliated Underlying Fund. GSAM has agreed to waive a portion of its management fee payable by the Fund in an amount equal to the management fee it earns as an investment adviser to the affiliated Underlying Fund in which the Fund invests, except those management fees it earns from the Fund’s investments of cash collateral received in connection with securities lending transactions in the Goldman Sachs Financial Square Government Fund. For the fiscal year ended December 31, 2020, GSAM waived $17 of the Fund’s management fee.
17
GOLDMAN SACHS VARIABLE INSURANCE TRUST U.S. EQUITY INSIGHTS FUND
Notes to Financial Statements (continued)
December 31, 2020
4. AGREEMENTS AND AFFILIATED TRANSACTIONS (continued)
B. Distribution and Service (12b-1) Plan — The Trust, on behalf of Service Shares of the Fund, has adopted a Distribution and Service Plan subject to Rule 12b-1 under the Act. Under the Distribution and Service Plan, Goldman Sachs, which serves as distributor, is entitled to a fee accrued daily and paid monthly, for distribution services and personal and account maintenance services, which may then be paid by Goldman Sachs to authorized dealers, equal to, on an annual basis, 0.25% of the Fund’s average daily net assets attributable to Service Shares. Goldman Sachs has agreed to waive distribution and service fees so as not to exceed an annual rate of 0.21% of average daily net assets attributable to Service Shares. This distribution and service fee waiver will remain in place through at least April 29, 2021, and prior to such date Goldman Sachs may not terminate the arrangement without the approval of the Trustees. For the fiscal year ended December 31, 2020, Goldman Sachs waived $20,555 in distribution and service fees for the Fund’s Service Shares.
C. Transfer Agency Agreement — Goldman Sachs also serves as the transfer agent of the Fund for a fee pursuant to the Transfer Agency Agreement. The fees charged for such transfer agency services are accrued daily and paid monthly at an annual rate of 0.02% of the average daily net assets of Institutional and Service Shares.
D. Other Expense Agreements and Affiliated Transactions — GSAM has agreed to reduce or limit certain “Other Expenses” of the Fund (excluding acquired fund fees and expenses, transfer agency fees and expenses, service fees and shareholder administration fees (as applicable), taxes, interest, brokerage fees, expenses of shareholder meetings, litigation and indemnification, and extraordinary expenses) to the extent such expenses exceed, on an annual basis, a percentage rate of the average daily net assets of the Fund. Such Other Expense reimbursements, if any, are accrued daily and paid monthly. In addition, the Fund is not obligated to reimburse GSAM for prior fiscal year expense reimbursements, if any. The Other Expense limitation as an annual percentage rate of average daily net assets for the Fund is 0.004%. The Other Expense limitation will remain in place through at least April 29, 2021, and prior to such date GSAM may not terminate the arrangement without the approval of the Trustees. In addition, the Fund has entered into certain offset arrangements with the custodian and the transfer agent, which may result in a reduction of the Fund’s expenses and are received irrespective of the application of the “Other Expense” limitation described above.
For the fiscal year ended December 31, 2020, these expense reductions, including any fee waivers and Other Expense reimbursements, were as follows:
| | | | | | | | | | | | | | | | | | |
Management
Fee Waiver | | | Distribution
and Service
Fee Waiver | | | Custody
Fee
Credits | | | Other Expense
Reimbursement | | | Total
Expense
Reductions | |
| | | | |
| | $236,298 | | | $ | 20,555 | | | $ | 5,524 | | | $ | 316,905 | | | $ | 579,282 | |
E. Line of Credit Facility — As of December 31, 2020, the Fund participated in a $700,000,000 committed, unsecured revolving line of credit facility (the “facility”) together with other funds of the Trust and certain registered investment companies having management agreements with GSAM or its affiliates. This facility is to be used for temporary emergency purposes, or to allow for an orderly liquidation of securities to meet redemption requests. The interest rate on borrowings is based on the federal funds rate. The facility also requires a fee to be paid by the Fund based on the amount of the commitment that has not been utilized. For the fiscal year ended December 31, 2020, the Fund did not have any borrowings under the facility. Prior to April 28, 2020, the facility was $580,000,000.
F. Other Transactions with Affiliates — The following table provides information about the Fund’s investments in the Goldman Sachs Financial Square Government Fund as of and for the fiscal year ended December 31, 2020:
| | | | | | | | | | | | | | | | | | | | | | |
Beginning
Value as of
December 31, 2019 | | | Purchases
at Cost | | | Proceeds
from Sales | | | Ending
Value as of
December 31, 2020 | | | Shares as of
December 31, 2020 | | | Dividend Income
from Affiliated
Investment Company | |
| | | | | |
| | $— | | | $ | 969,969 | | | $ | (969,969 | ) | | $ | — | | | | — | | | $ | 3 | |
18
GOLDMAN SACHS VARIABLE INSURANCE TRUST U.S. EQUITY INSIGHTS FUND
5. PORTFOLIO SECURITIES TRANSACTIONS
The cost of purchases and proceeds from sales and maturities of long-term securities for the fiscal year ended December 31, 2020, were $593,303,794 and $629,252,806, respectively.
6. SECURITIES LENDING
Pursuant to exemptive relief granted by the Securities and Exchange Commission (“SEC”) and the terms and conditions contained therein, the Fund may lend its securities through a securities lending agent, Goldman Sachs Agency Lending (“GSAL”), a wholly-owned subsidiary of Goldman Sachs, to certain qualified borrowers including Goldman Sachs and affiliates. In accordance with the Fund’s securities lending procedures, the Fund receives cash collateral at least equal to the market value of the securities on loan. The market value of the loaned securities is determined at the close of business of the Fund, at their last sale price or official closing price on the principal exchange or system on which they are traded, and any additional required collateral is delivered to the Fund on the next business day. As with other extensions of credit, the Fund may experience delay in the recovery of its securities or incur a loss should the borrower of the securities breach its agreement with the Fund or become insolvent at a time when the collateral is insufficient to cover the cost of repurchasing securities on loan. Dividend income received from securities on loan may not be subject to withholding taxes and therefore withholding taxes paid may differ from the amounts listed in the Statement of Operations. Loans of securities are terminable at any time and as such 1) the remaining contractual maturities of the outstanding securities lending transactions are considered to be overnight and continuous and 2) the borrower, after notice, is required to return borrowed securities within the standard time period for settlement of securities transactions.
The Fund invests the cash collateral received in connection with securities lending transactions in the Goldman Sachs Financial Square Government Fund (“Government Money Market Fund”), an affiliated series of the Goldman Sachs Trust. The Government Money Market Fund is registered under the Act as an open end investment company, is subject to Rule 2a-7 under the Act, and is managed by GSAM, for which GSAM may receive a management fee of up to 0.16% on an annualized basis of the average daily net assets of the Government Money Market Fund.
In the event of a default by a borrower with respect to any loan, GSAL will exercise any and all remedies provided under the applicable borrower agreement to make the Fund whole. These remedies include purchasing replacement securities by applying the collateral held from the defaulting broker against the purchase cost of the replacement securities. If GSAL is unable to purchase replacement securities, GSAL will indemnify the Fund by paying the Fund an amount equal to the market value of the securities loaned minus the value of cash collateral received from the borrower for the loan, subject to an exclusion for any shortfalls resulting from a loss of value in such cash collateral due to reinvestment risk. The Fund’s master netting agreements with certain borrowers provide the right, in the event of a default (including bankruptcy or insolvency), for the non-defaulting party to liquidate the collateral and calculate net exposure to the defaulting party or request additional collateral. However, in the event of a default by a borrower, a resolution authority could determine that such rights are not enforceable due to the restrictions or prohibitions against the right of set-off that may be imposed in accordance with a particular jurisdiction’s bankruptcy or insolvency laws. The Fund’s loaned securities were all subject to enforceable Securities Lending Agreements and the value of the collateral was at least equal to the value of the cash received. The amounts of the Fund’s overnight and continuous agreements, which represent the gross amounts of recognized liabilities for securities lending transactions outstanding as of December 31, 2020, are disclosed as “Payable upon return of securities loaned” on the Statement of Assets and Liabilities, where applicable. The Fund did not have securities on loan as of December 31, 2020.
Both the Fund and GSAL received compensation relating to the lending of the Fund’s securities. The amounts earned, if any, by the Fund for the fiscal year ended December 31, 2020, are reported under Investment Income on the Statement of Operations.
19
GOLDMAN SACHS VARIABLE INSURANCE TRUST U.S. EQUITY INSIGHTS FUND
Notes to Financial Statements (continued)
December 31, 2020
6. SECURITIES LENDING (continued)
The table below details securities lending activity with affiliates of Goldman Sachs:
| | | | | | | | |
| For the Fiscal Year ended December 31, 2020 | | | Amount Payable to
Goldman Sachs
Upon Return of
Securities Loaned as of
December 31, 2020 | |
Earnings of GSAL
Relating to
Securities
Loaned | | Amount Received
by the Fund from
Lending to
Goldman Sachs | |
| $155 | | $ | 1,364 | | | $ | — | |
The following table provides information about the Fund’s investment in the Government Money Market Fund for the fiscal year ended December 31, 2020:
| | | | | | | | | | | | | | |
Beginning
Value as of
December 31, 2019 | | | Purchases
at Cost | | | Proceeds
from Sales | | | Ending
Value as of
December 31, 2020 | |
| | | |
| $ | — | | | $ | 513,975 | | | $ | (513,975 | ) | | $ | — | |
7. TAX INFORMATION
The tax character of distributions paid during the fiscal years ended December 31, 2019 and December 31, 2020 was as follows:
| | | | | | | | |
| | | 2019 | | | 2020 | |
Distributions paid from: | | | | | | | | |
Ordinary income | | $ | 3,670,173 | | | $ | 2,652,858 | |
Net long-term capital gains | | | 10,911,445 | | | | 12,398,395 | |
| Total taxable distributions | | $ | 14,581,618 | | | $ | 15,051,253 | |
As of December 31, 2020, the components of accumulated earnings (losses) on a tax-basis were as follows:
| | | | |
Undistributed ordinary income — net | | $ | 4,947,630 | |
| Undistributed long-term capital gains | | | 3,798,063 | |
| Total undistributed earnings | | $ | 8,745,693 | |
| Timing differences (Real Estate Investment Trusts) | | | 37,855 | |
| Unrealized gains — net | | | 84,905,457 | |
| Total accumulated earnings — net | | $ | 93,689,005 | |
As of December 31, 2020, the Fund’s aggregate security unrealized gains and losses based on cost for U.S. federal income tax purposes were as follows:
| | | | |
| Tax cost | | $ | 235,399,733 | |
| Gross unrealized gain | | | 86,607,410 | |
| Gross unrealized loss | | | (1,701,953 | ) |
| Net unrealized gain | | $ | 84,905,457 | |
20
GOLDMAN SACHS VARIABLE INSURANCE TRUST U.S. EQUITY INSIGHTS FUND
7. TAX INFORMATION (continued)
The difference between GAAP-basis and tax-basis unrealized gains (losses) is attributable primarily to wash sales.
GSAM has reviewed the Fund’s tax positions for all open tax years (the current and prior three years, as applicable) and has concluded that no provision for income tax is required in the Fund’s financial statements. Such open tax years remain subject to examination and adjustment by tax authorities.
8. OTHER RISKS
The Fund’s risks include, but are not limited to, the following:
Investments in Other Investment Companies Risk — As a shareholder of another investment company, the Fund will indirectly bear its proportionate share of any net management fees and other expenses paid by such other investment companies, in addition to the fees and expenses regularly borne by the Fund.
Large Shareholder Transactions Risk — The Fund may experience adverse effects when certain large shareholders, such as other funds, participating insurance companies, accounts and Goldman Sachs affiliates, purchase or redeem large amounts of shares of the Fund. Such large shareholder redemptions, which may occur rapidly or unexpectedly, may cause the Fund to sell portfolio securities at times when it would not otherwise do so, which may negatively impact the Fund’s NAV and liquidity. These transactions may also accelerate the realization of taxable income to shareholders if such sales of investments resulted in gains, and may also increase transaction costs. In addition, a large redemption could result in the Fund’s current expenses being allocated over a smaller asset base, leading to an increase in the Fund’s expense ratio. Similarly, large Fund share purchases may adversely affect the Fund’s performance to the extent that the Fund is delayed in investing new cash or otherwise maintains a larger cash position than it ordinarily would.
Liquidity Risk — The Fund may make investments that are illiquid or that may become less liquid in response to market developments or adverse investor perceptions. Illiquid investments may be more difficult to value. Liquidity risk may also refer to the risk that the Fund will not be able to pay redemption proceeds within the allowable time period or without significant dilution to remaining investors’ interests because of unusual market conditions, an unusually high volume of redemption requests, or other reasons. To meet redemption requests, the Fund may be forced to sell investments at an unfavorable time and/or under unfavorable conditions. If the Fund is forced to sell securities at an unfavorable time and/or under unfavorable conditions, such sales may adversely affect the Fund’s NAV and dilute remaining investors’ interests. Redemptions by large shareholders may have a negative impact on the Fund’s liquidity.
Market and Credit Risks — In the normal course of business, the Fund trades financial instruments and enters into financial transactions where risk of potential loss exists due to changes in the market (market risk). The value of the securities in which the Fund invests may go up or down in response to the prospects of individual companies, particular sectors or governments and/or general economic conditions throughout the world due to increasingly interconnected global economies and financial markets. Events such as war, acts of terrorism, social unrest, natural disasters, the spread of infectious illness or other public health threats could also significantly impact the Fund and its investments. Additionally, the Fund may also be exposed to credit risk in the event that an issuer or guarantor fails to perform or that an institution or entity with which the Fund has unsettled or open transactions defaults.
21
GOLDMAN SACHS VARIABLE INSURANCE TRUST U.S. EQUITY INSIGHTS FUND
Notes to Financial Statements (continued)
December 31, 2020
9. INDEMNIFICATIONS
Under the Trust’s organizational documents, its Trustees, officers, employees and agents are indemnified, to the extent permitted by the Act and state law, against certain liabilities that may arise out of performance of their duties to the Fund. Additionally, in the course of business, the Fund enters into contracts that contain a variety of indemnification clauses. The Fund’s maximum exposure under these arrangements is unknown, as this would involve future claims that may be made against the Fund that have not yet occurred. However, GSAM believes the risk of loss under these arrangements to be remote.
10. OTHER MATTERS
On October 22, 2020, Goldman Sachs announced a settlement of matters involving 1Malaysia Development Bhd. (1MDB), a Malaysian sovereign wealth fund, with the United States Department of Justice as well as criminal and civil authorities in the UK, Singapore and Hong Kong. Further information regarding the 1MDB settlement can be found at https://www.goldmansachs.com/media-relations/press-releases/current/goldman-sachs-2020-10-22.html. The 1MDB settlement will not materially adversely affect GSAM’s ability to serve as investment manager.
11. SUBSEQUENT EVENTS
Subsequent events after the Statement of Assets and Liabilities date have been evaluated, and GSAM has concluded that there is no impact requiring adjustment or disclosure in the financial statements.
12. SUMMARY OF SHARE TRANSACTIONS
Share activity is as follows:
| | | | | | | | | | | | | | | | |
| | | For the Fiscal Year Ended
December 31, 2020 | | | For the Fiscal Year Ended
December 31, 2019 | |
| | | Shares | | | Dollars | | | Shares | | | Dollars | |
| Institutional Shares | | | | | | | | | | | | | | | | |
| Shares sold | | | 635,655 | | | $ | 11,594,488 | | | | 441,372 | | | $ | 7,774,633 | |
| Reinvestment of distributions | | | 632,341 | | | | 12,570,928 | | | | 681,626 | | | | 12,098,854 | |
| Shares redeemed | | | (2,268,793 | ) | | | (41,014,558 | ) | | | (2,468,062 | ) | | | (42,483,665 | ) |
| | | | (1,000,797 | ) | | | (16,849,142 | ) | | | (1,345,064 | ) | | | (22,610,178 | ) |
| Service Shares | | | | | | | | | | | | | | | | |
| Shares sold | | | 116,235 | | | | 2,117,630 | | | | 228,384 | | | | 3,875,360 | |
| Reinvestment of distributions | | | 123,954 | | | | 2,480,325 | | | | 139,012 | | | | 2,482,764 | |
| Shares redeemed | | | (619,902 | ) | | | (11,353,169 | ) | | | (827,588 | ) | | | (14,150,377 | ) |
| | | | (379,713 | ) | | | (6,755,214 | ) | | | (460,192 | ) | | | (7,792,253 | ) |
| | | | |
| NET DECREASE | | | (1,380,510) | | | | $(23,604,356) | | | | (1,805,256 | ) | | | $(30,402,431) | |
22
Report of Independent Registered Public Accounting Firm
To the Board of Trustees of Goldman Sachs Variable Insurance Trust and Shareholders of Goldman Sachs U.S. Equity Insights Fund
Opinion on the Financial Statements
We have audited the accompanying statement of assets and liabilities, including the schedule of investments, of Goldman Sachs U.S. Equity Insights Fund (one of the funds constituting Goldman Sachs Variable Insurance Trust, referred to hereafter as the “Fund”) as of December 31, 2020, the related statement of operations for the year ended December 31, 2020, the statements of changes in net assets for each of the two years in the period ended December 31, 2020, including the related notes, and the financial highlights for each of the five years in the period ended December 31, 2020 (collectively referred to as the “financial statements”). In our opinion, the financial statements present fairly, in all material respects, the financial position of the Fund as of December 31, 2020, the results of its operations for the year then ended, the changes in its net assets for each of the two years in the period ended December 31, 2020 and the financial highlights for each of the five years in the period ended December 31, 2020 in conformity with accounting principles generally accepted in the United States of America.
Basis for Opinion
These financial statements are the responsibility of the Fund’s management. Our responsibility is to express an opinion on the Fund’s financial statements based on our audits. We are a public accounting firm registered with the Public Company Accounting Oversight Board (United States) (PCAOB) and are required to be independent with respect to the Fund in accordance with the U.S. federal securities laws and the applicable rules and regulations of the Securities and Exchange Commission and the PCAOB.
We conducted our audits of these financial statements in accordance with the standards of the PCAOB. Those standards require that we plan and perform the audit to obtain reasonable assurance about whether the financial statements are free of material misstatement, whether due to error or fraud.
Our audits included performing procedures to assess the risks of material misstatement of the financial statements, whether due to error or fraud, and performing procedures that respond to those risks. Such procedures included examining, on a test basis, evidence regarding the amounts and disclosures in the financial statements. Our audits also included evaluating the accounting principles used and significant estimates made by management, as well as evaluating the overall presentation of the financial statements. Our procedures included confirmation of securities owned as of December 31, 2020 by correspondence with the custodian, transfer agent and brokers. We believe that our audits provide a reasonable basis for our opinion.
/s/PricewaterhouseCoopers LLP
Boston, Massachusetts
February 17, 2021
We have served as the auditor of one or more investment companies in the Goldman Sachs fund complex since 2000.
23
GOLDMAN SACHS VARIABLE INSURANCE TRUST U.S. EQUITY INSIGHTS FUND
Voting Results of Special Meeting of Shareholders (Unaudited)
A Special Meeting (the “Meeting”) of the Goldman Sachs Variable Insurance Trust (“VIT”) was held on January 23, 2020 to consider and act upon the proposal below. The Fund has amortized its respective share of the proxy, shareholder meeting and other related costs and GSAM has agreed to reimburse the Fund to the extent such expenses exceed a specified percentage of the Fund’s net assets.
At the Meeting, Dwight L. Bush, Kathryn A. Cassidy, Joaquin Delgado and Gregory G. Weaver were elected to the Trust’s Board of Trustees. In electing trustees, the Trust’s shareholders voted as follows:
| | | | | | | | | | | | | | | | |
| | | | | |
Proposal 1. Election of Trustees | | For | | | Against | | | Withheld | | | Broker Non-Votes | |
| | | | | |
Dwight L. Bush | | | 745,493,677.130 | | | | 0 | | | | 17,848,840.639 | | | | 0 | |
| | | | | |
Kathryn A. Cassidy | | | 746,559,784.810 | | | | 0 | | | | 16,782,732.959 | | | | 0 | |
| | | | | |
Joaquin Delgado | | | 744,593,456.532 | | | | 0 | | | | 18,749,061.237 | | | | 0 | |
| | | | | |
Gregory G. Weaver | | | 746,707,039.321 | | | | 0 | | | | 16,635,478.448 | | | | 0 | |
24
GOLDMAN SACHS VARIABLE INSURANCE TRUST U.S. EQUITY INSIGHTS FUND
| | |
| Fund Expenses — Six Month Period Ended December 31, 2020 (Unaudited) | | |
As a shareholder of Institutional or Service Shares of the Fund, you incur ongoing costs, including management fees, distribution and/or service (12b-1) fees (with respect to Service Shares) and other Fund expenses. This example is intended to help you understand your ongoing costs (in dollars) of investing in Institutional Shares and Service Shares of the Fund and to compare these costs with the ongoing costs of investing in other mutual funds.
The example is based on an investment of $1,000 invested at the beginning of the period and held for the entire period from July 1, 2020 through December 31, 2020, which represents a period of 184 days of a 366 day year.
Actual Expenses — The first line under each share class in the table below provides information about actual account values and actual expenses. You may use the information in this line, together with the amount you invested, to estimate the expenses that you paid over the period. Simply divide your account value by $1,000 (for example, an $8,600 account value divided by $1,000=8.6), then multiply the result by the number in the first line under the heading entitled “Expenses Paid” to estimate the expenses you paid on your account during this period.
Hypothetical Example for Comparison Purposes — The second line under each share class in the table below provides information about hypothetical account values and hypothetical expenses based on the Fund’s actual net expense ratio and an assumed rate of return of 5% per year before expenses, which is not the Fund’s actual return. The hypothetical account values and expenses may not be used to estimate the actual ending account balance or expenses you paid for the period. You may use this information to compare the ongoing costs of investing in the Fund and other funds. To do so, compare this 5% hypothetical example with the 5% hypothetical examples that appear in the shareholder reports of the other funds.
Please note that the expenses shown in the table are meant to highlight your ongoing costs only. As a shareholder of the Fund you do not incur any transaction costs, such as sales charges, redemption fees, or exchange fees, but shareholders of other funds may incur such costs. The second line of the table is useful in comparing ongoing costs only and will not help you determine the relative total costs of owning different funds whose shareholders may incur transaction costs.
| | | | | | | | | | | | |
| Share Class | | Beginning
Account Value
07/01/20 | | | Ending
Account Value
12/31/20 | | | Expenses
Paid for the
6 Months
Ended
12/31/20* | |
| Institutional | | | | | | | | | | | | |
| | | | |
| Actual | | $ | 1,000 | | | $ | 1,192.80 | | | $ | 3.09 | |
| Hypothetical 5% return | | | 1,000 | | | | 1,022.32 | + | | | 2.85 | |
| Service | | | | | | | | | | | | |
| | | | |
| Actual | | | 1,000 | | | | 1,191.70 | | | | 4.24 | |
| Hypothetical 5% return | | | 1,000 | | | | 1,021.27 | + | | | 3.91 | |
| | + | Hypothetical expenses are based on the Fund’s actual annualized net expense ratios and an assumed rate of return of 5% per year before expenses. | |
| | * | Expenses are calculated using the Fund’s annualized net expense ratio for each class, which represents the ongoing expenses as a percentage of net assets for the six months ended December 31, 2020. Expenses are calculated by multiplying the annualized net expense ratio by the average account value for the period; then multiplying the result by the number of days in the most recent fiscal half year; and then dividing that result by the number of days in the fiscal year. The annualized net expense ratios for the period were 0.56% and 0.77% for Institutional and Service Shares, respectively. | |
25
GOLDMAN SACHS VARIABLE INSURANCE TRUST U.S. EQUITY INSIGHTS FUND
Trustees and Officers (Unaudited)
Independent Trustees
| | | | | | | | | | | | |
| | | | | |
Name,
Address and Age1 | | Position(s) Held
with the Trust | | Term of Office and
Length of
Time Served2 | | Principal Occupation(s) During Past 5 Years | | Number of
Portfolios in
Fund Complex
Overseen by
Trustee3 | | | Other Directorships Held by Trustee4 |
Jessica Palmer Age: 71 | | Chair of the Board of Trustees | | Since 2018 (Trustee since 2007) | | Ms. Palmer is retired. She was formerly Consultant, Citigroup Human Resources Department (2007-2008); Managing Director, Citigroup Corporate and Investment Banking (previously, Salomon Smith Barney/Salomon Brothers) (1984-2006). Ms. Palmer was a Member of the Board of Trustees of Indian Mountain School (private elementary and secondary school) (2004-2009). Chair of the Board of Trustees — Goldman Sachs Variable Insurance Trust and Goldman Sachs Trust. | | | 105 | | | None |
Dwight L. Bush Age: 63 | | Trustee | | Since 2020 | | Ambassador Bush is President and CEO of D.L. Bush & Associates (a financial advisory and private investment firm) (2002-2014 and 2017-present); and was formerly U.S. Ambassador to the Kingdom of Morocco (2014-2017) and a Member of the Board of Directors of Santander Bank, N.A. (2018-2019). Previously, Ambassador Bush served as an Advisory Board Member of Goldman Sachs Trust and Goldman Sachs Variable Insurance Trust (October 2019-January 2020). Trustee — Goldman Sachs Variable Insurance Trust and Goldman Sachs Trust. | | | 105 | | | None |
Kathryn A. Cassidy Age: 66 | | Trustee | | Since 2015 | | Ms. Cassidy is retired. Formerly, she was Advisor to the Chairman (May 2014-December 2014); and Senior Vice President and Treasurer (2008-2014), General Electric Company & General Electric Capital Corporation (technology and financial services companies). Trustee — Goldman Sachs Variable Insurance Trust and Goldman Sachs Trust. | | | 105 | | | None |
Diana M. Daniels Age: 71 | | Trustee | | Since 2007 | | Ms. Daniels is retired. Formerly, she was Vice President, General Counsel and Secretary, The Washington Post Company (1991-2006). Ms. Daniels is a Trustee Emeritus and serves as a Presidential Councillor of Cornell University (2013-Present); former Member of the Legal Advisory Board, New York Stock Exchange (2003-2006) and of the Corporate Advisory Board, Standish Mellon Management Advisors (2006-2007). Trustee — Goldman Sachs Variable Insurance Trust and Goldman Sachs Trust. | | | 105 | | | None |
Joaquin Delgado Age: 60 | | Trustee | | Since 2020 | | Dr. Delgado is retired. He is Director, Hexion Inc. (a specialty chemical manufacturer) (2019-present); and Director, Stepan Company (a specialty chemical manufacturer) (2011-present); and was formerly Executive Vice President, Consumer Business Group of 3M Company (July 2016-July 2019); and Executive Vice President, Health Care Business Group of 3M Company (October 2012-July 2016). Previously, Dr. Delgado served as an Advisory Board Member of Goldman Sachs Trust and Goldman Sachs Variable Insurance Trust (October 2019-January 2020). Trustee — Goldman Sachs Variable Insurance Trust and Goldman Sachs Trust. | | | 105 | | | Stepan Company (a specialty chemical manufacturer) |
| | | | | | | | | | | | |
26
GOLDMAN SACHS VARIABLE INSURANCE TRUST U.S. EQUITY INSIGHTS FUND
Trustees and Officers (Unaudited) (continued)
Independent Trustees
| | | | | | | | | | | | |
Name,
Address and Age1 | | Position(s) Held
with the Trust | | Term of Office and
Length of
Time Served2 | | Principal Occupation(s) During Past 5 Years | | Number of
Portfolios in
Fund Complex
Overseen by
Trustee3 | | | Other Directorships Held by Trustee4 |
Roy W. Templin Age: 60 | | Trustee | | Since 2013 | | Mr. Templin is retired. He is Director, Armstrong World Industries, Inc. (a designer and manufacturer of ceiling, wall and suspension system solutions) (2016-Present); and was formerly Chairman of the Board of Directors, Con-Way Incorporated (a transportation, logistics and supply chain management service company) (2014-2015); Executive Vice President and Chief Financial Officer, Whirlpool Corporation (an appliance manufacturer and marketer) (2004-2012). Trustee — Goldman Sachs Variable Insurance Trust and Goldman Sachs Trust. | | | 105 | | | Armstrong World Industries, Inc. (a ceiling, wall and suspension systems solutions manufacturer) |
Gregory G. Weaver Age: 69 | | Trustee | | Since 2015 | | Mr. Weaver is retired. He is Director, Verizon Communications Inc. (2015-Present); and was formerly Chairman and Chief Executive Officer, Deloitte & Touche LLP (a professional services firm) (2001-2005 and 2012-2014); and Member of the Board of Directors, Deloitte & Touche LLP (2006-2012). Trustee — Goldman Sachs Variable Insurance Trust and Goldman Sachs Trust. | | | 105 | | | Verizon Communications Inc. |
27
GOLDMAN SACHS VARIABLE INSURANCE TRUST U.S. EQUITY INSIGHTS FUND
Trustees and Officers (Unaudited) (continued)
Interested Trustee*
| | | | | | | | | | | | |
Name,
Address and Age1 | | Position(s) Held
with the Trust | | Term of Office and
Length of
Time Served2 | | Principal Occupation(s) During Past 5 Years | | Number of
Portfolios in
Fund Complex
Overseen by
Trustee3 | | | Other Directorships Held by Trustee4 |
James A. McNamara Age: 58 | | Trustee and President | | Since 2007 | | Advisory Director, Goldman Sachs (January 2018-Present); Managing Director, Goldman Sachs (January 2000-December 2017); Director of Institutional Fund Sales, GSAM (April 1998-December 2000); and Senior Vice President and Manager, Dreyfus Institutional Service Corporation (January 1993-April 1998). President and Trustee — Goldman Sachs Variable Insurance Trust; Goldman Sachs Trust; Goldman Sachs Trust II; Goldman Sachs MLP and Energy Renaissance Fund; Goldman Sachs ETF Trust; Goldman Sachs Credit Income Fund; and Goldman Sachs Real Estate Diversified Income Fund. | | | 158 | | | None |
| | | | | | | | | | | | |
| * | Mr. McNamara is considered to be an “Interested Trustee” because he holds positions with Goldman Sachs and owns securities issued by The Goldman Sachs Group, Inc. Mr. McNamara holds comparable positions with certain other companies of which Goldman Sachs, GSAM or an affiliate thereof is the investment adviser, administrator and/or distributor. |
| 1 | Each Trustee may be contacted by writing to the Trustee, c/o Goldman Sachs, 200 West Street, New York, New York, 10282, Attn: Caroline Kraus. Information is provided as of December 31, 2020. |
| 2 | Subject to such policies as may be adopted by the Board from time-to-time, each Trustee holds office for an indefinite term, until the earliest of: (a) the election of his or her successor; (b) the date the Trustee resigns or is removed by the Board or shareholders, in accordance with the Trust’s Declaration of Trust; or (c) the termination of the Trust. The Board has adopted policies which provide that each Independent Trustee shall retire as of December 31st of the calendar year in which he or she reaches (a) his or her 75th birthday or (b) the 15th anniversary of the date he or she became a Trustee, whichever is earlier, unless a waiver of such requirements shall have been adopted by a majority of the other Trustees. These policies may be changed by the Trustees without shareholder vote. |
| 3 | The Goldman Sachs Fund Complex includes certain other companies listed above for each respective Trustee. As of December 31, 2020, Goldman Sachs Variable Insurance Trust consisted of 13 portfolios; Goldman Sachs Trust consisted of 92 portfolios (90 of which offered shares to the public); Goldman Sachs Trust II consisted of 19 portfolios (17 of which offered shares to the public); Goldman Sachs ETF Trust consisted of 31 portfolios (20 of which offered shares to the public); and Goldman Sachs MLP and Energy Renaissance Fund, Goldman Sachs Credit Income Fund and Goldman Sachs Real Estate Diversified Income Fund each consisted of one portfolio. Goldman Sachs Credit Income Fund did not offer shares to the public. |
| 4 | This column includes only directorships of companies required to report to the Securities and Exchange Commission under the Securities Exchange Act of 1934 (i.e., “public companies”) or other investment companies registered under the Act. |
Additional information about the Trustees is available in the Fund’s Statement of Additional Information, which can be obtained from Goldman Sachs free of charge by calling this toll-free number (in the United States of America): 1-800-526-7384.
28
GOLDMAN SACHS VARIABLE INSURANCE TRUST U.S. EQUITY INSIGHTS FUND
Trustees and Officers (Unaudited) (continued)
Officers of the Trust*
| | | | | | |
| | | |
| Name, Address and Age1 | | Position(s) Held with the Trust | | Term of
Office and
Length of
Time Served2 | | Principal Occupation(s) During Past 5 Years |
James A. McNamara
200 West Street New York, NY 10282 Age: 58 | | Trustee and
President | | Since 2007 | | Advisory Director, Goldman Sachs (January 2018-Present); Managing Director, Goldman Sachs (January 2000-December 2017); Director of Institutional Fund Sales, GSAM (April 1998-December 2000); and Senior Vice President and Manager, Dreyfus Institutional Service Corporation (January 1993-April 1998). President and Trustee — Goldman Sachs Variable Insurance Trust; Goldman Sachs Trust; Goldman Sachs Trust II; Goldman Sachs MLP and Energy Renaissance Fund; Goldman Sachs ETF Trust; Goldman Sachs Credit Income Fund; and Goldman Sachs Real Estate Diversified Income Fund. |
Caroline L. Kraus
200 West Street New York, NY 10282 Age: 43 | | Secretary | | Since 2012 | | Managing Director, Goldman Sachs (January 2016-Present); Vice President, Goldman Sachs (August 2006-December 2015); Senior Counsel, Goldman Sachs (January 2020-Present); Associate General Counsel, Goldman Sachs (2012-December 2019); Assistant General Counsel, Goldman Sachs (August 2006-December 2011); and Associate, Weil, Gotshal & Manges, LLP (2002-2006). Secretary — Goldman Sachs Variable Insurance Trust (previously Assistant Secretary (2012)); Goldman Sachs Trust (previously Assistant Secretary (2012)); Goldman Sachs Trust II; Goldman Sachs BDC, Inc.; Goldman Sachs Private Middle Market Credit LLC; Goldman Sachs Private Middle Market Credit II LLC; Goldman Sachs Middle Market Lending Corp.; Goldman Sachs MLP and Energy Renaissance Fund; Goldman Sachs ETF Trust; Goldman Sachs Credit Income Fund; and Goldman Sachs Real Estate Diversified Income Fund. |
Joseph F. DiMaria
30 Hudson Street Jersey City, NJ 07302 Age: 52 | | Treasurer, Principal
Financial Officer
and Principal
Accounting Officer | | Since 2017
(Treasurer
and Principal
Financial
Officer
since 2019) | | Managing Director, Goldman Sachs (November 2015-Present) and Vice President — Mutual Fund Administration, Columbia Management Investment Advisers, LLC (May 2010-October 2015). Treasurer, Principal Financial Officer and Principal Accounting Officer — Goldman Sachs Variable Insurance Trust (previously Assistant Treasurer (2016)); Goldman Sachs Trust (previously Assistant Treasurer (2016)); Goldman Sachs Trust II (previously Assistant Treasurer (2017)); Goldman Sachs MLP and Energy Renaissance Fund (previously Assistant Treasurer (2017)); Goldman Sachs ETF Trust (previously Assistant Treasurer (2017)); Goldman Sachs Credit Income Fund; and Goldman Sachs Real Estate Diversified Income Fund. |
| * | Represents a partial list of officers of the Trust. Additional information about all the officers is available in the Fund’s Statement of Additional Information, which can be obtained from Goldman Sachs free of charge by calling this toll-free number (in the United States): 1-800-526-7384. |
| 1 | Information is provided as of December 31, 2020. |
| 2 | Officers hold office at the pleasure of the Board of Trustees or until their successors are duly elected and qualified. Each officer holds comparable positions with certain other companies of which Goldman Sachs, GSAM or an affiliate thereof is the investment adviser, administrator and/or distributor. |
Goldman Sachs Variable Insurance Trust — Tax Information (Unaudited)
For the year ended December 31, 2020, 58.37% of the dividends paid from net investment company taxable income by the U.S. Equity Insights Fund qualify for the dividends received deduction available to corporations.
Pursuant to Section 852 of the Internal Revenue Code, the U.S. Equity Insights Fund designates $12,398,395, or, if different, the maximum amount allowable, as capital gain dividends paid during the year ended December 31, 2020.
29
| | |
| TRUSTEES | | OFFICERS |
| Jessica Palmer, Chair | | James A. McNamara, President |
| Dwight L. Bush | | Joseph F. DiMaria, Principal Financial Officer, |
| Kathryn A. Cassidy | | Principal Accounting Officer and Treasurer |
| Diana M. Daniels | | Caroline L. Kraus, Secretary |
| Joaquin Delgado | | |
| James A. McNamara | | |
| Roy W. Templin | | |
| Gregory G. Weaver | | |
GOLDMAN SACHS & CO. LLC
Distributor and Transfer Agent
GOLDMAN SACHS ASSET MANAGEMENT, L.P.
Investment Adviser
200 West Street, New York
New York 10282
Visit our web site at www.GSAMFUNDS.com to obtain the most recent month-end returns.
The reports concerning the Fund included in this shareholder report may contain certain forward-looking statements about the factors that may affect the performance of the Fund in the future. These statements are based on Fund management’s predictions and expectations concerning certain future events and their expected impact on the Fund, such as performance of the economy as a whole and of specific industry sectors, changes in the levels of interest rates, the impact of developing world events, and other factors that may influence the future performance of the Fund. Management believes these forward-looking statements to be reasonable, although they are inherently uncertain and difficult to predict. Actual events may cause adjustments in portfolio management strategies from those currently expected to be employed.
A description of the policies and procedures that the Fund uses to determine how to vote proxies relating to portfolio securities and information regarding how the Fund voted proxies relating to portfolio securities for the 12-month period ended December 31 is available (i) without charge, upon request by calling 1-800-621-2550; and (ii) on the Securities and Exchange Commission (“SEC”) web site at http://www.sec.gov.
The Fund will file its portfolio holdings information for each month in a fiscal quarter within 60 days after the end of the relevant fiscal quarter on Form N-PORT. Portfolio holdings information for the third month of each fiscal quarter will be made available on the SEC’s web site at http://www.sec.gov. Portfolio holdings information may be obtained upon request and without charge by calling 1-800-526-7384 (for Retail Shareholders) or 1-800-621-2550 (for Institutional Shareholders).
Views and opinions expressed are for informational purposes only and do not constitute a recommendation by GSAM to buy, sell, or hold any security. Views and opinions are current as of the date of this presentation and may be subject to change, they should not be construed as investment advice.
Goldman Sachs & Co. LLC (“Goldman Sachs”) does not provide legal, tax or accounting advice. Any statement contained in this communication (including any attachments) concerning U.S. tax matters was not intended or written to be used, and cannot be used, for the purpose of avoiding penalties under the Internal Revenue Code, and was written to support the promotion or marketing of transaction or matter addressed. Clients of Goldman Sachs should obtain their own independent tax advice based on their particular circumstances.
The website links provided are for your convenience only and are not an endorsement or recommendation by GSAM of any of these websites or the products or services offered. GSAM is not responsible for the accuracy and validity of the content of these websites.
Fund holdings and allocations shown are as of December 31, 2020 and may not be representative of future investments. Fund holdings should not be relied on in making investment decisions and should not be construed as research or investment advice regarding particular securities. Current and future holdings are subject to risk.
References to indices, benchmarks or other measures of relative market performance over a specified period of time are provided for your information only and do not imply that the portfolio will achieve similar results. The index composition may not reflect the manner in which a portfolio is constructed. While an adviser seeks to design a portfolio which reflects appropriate risk and return features, portfolio characteristics may deviate from those of the benchmark.
The Global Industry Classification Standard (“GICS”) was developed by and is the exclusive property and a service mark of Morgan Stanley Capital International Inc. (“MSCI”) and Standard & Poor’s, a division of The McGraw-Hill Companies, Inc. (“S&P”) and is licensed for use by Goldman Sachs. Neither MSCI, S&P nor any other party involved in making or compiling the GICS or any GICS classifications makes any express or implied warranties or representations with respect to such standard or classification (or the results to be obtained by the use thereof), and all such parties hereby expressly disclaim all warranties of originality, accuracy, completeness, merchantability or fitness for a particular purpose with respect to any of such standard or classification. Without limiting any of the foregoing, in no event shall MSCI, S&P, any of their affiliates or any third party involved in making or compiling the GICS or any GICS classifications have any liability for any direct, indirect, special, punitive, consequential or any other damages (including lost profits) even if notified of the possibility of such damages.
The portfolio risk management process includes an effort to monitor and manage risk, but does not imply low risk.
Shares of the Goldman Sachs VIT Funds are offered to separate accounts of participating life insurance companies for the purpose of funding variable annuity contracts and variable life insurance policies. Shares of the Fund are not offered directly to the general public. The variable annuity contracts and variable life insurance policies are described in the separate prospectuses issued by participating insurance companies. You should refer to those prospectuses for information about surrender charges, mortality and expense risk fees and other charges that may be assessed by participating insurance companies under the variable annuity contracts or variable life insurance policies. Such fees or charges, if any, may affect the return you may realize with respect to your investments. Ask your representative for more complete information. Please consider a fund’s objectives, risks and charges and expenses, and read the prospectus carefully before investing. The prospectus contains this and other information about the Fund.
This material is not authorized for distribution to prospective investors unless preceded or accompanied by a current prospectus or summary prospectus, if applicable. Investors should consider the Fund’s objective, risks, and charges and expenses, and read the summary prospectus, if available, and/or the prospectus carefully before investing or sending money. The summary prospectus, if available, and the prospectus contain this and other information about the Fund and may be obtained from your authorized dealer or from Goldman Sachs & Co. LLC by calling 1-800-621-2550.
This report is prepared for the general information of contract owners and is not an offer of shares of the Goldman Sachs Variable Insurance Trust — Goldman Sachs U.S. Equity Insights Fund.
© 2021 Goldman Sachs. All rights reserved.
VITUSAR-21/229753-OTU-02/2021
| | (a) | As of the end of the period covered by this report, the registrant has adopted a code of ethics that applies to the registrant’s principal executive officer, principal financial officer, principal accounting officer or controller, or persons performing similar functions, regardless of whether these individuals are employed by the registrant or a third party (the “Code of Ethics”). |
| | (c) | During the period covered by this report, no amendments were made to the provisions of the Code of Ethics. |
| | (d) | During the period covered by this report, the registrant did not grant any waivers, including an implicit waiver, from any provision of the Code of Ethics. |
| | (f) | A copy of the Code of Ethics is available as provided in Item 13(a)(1) of this report. |
| ITEM 3. | AUDIT COMMITTEE FINANCIAL EXPERT. |
| | The registrant’s board of trustees has determined that the registrant has at least one “audit committee financial expert” (as defined in Item 3 of Form N-CSR) serving on its audit committee. Gregory G. Weaver is the “audit committee financial expert” and is “independent” (as each term is defined in Item 3 of Form N-CSR). |
| ITEM 4. | PRINCIPAL ACCOUNTANT FEES AND SERVICES. |
Item 4 — Principal Accountant Fees and Services for the Goldman Sachs Variable Insurance Trust (“GSVIT”):
Table 1 – Items 4(a) - 4(d)
| | | | | | | | | | |
| | | 2020 | | | 2019 | | | Description of Services Rendered |
Audit Fees: | | | | | | | | | | |
• PricewaterhouseCoopers (“PwC”) | | $ | 436,130 | | | $ | 437,130 | | | Financial statement audits. |
Audit-Related Fees | | | | | | | | | | |
PwC | | $ | 84,939 | | | $ | 34,240 | | | Other attest services. |
Tax Fees | | | | | | | | | | |
PwC | | $ | 0 | | | $ | 113,470 | | | Tax compliance services provided in connection with the preparation and review of the Registrant’s tax returns and certain other tax-related services. |
Items 4(b)(c) & (d) Table 2. Non-Audit Services to the GSVIT’s* that were pre-approved by the GSVIT’s Audit Committee pursuant to Rule 2-01(c)(7)(ii) of Regulation S-X
| | | | | | | | | | |
| | | 2020 | | | 2019 | | | Description of Services Rendered |
Audit-Related Fees | | | | | | | | | | |
PwC | | $ | 2,060,932 | | | $ | 2,000,617 | | | Internal control review performed in accordance with Statement on Standards for Attestation Engagements No. 16 and Semi-Annual Updates related to withholding tax accrual for non-US Jurisdictions. These fees are borne by the Funds’ adviser. |
| * | These include the advisor (excluding sub-advisors) and any entity controlling, controlled by or under common control with the advisor that provides ongoing services to the registrant (hereinafter referred to as “service affiliates”). |
Item 4(e)(1) — Audit Committee Pre Approval Policies and Procedures
Pre-Approval of Audit and Non-Audit Services Provided to the Funds of the Goldman Sachs Variable Insurance Trust. The Audit and Non-Audit Services Pre-Approval Policy (the “Policy”) adopted by the Audit Committee of GSVIT sets forth the procedures and the conditions pursuant to which services performed by an independent auditor for GSVIT may be pre-approved. Services may be pre-approved specifically by the Audit Committee as a whole or, in certain circumstances, by the Audit Committee Chairman or the person designated as the Audit Committee Financial Expert. In addition, subject to specified cost limitations, certain services may be pre-approved under the provisions of the Policy. The Policy provides that the Audit Committee will consider whether the services provided by an independent auditor are consistent with the Securities and Exchange Commission’s rules on auditor independence. The Policy provides for periodic review and pre-approval by the Audit Committee of the services that may be provided by the independent auditor.
De Minimis Waiver. The pre-approval requirements of the Policy may be waived with respect to the provision of non-audit services that are permissible for an independent auditor to perform, provided (1) the aggregate amount of all such services provided constitutes no more than five percent of the total amount of revenues subject to pre-approval that was paid to the independent auditors during the fiscal year in which the services are provided; (2) such services were not recognized by GSVIT at the time of the engagement to be non-audit services; and (3) such services are promptly brought to the attention of the Audit Committee and approved prior to the completion of the audit by the Audit Committee or by one or more members of the Audit Committee to whom authority to grant such approvals has been delegated by the Audit Committee, pursuant to the pre-approval provisions of the Policy.
Pre-Approval of Non-Audit Services Provided to GSVIT’s Investment Advisers. The Policy provides that, in addition to requiring pre-approval of audit and non-audit services provided to GSVIT, the Audit Committee will pre-approve those non-audit services provided to GSVIT’s investment advisers (and entities controlling, controlled by or under common control with the investment advisers that provide ongoing services to GSVIT) where the engagement relates directly to the operations or financial reporting of GSVIT.
Item 4(e)(2) — 0% of the audit-related fees, tax fees and other fees listed in Table 1 were approved by GSVIT’s Audit Committee pursuant to the “de minimis” exception of Rule 2-01(c)(7)(i)(C) of Regulation S-X. In addition, 0% of the non-audit services to the GSVIT’s service affiliates listed in Table 2 were approved by GSVIT’s Audit Committee pursuant to the “de minimis” exception of Rule 2-01(c)(7)(i)(C) of Regulation S-X.
Item 4(f) — Not applicable.
Items 4(g) Aggregate Non-Audit Fees Disclosure
The aggregate non-audit fees billed to GSVIT for the twelve months ended December 31, 2020 and December 31, 2019 by PwC were approximately $84,939 and $147,710, respectively.
The aggregate non-audit fees billed to GSVIT’s adviser and service affiliates for non-audit services for the twelve months ended December 31, 2019 and December 31, 2018 by PwC were approximately $14.7 million and $12.3 million, respectively. The figures for these entities are not yet available for the twelve months ended December 31, 2020. With regard to the aggregate non-audit fees billed to GSVIT’s adviser and service affiliates, the 2019 and 2018 amounts include fees for non-audit services required to be pre-approved [see Table 2] and fees for non-audit services that did not require pre-approval since they did not directly relate to GSVIT’s operations or financial reporting.
Items 4(h) — GSVIT’s Audit Committee has considered whether the provision of non-audit services to GSVIT’s investment adviser and service affiliates that did not require pre-approval pursuant to paragraph (c)(7)(ii) of Rule 2-01 of Regulation S-X is compatible with maintaining the auditor’s independence.
| ITEM 5. | AUDIT COMMITTEE OF LISTED REGISTRANTS. |
Not applicable.
| ITEM 6. | SCHEDULE OF INVESTMENTS |
Schedule of Investments is included as part of the Reports to Shareholders filed under Item 1.
| ITEM 7. | DISCLOSURE OF PROXY VOTING POLICIES AND PROCEDURES FOR CLOSED-END MANAGEMENT INVESTMENT COMPANIES. |
Not applicable.
| ITEM 8. | PORTFOLIO MANAGERS OF CLOSED-END MANAGEMENT INVESTMENT COMPANIES |
Not applicable.
| ITEM 9. | PURCHASES OF EQUITY SECURITIES BY CLOSED-END MANAGEMENT INVESTMENT COMPANY AND AFFILIATED PURCHASERS |
Not applicable.
| ITEM 10. | SUBMISSION OF MATTERS TO A VOTE OF SECURITY HOLDERS. |
There have been no material changes to the procedures by which shareholders may recommend nominees to the registrant’s board of trustees.
| ITEM 11. | CONTROLS AND PROCEDURES. |
| | (a) | The registrant’s principal executive and principal financial officers or persons performing similar functions have concluded that the registrant’s disclosure controls and procedures (as defined in Rule 30a-3(c) under the Investment Company Act of 1940, as amended (the “1940 Act”)) are effective as of a date within 90 days of the filing date of this report that includes the disclosure required by this paragraph, based on the evaluation of these controls and procedures required by Rule 30a-3(b) under the 1940 Act and 15d-15(b) under the Securities Exchange Act of 1934, as amended. |
| | (b) | There were no changes in the registrant’s internal control over financial reporting (as defined in Rule 30a-3(d) under the 1940 Act) that occurred during the period covered by this report that have materially affected, or are reasonably likely to materially affect, the registrant’s internal control over financial reporting. |
| ITEM 12. | DISCLOSURE OF SECURITIES LENDING ACTIVITIES FOR CLOSED-END MANAGEMENT INVESTMENT COMPANIES. |
Not applicable.
SIGNATURES
Pursuant to the requirements of the Securities Exchange Act of 1934 and the Investment Company Act of 1940, the registrant has duly caused this report to be signed on its behalf by the undersigned, thereunto duly authorized.
Goldman Sachs Variable Insurance Trust
| | |
/s/ James A. McNamara |
By: James A. McNamara |
Chief Executive Officer of |
Goldman Sachs Variable Insurance Trust |
|
Date: February 25, 2021 |
Pursuant to the requirements of the Securities Exchange Act of 1934 and the Investment Company Act of 1940, the report has been signed below by the following persons on behalf of the registrant and in the capacities and on the dates indicated.
| | |
/s/ James A. McNamara |
By: James A. McNamara |
Chief Executive Officer of |
Goldman Sachs Variable Insurance Trust |
|
Date: February 25, 2021 |
|
/s/ Joseph F. DiMaria |
By: Joseph F. DiMaria |
Principal Financial Officer of |
Goldman Sachs Variable Insurance Trust |
|
Date: February 25, 2021 |