UNITED STATES
SECURITIES AND EXCHANGE COMMISSION
Washington, D.C. 20549
FORM N-CSR
CERTIFIED SHAREHOLDER REPORT OF REGISTERED
MANAGEMENT INVESTMENT COMPANIES
Investment Company Act file number 811-08361
Goldman Sachs Variable Insurance Trust
(Exact name of registrant as specified in charter)
71 South Wacker Drive, Chicago, Illinois 60606-6303
(Address of principal executive offices) (Zip code)
Robert Griffith, Esq.
Goldman Sachs & Co. LLC
200 West Street
New York, NY 10282
Copies to:
Stephen H. Bier, Esq.
Dechert LLP
1095 Avenue of the Americas
New York, NY 10036
(Name and address of agents for service)
Registrant’s telephone number, including area code: (312) 655-4400
Date of fiscal year end: December 31
Date of reporting period: December 31, 2023
| ITEM 1. | REPORTS TO STOCKHOLDERS. |
| | The Annual Report to Shareholders is filed herewith. |
Goldman Sachs Variable Insurance Trust
| | |
| ∎ | | GOLDMAN SACHS MULTI-STRATEGY ALTERNATIVES PORTFOLIO |
| | |
| ∎ | | GOLDMAN SACHS TREND DRIVEN ALLOCATION FUND |
TABLE OF CONTENTS
|
| |
Effective January 24, 2023, open-end mutual funds and exchange traded funds will be required to provide shareholders with streamlined annual and semi-annual shareholder reports (“Tailored Shareholder Reports”). Funds will be required to prepare a separate Tailored Shareholder Report for each share class of a fund that highlights key information to investors. Other information, including financial statements, will no longer appear in a fund’s shareholder report, but will be available online, delivered free of charge upon request, and filed with the SEC on a semi-annual basis on Form N-CSR. The new requirements have a compliance date of July 24, 2024. |
| | | | | | |
| | | | |
| NOT FDIC-INSURED | | May Lose Value | | No Bank Guarantee | | |
MARKET REVIEW
Goldman Sachs Variable Insurance Trust Funds — Goldman Sachs VIT Multi Asset Strategies Funds
Market Review
Ongoing inflation trends and macroeconomic data, central bank monetary policy, interest rate volatility, geopolitical events, and U.S. and European banking stress had the greatest influence on the capital markets during the 12-month period ended December 31, 2023 (the “Reporting Period”).
During the first quarter of 2023, when the Reporting Period began, investors focused on the evolution of the European energy crisis, the speed of China’s economic reopening and the pace of U.S. disinflation. In the U.S., inflation was not moderating as quickly as U.S. Federal Reserve (“Fed”) policymakers had hoped, and they maintained a hawkish stance, raising the target federal funds (“fed funds”) rate twice during the quarter—by 25 basis points each time. (Hawkish tends to suggest higher interest rates; opposite of dovish. A basis point is 1/100th of a percentage point.) In March 2023, investor sentiment was dominated by worries about the U.S. and European banking sectors. Swift response from U.S. and European policymakers rather quickly calmed nerves, but the turmoil made the Fed’s decisions on interest rates more complex given its objective of mitigating downside risks to economic growth while combating persistent inflation amid a tight labor market. Investor concerns about a potential European energy crisis eased, while China’s economy continued to reopen after the Chinese government had finally lifted its stringent zero-COVID policy in January 2023. For the first quarter overall, global equities generated solidly positive returns, with developed markets equities outperforming emerging markets equities. There was substantial dispersion of returns across broad equity indices, with growth equities materially outperforming value equities. Within developed equity markets, non-U.S. equities outpaced U.S. equities. In the U.S. equity market, information technology equities broadly outperformed financials and energy equities. As for global fixed income, yields broadly declined during the first quarter, leading to positive bond returns.
During the second quarter of 2023, as economic growth remained resilient, many market participants reconsidered their previous expectations of a global economic slowdown. Central banks focused on combating inflation, which decreased but remained elevated. In May, the Fed raised the fed funds rate by 25 basis points to a range between 5.00% and 5.25%. The European Central Bank and Bank of England also raised their policy rates 50 basis points and 75 basis points, respectively. In June, the Fed left the fed funds rate unchanged, but according to the Fed’s median dot plot projection, policymakers increased their estimate for the peak rate to 5.6%, up from 5.1% in March. (The dot plot shows interest rate projections of the members of the Federal Open Market Committee.) For the second quarter overall, global equities recorded positive returns, with developed markets equities outperforming emerging markets equities on the back of better than consensus expected first quarter corporate earnings in the developed markets. European equities, while posting positive returns, underperformed other developed equity markets, such as Japan and the U.S. In the U.S., equity gains were fueled by rallies in the information technology and consumer discretionary sectors. The advance in the information technology sector was driven in part by market expectations of artificial intelligence (“AI”) potential and the growing demand for AI processors. Regarding global fixed income, performance was broadly negative during the second quarter as bond yields increased. Duration-sensitive assets sold off as higher interest rates and expectations for further monetary policy tightening weighed on market sentiment.
During the third quarter of 2023, most asset classes posted losses despite a relatively benign macroeconomic backdrop. Inflation data continued to improve across major developed markets, leading central banks to signal that they were at, or close to, their peak policy rates. In the U.S., economic growth remained resilient, while upward momentum in inflation and the labor market began to weaken—a welcome development for the Fed as it sought to reach its inflation target on a sustainable basis. Policymakers, having raised the fed funds rate by 25 basis points at their July meeting, remained on hold at their September meeting. Elsewhere, Europe and U.K. inflation surprised to the downside; China continued its efforts in support of its economy; and the Bank of Japan began to gradually normalize its monetary policy. In addition, investors had to grapple with some unexpected events during the third quarter. In August, for example, Fitch Ratings downgraded its U.S. credit rating from AAA to AA+, and the markets confronted the possibility of a U.S. government shutdown, which was then narrowly avoided in September. For the third quarter overall, global equities produced negative returns, with developed markets equities performing the worst. U.S. equities and emerging markets equities also declined. In global fixed income, bond yields rose amid significant interest rate volatility. Investors remained wary of inflation, as data indicated it might be stickier, or more persistent, than consensus expected, and markets seemed to expect the Fed and other developed markets central banks to keep interest rates higher for longer.
Most asset classes generated gains during the fourth quarter of 2023, benefiting from a positive backdrop that included strong economic growth, resilient labor markets, subdued inflationary pressures across developed economies, and signals from major central banks regarding the end of their rate hiking cycles. Broadly, the performance of the capital markets was driven by investors’ reactions to lower inflation and a dovish Fed. As a result of a significant slowdown in inflation, the potential of an economic “soft
MARKET REVIEW
landing” increased, leading to a sharp drop in interest rates and a broad-based rally across the capital markets. (A soft landing, in economics, is a cyclical downturn that avoids recession. It typically describes attempts by central banks to raise interest rates just enough to stop an economy from overheating and experiencing high inflation, without causing a significant increase in unemployment, or a hard landing.) At both their November and December meetings, Fed policymakers left the fed funds rate unchanged in a range between 5.25% and 5.50%. The Fed also signaled in December that it may have reached the peak of its monetary policy tightening cycle, with its median dot plot projection indicating there could be 75 basis points of rate cuts in 2024. For the fourth quarter overall, global equities posted significantly positive returns, with U.S. equities outperforming developed markets equities and emerging markets equities. In the U.S. equity market, gains were led by information technology, financials and consumer discretionary stocks, while energy stocks performed the worst due to a drop in oil prices. In global fixed income, yields rose during October and then fell significantly in November and December, leading to positive bond returns for the fourth quarter overall.
GOLDMAN SACHS VARIABLE INSURANCE TRUST MULTI-STRATEGY ALTERNATIVES PORTFOLIO
INVESTMENT OBJECTIVE
The Portfolio seeks long-term growth of capital.
Portfolio Management Discussion and Analysis
Below, the Goldman Sachs Multi-Asset Solutions (“MAS”) Group discusses the Goldman Sachs Variable Insurance Trust – Goldman Sachs Multi-Strategy Alternatives Portfolio’s (the “Portfolio”) performance and positioning for the 12-month period ended December 31, 2023 (the “Reporting Period”).
How did the Portfolio perform during the Reporting Period?
During the Reporting Period, the Portfolio’s Institutional, Service and Advisor Shares generated average annual total returns of 7.90%, 7.77% and 7.53%, respectively. These returns compare to the 5.01% average annual total return of the Portfolio’s benchmark, the ICE BofA 3-Month U.S. Treasury Bill Index during the same period.
Please note that the Portfolio’s benchmark being the ICE BofA 3-Month U.S. Treasury Bill Index is a means of emphasizing that the Portfolio has an unconstrained strategy. That said, this Portfolio employs a benchmark agnostic strategy and thus comparisons to a benchmark index are not particularly relevant.
What key factors were responsible for the Portfolio’s performance during the Reporting Period?
The Portfolio’s performance is driven by three sources of return: long-term strategic asset allocation to market exposures, medium-term and short-term dynamic allocations, and excess returns from investments in Underlying Funds. Long-term strategic asset allocation is the process by which the Portfolio’s assets are allocated across underlying asset classes and strategies in a way that considers the risks of each underlying asset class and strategy. Medium-term dynamic allocation is the process by which we adjust the portfolio for changes in the business or economic cycle, while short-term dynamic allocation is the implementation of tactical market views with the goal of improving the Portfolio’s risk-adjusted return. The risk-adjusted return on an investment takes into account the risk associated with that investment relative to other potential investments. Excess returns from investments in Underlying Funds is by how much the Underlying Funds outperform or underperform their respective benchmark indices.
During the Reporting Period, the Portfolio generated positive absolute returns, largely because of long-term strategic asset allocation. Short-term dynamic allocation and selection within the Underlying Funds also bolstered performance. Medium-term dynamic allocation detracted slightly from the Portfolio’s returns.
Long-term strategic asset allocation added to the Portfolio’s performance during the Reporting Period, with most strategic allocations contributing positively. Among the exceptions were a strategic allocation to U.S. Treasury futures and the Portfolio’s U.S. interest rate options strategy, which seeks to profit if interest rates fall, remain constant or rise less than anticipated. Both of these strategic allocations detracted from the Portfolio’s performance, as U.S. Treasury yields rose during the Reporting Period. (Our long U.S. interest rate options strategy is a macroeconomic hedge that buys options on short-term interest rates, including call options. A call option is an option that gives the holder the right to buy a certain quantity of an underlying security at an agreed-upon price at any time up to an agreed-upon date.) Among liquid alternatives strategies, the Portfolio was hampered by its strategic allocation to managed futures.
Medium-term dynamic allocation detracted modestly from the Portfolio’s performance during the Reporting Period. Specifically, the Portfolio was hindered by our medium-term dynamic views that it has decreased exposure to corporate credit and an increased duration position. (Duration is a measure of a portfolio’s sensitivity to changes in interest rates.)
Short-term dynamic allocations, which are primarily implemented through the use of derivatives and exchange-traded funds (“ETFs”), had a positive impact on the Portfolio’s performance during the Reporting Period. Within equities, the Portfolio benefited most from its short-term dynamic allocations to the energy sector and to the Eurozone banking sector. In fixed income, the Portfolio was helped by its short-term dynamic allocation to emerging markets debt, though this was offset somewhat by its short-term dynamic allocation to two-year and 10-year U.S. Treasury futures, which hurt.
Overall, security selection within the Underlying Funds added to the Portfolio’s returns, with many fixed income and equity Underlying Funds outperforming their benchmark indices during the Reporting Period. The Goldman Sachs Strategic Income Fund and Goldman Sachs Emerging Markets Equity Insights Fund outperformed their respective benchmark indices the most during the Reporting Period. In addition, the Goldman Sachs Core Fixed Income Fund outperformed its benchmark index between May 2023, when it was added as an Underlying Fund, and the end of the Reporting Period. The Goldman Sachs High Yield Fund and Goldman Sachs Global Infrastructure Fund underperformed their respective benchmark indices most during the Reporting Period. The performance of liquid alternative Underlying Funds was positive overall, with the Goldman Sachs Long Short Credit Strategies Fund significantly outperforming its cash benchmark. On the other hand, the Goldman Sachs Managed Futures Strategy Fund underperformed its cash benchmark during the Reporting Period.
GOLDMAN SACHS VARIABLE INSURANCE TRUST MULTI-STRATEGY ALTERNATIVES PORTFOLIO
How was the Portfolio positioned at the beginning of the Reporting Period?
At the beginning of the Reporting Period, the Portfolio was positioned, in terms of its total net assets, with 35.7% in liquid alternative strategies, 29.5% in real assets/satellite asset classes, 16.19% in directional views and the balance in cash. Liquid alternatives strategies generally include, but are not limited to, momentum or trend trading strategies (investment decisions based on trends in asset prices over time), hedge fund beta (long term total returns consistent with investment results that approximate the return and risk patterns of a diversified universe of hedge funds), managed risk investment strategies (which seek to manage extreme risk scenarios by implementing daily and monthly risk targets across a diversified mix of asset classes) and unconstrained fixed income strategies (which have the ability to move across various fixed income sectors). Real assets/satellite asset classes generally include, but are not limited to, commodities, global real estate securities, global infrastructure securities, master limited partnerships, emerging markets equities and emerging markets debt. Directional views include more traditional beta investments, such as U.S. equities and non-U.S. developed markets equities. This above sector breakout is inclusive of derivative exposure across all asset classes.
How did you manage the Portfolio’s allocations during the Reporting Period?
During the Reporting Period, we made adjustments to the Portfolio’s long-term strategic asset allocation. Specifically, during May 2023, we increased the Portfolio’s strategic allocations to core fixed income, high yield corporate bonds, high yield loans and emerging markets debt.
Within medium-term dynamic allocations, in January 2023, we increased the Portfolio’s exposures to U.S. large-cap equities, emerging markets equities and emerging markets debt. In February, we further increased the Portfolio’s exposure to emerging markets debt, while reducing its exposure to U.S. large-cap equities. During April, we added to the Portfolio’s emerging markets debt exposure. In May, we increased the Portfolio’s exposure to managed futures and reduced its exposure to corporate credit. We also decreased exposure to emerging markets equities overall. Additionally, we increased the Portfolio’s exposure to global infrastructure securities. During August, we reduced the Portfolio’s investments in two-year U.S. Treasury futures. In October, we increased exposures to high yield corporate bonds and global infrastructure securities. We decreased the Portfolio’s investments in 10-year U.S. Treasury futures and non-U.S. developed markets equities. During November, we further increased the Portfolio’s exposure to high yield corporate bonds and increased its exposure to high yield loans. We increased both of these exposures again during December, while reducing the Portfolio’s exposure to non-U.S. developed markets equities and its investments in two-year U.S. Treasury futures.
During the Reporting Period, we continued to express our short-term dynamic views mainly through the use of ETFs and derivatives. Using these instruments, we maintained tactical exposures to U.S. equities, non-U.S. developed markets equities, fixed income and currencies. Among notable short-term tactical allocations were investments in Eurozone bank futures, U.S. dollar/Japanese yen currency forwards, U.S. dollar/Brazilian real currency forwards and energy master limited partnerships. In October 2023, we increased the Portfolio’s overall equity risk by increasing its exposure to non-U.S. developed markets equities.
Regarding Underlying Funds, as mentioned previously, we added the Goldman Sachs Core Fixed Income Fund as an Underlying Fund in May 2023.
How was the Portfolio positioned at the end of the Reporting Period?
At the end of the Reporting Period, the Portfolio was positioned, in terms of its total net assets, with 41.00% in liquid alternative strategies, 50.19% in real assets/satellite asset classes, 7.10% in directional views and the balance in cash. This above sector breakout is inclusive of derivative exposure across all asset classes.
How did the Portfolio use derivatives and similar instruments during the Reporting Period?
During the Reporting Period, the Portfolio employed equity index futures to effect long exposures in European large-cap equities (neutral impact on performance) and emerging markets equities (negative impact).
Within fixed income during the Reporting Period, the Portfolio used interest rate futures to express views on the U.S. Treasury yield curve (negative impact) and on the German government bond yield curve (positive impact). The Portfolio also used interest rate options in a macroeconomic hedge that seeks to profit if interest rates fall, remain constant or rise less than anticipated (negative impact). Finally, within short-term tactical views on currencies, the Portfolio employed forward foreign currency exchange contracts (neutral impact).
Additionally, some of the Underlying Funds used derivatives during the Reporting Period to apply their active investment views with greater versatility and potentially to afford greater risk management precision. As market conditions warranted during the Reporting Period, some of these Underlying Funds engaged in forward foreign currency exchange contracts, financial futures contracts, options, swap contracts and structured securities to attempt to enhance portfolio return and for hedging purposes.
What is the Portfolio’s tactical view and strategy for the months ahead?
At the end of the Reporting Period, we believed the U.S. was still in the late stages of the economic cycle. Although our base case was for a “soft landing” in 2024, we thought the risks of a recession remained above average as long as the Fed maintained its restrictive posture. (A soft landing, in economics, is a cyclical downturn that avoids recession. It typically describes attempts by central banks to raise interest rates just enough to stop an economy from overheating and experiencing high inflation, without
GOLDMAN SACHS VARIABLE INSURANCE TRUST MULTI-STRATEGY ALTERNATIVES PORTFOLIO
causing a significant increase in unemployment, or a hard landing.) Because of the Fed’s progress on inflation during the Reporting Period, we expected policymakers to shift their focus to economic growth in the near term, which could lead to a rate cutting cycle. While U.S. wage growth was near levels consistent with the Fed’s long-term targets, the job market remained tight and unemployment was still below 4%.
In our view, bonds continued to look attractive at the end of the Reporting Period, even though their yields had fallen from recent highs. We also believed bonds could provide portfolio diversification benefits in the event of an economic downturn. Overall, we thought the resilience of the U.S. economy and declining inflation would be supportive for U.S. equities, although their high valuations relative to history could remain a headwind. At the end of the Reporting Period, the Portfolio’s equity and fixed income allocations were near our long-term neutral positions. Going forward, we continued to believe a dynamic investment approach and careful risk management should help us identify attractive opportunities, both regionally and across asset classes.
FUND BASICS
Multi-Strategy Alternatives Portfolio
as of December 31, 2023
|
|
OVERALL UNDERLYING FUND AND ETF WEIGHTINGS1 |
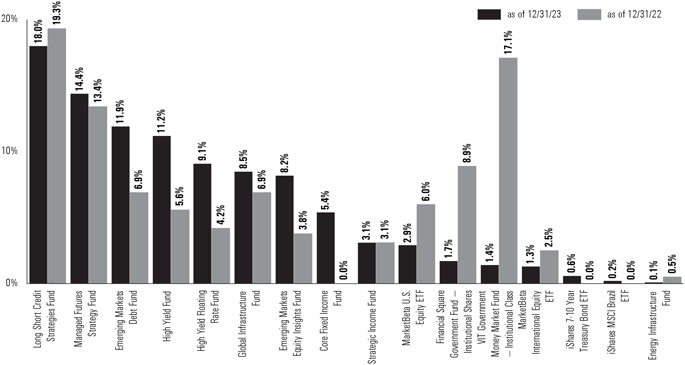
| | 1 | The Portfolio is actively managed and, as such, its composition may differ over time. The percentage shown for each Underlying Fund and ETF reflects the value of that Underlying Fund or ETF as a percentage of net assets of the Portfolio. Figures in the graph above may not sum to 100% due to rounding and/or exclusion of other assets and liabilities. Underlying sector allocations of exchange traded funds and investment companies held by the Portfolio are not reflected in the graph above. The graph depicts the Portfolio’s investments but may not represent the Portfolio’s market exposure due to the exclusion of certain derivatives, if any, as listed in the Additional Investment Information section of the Schedule of Investments. |
| | | For more information about your Fund, please refer to www.GSAMFUNDS.com. There, you can learn more about your Fund’s investment strategies, holdings, and performance. |
GOLDMAN SACHS VARIABLE INSURANCE TRUST MULTI-STRATEGY ALTERNATIVES PORTFOLIO
Performance Summary
December 31, 2023
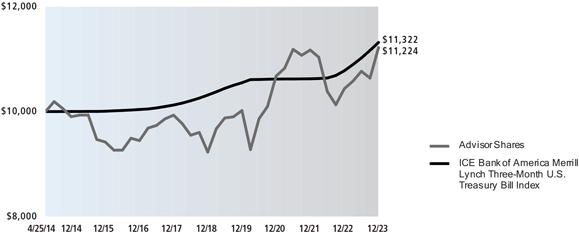
The following graph shows the value, as of December 31, 2023, of a $10,000 investment made on April 25, 2014 (commencement of the Fund’s operations) in Advisor Shares at NAV. For comparative purposes, the performance of the Portfolio’s benchmark, the ICE Bank of America Merrill Lynch Three-Month U.S. Treasury Bill Index, is shown. Performance reflects applicable fee waivers and/or expense limitations in effect during the periods shown and, in their absence, performance would be reduced. Returns do not reflect the deduction of taxes that a shareholder would pay on Fund distributions or the redemption of Fund shares. The returns set forth below represent past performance. Past performance does not guarantee future results. The Fund’s investment return and principal value will fluctuate so that an investor’s shares, when redeemed, may be worth more or less than their original cost. Current performance may be lower or higher than the performance quoted below. Please visit our web site at www.GSAMFUNDS.com to obtain the most recent month-end returns.
|
|
Multi-Strategy Alternatives Portfolio’s Lifetime Performance |
|
Performance of a $10,000 investment, with distributions reinvested, from April 25, 2014 through December 31, 2023. |
| | | | | | |
| | | |
Average Annual Total Returns through December 31, 2023* | | One Year | | Five Years | | Since Inception |
| | | |
Institutional (Commenced on April 25, 2014) | | 7.90% | | 4.41% | | 1.59% |
| | | | | | | |
| | | |
Service (Commenced on April 25, 2014) | | 7.77% | | 4.16% | | 1.35% |
| | | | | | | |
| | | |
Advisor (Commenced on April 25, 2014) | | 7.53% | | 4.00% | | 1.20% |
| | | | | | | |
| * | These returns assume reinvestment of all distributions at NAV. Because Institutional, Service and Advisor Shares do not involve sales charge, such a charge is not applied to their Average Annual Total Returns. |
GOLDMAN SACHS VARIABLE INSURANCE TRUST TREND DRIVEN ALLOCATION FUND
INVESTMENT OBJECTIVE
The Fund seeks total return while seeking to provide volatility management.
Portfolio Management Discussion and Analysis
Below, the Goldman Sachs Quantitative Investment Strategies (“QIS”) Team discusses the Variable Insurance Trust – Goldman Sachs Trend Driven Allocation Fund’s (the “Fund”) performance and positioning for the 12-month period ended December 31, 2023 (the “Reporting Period”).
How did the Fund perform during the Reporting Period?
During the Reporting Period, the Fund’s Institutional and Service Shares generated average annual total returns of 15.85% and 15.57%, respectively. These returns compare to the 15.90% average annual total return of the Fund’s blended benchmark during the same time period. The components of the Fund’s blended benchmark, which is comprised 60% of the MSCI World Index (Net, USD, Hedged) and 40% of the Bloomberg U.S. Treasury Index (Total Return, Unhedged, USD), generated average annual total returns of 24.30% and 4.05%, respectively, during the same time period.
During the Reporting Period, the Fund’s overall annualized volatility was 11.13%, more than the Fund’s blended benchmark’s annualized volatility of 10.54% during the same time period. By way of comparison, the S&P 500® Index’s annualized volatility was 15.15% during the Reporting Period.
What key factors were responsible for the Fund’s performance during the Reporting Period?
The Fund primarily seeks to achieve its investment objective by investing in a portfolio of equity and fixed income asset classes, with the expectation of investing at least 50% of its assets in equities and a minimum of 30% of its assets in fixed income, assuming normal market conditions. The Investment Adviser makes investment decisions based upon its analysis of macro factors, most notably “trends” from around the world. The trends analyzed by the Investment Adviser are based on, but are not limited to, relative considerations around the prices and volatility of the underlying markets. If recent prices are higher than measures of historical prices for an asset, the Investment Adviser generally considers there to be a positive (strong) trend for these assets, whereas recent prices below such measures generally indicate negative (poor) trends. If the current measure of volatility is elevated relative to historic realizations of this volatility measure for an asset, the Investment Adviser generally considers there to be a negative (poor) trend for this asset, whereas volatility that is less elevated indicates positive (strong) trends. As a result of the trends analysis, the Investment Adviser may allocate more of the Fund’s assets to investments with relatively strong recent trends and allocate assets away from investments with relatively poor recent trends.
In addition, as a continuing part of the Fund’s investment strategy, the Investment Adviser seeks to manage volatility and limit losses by allocating the Fund’s assets away from risky investments in distressed or volatile market environments. In this context, volatility is a statistical measurement of the magnitude of up and/or down fluctuations in the value of a financial instrument or index. While the Investment Adviser attempts to manage the Fund’s volatility, there can be no guarantee that the Fund will be successful.
During the Reporting Period, the Fund performed in line with its blended benchmark. Because of heightened equity market volatility driven by geopolitical tensions in the Middle East, the Fund’s drawdown control and volatility management mechanisms were activated in October, actively de-risking the Fund into cash. (A drawdown is a peak-to-trough decline during a specific time period and is a measure of downside volatility.) The increase in the Fund’s cash allocation detracted slightly from its relative performance for the Reporting Period overall. On the positive side, the Fund benefited from its underweight versus the blended benchmark in fixed income, which added to relative returns.
From an absolute return perspective, the Fund was helped by its allocations to U.S. large-cap equities, which posted gains amid a rally in the information technology sector. Exposure to European and Japanese equities added further to absolute performance. The Fund also benefited from its participation in the fed funds market. Conversely, allocations to U.S. Treasury securities detracted from the Fund’s absolute returns.
What was the Fund’s volatility during the Reporting Period?
As part of our investment approach, we seek to mitigate the Fund’s volatility. As mentioned earlier, for the Reporting Period overall, the Fund’s overall annualized volatility was 11.13%, more than its blended benchmark’s annualized volatility of 10.54%. By way of comparison, the S&P 500® Index’s annualized volatility was 15.15% during the Reporting Period.
How was the Fund positioned during the Reporting Period?
During the Reporting Period, we managed the Fund’s allocations across equity and fixed income markets based upon an analysis of market factors and trends from around the world. At the beginning of the Reporting Period, the Fund’s total assets were allocated 69.5% to equities, 30.5% to fixed income and 0% to cash. (Many of these positions were implemented through the use of
GOLDMAN SACHS VARIABLE INSURANCE TRUST TREND DRIVEN ALLOCATION FUND
exchanged-traded index future contracts.) Within the equity allocation, the Fund had significant exposure to U.S. large-cap equities and, to a lesser extent, to European, Japanese and U.K. equities. Within the fixed income allocation, the Fund had substantial exposure to U.S. Treasury securities at the beginning of the Reporting Period.
Between January and September 2023, we made no significant changes to the Fund’s allocations. In October, as equity market volatility increased, we reduced the Fund’s allocations to U.S. large-cap equities, Japanese equities, European equities and U.K. equities. We also decreased its allocation to U.S. Treasury securities and increased its cash position. In November, we unwound these changes, and at the end of the Reporting Period, the Fund’s allocations were near where they were at the beginning of the Reporting Period.
How did the Fund use derivatives and similar instruments during the Reporting Period?
During the Reporting Period, the Fund employed exchange-traded equity index futures to gain exposure to U.S. large-cap stocks and to European, Japanese and U.K. equities. The use of these instruments had a positive impact overall on absolute returns. In addition, the Fund used bond futures to gain exposure to U.S. Treasury securities, which had a negative impact on the Fund’s performance during the Reporting Period.
What is the Fund’s tactical asset allocation view and strategy for the months ahead?
At the end of the Reporting Period, the Fund’s total assets were allocated 69.0% to equities, 31% to fixed income and 0% to cash. (Many of these positions were implemented through the use of exchanged-traded index future contracts.) Within the equity allocation, the Fund had significant exposure to U.S. large-cap equities and, to a lesser extent, to European, Japanese and U.K. equities. Within the fixed income allocation, the Fund had substantial exposure to U.S. Treasury securities at the end of the Reporting Period.
Going forward, we intend to position the Fund based on analyses of trends from around the world, while dynamically managing the volatility, or risk, of the overall portfolio. In general, the Fund will seek to invest at least 50% of its assets in equity investments and at least 30% of its assets in fixed income investments. The Fund may deviate from these strategic allocations in order to allocate more of the Fund’s assets to investments with relatively strong recent trends and allocate assets away from investments with relatively poor recent trends. When volatility increases, our goal is to preserve capital by proportionally increasing the Fund’s cash exposure and reducing its exposure to riskier asset classes. There is no guarantee the Fund’s dynamic management strategy will cause it to achieve its investment objective.
FUND BASICS
Trend Driven Allocation Fund
as of December 31, 2023
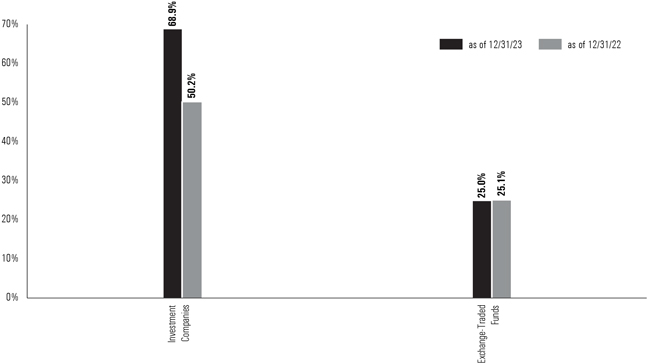
| | 1 | The percentage shown for each investment category reflects the value of investments in that category as a percentage of net assets. Figures in the above graph may not sum to 100% due to the exclusion of other assets and liabilities. The underlying composition of exchange traded funds and investment companies held by the Fund are not reflected in the graph above. Consequently, the Fund’s overall composition may differ from the percentages contained in the graph above. The graph depicts the Fund’s investments but may not represent the Fund’s market exposure due to the exclusion of certain derivatives, if any, as listed in the Additional Investment Information section of the Schedule of Investments. |
| | | For more information about your Fund, please refer to www.GSAMFUNDS.com. There, you can learn more about your Fund’s investment strategies, holdings, and performance. |
GOLDMAN SACHS VARIABLE INSURANCE TRUST TREND DRIVEN ALLOCATION FUND FUND
Performance Summary
December 31, 2023
The following graph shows the value, as of December 31, 2023, of a $10,000 investment made on January 1, 2014 in Service Shares at NAV. For comparative purposes, the performance of the Fund’s blended benchmark, the Allocation Composite Index, (comprised of the Morgan Stanley Capital International (MSCI) World Index (Net, USD, Hedged) (60%) and the Bloomberg U.S. Treasury Index (Total Return, USD, Unhedged) (40%)) is shown. Performance reflects applicable fee waivers and/or expense limitations in effect during the periods shown and, in their absence, performance would be reduced. Returns do not reflect the deduction of taxes that a shareholder would pay on Fund distributions or the redemption of Fund shares. The returns set forth below represent past performance. Past performance does not guarantee future results. The Fund’s investment return and principal value will fluctuate so that an investor’s shares, when redeemed, may be worth more or less than their original cost. Current performance may be lower or higher than the performance quoted below. Please visit our web site at www.GSAMFUNDS.com to obtain the most recent month-end returns.
|
|
Trend Driven Allocation Fund’s 10 Year Performance |
|
Performance of a $10,000 investment, with distributions reinvested, from January 1, 2014 through December 31, 2023. 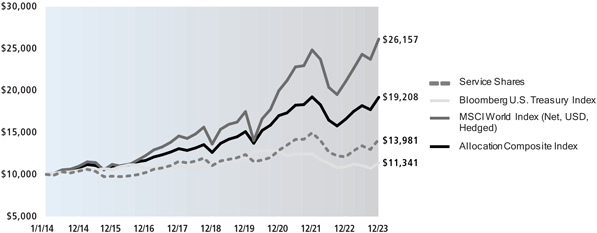
|
| | | | | | |
| | | |
Average Annual Total Returns through December 31, 2023* | | One Year | | Five Years | | Ten Years |
| | | |
Institutional | | 15.85% | | 5.07% | | 3.66% |
| | | | | | | |
| | | |
Service | | 15.57% | | 4.81% | | 3.41% |
| | | | | | | |
| * | These returns assume reinvestment of all distributions at NAV. Because Institutional and Service Shares do not involve sales charge, such a charge is not applied to their Average Annual Total Return. |
GOLDMAN SACHS VARIABLE INSURANCE TRUST MULTI-ASSET STRATEGIES FUNDS
Index Definitions
ICE BofAML Three-Month T-Bill Index measures total return on cash, including price and interest income, based on short-term government Treasury Bills of about 90-day maturity, as reported by Bank of America Merrill Lynch.
MSCI ACWI Investable Market Index captures large, mid and small cap representation across 23 developed markets and 27 emerging markets countries.
MSCI Emerging Markets Index captures large-cap and mid-cap representation across 26 emerging markets countries. The index covers approximately 85% of the free float-adjusted market capitalization in each country.
Bloomberg U.S. Treasury Index measures U.S. dollar-denominated, fixed-rate, nominal debt issued by the U.S. Treasury. Treasury bills are excluded by the maturity constraint.
MSCI World Index is a broad global equity index that represents large and mid-cap equity performance across 23 developed markets countries. It covers approximately 85% of the free float-adjusted market capitalization in each country.
S&P 500® Index is a U.S. stock market index based on the market capitalizations of 500 large companies having common stock listed on the New York Stock Exchange or NASDAQ. The S&P 500® Index components and their weightings are determined by S&P Dow Jones Indices.
It is not possible to invest directly in an unmanaged index.
GOLDMAN SACHS VARIABLE INSURANCE TRUST MULTI-STRATEGY ALTERNATIVES PORTFOLIO
|
Schedule of Investments December 31, 2023 |
| | | | | | | | |
| | | Shares | | Description | | Value | |
| |
| | Underlying Funds (Class R6 Shares)(a) – 90.0% | |
| |
| | Equity – 16.8% | |
| | 258,348 | | Goldman Sachs Global Infrastructure Fund | | $ | 3,219,022 | |
| | 386,922 | | Goldman Sachs Emerging Markets Equity Insights Fund | | | 3,134,071 | |
| | 4,466 | | Goldman Sachs Energy Infrastructure Fund | | | 49,255 | |
| | | | | | | | |
| | | | | | | 6,402,348 | |
| | | |
| |
| | Fixed Income – 73.2% | |
| | 866,585 | | Goldman Sachs Long Short Credit Strategies Fund | | | 6,863,356 | |
| | 558,562 | | Goldman Sachs Managed Futures Strategy Fund | | | 5,490,662 | |
| | 478,172 | | Goldman Sachs Emerging Markets Debt Fund | | | 4,542,639 | |
| | 757,078 | | Goldman Sachs High Yield Fund | | | 4,254,780 | |
| | 388,593 | | Goldman Sachs High Yield Floating Rate Fund | | | 3,458,481 | |
| | 221,396 | | Goldman Sachs Core Fixed Income Fund | | | 2,061,193 | |
| | 124,143 | | Goldman Sachs Strategic Income Fund | | | 1,165,702 | |
| | | | | | | | |
| | | | | | | 27,836,813 | |
| | | |
| | TOTAL UNDERLYING FUNDS (CLASS R6 SHARES)
(Cost $33,612,750) | | | 34,239,161 | |
| | | |
| | | | | | | | |
| |
| | Exchange Traded Funds – 4.9% | |
| | | |
| | 16,873 | | Goldman Sachs MarketBeta U.S. Equity ETF(a)(b) | | | 1,102,650 | |
| | 8,847 | | Goldman Sachs MarketBeta International Equity ETF(a) | | | 475,349 | |
| | 2,255 | | iShares 7-10 Year Treasury Bond ETF | | | 217,360 | |
| | 2,343 | | iShares MSCI Brazil ETF | | | 81,911 | |
| | | |
| | |
| | TOTAL EXCHANGE TRADED FUNDS
(Cost $1,579,562) | | | 1,877,270 | |
| | | |
| | | |
| | | Shares | | Dividend Rate | | Value | |
| |
| | Investment Companies (Institutional Shares) – 3.1%(a) | |
| |
| | Goldman Sachs Financial Square Government Fund | |
| | 635,024 | | 5.248% | | | 635,024 | |
| |
| | Goldman Sachs VIT Government Money Market Fund | |
| | 536,056 | | 5.270 | | | 536,056 | |
| | | |
| | |
| | Total Investment Companies (Cost $1,171,080) | | | 1,171,080 | |
| | | |
| |
| | TOTAL INVESTMENTS BEFORE SECURITIES LENDING | |
| | REINVESTMENT VEHICLE (Cost $36,363,392) | | | 37,287,511 | |
| | | |
| | | | | | | | |
| | | Shares | | Dividend Rate | | Value | |
| |
| | Securities Lending Reinvestment Vehicle – 0.0%(a) | |
| |
| | Goldman Sachs Financial Square Government Fund – Institutional Shares | |
| | 6,700 | | 5.248% | | $ | 6,700 | |
| | (Cost $6,700) | |
| | | |
| | TOTAL INVESTMENTS – 98.0% | | | | |
| | (Cost $36,370,092) | | $ | 37,294,211 | |
| | | |
| | OTHER ASSETS IN EXCESS OF LIABILITIES – 2.0% | | | 750,279 | |
| | | |
| | NET ASSETS – 100.0% | | $ | 38,044,490 | |
| | | |
| | |
| The percentage shown for each investment category reflects the value of investments in that category as a percentage of net assets. |
| |
| (a) | | Represents an affiliated issuer. |
| (b) | | All or a portion of security is on loan. |
| | |
| |
| Currency Abbreviations: |
| BRL | | Brazilian Real |
| CHF | | Swiss Franc |
| EUR | | Euro |
| USD | | United States Dollar |
| | |
| The accompanying notes are an integral part of these financial statements. | | 13 |
GOLDMAN SACHS VARIABLE INSURANCE TRUST MULTI-STRATEGY ALTERNATIVES PORTFOLIO
|
Schedule of Investments (continued) December 31, 2023 |
|
|
ADDITIONAL INVESTMENT INFORMATION |
FORWARD FOREIGN CURRENCY EXCHANGE CONTRACTS — At December 31, 2023, the Portfolio had the following forward foreign currency exchange contracts:
FORWARD FOREIGN CURRENCY EXCHANGE CONTRACTS WITH UNREALIZED GAIN
| | | | | | | | | | | | | | | | | | | | | | | | |
| Counterparty | | Currency Purchased | | | | Currency Sold | | | | | | Settlement Date | | | | Unrealized Gain | |
| |
Morgan Stanley Co., Inc. | | | | | | | | | | | | | | | | | | | | | | | | |
| | USD | | 78,378 | | | | BRL | | | 380,000 | | | | | | | 2/2/2024 | | | | $ | 286 | |
| | EUR | | 50,000 | | | | USD | | | 54,185 | | | | | | | 3/20/2024 | | | | | 1,184 | |
|
| |
| | | | | | | | | |
TOTAL | | | | | | | | | | | | | | | | | | | | | | $ | 1,470 | |
|
| |
FORWARD FOREIGN CURRENCY EXCHANGE CONTRACTS WITH UNREALIZED LOSS
| | | | | | | | | | | | | | | | | | | | | | | | | | | | |
| Counterparty | | Currency Purchased | | | | Currency Sold | | | | | Settlement Date | | | | | | Unrealized Loss |
| |
Morgan Stanley Co., Inc. | | | | | | | | | | | | | | | | | | | | | | | | | | | | |
| | BRL | | 380,000 | | | | | USD | | | 78,701 | | | | | | | 1/3/2024 | | | | | | | | (473) | |
| | USD | | 77,265 | | | | | BRL | | | 380,000 | | | | | | | 1/3/2024 | | | | | | | | (962) | |
| | USD | | 57,660 | | | | | CHF | | | 50,000 | | | | | | | 3/20/2024 | | | | | | | | (2,267) | |
|
| |
| | | | | | | | | |
TOTAL | | | | | | | | | | | | | | | | | | | | | | | | | | $ | (3,702) | |
|
| |
FUTURES CONTRACTS — At December 31, 2023, the Portfolio had the following futures contracts:
| | | | | | | | | | | | | | | | | | | | | | | | |
| | | | | | | | | | | | | | | | | | | Unrealized |
| | | Number of | | | | Expiration | | | | | | Notional | | | | | | Appreciation/ |
| Description | | Contracts | | | | Date | | | | | | Amount | | | | | | (Depreciation) |
| |
Long position contracts: | | | | | | | | | | | | | | | | | | | | | | | | |
EURO STOXX 50 Index | | 2 | | | | | 03/15/24 | | | | | | | $ | 100,305 | | | | | | | $ | (312) | |
EURO-BUND Week Op Mar24 | | 1 | | | | | 03/07/24 | | | | | | | | 151,429 | | | | | | | | 4,818 | |
U.S. Treasury 10 Year Note | | 9 | | | | | 03/19/24 | | | | | | | | 1,014,609 | | | | | | | | 30,652 | |
|
| |
| | | | | | | |
Total | | | | | | | | | | | | | | | | | | | | | | | 35,158 | |
|
| |
| | | | | | | |
Short position contracts: | | | | | | | | | | | | | | | | | | | | | | | | |
Euro Bund Future | | (1) | | | | | 03/07/24 | | | | | | | | (151,429 | ) | | | | | | | 766 | |
|
| |
| | | | | | | |
Total Futures Contracts | | | | | | | | | | | | | | | | | | | | | | $ | 35,924 | |
|
| |
| | |
| 14 | | The accompanying notes are an integral part of these financial statements. |
GOLDMAN SACHS VARIABLE INSURANCE TRUST MULTI-STRATEGY ALTERNATIVES PORTFOLIO
|
|
ADDITIONAL INVESTMENT INFORMATION (continued) |
PURCHASED OPTIONS CONTRACTS — At December 31, 2023, the Fund had the following purchased option contracts:
| | | | | | | | | | | | | | | | | | | | | | | | | | | | |
| | | | | | | | | | | | | | | | | Premiums Paid | | Unrealized | |
| | | Exercise | | | Expiration | | | Number of | | | | | Market | | | (Received) by | | Appreciation/ | |
| Description | | Rate | | | Date | | | Contracts | | | Notional Amount | | Value | | | the Fund | | (Depreciation) | |
Purchased Option Contracts: Calls | |
| 3 Month Secured Overnight | | | | | | | | | | | | | | | | | | | | | | | | | | | | |
Financing Rate | | | $96.75 | | | | 06/12/2026 | | | | 6 | | | $ | 1,453,650 | | | $ | 11,850 | | | $ | 9,314 | | | $ | 2,536 | |
| 3 Month Secured Overnight | | | | | | | | | | | | | | | | | | | | | | | | | | | | |
Financing Rate | | | 97.50 | | | | 12/12/2025 | | | | 26 | | | | 6,300,775 | | | | 27,463 | | | | 31,260 | | | | (3,798) | |
| 3 Month Secured Overnight | | | | | | | | | | | | | | | | | | | | | | | | | | | | |
Financing Rate | | | 96.50 | | | | 12/12/2025 | | | | 5 | | | | 1,211,688 | | | | 11,281 | | | | 9,024 | | | | 2,257 | |
| 3 Month Secured Overnight | | | | | | | | | | | | | | | | | | | | | | | | | | | | |
Financing Rate | | | 97.50 | | | | 09/12/2025 | | | | 28 | | | | 6,783,000 | | | | 28,000 | | | | 31,565 | | | | (3,565) | |
| 3 Month Secured Overnight | | | | | | | | | | | | | | | | | | | | | | | | | | | | |
Financing Rate | | | 96.63 | | | | 09/12/2025 | | | | 1 | | | | 242,250 | | | | 1,969 | | | | 1,860 | | | | 109 | |
| 3 Month Secured Overnight | | | | | | | | | | | | | | | | | | | | | | | | | | | | |
Financing Rate | | | 96.50 | | | | 09/12/2025 | | | | 5 | | | | 1,211,250 | | | | 10,719 | | | | 8,512 | | | | 2,207 | |
| 3 Month Secured Overnight | | | | | | | | | | | | | | | | | | | | | | | | | | | | |
Financing Rate | | | 97.25 | | | | 06/13/2025 | | | | 24 | | | | 5,807,400 | | | | 25,950 | | | | 29,712 | | | | (3,762) | |
| 3 Month Secured Overnight | | | | | | | | | | | | | | | | | | | | | | | | | | | | |
Financing Rate | | | 96.75 | | | | 06/13/2025 | | | | 6 | | | | 1,451,850 | | | | 11,663 | | | | 9,764 | | | | 1,899 | |
| 3 Month Secured Overnight | | | | | | | | | | | | | | | | | | | | | | | | | | | | |
Financing Rate | | | 96.63 | | | | 06/13/2025 | | | | 1 | | | | 241,975 | | | | 1,750 | | | | 1,723 | | | | 27 | |
| 3 Month Secured Overnight | | | | | | | | | | | | | | | | | | | | | | | | | | | | |
Financing Rate | | | 96.25 | | | | 06/13/2025 | | | | 5 | | | | 1,209,875 | | | | 11,375 | | | | 9,199 | | | | 2,176 | |
| 3 Month Secured Overnight | | | | | | | | | | | | | | | | | | | | | | | | | | | | |
Financing Rate | | | 98.00 | | | | 03/14/2025 | | | | 13 | | | | 3,138,850 | | | | 5,363 | | | | 4,093 | | | | 1,270 | |
| 3 Month Secured Overnight | | | | | | | | | | | | | | | | | | | | | | | | | | | | |
Financing Rate | | | 97.25 | | | | 03/14/2025 | | | | 18 | | | | 4,346,100 | | | | 14,737 | | | | 32,665 | | | | (17,927) | |
| 3 Month Secured Overnight | | | | | | | | | | | | | | | | | | | | | | | | | | | | |
Financing Rate | | | 97.00 | | | | 03/14/2025 | | | | 18 | | | | 4,346,100 | | | | 18,450 | | | | 23,892 | | | | (5,442) | |
| 3 Month Secured Overnight | | | | | | | | | | | | | | | | | | | | | | | | | | | | |
Financing Rate | | | 96.50 | | | | 03/14/2025 | | | | 1 | | | | 241,450 | | | | 1,537 | | | | 1,693 | | | | (156) | |
| 3 Month Secured Overnight | | | | | | | | | | | | | | | | | | | | | | | | | | | | |
Financing Rate | | | 98.00 | | | | 12/13/2024 | | | | 20 | | | | 4,813,500 | | | | 5,500 | | | | 4,047 | | | | 1,454 | |
| 3 Month Secured Overnight | | | | | | | | | | | | | | | | | | | | | | | | | | | | |
Financing Rate | | | 97.25 | | | | 12/13/2024 | | | | 21 | | | | 5,054,175 | | | | 11,550 | | | | 33,518 | | | | (21,969) | |
| 3 Month Secured Overnight | | | | | | | | | | | | | | | | | | | | | | | | | | | | |
Financing Rate | | | 96.25 | | | | 12/13/2024 | | | | 1 | | | | 240,675 | | | | 1,337 | | | | 1,574 | | | | (237) | |
| 3 Month Secured Overnight | | | | | | | | | | | | | | | | | | | | | | | | | | | | |
Financing Rate | | | 97.25 | | | | 09/13/2024 | | | | 12 | | | | 2,877,150 | | | | 3,300 | | | | 15,979 | | | | (12,679) | |
| 3 Month Secured Overnight | | | | | | | | | | | | | | | | | | | | | | | | | | | | |
Financing Rate | | | 96.00 | | | | 09/13/2024 | | | | 1 | | | | 239,763 | | | | 975 | | | | 1,421 | | | | (446) | |
| 3 Month Secured Overnight | | | | | | | | | | | | | | | | | | | | | | | | | | | | |
Financing Rate | | | 95.38 | | | | 09/13/2024 | | | | 5 | | | | 1,198,813 | | | | 8,781 | | | | 20,390 | | | | (11,609) | |
| 3 Month Secured Overnight | | | | | | | | | | | | | | | | | | | | | | | | | | | | |
Financing Rate | | | 95.25 | | | | 09/13/2024 | | | | 4 | | | | 959,050 | | | | 7,850 | | | | 15,996 | | | | (8,146) | |
| 3 Month Secured Overnight | | | | | | | | | | | | | | | | | | | | | | | | | | | | |
Financing Rate | | | 98.50 | | | | 06/14/2024 | | | | 47 | | | | 11,219,487 | | | | 2,056 | | | | 7,034 | | | | (4,978) | |
| 3 Month Secured Overnight | | | | | | | | | | | | | | | | | | | | | | | | | | | | |
Financing Rate | | | 97.75 | | | | 06/14/2024 | | | | 40 | | | | 9,548,500 | | | | 2,750 | | | | 53,460 | | | | (50,710) | |
| 3 Month Secured Overnight | | | | | | | | | | | | | | | | | | | | | | | | | | | | |
Financing Rate | | | 97.25 | | | | 06/14/2024 | | | | 8 | | | | 1,909,700 | | | | 800 | | | | 7,667 | | | | (6,867) | |
| 3 Month Secured Overnight | | | | | | | | | | | | | | | | | | | | | | | | | | | | |
Financing Rate | | | 95.38 | | | | 06/14/2024 | | | | 5 | | | | 1,193,562 | | | | 4,094 | | | | 18,375 | | | | (14,282) | |
| 3 Month Secured Overnight | | | | | | | | | | | | | | | | | | | | | | | | | | | | |
Financing Rate | | | 95.13 | | | | 06/14/2024 | | | | 4 | | | | 954,850 | | | | 4,725 | | | | 14,119 | | | | (9,394) | |
| 3 Month Secured Overnight | | | | | | | | | | | | | | | | | | | | | | | | | | | | |
Financing Rate | | | 97.75 | | | | 03/15/2024 | | | | 46 | | | | 10,926,725 | | | | 862 | | | | 54,441 | | | | (53,578) | |
| | |
| The accompanying notes are an integral part of these financial statements. | | 15 |
GOLDMAN SACHS VARIABLE INSURANCE TRUST MULTI - STRATEGY ALTERNATIVES PORTFOLIO
|
Schedule of Investments (continued) December 31, 2023 |
|
|
ADDITIONAL INVESTMENT INFORMATION (continued) |
| | | | | | | | | | | | | | | | | | | | | | | | | | | | |
| | | | | | | | | | | | | | | | | | Premiums Paid | | | Unrealized | |
| | | Exercise | | | Expiration | | | Number of | | | | | | Market | | | (Received) by | | | Appreciation/ | |
| Description | | Rate | | | Date | | | Contracts | | | Notional Amount | | | Value | | | the Fund | | | (Depreciation) | |
3 Month Secured Overnight Financing Rate | | $ | 95.38 | | | | 03/15/2024 | | | | 5 | | | $ | 1,187,687 | | | $ | 719 | | | $ | 15,921 | | | $ | (15,202) | |
3 Month Secured Overnight Financing Rate | | | 95.00 | | | | 03/15/2024 | | | | 8 | | | | 1,900,300 | | | | 2,650 | | | | 23,424 | | | | (20,774) | |
Total purchased option contracts | | | | | | | | | | | 384 | | | $ | 92,210,150 | | | $ | 240,056 | | | $ | 491,642 | | | $ | (251,586) | |
| | |
| 16 | | The accompanying notes are an integral part of these financial statements. |
GOLDMAN SACHS VARIABLE INSURANCE TRUST TREND DRIVEN ALLOCATION FUND
|
Schedule of Investments December 31, 2023 |
| | | | | | | | |
| | | Shares | | Dividend Rate | | Value | |
| |
| | Investment Companies (Institutional Shares) – 68.9%(a) | |
| | Goldman Sachs Financial Square Government Fund | |
| | 40,408,374 | | 5.248% | | $ | 40,408,374 | |
| | Goldman Sachs Financial Square Treasury Instruments Fund | |
| | 38,864,945 | | 5.206 | | | 38,864,945 | |
| | Goldman Sachs Financial Square Treasury Obligations Fund | |
| | 38,870,537 | | 5.241 | | | 38,870,537 | |
| | Goldman Sachs Financial Square Treasury Solutions Fund | |
| | 38,392,063 | | 5.231 | | | 38,392,063 | |
| | Goldman Sachs VIT Government Money Market Fund | |
| | 35,050,510 | | 5.270 | | | 35,050,510 | |
| | | |
| |
| | Total Investment Companies | |
| | (Cost $191,586,429) | | | 191,586,429 | |
| | | |
| | | |
| | | | Description | | | | |
| |
| | Exchange-Traded Funds – 25.0% | |
| | | |
| | 75,565 | | iShares Core S&P 500 ETF | | | 36,092,111 | |
| | 76,300 | | Vanguard S&P 500 ETF | | | 33,327,840 | |
| | | |
| | TOTAL EXCHANGE-TRADED FUNDS | |
| | (Cost $41,770,457) | | | 69,419,951 | |
| | | |
| | TOTAL INVESTMENTS – 93.9% | |
| | (Cost $233,356,886) | | $ | 261,006,380 | |
| | | |
| | OTHER ASSETS IN EXCESS OF LIABILITIES – 6.1% | | | 17,006,589 | |
| | | |
| | NET ASSETS – 100.0% | | $ | 278,012,969 | |
| | | |
The percentage shown for each investment category reflects the value of investments in that category as a percentage of net assets.
| (a) | Represents an affiliated issuer. |
| | |
| |
| | | ADDITIONAL INVESTMENT INFORMATION |
FUTURES CONTRACTS — At December 31, 2023, the Fund had the following futures contracts:
| | | | | | | | | | | | | | | | |
| | | | | | | | | | | | Unrealized | |
| | | Number of | | | Expiration | | | Notional | | | Appreciation/ | |
| Description | | Contracts | | | Date | | | Amount | | | (Depreciation) | |
Long position contracts: | | | | | | | | | | | | | | | | |
EURO STOXX 50 Index | | | 372 | | | | 03/15/24 | | | $ | 18,656,714 | | | $ | (113,834 | ) |
FTSE 100 Index | | | 84 | | | | 03/15/24 | | | | 8,304,937 | | | | 189,035 | |
S&P 500 E-Mini Index | | | 348 | | | | 03/15/24 | | | | 83,868,000 | | | | 2,119,971 | |
TOPIX Index | | | 76 | | | | 03/07/24 | | | | 12,752,908 | | | | 144,576 | |
U.S. Treasury 10 Year Note | | | 752 | | | | 03/19/24 | | | | 84,776,250 | | | | 2,966,400 | |
| Total Futures Contracts | | | | | | | | | | | | | | $ | 5,306,148 | |
| | |
| The accompanying notes are an integral part of these financial statements. | | 17 |
GOLDMAN SACHS VARIABLE INSURANCE TRUST MULTI-ASSET STRATEGIES FUNDS
|
Statements of Assets and Liabilities December 31, 2023 |
| | | | | | | | | | | | |
| | | | | Multi-Strategy
Alternatives Portfolio | | | Trend Driven Allocation
Fund |
| | | | |
| | Assets: | | | | | | | | | | |
| | | | |
| | Investments in affiliated issuers, at value (cost $36,081,010 and $191,586,429, respectively)(a) | | $ | 36,988,240 | | | $ | 191,586,429 | | | |
| | Investments in unaffiliated issuers, at value (cost $282,382 and $41,770,457, respectively) | | | 299,271 | | | | 69,419,951 | | | |
| | Investments in affiliated securities lending reinvestment vehicle, at value which equals cost | | | 6,700 | | | | — | | | |
| | Purchased Options, at value (premiums paid $491,642 and $–, respectively) | | | 240,056 | | | | — | | | |
| | Cash | | | 609,445 | | | | 8,113,476 | | | |
| | Foreign Currency, at value (cost $– and $210,979, respectively) | | | — | | | | 218,392 | | | |
| | Receivables: | | | | | | | | | | |
| | Reimbursement from investment adviser | | | 8,975 | | | | 3,928 | | | |
| | Due from broker | | | 6,242 | | | | — | | | |
| | Dividends | | | 6,012 | | | | 507,445 | | | |
| | Fund shares sold | | | 4,289 | | | | 129,201 | | | |
| | Collateral for futures contracts | | | — | | | | 8,513,209 | | | |
| | Unrealized gain on forward foreign currency exchange contracts | | | 1,470 | | | | — | | | |
| | Variation margin on futures contracts | | | 150 | | | | — | | | |
| | Other assets | | | 5,609 | | | | — | | | |
| | |
| | Total assets | | | 38,176,459 | | | | 278,492,031 | | | |
| | |
| | | | | | | | | | | | |
| | | | |
| | Liabilities: | | | | | | | | | | |
| | | | |
| | Variation margin on futures contracts | | | — | | | | 119,610 | | | |
| | Unrealized loss on forward foreign currency exchange contracts | | | 3,702 | | | | — | | | |
| | Payables: | | | | | | | | | | |
| | Distribution and Service fees and Transfer Agency fees | | | 59,233 | | | | 63,082 | | | |
| | Fund shares redeemed | | | 13,064 | | | | 80,609 | | | |
| | Payable upon return of securities loaned | | | 6,700 | | | | — | | | |
| | Management fees | | | — | | | | 149,871 | | | |
| | Accrued expenses | | | 49,270 | | | | 65,890 | | | |
| | |
| | Total liabilities | | | 131,969 | | | | 479,062 | | | |
| | |
| | | | |
| | Net Assets: | | | | | | | | | | |
| | | | |
| | Paid-in Capital | | | 41,984,156 | | | | 275,331,784 | | | |
| | Total distributable earnings (loss) | | | (3,939,666 | ) | | | 2,681,185 | | | |
| | |
| | NET ASSETS | | $ | 38,044,490 | | | $ | 278,012,969 | | | |
| | | Net Assets: | | | | | | | | | | |
| | | Institutional | | $ | 1,979,415 | | | $ | 441,961 | | | |
| | | Service | | | 12,055,069 | | | | 277,571,008 | | | |
| | | Advisor | | | 24,010,006 | | | | — | | | |
| | | Total Net Assets | | $ | 38,044,490 | | | $ | 278,012,969 | | | |
| | | Shares Outstanding $0.001 par value (unlimited number of shares authorized): | | | | | | | | | | |
| | | Institutional | | | 222,735 | | | | 38,651 | | | |
| | | Service | | | 1,355,623 | | | | 24,455,403 | | | |
| | | Advisor | | | 2,716,108 | | | | — | | | |
| | | Net asset value, offering and redemption price per share: | | | | | | | | | | |
| | | Institutional | | $ | 8.89 | | | $ | 11.43 | | | |
| | | Service | | | 8.89 | | | | 11.35 | | | |
| | | Advisor | | | 8.84 | | | | — | | | |
| | (a) | Includes loaned securities having a market value of $6,535 and $–, respectively. |
| | |
| 18 | | The accompanying notes are an integral part of these financial statements. |
GOLDMAN SACHS VARIABLE INSURANCE TRUST MULTI-ASSET STRATEGIES FUNDS
|
Statements of Operations For the Fiscal Year Ended December 31, 2023 |
| | | | | | | | | | | | | | |
| | | | | Multi-Strategy
Alternatives
Portfolio | | | Trend Driven
Allocation Fund | |
| | | | |
| | Investment income: | | | | | | | | | | | | |
| | | | |
| | Dividends — affiliated Underlying Funds | | $ | 1,517,736 | | | $ | 7,021,522 | | | | | |
| | | | |
| | Securities lending income, net of rebates received or paid to borrowers – affiliated issuer | | | 7,432 | | | | — | | | | | |
| | | | |
| | Dividends — unaffiliated issuers | | | 5,767 | | | | 1,386,276 | | | | | |
| | | |
| | | | |
| | Total Investment Income | | | 1,530,935 | | | | 8,407,798 | | | | | |
| | | |
| | | | | | | | | | | | | | |
| | | | |
| | Expenses: | | | | | | | | | | | | |
| | | | |
| | Distribution and/or Service (12b-1) fees(a) | | | 106,960 | | | | 687,361 | | | | | |
| | | | |
| | Professional fees | | | 70,760 | | | | 62,837 | | | | | |
| | | | |
| | Custody, accounting and administrative services | | | 64,041 | | | | 54,037 | | | | | |
| | | | |
| | Management fees | | | 54,701 | | | | 2,175,600 | | | | | |
| | | | |
| | Printing and mailing costs | | | 50,240 | | | | 40,667 | | | | | |
| | | | |
| | Trustee fees | | | 21,513 | | | | 20,329 | | | | | |
| | | | |
| | Shareholder Administration fees — Service Shares | | | 14,214 | | | | — | | | | | |
| | | | |
| | Transfer Agency fees(a) | | | 7,293 | | | | 55,079 | | | | | |
| | | | |
| | Shareholder meeting expense | | | 1,480 | | | | 10,982 | | | | | |
| | | | |
| | Other | | | 10,677 | | | | 28,167 | | | | | |
| | | |
| | | | |
| | Total expenses | | | 401,879 | | | | 3,135,059 | | | | | |
| | | |
| | | | |
| | Less — expense reductions | | | (201,504 | ) | | | (613,589 | ) | | | | |
| | | |
| | | | |
| | Net expenses | | | 200,375 | | | | 2,521,470 | | | | | |
| | | |
| | | | |
| | NET INVESTMENT INCOME | | | 1,330,560 | | | | 5,886,328 | | | | | |
| | | |
| | | | | | | | | | | | | | |
| | | | |
| | Realized and Unrealized gain (loss): | | | | | | | | | | | | |
| | | | |
| | Net realized gain (loss) from: | | | | | | | | | | | | |
| | | | |
| | Investments — unaffiliated issuers | | | 16,667 | | | | 3,613,645 | | | | | |
| | | | |
| | Investment — affiliated Underlying Funds | | | (121,496 | ) | | | — | | | | | |
| | | | |
| | Futures contracts | | | (47,283 | ) | | | 8,151,940 | | | | | |
| | | | |
| | Foreign currency transactions | | | 41 | | | | 93,649 | | | | | |
| | | | |
| | Purchased Options | | | (133,344 | ) | | | — | | | | | |
| | | | |
| | Forward foreign currency exchange contracts | | | (1,682 | ) | | | — | | | | | |
| | | | |
| | Capital gain distributions from affiliated Underlying Funds | | | 2,817 | | | | — | | | | | |
| | | | |
| | Net change in unrealized gain (loss) on: | | | | | | | | | | | | |
| | | | |
| | Investments — unaffiliated issuers | | | 16,889 | | | | 11,313,902 | | | | | |
| | | | |
| | Investment — affiliated Underlying Funds | | | 1,676,504 | | | | — | | | | | |
| | | | |
| | Futures contracts | | | 42,145 | | | | 10,549,348 | | | | | |
| | | | |
| | Foreign currency translations | | | (1,617 | ) | | | 140,370 | | | | | |
| | | | |
| | Purchased Options | | | (27,138 | ) | | | — | | | | | |
| | | | |
| | Forward foreign currency exchange contracts | | | (2,082 | ) | | | — | | | | | |
| | | |
| | Net realized and unrealized gain | | | 1,420,421 | | | | 33,862,854 | | | | | |
| | | |
| | NET INCREASE IN NET ASSETS RESULTING FROM OPERATIONS | | $ | 2,750,981 | | | $ | 39,749,182 | | | | | |
| | | |
| | (a) | Class specific Distribution and/or Service and Transfer Agency fees were as follows: |
| | | | | | | | | | | | | | | | | | | | | | |
| | | Distribution and/or
Service (12b-1) fees | | | Transfer Agency Fees | | | |
| Fund | | Service | | | Advisor | | | Institutional | | | Service | | | Advisor | |
Multi-Strategy Alternatives Portfolio | | $ | 14,214 | | | $ | 92,746 | | | $ | 382 | | | $ | 2,274 | | | $ | 4,637 | |
Trend Driven Allocation Fund | | | 687,361 | | | | – | | | | 90 | | | | 54,989 | | | | – | |
| | |
| The accompanying notes are an integral part of these financial statements. | | 19 |
GOLDMAN SACHS VARIABLE INSURANCE TRUST MULTI-ASSET STRATEGIES FUNDS
|
Statements of Changes in Net Assets December 31, 2023 |
| | | | | | | | | | | | | | | | | | |
| | | | | Multi-Strategy Alternatives Portfolio | | | Trend Driven Allocation Fund | |
| | | | | |
| | | | | For the Fiscal Year Ended
December 31, 2023 | | | For the Fiscal Year Ended
December 31, 2022 | | | For the Fiscal Year Ended
December 31, 2023 | | | For the Fiscal Year Ended
December 31, 2022 | |
| | | | | |
| | From operations: | | | | | | | | | | | | | | | | |
| | | | | |
| | Net investment income | | $ | 1,330,560 | | | $ | 1,559,129 | | | $ | 5,886,328 | | | $ | 404,319 | |
| | | | | |
| | Net realized gain (loss) | | | (284,280 | ) | | | (3,743,647 | ) | | | 11,859,234 | | | | (33,971,393) | |
| | | | | |
| | Net change in unrealized gain (loss) | | | 1,704,701 | | | | (1,315,124 | ) | | | 22,003,620 | | | | (32,715,194) | |
| | | |
| | | | | |
| | Net increase (decrease) in net assets resulting from operations | | | 2,750,981 | | | | (3,499,642 | ) | | | 39,749,182 | | | | (66,282,268) | |
| | | |
| | | | | | | | | | | | | | | | | | |
| | | | | |
| | Distributions to shareholders: | | | | | | | | | | | | | | | | |
| | | | | |
| | From distributable earnings: | | | | | | | | | | | | | | | | |
| | | | | |
| | Institutional Shares | | | (130,485 | ) | | | (84,430 | ) | | | (8,240 | ) | | | (20,604) | |
| | | | | |
| | Service Shares | | | (765,139 | ) | | | (388,859 | ) | | | (4,606,548 | ) | | | (10,871,371) | |
| | | | | |
| | Advisor Shares | | | (1,504,491 | ) | | | (806,855 | ) | | | – | | | | – | |
| | | |
| | | | | |
| | Total distributions to shareholders | | | (2,400,115 | ) | | | (1,280,144 | ) | | | (4,614,788 | ) | | | (10,891,975) | |
| | | |
| | | | | | | | | | | | | | | | | | |
| | | | | |
| | From share transactions: | | | | | | | | | | | | | | | | |
| | | | | |
| | Proceeds from sales of shares | | | 7,733,501 | | | | 76,038,713 | | | | 12,946,328 | | | | 25,924,207 | |
| | | | | |
| | Reinvestment of distributions | | | 2,400,115 | | | | 1,280,144 | | | | 4,614,788 | | | | 10,891,975 | |
| | | | | |
| | Cost of shares redeemed | | | (9,199,182 | ) | | | (65,417,529 | ) | | | (42,122,016 | ) | | | (49,855,165) | |
| | | |
| | | | | |
| | Net increase (decrease) in net assets resulting from share transactions | | | 934,434 | | | | 11,901,328 | | | | (24,560,900 | ) | | | (13,038,983) | |
| | | |
| | | | | |
| | TOTAL INCREASE (DECREASE) | | | 1,285,300 | | | | 7,121,542 | | | | 10,573,494 | | | | (90,213,226) | |
| | | |
| | | | | | | | | | | | | | | | | | |
| | | | | |
| | Net Assets: | | | | | | | | | | | | | | | | |
| | | | | |
| | Beginning of year | | | 36,759,190 | | | | 29,637,648 | | | | 267,439,475 | | | | 357,652,701 | |
| | | |
| | | | | |
| | End of year | | $ | 38,044,490 | | | $ | 36,759,190 | | | $ | 278,012,969 | | | $ | 267,439,475 | |
| | | |
| | |
| 20 | | The accompanying notes are an integral part of these financial statements. |
GOLDMAN SACHS VARIABLE INSURANCE TRUST MULTI-STRATEGY ALTERNATIVES PORTFOLIO
|
Financial Highlights Selected Data for a Share Outstanding Throughout Each Year |
| | | | | | | | | | | | | | | | | | | | | | | | | | | |
| | | | | Goldman Sachs Multi-Strategy Alternatives Portfolio |
| | |
| | | | | Institutional Shares |
| | |
| | | | | Year Ended December 31, |
| | | | | | |
| | | | | 2023 | | 2022 | | 2021 | | 2020 | | 2019 |
| | | | | | |
| | Per Share Data | | | | | | | | | | | | | | | | | | | | | | | | | |
| | | | | | |
| | | Net asset value, beginning of year | | | $ | 8.81 | | | | $ | 9.77 | | | | $ | 9.46 | | | | $ | 9.02 | | | | $ | 8.51 | |
| | | |
| | | | | | |
| | Net investment income(a)(b) | | | | 0.36 | | | | | 0.38 | | | | | 0.23 | | | | | 0.25 | | | | | 0.30 | |
| | | | | | |
| | Net realized and unrealized gain (loss) | | | | 0.35 | | | | | (0.99 | ) | | | | 0.25 | | | | | 0.39 | | | | | 0.48 | |
| | | |
| | | | | | |
| | Total from investment operations | | | | 0.71 | | | | | (0.61 | ) | | | | 0.48 | | | | | 0.64 | | | | | 0.78 | |
| | | |
| | | | | | |
| | Distributions to shareholders from net investment income | | | | (0.63 | ) | | | | (0.35 | ) | | | | (0.17 | ) | | | | (0.20 | ) | | | | (0.27) | |
| | | |
| | | | | | |
| | Net asset value, end of year | | | $ | 8.89 | | | | $ | 8.81 | | | | $ | 9.77 | | | | $ | 9.46 | | | | $ | 9.02 | |
| | | |
| | | | | | |
| | Total Return(c) | | | | 7.90 | % | | | | (6.24 | )% | | | | 5.03 | % | | | | 7.05 | % | | | | 9.11% | |
| | | |
| | | | | | |
| | Net assets, end of year (in 000’s) | | | $ | 1,979 | | | | $ | 2,203 | | | | $ | 2,515 | | | | $ | 1,520 | | | | $ | 1,309 | |
| | | | | | |
| | Ratio of net expenses to average net assets(d) | | | | 0.22 | % | | | | 0.20 | % | | | | 0.22 | % | | | | 0.21 | % | | | | 0.25% | |
| | | | | | |
| | Ratio of total expenses to average net assets(d) | | | | 0.77 | % | | | | 0.69 | % | | | | 1.02 | % | | | | 1.39 | % | | | | 1.60% | |
| | | | | | |
| | Ratio of net investment income to average net assets | | | | 3.98 | % | | | | 4.08 | % | | | | 2.29 | % | | | | 2.73 | % | | | | 3.30% | |
| | | | | | |
| | Portfolio turnover rate(e) | | | | 23 | % | | | | 199 | % | | | | 25 | % | | | | 5 | % | | | | 26% | |
| | | |
| | (a) | Calculated based on the average shares outstanding methodology. |
| | (b) | Recognition of net investment income by the Fund is affected by the timing of declaration of dividends by the Underlying Funds in which the Fund invests. |
| | (c) | Assumes investment at the NAV at the beginning of the year, reinvestment of all dividends and distributions, a complete redemption of the investment at the NAV at the end of the year and no sales or redemption charges (if any). Total returns would be reduced if a sales or redemption charge was taken into account. Returns do not reflect the impact of taxes to shareholders relating to Fund distributions or the redemption of Fund shares. |
| | (d) | Expense ratios exclude the expenses of the Underlying Funds in which the Fund invests. |
| | (e) | The Fund’s portfolio turnover rate is calculated in accordance with regulatory requirements, without regard to transactions involving short term investments and certain derivatives. If such transactions were included, the Fund’s portfolio turnover rate may be higher. |
| | |
| The accompanying notes are an integral part of these financial statements. | | 21 |
GOLDMAN SACHS VARIABLE INSURANCE TRUST MULTI-STRATEGY ALTERNATIVES PORTFOLIO
|
Financial Highlights (continued) Selected Data for a Share Outstanding Throughout Each Year |
| | | | | | | | | | | | | | | | | | | | | | | | | | | |
| | | | | Goldman Sachs Multi-Strategy Alternatives Portfolio |
| | |
| | | | | Service Shares |
| | |
| | | | | Year Ended December 31, |
| | | | | | |
| | | | | 2023 | | 2022 | | 2021 | | 2020 | | 2019 |
| | | | | | |
| | Per Share Data | | | | | | | | | | | | | | | | | | | | | | | | | |
| | | | | | |
| | | Net asset value, beginning of year | | | $ | 8.81 | | | | $ | 9.76 | | | | $ | 9.45 | | | | $ | 9.02 | | | | $ | 8.52 | |
| | | |
| | | | | | |
| | Net investment income(a)(b) | | | | 0.34 | | | | | 0.31 | | | | | 0.20 | | | | | 0.23 | | | | | 0.32 | |
| | | | | | |
| | Net realized and unrealized gain (loss) | | | | 0.34 | | | | | (0.95 | ) | | | | 0.26 | | | | | 0.38 | | | | | 0.43 | |
| | | |
| | | | | | |
| | Total from investment operations | | | | 0.68 | | | | | (0.64 | ) | | | | 0.46 | | | | | 0.61 | | | | | 0.75 | |
| | | |
| | | | | | |
| | Distributions to shareholders from net investment income | | | | (0.60 | ) | | | | (0.31 | ) | | | | (0.15 | ) | | | | (0.18 | ) | | | | (0.25) | |
| | | |
| | | | | | |
| | Net asset value, end of year | | | $ | 8.89 | | | | $ | 8.81 | | | | $ | 9.76 | | | | $ | 9.45 | | | | $ | 9.02 | |
| | | |
| | | | | | |
| | Total Return(c) | | | | 7.77 | % | | | | (6.54 | )% | | | | 4.84 | % | | | | 6.70 | % | | | | 8.82% | |
| | | |
| | | | | | |
| | Net assets, end of year (in 000’s) | | | $ | 12,055 | | | | $ | 11,356 | | | | $ | 6,538 | | | | $ | 3,472 | | | | $ | 2,857 | |
| | | | | | |
| | Ratio of net expenses to average net assets(d) | | | | 0.47 | % | | | | 0.45 | % | | | | 0.47 | % | | | | 0.46 | % | | | | 0.51% | |
| | | | | | |
| | Ratio of total expenses to average net assets(d) | | | | 1.02 | % | | | | 0.88 | % | | | | 1.28 | % | | | | 1.65 | % | | | | 1.86% | |
| | | | | | |
| | Ratio of net investment income to average net assets | | | | 3.74 | % | | | | 3.34 | % | | | | 2.04 | % | | | | 2.51 | % | | | | 3.54% | |
| | | | | | |
| | Portfolio turnover rate(e) | | | | 23 | % | | | | 199 | % | | | | 25 | % | | | | 5 | % | | | | 26% | |
| | | |
| | (a) | Calculated based on the average shares outstanding methodology. |
| | (b) | Recognition of net investment income by the Fund is affected by the timing of declaration of dividends by the Underlying Funds in which the Fund invests. |
| | (c) | Assumes investment at the NAV at the beginning of the year, reinvestment of all dividends and distributions, a complete redemption of the investment at the NAV at the end of the year and no sales or redemption charges (if any). Total returns would be reduced if a sales or redemption charge was taken into account. Returns do not reflect the impact of taxes to shareholders relating to Fund distributions or the redemption of Fund shares. |
| | (d) | Expense ratios exclude the expenses of the Underlying Funds in which the Fund invests. |
| | (e) | The Fund’s portfolio turnover rate is calculated in accordance with regulatory requirements, without regard to transactions involving short term investments and certain derivatives. If such transactions were included, the Fund’s portfolio turnover rate may be higher. |
| | |
| 22 | | The accompanying notes are an integral part of these financial statements. |
GOLDMAN SACHS VARIABLE INSURANCE TRUST MULTI-STRATEGY ALTERNATIVES PORTFOLIO
|
Financial Highlights (continued) Selected Data for a Share Outstanding Throughout Each Year |
| | | | | | | | | | | | | | | | | | | | | | | | | | | |
| | | | | Goldman Sachs Multi-Strategy Alternatives Portfolio |
| | |
| | | | | Advisor Shares |
| | |
| | | | | Year Ended December 31, |
| | | | | | |
| | | | | 2023 | | 2022 | | 2021 | | 2020 | | 2019 |
| | | | | | |
| | | Per Share Data | | | | | | | | | | | | | | | | | | | | | | | | | |
| | | | | | |
| | Net asset value, beginning of year | | | $ | 8.77 | | | | $ | 9.73 | | | | $ | 9.42 | | | | $ | 8.99 | | | | $ | 8.49 | |
| | | |
| | | | | | |
| | Net investment income(a)(b) | | | | 0.32 | | | | | 0.37 | | | | | 0.18 | | | | | 0.20 | | | | | 0.24 | |
| | | | | | |
| | Net realized and unrealized gain (loss) | | | | 0.34 | | | | | (1.01 | ) | | | | 0.26 | | | | | 0.39 | | | | | 0.49 | |
| | | |
| | | | | | |
| | Total from investment operations | | | | 0.66 | | | | | (0.64 | ) | | | | 0.44 | | | | | 0.59 | | | | | 0.73 | |
| | | |
| | | | | | |
| | Distributions to shareholders from net investment income | | | | (0.59 | ) | | | | (0.32 | ) | | | | (0.13 | ) | | | | (0.16 | ) | | | | (0.23) | |
| | | |
| | | | | | |
| | Net asset value, end of year | | | $ | 8.84 | | | | $ | 8.77 | | | | $ | 9.73 | | | | $ | 9.42 | | | | $ | 8.99 | |
| | | |
| | | | | | |
| | Total Return(c) | | | | 7.53 | % | | | | (6.61 | )% | | | | 4.66 | % | | | | 6.56 | % | | | | 8.60% | |
| | | |
| | | | | | |
| | Net assets, end of year (in 000’s) | | | $ | 24,010 | | | | $ | 23,200 | | | | $ | 20,585 | | | | $ | 17,698 | | | | $ | 15,410 | |
| | | | | | |
| | Ratio of net expenses to average net assets(d) | | | | 0.62 | % | | | | 0.60 | % | | | | 0.62 | % | | | | 0.61 | % | | | | 0.64% | |
| | | | | | |
| | Ratio of total expenses to average net assets(d) | | | | 1.17 | % | | | | 1.09 | % | | | | 1.44 | % | | | | 1.79 | % | | | | 2.01% | |
| | | | | | |
| | Ratio of net investment income to average net assets | | | | 3.58 | % | | | | 3.99 | % | | | | 1.89 | % | | | | 2.28 | % | | | | 2.61% | |
| | | | | | |
| | Portfolio turnover rate(e) | | | | 23 | % | | | | 199 | % | | | | 25 | % | | | | 5 | % | | | | 26% | |
| | | |
| | (a) | Calculated based on the average shares outstanding methodology. |
| | (b) | Recognition of net investment income by the Fund is affected by the timing of declaration of dividends by the Underlying Funds in which the Fund invests. |
| | (c) | Assumes investment at the NAV at the beginning of the year, reinvestment of all dividends and distributions, a complete redemption of the investment at the NAV at the end of the year and no sales or redemption charges (if any). Total returns would be reduced if a sales or redemption charge was taken into account. Returns do not reflect the impact of taxes to shareholders relating to Fund distributions or the redemption of Fund shares. |
| | (d) | Expense ratios exclude the expenses of the Underlying Funds in which the Fund invests. |
| | (e) | The Fund’s portfolio turnover rate is calculated in accordance with regulatory requirements, without regard to transactions involving short term investments and certain derivatives. If such transactions were included, the Fund’s portfolio turnover rate may be higher. |
| | |
| The accompanying notes are an integral part of these financial statements. | | 23 |
GOLDMAN SACHS TREND DRIVEN ALLOCATION FUND
|
Financial Highlights (continued) Selected Data for a Share Outstanding Throughout Each Year |
| | | | | | | | | | | | | | | | | | | | | | | | | | | |
| | | | | Goldman Sachs Trend Driven Allocation Fund |
| | |
| | | | | Institutional Shares |
| | |
| | | | | Year Ended December 31, |
| | | | | | |
| | | | | 2023 | | 2022 | | 2021 | | 2020 | | 2019 |
| | | | | | |
| | | Per Share Data | | | | | | | | | | | | | | | | | | | | | | | | | |
| | | | | | |
| | Net asset value, beginning of year | | | $ | 10.06 | | | | $ | 12.92 | | | | $ | 12.61 | | | | $ | 12.32 | | | | $ | 11.65 | |
| | | |
| | | | | | |
| | Net investment income (loss)(a) | | | | 0.26 | | | | | 0.07 | | | | | (0.04 | ) | | | | 0.02 | | | | | 0.15 | |
| | | | | | |
| | Net realized and unrealized gain (loss) | | | | 1.33 | | | | | (2.51 | ) | | | | 2.10 | | | | | 0.52 | | | | | 1.28 | |
| | | |
| | | | | | |
| | Total from investment operations | | | | 1.59 | | | | | (2.44 | ) | | | | 2.06 | | | | | 0.54 | | | | | 1.43 | |
| | | |
| | | | | | |
| | Distributions to shareholders from net investment income | | | | (0.22 | ) | | | | – | | | | | – | | | | | (0.07 | ) | | | | (0.22) | |
| | | | | | |
| | Distributions to shareholders from net realized gains | | | | – | | | | | (0.42 | ) | | | | (1.75 | ) | | | | (0.18 | ) | | | | (0.54) | |
| | | |
| | | | | | |
| | Total distributions | | | | (0.22 | ) | | | | (0.42 | ) | | | | (1.75 | ) | | | | (0.25 | ) | | | | (0.76) | |
| | | |
| | | | | | |
| | Net asset value, end of year | | | $ | 11.43 | | | | $ | 10.06 | | | | $ | 12.92 | | | | $ | 12.61 | | | | $ | 12.32 | |
| | | |
| | | | | | |
| | Total Return(b) | | | | 15.85 | % | | | | (19.00 | )% | | | | 16.46 | % | | | | 4.35 | % | | | | 12.29% | |
| | | |
| | | | | | |
| | Net assets, end of year (in 000’s) | | | $ | 442 | | | | $ | 506 | | | | $ | 337 | | | | $ | 289 | | | | $ | 277 | |
| | | | | | |
| | Ratio of net expenses to average net assets | | | | 0.67 | % | | | | 0.66 | % | | | | 0.65 | % | | | | 0.60 | % | | | | 0.59% | |
| | | | | | |
| | Ratio of total expenses to average net assets | | | | 0.89 | % | | | | 0.92 | % | | | | 0.87 | % | | | | 0.90 | % | | | | 0.89% | |
| | | | | | |
| | Ratio of net investment income (loss) to average net assets | | | | 2.38 | % | | | | 0.63 | % | | | | (0.32 | )% | | | | 0.13 | % | | | | 1.18% | |
| | | | | | |
| | Portfolio turnover rate(c) | | | | 10 | % | | | | 344 | % | | | | 12 | % | | | | 168 | % | | | | 61% | |
| | | |
| | (a) | Calculated based on the average shares outstanding methodology. |
| | (b) | Assumes investment at the NAV at the beginning of the year, reinvestment of all dividends and distributions, a complete redemption of the investment at the NAV at the end of the year and no sales or redemption charges (if any). Total returns would be reduced if a sales or redemption charge was taken into account. Returns do not reflect the impact of taxes to shareholders relating to Fund distributions or the redemption of Fund shares. |
| | (c) | The Fund’s portfolio turnover rate is calculated in accordance with regulatory requirements, without regard to transactions involving short term investments and certain derivatives. If such transactions were included, the Fund’s portfolio turnover rate may be higher. |
| | |
| 24 | | The accompanying notes are an integral part of these financial statements. |
GOLDMAN SACHS VARIABLE INSURANCE TRUST TREND DRIVEN ALLOCATION FUND
|
Financial Highlights (continued) Selected Data for a Share Outstanding Throughout Each Year |
| | | | | | | | | | | | | | | | | | | | | | | | | | | |
| | | | | Goldman Sachs Trend Driven Allocation Fund |
| | |
| | | | | Service Shares |
| | |
| | | | | Year Ended December 31, |
| | | | | | |
| | | | | 2023 | | 2022 | | 2021 | | 2020 | | 2019 |
| | | | | | |
| | | Per Share Data | | | | | | | | | | | | | | | | | | | | | | | | | |
| | | | | | |
| | Net asset value, beginning of year | | | $ | 9.99 | | | | $ | 12.86 | | | | $ | 12.59 | | | | $ | 12.30 | | | | $ | 11.64 | |
| | | |
| | | | | | |
| | Net investment income (loss)(a) | | | | 0.23 | | | | | 0.02 | | | | | (0.08 | ) | | | | (0.01 | ) | | | | 0.11 | |
| | | | | | |
| | Net realized and unrealized gain (loss) | | | | 1.32 | | | | | (2.47 | ) | | | | 2.10 | | | | | 0.51 | | | | | 1.28 | |
| | | |
| | | | | | |
| | Total from investment operations | | | | 1.55 | | | | | (2.45 | ) | | | | 2.02 | | | | | 0.50 | | | | | 1.39 | |
| | | |
| | | | | | |
| | Distributions to shareholders from net investment income | | | | (0.19 | ) | | | | – | | | | | – | | | | | (0.03 | ) | | | | (0.19) | |
| | | | | | |
| | Distributions to shareholders from net realized gains | | | | – | | | | | (0.42 | ) | | | | (1.75 | ) | | | | (0.18 | ) | | | | (0.54) | |
| | | |
| | | | | | |
| | Total distributions | | | | (0.19 | ) | | | | (0.42 | ) | | | | (1.75 | ) | | | | (0.21 | ) | | | | (0.73) | |
| | | |
| | | | | | |
| | Net asset value, end of year | | | $ | 11.35 | | | | $ | 9.99 | | | | $ | 12.86 | | | | $ | 12.59 | | | | $ | 12.30 | |
| | | |
| | | | | | |
| | Total Return(b) | | | | 15.57 | % | | | | (19.16 | )% | | | | 16.17 | % | | | | 4.10 | % | | | | 11.94% | |
| | | |
| | | | | | |
| | Net assets, end of year (in 000’s) | | | $ | 277,571 | | | | $ | 266,934 | | | | $ | 357,316 | | | | $ | 335,784 | | | | $ | 345,219 | |
| | | | | | |
| | Ratio of net expenses to average net assets | | | | 0.92 | % | | | | 0.91 | % | | | | 0.92 | % | | | | 0.85 | % | | | | 0.84% | |
| | | | | | |
| | Ratio of total expenses to average net assets | | | | 1.14 | % | | | | 1.17 | % | | | | 1.14 | % | | | | 1.15 | % | | | | 1.14% | |
| | | | | | |
| | Ratio of net investment income (loss) to average net assets | | | | 2.14 | % | | | | 0.13 | % | | | | (0.58 | )% | | | | (0.12 | )% | | | | 0.91% | |
| | | | | | |
| | Portfolio turnover rate(c) | | | | 10 | % | | | | 344 | % | | | | 12 | % | | | | 168 | % | | | | 61% | |
| | | |
| | (a) | Calculated based on the average shares outstanding methodology. |
| | (b) | Assumes investment at the NAV at the beginning of the year, reinvestment of all dividends and distributions, a complete redemption of the investment at the NAV at the end of the year and no sales or redemption charges (if any). Total returns would be reduced if a sales or redemption charge was taken into account. Returns do not reflect the impact of taxes to shareholders relating to Fund distributions or the redemption of Fund shares. |
| | (c) | The Fund’s portfolio turnover rate is calculated in accordance with regulatory requirements, without regard to transactions involving short term investments and certain derivatives. If such transactions were included, the Fund’s portfolio turnover rate may be higher. |
| | |
| The accompanying notes are an integral part of these financial statements. | | 25 |
GOLDMAN SACHS VARIABLE INSURANCE TRUST MULTI-ASSET STRATEGIES FUNDS
|
Notes to Financial Statements December 31, 2023 |
Goldman Sachs Variable Insurance Trust (the “Trust” or “VIT”) is a Delaware statutory trust registered under the Investment Company Act of 1940, as amended (the “Act”), as an open-end management investment company. The following table lists those series of the Trust that are included in this report (collectively, the “Funds” or individually a “Fund”), along with their corresponding share classes and respective diversification status under the Act:
| | | | |
| Fund | | Share Classes Offered | | Diversified/ Non-diversified |
| | |
| Multi-Strategy Alternatives | | Institutional, Service and Advisor | | Diversified |
| | |
| Trend Driven Allocation | | Institutional and Service | | Diversified |
Goldman Sachs Asset Management, L.P. (“GSAM”), an affiliate of Goldman Sachs & Co. LLC (��Goldman Sachs”), serves as investment adviser to the Funds pursuant to management agreements (the “Agreements”) with the Trust.
The Multi-Strategy Alternatives Portfolio invests primarily in a combination of domestic and international equity and fixed income underlying funds (“Underlying Funds”) which are registered under the Act, for which GSAM acts as investment adviser. Additionally, the Multi-Strategy Alternatives Portfolio may invest a portion of its assets directly in other securities and instruments, including unaffiliated exchange traded funds (“Unaffiliated Funds”). The Trend Driven Allocation Fund may invest in one or a combination of the following securities and instruments: pooled investment vehicles, including exchange-traded funds (“ETFs”) and other investment companies; equity securities of U.S. and non-U.S. issuers; U.S. fixed income securities; and derivatives that provide exposure to a broad spectrum of asset classes and geographic regions.
|
|
2. SIGNIFICANT ACCOUNTING POLICIES |
The financial statements have been prepared in accordance with accounting principles generally accepted in the United States of America (“GAAP”) and require management to make estimates and assumptions that may affect the reported amounts and disclosures. Actual results may differ from those estimates and assumptions. Each Fund is an investment company under GAAP and follows the accounting and reporting guidance applicable to investment companies.
A. Investment Valuation — The valuation policy of the Funds and Underlying Funds is to value investments at fair value.
B. Investment Income and Investments — Investment income includes interest income, dividend income, and securities lending income, if any. Interest income is accrued daily and adjusted for amortization of premiums and accretion of discounts. Dividend income is recognized on ex-dividend date or, for certain foreign securities, as soon as such information is obtained subsequent to the ex-dividend date. Non-cash dividends, if any, are recorded at the fair market value of the securities received. Investment transactions are reflected on trade date. Realized gains and losses are calculated using identified cost. Investment transactions are recorded on the following business day for daily net asset value (“NAV”) calculations. Investment income is recorded net of any foreign withholding taxes, less any amounts reclaimable. The Funds may file withholding tax reclaims in certain jurisdictions to recover a portion of amounts previously withheld.
For derivative contracts, unrealized gains and losses are recorded daily and become realized gains and losses upon disposition or termination of the contract.
C. Class Allocations and Expenses — Investment income, realized and unrealized gain (loss), if any, and non-class specific expenses of each Fund are allocated daily based upon the proportion of net assets of each class. Non-class specific expenses directly incurred by a Fund are charged to that Fund, while such expenses incurred by the Trust are allocated across the applicable Funds on a straight-line and/or pro-rata basis depending upon the nature of the expenses. Class specific expenses, where applicable, are borne by the respective share classes and include Distribution and Service and Transfer Agency fees. Expenses included in the accompanying financial statements reflect the expenses of each Fund and do not include any expenses associated with the Underlying Funds. Because the Underlying Funds have varied expense and fee levels and each Fund may own different proportions of the Underlying Funds at different times, the amount of fees and expenses incurred indirectly by the Funds will vary.
D. Federal Taxes and Distributions to Shareholders — It is each Fund’s policy to comply with the requirements of the Internal Revenue Code of 1986, as amended (the “Code”), applicable to regulated investment companies and to distribute each year substantially all of its investment company taxable income and capital gains to its shareholders. Accordingly, each Fund is not
GOLDMAN SACHS VARIABLE INSURANCE TRUST MULTI-ASSET STRATEGIES FUNDS
|
|
2. SIGNIFICANT ACCOUNTING POLICIES (continued) |
required to make any provisions for the payment of federal income tax. Distributions to shareholders are recorded on the ex-dividend date. Income and capital gains distributions, if any, are declared and paid at least annually.
Net capital losses, if any, are carried forward to future fiscal years and may be used to the extent allowed by the Code to offset any future capital gains. Losses that are carried forward will retain their character as either short-term or long-term capital losses. Utilization of capital loss carryforwards will reduce the requirement of future capital gains distributions.
The characterization of distributions to shareholders for financial reporting purposes is determined in accordance with federal income tax rules, which may differ from GAAP. The source of each Fund’s distributions may be shown in the accompanying financial statements as either from distributable earnings or capital. Certain components of the Funds’ net assets on the Statements of Assets and Liabilities reflect permanent GAAP/tax differences based on the appropriate tax character.
E. Foreign Currency Translation — The accounting records and reporting currency of a Fund are maintained in U.S. dollars. Assets and liabilities denominated in foreign currencies are translated into U.S. dollars using the current exchange rates at the close of each business day. The effect of changes in foreign currency exchange rates on investments is included within net realized and unrealized gain (loss) on investments. Changes in the value of other assets and liabilities as a result of fluctuations in foreign exchange rates are included in the Statements of Operations within net change in unrealized gain (loss) on foreign currency translation. Transactions denominated in foreign currencies are translated into U.S. dollars on the date the transaction occurred, the effects of which are included within net realized gain (loss) on foreign currency transactions.
|
|
3. INVESTMENTS AND FAIR VALUE MEASUREMENTS |
U.S. GAAP defines the fair value of a financial instrument as the amount that would be received to sell an asset or paid to transfer a liability in an orderly transaction between market participants at the measurement date (i.e., the exit price); the Funds’ policy is to use the market approach. GAAP establishes a fair value hierarchy that prioritizes the inputs to valuation techniques used to measure fair value. The hierarchy gives the highest priority to unadjusted quoted prices in active markets for identical assets or liabilities (Level 1 measurements) and the lowest priority to unobservable inputs (Level 3 measurements). The level in the fair value hierarchy within which the fair value measurement in its entirety falls shall be determined based on the lowest level input that is significant to the fair value measurement in its entirety. The levels used for classifying investments are not necessarily an indication of the risk associated with investing in these investments. The three levels of the fair value hierarchy are described below:
Level 1 — Unadjusted quoted prices in active markets that are accessible at the measurement date for identical, unrestricted assets or liabilities;
Level 2 — Quoted prices in markets that are not active or financial instruments for which significant inputs are observable (including, but not limited to, quoted prices for similar investments, interest rates, foreign exchange rates, volatility and credit spreads), either directly or indirectly;
Level 3 — Prices or valuations that require significant unobservable inputs (including GSAM’s assumptions in determining fair value measurement).
The Board of Trustees (“Trustees”) has approved Valuation Procedures that govern the valuation of the portfolio investments held by the Funds, including investments for which market quotations are not readily available. With respect to the Funds’ investments that do not have readily available market quotations, the Trustees have designated the Adviser as the valuation designee to perform fair valuations pursuant to Rule 2a-5 under the Investment Company Act of 1940 (the “Valuation Designee”). GSAM has day-to-day responsibility for implementing and maintaining internal controls and procedures related to the valuation of the Funds’ investments. To assess the continuing appropriateness of pricing sources and methodologies, GSAM regularly performs price verification procedures and issues challenges as necessary to third party pricing vendors or brokers, and any differences are reviewed in accordance with the Valuation Procedures.
A. Level 1 and Level 2 Fair Value Investments — The valuation techniques and significant inputs used in determining the fair values for investments classified as Level 1 and Level 2 are as follows:
Equity Securities — Equity securities traded on a U.S. securities exchange or the NASDAQ system, or those located on certain foreign exchanges, including but not limited to the Americas, are valued daily at their last sale price or official closing price on the principal exchange or system on which they are traded. If there is no sale or official closing price or such price is believed by GSAM to not represent fair value, equity securities will be valued at the valid closing bid price for long positions and at the valid closing
GOLDMAN SACHS VARIABLE INSURANCE TRUST MULTI-ASSET STRATEGIES FUNDS
|
Notes to Financial Statements (continued) December 31, 2023 |
|
|
3. INVESTMENTS AND FAIR VALUE MEASUREMENTS (continued) |
ask price for short positions (i.e. where there is sufficient volume, during normal exchange trading hours). If no valid bid/ask price is available, the equity security will be valued pursuant to the Valuation Procedures and consistent with applicable regulatory guidance. To the extent these investments are actively traded, they are classified as Level 1 of the fair value hierarchy, otherwise they are generally classified as Level 2. Certain equity securities containing unique attributes may be classified as Level 2.
Unlisted equity securities for which market quotations are available are valued at the last sale price on the valuation date, or if no sale occurs, at the last bid price for long positions or the last ask price for short positions, and are generally classified as Level 2. Securities traded on certain foreign securities exchanges are valued daily at fair value determined by an independent fair value service (if available) under the Valuation Procedures and consistent with applicable regulatory guidance. The independent fair value service takes into account multiple factors including, but not limited to, movements in the securities markets, certain depositary receipts, futures contracts and foreign currency exchange rates that have occurred subsequent to the close of the foreign securities exchange. These investments are generally classified as Level 2 of the fair value hierarchy.
Underlying Funds (including Money Market Funds) — Underlying Funds include ETFs and other investment companies. Investments in the Underlying Funds (except ETFs) are valued at the NAV per share on the day of valuation. ETFs are valued daily at the last sale price or official closing price on the principal exchange or system on which the investment is traded. Because the Funds invest in Underlying Funds that fluctuate in value, each Fund’s shares will correspondingly fluctuate in value. Underlying Funds are generally classified as Level 1 of the fair value hierarchy. To the extent that underlying ETFs are actively traded, they are classified as Level 1 of the fair value hierarchy, otherwise they are generally classified as Level 2. For information regarding an Underlying Fund’s accounting policies and investment holdings, please see the Underlying Fund’s shareholder report.
Derivative Contracts — A derivative is an instrument whose value is derived from underlying assets, indices, reference rates or a combination of these factors. A Fund enters into derivative transactions to hedge against changes in interest rates, securities prices, and/or currency exchange rates, to increase total return, or to gain access to certain markets or attain exposure to other underliers. For financial reporting purposes, cash collateral that has been pledged to cover obligations of a Fund and cash collateral received, if any, is reported separately on the Statements of Assets and Liabilities as either due to broker/receivable for collateral on certain derivative contracts. Non-cash collateral pledged by a Fund, if any, is noted in the Schedules of Investments.
Exchange-traded derivatives, including futures and options contracts, are generally valued at the last sale or settlement price on the exchange where they are principally traded. Exchange-traded options without settlement prices are generally valued at the midpoint of the bid and ask prices on the exchange where they are principally traded (or, in the absence of two-way trading, at the last bid price for long positions and the last ask price for short positions). Exchange-traded derivatives typically fall within Level 1 of the fair value hierarchy. Over-the-counter (“OTC”) and centrally cleared derivatives are valued using market transactions and other market evidence, including market-based inputs to models, calibration to market-clearing transactions, broker or dealer quotations, or other alternative pricing sources. Where models are used, the selection of a particular model to value OTC and centrally cleared derivatives depends upon the contractual terms of, and specific risks inherent in, the instrument, as well as the availability of pricing information in the market. Valuation models require a variety of inputs, including contractual terms, market prices, yield curves, credit curves, measures of volatility, voluntary and involuntary prepayment rates, loss severity rates and correlations of such inputs. For OTC and centrally cleared derivatives that trade in liquid markets, model inputs can generally be verified and model selection does not involve significant management judgment. OTC and centrally cleared derivatives are classified within Level 2 of the fair value hierarchy when significant inputs are corroborated by market evidence.
i. Futures Contracts — Futures contracts are contracts to buy or sell a standardized quantity of a specified commodity or security. Upon entering into a futures contract, the Fund deposits cash or securities in an account on behalf of the broker in an amount sufficient to meet the initial margin requirement. Subsequent payments are made or received by the Fund equal to the daily change in the contract value and are recorded as variation margin receivable or payable with a corresponding offset to unrealized gains or losses.
ii. Options — When the Multi-Strategy Alternatives Portfolio writes call or put options, an amount equal to the premium received is recorded as a liability and is subsequently marked-to-market to reflect the current value of the option written. Swaptions are options on swap contracts.
Upon the purchase of a call option or a put option by the Fund, the premium paid is recorded as an investment and subsequently marked-to-market to reflect the current value of the option. Certain options may be purchased with premiums to be determined on a future date. The premiums for these options are based upon implied volatility parameters at specified terms.
GOLDMAN SACHS VARIABLE INSURANCE TRUST MULTI-ASSET STRATEGIES FUNDS
|
|
3. INVESTMENTS AND FAIR VALUE MEASUREMENTS (continued) |
B. Level 3 Fair Value Investments — To the extent that significant inputs to valuation models and other alternative pricing sources are unobservable, or if quotations are not readily available, or if GSAM believes that such quotations do not accurately reflect fair value, the fair value of a Fund’s investments may be determined under the Valuation Procedures. GSAM, consistent with its procedures and applicable regulatory guidance, may make an adjustment to the most recent valuation prices of either domestic or foreign securities in light of significant events to reflect what it believes to be the fair value of the securities at the time of determining a Fund’s NAV. To the extent investments are valued using single source broker quotations obtained directly from the broker or passed through from third party pricing vendors, such investments are classified as Level 3 investments.
C. Fair Value Hierarchy — The following is a summary of the Funds’ investments and derivatives classified in the fair value hierarchy as of December 31, 2023:
| | | | | | | | | | | | |
| Multi-Strategy Alternatives Portfolio | | | | | | | | | | | | |
| | | |
| Investment Type | | Level 1 | | | Level 2 | | | Level 3 | |
|
| |
| | | |
Assets | | | | | | | | | | | | |
| | | |
Fixed Income Underlying Funds | | $ | 27,836,813 | | | $ | — | | | $ | — | |
| | | |
Equity Underlying Funds | | | 6,402,348 | | | | | | | | | |
| | | |
Exchange-Traded Funds | | | 1,877,270 | | | | — | | | | — | |
| | | |
Investment Companies | | | 1,171,080 | | | | — | | | | — | |
| | | |
Securities Lending Reinvestment Vehicle | | | 6,700 | | | | — | | | | — | |
|
| |
| | | |
Total | | $ | 37,294,211 | | | $ | — | | | $ | — | |
|
| |
| | | |
Derivative Type | | | | | | | | | | | | |
|
| |
| | | |
Assets | | | | | | | | | | | | |
| | | |
Forward Foreign Currency Exchange Contracts(a) | | $ | — | | | $ | 1,470 | | | $ | — | |
| | | |
Futures Contracts(a) | | | 36,236 | | | | — | | | | — | |
| | | |
Purchased Options Contracts | | | 240,056 | | | | — | | | | — | |
|
| |
| | | |
Total | | $ | 276,292 | | | $ | 1,470 | | | $ | — | |
|
| |
| | | |
Liabilities | | | | | | | | | | | | |
| | | |
Forward Foreign Currency Exchange Contracts(a) | | $ | — | | | $ | (3,702 | ) | | $ | — | |
| | | |
Futures Contracts(a) | | | (312 | ) | | | — | | | | — | |
|
| |
| | | |
Total | | $ | (312 | ) | | $ | (3,702 | ) | | $ | — | |
|
| |
| | | |
| Trend Driven Allocation Fund | | | | | | | | | | | | |
| | | |
| Investment Type | | Level 1 | | | Level 2 | | | Level 3 | |
|
| |
| | | |
Assets | | | | | | | | | | | | |
| | | |
Exchange-Traded Funds | | $ | 69,419,951 | | | $ | — | | | $ | — | |
| | | |
Investment Companies | | | 191,586,429 | | | | — | | | | — | |
|
| |
| | | |
Total | | $ | 261,006,380 | | | $ | — | | | $ | — | |
|
| |
| | | |
Derivative Type | | | | | | | | | | | | |
|
| |
| | | |
Assets | | | | | | | | | | | | |
| | | |
Futures Contracts(a) | | $ | 5,419,983 | | | $ | — | | | $ | — | |
|
| |
| | | |
Liabilities | | | | | | | | | | | | |
| | | |
Futures Contracts(a) | | $ | (113,834 | ) | | $ | — | | | $ | — | |
|
| |
| | (a) | Amount shown represents unrealized gain (loss) at fiscal year end. |
GOLDMAN SACHS VARIABLE INSURANCE TRUST MULTI-ASSET STRATEGIES FUNDS
|
Notes to Financial Statements (continued) December 31, 2023 |
|
|
4. INVESTMENTS IN DERIVATIVES |
The following tables set forth, by certain risk types, the gross value of derivative contracts (not considered to be hedging instruments for accounting disclosure purposes) as of December 31, 2023. These instruments were used as part of the Funds’ investment strategies and to obtain and/or manage exposure related to the risks below. The values in the tables below exclude the effects of cash collateral received or posted pursuant to these derivative contracts, and therefore are not representative of the Funds’ net exposure
| | | | | | | | | | | | |
| Multi-Strategy Alternatives Portfolio | | | | | | | | | | |
| | | | |
| Risk | | Statements for Assets and Liabilities | | Assets1 | | | Statements for Assets and Liabilities | | Liabilities1 | |
| | | | |
| Currency | | Receivables for unrealized gain on forward foreign currency exchange contracts | | $ | 1,470 | | | Payable for unrealized loss on forward foreign currency exchange contracts | | $ | (3,702 | ) |
| Equity | | | | | — | | | Variation margin on futures contracts | | | (312 | ) |
| Interest Rate | | Purchased options at value/Variation margin on futures contracts | | | 276,292 | | | | | | — | |
| | | | |
Total | | | | $ | 277,762 | | | | | $ | (4,014 | ) |
| | | |
| Trend Driven Allocation Fund | | | | | | | | | | |
| | | | |
| Risk | | Statements for Assets and Liabilities | | Assets1 | | | Statements for Assets and Liabilities | | Liabilities1 | |
| Equity | | Variation margin on futures contracts | | $ | 2,453,583 | | | Variation margin on futures contracts | | $ | (113,834 | ) |
| Interest Rate | | Variation margin on futures contracts | | | 2,966,400 | | | | | | — | |
| | | | |
Total | | | | $ | 5,419,983 | | | | | $ | (113,834 | ) |
| | (1) | Includes unrealized gain (loss) on futures contracts described in the Additional Investment Information sections of the Schedules of Investments. Only the variation margin as of December 31, 2023 is reported within the Statements of Assets and Liabilities. |
The following table sets forth, by certain risk types, the Funds’ gains (losses) related to these derivatives and their indicative volumes for the fiscal year ended December 31, 2023. These gains (losses) should be considered in the context that these derivative contracts may have been executed to create investment opportunities and/or economically hedge certain investments, and accordingly, certain gains (losses) on such derivative contracts may offset certain (losses) gains attributable to investments. These gains (losses) are included in “Net realized gain (loss)” or “Net change in unrealized gain (loss)” on the Statements of Operations:
GOLDMAN SACHS VARIABLE INSURANCE TRUST MULTI-ASSET STRATEGIES FUNDS
|
|
4. INVESTMENTS IN DERIVATIVES (continued) |
| | | | | | | | | | |
| Multi-Strategy Alternatives Portfolio | | | | | | | | |
| | | |
Risk | | Statement of Operations | | Net Realized
Gain (Loss) | | | Net Change in
Unrealized Gain (Loss) | |
| | | |
| Currency | | Net realized gain (loss) from forward currency exchange contracts/Net change in unrealized gain (loss) on forward currency exchange contracts | | $ | (1,682 | ) | | $ | (2,082 | ) |
| | | |
| Equity | | Net realized gain (loss) from futures contracts/Net change in unrealized gain (loss) on futures contracts | | | 26,038 | | | | 3,794 | |
| | | |
| Interest Rate | | Net realized gain (loss) from futures contracts/Net change in unrealized gain (loss) on futures | | | (206,665 | ) | | | 11,213 | |
| | | |
Total | | | | $ | (182,309 | ) | | $ | 12,925 | |
| | |
| Trend Driven Allocation Fund | | | | | | | | |
| | | |
| Risk | | Statement of Operations | | Net Realized
Gain (Loss) | | | Net Change in Unrealized Gain (Loss) | |
| | | |
| Equity | | Net realized gain (loss) from futures contracts/Net change in unrealized gain (loss) on futures contracts | | | 13,500,104 | | | | 6,700,069 | |
| | | |
| Interest Rate | | Net realized gain (loss) from futures contracts/Net change in unrealized gain (loss) on futures contracts | | | (5,348,164 | ) | | | 3,849,279 | |
| | | |
Total | | | | $ | 8,151,940 | | | $ | 10,549,348 | |
For the fiscal year ended December 31, 2023, the relevant values for each derivative type were as follows:
| | | | | | | | |
| | | Average number of Contracts or Notional Amounts(a) |
| |
| | | |
| | | |
| Fund | | Futures Contracts | | | Forward Contracts | | Purchased Options |
|
|
| | | |
Multi-Strategy Alternatives Portfolio | | | 23 | | | 152,192 | | 310 |
|
|
| | | |
Trend Driven Allocation Fund | | | 1,660 | | | – | | – |
|
|
| | (a) | Amounts disclosed represent average number of contracts for futures and purchased options and notional amounts for forward contracts, based on absolute values, which is indicative of volume of this derivative type, for the months that the Fund held such derivatives during the fiscal year ended December 31, 2023. |
|
|
5. AGREEMENTS AND AFFILIATED TRANSACTIONS |
A. Management Agreement — Under the Agreement, GSAM manages the Funds, subject to the general supervision of the Trustees.
As compensation for the services rendered pursuant to the Agreement, the assumption of the expenses related thereto and administration of the Funds’ business affairs, including providing facilities, GSAM is entitled to a management fee, accrued daily and paid monthly, equal to an annual percentage rate of each Fund’s average daily net assets.
For the fiscal year ended December 31, 2023, contractual and effective net management fees with GSAM were at the following rates:
| | | | | | | | | | | | | | |
| | | Contractual Management Rate | | | | |
| | | | | | | |
| Fund | | First
$1 billion | | Next
$1 billion | | Next
$3 billion | | Next
$3 billion | | Over
$8 billion | | Effective
Rate | | Effective Net
Management
Rate^ |
|
|
| | | | | | | |
Multi-Strategy Alternatives Portfolio | | 0.15% | | 0.15% | | 0.15% | | 0.15% | | 0.15% | | 0.15% | | —%* |
|
|
| | | | | | | |
Trend Driven Allocation Fund | | 0.79 | | 0.71 | | 0.68 | | 0.66 | | 0.65 | | 0.78 | | 0.64 |
|
|
GOLDMAN SACHS VARIABLE INSURANCE TRUST MULTI-ASSET STRATEGIES FUNDS
|
Notes to Financial Statements (continued) December 31, 2023 |
|
|
5. AGREEMENTS AND AFFILIATED TRANSACTIONS (continued) |
| | ^ | Effective Net Management Rate includes the impact of management fee waivers of affiliated Underlying Funds, if any. The Effective Net Management Rate may not correlate to the Contractual Management Rate as a result of management fee waivers that may be in effect from time to time. |
| | * | GSAM agreed to waive a portion of its management fee in order to achieve an effective net management rate as defined in the Funds’ most recent prospectus. This waiver will remain in effect through at least April 28, 2024, and prior to such date GSAM may not terminate the arrangement without approval of the Trustees. |
The Multi-Strategy Alternatives Portfolio invests in Institutional Shares of the Goldman Sachs Financial Square Government and Goldman Sachs VIT Government Money Market Funds and the Trend Driven Allocation Fund invests in Institutional Shares of the Goldman Sachs Financial Square Government, Goldman Sachs Financial Square Treasury Instruments, Goldman Sachs Financial Square Treasury Obligations, and Goldman Sachs Financial Square Treasury Solutions Funds, which are affiliated Underlying Funds. GSAM has agreed to waive a portion of its management fee payable by the Funds in an amount equal to the management fee it earns as an investment adviser to the affiliated Underlying Fund in which the Funds invest, except those management fees it earns from the Funds’ investments of cash collateral received in connection with securities lending transactions in the Goldman Sachs Financial Square Government Fund. For the fiscal year ended December 31, 2023 GSAM waived $3,882 and $88,097 of the Multi-Strategy Alternatives Portfolio’s and Trend Driven Allocation Fund’s management fee, respectively.
B. Distribution and/or Service (12b-1) Plans — The Trust, on behalf of Service Shares of the Funds has adopted a Distribution and Service Plan subject to Rule 12b-1 under the Act. Under the Distribution and Service Plan, Goldman Sachs, which serves as distributor (the “Distributor”), is entitled to a fee accrued daily and paid monthly, for distribution services and personal and account maintenance services, which may then be paid by Goldman Sachs to authorized dealers, equal to, on an annual basis, 0.25% of the Funds’ average daily net assets attributable to Service Shares.
The Trust, on behalf of Advisor Shares of the Multi-Strategy Alternatives Portfolio, has adopted a Distribution Plan subject to Rule 12b-1 under the Act. Under the Distribution Plan, Goldman Sachs as Distributor is entitled to a fee accrued daily and paid monthly for distribution services, which may then be paid by Goldman Sachs to authorized dealers, equal to, on an annual basis, 0.15% of the Multi-Strategy Alternatives Portfolio’s average daily net assets attributable to Advisor Shares.
C. Service Plans — The Trust, on behalf of Advisor Shares of the Multi-Strategy Alternatives Portfolio, has adopted a Service Plan to allow Advisor Shares to compensate service organizations (including Goldman Sachs) for providing varying levels of personal and account maintenance and administration services to their customers who are beneficial owners of such shares. The Service Plans each provide for compensation to the service organizations equal to 0.25% of the average daily net assets attributable to Advisor Shares of the Multi-Strategy Alternatives Portfolio.
D. Transfer Agency Agreement — Goldman Sachs also serves as the transfer agent of the Funds for a fee pursuant to the Transfer Agency Agreement. The fees charged for such transfer agency services are accrued daily and paid monthly at an annual rate of 0.02% of the average daily net assets of Institutional, Service and Advisor Shares.
E. Other Expense Agreements and Affiliated Transactions — GSAM has agreed to reduce or limit certain “Other Expenses” of the Funds (excluding acquired fund fees and expenses, transfer agency fees and expenses, service fees and shareholder administration fees (as applicable), taxes, interest, brokerage fees, expenses of shareholder meetings, litigation and indemnification, and extraordinary expenses) to the extent such expenses exceed, on an annual basis, a percentage rate of the average daily net assets of each Fund. Such Other Expense reimbursements, if any, are accrued daily and paid monthly. In addition, the Funds are not obligated to reimburse GSAM for prior fiscal year expense reimbursements, if any. The Other Expense limitations as an annual percentage rate of average daily net assets for the Multi-Strategy Alternatives Portfolio and Trend Driven Allocation Fund are 0.204% and 0.004%, respectively. These Other Expense limitations will remain in place through at least April 28, 2024, and prior to such date GSAM may not terminate the arrangements without the approval of the Trustees. In addition, the Funds have entered into certain offset arrangements with the custodian and the transfer agent, which may result in a reduction of the Funds’ expenses and are received irrespective of the application of the “Other Expense” limitations described above.
For the fiscal year ended December 31, 2023, these expense reductions, including any fee waivers and Other Expense reimbursements, were as follows:
| | | | | | | | | | | | |
| Fund | | Management
Fee Waiver | | | Other Expense
Reimbursements | | | Total Expense
Reductions | |
|
| |
| | | |
Multi-Strategy Alternatives Portfolio | | $ | 58,584 | | | $ | 142,920 | | | $ | 201,504 | |
|
| |
| | | |
Trend Driven Allocation Fund | | | 418,568 | | | | 195,021 | | | | 613,589 | |
|
| |
GOLDMAN SACHS VARIABLE INSURANCE TRUST MULTI-ASSET STRATEGIES FUNDS
|
|
5. AGREEMENTS AND AFFILIATED TRANSACTIONS (continued) |
F. Line of Credit Facility — As of December 31, 2023, the Funds participated in a $1,110,000,000 committed, unsecured revolving line of credit facility (the “facility”) together with other funds of the Trust and certain registered investment companies having management agreements with GSAM or its affiliates. This facility is to be used for temporary emergency purposes, or to allow for an orderly liquidation of securities to meet redemption requests. The interest rate on borrowings is based on the federal funds rate. The facility also requires a fee to be paid by the Funds based on the amount of the commitment that has not been utilized. For the fiscal year ended December 31, 2023, the Funds did not have any borrowings under the facility. Prior to April 19, 2023, the facility was $1,250,000,000.
G. Other Transactions with Affiliates —The Multi-Strategy Alternatives Portfolio invests primarily in Class R6 and Institutional Shares of the Underlying Funds. These Underlying Funds are considered to be affiliated with the Multi-Strategy Alternatives Portfolio. The table below shows the transactions in and earnings from investments in these Underlying Funds for the fiscal year ended December 31, 2023:
Multi-Strategy Alternatives Portfolio
| | | | | | | | | | | | | | | | | | | | | | | | | | | | | | | | | | |
Underlying Fund | | Beginning value as of December 31, 2022 | | Purchases at
Cost | | | Proceeds from Sales | | | Realized Gain
(Loss) | | | Change in
Unrealized
Appreciation
(Depreciation) | | | Ending value as of December 31, 2023 | | | Shares as of
December
31, 2023 | | | Dividend
Income | | | Capital Gain
Distribution | |
|
| |
Goldman Sachs Core Fixed Income Fund | |
| | $ – | | $ | 2,149,149 | | | $ | (100,000 | ) | | $ | (3,448 | ) | | $ | 15,492 | | | $ | 2,061,193 | | | | 221,396 | | | $ | 49,150 | | | $ | – | |
| |
Goldman Sachs Emerging Markets Debt Fund | |
| | 2,550,458 | | | 2,111,328 | | | | (400,000 | ) | | | (26,591 | ) | | | 307,444 | | | | 4,542,639 | | | | 478,172 | | | | 211,328 | | | | – | |
| |
Goldman Sachs Emerging Markets Equity Insights Fund | |
| | 1,401,569 | | | 2,018,096 | | | | (470,000 | ) | | | (76 | ) | | | 184,482 | | | | 3,134,071 | | | | 386,922 | | | | 118,096 | | | | – | |
| |
Goldman Sachs Energy Infrastructure Fund | |
| | 166,361 | | | 6,125 | | | | (129,999 | ) | | | 9,937 | | | | (3,169 | ) | | | 49,255 | | | | 4,466 | | | | 3,308 | | | | 2,817 | |
| |
Goldman Sachs Financial Square Government Fund | |
| | 3,276,259 | | | 15,696,842 | | | | (18,338,077 | ) | | | – | | | | – | | | | 635,024 | | | | 635,024 | | | | 94,260 | | | | – | |
| |
Goldman Sachs Global Infrastructure Fund | |
| | 2,544,911 | | | 1,081,775 | | | | (541,552 | ) | | | 327 | | | | 133,561 | | | | 3,219,022 | | | | 258,348 | | | | 70,223 | | | | – | |
| |
Goldman Sachs High Yield Floating Rate Fund | |
| | 1,539,318 | | | 2,151,781 | | | | (300,000 | ) | | | (5,460 | ) | | | 72,842 | | | | 3,458,481 | | | | 388,593 | | | | 171,781 | | | | – | |
| |
Goldman Sachs High Yield Fund | |
| | 2,057,530 | | | 2,265,770 | | | | (257,749 | ) | | | (17,880 | ) | | | 207,109 | | | | 4,254,780 | | | | 757,078 | | | | 158,021 | | | | – | |
| |
Goldman Sachs Long Short Credit Strategies Fund | |
| | 7,094,397 | | | 705,600 | | | | (1,200,000 | ) | | | (83,268 | ) | | | 346,627 | | | | 6,863,356 | | | | 866,585 | | | | 405,600 | | | | – | |
| |
Goldman Sachs Managed Futures Strategy Fund | |
| | 4,930,459 | | | 1,397,864 | | | | (700,000 | ) | | | (128,747 | ) | | | (8,914 | ) | | | 5,490,662 | | | | 558,562 | | | | 7,864 | | | | – | |
| |
Goldman Sachs MarketBeta U.S. Equity ETF | |
| | 2,196,208 | | | 200,153 | | | | (1,679,375 | ) | | | 94,133 | | | | 291,531 | | | | 1,102,650 | | | | 16,873 | | | | 22,760 | | | | – | |
| |
Goldman Sachs MarketBeta International Equity ETF | |
| | 928,624 | | | – | | | | (537,172 | ) | | | 38,216 | | | | 45,681 | | | | 475,349 | | | | 8,847 | | | | 20,687 | | | | – | |
| |
Goldman Sachs Strategic Income Fund | |
| | 1,146,354 | | | 147,856 | | | | (213,687 | ) | | | 1,361 | | | | 83,818 | | | | 1,165,702 | | | | 124,143 | | | | 34,169 | | | | – | |
| |
Goldman Sachs VIT Government Money Market Fund | |
| | 6,285,567 | | | 150,489 | | | | (5,900,000 | ) | | | – | | | | – | | | | 536,056 | | | | 536,056 | | | | 150,489 | | | | – | |
| |
Total | | $ 36,118,015 | | $ | 30,082,828 | | | $ | (30,767,611 | ) | | $ | (121,496 | ) | | $ | 1,676,504 | | | $ | 36,988,240 | | | | | | | $ | 1,517,736 | | | $ | 2,817 | |
|
| |
As of December 31, 2023, The Goldman Sachs Group, Inc. was the beneficial owner of approximately 8% of the Institutional Shares of the Trend Driven Allocation Fund.
The following table provides information about Trend Driven Allocation Fund’s investments in the Institutional Shares of the Goldman Sachs VIT Government Money Market Fund, Goldman Sachs Financial Square Government, Goldman Sachs Financial Square Treasury Instruments, Goldman Sachs Financial Square Treasury Obligations, and Goldman Sachs Financial Square Treasury Solutions Funds as of and for the fiscal year ended December 31, 2023:
GOLDMAN SACHS VARIABLE INSURANCE TRUST MULTI-ASSET STRATEGIES FUNDS
|
Notes to Financial Statements (continued) December 31, 2023 |
|
|
5. AGREEMENTS AND AFFILIATED TRANSACTIONS (continued) |
Trend Driven Allocation Fund
| | | | | | | | | | | | | | | | | | | | | | | | | | | | | | | | | | |
Underlying Fund | | Beginning value
as of December 31, 2022 | | Purchases at
Cost | | | Proceeds from
Sales | | | Realized Gain
(Loss) | | | Change in
Unrealized
Appreciation
(Depreciation) | | | Ending value
as of December
31, 2023 | | | Shares as of December
31, 2023 | | | Dividend
Income | | | Capital Gain
Distribution | |
| |
Goldman Sachs Financial Square Government Fund | |
| | $ 53,931,471 | | $ | 114,224,484 | | | $ | (127,747,581 | ) | | $ | – | | | $ | – | | | $ | 40,408,374 | | | | 40,408,374 | | | $ | 2,685,914 | | | $ | – | |
| |
Goldman Sachs Financial Square Treasury Instruments Fund | |
| | 26,776,391 | | | 13,345,757 | | | | (1,257,203 | ) | | | – | | | | – | | | | 38,864,945 | | | | 38,864,945 | | | | 1,416,756 | | | | – | |
| |
Goldman Sachs Financial Square Treasury Obligations Fund | |
| | 26,777,206 | | | 13,823,416 | | | | (1,730,085 | ) | | | – | | | | – | | | | 38,870,537 | | | | 38,870,537 | | | | 1,439,446 | | | | – | |
| |
Goldman Sachs Financial Square Treasury Solutions Fund | |
| | 26,776,391 | | | 13,345,757 | | | | (1,730,085 | ) | | | – | | | | – | | | | 38,392,063 | | | | 38,392,063 | | | | 1,428,807 | | | | – | |
| |
Goldman Sachs VIT Government Money Market Fund | |
| | – | | | 35,050,510 | | | | – | | | | – | | | | – | | | | 35,050,510 | | | | 35,050,510 | | | | 50,599 | | | | – | |
| |
Total | | $ 134,261,459 | | $ | 189,789,924 | | | $ | (132,464,954 | ) | | $ | – | | | $ | – | | | $ | 191,586,429 | | | | | | | $ | 7,021,522 | | | $ | – | |
|
| |
|
|
6. PORTFOLIO SECURITIES TRANSACTIONS |
The cost of purchases and proceeds from sales and maturities of long-term securities for the fiscal year ended December 31, 2023, were as follows:
| | | | | | | | |
| Fund | | Purchases | | | Sales | |
| | |
Multi-Strategy Alternatives Portfolio | | $ | 15,298,855 | | | $ | 6,783,799 | |
| | |
Trend Driven Allocation Fund | | | 6,652,896 | | | | 19,539,477 | |
The Multi-Strategy Alternatives Portfolio may lend its securities through a securities lending agent, the Bank of New York Mellon (“BNYM”), to certain qualified borrowers. Pursuant to exemptive relief granted by the Securities and Exchange Commission (“SEC”) and the terms and conditions contained therein, the Trend Driven Allocation Fund may lend its securities through a securities lending agent, Goldman Sachs Agency Lending (“GSAL”), a wholly-owned subsidiary of Goldman Sachs, to certain qualified borrowers including Goldman Sachs and affiliates. In accordance with the Funds’ securities lending procedures, the Funds receive cash collateral at least equal to the market value of the securities on loan. The market value of the loaned securities is determined at the close of business of the Funds at their last sale price or official closing price on the principal exchange or system on which they are traded, and any additional required collateral is delivered to the Funds on the next business day. As with other extensions of credit, the Funds may experience delay in the recovery of their securities or incur a loss should the borrower of the securities breach its agreement with the Funds or become insolvent at a time when the collateral is insufficient to cover the cost of repurchasing securities on loan. Dividend income received from securities on loan may not be subject to withholding taxes and therefore withholding taxes paid may differ from the amounts listed in the Statements of Operations. Loans of securities are terminable at any time and as such 1) the remaining contractual maturities of the outstanding securities lending transactions are considered to be overnight and continuous and 2) the borrower, after notice, is required to return borrowed securities within the standard time period for settlement of securities transactions.
The Funds invest the cash collateral received in connection with securities lending transactions in the Goldman Sachs Financial Square Government Fund (“Government Money Market Fund”), an affiliated series of the Goldman Sachs Trust. The Government Money Market Fund is registered under the Act as an open end investment company, is subject to Rule 2a-7 under the Act, and is managed by GSAM, for which GSAM may receive a management fee of up to 0.16% on an annualized basis of the average daily net assets of the Government Money Market Fund.
GOLDMAN SACHS VARIABLE INSURANCE TRUST MULTI-ASSET STRATEGIES FUNDS
|
|
7. SECURITIES LENDING (continued) |
In the event of a default by a borrower with respect to any loan, GSAL will and BNYM may exercise any and all remedies provided under the applicable borrower agreement to make the Funds whole. These remedies include purchasing replacement securities by applying the collateral held from the defaulting broker against the purchase cost of the replacement securities. If GSAL or BNYM are unable to purchase replacement securities, GSAL and/or BNYM will indemnify the Funds by paying the Funds an amount equal to the market value of the securities loaned minus the value of cash collateral received from the borrower for the loan, subject to an exclusion for any shortfalls resulting from a loss of value in such cash collateral due to reinvestment risk. The Funds’ master netting agreements with certain borrowers provide the right, in the event of a default (including bankruptcy or insolvency), for the non-defaulting party to liquidate the collateral and calculate net exposure to the defaulting party or request additional collateral. However, in the event of a default by a borrower, a resolution authority could determine that such rights are not enforceable due to the restrictions or prohibitions against the right of set-off that may be imposed in accordance with a particular jurisdiction’s bankruptcy or insolvency laws. The Funds’ loaned securities were all subject to enforceable Securities Lending Agreements and the value of the collateral was at least equal to the value of the cash received. The amounts of the Funds’ overnight and continuous agreements, which represent the gross amounts of recognized liabilities for securities lending transactions outstanding as of December 31, 2023, are disclosed as “Payable upon return of securities loaned” on the Statements of Assets and Liabilities, where applicable. The Funds did not have securities on loan as of December 31, 2023.
The Funds, GSAL and BNYM received compensation relating to the lending of the Funds’ securities. The amounts earned, if any, by the Funds for the fiscal year ended December 31, 2023, are reported under Investment Income on the Statements of Operations.
The table below details securities lending activity with affiliates of Goldman Sachs:
| | | | | | | | | | | | |
| | | For the Fiscal Year Ended December 31, 2023 | | | | |
| Fund | | Earnings of GSAL Relating to Securities Loaned | | | Amounts Received by the Funds from Lending to Goldman Sachs | | | Amounts Payable to
Goldman Sachs Upon Return of Securities Loaned as of
December 31, 2023 | |
| | | |
Trend Driven Allocation Fund | | $ | — | | | $ | 3,840 | | | $ | — | |
The following table provides information about the Funds’ investment in the Government Money Market Fund for the year ended December 31, 2023.
| | | | | | | | | | | | | | | | |
| | | Beginning value as | | | Purchases | | | Proceeds | | | Ending value as | |
| Fund | | of December 31, 2022 | | | at Cost | | | from Sales | | | of December 31, 2023 | |
| | | | |
Multi-Strategy Alternatives Portfolio | | $ | 911,315 | | | $ | 3,942,735 | | | $ | (4,847,350) | | | $ | 6,700 | |
The tax character of distributions paid during the year ended December 31, 2023 were as follows:
| | | | | | | | |
| | | Multi-Strategy
Alternatives
Portfolio | | | Trend Driven
Allocation
Fund | |
|
| |
| | |
Distributions paid from: | | | | | | | | |
| | |
Ordinary Income | | $ | 2,400,115 | | | $ | 4,614,788 | |
|
| |
The tax character of distributions paid during the fiscal year ended December 31, 2022 were as follows:
| | | | | | | | |
| | | Multi-Strategy
Alternatives
Portfolio | | | Trend Driven
Allocation Fund | |
| |
| | |
Distributions paid from: | | | | | | | | |
| | |
Ordinary Income | | $ | 1,280,144 | | | $ | 4,200,089 | |
| | |
Net long-term capital gains | | | — | | | | 6,691,886 | |
|
| |
| | |
Total distributions | | $ | 1,280,144 | | | $ | 10,891,975 | |
|
| |
GOLDMAN SACHS VARIABLE INSURANCE TRUST MULTI-ASSET STRATEGIES FUNDS
|
Notes to Financial Statements (continued) December 31, 2023 |
|
|
8. TAX INFORMATION (continued) |
As of December 31, 2023, the components of accumulated earnings (losses) on a tax basis were as follows:
| | | | | | | | |
| | | Multi-Strategy
Alternatives
Portfolio | | | Trend Driven
Allocation Fund | |
|
| |
| | |
Undistributed ordinary income — net | | $ | 201,552 | | | $ | 1,150,715 | |
|
| |
| | |
Capital loss carryforwards: | | | | | | | | |
| | |
Perpetual Short-Term | | | (1,821,585 | ) | | | — | |
| | |
Perpetual Long-Term | | | (2,036,338 | ) | | | (21,617,307) | |
|
| |
| | |
Total capital loss carryforwards | | | (3,857,923 | ) | | | (21,617,307) | |
|
| |
| | |
Timing differences — – | | | (6,295 | ) | | | — | |
| | |
Unrealized gains (losses) — net | | | (277,000 | ) | | | 23,147,777 | |
|
| |
| | |
Total accumulated earnings (losses) — net | | $ | (3,939,666 | ) | | $ | 2,681,185 | |
|
| |
As of December 31, 2023, the Funds’ aggregate security unrealized gains and losses based on cost for U.S. federal income tax purposes were as follows:
| | | | | | | | |
| | | Multi-Strategy
Alternatives
Portfolio | | | Trend Driven
Allocation Fund | |
|
| |
| | |
Tax Cost | | $ | 37,851,038 | | | $ | 243,954,185 | |
|
| |
| | |
Gross unrealized gain | | | 1,274,756 | | | | 23,147,777 | |
| | |
Gross unrealized loss | | | (1,551,756 | ) | | | — | |
|
| |
| | |
Net unrealized gain (loss) | | $ | (277,000 | ) | | $ | 23,147,777 | |
|
| |
The difference between GAAP-basis and tax-basis unrealized gains (losses) is attributable primarily to wash sales, net mark to market gains (losses) on regulated futures, options contracts and foreign currency contracts.
GSAM has reviewed the Funds’ tax positions for all open tax years (the current and prior three years, as applicable) and has concluded that no provision for income tax is required in the Funds’ financial statements. Such open tax years remain subject to examination and adjustment by tax authorities.
The Funds’ risks include, but are not limited to, the following:
Derivatives Risk — The Funds’ use of derivatives and other similar instruments (collectively referred to in this paragraph as “derivatives”) may result in loss, including due to adverse market movements. Derivatives, which may pose risks in addition to and greater than those associated with investing directly in securities, currencies or other assets and instruments, may increase market exposure and be illiquid or less liquid, volatile, difficult to price and leveraged so that small changes in the value of the underlying assets or instruments may produce disproportionate losses to the Funds. Certain derivatives are also subject to counterparty risk, which is the risk that the other party in the transaction will not, or lacks the capacity or authority to, fulfill its contractual obligations, liquidity risk, which includes the risk that the Funds will not be able to exit the derivative when it is advantageous to do so, and risks arising from margin requirements, which include the risk that the Funds will be required to pay additional margin or set aside additional collateral to maintain open derivative positions. The use of derivatives is a highly specialized activity that involves investment techniques and risks different from those associated with investments in more traditional securities and instruments. Losses from derivatives can also result from a lack of correlation between changes in the value of derivative instruments and the portfolio assets (if any) being hedged.
GOLDMAN SACHS VARIABLE INSURANCE TRUST MULTI-ASSET STRATEGIES FUNDS
|
|
9. OTHER RISKS (continued) |
Foreign and Emerging Countries Risk — Investing in foreign markets may involve special risks and considerations not typically associated with investing in the U.S. Foreign securities may be subject to risk of loss because of more or less foreign government regulation; less public information; less stringent investor protections; less stringent accounting, corporate governance, financial reporting and disclosure standards; and less economic, political and social stability in the countries in which the Funds or an Underlying Fund invests. The imposition of sanctions, exchange controls (including repatriation restrictions), confiscations of assets and property, trade restrictions (including tariffs) and other government restrictions by the U.S. or other governments, or from problems in share registration, settlement or custody, may also result in losses. The type and severity of sanctions and other similar measures, including counter sanctions and other retaliatory actions, that may be imposed could vary broadly in scope, and their impact is impossible to predict. For example, the imposition of sanctions and other similar measures could, among other things, cause a decline in the value and/or liquidity of securities issued by the sanctioned country or companies located in or economically tied to the sanctioned country and increase market volatility and disruption in the sanctioned country and throughout the world. Sanctions and other similar measures could limit or prevent a Fund or an Underlying Fund from buying and selling securities (in the sanctioned country and other markets), significantly delay or prevent the settlement of securities transactions, and significantly impact a Fund or Underlying Fund’s liquidity and performance. Foreign risk also involves the risk of negative foreign currency exchange rate fluctuations, which may cause the value of securities denominated in such foreign currency (or other instruments through which the Funds or an Underlying Fund has exposure to foreign currencies) to decline in value. Currency exchange rates may fluctuate significantly over short periods of time. To the extent that the Funds or an Underlying Fund also invests in securities of issuers located in, or economically tied to, emerging markets, these risks may be more pronounced.
Interest Rate Risk — When interest rates increase, fixed income securities or instruments held by a Fund will generally decline in value. Long-term fixed income securities or instruments will normally have more price volatility because of this risk than short-term fixed income securities or instruments. A wide variety of market factors can cause interest rates to rise, including central bank monetary policy, rising inflation and changes in general economic conditions. Changing interest rates may have unpredictable effects on the markets, may result in heightened market volatility and may detract from Fund performance. In addition, changes in monetary policy may exacerbate the risks associated with changing interest rates. Funds with longer average portfolio durations will generally be more sensitive to changes in interest rates than funds with a shorter average portfolio duration. Fluctuations in interest rates may also affect the liquidity of fixed income securities and instruments held by the Fund. A sudden or unpredictable increase in interest rates may cause volatility in the market and may decrease the liquidity of the Fund’s investments, which would make it harder for the Fund to sell its investments at an advantageous time.
Investments in Other Investment Companies Risk — As a shareholder of another investment company, including an ETF, the Funds will indirectly bear its proportionate share of any net management fees and other expenses paid by such other investment companies, in addition to the fees and expenses regularly borne by the Fund. ETFs are subject to risks that do not apply to conventional mutual funds, including but not limited to the following: (i) the market price of the ETF’s shares may trade at a premium or a discount to their NAV; and (ii) an active trading market for an ETF’s shares may not develop or be maintained.
Investments in the Underlying Funds Risk — The investments of the Multi-Strategy Alternatives Portfolio may be concentrated in one or more Underlying Funds (including ETFs and other registered investment companies) subject to statutory limitations prescribed by the Act or exemptive relief or regulations thereunder. The Multi-Strategy Alternatives Portfolio’s investment performance is directly related to the investment performance of the Underlying Funds it holds. The Multi-Strategy Alternatives Portfolio is subject to the risk factors associated with the investments of the Underlying Funds and will be affected by the investment policies and practices of the Underlying Funds in direct proportion to the amount of assets allocated to each. If the Multi-Strategy Alternatives Portfolio has a relative concentration of its portfolio in a single Underlying Fund, it may be more susceptible to adverse developments affecting that Underlying Fund, and may be more susceptible to losses because of these developments. A strategy used by the Underlying Funds may fail to produce the intended results.
Large Shareholder Transactions Risk — A Fund or an Underlying Fund may experience adverse effects when certain large shareholders, such as other funds, participating insurance companies, accounts and Goldman Sachs affiliates, purchase or redeem large amounts of shares of the Fund or an Underlying Fund. Such large shareholder redemptions, which may occur rapidly or unexpectedly, may cause a Fund or an Underlying Fund to sell portfolio securities at times when it would not otherwise do so, which may negatively impact a Fund’s or an Underlying Fund’s NAV and liquidity. These transactions may also accelerate the realization
GOLDMAN SACHS VARIABLE INSURANCE TRUST MULTI-ASSET STRATEGIES FUNDS
|
Notes to Financial Statements (continued) December 31, 2023 |
|
|
9. OTHER RISKS (continued) |
of taxable income to shareholders if such sales of investments resulted in gains, and may also increase transaction costs. In addition, a large redemption could result in a Fund’s or an Underlying Fund’s current expenses being allocated over a smaller asset base, leading to an increase in the Fund’s or Underlying Fund’s expense ratio. Similarly, large Fund or Underlying Fund share purchases may adversely affect a Fund’s or Underlying Fund’s performance to the extent that the Fund or the Underlying Fund is delayed in investing new cash or otherwise maintains a larger cash position than it ordinarily would.
Liquidity Risk — A Fund or an Underlying Fund may make investments that are illiquid or that may become less liquid in response to market developments or adverse investor perceptions. Illiquid investments may be more difficult to value. Liquidity risk may also refer to the risk that a Fund or an Underlying Fund will not be able to pay redemption proceeds within the allowable time period or without significant dilution to remaining investors’ interests because of unusual market conditions, an unusually high volume of redemption requests, or other reasons. To meet redemption requests, a Fund or an Underlying Fund may be forced to sell investments at an unfavorable time and/or under unfavorable conditions. If a Fund or an Underlying Fund is forced to sell securities at an unfavorable time and/or under unfavorable conditions, such sales may adversely affect the Fund’s or Underlying Fund’s NAV and dilute remaining investors’ interests. Liquidity risk may be the result of, among other things, the reduced number and capacity of traditional market participants to make a market in fixed income securities or the lack of an active market. The potential for liquidity risk may be magnified by a rising interest rate environment or other circumstances where investor redemptions from fixed income funds may be higher than normal, potentially causing increased supply in the market due to selling activity. These risks may be more pronounced in connection with the Funds’ investments in securities of issuers located in emerging market countries. Redemptions by large shareholders may have a negative impact on a Fund’s or Underlying Fund’s liquidity.
Market and Credit Risks — In the normal course of business, a Fund or an Underlying Fund trades financial instruments and enters into financial transactions where risk of potential loss exists due to changes in the market (market risk). The value of the securities in which a Fund or an Underlying Fund invests may go up or down in response to the prospects of individual companies, particular sectors or governments and/or general economic conditions throughout the world due to increasingly interconnected global economies and financial markets. Events such as war, military conflict, acts of terrorism, social unrest, natural disasters, recessions, inflation, rapid interest rate changes, supply chain disruptions, sanctions, the spread of infectious illness or other public health threats could also significantly impact a Fund and/or an Underlying Fund and their investments. Additionally, a Fund and/or an Underlying Fund may also be exposed to credit risk in the event that an issuer or guarantor fails to perform or that an institution or entity with which the Fund and the Underlying Fund have unsettled or open transactions defaults.
Under the Trust’s organizational documents, its Trustees, officers, employees and agents are indemnified, to the extent permitted by the Act and state law, against certain liabilities that may arise out of performance of their duties to the Funds. Additionally, in the course of business, the Funds enter into contracts that contain a variety of indemnification clauses. The Funds’ maximum exposure under these arrangements is unknown, as this would involve future claims that may be made against the Funds that have not yet occurred. However, GSAM believes the risk of loss under these arrangements to be remote.
Pursuant to an effort to consolidate the membership of the Board of Trustees of the Trust (the “Board”) with the Board of Trustees of each of Goldman Sachs ETF Trust, Goldman Sachs ETF Trust II, Goldman Sachs Real Estate Diversified Income Fund, Goldman Sachs Trust II and Goldman Sachs Trust, in July 2023, the Board voted to nominate Cheryl K. Beebe, John G. Chou, Eileen H. Dowling, Lawrence Hughes, John F. Killian, Steven D. Krichmar, Michael Latham, Lawrence W. Stranghoener and Paul C. Wirth (the “Nominees”) for election as Trustees of the Trust. Messrs. Chou and Wirth and Ms. Dowling were serving as Trustees of the Trust. At a virtual special joint meeting of shareholders held on November 16, 2023, each of the Nominees (except Messrs. Chou and Wirth and Ms. Dowling) was elected to serve as Trustees alongside the current Trustees of the Trust, effective January 1, 2024. Each of Messrs. Chou and Wirth and Ms. Dowling was also elected at the meeting and continue to serve as Trustees of the Trust.
GOLDMAN SACHS VARIABLE INSURANCE TRUST MULTI-ASSET STRATEGIES FUNDS
| | | | | | | | |
| Subsequent events after the Statements of Assets and Liabilities date have been evaluated, and GSAM has concluded that there is no impact requiring adjustment or disclosure in the financial statements. |
|
|
13. SUMMARY OF SHARE TRANSACTIONS |
| | | | | | | | | | | | | | | | |
| Share activity is as follows: | | | | | | | | | | | | | | | | |
| |
| | | Multi-Strategy Alternatives Portfolio | |
| | |
| | | For the Fiscal Year Ended | | | For the Fiscal Year Ended | |
| | | December 31, 2023 | | | December 31, 2022 | |
| |
| | | | |
| | | | |
| | | Shares | | | Dollars | | | Shares | | | Dollars |
| |
| | | | |
| | | | |
Institutional Shares | | | | | | | | | | | | | | | | |
| | | | |
Shares sold | | | 8,153 | | | $ | 73,373 | | | | 27,388 | | | $ | 258,170 | |
| | | | |
Reinvestment of distributions | | | 14,677 | | | | 130,485 | | | | 9,562 | | | | 84,430 | |
| | | | |
Shares redeemed | | | (50,253 | ) | | | (447,734 | ) | | | (44,143 | ) | | | (411,218) | |
|
| |
| | | | |
| | | (27,423 | ) | | | (243,876 | ) | | | (7,193 | ) | | | (68,618) | |
|
| |
| | | | |
Service Shares | | | | | | | | | | | | | | | | |
| | | | |
Shares sold | | | 470,659 | | | | 4,228,888 | | | | 7,434,585 | | | | 69,525,534 | |
| | | | |
Reinvestment of distributions | | | 86,067 | | | | 765,139 | | | | 43,989 | | | | 388,859 | |
| | | | |
Shares redeemed | | | (489,436 | ) | | | (4,417,319 | ) | | | (6,859,851 | ) | | | (62,785,354) | |
|
| |
| | | | |
| | | 67,290 | | | | 576,708 | | | | 618,723 | | | | 7,129,039 | |
|
| |
| | | | |
Advisor Shares | | | | | | | | | | | | | | | | |
| | | | |
Shares sold | | | 381,565 | | | | 3,431,240 | | | | 680,336 | | | | 6,255,009 | |
| | | | |
Reinvestment of distributions | | | 170,191 | | | | 1,504,491 | | | | 91,792 | | | | 806,855 | |
| | | | |
Shares redeemed | | | (482,187 | ) | | | (4,334,129 | ) | | | (240,786 | ) | | | (2,220,957) | |
|
| |
| | | | |
| | | 69,569 | | | | 601,602 | | | | 531,342 | | | | 4,840,907 | |
|
| |
| | | | |
NET INCREASE IN SHARES | | | 109,436 | | | $ | 934,434 | | | | 1,142,872 | | | $ | 11,901,328 | |
|
| |
| |
| | | Trend Driven Allocation Fund | |
| | |
| | | For the Fiscal Year Ended | | | For the Fiscal Year Ended | |
| | | December 31, 2023 | | | December 31, 2022 | |
| |
| | | | |
| | | | |
| | | Shares | | | Dollars | | | Shares | | | Dollars |
| |
| | | | |
| | | | |
Institutional Shares | | | | | | | | | | | | | | | | |
| | | | |
Shares sold | | | 1,130 | | | $ | 12,091 | | | | 25,026 | | | $ | 296,816 | |
| | | | |
Reinvestment of distributions | | | 746 | | | | 8,240 | | | | 1,959 | | | | 20,604 | |
| | | | |
Shares redeemed | | | (13,506 | ) | | | (144,781 | ) | | | (2,759 | ) | | | (30,602) | |
|
| |
| | | | |
| | | (11,630 | ) | | | (124,450 | ) | | | 24,226 | | | | 286,818 | |
|
| |
| | | | |
Service Shares | | | | | | | | | | | | | | | | |
| | | | |
Shares sold | | | 1,203,792 | | | | 12,934,237 | | | | 2,260,227 | | | | 25,627,391 | |
| | | | |
Reinvestment of distributions | | | 419,923 | | | | 4,606,548 | | | | 1,041,319 | | | | 10,871,371 | |
| | | | |
Shares redeemed | | | (3,895,032 | ) | | | (41,977,235 | ) | | | (4,360,235 | ) | | | (49,824,563) | |
|
| |
| | | | |
| | | (2,271,317 | ) | | | (24,436,450 | ) | | | (1,058,689 | ) | | | (13,325,801) | |
|
| |
| | | | |
NET DECREASE IN SHARES | | | (2,282,947 | ) | | $ | (24,560,900 | ) | | | (1,034,463 | ) | | $ | (13,038,983) | |
|
| |
Report of Independent Registered Public Accounting Firm
To the Board of Trustees of Goldman Sachs Variable Insurance Trust and Shareholders of Goldman Sachs Multi-Strategy Alternatives Portfolio and Goldman Sachs Trend Driven Allocation Fund
Opinions on the Financial Statements
We have audited the accompanying statements of assets and liabilities, including the schedules of investments, of Goldman Sachs Multi-Strategy Alternatives Portfolio and Goldman Sachs Trend Driven Allocation Fund (two of the funds constituting Goldman Sachs Variable Insurance Trust, hereafter collectively referred to as the “Funds”) as of December 31, 2023, the related statements of operations for the year ended December 31, 2023, the statements of changes in net assets for each of the two years in the period ended December 31, 2023, including the related notes, and the financial highlights for each of the five years in the period ended December 31, 2023 (collectively referred to as the “financial statements”). In our opinion, the financial statements present fairly, in all material respects, the financial position of each of the Funds as of December 31, 2023, the results of each of their operations for the year then ended, the changes in each of their net assets for each of the two years in the period ended December 31, 2023 and each of the financial highlights for each of the five years in the period ended December 31, 2023 in conformity with accounting principles generally accepted in the United States of America.
Basis for Opinions
These financial statements are the responsibility of the Funds’ management. Our responsibility is to express an opinion on the Funds’ financial statements based on our audits. We are a public accounting firm registered with the Public Company Accounting Oversight Board (United States) (PCAOB) and are required to be independent with respect to the Funds in accordance with the U.S. federal securities laws and the applicable rules and regulations of the Securities and Exchange Commission and the PCAOB.
We conducted our audits of these financial statements in accordance with the standards of the PCAOB. Those standards require that we plan and perform the audit to obtain reasonable assurance about whether the financial statements are free of material misstatement, whether due to error or fraud.
Our audits included performing procedures to assess the risks of material misstatement of the financial statements, whether due to error or fraud, and performing procedures that respond to those risks. Such procedures included examining, on a test basis, evidence regarding the amounts and disclosures in the financial statements. Our audits also included evaluating the accounting principles used and significant estimates made by management, as well as evaluating the overall presentation of the financial statements. Our procedures included confirmation of securities owned as of December 31, 2023 by correspondence with the custodian, transfer agent and brokers; when replies were not received from brokers, we performed other auditing procedures. We believe that our audits provide a reasonable basis for our opinions.
/s/ PricewaterhouseCoopers LLP
Boston, Massachusetts
February 15, 2024
We have served as the auditor of one or more investment companies in the Goldman Sachs fund complex since 2000.
GOLDMAN SACHS VARIABLE INSURANCE TRUST MULTI-ASSET STRATEGIES FUNDS
Fund Expenses — Six Month Period Ended December 31, 2023 (Unaudited)
As a shareholder of Institutional, Service or Advisor Shares of the Funds, you incur ongoing costs, including management fees, distribution and/or service (12b-1) fees (with respect to Service and Advisor Shares) and other Fund expenses. This example is intended to help you understand your ongoing costs (in dollars) of investing in the Institutional Shares, Service Shares and Advisor Shares of the Funds and to compare these costs with the ongoing costs of investing in other mutual funds.
The example is based on an investment of $1,000 invested at the beginning of the period and held for the entire period from July 1, 2023 through December 31, 2023, which represents a period of 184 days of a 365 day year.
Actual Expenses — The first line under each share class in the table below provides information about actual account values and actual expenses. You may use the information in this line, together with the amount you invested, to estimate the expenses that you paid over the period. Simply divide your account value by $1,000 (for example, an $8,600 account value divided by $1,000=8.6), then multiply the result by the number in the first line under the heading entitled “Expenses Paid” to estimate the expenses you paid on your account during this period.
Hypothetical Example for Comparison Purposes — The second line under each share class in the table below provides information about hypothetical account values and hypothetical expenses based on the Funds’ actual net expense ratio and an assumed rate of return of 5% per year before expenses, which is not the Funds’ actual return. The hypothetical account values and expenses may not be used to estimate the actual ending account balance or expenses you paid for the period. You may use this information to compare the ongoing costs of investing in the Funds and other funds. To do so, compare this 5% hypothetical example with the 5% hypothetical examples that appear in the shareholder reports of the other funds.
Please note that the expenses shown in the table are meant to highlight your ongoing costs only. As a shareholder of the Funds you do not incur any transaction costs, such as sales charges, redemption fees, or exchange fees, but shareholders of other funds may incur such costs. The second line of the table is useful in comparing ongoing costs only and will not help you determine the relative total costs of owning different funds whose shareholders may incur transaction costs.
| | | | | | | | | | | | |
| | | Multi-Strategy Alternatives Portfolio | | Trend Driven Allocation Fund |
| Share Class | | Beginning
Account Value 7/1/23 | | Ending
Account Value
12/31/23 | | Expenses
Paid for the 6 months ended 12/31/23* | | Beginning
Account Value 7/1/23 | | Ending
Account Value
12/31/23 | | Expenses
Paid for the 6 months ended 12/31/23* |
| Institutional | | | | | | | | | | | | |
Actual | | $1,000.00 | | $1,043.50 | | $1.13 | | $1,000.00 | | $1,042.50 | | $3.45 |
Hypothetical 5% return | | 1,000.00 | | 1,024.10+ | | 1.12 | | 1,000.00 | | 1,021.83+ | | 3.41 |
| Service | | | | | | | | | | | | |
Actual | | 1,000.00 | | 1,042.20 | | 2.42 | | 1,000.00 | | 1,042.00 | | 4.74 |
Hypothetical 5% return | | 1,000.00 | | 1,022.84+ | | 2.40 | | 1,000.00 | | 1,020.57+ | | 4.69 |
| Advisor | | | | | | | | | | | | |
Actual | | 1,000.00 | | 1,042.00 | | 3.19 | | N/A | | N/A | | N/A |
Hypothetical 5% return | | 1,000.00 | | 1,022.08+ | | 3.16 | | N/A | | N/A | | N/A |
| + | Hypothetical expenses are based on each Fund’s actual annualized net expense ratios and an assumed rate of return of 5% per year before expenses. |
| * | Expenses are calculated using each Fund’s annualized net expense ratio for each class, which represents the ongoing expenses as a percentage of net assets for the six months ended December 31, 2023. Expenses are calculated by multiplying the annualized net expense ratio by the average account value for the period; then multiplying the result by the number of days in the most recent fiscal half year; and then dividing that result by the number of days in the fiscal year. |
| | The annualized net expense ratios for the period were as follows: |
| | | | | | | | | | | | |
| Fund | | Advisor | | | Institutional | | Service | | | |
Multi-Strategy Alternatives Portfolio | | | 0.62 | % | | 0.22% | | | 0.47 | % | | |
Trend Driven Allocation Fund | | | N/A | | | 0.67 | | | 0.92 | | | |
41
GOLDMAN SACHS VARIABLE INSURANCE TRUST MULTI-ASSET STRATEGIES FUNDS
Voting Results of Special Meeting of Shareholders (Unaudited)
A Special Meeting of Shareholders (the “Meeting”) of the Goldman Sachs Variable Insurance Trust (“the Trust”) was held on November 16, 2023 to consider and elect nominees to the Trust’s Board of Trustees. At the Meeting, Cheryl K. Beebe, Lawrence Hughes, John F. Killian, Steven D. Krichmar, Michael Latham, and Lawrence W. Stranghoener were elected to the Trust’s Board of Trustees. In addition, at the Meeting, John G. Chou, Eileen H. Dowling, and Paul C. Wirth, each of whom was previously appointed to the Trust’s Board of Trustees rather than elected by shareholders, were elected. In electing the nominees, the Trust’s shareholders voted as follows:
| | | | | | | | | | |
Proposal Election of Trustees | | For | | Withheld |
| | |
Cheryl K. Beebe | | | | 932,148,752 | | | | | 26,776,872 | |
| | |
John G. Chou | | | | 930,378,362 | | | | | 28,547,262 | |
| | |
Eileen H. Dowling | | | | 932,188,448 | | | | | 26,737,175 | |
| | |
Lawrence Hughes | | | | 932,346,926 | | | | | 26,578,698 | |
| | |
John F. Killian | | | | 931,754,574 | | | | | 27,171,049 | |
| | |
Steven D. Krichmar | | | | 932,002,203 | | | | | 26,923,420 | |
| | |
Michael Latham | | | | 931,832,553 | | | | | 27,093,071 | |
| | |
Lawrence W. Stranghoener | | | | 931,376,144 | | | | | 27,549,480 | |
| | |
Paul C. Wirth | | | | 932,041,013 | | | | | 26,884,610 | |
| | | | | | | | | | |
GOLDMAN SACHS VARIABLE INSURANCE TRUST MULTI-ASSET STRATEGIES FUNDS
Trustees and Officers (Unaudited)
Independent Trustees
| | | | | | | | | | |
| | | | | |
Name, Address and Age1 | | Position(s) Held with the Trust | | Term of Office
and Length of
Time Served2 | | Principal Occupations During Past 5 Years | | Number of Portfolios in
Fund Complex
Overseen by
Trustee3 | | Other Directorships Held by Trustee4 |
| | | | | |
Gregory G. Weaver Age: 72 | | Chair of the Board of Trustees | | Since 2023 (Trustee since 2015) | | Mr. Weaver is retired. He is Director, Verizon Communications Inc. (2015-Present); and was formerly Chairman and Chief Executive Officer, Deloitte & Touche LLP (a professional services firm) (2001-2005 and 2012-2014); and Member of the Board of Directors, Deloitte & Touche LLP (2006-2012). Chair of the Board of Trustees — Goldman Sachs Variable Insurance Trust and Goldman Sachs Trust. | | 102 | | Verizon Communications Inc. |
| | | | | |
Dwight L. Bush Age: 66 | | Trustee | | Since 2020 | | The Honorable Dwight Bush is President and CEO of D.L. Bush & Associates (a financial advisory and private investment firm) (2002-2014 and 2017-Present); Director of MoneyLion, Inc. (an operator of a data-driven, digital financial platform) (2021-Present); and was formerly U.S. Ambassador to the Kingdom of Morocco (2014- 2017) and a Member of the Board of Directors of Santander Bank, N.A. (2018-2019). Previously, he served as an Advisory Board Member of Goldman Sachs Trust and Goldman Sachs Variable Insurance Trust (October 2019-January 2020). Trustee — Goldman Sachs Variable insurance Trust and Goldman Sachs Trust. | | 102 | | MoneyLion, Inc. (an operator of a data- driven, digital financial platform) |
| | | | | |
Kathryn A. Cassidy Age: 69 | | Trustee | | Since 2015 | | Ms. Cassidy is retired. She is Director, Vertical Aerospace Ltd. (an aerospace and technology company) (2021-Present). Formerly, Ms. Cassidy was Advisor to the Chairman (May 2014- December 2014); and Senior Vice President and Treasurer (2008-2014), General Electric Company & General Electric Capital Corporation (technology and financial services companies). Trustee — Goldman Sachs Variable Insurance Trust and Goldman Sachs Trust. | | 102 | | Vertical Aerospace Ltd. (an aerospace and technology company) |
| | | | | |
John G. Chou Age: 67 | | Trustee | | Since 2022 | | Mr. Chou is retired. Formerly, he was Executive Vice President and Special Advisor to the Chairman and CEO (2021-2022); Executive Vice President and Chief Legal Officer (2019-2021); Executive Vice President and Chief Legal & Business Officer (2017-2019); and Executive Vice President and General Counsel (2011-2017) of Cencora, Inc. (a pharmaceutical and healthcare company. Trustee — Goldman Sachs Variable Insurance Trust and Goldman Sachs Trust. | | 102 | | None |
| | | | | |
Joaquin Delgado Age: 63 | | Trustee | | Since 2020 | | Dr. Delgado is retired. He is Director, Stepan Company (a specialty chemical manufacturer) (2011-Present); and was formerly Director, Hexion Inc. (a specialty chemical manufacturer) (2019-2022); Executive Vice President, Consumer Business Group of 3M Company (July 2016-July 2019); and Executive Vice President, Health Care Business Group of 3M Company (October 2012-July 2016). Previously, Dr. Delgado served as an Advisory Board Member of Goldman Sachs Trust and Goldman Sachs Variable Insurance Trust (October 2019-January 2020). Trustee — Goldman Sachs Variable insurance Trust and Goldman Sachs Trust. | | 102 | | Stepan Company (a specialty chemical manufacturer) |
| | | | | | | | | | |
GOLDMAN SACHS VARIABLE INSURANCE TRUST MULTI-ASSET STRATEGIES FUNDS
Trustees and Officers (Unaudited) (continued)
Independent Trustees
| | | | | | | | | | |
| | | | | |
Name, Address and Age1 | | Position(s) Held with the Trust | | Term of Office
and Length of
Time Served2 | | Principal Occupations During Past 5 Years | | Number of Portfolios in
Fund Complex
Overseen by
Trustee3 | | Other Directorships Held by Trustee4 |
| | | | | |
Eileen H. Dowling Age: 61 | | Trustee | | Since 2021 | | Ms. Dowling is retired. Formerly, she was Senior Advisor (April 2021-September 2021); and Managing Director (2013-2021), BlackRock, Inc. (a financial services firm). As Managing Director, she held senior management positions, including Global Head of Global Consultant Relations (2017-2021), Multinational Corporations (2019-2021), the Institutional Product Group (2015-2019) and Institutional Marketing (2013- 2016). Ms. Dowling was a member of the Global Operating Committee and Product Executive Committee of BlackRock. Trustee — Goldman Sachs Variable Insurance Trust and Goldman Sachs Trust. | | 102 | | None |
| | | | | |
Paul C. Wirth Age: 66 | | Trustee | | Since 2022 | | Mr. Wirth is retired. He is Executive Advisor, My Next Season LLC (a career transition advisory firm) (2023 – Present) Formerly, he was Deputy Chief Financial Officer and Principal Accounting Officer (2011-2020); Finance Director and Principal Accounting Officer (2010-2011); and Managing Director, Global Controller, and Chief Accounting Officer (2005-2010) of Morgan Stanley. Trustee — Goldman Sachs Variable Insurance Trust and Goldman Sachs Trust. | | 102 | | None |
| | | �� | | | | | | | |
GOLDMAN SACHS VARIABLE INSURANCE TRUST MULTI-ASSET STRATEGIES FUNDS
Trustees and Officers (Unaudited) (continued)
Interested Trustee*
| | | | | | | | | | |
| | | | | |
Name, Address and Age1 | | Position(s) Held with the Trust | | Term of Office
and Length of
Time Served2 | | Principal Occupations During Past 5 Years | | Number of Portfolios in
Fund Complex
Overseen by
Trustee3 | | Other Directorships Held by Trustee4 |
| | | | | |
James A. McNamara Age: 61 | | President and Trustee | | Since 2007 | | Advisory Director, Goldman Sachs (January 2018-Present); Managing Director, Goldman Sachs (January 2000-December 2017); Director of Institutional Fund Sales, GSAM (April 1998- December 2000); and Senior Vice President and Manager, Dreyfus Institutional Service Corporation (January 1993-April 1998). President and Trustee — Goldman Sachs Variable Insurance Trust; Goldman Sachs Trust; Goldman Sachs Trust II; Goldman Sachs ETF Trust; Goldman Sachs ETF Trust II; Goldman Sachs Credit Income Fund; and Goldman Sachs Real Estate Diversified Income Fund. | | 192 | | None |
| | | | | | | | | | |
| * | Mr. McNamara is considered to be an “Interested Trustee” because he holds positions with Goldman Sachs and owns securities issued by The Goldman Sachs Group, Inc. Mr. McNamara holds comparable positions with certain other companies of which Goldman Sachs, GSAM or an affiliate thereof is the investment adviser, administrator and/or distributor. |
| 1 | Each Trustee may be contacted by writing to the Trustee, c/o Goldman Sachs, 200 West Street, New York, New York, 10282, Attn: Robert Griffith. Information is provided as of December 31, 2023. |
| 2 | Subject to such policies as may be adopted by the Board from time-to-time, each Trustee holds office for an indefinite term, until the earliest of: (a) the election of his or her successor; (b) the date the Trustee resigns or is removed by the Board or shareholders, in accordance with the Trust’s Declaration of Trust; or (c) the termination of the Trust. The Board has adopted policies which provide that each Independent Trustee shall retire as of December 31st of the calendar year in which he or she reaches (a) his or her 75th birthday or (b) the 15th anniversary of the date he or she became a Trustee, whichever is earlier, unless a waiver of such requirements shall have been adopted by a majority of the other Trustees. These policies may be changed by the Trustees without shareholder vote. |
| 3 | The Goldman Sachs Fund Complex includes certain other companies listed above for each respective Trustee. As of December 31, 2023, Goldman Sachs Trust consisted of 87 portfolios; Goldman Sachs Variable Insurance Trust consisted of 15 portfolios (11 of which offered shares to the public); Goldman Sachs Trust II consisted of 18 portfolios (7 of which offered shares to the public); Goldman Sachs ETF Trust consisted of 68 portfolios (37 of which offered shares to the public); Goldman Sachs ETF Trust II consisted of 2 portfolios; and Goldman Sachs Credit Income Fund and Goldman Sachs Real Estate Diversified Income Fund each consisted of one portfolio. Goldman Sachs Credit Income Fund did not offer shares to the public. |
| 4 | This column includes only directorships of companies required to report to the Securities and Exchange Commission under the Securities Exchange Act of 1934 (i.e., “public companies”) or other investment companies registered under the Act. |
Additional information about the Trustees is available in the Funds’ Statement of Additional Information, which can be obtained from Goldman Sachs free of charge by calling this toll-free number (in the United States of America): 1-800-526-7384.
GOLDMAN SACHS VARIABLE INSURANCE TRUST MULTI-ASSET STRATEGIES FUNDS
Trustees and Officers (Unaudited) (continued)
Officers of the Trust*
| | | | | | |
| | | |
| Name, Address and Age1 | | Position(s) Held with the Trust | | Term of Office and Length of Time Served2 | | Principal Occupations During Past 5 Years |
| | | |
James A. McNamara 200 West Street New York, NY 10282 Age: 61 | | Trustee and President | | Since 2007 | | Advisory Director, Goldman Sachs (January 2018-Present); Managing Director, Goldman Sachs (January 2000-December 2017); Director of Institutional Fund Sales, GSAM (April 1998-December 2000); and Senior Vice President and Manager, Dreyfus Institutional Service Corporation (January 1993-April 1998). President and Trustee — Goldman Sachs Variable Insurance Trust; Goldman Sachs Trust; Goldman Sachs Trust II; Goldman Sachs ETF Trust; Goldman Sachs ETF Trust II; Goldman Sachs Credit Income Fund; and Goldman Sachs Real Estate Diversified Income Fund. |
| | | |
Robert Griffith 200 West Street New York, NY 10282 Age: 49 | | Secretary | | Since 2023 | | Managing Director, Goldman Sachs (September 2022 – Present); General Counsel, Exchange Traded Concepts, LLC (October 2021 – September 2022); Vice President, Goldman Sachs (August 2011 – October 2021); Associate General Counsel, Goldman Sachs (December 2014 – Present); Assistant General Counsel, Goldman Sachs (August 2011 – December 2014); Vice President and Counsel, Nomura Holding America, Inc. (2010 – 2011); and Associate, Simpson Thacher & Bartlett LLP (2005 – 2010). Secretary — Goldman Sachs Variable Insurance Trust; (previously Assistant Secretary (2022)); Goldman Sachs Trust (previously Assistant Secretary (2022)); Goldman Sachs Trust II (previously Assistant Secretary (2022)); Goldman Sachs ETF Trust (previously Assistant Secretary (2022)); Goldman Sachs ETF Trust II; (previously Assistant Secretary (2022)); and Goldman Sachs Real Estate Diversified Income Fund (previously Assistant Secretary (2022)). |
| | | |
Joseph F. DiMaria 30 Hudson Street Jersey City, NJ 07302 Age: 55 | | Treasurer, Principal Financial Officer and Principal Accounting Officer | | Since 2017 (Treasurer and Principal Financial Officer since 2019) | | Managing Director, Goldman Sachs (November 2015-Present) and Vice President — Mutual Fund Administration, Columbia Management Investment Advisers, LLC (May 2010- October 2015). Treasurer, Principal Financial Officer and Principal Accounting Officer — Goldman Sachs Variable Insurance Trust (previously Assistant Treasurer (2016)); Goldman Sachs Trust (previously Assistant Treasurer (2016)); Goldman Sachs Trust II (previously Assistant Treasurer (2017)); Goldman Sachs ETF Trust (previously Assistant Treasurer (2017)); Goldman Sachs ETF Trust II; Goldman Sachs Credit Income Fund; and Goldman Sachs Real Estate Diversified Income Fund. |
| | | | | | |
| * | Represents a partial list of officers of the Trust. Additional information about all the officers is available in the Funds’ Statement of Additional Information, which can be obtained from Goldman Sachs free of charge by calling this toll-free number (in the United States): 1-800-526-7384. |
| 1 | Information is provided as of December 31, 2023. |
| 2 | Officers hold office at the pleasure of the Board of Trustees or until their successors are duly elected and qualified. Each officer holds comparable positions with certain other companies of which Goldman Sachs, GSAM or an affiliate thereof is the investment adviser, administrator and/or distributor. |
Goldman Sachs Variable Insurance Trust — Tax Information (Unaudited)
For the year ended December 31, 2023, 3.31% and 8.99% of the dividends paid from net investment company taxable income by the Multi-Strategy Alternatives Portfolio and Trend Driven Allocation Fund, respectively, qualify for the dividends received deduction available to corporations.
For the year ended December 31, 2023, the Multi-Strategy Alternatives Portfolio has elected to pass through a credit for taxes paid to foreign jurisdictions. The total amount of income received by the Multi-Strategy Alternatives Portfolio from sources within foreign countries and possessions of the United States was $0.0275 per share, all of which is attributable to qualified passive income. The percentage of net investment income dividends paid by the Portfolio during the year ended December 31, 2023 from foreign sources was 6.91%. The total amount of foreign taxes paid by the Portfolio was $0.0039 per share.
(This page intentionally left blank)
(This page intentionally left blank)
(This page intentionally left blank)
TRUSTEES TRUSTEES (continued) Gregory G. Weaver, Chair Michael Latham* Cheryl K. Beebe* James A. McNamara Dwight L. Bush Lawrence W. Stranghoener* Kathryn A. Cassidy Paul C. Wirth John G. Chou *Effective January 1, 2024 Joaquin Delgado OFFICERS Eileen H. Dowling James A. McNamara, President Lawrence Hughes* Joseph F. DiMaria, Principal Financial Officer, John F. Killian* Principal Accounting Officer and Treasurer Steven D. Krichmar* Robert Griffith, Secretary GOLDMAN SACHS & CO. LLC GOLDMAN SACHS ASSET MANAGEMENT, L.P. Distributor and Transfer Agent Investment Adviser 200 West Street, New York New York 10282 Visit our website at www.GSAMFUNDS.com to obtain the most recent month-end returns. The reports concerning the Funds included in this shareholder report may contain certain forward-looking statements about the factors that may affect the performance of the Funds in the future. These statements are based on Fund management’s predictions and expectations concerning certain future events and their expected impact on the Funds, such as performance of the economy as a whole and of specific industry sectors, changes in the levels of interest rates, the impact of developing world events, and other factors that may influence the future performance of the Funds. Management believes these forward-looking statements to be reasonable, although they are inherently uncertain and difficult to predict. Actual events may cause adjustments in portfolio management strategies from those currently expected to be employed. A description of the policies and procedures that the Fund uses to determine how to vote proxies relating to portfolio securities and information regarding how the Fund voted proxies relating to portfolio securities during the most recent 12-month period ended June 30 is available (i) without charge, upon request by calling 1-800-621-2550; and (ii) on the Securities and Exchange Commission (“SEC”) web site at http://www.sec.gov. The Fund will file its portfolio holdings information for each month in a fiscal quarter within 60 days after the end of the relevant fiscal quarter on Form N-PORT. Portfolio holdings information for the third month of each fiscal quarter will be made available on the SEC’s web site at http://www.sec.gov. Portfolio holdings information may be obtained upon request and without charge by calling 1-800-526-7384 (for Retail Shareholders) or 1-800-621-2550 (for Institutional Shareholders). Views and opinions expressed are for informational purposes only and do not constitute a recommendation by GSAM to buy, sell, or hold any security. Views and opinions are current as of the date of this presentation and may be subject to change, they should not be construed as investment advice. Goldman Sachs & Co. LLC (“Goldman Sachs”) does not provide legal, tax or accounting advice. Any statement contained in this communication (including any attachments) concerning U.S. tax matters was not intended or written to be used, and cannot be used, for the purpose of avoiding penalties under the Internal Revenue Code, and was written to support the promotion or marketing of transaction or matter addressed. Clients of Goldman Sachs should obtain their own independent tax advice based on their particular circumstances. The website links provided are for your convenience only and are not an endorsement or recommendation by GSAM of any of these websites or the products or services offered. GSAM is not responsible for the accuracy and validity of the content of these websites. Economic and market forecasts presented herein reflect our judgment as of the date of this presentation and are subject to change without notice. These forecasts do not take into account the specific investment objectives, restrictions, tax and financial situation or other needs of any specific client. Actual data will vary and may not be reflected here. These forecasts are subject to high levels of uncertainty that may affect actual performance. Accordingly, these forecasts should be viewed as merely representative of a broad range of possible outcomes. These forecasts are estimated, based on assumptions, and are subject to significant revision and may change materially as economic and market conditions change. Goldman Sachs has no obligation to provide updates or changes to these forecasts. Case studies and examples are for illustrative purposes only. Fund holdings and allocations shown are as of December 31, 2023 and may not be representative of future investments. Fund holdings should not be relied on in making investment decisions and should not be construed as research or investment advice regarding particular securities. Current and future holdings are subject to risk. References to indices, benchmarks or other measures of relative market performance over a specified period of time are provided for your information only and do not imply that the portfolio will achieve similar results. The index composition may not reflect the manner in which a portfolio is constructed. While an adviser seeks to design a portfolio which reflects appropriate risk and return features, portfolio characteristics may deviate from those of the benchmark. The Global Industry Classification Standard (“GICS”) was developed by and is the exclusive property and a service mark of Morgan Stanley Capital International Inc. (“MSCI”) and Standard & Poor’s, a division of The McGraw-Hill Companies, Inc. (“S&P”) and is licensed for use by Goldman Sachs. Neither MSCI, S&P nor any other party involved in making or compiling the GICS or any GICS classifications makes any express or implied warranties or representations with respect to such standard or classification (or the results to be obtained by the use thereof), and all such parties hereby expressly disclaim all warranties of originality, accuracy, completeness, merchantability or fitness for a particular purpose with respect to any of such standard or classification. Without limiting any of the foregoing, in no event shall MSCI, S&P, any of their affiliates or any third party involved in making or compiling the GICS or any GICS classifications have any liability for any direct, indirect, special, punitive, consequential or any other damages (including lost profits) even if notified of the possibility of such damages. The portfolio risk management process includes an effort to monitor and manage risk, but does not imply low risk. Shares of the Goldman Sachs VIT Funds are offered to separate accounts of participating life insurance companies for the purpose of funding variable annuity contracts and variable life insurance policies. Shares of the Fund are not offered directly to the general public. The variable annuity contracts and variable life insurance policies are described in the separate prospectuses issued by participating insurance companies. You should refer to those prospectuses for information about surrender charges, mortality and expense risk fees and other charges that may be assessed by participating insurance companies under the variable annuity contracts or variable life insurance policies. Such fees or charges, if any, may affect the return you may realize with respect to your investments. Ask your representative for more complete information. Please consider a fund’s objectives, risks and charges and expenses, and read the prospectus carefully before investing. The prospectus contains this and other information about the Fund. This material is not authorized for distribution to prospective investors unless preceded or accompanied by a current prospectus or summary prospectus, if applicable. Investors should consider the Fund’s objective, risks, and charges and expenses, and read the summary prospectus, if available, and/or the prospectus carefully before investing or sending money. The summary prospectus, if available, and the prospectus contain this and other information about the Fund and may be obtained from your authorized dealer or from Goldman Sachs & Co. LLC by calling 1-800-621-2550. This report is prepared for the general information of contract owners and is not an offer of shares of the Goldman Sachs Variable Insurance Trust Funds. © 2024 Goldman Sachs. All rights reserved. VITFOFAR-24/356416-OTU-1966361
Goldman Sachs Variable Insurance Trust Goldman Sachs Government Money Market Fund Annual Report December 31, 2023
Goldman Sachs Government Money Market Fund
Effective January 24, 2023, open-end mutual funds and exchange traded funds will be required to provide shareholders with streamlined annual and semi-annual shareholder reports (“Tailored Shareholder Reports”). Funds will be required to prepare a separate Tailored Shareholder Report for each share class of a fund that highlights key information to investors. Other information, including financial statements, will no longer appear in a fund’s shareholder report, but will be available online, delivered free of charge upon request, and filed with the SEC on a semi-annual basis on Form N-CSR. The new requirements have a compliance date of July 24, 2024.
You could lose money by investing in the Fund. Although the Fund seeks to preserve the value of your investment at $1.00 per share, it cannot guarantee it will do so. An investment in the Fund is not a bank account or a deposit of the bank and is not insured or guaranteed by the Federal Deposit Insurance Corporation or any other government agency. The Fund’s sponsor is not required to reimburse the Fund for losses, and you should not expect that the sponsor will provide financial support to the Fund at any time, including during periods of market stress.
GOLDMAN SACHS VARIABLE INSURANCE TRUST GOVERNMENT MONEY MARKET FUND
|
| |
INVESTMENT OBJECTIVE The Fund seeks to maximize current income to the extent consistent with the preservation of capital and the maintenance of liquidity by investing exclusively in high quality money market instruments. |
Portfolio Management Discussion and Analysis
Below, the Goldman Sachs Money Market Portfolio Management Team discusses the Goldman Sachs Variable Insurance Trust — Goldman Sachs Government Money Market Fund’s (the “Fund”) performance and positioning for the 12-month period ended December 31, 2023 (the “Reporting Period”).
How did the Fund perform during the Reporting Period?
The Fund’s Institutional Shares’ standardized 7-day current yield was 5.25% and their standardized 7-day effective yield was 5.38% as of December 31, 2023. The Institutional Shares’ one-month simple average yield was 5.25% as of December 31, 2023. The Institutional Shares’ 7-day distribution yield as of December 31, 2023 was 5.27%.
The Fund’s Service Shares’ standardized 7-day current yield was 5.00% and their standardized 7-day effective yield was 5.12% as of December 31, 2023. The Service Shares’ one-month simple average yield was 5.00% as of December 31, 2023. The Service Shares’ 7-day distribution yield as of December 31, 2023 was 5.02%.
The yields represent past performance. Past performance does not guarantee future results. Current performance may be lower or higher than the performance quoted above.
Yields will fluctuate as market conditions change. The yield quotations more closely reflect the current earnings of the Fund than total return quotations.
What economic and market factors most influenced the money markets as a whole during the Reporting Period?
During the Reporting Period, the money markets were most influenced by Federal Reserve (“Fed”) policy and the outlook for the U.S. economy.
In the first quarter of 2023, when the Reporting Period began, the Fed continued tightening monetary policy, raising the targeted federal funds (“fed funds”) rate twice—by 25 basis points in both February and March. (A basis point is 1/100th of a percentage point.) In mid-March, Silicon Valley Bank and Signature Bank failed, marking the largest U.S. regional bank failure since the 2008 financial crisis. That same month, the Swiss government brokered a deal for UBS to purchase Credit Suisse, which was on the brink of collapse. During the quarter overall, a tight labor market and firm inflation supported the U.S. dollar, though economic growth headwinds from tighter financial and credit conditions led to dovish monetary policy expectations, weighing on the currency. (Dovish tends to suggest lower interest rates; opposite of hawkish.)
In the second quarter of 2023, the Fed raised the fed funds rate by another 25 basis points at its May policy meeting and signaled a willingness to pause on further rate actions, as U.S. inflation had started to moderate. Also in May, First Republic Bank was seized by the Federal Deposit Insurance Corporation and sold to JPMorgan Chase. In early June, the resolution of U.S. debt ceiling negotiations, coupled with the easing of banking sector stress, improved investor sentiment overall. Fed policymakers left interest rates unchanged at their June meeting, though Fed Chair Jerome Powell suggested hiking rates “at consecutive meetings is not off the table.” The Fed’s June dot plot showed a median projection of two additional rate hikes in 2023. (The Fed’s dot plot shows the interest rate projections of the members of the Federal Open Market Committee.)
During the third quarter of 2023, Fed officials hiked the fed funds rate by an additional 25 basis points at their July policy meeting but remained on hold at their September meeting. Resilient U.S. economic data and market expectations that policy rates would stay higher for longer pushed up the 10-year U.S. Treasury yield, which hit 4.63% on September 27th—its highest level since 2007. In August, Fitch Ratings downgraded long-term U.S. sovereign debt from AAA to AA+, reflecting U.S. governance and medium-term fiscal challenges. Subsequently, Moody’s Investors Service took ratings action on 27 U.S. banks in response to profitability concerns, low regulatory capital among regional banks compared to larger banks and global peers, and potential losses on loans (particularly for those with large commercial real estate exposure). The U.S. labor market remained strong, continuing to make progress toward rebalancing itself from pandemic-era extremes. Inflation eased overall, but there was a reacceleration in some key components. Nevertheless, the U.S. remained on a disinflationary path, supporting market expectations that the Fed may have reached the end of its current interest rate hiking cycle.
The fourth quarter of 2023 marked an important inflection point. In October, U.S. Treasury yields rose to multi-year highs, with the 10-year U.S. Treasury yield briefly breaching 5% for the first time since 2007. The increase was driven, in our view, by better than previously anticipated U.S. economic growth prospects, which dampened market expectations for Fed interest rate cuts in 2024. The
GOLDMAN SACHS VARIABLE INSURANCE TRUST GOVERNMENT MONEY MARKET FUND
Fed left the fed funds rate unchanged in October, as tighter financial conditions, led by higher long-term interest rates, alleviated the need, as determined by the Fed, for further policy tightening. November 2023 saw the greatest easing of U.S. financial conditions in any month during the previous 40 years. The easing was largely the result of a significant drop in interest rates, with the 10-year U.S. Treasury yield falling approximately 51 basis points during the month. Weaker inflation data and ongoing disinflation trends suggested the Fed might have reached the peak of its monetary policy tightening cycle. At their November meeting, Fed policymakers left the fed funds rate unchanged in a range between 5.25% and 5.50%. At its December meeting, the Fed again left the target range for the fed funds rate unchanged. Meeting minutes indicated that Fed policymakers viewed the fed funds rate as “likely at or near its peak for this tightening cycle.” There were also comments in the minutes on inflation progress to date and the Fed’s inflation outlook, risks to economic growth from keeping rates too high, and how long the policy rate might need to remain restrictive. Perhaps most significantly, the Fed indicated that three interest rate cuts were possible in 2024.
In this environment, the yields of taxable money market funds increased. Investments in U.S. taxable money market funds rose during the Reporting Period, from approximately $4.5 trillion to $5.7 trillion, according to iMoneyNet. U.S. tax-exempt money market fund investments increased during the Reporting Period from $108 billion to $122 billion, according to iMoneyNet.
Yields rose along the money market yield curve, as the Fed raised the fed funds rate and tightened monetary policy. (Yield curve is a spectrum of interest rates based on maturities of varying lengths.) That said, the money market yield curve inverted during the Reporting Period. (In an inverted yield curve, shorter-term yields are higher than longer-term yields.) At the start of the Reporting Period, six-month and one-year yields were modestly above that of the very front-end, or short-term end, of the curve. As the Reporting Period progressed, the middle segment of the yield curve rose well above the one-year segment, though this inversion eased slightly toward the end of the Reporting Period.
Money market funds overall remained a viable investment for investors seeking stability, liquidity and yield amid ongoing uncertainty and elevated volatility in the financial markets broadly.
During the Reporting Period, the Securities & Exchange Commission (“SEC”) adopted changes to the rules that govern money market funds. While some of these changes have already taken effect, the remaining changes will take effect either by April 2, 2024 or October 2, 2024.
1. Effective October 2, 2023, institutional and retail money market funds were no longer permitted to temporarily restrict redemptions (a “redemption gate”) and/or impose a liquidity fee on redemptions (up to 2%) if the applicable fund’s portfolio liquidity fell below the required minimums. Government money market funds are exempt from requirements relating to these redemption gates and/or liquidity fees.
2. Effective April 2, 2024, institutional and retail money market funds will be permitted to impose a discretionary liquidity fee on redemptions (up to 2%), if the applicable fund’s board of trustees (or its delegate) determines that it is in the best interests of the fund to do so. Government money market funds will continue to be exempt from requirements relating to these discretionary liquidity fees. Institutional and retail money market funds may choose to rely on this modified discretionary liquidity fee framework prior to April 2, 2024.
3. Effective April 2, 2024, all money market funds will be required to increase their minimum levels of daily and weekly liquid assets from 10% and 30%, respectively, to 25% and 50%, respectively.
4. Effective October 2, 2024, institutional money market funds will be required to impose a mandatory liquidity fee on redemptions, if the applicable fund experiences total daily net redemptions that exceed 5% of net assets, unless the fee is de minimis (i.e., less than 1 basis point of the value of the shares redeemed). Government and retail money market funds will be exempt from these requirements.
What key factors were responsible for the Fund’s performance during the Reporting Period?
The Fund’s yields increased during the Reporting Period, largely because of the economic and market factors discussed above. The Fund remained highly liquid throughout.
The Fund continued to be flexibly guided by shifting marketing conditions, and we positioned the Fund to seek to take advantage of the Fed’s monetary policy. During the Reporting Period, the Fund’s positioning along the money market yield curve and in specific securities was predicated on market expectations around interest rates and Fed rate hikes and/or pauses in the near term. The overall strategy of the Fund shifted as the Reporting Period progressed from shorter weighted average maturities and weighted average life to longer weighted average maturities and weighted average life, as we sought to take advantage of the gradually shifting monetary policy actions of the Fed.
Indeed, duration management and positioning play a key role in our management philosophy. (Duration is a measure of a fund’s sensitivity to changes in interest rates.) That said, it should be noted that regardless of interest rate conditions, we manage the Fund consistently. Our investment approach has always been tri-fold—to seek preservation of capital, daily liquidity and maximization of yield potential. We manage interest, liquidity and credit risk daily. Whether interest rates are historically low, high or in-between, we intend to continue to use our actively managed approach to provide the best possible return within the framework of the Fund’s guidelines and objectives.
GOLDMAN SACHS VARIABLE INSURANCE TRUST GOVERNMENT MONEY MARKET FUND
How did you manage the Fund’s weighted average maturity during the Reporting Period?
On December 31, 2022, the Fund’s weighted average maturity was 6 days. At any given time, the Fund’s decisions around weighted average maturity positioning are based on how market interest rates compare with our near-term expectations, including supply dynamics and monetary policy. At the end of the Reporting Period, the Fund’s weighted average maturity was 51 days. Lengthening weighted average maturities, albeit within historical ranges, during the Reporting Period was additive to Fund performance overall given the slowing rate increases and then pauses of the Fed—and as easing began to be priced into the market.
Throughout the Reporting Period, we focused on U.S. government agency repurchase agreements, U.S. Treasuries, U.S. government agency securities, U.S. Treasury repurchase agreements and floating rate, or variable rate, demand notes when and where we saw what we considered to be attractive opportunities. The Fund primarily held instruments with an effective maturity of one year or less.
The weighted average maturity of a money market fund is a measure of its price sensitivity to changes in interest rates. Also known as effective maturity, weighted average maturity measures the weighted average of the maturity date of bonds held by the Fund taking into consideration any available maturity shortening features. A Fund’s weighted average maturity is an average of the effective maturities of all securities held in the portfolio, weighted by each security’s percentage of net assets. This must not exceed 60 days, as calculated under SEC Rule 2a-7.
How did you manage the Fund’s weighted average life during the Reporting Period?
During the Reporting Period, we managed the weighted average life of the Fund between 39 days and 116 days. The weighted average life of the Fund was 40 days as of December 31, 2022 and was 113 days on December 31, 2023. The weighted average life of a money market fund is a measure of a money market fund’s price sensitivity to changes in liquidity and/or credit risk.
Under amendments to SEC Rule 2a-7 that became effective in May 2010, the maximum allowable weighted average life of a money market fund is 120 days. While one of the goals of the SEC’s money market fund rule is to reinforce conservative investment practices across the money market fund industry, our security selection process has long emphasized conservative investment choices.
How was the Fund invested during the Reporting Period?
The Fund had investments in U.S. government agency repurchase agreements, U.S. Treasury securities, U.S. government agency securities, U.S. Treasury repurchase agreements and floating rate, or variable rate, demand notes during the Reporting Period.
Adding most to Fund performance during the Reporting Period tended to be its floating rate exposure and its overnight repurchase agreement positions—as well as its shorter duration position, especially during the first half of the Reporting Period when rates were rising more significantly. Conversely, the Fund’s fixed rate positions, albeit a modest percentage of Fund assets, detracted from performance during the Reporting Period.
Throughout, we stayed true to our investment discipline, favoring liquidity and high quality credits over added yield. The primary focal points for our team are consistently managing interest rate risk and credit risk. We were able to navigate interest rate risk by adjusting the Fund’s weighted average maturity longer or shorter as market conditions shifted and to mitigate potential credit risk by buying high quality, creditworthy names, strategies which added to the Fund’s performance during the Reporting Period. Throughout the Reporting Period, we managed the Fund’s allocations to different sub-sectors of the money market depending on their relative value. We also adapted a flexible approach to our duration management and positioning so that we could take advantage of opportunities wherever they may arise.
Did you make any changes in the Fund’s portfolio during the Reporting Period?
We made adjustments to the Fund’s weighted average maturity, weighted average life and specific security type composition allocations based on then-current market conditions, our near-term view, and anticipated and actual Fed monetary policy statements. As interest rates were rising, we tended to focus on Treasury floating rate securities and shorter-duration securities, when applicable. Then, as Fed statements and economic data shifted, we changed our allocation strategy for the Fund accordingly. More specifically, later in the Reporting Period, we extended the Fund’s weighted average maturity and weighted average life to extend the Fund’s duration positioning given our shifting outlook on interest rates. We implemented this strategy by reducing the Fund’s allocation to Treasury floating rate securities and overnight repurchase agreements.
Were there any changes to the Fund’s portfolio management team during the Reporting Period?
There were no changes to the Fund’s portfolio management team during the Reporting Period.
What is the Fund’s tactical view and strategy for the months ahead?
At the end of the Reporting Period, with inflationary pressures subsiding, U.S. economic data had begun to support the possibility of a soft landing. (A soft landing, in economics, is a cyclical downturn that avoids recession. It typically describes attempts by central banks to raise interest rates just enough to stop an economy from overheating and experiencing high inflation, without causing a significant increase in unemployment, or a hard landing.) In our view, the Fed had reached an inflection point with respect to policy rates, and we believed it was likely the Fed would begin to lower rates in the first half of 2024.
GOLDMAN SACHS VARIABLE INSURANCE TRUST GOVERNMENT MONEY MARKET FUND
Market liquidity concerns at the end of the Reporting Period centered on the Fed’s quantitative tightening (that is, reduction in the size of its balance sheet), the Fed’s reverse repo (“RRP”) facility and the continued large issuance of Treasury securities across all maturities—which, collectively, remove a significant amount of cash from the U.S. monetary system. (Through the RRP facility, the Fed borrows from financial entities, including money market mutual funds.)
Looking ahead, our strategy continues to be flexibly guided by shifting market conditions, positioning the Fund and its duration to seek to take advantage of anticipated interest rate movements or lack thereof. As always, we intend to continue to use our actively managed approach to seek the best possible return within the framework of the Fund’s investment guidelines and objectives. In addition, we will continue to manage interest, liquidity and credit risk daily.
We will, of course, continue to closely monitor economic data, Fed policy, and any shifts in the money market yield curve, as we strive to strategically navigate the interest rate environment.
FUND BASICS
|
Security Type |
(Percentage of Net Assets) |
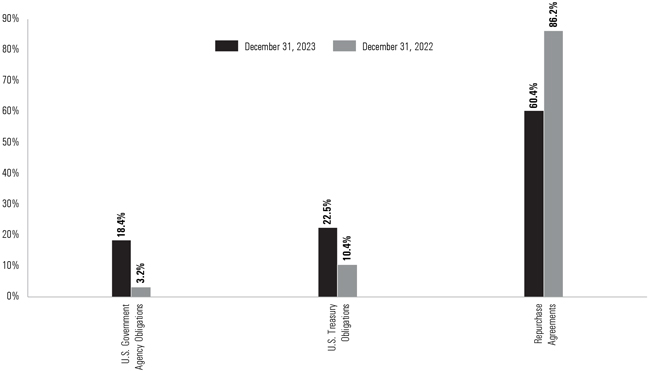
| | † | The Fund is actively managed and, as such, its portfolio composition may differ over time. The percentage shown for each investment category reflects the value (based on amortized cost) of investments in that category as a percentage of net assets. Figures in the above chart may not sum to 100% due to the exclusion of other assets and liabilities. |
| | | For more information about your Fund, please refer to www.GSAMFUNDS.com. There, you can learn more about your Fund’s investment strategies, holdings, and performance. |
GOLDMAN SACHS VARIABLE INSURANCE TRUST GOVERNMENT MONEY MARKET FUND
|
Schedule of Investments December 31, 2023 |
| | | | | | | | | | | | | | | | |
| | | Principal Amount | | | Interest Rate | | | Maturity Date | | Amortized Cost | |
| |
| | U.S. Government Agency Obligations – 18.4% | |
| |
| | Federal Farm Credit Banks Funding Corp. | |
| | $ | | | 400,000 | | | | 4.947 | % | | 01/12/24 | | $ | 399,432 | |
| | Federal Farm Credit Banks Funding Corp. (FEDL01 + 0.075%) | |
| | | | | 1,300,000 | | | | 5.412 | (a) | | 09/13/24 | | | 1,299,331 | |
| | Federal Farm Credit Banks Funding Corp. (FEDL01 + 0.140%) | |
| | | | | 700,000 | | | | 5.470 | (a) | | 09/17/24 | | | 699,995 | |
| | | | | 200,000 | | | | 5.472 | (a) | | 11/14/24 | | | 199,966 | |
| | | | | 751,000 | | | | 5.473 | (a) | | 05/19/25 | | | 750,678 | |
| | Federal Farm Credit Banks Funding Corp. (FEDL01 + 0.150%) | |
| | | | | 1,040,000 | | | | 5.480 | (a) | | 09/26/25 | | | 1,040,000 | |
| | Federal Farm Credit Banks Funding Corp. (FEDL01 + 0.155%) | |
| | | | | 1,728,000 | | | | 5.485 | (a) | | 06/27/25 | | | 1,728,000 | |
| | Federal Farm Credit Banks Funding Corp. (Prime Rate - 3.000%) | |
| | | | | 1,818,000 | | | | 5.501 | (a) | | 03/22/24 | | | 1,817,921 | |
| | | | | 1,200,000 | | | | 5.501 | (a) | | 01/24/25 | | | 1,199,939 | |
| | | | | 2,078,000 | | | | 5.500 | (a) | | 07/28/25 | | | 2,078,000 | |
| | Federal Farm Credit Banks Funding Corp. (Prime Rate - 3.005%) | |
| | | | | 1,585,000 | | | | 5.495 | (a) | | 02/10/25 | | | 1,584,949 | |
| | Federal Farm Credit Banks Funding Corp. (Prime Rate - 3.020%) | |
| | | | | 1,514,000 | | | | 5.480 | (a) | | 09/08/25 | | | 1,514,000 | |
| | Federal Farm Credit Banks Funding Corp. (Prime Rate - 3.040%) | |
| | | | | 1,768,000 | | | | 5.460 | (a) | | 06/18/25 | | | 1,768,000 | |
| | Federal Farm Credit Banks Funding Corp. (SOFR + 0.060%) | |
| | | | | 500,000 | | | | 5.467 | (a) | | 04/29/24 | | | 499,854 | |
| | | | | 500,000 | | | | 5.469 | (a) | | 07/22/24 | | | 499,726 | |
| | Federal Farm Credit Banks Funding Corp. (SOFR + 0.090%) | |
| | | | | 946,000 | | | | 5.490 | (a) | | 03/07/25 | | | 946,000 | |
| | Federal Farm Credit Banks Funding Corp. (SOFR + 0.110%) | |
| | | | | 3,842,000 | | | | 5.510 | (a) | | 03/11/25 | | | 3,842,000 | |
| | Federal Farm Credit Banks Funding Corp. (SOFR + 0.115%) | |
| | | | | 993,000 | | | | 5.515 | (a) | | 12/03/24 | | | 993,000 | |
| | Federal Farm Credit Banks Funding Corp. (SOFR + 0.125%) | |
| | | | | 2,690,000 | | | | 5.525 | (a) | | 02/04/25 | | | 2,690,000 | |
| | | | | 1,043,000 | | | | 5.525 | (a) | | 02/10/25 | | | 1,043,000 | |
| | | | | 5,863,000 | | | | 5.525 | (a) | | 03/24/25 | | | 5,863,000 | |
| | Federal Farm Credit Banks Funding Corp. (SOFR + 0.130%) | |
| | | | | 1,561,000 | | | | 5.530 | (a) | | 08/13/25 | | | 1,561,000 | |
| | Federal Farm Credit Banks Funding Corp. (SOFR + 0.135%) | |
| | | | | 1,654,000 | | | | 5.535 | (a) | | 04/29/25 | | | 1,654,103 | |
| | | | | 850,000 | | | | 5.535 | (a) | | 06/03/25 | | | 850,000 | |
| | Federal Farm Credit Banks Funding Corp. (SOFR + 0.140%) | |
| | | | | 1,978,000 | | | | 5.542 | (a) | | 11/26/24 | | | 1,977,487 | |
| | | | | 1,781,000 | | | | 5.543 | (a) | | 11/26/24 | | | 1,780,538 | |
| | | | | 2,699,000 | | | | 5.540 | (a) | | 08/22/25 | | | 2,699,000 | |
| | Federal Farm Credit Banks Funding Corp. (SOFR + 0.145%) | |
| | | | | 2,117,000 | | | | 5.545 | (a) | | 04/28/25 | | | 2,117,000 | |
| | | | | 686,000 | | | | 5.545 | (a) | | 06/27/25 | | | 686,000 | |
| | Federal Farm Credit Banks Funding Corp. (SOFR + 0.150%) | |
| | | | | 1,173,000 | | | | 5.550 | (a) | | 01/03/25 | | | 1,173,000 | |
| | | | | 807,000 | | | | 5.550 | (a) | | 02/14/25 | | | 807,000 | |
| | | | | 1,661,000 | | | | 5.550 | (a) | | 05/27/25 | | | 1,661,000 | |
| | | | | 2,003,000 | | | | 5.550 | (a) | | 12/15/25 | | | 2,003,000 | |
| | Federal Farm Credit Banks Funding Corp. (SOFR + 0.155%) | |
| | | | | 2,100,000 | | | | 5.555 | (a) | | 04/05/24 | | | 2,099,989 | |
| | | | | 2,482,000 | | | | 5.555 | (a) | | 02/10/25 | | | 2,482,000 | |
| | | | | 1,989,000 | | | | 5.556 | (a) | | 09/15/25 | | | 1,988,831 | |
| | | | | 3,220,000 | | | | 5.555 | (a) | | 11/28/25 | | | 3,220,000 | |
| | | | | 2,463,000 | | | | 5.555 | (a) | | 12/01/25 | | | 2,463,000 | |
| | | | | | | | | | | | | | | | |
| | | Principal Amount | | | Interest Rate | | | Maturity Date | | Amortized Cost | |
| |
| | U.S. Government Agency Obligations – (continued) | |
| |
| | Federal Farm Credit Banks Funding Corp. (SOFR + 0.160%) | |
| | $ | | | 476,000 | | | | 5.560 | %(a) | | 01/30/25 | | $ | 476,000 | |
| | | | | 768,000 | | | | 5.560 | (a) | | 04/10/25 | | | 768,000 | |
| | | | | 2,306,000 | | | | 5.560 | (a) | | 07/21/25 | | | 2,306,000 | |
| | | | | 3,323,000 | | | | 5.560 | (a) | | 08/04/25 | | | 3,323,000 | |
| | | | | 756,000 | | | | 5.560 | (a) | | 10/27/25 | | | 756,000 | |
| | | | | 1,554,000 | | | | 5.560 | (a) | | 11/03/25 | | | 1,554,000 | |
| | Federal Farm Credit Banks Funding Corp. (SOFR + 0.165%) | |
| | | | | 2,871,000 | | | | 5.565 | (a) | | 06/27/24 | | | 2,870,945 | |
| | | | | 3,442,000 | | | | 5.565 | (a) | | 02/06/25 | | | 3,442,000 | |
| | | | | 5,626,000 | | | | 5.565 | (a) | | 08/14/25 | | | 5,626,000 | |
| | Federal Farm Credit Banks Funding Corp. (SOFR + 0.170%) | |
| | | | | 1,909,000 | | | | 5.570 | (a) | | 01/23/25 | | | 1,909,000 | |
| | Federal Farm Credit Banks Funding Corp. (SOFR + 0.180%) | |
| | | | | 4,300,000 | | | | 5.580 | (a) | | 10/16/24 | | | 4,300,000 | |
| | | | | 2,350,000 | | | | 5.578 | (a) | | 12/19/24 | | | 2,350,187 | |
| | | | | 2,100,000 | | | | 5.580 | (a) | | 12/19/24 | | | 2,100,168 | |
| | | | | 2,500,000 | | | | 5.580 | (a) | | 01/03/25 | | | 2,500,000 | |
| | | | | 5,337,000 | | | | 5.580 | (a) | | 01/17/25 | | | 5,337,000 | |
| | | | | 4,794,000 | | | | 5.580 | (a) | | 03/07/25 | | | 4,794,000 | |
| | | | | 784,000 | | | | 5.577 | (a) | | 04/28/25 | | | 784,282 | |
| | Federal Farm Credit Banks Funding Corp. (SOFR + 0.190%) | |
| | | | | 2,400,000 | | | | 5.590 | (a) | | 11/25/24 | | | 2,400,000 | |
| | | | | 5,300,000 | | | | 5.590 | (a) | | 12/27/24 | | | 5,300,000 | |
| | Federal Farm Credit Banks Funding Corp. (SOFR + 0.195%) | |
| | | | | 1,804,000 | | | | 5.595 | (a) | | 06/02/25 | | | 1,804,000 | |
| | Federal Farm Credit Banks Funding Corp. (SOFR + 0.200%) | |
| | | | | 427,000 | | | | 5.595 | (a) | | 12/05/24 | | | 427,257 | |
| | Federal Home Loan Bank | | | | |
| | | | | 1,490,000 | | | | 4.945 | | | 01/12/24 | | | 1,487,883 | |
| | | | | 3,857,000 | | | | 5.059 | | | 02/06/24 | | | 3,838,659 | |
| | | | | 65,000 | | | | 5.060 | | | 02/06/24 | | | 64,691 | |
| | | | | 4,212,000 | | | | 5.070 | | | 02/06/24 | | | 4,191,971 | |
| | | | | 4,000,000 | | | | 5.092 | | | 02/08/24 | | | 3,979,818 | |
| | | | | 2,035,000 | | | | 5.093 | | | 02/09/24 | | | 2,024,462 | |
| | | | | 18,400,000 | | | | 5.340 | | | 04/23/24 | | | 18,400,000 | |
| | | | | 2,980,000 | | | | 5.407 | | | 04/25/24 | | | 2,930,347 | |
| | | | | 4,324,000 | | | | 5.422 | | | 04/25/24 | | | 4,251,954 | |
| | | | | 20,990,000 | | | | 5.330 | | | 04/26/24 | | | 20,990,000 | |
| | | | | 19,510,000 | | | | 5.340 | | | 04/26/24 | | | 19,510,000 | |
| | | | | 13,150,000 | | | | 5.370 | | | 05/21/24 | | | 13,150,000 | |
| | | | | 6,905,000 | | | | 5.300 | | | 05/22/24 | | | 6,905,000 | |
| | | | | 15,210,000 | | | | 5.360 | | | 06/11/24 | | | 15,210,000 | |
| | | | | 9,505,000 | | | | 5.375 | | | 06/11/24 | | | 9,505,000 | |
| | | | | 6,595,000 | | | | 5.490 | | | 07/15/24 | | | 6,595,000 | |
| | | | | 6,620,000 | | | | 5.520 | | | 07/15/24 | | | 6,620,000 | |
| | | | | 10,305,000 | | | | 5.500 | | | 07/19/24 | | | 10,305,000 | |
| | | | | 9,800,000 | | | | 5.620 | | | 07/30/24 | | | 9,800,000 | |
| | | | | 8,260,000 | | | | 5.550 | | | 08/12/24 | | | 8,260,000 | |
| | | | | 8,220,000 | | | | 5.620 | | | 08/26/24 | | | 8,220,000 | |
| | | | | 1,750,000 | | | | 5.245 | | | 10/25/24 | | | 1,678,656 | |
| | | | | 1,750,000 | | | | 5.243 | | | 10/31/24 | | | 1,677,293 | |
| | Federal Home Loan Bank (SOFR + 0.060%) | |
| | | | | 200,000 | | | | 5.469 | (a) | | 07/01/24 | | | 199,901 | |
| | Federal Home Loan Bank (SOFR + 0.075%) | |
| | | | | 400,000 | | | | 5.480 | (a) | | 03/01/24 | | | 399,954 | |
| | Federal Home Loan Bank (SOFR + 0.095%) | |
| | | | | 9,345,000 | | | | 5.495 | (a) | | 03/13/25 | | | 9,345,000 | |
| | |
| 6 | | The accompanying notes are an integral part of these financial statements. |
GOLDMAN SACHS VARIABLE INSURANCE TRUST GOVERNMENT MONEY MARKET FUND
| | | | | | | | | | | | | | | | |
| | | Principal Amount | | | Interest Rate | | | Maturity Date | | Amortized Cost | |
| |
| | U.S. Government Agency Obligations – (continued) | |
| |
| | Federal Home Loan Bank (SOFR + 0.115%) | |
| | $ | | | 4,910,000 | | | | 5.515 | %(a) | | 11/06/24 | | $ | 4,910,000 | |
| | Federal Home Loan Bank (SOFR + 0.120%) | |
| | | | | 4,755,000 | | | | 5.520 | (a) | | 01/03/25 | | | 4,755,000 | |
| | | | | 9,465,000 | | | | 5.520 | (a) | | 04/17/25 | | | 9,465,000 | |
| | Federal Home Loan Bank (SOFR + 0.125%) | |
| | | | | 4,755,000 | | | | 5.525 | (a) | | 02/03/25 | | | 4,755,000 | |
| | | | | 4,045,000 | | | | 5.525 | (a) | | 03/24/25 | | | 4,045,000 | |
| | | | | 1,895,000 | | | | 5.525 | (a) | | 05/28/25 | | | 1,895,000 | |
| | Federal Home Loan Bank (SOFR + 0.130%) | |
| | | | | 9,145,000 | | | | 5.530 | (a) | | 05/09/25 | | | 9,145,000 | |
| | Federal Home Loan Bank (SOFR + 0.135%) | |
| | | | | 4,755,000 | | | | 5.535 | (a) | | 05/02/25 | | | 4,755,000 | |
| | Federal Home Loan Bank (SOFR + 0.140%) | |
| | | | | 4,735,000 | | | | 5.540 | (a) | | 08/25/25 | | | 4,735,000 | |
| | Federal Home Loan Bank (SOFR + 0.150%) | |
| | | | | 3,600,000 | | | | 5.550 | (a) | | 02/23/24 | | | 3,600,000 | |
| | | | | 5,185,000 | | | | 5.550 | (a) | | 05/28/25 | | | 5,185,000 | |
| | | | | 5,085,000 | | | | 5.550 | (a) | | 06/06/25 | | | 5,085,000 | |
| | | | | 470,000 | | | | 5.550 | (a) | | 09/02/25 | | | 470,000 | |
| | Federal Home Loan Bank (SOFR + 0.155%) | |
| | | | | 4,575,000 | | | | 5.555 | (a) | | 07/08/25 | | | 4,575,000 | |
| | | | | 6,495,000 | | | | 5.555 | (a) | | 08/21/25 | | | 6,495,000 | |
| | | | | 4,325,000 | | | | 5.555 | (a) | | 08/22/25 | | | 4,325,000 | |
| | | | | 3,320,000 | | | | 5.555 | (a) | | 09/26/25 | | | 3,320,000 | |
| | | | | 2,365,000 | | | | 5.555 | (a) | | 11/14/25 | | | 2,365,000 | |
| | | | | 3,850,000 | | | | 5.555 | (a) | | 12/08/25 | | | 3,850,000 | |
| | Federal Home Loan Bank (SOFR + 0.160%) | |
| | | | | 4,000,000 | | | | 5.560 | (a) | | 02/03/25 | | | 4,000,000 | |
| | | | | 7,980,000 | | | | 5.560 | (a) | | 07/10/25 | | | 7,980,000 | |
| | | | | 6,790,000 | | | | 5.560 | (a) | | 07/14/25 | | | 6,790,000 | |
| | | | | 2,920,000 | | | | 5.560 | (a) | | 07/25/25 | | | 2,920,000 | |
| | | | | 1,785,000 | | | | 5.560 | (a) | | 08/08/25 | | | 1,785,000 | |
| | Federal Home Loan Bank (SOFR + 0.165%) | |
| | | | | 4,010,000 | | | | 5.565 | (a) | | 01/17/25 | | | 4,010,000 | |
| | Federal Home Loan Bank (SOFR + 0.190%) | |
| | | | | 14,400,000 | | | | 5.590 | (a) | | 11/22/24 | | | 14,400,000 | |
| | Federal Home Loan Mortgage Corp. | | | | |
| | | | | 7,387,000 | | | | 5.400 | | | 06/11/24 | | | 7,387,000 | |
| | | | | 7,387,000 | | | | 5.380 | | | 06/12/24 | | | 7,387,000 | |
| | Federal National Mortgage Association | |
| | | | | 9,894,000 | | | | 5.600 | | | 07/31/24 | | | 9,894,000 | |
| | U.S. International Development Finance Corp. (3 Mo. U.S. T-Bill + 0.000%) | |
| | | | | 550,000 | | | | 5.520 | (a) | | 09/15/26 | | | 550,000 | |
| | | | | 1,875,000 | | | | 5.520 | (a) | | 03/15/30 | | | 1,875,000 | |
| | | | | 3,131,798 | | | | 5.520 | (a) | | 12/15/33 | | | 3,131,798 | |
| | | |
| | |
| | TOTAL U.S. GOVERNMENT AGENCY OBLIGATIONS | | $ | 468,187,965 | |
| | | |
| | | | | | | | | | | | | | | | |
| | |
| | U.S. Treasury Obligations – 22.5% | | | | |
| | |
| | United States Treasury Bills | | | | |
| | | | | 7,972,200 | | | | 5.392 | | | 01/18/24 | | | 7,952,304 | |
| | | | | 17,667,000 | | | | 5.457 | | | 01/25/24 | | | 17,604,454 | |
| | | | | 334,600 | | | | 5.458 | | | 01/25/24 | | | 333,415 | |
| | | | | 267,500 | | | | 5.459 | | | 01/25/24 | | | 266,553 | |
| | | | | 152,700 | | | | 5.460 | | | 01/25/24 | | | 152,159 | |
| | | | | 731,900 | | | | 5.462 | | | 01/25/24 | | | 729,309 | |
| | | | | 11,053,400 | | | | 5.473 | | | 02/01/24 | | | 11,002,716 | |
| | | | | 2,339,100 | | | | 5.527 | | | 02/13/24 | | | 2,324,139 | |
| | | | | | | | | | | | | | | | |
| | | Principal Amount | | | Interest Rate | | | Maturity Date | | Amortized Cost | |
| |
| | U.S. Treasury Obligations – (continued) | |
| | | | | |
| | $ | | | 2,334,400 | | | | 5.387 | % | | 02/20/24 | | $ | 2,317,314 | |
| | | | | 2,527,700 | | | | 5.506 | | | 02/27/24 | | | 2,506,346 | |
| | | | | 869,100 | | | | 5.508 | | | 02/27/24 | | | 861,758 | |
| | | | | 4,279,800 | | | | 5.580 | | | 04/04/24 | | | 4,220,125 | |
| | | | | 853,500 | | | | 5.421 | | | 04/09/24 | | | 841,201 | |
| | | | | 431,800 | | | | 5.558 | | | 04/11/24 | | | 425,342 | |
| | | | | 1,279,700 | | | | 5.566 | | | 04/11/24 | | | 1,260,560 | |
| | | | | 1,599,600 | | | | 5.571 | | | 04/11/24 | | | 1,575,675 | |
| | | | | 2,849,700 | | | | 5.379 | | | 04/16/24 | | | 2,805,983 | |
| | | | | 620,400 | | | | 5.384 | | | 04/16/24 | | | 610,882 | |
| | | | | 4,317,700 | | | | 5.394 | | | 04/16/24 | | | 4,251,462 | |
| | | | | 1,118,100 | | | | 5.399 | | | 04/16/24 | | | 1,100,947 | |
| | | | | 810,500 | | | | 5.389 | | | 04/23/24 | | | 797,221 | |
| | | | | 731,700 | | | | 5.395 | | | 04/23/24 | | | 719,712 | |
| | | | | 48,670,600 | | | | 5.400 | | | 04/23/24 | | | 47,873,168 | |
| | | | | 24,320,600 | | | | 5.564 | | | 04/25/24 | | | 23,906,897 | |
| | | | | 2,803,600 | | | | 5.379 | (b) | | 04/30/24 | | | 2,755,320 | |
| | | | | 70,991,600 | | | | 5.390 | (b) | | 04/30/24 | | | 69,769,076 | |
| | | | | 7,024,400 | | | | 5.558 | | | 05/02/24 | | | 6,897,344 | |
| | | | | 232,700 | | | | 5.480 | | | 05/09/24 | | | 228,319 | |
| | | | | 4,807,200 | | | | 5.483 | | | 05/09/24 | | | 4,716,694 | |
| | | | | 360,900 | | | | 5.490 | | | 05/09/24 | | | 354,105 | |
| | | | | 3,163,200 | | | | 5.494 | | | 05/09/24 | | | 3,103,646 | |
| | | | | 50,012,600 | | | | 5.354 | | | 06/20/24 | | | 48,793,918 | |
| | | | | 80,000,000 | | | | 5.301 | | | 06/27/24 | | | 77,990,578 | |
| | | | | 4,200,400 | | | | 5.421 | | | 10/31/24 | | | 4,019,071 | |
| | | | | 1,280,600 | | | | 5.432 | | | 10/31/24 | | | 1,225,317 | |
| | | | | 2,019,500 | | | | 5.452 | | | 10/31/24 | | | 1,932,319 | |
| | | | | 12,000,000 | | | | 5.506 | | | 10/31/24 | | | 11,481,967 | |
| | | | | 5,142,000 | | | | 4.890 | | | 11/29/24 | | | 4,908,970 | |
| | | | | 1,163,500 | | | | 5.195 | | | 11/29/24 | | | 1,110,771 | |
| | | | | 45,000,000 | | | | 5.282 | | | 11/29/24 | | | 42,960,651 | |
| | | | | 44,990,000 | | | | 4.899 | | | 12/26/24 | | | 42,922,709 | |
| | United States Treasury Floating Rate Note | |
| | | | | 3,750,400 | | | | 5.174 | | | 11/15/24 | | | 3,658,235 | |
| | | | | 419,500 | | | | 5.182 | | | 11/15/24 | | | 403,763 | |
| | | | | 1,240,500 | | | | 5.184 | | | 11/15/24 | | | 1,210,015 | |
| | | | | 890,400 | | | | 5.225 | | | 11/15/24 | | | 856,999 | |
| | | | | 445,000 | | | | 5.243 | | | 11/15/24 | | | 428,307 | |
| | | | | 1,636,400 | | | | 4.994 | | | 11/30/24 | | | 1,595,072 | |
| | | | | 1,408,200 | | | | 5.135 | | | 12/15/24 | | | 1,354,776 | |
| | | | | 5,142,100 | | | | 4.805 | | | 12/31/24 | | | 5,103,882 | |
| | | | | 939,500 | | | | 5.064 | | | 12/31/24 | | | 932,517 | |
| | | | | 1,644,100 | | | | 5.066 | | | 12/31/24 | | | 1,631,880 | |
| | | | | 1,168,900 | | | | 5.069 | | | 12/31/24 | | | 1,160,212 | |
| | | | | 1,644,100 | | | | 5.070 | | | 12/31/24 | | | 1,631,880 | |
| | | | | 1,168,900 | | | | 5.072 | | | 12/31/24 | | | 1,131,416 | |
| | | | | 1,873,000 | | | | 5.073 | | | 12/31/24 | | | 1,841,733 | |
| | | | | 704,100 | | | | 5.074 | | | 12/31/24 | | | 698,867 | |
| | | | | 701,300 | | | | 5.076 | | | 12/31/24 | | | 678,811 | |
| | | | | 938,800 | | | | 5.083 | | | 12/31/24 | | | 911,000 | |
| | | | | 352,100 | | | | 5.084 | | | 12/31/24 | | | 349,483 | |
| | | | | 2,348,800 | | | | 5.089 | | | 12/31/24 | | | 2,331,343 | |
| | | | | 1,174,400 | | | | 5.109 | | | 12/31/24 | | | 1,165,671 | |
| | | | | 4,675,400 | | | | 5.113 | | | 12/31/24 | | | 4,640,650 | |
| | | | | 3,039,200 | | | | 5.115 | | | 12/31/24 | | | 2,976,296 | |
| | | | | 935,200 | | | | 5.121 | | | 12/31/24 | | | 905,210 | |
| | |
| The accompanying notes are an integral part of these financial statements. | | 7 |
GOLDMAN SACHS VARIABLE INSURANCE TRUST GOVERNMENT MONEY MARKET FUND
|
Schedule of Investments (continued) December 31, 2023 |
| | | | | | | | | | | | | | | | |
| | | Principal Amount | | | Interest Rate | | | Maturity Date | | Amortized Cost | |
| |
| | U.S. Treasury Obligations – (continued) | |
| |
| | United States Treasury Floating Rate Note (3 Mo. U.S. T-Bill MMY + 0.037%) | |
| | $ | | | 4,639,400 | | | | 5.367 | %(a) | | 07/31/24 | | $ | 4,639,751 | |
| | United States Treasury Floating Rate Note (3 Mo. U.S. T-Bill MMY + 0.125%) | |
| | | | | 29,438,000 | | | | 5.461 | (a) | | 07/31/25 | | | 29,412,366 | |
| | United States Treasury Floating Rate Note (3 Mo. U.S. T-Bill MMY + 0.169%) | |
| | | | | 14,809,000 | | | | 5.500 | (a) | | 04/30/25 | | | 14,808,419 | |
| | United States Treasury Floating Rate Note (3 Mo. U.S. T-Bill MMY + 0.170%) | |
| | | | | 849,100 | | | | 5.499 | (a) | | 10/31/25 | | | 847,927 | |
| | | | | 20,970,700 | | | | 5.509 | (a) | | 10/31/25 | | | 20,941,714 | |
| | | |
| | |
| | TOTAL U.S. TREASURY OBLIGATIONS | | $ | 569,858,612 | |
| | | |
| | |
| | TOTAL INVESTMENTS BEFORE REPURCHASE AGREEMENTS | | $ | 1,038,046,577 | |
| | | |
| | | | | | | | | | | | | | | | |
| | |
| | Repurchase Agreements(c) – 60.4% | | | | |
| | | |
| | Bank of America, NA | | | | | | | |
| | | | | 19,000,000 | | | | 5.690 | | | 04/17/24 | | $ | 19,000,000 | |
| | Maturity Value: $19,549,559 | | | | |
| | Settlement Date: 10/17/23 | | | | |
| | Collateralized by Federal National Mortgage Association, 3.500%, due 03/01/45. The market value of the collateral, including accrued interest, was $19,570,000. | |
| | | | | 8,000,000 | | | | 5.660 | | | 04/19/24 | | $ | 8,000,000 | |
| | Maturity Value: $8,228,916 | | | | |
| | Settlement Date: 10/20/23 | | | | |
| | Collateralized by Federal National Mortgage Association, 3.000% to 3.500%, due 03/01/45 to 08/01/46. The aggregate market value of the collateral, including accrued interest, was $8,240,000. | |
| | | |
| | BNP Paribas | | | | | | | |
| | | | | 7,000,000 | | | | 5.250 | (d) | | 01/07/24 | | $ | 7,000,000 | |
| | Maturity Value: $7,185,792 | | | | |
| | Settlement Date: 12/15/23 | | | | |
| | Collateralized by a U.S. Treasury Inflation-Indexed Bond, 1.000%, due 02/15/48, a U.S. Treasury Inflation-Indexed Note, 0.500%, due 04/15/24, U.S. Treasury Interest-Only Stripped Securities, 0.000%, due 11/15/42 to 08/15/46 and a U.S. Treasury Note, 3.625%, due 03/31/30. The aggregate market value of the collateral, including accrued interest, was $7,140,050. | |
| | | | | 10,000,000 | | | | 5.260 | (d) | | 01/07/24 | | $ | 10,000,000 | |
| | Maturity Value: $10,265,922 | | | | |
| | Settlement Date: 12/15/23 | | | | |
| | Collateralized by Federal National Mortgage Association, 3.000%, due 09/01/51, Government National Mortgage Association, 4.000%, due 04/20/52 and U.S. Treasury Notes, 4.125% to 4.375%, due 08/15/26 to 08/31/30. The aggregate market value of the collateral, including accrued interest, was $10,299,818. | |
| | | | | 8,600,000 | | | | 5.490 | (d) | | 01/07/24 | | $ | 8,600,000 | |
| | Maturity Value: $8,840,004 | | | | |
| | Settlement Date: 08/30/23 | | | | |
| | Collateralized by Government National Mortgage Association, 4.000%, due 04/20/52 and a U.S. Treasury Note, 4.125%, due 08/31/30. The aggregate market value of the collateral, including accrued interest, was $8,857,832. | |
| | | |
| | | | | | | | | | | | | | | | |
| | | Principal Amount | | | Interest Rate | | | Maturity Date | | Amortized Cost | |
| |
| | Repurchase Agreements(c) – (continued) | |
| | |
| | Fixed Income Clearing Corp. | | | | |
| | $ | | | 9,000,000 | | | | 5.310 | % | | 01/02/24 | | $ | 9,000,000 | |
| | Maturity Value: $9,005,310 | | | | |
| | Settlement Date: 12/29/23 | | | | |
| | Collateralized by a U.S. Treasury Note, 0.250%, due 07/31/25. The market value of the collateral, including accrued interest, was $9,180,000. | |
| | | | | 35,000,000 | | | | 5.330 | | | 01/02/24 | | $ | 35,000,000 | |
| | Maturity Value: $35,020,728 | | | | |
| | Settlement Date: 12/29/23 | | | | |
| | Collateralized by a U.S. Treasury Bill, 4.500%, due 07/15/26. The market value of the collateral, including accrued interest, was $35,700,000. | |
| | | |
| | Joint Account III | | | | | | | |
| | | | | 1,328,400,000 | | | | 5.350 | | | 01/02/24 | | $ | 1,328,400,000 | |
| | Maturity Value: $1,329,189,686 | | | | |
| | Settlement Date: 12/29/23 | | | | |
| | | |
| | Royal Bank of Canada | | | | | | | |
| | | | | 10,000,000 | | | | 5.240 | (d) | | 01/07/24 | | $ | 10,000,000 | |
| | Maturity Value: $10,263,456 | | | | |
| | Settlement Date: 12/15/23 | | | | |
| | Collateralized by Federal Home Loan Mortgage Corp., 4.000%, due 04/01/52 and Federal National Mortgage Association, 4.000% to 6.000%, due 09/01/52 to 09/01/53. The aggregate market value of the collateral, including accrued interest, was $10,199,999. | |
| | | | | 10,000,000 | | | | 5.270 | (d) | | 01/07/24 | | $ | 10,000,000 | |
| | Maturity Value: $10,260,572 | | | | |
| | Settlement Date: 12/19/23 | | | | |
| | Collateralized by Federal Home Loan Mortgage Corp., 4.000%, due 04/01/52 and Federal National Mortgage Association, 4.500% to 6.000%, due 09/01/48 to 09/01/53. The aggregate market value of the collateral, including accrued interest, was $10,200,000. | |
| | | | | 17,000,000 | | | | 5.500 | (d) | | 01/07/24 | | $ | 17,000,000 | |
| | Maturity Value: $17,472,695 | | | | |
| | Settlement Date: 09/07/23 | | | | |
| | Collateralized by Federal Home Loan Mortgage Corp., 4.000%, due 04/01/52 and Federal National Mortgage Association, 3.500% to 4.000%, due 09/01/45 to 08/01/59. The aggregate market value of the collateral, including accrued interest, was $17,340,002. | |
| | | | | 17,000,000 | | | | 5.500 | (d) | | 01/07/24 | | $ | 17,000,000 | |
| | Maturity Value: $17,470,097 | | | | |
| | Settlement Date: 09/08/23 | | | | |
| | Collateralized by Federal Home Loan Mortgage Corp., 4.000%, due 04/01/52 and Federal National Mortgage Association, 2.500% to 5.500%, due 10/01/45 to 03/01/53. The aggregate market value of the collateral, including accrued interest, was $17,340,001. | |
| | | | | 17,200,000 | | | | 5.500 | (d) | | 01/07/24 | | $ | 17,200,000 | |
| | Maturity Value: $17,680,883 | | | | |
| | Settlement Date: 08/30/23 | | | | |
| | Collateralized by Federal Home Loan Mortgage Corp., 3.000% to 6.500%, due 04/01/33 to 08/01/53 and Federal National Mortgage Association, 2.000% to 6.000%, due 10/01/45 to 09/01/62. The aggregate market value of the collateral, including accrued interest, was $17,543,998. | |
| | |
| 8 | | The accompanying notes are an integral part of these financial statements. |
GOLDMAN SACHS VARIABLE INSURANCE TRUST GOVERNMENT MONEY MARKET FUND
| | | | | | | | | | | | | | | | |
| | | Principal Amount | | | Interest Rate | | | Maturity Date | | Amortized Cost | |
| |
| | Repurchase Agreements(c) – (continued) | |
| | |
| | Royal Bank of Canada – (continued) | | | | |
| | $ | | | 17,200,000 | | | | 5.500 | %(d) | | 01/07/24 | | $ | 17,200,000 | |
| | Maturity Value: $17,678,256 | | | | |
| | Settlement Date: 08/31/23 | | | | |
| | Collateralized by Federal Home Loan Mortgage Corp., 4.000%, due 04/01/52 and Federal National Mortgage Association, 2.500% to 6.000%, due 10/01/45 to 09/01/62. The aggregate market value of the collateral, including accrued interest, was $17,544,001. | |
| | | |
| | Wells Fargo Securities, LLC | | | | |
| | | | | 15,000,000 | | | | 5.360 | | | 01/04/24 | | $ | 15,000,000 | |
| | Maturity Value: $15,015,633 | | | | |
| | Settlement Date: 12/28/23 | | | | |
| | Collateralized by Federal National Mortgage Association, 6.000%, due 10/01/53. The market value of the collateral, including accrued interest, was $15,450,000. | |
| | | | | 5,000,000 | | | | 5.430 | | | 03/22/24 | | $ | 5,000,000 | |
| | Maturity Value: $5,070,138 | | | | |
| | Settlement Date: 12/20/23 | | | | |
| | Collateralized by Federal National Mortgage Association, 6.000%, due 10/01/53. The market value of the collateral, including accrued interest, was $5,150,001. | |
| | | |
| | |
| | TOTAL REPURCHASE AGREEMENTS | | $ | 1,533,400,000 | |
| | | |
| | |
| | TOTAL INVESTMENTS – 101.3% | | $ | 2,571,446,577 | |
| | | |
| | |
| | LIABILITIES IN EXCESS OF OTHER ASSETS – (1.3)% | | | (33,356,666) | |
| | | |
| | | |
| | NET ASSETS – 100.0% | | | | | $ | 2,538,089,911 | |
| | | |
| | |
|
| The percentage shown for each investment category reflects the value of investments in that category as a percentage of net assets. |
| |
| (a) | | Variable or floating rate security. Except for floating rate notes (for which final maturity is disclosed), maturity date disclosed is the next interest reset date. Interest rate disclosed is that which is in effect on December 31, 2023. |
| (b) | | All or a portion represents a forward commitment. |
| (c) | | Unless noted, all repurchase agreements were entered into on December 31, 2023. Additional information on Joint Repurchase Agreement Account III appears in the Additional Investment Information section. |
| (d) | | The instrument is subject to a demand feature. Interest rates represent either the stated coupon rate, annualized yield on date of purchase for discounted securities, or, for floating rate securities, the current reset rate, which is based upon current interest rate indices. |
| |
| | Maturity dates represent either the final legal maturity date on the security, the demand date for puttable securities, the date of the next interest rate reset for variable rate securities, or the prerefunded date for those types of securities. |
| | |
|
| Investment Abbreviations: |
| FEDL01 | | —US Federal Funds Effective Rate |
| | |
|
| Investment Abbreviations: (continued) |
| MMY | | —Money Market Yield |
| Mo. | | —Month |
| Prime | | —Federal Reserve Bank Prime Loan Rate US |
| SOFR | | —Secured Overnight Financing Rate |
| T-Bill | | —Treasury Bill |
| | | |
| | |
| The accompanying notes are an integral part of these financial statements. | | 9 |
GOLDMAN SACHS VARIABLE INSURANCE TRUST GOVERNMENT MONEY MARKET FUND
|
Schedule of Investments (continued) December 31, 2023 |
|
|
ADDITIONAL INVESTMENT INFORMATION |
JOINT REPURCHASE AGREEMENT ACCOUNT III— At December 31, 2023, the Fund had undivided interests in the Joint Repurchase Agreement Account III with a maturity date of January 2, 2024, as follows:
| | | | | | | | | | |
| Fund | | Principal Amount | | Maturity Value | | | Collateral Value
Allocation | |
| |
Government Money Market Fund | | $1,328,400,000 | | | $1,329,189,686 | | | | $1,365,566,224 | |
| |
REPURCHASE AGREEMENTS— At December 31, 2023, the Principal Amounts of the Fund’s interest in the Joint Repurchase Agreement Account III were as follows:
| | | | | | | | |
| Counterparty | | Interest Rate | | | Principal Amount | |
| |
ABN Amro Bank N.V. | | | 5.360% | | | | $241,527,273 | |
| |
Bank of America, N.A. | | | 5.350 | | | | 241,527,273 | |
| |
Bank of Montreal | | | 5.340 | | | | 120,763,636 | |
| |
BofA Securities, Inc. | | | 5.350 | | | | 241,527,273 | |
| |
Credit Agricole Corporate and Investment Bank | | | 5.340 | | | | 96,610,909 | |
| |
Wells Fargo Securities, LLC | | | 5.350 | | | | 386,443,636 | |
| |
Total | | | | | | | $1,328,400,000 | |
| |
At December 31, 2023, the Joint Repurchase Agreement Account III was fully collateralized by:
| | | | | | | | |
| Issuer | | Interest Rate | | | Maturity Dates | |
| |
Federal Home Loan Bank | | | 4.250% | | | | 10/19/2038 | |
| |
Federal Home Loan Mortgage Corp. | | | 3.000% to 6.500 | | | | 08/01/46 to 02/01/53 | |
| |
Federal National Mortgage Association | | | 2.000 to 7.000 | | | | 08/01/33 to 12/01/53 | |
| |
Government National Mortgage Association | | | 2.000 to 7.500 | | | | 12/20/26 to 12/20/53 | |
| |
U.S. Treasury Bills | | | – | | | | 3/12/24 to 3/21/2024 | |
| |
U.S. Treasury Bonds | | | 1.375 | | | | 8/15/2050 | |
| |
U.S. Treasury Notes | | | 0.375 to 4.875 | | | | 05/15/26 to 05/15/32 | |
| |
| | |
| 10 | | The accompanying notes are an integral part of these financial statements. |
GOLDMAN SACHS VARIABLE INSURANCE TRUST GOVERNMENT MONEY MARKET FUND
|
Statement of Assets and Liabilities December 31, 2023 |
| | | | | | | | |
| | | | | Goldman Sachs Government Money Market Fund | | |
| | | |
| | Assets: | | | | | | |
| | Investments based on amortized cost | | $ | 1,038,046,577 | | | |
| | Repurchase agreements based on amortized cost | | | 1,533,400,000 | | | |
| | Cash | | | 20,093,583 | | | |
| | Receivables: | | | | | | |
| | Fund shares sold | | | 11,417,197 | | | |
| | Interest | | | 7,728,545 | | | |
| | Investments sold | | | 2,754,976 | | | |
| | Reimbursement from investment adviser | | | 128,333 | | | |
| | Other assets | | | 43,821 | | | |
| | |
| | Total assets | | | 2,613,613,032 | | | |
| | |
| | | | | | | | |
| |
| | Liabilities: |
| | Payables: | | | | | | |
| | Investments purchased | | | 72,524,396 | | | |
| | Fund shares redeemed | | | 2,185,340 | | | |
| | Management fees | | | 343,439 | | | |
| | Distribution and Service fees and Transfer Agency fees | | | 208,000 | | | |
| | Accrued expenses | | | 261,946 | | | |
| | |
| | Total liabilities | | | 75,523,121 | | | |
| | |
| | | |
| | Net Assets: | | | | | | |
| | Paid-in Capital | | | 2,538,020,167 | | | |
| | Total distributable earnings (loss) | | | 69,744 | | | |
| | |
| | NET ASSETS | | $ | 2,538,089,911 | | | |
| | |
| | | |
| | Net asset value, offering and redemption price per share | | $ | 1.00 | | | |
| | | Net Assets: | | | | | | |
| | | Institutional Shares | | $ | 1,756,706,849 | | | |
| | | Service Shares | | | 781,383,062 | | | |
| | | Total Net Assets | | $ | 2,538,089,911 | | | |
| | | Shares Outstanding $0.001 par value (unlimited number of shares authorized): | | | | | | |
| | | Institutional Shares | | | 1,756,658,468 | | | |
| | | Service Shares | | | 781,361,680 | | | |
| | |
| The accompanying notes are an integral part of these financial statements. | | 11 |
GOLDMAN SACHS VARIABLE INSURANCE TRUST GOVERNMENT MONEY MARKET FUND
|
Statement of Operations For the Fiscal Year Ended December 31, 2023 |
| | | | | | | | |
| | | | | Goldman Sachs Government Money Market Fund | | | |
| | | |
| | Investment income: | | | | | | |
| | Interest income | | $ | 118,175,520 | | | |
| | | | | | | | |
| | | |
| | Expenses: | | | | | | |
| | | |
| | Management fees | | | 3,676,946 | | | |
| | | |
| | Distribution and Service fees—Service Shares | | | 1,889,792 | | | |
| | | |
| | Transfer Agency fees(a) | | | 459,577 | | | |
| | | |
| | Printing and mailing costs | | | 345,411 | | | |
| | | |
| | Shareholder meeting expense | | | 96,216 | | | |
| | | |
| | Professional fees | | | 95,446 | | | |
| | | |
| | Custody, accounting and administrative services | | | 87,756 | | | |
| | | |
| | Trustee fees | | | 24,523 | | | |
| | | |
| | Other | | | 39,513 | | | |
| | |
| | Total expenses | | | 6,715,180 | | | |
| | |
| | Less — expense reductions | | | (500,726 | ) | | |
| | |
| | Net expenses | | | 6,214,454 | | | |
| | |
| | NET INVESTMENT INCOME | | | 111,961,066 | | | |
| | |
| | | | | | | | | |
| | |
| | Net realized gain from investment transactions | | | 316,911 | | | |
| | |
| | NET INCREASE IN NET ASSETS RESULTING FROM OPERATIONS | | $ | 112,277,977 | | | |
| | |
| | (a) | Institutional and Service Shares incurred Transfer Agency fees of $308,405 and $151,172, respectively. |
| | |
| 12 | | The accompanying notes are an integral part of these financial statements. |
GOLDMAN SACHS VARIABLE INSURANCE TRUST GOVERNMENT MONEY MARKET FUND
|
Statements of Changes in Net Assets |
| | | | | | | | | | | | |
| | | | | Goldman Sachs Government Money Market Fund. | | | |
| | | | | For the Fiscal
Year Ended
December 31, 2023 | | | For the Fiscal Year Ended
December 31, 2022 | | | |
| | | | |
| | From operations: | | | | | | | | | | |
| | | | |
| | Net investment income | | $ | 111,961,066 | | | $ | 27,763,477 | | | |
| | | | |
| | Net realized gain (loss) from investment transactions | | | 316,911 | | | | (219,781 | ) | | |
| | |
| | | | |
| | Net increase in net assets resulting from operations | | | 112,277,977 | | | | 27,543,696 | | | |
| | |
| | | | | | | | | | | | |
| | | | |
| | Distributions to shareholders: | | | | | | | | | | |
| | | | |
| | From distributable earnings: | | | | | | | | | | |
| | | | |
| | Institutional Shares | | | (76,620,390 | ) | | | (18,642,223 | ) | | |
| | | | |
| | Service Shares | | | (35,577,989 | ) | | | (8,911,722 | ) | | |
| | |
| | | | |
| | Total distributions to shareholders | | | (112,198,379 | ) | | | (27,553,945 | ) | | |
| | |
| | | | | | | | | | | | |
| | | | |
| | From share transactions (at $1.00 per share): | | | | | | | | | | |
| | | | |
| | Proceeds from sales of shares | | | 2,274,304,705 | | | | 2,307,084,458 | | | |
| | | | |
| | Reinvestment of distributions | | | 111,955,715 | | | | 27,550,932 | | | |
| | | | |
| | Cost of shares redeemed | | | (2,361,010,400 | ) | | | (846,623,441 | ) | | |
| | |
| | | | |
| | Net increase in net assets resulting from share transactions | | | 25,250,020 | | | | 1,488,011,949 | | | |
| | |
| | | | |
| | TOTAL INCREASE | | | 25,329,618 | | | | 1,488,001,700 | | | |
| | |
| | | | | | | | | | | | |
| | | | |
| | Net Assets: | | | | | | | | | | |
| | | | |
| | Beginning of year | | | 2,512,760,293 | | | | 1,024,758,593 | | | |
| | |
| | | | |
| | End of year | | $ | 2,538,089,911 | | | $ | 2,512,760,293 | | | |
| | |
| | |
| The accompanying notes are an integral part of these financial statements. | | 13 |
GOLDMAN SACHS VARIABLE INSURANCE TRUST GOVERNMENT MONEY MARKET FUND
|
Financial Highlights Selected Data for a Share Outstanding Throughout Each Year |
| | | | | | | | | | | | | | | | | | | | | | | | | | | | | |
| | | | | Goldman Sachs Government Money Market Fund | | |
| | | |
| | | | | Institutional Shares | | |
| | | |
| | | | | Year Ended December 31, | | |
| | | | | | | |
| | | | | 2023 | | 2022 | | 2021 | | 2020 | | 2019 | | |
| | | | | | | |
| | Per Share Data | | | | | | | | | | | | | | | | | | | | | | | | | | | |
| | | | | | | |
| | Net asset value, beginning of year | | | $ | 1.00 | | | | $ | 1.00 | | | | $ | 1.00 | | | | $ | 1.00 | | | | $ | 1.00 | | | |
| | |
| | | | | | | |
| | Net investment income(a) | | | | 0.050 | | | | | 0.016 | | | | | – | (b) | | | | 0.004 | | | | | 0.021 | | | |
| | | | | | | |
| | Distributions to shareholders from net investment income(c) | | | | (0.050 | ) | | | | (0.016 | ) | | | | – | (b) | | | | (0.004 | ) | | | | (0.021 | ) | | |
| | |
| | | | | | | |
| | Net asset value, end of year | | | $ | 1.00 | | | | $ | 1.00 | | | | $ | 1.00 | | | | $ | 1.00 | | | | $ | 1.00 | | | |
| | |
| | | | | | | |
| | Total Return(d) | | | | 5.05 | % | | | | 1.58 | % | | | | 0.01 | % | | | | 0.43 | % | | | | 2.11 | % | | |
| | |
| | | | | | | |
| | Net assets, end of year (in 000’s) | | | $ | 1,756,707 | | | | $ | 1,834,293 | | | | $ | 523,751 | | | | $ | 582,216 | | | | $ | 363,783 | | | |
| | | | | | | |
| | Ratio of net expenses to average net assets | | | | 0.19 | % | | | | 0.17 | % | | | | 0.09 | % | | | | 0.18 | % | | | | 0.18 | % | | |
| | | | | | | |
| | Ratio of total expenses to average net assets | | | | 0.21 | % | | | | 0.20 | % | | | | 0.21 | % | | | | 0.20 | % | | | | 0.21 | % | | |
| | | | | | | |
| | Ratio of net investment income to average net assets | | | | 4.96 | % | | | | 1.92 | % | | | | – | %(e) | | | | 0.35 | % | | | | 2.06 | % | | |
| | |
| | (a) | Calculated based on the average shares outstanding methodology. |
| | (b) | Amount is less than $0.0005 per share. |
| | (c) | Distributions may not coincide with the current year net investment income or net realized gains as distributions may be paid from current or prior year earnings. |
| | (d) | Assumes reinvestment of all distributions. Returns do not reflect the deduction of taxes that a shareholder would pay on Fund distributions. |
| | (e) | Amount is less than 0.005%. |
| | | | | | | | | | | | | | | | | | | | | | | | | | | | | |
| | | | | Goldman Sachs Government Money Market Fund | | |
| | | |
| | | | | Service Shares | | |
| | | |
| | | | | Year Ended December 31, | | |
| | | | | | | |
| | | | | 2023 | | 2022 | | 2021 | | 2020 | | 2019 | | |
| | | | | | | |
| | Per Share Data | | | | | | | | | | | | | | | | | | | | | | | | | | | |
| | | | | | | |
| | Net asset value, beginning of year | | | $ | 1.00 | | | | $ | 1.00 | | | | $ | 1.00 | | | | $ | 1.00 | | | | $ | 1.00 | | | |
| | |
| | | | | | | |
| | Net investment income(a) | | | | 0.047 | | | | | 0.014 | | | | | – | (b) | | | | 0.003 | | | | | 0.018 | | | |
| | | | | | | |
| | Distributions to shareholders from net investment income(c) | | | | (0.047 | ) | | | | (0.014 | ) | | | | – | (b) | | | | (0.003 | ) | | | | (0.018 | ) | | |
| | |
| | | | | | | |
| | Net asset value, end of year | | | $ | 1.00 | | | | $ | 1.00 | | | | $ | 1.00 | | | | $ | 1.00 | | | | $ | 1.00 | | | |
| | |
| | | | | | | |
| | Total Return(d) | | | | 4.79 | % | | | | 1.37 | % | | | | 0.01 | % | | | | 0.27 | % | | | | 1.86 | % | | |
| | |
| | | | | | | |
| | Net assets, end of year (in 000’s) | | | $ | 781,383 | | | | $ | 678,468 | | | | $ | 501,008 | | | | $ | 579,416 | | | | $ | 350,112 | | | |
| | | | | | | |
| | Ratio of net expenses to average net assets | | | | 0.44 | % | | | | 0.38 | % | | | | 0.09 | % | | | | 0.33 | % | | | | 0.43 | % | | |
| | | | | | | |
| | Ratio of total expenses to average net assets | | | | 0.46 | % | | | | 0.45 | % | | | | 0.46 | % | | | | 0.45 | % | | | | 0.46 | % | | |
| | | | | | | |
| | Ratio of net investment income to average net assets | | | | 4.70 | % | | | | 1.48 | % | | | | – | %(e) | | | | 0.19 | % | | | | 1.81 | % | | |
| | |
| | (a) | Calculated based on the average shares outstanding methodology. |
| | (b) | Amount is less than $0.0005 per share. |
| | (c) | Distributions may not coincide with the current year net investment income or net realized gains as distributions may be paid from current or prior year earnings. |
| | (d) | Assumes reinvestment of all distributions. Returns do not reflect the deduction of taxes that a shareholder would pay on Fund distributions. |
| | (e) | Amount is less than 0.005%. |
| | |
| 14 | | The accompanying notes are an integral part of these financial statements. |
GOLDMAN SACHS VARIABLE INSURANCE TRUST GOVERNMENT MONEY MARKET FUND
|
Notes to Financial Statements December 31, 2023 |
Goldman Sachs Variable Insurance Trust (the “Trust” or “VIT”) is a Delaware statutory trust registered under the Investment Company Act of 1940, as amended (the “Act”), as an open-end management investment company. The Trust includes the Goldman Sachs Government Money Market Fund (the “Fund”). The Fund is a diversified portfolio under the Act offering two classes of shares — Institutional and Service Shares. Shares of the Trust are offered to separate accounts of participating life insurance companies for the purpose of funding variable annuity contracts and variable life insurance policies.
Goldman Sachs Asset Management, L.P. (“GSAM”), an affiliate of Goldman Sachs & Co. LLC (“Goldman Sachs”), serves as investment adviser to the Fund pursuant to a management agreement (the “Agreement”) with the Trust.
|
|
2. SIGNIFICANT ACCOUNTING POLICIES |
The financial statements have been prepared in accordance with accounting principles generally accepted in the United States
of America (“GAAP”) and require management to make estimates and assumptions that may affect the reported amounts and disclosures. Actual results may differ from those estimates and assumptions. The Fund is an investment company under GAAP and follows the accounting and reporting guidance applicable to investment companies.
A. Investment Valuation — The investment valuation policy of the Fund is to use the amortized-cost method permitted by Rule
2a-7 under the Act for valuing portfolio securities. The amortized-cost method of valuation involves valuing a security at its cost and thereafter applying a constant accretion or amortization to maturity of any discount or premium. Normally, a security’s amortized cost will approximate its market value. Under procedures and tolerances approved by the Board of Trustees (“Trustees”), GSAM evaluates daily the difference between the Fund’s net asset value (“NAV”) per share using the amortized costs of its portfolio securities and the Fund’s NAV per share using market-based values of its portfolio securities. The market-based value of a portfolio security is determined, where readily available, on the basis of market quotations provided by pricing services or securities dealers, or, where accurate market quotations are not readily available, on the basis of the security’s fair value as determined in accordance with the Valuation Procedures. The pricing services may use valuation models or matrix pricing, which may consider (among other things): (i) yield or price with respect to debt securities that are considered comparable in characteristics such as rating, interest rate and maturity date or (ii) quotations from securities dealers to determine current value.
B. Investment Income and Investments — Interest income is accrued daily and adjusted for amortization of premiums and accretion of discounts. Investment transactions are reflected on trade date. Realized gains and losses are calculated using identified cost.
C. Class Allocations and Expenses — Investment income, realized and unrealized gain (loss), if any, and non-class specific expenses of the Fund are allocated daily based upon the proportion of net assets of each class. Class specific expenses, where applicable, are borne by the respective share classes and include Distribution and Service and Transfer Agency fees. Non-class specific expenses directly incurred by the Fund are charged to the Fund, while such expenses incurred by the Trust are allocated across the Fund on a straight-line and/or pro-rata basis depending upon the nature of the expenses.
D. Federal Taxes and Distributions to Shareholders — It is the Fund’s policy to comply with the requirements of the Internal Revenue Code of 1986, as amended (the “Code”), applicable to regulated investment companies (mutual funds) and to distribute each year substantially all of its investment company taxable and tax-exempt income and capital gains to its shareholders. Accordingly, the Fund is not required to make any provisions for the payment of federal income tax. Distributions to shareholders are declared and recorded daily and paid monthly by the Fund and may include short-term capital gains. Long-term capital gain distributions, if any, are declared and paid annually. The Fund may defer or accelerate the timing of the distribution of short-term capital gains (or any portion thereof).
The characterization of distributions to shareholders for financial reporting purposes is determined in accordance with federal income tax rules, which may differ from GAAP. The source of the Fund’s distributions may be shown in the accompanying financial statements as either from distributable earnings or capital. Certain components of the Fund’s net assets on the Statement of Assets and Liabilities reflect permanent GAAP/tax differences based on the appropriate tax character.
GOLDMAN SACHS VARIABLE INSURANCE TRUST GOVERNMENT MONEY MARKET FUND
|
Notes to Financial Statements (continued) December 31, 2023 |
|
|
2. SIGNIFICANT ACCOUNTING POLICIES (continued) |
The tax character of distributions paid during the fiscal year ended December 31, 2023 was as follows:
| | |
| | | Goldman Sachs Government Money Market Fund |
| |
Distributions paid from: | | |
| |
| Ordinary Income | | $ 112,198,379 |
The tax character of distributions paid during the fiscal year ended December 31, 2022 was as follows:
| | |
| | | Goldman Sachs Government Money Market Fund |
| |
Distributions paid from: | | |
| |
| Ordinary Income | | $ 27,553,945 |
As of December 31, 2023, the components of accumulated earnings (losses) on a tax basis were as follows:
| | | | |
| | |
| Goldman Sachs
Government Money Market Fund |
|
| |
| Undistributed ordinary income — net | | | $ 59,089 | |
| |
| Undistributed long-term capital gains | | | 10,732 | |
| |
| Total undistributed earnings | | | $ 69,821 | |
| |
| Unrealized gains (losses) — net | | | (77) | |
| |
| Total accumulated earnings (losses) — net | | | $ 69,744 | |
For the period ended December 31, 2023, the Goldman Sachs Government Money Market Fund utilized $210,225 in Capital Loss Carryforwards.
The amortized cost for the Fund stated in the accompanying Statement of Assets and Liabilities also represents aggregate cost for U.S. federal income tax purposes.
GSAM has reviewed the Fund’s tax positions for all open tax years (the current and prior three years, as applicable) and has concluded that no provision for income tax is required in the Fund’s financial statements. Such open tax years remain subject to examination and adjustment by tax authorities.
E. Forward Commitments — A forward commitment involves entering into a contract to purchase or sell securities, typically on an extended settlement basis, for a fixed price at a future date. The purchase of securities on a forward commitment basis involves a risk of loss if the value of the security to be purchased declines before the settlement date. Conversely, the sale of securities on a forward commitment basis involves the risk that the value of the securities sold may increase before the settlement date. Although the Fund will generally purchase securities on a forward commitment basis with the intention of acquiring the securities for its portfolio, the Fund may dispose of forward commitments prior to settlement which may result in a realized gain or loss.
F. Repurchase Agreements — Repurchase agreements involve the purchase of securities subject to the seller’s agreement to repurchase the securities at a mutually agreed upon date and price, under the terms of a Master Repurchase Agreement (“MRA”). During the term of a repurchase agreement, the value of the underlying securities held as collateral on behalf of the Fund, including accrued interest, is required to exceed the value of the repurchase agreement, including accrued interest. The gross value of repurchase agreements is included in the Statement of Assets and Liabilities for financial reporting purposes. The underlying securities for all repurchase agreements are held at the Fund’s custodian or designated sub-custodians under tri-party repurchase agreements.
GOLDMAN SACHS VARIABLE INSURANCE TRUST GOVERNMENT MONEY MARKET FUND
|
|
2. SIGNIFICANT ACCOUNTING POLICIES (continued) |
An MRA governs transactions between the Fund and select counterparties. An MRA contains provisions for, among other things, initiation of the transaction, income payments, events of default, and maintenance of securities for repurchase agreements. An MRA also permits offsetting with collateral to create one single net payment in the event of default or similar events, including the bankruptcy or insolvency of a counterparty.
If the seller defaults, the Fund could suffer a loss to the extent that the proceeds from the sale of the underlying securities and other collateral held by the Fund are less than the repurchase price and the Fund’s costs associated with delay and enforcement of the repurchase agreement. In addition, in the event of default or insolvency of the seller, a court could determine that the Fund’s interest in the collateral is not enforceable, resulting in additional losses to the Fund.
Pursuant to exemptive relief granted by the Securities and Exchange Commission (“SEC”) and terms and conditions contained therein, the Fund, together with other funds of the Trust and registered investment companies having management agreements with GSAM or its affiliates, may transfer uninvested cash into joint accounts, the daily aggregate balance of which is invested in one or more repurchase agreements. Under these joint accounts, the Fund maintains pro-rata credit exposure to the underlying repurchase agreements’ counterparties. With the exception of certain transaction fees, the Fund is not subject to any expenses in relation to these investments.
|
|
3. INVESTMENTS AND FAIR VALUE MEASUREMENTS |
U.S. GAAP defines the fair value of a financial instrument as the amount that would be received to sell an asset or paid to transfer a liability in an orderly transaction between market participants at the measurement date (i.e., the exit price); the Fund’s policy is to use the market approach. GAAP establishes a fair value hierarchy that prioritizes the inputs to valuation techniques used to measure fair value. The hierarchy gives the highest priority to unadjusted quoted prices in active markets for identical assets or liabilities (Level 1 measurements) and the lowest priority to unobservable inputs (Level 3 measurements). The level in the fair value hierarchy within which the fair value measurement in its entirety falls shall be determined based on the lowest level input that is significant to the fair value measurement in its entirety. The levels used for classifying investments are not necessarily an indication of the risk associated with investing in these investments. The three levels of the fair value hierarchy are described below:
Level 1 — Unadjusted quoted prices in active markets that are accessible at the measurement date for identical, unrestricted assets or liabilities;
Level 2 — Quoted prices in markets that are not active or financial instruments for which significant inputs are observable (including, but not limited to, quoted prices for similar investments, interest rates, foreign exchange rates, volatility and credit spreads), either directly or indirectly;
Level 3 — Prices or valuations that require significant unobservable inputs (including GSAM’s assumptions in determining fair value measurement).
The Trustees have approved Valuation Procedures that govern the valuation of the portfolio investments held by the Fund, including investments for which market quotations are not readily available. With respect to the Fund’s investments that do not have readily available market quotations, the Trustees have designated the Adviser as the valuation designee to perform fair valuations pursuant to Rule 2a-5 under the Investment Company Act of 1940 (the “Valuation Designee”). GSAM has day-to-day responsibility for implementing and maintaining internal controls and procedures related to the valuation (including both the amortized cost and market-based methods of valuation) of the Fund’s investments. To assess the continuing appropriateness of pricing sources and methodologies related to the market-based method of valuation, GSAM regularly performs price verification procedures and issues challenges as necessary to third party pricing vendors or brokers, and any differences are reviewed in accordance with the Valuation Procedures.
As of December 31, 2023, all investments, including repurchase agreements, are classified as Level 2 of the fair value hierarchy. Please refer to the Schedule of Investments for further detail.
GOLDMAN SACHS VARIABLE INSURANCE TRUST GOVERNMENT MONEY MARKET FUND
|
Notes to Financial Statements (continued) December 31, 2023 |
|
|
4. AGREEMENTS AND AFFILIATED TRANSACTIONS |
A. Management Agreement — Under the Agreement, GSAM manages the Fund, subject to the general supervision of the Trustees.
As compensation for the services rendered pursuant to the Agreement, the assumption of the expenses related thereto and administration of the Fund’s business affairs, including providing facilities, GSAM is entitled to a management fee, accrued daily and paid monthly, equal to an annual percentage rate of the Fund’s average daily net assets.
B. Distribution and/or Service (12b-1) Plans — The Trust, on behalf of the Service Shares of the Fund, has adopted a Distribution and Service Plan subject to Rule 12b-1 under the Act. Under the Distribution and Service Plan, Goldman Sachs, which serves as distributor (the “Distributor”), is entitled to a fee accrued daily and paid monthly, for distribution services and personal and account maintenance services, which may then be paid by Goldman Sachs to authorized dealers, equal to, on an annual basis, 0.25% of the Fund’s average daily net assets attributable to Service Shares.
C. Transfer Agency Agreement — Goldman Sachs also serves as the transfer agent of the Fund for a fee pursuant to a Transfer Agency Agreement. The fee charged for such transfer agency services is accrued daily and paid monthly at an annual rate of 0.02%of the Fund’s average daily net assets of Institutional Shares and Service Shares.
D. Other Expense Agreements — GSAM has agreed to limit certain “Other Expenses” of the Fund (excluding acquired fund fees and expenses, transfer agency fees and expenses, taxes, interest, brokerage fees, expenses of shareholder meetings, litigation and indemnification, and extraordinary expenses) to the extent that such expenses exceed, on an annual basis, 0.004% of the average daily net assets of the Fund. Such Other Expense reimbursements, if any, are accrued daily and paid monthly. In addition, the Fund is not obligated to reimburse GSAM for prior fiscal year expense reimbursements, if any. This Other Expense limitation will remain in place through at least April 28, 2024, and prior to such date GSAM may not terminate the arrangement without the approval of the Trustees. In addition, the Fund has entered into certain offset arrangements with the custodian and the transfer agent, which may result in a reduction of the Fund’s expenses and are received irrespective of the application of the “Other Expense” limitation described above. For the year ended December 31, 2023, these expense reductions, including any fee waiver and Other Expense reimbursements, were as follows:
| | | | |
| Fund | | Other Expense
Reimbursements | | Total Expense
Reductions |
| | |
| Goldman Sachs Government Money Market Fund | | $ 500,726 | | $ 500,726 |
E. Contractual and Net Fund Expenses — The investment adviser may contractually agree to waive or reimburse certain fees and expenses until a specified date. The investment adviser or transfer agent may also voluntarily waive certain fees and expenses, and such voluntary waivers may be discontinued or modified at any time without notice. The following table outlines such fees (net of waivers) and Other Expenses (net of reimbursements and custodian and transfer agency fee credit reductions) in order to determine the Fund’s net annualized expenses for the fiscal year. The Fund is not obligated to reimburse GSAM or Goldman Sachs for prior fiscal year fee waivers and/or expense reimbursements, if any.
| | | | | | | | | | | | | | | | |
| | | Institutional Shares | | | Service Shares | |
| | | | |
| Fee/Expense Type | | Contractual
rate, if any | | | Ratio of net expenses to
average net assets for
the fiscal year ended
December 31, 2023 | | | Contractual
rate, if any | | | Ratio of net expenses to
average net assets for
the fiscal year ended
December 31, 2023 | |
| | | | | | | | | | | | | |
Management Fee | | | 0.16 | % | | | 0.16 | % | | | 0.16 | % | | | 0.16% | |
| | | | |
Distribution and Service Fees | | | N/A | | | | N/A | | | | 0.25 | | | | 0.25 | |
| | | | |
Transfer Agency Fees | | | 0.02 | | | | 0.02 | | | | 0.02 | | | | 0.02 | |
| | | | |
Other Expenses | | | — | | | | 0.03 | | | | — | | | | 0.03 | |
|
| |
Total Annual Fund Operating Expenses | | | | | | | 0.21 | | | | | | | | 0.46 | |
| |
| | | | |
Other Reimbursements | | | | | | | (0.02 | ) | | | | | | | (0.02) | |
|
| |
| | | | |
Net Expenses | | | | | | | 0.19 | % | | | | | | | 0.44% | |
| |
N/A — Fees not applicable to respective share class.
F. Other Transactions with Affiliates — The Fund may purchase securities from, or sell securities to, an affiliated fund provided the affiliation is solely due to having a common investment adviser, common officers, or common Trustees.
GOLDMAN SACHS VARIABLE INSURANCE TRUST GOVERNMENT MONEY MARKET FUND
|
|
4. AGREEMENTS AND AFFILIATED TRANSACTIONS (continued) |
For the fiscal year ended December 31, 2023, the purchase and sale transactions and related net realized gain (loss) for the Fund with affiliated funds in compliance with Rule 17a-7 under the Act were as follows:
| | | | | | | | | | | | |
| Fund | | Purchases | | | Sales | | | Net Realized Gain/(Loss) | |
|
| |
Goldman Sachs Government Money Market Fund | | $ | — | | | $ | 699,821 | | | $ | (179) | |
| |
G. Line of Credit Facility — As of December 31, 2023, the Fund participated in a $1,110,000,000 committed, unsecured revolving line of credit facility (the “facility”) together with other funds of the Trust and certain registered investment companies having management agreements with GSAM or its affiliates. This facility is to be used for temporary emergency purposes, or to allow for an orderly liquidation of securities to meet redemption requests. The interest rate on borrowings is based on the federal funds rate. The facility also requires a fee to be paid by the Fund based on the amount of the commitment that has not been utilized. For the fiscal year ended December 31, 2023, the Fund did not have any borrowings under the facility. Prior to April 19, 2023, the facility was $1,250,000,000.
The Fund’s risks include, but are not limited to, the following:
Interest Rate Risk — When interest rates increase, a Fund’s yield will tend to be lower than prevailing market rates, and the market value of its investments will generally decline. A wide variety of market factors can cause interest rates to rise, including central bank monetary policy, rising inflation and changes in general economic conditions. Changing interest rates may have unpredictable effects on the markets, may result in heightened market volatility and may detract from Fund performance. In addition, changes in monetary policy may exacerbate the risks associated with changing interest rates. A low interest rate environment poses additional risks to a Fund, because low yields on the Fund’s portfolio holdings may have an adverse impact on the Fund’s ability to provide a positive yield to its shareholders, pay expenses out current income, or minimize the volatility of the Fund’s NAV per share and/or achieve its investment objective. Fluctuations in interest rates may also affect the liquidity of the Fund investments.
Large Shareholder Transactions Risk — The Fund may experience adverse effects when certain large shareholders, such as other funds, participating insurance companies, accounts and Goldman Sachs affiliates, purchase or redeem large amounts of shares of the Fund. Such large shareholder redemptions, which may occur rapidly or unexpectedly, may cause the Fund to sell portfolio securities at times when it would not otherwise do so, which may negatively impact the Fund’s NAV and liquidity. Similarly, large Fund share purchases may adversely affect the Fund’s performance to the extent that the Fund is delayed in investing new cash or otherwise maintains a larger cash position than it ordinarily would. These transactions may also increase transaction costs. In addition, a large redemption could result in the Fund’s current expenses being allocated over a smaller asset base, leading to an increase in the Fund’s expense ratio.
Market and Credit Risks — In the normal course of business, the Fund trades financial instruments and enters into financial transactions where risk of potential loss exists due to changes in the market (market risk). The value of the securities in which the Fund invests may go up or down in response to the prospects of individual companies, particular sectors or governments and/ or general economic conditions throughout the world due to increasingly interconnected global economies and financial markets. Events such as war, military conflict, acts of terrorism, social unrest, natural disasters, recessions, inflation, rapid interest rate changes, supply chain disruptions, sanctions, the spread of infectious illness or other public health threats could also significantly impact the Fund and its investments. Additionally, the Fund may also be exposed to credit risk in the event that an issuer or guarantor fails to perform or that an institution or entity with which the Fund has unsettled or open transactions defaults.
Under the Trust’s organizational documents, its Trustees, officers, employees and agents are indemnified, to the extent permitted by the Act and state law, against certain liabilities that may arise out of performance of their duties to the Fund. Additionally, in the course of business, the Fund enters into contracts that contain a variety of indemnification clauses. The Fund’s maximum exposure under these arrangements is unknown, as this would involve future claims that may be made against the Fund that have not yet occurred. However, GSAM believes the risk of loss under these arrangements to be remote.
GOLDMAN SACHS VARIABLE INSURANCE TRUST GOVERNMENT MONEY MARKET FUND
|
Notes to Financial Statements (continued) December 31, 2023 |
Exemptive Orders — Pursuant to SEC exemptive orders, the Funds may enter into certain principal transactions, including repurchase agreements, with Goldman Sachs.
Pursuant to an effort to consolidate the membership of the Board of Trustees of the Trust (the “Board”) with the Board of Trustees of each of Goldman Sachs ETF Trust, Goldman Sachs ETF Trust II, Goldman Sachs Real Estate Diversified Income Fund, Goldman Sachs Trust II and Goldman Sachs Trust, in July 2023, the Board voted to nominate Cheryl K. Beebe, John G. Chou, Eileen H. Dowling, Lawrence Hughes, John F. Killian, Steven D. Krichmar, Michael Latham, Lawrence W. Stranghoener and Paul C. Wirth (the “Nominees”) for election as Trustees of the Trust. Messrs. Chou and Wirth and Ms. Dowling were serving as Trustees of the Trust at the time of their nominations. At a virtual special joint meeting of shareholders held on November 16, 2023, each of the Nominees (except Messrs. Chou and Wirth and Ms. Dowling) was elected to serve as Trustees alongside the then current Trustees of the Trust, effective January 1, 2024. Each of Messrs. Chou and Wirth and Ms. Dowling was also elected at the meeting and continue to serve as Trustees of the Trust.
Subsequent events after the Statement of Assets and Liabilities date have been evaluated and GSAM has concluded that there is no impact requiring adjustment or disclosure in the financial statements.
|
|
9. SUMMARY OF SHARE TRANSACTIONS |
Share activity is as follows:
| | | | | | | | |
| | | Goldman Sachs Government Money Market Fund | |
| | |
| | | For the Fiscal Year Ended
December 31, 2023 | | | For the Fiscal Year Ended
December 31, 2022 | |
| |
| | | | |
| | |
| | | Shares | | | Shares | |
| |
| | | | |
| | |
Institutional Shares* | | | | | | | | |
| | |
Shares sold | | | 1,959,289,446 | | | | 1,919,889,511 | |
| | |
Reinvestment of distributions | | | 76,375,080 | | | | 18,639,420 | |
| | |
Shares redeemed | | | (2,113,305,922 | ) | | | (627,979,771) | |
|
| |
| | |
| | | (77,641,396 | ) | | | 1,310,549,160 | |
|
| |
| | |
Service Shares* | | | | | | | | |
| | |
Shares sold | | | 315,015,259 | | | | 387,194,947 | |
| | |
Reinvestment of distributions | | | 35,580,635 | | | | 8,911,512 | |
| | |
Shares redeemed | | | (247,704,478 | ) | | | (218,643,670) | |
|
| |
| | |
| | | 102,891,416 | | | | 177,462,789 | |
|
| |
| | |
NET INCREASE IN SHARES | | | 25,250,020 | | | | 1,488,011,949 | |
|
| |
| | * | Valued at $1.00 per share. |
Report of Independent Registered Public Accounting Firm
To the Board of Trustees of Goldman Sachs Variable Insurance Trust and Shareholders of Goldman Sachs Government Money Market Fund
Opinion on the Financial Statements
We have audited the accompanying statement of assets and liabilities, including the schedule of investments, of Goldman Sachs Government Money Market Fund (one of the funds constituting Goldman Sachs Variable Insurance Trust, referred to hereafter as the “Fund”) as of December 31, 2023, the related statement of operations for the year ended December 31, 2023, the statements of changes in net assets for each of the two years in the period ended December 31, 2023, including the related notes, and the financial highlights for each of the five years in the period ended December 31, 2023 (collectively referred to as the “financial statements”). In our opinion, the financial statements present fairly, in all material respects, the financial position of the Fund as of December 31, 2023, the results of its operations for the year then ended, the changes in its net assets for each of the two years in the period ended December 31, 2023 and the financial highlights for each of the five years in the period ended December 31, 2023 in conformity with accounting principles generally accepted in the United States of America.
Basis for Opinion
These financial statements are the responsibility of the Fund’s management. Our responsibility is to express an opinion on the Fund’s financial statements based on our audits. We are a public accounting firm registered with the Public Company Accounting Oversight Board (United States) (PCAOB) and are required to be independent with respect to the Fund in accordance with the U.S. federal securities laws and the applicable rules and regulations of the Securities and Exchange Commission and the PCAOB.
We conducted our audits of these financial statements in accordance with the standards of the PCAOB. Those standards require that we plan and perform the audit to obtain reasonable assurance about whether the financial statements are free of material misstatement, whether due to error or fraud.
Our audits included performing procedures to assess the risks of material misstatement of the financial statements, whether due to error or fraud, and performing procedures that respond to those risks. Such procedures included examining, on a test basis, evidence regarding the amounts and disclosures in the financial statements. Our audits also included evaluating the accounting principles used and significant estimates made by management, as well as evaluating the overall presentation of the financial statements. Our procedures included confirmation of securities owned as of December 31, 2023 by correspondence with the custodian and brokers; when replies were not received from brokers, we performed other auditing procedures. We believe that our audits provide a reasonable basis for our opinion.
/s/ PricewaterhouseCoopers LLP
Boston, Massachusetts
February 15, 2024
We have served as the auditor of one or more investment companies in the Goldman Sachs fund complex since 2000.
GOLDMAN SACHS VARIABLE INSURANCE TRUST GOVERNMENT MONEY MARKET FUND
Fund Expenses — Six Month Period Ended December 31, 2023 (Unaudited)
As a shareholder of Institutional Shares and Service Shares of the Fund, you incur ongoing costs, including management fees; distribution and service (12b-1) fees (with respect to Service Shares); and other Fund expenses. This example is intended to help you understand your ongoing costs (in dollars) of investing in the Fund and to compare these costs with the ongoing costs of investing in other mutual funds.
The example is based on an investment of $1,000 invested at the beginning of the period and held for the entire period from July 1, 2023, through December 31, 2023, which represents a period of 184 days of a 365 day year.
Actual Expenses — The first line in the table below provides information about actual account values and actual expenses. You may use the information in this line, together with the amount you invested, to estimate the expenses that you paid over the period. Simply divide your account value by $1,000 (for example, an $8,600 account value divided by $1,000=8.6), then multiply the result by the number in the first line under the heading entitled “Expenses Paid” to estimate the expenses you paid on your account during this period.
Hypothetical Example for Comparison Purposes — The second line in the table below provides information about hypothetical account values and hypothetical expenses based on the Fund’s actual net expense ratio and an assumed rate of return of 5% per year before expenses, which is not the Fund’s actual return. The hypothetical account values and expenses may not be used to estimate the actual ending account balance or expenses you paid for the period. You may use this information to compare the ongoing costs of investing in the Fund and other funds. To do so, compare this 5% hypothetical example with the 5% hypothetical examples that appear in the shareholder reports of the other funds.
Please note that the expenses shown in the table are meant to highlight your ongoing costs only and do not reflect any transactional costs, such as sales charges, redemption fees, or exchange fees. Therefore, the second line of the table is useful in comparing ongoing costs only and will not help you determine the relative total costs of owning different funds. In addition, if these transactional costs were included, your costs would have been higher.
| | | | | | | | | | | | |
| | | Goldman Sachs Variable Insurance Trust Government Money
Market Fund | |
| Share Class | | Beginning Account Value 7/1/23 | | | Ending Account Value 12/31/23 | | | Expenses Paid for the 6 months ended 12/31/23* | |
| Institutional Shares | | | | | | | | | | | | |
Actual | | | $1,000.00 | | | | $1,026.50 | | | | $0.97 | |
Hypothetical 5% return | | | 1,000.00 | | | | 1,024.25+ | | | | 0.97 | |
| Service Shares | | | | | | | | | | | | |
Actual | | | 1,000.00 | | | | 1,025.30 | | | | 2.25 | |
Hypothetical 5% return | | | 1,000.00 | | | | 1,022.99+ | | | | 2.24 | |
| * | Expenses are calculated using each Fund’s annualized net expense ratio for each class, which represents the ongoing expenses as a percentage of net assets for the six months ended December 31, 2023. Expenses are calculated by multiplying the annualized net expense ratio by the average account value for the period; then multiplying the result by the number of days in the most recent fiscal half year; and then dividing that result by the number of days in the fiscal year. |
| + | Hypothetical expenses are based on each Fund’s actual annualized net expense ratios and an assumed rate of return of 5% per year before expenses. |
| | The annualized net expense ratios for the period were as follows: |
| | | | | | |
| Fund | | Institutional
Shares | | Service Shares | | |
Goldman Sachs Variable Insurance Trust Government Money Market Fund | | 0.19% | | 0.44% | | |
22
GOLDMAN SACHS VARIABLE INSURANCE TRUST FUNDS
Voting Results of Special Meeting of Shareholders (Unaudited)
A Special Meeting of Shareholders (the “Meeting”) of the Goldman Sachs Variable Insurance Trust (the “Trust”) was held on November 16, 2023 to consider and elect nominees to the Trust’s Board of Trustees. At the Meeting, Cheryl K. Beebe, Lawrence Hughes, John F. Killian, Steven D. Krichmar, Michael Latham and Lawrence W. Stranghoener were elected to the Trust’s Board of Trustees. In addition, at the Meeting, John G. Chou, Eileen H. Dowling and Paul C. Wirth, each of whom was previously appointed to the Trust’s Board of Trustees rather than elected by shareholders, were elected. In electing the nominees, the Trust’s shareholders voted as follows:
| | | | | | |
Proposal Election of Trustees | | For | | Withheld | | |
| | | |
Cheryl K. Beebe | | 932,148,752 | | 26,776,872 | | |
| | | |
John G. Chou | | 930,378,362 | | 28,547,262 | | |
| | | |
Eileen H. Dowling | | 932,188,448 | | 26,737,175 | | |
| | | |
Lawrence Hughes | | 932,346,926 | | 26,578,698 | | |
| | | |
John F. Killian | | 931,754,574 | | 27,171,049 | | |
| | | |
Steven D. Krichmar | | 932,002,203 | | 26,923,420 | | |
| | | |
Michael Latham | | 931,832,553 | | 27,093,071 | | |
| | | |
Lawrence W. Stranghoener | | 931,376,144 | | 27,549,480 | | |
| | | |
Paul C. Wirth | | 932,041,013 | | 26,884,610 | | |
| | | | | | |
GOLDMAN SACHS VARIABLE INSURANCE TRUST GOVERNMENT MONEY MARKET FUND
Trustees and Officers (Unaudited)
Independent Trustees
| | | | | | | | | | |
| | | | | |
Name, Address and Age1 | | Position(s) Held with the Trust | | Term of Office and Length of Time Served2 | | Principal Occupations During Past 5 Years | | Number of Portfolios in Fund Complex Overseen by Trustee3 | | Other Directorships Held by Trustee4 |
| | | | | |
Gregory G. Weaver Age: 72 | | Chair of the Board of Trustees | | Since 2023 (Trustee since 2015) | | Mr. Weaver is retired. He is Director, Verizon Communications Inc. (2015-Present); and was formerly Chairman and Chief Executive Officer, Deloitte & Touche LLP (a professional services firm) (2001-2005 and 2012-2014); and Member of the Board of Directors, Deloitte & Touche LLP (2006-2012). Chair of the Board of Trustees — Goldman Sachs Variable Insurance Trust and Goldman Sachs Trust. | | 102 | | Verizon Communications Inc. |
| | | | | |
Dwight L. Bush Age: 66 | | Trustee | | Since 2020 | | The Honorable Dwight Bush is President and CEO of D.L. Bush & Associates (a financial advisory and private investment firm) (2002-2014 and 2017-Present); Director of MoneyLion, Inc. (an operator of a data-driven, digital financial platform) (2021-Present); and was formerly U.S. Ambassador to the Kingdom of Morocco (2014-2017) and a Member of the Board of Directors of Santander Bank, N.A. (2018-2019). Previously, he served as an Advisory Board Member of Goldman Sachs Trust and Goldman Sachs Variable Insurance Trust (October 2019-January 2020). Trustee — Goldman Sachs Variable Insurance Trust and Goldman Sachs Trust. | | 102 | | MoneyLion, Inc. (an operator of a datadriven, digital financial platform) |
| | | | | |
Kathryn A. Cassidy Age: 69 | | Trustee | | Since 2015 | | Ms. Cassidy is retired. She is Director, Vertical Aerospace Ltd. (an aerospace and technology company) (2021-Present). Formerly, Ms. Cassidy was Advisor to the Chairman (May 2014- December 2014); and Senior Vice President and Treasurer (2008-2014), General Electric Company & General Electric Capital Corporation (technology and financial services companies). Trustee — Goldman Sachs Variable Insurance Trust and Goldman Sachs Trust. | | 102 | | Vertical Aerospace Ltd. (an aerospace and technology company) |
| | | | | |
John G. Chou Age: 67 | | Trustee | | Since 2022 | | Mr. Chou is retired. Formerly, he was Executive Vice President and Special Advisor to the Chairman and CEO (2021-2022); Executive Vice President and Chief Legal Officer (2019-2021); Executive Vice President and Chief Legal & Business Officer (2017-2019); and Executive Vice President and General Counsel (2011-2017) of Cencora, Inc. (a pharmaceutical and healthcare company. Trustee — Goldman Sachs Variable Insurance Trust and Goldman Sachs Trust. | | 102 | | None |
| | | | | |
Joaquin Delgado Age: 63 | | Trustee | | Since 2020 | | Dr. Delgado is retired. He is Director, Stepan Company (a specialty chemical manufacturer) (2011-Present); and was formerly Director, Hexion Inc. (a specialty chemical manufacturer) (2019-2022); Executive Vice President, Consumer Business Group of 3M Company (July 2016-July 2019); and Executive Vice President, Health Care Business Group of 3M Company (October 2012-July 2016). Previously, Dr. Delgado served as an Advisory Board Member of Goldman Sachs Trust and Goldman Sachs Variable Insurance Trust (October 2019-January 2020). Trustee — Goldman Sachs Variable Insurance Trust and Goldman Sachs Trust. | | 102 | | Stepan Company (a specialty chemical manufacturer) |
| | | | | | | | | | |
GOLDMAN SACHS VARIABLE INSURANCE TRUST GOVERNMENT MONEY MARKET FUND
Trustees and Officers (Unaudited) (continued)
Independent Trustees
| | | | | | | | | | |
| | | | | |
Name, Address and Age1 | | Position(s) Held with the Trust | | Term of Office and Length of Time Served2 | | Principal Occupations During Past 5 Years | | Number of Portfolios in Fund Complex Overseen by Trustee3 | | Other Directorships Held by Trustee4 |
| | | | | |
Eileen H. Dowling Age: 61 | | Trustee | | Since 2021 | | Ms. Dowling is retired. Formerly, she was Senior Advisor (April 2021-September 2021); and Managing Director (2013-2021), BlackRock, Inc. (a financial services firm). As Managing Director, she held senior management positions, including Global Head of Global Consultant Relations (2017-2021), Multinational Corporations (2019-2021), the Institutional Product Group (2015-2019) and Institutional Marketing (2013-2016). Ms. Dowling was a member of the Global Operating Committee and Product Executive Committee of BlackRock. Trustee — Goldman Sachs Variable Insurance Trust and Goldman Sachs Trust. | | 102 | | None |
| | | | | |
Paul C. Wirth Age: 66 | | Trustee | | Since 2022 | | Mr. Wirth is retired. He is Executive Advisor, My Next Season LLC (a career transition advisory firm) (2023 – Present) Formerly, he was Deputy Chief Financial Officer and Principal Accounting Officer (2011-2020); Finance Director and Principal Accounting Officer (2010-2011); and Managing Director, Global Controller, and Chief Accounting Officer (2005-2010) of Morgan Stanley. Trustee — Goldman Sachs Variable Insurance Trust and Goldman Sachs Trust. | | 102 | | None |
| | | | | |
| | | | | | | | | | |
GOLDMAN SACHS VARIABLE INSURANCE TRUST GOVERNMENT MONEY MARKET FUND
Trustees and Officers (Unaudited) (continued)
Interested Trustee*
| | | | | | | | | | |
| | | | | |
Name, Address and Age1 | | Position(s) Held with the Trust | | Term of Office and Length of Time Served2 | | Principal Occupations During Past 5 Years | | Number of Portfolios in Fund Complex Overseen by Trustee3 | | Other Directorships Held by Trustee4 |
| | | | | |
James A. McNamara Age: 61 | | President and Trustee | | Since 2007 | | Advisory Director, Goldman Sachs (January 2018-Present); Managing Director, Goldman Sachs (January 2000-December 2017); Director of Institutional Fund Sales, GSAM (April 1998-December 2000); and Senior Vice President and Manager, Dreyfus Institutional Service Corporation (January 1993-April 1998). President and Trustee — Goldman Sachs Variable Insurance Trust; Goldman Sachs Trust; Goldman Sachs Trust II; Goldman Sachs ETF Trust; Goldman Sachs ETF Trust II; Goldman Sachs Credit Income Fund; and Goldman Sachs Real Estate Diversified Income Fund. | | 192 | | None |
| | | | | | | | | | | |
| * | Mr. McNamara is considered to be an “Interested Trustee” because he holds positions with Goldman Sachs and owns securities issued by The Goldman Sachs Group, Inc. Mr. McNamara holds comparable positions with certain other companies of which Goldman Sachs, GSAM or an affiliate thereof is the investment adviser, administrator and/or distributor. |
| 1 | Each Trustee may be contacted by writing to the Trustee, c/o Goldman Sachs, 200 West Street, New York, New York, 10282, Attn: Robert Griffith. Information is provided as of December 31, 2023. |
| 2 | Subject to such policies as may be adopted by the Board from time-to-time, each Trustee holds office for an indefinite term, until the earliest of: (a) the election of his or her successor; (b) the date the Trustee resigns or is removed by the Board or shareholders, in accordance with the Trust’s Declaration of Trust; or (c) the termination of the Trust. The Board has adopted policies which provide that each Independent Trustee shall retire as of December 31st of the calendar year in which he or she reaches (a) his or her 75th birthday or (b) the 15th anniversary of the date he or she became a Trustee, whichever is earlier, unless a waiver of such requirements shall have been adopted by a majority of the other Trustees. These policies may be changed by the Trustees without shareholder vote. |
| 3 | The Goldman Sachs Fund Complex includes certain other companies listed above for each respective Trustee. As of December 31, 2023, Goldman Sachs Trust consisted of 87 portfolios; Goldman Sachs Variable Insurance Trust consisted of 15 portfolios (11 of which offered shares to the public); Goldman Sachs Trust II consisted of 18 portfolios (7 of which offered shares to the public); Goldman Sachs ETF Trust consisted of 68 portfolios (37 of which offered shares to the public); Goldman Sachs ETF Trust II consisted of 2 portfolios; and Goldman Sachs Credit Income Fund and Goldman Sachs Real Estate Diversified Income Fund each consisted of one portfolio. Goldman Sachs Credit Income Fund did not offer shares to the public. |
| 4 | This column includes only directorships of companies required to report to the Securities and Exchange Commission under the Securities Exchange Act of 1934 (i.e., “public companies”) or other investment companies registered under the Act. |
Additional information about the Trustees is available in the Funds’ Statement of Additional Information, which can be obtained from Goldman Sachs free of charge by calling this toll-free number (in the United States of America): 1-800-621-2550.
GOLDMAN SACHS VARIABLE INSURANCE TRUST GOVERNMENT MONEY MARKET FUND
Trustees and Officers (Unaudited) (continued)
Officers of the Trust*
| | | | | | |
| | | |
| Name, Address and Age1 | | Position(s) Held with the Trust | | Term of Office and Length of Time Served2 | | Principal Occupations During Past 5 Years |
| | | |
James A. McNamara 200 West Street New York, NY 10282 Age: 61 | | Trustee and President | | Since 2007 | | Advisory Director, Goldman Sachs (January 2018-Present); Managing Director, Goldman Sachs (January 2000-December 2017); Director of Institutional Fund Sales, GSAM (April 1998-December 2000); and Senior Vice President and Manager, Dreyfus Institutional Service Corporation (January 1993-April 1998). President and Trustee — Goldman Sachs Variable Insurance Trust; Goldman Sachs Trust; Goldman Sachs Trust II; Goldman Sachs ETF Trust; Goldman Sachs ETF Trust II; Goldman Sachs Credit Income Fund; and Goldman Sachs Real Estate Diversified Income Fund. |
| | | |
Robert Griffith 200 West Street New York, NY 10282 Age: 49 | | Secretary | | Since 2023 | | Managing Director, Goldman Sachs (September 2022 – Present); General Counsel, Exchange Traded Concepts, LLC (October 2021 – September 2022); Vice President, Goldman Sachs (August 2011 – October 2021); Associate General Counsel, Goldman Sachs (December 2014 – Present); Assistant General Counsel, Goldman Sachs (August 2011 – December 2014); Vice President and Counsel, Nomura Holding America, Inc. (2010 – 2011); and Associate, Simpson Thacher & Bartlett LLP (2005 – 2010). Secretary—Goldman Sachs Variable Insurance Trust (previously Assistant Secretary (2022)); Goldman Sachs Trust (previously Assistant Secretary (2022)); Goldman Sachs Trust II (previously Assistant Secretary (2022)); Goldman Sachs ETF Trust (previously Assistant Secretary (2022)); Goldman Sachs ETF Trust II (previously Assistant Secretary (2022)); and Goldman Sachs Real Estate Diversified Income Fund (previously Assistant Secretary (2022)). |
| | | |
Joseph F. DiMaria 30 Hudson Street Jersey City, NJ 07302 Age: 55 | | Treasurer, Principal Financial Officer and Principal Accounting Officer | | Since 2017 (Treasurer and Principal Financial Officer since 2019) | | Managing Director, Goldman Sachs (November 2015-Present) and Vice President — Mutual Fund Administration, Columbia Management Investment Advisers, LLC (May 2010-October 2015). Treasurer, Principal Financial Officer and Principal Accounting Officer — Goldman Sachs Variable Insurance Trust (previously Assistant Treasurer (2016)); Goldman Sachs Trust (previously Assistant Treasurer (2016)); Goldman Sachs Trust II (previously Assistant Treasurer (2017)); Goldman Sachs ETF Trust (previously Assistant Treasurer (2017)); Goldman Sachs ETF Trust II; Goldman Sachs Credit Income Fund; and Goldman Sachs Real Estate Diversified Income Fund. |
| | | | | | |
| * | Represents a partial list of officers of the Trust. Additional information about all the officers is available in the Funds’ Statement of Additional Information, which can be obtained from Goldman Sachs free of charge by calling this toll-free number (in the United States): 1-800-621-2550. |
| 1 | Information is provided as of December 31, 2023. |
| 2 | Officers hold office at the pleasure of the Board of Trustees or until their successors are duly elected and qualified. Each officer holds comparable positions with certain other companies of which Goldman Sachs, GSAM or an affiliate thereof is the investment adviser, administrator and/or distributor. |
Goldman Sachs Variable Insurance Trust — Tax Information (Unaudited)
For the year ended December 31, 2023, the Government Money Market Fund designated 99.78% of the dividends paid from net investment company taxable income as section 163(j) Interest Dividends.
(This page intentionally left blank)
(This page intentionally left blank)
TRUSTEES TRUSTEES (continued) Gregory G. Weaver, Chair Michael Latham* Cheryl K. Beebe* James A. McNamara Dwight L. Bush Lawrence W. Stranghoener* Kathryn A. Cassidy Paul C. Wirth John G. Chou *Effective January 1, 2024 Joaquin Delgado Eileen H. Dowling OFFICERS Lawrence Hughes* James A. McNamara, President John F. Killian* Joseph F. DiMaria, Principal Financial Officer, Steven D. Krichmar* Principal Accounting Officer and Treasurer Robert Griffith, Secretary GOLDMAN SACHS & CO. LLC GOLDMAN SACHS ASSET MANAGEMENT, L.P. Distributor and Transfer Agent Investment Adviser 200 West Street, New York New York 10282 Visit our website at www.GSAMFUNDS.com to obtain the most recent month-end returns. The reports concerning the Fund included in this shareholder report may contain certain forward-looking statements about the factors that may affect the performance of the Fund in the future. These statements are based on Fund management’s predictions and expectations concerning certain future events and their expected impact on the Fund, such as performance of the economy as a whole and of specific industry sectors, changes in the levels of interest rates, the impact of developing world events, and other factors that may influence the future performance of the Fund. Management believes these forward-looking statements to be reasonable, although they are inherently uncertain and difficult to predict. Actual events may cause adjustments in portfolio management strategies from those currently expected to be employed. A description of the policies and procedures that the Fund uses to determine how to vote proxies relating to portfolio securities and information regarding how the Fund voted proxies relating to portfolio securities during the most recent 12-month period ended June 30 is available (i) without charge, upon request by calling 1-800-621-2550; and (ii) on the Securities and Exchange Commission (“SEC”) web site at http://www.sec.gov. Views and opinions expressed are for informational purposes only and do not constitute a recommendation by Goldman Sachs Asset Management to buy, sell, or hold any security. Views and opinions are current as of the date of this presentation and may be subject to change, they should not be construed as investment advice. Goldman Sachs & Co. LLC (“Goldman Sachs”) does not provide legal, tax or accounting advice. Any statement contained in this communication (including any attachments) concerning U.S. tax matters was not intended or written to be used, and cannot be used, for the purpose of avoiding penalties under the Internal Revenue Code, and was written to support the promotion or marketing of transaction or matter addressed. Clients of Goldman Sachs should obtain their own independent tax advice based on their particular circumstances. The website links provided are for your convenience only and are not an endorsement or recommendation by Goldman Sachs Asset Management of any of these websites or the products or services offered. Goldman Sachs Asset Management is not responsible for the accuracy and validity of the content of these websites. Fund holdings and allocations shown are as of December 31, 2023 and may not be representative of future investments. Fund holdings should not be relied on in making investment decisions and should not be construed as research or investment advice regarding particular securities. Current and future holdings are subject to risk. The portfolio risk management process includes an effort to monitor and manage risk, but does not imply low risk. Shares of the Goldman Sachs VIT Funds are offered to separate accounts of participating life insurance companies for the purpose of funding variable annuity contracts and variable life insurance policies. Shares of the Fund are not offered directly to the general public. The variable annuity contracts and variable life insurance policies are described in the separate prospectuses issued by participating insurance companies. You should refer to those prospectuses for information about surrender charges, mortality and expense risk fees and other charges that may be assessed by participating insurance companies under the variable annuity contracts or variable life insurance policies. Such fees or charges, if any, may affect the return you may realize with respect to your investments. Ask your representative for more complete information. Please consider a fund’s objectives, risks and charges and expenses, and read the prospectus carefully before investing. The prospectus contains this and other information about the Fund. This material is not authorized for distribution to prospective investors unless preceded or accompanied by a current prospectus or summary prospectus, if applicable. Investors should consider the Fund’s objective, risks, and charges and expenses, and read the summary prospectus, if available, and/or the prospectus carefully before investing or sending money. The summary prospectus, if available, and the prospectus contain this and other information about the Fund and may be obtained from your authorized dealer or from Goldman Sachs & Co. LLC by calling1-800-621-2550. This report is prepared for the general information of contract owners and is not an offer of shares of the Goldman Sachs Variable Insurance Trust — Goldman Sachs Government Money Market Fund. © 2024 Goldman Sachs. All rights reserved. VITMMAR-24/356078-OTU-1966940
Goldman Sachs Variable Insurance Trust Goldman Sachs Core Fixed Income Fund Annual Report December 31, 2023
Goldman Sachs Variable Insurance Trust
∎ GOLDMAN SACHS CORE FIXED INCOME FUND
TABLE OF CONTENTS
|
| |
Effective January 24, 2023, open-end mutual funds and exchange traded funds will be required to provide shareholders with streamlined annual and semi-annual shareholder reports (“Tailored Shareholder Reports”). Funds will be required to prepare a separate Tailored Shareholder Report for each share class of a fund that highlights key information to investors. Other information, including financial statements, will no longer appear in a fund’s shareholder report, but will be available online, delivered free of charge upon request, and filed with the SEC on a semi-annual basis on Form N-CSR. The new requirements have a compliance date of July 24, 2024. |
| | | | | | |
| | | | |
| NOT FDIC-INSURED | | May Lose Value | | No Bank Guarantee | | |
GOLDMAN SACHS VARIABLE INSURANCE TRUST CORE FIXED INCOME FUND
INVESTMENT OBJECTIVE
The Fund seeks a total return consisting of capital appreciation and income.
Portfolio Management Discussion and Analysis
Below, the Goldman Sachs Fixed Income Portfolio Management Team discusses the Goldman Sachs Variable Insurance Trust — Goldman Sachs Core Fixed Income Fund’s (the “Fund”) performance and positioning for the 12-month period ended December 31, 2023 (the “Reporting Period”).
How did the Fund perform during the Reporting Period?
During the Reporting Period, the Fund’s Institutional and Service Shares generated average annual total returns of 6.08% and 5.83%, respectively. This compares to the 5.53% average annual total return of the Fund’s benchmark, the Bloomberg U.S. Aggregate Bond Index (the “Bloomberg Index”), during the same time period.
What economic and market factors most influenced the U.S. fixed income market and the Fund during the Reporting Period?
During the Reporting Period, the U.S. fixed income market and Fund were most influenced by interest rate volatility, which was driven by market expectations for U.S. Federal Reserve (“Fed”) monetary policy, and investor optimism about the potential of an economic “soft landing.” (A soft landing, in economics, is a cyclical downturn that avoids recession. It typically describes attempts by central banks to raise interest rates just enough to stop an economy from overheating and experiencing high inflation, without causing a significant increase in unemployment, or a hard landing.)
In the first quarter of 2023, when the Reporting Period began, the U.S. fixed income market broadly reflected optimism that the Fed might be nearing the end of its interest rate hiking cycle. Overall, signs of disinflation tempered investor fears of renewed aggressive monetary policy tightening, while economic reopening in China and abating recession risks in Europe supported the economic growth outlook. At the beginning of February, the Fed stepped down its pace of interest rate increases to 25 basis points from 50 basis points in December 2022 and 75 basis points at each of the four previous policy meetings prior to December. Fed policymakers also indicated they thought “ongoing” rate hikes would be appropriate, a modestly hawkish surprise. (A basis point is 1/100th of a percentage point. Hawkish tends to suggest higher interest rates; opposite of dovish.) Also in February, the release of unexpectedly strong U.S. economic and labor market data raised concerns about the “stickiness,” or persistence, of inflation, leading market participants to anticipate further monetary policy tightening. Bond prices fell amid a rise in interest rate volatility. The volatility continued into March as Fed Chair Powell opened the door to tighter Fed monetary policy, leading markets to reprice the terminal federal funds rate higher and for longer. The two-year U.S. Treasury yield rose in response, breaching 5% for the first time since 2007. The momentum reversed sharply in mid-March given a broad flight to quality that ensued amid U.S. and European banking stress, and short-term U.S. Treasury yields fell by more than 100 basis points, though the U.S. Treasury yield curve, or spectrum of maturities, remained inverted. (In 2022, before the Reporting Period started, the U.S. Treasury yield curve inverted between two-year and 10-year maturities, meaning two-year yields were higher than 10-year yields. Historically, an inverted U.S. Treasury yield curve often precedes an economic recession.) In this environment, Fed officials grappled with a difficult trade-off between the firm macroeconomic backdrop, including resilient labor markets and elevated inflation, and rising financial stability concerns. At its March meeting, the Fed implemented a 25 basis point rate hike, projected a weak economic outlook for the rest of 2023, and struck a more cautious tone on the forward path for the federal funds rate.
During the second quarter of 2023, bond yields were broadly volatile, fluctuating in response to sticky inflation data, signs of moderating economic growth, developments in the banking sector and concerns over tightening credit conditions. In May, the Fed raised the federal funds rate 25 basis points, with its continued hawkish language, along with political infighting related to the U.S. debt ceiling, driving up bond yields. Market conditions improved during June, as investors priced in the view the U.S. would avoid recession. The Fed opted for a hawkish pause. In other words, the Fed halted monetary policy action for the first time in more than a year but still maintained higher-for-longer messaging on interest rates.
July 2023 was a mixed month for U.S. fixed income overall, as spread, or non-government bond, sectors delivered strong performance and U.S. Treasury securities faltered amid continued Fed tightening. The Fed raised the federal funds rate by 25 basis points to a range between 5.25% and 5.50%, stating that incoming data would determine upcoming policy actions. During August, spread sectors broadly weakened amidst deteriorating risk sentiment, driven in part by investor concerns about China’s property market and worries about softening economic growth in Europe. Investors also remained wary of inflation, as data indicated it might be stickier than consensus expected. U.S. Treasury yields rose, with the 10-year U.S. Treasury yield hitting 4.36% on August 22nd, its highest level since 2007. In August, Fitch Ratings downgraded long-term U.S. sovereign debt from AAA to AA+, reflecting U.S. governance and medium-term fiscal challenges. Although the Fed left the federal funds rate unchanged at its September meeting, policymakers suggested there would likely be one more rate hike in 2023. Bond yields rose, with the 10-year U.S. Treasury yield climbing above 4.5% for the first time since 2007, as markets anticipated the Fed would keep interest rates higher for longer.
GOLDMAN SACHS VARIABLE INSURANCE TRUST CORE FIXED INCOME FUND
In October 2023, bond yields rose to multi-year highs, with the 10-year U.S. Treasury yield briefly breaching 5% for the first time since 2007. The increase was driven, in our view, by better than previously anticipated U.S. economic growth prospects, which dampened market expectations for Fed interest rate cuts in 2024. November 2023 then saw the greatest easing of U.S. financial conditions in any month during the previous 40 years. Factors behind the easing included ongoing disinflation, soft landing optimism and expectations of a dovish Fed pivot. (Dovish suggests lower interest rates; opposite of hawkish.) Bond yields plunged, with the 10-year U.S. Treasury yield falling approximately 67 basis points in November. At both their November and December meetings, Fed policymakers left the federal funds rate unchanged at a range between 5.25% and 5.50%. In December, the Fed signaled it may have reached the peak of its current monetary policy tightening cycle, with its median dot plot projection showing 75 basis points of rate cuts in 2024. (The dot plot shows interest rate projections of the members of the Federal Open Market Committee.) Following the Fed meeting, U.S. financial conditions eased further, and the 10-year U.S. Treasury yield fell below 4% for the first time since August 2023.
During the Reporting Period overall, spread sectors generally produced positive total returns that outperformed U.S. Treasury securities. Sovereign emerging markets debt and corporate bonds were the strongest performers. Asset backed securities (“ABS”), commercial mortgage-backed securities (“CMBS”), agency securities and mortgage-backed securities also delivered positive, albeit more modest, total returns. Lower quality securities broadly outperformed those of higher quality during the Reporting Period.
U.S. Treasury yields were volatile during the Reporting Period. The yield on a two-year Treasury started the Reporting Period at 4.43%, peaked at 5.22% in October, and closed the Reporting Period at 4.25%. The yield on the bellwether 10-year Treasury began the Reporting Period at 3.88%, peaked in October at 4.99% and finished the Reporting Period at 3.88%. This resulted in a steeper, less inverted U.S. Treasury yield curve by the end of the Reporting Period. (In a steeper yield curve, the differential in yields between longer-term and shorter-term maturities widens.)
What key factors were responsible for the Fund’s performance during the Reporting Period?
During the Reporting Period, the Fund’s cross-sector strategy contributed positively to its relative performance. In our cross-sector strategy, we invest Fund assets across a variety of fixed income sectors, including some that may not be included in the Bloomberg Index. In addition, security selection, which capitalizes on our fundamental research capabilities, bolstered the Fund’s returns. Our currency strategy did not have a material impact on the Fund’s results during the Reporting Period.
The Fund’s combined tactical duration and yield curve positioning added slightly to its relative performance during the Reporting Period.
Which fixed income market sectors most affected Fund performance during the Reporting Period?
During the Reporting Period, the Fund’s overweight position versus the Bloomberg Index in corporate credit and collateralized loan obligations added to relative returns. However, the Fund was hurt by our credit-interest rate paired strategy, which we used to partially hedge the Fund’s overweight in corporate credit, as interest rates rose and volatility persisted.
As for individual issue selection, the Fund’s positions in the investment grade corporate bonds of certain financial and industrial companies added to relative performance during the Reporting Period. In the securitized sector, selection of pass-through mortgage securities had a positive impact on the Fund’s relative returns. (Pass-through mortgage securities consist of a pool of residential mortgage loans in which homeowners’ monthly payments of principal, interest and prepayments pass from the mortgage servicer through a government agency or investment bank to investors.) In the government sector, the Fund benefited from its U.S. relative value trades. (A relative value trade is the simultaneous purchase of one security and sale of a related security as a unit.) Regarding country selection, the Fund’s long positions in the U.K., Sweden and Switzerland versus its short positions in Europe, Australia and Japan added to relative performance during the Reporting Period.
In addition, the Fund’s overweight relative to the Bloomberg Index in the intermediate-term segment of the credit curve contributed positively to returns. The Fund’s lower credit quality bias added further to relative performance. During the Reporting Period, the Fund maintained an overweight position in BBB-rated corporate bonds due to what we saw as the strength of corporate balance sheets and because we believed management teams would be conservative with their capital in order to retain investment grade status.
Did the Fund’s duration and yield curve positioning help or hurt its results during the Reporting Period?
During the Reporting Period, the Fund’s combined tactical duration and yield curve positioning added modestly to its relative returns. In terms of duration positioning, the Fund benefited from our active duration management, wherein we made small tactical shifts relative to the Bloomberg Index over the course of the Reporting Period, as well as from our systematic auction strategy. (Through our systematic auction strategy, we participate in bond auctions intra-month and rebalance the Fund’s duration/market value exposure leading into month end.) The Fund’s yield curve positioning also bolstered relative performance, led by its U.S. Treasury yield curve steepener positions. (A steepening position seeks to take advantage of a widening differential between yields at the shorter- and longer-term ends of a range of maturities.)
GOLDMAN SACHS VARIABLE INSURANCE TRUST CORE FIXED INCOME FUND
How did the Fund use derivatives and similar instruments during the Reporting Period?
As market conditions warranted during the Reporting Period, currency transactions were carried out using forward foreign exchange contracts. Currency transactions were used as we sought both to enhance returns and to hedge the Fund’s portfolio against currency exchange rate fluctuations. Forward foreign exchange contracts had a negative impact on Fund performance during the Reporting Period. In addition, Treasury futures were employed for hedging purposes and to take active views on the U.S. Treasury yield curve as well as for duration management. During the Reporting Period, Treasury futures overall had a positive impact on the Fund’s results. Swaptions (options on interest rate swap contracts), which were used to express our interest rate views and to hedge volatility and yield curve risks in the Fund, had a negative impact on the Fund’s performance during the Reporting Period. Interest rate swaps were employed as a cost-efficient means to assist in implementing rates viewpoints and to hedge portfolio exposure as needed, more easily facilitating duration and cross-sector positioning. The use of interest rate swaps during the Reporting Period had a neutral impact on the Fund’s performance. Fed funds futures and Secured Overnight Financing Rate (“SOFR”) futures were employed to hedge the Fund’s interest rate exposure and to facilitate duration management. During the Reporting Period, the use of Fed funds futures had a positive impact on the Fund’s performance, while the use of SOFR futures had a neutral impact. The Fund also utilized index credit default swaps as well as individual credit default swaps to implement specific credit-related investment strategies, including management of the Fund’s exposure to credit spreads, which collectively had a positive impact on the Fund’s results during the Reporting Period. In addition, the Fund employed mortgage-backed securities forward agreements (known as “TBAs”) to express investment views and to efficiently manage certain of its mortgage-backed securities positions, which had a positive impact on performance.
We employ derivatives and similar instruments to efficiently manage the Fund. Derivatives and similar instruments allow us to manage interest rate, credit and currency risks more effectively by allowing us both to hedge and to apply active investment views with greater versatility and to afford greater risk management precision than we would otherwise be able to implement.
Were there any notable changes in the Fund’s weightings during the Reporting Period?
During the Reporting Period, we made a number of changes in the Fund’s weightings. After spreads tightened at the start of 2023, we decreased the Fund’s overweight position versus the Bloomberg Index in pass-through mortgage securities. In the second calendar quarter, we added to the Fund’s overweight in pass-through mortgage securities, as we sought to take advantage of widening spreads stemming from interest rate volatility. In addition, deteriorating valuations and weaker economic growth led us to move the Fund to a more defensive stance by reducing its credit beta and adjusting the credit-interest rate paired strategy. (Credit beta is a measure of exposure to corporate bond market risk.) In September 2023, we moderated the Fund’s overweight in investment grade corporate bonds due to significant economic uncertainty. In November, we decreased the Fund’s overweight in pass-through mortgage securities after the sector rallied on the back of a stronger macroeconomic picture. In December, after the Fed’s policy meeting, we further reduced the Fund’s overweight in pass-through mortgage securities and decreased its overweight in corporate credit. During the fourth quarter overall, we trimmed the Fund’s short position in Japanese interest rates, as the Bank of Japan began to shift its monetary policy and Japanese rates started to rise.
What is the Fund’s tactical view and strategy for the months ahead?
At the end of the Reporting Period, we believed three factors would dominate fixed income market sentiment in 2024. The first, in our view, would be Fed policy. Given that the Fed has signaled its next policy action is likely to be interest rate cuts, we believed the speed of those rate cuts, when they are made, and by how many basis points they are cut during 2024 will likely drive bond market performance in the near term. In addition, we expected to see lagging effects from the Fed’s monetary policy tightening, which could increase stress in some pockets of the corporate bond market. The second key factor should be the path of inflation and economic growth. In our opinion, the Fed wants to see more progress on disinflation before it begins to cut interest rates, so we planned to continue monitoring the cumulative impact of the Fed’s interest rate hiking cycle. We believed U.S. economic growth may deteriorate, though remain positive overall, the longer the Fed keeps policy rates at high levels. The third key factor, in our view, may well be a combination of geopolitical tensions, including the ongoing Middle East and Russia/Ukraine conflicts, and deglobalization trends (within U.S./China, in particular).
At the end of the Reporting Period, we thought fixed income valuations reflected a rather optimistic economic outlook. As a result, we had modestly reduced the Fund’s exposure to spread sectors. In our view, risks would lean toward the downside should incoming data fall short of investors’ soft landing expectations. Looking ahead, we believed further disinflation progress, along with higher term premiums, would increase what we considered the protective benefits of U.S. bond yields when paired with spread sector exposures. (Term premium is the compensation that investors generally receive for the added risk of owning longer-term bonds.) We had a neutral view on interest rates at the end of the Reporting Period, as we thought some of the factors leading to higher term premiums across the yield curve could persist, such as the market’s assessment of where long-term equilibrium rates may settle. (Long-term equilibrium rates refer to the interest rates that support the economy at full employment/maximum output while keeping inflation constant.) Accordingly, the Fund was overweight the intermediate maturity portion of the U.S. Treasury yield curve at the end of the Reporting Period and was positioned for the curve to steepen. We believed this positioning would make the Fund less sensitive to an expansion in term premiums and could also perform well in a scenario where medium-term economic growth expectations moderate.
GOLDMAN SACHS VARIABLE INSURANCE TRUST CORE FIXED INCOME FUND
In terms of positioning at the end of the Reporting Period, the Fund was overweight ABS, collateralized loan obligations and CMBS relative to the Bloomberg Index. It was modestly overweight investment grade corporate bonds. Compared to the Bloomberg Index, the Fund was rather neutrally positioned in mortgage-backed securities and was underweight U.S. government securities at the end of the Reporting Period.
FUND BASICS
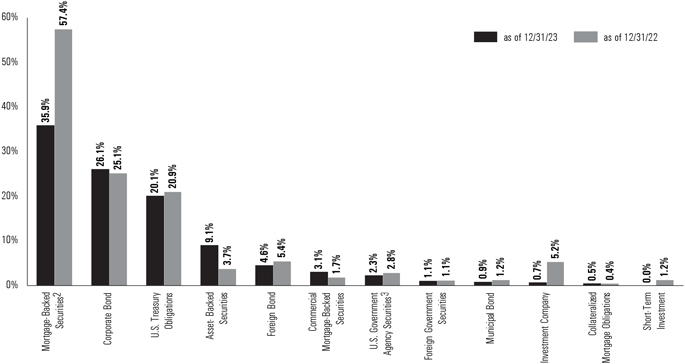
| | 1 | The percentage shown for each investment category reflects the value of investments in that category as a percentage of net assets. Figures in the above graph may not sum to 100% due to the exclusion of other assets and liabilities. Short-Term Investments represent investments in commercial paper. Underlying sector allocations of investment companies held by the Fund are not reflected in the graph above. The graph depicts the Fund’s investments but may not represent the Fund’s market exposure due to the exclusion of certain derivatives, if any, as listed in the Additional Investment Information section of the Schedule of Investments. |
| | 2 | Mortgage-backed securities guaranteed by the Government National Mortgage Association (“GNMA”), Federal National Mortgage Association (“FNMA”) or the Federal Home Loan Mortgage Corp. (“FHLMC”). GNMA instruments are backed by the full faith and credit of the United States Government. |
| | 3 | “U.S. Government Agency Security” include agency securities offered by companies such as Federal Farm Credit Bank (“FFCB”) and the FNMA which operate under a government charter. While they are required to report to a government regulator, their assets are not explicitly guaranteed by the government and they otherwise operate like any other publicly traded company. |
| | | For more information about your Fund, please refer to www.GSAMFUNDS.com. There, you can learn more about your Fund’s investment strategies, holdings, and performance. |
GOLDMAN SACHS VARIABLE INSURANCE TRUST CORE FIXED INCOME FUND
Performance Summary
December 31, 2023
The following graph shows the value, as of December 31, 2023, of a $10,000 investment made on January 1, 2014 in Service Shares at NAV. For comparative purposes, the performance of the Fund’s benchmark, the Bloomberg U.S. Aggregate Bond Index, is shown. Performance reflects applicable fee waivers and/or expense limitations in effect during the periods shown and, in their absence, performance would be reduced. Returns do not reflect the deduction of taxes that a shareholder would pay on Fund distributions or the redemption of Fund shares. The returns set forth below represent past performance. Past performance does not guarantee future results. The Fund’s investment return and principal value will fluctuate so that an investor’s shares, when redeemed, may be worth more or less than their original cost. Current performance may be lower or higher than the performance quoted below. Please visit our web site at www.GSAMFUNDS.com to obtain the most recent month-end return.
|
|
Core Fixed Income Fund’s 10 Year Performance |
|
Performance of a $10,000 investment, with distributions reinvested, from January 1, 2014 through December 31, 2023. |
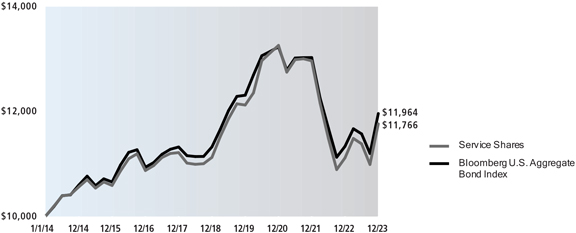
| | | | | | |
| | | |
Average Annual Total Returns through December 31, 2023* | | One Year | | Five Years | | Ten Years |
| | | |
Institutional | | 6.08% | | 1.37% | | 1.88% |
| | | | | | | |
| | | |
Service | | 5.83% | | 1.13% | | 1.64% |
| | | | | | | |
| * | These returns assume reinvestment of all distributions at NAV. Because Institutional and Service Shares do not involve sales charge, such a charge is not applied to their Average Annual Total Returns. |
GOLDMAN SACHS VARIABLE INSURANCE TRUST CORE FIXED INCOME FUND
Index Definitions
Bloomberg U.S. Aggregate Bond Index represents an unmanaged diversified portfolio of fixed income securities, including U.S. Treasuries, investment-grade corporate bonds and mortgage-backed and asset-backed securities.
It is not possible to invest directly in an index.
GOLDMAN SACHS VARIABLE INSURANCE TRUST CORE FIXED INCOME FUND
|
Schedule of Investments December 31, 2023 |
| | | | | | | | | | | | | | | | |
| | | Principal Amount | | | Interest Rate | | | Maturity Date | | Value | |
| |
| | Mortgage-Backed Securities – 35.9% | |
| | |
| | FHLMC | | | | |
| | | | | $2,883 | | | | 7.500 | % | | 12/01/29 | | $ | 3,042 | |
| | | | | 907 | | | | 5.000 | | | 10/01/33 | | | 915 | |
| | | | | 1,271 | | | | 5.000 | | | 07/01/35 | | | 1,284 | |
| | | | | 1,844 | | | | 5.000 | | | 12/01/35 | | | 1,877 | |
| | | | | 379 | | | | 5.000 | | | 03/01/38 | | | 385 | |
| | | | | 872 | | | | 5.000 | | | 06/01/41 | | | 889 | |
| | | | | 4,446 | | | | 4.500 | | | 08/01/48 | | | 4,385 | |
| | | | | 5,335 | | | | 4.500 | | | 11/01/48 | | | 5,264 | |
| | | | | 563,503 | | | | 3.000 | | | 09/01/49 | | | 509,302 | |
| | | | | 408,741 | | | | 4.000 | | | 03/01/50 | | | 392,938 | |
| | | | | 833,823 | | | | 4.500 | | | 03/01/50 | | | 822,979 | |
| | | | | 283,438 | | | | 3.000 | | | 10/01/50 | | | 254,094 | |
| | | | | 933,391 | | | | 2.500 | | | 02/01/51 | | | 799,899 | |
| | | | | 1,885,994 | | | | 2.000 | | | 05/01/51 | | | 1,547,749 | |
| | | | | 884,426 | | | | 2.500 | | | 05/01/51 | | | 759,335 | |
| | | | | 885,456 | | | | 2.500 | | | 05/01/51 | | | 765,461 | |
| | | | | 830,360 | | | | 2.500 | | | 09/01/51 | | | 714,458 | |
| | | | | 771,558 | | | | 4.500 | | | 04/01/52 | | | 750,432 | |
| | | | | 571,294 | | | | 4.500 | | | 06/01/52 | | | 556,423 | |
| | | | | 388,291 | | | | 6.000 | | | 12/01/52 | | | 401,734 | |
| | FNMA | | | | |
| | | | | 55 | | | | 4.500 | | | 07/01/24 | | | 56 | |
| | | | | 566 | | | | 9.000 | | | 11/01/25 | | | 567 | |
| | | | | 6,573 | | | | 7.000 | | | 08/01/26 | | | 6,647 | |
| | | | | 2,494 | | | | 8.000 | | | 10/01/29 | | | 2,601 | |
| | | | | 777 | | | | 8.500 | | | 04/01/30 | | | 825 | |
| | | | | 1,466 | | | | 8.000 | | | 05/01/30 | | | 1,505 | |
| | | | | 2,806 | | | | 8.000 | | | 08/01/32 | | | 3,017 | |
| | | | | 3,623 | | | | 4.500 | | | 08/01/39 | | | 3,616 | |
| | | | | 6,511 | | | | 3.000 | | | 01/01/43 | | | 6,024 | |
| | | | | 12,464 | | | | 3.000 | | | 01/01/43 | | | 11,536 | |
| | | | | 7,630 | | | | 3.000 | | | 03/01/43 | | | 7,073 | |
| | | | | 19,619 | | | | 3.000 | | | 03/01/43 | | | 18,049 | |
| | | | | 59,920 | | | | 3.000 | | | 03/01/43 | | | 55,098 | |
| | | | | 7,555 | | | | 3.000 | | | 04/01/43 | | | 6,969 | |
| | | | | 9,667 | | | | 3.000 | | | 04/01/43 | | | 8,897 | |
| | | | | 14,291 | | | | 3.000 | | | 04/01/43 | | | 13,138 | |
| | | | | 17,765 | | | | 3.000 | | | 04/01/43 | | | 16,338 | |
| | | | | 73,329 | | | | 3.000 | | | 04/01/43 | | | 67,440 | |
| | | | | 9,800 | | | | 3.000 | | | 05/01/43 | | | 9,008 | |
| | | | | 36,325 | | | | 3.000 | | | 05/01/43 | | | 33,389 | |
| | | | | 40,704 | | | | 3.000 | | | 05/01/43 | | | 37,433 | |
| | | | | 266,301 | | | | 4.000 | | | 12/01/44 | | | 257,035 | |
| | | | | 224,641 | | | | 4.500 | | | 04/01/45 | | | 224,387 | |
| | | | | 27,956 | | | | 4.500 | | | 05/01/45 | | | 27,889 | |
| | | | | 540,798 | | | | 4.000 | | | 08/01/45 | | | 522,762 | |
| | | | | 130,678 | | | | 4.000 | | | 02/01/48 | | | 126,116 | |
| | | | | 153,867 | | | | 4.000 | | | 03/01/48 | | | 148,447 | |
| | | | | 2,779 | | | | 4.000 | | | 07/01/48 | | | 2,680 | |
| | | | | 9,387 | | | | 4.000 | | | 07/01/48 | | | 9,059 | |
| | | | | 258,517 | | | | 4.500 | | | 07/01/48 | | | 255,074 | |
| | | | | 172,405 | | | | 4.000 | | | 08/01/48 | | | 166,278 | |
| | | | | 137,425 | | | | 5.000 | | | 11/01/48 | | | 139,147 | |
| | | | | 1,905,630 | | | | 2.000 | | | 10/01/50 | | | 1,567,437 | |
| | | | | 437,554 | | | | 3.000 | | | 10/01/50 | | | 394,579 | |
| | | | | 568,508 | | | | 3.000 | | | 10/01/50 | | | 509,651 | |
| | | | | 573,056 | | | | 3.000 | | | 10/01/50 | | | 516,772 | |
| | | | | 1,905,709 | | | | 2.000 | | | 11/01/50 | | | 1,567,501 | |
| | | | | | | | | | | | | | | | |
| | | Principal Amount | | | Interest Rate | | | Maturity Date | | Value | |
| |
| | Mortgage-Backed Securities – (continued) | |
| | |
| | FNMA – (continued) | | | | |
| | | | | $74,713 | | | | 2.500 | % | | 03/01/51 | | $ | 64,705 | |
| | | | | 92,977 | | | | 2.500 | | | 09/01/51 | | | 80,290 | |
| | | | | 370,675 | | | | 2.500 | | | 10/01/51 | | | 319,643 | |
| | | | | 169,619 | | | | 2.500 | | | 11/01/51 | | | 146,368 | |
| | | | | 218,804 | | | | 2.500 | | | 11/01/51 | | | 188,626 | |
| | | | | 1,445,083 | | | | 6.000 | | | 11/01/52 | | | 1,489,694 | |
| | | | | 918,917 | | | | 5.500 | | | 04/01/53 | | | 924,433 | |
| | | | | 1,970,053 | | | | 6.500 | | | 09/01/53 | | | 2,029,050 | |
| | | | | 2,000,000 | | | | 2.000 | | | TBA-30yr(a) | | | 1,634,386 | |
| | | | | 2,000,000 | | | | 2.500 | | | TBA-30yr(a) | | | 1,701,414 | |
| | | | | 3,000,000 | | | | 3.500 | | | TBA-30yr(a) | | | 2,749,902 | |
| | | | | 1,000,000 | | | | 6.000 | | | TBA-30yr(a) | | | 1,015,380 | |
| | | | | 1,000,000 | | | | 6.500 | | | TBA-30yr(a) | | | 1,024,531 | |
| | | | | 1,000,000 | | | | 7.000 | | | TBA-30yr(a) | | | 1,031,368 | |
| | | | | 1,000,000 | | | | 7.000 | | | TBA-30yr(a) | | | 1,031,055 | |
| | | | | 964,453 | | | | 3.500 | | | 09/01/62 | | | 869,914 | |
| | FNMA, Series 2012-111, Class B | | | | |
| | | | | 4,739 | | | | 7.000 | | | 10/25/42 | | | 5,139 | |
| | FNMA, Series 2012-153, Class B | | | | |
| | | | | 12,722 | | | | 7.000 | | | 07/25/42 | | | 13,896 | |
| | GNMA | | | | |
| | | | | 1,061 | | | | 7.000 | | | 11/15/25 | | | 1,063 | |
| | | | | 307 | | | | 7.000 | | | 04/15/26 | | | 308 | |
| | | | | 467 | | | | 7.000 | | | 04/15/26 | | | 468 | |
| | | | | 564 | | | | 7.000 | | | 03/15/27 | | | 567 | |
| | | | | 238 | | | | 7.000 | | | 11/15/27 | | | 239 | |
| | | | | 1,237 | | | | 7.000 | | | 11/15/27 | | | 1,265 | |
| | | | | 2,804 | | | | 7.000 | | | 02/15/28 | | | 2,840 | |
| | | | | 62 | | | | 7.000 | | | 05/15/28 | | | 63 | |
| | | | | 1,216 | | | | 7.000 | | | 06/15/28 | | | 1,236 | |
| | | | | 567 | | | | 7.000 | | | 07/15/28 | | | 578 | |
| | | | | 1,227 | | | | 7.000 | | | 07/15/28 | | | 1,246 | |
| | | | | 5,761 | | | | 7.000 | | | 09/15/28 | | | 5,859 | |
| | | | | 42,356 | | | | 6.000 | | | 08/20/34 | | | 44,149 | |
| | | | | 37,441 | | | | 5.000 | | | 06/15/40 | | | 38,168 | |
| | | | | 157,153 | | | | 4.000 | | | 08/20/43 | | | 153,289 | |
| | | | | 59,448 | | | | 4.000 | | | 10/20/45 | | | 57,890 | |
| | | | | 177,922 | | | | 3.500 | | | 04/20/47 | | | 167,994 | |
| | | | | 219,752 | | | | 3.500 | | | 12/20/47 | | | 207,101 | |
| | | | | 900,918 | | | | 4.000 | | | 07/20/48 | | | 871,401 | |
| | | | | 29,888 | | | | 5.000 | | | 08/20/48 | | | 30,013 | |
| | | | | 97,468 | | | | 4.500 | | | 09/20/48 | | | 96,142 | |
| | | | | 104,694 | | | | 5.000 | | | 10/20/48 | | | 105,133 | |
| | | | | 286,957 | | | | 5.000 | | | 11/20/48 | | | 288,162 | |
| | | | | 36,691 | | | | 5.000 | | | 12/20/48 | | | 36,833 | |
| | | | | 227,302 | | | | 4.500 | | | 01/20/49 | | | 223,997 | |
| | | | | 31,009 | | | | 4.500 | | | 03/20/49 | | | 30,558 | |
| | | | | 632,559 | | | | 3.000 | | | 08/20/49 | | | 576,702 | |
| | | | | 204,064 | | | | 4.500 | | | 10/20/49 | | | 201,665 | |
| | | | | 410,895 | | | | 3.000 | | | 03/20/50 | | | 375,150 | |
| | | | | 203,999 | | | | 4.500 | | | 03/20/50 | | | 200,476 | |
| | | | | 634,993 | | | | 3.500 | | | 02/20/51 | | | 596,184 | |
| | | | | 821,345 | | | | 3.000 | | | 11/20/51 | | | 743,814 | |
| | | | | 960,051 | | | | 3.000 | | | 11/20/51 | | | 864,308 | |
| | | | | 966,879 | | | | 2.500 | | | 01/20/52 | | | 835,014 | |
| | | | | 940,947 | | | | 4.500 | | | 09/20/52 | | | 918,740 | |
| | | | | 935,299 | | | | 4.500 | | | 10/20/52 | | | 913,518 | |
| | | | | 1,000,000 | | | | 2.000 | | | TBA-30yr(a) | | | 845,836 | |
| | |
| 8 | | The accompanying notes are an integral part of these financial statements. |
GOLDMAN SACHS VARIABLE INSURANCE TRUST CORE FIXED INCOME FUND
| | | | | | | | | | | | | | | | |
| | | Principal Amount | | | Interest Rate | | | Maturity Date | | Value | |
| |
| | Mortgage-Backed Securities – (continued) | |
| | |
| | GNMA – (continued) | | | | |
| | | | | $1,000,000 | | | | 2.500 | % | | TBA-30yr(a) | | $ | 875,408 | |
| | | | | 1,000,000 | | | | 3.000 | | | TBA-30yr(a) | | | 904,568 | |
| | | | | 2,000,000 | | | | 5.000 | | | TBA-30yr(a) | | | 1,986,190 | |
| | | | | 1,000,000 | | | | 5.500 | | | TBA-30yr(a) | | | 1,006,050 | |
| | | | | 1,000,000 | | | | 6.000 | | | TBA-30yr(a) | | | 1,016,353 | |
| | | | | 1,000,000 | | | | 6.500 | | | TBA-30yr(a) | | | 1,023,468 | |
| | GNMA, Series 2021-135, Class A | |
| | | | | 959,079 | | | | 2.000 | | | 08/20/51 | | | 804,103 | |
| | | |
| | |
| | TOTAL MORTGAGE-BACKED SECURITIES
(Cost $49,256,087) | | | 48,410,788 | |
| | | |
| | | | | | | | | | | | | | | | |
| |
| | Corporate Bonds – 26.1% | |
| |
| | Aerospace/Defense – 1.2% | |
| | Boeing Co. (The) | |
| | | | | 50,000 | | | | 3.450 | | | 11/01/28(b) | | | 47,084 | |
| | | | | 25,000 | | | | 5.150 | | | 05/01/30(b) | | | 25,453 | |
| | | | | 25,000 | | | | 3.250 | | | 02/01/35(b) | | | 21,108 | |
| | | | | 325,000 | | | | 5.705 | | | 05/01/40(b) | | | 336,846 | |
| | | | | 100,000 | | | | 5.805 | | | 05/01/50(b) | | | 103,717 | |
| | L3Harris Technologies, Inc. | |
| | | | | 50,000 | | | | 5.600 | | | 07/31/53(b) | | | 53,404 | |
| | Lockheed Martin Corp. | |
| | | | | 150,000 | | | | 5.250 | | | 01/15/33(b) | | | 159,194 | |
| | Northrop Grumman Corp. | |
| | | | | 75,000 | | | | 3.250 | | | 01/15/28(b) | | | 71,715 | |
| | | | | 25,000 | | | | 4.750 | | | 06/01/43 | | | 23,937 | |
| | | | | 50,000 | | | | 5.250 | | | 05/01/50(b) | | | 51,504 | |
| | RTX Corp. | |
| | | | | 50,000 | | | | 3.950 | | | 08/16/25(b) | | | 49,292 | |
| | | | | 50,000 | | | | 4.125 | | | 11/16/28(b) | | | 48,844 | |
| | | | | 600,000 | | | | 6.100 | | | 03/15/34(b) | | | 650,594 | |
| | | | | 25,000 | | | | 4.050 | | | 05/04/47(b) | | | 20,853 | |
| | | | | | | | | | | | | | | | |
| | | | | 1,663,545 | |
| | | |
| | Agriculture – 0.2% | |
| | Archer-Daniels-Midland Co. | |
| | | | | 25,000 | | | | 3.250 | | | 03/27/30(b) | | | 23,346 | |
| | | | | 100,000 | | | | 2.900 | | | 03/01/32(b) | | | 88,929 | |
| | Philip Morris International, Inc. | |
| | | | | 50,000 | | | | 5.625 | | | 11/17/29(b) | | | 52,447 | |
| | | | | 100,000 | | | | 5.750 | | | 11/17/32(b) | | | 104,992 | |
| | | | | | | | | | | | | | | | |
| | | | | 269,714 | |
| | | |
| | Auto Manufacturers – 0.5% | |
| | General Motors Co. | |
| | | | | 25,000 | | | | 4.000 | | | 04/01/25 | | | 24,571 | |
| | General Motors Financial Co., Inc. | |
| | | | | 125,000 | | | | 4.300 | | | 07/13/25(b) | | | 122,975 | |
| | | | | 125,000 | | | | 1.500 | | | 06/10/26(b) | | | 114,605 | |
| | | | | 125,000 | | | | 2.350 | | | 01/08/31(b) | | | 103,375 | |
| | | | | 358,000 | | | | 2.700 | | | 06/10/31(b) | | | 300,337 | |
| | | | | | | | | | | | | | | | |
| | | | | 665,863 | |
| | | |
| | Banks – 5.8% | |
| | Bank of America Corp. | |
| | (SOFR + 1.290%) | |
| | | | | 140,000 | | | | 5.080 | | | 01/20/27(b)(c) | | | 139,753 | |
| | (TSFR3M + 1.302%) | |
| | | | | 85,000 | | | | 3.419 | | | 12/20/28(b)(c) | | | 80,024 | |
| | | | | | | | | | | | | | | | |
| | | Principal Amount | | | Interest Rate | | | Maturity Date | | Value | |
| |
| | Corporate Bonds – (continued) | |
| |
| | Banks – (continued) | |
| | (SOFR + 1.630%) | |
| | | | | $370,000 | | | | 5.202 | % | | 04/25/29(b)(c) | | $ | 372,257 | |
| | (SOFR + 2.150%) | |
| | | | | 175,000 | | | | 2.592 | | | 04/29/31(b)(c) | | | 150,714 | |
| | (SOFR + 1.220%) | |
| | | | | 110,000 | | | | 2.299 | | | 07/21/32(b)(c) | | | 89,851 | |
| | (SOFR + 1.830%) | |
| | | | | 390,000 | | | | 4.571 | | | 04/27/33(b)(c) | | | 372,005 | |
| | (US 5 Year CMT T-Note + 1.200%) | |
| | | | | 100,000 | | | | 2.482 | | | 09/21/36(b)(c) | | | 79,343 | |
| | Bank of America Corp., GMTN | |
| | (TSFR3M + 1.632%) | |
| | | | | 25,000 | | | | 3.593 | | | 07/21/28(b)(c) | | | 23,724 | |
| | Bank of America Corp., MTN | |
| | | | | 45,000 | | | | 3.248 | | | 10/21/27(b) | | | 42,833 | |
| | (TSFR3M + 1.837%) | |
| | | | | 75,000 | | | | 3.824 | | | 01/20/28(b)(c) | | | 72,114 | |
| | (SOFR + 1.050%) | |
| | | | | 400,000 | | | | 2.551 | | | 02/04/28(b)(c) | | | 370,640 | |
| | (SOFR + 2.040%) | |
| | | | | 305,000 | | | | 4.948 | | | 07/22/28(b)(c) | | | 304,735 | |
| | (TSFR3M + 1.572%) | |
| | | | | 50,000 | | | | 4.271 | | | 07/23/29(b)(c) | | | 48,250 | |
| | (SOFR + 1.530%) | |
| | | | | 50,000 | | | | 1.898 | | | 07/23/31(b)(c) | | | 40,839 | |
| | (SOFR + 1.330%) | |
| | | | | 75,000 | | | | 2.972 | | | 02/04/33(b)(c) | | | 63,732 | |
| | (SOFR + 2.160%) | |
| | | | | 73,000 | | | | 5.015 | | | 07/22/33(b)(c) | | | 72,172 | |
| | Bank of America Corp., Series L | |
| | | | | 25,000 | | | | 4.183 | | | 11/25/27(b) | | | 24,313 | |
| | Bank of America Corp., Series N | |
| | (SOFR + 1.220%) | |
| | | | | 50,000 | | | | 2.651 | | | 03/11/32(b)(c) | | | 42,255 | |
| | Bank of New York Mellon Corp. (The) | |
| | (SOFR + 1.755%) | |
| | | | | 20,000 | | | | 4.596 | | | 07/26/30(b)(c) | | | 19,894 | |
| | Citigroup, Inc. | |
| | | | | 220,000 | | | | 3.400 | | | 05/01/26 | | | 212,358 | |
| | | | | 150,000 | | | | 4.450 | | | 09/29/27 | | | 146,533 | |
| | (SOFR + 1.422%) | |
| | | | | 75,000 | | | | 2.976 | | | 11/05/30(b)(c) | | | 66,857 | |
| | (SOFR + 1.351%) | |
| | | | | 200,000 | | | | 3.057 | | | 01/25/33(b)(c) | | | 170,688 | |
| | (SOFR + 2.086%) | |
| | | | | 165,000 | | | | 4.910 | | | 05/24/33(b)(c) | | | 161,576 | |
| | Fifth Third Bancorp | |
| | | | | 30,000 | | | | 2.375 | | | 01/28/25(b) | | | 29,025 | |
| | Huntington Bancshares, Inc. | |
| | | | | 50,000 | | | | 4.000 | | | 05/15/25(b) | | | 48,993 | |
| | JPMorgan Chase & Co. | |
| | (SOFR + 1.160%) | |
| | | | | 125,000 | | | | 2.301 | | | 10/15/25(b)(c) | | | 121,790 | |
| | (TSFR3M + 1.507%) | |
| | | | | 100,000 | | | | 3.960 | | | 01/29/27(b)(c) | | | 97,687 | |
| | | | | 15,000 | | | | 3.625 | | | 12/01/27(b) | | | 14,382 | |
| | |
| The accompanying notes are an integral part of these financial statements. | | 9 |
GOLDMAN SACHS VARIABLE INSURANCE TRUST CORE FIXED INCOME FUND
|
Schedule of Investments (continued) December 31, 2023 |
| | | | | | | | | | | | | | | | |
| | | Principal Amount | | | Interest Rate | | | Maturity Date | | Value | |
| |
| | Corporate Bonds – (continued) | |
| |
| | Banks – (continued) | |
| | (TSFR3M + 1.599%) | |
| | | | | $972,000 | | | | 3.782 | % | | 02/01/28(b)(c) | | $ | 938,670 | |
| | (TSFR3M + 1.207%) | |
| | | | | 45,000 | | | | 3.509 | | | 01/23/29(b)(c) | | | 42,601 | |
| | (TSFR3M + 3.790%) | |
| | | | | 25,000 | | | | 4.493 | | | 03/24/31(b)(c) | | | 24,383 | |
| | (SOFR + 2.040%) | |
| | | | | 25,000 | | | | 2.522 | | | 04/22/31(b)(c) | | | 21,635 | |
| | (SOFR + 1.260%) | |
| | | | | 150,000 | | | | 2.963 | | | 01/25/33(b)(c) | | | 128,445 | |
| | (SOFR + 2.080%) | |
| | | | | 165,000 | | | | 4.912 | | | 07/25/33(b)(c) | | | 163,167 | |
| | JPMorgan Chase & Co., Series HH | |
| | (TSFR3M + 3.125%) | |
| | | | | 74,000 | | | | 4.600 | | | 12/31/99(b)(c) | | | 71,282 | |
| | M&T Bank Corp. | |
| | (SOFR + 2.800%) | |
| | | | | 265,000 | | | | 7.413 | | | 10/30/29(b)(c) | | | 285,408 | |
| | Morgan Stanley | |
| | | | | 25,000 | | | | 3.625 | | | 01/20/27 | | | 24,250 | |
| | | | | 20,000 | | | | 3.950 | | | 04/23/27 | | | 19,412 | |
| | (SOFR + 1.295%) | |
| | | | | 213,000 | | | | 5.050 | | | 01/28/27(b)(c) | | | 213,180 | |
| | (SOFR + 1.000%) | |
| | | | | 200,000 | | | | 2.475 | | | 01/21/28(b)(c) | | | 185,620 | |
| | (SOFR + 2.076%) | |
| | | | | 165,000 | | | | 4.889 | | | 07/20/33(b)(c) | | | 160,920 | |
| | (SOFR + 1.360%) | |
| | | | | 150,000 | | | | 2.484 | | | 09/16/36(b)(c) | | | 119,066 | |
| | Morgan Stanley, GMTN | |
| | (TSFR3M + 1.890%) | |
| | | | | 25,000 | | | | 4.431 | | | 01/23/30(b)(c) | | | 24,353 | |
| | (SOFR + 1.143%) | |
| | | | | 400,000 | | | | 2.699 | | | 01/22/31(b)(c) | | | 350,388 | |
| | Morgan Stanley, MTN | |
| | (SOFR + 1.152%) | |
| | | | | 75,000 | | | | 2.720 | | | 07/22/25(b)(c) | | | 73,795 | |
| | (SOFR + 1.590%) | |
| | | | | 305,000 | | | | 5.164 | | | 04/20/29(b)(c) | | | 306,424 | |
| | (SOFR + 3.120%) | |
| | | | | 50,000 | | | | 3.622 | | | 04/01/31(b)(c) | | | 46,074 | |
| | (SOFR + 1.034%) | |
| | | | | 75,000 | | | | 1.794 | | | 02/13/32(b)(c) | | | 59,843 | |
| | Truist Financial Corp., MTN | |
| | (SOFR + 2.050%) | |
| | | | | 50,000 | | | | 6.047 | | | 06/08/27(b)(c) | | | 50,897 | |
| | US Bancorp | |
| | (SOFR + 2.020%) | |
| | | | | 145,000 | | | | 5.775 | | | 06/12/29(b)(c) | | | 148,932 | |
| | Wells Fargo & Co. | |
| | | | | 175,000 | | | | 3.000 | | | 10/23/26 | | | 166,179 | |
| | Wells Fargo & Co., GMTN | |
| | | | | 50,000 | | | | 4.300 | | | 07/22/27 | | | 48,960 | |
| | Wells Fargo & Co., MTN | |
| | | | | 25,000 | | | | 3.750 | | | 01/24/24(b) | | | 24,970 | |
| | (SOFR + 1.980%) | |
| | | | | 215,000 | | | | 4.808 | | | 07/25/28(b)(c) | | | 213,560 | |
| | | | | | | | | | | | | | | | |
| | | Principal Amount | | | Interest Rate | | | Maturity Date | | Value | |
| |
| | Corporate Bonds – (continued) | |
| |
| | Banks – (continued) | |
| | (SOFR + 2.100%) | |
| | | | | $408,000 | | | | 4.897 | % | | 07/25/33(b)(c) | | $ | 397,727 | |
| | (TSFR3M + 4.502%) | |
| | | | | 25,000 | | | | 5.013 | | | 04/04/51(b)(c) | | | 23,846 | |
| | | | | | | | | | | | | | | | |
| | | | | 7,813,324 | |
| | | |
| | Beverages – 0.4% | |
| | Constellation Brands, Inc. | |
| | | | | 50,000 | | | | 4.400 | | | 11/15/25(b) | | | 49,431 | |
| | | | | 50,000 | | | | 3.600 | | | 02/15/28(b) | | | 48,020 | |
| | | | | 25,000 | | | | 3.150 | | | 08/01/29(b) | | | 23,255 | |
| | | | | 100,000 | | | | 2.250 | | | 08/01/31(b) | | | 84,117 | |
| | Keurig Dr Pepper, Inc. | |
| | | | | 225,000 | | | | 4.597 | | | 05/25/28(b) | | | 225,387 | |
| | | | | 25,000 | | | | 3.800 | | | 05/01/50(b) | | | 20,284 | |
| | | | | 100,000 | | | | 4.500 | | | 04/15/52(b) | | | 91,486 | |
| | | | | | | | | | | | | | | | |
| | | | | 541,980 | |
| | | |
| | Biotechnology – 0.5% | |
| | Amgen, Inc. | |
| | | | | 70,000 | | | | 3.125 | | | 05/01/25(b) | | | 68,246 | |
| | | | | 239,000 | | | | 5.250 | | | 03/02/30(b) | | | 245,771 | |
| | | | | 238,000 | | | | 5.250 | | | 03/02/33(b) | | | 243,938 | |
| | Royalty Pharma PLC | |
| | | | | 75,000 | | | | 1.200 | | | 09/02/25(b) | | | 70,020 | |
| | | | | | | | | | | | | | | | |
| | | | | 627,975 | |
| | | |
| | Building Materials – 0.5% | |
| | Carrier Global Corp. | |
| | | | | 150,000 | | | | 2.493 | | | 02/15/27(b) | | | 141,173 | |
| | | | | 75,000 | | | | 2.722 | | | 02/15/30(b) | | | 67,147 | |
| | | | | 255,000 | | | | 5.900 | | | 03/15/34(b)(d) | | | 275,999 | |
| | Martin Marietta Materials, Inc. | |
| | | | | 175,000 | | | | 3.200 | | | 07/15/51(b) | | | 130,030 | |
| | Masco Corp. | |
| | | | | 50,000 | | | | 1.500 | | | 02/15/28(b) | | | 43,780 | |
| | | | | | | | | | | | | | | | |
| | | | | 658,129 | |
| | | |
| | Chemicals – 0.3% | |
| | DuPont de Nemours, Inc. | |
| | | | | 50,000 | | | | 4.493 | | | 11/15/25(b) | | | 49,687 | |
| | Ecolab, Inc. | |
| | | | | 4,000 | | | | 2.750 | | | 08/18/55(b) | | | 2,701 | |
| | Huntsman International LLC | |
| | | | | 25,000 | | | | 4.500 | | | 05/01/29(b) | | | 24,123 | |
| | International Flavors & Fragrances, Inc. | |
| | | | | 75,000 | | | | 1.832 | | | 10/15/27(b)(d) | | | 65,714 | |
| | | | | 150,000 | | | | 2.300 | | | 11/01/30(b)(d) | | | 124,446 | |
| | | | | 50,000 | | | | 3.268 | | | 11/15/40(b)(d) | | | 35,945 | |
| | Sherwin-Williams Co. (The) | |
| | | | | 25,000 | | | | 3.450 | | | 06/01/27(b) | | | 24,148 | |
| | | | | 50,000 | | | | 2.950 | | | 08/15/29(b) | | | 46,327 | |
| | | | | | | | | | | | | | | | |
| | | | | 373,091 | |
| | | |
| | Commercial Services – 0.4% | |
| | CoStar Group, Inc. | |
| | | | | 100,000 | | | | 2.800 | | | 07/15/30(b)(d) | | | 85,570 | |
| | Emory University, Series 2020 | |
| | | | | 140,000 | | | | 2.143 | | | 09/01/30(b) | | | 120,425 | |
| | Global Payments, Inc. | |
| | | | | 50,000 | | | | 2.650 | | | 02/15/25(b) | | | 48,460 | |
| | |
| 10 | | The accompanying notes are an integral part of these financial statements. |
GOLDMAN SACHS VARIABLE INSURANCE TRUST CORE FIXED INCOME FUND
| | | | | | | | | | | | | | | | |
| | | Principal Amount | | | Interest Rate | | | Maturity Date | | Value | |
| |
| | Corporate Bonds – (continued) | |
| |
| | Commercial Services – (continued) | |
| | PayPal Holdings, Inc. | |
| | | | | $150,000 | | | | 1.650 | % | | 06/01/25(b) | | $ | 143,209 | |
| | | | | 75,000 | | | | 2.650 | | | 10/01/26(b) | | | 71,258 | |
| | | | | 25,000 | | | | 2.850 | | | 10/01/29(b) | | | 22,897 | |
| | S&P Global, Inc. | |
| | | | | 75,000 | | | | 4.250 | | | 05/01/29(b) | | | 74,786 | |
| | | | | | | | | | | | | | | | |
| | | | | 566,605 | |
| | | |
| | Computers – 0.2% | |
| | Dell International LLC / EMC Corp. | |
| | | | | 52,000 | | | | 5.850 | | | 07/15/25(b) | | | 52,536 | |
| | | | | 125,000 | | | | 6.020 | | | 06/15/26(b) | | | 127,918 | |
| | | | | 25,000 | | | | 5.300 | | | 10/01/29(b) | | | 25,756 | |
| | Hewlett Packard Enterprise Co. | |
| | | | | 45,000 | | | | 4.900 | | | 10/15/25(b) | | | 44,843 | |
| | | | | | | | | | | | | | | | |
| | | | | 251,053 | |
| | | |
| | Cosmetics/Personal Care – 0.1% | |
| | Colgate-Palmolive Co. | |
| | | | | $100,000 | | | | 3.250 | | | 08/15/32(b) | | | 92,889 | |
| | | |
| | Diversified Financial Services – 0.4% | |
| | Air Lease Corp. | |
| | | | | 75,000 | | | | 3.375 | | | 07/01/25(b) | | | 72,639 | |
| | Air Lease Corp., GMTN | |
| | | | | 75,000 | | | | 3.750 | | | 06/01/26(b) | | | 72,466 | |
| | Air Lease Corp., MTN | |
| | | | | 75,000 | | | | 2.300 | | | 02/01/25(b) | | | 72,367 | |
| | | | | 75,000 | | | | 2.875 | | | 01/15/26(b) | | | 71,499 | |
| | American Express Co. | |
| | | | | 25,000 | | | | 3.625 | | | 12/05/24(b) | | | 24,587 | |
| | Aviation Capital Group LLC | |
| | | | | 50,000 | | | | 1.950 | | | 01/30/26(b)(d) | | | 46,320 | |
| | Capital One Financial Corp. | |
| | | | | 45,000 | | | | 3.300 | | | 10/30/24(b) | | | 44,234 | |
| | Discover Financial Services | |
| | | | | 75,000 | | | | 3.750 | | | 03/04/25(b) | | | 73,274 | |
| | Intercontinental Exchange, Inc. | |
| | | | | 50,000 | | | | 3.000 | | | 06/15/50(b) | | | 35,793 | |
| | Mastercard, Inc. | |
| | | | | 25,000 | | | | 3.300 | | | 03/26/27(b) | | | 24,248 | |
| | Nuveen LLC | |
| | | | | 25,000 | | | | 4.000 | | | 11/01/28(b)(d) | | | 24,383 | |
| | | | | | | | | | | | | | | | |
| | | | | 561,810 | |
| | | |
| | Electric – 1.1% | |
| | American Electric Power Co., Inc. | |
| | | | | 50,000 | | | | 2.300 | | | 03/01/30(b) | | | 42,743 | |
| | Arizona Public Service Co. | |
| | | | | 45,000 | | | | 2.950 | | | 09/15/27(b) | | | 42,510 | |
| | Avangrid, Inc. | |
| | | | | 25,000 | | | | 3.200 | | | 04/15/25(b) | | | 24,309 | |
| | Berkshire Hathaway Energy Co. | |
| | | | | 25,000 | | | | 3.250 | | | 04/15/28(b) | | | 23,751 | |
| | | | | 50,000 | | | | 3.700 | | | 07/15/30(b) | | | 47,362 | |
| | Dominion Energy, Inc. | |
| | | | | 50,000 | | | | 3.071 | | | 08/15/24(e) | | | 49,143 | |
| | Dominion Energy, Inc., Series C | |
| | | | | 25,000 | | | | 3.375 | | | 04/01/30(b) | | | 23,035 | |
| | Entergy Corp. | |
| | | | | 45,000 | | | | 2.950 | | | 09/01/26(b) | | | 42,761 | |
| | | | | | | | | | | | | | | | |
| | | Principal Amount | | | Interest Rate | | | Maturity Date | | Value | |
| |
| | Corporate Bonds – (continued) | |
| |
| | Electric – (continued) | |
| | Exelon Corp. | |
| | | | | $50,000 | | | | 4.050 | % | | 04/15/30(b) | | $ | 47,778 | |
| | | | | 25,000 | | | | 4.700 | | | 04/15/50(b) | | | 22,589 | |
| | FirstEnergy Corp. | |
| | | | | 100,000 | | | | 2.650 | | | 03/01/30(b) | | | 86,879 | |
| | FirstEnergy Corp., Series B | |
| | | | | 50,000 | | | | 2.250 | | | 09/01/30(b) | | | 42,125 | |
| | Florida Power & Light Co. | |
| | | | | 68,000 | | | | 4.125 | | | 02/01/42(b) | | | 61,242 | |
| | MidAmerican Energy Co. | |
| | | | | 25,000 | | | | 3.650 | | | 04/15/29(b) | | | 23,899 | |
| | NextEra Energy Capital Holdings, Inc. | |
| | | | | 70,000 | | | | 1.900 | | | 06/15/28(b) | | | 62,124 | |
| | NRG Energy, Inc. | |
| | | | | 75,000 | | | | 3.750 | | | 06/15/24(b)(d) | | | 74,056 | |
| | Ohio Power Co., Series P | |
| | | | | 25,000 | | | | 2.600 | | | 04/01/30(b) | | | 21,911 | |
| | Pacific Gas and Electric Co. | |
| | | | | 25,000 | | | | 2.100 | | | 08/01/27(b) | | | 22,546 | |
| | | | | 50,000 | | | | 2.500 | | | 02/01/31(b) | | | 41,299 | |
| | | | | 25,000 | | | | 3.300 | | | 08/01/40(b) | | | 18,324 | |
| | | | | 25,000 | | | | 3.500 | | | 08/01/50(b) | | | 17,322 | |
| | Progress Energy, Inc. | |
| | | | | 95,000 | | | | 7.000 | | | 10/30/31 | | | 107,323 | |
| | Southern California Edison Co., Series A | |
| | | | | 50,000 | | | | 4.200 | | | 03/01/29(b) | | | 49,009 | |
| | Southern Co. (The) | |
| | | | | 60,000 | | | | 3.250 | | | 07/01/26(b) | | | 57,875 | |
| | Virginia Electric and Power Co. | |
| | | | | 75,000 | | | | 2.450 | | | 12/15/50(b) | | | 46,235 | |
| | Vistra Operations Co. LLC | |
| | | | | 125,000 | | | | 3.550 | | | 07/15/24(b)(d) | | | 123,110 | |
| | Xcel Energy, Inc. | |
| | | | | 250,000 | | | | 3.350 | | | 12/01/26(b) | | | 240,933 | |
| | | | | | | | | | | | | | | | |
| | | | | 1,462,193 | |
| | | |
| | Entertainment – 0.4% | |
| | Warnermedia Holdings, Inc. | |
| | | | | 250,000 | | | | 4.054 | | | 03/15/29(b) | | | 237,055 | |
| | | | | 375,000 | | | | 4.279 | | | 03/15/32(b) | | | 343,076 | |
| | | | | | | | | | | | | | | | |
| | | | | 580,131 | |
| | | |
| | Environmental Control – 0.5% | |
| | Republic Services, Inc. | |
| | | | | 100,000 | | | | 1.750 | | | 02/15/32(b) | | | 81,445 | |
| | Veralto Corp. | |
| | | | | 410,000 | | | | 5.450 | | | 09/18/33(b)(d) | | | 425,375 | |
| | Waste Management, Inc. | |
| | | | | 75,000 | | | | 3.150 | | | 11/15/27(b) | | | 71,861 | |
| | | | | 50,000 | | | | 1.150 | | | 03/15/28(b) | | | 44,007 | |
| | | | | | | | | | | | | | | | |
| | | | | 622,688 | |
| | | |
| | Food – 0.6% | |
| | General Mills, Inc. | |
| | | | | 75,000 | | | | 4.200 | | | 04/17/28(b) | | | 74,021 | |
| | J M Smucker Co. (The) | |
| | | | | 179,000 | | | | 5.900 | | | 11/15/28(b) | | | 188,476 | |
| | | | | 315,000 | | | | 6.200 | | | 11/15/33(b) | | | 343,604 | |
| | Kraft Heinz Foods Co. | |
| | | | | 95,000 | | | | 3.750 | | | 04/01/30(b) | | | 90,743 | |
| | |
| The accompanying notes are an integral part of these financial statements. | | 11 |
GOLDMAN SACHS VARIABLE INSURANCE TRUST CORE FIXED INCOME FUND
|
Schedule of Investments (continued) December 31, 2023 |
| | | | | | | | | | | | | | | | |
| | | Principal Amount | | | Interest Rate | | | Maturity Date | | Value | |
| |
| | Corporate Bonds – (continued) | |
| |
| | Food – (continued) | |
| | Mars, Inc. | |
| | | | | $25,000 | | | | 2.700 | % | | 04/01/25(b)(d) | | $ | 24,332 | |
| | | | | 25,000 | | | | 3.200 | | | 04/01/30(b)(d) | | | 23,091 | |
| | Sysco Corp. | |
| | | | | 25,000 | | | | 6.600 | | | 04/01/50(b) | | | 29,282 | |
| | | | | | | | | | | | | | | | |
| | | | | 773,549 | |
| | | |
| | Gas – 0.1% | |
| | East Ohio Gas Co. (The) | |
| | | | | 25,000 | | | | 1.300 | | | 06/15/25(b)(d) | | | 23,642 | |
| | | | | 25,000 | | | | 2.000 | | | 06/15/30(b)(d) | | | 20,746 | |
| | NiSource, Inc. | |
| | | | | 95,000 | | | | 3.490 | | | 05/15/27(b) | | | 91,509 | |
| | | | | 25,000 | | | | 3.600 | | | 05/01/30(b) | | | 23,325 | |
| | | | | | | | | | | | | | | | |
| | | | | 159,222 | |
| | | |
| | Hand/Machine Tools – 0.0% | |
| | Stanley Black & Decker, Inc. | |
| | | | | 24,000 | | | | 4.250 | | | 11/15/28(b) | | | 23,506 | |
| | | |
| | Healthcare-Products – 0.3% | |
| | DH Europe Finance II Sarl | |
| | | | | 25,000 | | | | 2.600 | | | 11/15/29(b) | | | 22,619 | |
| | | | | 75,000 | | | | 3.250 | | | 11/15/39(b) | | | 62,252 | |
| | GE Healthcare Technologies, Inc. | |
| | | | | 100,000 | | | | 6.377 | | | 11/22/52(b) | | | 116,220 | |
| | STERIS Irish FinCo UnLtd Co. | |
| | | | | 75,000 | | | | 2.700 | | | 03/15/31(b) | | | 64,489 | |
| | Stryker Corp. | |
| | | | | 100,000 | | | | 1.950 | | | 06/15/30(b) | | | 85,521 | |
| | Thermo Fisher Scientific, Inc. | |
| | | | | 25,000 | | | | 1.750 | | | 10/15/28(b) | | | 22,305 | |
| | | | | | | | | | | | | | | | |
| | | | | 373,406 | |
| | | |
| | Healthcare-Services – 1.5% | |
| | Adventist Health System | |
| | | | | 30,000 | | | | 2.952 | | | 03/01/29(b) | | | 27,086 | |
| | Banner Health | |
| | | | | 120,000 | | | | 2.338 | | | 01/01/30(b) | | | 103,603 | |
| | Baylor Scott & White Holdings, Series 2021 | |
| | | | | 40,000 | | | | 1.777 | | | 11/15/30(b) | | | 33,291 | |
| | Centene Corp. | |
| | | | | 150,000 | | | | 4.250 | | | 12/15/27(b) | | | 144,879 | |
| | | | | 110,000 | | | | 2.625 | | | 08/01/31(b) | | | 91,727 | |
| | CommonSpirit Health | |
| | | | | 225,000 | | | | 6.461 | | | 11/01/52(b) | | | 264,028 | |
| | HCA, Inc. | |
| | | | | 80,000 | | | | 3.500 | | | 09/01/30(b) | | | 72,564 | |
| | Humana, Inc. | |
| | | | | 18,000 | | | | 5.500 | | | 03/15/53(b) | | | 18,664 | |
| | Rush Obligated Group, Series 2020 | |
| | | | | 60,000 | | | | 3.922 | | | 11/15/29(b) | | | 57,004 | |
| | Stanford Health Care, Series 2020 | |
| | | | | 40,000 | | | | 3.310 | | | 08/15/30(b) | | | 36,931 | |
| | Sutter Health, Series 20A | |
| | | | | 40,000 | | | | 2.294 | | | 08/15/30(b) | | | 34,284 | |
| | UnitedHealth Group, Inc. | |
| | | | | 275,000 | | | | 5.300 | | | 02/15/30(b) | | | 287,724 | |
| | | | | 525,000 | | | | 5.350 | | | 02/15/33(b) | | | 555,287 | |
| | | | | 100,000 | | | | 5.875 | | | 02/15/53(b) | | | 113,244 | |
| | | | | | | | | | | | | | | | |
| | | Principal Amount | | | Interest Rate | | | Maturity Date | | Value | |
| |
| | Corporate Bonds – (continued) | |
| |
| | Healthcare-Services – (continued) | |
| | UnitedHealth Group, Inc. – (continued) | |
| | | | | $168,000 | | | | 5.050 | % | | 04/15/53(b) | | $ | 169,942 | |
| | | | | | | | | | | | | | | | |
| | | | | 2,010,258 | |
| | | |
| | Home Builders – 0.0% | |
| | Lennar Corp. | |
| | | | | 70,000 | | | | 4.750 | | | 11/29/27(b) | | | 70,006 | |
| | | |
| | Insurance – 0.2% | |
| | American International Group, Inc. | |
| | | | | 25,000 | | | | 3.400 | | | 06/30/30(b) | | | 23,001 | |
| | Arch Capital Group US, Inc. | |
| | | | | 36,000 | | | | 5.144 | | | 11/01/43 | | | 34,199 | |
| | Berkshire Hathaway Finance Corp. | |
| | | | | 75,000 | | | | 1.850 | | | 03/12/30(b) | | | 65,322 | |
| | Marsh & McLennan Cos., Inc. | |
| | | | | 50,000 | | | | 4.375 | | | 03/15/29(b) | | | 49,794 | |
| | Principal Financial Group, Inc. | |
| | | | | 50,000 | | | | 3.100 | | | 11/15/26(b) | | | 47,683 | |
| | | | | 75,000 | | | | 2.125 | | | 06/15/30(b) | | | 63,364 | |
| | Willis North America, Inc. | |
| | | | | 25,000 | | | | 2.950 | | | 09/15/29(b) | | | 22,416 | |
| | | | | | | | | | | | | | | | |
| | | | | 305,779 | |
| | | |
| | Internet – 0.8% | |
| | Amazon.com, Inc. | |
| | | | | 335,000 | | | | 5.200 | | | 12/03/25(b) | | | 339,083 | |
| | | | | 45,000 | | | | 4.800 | | | 12/05/34(b) | | | 46,572 | |
| | | | | 15,000 | | | | 3.875 | | | 08/22/37(b) | | | 13,922 | |
| | | | | 50,000 | | | | 3.100 | | | 05/12/51(b) | | | 37,371 | |
| | Expedia Group, Inc. | |
| | | | | 14,000 | | | | 4.625 | | | 08/01/27(b) | | | 13,962 | |
| | | | | 35,000 | | | | 3.800 | | | 02/15/28(b) | | | 33,702 | |
| | | | | 14,000 | | | | 2.950 | | | 03/15/31(b) | | | 12,363 | |
| | Meta Platforms, Inc. | |
| | | | | 250,000 | | | | 3.500 | | | 08/15/27(b) | | | 243,331 | |
| | Netflix, Inc. | |
| | | | | 210,000 | | | | 5.875 | | | 11/15/28 | | | 221,836 | |
| | | | | 90,000 | | | | 4.875 | | | 06/15/30(b)(d) | | | 91,013 | |
| | | | | | | | | | | | | | | | |
| | | | | 1,053,155 | |
| | | |
| | Iron/Steel – 0.0% | |
| | Steel Dynamics, Inc. | |
| | | | | 20,000 | | | | 2.400 | | | 06/15/25(b) | | | 19,157 | |
| | | | | 50,000 | | | | 1.650 | | | 10/15/27(b) | | | 44,548 | |
| | | | | | | | | | | | | | | | |
| | | | | 63,705 | |
| | | |
| | Lodging – 0.2% | |
| | Hyatt Hotels Corp. | |
| | | | | 75,000 | | | | 1.800 | | | 10/01/24(b) | | | 72,789 | |
| | Marriott International, Inc. | |
| | | | | 125,000 | | | | 5.000 | | | 10/15/27(b) | | | 126,564 | |
| | Marriott International, Inc., Series HH | |
| | | | | 125,000 | | | | 2.850 | | | 04/15/31(b) | | | 108,417 | |
| | | | | | | | | | | | | | | | |
| | | | | 307,770 | |
| | | |
| | Machinery-Diversified – 0.2% | |
| | Ingersoll Rand, Inc. | |
| | | | | 90,000 | | | | 5.700 | | | 08/14/33(b) | | | 95,224 | |
| | Otis Worldwide Corp. | |
| | | | | 25,000 | | | | 2.293 | | | 04/05/27(b) | | | 23,296 | |
| | |
| 12 | | The accompanying notes are an integral part of these financial statements. |
GOLDMAN SACHS VARIABLE INSURANCE TRUST CORE FIXED INCOME FUND
| | | | | | | | | | | | | | | | |
| | | Principal Amount | | | Interest Rate | | | Maturity Date | | Value | |
| |
| | Corporate Bonds – (continued) | |
| |
| | Machinery-Diversified – (continued) | |
| | Otis Worldwide Corp. – (continued) | |
| | | | | $150,000 | | | | 2.565 | % | | 02/15/30(b) | | $ | 133,551 | |
| | | | | | | | | | | | | | | | |
| | | | | 252,071 | |
| | | |
| | Media – 0.7% | |
| | Charter Communications Operating LLC / Charter | |
| | Communications Operating Capital | |
| | | | | 320,000 | | | | 4.908 | | | 07/23/25(b) | | | 317,014 | |
| | Comcast Corp. | |
| | | | | 50,000 | | | | 3.950 | | | 10/15/25(b) | | | 49,355 | |
| | | | | 25,000 | | | | 3.300 | | | 02/01/27(b) | | | 24,134 | |
| | | | | 75,000 | | | | 3.300 | | | 04/01/27(b) | | | 72,202 | |
| | | | | 225,000 | | | | 3.150 | | | 02/15/28(b) | | | 214,546 | |
| | | | | 125,000 | | | | 4.150 | | | 10/15/28(b) | | | 123,270 | |
| | | | | 25,000 | | | | 3.750 | | | 04/01/40(b) | | | 21,510 | |
| | | | | 25,000 | | | | 4.700 | | | 10/15/48(b) | | | 23,886 | |
| | Fox Corp. | |
| | | | | 25,000 | | | | 4.030 | | | 01/25/24(b) | | | 24,967 | |
| | | | | 25,000 | | | | 4.709 | | | 01/25/29(b) | | | 24,878 | |
| | | | | | | | | | | | | | | | |
| | | | | 895,762 | |
| | | |
| | Mining – 0.1% | |
| | Newmont Corp. | |
| | | | | 75,000 | | | | 2.250 | | | 10/01/30(b) | | | 64,818 | |
| | Newmont Corp. / Newcrest Finance Pty Ltd. | |
| | | | | 25,000 | | | | 3.250 | | | 05/13/30(b)(d) | | | 22,498 | |
| | | | | | | | | | | | | | | | |
| | | | | 87,316 | |
| | | |
| | Oil & Gas – 0.1% | |
| | Occidental Petroleum Corp. | |
| | | | | 69,000 | | | | 7.875 | | | 09/15/31 | | | 78,395 | |
| | Phillips 66 | |
| | | | | 25,000 | | | | 1.300 | | | 02/15/26(b) | | | 23,210 | |
| | | | | | | | | | | | | | | | |
| | | | | 101,605 | |
| | | |
| | Packaging & Containers – 0.0% | |
| | Berry Global, Inc. | |
| | | | | 50,000 | | | | 1.570 | | | 01/15/26(b) | | | 46,496 | |
| | | |
| | Pharmaceuticals – 1.3% | |
| | AbbVie, Inc. | |
| | | | | 49,000 | | | | 4.300 | | | 05/14/36(b) | | | 46,983 | |
| | | | | 125,000 | | | | 4.050 | | | 11/21/39(b) | | | 113,047 | |
| | | | | 148,000 | | | | 4.250 | | | 11/21/49(b) | | | 132,087 | |
| | Becton Dickinson and Co. | |
| | | | | 100,000 | | | | 2.823 | | | 05/20/30(b) | | | 89,392 | |
| | Bristol-Myers Squibb Co. | |
| | | | | 75,000 | | | | 2.950 | | | 03/15/32(b) | | | 66,668 | |
| | | | | 25,000 | | | | 4.250 | | | 10/26/49(b) | | | 21,693 | |
| | | | | 105,000 | | | | 6.250 | | | 11/15/53(b) | | | 120,287 | |
| | Cencora, Inc. | |
| | | | | 75,000 | | | | 3.450 | | | 12/15/27(b) | | | 72,264 | |
| | Cigna Group (The) | |
| | | | | 50,000 | | | | 2.400 | | | 03/15/30(b) | | | 43,806 | |
| | | | | 250,000 | | | | 2.375 | | | 03/15/31(b) | | | 213,353 | |
| | | | | 125,000 | | | | 4.800 | | | 08/15/38(b) | | | 121,086 | |
| | | | | 75,000 | | | | 4.900 | | | 12/15/48(b) | | | 71,401 | |
| | CVS Health Corp. | |
| | | | | 350,000 | | | | 2.125 | | | 09/15/31(b) | | | 289,593 | |
| | | | | 175,000 | | | | 4.780 | | | 03/25/38(b) | | | 165,430 | |
| | | | | | | | | | | | | | | | |
| | | Principal Amount | | | Interest Rate | | | Maturity Date | | Value | |
| |
| | Corporate Bonds – (continued) | |
| |
| | Pharmaceuticals – (continued) | |
| | Pfizer, Inc. | |
| | | | | $75,000 | | | | 3.450 | % | | 03/15/29(b) | | $ | 72,223 | |
| | Zoetis, Inc. | |
| | | | | 45,000 | | | | 3.000 | | | 09/12/27(b) | | | 42,720 | |
| | | | | 150,000 | | | | 2.000 | | | 05/15/30(b) | | | 129,265 | |
| | | | | | | | | | | | | | | | |
| | | | | 1,811,298 | |
| | | |
| | Pipelines – 1.2% | |
| | Cheniere Energy Partners LP | |
| | | | | 75,000 | | | | 5.950 | | | 06/30/33(b)(d) | | | 76,987 | |
| | Columbia Pipelines Operating Co. LLC | |
| | | | | 240,000 | | | | 6.036 | | | 11/15/33(b)(d) | | | 251,601 | |
| | Energy Transfer LP | |
| | | | | 15,000 | | | | 4.250 | | | 04/01/24(b) | | | 14,929 | |
| | | | | 50,000 | | | | 2.900 | | | 05/15/25(b) | | | 48,488 | |
| | | | | 25,000 | | | | 5.250 | | | 04/15/29(b) | | | 25,197 | |
| | | | | 275,000 | | | | 5.750 | | | 02/15/33(b) | | | 284,176 | |
| | | | | 5,000 | | | | 6.000 | | | 06/15/48(b) | | | 5,053 | |
| | Kinder Morgan, Inc. | |
| | | | | 275,000 | | | | 4.300 | | | 03/01/28(b) | | | 271,732 | |
| | MPLX LP | |
| | | | | 75,000 | | | | 2.650 | | | 08/15/30(b) | | | 64,788 | |
| | | | | 35,000 | | | | 4.500 | | | 04/15/38(b) | | | 31,164 | |
| | | | | 25,000 | | | | 5.500 | | | 02/15/49(b) | | | 24,218 | |
| | Plains All American Pipeline LP / PAA Finance Corp. | |
| | | | | 25,000 | | | | 3.800 | | | 09/15/30(b) | | | 23,028 | |
| | Sabine Pass Liquefaction LLC | |
| | | | | 75,000 | | | | 5.625 | | | 03/01/25(b) | | | 75,145 | |
| | | | | 75,000 | | | | 5.000 | | | 03/15/27(b) | | | 75,319 | |
| | Targa Resources Corp. | |
| | | | | 55,000 | | | | 4.200 | | | 02/01/33(b) | | | 50,642 | |
| | Western Midstream Operating LP | |
| | | | | 75,000 | | | | 3.100 | | | 02/01/25(b) | | | 73,058 | |
| | | | | 25,000 | | | | 5.450 | | | 04/01/44(b) | | | 22,658 | |
| | | | | 20,000 | | | | 5.300 | | | 03/01/48(b) | | | 17,498 | |
| | Williams Cos., Inc. (The) | |
| | | | | 25,000 | | | | 3.900 | | | 01/15/25(b) | | | 24,603 | |
| | | | | 35,000 | | | | 4.000 | | | 09/15/25(b) | | | 34,360 | |
| | | | | 125,000 | | | | 5.650 | | | 03/15/33(b) | | | 130,687 | |
| | | | | | | | | | | | | | | | |
| | | | | 1,625,331 | |
| | | |
| | REITS – 1.3% | |
| | Agree LP | |
| | | | | 170,000 | | | | 4.800 | | | 10/01/32(b) | | | 160,727 | |
| | Alexandria Real Estate Equities, Inc. | |
| | | | | 25,000 | | | | 3.375 | | | 08/15/31(b) | | | 22,555 | |
| | American Homes 4 Rent LP | |
| | | | | 50,000 | | | | 4.900 | | | 02/15/29(b) | | | 49,537 | |
| | | | | 30,000 | | | | 2.375 | | | 07/15/31(b) | | | 24,755 | |
| | American Tower Corp. | |
| | | | | 100,000 | | | | 2.400 | | | 03/15/25(b) | | | 96,727 | |
| | | | | 75,000 | | | | 2.100 | | | 06/15/30(b) | | | 62,954 | |
| | Crown Castle, Inc. | |
| | | | | 60,000 | | | | 3.650 | | | 09/01/27(b) | | | 57,081 | |
| | CubeSmart LP | |
| | | | | 45,000 | | | | 4.000 | | | 11/15/25(b) | | | 43,915 | |
| | | | | 60,000 | | | | 2.500 | | | 02/15/32(b) | | | 49,850 | |
| | Essex Portfolio LP | |
| | | | | 50,000 | | | | 3.000 | | | 01/15/30(b) | | | 44,556 | |
| | |
| The accompanying notes are an integral part of these financial statements. | | 13 |
GOLDMAN SACHS VARIABLE INSURANCE TRUST CORE FIXED INCOME FUND
|
Schedule of Investments (continued) December 31, 2023 |
| | | | | | | | | | | | | | | | |
| | | Principal Amount | | | Interest Rate | | | Maturity Date | | Value | |
| |
| | Corporate Bonds – (continued) | |
| |
| | REITS – (continued) | |
| | Healthcare Realty Holdings LP | |
| | | | | $25,000 | | | | 2.050 | % | | 03/15/31(b) | | $ | 19,360 | |
| | Host Hotels & Resorts LP, Series J | |
| | | | | 42,000 | | | | 2.900 | | | 12/15/31(b) | | | 35,292 | |
| | Invitation Homes Operating Partnership LP | |
| | | | | 75,000 | | | | 2.300 | | | 11/15/28(b) | | | 66,779 | |
| | | | | 195,000 | | | | 2.000 | | | 08/15/31(b) | | | 155,042 | |
| | Kilroy Realty LP | |
| | | | | 20,000 | | | | 4.750 | | | 12/15/28(b) | | | 19,053 | |
| | Mid-America Apartments L.P. | |
| | | | | 50,000 | | | | 1.700 | | | 02/15/31(b) | | | 40,685 | |
| | National Retail Properties, Inc. | |
| | | | | 35,000 | | | | 3.900 | | | 06/15/24(b) | | | 34,700 | |
| | | | | 45,000 | | | | 4.000 | | | 11/15/25(b) | | | 44,077 | |
| | Prologis L.P. | |
| | | | | 25,000 | | | | 1.750 | | | 07/01/30(b) | | | 20,979 | |
| | | | | 125,000 | | | | 4.625 | | | 01/15/33(b) | | | 125,690 | |
| | Realty Income Corp. | |
| | | | | 25,000 | | | | 3.950 | | | 08/15/27(b) | | | 24,323 | |
| | Regency Centers LP | |
| | | | | 100,000 | | | | 2.950 | | | 09/15/29(b) | | | 89,634 | |
| | Retail Opportunity Investments Partnership LP | |
| | | | | 200,000 | | | | 6.750 | | | 10/15/28(b) | | | 210,306 | |
| | Spirit Realty LP | |
| | | | | 75,000 | | | | 3.400 | | | 01/15/30(b) | | | 68,286 | |
| | UDR, Inc., MTN | |
| | | | | 25,000 | | | | 2.100 | | | 08/01/32(b) | | | 19,650 | |
| | | | | 100,000 | | | | 1.900 | | | 03/15/33(b) | | | 76,517 | |
| | Ventas Realty LP | |
| | | | | 45,000 | | | | 3.500 | | | 02/01/25(b) | | | 43,975 | |
| | WP Carey, Inc. | |
| | | | | 20,000 | | | | 4.600 | | | 04/01/24(b) | | | 19,906 | |
| | | | | 30,000 | | | | 4.000 | | | 02/01/25(b) | | | 29,555 | |
| | | | | 25,000 | | | | 3.850 | | | 07/15/29(b) | | | 23,441 | |
| | | | | 25,000 | | | | 2.400 | | | 02/01/31(b) | | | 21,133 | |
| | | | | | | | | | | | | | | | |
| | | | | 1,801,040 | |
| | | |
| | Retail – 0.7% | |
| | 7-Eleven, Inc. | |
| | | | | 100,000 | | | | 1.300 | | | 02/10/28(b)(d) | | | 87,441 | |
| | AutoNation, Inc. | |
| | | | | 83,000 | | | | 4.500 | | | 10/01/25(b) | | | 81,315 | |
| | | | | 25,000 | | | | 1.950 | | | 08/01/28(b) | | | 21,510 | |
| | Dollar Tree, Inc. | |
| | | | | 50,000 | | | | 4.000 | | | 05/15/25(b) | | | 49,113 | |
| | | | | 50,000 | | | | 4.200 | | | 05/15/28(b) | | | 48,927 | |
| | Home Depot, Inc. (The) | |
| | | | | 25,000 | | | | 3.900 | | | 12/06/28(b) | | | 24,642 | |
| | | | | 150,000 | | | | 3.250 | | | 04/15/32(b) | | | 138,653 | |
| | | | | 25,000 | | | | 4.250 | | | 04/01/46(b) | | | 22,631 | |
| | Lowe’s Cos., Inc. | |
| | | | | 25,000 | | | | 3.100 | | | 05/03/27(b) | | | 23,963 | |
| | | | | 75,000 | | | | 1.700 | | | 09/15/28(b) | | | 66,360 | |
| | | | | 25,000 | | | | 3.000 | | | 10/15/50(b) | | | 17,027 | |
| | | | | 50,000 | | | | 4.250 | | | 04/01/52(b) | | | 42,384 | |
| | McDonald’s Corp., MTN | |
| | | | | 79,000 | | | | 4.600 | | | 09/09/32(b) | | | 80,031 | |
| | | | | 25,000 | | | | 4.200 | | | 04/01/50(b) | | | 22,214 | |
| | | | | | | | | | | | | | | | |
| | | Principal Amount | | | Interest Rate | | | Maturity Date | | Value | |
| |
| | Corporate Bonds – (continued) | |
| |
| | Retail – (continued) | |
| | Starbucks Corp. | |
| | | | | $100,000 | | | | 4.000 | % | | 11/15/28(b) | | $ | 98,491 | |
| | Tractor Supply Co. | |
| | | | | 50,000 | | | | 1.750 | | | 11/01/30(b) | | | 41,005 | |
| | Walgreens Boots Alliance, Inc. | |
| | | | | 41,000 | | | | 4.100 | | | 04/15/50(b) | | | 29,762 | |
| | | | | | | | | | | | | | | | |
| | | | | 895,469 | |
| | | |
| | Semiconductors – 0.5% | |
| | Applied Materials, Inc. | |
| | | | | 25,000 | | | | 1.750 | | | 06/01/30(b) | | | 21,290 | |
| | Broadcom, Inc. | |
| | | | | 74,000 | | | | 4.150 | | | 04/15/32(b)(d) | | | 69,839 | |
| | | | | 100,000 | | | | 3.419 | | | 04/15/33(b)(d) | | | 87,846 | |
| | | | | 50,000 | | | | 3.469 | | | 04/15/34(b)(d) | | | 43,521 | |
| | | | | 162,000 | | | | 3.137 | | | 11/15/35(b)(d) | | | 133,049 | |
| | | | | 100,000 | | | | 3.500 | | | 02/15/41(b)(d) | | | 79,364 | |
| | Intel Corp. | |
| | | | | 175,000 | | | | 5.200 | | | 02/10/33(b) | | | 182,845 | |
| | | | | 75,000 | | | | 3.050 | | | 08/12/51(b) | | | 53,055 | |
| | Micron Technology, Inc. | |
| | | | | 50,000 | | | | 2.703 | | | 04/15/32(b) | | | 41,969 | |
| | | | | | | | | | | | | | | | |
| | | | | 712,778 | |
| | | |
| | Software – 1.5% | |
| | Adobe, Inc. | |
| | | | | 50,000 | | | | 2.150 | | | 02/01/27(b) | | | 46,904 | |
| | | | | 75,000 | | | | 2.300 | | | 02/01/30(b) | | | 67,281 | |
| | Black Knight InfoServ LLC | |
| | | | | 75,000 | | | | 3.625 | | | 09/01/28(b)(d) | | | 71,428 | |
| | Fiserv, Inc. | |
| | | | | 25,000 | | | | 4.200 | | | 10/01/28(b) | | | 24,473 | |
| | Intuit, Inc. | |
| | | | | 25,000 | | | | 1.350 | | | 07/15/27(b) | | | 22,560 | |
| | Oracle Corp. | |
| | | | | 150,000 | | | | 4.500 | | | 05/06/28(b) | | | 150,042 | |
| | | | | 34,000 | | | | 2.950 | | | 04/01/30(b) | | | 30,687 | |
| | | | | 175,000 | | | | 4.650 | | | 05/06/30(b) | | | 174,135 | |
| | | | | 275,000 | | | | 2.875 | | | 03/25/31(b) | | | 243,534 | |
| | | | | 250,000 | | | | 6.250 | | | 11/09/32(b) | | | 271,858 | |
| | | | | 157,000 | | | | 4.900 | | | 02/06/33(b) | | | 156,258 | |
| | | | | 225,000 | | | | 6.900 | | | 11/09/52(b) | | | 263,719 | |
| | | | | 50,000 | | | | 3.850 | | | 04/01/60(b) | | | 36,384 | |
| | Roper Technologies, Inc. | |
| | | | | 50,000 | | | | 4.200 | | | 09/15/28(b) | | | 49,160 | |
| | ServiceNow, Inc. | |
| | | | | 125,000 | | | | 1.400 | | | 09/01/30(b) | | | 102,806 | |
| | Take-Two Interactive Software, Inc. | |
| | | | | 85,000 | | | | 3.700 | | | 04/14/27(b) | | | 82,336 | |
| | VMware, Inc. | |
| | | | | 25,000 | | | | 1.800 | | | 08/15/28(b) | | | 21,940 | |
| | | | | 100,000 | | | | 2.200 | | | 08/15/31(b) | | | 82,761 | |
| | Workday, Inc. | |
| | | | | 75,000 | | | | 3.500 | | | 04/01/27(b) | | | 72,526 | |
| | | | | 25,000 | | | | 3.800 | | | 04/01/32(b) | | | 23,296 | |
| | | | | | | | | | | | | | | | |
| | | | | 1,994,088 | |
| | | |
| | Telecommunications – 1.9% | |
| | AT&T, Inc. | |
| | | | | 288,000 | | | | 2.300 | | | 06/01/27(b) | | | 267,451 | |
| | |
| 14 | | The accompanying notes are an integral part of these financial statements. |
GOLDMAN SACHS VARIABLE INSURANCE TRUST CORE FIXED INCOME FUND
| | | | | | | | | | | | | | | | |
| | | Principal Amount | | | Interest Rate | | | Maturity Date | | Value | |
| |
| | Corporate Bonds – (continued) | |
| |
| | Telecommunications – (continued) | |
| | AT&T, Inc. – (continued) | |
| | | | | $150,000 | | | | 4.350 | % | | 03/01/29(b) | | $ | 148,088 | |
| | | | | 50,000 | | | | 2.750 | | | 06/01/31(b) | | | 43,806 | |
| | | | | 478,000 | | | | 2.550 | | | 12/01/33(b) | | | 389,976 | |
| | | | | 25,000 | | | | 4.900 | | | 08/15/37(b) | | | 24,202 | |
| | | | | 60,000 | | | | 4.850 | | | 03/01/39(b) | | | 57,382 | |
| | | | | 75,000 | | | | 3.500 | | | 06/01/41(b) | | | 59,608 | |
| | | | | 25,000 | | | | 4.350 | | | 06/15/45(b) | | | 21,629 | |
| | | | | 25,000 | | | | 5.150 | | | 11/15/46(b) | | | 24,087 | |
| | | | | 25,000 | | | | 4.500 | | | 03/09/48(b) | | | 21,901 | |
| | | | | 25,000 | | | | 3.650 | | | 06/01/51(b) | | | 18,870 | |
| | T-Mobile USA, Inc. | |
| | | | | 49,000 | | | | 3.500 | | | 04/15/25(b) | | | 47,986 | |
| | | | | 75,000 | | | | 1.500 | | | 02/15/26(b) | | | 69,862 | |
| | | | | 153,000 | | | | 3.750 | | | 04/15/27(b) | | | 148,471 | |
| | | | | 25,000 | | | | 4.750 | | | 02/01/28(b) | | | 24,903 | |
| | | | | 175,000 | | | | 2.050 | | | 02/15/28(b) | | | 157,945 | |
| | | | | 83,000 | | | | 3.875 | | | 04/15/30(b) | | | 78,799 | |
| | | | | 75,000 | | | | 2.875 | | | 02/15/31(b) | | | 66,049 | |
| | | | | 75,000 | | | | 3.500 | | | 04/15/31(b) | | | 68,603 | |
| | | | | 500,000 | | | | 5.200 | | | 01/15/33(b) | | | 512,275 | |
| | | | | 25,000 | | | | 3.000 | | | 02/15/41(b) | | | 18,740 | |
| | Verizon Communications, Inc. | |
| | | | | 108,000 | | | | 4.329 | | | 09/21/28 | | | 106,892 | |
| | | | | 200,000 | | | | 2.550 | | | 03/21/31(b) | | | 172,484 | |
| | | | | | | | | | | | | | | | |
| | | | | 2,550,009 | |
| | | |
| | Transportation – 0.4% | |
| | Burlington Northern Santa Fe LLC | |
| | | | | 25,000 | | | | 4.050 | | | 06/15/48(b) | | | 21,697 | |
| | CSX Corp. | |
| | | | | 175,000 | | | | 3.800 | | | 03/01/28(b) | | | 171,961 | |
| | | | | 100,000 | | | | 4.100 | | | 11/15/32(b) | | | 97,203 | |
| | FedEx Corp. | |
| | | | | 45,000 | | | | 3.400 | | | 02/15/28(b) | | | 43,172 | |
| | | | | 75,000 | | | | 5.250 | | | 05/15/50(b) | | | 74,859 | |
| | Union Pacific Corp. | |
| | | | | 125,000 | | | | 2.800 | | | 02/14/32(b) | | | 110,948 | |
| | | | | | | | | | | | | | | | |
| | | | | 519,840 | |
| | | |
| | TOTAL CORPORATE BONDS (Cost $36,668,902) | | | 35,184,449 | |
| | | |
| | | | | | | | | | | | | | | | |
| |
| | Asset- Backed Securities – 9.1% | |
| |
| | Collateralized Debt Obligations – 0.2% | |
| | Arbor Realty Commercial Real Estate Notes Ltd., Series 2022- FL1, Class A (SOFR + 1.450%) | |
| | | | | 250,000 | | | | 6.788 | | | 01/15/37(b)(c)(d) | | | 248,444 | |
| | | |
| | Collateralized Loan Obligations – 4.7% | |
| | Allegro CLO VIII Ltd., Series 2018-2A, Class A (TSFR3M + 1.362%) | |
| | | | | 380,680 | | | | 6.755 | | | 07/15/31(b)(c)(d) | | | 380,668 | |
| | AMMC CLO XI Ltd., Series 2012-11A, Class A1R2 (TSFR3M + 1.272%) | |
| | | | | 386,425 | | | | 6.662 | | | 04/30/31(b)(c)(d) | | | 385,846 | |
| | Cathedral Lake VIII Ltd., Series 2021-8A, Class C (TSFR3M + 2.882%) | |
| | | | | 200,000 | | | | 8.294 | | | 01/20/35(b)(c)(d) | | | 199,002 | |
| | | | | | | | | | | | | | | | |
| | | Principal Amount | | | Interest Rate | | | Maturity Date | | Value | |
| |
| | Asset- Backed Securities – (continued) | |
| |
| | Collateralized Loan Obligations – (continued) | |
| | CBAM Ltd., Series 2018-5A, Class A (TSFR3M + 1.282%) | |
| | | | | $499,936 | | | | 6.684 | % | | 04/17/31(b)(c)(d) | | $ | 499,404 | |
| | Cedar Funding IX CLO Ltd., Series 2018-9A, Class A1 (TSFR3M +1.242%) | |
| | | | | 245,907 | | | | 6.657 | | | 04/20/31(b)(c)(d) | | | 245,859 | |
| | CFIP CLO Ltd., Series 2021-1A, Class A (TSFR3M + 1.482%) | |
| | | | | 700,000 | | | | 6.897 | | | 01/20/35(b)(c)(d) | | | 699,188 | |
| | CFIP CLO Ltd., Series 2021-1A, Class C1 (TSFR3M + 2.662%) | |
| | | | | 300,000 | | | | 8.077 | | | 01/20/35(b)(c)(d) | | | 297,609 | |
| | Crown City CLO I, Series 2020-1A, Class A1AR (TSFR3M + 1.452%) | |
| | | | | 250,000 | | | | 6.867 | | | 07/20/34(b)(c)(d) | | | 249,108 | |
| | Diameter Capital CLO 1 Ltd., Series 2021-1A, Class A1A (TSFR3M + 1.502%) | |
| | | | | 425,000 | | | | 6.895 | | | 07/15/36(b)(c)(d) | | | 424,249 | |
| | HalseyPoint CLO Ltd., Series 2020-3A, Class A1A (TSFR3M + 1.712%) | |
| | | | | 250,000 | | | | 7.102 | | | 11/30/32(b)(c)(d) | | | 250,098 | |
| | Hayfin US XII Ltd., Series 2018-8A, Class A (TSFR3M + 1.382%) | |
| | | | | 237,690 | | | | 6.797 | | | 04/20/31(b)(c)(d) | | | 237,679 | |
| | Jamestown CLO XV Ltd., Series 2020-15A, Class A (TSFR3M + 1.602%) | |
| | | | | 300,000 | | | | 6.995 | | | 04/15/33(b)(c)(d) | | | 298,852 | |
| | JP Morgan Mortgage Trust, Series 2023-HE3, Class A1 (SOFR + 1.600%) | |
| | | | | 140,000 | | | | 6.937 | | | 05/25/54(b)(c)(d) | | | 140,000 | |
| | Marble Point CLO XVII Ltd., Series 2020-1A, Class A (TSFR3M +1.562%) | |
| | | | | 500,000 | | | | 6.977 | | | 04/20/33(b)(c)(d) | | | 499,502 | |
| | OCP CLO Ltd., Series 2019-16A, Class AR (TSFR3M + 1.262%) | |
| | | | | 250,000 | | | | 6.668 | | | 04/10/33(b)(c)(d) | | | 249,504 | |
| | Pikes Peak CLO 12 Ltd., Series 2023-12A, Class A (TSFR3M + 2.100%) | |
| | | | | 350,000 | | | | 7.516 | | | 04/20/36(b)(c)(d) | | | 351,970 | |
| | Post CLO Ltd., Series 2018-1A, Class A (TSFR3M + 1.312%) | |
| | | | | 394,044 | | | | 6.705 | | | 04/16/31(b)(c)(d) | | | 394,034 | |
| | Southwick Park CLO LLC, Series 2019-4A, Class A1R (TSFR3M +1.322%) | |
| | | | | 250,000 | | | | 6.737 | | | 07/20/32(b)(c)(d) | | | 249,271 | |
| | Venture CLO Ltd., Series 2020-39A, Class A1 (TSFR3M + 1.542%) | |
| | | | | 275,000 | | | | 6.935 | | | 04/15/33(b)(c)(d) | | | 273,009 | |
| | | | | | | | | | | | | | | | |
| | | | | 6,324,852 | |
| | | |
| | Diversified Financial Services – 4.2% | |
| | Bank of America Auto Trust, Series 2023-2A, Class A2 | |
| | | | | 225,000 | | | | 5.850 | | | 08/17/26(b)(d) | | | 226,318 | |
| | Barclays Dryrock Issuance Trust, Series 2023-1, Class A | |
| | | | | 600,000 | | | | 4.720 | | | 02/15/29 | | | 599,879 | |
| | Barclays Dryrock Issuance Trust, Series 2023-2, Class A (SOFR +0.900%) | |
| | | | | 300,000 | | | | 6.227 | | | 08/15/28(c) | | | 300,674 | |
| | Benefit Street Partners CLO Xxx Ltd., Series 2023-30A, Class A | |
| | (TSFR3M + 2.100%) | |
| | | | | 350,000 | | | | 7.478 | | | 04/25/36(b)(c)(d) | | | 351,761 | |
| | Capital One Multi-Asset Execution Trust, Series 2022-A3, Class A | |
| | | | | 300,000 | | | | 4.950 | | | 10/15/27 | | | 300,770 | |
| | |
| The accompanying notes are an integral part of these financial statements. | | 15 |
GOLDMAN SACHS VARIABLE INSURANCE TRUST CORE FIXED INCOME FUND
|
Schedule of Investments (continued) December 31, 2023 |
| | | | | | | | | | | | | | | | |
| | | Principal Amount | | | Interest Rate | | | Maturity Date | | Value | |
| |
| | Asset- Backed Securities – (continued) | |
| |
| | Diversified Financial Services – (continued) | |
| | Citibank Credit Card Issuance Trust, Series 2023-A1, Class A1 | |
| | | | | $275,000 | | | | 5.230 | % | | 12/08/27 | | $ | 277,111 | |
| | Discover Card Execution Note Trust, Series 2023-A1, Class A | |
| | | | | 300,000 | | | | 4.310 | | | 03/15/28 | | | 295,463 | |
| | Ford Credit Auto Owner Trust, Series 2023-C, Class A2A | |
| | | | | 450,000 | | | | 5.680 | | | 09/15/26(b) | | | 452,386 | |
| | GM Financial Consumer Automobile Receivables Trust, Series 2023-4, Class A2A | |
| | | | | 325,000 | | | | 5.890 | | | 11/16/26(b) | | | 326,651 | |
| | HalseyPoint CLO Ltd., Series 2023-7A, Class A (TSFR3M + 2.250%) | |
| | | | | 600,000 | | | | 7.509 | | | 07/20/36(b)(c)(d) | | | 604,439 | |
| | Honda Auto Receivables Owner Trust, Series 2023-4, Class A3 | |
| | | | | 525,000 | | | | 5.670 | | | 06/21/28(b) | | | 536,140 | |
| | Hyundai Auto Lease Securitization Trust, Series 2022-A, Class A4 | |
| | | | | 300,000 | | | | 1.320 | | | 12/15/25(b)(d) | | | 295,498 | |
| | Hyundai Auto Receivables Trust, Series 2023-A, Class A2A | |
| | | | | 242,469 | | | | 5.190 | | | 12/15/25(b) | | | 242,126 | |
| | Nissan Auto Receivables Owner Trust, Series 2023-A, Class A2A | |
| | | | | 290,684 | | | | 5.340 | | | 02/17/26(b) | | | 290,136 | |
| | Santander Drive Auto Receivables Trust, Series 2023-6, Class A2 | |
| | | | | 400,000 | | | | 6.080 | | | 05/17/27(b) | | | 401,375 | |
| | World Omni Auto Receivables Trust, Series 2023-B, Class A2A | |
| | | | | 257,443 | | | | 5.250 | | | 11/16/26(b) | | | 257,104 | |
| | | | | | | | | | | | | | | | |
| | | | | 5,757,831 | |
| | | |
| | TOTAL ASSET- BACKED SECURITIES (Cost $12,305,322) | | | 12,331,127 | |
| | | |
| | | | | | | | | | | | | | | | |
| |
| | Foreign Bonds – 4.6% | |
| | Agriculture – 0.1% | |
| | BAT Capital Corp. (United Kingdom) | |
| | | | | 25,000 | | | | 3.222 | | | 08/15/24(b) | | | 24,603 | |
| | | | | 100,000 | | | | 2.259 | | | 03/25/28(b) | | | 89,456 | |
| | | | | 25,000 | | | | 4.540 | | | 08/15/47(b) | | | 19,228 | |
| | | | | | | | | | | | | | | | |
| | | | | 133,287 | |
| | | |
| | Banks – 2.2% | |
| | Banco Santander SA (Spain) | |
| | | | | 200,000 | | | | 2.746 | | | 05/28/25 | | | 193,059 | |
| | | | | 400,000 | | | | 6.921 | | | 08/08/33 | | | 426,699 | |
| | Barclays PLC (United Kingdom) | |
| | (SOFR + 2.714%) | |
| | | | | 200,000 | | | | 2.852 | | | 05/07/26(b)(c) | | | 193,061 | |
| | BNP Paribas SA (France) | |
| | | | | 200,000 | | | | 3.375 | | | 01/09/25(d) | | | 195,817 | |
| | (SOFR + 1.004%) | |
| | | | | 200,000 | | | | 1.323 | | | 01/13/27(b)(c)(d) | | | 184,464 | |
| | BPCE SA (France) | |
| | (SOFR + 1.730%) | |
| | | | | 250,000 | | | | 3.116 | | | 10/19/32(b)(c)(d) | | | 203,649 | |
| | Credit Suisse AG (Switzerland) | |
| | | | | 250,000 | | | | 1.250 | | | 08/07/26 | | | 226,772 | |
| | HSBC Holdings PLC (United Kingdom) | |
| | (SOFR + 1.538%) | |
| | | | | 200,000 | | | | 1.645 | | | 04/18/26(b)(c) | | | 190,084 | |
| | | | | | | | | | | | | | | | |
| | | Principal Amount | | | Interest Rate | | | Maturity Date | | Value | |
| |
| | Foreign Bonds – (continued) | |
| |
| | Banks – (continued) | |
| | ING Groep NV (Netherlands) | |
| | (US 1 Year CMT T-Note + 1.100%) | |
| | | | | $200,000 | | | | 1.400 | % | | 07/01/26(b)(c)(d) | | $ | 188,170 | |
| | Macquarie Group Ltd. (Australia) | |
| | (SOFR + 1.069%) | |
| | | | | 50,000 | | | | 1.340 | | | 01/12/27(b)(c)(d) | | | 45,931 | |
| | Toronto-Dominion Bank (The) (Canada) | |
| | | | | 175,000 | | | | 4.456 | | | 06/08/32 | | | 170,051 | |
| | UBS Group AG (Switzerland) | |
| | | | | 250,000 | | | | 4.550 | | | 04/17/26 | | | 246,622 | |
| | (US 1 Year CMT T-Note + 1.100%) | |
| | | | | 200,000 | | | | 2.746 | | | 02/11/33(b)(c)(d) | | | 163,762 | |
| | (SOFR + 5.020%) | |
| | | | | 250,000 | | | | 9.016 | | | 11/15/33(b)(c)(d) | | | 307,491 | |
| | Westpac Banking Corp. (Australia) | |
| | (US 5 Year CMT T-Note + 2.000%) | |
| | | | | 25,000 | | | | 4.110 | | | 07/24/34(b)(c) | | | 22,916 | |
| | Westpac Banking Corp., GMTN (Australia) | |
| | (USISOA05 + 2.236%) | |
| | | | | 25,000 | | | | 4.322 | | | 11/23/31(b)(c) | | | 24,046 | |
| | | | | | | | | | | | | | | | |
| | | | | 2,982,594 | |
| | | |
| | Beverages – 0.7% | |
| | Anheuser-Busch Cos. LLC / Anheuser-Busch InBev Worldwide, Inc. (Belgium) | |
| | | | | 335,000 | | | | 4.700 | | | 02/01/36(b) | | | 334,343 | |
| | | | | 70,000 | | | | 4.900 | | | 02/01/46(b) | | | 69,063 | |
| | Anheuser-Busch InBev Worldwide, Inc. (Belgium) | |
| | | | | 175,000 | | | | 4.750 | | | 01/23/29(b) | | | 177,930 | |
| | | | | 25,000 | | | | 8.200 | | | 01/15/39 | | | 33,395 | |
| | | | | 40,000 | | | | 5.450 | | | 01/23/39(b) | | | 42,203 | |
| | | | | 25,000 | | | | 4.950 | | | 01/15/42 | | | 25,053 | |
| | | | | 100,000 | | | | 4.600 | | | 04/15/48(b) | | | 94,874 | |
| | JDE Peet’s NV (Netherlands) | |
| | | | | 150,000 | | | | 1.375 | | | 01/15/27(b)(d) | | | 134,810 | |
| | | | | | | | | | | | | | | | |
| | | | | 911,671 | |
| | | |
| | Biotechnology – 0.0% | |
| | CSL Finance PLC (Australia) | |
| | | | | 25,000 | | | | 3.850 | | | 04/27/27(b)(d) | | | 24,334 | |
| | | |
| | Coal – 0.0% | |
| | Teck Resources Ltd. (Canada) | |
| | | | | 18,000 | | | | 3.900 | | | 07/15/30(b) | | | 16,739 | |
| | | |
| | Commercial Services – 0.2% | |
| | DP World Crescent Ltd., EMTN (United Arab Emirates) | |
| | | | | 200,000 | | | | 3.875 | | | 07/18/29 | | | 189,224 | |
| | | |
| | Diversified Financial Services – 0.4% | |
| | AerCap Ireland Capital DAC / AerCap Global Aviation Trust (Ireland) | |
| | | | | 250,000 | | | | 2.450 | | | 10/29/26(b) | | | 231,577 | |
| | | | | 225,000 | | | | 3.000 | | | 10/29/28(b) | | | 205,403 | |
| | Avolon Holdings Funding Ltd. (Ireland) | |
| | | | | 25,000 | | | | 3.950 | | | 07/01/24(b)(d) | | | 24,682 | |
| | | | | 100,000 | | | | 2.875 | | | 02/15/25(b)(d) | | | 96,568 | |
| | |
| 16 | | The accompanying notes are an integral part of these financial statements. |
GOLDMAN SACHS VARIABLE INSURANCE TRUST CORE FIXED INCOME FUND
| | | | | | | | | | | | | | | | |
| | | Principal Amount | | | Interest Rate | | | Maturity Date | | Value | |
| |
| | Foreign Bonds – (continued) | |
| |
| | Diversified Financial Services – (continued) | |
| | Avolon Holdings Funding Ltd. (Ireland) – (continued) | |
| | | | | $25,000 | | | | 4.250 | % | | 04/15/26(b)(d) | | $ | 24,179 | |
| | | | | | | | | | | | | | | | |
| | | | | 582,409 | |
| | | |
| | Machinery-Construction & Mining – 0.1% | |
| | Weir Group PLC (The) (United Kingdom) | |
| | | | | 200,000 | | | | 2.200 | | | 05/13/26(b)(d) | | | 185,736 | |
| | | |
| | Mining – 0.2% | |
| | Glencore Funding LLC (Australia) | |
| | | | | 75,000 | | | | 4.125 | | | 03/12/24(b)(d) | | | 74,667 | |
| | | | | 25,000 | | | | 4.625 | | | 04/29/24(d) | | | 24,886 | |
| | | | | 75,000 | | | | 1.625 | | | 04/27/26(b)(d) | | | 69,465 | |
| | | | | 150,000 | | | | 2.625 | | | 09/23/31(b)(d) | | | 127,416 | |
| | | | | | | | | | | | | | | | |
| | | | | 296,434 | |
| | | |
| | Oil & Gas – 0.2% | |
| | Saudi Arabian Oil Co. (Saudi Arabia) | |
| | | | | 220,000 | | | | 3.500 | | | 04/16/29 | | | 207,831 | |
| | | |
| | Pipelines – 0.3% | |
| | Enbridge, Inc. (Canada) | |
| | | | | 111,000 | | | | 5.700 | | | 03/08/33(b) | | | 115,373 | |
| | | | | 125,000 | | | | 2.500 | | | 08/01/33(b) | | | 102,325 | |
| | Galaxy Pipeline Assets Bidco Ltd. (United Arab Emirates) | |
| | | | | 186,624 | | | | 2.940 | | | 09/30/40 | | | 153,498 | |
| | | | | | | | | | | | | | | | |
| | | | | 371,196 | |
| | | |
| | Semiconductors – 0.2% | |
| | NXP BV / NXP Funding LLC / NXP USA, Inc. (China) | |
| | | | | 25,000 | | | | 3.400 | | | 05/01/30(b) | | | 22,970 | |
| | | | | 125,000 | | | | 2.500 | | | 05/11/31(b) | | | 106,317 | |
| | | | | 125,000 | | | | 2.650 | | | 02/15/32(b) | | | 105,363 | |
| | | | | | | | | | | | | | | | |
| | | | | 234,650 | |
| | | |
| | Transportation – 0.0% | |
| | Canadian Pacific Railway Co. (Canada) | |
| | | | | 25,000 | | | | 2.050 | | | 03/05/30(b) | | | 21,426 | |
| | | |
| | TOTAL FOREIGN BONDS (Cost $6,489,284) | | | 6,157,531 | |
| | | |
| | | | | | | | | | | | | | | | |
| |
| | Commercial Mortgage-Backed Securities – 3.1% | |
| |
| | 3650R Commercial Mortgage Trust, Series 2021-PF1, Class AS | |
| | | | | 150,000 | | | | 2.778 | | | 11/15/54(c) | | | 121,179 | |
| | BANK, Series 2019-BN21, Class A5 | |
| | | | | 150,000 | | | | 2.851 | | | 10/17/52(b) | | | 132,620 | |
| | BANK, Series 2021-BN32, Class A5 | |
| | | | | 150,000 | | | | 2.643 | | | 04/15/54(b) | | | 128,485 | |
| | BANK, Series 2022-BNK43, Class A5 | |
| | | | | 200,000 | | | | 4.399 | | | 08/15/55(b) | | | 190,802 | |
| | BANK, Series 2023-BNK46, Class A4 | |
| | | | | 200,000 | | | | 5.745 | | | 08/15/56(b) | | | 210,947 | |
| | BANK5, Series 2023-5YR2, Class A3 | |
| | | | | 250,000 | | | | 6.656 | | | 07/15/56(b)(c) | | | 264,986 | |
| | BANK5, Series 2023-5YR3, Class A3 | |
| | | | | 200,000 | | | | 6.724 | | | 09/15/56(b)(c) | | | 213,088 | |
| | BBCMS Mortgage Trust, Series 2023-C21, Class AS | |
| | | | | 175,000 | | | | 6.296 | | | 09/15/56(b)(c) | | | 181,423 | |
| | Benchmark Mortgage Trust, Series 2021-B31, Class A5 | |
| | | | | 250,000 | | | | 2.669 | | | 12/15/54(b) | | | 210,935 | |
| | | | | | | | | | | | | | | | |
| | | Principal Amount | | | Interest Rate | | | Maturity Date | | Value | |
| |
| | Commercial Mortgage-Backed Securities – (continued) | |
| |
| | BMO Mortgage Trust, Series 2023-C7, Class A5 | |
| | | | | $200,000 | | | | 6.160 | % | | 12/15/56(b) | | $ | 216,480 | |
| | BX Commercial Mortgage Trust, Series 2023-VLT2, Class A | |
| | | | | 250,000 | | | | 7.643 | | | 06/15/40(c)(d) | | | 249,394 | |
| | BX Trust, Series 2021-ARIA, Class C | |
| | | | | 50,000 | | | | 7.122 | | | 10/15/36(c)(d) | | | 48,320 | |
| | BX Trust, Series 2022-PSB, Class A | |
| | | | | 88,577 | | | | 7.813 | | | 08/15/39(c)(d) | | | 88,528 | |
| | Cantor Commercial Real Estate Lending, Series 2019-CF3, Class A4 | |
| | | | | 100,000 | | | | 3.006 | | | 01/15/53(b) | | | 88,787 | |
| | Citigroup Commercial Mortgage Trust, Series 2023-PRM3, Class A | |
| | | | | 200,000 | | | | 6.360 | | | 07/10/28(c)(d) | | | 205,404 | |
| | DOLP Trust, Series 2021-NYC, Class A | |
| | | | | 200,000 | | | | 2.956 | | | 05/10/41(d) | | | 164,707 | |
| | EQUS Mortgage Trust, Series 2021-EQAZ, Class A | |
| | | | | 199,996 | | | | 6.231 | | | 10/15/38(b)(c)(d) | | | 195,724 | |
| | Freddie Mac Multifamily Structured Pass Through Certificates, Series K-152, Class A2 | |
| | | | | 200,000 | | | | 3.780 | | | 11/25/32(b)(c) | | | 189,825 | |
| | Freddie Mac Multifamily Structured Pass Through Certificates, Series K-161, Class A2 | |
| | | | | 300,000 | | | | 4.900 | | | 10/25/33(b) | | | 309,079 | |
| | Freddie Mac Multifamily Structured Pass Through Certificates, Series K510, Class A2 | |
| | | | | 100,000 | | | | 5.069 | | | 10/25/28(b)(c) | | | 102,121 | |
| | Freddie Mac Multifamily Structured Pass Through Certificates, Series KF153, Class AS | |
| | | | | 200,000 | | | | 6.011 | | | 02/25/33(b)(c) | | | 199,518 | |
| | GS Mortgage Securities Trust, Series 2017-GS7, Class A4 | |
| | | | | 200,000 | | | | 3.430 | | | 08/10/50(b) | | | 184,342 | |
| | MSWF Commercial Mortgage Trust, Series 2023-2, Class A2 | |
| | | | | 325,000 | | | | 6.890 | | | 12/15/56(b) | | | 340,267 | |
| | | |
| | TOTAL COMMERCIAL MORTGAGE-BACKED SECURITIES (Cost $4,337,123) | | | 4,236,961 | |
| | | |
| | | | | | | | | | | | | | | | |
| |
| | U.S. Government Agency Securities – 2.3% | |
| |
| | Federal Farm Credit Banks Funding Corp. | |
| | | | | 460,000 | | | | 2.900 | | | 04/12/32 | | | 416,758 | |
| | | | | 230,000 | | | | 3.300 | | | 05/19/32 | | | 213,774 | |
| | | | | 130,000 | | | | 3.500 | | | 09/01/32 | | | 122,147 | |
| | | | | 600,000 | | | | 2.850 | | | 03/28/34 | | | 524,286 | |
| | | | | 340,000 | | | | 3.080 | | | 03/30/37 | | | 291,025 | |
| | Federal Home Loan Banks | |
| | | | | 250,000 | | | | 3.375 | | | 09/10/32 | | | 231,410 | |
| | | | | 430,000 | | | | 4.750 | | | 12/10/32 | | | 444,357 | |
| | Federal National Mortgage Association | |
| | | | | 400,000 | | | | 1.875 | | | 09/24/26 | | | 377,637 | |
| | | | | 400,000 | | | | 6.250 | | | 05/15/29 | | | 443,754 | |
| | | |
| | TOTAL U.S. GOVERNMENT AGENCY SECURITIES (Cost $3,318,808) | | | 3,065,148 | |
| | | |
| | | | | | | | | | | | | | | | |
| |
| | Foreign Government Securities – 1.1% | |
| |
| | Sovereign – 1.1% | |
| | Indonesia Government International Bond | |
| | | | | 200,000 | | | | 4.850 | | | 01/11/33(b) | | | 203,444 | |
| | |
| The accompanying notes are an integral part of these financial statements. | | 17 |
GOLDMAN SACHS VARIABLE INSURANCE TRUST CORE FIXED INCOME FUND
|
Schedule of Investments (continued) December 31, 2023 |
| | | | | | | | | | | | | | | | |
| | | Principal Amount | | | Interest Rate | | | Maturity Date | | Value | |
| |
| | Foreign Government Securities – (continued) | |
| |
| | Sovereign – (continued) | |
| | Indonesia Government International Bond – (continued) | |
| | | | | $200,000 | | | | 3.050 | % | | 03/12/51 | | $ | 152,312 | |
| | Israel Government AID Bond | |
| | | | | 100,000 | | | | 5.500 | | | 04/26/24(f) | | | 100,042 | |
| | Mexico Government International Bond | |
| | | | | 400,000 | | | | 3.250 | | | 04/16/30(b) | | | 361,500 | |
| | | | | 110,000 | | | | 1.450 | | | 10/25/33(b) | | | 94,406 | |
| | | | | 200,000 | | | | 4.280 | | | 08/14/41(b) | | | 165,572 | |
| | Panama Government International Bond | |
| | | | | 200,000 | | | | 6.875 | | | 01/31/36(b) | | | 199,428 | |
| | Peruvian Government International Bond | |
| | | | | 50,000 | | | | 3.230 | | | 07/28/21(b) | | | 31,078 | |
| | Romanian Government International Bond | |
| | | | | 40,000 | | | | 3.000 | | | 02/27/27(d) | | | 37,249 | |
| | | | | 10,000 | | | | 2.124 | | | 07/16/31(d) | | | 8,776 | |
| | | | | 30,000 | | | | 2.625 | | | 12/02/40(d) | | | 22,210 | |
| | | | | 10,000 | | | | 4.625 | | | 04/03/49(d) | | | 9,253 | |
| | Romanian Government International Bond, EMTN | |
| | | | | 50,000 | | | | 2.875 | | | 03/11/29 | | | 49,900 | |
| | | |
| | TOTAL FOREIGN GOVERNMENT SECURITIES (Cost $1,624,971) | | | 1,435,170 | |
| | | |
| | | | | | | | | | | | | | | | |
| |
| | Municipal Bonds – 0.9% | |
| |
| | Arizona – 0.0% | |
| | City of Tucson AZ, Series A | |
| | | | | 25,000 | | | | 1.932 | | | 07/01/31 | | | 20,553 | |
| | | |
| | California – 0.5% | |
| | California Health Facilities Financing Authority | |
| | | | | 125,000 | | | | 3.478 | | | 06/01/29 | | | 119,161 | |
| | | | | 100,000 | | | | 3.790 | | | 06/01/32 | | | 93,562 | |
| | California Statewide Communities Development Authority | |
| | | | | 50,000 | | | | 1.877 | | | 02/01/31 | | | 41,908 | |
| | Municipal Improvement Corp. of Los Angeles, Series A | |
| | | | | 35,000 | | | | 1.648 | | | 11/01/28 | | | 30,818 | |
| | | | | 80,000 | | | | 2.074 | | | 11/01/30 | | | 68,437 | |
| | Port of Oakland, Series R | |
| | | | | 80,000 | | | | 2.199 | | | 05/01/31 | | | 67,846 | |
| | San Francisco Municipal Transportation Agency, Series A | |
| | | | | 30,000 | | | | 1.302 | | | 03/01/28 | | | 26,340 | |
| | San Jose Financing Authority | |
| | | | | 25,000 | | | | 1.812 | | | 06/01/29 | | | 21,740 | |
| | | | | 25,000 | | | | 1.862 | | | 06/01/30 | | | 21,198 | |
| | State of California | |
| | | | | 105,000 | | | | 7.625 | | | 03/01/40 | | | 131,785 | |
| | | | | | | | | | | | | | | | |
| | | | | 622,795 | |
| | | |
| | Florida – 0.0% | |
| | State Board of Administration Finance Corp., Series A | |
| | | | | 70,000 | | | | 2.154 | | | 07/01/30 | | | 59,710 | |
| | | |
| | Illinois – 0.1% | |
| | Chicago O’Hare International Airport, Series D | |
| | | | | 85,000 | | | | 2.346 | | | 01/01/30 | | | 75,181 | |
| | State of Illinois GO Bonds | |
| | | | | 25,000 | | | | 5.100 | | | 06/01/33 | | | 24,736 | |
| | | | | 85,714 | | | | 7.350 | | | 07/01/35 | | | 93,100 | |
| | | | | | | | | | | | | | | | |
| | | | | 193,017 | |
| | | |
| | | | | | | | | | | | | | | | |
| | | Principal Amount | | | Interest Rate | | | Maturity Date | | Value | |
| |
| | Municipal Bonds – (continued) | |
| |
| | Louisiana – 0.1% | |
| | City of New Orleans LA Water System Revenue | |
| | | | | $25,000 | | | | 1.008 | % | | 12/01/26 | | $ | 22,479 | |
| | Louisiana Local Government Environmental Facilities & Community Development Auth, Series 2022-ELL, Class A3 | |
| | | | | 140,000 | | | | 4.275 | | | 02/01/36 | | | 135,971 | |
| | | | | | | | | | | | | | | | |
| | | | | 158,450 | |
| | | |
| | New York – 0.1% | |
| | City of New York NY, Series 2 | |
| | | | | 40,000 | | | | 1.940 | | | 03/01/29 | | | 35,397 | |
| | Metropolitan Transportation Authority, Series A2 | |
| | | | | 25,000 | | | | 5.989 | | | 11/15/30 | | | 26,595 | |
| | New York City Transitional Finance Authority Future Tax Secured Revenue, Series B2 | |
| | | | | 10,000 | | | | 3.590 | | | 08/01/27 | | | 9,753 | |
| | | | | | | | | | | | | | | | |
| | | | | 71,745 | |
| | | |
| | Ohio – 0.1% | |
| | American Municipal Power, Inc., Series E | |
| | | | | 95,000 | | | | 6.270 | | | 02/15/50 | | | 103,564 | |
| | | |
| | TOTAL MUNICIPAL BONDS (Cost $1,291,326) | | | 1,229,834 | |
| | | |
| | | | | | | | | | | | | | | | |
| |
| | Collateralized Mortgage Obligations – 0.5% | |
| |
| | Alternative Loan Trust, Series 2005-38, Class A1 (Federal Reserve US 12 mo. Cumulative Avg 1 yr. CMT + 1.500%) | |
| | | | | 37,699 | | | | 6.512 | | | 09/25/35(b)(c) | | | 33,531 | |
| | Angel Oak Mortgage Trust, Series 2021-6, Class A1 | |
| | | | | 68,222 | | | | 1.458 | | | 09/25/66(b)(c)(d) | | | 54,738 | |
| | Chase Home Lending Mortgage Trust, Series 2023-RPL2, Class A1 | |
| | | | | 147,777 | | | | 3.250 | | | 03/25/63(b)(c)(d) | | | 130,939 | |
| | Connecticut Avenue Securities Trust, Series 2021-R01, Class 1M2 (SOFR + 1.550%) | |
| | | | | 44,000 | | | | 6.887 | | | 10/25/41(b)(c)(d) | | | 44,009 | |
| | Connecticut Avenue Securities Trust, Series 2021-R03, Class 1M2 (SOFR + 1.650%) | |
| | | | | 42,000 | | | | 6.987 | | | 12/25/41(b)(c)(d) | | | 41,456 | |
| | Connecticut Avenue Securities Trust, Series 2022-R05, Class 2M1 (SOFR + 1.900%) | |
| | | | | 30,144 | | | | 7.237 | | | 04/25/42(b)(c)(d) | | | 30,327 | |
| | Connecticut Avenue Securities Trust, Series 2022-R05, Class 2M2 (SOFR + 3.000%) | |
| | | | | 36,000 | | | | 8.337 | | | 04/25/42(b)(c)(d) | | | 36,863 | |
| | Connecticut Avenue Securities Trust, Series 2023-R03, Class 2M2 (SOFR + 3.900%) | |
| | | | | 30,000 | | | | 9.237 | | | 04/25/43(b)(c)(d) | | | 32,116 | |
| | Connecticut Avenue Securities Trust, Series 2023-R08, Class 1M2 (SOFR + 2.500%) | |
| | | | | 50,000 | | | | 7.837 | | | 10/25/43(b)(c)(d) | | | 51,102 | |
| | Federal Home Loan Mortgage Corporation, Series 2020-DNA5, Class M2 (SOFR + 2.800%) | |
| | | | | 9,309 | | | | 8.137 | | | 10/25/50(b)(c)(d) | | | 9,444 | |
| | Federal Home Loan Mortgage Corporation, Series 2021-DNA5, Class M2 (SOFR + 1.650%) | |
| | | | | 18,721 | | | | 6.987 | | | 01/25/34(b)(c)(d) | | | 18,796 | |
| | |
| 18 | | The accompanying notes are an integral part of these financial statements. |
GOLDMAN SACHS VARIABLE INSURANCE TRUST CORE FIXED INCOME FUND
| | | | | | | | | | | | | | | | |
| | | Principal Amount | | | Interest Rate | | | Maturity Date | | Value | |
| |
| | Collateralized Mortgage Obligations – (continued) | |
| |
| | Federal Home Loan Mortgage Corporation, Series 2022-DNA1, Class M1A (SOFR + 1.000%) | |
| | | | | $71,222 | | | | 6.337 | % | | 01/25/42(b)(c)(d) | | $ | 70,988 | |
| | Federal Home Loan Mortgage Corporation, Series 2022-DNA3, Class M1A (SOFR + 2.000%) | |
| | | | | 27,386 | | | | 7.337 | | | 04/25/42(b)(c)(d) | | | 27,648 | |
| | JP Morgan Mortgage Trust, Series 2021-6, Class A3 | |
| | | | | 89,276 | | | | 2.500 | | | 10/25/51(b)(c)(d) | | | 73,080 | |
| | JP Morgan Mortgage Trust, Series 2023-10, Class A6 | |
| | | | | 48,910 | | | | 6.000 | | | 05/25/54(b)(c)(d) | | | 48,846 | |
| | Wells Fargo Mortgage Backed Securities Trust, Series 2019-3, Class A1 | |
| | | | | 5,726 | | | | 3.500 | | | 07/25/49(b)(c)(d) | | | 5,149 | |
| | | |
| | TOTAL COLLATERALIZED MORTGAGE OBLIGATIONS (Cost $724,480) | | | 709,032 | |
| | | |
| | | | | | | | | | | | | | | | |
| |
| | U.S. Treasury Obligations – 20.1% | |
| |
| | U.S. Treasury Bonds | |
| | | | | 1,640,000 | | | | 3.125 | (g) | | 11/15/41 | | | 1,427,569 | |
| | | | | 1,550,000 | | | | 2.750 | (g) | | 08/15/42 | | | 1,258,648 | |
| | | | | 2,310,000 | | | | 2.750 | (g) | | 11/15/42 | | | 1,869,656 | |
| | | | | 220,000 | | | | 4.750 | (g) | | 11/15/43 | | | 236,397 | |
| | | | | 230,000 | | | | 3.000 | (g) | | 02/15/49 | | | 187,594 | |
| | | | | 230,000 | | | | 2.875 | (g) | | 05/15/49 | | | 183,245 | |
| | | | | 420,000 | | | | 2.250 | (g) | | 08/15/49 | | | 294,000 | |
| | | | | 2,930,000 | | | | 2.375 | (g) | | 11/15/49 | | | 2,106,853 | |
| | | | | 610,000 | | | | 2.000 | (g) | | 02/15/50 | | | 402,314 | |
| | | | | 480,000 | | | | 2.375 | (g) | | 05/15/51 | | | 343,500 | |
| | | | | 170,000 | | | | 2.000 | (g) | | 08/15/51 | | | 111,323 | |
| | | | | 160,000 | | | | 2.250 | (g) | | 02/15/52 | | | 111,200 | |
| | | | | 1,630,000 | | | | 4.000 | (g) | | 11/15/52 | | | 1,611,917 | |
| | U.S. Treasury Inflation Indexed Bonds | |
| | | | | 393,330 | | | | 1.500 | | | 02/15/53 | | | 358,009 | |
| | U.S. Treasury Notes | |
| | | | | 620,000 | | | | 2.500 | (g) | | 05/31/24 | | | 612,977 | |
| | | | | 620,000 | | | | 3.000 | (g) | | 06/30/24 | | | 613,413 | |
| | | | | 1,250,000 | | | | 3.000 | (g) | | 07/31/24 | | | 1,235,010 | |
| | | | | 620,000 | | | | 4.250 | (g) | | 09/30/24 | | | 616,852 | |
| | | | | 620,000 | | | | 4.250 | (g) | | 12/31/24 | | | 616,827 | |
| | | | | 636,000 | | | | 0.375 | (g) | | 12/31/25 | | | 589,542 | |
| | | | | 4,050,000 | | | | 0.750 | (g) | | 03/31/26 | | | 3,758,906 | |
| | | | | 1,720,000 | | | | 0.625 | (g) | | 07/31/26 | | | 1,575,547 | |
| | | | | 620,000 | | | | 4.375 | (g) | | 08/15/26 | | | 624,311 | |
| | | | | 640,000 | | | | 0.750 | (g) | | 08/31/26 | | | 586,900 | |
| | | | | 640,000 | | | | 2.625 | (g) | | 05/31/27 | | | 612,750 | |
| | | | | 660,000 | | | | 0.500 | (g) | | 06/30/27 | | | 586,214 | |
| | | | | 140,000 | | | | 1.250 | (g) | | 03/31/28 | | | 125,573 | |
| | | | | 970,000 | | | | 2.875 | (g) | | 05/15/28 | | | 930,215 | |
| | | | | 1,180,000 | | | | 1.250 | (g) | | 06/30/28 | | | 1,052,413 | |
| | | | | 250,000 | | | | 3.125 | (g) | | 11/15/28 | | | 241,543 | |
| | | | | 1,160,000 | | | | 3.750 | (g) | | 12/31/28 | | | 1,154,965 | |
| | | | | 1,150,000 | | | | 3.750 | (g) | | 12/31/30 | | | 1,140,990 | |
| | | |
| | TOTAL U.S. TREASURY OBLIGATIONS (Cost $30,391,917) | | | 27,177,173 | |
| | | |
| | | | | | | | | | | | |
| | | Shares | | | Dividend Rate | | Value | |
| |
| | Investment Company – 0.7%(h) | |
| |
| | Goldman Sachs Financial Square Government Fund - Institutional Shares | |
| | | | | 896,009 | | | 5.248% | | $ | 896,009 | |
| | (Cost $896,009) | |
| | | |
| | TOTAL INVESTMENTS – 104.4% (Cost $147,304,229) | | $ | 140,833,222 | |
| | | |
| | LIABILITIES IN EXCESS OF OTHER ASSETS – (4.4)% | | | (5,931,838 | ) |
| | | |
| | NET ASSETS – 100.0% | | $ | 134,901,384 | |
| | | |
| | |
| The percentage shown for each investment category reflects the value of investments in that category as a percentage of net assets. |
| |
| (a) | | TBA (To Be Announced) Securities are purchased on a forward commitment basis with an approximate principal amount and no defined maturity date. The actual principal and maturity date will be determined upon settlement when the specific mortgage pools are assigned. Total market value of TBA securities (excluding forward sales contracts, if any) amounts to $17,845,909 which represents approximately 13.2% of the Fund’s net assets as of December 31, 2023. |
| |
| (b) | | Securities with “Call” features. Maturity dates disclosed are the final maturity date. |
| |
| (c) | | Variable or floating rate security. Except for floating rate notes (for which final maturity is disclosed), maturity date disclosed is the next interest reset date. Interest rate disclosed is that which is in effect on December 31, 2023. |
| |
| (d) | | Exempt from registration under Rule 144A of the Securities Act of 1933. |
| |
| (e) | | Step coupon. |
| |
| (f) | | Guaranteed by the United States Government. Total market value of $100,042, which represents 0.1% of net assets as of December 31, 2023. |
| |
| (g) | | Interest rates represent either the stated coupon rate, annualized yield on date of purchase for discounted securities, or, for floating rate securities, the current reset rate, which is based upon current interest rate indices. |
| |
| (h) | | Represents an affiliated issuer. |
| | |
|
| Investment Abbreviations: |
| BBSW | | —Bank Bill Swap Rate |
| CLO | | —Collateralized Loan Obligation |
| CMT | | —Constant Maturity Treasury Index |
| CORRA | | —Canadian Overnight Repo Rate Average |
| ESTRON | | —Euro Short-Term Rate |
| FHLMC | | —Federal Home Loan Mortgage Corp. |
| FNMA | | —Federal National Mortgage Association |
| GMTN | | —Global Medium Term Note |
| GNMA | | —Insured by Government National Mortgage Association |
| GO | | —General Obligation |
| LP | | —Limited Partnership |
| Mo. | | —Month |
| MTN | | —Medium Term Note |
| NIBOR | | —Norwegian Interbank Offered Rate |
| PLC | | —Public Limited Company |
| SOFR | | —Secured Overnight Financing Rate |
| SONIO | | —Sterling Overnight Index Average |
| STIBOR | | —Stockholm Interbank Offered Rate |
| TSFR | | —Term Secured Overnight Financing Rate |
|
| | |
| The accompanying notes are an integral part of these financial statements. | | 19 |
GOLDMAN SACHS VARIABLE INSURANCE TRUST CORE FIXED INCOME FUND
|
Schedule of Investments (continued) December 31, 2023 |
| | |
|
| Currency Abbreviations: |
| AUD | | Australian Dollar |
| CAD | | Canadian Dollar |
| CHF | | Swiss Franc |
| EUR | | Euro |
| GBP | | British Pound |
| | |
|
| Currency Abbreviations: (continued) |
| JPY | | Japanese Yen |
| NOK | | Norwegian Krone |
| NZD | | New Zealand Dollar |
| SEK | | Swedish Krona |
| USD | | United States Dollar |
|
|
|
ADDITIONAL INVESTMENT INFORMATION |
FORWARD FOREIGN CURRENCY EXCHANGE CONTRACTS — At December 31, 2023, the Fund had the following forward foreign currency exchange contracts:
FORWARD FOREIGN CURRENCY EXCHANGE CONTRACTS WITH UNREALIZED GAIN
| | | | | | | | | | | | | | | | | | |
| Counterparty | | Currency Purchased | | | Currency Sold | | | Settlement Date | | Unrealized Gain | |
Morgan Stanley Co., Inc. | | | | | | | | | | | | | | | | | | |
| | GBP | | | 274,786 | | | USD | | | 334,125 | | | 1/10/2024 | | $ | 16,146 | |
| | SEK | | | 2,464,352 | | | USD | | | 227,856 | | | 1/30/2024 | | | 16,765 | |
| | CAD | | | 330,474 | | | USD | | | 241,552 | | | 2/9/2024 | | | 7,985 | |
| | EUR | | | 845,718 | | | USD | | | 917,918 | | | 2/14/2024 | | | 17,336 | |
| | AUD | | | 123,850 | | | USD | | | 83,375 | | | 3/20/2024 | | | 1,220 | |
| | CAD | | | 180,894 | | | USD | | | 134,611 | | | 3/20/2024 | | | 2,052 | |
| | CHF | | | 242,933 | | | USD | | | 278,755 | | | 3/20/2024 | | | 12,408 | |
| | EUR | | | 120,301 | | | USD | | | 132,020 | | | 3/20/2024 | | | 1,201 | |
| | GBP | | | 93,852 | | | USD | | | 118,928 | | | 3/20/2024 | | | 746 | |
| | NOK | | | 991,643 | | | USD | | | 94,097 | | | 3/20/2024 | | | 3,675 | |
| | NZD | | | 155,689 | | | USD | | | 96,711 | | | 3/20/2024 | | | 1,728 | |
| | SEK | | | 1,056,856 | | | USD | | | 103,245 | | | 3/20/2024 | | | 1,860 | |
| | | JPY | | | 28,164,635 | | | USD | | | 195,761 | | | 3/21/2024 | | | 6,459 | |
| | | | | | |
TOTAL | | | | | | | | | | | | | | | | $ | 89,581 | |
|
| FORWARD FOREIGN CURRENCY EXCHANGE CONTRACTS WITH UNREALIZED LOSS | |
| Counterparty | | Currency Purchased | | | Currency Sold | | | Settlement Date | | Unrealized Loss | |
Morgan Stanley Co., Inc. | | | | | | | | | | | | | | | | | | |
| | USD | | | 369,797 | | | GBP | | | 304,123 | | | 1/10/2024 | | | (17,870 | ) |
| | USD | | | 238,640 | | | SEK | | | 2,579,932 | | | 1/30/2024 | | | (17,454 | ) |
| | USD | | | 237,949 | | | CAD | | | 325,544 | | | 2/9/2024 | | | (7,866 | ) |
| | USD | | | 106,565 | | | AUD | | | 163,644 | | | 2/12/2024 | | | (5,100 | ) |
| | USD | | | 116,878 | | | JPY | | | 17,133,736 | | | 2/13/2024 | | | (5,433 | ) |
| | USD | | | 1,119,802 | | | EUR | | | 1,031,723 | | | 2/14/2024 | | | (21,149 | ) |
| | USD | | | 83,123 | | | AUD | | | 126,242 | | | 3/20/2024 | | | (3,106 | ) |
| | USD | | | 119,717 | | | CAD | | | 162,213 | | | 3/20/2024 | | | (2,833 | ) |
| | USD | | | 287,526 | | | CHF | | | 248,026 | | | 3/20/2024 | | | (9,742 | ) |
| | USD | | | 119,845 | | | EUR | | | 111,010 | | | 3/20/2024 | | | (3,086 | ) |
| | USD | | | 111,994 | | | GBP | | | 89,011 | | | 3/20/2024 | | | (1,507 | ) |
| | USD | | | 74,509 | | | NOK | | | 816,049 | | | 3/20/2024 | | | (5,950 | ) |
| | USD | | | 85,918 | | | NZD | | | 140,214 | | | 3/20/2024 | | | (2,736 | ) |
| | USD | | | 93,648 | | | SEK | | | 979,224 | | | 3/20/2024 | | | (3,736 | ) |
| | | USD | | | 244,391 | | | JPY | | | 34,122,409 | | | 3/21/2024 | | | (605 | ) |
| | | | | | |
TOTAL | | | | | | | | | | | | | | | | $ | (108,173 | ) |
FORWARD SALES CONTRACTS — At December 31, 2023, the Fund had the following forward sales contracts:
| | | | | | | | | | | | | | |
| | | Interest | | | | | | Principal | | | | |
| Description | | Rate | | Maturity Date (a) | | Settlement Date | | Amount | | | Value | |
Federal National Mortgage Association | | 3.000% | | TBA-30yr | | 01/15/54 | | $ | (3,000,000 | ) | | $ | (2,651,037 | ) |
Federal National Mortgage Association | | 4.500 | | TBA-30yr | | 01/15/54 | | | (3,000,000 | ) | | | (2,910,467 | ) |
Federal National Mortgage Association | | 5.000 | | TBA-30yr | | 01/15/54 | | | (2,000,000 | ) | | | (1,979,364 | ) |
Federal National Mortgage Association | | 5.500 | | TBA-30yr | | 01/15/54 | | | (3,000,000 | ) | | | (3,014,310 | ) |
| | |
| 20 | | The accompanying notes are an integral part of these financial statements. |
GOLDMAN SACHS VARIABLE INSURANCE TRUST CORE FIXED INCOME FUND
|
|
ADDITIONAL INVESTMENT INFORMATION (continued) |
| | | | | | | | | | | | | | |
| | | Interest | | | | | | Principal | | | | |
| Description | | Rate | | Maturity Date (a) | | Settlement Date | | Amount | | | Value | |
Government National Mortgage Association | | 6.500% | | TBA-30yr | | 01/15/54 | | $ | (1,000,000 | ) | | $ | (1,023,468 | ) |
| | | | | |
Total (Proceed Receivable $11,494,580) | | | | | | | | | | | | $ | (11,578,646 | ) |
| | (a) | TBA (To Be Announced) Securities are purchased on a forward commitment basis with an approximate principal amount and no defined maturity date. The actual principal and maturity date will be determined upon settlement when the specific mortgage pools are assigned. |
FUTURES CONTRACTS — At December 31, 2023, the Fund had the following futures contracts:
| | | | | | | | | | | | |
| Description | | Number of
Contracts | | Expiration
Date | | Notional Amount | | | Unrealized
Appreciation/
(Depreciation) | |
Long position contracts: | | | | | | | | | | | | |
U.S. Treasury 10 Year Note | | 42 | | 03/19/24 | | $ | 4,734,843 | | | $ | 29,932 | |
U.S. Treasury 2 Year Note | | 32 | | 03/28/24 | | | 6,588,500 | | | | 7,955 | |
U.S. Treasury 5 Year Note | | 78 | | 03/28/24 | | | 8,477,625 | | | | 81,172 | |
U.S. Treasury Long Bond | | 19 | | 03/19/24 | | | 2,366,094 | | | | 38,763 | |
U.S. Treasury Ultra Bond | | 16 | | 03/19/24 | | | 2,129,500 | | | | 91,988 | |
| | | | |
Total | | | | | | | | | | $ | 249,810 | |
Short position contracts: | | | | | | | | | | | | |
Euro Bund Future | | (1) | | 03/07/24 | | | (151,429 | ) | | | (3,744 | ) |
EURO-BOBL Future | | (13) | | 03/07/24 | | | (1,711,686 | ) | | | (23,366 | ) |
Euro-OAT Future | | (1) | | 03/07/24 | | | (145,081 | ) | | | 142 | |
U.S. Treasury 10 Year Ultra Note | | (10) | | 03/19/24 | | | (1,177,812 | ) | | | (50,736 | ) |
| | | | |
Total | | | | | | | | | | $ | (77,704 | ) |
| | | | |
Total Futures Contracts | | | | | | | | | | $ | 172,106 | |
SWAP CONTRACTS — At December 31, 2023, the Fund had the following swap contracts:
OVER THE COUNTER CREDIT DEFAULT SWAP CONTRACTS
| | | | | | | | | | | | | | | | | | | | | | | | |
Reference Obligation/
Index | | Financing
Rate
Received
(Paid) by the
Fund | | Credit
Spread at
December
31, 2023(a) | | Counterparty | | Termination Date | | Notional Amount (000’s) | | | Value | | | Upfront Premium
(Received) Paid | | | Unrealized
Appreciation/
(Depreciation) | |
Nordstrom,
Inc.(b) | | 1.000% | | 0.213% | | Bank of
America NA | | 06/20/2024 | | | 225 | | | $ | 480 | | | $ | (102 | ) | | $ | 582 | |
ICE CD JWN(b) | | 1.000% | | 0.260 | | Bank of
America NA | | 12/20/2024 | | | 100 | | | | 260 | | | | (1,928 | ) | | | 2,188 | |
Markit CDX North America Investment Grade Index(b) | | 1.000% | | 1.119 | | Bank of
America NA | | 06/20/2025 | | | 4,500 | | | | 50,338 | | | | 6,566 | | | | 43,772 | |
Markit CDX North America Investment Grade Index(b) | | 1.000% | | 1.462 | | Bank of
America NA | | 12/20/2025 | | | 575 | | | | 8,406 | | | | – | | | | 8,406 | |
General Electric
Co.(b) | | 1.000% | | 1.688 | | Bank of
America NA | | 06/20/2026 | | | 175 | | | | 2,955 | | | | – | | | | 2,955 | |
Markit CDX North America Investment Grade Index(b) | | 1.000% | | 1.640 | | Bank of
America NA | | 06/20/2026 | | | 4,775 | | | | 78,298 | | | | 19,507 | | | | 58,791 | |
ICE CDX Investment Grade Index(b) | | 1.000% | | 1.747 | | Bank of
America NA | | 12/20/2026 | | | 2,900 | | | | 50,654 | | | | 45,927 | | | | 4,727 | |
ICE CDX Investment Grade Index(b) | | 1.000% | | 2.011 | | Bank of
America NA | | 06/20/2028 | | | 1,008 | | | | 20,274 | | | | 14,606 | | | | 5,668 | |
Chile Government International Bond(b) | | 1.000% | | 2.302 | | Bank of
America NA | | 12/20/2028 | | | 90 | | | | 2,072 | | | | 1,436 | | | | 636 | |
Mexico Government International Bond(b) | | 1.000% | | 0.541 | | Bank of
America NA | | 12/20/2028 | | | 210 | | | | 1,135 | | | | (2,201 | ) | | | 3,336 | |
CMBX Index(c) | | 0.500% | | 1.766 | | Morgan Stanley
Co., Inc | | 04/17/2065 | | | 300 | | | | (5,297 | ) | | | (5,612 | ) | | | 315 | |
| | |
| The accompanying notes are an integral part of these financial statements. | | 21 |
GOLDMAN SACHS VARIABLE INSURANCE TRUST CORE FIXED INCOME FUND
|
Schedule of Investments (continued) December 31, 2023 |
|
|
ADDITIONAL INVESTMENT INFORMATION (continued) |
OVER THE COUNTER CREDIT DEFAULT SWAP CONTRACTS
| | | | | | | | | | | | | | | | | | | | | | | | |
| Reference Obligation/Index | | Financing
Rate
Received
(Paid) by the
Fund | | Credit
Spread at
December
31, 2023(a) | | Counterparty | | Termination Date | | Notional Amount (000’s) | | | Value | | | Upfront Premium
(Received) Paid | | | Unrealized
Appreciation/
(Depreciation) | |
| | | | | | | | |
TOTAL | | | | | | | | | | | | | | $ | 209,575 | | | $ | 78,199 | | | $ | 131,376 | |
| | (a) | Credit spread on the referenced obligation, together with the period of expiration, are indicators of payment/performance risk. The likelihood of a credit event occurring which would require a fund or its counterparty to make a payment or otherwise be required to perform under the swap contract is generally greater as the credit spread and term of the swap contract increase. |
| | (b) | Payments made quarterly. |
| | (c) | Payments made monthly. |
CENTRALLY CLEARED INTEREST RATE SWAP CONTRACTS
| | | | | | | | | | | | | | | | | | | | | | |
Payments Made by the
Fund(a) | | Payments Received by the Fund | | Termination
Date | | Notional Amounts
(000's) | | | Value | | | Upfront Premium
(Received) Paid | | Unrealized Appreciation/
(Depreciation) | |
1 Day SOFR(b) | | 3.500% | | 4/19/2025 | | USD | | | 250 | | | $ | 1,819 | | | $ | (233 | ) | | $ | 2,052 | |
3 Month BBSW(c) | | 3.750 | | 3/20/2026 | | AUD | | | 4,340 | | | | 2,346 | | | | – | | | | 2,346 | |
3.750%(d) | | CORRA | | 3/20/2026 | | CAD | | | 2,600 | | | | 6,196 | | | | – | | | | 6,196 | |
1 Day SOFR(b) | | 1.250 | | 3/20/2026 | | CHF | | | 1,850 | | | | (8,426 | ) | | | (9,203 | ) | | | 777 | |
1 Day ESTRON(b) | | 3.000 | | 3/20/2026 | | EUR | | | 7,430 | | | | (106,959 | ) | | | (79,071 | ) | | | (27,888 | ) |
5.250 (b) | | 1 Day SONIO | | 3/20/2026 | | GBP | | | 2,240 | | | | 78,801 | | | | 61,521 | | | | 17,280 | |
4.250 (b) | | 6 Month NIBOR | | 3/20/2026 | | NOK | | | 30,700 | | | | 29,690 | | | | 22,990 | | | | 6,700 | |
3.500 (b) | | 3 Month STIBOR | | 3/20/2026 | | SEK | | | 31,430 | | | | 50,436 | | | | 32,438 | | | | 17,998 | |
4.000 (b) | | 1 Day SOFR | | 3/20/2026 | | USD | | | 2,200 | | | | 7,524 | | | | 696 | | | | 6,828 | |
0.500 (b) | | 12 Month BOJDTR | | 8/2/2026 | | JPY | | | 197,380 | | | | 4,463 | | | | 6,108 | | | | (1,645 | ) |
3.000 (b) | | 1 Day ESTRON | | 10/20/2027 | | EUR | | | 2,790 | | | | 52,322 | | | | 10,018 | | | | 42,304 | |
3.731 (b) | | 1 Day SOFR | | 11/28/2027 | | USD | | | 1,250 | | | | 14,357 | | | | 4,562 | | | | 9,795 | |
2.673 (b) | | 1 Day ESTRON | | 4/22/2028 | | EUR | | | 2,510 | | | | 63,925 | | | | 10,319 | | | | 53,606 | |
1 Day ESTRON(b) | | 2.852 | | 4/22/2028 | | EUR | | | 2,510 | | | | (62,573 | ) | | | (8,893 | ) | | | (53,680 | ) |
12 Month BOJDTR(b) | | 0.500 | | 8/3/2028 | | JPY | | | 413,390 | | | | 8,890 | | | | – | | | | 8,890 | |
2.500 (b) | | 1 Day ESTRON | | 10/19/2028 | | EUR | | | 1,490 | | | | 28,007 | | | | 10,417 | | | | 17,590 | |
4.750 (b) | | 1 Day SONIO | | 3/20/2029 | | GBP | | | 590 | | | | 50,011 | | | | 28,872 | | | | 21,139 | |
4.250 (b) | | 1 Day SOFR | | 3/20/2029 | | USD | | | 1,480 | | | | 55,158 | | | | 46,962 | | | | 8,196 | |
12 Month BOJDTR(b) | | 0.500 | | 3/21/2029 | | JPY | | | 1,195,000 | | | | 4,858 | | | | – | | | | 4,858 | |
1 Day SOFR(b) | | 2.680 | | 7/28/2032 | | USD | | | 1,400 | | | | 35,291 | | | | – | | | | 35,291 | |
1.250 (b) | | 12 Month BOJDTR | | 8/2/2033 | | JPY | | | 84,700 | | | | 1,392 | | | | 1,994 | | | | (602 | ) |
12 Month BOJDTR(b) | | 1.250 | | 8/3/2033 | | JPY | | | 104,000 | | | | (1,697 | ) | | | (2,062 | ) | | | 365 | |
4.306 (b) | | 1 Day SOFR | | 10/5/2033 | | USD | | | 2,230 | | | | 80,123 | | | | 10,024 | | | | 70,099 | |
3.000 (b) | | 1 Day ESTRON | | 11/10/2033 | | EUR | | | 2,090 | | | | 43,732 | | | | 29,970 | | | | 13,762 | |
4.250 (d) | | 6 Month BBSW | | 3/20/2034 | | AUD | | | 420 | | | | 1,574 | | | | – | | | | 1,574 | |
CORRA(d) | | 3.250 | | 3/20/2034 | | CAD | | | 70 | | | | (1,004 | ) | | | – | | | | (1,004 | ) |
1.500 (b) | | 1 Day SOFR | | 3/20/2034 | | CHF | | | 300 | | | | 11,404 | | | | 10,899 | | | | 505 | |
3.000 (b) | | 1 Day ESTRON | | 3/20/2034 | | EUR | | | 280 | | | | 14,782 | | | | 14,057 | | | | 725 | |
4.250 (b) | | 1 Day SONIO | | 3/20/2034 | | GBP | | | 80 | | | | 8,558 | | | | 4,322 | | | | 4,236 | |
6 Month NIBOR(b) | | 3.750 | | 3/20/2034 | | NOK | | | 320 | | | | (1,238 | ) | | | (846 | ) | | | (392 | ) |
4.750 (d) | | 3 Month NZD BKBM | | 3/20/2034 | | NZD | | | 440 | | | | 14,479 | | | | 509 | | | | 13,970 | |
3 Month STIBOR(b) | | 3.000 | | 3/20/2034 | | SEK | | | 6,700 | | | | (40,431 | ) | | | (24,669 | ) | | | (15,762 | ) |
4.250 (b) | | 1 Day SOFR | | 3/20/2034 | | USD | | | 170 | | | | 11,824 | | | | 10,814 | | | | 1,010 | |
2.910 (b) | | 1 Day SOFR | | 7/28/2037 | | USD | | | 3,440 | | | | (75,229 | ) | | | – | | | | (75,229 | ) |
2.152 (b) | | 1 Day ESTRON | | 8/9/2037 | | EUR | | | 1,830 | | | | (44,832 | ) | | | – | | | | (44,832 | ) |
3.391 (b) | | 1 Day SOFR | | 5/10/2038 | | USD | | | 4,350 | | | | (26,136 | ) | | | – | | | | (26,136 | ) |
1.500 (b) | | 12 Month BOJDTR | | 8/3/2038 | | JPY | | | 113,000 | | | | (5,897 | ) | | | – | | | | (5,897 | ) |
1 Day ESTRON(b) | | 1.452 | | 8/10/2042 | | EUR | | | 4,700 | | | | 171,565 | | | | – | | | | 171,565 | |
1 Day SOFR(b) | | 2.080 | | 7/28/2047 | | USD | | | 3,410 | | | | 77,470 | | | | – | | | | 77,470 | |
1.051 (b) | | 1 Day ESTRON | | 8/11/2047 | | EUR | | | 2,760 | | | | (85,293 | ) | | | – | | | | (85,293 | ) |
1 Day SOFR(b) | | 2.564 | | 5/11/2053 | | USD | | | 3,700 | | | | 39,321 | | | | (976 | ) | | | 40,297 | |
1 Day ESTRON(b) | | 2.000 | | 5/17/2053 | | EUR | | | 780 | | | | 2,703 | | | | – | | | | 2,703 | |
1 Day ESTRON(b) | | 2.500 | | 11/10/2053 | | EUR | | | 940 | | | | (45,138 | ) | | | (32,532 | ) | | | (12,606 | ) |
1 Day SOFR(b) | | 3.614 | | 11/15/2053 | | USD | | | 1,190 | | | | (51,345 | ) | | | (7,883 | ) | | | (43,462 | ) |
| | |
| 22 | | The accompanying notes are an integral part of these financial statements. |
GOLDMAN SACHS VARIABLE INSURANCE TRUST CORE FIXED INCOME FUND
|
|
ADDITIONAL INVESTMENT INFORMATION (continued) |
CENTRALLY CLEARED INTEREST RATE SWAP CONTRACTS
| | | | | | | | | | | | | | | | | | | | | | |
Payments Made by the
Fund(a) | | Payments Received by
the Fund | | Termination
Date | | Notional Amounts
(000's) | | | Value | | | Upfront Premium
(Received) Paid | | Unrealized
Appreciation/
(Depreciation) | |
1 Day SOFR(b) | | 3.513% | | 11/29/2053 | | USD | | | 400 | | | $ | (14,434 | ) | | $ | (6,798 | ) | | $ | (7,636 | ) |
1 Day ESTRON(b) | | 2.500 | | 3/20/2054 | | EUR | | | 230 | | | | (10,492 | ) | | | (6,771 | ) | | | (3,721 | ) |
| | | | | | | |
TOTAL | | | | | | | | | | | | $ | 391,897 | | | $ | 137,555 | | | $ | 254,342 | |
| | (a) | Represents forward starting interest rate swaps whose effective dates of commencement of accruals and cash flows occur subsequent to December 31, 2023. |
| | (b) | Payments made annually. |
| | (c) | Payments made quarterly. |
| | (d) | Payments made semi-annually. |
OVER-THE-COUNTER - INTEREST RATE SWAPTIONS — At December 31, 2023, the Fund had the following written option contracts:
| | | | | | | | | | | | | | | | | | | | | | | | | | | | | | |
| Description | | Counterparty | | Exercise
Rate | | | Expiration Date | | | Number of
Contracts | | | Notional Amount | | | Market Value | | | Premiums Paid
(Received) by the Fund | | | Unrealized
Appreciation/
(Depreciation) | |
Purchased Option Contracts: | | | | | | | | | | | | | | | | | | | | | |
Puts | | | | | | | | | | | | | | | | | | | | | | | | | | | | | | |
3M IRS | | Morgan Stanley Co., Inc | | | EUR 3.80 | | | | 03/14/2024 | | | | 7,140,000 | | | $ | 7,140,000 | | | $ | 572 | | | $ | 2,128 | | | $ | (1,556) | |
3M IRS | | Morgan Stanley Co., Inc | | | 3.43 | | | | 03/14/2024 | | | | 3,570,000 | | | | 3,570,000 | | | | 1,379 | | | | 3,902 | | | | (2,522) | |
Total purchased option contracts | | | | | | | | 10,710,000 | | | $ | 10,710,000 | | | $ | 1,951 | | | $ | 6,030 | | | $ | (4,078) | |
| | | | | | | | |
| Description | | Counterparty | | Exercise
Rate | | | Expiration Date | | | Number of
Contracts | | | Notional Amount | | | Market Value | | | Premiums Paid
(Received) by the Fund | | | Unrealized
Appreciation/
(Depreciation) | |
Written Option Contracts: | | | | | | | | | | | | | | | | | | | | | |
Puts | | | | | | | | | | | | | | | | | | | | | | | | | | | | | | |
3M IRS | | Morgan Stanley Co., Inc | | | EUR 3.65 | | | | 03/14/2024 | | | | (10,710,000 | ) | | $ | (10,710,000) | | | $ | (1,615 | ) | | $ | (5,202) | | | $ | 3,587 | |
| | |
| |
| Abbreviations: |
| 3M IRS | | —3 Months Interest Rate Swaptions |
| | |
| The accompanying notes are an integral part of these financial statements. | | 23 |
GOLDMAN SACHS VARIABLE INSURANCE TRUST CORE FIXED INCOME FUND
|
Statement of Assets and Liabilities December 31, 2023 |
| | | | | | | | |
| | | | | Core Fixed Income
Fund | | |
| | | |
| | | Assets: | | | | | | |
| | | |
| | Investments in unaffiliated issuers, at value (cost $146,408,220) | | $ | 139,937,213 | | | |
| | Investments in affiliated issuers, at value (cost $896,009) | | | 896,009 | | | |
| | Purchased Options, at value (premiums paid $6,030) | | | 1,951 | | | |
| | Cash | | | 2,014,884 | | | |
| | Foreign Currency, at value (cost $13,058) | | | 13,050 | | | |
| | Receivables: | | | | | | |
| | Investments sold on an extended-settlement basis | | | 38,703,518 | | | |
| | Collateral on certain derivative contracts(a) | | | 1,000,562 | | | |
| | Interest and dividends | | | 947,114 | | | |
| | Fund shares sold | | | 100,109 | | | |
| | Reimbursement from investment adviser | | | 14,566 | | | |
| | Unrealized gain on forward foreign currency exchange contracts | | | 89,581 | | | |
| | Unrealized gain on swap contracts | | | 131,376 | | | |
| | Variation margin on futures contracts | | | 87,247 | | | |
| | Upfront payments received on swap contracts | | | 78,199 | | | |
| | Other assets | | | 1,140 | | | |
| | |
| | Total assets | | | 184,016,519 | | | |
| | |
| | | | | | | | |
| | | |
| | Liabilities: | | | | | | |
| | | |
| | Written options, at value (premiums received $5,202) | | | 1,615 | | | |
| | Forward sale contracts, at value (proceeds received $11,494,580) | | | 11,578,646 | | | |
| | Unrealized loss on forward foreign currency exchange contracts | | | 108,173 | | | |
| | Payables: | | | | | | |
| | Investments purchased | | | 37,236,422 | | | |
| | Management fees | | | 44,779 | | | |
| | Fund shares redeemed | | | 22,095 | | | |
| | Distribution and Service fees and Transfer Agency fees | | | 20,469 | | | |
| | Accrued expenses | | | 102,936 | | | |
| | |
| | Total liabilities | | | 49,115,135 | | | |
| | |
| | | |
| | Net Assets: | | | | | | |
| | | |
| | Paid-in Capital | | | 147,419,293 | | | |
| | Total distributable earnings (loss) | | | (12,517,909 | ) | | |
| | |
| | NET ASSETS | | $ | 134,901,384 | | | |
| | | Net Assets: | | | | | | |
| | | Institutional | | $ | 47,420,966 | | | |
| | | Service | | | 87,480,418 | | | |
| | | Total Net Assets | | $ | 134,901,384 | | | |
| | | Shares Outstanding $0.001 par value (unlimited number of shares authorized): | | | | | | |
| | | Institutional | | | 4,898,121 | | | |
| | | Service | | | 9,048,285 | | | |
| | | Net asset value, offering and redemption price per share: | | | | | | |
| | | Institutional | | $ | 9.68 | | | |
| | | Service | | | 9.67 | | | |
| (a) | Segregated for initial margin and/or collateral as follows: |
| | | | | | | | | | | | | | | | | | | | | | |
| Fund | | Futures | | | | | | Forwards | | | | | Swaps | | | | |
Core Fixed Income Fund | | $ | 439,488 | | | | | | | $(50,000) | | | | | | $ | 611,074 | | | | | |
| | |
| 24 | | The accompanying notes are an integral part of these financial statements. |
GOLDMAN SACHS VARIABLE INSURANCE TRUST CORE FIXED INCOME FUND
|
Statement of Operations For the Fiscal Year Ended December 31, 2023 |
| | | | | | | | |
| | | | | Core Fixed Income
Fund | | | |
| | | |
| | Investment income: | | | | | | |
| | | |
| | | Interest | | $ | 4,649,355 | | | |
| | | |
| | Dividends — affiliated issuers | | | 55,203 | | | |
| | |
| | | |
| | Total Investment Income | | | 4,704,558 | | | |
| | |
| | | | | | | | |
| | | |
| | Expenses: | | | | | | |
| | | |
| | Management fees | | | 486,158 | | | |
| | | |
| | Service fees — Service | | | 198,961 | | | |
| | | |
| | Professional fees | | | 107,915 | | | |
| | | |
| | Custody, accounting and administrative services | | | 71,400 | | | |
| | | |
| | Transfer Agency fees(a) | | | 24,308 | | | |
| | | |
| | Trustee fees | | | 21,641 | | | |
| | | |
| | Printing and mailing costs | | | 17,206 | | | |
| | | |
| | Shareholder meeting expense | | | 4,896 | | | |
| | | |
| | Other | | | 24,825 | | | |
| | |
| | | |
| | Total expenses | | | 957,310 | | | |
| | |
| | | |
| | Less — expense reductions | | | (240,444 | ) | | |
| | |
| | | |
| | Net expenses | | | 716,866 | | | |
| | |
| | | |
| | NET INVESTMENT INCOME | | | 3,987,692 | | | |
| | |
| | | | | | | | |
| | | |
| | Realized and Unrealized gain (loss): | | | | | | |
| | | |
| | Net realized gain (loss) from: | | | | | | |
| | | |
| | Investments — unaffiliated issuers | | | (2,479,873 | ) | | |
| | | |
| | Forward sales contracts | | | 894,356 | | | |
| | | |
| | Swap Contracts | | | 221,180 | | | |
| | | |
| | Foreign currency transactions | | | (2,805 | ) | | |
| | | |
| | Purchased Options | | | (10,899 | ) | | |
| | | |
| | Written options | | | (11,088 | ) | | |
| | | |
| | Forward foreign currency exchange contracts | | | (34,040 | ) | | |
| | | |
| | Futures contracts | | | (53,539 | ) | | |
| | | |
| | Net change in unrealized gain (loss) on: | | | | | | |
| | | |
| | Investments — unaffiliated issuers | | | 4,765,367 | | | |
| | | |
| | Swap Contracts | | | 242,570 | | | |
| | | |
| | Futures contracts | | | 239,333 | | | |
| | | |
| | Forward foreign currency exchange contracts | | | 5,537 | | | |
| | | |
| | Purchased Options | | | 1,181 | | | |
| | | |
| | Written options | | | (660 | ) | | |
| | | |
| | Foreign currency translations | | | (130,032 | ) | | |
| | | |
| | Forward sales contracts | | | (399,128 | ) | | |
| | |
| | | |
| | Net realized and unrealized gain | | | 3,247,460 | | | |
| | |
| | | |
| | NET INCREASE IN NET ASSETS RESULTING FROM OPERATIONS | | $ | 7,235,152 | | | |
| | |
| | (a) | Class specific Distribution and/or Service and Transfer Agency fees were as follows: |
| | | | | | |
| | | Transfer Agency Fees | | |
| Fund | | Institutional | | Service |
Core Fixed Income Fund | | $8,391 | | $15,917 |
| | |
| The accompanying notes are an integral part of these financial statements. | | 25 |
GOLDMAN SACHS VARIABLE INSURANCE TRUST CORE FIXED INCOME FUND
|
Statements of Changes in Net Assets |
| | | | | | | | | | | | |
| | | | | Core Fixed Income Fund. | | | |
| | | | | For the Fiscal Year Ended
December 31, 2023 | | | For the Fiscal Year Ended
December 31, 2022 | | | |
| | | | |
| | | From operations: | | | | | | | | | | |
| | | | |
| | Net investment income | | $ | 3,987,692 | | | $ | 1,921,787 | | | |
| | | | |
| | Net realized loss | | | (1,476,708 | ) | | | (5,191,585 | ) | | |
| | | | |
| | Net change in unrealized gain (loss) | | | 4,724,168 | | | | (12,101,618 | ) | | |
| | |
| | | | |
| | Net increase (decrease) in net assets resulting from operations | | | 7,235,152 | | | | (15,371,416 | ) | | |
| | |
| | | | | | | | | | | | |
| | | | |
| | Distributions to shareholders: | | | | | | | | | | |
| | | | |
| | From distributable earnings: | | | | | | | | | | |
| | | | |
| | Institutional Shares | | | (1,301,980 | ) | | | (498,802 | ) | | |
| | | | |
| | Service Shares | | | (2,263,048 | ) | | | (1,038,833 | ) | | |
| | |
| | | | |
| | Total distributions to shareholders | | | (3,565,028 | ) | | | (1,537,635 | ) | | |
| | |
| | | | | | | | | | | | |
| | | | |
| | From share transactions: | | | | | | | | | | |
| | | | |
| | Proceeds from sales of shares | | | 25,601,052 | | | | 33,277,943 | | | |
| | | | |
| | Reinvestment of distributions | | | 3,565,028 | | | | 1,537,635 | | | |
| | | | |
| | Cost of shares redeemed | | | (8,631,963 | ) | | | (10,255,336 | ) | | |
| | |
| | | | |
| | Net increase in net assets resulting from share transactions | | | 20,534,117 | | | | 24,560,242 | | | |
| | |
| | | | |
| | TOTAL INCREASE | | | 24,204,241 | | | | 7,651,191 | | | |
| | |
| | | | | | | | | | | | |
| | | | |
| | Net Assets: | | | | | | | | | | |
| | | | |
| | Beginning of year | | | 110,697,143 | | | | 103,045,952 | | | |
| | |
| | | | |
| | End of year | | $ | 134,901,384 | | | $ | 110,697,143 | | | |
| | |
| | |
| 26 | | The accompanying notes are an integral part of these financial statements. |
GOLDMAN SACHS VARIABLE INSURANCE TRUST CORE FIXED INCOME FUND
|
Financial Highlights Selected Data for a Share Outstanding Throughout Each Year |
| | | | | | | | | | | | | | | | | | | | | | | | | | | | | |
| | | | | Goldman Sachs Core Fixed Income Fund | | |
| | | |
| | | | | Institutional Shares | | |
| | | | | Year Ended December 31, | | |
| | | | | | | |
| | | | | 2023 | | 2022 | | 2021 | | 2020 | | 2019 | | |
| | | | | | | |
| | Per Share Data | | | | | | | | | | | | | | | | | | | | | | | | | | | |
| | | | | | | |
| | Net asset value, beginning of year | | | $ | 9.41 | | | | $ | 11.13 | | | | $ | 11.53 | | | | $ | 10.85 | | | | $ | 10.20 | | | |
| | |
| | | | | | | |
| | Net investment income(a) | | | | 0.33 | | | | | 0.21 | | | | | 0.12 | | | | | 0.18 | | | | | 0.26 | | | |
| | | | | | | |
| | Net realized and unrealized gain (loss) | | | | 0.23 | | | | | (1.77 | ) | | | | (0.36 | ) | | | | 0.86 | | | | | 0.69 | | | |
| | |
| | | | | | | |
| | Total from investment operations | | | | 0.56 | | | | | (1.56 | ) | | | | (0.24 | ) | | | | 1.04 | | | | | 0.95 | | | |
| | |
| | | | | | | |
| | Distributions to shareholders from net investment income | | | | (0.29 | ) | | | | (0.16 | ) | | | | (0.14 | ) | | | | (0.26 | ) | | | | (0.30 | ) | | |
| | | | | | | |
| | Distributions to shareholders from net realized gains | | | | – | | | | | – | | | | | (0.02 | ) | | | | (0.10 | ) | | | | – | | | |
| | |
| | | | | | | |
| | Total distributions | | | | (0.29 | ) | | | | (0.16 | ) | | | | (0.16 | ) | | | | (0.36 | ) | | | | (0.30 | ) | | |
| | |
| | | | | | | |
| | Net asset value, end of year | | | $ | 9.68 | | | | $ | 9.41 | | | | $ | 11.13 | | | | $ | 11.53 | | | | $ | 10.85 | | | |
| | |
| | | | | | | |
| | Total Return(b) | | | | 6.08 | % | | | | (14.03 | )% | | | | (2.06 | )% | | | | 9.64 | % | | | | 9.28 | % | | |
| | |
| | | | | | | |
| | Net assets, end of year (in 000’s) | | | $ | 47,421 | | | | $ | 38,157 | | | | $ | 31,179 | | | | $ | 25,194 | | | | $ | 17,421 | | | |
| | | | | | | |
| | Ratio of net expenses to average net assets | | | | 0.43 | % | | | | 0.41 | % | | | | 0.41 | % | | | | 0.41 | % | | | | 0.44 | % | | |
| | | | | | | |
| | Ratio of total expenses to average net assets | | | | 0.62 | % | | | | 0.70 | % | | | | 0.81 | % | | | | 0.93 | % | | | | 1.08 | % | | |
| | | | | | | |
| | Ratio of net investment income to average net assets | | | | 3.45 | % | | | | 2.07 | % | | | | 1.09 | % | | | | 1.61 | % | | | | 2.41 | % | | |
| | | | | | | |
| | Portfolio turnover rate(c) | | | | 841 | % | | | | 693 | % | | | | 513 | % | | | | 501 | % | | | | 556 | % | | |
| | |
| | (a) | Calculated based on the average shares outstanding methodology. |
| | (b) | Assumes investment at the NAV at the beginning of the year, reinvestment of all dividends and distributions, a complete redemption of the investment at the NAV at the end of the year and no sales or redemption charges (if any). Total returns would be reduced if a sales or redemption charge was taken into account. Returns do not reflect the impact of taxes to shareholders relating to Fund distributions or the redemption of Fund shares. |
| | (c) | The Fund’s portfolio turnover rate is calculated in accordance with regulatory requirements, without regard to transactions involving short term investments and certain derivatives. If such transactions were included, the Fund’s portfolio turnover rate may be higher. |
| | |
| The accompanying notes are an integral part of these financial statements. | | 27 |
GOLDMAN SACHS VARIABLE INSURANCE TRUST CORE FIXED INCOME FUND
|
Financial Highlights (continued) Selected Data for a Share Outstanding Throughout Each Year |
| | | | | | | | | | | | | | | | | | | | | | | | | | | | | |
| | | | | Goldman Sachs Core Fixed Income Fund | | |
| | | |
| | | | | Service Shares | | |
| | | | | Year Ended December 31, | | |
| | | | | | | |
| | | | | 2023 | | 2022 | | 2021 | | 2020 | | 2019 | | |
| | | | | | | |
| | Per Share Data | | | | | | | | | | | | | | | | | | | | | | | | | | | |
| | | | | | | |
| | Net asset value, beginning of year | | | $ | 9.40 | | | | $ | 11.13 | | | | $ | 11.53 | | | | $ | 10.85 | | | | $ | 10.21 | | | |
| | |
| | | | | | | |
| | Net investment income(a) | | | | 0.30 | | | | | 0.18 | | | | | 0.09 | | | | | 0.16 | | | | | 0.25 | | | |
| | | | | | | |
| | Net realized and unrealized gain (loss) | | | | 0.24 | | | | | (1.77 | ) | | | | (0.34 | ) | | | | 0.85 | | | | | 0.66 | | | |
| | |
| | | | | | | |
| | Total from investment operations | | | | 0.54 | | | | | (1.59 | ) | | | | (0.25 | ) | | | | 1.01 | | | | | 0.91 | | | |
| | |
| | | | | | | |
| | Distributions to shareholders from net investment income | | | | (0.27 | ) | | | | (0.14 | ) | | | | (0.13 | ) | | | | (0.23 | ) | | | | (0.27 | ) | | |
| | | | | | | |
| | Distributions to shareholders from net realized gains | | | | – | | | | | – | | | | | (0.02 | ) | | | | (0.10 | ) | | | | – | | | |
| | |
| | | | | | | |
| | Total distributions | | | | (0.27 | ) | | | | (0.14 | ) | | | | (0.15 | ) | | | | (0.33 | ) | | | | (0.27 | ) | | |
| | |
| | | | | | | |
| | Net asset value, end of year | | | $ | 9.67 | | | | $ | 9.40 | | | | $ | 11.13 | | | | $ | 11.53 | | | | $ | 10.85 | | | |
| | |
| | | | | | | |
| | Total Return(b) | | | | 5.83 | % | | | | (14.28 | )% | | | | (2.23 | )% | | | | 9.37 | % | | | | 9.00 | % | | |
| | |
| | | | | | | |
| | Net assets, end of year (in 000’s) | | | $ | 87,480 | | | | $ | 72,540 | | | | $ | 71,867 | | | | $ | 46,631 | | | | $ | 37,524 | | | |
| | | | | | | |
| | Ratio of net expenses to average net assets | | | | 0.68 | % | | | | 0.66 | % | | | | 0.66 | % | | | | 0.66 | % | | | | 0.68 | % | | |
| | | | | | | |
| | Ratio of total expenses to average net assets | | | | 0.87 | % | | | | 0.95 | % | | | | 1.06 | % | | | | 1.18 | % | | | | 1.35 | % | | |
| | | | | | | |
| | Ratio of net investment income to average net assets | | | | 3.19 | % | | | | 1.82 | % | | | | 0.85 | % | | | | 1.39 | % | | | | 2.33 | % | | |
| | | | | | | |
| | Portfolio turnover rate(c) | | | | 841 | % | | | | 693 | % | | | | 513 | % | | | | 501 | % | | | | 556 | % | | |
| | |
| | (a) | Calculated based on the average shares outstanding methodology. |
| | (b) | Assumes investment at the NAV at the beginning of the year, reinvestment of all dividends and distributions, a complete redemption of the investment at the NAV at the end of the year and no sales or redemption charges (if any). Total returns would be reduced if a sales or redemption charge was taken into account. Returns do not reflect the impact of taxes to shareholders relating to Fund distributions or the redemption of Fund shares. |
| | (c) | The Fund’s portfolio turnover rate is calculated in accordance with regulatory requirements, without regard to transactions involving short term investments and certain derivatives. If such transactions were included, the Fund’s portfolio turnover rate may be higher. |
| | |
| 28 | | The accompanying notes are an integral part of these financial statements. |
CORE FIXED INCOME FUND
|
Notes to Financial Statements December 31, 2023 |
Goldman Sachs Variable Insurance Trust (the “Trust” or “VIT”) is a Delaware statutory trust registered under the Investment Company Act of 1940, as amended (the “Act”), as an open-end management investment company. The following table lists the series of the Trust that is included in this report (the “Fund”), along with its corresponding share classes and respective diversification status under the Act:
| | | | |
| Fund | | Share Classes Offered | | Diversified/ Non-diversified |
| | |
| Core Fixed Income Fund | | Institutional and Service | | Diversified |
Shares of the Trust are offered to a separate account of participating life insurance companies for the purpose of funding variable annuity contracts and variable life insurance policies.
Goldman Sachs Asset Management, L.P. (“GSAM”), an affiliate of Goldman Sachs & Co. LLC (“Goldman Sachs”), serves as investment adviser to the Fund pursuant to a management agreement (the “Agreement”) with the Trust.
|
|
2. SIGNIFICANT ACCOUNTING POLICIES |
The financial statements have been prepared in accordance with accounting principles generally accepted in the United States of America (“GAAP”) and require management to make estimates and assumptions that may affect the reported amounts and disclosures. Actual results may differ from those estimates and assumptions. The Fund is an investment company under GAAP and follows the accounting and reporting guidance applicable to investment companies.
A. Investment Valuation — The Fund’s valuation policy is to value investments at fair value.
B. Investment Income and Investments — Investment income includes interest income, dividend income, and securities lending income, if any. Interest income is accrued daily and adjusted for amortization of premiums and accretion of discounts. Dividend income is recognized on ex-dividend date or, for certain foreign securities, as soon as such information is obtained subsequent to the ex-dividend date. Non-cash dividends, if any, are recorded at the fair market value of the securities received. Investment transactions are reflected on trade date. Realized gains and losses are calculated using identified cost. Investment transactions are recorded on the following business day for daily net asset value (“NAV”) calculations.
For derivative contracts, unrealized gains and losses are recorded daily and become realized gains and losses upon disposition or termination of the contract. Upfront payments, if any, are made or received upon entering into a swap agreement and are reflected in the Statement of Assets and Liabilities. Upfront payments are recognized over the contract’s term/event as realized gains or losses, with the exception of forward starting swap contracts whose realized gains or losses are recognized from the effective start date. For securities with paydown provisions, principal payments received are treated as a proportionate reduction to the cost basis of the securities, and excess or shortfall amounts are recorded as income. For treasury inflation protected securities (“TIPS”), adjustments to principal due to inflation/ deflation are reflected as increases/decreases to interest income with a corresponding adjustment to cost.
C. Class Allocations and Expenses — Investment income, realized and unrealized gain (loss), if any, and non-class specific expenses of the Fund are allocated daily based upon the proportion of net assets of each class. Non-class specific expenses directly incurred by the Fund are charged to the Fund, while such expenses incurred by the Trust are allocated across the Fund on a straight-line and/or pro-rata basis depending upon the nature of the expenses. Class specific expenses, where applicable, are borne by the respective share classes and include Distribution and Service and Transfer Agency fees.
D. Federal Taxes and Distributions to Shareholders — It is the Fund’s policy to comply with the requirements of the Internal Revenue Code of 1986, as amended (the “Code”), applicable to regulated investment companies and to distribute each year substantially all of its investment company taxable income and capital gains to its shareholders. Accordingly, the Fund is not required to make any provisions for the payment of federal income tax. Distributions to shareholders are recorded on the ex-dividend date. Income and capital gains distributions, if any, are declared and paid according to the following schedule:
| | | | |
| Fund | | Income Distributions Declared/Paid | | Capital Gains Distributions Declared/Paid |
| | |
| Core Fixed Income Fund | | Quarterly | | Annually |
CORE FIXED INCOME FUND
|
Notes to Financial Statements (continued) December 31, 2023 |
|
|
2. SIGNIFICANT ACCOUNTING POLICIES (continued) |
Net capital losses, if any, are carried forward to future fiscal years and may be used to the extent allowed by the Code to offset any future capital gains. Losses that are carried forward will retain their character as either short-term or long-term capital losses. Utilization of capital loss carryforwards will reduce the requirement of future capital gains distributions.
The characterization of distributions to shareholders for financial reporting purposes is determined in accordance with federal income tax rules, which may differ from GAAP. The source of the Fund’s distributions may be shown in the accompanying financial statements as either from distributable earnings or capital. Certain components of the Fund’s net assets on the Statement of Assets and Liabilities reflect permanent GAAP/tax differences based on the appropriate tax character.
E. Foreign Currency Translation — The accounting records and reporting currency of the Fund are maintained in U.S. dollars. Assets and liabilities denominated in foreign currencies are translated into U.S. dollars using the current exchange rates at the close of each business day. The effect of changes in foreign currency exchange rates on investments is included within net realized and unrealized gain (loss) on investments. Changes in the value of other assets and liabilities as a result of fluctuations in foreign exchange rates are included in the Statement of Operations within net change in unrealized gain (loss) on foreign currency translation. Transactions denominated in foreign currencies are translated into U.S. dollars on the date the transaction occurred, the effects of which are included within net realized gain (loss) on foreign currency transactions.
|
|
3. INVESTMENTS AND FAIR VALUE MEASUREMENTS |
U.S. GAAP defines the fair value of a financial instrument as the amount that would be received to sell an asset or paid to transfer a liability in an orderly transaction between market participants at the measurement date (i.e., the exit price); the Fund’s policy is to use the market approach. GAAP establishes a fair value hierarchy that prioritizes the inputs to valuation techniques used to measure fair value. The hierarchy gives the highest priority to unadjusted quoted prices in active markets for identical assets or liabilities (Level 1 measurements) and the lowest priority to unobservable inputs (Level 3 measurements). The level in the fair value hierarchy within which the fair value measurement in its entirety falls shall be determined based on the lowest level input that is significant to the fair value measurement in its entirety. The levels used for classifying investments are not necessarily an indication of the risk associated with investing in these investments. The three levels of the fair value hierarchy are described below:
Level 1 — Unadjusted quoted prices in active markets that are accessible at the measurement date for identical, unrestricted assets or liabilities;
Level 2 — Quoted prices in markets that are not active or financial instruments for which significant inputs are observable (including, but not limited to, quoted prices for similar investments, interest rates, foreign exchange rates, volatility and credit spreads), either directly or indirectly;
Level 3 — Prices or valuations that require significant unobservable inputs (including GSAM’s assumptions in determining fair value measurement).
The Board of Trustees (“Trustees”) has approved Valuation Procedures that govern the valuation of the portfolio investments held by the Fund, including investments for which market quotations are not readily available. With respect to the Fund’s investments that do not have readily available market quotations, the Trustees have designated the Adviser as the valuation designee to perform fair valuations pursuant to Rule 2a-5 under the Investment Company Act of 1940 (the “Valuation Designee”). GSAM has day-to-day responsibility for implementing and maintaining internal controls and procedures related to the valuation of the Fund’s investments. To assess the continuing appropriateness of pricing sources and methodologies, GSAM regularly performs price verification procedures and issues challenges as necessary to third party pricing vendors or brokers, and any differences are reviewed in accordance with the Valuation Procedures.
A. Level 1 and Level 2 Fair Value Investments — The valuation techniques and significant inputs used in determining the fair values for investments classified as Level 1 and Level 2 are as follows:
Money Market Funds — Investments in the Goldman Sachs Financial Square Government Fund (“Underlying Money Market Fund”) are valued at the NAV per share of the Institutional Share class on the day of valuation. These investments are generally classified as Level 1 of the fair value hierarchy. For information regarding the Underlying Money Market Fund’s accounting policies and investment holdings, please see the Underlying Money Market Fund’s shareholder report.
CORE FIXED INCOME FUND
|
|
3. INVESTMENTS AND FAIR VALUE MEASUREMENTS (continued) |
Debt Securities — Debt securities for which market quotations are readily available are valued daily on the basis of quotations supplied by dealers or an independent pricing service. The pricing services may use valuation models or matrix pricing, which consider: (i) yield or price with respect to bonds that are considered comparable in characteristics such as rating, interest rate and maturity date or (ii) quotations from securities dealers to determine current value. With the exception of treasury securities of G7 countries, which are generally classified as Level 1, these investments are generally classified as Level 2 of the fair value hierarchy.
i. Mortgage-Backed and Asset-Backed Securities — Mortgage-backed securities represent direct or indirect participations in, or are collateralized by and payable from, mortgage loans secured by residential and/or commercial real estate property. Asset-backed securities include securities whose principal and interest payments are collateralized by pools of other assets or receivables. The value of certain mortgage-backed and asset-backed securities (including adjustable rate mortgage loans) may be particularly sensitive to changes in prevailing interest rates. The value of these securities may also fluctuate in response to the market’s perception of the creditworthiness of the issuers.
Asset-backed securities may present credit risks that are not presented by mortgage-backed securities because they generally do not have the benefit of a security interest in collateral that is comparable to mortgage assets. Some asset-backed securities may only have a subordinated claim on collateral.
Stripped mortgage-backed securities are usually structured with two different classes: one that receives substantially all interest payments (interest-only, or “IO” and/or high coupon rate with relatively low principal amount, or “IOette”), and the other that receives substantially all principal payments (principal-only, or “PO”) from a pool of mortgage loans. Little to no principal will be received at the maturity of an IO; as a result, periodic adjustments are recorded to reduce the cost of the security until maturity. These adjustments are included in interest income.
ii. Treasury Inflation Protected Securities — TIPS are treasury securities in which the principal amount is adjusted daily to keep pace with inflation, as measured by the U.S. Consumer Pricing Index for Urban Consumers. The repayment of the original bond principal upon maturity is guaranteed by the full faith and credit of the U.S. Government.
iii. When-Issued Securities and Forward Commitments — When-issued securities, including TBA (“To Be Announced”) securities, are securities that are authorized but not yet issued in the market and purchased in order to secure what is considered to be an advantageous price or yield to the Fund. A forward commitment involves entering into a contract to purchase or sell securities, typically on an extended settlement basis, for a fixed price at a future date. The purchase of securities on a when-issued or forward commitment basis involves a risk of loss if the value of the security to be purchased declines before the settlement date. Conversely, the sale of securities on a forward commitment basis involves the risk that the value of the securities sold may increase before the settlement date. Although the Fund will generally purchase securities on a when-issued or forward commitment basis with the intention of acquiring the securities for its portfolio, the Fund may dispose of when-issued securities or forward commitments prior to settlement, which may result in a realized gain or loss. For financial reporting purposes, cash collateral that has been pledged to cover obligations of the Fund and cash collateral received, if any, is reported separately on the Statement of Assets and Liabilities as receivables/payables for collateral on other investments. Non-cash collateral pledged by the Fund, if any, is noted in the Schedule of Investments.
Derivative Contracts — A derivative is an instrument whose value is derived from underlying assets, indices, reference rates or a combination of these factors. The Fund enters into derivative transactions to hedge against changes in interest rates, securities prices, and/or currency exchange rates, to increase total return, or to gain access to certain markets or attain exposure to other underliers. For financial reporting purposes, cash collateral that has been pledged to cover obligations of the Fund and cash collateral received, if any, is reported separately on the Statement of Assets and Liabilities as either due to broker/receivable for collateral on certain derivative contracts. Non-cash collateral pledged by the Fund, if any, is noted in the Schedule of Investments.
Exchange-traded derivatives, including futures and options contracts, are generally valued at the last sale or settlement price on the exchange where they are principally traded. Exchange-traded options without settlement prices are generally valued at the midpoint of the bid and ask prices on the exchange where they are principally traded (or, in the absence of two-way trading, at the last bid price for long positions and the last ask price for short positions). Exchange-traded derivatives typically fall within Level 1 of the fair value hierarchy. Over-the-counter (“OTC”) and centrally cleared derivatives are valued using market transactions and other market evidence, including market-based inputs to models, calibration to market-clearing transactions, broker or dealer quotations, or other alternative pricing sources. Where models are used, the selection of a particular model to value OTC and centrally cleared derivatives depends upon the contractual terms of, and specific risks inherent in, the instrument, as well as the availability of pricing information in the market. Valuation models require a variety of inputs, including contractual terms, market prices, yield curves, credit curves, measures of volatility, voluntary and involuntary prepayment rates, loss severity rates and correlations of such inputs.
CORE FIXED INCOME FUND
|
Notes to Financial Statements (continued) December 31, 2023 |
|
|
3. INVESTMENTS AND FAIR VALUE MEASUREMENTS (continued) |
For OTC and centrally cleared derivatives that trade in liquid markets, model inputs can generally be verified and model selection does not involve significant management judgment. OTC and centrally cleared derivatives are classified within Level 2 of the fair value hierarchy when significant inputs are corroborated by market evidence.
i. Forward Contracts — A forward contract is a contract between two parties to buy or sell an asset at a specified price on a future date. A forward contract settlement can occur on a cash or delivery basis. Forward contracts are marked-to-market daily using independent vendor prices, and the change in value, if any, is recorded as an unrealized gain or loss. Cash and certain investments may be used to collateralize forward contracts.
A forward foreign currency exchange contract is a forward contract in which the Fund agrees to receive or deliver a fixed quantity of one currency for another, at a pre-determined price at a future date. All forward foreign currency exchange contracts are marked to market daily by using the outright forward rates or interpolating based upon maturity dates, where available. Non-deliverable forward foreign currency exchange contracts are settled with the counterparty in cash without the delivery of foreign currency.
ii. Futures Contracts — Futures contracts are contracts to buy or sell a standardized quantity of a specified commodity or security. Upon entering into a futures contract, the Fund deposits cash or securities in an account on behalf of the broker in an amount sufficient to meet the initial margin requirement. Subsequent payments are made or received by the Fund equal to the daily change in the contract value and are recorded as variation margin receivable or payable with a corresponding offset to unrealized gains or losses.
iii. Options — When the Fund writes call or put options, an amount equal to the premium received is recorded as a liability and is subsequently marked-to-market to reflect the current value of the option written. Swaptions are options on swap contracts.
Upon the purchase of a call option or a put option by the Fund, the premium paid is recorded as an investment and subsequently marked-to-market to reflect the current value of the option. Certain options may be purchased with premiums to be determined on a future date. The premiums for these options are based upon implied volatility parameters at specified terms.
iv. Swap Contracts — Bilateral swap contracts are agreements in which the Fund and a counterparty agree to exchange periodic payments on a specified notional amount or make a net payment upon termination. Bilateral swap transactions are privately negotiated in the OTC market and payments are settled through direct payments between the Fund and the counterparty. By contrast, certain swap transactions are subject to mandatory central clearing. These swaps are executed through a derivatives clearing member (“DCM”), acting in an agency capacity, and submitted to a central counterparty (“CCP”) (“centrally cleared swaps”), in which case all payments are settled with the CCP through the DCM. Swaps are marked-to-market daily using pricing vendor quotations, counterparty or clearinghouse prices or model prices, and the change in value, if any, is recorded as an unrealized gain or loss. Upon entering into a swap contract, the Fund is required to satisfy an initial margin requirement by delivering cash or securities to the counterparty (or in some cases, segregated in a triparty account on behalf of the counterparty), which can be adjusted by any mark-to-market gains or losses pursuant to bilateral or centrally cleared arrangements. For centrally cleared swaps the daily change in valuation, if any, is recorded as a receivable or payable for variation margin.
An interest rate swap is an agreement that obligates two parties to exchange a series of cash flows at specified intervals, based upon or calculated by reference to changes in interest rates on a specified notional principal amount. The payment flows are usually netted against each other, with the difference being paid by one party to the other.
A credit default swap is an agreement that involves one party (the buyer of protection) making a stream of payments to another party (the seller of protection) in exchange for the right to receive protection on a reference security or obligation, including a group of assets or exposure to the performance of an index. The Fund’s investment in credit default swaps may involve greater risks than if the Fund had invested in the referenced obligation directly. Credit events are contract specific but may include bankruptcy, failure to pay, restructuring and obligation acceleration. If the Fund buys protection through a credit default swap and no credit event occurs, its payments are limited to the periodic payments previously made to the counterparty. Upon the occurrence of a specified credit event, the Fund, as a buyer of credit protection, is entitled to receive an amount equal to the notional amount of the swap and deliver to the seller the defaulted reference obligation in a physically settled trade. The Fund may also receive a net settlement amount in the form of cash or securities equal to the notional amount of the swap reduced by the recovery value of the reference obligation in a cash settled trade.
As a seller of protection, the Fund generally receives a payment stream throughout the term of the swap, provided that there is no credit event. In addition, if the Fund sells protection through a credit default swap, the Fund could suffer a loss because the value of the referenced obligation and the premium payments received may be less than the notional amount of the swap paid to
CORE FIXED INCOME FUND
|
|
3. INVESTMENTS AND FAIR VALUE MEASUREMENTS (continued) |
the buyer of protection. Upon the occurrence of a specified credit event, the Fund, as a seller of credit protection, may be required to take possession of the defaulted reference obligation and pay the buyer an amount equal to the notional amount of the swap in a physically settled trade. The Fund may also pay a net settlement amount in the form of cash or securities equal to the notional amount of the swap reduced by the recovery value of the reference obligation in a cash settled trade. Recovery values are at times established through the credit event auction process in which market participants are ensured that a transparent price has been set for the defaulted security or obligation. In addition, the Fund is entitled to a return of any assets, which have been pledged as collateral to the counterparty upon settlement.
The maximum potential amount of future payments (undiscounted) that the Fund as seller of protection could be required to make under a credit default swap would be an amount equal to the notional amount of the agreement. These potential amounts would be partially offset by any recovery values of the respective referenced obligations or net amounts received from a settlement of a credit default swap for the same reference security or obligation where the Fund bought credit protection.
B. Level 3 Fair Value Investments — To the extent that significant inputs to valuation models and other alternative pricing sources are unobservable, or if quotations are not readily available, or if GSAM believes that such quotations do not accurately reflect fair value, the fair value of the Fund’s investments may be determined under the Valuation Procedures. GSAM, consistent with its procedures and applicable regulatory guidance, may make an adjustment to the most recent valuation prices of either domestic or foreign securities in light of significant events to reflect what it believes to be the fair value of the securities at the time of determining a Fund’s NAV. To the extent investments are valued using single source broker quotations obtained directly from the broker or passed through from third party pricing vendors, such investments are classified as Level 3 investments.
C. Fair Value Hierarchy — The following is a summary of the Fund’s investments and derivatives classified in the fair value hierarchy as of December 31, 2023:
| | | | | | | | | | | | |
| Core Fixed Income Fund | | | | | | | | | | | | |
| | | |
| Investment Type | | Level 1 | | | Level 2 | | | Level 3 | |
|
| |
| | | |
Assets | | | | | | | | | | | | |
| | | |
Fixed Income | | | | | | | | | | | | |
| | | |
Asset- Backed Securities | | $ | — | | | $ | 12,331,127 | | | $ | — | |
| | | |
Collateralized Mortgage Obligations | | | — | | | | 709,032 | | | | — | |
| | | |
Commercial Mortgage-Backed Securities | | | — | | | | 4,236,961 | | | | — | |
| | | |
Corporate Bond | | | — | | | | 35,184,449 | | | | — | |
| | | |
Foreign Bond | | | — | | | | 6,157,531 | | | | — | |
| | | |
Foreign Government Securities | | | — | | | | 1,435,170 | | | | — | |
| | | |
Mortgage-Backed Securities | | | — | | | | 48,410,788 | | | | — | |
| | | |
Municipal Bond | | | — | | | | 1,229,834 | | | | — | |
| | | |
U.S. Government Agency Securities | | | — | | | | 3,065,148 | | | | — | |
| | | |
U.S. Treasury Obligations | | | 27,177,173 | | | | — | | | | — | |
| | | |
Investment Company | | | 896,009 | | | | — | | | | — | |
|
| |
| | | |
Total | | $ | 28,073,182 | | | $ | 112,760,040 | | | $ | — | |
|
| |
| | | |
Liabilities | | | | | | | | | | | | |
| | | |
Fixed Income | | | | | | | | | | | | |
| | | |
Forward Sales Contracts | | $ | — | | | $ | (11,578,646 | ) | | $ | — | |
|
| |
| | | |
| Derivative Type | | | | | | | | | |
|
| |
| | | |
Assets | | | | | | | | | | | | |
| | | |
Credit Default Swap Contracts(a) | | $ | — | | | $ | 131,376 | | | $ | — | |
| | | |
Forward Foreign Currency Exchange Contracts(a) | | | — | | | | 89,581 | | | | — | |
| | | |
Futures Contracts(a) | | | 249,952 | | | | — | | | | — | |
| | | |
Interest Rate Swap Contracts(a) | | | — | | | | 660,127 | | | | — | |
| | | |
Purchased Options Contracts | | | — | | | | 1,951 | | | | — | |
|
| |
| | | |
Total | | $ | 249,952 | | | $ | 883,035 | | | $ | — | |
|
| |
| | | |
Liabilities | | | | | | | | | | | | |
| | | |
Forward Foreign Currency Exchange Contracts(a) | | $ | — | | | $ | (108,173 | ) | | $ | — | |
CORE FIXED INCOME FUND
|
Notes to Financial Statements (continued) December 31, 2023 |
|
|
3. INVESTMENTS AND FAIR VALUE MEASUREMENTS (continued) |
| | | | | | | | | | | | |
| | | |
Futures Contracts(a) | | $ | (77,846 | ) | | $ | — | | | $ | — | |
| | | |
Interest Rate Swap Contracts(a) | | | — | | | | (405,785 | ) | | | — | |
| | | |
Written Options Contracts | | | — | | | | (1,615 | ) | | | — | |
|
| |
| | | |
Total | | $ | (77,846 | ) | | $ | (515,573 | ) | | $ | — | |
|
| |
| | (a) | Amount shown represents unrealized gain (loss) at fiscal year end. |
For further information regarding security characteristics, see the Schedule of Investments.
|
|
4. INVESTMENTS IN DERIVATIVES |
The following table sets forth, by certain risk types, the gross value of derivative contracts (not considered to be hedging instruments for accounting disclosure purposes) as of December 31, 2023. These instruments were used as part of the Fund’s investment strategies and to obtain and/or manage exposure related to the risks below. The values in the tables below exclude the effects of cash collateral received or posted pursuant to these derivative contracts, and therefore are not representative of the Fund’s net exposure
| | | | | | | | | | | | |
| Core Fixed Income Fund | | | | | | | | | | |
| | | | | | | | | | | | |
| | | | |
| Risk | | Statement of Assets and Liabilities | | Assets1 | | | Statement of Assets and Liabilities | | Liabilities1 | |
| | | | |
| Credit | | Receivable for unrealized gain on swap contracts | | $ | 131,376 | | | | | $ | — | |
| Currency | | Receivables for unrealized gain on forward foreign currency exchange contracts | | | 89,581 | | | Payable for unrealized loss on forward foreign currency exchange contracts | | $ | (108,173 | ) |
| Interest Rate | | Purchased options at value, Variation margin on futures and swaps contracts | | | 912,031 | | | Written options at value, Variation margin on futures and swaps contracts | | | (485,246 | ) |
| | | | |
Total | | | | $ | 1,132,988 | | | | | $ | (593,419 | ) |
| | 1 | Includes unrealized gain (loss) on futures contracts described in the Additional Investment Information sections of the Schedule of Investments. Only the variation margin as of December 31, 2023 is reported within the Statement of Assets and Liabilities. |
The following table sets forth, by certain risk types, the Fund’s gains (losses) related to these derivatives and their indicative volumes for the fiscal year ended December 31, 2023. These gains (losses) should be considered in the context that these derivative contracts may have been executed to create investment opportunities and/or economically hedge certain investments, and accordingly, certain gains (losses) on such derivative contracts may offset certain (losses) gains attributable to investments. These gains (losses) are included in “Net realized gain (loss)” or “Net change in unrealized gain (loss)” on the Statement of Operations:
| | | | | | | | | | |
| Core Fixed Income Fund | | | | | | | | |
| | | |
| Risk | | Statement of Operations | | Net Realized
Gain (Loss) | | | Net Change in
Unrealized
Gain (Loss) | |
| Currency | | Net realized gain (loss) from forward currency exchange contracts/Net change in unrealized gain (loss) on forward currency exchange contracts | | $ | (34,040 | ) | | $ | 5,537 | |
| Credit | | Net realized gain (loss) from swap contracts/Net change in unrealized gain (loss) on swap contracts | | | 158,225 | | | | 140,992 | |
| Interest Rate | | Net realized gain (loss) from futures and swap contracts/Net change in unrealized gain (loss) on futures and swap contracts | | | (12,571 | ) | | | 341,432 | |
| | | |
Total | | | | $ | 111,614 | | | $ | 487,961 | |
CORE FIXED INCOME FUND
|
|
4. INVESTMENTS IN DERIVATIVES (continued) |
| | | | | | | | | | | | | | | | |
| | | Average number of Contracts or Notional Amounts(a) |
| | | | | |
| Fund | | Futures Contracts | | | Forward Contracts | | | Swap Contracts | | | Purchased Options | | Written Options |
| | | | | |
Core Fixed Income Fund | | | 165 | | | | 86,101,210 | | | | 1,310,102,447 | | | 5,580,000 | | 40,529,167 |
| | (a) | Amounts disclosed represent average number of contracts for futures contracts, notional amounts for forward contracts, swap agreements, purchased and written swaptions, or shares/units outstanding for purchased options and written options, based on absolute values, which is indicative of volume of this derivative type, for the months that the Fund held such derivatives during the fiscal year ended December 31, 2023. |
|
|
5. AGREEMENTS AND AFFILIATED TRANSACTIONS |
A. Management Agreement — Under the Agreement, GSAM manages the Fund, subject to the general supervision of the Trustees.
As compensation for the services rendered pursuant to the Agreement, the assumption of the expenses related thereto and administration of the Fund’s business affairs, including providing facilities, GSAM is entitled to a management fee, accrued daily and paid monthly, equal to an annual percentage rate of the Fund’s average daily net assets.
For the fiscal year ended December 31, 2023, contractual and effective net management fees with GSAM were at the following rates:
| | | | | | | | | | | | | | |
| | | Contractual Management Rate | | | | |
| | | | | | | |
| Fund | | First
$1 billion | | Next
$1 billion | | Next
$3 billion | | Next
$3 billion | | Over
$8 billion | | Effective Rate | | Effective Net Management Rate^ |
|
|
| | | | | | | |
Core Fixed Income Fund | | 0.40% | | 0.36% | | 0.34% | | 0.33% | | 0.32% | | 0.40% | | 0.40% |
|
|
| | ^ | Effective Net Management Rate includes the impact of management fee waivers of affiliated Underlying Funds, if any. The Effective Net Management Rate may not correlate to the Contractual Management Rate as a result of management fee waivers that may be in effect from time to time. |
The Fund invests in Institutional Shares of the Goldman Sachs Financial Square Government Fund, which is an affiliated Underlying Fund. GSAM has agreed to waive a portion of its management fee payable by the Fund in an amount equal to the management fee it earns as an investment adviser to the affiliated Underlying Fund in which the Fund invest. For the fiscal year ended December 31, 2023, GSAM waived $1,922 of the Fund’s management fee.
B. Distribution and/or Service (12b-1) Plans — The Trust, on behalf of Service Shares of the Fund, has adopted a Distribution and Service Plan subject to Rule 12b-1 under the Act. Under the Distribution and Service Plan, Goldman Sachs, which serves as distributor (the “Distributor”), is entitled to a fee accrued daily and paid monthly for distribution services and personal and account maintenance services, which may then be paid by Goldman Sachs to authorized dealers, equal to, on an annual basis, 0.25% of the Fund’s average daily net assets attributable to Service Shares.
C. Transfer Agency Agreement — Goldman Sachs also serves as the transfer agent of the Fund for a fee pursuant to the Transfer Agency Agreement. The fees charged for such transfer agency services are accrued daily and paid monthly at an annual rate of 0.02% of the average daily net assets of Institutional and Service Shares.
D. Other Expense Agreements and Affiliated Transactions — GSAM has agreed to reduce or limit certain “Other Expenses” of the Fund (excluding acquired fund fees and expenses, transfer agency fees and expenses, service fees and shareholder administration fees (as applicable), taxes, interest, brokerage fees, expenses of shareholder meetings, litigation and indemnification, and extraordinary expenses) to the extent such expenses exceed, on an annual basis, a percentage rate of the average daily net assets of the Fund. Such Other Expense reimbursements, if any, are accrued daily and paid monthly. In addition, the Fund is not obligated to reimburse GSAM for prior fiscal year expense reimbursements, if any. The Other Expense limitations as an annual percentage rate of average daily net assets for the Fund is 0.004%. These Other Expense limitations will remain in place through at least April 28, 2024, and prior to such date GSAM may not terminate the arrangements without the approval of the Trustees. In addition, the Fund has entered into certain offset arrangements with the custodian and the transfer agent, which may result in a reduction of the Fund’s expenses and are received irrespective of the application of the “Other Expense” limitations described above.
CORE FIXED INCOME FUND
|
Notes to Financial Statements (continued) December 31, 2023 |
|
|
5. AGREEMENTS AND AFFILIATED TRANSACTIONS (continued) |
For the fiscal year ended December 31, 2023, these expense reductions, including any fee waivers and Other Expense reimbursements, were as follows:
| | | | | | |
| Fund | | Management
Fee Waiver | | Other Expense
Reimbursements | | Total Expense
Reductions |
|
|
| | | |
Core Fixed Income Fund | | $ 1,922 | | $ 238,522 | | $ 240,444 |
|
|
E. Line of Credit Facility — As of December 31, 2023, the Fund participated in a $1,110,000,000 committed, unsecured revolving line of credit facility (the “facility”) together with other funds of the Trust and certain registered investment companies having management agreements with GSAM or its affiliates. This facility is to be used for temporary emergency purposes, or to allow for an orderly liquidation of securities to meet redemption requests. The interest rate on borrowings is based on the federal funds rate. The facility also requires a fee to be paid by the Fund based on the amount of the commitment that has not been utilized. For the fiscal year ended December 31, 2023, the Fund did not have any borrowings under the facility. Prior to April 19, 2023, the facility was $1,250,000,000.
F. Other Transactions with Affiliates —The following table provides information about the Fund’s investment in the Goldman Sachs Financial Square Government Fund as of and for the fiscal year ended December 31, 2023:
| | | | | | | | | | | | | | | | | | | | | | | | |
| Fund | | Beginning value
as of December
31, 2022 | | | Purchases at Cost | | | Proceeds from
Sales | | | Ending value as of
December 31, 2023 | | | Shares as of
December 31, 2023 | | | Dividend Income | |
|
| |
| | | | | | |
Core Fixed Income Fund | | $ | 5,716,986 | | | $ | 33,529,835 | | | $ | (38,350,812 | ) | | $ | 896,009 | | | $ | 896,009 | | | $ | 55,203 | |
|
| |
|
|
6. PORTFOLIO SECURITIES TRANSACTIONS |
The cost of purchases and proceeds from sales and maturities of long-term securities for the fiscal year ended December 31, 2023, were as follows:
| | | | | | | | |
| Fund | | Purchase of
U.S. Government and
Agency Obligations | | Purchases (Excluding
U.S. Governement and
Agency Obligations) | | Sales and Maturities of
U.S. Government and
Agency Obligations | | Sales and Maturities (Excluding
U.S. Government and
Agency Obligations) |
|
|
| | | | |
Core Fixed Income Fund | | $ 26,317,001 | | $ 1,489,202,296 | | $ 10,654,365 | | $ 1,487,584,435 |
|
|
The tax character of distributions paid during the year ended December 31, 2023 were as follows:
| | |
| | | Core Fixed Income
Fund |
|
|
| |
Distributions paid from: | | |
| |
Ordinary Income | | $ 3,565,028 |
|
|
|
The tax character of distributions paid during the fiscal year ended December 31, 2022 were as follows: |
| | | Core Fixed Income
Fund |
|
|
| |
Distributions paid from: | | |
| |
Ordinary Income | | $ 1,537,635 |
|
|
|
As of December 31, 2023, the components of accumulated earnings (losses) on a tax basis were as follows: |
CORE FIXED INCOME FUND
|
|
7. TAX INFORMATION (continued) |
| | | | |
| | | Core Fixed Income
Fund | |
| |
Undistributed ordinary income — net | | $ | 704,411 | |
| |
Capital loss carryforwards: | | | | |
| |
Perpetual Short-Term | | | (4,056,433 | ) |
| |
Perpetual Long-Term | | | (3,071,886 | ) |
| |
Total capital loss carryforwards | | | (7,128,319 | ) |
| |
Timing differences (straddle loss deferrals) | | | (55,349 | ) |
| |
Unrealized gains (losses) — net | | | (6,038,652 | ) |
| |
Total accumulated earnings (losses) — net | | $ | (12,517,909 | ) |
|
As of December 31, 2023, the Fund’s aggregate security unrealized gains and losses based on cost for U.S. federal income tax purposes were as follows: | |
| | | Core Fixed Income
Fund | |
| |
Tax Cost | | $ | 147,201,171 | |
| |
Gross unrealized gain | | | 2,573,209 | |
| |
Gross unrealized loss | | | (8,611,861 | ) |
| |
Net unrealized gain (loss) | | $ | (6,038,652 | ) |
The difference between GAAP-basis and tax-basis unrealized gains (losses) is attributable primarily to wash sales, net mark to market gains (losses) on regulated futures and foreign currency contracts, and differences in the tax treatment of market discount accretion and premium amortizations and swap transactions.
GSAM has reviewed the Fund’s tax positions for all open tax years (the current and prior three years, as applicable) and has concluded that no provision for income tax is required in the Fund’s financial statements. Such open tax years remain subject to examination and adjustment by tax authorities.
The Fund’s risks include, but are not limited to, the following:
Derivatives Risk — The Fund’s use of derivatives and other similar instruments (collectively referred to in this paragraph as “derivatives”) may result in loss, including due to adverse market movements. Derivatives, which may pose risks in addition to and greater than those associated with investing directly in securities, currencies or other assets and instruments, may increase market exposure and be illiquid or less liquid, volatile, difficult to price and leveraged so that small changes in the value of the underlying assets or instruments may produce disproportionate losses to the Fund. Certain derivatives are also subject to counterparty risk, which is the risk that the other party in the transaction will not, or lacks the capacity or authority to, fulfill its contractual obligations, liquidity risk, which includes the risk that the Fund will not be able to exit the derivative when it is advantageous to do so, and risks arising from margin requirements, which include the risk that the Fund will be required to pay additional margin or set aside additional collateral to maintain open derivative positions. The use of derivatives is a highly specialized activity that involves investment techniques and risks different from those associated with investments in more traditional securities and instruments. Losses from derivatives can also result from a lack of correlation between changes in the value of derivative instruments and the portfolio assets (if any) being hedged.
CORE FIXED INCOME FUND
|
Notes to Financial Statements (continued) December 31, 2023 |
|
|
8. OTHER RISKS (continued) |
Foreign and Emerging Countries Risk — Investing in foreign markets may involve special risks and considerations not typically associated with investing in the U.S. Foreign securities may be subject to risk of loss because of more or less foreign government regulation; less public information; less stringent investor protections; less stringent accounting, corporate governance, financial reporting and disclosure standards; and less economic, political and social stability in the countries in which the Fund invests. The imposition of sanctions, exchange controls (including repatriation restrictions), confiscation of assets and property, trade restrictions (including tariffs) and other government restrictions by the U.S. or other governments, or from problems in registration, settlement or custody, may also result in losses. The type and severity of sanctions and other similar measures, including counter sanctions and other retaliatory actions, that may be imposed could vary broadly in scope, and their impact is impossible to predict. For example, the imposition of sanctions and other similar measures could, among other things, cause a decline in the value and/or liquidity of securities issued by the sanctioned country or companies located in or economically tied to the sanctioned country and increase market volatility and disruption in the sanctioned country and throughout the world. Sanctions and other similar measures could limit or prevent the Fund from buying and selling securities (in the sanctioned country and other markets), significantly delay or prevent the settlement of securities transactions, and significantly impact the Fund’s liquidity and performance. Foreign risk also involves the risk of negative foreign currency exchange rate fluctuations, which may cause the value of securities denominated in such foreign currency (or other instruments through which the Fund has exposure to foreign currencies) to decline in value. Currency exchange rates may fluctuate significantly over short periods of time. To the extent that the Fund also invests in securities of issuers located in, or economically tied to, emerging markets, these risks may be more pronounced.
Interest Rate Risk — When interest rates increase, fixed income securities or instruments held by the Fund will generally decline in value. Long-term fixed income securities or instruments will normally have more price volatility because of this risk than short-term fixed income securities or instruments. A wide variety of market factors can cause interest rates to rise, including central bank monetary policy, rising inflation and changes in general economic conditions. Changing interest rates may have unpredictable effects on the markets, may result in heightened market volatility and may detract from Fund’s performance. In addition, changes in monetary policy may exacerbate the risks associated with changing interest rates. Funds with longer average portfolio durations will generally be more sensitive to changes in interest rates than funds with a shorter average portfolio duration. Fluctuations in interest rates may also affect the liquidity of fixed income securities and instruments held by the Fund. A sudden or unpredictable increase in interest rates may cause volatility in the market and may decrease the liquidity of the Fund’s investments, which would make it harder for the Fund to sell its investments at an advantageous time.
Investments in Other Investment Companies Risk — As a shareholder of another investment company, the Fund will indirectly bear its proportionate share of any net management fees and other expenses paid by such other investment companies, in addition to the fees and expenses regularly borne by the Fund.
Large Shareholder Transactions Risk — The Fund may experience adverse effects when certain large shareholders, such as other funds, institutional investors (including those trading by use of non-discretionary mathematical formulas), financial intermediaries (who may make investment decisions on behalf of underlying clients and/or include the Fund in their investment model), individuals, accounts and Goldman Sachs affiliates, purchase or redeem large amounts of shares of the Fund. Such large shareholder redemptions, which may occur rapidly or unexpectedly, may cause the Fund to sell portfolio securities at times when it would not otherwise do so, which may negatively impact the Fund’s NAV and liquidity. These transactions may also accelerate the realization of taxable income to shareholders if such sales of investments resulted in gains, and may also increase transaction costs. In addition, a large redemption could result in the Fund’s current expenses being allocated over a smaller asset base, leading to an increase in the Fund’s expense ratio. Similarly, large Fund share purchases may adversely affect the Fund’s performance to the extent that the Fund is delayed in investing new cash or otherwise maintains a larger cash position than it ordinarily would.
Market and Credit Risks — In the normal course of business, the Fund trades financial instruments and enters into financial transactions where risk of potential loss exists due to changes in the market (market risk). The value of the securities in which the Fund invests may go up or down in response to the prospects of individual companies, particular sectors or governments and/ or general economic conditions throughout the world due to increasingly interconnected global economies and financial markets. Events such as war, military conflict, acts of terrorism, social unrest, natural disasters, recessions, inflation, rapid interest rate
CORE FIXED INCOME FUND
|
|
8. OTHER RISKS (continued) |
changes, supply chain disruptions, sanctions, the spread of infectious illness or other public health threats could also significantly impact the Fund and its investments. Additionally, the Fund may also be exposed to credit risk in the event that an issuer or guarantor fails to perform or that an institution or entity with which the Fund has unsettled or open transactions defaults.
Mortgage-Backed and Other Asset-Backed Securities Risks — Mortgage-related and other asset-backed securities are subject to credit/ default, interest rate and certain additional risks, including “extension risk” (i.e., in periods of rising interest rates, issuers may pay principal later than expected) and “prepayment risk” (i.e., in periods of declining interest rates, issuers may pay principal more quickly than expected, causing the Fund to reinvest proceeds at lower prevailing interest rates). Due to these risks, asset-backed securities may become more volatile in certain interest rate environments. Mortgage-backed securities offered by non-governmental issuers are subject to other risks as well, including failures of private insurers to meet their obligations and unexpectedly high rates of default on the mortgages backing the securities, particularly during periods of rising interest rates. Other asset-backed securities are subject to risks similar to those associated with mortgage-backed securities, as well as risks associated with the nature and servicing of the assets backing the securities. Asset-backed securities may not have the benefit of a security interest in collateral comparable to that of mortgage assets, resulting in additional credit risk.
Under the Trust’s organizational documents, its Trustees, officers, employees and agents are indemnified, to the extent permitted by the Act and state law, against certain liabilities that may arise out of performance of their duties to the Fund. Additionally, in the course of business, the Fund enters into contracts that contain a variety of indemnification clauses. The Fund‘s maximum exposure under these arrangements is unknown, as this would involve future claims that may be made against the Fund that have not yet occurred. However, GSAM believes the risk of loss under these arrangements to be remote.
Pursuant to an effort to consolidate the membership of the Board of Trustees of the Trust (the “Board”) with the Board of Trustees of each of Goldman Sachs ETF Trust, Goldman Sachs ETF Trust II, Goldman Sachs Real Estate Diversified Income Fund, Goldman Sachs Trust II and Goldman Sachs Trust, in July 2023, the Board voted to nominate Cheryl K. Beebe, John G. Chou, Eileen H. Dowling, Lawrence Hughes, John F. Killian, Steven D. Krichmar, Michael Latham, Lawrence W. Stranghoener and Paul C. Wirth (the “Nominees”) for election as Trustees of the Trust. Messrs. Chou and Wirth and Ms. Dowling were serving as Trustees of the Trust at the time of their nominations. At a virtual special joint meeting of shareholders held on November 16, 2023, each of the Nominees (except Messrs. Chou and Wirth and Ms. Dowling) was elected to serve as Trustees alongside the then current Trustees of the Trust, effective January 1, 2024. Each of Messrs. Chou and Wirth and Ms. Dowling was also elected at the meeting and continue to serve as Trustees of the Trust.
Subsequent events after the Statement of Assets and Liabilities date have been evaluated, and GSAM has concluded that there is no impact requiring adjustment or disclosure in the financial statements.
CORE FIXED INCOME FUND
|
Notes to Financial Statements (continued) December 31, 2023 |
|
|
12. SUMMARY OF SHARE TRANSACTIONS |
Share activity is as follows:
| | | | | | | | | | | | | | | | |
| | | Core Fixed Income Fund | |
| | |
| | | For the Fiscal Year Ended
December 31, 2023 | | | For the Fiscal Year Ended
December 31, 2022 | |
| |
| | | | |
| | | | |
| | | Shares | | | Dollars | | | Shares | | | Dollars |
| |
| | | | |
| | | | |
Institutional Shares | | | | | | | | | | | | | | | | |
| | | | |
Shares sold | | | 954,001 | | | $ | 8,976,795 | | | | 1,549,382 | | | $ | 15,081,809 | |
| | | | |
Reinvestment of distributions | | | 138,907 | | | | 1,301,980 | | | | 51,565 | | �� | | 498,802 | |
| | | | |
Shares redeemed | | | (249,018 | ) | | | (2,354,053 | ) | | | (346,895 | ) | | | (3,639,227) | |
|
| |
| | | | |
| | | 843,890 | | | | 7,924,722 | | | | 1,254,052 | | | | 11,941,384 | |
|
| |
| | | | |
Service Shares | | | | | | | | | | | | | | | | |
| | | | |
Shares sold | | | 1,754,431 | | | | 16,624,257 | | | | 1,821,761 | | | | 18,196,134 | |
| | | | |
Reinvestment of distributions | | | 241,675 | | | | 2,263,048 | | | | 107,310 | | | | 1,038,833 | |
| | | | |
Shares redeemed | | | (665,325 | ) | | | (6,277,910 | ) | | | (669,929 | ) | | | (6,616,109) | |
|
| |
| | | | |
| | | 1,330,781 | | | | 12,609,395 | | | | 1,259,142 | | | | 12,618,858 | |
|
| |
| | | | |
NET INCREASE IN SHARES | | | 2,174,671 | | | $ | 20,534,117 | | | | 2,513,194 | | | $ | 24,560,242 | |
|
| |
Report of Independent Registered Public Accounting Firm
To the Board of Trustees of Goldman Sachs Variable Insurance Trust and Shareholders of Goldman Sachs Core Fixed Income Fund
Opinion on the Financial Statements
We have audited the accompanying statement of assets and liabilities, including the schedule of investments, of Goldman Sachs Core Fixed Income Fund (one of the funds constituting Goldman Sachs Variable Insurance Trust, referred to hereafter as the “Fund”) as of December 31, 2023, the related statement of operations for the year ended December 31, 2023, the statements of changes in net assets for each of the two years in the period ended December 31, 2023, including the related notes, and the financial highlights for each of the five years in the period ended December 31, 2023 (collectively referred to as the “financial statements”). In our opinion, the financial statements present fairly, in all material respects, the financial position of the Fund as of December 31, 2023, the results of its operations for the year then ended, the changes in its net assets for each of the two years in the period ended December 31, 2023 and the financial highlights for each of the five years in the period ended December 31, 2023 in conformity with accounting principles generally accepted in the United States of America.
Basis for Opinion
These financial statements are the responsibility of the Fund’s management. Our responsibility is to express an opinion on the Fund’s financial statements based on our audits. We are a public accounting firm registered with the Public Company Accounting Oversight Board (United States) (PCAOB) and are required to be independent with respect to the Fund in accordance with the U.S. federal securities laws and the applicable rules and regulations of the Securities and Exchange Commission and the PCAOB.
We conducted our audits of these financial statements in accordance with the standards of the PCAOB. Those standards require that we plan and perform the audit to obtain reasonable assurance about whether the financial statements are free of material misstatement, whether due to error or fraud.
Our audits included performing procedures to assess the risks of material misstatement of the financial statements, whether due to error or fraud, and performing procedures that respond to those risks. Such procedures included examining, on a test basis, evidence regarding the amounts and disclosures in the financial statements. Our audits also included evaluating the accounting principles used and significant estimates made by management, as well as evaluating the overall presentation of the financial statements. Our procedures included confirmation of securities owned as of December 31, 2023 by correspondence with the custodian, transfer agent and brokers; when replies were not received from brokers, we performed other auditing procedures. We believe that our audits provide a reasonable basis for our opinion.
/s/ PricewaterhouseCoopers LLP
Boston, Massachusetts
February 15, 2024
We have served as the auditor of one or more investment companies in the Goldman Sachs fund complex since 2000.
GOLDMAN SACHS VARIABLE INSURANCE TRUST CORE FIXED INCOME FUND
Fund Expenses — Six Month Period Ended December 31, 2023 (Unaudited)
As a shareholder of Institutional Shares and Service Shares of the Fund, you incur ongoing costs, including management fees; distribution and service (12b-1) fees (with respect to Service Shares); and other Fund expenses. This example is intended to help you understand your ongoing costs (in dollars) of investing in the Fund and to compare these costs with the ongoing costs of investing in other mutual funds.
The example is based on an investment of $1,000 invested at the beginning of the period and held for the entire period from July 1, 2023 through December 31, 2023, which represents a period of 184 days of a 365 day year.
Actual Expenses — The first line under each share class in the table below provides information about actual account values and actual expenses. You may use the information in this line, together with the amount you invested, to estimate the expenses that you paid over the period. Simply divide your account value by $1,000 (for example, an $8,600 account value divided by $1,000=8.6), then multiply the result by the number in the first line under the heading entitled “Expenses Paid” to estimate the expenses you paid on your account during this period.
Hypothetical Example for Comparison Purposes — The second line under each share class in the table below provides information about hypothetical account values and hypothetical expenses based on the Fund’s actual net expense ratio and an assumed rate of return of 5% per year before expenses, which is not the Fund’s actual return. The hypothetical account values and expenses may not be used to estimate the actual ending account balance or expenses you paid for the period. You may use this information to compare the ongoing costs of investing in the Fund and other funds. To do so, compare this 5% hypothetical example with the 5% hypothetical examples that appear in the shareholder reports of the other funds.
Please note that the expenses shown in the table are meant to highlight your ongoing costs only and do not reflect any transactional costs, such as sales charges, redemption fees, or exchange fees. Therefore, the second line of the table is useful in comparing ongoing costs only and will not help you determine the relative total costs of owning different funds. In addition, if these transactional costs were included, your costs would have been higher.
| | | | | | | | | | | | |
| | | Core Fixed Income Fund | |
| Share Class | | Beginning
Account Value
7/1/23 | | | Ending
Account Value
12/31/23 | | | Expenses
Paid for the 6 months
ended 12/31/23* | |
| Institutional | | | | | | | | | | | | |
Actual | | | $1,000.00 | | | | $1,034.90 | | | | $2.21 | |
Hypothetical 5% return | | | 1,000.00 | | | | 1,023.04+ | | | | 2.19 | |
| Service | | | | | | | | | | | | |
Actual | | | 1,000.00 | | | | 1,033.60 | | | | 3.49 | |
Hypothetical 5% return | | | 1,000.00 | | | | 1,021.78+ | | | | 3.47 | |
| + | Hypothetical expenses are based on each Fund’s actual annualized net expense ratios and an assumed rate of return of 5% per year before expenses. |
| * | Expenses are calculated using each Fund’s annualized net expense ratio for each class, which represents the ongoing expenses as a percentage of net assets for the six months ended December 31, 2023. Expenses are calculated by multiplying the annualized net expense ratio by the average account value for the period; then multiplying the result by the number of days in the most recent fiscal half year; and then dividing that result by the number of days in the fiscal year. The annualized net expense ratios for the period were 0.43% and 0.68% for Institutional Shares and Service Shares, respectively. |
42
GOLDMAN SACHS VARIABLE INSURANCE TRUST CORE FIXED INCOME FUND
Voting Results of Special Meeting of Shareholders (Unaudited)
A Special Meeting of Shareholders (the “Meeting”) of the Goldman Sachs Variable Insurance Trust (the “Trust”) was held on November 16, 2023 to consider and elect nominees to the Trust’s Board of Trustees. At the Meeting, Cheryl K. Beebe, Lawrence Hughes, John F. Killian, Steven D. Krichmar, Michael Latham and Lawrence W. Stranghoener were elected to the Trust’s Board of Trustees. In addition, at the Meeting, John G. Chou, Eileen H. Dowling and Paul C. Wirth, each of whom was previously appointed to the Trust’s Board of Trustees rather than elected by shareholders, were elected. In electing the nominees, the Trust’s shareholders voted as follows:
| | | | |
Proposal Election of Trustees | | For | | Withheld |
| | |
Cheryl K. Beebe | | 932,148,752 | | 26,776,872 |
| | |
John G. Chou | | 930,378,362 | | 28,547,262 |
| | |
Eileen H. Dowling | | 932,188,448 | | 26,737,175 |
| | |
Lawrence Hughes | | 932,346,926 | | 26,578,698 |
| | |
John F. Killian | | 931,754,574 | | 27,171,049 |
| | |
Steven D. Krichmar | | 932,002,203 | | 26,923,420 |
| | |
Michael Latham | | 931,832,553 | | 27,093,071 |
| | |
Lawrence W. Stranghoener | | 931,376,144 | | 27,549,480 |
| | |
Paul C. Wirth | | 932,041,013 | | 26,884,610 |
GOLDMAN SACHS VARIABLE INSURANCE TRUST CORE FIXED INCOME FUND
Trustees and Officers (Unaudited)
Independent Trustees
| | | | | | | | | | |
| | | | | |
Name, Address and Age1 | | Position(s) Held with the Trust | | Term of Office and Length of Time Served2 | | Principal Occupations During Past 5 Years | | Number of Portfolios in Fund Complex Overseen by Trustee3 | | Other Directorships Held by Trustee4 |
| | | | | |
Gregory G. Weaver Age: 72 | | Chair of the Board of Trustees | | Since 2023 (Trustee since 2015) | | Mr. Weaver is retired. He is Director, Verizon Communications Inc. (2015-Present); and was formerly Chairman and Chief Executive Officer, Deloitte & Touche LLP (a professional services firm) (2001-2005 and 2012-2014); and Member of the Board of Directors, Deloitte & Touche LLP (2006-2012). Chair of the Board of Trustees — Goldman Sachs Variable Insurance Trust and Goldman Sachs Trust. | | 102 | | Verizon Communications Inc. |
| | | | | |
Dwight L. Bush Age: 66 | | Trustee | | Since 2020 | | The Honorable Dwight Bush is President and CEO of D.L. Bush & Associates (a financial advisory and private investment firm) (2002-2014 and 2017-Present); Director of MoneyLion, Inc. (an operator of a data-driven, digital financial platform) (2021-Present); and was formerly U.S. Ambassador to the Kingdom of Morocco (2014- 2017) and a Member of the Board of Directors of Santander Bank, N.A. (2018-2019). Previously, he served as an Advisory Board Member of Goldman Sachs Trust and Goldman Sachs Variable Insurance Trust (October 2019-January 2020). Trustee — Goldman Sachs Variable Insurance Trust and Goldman Sachs Trust. | | 102 | | MoneyLion, Inc. (an operator of a data- driven, digital financial platform) |
| | | | | |
Kathryn A. Cassidy Age: 69 | | Trustee | | Since 2015 | | Ms. Cassidy is retired. She is Director, Vertical Aerospace Ltd. (an aerospace and technology company) (2021-Present). Formerly, Ms. Cassidy was Advisor to the Chairman (May 2014- December 2014); and Senior Vice President and Treasurer (2008-2014), General Electric Company & General Electric Capital Corporation (technology and financial services companies). Trustee — Goldman Sachs Variable Insurance Trust and Goldman Sachs Trust. | | 102 | | Vertical Aerospace Ltd. (an aerospace and technology company) |
| | | | | |
John G. Chou Age: 67 | | Trustee | | Since 2022 | | Mr. Chou is retired. Formerly, he was Executive Vice President and Special Advisor to the Chairman and CEO (2021-2022); Executive Vice President and Chief Legal Officer (2019-2021); Executive Vice President and Chief Legal & Business Officer (2017-2019); and Executive Vice President and General Counsel (2011-2017) of Cencora, Inc. (a pharmaceutical and healthcare company. Trustee — Goldman Sachs Variable Insurance Trust and Goldman Sachs Trust. | | 102 | | None |
| | | | | |
Joaquin Delgado Age: 63 | | Trustee | | Since 2020 | | Dr. Delgado is retired. He is Director, Stepan Company (a specialty chemical manufacturer) (2011-Present); and was formerly Director, Hexion Inc. (a specialty chemical manufacturer) (2019-2022); Executive Vice President, Consumer Business Group of 3M Company (July 2016-July 2019); and Executive Vice President, Health Care Business Group of 3M Company (October 2012-July 2016). Previously, Dr. Delgado served as an Advisory Board Member of Goldman Sachs Trust and Goldman Sachs Variable Insurance Trust (October 2019-January 2020). Trustee — Goldman Sachs Variable Insurance Trust and Goldman Sachs Trust. | | 102 | | Stepan Company (a specialty chemical manufacturer) |
| | | | | |
| | | | | | | | | | |
GOLDMAN SACHS VARIABLE INSURANCE TRUST CORE FIXED INCOME FUND
Trustees and Officers (Unaudited) (continued)
Independent Trustees
| | | | | | | | | | |
| | | | | |
Name, Address and Age1 | | Position(s) Held with the Trust | | Term of Office and Length of Time Served2 | | Principal Occupations During Past 5 Years | | Number of Portfolios in Fund��Complex Overseen by Trustee3 | | Other Directorships Held by Trustee4 |
| | | | | |
Eileen H. Dowling Age: 61 | | Trustee | | Since 2021 | | Ms. Dowling is retired. Formerly, she was Senior Advisor (April 2021-September 2021); and Managing Director (2013-2021), BlackRock, Inc. (a financial services firm). As Managing Director, she held senior management positions, including Global Head of Global Consultant Relations (2017-2021), Multinational Corporations (2019-2021), the Institutional Product Group (2015-2019) and Institutional Marketing (2013- 2016). Ms. Dowling was a member of the Global Operating Committee and Product Executive Committee of BlackRock. Trustee — Goldman Sachs Variable Insurance Trust and Goldman Sachs Trust. | | 102 | | None |
| | | | | |
Paul C. Wirth Age: 66 | | Trustee | | Since 2022 | | Mr. Wirth is retired. He is Executive Advisor, My Next Season LLC (a career transition advisory firm) (2023 – Present) Formerly, he was Deputy Chief Financial Officer and Principal Accounting Officer (2011-2020); Finance Director and Principal Accounting Officer (2010-2011); and Managing Director, Global Controller, and Chief Accounting Officer (2005-2010) of Morgan Stanley. Trustee — Goldman Sachs Variable Insurance Trust and Goldman Sachs Trust. | | 102 | | None |
| | | | | |
| | | | | | | | | | |
GOLDMAN SACHS VARIABLE INSURANCE TRUST CORE FIXED INCOME FUND
Trustees and Officers (Unaudited) (continued)
Interested Trustee*
| | | | | | | | | | |
| | | | | |
Name, Address and Age1 | | Position(s) Held with the Trust | | Term of Office and Length of Time Served2 | | Principal Occupations During Past 5 Years | | Number of Portfolios in Fund Complex Overseen by Trustee3 | | Other Directorships Held by Trustee4 |
| | | | | |
James A. McNamara Age: 61 | | President and Trustee | | Since 2007 | | Advisory Director, Goldman Sachs (January 2018-Present); Managing Director, Goldman Sachs (January 2000-December 2017); Director of Institutional Fund Sales, GSAM (April 1998- December 2000); and Senior Vice President and Manager, Dreyfus Institutional Service Corporation (January 1993-April 1998). President and Trustee — Goldman Sachs Variable Insurance Trust; Goldman Sachs Trust; Goldman Sachs Trust II; Goldman Sachs ETF Trust; Goldman Sachs ETF Trust II; Goldman Sachs Credit Income Fund; and Goldman Sachs Real Estate Diversified Income Fund. | | 192 | | None |
| | | | | |
| | | | | | | | | | |
| * | Mr. McNamara is considered to be an “Interested Trustee” because he holds positions with Goldman Sachs and owns securities issued by The Goldman Sachs Group, Inc. Mr. McNamara holds comparable positions with certain other companies of which Goldman Sachs, GSAM or an affiliate thereof is the investment adviser, administrator and/or distributor. |
| 1 | Each Trustee may be contacted by writing to the Trustee, c/o Goldman Sachs, 200 West Street, New York, New York, 10282, Attn: Robert Griffith. Information is provided as of December 31, 2023. |
| 2 | Subject to such policies as may be adopted by the Board from time-to-time, each Trustee holds office for an indefinite term, until the earliest of: (a) the election of his or her successor; (b) the date the Trustee resigns or is removed by the Board or shareholders, in accordance with the Trust’s Declaration of Trust; or (c) the termination of the Trust. The Board has adopted policies which provide that each Independent Trustee shall retire as of December 31st of the calendar year in which he or she reaches (a) his or her 75th birthday or (b) the 15th anniversary of the date he or she became a Trustee, whichever is earlier, unless a waiver of such requirements shall have been adopted by a majority of the other Trustees. These policies may be changed by the Trustees without shareholder vote. |
| 3 | The Goldman Sachs Fund Complex includes certain other companies listed above for each respective Trustee. As of December 31, 2023, Goldman Sachs Variable Insurance Trust consisted of 15 portfolios (11 of which offered shares to the public); Goldman Sachs Trust consisted of 87 portfolios; Goldman Sachs Trust II consisted of 18 portfolios (7 of which offered shares to the public); Goldman Sachs ETF Trust consisted of 68 portfolios (37 of which offered shares to the public); Goldman Sachs ETF Trust II consisted of 2 portfolios; and Goldman Sachs Credit Income Fund and Goldman Sachs Real Estate Diversified Income Fund each consisted of one portfolio. Goldman Sachs Credit Income Fund did not offer shares to the public. |
| 4 | This column includes only directorships of companies required to report to the Securities and Exchange Commission under the Securities Exchange Act of 1934 (i.e., “public companies”) or other investment companies registered under the Act. |
Additional information about the Trustees is available in the Fund’s Statement of Additional Information, which can be obtained from Goldman Sachs free of charge by calling this toll-free number (in the United States of America): 1-800-526-7384.
GOLDMAN SACHS VARIABLE INSURANCE TRUST CORE FIXED INCOME FUND
Trustees and Officers (Unaudited) (continued)
Officers of the Trust*
| | | | | | |
| | | |
| Name, Address and Age1 | | Position(s) Held with the Trust | | Term of Office and Length of Time Served2 | | Principal Occupations During Past 5 Years |
| | | |
James A. McNamara 200 West Street New York, NY 10282 Age: 61 | | Trustee and President | | Since 2007 | | Advisory Director, Goldman Sachs (January 2018-Present); Managing Director, Goldman Sachs (January 2000-December 2017); Director of Institutional Fund Sales, GSAM (April 1998-December 2000); and Senior Vice President and Manager, Dreyfus Institutional Service Corporation (January 1993-April 1998). President and Trustee — Goldman Sachs Variable Insurance Trust; Goldman Sachs Trust; Goldman Sachs Trust II; Goldman Sachs ETF Trust; Goldman Sachs ETF Trust II; Goldman Sachs Credit Income Fund; and Goldman Sachs Real Estate Diversified Income Fund. |
| | | |
Robert Griffith 200 West Street New York, NY 10282 Age: 49 | | Secretary | | Since 2023 | | Managing Director, Goldman Sachs (September 2022 – Present); General Counsel, Exchange Traded Concepts, LLC (October 2021 – September 2022); Vice President, Goldman Sachs (August 2011 – October 2021); Associate General Counsel, Goldman Sachs (December 2014 – Present); Assistant General Counsel, Goldman Sachs (August 2011 – December 2014); Vice President and Counsel, Nomura Holding America, Inc. (2010 – 2011); and Associate, Simpson Thacher & Bartlett LLP (2005 – 2010). Secretary—Goldman Sachs Variable Insurance Trust; (previously Assistant Secretary (2022));Goldman Sachs Trust (previously Assistant Secretary (2022)); Goldman Sachs Trust II (previously Assistant Secretary (2022)); Goldman Sachs ETF Trust (previously Assistant Secretary (2022)); Goldman Sachs ETF Trust II; (previously Assistant Secretary (2022)); and Goldman Sachs Real Estate Diversified Income Fund (previously Assistant Secretary (2022)). |
| | | |
Joseph F. DiMaria 30 Hudson Street Jersey City, NJ 07302 Age: 55 | | Treasurer, Principal Financial Officer and Principal Accounting Officer | | Since 2017 (Treasurer and Principal Financial Officer since 2019) | | Managing Director, Goldman Sachs (November 2015-Present) and Vice President — Mutual Fund Administration, Columbia Management Investment Advisers, LLC (May 2010- October 2015). Treasurer, Principal Financial Officer and Principal Accounting Officer — Goldman Sachs Variable Insurance Trust (previously Assistant Treasurer (2016)); Goldman Sachs Trust (previously Assistant Treasurer (2016)); Goldman Sachs Trust II (previously Assistant Treasurer (2017)); Goldman Sachs ETF Trust (previously Assistant Treasurer (2017)); Goldman Sachs ETF Trust II; Goldman Sachs Credit Income Fund; and Goldman Sachs Real Estate Diversified Income Fund. |
| | | |
| | | | | | |
| * | Represents a partial list of officers of the Trust. Additional information about all the officers is available in the Fund’s Statement of Additional Information, which can be obtained from Goldman Sachs free of charge by calling this toll-free number (in the United States): 1-800-526-7384. |
| 1 | Information is provided as of December 31, 2023. |
| 2 | Officers hold office at the pleasure of the Board of Trustees or until their successors are duly elected and qualified. Each officer holds comparable positions with certain other companies of which Goldman Sachs, GSAM or an affiliate thereof is the investment adviser, administrator and/or distributor. |
Goldman Sachs Variable Insurance Trust — Tax Information (Unaudited)
For the year ended December 31, 2023, the Core Fixed Income Fund designated 100% of the dividends paid from net investment company taxable income as section 163(j) Interest Dividends.
(This page intentionally left blank)
(This page intentionally left blank)
TRUSTEES TRUSTEES (continued) Gregory G. Weaver, Chair Michael Latham* Cheryl K. Beebe* James A. McNamara Dwight L. Bush Lawrence W. Stranghoener* Kathryn A. Cassidy Paul C. Wirth John G. Chou * Effective January 1, 2024 Joaquin Delgado Eileen H. Dowling OFFICERS Lawrence Hughes* James A. McNamara, President John F. Killian* Joseph F. DiMaria, Principal Financial Officer, Steven D. Kirchmar* Principal Accounting Officer and Treasurer Robert Griffith, Secretary GOLDMAN SACHS & CO. LLC GOLDMAN SACHS ASSET MANAGEMENT, L.P. Distributor and Transfer Agent Investment Adviser 200 West Street, New York New York 10282 Visit our website at www.GSAMFUNDS.com to obtain the most recent month-end returns. The reports concerning the Fund included in this shareholder report may contain certain forward-looking statements about the factors that may affect the performance of the Fund in the future. These statements are based on Fund management’s predictions and expectations concerning certain future events and their expected impact on the Fund, such as performance of the economy as a whole and of specific industry sectors, changes in the levels of interest rates, the impact of developing world events, and other factors that may influence the future performance of the Fund. Management believes these forward-looking statements to be reasonable, although they are inherently uncertain and difficult to predict. Actual events may cause adjustments in portfolio management strategies from those currently expected to be employed. A description of the policies and procedures that the Fund uses to determine how to vote proxies relating to portfolio securities and information regarding how the Fund voted proxies relating to portfolio securities during the most recent 12-month period ended June 30 is available (i) without charge, upon request by calling 1-800-621-2550; and (ii) on the Securities and Exchange Commission (“SEC”) web site at http://www.sec.gov. The Fund will file its portfolio holdings information for each month in a fiscal quarter within 60 days after the end of the relevant fiscal quarter on Form N-PORT. Portfolio holdings information for the third month of each fiscal quarter will be made available on the SEC’s web site at http://www.sec.gov. Portfolio holdings information may be obtained upon request and without charge by calling 1-800-526-7384 (for Retail Shareholders) or 1-800-621-2550 (for Institutional Shareholders). Views and opinions expressed are for informational purposes only and do not constitute a recommendation by Goldman Sachs Asset Management to buy, sell, or hold any security. Views and opinions are current as of the date of this presentation and may be subject to change, they should not be construed as investment advice. Goldman Sachs & Co. LLC (“Goldman Sachs”) does not provide legal, tax or accounting advice. Any statement contained in this communication (including any attachments) concerning U.S. tax matters was not intended or written to be used, and cannot be used, for the purpose of avoiding penalties under the Internal Revenue Code, and was written to support the promotion or marketing of transaction or matter addressed. Clients of Goldman Sachs should obtain their own independent tax advice based on their particular circumstances. The website links provided are for your convenience only and are not an endorsement or recommendation by Goldman Sachs Asset Management of any of these websites or the products or services offered. Goldman Sachs Asset Management is not responsible for the accuracy and validity of the content of these websites. Economic and market forecasts presented herein reflect our judgment as of the date of this presentation and are subject to change without notice. These forecasts do not take into account the specific investment objectives, restrictions, tax and financial situation or other needs of any specific client. Actual data will vary and may not be reflected here. These forecasts are subject to high levels of uncertainty that may affect actual performance. Accordingly, these forecasts should be viewed as merely representative of a broad range of possible outcomes. These forecasts are estimated, based on assumptions, and are subject to significant revision and may change materially as economic and market conditions change. Goldman Sachs has no obligation to provide updates or changes to these forecasts. Case studies and examples are for illustrative purposes only. Fund holdings and allocations shown are as of December 31, 2023 and may not be representative of future investments. Fund holdings should not be relied on in making investment decisions and should not be construed as research or investment advice regarding particular securities. Current and future holdings are subject to risk. References to indices, benchmarks or other measures of relative market performance over a specified period of time are provided for your information only and do not imply that the portfolio will achieve similar results. The index composition may not reflect the manner in which a portfolio is constructed. While an adviser seeks to design a portfolio which reflects appropriate risk and return features, portfolio characteristics may deviate from those of the benchmark. The Global Industry Classification Standard (“GICS”) was developed by and is the exclusive property and a service mark of Morgan Stanley Capital International Inc. (“MSCI”) and Standard & Poor’s, a division of The McGraw-Hill Companies, Inc. (“S&P”) and is licensed for use by Goldman Sachs. Neither MSCI, S&P nor any other party involved in making or compiling the GICS or any GICS classifications makes any express or implied warranties or representations with respect to such standard or classification (or the results to be obtained by the use thereof), and all such parties hereby expressly disclaim all warranties of originality, accuracy, completeness, merchantability or fitness for a particular purpose with respect to any of such standard or classification. Without limiting any of the foregoing, in no event shall MSCI, S&P, any of their affiliates or any third party involved in making or compiling the GICS or any GICS classifications have any liability for any direct, indirect, special, punitive, consequential or any other damages (including lost profits) even if notified of the possibility of such damages. The portfolio risk management process includes an effort to monitor and manage risk, but does not imply low risk. Shares of the Goldman Sachs VIT Funds are offered to separate accounts of participating life insurance companies for the purpose of funding variable annuity contracts and variable life insurance policies. Shares of the Fund are not offered directly to the general public. The variable annuity contracts and variable life insurance policies are described in the separate prospectuses issued by participating insurance companies. You should refer to those prospectuses for information about surrender charges, mortality and expense risk fees and other charges that may be assessed by participating insurance companies under the variable annuity contracts or variable life insurance policies. Such fees or charges, if any, may affect the return you may realize with respect to your investments. Ask your representative for more complete information. Please consider a fund’s objectives, risks and charges and expenses, and read the prospectus carefully before investing. The prospectus contains this and other information about the Fund. This material is not authorized for distribution to prospective investors unless preceded or accompanied by a current prospectus or summary prospectus, if applicable. Investors should consider the Fund’s objective, risks, and charges and expenses, and read the summary prospectus, if available, and/or the prospectus carefully before investing or sending money. The summary prospectus, if available, and the prospectus contain this and other information about the Fund and may be obtained from your authorized dealer or from Goldman Sachs & Co. LLC by calling 1-800-621-2550. This report is prepared for the general information of contract owners and is not an offer of shares of the Goldman Sachs Variable Insurance Trust Funds. © 2024 Goldman Sachs. All rights reserved. VITFIAR-24/356409-OTU-02/2024
Goldman Sachs Variable Insurance Trust Goldman Sachs International Equity Insights Fund Goldman Sachs Large Cap Value Fund Goldman Sachs Mid Cap Growth Fund Goldman Sachs Mid Cap Value Fund Goldman Sachs Small Cap Equity Insights Fund Goldman Sachs Strategic Growth Fund Goldman Sachs U.S. Equity Insights Fund Annual Report December 31, 2023
Goldman Sachs Variable Insurance Trust
| | |
| ∎ | | GOLDMAN SACHS INTERNATIONAL EQUITY INSIGHTS FUND |
| | |
| ∎ | | GOLDMAN SACHS LARGE CAP VALUE FUND |
| | |
| ∎ | | GOLDMAN SACHS MID CAP GROWTH FUND |
| | |
| ∎ | | GOLDMAN SACHS MID CAP VALUE FUND |
| | |
| ∎ | | GOLDMAN SACHS SMALL CAP EQUITY INSIGHTS FUND |
| | |
| ∎ | | GOLDMAN SACHS STRATEGIC GROWTH FUND |
| | |
| ∎ | | GOLDMAN SACHS U.S. EQUITY INSIGHTS FUND |
TABLE OF CONTENTS
|
| |
Effective January 24, 2023, open-end mutual funds and exchange traded funds will be required to provide shareholders with streamlined annual and semi-annual shareholder reports (“Tailored Shareholder Reports”). Funds will be required to prepare a separate Tailored Shareholder Report for each share class of a fund that highlights key information to investors. Other information, including financial statements, will no longer appear in a fund’s shareholder report, but will be available online, delivered free of charge upon request, and filed with the SEC on a semi-annual basis on Form N-CSR. The new requirements have a compliance date of July 24, 2024. |
| | | | | | |
| | | | |
| NOT FDIC-INSURED | | May Lose Value | | No Bank Guarantee | | |
MARKET REVIEW
Goldman Sachs Variable Insurance Trust Funds
Market Review
U.S. Equities
In a sharp reversal from 2022, the S&P 500® Index (the “S&P 500 Index”), representing the U.S. equity market, returned 26.29% during the 12 months ended December 31, 2023 (the “Reporting Period”), closing the calendar year with the best fourth quarter since 2003. Such strong performance, however, masks volatility and a wide range of challenges.
In the first quarter of 2023, the S&P 500 Index gained 7.53%, marking its second straight quarterly gain. Among the factors behind the market’s strength were disinflation narrative momentum, soft economic landing expectations, and a lowered bar for fourth quarter 2022 corporate earnings. (A soft landing, in economics, is a cyclical downturn that avoids recession. It typically describes attempts by central banks to raise interest rates just enough to stop an economy from overheating and experiencing high inflation, without causing a significant increase in unemployment, or a hard landing.) Following a stellar start to the year, February proved to be a setback for the disinflation path after nonfarm payrolls illustrated the largest job growth in six months, and the unemployment rate fell to a 53-year low, which pushed market forecasts for the Fed’s terminal rate up. In addition, January inflation data saw their largest monthly increases since mid-2022, illustrating that more work was needed to combat inflation. While fourth quarter 2022 corporate earnings did disappoint as margins came under pressure by persistently high input costs and weaker demand, the labor market outlook appeared to be positive due to supply-chain enhancements, ongoing consumer resilience and consensus expectations for inflation pressures to diminish as 2023 progressed. Consensus forecasts for the Fed’s interest rate path took a dovish turn in March due to an abrupt banking crisis that escalated the risk of raising rates. Economic data in March also contributed to the dovish sentiment.
The S&P 500 Index returned 8.74% in the second quarter of 2023. The market’s strength was predominately driven by disinflation momentum, an upswing in soft landing expectations, consumer resilience, a better than consensus expected first quarter corporate earnings season, and persistent enthusiasm around artificial intelligence (“AI”), including the possibility for a boom in AI-related chipmakers. Growth stocks significantly outperformed their value counterparts, as mega-cap technology stocks accounted for the vast majority of the S&P 500 Index’ rally in the quarter. Inflation reached its lowest level in more than two years on the back of lower energy prices. The soft landing narrative took form with a still-tight labor market and robust housing market helping to counteract the possibility of a recession. First quarter corporate earnings metrics, though supported by a lower bar, were well above their one-year averages due to a combination of pricing power, supply-chain normalizations, cost-cutting initiatives and margin expansion. Despite U.S. equity market strength in the quarter, the implacable “higher for longer” messaging from the Fed remained an overhang. Concentrated leadership was another critical concern for investors that raised doubts about the sustainability of the U.S. equity market rally. On the geopolitical front, a slower than consensus expected economic recovery in China presented a setback for the market.
In the third quarter of 2023, the S&P 500 Index returned -3.27%, marking its first quarterly decline of the calendar year. The S&P 500 Index started off strong in the first two months of the quarter, reaching its year-to-date 2023 high at the end of July before a sharp pullback in September. Although economic activity remained resilient, the market declined mostly due to a pickup in soft landing concerns, surging energy prices and disinflationary pressures on corporate earnings. Concerns about a looming threat of a federal government shutdown, consumer impacts from student loan repayments resuming, and a strike against automakers by the United Auto Workers union that began in September further weighed on investor sentiment. The Fed acted in line with consensus forecasts, hiking interest rates by 25 basis points in July and keeping rates unchanged at 5.25%-5.50% in September. (A basis point is 1/100th of a percentage point.) However, the Fed’s “higher for longer” narrative appeared to gain further recognition from investors. On the earnings front, S&P 500 Index companies saw earnings decline 4.21% in the second calendar quarter from a year earlier, marking the third consecutive quarter of negative earnings growth.
The S&P 500 Index gained 11.69% in the fourth quarter of 2023, finishing the year nearly eclipsing its all-time high. The quarter saw a broadening of market leadership following the mega-cap dominance for most of the calendar year. U.S. equity markets began the quarter with negative momentum, as investors digested a more resilient than consensus expected U.S. economy and a “higher for longer” Fed interest rate regime. The market then shifted direction in November and December. November saw the most significant easing in financial conditions of any month in more than four decades. Market sentiment took a positive turn on the back of an overall shift in tonality from Fed officials signaling potential easing of monetary policy in 2024, a gradual cooldown in economic activity while the labor market remained resilient, and a rally across U.S. Treasuries marking one of the best monthly performances
MARKET REVIEW
on record—all underpinning soft landing and disinflation traction themes. The Fed held interest rates unchanged throughout the quarter, as growth of the U.S. economy slowed, the unemployment rate remained low despite abating job gains, and inflationary pressures continued to trend downwards. Near the end of the quarter, there was a major shift in the Fed’s policy path expectations, with the Summary of Economic Projections median dot plot signaling 75 basis points of rate cuts in 2024. (The Fed’s dot plot shows the interest rate projections of the members of the Federal Open Market Committee.) U.S. economic data provided further evidence of disinflation momentum, with November’s annualized core Consumer Price Index dropping to its lowest level since September 2021 and core Personal Consumption Expenditure Index increasing 1.9% on a six-month annualized basis, measuring below the Fed’s inflation target of 2% for the first time in more than three years. Market seasonality proved to be another tailwind to equities during the quarter, as November and December historically represent the strongest two-month period for U.S. stocks.
For the Reporting Period overall, nine of the 11 sectors in the S&P 500 Index posted positive absolute returns. Information technology was the best performing sector in the S&P 500 Index, as measured by total return, followed by communication services and consumer discretionary. The weakest performing sectors in the S&P 500 Index during the Reporting Period were utilities and energy—the only two to post negative absolute returns.
Within the U.S. equity market, all capitalization segments posted double-digit positive returns, with large-cap stocks, as measured by the Russell 1000® Index, performing best. Mid-cap stocks, as measured by the Russell Midcap® Index, and small-cap stocks, as measured by the Russell 2000® Index, followed, with these two market segments posting returns similar to each other. From a style perspective, growth-oriented stocks materially outperformed value-oriented stocks across the capitalization spectrum but most significantly within the large-cap segment of the market. (All as measured by the FTSE Russell indices.)
International Equities
International equities rallied strongly but lagged the U.S. equity market during the Reporting Period. The MSCI Europe, Australasia, Far East (EAFE) Index (Net, USD, Unhedged) (the “MSCI EAFE Index”) posted a return of 18.24%.*
International equities performed well during the first quarter of 2023 overall. Markets gained in January on the back of consensus expectations around peaking inflation in the U.S. and Europe, the slowing pace of central bank interest rate hikes and receding concerns about recession. China finally lifted its stringent zero-COVID policy, which increased global hopes around the resolution of supply-chain disruptions and economic recovery driven by strong domestic consumption. Several companies announced job cuts, but the overall job market remained in good shape, raising optimism around the mild impact of a potential impending global recession. February saw a pullback in international equity market performance, as market sentiment was governed by dampening expectations around potential peaking of interest rate hikes, ongoing geopolitical tensions between Russia and Ukraine, and a re-escalation of U.S./China tensions. Japan saw its highest level of inflation in 40 years. However, international equities rebounded in March, with market sentiment most influenced by speculation around the potential peaking of inflation, the slowing pace of central bank interest rate hikes and receding concerns about a global recession—all despite U.S. and European regional banking tensions.
During the second quarter of 2023, international equities gained, albeit more modestly than in the prior quarter. International equity markets recovered slightly in April from the banking turmoil that plagued March. In Europe, although manufacturing lagged, headline inflation fell sharply as energy prices fell globally. China enjoyed strong economic growth, but geopolitical concerns around U.S./China tensions continued to weaken investor sentiment toward the country. The Japanese equity market rose for the fourth consecutive month, particularly notable in light of the new Bank of Japan governor declaring a commitment to a loose monetary easing policy and famed investor Warren Buffett declaring that he planned to add to his Japanese equity investments. In May, international equities declined. Globally, high inflation rates persisted, dampening market sentiment, while sustained wage growth raised concerns around peak central bank policy rates potentially being higher than consensus expected. In the U.K., inflation hit a 31-year high. Concerns surrounding the U.S. debt ceiling also loomed over the markets during the month. International equities then rebounded in June. The Bank of England (“BoE”) hiked its interest rates more than consensus expected to combat persistent inflation, encouraging other central banks to continue policy tightening. China’s recovery-fueled momentum slowed. In Japan, import prices began to ease along with other inflation drivers.
The third quarter of 2023 was a challenging one for international equities, marked by persistent inflation, contractionary economic concerns, particularly in Europe, and further interest rate hikes. Recession fears were renewed by a steep rise in oil prices. Further, a selloff in global bond markets put increased pressure on risk assets. In Europe, concerns persisted around the contractionary effect of elevated interest rates on the economy as the European Central Bank (“ECB”) raised rates twice in the quarter. However,
MARKET REVIEW
inflation in Europe fell to a two-year low, and the ECB suggested its September hike may be the last. The U.K. equity market gained modestly for the quarter, largely supported by its energy sector, which benefited from increased oil prices. The market also benefited from sterling, its currency, depreciation relative to the U.S. dollar. Additionally, U.K. markets showed signs of improving consumer confidence. The BoE raised rates more than consensus expected in July and once more in August before ending its run of 14 consecutive rate hikes in September. The Japanese equity market also gained modestly during the quarter, with weakness in the yen and strong domestic demand major tailwinds. In July, the Bank of Japan endorsed higher bond yields and signaled toward a potential end to negative interest rates by calendar year end. In China, lower economic growth and real estate market concerns continued to plague its equity market, despite new stimulus policies.
International equities rallied strongly in the fourth quarter of 2023, fueled by expectations of interest rate cuts in 2024 amid falling inflation numbers and a fizzling out of the “higher for longer” narrative. In Europe, equities were weak in October but then recovered to close out the year. Headline inflation in December ticked up from November; however, core inflation fell. U.K. equities posted positive returns overall but lagged other geographies during the quarter due to sterling appreciation and a large exposure to the underperforming energy sector. Although U.K. GDP growth entered negative territory during the quarter, markets were buoyed by expectations of an ending rate hike cycle. As a result, domestic small-cap and mid-cap stocks performed especially well. The Japanese equity market similarly posted positive, albeit modest, returns for the quarter. Yen appreciation was a headwind for Japanese equities. Further, expectations of rate cuts and dovish U.S. Fed moves were positive news for Japanese equities. The December 2023 Bank of Japan Tankan survey signaled toward improving business sentiment. However, the Bank of Japan’s December meeting, though not featuring any policy or rate changes, slightly dampened consensus expectations of an imminent end to its negative policy rates.
For the Reporting Period overall, all 11 sectors of the MSCI EAFE Index gained, led by information technology, industrials and consumer discretionary. Consumer staples, real estate and health care were the weakest performers on the basis of total return, though still produced positive absolute returns during the Reporting Period.
From a country perspective, Italy, Ireland and Spain were the strongest constituents of the MSCI EAFE Index during the Reporting Period, based on total return. The only individual country constituents of the MSCI EAFE Index to post negative absolute returns during the Reporting Period were Hong Kong, Canada and Finland.
*All index returns are expressed in U.S. dollar terms.
GOLDMAN SACHS VARIABLE INSURANCE TRUST INTERNATIONAL EQUITY INSIGHTS FUND
INVESTMENT OBJECTIVE
The Fund seeks long-term growth of capital.
Portfolio Management Discussion and Analysis
Below, the Goldman Sachs Quantitative Investment Strategies Team discuss the Goldman Sachs Variable Insurance Trust — Goldman Sachs International Equity Insights Fund’s (the “Fund”) performance and positioning for the 12-month period ended December 31, 2023 (the “Reporting Period”).
How did the Fund perform during the Reporting Period?
During the Reporting Period, the Fund’s Institutional and Service Shares generated average annual total returns of 18.71% and 18.43%, respectively. These returns compare to the 18.24% average annual total return of the Fund’s benchmark, the MSCI Europe, Australasia, Far East (EAFE) Index (net, USD, unhedged) (the “MSCI EAFE Index”), during the same time period.
What key factors were responsible for the Fund’s performance during the Reporting Period?
The Fund uses a quantitative style of management, in combination with a qualitative overlay, that emphasizes fundamentally-based stock selection, careful portfolio construction and efficient implementation.
During the Reporting Period, the Fund outperformed the MSCI EAFE Index on a relative basis, with all four of our quantitative model’s investment themes contributing positively to results. Stock selection overall, driven by these investment themes, boosted relative performance.
Which investment themes helped and which hurt within the Team’s stock selection strategy?
In keeping with our investment approach, we use our quantitative model and four investment themes to take a long-term view of market patterns and look for inefficiencies, selecting stocks for the Fund and overweighting or underweighting the ones chosen by the model. Over time and by design, the performance of any one of the model’s investment themes tends to have a low correlation with the model’s other themes, demonstrating the diversification benefit of the Fund’s theme-driven quantitative model. The variance in performance supports our research indicating that the diversification provided by the Fund’s different investment themes is a significant investment advantage over the long term, even though the Fund may experience underperformance in the short term. Of course, diversification does not protect an investor from market risk nor does it ensure a profit.
As mentioned, during the Reporting Period, all four of our investment themes contributed positively to the Fund’s relative returns. Sentiment Analysis added most, followed by Fundamental Mispricings, High Quality Business Models and Market Themes & Trends. Sentiment Analysis seeks to identify stocks experiencing improvements in their overall market sentiment. Fundamental Mispricings seeks to identify high quality businesses trading at a fair price, which we believe may lead to strong performance over the long run. High Quality Business Models seeks to identify companies that are generating high quality revenues with sustainable business models and aligned management incentives. Market Themes & Trends seeks to identify companies positively positioned to benefit from themes and trends in the market and macroeconomic environment.
How did the Fund’s sector and industry allocations affect relative performance during the Reporting Period?
In constructing the Fund’s portfolio, we focus on picking stocks rather than making sector or industry bets. Consequently, the Fund is similar to its benchmark, the MSCI EAFE Index, in terms of its sector and industry allocations and style. Relative performance is primarily driven by stock selection, not by sector or industry allocations.
Did stock selection help or hurt Fund performance during the Reporting Period?
We seek to outpace the MSCI EAFE Index by overweighting stocks that we expect to outperform and underweighting those that we think may lag. At the same time, we strive to maintain a risk profile similar to the MSCI EAFE Index. The Fund’s investments are selected using fundamental research and a variety of quantitative techniques based on our investment themes. For example, the Fund aims to hold a basket of stocks with better Fundamental Mispricings characteristics than the benchmark index.
During the Reporting Period, stock selection overall helped the Fund’s performance, with investments in the consumer discretionary, industrials and real estate sectors contributing most positively to results relative to the MSCI EAFE Index. Holdings in the energy, consumer staples and financials sectors detracted from relative results during the Reporting Period.
GOLDMAN SACHS VARIABLE INSURANCE TRUST INTERNATIONAL EQUITY INSIGHTS FUND
Which individual stock positions contributed the most to the Fund’s relative returns during the Reporting Period?
The Fund benefited most from overweight positions in Japan-based semiconductor production equipment manufacturer SCREEN Holdings, Japan-based heavy machinery maker Mitsubishi Heavy Industries and Japan-based steel producer and other metals supplier Kobe Steel. The overweight in SCREEN Holdings was fueled mainly by our Sentiment Analysis and Fundamental Mispricings investment themes. The overweight in Mitsubishi Heavy Industries was based primarily on our Sentiment Analysis and Market Themes & Trends investment themes. The overweight in Kobe Steel was driven by our Sentiment Analysis and Fundamental Mispricings investment themes.
Which individual positions detracted from the Fund’s results during the Reporting Period?
Detracting most from the Fund’s results relative to the MSCI EAFE Index were overweight positions in U.K.-based multinational tobacco products manufacturer British American Tobacco, Denmark-based biotechnology company Genmab and Norway-based international energy company Equinor. The overweight in British American Tobacco was implemented because of our Fundamental Mispricings and High Quality Business Models themes. The overweight in Genmab was based primarily on our High Quality Business Models and Sentiment Analysis investment themes. The overweight in Equinor was driven primarily by our Market Themes & Trends and Fundamental Mispricings investment themes.
Which countries helped or hurt the Fund’s relative performance during the Reporting Period?
Compared to the MSCI EAFE Index, the Fund was helped most by its positioning in Japan, France and Germany. Positioning in the U.K., Australia and Norway detracted most from the Fund’s relative results during the Reporting Period.
How did the Fund use derivatives during the Reporting Period?
During the Reporting Period, we used equity index futures contracts, on an opportunistic basis, to equitize the Fund’s cash holdings. In other words, we put the Fund’s cash holdings to work by using them as collateral for the purchase of stock futures. The use of these derivatives did not have a material impact on Fund results during the Reporting Period.
Did you make any enhancements to your quantitative models during the Reporting Period?
We continuously look for ways to improve our investment process. During the Reporting Period, within our Sentiment Analysis investment theme, we implemented an enhancement across all regions except Japan that aims to improve our sentiment identification in earnings call reports by utilizing many of the latest developments in machine learning and natural language processing (“NLP”). In our High Quality Business Models investment theme, we implemented a new signal across all regions that aims to apply U.S. consumer spending data to non-U.S. companies to help predict their future returns. Across all regions, we implemented two new signals within our Market Themes & Trends investment theme. The first signal leverages advanced machine learning algorithms to capture nuanced behavior of our existing suite of more than a hundred alpha factors. The second signal aims to apply NLP techniques to account for fine-grained linguistic meaning of documents when quantifying company linkages for text-based cross-stock momentum factors.
In fact, we introduced several new signals and enhancements during the Reporting Period that leverage machine learning techniques, such as NLP, as well as those that are based on different types of alternative data sources. The Team’s new NLP-based signals utilize the transformer architecture to be able to extract insights from different bodies of text. For example, within the Sentiment Analysis investment theme, we introduced a suite of signals that seeks to identify changes in sentiment within company regulatory filings and documents by using advanced NLP models to synthesize the context of the language used within the document. In addition to the NLP-based signals, we also introduced a new signal that seeks to capture the level of attention stocks receive as a result of being mentioned in news articles and blog posts. We believe companies that receive outsized attention in the media experience positive, but temporary, price trends that ultimately revert over the longer term. We also introduced new signals within the Market Themes & Trends investment theme. The first signal introduced in all regions except Japan leverages NLP and topic modeling techniques to identify economic linkages between companies based on their current descriptions. Additionally, we implemented a suite of signals that leverage word embedding techniques to capture the meanings of the words and language used with employer reviews in order to identify the economic linkages between companies mentioned.
Lastly, we extended a signal from our U.S. regional models to the U.K. and Europe regional models that focuses on consumers’ spending growth trends, as we believe companies with exposure to segments of the market that are exhibiting changes in consumer spending trends may also experience a similar impact to their expected sales growth.
What changes did you make to the Fund’s country weightings during the Reporting Period?
During the Reporting Period, we increased the Fund’s positions relative to the MSCI EAFE Index in Germany, Japan, Switzerland and Hong Kong. We decreased the Fund’s positions relative to the MSCI EAFE Index in Sweden, France, Australia, Norway, Denmark and the U.K.
GOLDMAN SACHS VARIABLE INSURANCE TRUST INTERNATIONAL EQUITY INSIGHTS FUND
What were the Fund’s sector and country weightings at the end of the Reporting Period?
As of December 31, 2023, the Fund was overweight the financials, information technology and real estate sectors relative to the MSCI EAFE Index. The Fund was underweight consumer staples, health care and energy and was rather neutral to the MSCI EAFE Index in consumer discretionary, industrials, utilities, materials and communication services on the same date.
In terms of countries, the Fund was overweight relative to the MSCI EAFE Index in Germany, Switzerland and Japan at the end of the Reporting Period. Compared to the MSCI EAFE Index, the Fund was underweight in the U.K. and was relatively neutral compared to the MSCI EAFE Index in the remaining constituents of the MSCI EAFE Index at the end of the Reporting Period.
Were there any changes to the Fund’s portfolio management team during the Reporting Period?
There were no changes to the Fund’s portfolio management team during the Reporting Period.
What is your strategy going forward for the Fund?
Looking ahead, we continue to believe that less expensive stocks should outpace more expensive stocks, and stocks with good momentum are likely to outperform those with poor momentum. We intend to maintain our focus on seeking companies about which fundamental research analysts are becoming more positive as well as profitable companies with sustainable earnings and a track record of using their capital to enhance shareholder value. As such, we anticipate remaining fully invested with long-term performance likely to be the result of stock selection rather than sector or capitalization allocations.
We stand behind our investment philosophy that sound economic investment principles, coupled with a disciplined quantitative approach, can provide strong, uncorrelated returns over the long term. Our research agenda is robust, and we continue to enhance our existing models, add new proprietary forecasting signals and improve our trading execution as we seek to provide the most value to our shareholders.
FUND BASICS
International Equity Insights Fund
as of December 31, 2023
|
|
TOP TEN HOLDINGS AS OF 12/31/231 |
| | | | | | |
| | | |
Holding | | % of
Net Assets | | Line of Business | | Country |
| | | |
ASML Holding NV | | 2.7% | | Semiconductors & Semiconductor Equipment | | Netherlands |
| | | |
Nestle SA | | 2.1 | | Food Products | | United States |
| | | |
Roche Holding AG | | 1.9 | | Pharmaceuticals | | United States |
| | | |
Novo Nordisk A/S, Class B | | 1.9 | | Pharmaceuticals | | Denmark |
| | | |
SAP SE | | 1.9 | | Software | | Germany |
| | | |
Novartis AG | | 1.8 | | Pharmaceuticals | | Switzerland |
| | | |
Shell PLC | | 1.5 | | Oil, Gas & Consumable Fuels | | Netherlands |
| | | |
Air Liquide SA | | 1.4 | | Chemicals | | France |
| | | |
BHP Group Ltd. | | 1.3 | | Metals & Mining | | Australia |
| | | |
UBS Group AG | | 1.3 | | Capital Markets | | Switzerland |
| | 1 | The top 10 holdings may not be representative of the Fund’s future investments. |
|
|
FUND VS. BENCHMARK SECTOR ALLOCATIONS2 |
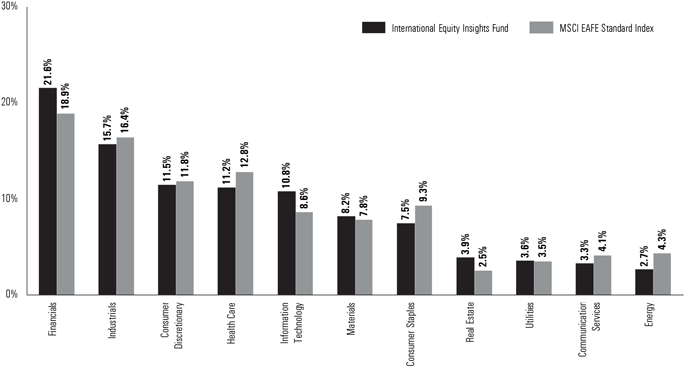
| | 2 | The Fund is actively managed and, as such, its composition may differ over time. Consequently, the Fund’s overall sector allocations may differ from percentages contained in the graph above. The graph categorizes investments using Global Industry Classification Standard (“GICS”); however, the sector classifications used by the portfolio management team may differ from GICS. The percentage shown for each investment category reflects the value of investments in that category as a percentage of market value |
FUND BASICS
| | (excluding investments in the securities lending reinvestment vehicle, if any). The graph depicts the Fund’s investments but may not represent the Fund’s market exposure due to the exclusion of certain derivatives, if any, as listed in the Additional Investment Information section of the Schedule of Investments. |
| | | For more information about the Fund, please refer to www.GSAMFUNDS.com. There, you can learn more about the Fund’s investment strategies, holdings, and performance. |
GOLDMAN SACHS VARIABLE INSURANCE TRUST INTERNATIONAL EQUITY INSIGHTS FUND
Performance Summary
December 31, 2023
The following graph shows the value, as of December 31, 2023, of a $10,000 investment made on January 1, 2014 in Institutional Shares at NAV. For comparative purposes, the performance of the Fund’s benchmark, the MSCI EAFE Standard Index (Net, USD, Unhedged), is shown. Performance reflects applicable fee waivers and/or expense limitations in effect during the periods shown and, in their absence, performance would be reduced. Returns do not reflect the deduction of taxes that a shareholder would pay on Fund distributions or the redemption of Fund shares. The returns set forth below represent past performance. Past performance does not guarantee future results. The Fund’s investment return and principal value will fluctuate so that an investor’s shares, when redeemed, may be worth more or less than their original cost. Current performance may be lower or higher than the performance quoted below. Please visit our web site at www.GSAMFUNDS.com to obtain the most recent month-end returns.
|
|
International Equity Insights Fund’s 10 Year Performance |
|
Performance of a $10,000 investment, with distributions reinvested, from January 1, 2014 through December 31, 2023. |
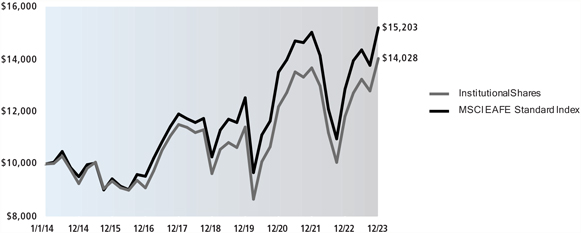
| | | | | | |
| | | |
Average Annual Total Returns through December 31, 2023* | | One Year | | Five Years | | Ten Years |
| | | |
Institutional | | 18.71% | | 7.80% | | 3.44% |
| | | | | | | |
| | | |
Service | | 18.43% | | 7.55% | | 3.19% |
| | | | | | | |
| * | These returns assume reinvestment of all distributions at NAV. Because Institutional and Service Shares do not involve sales charge, such a charge is not applied to their Average Annual Total Returns. |
GOLDMAN SACHS VARIABLE INSURANCE TRUST LARGE CAP VALUE FUND
INVESTMENT OBJECTIVE
The Fund seeks long-term capital appreciation.
Portfolio Management Discussion and Analysis
Below, the Goldman Sachs Fundamental Equity U.S. Equity Portfolio Management Team discusses the Goldman Sachs Variable Insurance Trust — Goldman Sachs Large Cap Value Fund’s (the “Fund”) performance and positioning for the 12-month period ended December 31, 2023 (the “Reporting Period”).
How did the Fund perform during the Reporting Period?
During the Reporting Period, the Fund’s Institutional and Service Shares generated average annual total returns of 13.01% and 12.71%, respectively. These returns compare to the 11.46% average annual total return of the Fund’s benchmark, the Russell 1000® Value Index (with dividends reinvested) (the “Russell Index”) during the same time period.
What key factors were responsible for the Fund’s performance during the Reporting Period?
The Fund posted double-digit positive absolute returns that outperformed the Russell Index on a relative basis during the Reporting Period due primarily to stock selection decisions overall. Sector allocation positioning as a whole detracted, albeit modestly.
Which equity market sectors most significantly affected Fund performance?
Stock selection in the information technology, industrials and materials sectors contributed most positively to the Fund’s relative results during the Reporting Period. Having an overweighted allocation to information technology, the second-strongest sector in the Russell Index during the Reporting Period, also boosted relative results. Only partially offsetting these positive contributors was stock selection in the financials, utilities and energy sectors, which detracted from the Fund’s relative results during the Reporting Period. Allocation positioning in the financials and utilities sectors further dampened the Fund’s relative performance.
What were some of the Fund’s best-performing individual stocks?
Relative to the Russell Index, the Fund benefited most from positions in technology infrastructure and computer company Dell Technologies, customer relationship management software provider Salesforce and industrials conglomerate General Electric.
Shares of Dell Technologies, a new purchase for the Fund during the Reporting Period, appreciated on the back of strong artificial intelligence (“AI”)-induced momentum, as investors saw the company as a beneficiary of the investment cycle and as the company demonstrated the ability to surpass consensus expectations. Most of the company’s stock strength came after it announced second quarter 2023 results well ahead of consensus estimates, as the company stated it was seeing AI-related benefits come to fruition. The results were driven by AI servers and better margins on its personal computers. The company additionally saw improved cash flow, an alleviation of working capital issues, and an excess of cash that should bode well, in our view, for return of capital plans. At the end of the Reporting Period, we believed the personal computer market was close to bottoming, as units sold were back to pre-pandemic levels and channel inventory had come down substantially. As consensus expectations had been heavily de-risked, we believed estimates should move higher as the company shows execution and the ability to return to historically free cash flow conversion levels in the near term. Further, Dell Technologies maintains, in our opinion, a strong balance sheet, and we expected even more return of capital going forward.
Salesforce’s strength commenced in the beginning of 2023 when the company announced a 10% reduction in its workforce along with a broader reduction in costs across the business. Furthermore, it was announced that Elliot Investment Management initiated a multi-billion dollar stake in the company, which was reflected positively in its stock price. In March 2023, the company reported its fourth quarter 2022 earnings, which largely beat consensus expectations, driven by growth in its cloud-based customer relationship management business that has more than 150,000 customers globally. The company’s stock gained further on the news that Elliot Investment Management dropped its plan to nominate directors to Salesforce’s Board of Directors after its strong earnings. The company kept this momentum going as it reported first quarter 2023 earnings better than consensus expected across virtually all metrics. Finally, the company reported a solid third quarter 2023, illustrating a slight beat of consensus expectations on revenue and margins. Further, Salesforce’s management narrowed its full fiscal year guidance to the upper end of its previous range and increased its margin guidance on ongoing strength. Its commentary focused on positive traction in AI products and improvement in the overall spending environment. At the end of the Reporting Period, we remained positive on the company, as it has demonstrated, in our opinion, impressive margin expansion, and we continued to have confidence in the capital return opportunity in Salesforce’s stock. We further believed its management is well equipped to navigate relatively conservative guidance and is focused on margin expansion by being more disciplined with capital. In our view, an improving spending environment should bode well for the company.
GOLDMAN SACHS VARIABLE INSURANCE TRUST LARGE CAP VALUE FUND
General Electric’s (“GE”) share price appreciated in January 2023 on the news of a solid fourth quarter 2022 earnings release, with the company’s core business reporting results ahead of consensus expectations. Additionally, investors reacted positively to GE’s newly-deleveraged business in the wake of the then-recent spinoff of its healthcare segment. GE’s stock appreciated further after the company reaffirmed its 2023 guidance and announced its expectations for greater aerospace profits. The company continued this trend by announcing two big quarters ahead of consensus expectations, as GE then had the fastest free cash flow and earnings growth rates of large-cap industrial companies. Such momentum was further illustrated in its third quarter 2023 earnings results, wherein the company continued to demonstrate strong execution, leading to a beat of consensus expectations in earnings and another guidance raise for the next quarter given that its onshore business turned profitable, free cash flow improved, and the company updated the timing for its next spinoff to early second quarter 2024. At the end of the Reporting Period, we continued to like GE for its leading aerospace exposure, which we believed was still below mid-cycle—as well as the improvement and energy transition opportunities within its power business—all, in our view, at an attractive valuation. We also continued to believe the company’s balance sheet was strong and effective management execution was illustrating a promising path ahead.
Which stocks detracted significantly from the Fund’s performance during the Reporting Period?
Among those companies detracting most from the Fund’s results relative to the Russell Index were positions in pharmaceuticals company Bristol-Myers Squibb, wealth management and securities brokerage firm Charles Schwab and regional bank First Republic Bank.
Much of the negative performance of Bristol-Myers Squibb was attributed to ongoing pessimism around the declining sales of Revlimid, a cancer drug threatened by generic alternatives. The company did report third quarter 2023 bottom-line earnings ahead of consensus expectations in October 2023, but the company’s stock continued to decline through November, as Revlimid sales continued to struggle. Additionally, investors reacted negatively to an announcement mid-November that the U.S. Food and Drug Administration delayed approval of earlier use of another cancer treatment drug. Overall, at the end of the Reporting Period, we believed generics erosion had already been accounted for by investors, and the company’s future growth profile would be determined by sales from its new product portfolios, which, in our view, was on track to potentially offset its patent cliff. (Patent cliff refers to a sharp decline in revenue or profitability when a firm’s patents expire, opening them up to competition. Patent cliffs are particularly salient in the pharmaceutical industry, when generic drug makers may begin grabbing market share.) As more pipeline wins come in, we believed the stock should perform well. We maintain conviction that the company was well positioned financially, with a strong balance sheet and enough products in its pipeline to renew its growth trajectory.
During the Reporting Period, Charles Schwab’s share price initially depreciated along with the broader financial sector, as regional bank fears spread, causing concerns around possible outflows from the brokerage firm. While the stock declined, the company saw an elevated level of inflows, as a bank-type run did not occur, and customers saw the company as more of a safe haven amid the volatile market environment. The company also demonstrated it had ample liquidity and could continue to operate even in a deposit flight scenario. Ultimately, while we like the company in the longer term, we exited the Fund position, as we believed Charles Schwab might face further pressure from client cash sorting, as customers moved money from bank accounts into other asset classes to take advantage of higher rates.
First Republic Bank engages in the provision of private banking, business banking, real estate lending and wealth management. In the first quarter of 2023, its stock price declined, driven by broader fears in the banking industry, as regional banks demonstrated an asset-liability mismatch in invested securities that caused concerns among customers and led to withdrawals of balances in favor of larger financial institutions. While we had liked its underlying business, we decided to sell the Fund’s position in First Republic Bank, as perception often drives stock prices and fear around the solvency of regional banks caused volatility in the sub-industry.
How did the Fund use derivatives and similar instruments during the Reporting Period?
During the Reporting Period, we did not use derivatives as part of an active management strategy.
Did the Fund make any significant purchases or sales during the Reporting Period?
During the Reporting Period, in addition to the purchase of Dell Technologies, mentioned earlier, we established a Fund position in Danaher, a global science and technology conglomerate. The company had struggled in the first half of 2023 given the soft biotechnology spending environment and as the company was forced to lower its guidance. We bought its shares because we became more comfortable with the macroeconomic conditions, as we believed most of the poor spending conditions were priced in and that emerging biotechnology spending had bottomed. Further, we believe the bioprocessing end-market for tools may well be the first to recover, as we expect excess channel inventory to normalize—an area in which Danaher has meaningful exposure.
We initiated a Fund position in global payment and travel company American Express during the Reporting Period. Its stock price declined in line with the rest of the financials sector in March 2023, dropping 12% in one week, and we viewed this as an attractive entry point from a valuation standpoint. We believe the company is well positioned, as it is more insulated from inflation than its peers. We are also optimistic about the company because there is high visibility into card fee growth accelerating due to its premium customer base, new customer acquisition driving spending growth, and corporate spending increasing as it is still not at pre-pandemic levels.
GOLDMAN SACHS VARIABLE INSURANCE TRUST LARGE CAP VALUE FUND
Conversely, in addition to those sales already mentioned, we sold the Fund’s position in ConocoPhillips, an oil and natural gas exploration and production company, during the Reporting Period. While we like the company in the longer term, we decided to reallocate capital given our reservations around its valuation and medium-term catalysts. We ultimately sold the position in favor of what we saw as other more attractive risk/reward opportunities.
We exited the Fund’s position in multinational investment bank and financial services company Morgan Stanley during the Reporting Period. While we still like the company in the long term, its stock had been a relative outperformer versus its peers during the Reporting period, causing it to trade a relative premium. Further, its management had guided to flat net interest income in the near term. Given the events in the industry, investors were focused on this metric and on margin headwinds the company faced. In turn, we preferred to rotate capital into companies in which we had more conviction for the medium to long term.
Were there any notable changes in the Fund’s weightings during the Reporting Period?
In constructing the Fund’s portfolio, we focus on picking stocks rather than on making industry or sector bets. We seek to outpace the benchmark index by overweighting stocks that we expect to outperform and underweighting those that we think may lag. Consequently, changes in its sector weights are generally the direct result of individual stock selection or of stock appreciation or depreciation. That said, during the Reporting Period, the Fund’s exposure compared to the Russell Index to communication services, materials and real estate increased. The Fund’s allocations compared to the Russell Index in industrials decreased.
How was the Fund positioned relative to its benchmark index at the end of the Reporting Period?
At the end of December 2023, the Fund had overweighted positions relative to the Russell Index in the materials and health care sectors. On the same date, the Fund had underweighted positions compared to the Russell Index in financials and energy and was rather neutrally weighted to the Russell Index in the communication services, consumer discretionary, consumer staples, industrials, information technology, real estate and utilities sectors.
Were there any changes to the Fund’s portfolio management team during the Reporting Period?
There were no changes to the Fund’s portfolio management team during the Reporting Period.
What is the Fund’s tactical view and strategy for the months ahead?
Following a weak 2022, major U.S. equity indices reversed course in 2023, recording strong calendar year performance chiefly driven by a momentous rally from some of the largest mega-cap technology names, dubbed the “Magnificent Seven.” U.S. equities especially surged in the last two months of the fourth quarter of 2023, as the broader market and economy proved to be resilient—overcoming adversities from a banking crisis uprise that challenged depositors’ faith in regional banks, uncertainty surrounding the delayed effects of the Federal Reserve’s (“Fed”) monetary tightening regime on the U.S. economy, and heightened geopolitical tensions in Europe and the Middle East. At the end of 2023, we remained constructive on the U.S. equity market given that inflation was rather steadily approaching the Fed’s 2% target, a recession did not appear imminent, and then-recent economic data releases evidenced economic resilience, including a healthy labor market.
At the end of the Reporting Period, we believed there were several tailwinds to economic growth going forward, including strong real household income growth, a recovery in manufacturing activity, and an increased willingness of Fed officials to cut interest rates if disinflation persists. In our view, the Fed will likely take a cautious approach to cutting rates, although the latest Summary of Economic Projections published that the Fed’s voting members forecast a median federal funds rate of 4.6% by the end of 2024, penciling in 75 basis points of rate cuts to the Fed’s benchmark rate. (A basis point is 1/100th of a percentage point.)
In our view, throughout the coming year, market participants may well need to adapt to disruption from constant innovation, as governments and companies continue to invest in AI research, technology-enabled health care, and sustainability trends. We believe each of these themes had and will continue to transform industries long term, creating growth opportunities as well as a wide dispersion between companies. It is possible that election year uncertainty in 2024 may suppress risk appetite and increase volatility, though historically, once uncertainty is resolved, equity market performance is more correlated to fiscal and monetary policy. Ultimately, while the Fed seems to have steered away from a hard landing scenario during its tightening cycle, external shocks or an unexpected pivot to policy easing may rekindle inflation in a way that would require a recession to bring it lower.
We believe our extensive bottom-up research approach can be beneficial to navigating these evolving themes and heightened volatility, while also positioning investors to benefit from the next upcycle. Regardless of market direction, we intend to stay true to our quality-first investment approach and seek to invest in businesses with healthy balance sheets, relatively stable cash flows and differentiated business models aligned to secular tailwinds. We continue to test our models and re-evaluate our assumptions with increasing information, remain focused on the long-term investment horizon and believe this fundamental approach can generate added value in the long run. As always, we maintain our focus on undervalued companies that we believe have comparatively greater control of their own destiny, such as innovators with differentiated products, companies with low cost structures or companies that have been investing in their own businesses and may be poised to gain market share.
FUND BASICS
Large Cap Value Fund
as of December 31, 2023
|
|
TOP TEN HOLDINGS AS OF 12/31/231 |
| | | | |
| | |
Holding | | % of Net Assets | | Line of Business |
| | |
Exxon Mobil Corp. | | 3.7% | | Energy |
| | |
JPMorgan Chase & Co. | | 3.4 | | Financials |
| | |
CVS Health Corp. | | 2.3 | | Health Care |
| | |
Walmart, Inc. | | 2.3 | | Consumer Staples |
| | |
Danaher Corp. | | 2.2 | | Health Care |
| | |
BlackRock, Inc. | | 2.1 | | Financials |
| | |
Eaton Corp. PLC | | 2.0 | | Industrials |
| | |
Bank of America Corp. | | 2.0 | | Financials |
| | |
General Electric Co. | | 1.9 | | Industrials |
| | |
Alphabet, Inc., Class A | | 1.9 | | Communication Services |
| | 1 | The top 10 holdings may not be representative of the Fund’s future investments. |
|
|
FUND VS. BENCHMARK SECTOR ALLOCATIONS2 |
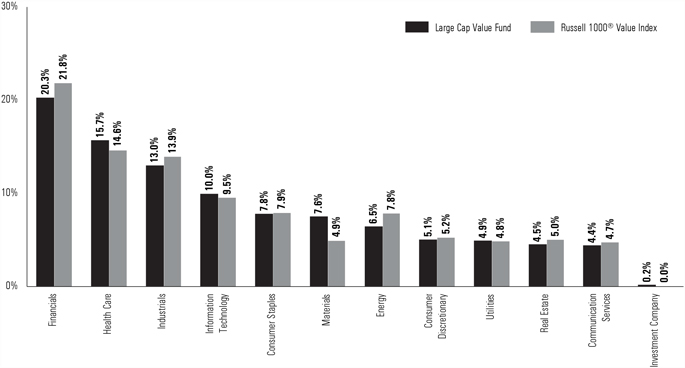
| | 2 | The Fund is actively managed and, as such, its composition may differ over time. Consequently, the Fund’s overall sector allocations may differ from percentages contained in the graph above. The graph categorizes investments using Global Industry Classification Standard (“GICS”); however, the sector classifications used by the portfolio management team may differ from GICS. The percentage shown for each investment category reflects the value of investments in that category as a percentage of market value (excluding investments in the securities lending reinvestment vehicle, if any). The graph depicts the Fund’s investments but may not represent the Fund’s market exposure due to the exclusion of certain derivatives, if any, as listed in the Additional Investment Information section of the Schedule of Investments. |
FUND BASICS
| | | For more information about the Fund, please refer to www.GSAMFUNDS.com. There, you can learn more about the Fund’s investment strategies, holdings, and performance. |
GOLDMAN SACHS VARIABLE INSURANCE TRUST LARGE CAP VALUE FUND
Performance Summary
December 31, 2023
The following graph shows the value, as of December 31, 2023, of a $10,000 investment made on January 1, 2014 in Service Shares at NAV. For comparative purposes, the performance of the Fund’s benchmark, the Russell 1000® Value Index (with distributions reinvested), is shown. Performance reflects applicable fee waivers and/or expense limitations in effect during the periods shown and, in their absence, performance would be reduced. Returns do not reflect the deduction of taxes that a shareholder would pay on Fund distributions or the redemption of Fund shares. The returns set forth below represent past performance. Past performance does not guarantee future results. The Fund’s investment return and principal value will fluctuate so that an investor’s shares, when redeemed, may be worth more or less than their original cost. Current performance may be lower or higher than the performance quoted below. Please visit our web site at www.GSAMFUNDS.com to obtain the most recent month-end returns.
|
|
Large Cap Value Fund’s 10 Year Performance |
|
Performance of a $10,000 investment, with distributions reinvested, from January 1, 2014 through December 31, 2023. |
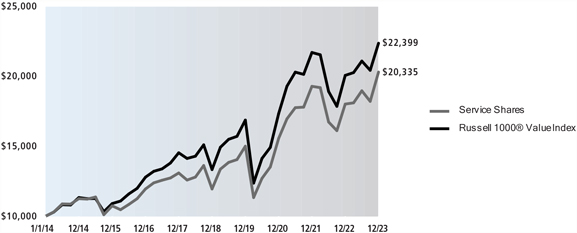
| | | | | | |
| | | |
Average Annual Total Returns through December 31, 2023* | | One Year | | Five Years | | Ten Years |
| | | |
Institutional | | 13.01% | | 11.45% | | 7.61% |
| | | | | | | |
| | | |
Service | | 12.71% | | 11.20% | | 7.35% |
| | | | | | | |
| * | These returns assume reinvestment of all distributions at NAV. Because Institutional and Service Shares do not involve sales charge, such a charge is not applied to their Average Annual Total Returns. |
GOLDMAN SACHS VARIABLE INSURANCE TRUST MID CAP GROWTH FUND
INVESTMENT OBJECTIVE
The Fund seeks long-term growth of capital.
Portfolio Management Discussion and Analysis
Below, the Goldman Sachs Fundamental Equity U.S. Equity Portfolio Management Team discusses the Goldman Sachs Variable Insurance Trust – Goldman Sachs Mid Cap Growth Fund’s (the “Fund”) performance and positioning for the 12-month period ended December 31, 2023 (the “Reporting Period”).
How did the Fund perform during the Reporting Period?
During the Reporting Period, the Fund’s Institutional and Service Shares generated average annual total returns of 18.68% and 18.45%, respectively. These returns compare to the 25.87% average annual total return of the Fund’s benchmark, the Russell Midcap® Growth Index (with dividends reinvested) (the “Russell Index”), during the same time period.
What key factors were responsible for the Fund’s performance during the Reporting Period?
During the Reporting Period, the Fund generated double-digit positive absolute returns but underperformed the Russell Index on a relative basis. Stock selection and sector positioning overall detracted from relative performance.
Which equity market sectors helped and hurt Fund performance?
Our bottom-up approach focuses on security selection, and therefore, we do not make active sector-level investment decisions. The Fund’s sector positioning is a result of our stock selection. That said, on a sector level, stock selection in consumer discretionary, financials and information technology detracted most from relative returns during the Reporting Period. Allocation positioning in financials and information technology also hurt. Partially offsetting these detractors was effective stock selection in the energy and communication services sectors, which contributed positively. Having no exposure to utilities, which was the second-weakest sector in the Russell Index during the Reporting Period, also proved beneficial.
Which individual stocks added to the Fund’s relative performance during the Reporting Period?
During the Reporting Period, the Fund was helped most versus the Russell Index by investments in CrowdStrike Holdings, Zscaler and Seagen.
CrowdStrike Holdings, a cybersecurity products and services provider, was a new purchase for the Fund during the Reporting Period. Since the beginning of 2023, the company showed a strong pipeline, with product momentum and partnerships driving investor confidence and stock performance. Heightened demand for digital security services fueled its business forward, with CrowdStrike Holdings posting second and third quarter 2023 results showing all headline metrics above consensus expectations. At the end of the Reporting Period, we believed the company had more room for growth, as it prioritizes market scaling and product innovation going forward. We continued to believe CrowdStrike Holdings offers a quality product, is gaining share in end markets and has healthy looking profitability metrics.
Zscaler engages in the provision of a cloud-based Internet security platform. Its stock traded higher in May 2023 after releasing preliminary fiscal third quarter results early, raising forecasts far above consensus expectations and illustrating better than expected demand, which was driven by its cross-sell and bundling strategies. Such results proved the company’s ability to perform well even in a difficult macroeconomic environment after the combination of interest rate hikes, rising inflation, supply-chain shortages and heightened geopolitical tensions took a hit on cybersecurity companies. The company’s stock rose further through the end of the calendar year, following its fiscal fourth quarter earnings report announced in September 2023, which delivered another beat of consensus expectations across all metrics and a rise in guidance for its next fiscal year. In our view, Zscaler continued to have solid fundamentals, shown by the breadth of its product portfolio and strong cybersecurity demand. At the end of the Reporting Period, we believed the company was well positioned and saw strength in its upsell and cross-sell abilities. We viewed Zscaler as having the most compelling technology, platform and consolidation opportunity of vendors in the industry, and we expected additional large deal momentum going forward.
The share price of biotechnology company Seagen appreciated at the beginning of 2023 after reporting both a strong fourth quarter 2022 earnings beat of consensus expectations on revenue and earnings per share and the reiteration of its management team’s confidence in the U.S. Food and Drug Administration review process for its bladder cancer drug Padcev. Following this positive performance, in mid-March 2023 it was announced that Pfizer would be acquiring Seagen for a premium, which caused its stock to appreciate further. Based on this announcement, we elected to liquidate the Fund’s position in Seagen and collect the profits from the transaction news.
GOLDMAN SACHS VARIABLE INSURANCE TRUST MID CAP GROWTH FUND
Which individual stocks detracted from the Fund’s relative performance during the Reporting Period?
The Fund’s investments in First Republic Bank, Etsy and Keysight Technologies detracted most from its relative performance during the Reporting Period.
First Republic Bank, a regional bank, engages in the provision of private banking, business banking, real estate lending and wealth management. In the first quarter of 2023, its stock price declined, driven by broader fears in the banking industry, as regional banks demonstrated an asset-liability mismatch in invested securities that caused concerns among customers and led to withdrawals of balances in favor of larger financial institutions. While we had liked its underlying business, we decided to sell the Fund’s position in First Republic Bank, as perception often drives stock prices and fear around the solvency of regional banks caused volatility in the sub-industry.
Etsy is a vintage and craft e-commerce company. Its stock declined during the Reporting Period, as its earnings reports were announced with cautious outlooks. Although the company delivered a clean beat of consensus expectations for its second quarter 2023 earnings report, its stock sold off further, driven by broader market uncertainties, as the company faced macroeconomic pressures around consumer discretionary spending persisting at then-current levels and potential negative impacts from federal student loan payments resuming later in the year. Etsy’s shares saw improvement in November and December 2023, as it reported solid performance in its third quarter 2023 earnings results, with an increase in active buyers and sellers, reaching an all-time high for active buyers. Further, in December, the company preannounced a positive fourth quarter 2023 update with a more optimistic outlook. Etsy additionally announced a restructuring plan, reducing its headcount to increase operational efficiencies, reduce costs and better align with its business needs. Despite market uncertainties, we believed Etsy had taken steps to improve its operational efficiencies to adjust to the changing environment. In turn, at the end of the Reporting Period, we believed the company had increased its growth runway by expanding internationally and launching targeted marketing campaigns. We also thought the company was well positioned to outperform its peers once the macroeconomic environment normalizes. Further, we believed the differentiated offerings on the Etsy platform would likely attract consumers. In our view, the company has demonstrated its resilient customer engagement, maintaining most of its pandemic share gains along with increasing transaction fees.
Keysight Technologies is a communications, networking and electronics industries company. Its stock declined during the Reporting Period, as its management communicated disappointing guidance and outlooks even as the company had relatively in-line to slight beats of consensus expectations in its earnings reports. Its management’s conservative tone in the light of the weakening economic outlook caused investors to be pessimistic about the company’s forward outlook, as they digested possible slowing order growth. While we believed demand was close to the bottom for Keysight Technologies, especially in manufacturing, we also felt there was limited visibility into a recovery. Additionally, we did not see a near-term catalyst to drive positive performance for the stock, and we expected the company’s earnings growth to slow. As a result, we decided to sell the Fund’s position in the company and allocate resources to what we believed were more prudent uses of capital with better risk/reward prospects.
How did the Fund use derivatives and similar instruments during the Reporting Period?
The Fund did not use derivatives or similar instruments within its investment process during the Reporting Period.
Did the Fund make any significant purchases or sales during the Reporting Period?
In addition to the purchase of CrowdStrike Holdings, mentioned earlier, we initiated a Fund position in off-price apparel and home accessories retailer Ross Stores during the Reporting Period. Off-price remained our most favored segment of defensive retail, and the combination of Ross Stores’ underlying fundamentals remaining healthy and the risk/reward appearing relatively more attractive to us prompted our decision to purchase its stock. We believe the stock could perform well, as the company’s previous guidance does not assume any trade down benefits or store traffic improvements. Further, strong store traffic suggests, in our view, lower-income consumers are finding greater spending capacity as inflation moderates.
Conversely, in addition to the sales already mentioned, we exited the Fund’s position in computational software company Cadence Design Systems during the Reporting Period. The company announced second quarter 2023 earnings, issuing third quarter 2023 guidance weaker than consensus expected. The company is facing increased regulatory risk and the potential for more stringent export restrictions that could impact its longer-term profitability. We ultimately decided to sell the position and reallocate the proceeds to what we saw as better risk/reward opportunities.
Were there any notable changes in the Fund’s weightings during the Reporting Period?
Changes to the Fund’s sector weightings relative to the Russell Index are due to our stock selection. As a result of these decisions during the Reporting Period, the Fund’s exposure compared to the Russell Index to consumer discretionary and information technology increased. The Fund’s allocations compared to the Russell Index in consumer staples, financials and health care decreased. The Fund’s position in cash also decreased during the Reporting Period.
Were there any changes to the Fund’s portfolio management team during the Reporting Period?
There were no changes to the Fund’s portfolio management team during the Reporting Period.
GOLDMAN SACHS VARIABLE INSURANCE TRUST MID CAP GROWTH FUND
How was the Fund positioned relative to the Russell Index at the end of the Reporting Period?
As mentioned, the Fund’s sector positioning relative to the Russell Index is the result of our stock selection, as we take a pure bottom-up, research-intensive approach to investing. From that perspective, then, at the end of the Reporting Period, the Fund’s portfolio was broadly diversified with overweight positions compared to the Russell Index in the materials, information technology, health care and real estate sectors. The Fund had underweighted allocations relative to the Russell Index in the financials, consumer staples and communication services sectors and was relatively neutrally weighted compared to the Russell Index in the consumer discretionary, energy and industrials sectors at the end of the Reporting Period. The Fund had no exposure to the utilities sector at the end of the Reporting Period.
What is the Fund’s tactical view and strategy for the months ahead?
Following a weak 2022, major U.S. equity indices reversed course in 2023, recording strong calendar year performance chiefly driven by a momentous rally from some of the largest mega-cap technology names, dubbed the “Magnificent Seven.” U.S. equities especially surged in the last two months of the fourth quarter of 2023, as the broader market and economy proved to be resilient—overcoming adversities from a banking crisis uprise that challenged depositors’ faith in regional banks, uncertainty surrounding the delayed effects of the Federal Reserve’s (“Fed”) monetary tightening regime on the U.S. economy, and heightened geopolitical tensions in Europe and the Middle East. At the end of 2023, we remained constructive on the U.S. equity market given that inflation was rather steadily approaching the Fed’s 2% target, a recession did not appear imminent, and then-recent economic data releases evidenced economic resilience, including a healthy labor market.
At the end of the Reporting Period, we believed there were several tailwinds to economic growth going forward, including strong real household income growth, a recovery in manufacturing activity, and an increased willingness of Fed officials to cut interest rates if disinflation persists. In our view, the Fed will likely take a cautious approach to cutting rates, although the latest Summary of Economic Projections published that the Fed’s voting members forecast a median federal funds rate of 4.6% by the end of 2024, penciling in 75 basis points of rate cuts to the Fed’s benchmark rate. (A basis point is 1/100th of a percentage point.)
In our view, throughout the coming year, market participants may well need to adapt to disruption from constant innovation, as governments and companies continue to invest in AI research, technology-enabled health care, and sustainability trends. We believe each of these themes had and will continue to transform industries long term, creating growth opportunities as well as a wide dispersion between companies. It is possible that election year uncertainty in 2024 may suppress risk appetite and increase volatility, though historically, once uncertainty is resolved, equity market performance is more correlated to fiscal and monetary policy. Ultimately, while the Fed seems to have steered away from a hard landing scenario during its tightening cycle, external shocks or an unexpected pivot to policy easing may rekindle inflation in a way that would require a recession to bring it lower.
We believe our extensive bottom-up research approach can be beneficial to navigating these evolving themes and heightened volatility, while also positioning investors to benefit from the next upcycle. Regardless of market direction, we intend to stay true to our quality-first investment approach and seek to invest in businesses with healthy balance sheets, relatively stable cash flows and differentiated business models aligned to secular tailwinds. We continue to test our models and re-evaluate our assumptions with increasing information, remain focused on the long-term investment horizon and believe this fundamental approach can generate added value in the long run. As always, we maintain our focus on seeking companies that we believe will generate long-term growth in today’s ever-changing market conditions.
FUND BASICS
Mid Cap Growth Fund
as of December 31, 2023
|
|
TOP TEN HOLDINGS AS OF 12/31/231 |
| | | | |
| | |
Holding | | % of Net Assets | | Line of Business |
| | |
Rockwell Automation, Inc. | | 3.0% | | Industrials |
| | |
Ross Stores, Inc. | | 2.7 | | Consumer Discretionary |
| | |
Crowdstrike Holdings, Inc., Class A | | 2.7 | | Information Technology |
| | |
Insulet Corp. | | 2.3 | | Health Care |
| | |
MSCI, Inc. | | 2.2 | | Financials |
| | |
Cencora, Inc. | | 2.2 | | Health Care |
| | |
Dexcom, Inc. | | 2.2 | | Health Care |
| | |
CoStar Group, Inc. | | 2.0 | | Real Estate |
| | |
Datadog, Inc., Class A | | 2.0 | | Information Technology |
| | |
Amphenol Corp., Class A | | 2.0 | | Information Technology |
| | 1 | The top 10 holdings may not be representative of the Fund’s future investments. |
|
|
FUND VS. BENCHMARK SECTOR ALLOCATIONS2 |
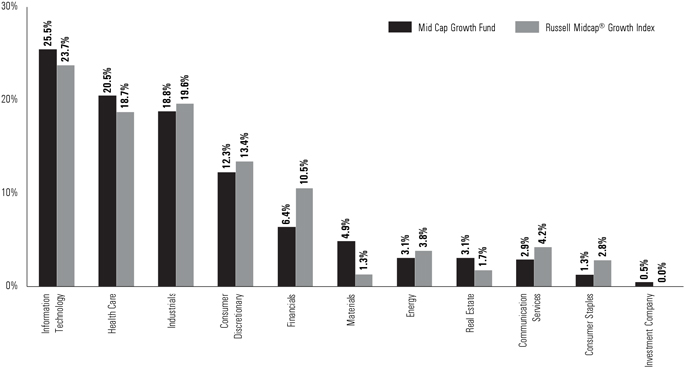
| | 2 | The Fund is actively managed and, as such, its composition may differ over time. Consequently, the Fund’s overall sector allocations may differ from percentages contained in the graph above. The graph categorizes investments using Global Industry Classification Standard (“GICS”); however, the sector classifications used by the portfolio management team may differ from GICS. The percentage shown for each investment category reflects the value of investments in that category as a percentage of market value (excluding investments in the securities lending reinvestment vehicle, if any). Investments in the securities lending reinvestment vehicle represented 0.7% of the Fund’s net assets at December 31, 2023. The graph depicts the Fund’s investments but may not represent the Fund’s market exposure due to the exclusion of certain derivatives, if any, as listed in the Additional Investment Information section of the Schedule of Investments. |
FUND BASICS
| | | For more information about the Fund, please refer to www.GSAMFUNDS.com. There, you can learn more about the Fund’s investment strategies, holdings, and performance. |
GOLDMAN SACHS VARIABLE INSURANCE TRUST MID CAP GROWTH FUND
Performance Summary
December 31, 2023
The following graph shows the value, as of December 31, 2023, of a $10,000 investment made on January 1, 2014 in Service Shares at NAV. For comparative purposes, the performance of the Fund’s benchmark, the Russell Midcap® Growth Index (with distributions reinvested), is shown. Performance reflects applicable fee waivers and/or expense limitations in effect during the periods shown and, in their absence, performance would be reduced. Returns do not reflect the deduction of taxes that a shareholder would pay on Fund distributions or the redemption of Fund shares. The returns set forth below represent past performance. Past performance does not guarantee future results. The Fund’s investment return and principal value will fluctuate so that an investor’s shares, when redeemed, may be worth more or less than their original cost. Current performance may be lower or higher than the performance quoted below. Please visit our web site at www.GSAMFUNDS.com to obtain the most recent month-end returns.
|
|
Mid Cap Growth Fund’s 10 Year Performance |
|
Performance of a $10,000 investment, with distributions reinvested, from January 1, 2014 through December 31, 2023. |
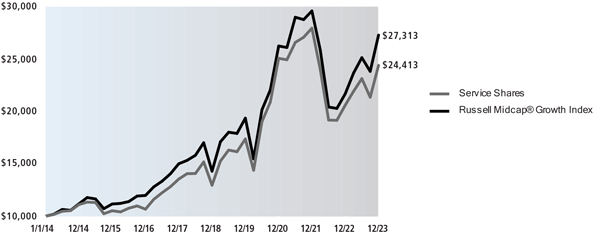
| | | | | | |
| | | |
Average Annual Total Returns through December 31, 2023* | | One Year | | Five Years | | Ten Years |
| | | |
Institutional | | 18.68% | | 13.67% | | 9.51% |
| | | | | | | |
| | | |
Service | | 18.45% | | 13.48% | | 9.33% |
| | | | | | | |
| * | These returns assume reinvestment of all distributions at NAV. Because Institutional and Service Shares do not involve sales charge, such a charge is not applied to their Average Annual Total Returns. |
GOLDMAN SACHS VARIABLE INSURANCE TRUST MID CAP VALUE FUND
INVESTMENT OBJECTIVE
The Fund seeks long-term capital appreciation.
Portfolio Management Discussion and Analysis
Below, the Goldman Sachs Fundamental Equity U.S. Equity Portfolio Management Team discusses the Goldman Sachs Variable Insurance Trust — Goldman Sachs Mid Cap Value Fund’s (the “Fund”) performance and positioning for the 12-month period ended December 31, 2023 (the “Reporting Period”).
How did the Fund perform during the Reporting Period?
During the Reporting Period, the Fund’s Institutional and Service Shares generated average annual total returns of 11.42% and 11.11%, respectively. These returns compare to the 12.71% average annual total return of the Fund’s benchmark, the Russell Midcap® Value Index (with dividends reinvested) (the “Russell Index”), during the same time period.
What key factors were responsible for the Fund’s performance during the Reporting Period?
The Fund posted double-digit positive absolute returns but underperformed the Russell Index on a relative basis during the Reporting Period due primarily to stock selection decisions overall. Sector allocation positioning as a whole contributed positively, albeit modestly.
Which equity market sectors most significantly affected Fund performance?
Detracting most from the Fund’s relative results during the Reporting Period were the utilities, consumer discretionary and financials sectors, wherein stock selection proved especially challenging. Allocation positioning in the consumer discretionary sector further dampened the Fund’s relative results. Contributing most positively to the Fund’s relative results during the Reporting Period was effective stock selection in the materials, health care and consumer staples sectors.
What were some of the Fund’s best-performing individual stocks?
The Fund benefited most relative to the Russell Index from positions in semiconductor company Marvell Technology, building materials company Martin Marietta Materials and pharmaceuticals company West Pharmaceutical Services.
Marvell Technology was a new purchase for the Fund during the Reporting Period. While it missed performance expectations in early 2023 due to China’s economic weakness, macroeconomic headwinds and storage weakness as customer digestion of inventory took place, most of Marvel Technology’s outperformance was attributed to the second quarter of 2023. Even during such time, we saw the company take share and be levered to more recession-resistant and growth-leaning end markets. In April 2023, the company posted a small beat of consensus expectations and raised its first quarter 2023 earnings report. But its stock rallied more after the company gave added visibility on its artificial intelligence (“AI”)-related pipeline. The company stated it expects its AI-related business to double its revenue in each of the next two years, which sparked investor optimism. Its management also announced it expects inventory digestion to resolve faster than it had previously expected. Further, in November 2023, the company’s stock performed well after competitors reported strong results and news surrounding positive data center trends, as investors believed there could be reacceleration in this end market. At the end of the Reporting Period, we believed Marvell Technology was well positioned to capitalize on the race to build out data centers to handle AI workloads. As a competitor currently dominates with 100% share of AI processing, we believe such complete dominance is unsustainable and that, as the market shifts from training to inference, other semiconductor companies may well capture market share. Given the fact that Marvell Technology develops semiconductors that allow faster connection speeds between servers, we believed the company was well positioned to be a leading vendor of choice as AI demand and cloud spending remain strong. Additionally, Marvell Technology develops Application-Specific Integrated Circuit (“ASIC”) chips, which are used by customers to drive faster processing speeds via simultaneously running multiple algorithms. The company’s critical intellectual property is part of the “picks and shovels” for AI, and as a result, should benefit from strategic investments to reshore semiconductor capacity in developed nations, in our view. We thus maintained our conviction in Marvell Technology at the end of the Reporting Period and believed the company is likely to continue to benefit from strong market leadership and the accelerating adoption and development of AI-enabled technologies.
Throughout the Reporting Period, Martin Marietta Materials drove earnings growth by implementing strong pricing in an improving cost environment while experiencing a growing backlog of projects across its geographies. The company reported solid earnings with its second quarter 2023 earnings per share coming in more than double consensus expectations. The company increased revenues and earnings the following quarter as well. Its stock also rose significantly during the Reporting Period, as it proved to be a major beneficiary of government infrastructure investment programs. It has additionally taken a meaningful approach to improving its emissions while being thoughtful about water consumption and waste. At the end of the Reporting Period, we continued to believe in Martin Marietta Materials, as we foresaw structurally improving unit probability, bottoming volumes as residential lead indicators stabilize, accelerating earnings outlook, and attractive valuation risk/reward. In our view, the company continued to show superior
GOLDMAN SACHS VARIABLE INSURANCE TRUST MID CAP VALUE FUND
pricing to its peers and gross profit per ton looked set to materially accelerate in 2024. We also believed the company remained well positioned to capitalize on the emerging reshoring trends widely expected to support steady and sustainable construction activity over the long term.
West Pharmaceutical Services manufactures and markets pharmaceuticals, biologics, vaccines and consumer health care products. Its stock price appreciated through the first three quarters of the Reporting Period, outperforming the industry’s growth with much of its positive momentum coming from solid earnings results featuring better than consensus expected forward guidance. The company’s leading market share position in the drug packaging space and its role as a key supplier for new biologics drove growth throughout the calendar year. The company’s stock price gained further after obesity drug trial studies showed positive results, igniting a rally in the pharmaceutical space and lifting West Pharmaceutical Services as it provides components that could be used in the next generation of diabetes and weight loss treatments. While we continued to like the growth prospects of the company, we decided to exit the Fund’s position, as its stock had appreciated significantly during the Reporting Period. We reallocated the profits to what we considered to be better risk/reward opportunities elsewhere.
Which stocks detracted significantly from the Fund’s performance during the Reporting Period?
Detracting from the Fund’s results relative to the Russell Index were positions in utility and power generation company AES, specialty chemical solutions provider Ashland and regional bank First Republic Bank.
Shares of AES were mostly weaker during the Reporting Period due to high leverage and financing needs for the company’s renewables development. The company’s stock came under pressure when it announced its first quarter 2023 earnings roughly in line with consensus expectations, but investors were concerned with AES’ ability to hit its growth targets with its then-current plan to exit coal assets by 2025. The company’s earnings growth was driven by tax credits more than it expected rather than earnings before interest, taxes, depreciation and amortization (“EBITDA”) growth, which hurt investor sentiment alongside the company’s illustrated need for more financing than it previously anticipated. The market was also unimpressed when the company reported its second quarter 2023 earnings, again largely in line with consensus expectations. The company’s shares traded lower still when it announced that its Chief Operating Officer would step down. At the end of the Reporting Period, we continued to believe in AES given that the stock remained inexpensive and highly leveraged to the renewable energy secular growth theme. In our view, the company should benefit from the Inflation Reduction Act in the U.S. and has strong utility growth opportunities driven by renewables, growth in its jurisdictions and past underinvestment.
Ashland struggled during the Reporting Period, as significant destocking drove outsized earnings headwinds, which took longer than it expected to stabilize. That said, we believed such a trend was close to its trough and that the company’s management had outlined a plan for the next year to better frame possible downside risk. Most of Ashland’s negative performance occurred after the company’s second quarter 2023 earnings release, in which its management noted that China’s economic re-opening was progressing at a slower pace than widely expected. Further, it stated that although the destocking that Ashland saw in December 2022 had slowed, it was still persistent throughout the quarter. With the second half of 2023 uncertain, Ashland lowered its fiscal year 2023 sales and EBITDA guidance, causing its stock price to drop. At the end of the Reporting Period, we continued to like Ashland given what we saw as the company’s opportunity for self-help margin expansion, the diversified nature of its business, and its strong management team. Further, given the valuation pullback, we believed the company was trading at an attractive level for strength in a normalized environment.
First Republic Bank engages in the provision of private banking, business banking, real estate lending and wealth management. In the first quarter of 2023, its stock price declined, driven by broader fears in the banking industry, as regional banks demonstrated an asset-liability mismatch in invested securities that caused concerns among customers and led to withdrawals of balances in favor of larger financial institutions. While we had liked its underlying business, we decided to sell the Fund’s position in First Republic Bank, as perception often drives stock prices and fear around the solvency of regional banks caused volatility in the sub-industry.
How did the Fund use derivatives and similar instruments during the Reporting Period?
During the Reporting Period, we did not use derivatives as part of an active management strategy.
Did the Fund make any significant purchases or sales during the Reporting Period?
In addition to the purchase of Marvell Technology, mentioned earlier, we initiated a Fund position in financial software and services provider Fidelity National Information Services during the Reporting Period. We saw potential for value creation with the company’s decision to separate its WorldPay business, redirecting focus to the company’s core legacy business. We believe in the company because a large portion of its business is highly defensive, and commercial momentum has continued to build, driving revenue growth. We also remain confident that Fidelity National Information Services’ global footprint in the banking industry is well positioned to continue to take advantage of accelerating payments innovation globally.
Conversely, in addition to the sales already mentioned, we exited the Fund’s position in utility company Ameren during the Reporting Period. The company beat consensus earnings expectations throughout the Reporting Period with a high quality management team, in our view. However, the company spent the second half of the calendar year in a regulatory battle, wherein the Illinois Public Utilities Commission ultimately issued disappointing regulatory decisions to Ameren, which we believed would negatively affect its earnings going forward. Following these results, we elected to sell the Fund’s position in Ameren in favor of what we saw as more attractive risk/reward opportunities in other names in the utilities sector in which we had more confidence.
GOLDMAN SACHS VARIABLE INSURANCE TRUST MID CAP VALUE FUND
We sold the Fund’s position in network and service enabling solutions and optical products provider Viavi Solutions during the Reporting Period. After several consecutive quarters of beating consensus expectations and raising guidance, Viavi Solutions reported a disappointing third quarter 2023. Its Network Services Enablement business segment was negatively impacted by a major slowdown in order placement by various services providers. It remained unclear when this business would come back, and so we decided to sell the Fund position for what we considered to be better risk/reward opportunities elsewhere.
Were there any notable changes in the Fund’s weightings during the Reporting Period?
In constructing the Fund’s portfolio, we focus on picking stocks rather than on making industry or sector bets. We seek to outpace the benchmark index by overweighting stocks that we expect to outperform and underweighting those that we think may lag. Consequently, changes in its sector weights are generally the direct result of individual stock selection or of stock appreciation or depreciation. That said, during the Reporting Period, the Fund’s exposure to energy and financials increased and its exposure to industrials decreased compared to the Russell Index. The Fund’s position in cash increased during the Reporting Period.
How was the Fund positioned relative to its benchmark index at the end of the Reporting Period?
At the end of December 2023, the Fund had overweighted positions relative to the Russell Index in materials. On the same date, the Fund had underweighted positions compared to the Russell Index in real estate and communication services and was rather neutrally weighted to the Russell Index in consumer discretionary, consumer staples, energy, financials, health care, industrials, information technology and utilities.
Were there any changes to the Fund’s portfolio management team during the Reporting Period?
There were no changes to the Fund’s portfolio management team during the Reporting Period.
What is the Fund’s tactical view and strategy for the months ahead?
Following a weak 2022, major U.S. equity indices reversed course in 2023, recording strong calendar year performance chiefly driven by a momentous rally from some of the largest mega-cap technology names, dubbed the “Magnificent Seven.” U.S. equities especially surged in the last two months of the fourth quarter of 2023, as the broader market and economy proved to be resilient—overcoming adversities from a banking crisis uprise that challenged depositors’ faith in regional banks, uncertainty surrounding the delayed effects of the Federal Reserve’s (“Fed”) monetary tightening regime on the U.S. economy, and heightened geopolitical tensions in Europe and the Middle East. At the end of 2023, we remained constructive on the U.S. equity market given that inflation was rather steadily approaching the Fed’s 2% target, a recession did not appear imminent, and then-recent economic data releases evidenced economic resilience, including a healthy labor market.
At the end of the Reporting Period, we believed there were several tailwinds to economic growth going forward, including strong real household income growth, a recovery in manufacturing activity, and an increased willingness of Fed officials to cut interest rates if disinflation persists. In our view, the Fed will likely take a cautious approach to cutting rates, although the latest Summary of Economic Projections published that the Fed’s voting members forecast a median federal funds rate of 4.6% by the end of 2024, penciling in 75 basis points of rate cuts to the Fed’s benchmark rate. (A basis point is 1/100th of a percentage point.)
In our view, throughout the coming year, market participants may well need to adapt to disruption from constant innovation, as governments and companies continue to invest in AI research, technology-enabled health care, and sustainability trends. We believe each of these themes had and will continue to transform industries long term, creating growth opportunities as well as a wide dispersion between companies. It is possible that election year uncertainty in 2024 may suppress risk appetite and increase volatility, though historically, once uncertainty is resolved, equity market performance is more correlated to fiscal and monetary policy. Ultimately, while the Fed seems to have steered away from a hard landing scenario during its tightening cycle, external shocks or an unexpected pivot to policy easing may rekindle inflation in a way that would require a recession to bring it lower.
We believe our extensive bottom-up research approach can be beneficial to navigating these evolving themes and heightened volatility, while also positioning investors to benefit from the next upcycle. Regardless of market direction, we intend to stay true to our quality-first investment approach and seek to invest in businesses with healthy balance sheets, relatively stable cash flows and differentiated business models aligned to secular tailwinds. We continue to test our models and re-evaluate our assumptions with increasing information, remain focused on the long-term investment horizon and believe this fundamental approach can generate added value in the long run. As always, we maintain our focus on undervalued companies that we believe have comparatively greater control of their own destiny, such as innovators with differentiated products, companies with low cost structures or companies that have been investing in their own businesses and may be poised to gain market share.
FUND BASICS
Mid Cap Value Fund
as of December 31, 2023
|
|
TOP TEN HOLDINGS AS OF 12/31/231 |
| | | | |
| | |
Holding | | % of Net Assets | | Line of Business |
| | |
Marvell Technology, Inc. | | 2.5% | | Information Technology |
| | |
Zimmer Biomet Holdings, Inc. | | 1.9 | | Health Care |
| | |
Steel Dynamics, Inc. | | 1.9 | | Materials |
| | |
Martin Marietta Materials, Inc. | | 1.9 | | Materials |
| | |
Fidelity National Information Services, Inc. | | 1.9 | | Financials |
| | |
AMETEK, Inc. | | 1.8 | | Industrials |
| | |
United Rentals, Inc. | | 1.7 | | Industrials |
| | |
Lennar Corp., Class A | | 1.6 | | Consumer Discretionary |
| | |
Fortive Corp. | | 1.6 | | Industrials |
| | |
Stanley Black & Decker, Inc. | | 1.6 | | Industrials |
| | 1 | The top 10 holdings may not be representative of the Fund’s future investments. |
|
|
FUND VS. BENCHMARK SECTOR ALLOCATIONS2 |
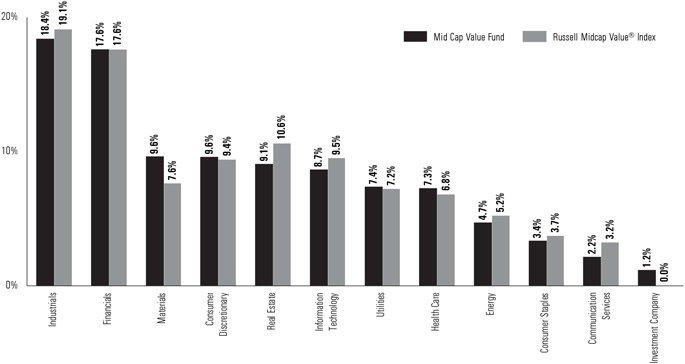
| | 2 | The Fund is actively managed and, as such, its composition may differ over time. Consequently, the Fund’s overall sector allocations may differ from percentages contained in the graph above. The graph categorizes investments using Global Industry Classification Standard (“GICS”); however, the sector classifications used by the portfolio management team may differ from GICS. The percentage shown for each investment category reflects the value of investments in that category as a percentage of market value (excluding investments in the securities lending reinvestment vehicle, if any). Investments in the securities lending reinvestment vehicle represented 0.9% of the Fund’s net assets at December 31, 2023. The graph depicts the Fund’s investments but may not represent the Fund’s market exposure due to the exclusion of certain derivatives, if any, as listed in the Additional Investment Information section of the Schedule of Investments. |
FUND BASICS
| | | For more information about the Fund, please refer to www.GSAMFUNDS.com. There, you can learn more about the Fund’s investment strategies, holdings, and performance. |
GOLDMAN SACHS VARIABLE INSURANCE TRUST MID CAP VALUE FUND
Performance Summary
December 31, 2023
The following graph shows the value, as of December 31, 2023, of a $10,000 investment made on January 1, 2014 in Institutional Shares at NAV. For comparative purposes, the performance of the Fund’s benchmark, the Russell Midcap Value® Index (with distributions reinvested), is shown. Performance reflects applicable fee waivers and/or expense limitations in effect during the periods shown and, in their absence, performance would be reduced. Returns do not reflect the deduction of taxes that a shareholder would pay on Fund distributions or the redemption of Fund shares. The returns set forth below represent past performance. Past performance does not guarantee future results. The Fund’s investment return and principal value will fluctuate so that an investor’s shares, when redeemed, may be worth more or less than their original cost. Current performance may be lower or higher than the performance quoted below. Please visit our web site at www.GSAMFUNDS.com to obtain the most recent month-end returns.
|
|
Mid Cap Value Fund’s 10 Year Performance |
|
Performance of a $10,000 investment, with distributions reinvested, from January 1, 2014 through December 31, 2023. |
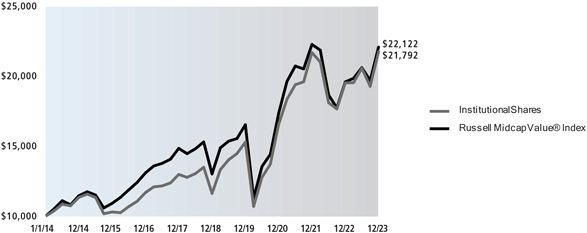
| | | | | | |
| | | |
Average Annual Total Returns through December 31, 2023* | | One Year | | Five Years | | Ten Years |
| | | |
Institutional | | 11.42% | | 13.36% | | 8.10% |
| | | | | | | |
| | | |
Service | | 11.11% | | 13.06% | | 7.82% |
| | | | | | | |
| * | These returns assume reinvestment of all distributions at NAV. Because Institutional and Service Shares do not involve sales charge, such a charge is not applied to their Average Annual Total Returns. |
GOLDMAN SACHS VARIABLE INSURANCE TRUST SMALL CAP EQUITY INSIGHTS FUND
INVESTMENT OBJECTIVE
The Fund seeks long-term growth of capital.
Portfolio Management Discussion and Analysis
Below, the Goldman Sachs Quantitative Investment Strategies Team discusses the Goldman Sachs Variable Insurance Trust — Goldman Sachs Small Cap Equity Insights Fund’s (the “Fund”) performance and positioning for the 12-month period ended December 31, 2023 (the “Reporting Period”).
How did the Fund perform during the Reporting Period?
During the Reporting Period, the Fund’s Institutional and Service Shares generated average annual total returns of 19.28% and 18.95%, respectively. These returns compare to the 16.93% average annual total return of the Fund’s benchmark, the Russell 2000® Index (with dividends reinvested) (the “Russell Index”) during the same time period.
What key factors were responsible for the Fund’s performance during the Reporting Period?
The Fund uses a quantitative style of management, in combination with a qualitative overlay, that emphasizes fundamentally-based stock selection, careful portfolio construction and efficient implementation. The Fund’s investments are selected using fundamental research and a variety of quantitative techniques based on certain investment themes, namely Fundamental Mispricings, High Quality Business Models, Sentiment Analysis and Market Themes & Trends.
During the Reporting Period, the Fund outperformed the Russell Index on a relative basis, with all four of our quantitative model’s investment themes contributing positively. Stock selection overall, driven by these investment themes, boosted relative performance.
What impact did the Fund’s investment themes have on performance during the Reporting Period?
In keeping with our investment approach, we use our quantitative model and four investment themes to take a long-term view of market patterns and look for inefficiencies, selecting stocks for the Fund and overweighting or underweighting the ones chosen by the model. Over time and by design, the performance of any one of the model’s investment themes tends to have a low correlation with the model’s other themes, demonstrating the diversification benefit of the Fund’s theme-driven quantitative model. The variance in performance supports our research indicating that the diversification provided by the Fund’s different investment themes is a significant investment advantage over the long term, even though the Fund may experience underperformance in the short term. Of course, diversification does not protect an investor from market risk nor does it ensure a profit.
During the Reporting Period, each of our four investment themes contributed positively to the Fund’s relative performance. High Quality Business Models bolstered relative results most, followed by Fundamental Mispricings, Sentiment Analysis and Market Themes & Trends. High Quality Business Models seeks to identify companies that are generating high quality revenues with sustainable business models and aligned management incentives. Fundamental Mispricings seeks to identify high quality businesses trading at a fair price, which we believe may lead to strong performance over the long run. Sentiment Analysis seeks to identify stocks experiencing improvements in their overall market sentiment. Market Themes & Trends seeks to identify companies positively positioned to benefit from themes and trends in the market and macroeconomic environment.
How did the Fund’s sector and industry allocations affect relative performance?
In constructing the Fund’s portfolio, our quantitative model focuses on stock selection rather than making sector or industry bets. Consequently, the Fund is similar to its benchmark, the Russell Index, in terms of its sector and industry allocations and style. Relative performance is primarily driven by stock selection, not by sector or industry allocations.
Did stock selection help or hurt Fund performance during the Reporting Period?
We seek to outpace the Russell Index by overweighting stocks that we expect to outperform and underweighting those that we think may lag. At the same time, we strive to maintain a risk profile similar to the Russell Index. The Fund’s investments are selected using fundamental research and a variety of quantitative techniques based on our investment themes. For example, the Fund aims to hold a basket of stocks with better Fundamental Mispricings characteristics than the Russell Index.
During the Reporting Period, stock selection overall helped. Stock selection in the financials, consumer discretionary and industrials sectors contributed the most positively to the Fund’s relative returns during the Reporting Period. Conversely, certain individual stock positions, especially in the health care, real estate and communication services sectors, detracted from the Fund’s relative returns.
GOLDMAN SACHS VARIABLE INSURANCE TRUST SMALL CAP EQUITY INSIGHTS FUND
Which individual stock positions contributed the most to the Fund’s relative returns during the Reporting Period?
The Fund benefited most from overweight positions in single-family home builder M/I Homes, cosmetics and skin care products company elf Beauty and insurance company Goosehead Insurance. The overweight in M/I Homes was established predominantly due to our High Quality Business Models and Sentiment Analysis investment themes. The Fund was overweight elf Beauty largely because of our High Quality Business Models investment theme. The overweight in Goosehead Insurance was driven by our Fundamental Mispricings investment theme.
Which individual positions detracted from the Fund’s results during the Reporting Period?
Detracting most from the Fund’s results relative to the Russell Index were overweight positions in outdoor and billboard media company Outfront Media and identity security company Clear Secure and a rather neutral position in commercial stage biopharmaceutical company TG Therapeutics. The overweight in Outfront Media was established primarily as a result of our Fundamental Mispricings and Sentiment Analysis investment themes. The Fund was overweight Clear Secure largely because of our High Quality Business Models investment theme. The Fund had a neutral position in TG Therapeutics driven primarily by our Sentiment Analysis investment theme.
How did the Fund use derivatives during the Reporting Period?
During the Reporting Period, we used equity index futures contracts, on an opportunistic basis, to equitize the Fund’s cash holdings. In other words, we put the Fund’s cash holdings to work by using them as collateral for the purchase of futures contracts. The use of these derivatives did not have a material impact on the Fund’s performance during the Reporting Period.
Did you make any enhancements to your quantitative models during the Reporting Period?
We continuously look for ways to improve our investment process. During the Reporting Period, we implemented a couple of new signals within our Sentiment Analysis investment theme. The first enhancement implemented aims to improve our sentiment identification in earnings call reports by utilizing many of the latest developments in machine learning and natural language processing (“NLP”). The second signal implemented in the U.S. region aims to capitalize upon price dislocations that are caused by uninformed exchange-traded fund trading. Finally, we implemented two new signals within our Market Themes & Trends investment theme. The first signal leverages advanced machine learning algorithms to capture nuanced behavior of our existing suite of more than a hundred alpha factors. The second signal aims to apply NLP techniques to account for fine-grained linguistic meaning of documents when quantifying company linkages for text-based cross-stock momentum factors.
In fact, we introduced several new signals and enhancements during the Reporting Period that leverage machine learning techniques, such as NLP, as well as those that are based on different types of alternative data sources. The Team’s new NLP-based signals utilize the transformer architecture to be able to extract insights from different bodies of text. For example, within the Sentiment Analysis investment theme, we introduced a suite of signals that seeks to identify changes in sentiment within company regulatory filings and documents by using advanced NLP models to synthesize the context of the language used within the document. In addition to the NLP-based signals, we also introduced a new signal that seeks to capture the level of attention stocks receive as a result of being mentioned in news articles and blog posts. We believe companies that receive outsized attention in the media experience positive, but temporary, price trends that ultimately revert over the longer term. We also introduced new signals within the Market Themes & Trends investment theme. The first signal introduced leverages NLP and topic modeling techniques to identify economic linkages between companies based on their current descriptions. Additionally, we implemented a suite of signals that leverage word embedding techniques to capture the meanings of the words and language used with employer reviews in order to identify the economic linkages between companies mentioned.
Lastly, within our High Quality Business Models investment theme, we introduced two suites of signals within the U.S. that are both based on jobs posting data. The first signals focus on the duration that jobs postings remain outstanding. We believe companies that are appealing to prospective employees can fulfill jobs postings quicker and are therefore better positioned for growth over the long term. The second suite of signals focus on the types of roles the company is trying to hire for, as we believe companies seeking to employ for high-in-demand roles will have to pay increased costs for the set of skills required and thus have their prospects for future growth be more challenged.
What was the Fund’s sector positioning relative to its benchmark index at the end of the Reporting Period?
As of December 31, 2023, the Fund was overweight the consumer discretionary and real estate sectors relative to the Russell Index. The Fund was underweight utilities, health care and industrials and was rather neutrally weighted in information technology, financials, communication services, energy, materials and consumer staples compared to the Russell Index on the same date.
Were there any changes to the Fund’s portfolio management team during the Reporting Period?
There were no changes to the Fund’s portfolio management team during the Reporting Period.
GOLDMAN SACHS VARIABLE INSURANCE TRUST SMALL CAP EQUITY INSIGHTS FUND
What is your strategy going forward for the Fund?
Looking ahead, we continue to believe that less expensive stocks should outpace more expensive stocks, and stocks with good momentum are likely to outperform those with poor momentum. We intend to maintain our focus on seeking companies about which fundamental research analysts are becoming more positive as well as profitable companies with sustainable earnings and a track record of using their capital to enhance shareholder value. As such, we anticipate remaining fully invested with long-term performance likely to be the result of stock selection rather than sector or capitalization allocations.
We stand behind our investment philosophy that sound economic investment principles, coupled with a disciplined quantitative approach, can provide strong, uncorrelated returns over the long term. Our research agenda is robust, and we continue to enhance our existing models, add new proprietary forecasting signals and improve our trading execution as we seek to provide the most value to our shareholders.
FUND BASICS
Small Cap Equity Insights Fund
as of December 31, 2023
|
|
TOP TEN HOLDINGS AS OF 12/31/231,2 |
| | | | |
| | |
Holding | | % of
Net Assets | | Line of Business |
| | |
Super Micro Computer, Inc. | | 1.1% | | Technology Hardware, Storage & Peripherals |
| | |
Ryman Hospitality Properties, Inc. REIT | | 0.9 | | Hotel & Resort REITs |
| | |
M/I Homes, Inc. | | 0.9 | | Household Durables |
| | |
Duolingo, Inc. | | 0.9 | | Diversified Consumer Services |
| | |
Academy Sports & Outdoors, Inc. | | 0.8 | | Specialty Retail |
| | |
Encore Wire Corp. | | 0.8 | | Electrical Equipment |
| | |
Qualys, Inc. | | 0.8 | | Software |
| | |
Summit Materials, Inc., Class A | | 0.8 | | Construction Materials |
| | |
Varonis Systems, Inc. | | 0.8 | | Software |
| | |
Comfort Systems USA, Inc. | | 0.8 | | Construction & Engineering |
| | 1 | The top 10 holdings may not be representative of the Fund’s future investments. |
| | 2 | The Fund’s overall top ten holdings differ from the table above due to the exclusion of the Goldman Sachs Financial Square Government Fund (a short-term investment fund) which represents 1.7% of the Fund’s net assets as of December 31, 2023. |
|
|
FUND VS. BENCHMARK SECTOR ALLOCATIONS3 |
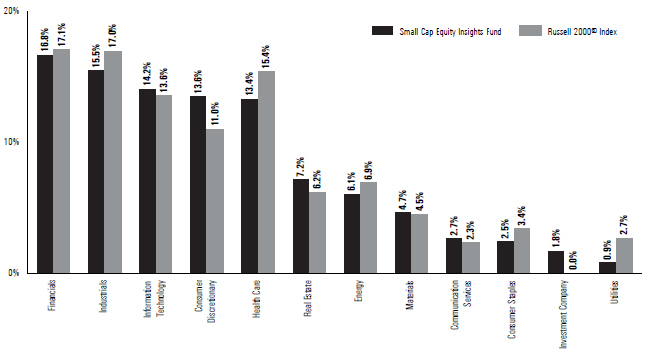
| | 3 | The Fund is actively managed and, as such, its composition may differ over time. Consequently, the Fund’s overall sector allocations may differ from percentages contained in the graph above. The graph categorizes investments using Global Industry Classification Standard (“GICS”); however, the sector classifications used by the portfolio management team may differ from GICS. The percentage shown for each investment category reflects the value of investments in that category as a percentage of market value (excluding investments in the securities lending reinvestment vehicle, if any). Underlying sector allocations of exchange traded funds |
FUND BASICS
| | and investment companies held by the Fund are not reflected in the graph above. Investments in the securities lending reinvestment vehicle represented 0.6% of the Fund’s net assets at December 31, 2023. The graph depicts the Fund’s investments but may not represent the Fund’s market exposure due to the exclusion of certain derivatives, if any, as listed in the Additional Investment Information section of the Schedule of Investments. |
| | | For more information about the Fund, please refer to www.GSAMFUNDS.com. There, you can learn more about the Fund’s investment strategies, holdings, and performance. |
GOLDMAN SACHS VARIABLE INSURANCE TRUST SMALL CAP EQUITY INSIGHTS FUND
Performance Summary
December 31, 2023
The following graph shows the value, as of December 31, 2023, of a $10,000 investment made on January 1, 2014 in Institutional Shares at NAV. For comparative purposes, the performance of the Fund’s benchmark, the Russell 2000® Index (with distributions reinvested), is shown. Performance reflects applicable fee waivers and/or expense limitations in effect during the periods shown and, in their absence, performance would be reduced. Returns do not reflect the deduction of taxes that a shareholder would pay on Fund distributions or the redemption of Fund shares. The returns set forth below represent past performance. Past performance does not guarantee future results. The Fund’s investment return and principal value will fluctuate so that an investor’s shares, when redeemed, may be worth more or less than their original cost. Current performance may be lower or higher than the performance quoted below. Please visit our web site at www.GSAMFUNDS.com to obtain the most recent month-end returns.
|
|
Small Cap Equity Insights Fund’s 10 Year Performance |
|
Performance of a $10,000 investment, with distributions reinvested, from January 1, 2014 through December 31, 2023. |
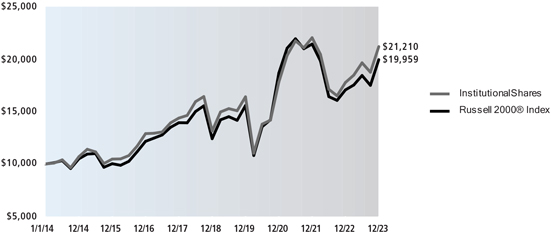
| | | | | | |
| | | |
Average Annual Total Returns through December 31, 2023* | | One Year | | Five Years | | Ten Years |
| | | |
Institutional | | 19.28% | | 10.04% | | 7.80% |
| | | | | | | |
| | | |
Service | | 18.95% | | 9.76% | | 7.53% |
| | | | | | | |
| * | These returns assume reinvestment of all distributions at NAV. Because Institutional and Service Shares do not involve sales charge, such a charge is not applied to their Average Annual Total Returns. |
GOLDMAN SACHS VARIABLE INSURANCE TRUST STRATEGIC GROWTH FUND
INVESTMENT OBJECTIVE
The Fund seeks long-term growth of capital.
Portfolio Management Discussion and Analysis
Below, the Goldman Sachs Fundamental Equity U.S. Equity Portfolio Management Team discusses the Goldman Sachs Variable Insurance Trust — Goldman Sachs Strategic Growth Fund’s (the “Fund”) performance and positioning for the 12-month period ended December 31, 2023 (the “Reporting Period”).
How did the Fund perform during the Reporting Period?
During the Reporting Period, the Fund’s Institutional and Service Shares generated average annual total returns of 41.94% and 41.65%, respectively. These returns compare to the 42.68% average annual total return of the Fund’s benchmark, the Russell 1000® Growth Index (with dividends reinvested) (the “Russell Index”), during the same time period.
What key factors were responsible for the Fund’s performance during the Reporting Period?
The Fund generated robust double-digit positive absolute returns but modestly underperformed the Russell Index on a relative basis during the Reporting Period. Sector allocation as a whole detracted, while stock selection overall contributed positively to the Fund’s relative results.
Which equity market sectors most significantly affected Fund performance?
Detracting most from the Fund’s relative results during the Reporting Period was weak stock selection in the consumer staples and financials sectors. Having an overweighted allocation to health care, which lagged the Russell Index during the Reporting Period, and having a position in cash when the Russell Index rallied strongly, also hurt. Offsetting these detractors was effective stock selection in the information technology and industrials sectors, which contributed positively to relative results. Having underweighted allocations to industrials and energy, each of which underperformed the Russell Index during the Reporting Period, also helped.
Which stocks detracted significantly from the Fund’s performance during the Reporting Period?
Detracting from the Fund’s results relative to the Russell Index were positions in specialty flavoring and food seasonings company McCormick & Company, social media conglomerate Meta Platforms and rare disease biopharmaceutical company Sarepta Therapeutics.
During the Reporting Period, McCormick & Company’s share price experienced volatility, as the company faced a challenging inflationary environment, hurting its performance. The company did see a few months of growth after reporting its first quarter 2023 earnings in late March, beating consensus expectations with an optimistic growth outlook through new products and its heat platform. However, the company’s stock fell sharply after reporting disappointing third quarter 2023 results, with earnings per share dropping, as the company continued to battle higher interest expenses and high borrowing costs. Furthermore, investors were concerned about its volume miss, driven by a lower recovery in China, which was shielded by pricing gains. Despite these headwinds, at the end of the Reporting Period, we continued to believe in the company, as, in our view, its U.S. consumer business is improving; it is gaining share globally; and its flavor solutions business grew significantly in the last months of the calendar year. Additionally, we continued to see tailwinds from its cost savings, supply chain and cost structure optimization programs going into 2024. Finally, its de-leveraging was occurring quickly with merger and acquisition opportunities coming back on its radar.
Meta Platforms was a new purchase for the Fund during the Reporting Period, but it was an underweight within the Fund’s portfolio, and so its strong performance led it to be a relative detractor. Meta Platforms has been focusing its efforts on different new devices to diversify and enter new markets, ramping up spending, especially on its metaverse construction project. As of the second quarter of 2023, the company was already demonstrating improving cost efficiency and better engagement trends. Trading throughout the third calendar quarter was mixed, as the company faced headwinds related to its advertising business, weaker growth and rising costs. Due to broader market pressures on companies, Meta Platforms was dealing with a downturn in digital advertising, as companies cut back on spending. However, at the end of the Reporting Period, we saw profit growth opportunities within its AI investments as well as in its plans to boost engagement and monetization within reels and messaging and grow its new app Threads’ userbase. We believed the company can combat headwinds within advertising as it furthers its AI capabilities, anticipating digital advertising revenue to be a new growth driver. We were also optimistic that the company can maintain its attractive operating margins and that the broader industry has positive tailwinds. While the company executed well ahead of our expectations during the Reporting Period, detracting from the Fund’s portfolio on a relative basis, we still believed that much of that is priced into its premium valuation. We thus continued to prefer other names in the technology industry. At the end of the Reporting Period, we believed in Meta Platform’s
GOLDMAN SACHS VARIABLE INSURANCE TRUST STRATEGIC GROWTH FUND
potential for growth and its ability to align its many apps to evolving consumptions habits within short-form video, messaging, commerce, augmented reality and social connections, but we intend to maintain the Fund’s underweight position in its stock for the near term.
Shares of Sarepta Therapeutics depreciated following the news in October 2023 that its study on its Duchenne Muscular Dystrophy treatment did not meet its primary endpoint. The outcome lowered the odds of approval in older patients and raised further questions surrounding whether the drug can stay in the market for four-to-five year olds. We ultimately decided to exit the Fund’s position, as without a clear catalyst to disprove the worst-case scenario, we saw a more difficult path up to our previous estimates for the company. As the company’s fate on this matter lies solely with the U.S. Food and Drug Administration, we decided it more prudent to sell the position in favor of what we saw as better risk/reward prospects elsewhere.
What were some of the Fund’s best-performing individual stocks?
Among those stocks the Fund benefited most from relative to the Russell Index were positions in semiconductor manufacturer and designer NVIDIA, customer relationship management software provider Salesforce and biotechnology company Seagen.
NVIDIA was the best performing stock in the S&P 500 Index during the Reporting Period, initially rising as investors had broad-based positive sentiment toward artificial intelligence (“AI”)-related companies. This positive momentum was then boosted throughout the Reporting Period, as NVIDIA consistently reported earnings that surpassed any bullish consensus expectations. Its second quarter 2023 revenue doubled from the previous year, as investment in AI propelled the company forward faster than widely anticipated. The company also impressed investors with strong third quarter 2023 earnings results that again saw outperformance with upbeat guidance looking forward. Overall, its strong performance during the Reporting Period was largely attributed to increased data center demand, with companies increasingly focusing on AI. Also, NVIDIA’s non-data center business coming off a trough, new product launches in gaming and professional visualization, a new product cycle related to Hopper, and strength in China as consumers were demanding more of the lower-specification chip products as they feared the possibility of further restrictions past the high end all boosted the company’s performance. At the end of the Reporting Period, we continued to view NVIDIA as one of the best positioned semiconductor companies over the long run, and we were increasingly bullish on consumer-levered semiconductor names. We believed NVIDIA’s competitive moats, compelling intellectual property and high growth end markets, particular toward AI and autonomous vehicles, should propel the company going forward.
Salesforce’s strength commenced in the beginning of 2023 when the company announced a 10% reduction in its workforce along with a broader reduction in costs across the business. Furthermore, it was announced that Elliot Investment Management initiated a multi-billion dollar stake in the company, which was reflected positively in its stock price. In March 2023, the company reported its fourth quarter 2022 earnings, which largely beat consensus expectations, driven by growth in its cloud-based customer relationship management business that has more than 150,000 customers globally. The company’s stock gained further on the news that Elliot Investment Management dropped its plan to nominate directors to Salesforce’s Board of Directors after its strong earnings. The company kept this momentum going as it reported first quarter 2023 earnings better than consensus expected across virtually all metrics. Finally, the company reported a solid third quarter 2023, illustrating a slight beat of consensus expectations on revenue and margins. Further, Salesforce’s management narrowed its full fiscal year guidance to the upper end of its previous range and increased its margin guidance on ongoing strength. Its commentary focused on positive traction in AI products and improvement in the overall spending environment. At the end of the Reporting Period, we remained positive on the company, as it has demonstrated, in our opinion, impressive margin expansion, and we continued to have confidence in the capital return opportunity in Salesforce’s stock. We further believed its management is well equipped to navigate relatively conservative guidance and is focused on margin expansion by being more disciplined with capital. In our view, an improving spending environment should bode well for the company.
The share price of Seagen appreciated at the beginning of 2023 after reporting both a strong fourth quarter 2022 earnings beat of consensus expectations on revenue and earnings per share and the reiteration of its management team’s confidence in the U.S. Food and Drug Administration review process for its bladder cancer drug Padcev. Following this positive performance, in mid-March 2023 it was announced that Pfizer would be acquiring Seagen for a premium, which caused its stock to appreciate further. Based on this announcement, we elected to liquidate the Fund’s position in Seagen and collect the profits from the transaction news.
How did the Fund use derivatives and similar instruments during the Reporting Period?
During the Reporting Period, we did not use derivatives as part of an active management strategy.
Did the Fund make any significant purchases or sales during the Reporting Period?
In addition to the purchase of Meta Platforms, mentioned earlier, we initiated a Fund position in semiconductor company Advanced Micro Devices (“AMD”) during the Reporting Period. We believe AMD should perform well given its ongoing diversification away from personal computers to embedded and data center computing. Further, the company, in our view, has a strong portfolio of offerings and should take share with its data center graphics processing units (“GPUs”). The personal computer end market is likely to be stable and grow from here, in our opinion. As such, we believe the company has the ability to gain market share and compound earnings going forward. Overall, we anticipate increasing revenue from the company and believe AMD is well positioned in growing automotive, telecommunications, and industrial end markets.
GOLDMAN SACHS VARIABLE INSURANCE TRUST STRATEGIC GROWTH FUND
We established a Fund position in financial business software company Intuit during the Reporting Period. We believe Intuit is a high quality business demonstrating durable revenue growth driven by pricing power, the opportunity to integrate generative AI into its offerings, its move to target up-market customers, international growth opportunities, and product cross-sell abilities. The company has had ongoing subscriber growth and a high level of recurring revenue in defensive categories that has allowed it to withstand macroeconomic headwinds relatively well. Overall, we believe near-term headwinds the business may face were reflected in its stock already. We further believe the company has a multitude of levers for long-term growth and potential margin expansion opportunity going forward.
Conversely, in addition to those sales already mentioned, we exited the Fund’s position in health care and insurance business UnitedHealth Group during the Reporting Period. While we continue to monitor the company, its stock price had been underperforming, in our opinion, due to softness within the company’s fundamentals, lack of guided visibility, and the probability of the company experiencing adverse cyclical factors due to Medicaid policy changes going forward. Therefore, we opted to sell the position and reallocate the proceeds to what we considered to be more attractive risk/reward opportunities.
We eliminated the Fund’s position in agricultural, construction and forestry machinery company Deere & Company during the Reporting Period. While we continue to like the company’s operations around being a dominant equipment provider with leading autonomous solutions, we decided to sell the position as we became more negative on the agricultural cycle. We believe 2023 may have been a peak year in terms of earnings for the company and that cyclical headwinds may present themselves in the macroeconomic environment in the months ahead. Overall, we believe the risk/reward potential is more attractive with other names in the industrials sector.
Were there any notable changes in the Fund’s weightings during the Reporting Period?
In constructing the Fund’s portfolio, we focus on picking stocks rather than on making industry or sector bets. We seek to outpace the benchmark index by overweighting stocks that we expect to outperform and underweighting those that we think may lag. Consequently, changes in its sector weights are generally the direct result of individual stock selection or of stock appreciation or depreciation. That said, during the Reporting Period, the Fund’s exposure to energy, industrials, information technology and real estate increased compared to the Russell Index. The Fund’s allocations compared to the Russell Index in communication services, consumer staples and health care decreased.
How was the Fund positioned relative to its benchmark index at the end of the Reporting Period?
At the end of December 2023, the Fund had overweighted positions relative to the Russell Index in the materials and real estate sectors. On the same date, the Fund had underweighted positions compared to the Russell Index in communication services, consumer staples and industrials and was rather neutrally weighted to the Russell Index in the consumer discretionary, energy, financials, health care, and information technology sectors at the end of the Reporting Period. The Fund had no exposure to the utilities sector at the end of the Reporting Period.
Were there any changes to the Fund’s portfolio management team during the Reporting Period?
There were no changes to the Fund’s portfolio management team during the Reporting Period.
What is the Fund’s tactical view and strategy for the months ahead?
Following a weak 2022, major U.S. equity indices reversed course in 2023, recording strong calendar year performance chiefly driven by a momentous rally from some of the largest mega-cap technology names, dubbed the “Magnificent Seven.” U.S. equities especially surged in the last two months of the fourth quarter of 2023, as the broader market and economy proved to be resilient—overcoming adversities from a banking crisis uprise that challenged depositors’ faith in regional banks, uncertainty surrounding the delayed effects of the Federal Reserve’s (“Fed”) monetary tightening regime on the U.S. economy, and heightened geopolitical tensions in Europe and the Middle East. At the end of 2023, we remained constructive on the U.S. equity market given that inflation was rather steadily approaching the Fed’s 2% target, a recession did not appear imminent, and then-recent economic data releases evidenced economic resilience, including a healthy labor market.
At the end of the Reporting Period, we believed there were several tailwinds to economic growth going forward, including strong real household income growth, a recovery in manufacturing activity, and an increased willingness of Fed officials to cut interest rates if disinflation persists. In our view, the Fed will likely take a cautious approach to cutting rates, although the latest Summary of Economic Projections published that the Fed’s voting members forecast a median federal funds rate of 4.6% by the end of 2024, penciling in 75 basis points of rate cuts to the Fed’s benchmark rate. (A basis point is 1/100th of a percentage point.)
In our view, throughout the coming year, market participants may well need to adapt to disruption from constant innovation, as governments and companies continue to invest in AI research, technology-enabled health care, and sustainability trends. We believe each of these themes had and will continue to transform industries long term, creating growth opportunities as well as a wide dispersion between companies. It is possible that election year uncertainty in 2024 may suppress risk appetite and increase volatility, though historically, once uncertainty is resolved, equity market performance is more correlated to fiscal and monetary policy. Ultimately, while the Fed seems to have steered away from a hard landing scenario during its tightening cycle, external shocks or an unexpected pivot to policy easing may rekindle inflation in a way that would require a recession to bring it lower.
GOLDMAN SACHS VARIABLE INSURANCE TRUST STRATEGIC GROWTH FUND
We believe our extensive bottom-up research approach can be beneficial to navigating these evolving themes and heightened volatility, while also positioning investors to benefit from the next upcycle. Regardless of market direction, we intend to stay true to our quality-first investment approach and seek to invest in businesses with healthy balance sheets, relatively stable cash flows and differentiated business models aligned to secular tailwinds. We continue to test our models and re-evaluate our assumptions with increasing information, remain focused on the long-term investment horizon and believe this fundamental approach can generate added value in the long run. As always, we maintain our focus on seeking companies that we believe will generate long-term growth in today’s ever-changing market conditions.
FUND BASICS
Strategic Growth Fund
as of December 31, 2023
|
|
TOP TEN HOLDINGS AS OF 12/31/231 |
| | | | |
| | |
Holding | | % of Net Assets | | Line of Business |
| | |
Microsoft Corp. | | 12.3% | | Information Technology |
| | |
Apple, Inc. | | 12.3 | | Information Technology |
| | |
Amazon.com, Inc. | | 6.6 | | Consumer Discretionary |
| | |
NVIDIA Corp. | | 4.6 | | Information Technology |
| | |
Alphabet, Inc., Class A | | 4.3 | | Communication Services |
| | |
Mastercard, Inc., Class A | | 3.2 | | Financials |
| | |
Eli Lilly & Co. | | 2.9 | | Health Care |
| | |
Alphabet, Inc., Class C | | 2.7 | | Communication Services |
| | |
Tesla, Inc. | | 2.1 | | Consumer Discretionary |
| | |
Advanced Micro Devices, Inc. | | 1.9 | | Information Technology |
| | 1 | The top 10 holdings may not be representative of the Fund’s future investments. |
|
|
FUND VS. BENCHMARK SECTOR ALLOCATIONS2 |
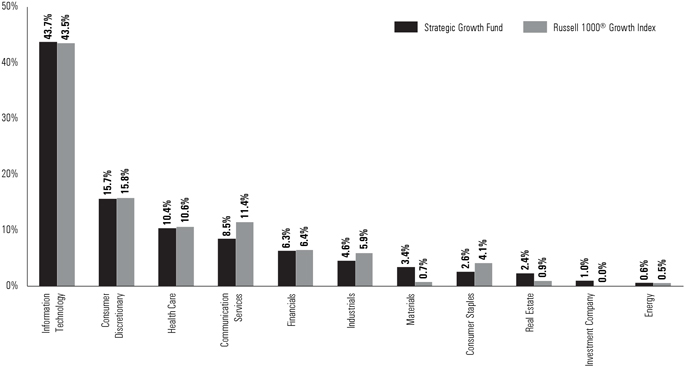
| | 2 | The Fund is actively managed and, as such, its composition may differ over time. Consequently, the Fund’s overall sector allocations may differ from percentages contained in the graph above. The graph categorizes investments using Global Industry Classification Standard (“GICS”); however, the sector classifications used by the portfolio management team may differ from GICS. The percentage shown for each investment category reflects the value of investments in that category as a percentage of market value (excluding investments in the securities lending reinvestment vehicle, if any). Investments in the securities lending reinvestment vehicle represented 0.7% of the Fund’s net assets at December 31, 2023. Underlying sector allocations of exchange traded funds and investment companies held by the Fund are not reflected in the graph above. |
FUND BASICS
| | | For more information about the Fund, please refer to www.GSAMFUNDS.com. There, you can learn more about the Fund’s investment strategies, holdings, and performance. |
GOLDMAN SACHS VARIABLE INSURANCE TRUST STRATEGIC GROWTH FUND
Performance Summary
December 31, 2023
The following graph shows the value, as of December 31, 2023, of a $10,000 investment made on January 1, 2014 in Service Shares at NAV. For comparative purposes, the performance of the Fund’s benchmark, the Russell 1000® Growth Index (with distributions reinvested), is shown. Performance reflects applicable fee waivers and/or expense limitations in effect during the periods shown and, in their absence, performance would be reduced. Returns do not reflect the deduction of taxes that a shareholder would pay on Fund distributions or the redemption of Fund shares. The returns set forth below represent past performance. Past performance does not guarantee future results. The Fund’s investment return and principal value will fluctuate so that an investor’s shares, when redeemed, may be worth more or less than their original cost. Current performance may be lower or higher than the performance quoted below. Please visit our web site at www.GSAMFUNDS.com to obtain the most recent month-end returns.
|
|
Strategic Growth Fund’s 10 Year Performance |
|
Performance of a $10,000 investment, with distributions reinvested, from January 1, 2014 through December 31, 2023. |
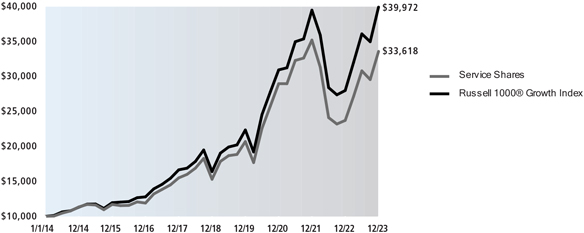
| | | | | | |
| | | |
Average Annual Total Returns through December 31, 2023* | | One Year | | Five Years | | Ten Years |
| | | |
Institutional | | 41.94% | | 17.32% | | 13.16% |
| | | | | | | |
| | | |
Service | | 41.65% | | 17.05% | | 12.88% |
| | | | | | | |
| * | These returns assume reinvestment of all distributions at NAV. Because Institutional and Service Shares do not involve sales charge, such a charge is not applied to their Average Annual Total Returns. |
GOLDMAN SACHS VARIABLE INSURANCE TRUST U.S. EQUITY INSIGHTS FUND
INVESTMENT OBJECTIVE
The Fund seeks long-term growth of capital and dividend income.
Portfolio Management Discussion and Analysis
Below, the Goldman Sachs Quantitative Investment Strategies Team discusses the Goldman Sachs Variable Insurance Trust — Goldman Sachs U.S. Equity Insights Fund’s (the “Fund”) performance and positioning for the 12-month period ended December 31, 2023 (the “Reporting Period”).
How did the Fund perform during the Reporting Period?
During the Reporting Period, the Fund’s Institutional and Service Shares generated average annual total returns of 23.81% and 23.59%, respectively. These returns compare to the 26.29% average annual total return of the Fund’s benchmark, the Standard & Poor’s 500® Index (with dividends reinvested) (the “S&P 500® Index”) during the same time period.
What key factors were responsible for the Fund’s performance during the Reporting Period?
The Fund uses a quantitative style of management, in combination with a qualitative overlay, that emphasizes fundamentally-based stock selection, careful portfolio construction and efficient implementation. The Fund’s investments are selected using fundamental research and a variety of quantitative techniques based on certain investment themes, namely Fundamental Mispricings, High Quality Business Models, Sentiment Analysis and Market Themes & Trends.
During the Reporting Period, the Fund posted healthy double-digit gains but underperformed the S&P 500® Index on a relative basis, with three of our four quantitative model’s investment themes detracting from results. Stock selection overall, driven by these investment themes, also dampened relative performance.
What impact did the Fund’s investment themes have on performance during the Reporting Period?
In keeping with our investment approach, we use our quantitative model and four investment themes to take a long-term view of market patterns and look for inefficiencies, selecting stocks for the Fund and overweighting or underweighting the ones chosen by the model. Over time and by design, the performance of any one of the model’s investment themes tends to have a low correlation with the model’s other themes, demonstrating the diversification benefit of the Fund’s theme-driven quantitative model. The variance in performance supports our research indicating that the diversification provided by the Fund’s different investment themes is a significant investment advantage over the long term, even though the Fund may experience underperformance in the short term. Of course, diversification does not protect an investor from market risk nor does it ensure a profit.
During the Reporting Period, three of our four investment themes detracted from the Fund’s relative performance, with Fundamental Mispricings hurting most, followed by High Quality Business Models and Sentiment Analysis. The Market Themes & Trends investment theme contributed positively, albeit modestly, to the Fund’s relative performance. Fundamental Mispricings seeks to identify high quality businesses trading at a fair price, which we believe may lead to strong performance over the long run. High Quality Business Models seeks to identify companies that are generating high quality revenues with sustainable business models and aligned management incentives. Sentiment Analysis seeks to identify stocks experiencing improvements in their overall market sentiment. Market Themes & Trends seeks to identify companies positively positioned to benefit from themes and trends in the market and macroeconomic environment.
How did the Fund’s sector and industry allocations affect relative performance?
In constructing the Fund’s portfolio, our quantitative model focuses on stock selection rather than making sector or industry bets. Consequently, the Fund is similar to its benchmark, the S&P 500® Index, in terms of its sector and industry allocations and style. Relative performance is primarily driven by stock selection, not by sector or industry allocations.
Did stock selection help or hurt Fund performance during the Reporting Period?
We seek to outpace the S&P 500® Index by overweighting stocks that we expect to outperform and underweighting those that we think may lag. At the same time, we strive to maintain a risk profile similar to the S&P 500® Index. The Fund’s investments are selected using fundamental research and a variety of quantitative techniques based on our investment themes. For example, the Fund aims to hold a basket of stocks with better Fundamental Mispricings characteristics than the benchmark index.
During the Reporting Period, stock selection detracted from the Fund’s performance, with investments in the consumer discretionary, industrials and health care sectors hurting most relative to the S&P 500® Index. Stock selection in the consumer staples, utilities and financials sectors contributed positively to the Fund’s results relative to the S&P 500® Index during the Reporting Period.
GOLDMAN SACHS VARIABLE INSURANCE TRUST U.S. EQUITY INSIGHTS FUND
Which individual positions detracted from the Fund’s results during the Reporting Period?
Detracting most from the Fund’s results relative to the S&P 500® Index were underweight positions in social media giant Meta Platforms and semiconductor device developer Broadcom and an overweight position in health and pharmacy services provider CVS Health. The Fund had an underweight position in Meta Platforms based primarily on our High Quality Business Models investment theme. The Fund’s underweight in Broadcom was due to our Sentiment Analysis investment theme. The overweight in CVS Health was established primarily because of our Fundamental Mispricings investment theme.
Which individual stock positions contributed the most to the Fund’s relative returns during the Reporting Period?
The Fund benefited most from overweight positions in cybersecurity company Palo Alto Networks and information technology infrastructure manufacturer Dell Technologies and an underweight position in pharmaceuticals company Pfizer. The overweight in Palo Alto Networks was established primarily because of our High Quality Business Models and Sentiment Analysis investment themes. The Fund was overweight Dell Technologies due mostly to our High Quality Business Models investment theme. The Fund’s underweight in Pfizer was driven primarily by our High Quality Business Models and Sentiment Analysis investment themes.
How did the Fund use derivatives during the Reporting Period?
During the Reporting Period, we used equity index futures contracts, on an opportunistic basis, to equitize the Fund’s cash holdings. In other words, we put the Fund’s cash holdings to work by using them as collateral for the purchase of futures contracts. The use of these derivatives did not have a material impact on the Fund’s performance during the Reporting Period.
Did you make any enhancements to your quantitative models during the Reporting Period?
We continuously look for ways to improve our investment process. During the Reporting Period, we implemented a couple of new signals within our Sentiment Analysis investment theme. The first enhancement implemented aims to improve our sentiment identification in earnings call reports by utilizing many of the latest developments in machine learning and natural language processing (“NLP”). The second signal implemented in the U.S. region aims to capitalize upon price dislocations that are caused by uninformed exchange-traded fund trading. Finally, we implemented two new signals within our Market Themes & Trends investment theme. The first signal leverages advanced machine learning algorithms to capture nuanced behavior of our existing suite of more than a hundred alpha factors. The second signal aims to apply NLP techniques to account for fine-grained linguistic meaning of documents when quantifying company linkages for text-based cross-stock momentum factors.
In fact, we introduced several new signals and enhancements during the Reporting Period that leverage machine learning techniques, such as NLP, as well as those that are based on different types of alternative data sources. The Team’s new NLP-based signals utilize the transformer architecture to be able to extract insights from different bodies of text. For example, within the Sentiment Analysis investment theme, we introduced a suite of signals that seeks to identify changes in sentiment within company regulatory filings and documents by using advanced NLP models to synthesize the context of the language used within the document. In addition to the NLP-based signals, we also introduced a new signal that seeks to capture the level of attention stocks receive as a result of being mentioned in news articles and blog posts. We believe companies that receive outsized attention in the media experience positive, but temporary, price trends that ultimately revert over the longer term. We also introduced new signals within the Market Themes & Trends investment theme. The first signal introduced leverages NLP and topic modeling techniques to identify economic linkages between companies based on their current descriptions. Additionally, we implemented a suite of signals that leverage word embedding techniques to capture the meanings of the words and language used with employer reviews in order to identify the economic linkages between companies mentioned.
Lastly, within our High Quality Business Models investment theme, we introduced two suites of signals within the U.S. that are both based on jobs posting data. The first signals focus on the duration that jobs postings remain outstanding. We believe companies that are appealing to prospective employees can fulfill jobs postings quicker and are therefore better positioned for growth over the long term. The second suite of signals focus on the types of roles the company is trying to hire for, as we believe companies seeking to employ for high-in-demand roles will have to pay increased costs for the set of skills required and thus have their prospects for future growth be more challenged.
What was the Fund’s sector positioning relative to its benchmark index at the end of the Reporting Period?
As of December 31, 2023, the Fund was overweight the consumer discretionary, information technology and real estate sectors relative to the S&P 500® Index. The Fund was underweight health care, industrials, utilities and energy and was rather neutrally weighted in financials, materials, communication services and consumer staples compared to the benchmark index on the same date.
Were there any changes to the Fund’s portfolio management team during the Reporting Period?
There were no changes to the Fund’s portfolio management team during the Reporting Period.
GOLDMAN SACHS VARIABLE INSURANCE TRUST U.S. EQUITY INSIGHTS FUND
What is your strategy going forward for the Fund?
Looking ahead, we continue to believe that less expensive stocks should outpace more expensive stocks, and stocks with good momentum are likely to outperform those with poor momentum. We intend to maintain our focus on seeking companies about which fundamental research analysts are becoming more positive as well as profitable companies with sustainable earnings and a track record of using their capital to enhance shareholder value. As such, we anticipate remaining fully invested with long-term performance likely to be the result of stock selection rather than sector or capitalization allocations.
We stand behind our investment philosophy that sound economic investment principles, coupled with a disciplined quantitative approach, can provide strong, uncorrelated returns over the long term. Our research agenda is robust, and we continue to enhance our existing models, add new proprietary forecasting signals and improve our trading execution as we seek to provide the most value to our shareholders.
FUND BASICS
U.S. Equity Insights Fund
as of December 31, 2023
|
|
TOP TEN HOLDINGS AS OF 12/31/231 |
| | | | |
| | |
Holding | | % of Net Assets | | Line of Business |
| | |
Microsoft Corp. | | 8.1% | | Information Technology |
| | |
Apple, Inc. | | 8.1 | | Information Technology |
| | |
Amazon.com, Inc. | | 3.9 | | Consumer Discretionary |
| | |
Alphabet, Inc., Class C | | 3.1 | | Communication Services |
| | |
Meta Platforms, Inc., Class A | | 3.0 | | Communication Services |
| | |
Berkshire Hathaway, Inc., Class B | | 2.7 | | Financials |
| | |
NVIDIA Corp. | | 2.6 | | Information Technology |
| | |
Visa, Inc., Class A | | 2.1 | | Financials |
| | |
Alphabet, Inc., Class A | | 1.9 | | Communication Services |
| | |
Tesla, Inc. | | 1.7 | | Consumer Discretionary |
| | 1 | The top 10 holdings may not be representative of the Fund’s future investments. |
|
|
FUND VS. BENCHMARK SECTOR ALLOCATIONS2 |
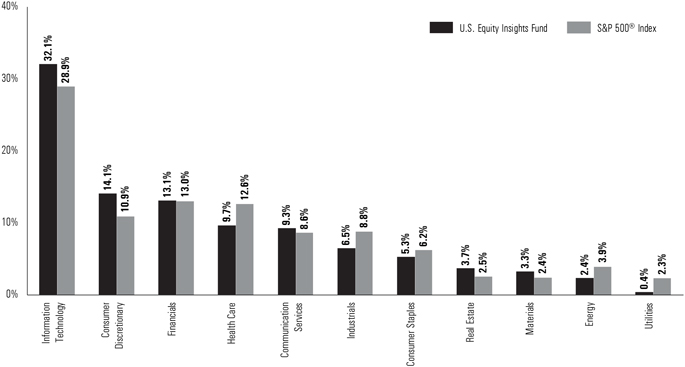
| | 2 | The Fund is actively managed and, as such, its composition may differ over time. Consequently, the Fund’s overall sector allocations may differ from percentages contained in the graph above. The graph categorizes investments using Global Industry Classification Standard (“GICS”); however, the sector classifications used by the portfolio management team may differ from GICS. The percentage shown for each investment category reflects the value of investments in that category as a percentage of market value. |
| | | For more information about the Fund, please refer to www.GSAMFUNDS.com. There, you can learn more about the Fund’s investment strategies, holdings, and performance. |
GOLDMAN SACHS VARIABLE INSURANCE TRUST U.S. EQUITY INSIGHTS FUND
Performance Summary
December 31, 2023
The following graph shows the value, as of December 31, 2023, of a $10,000 investment made on January 1, 2014 in Institutional Shares at NAV. For comparative purposes, the performance of the Fund’s benchmark, the S&P 500® Index, is shown. Performance reflects applicable fee waivers and/or expense limitations in effect during the periods shown and, in their absence, performance would be reduced. Returns do not reflect the deduction of taxes that a shareholder would pay on Fund distributions or the redemption of Fund shares. The returns set forth below represent past performance. Past performance does not guarantee future results. The Fund’s investment return and principal value will fluctuate so that an investor’s shares, when redeemed, may be worth more or less than their original cost. Current performance may be lower or higher than the performance quoted below. Please visit our web site at www.GSAMFUNDS.com to obtain the most recent month-end returns.
|
|
U.S. Equity Insights Fund’s 10 Year Performance |
|
Performance of a $10,000 investment, with distributions reinvested, from January 1, 2014 through December 31, 2023. |
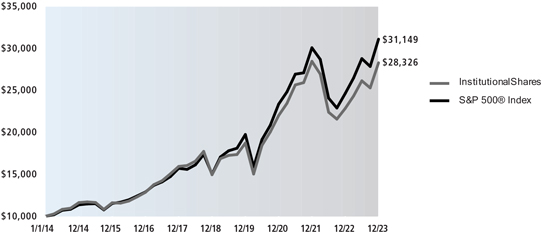
| | | | | | |
| | | |
Average Annual Total Returns through December 31, 2023* | | One Year | | Five Years | | Ten Years |
| | | |
Institutional | | 23.81% | | 13.60% | | 10.97% |
| | | | | | | |
| | | |
Service | | 23.59% | | 13.37% | | 10.74% |
| | | | | | | |
| * | These returns assume reinvestment of all distributions at NAV. Because Institutional and Service Shares do not involve sales charge, such a charge is not applied to their Average Annual Total Returns. |
GOLDMAN SACHS VARIABLE INSURANCE TRUST FUNDS
Index Definitions
S&P 500® Index is the Standard & Poor’s composite index of 500 stocks, an unmanaged index of common stock prices. The figures for the index do not include any deduction for fees, expenses or taxes.
Russell 2000® Index is an unmanaged index of common stock prices that measures the performance of the 2000 smallest companies in the Russell 3000® Index. The figures for the index do not include any deduction for fees, expenses or taxes.
Russell Midcap® Index measures the performance of the 800 smallest companies in the Russell 1000® Index, which represents approximately 25% of the total market capitalization of the Russell 1000® Index.
Russell 1000® Index measures the performance of the 1,000 largest companies in the Russell 3000® Index, which represents approximately 92% of the total market capitalization of the Russell 3000® Index.
The Russell 1000® Value Index is an unmanaged market capitalization weighted index of the 1000 largest U.S. companies with lower price-to-book ratios and lower forecasted growth values. The figures for the index do not include any deduction for fees, expenses or taxes.
Russell Midcap® Growth Index is an unmanaged index that measures the performance of those companies in the Russell Midcap® Index with higher price-to-book ratios and higher forecasted growth values.
The Russell Midcap Value® Index is an unmanaged index of common stock prices that measures the performance of those Russell Midcap companies with lower price-to-book ratios and lower forecasted growth values. The index figures do not reflect any deduction for fees, expenses or taxes
The Russell 1000® Growth Index is an unmanaged market capitalization weighted index of the 1000 largest U.S. companies with higher price-to-book ratios and higher forecasted growth values. The figures for the index do not include any deduction for fees, expenses or taxes.
It is not possible to invest directly in an index.
GOLDMAN SACHS VARIABLE INSURANCE TRUST INTERNATIONAL EQUITY INSIGHTS FUND
|
Schedule of Investments December 31, 2023 |
| | | | | | | | |
| | | Shares | | Description | | Value | |
| |
| | Common Stocks – 97.1% | |
| |
| | Australia – 6.8% | |
| | 23,252 | | ANZ Group Holdings Ltd. (Banks) | | $ | 410,817 | |
| | 10,998 | | Aristocrat Leisure Ltd. (Consumer Services) | | | 305,563 | |
| | 41,263 | | BHP Group Ltd. (Materials) | | | 1,409,735 | |
| | 19,678 | | BlueScope Steel Ltd. (Materials) | | | 313,716 | |
| | 64,927 | | Brambles Ltd. (Commercial & Professional Services) | | | 601,801 | |
| | 10,748 | | Challenger Ltd. (Financial Services) | | | 47,580 | |
| | 2,441 | | Cochlear Ltd. (Health Care Equipment & Services) | | | 496,611 | |
| | 533 | | Commonwealth Bank of Australia (Banks) | | | 40,624 | |
| | 45,885 | | Glencore PLC (Materials) | | | 275,817 | |
| | 21,195 | | Goodman Group REIT (Equity Real Estate Investment Trusts (REITs)) | | | 364,911 | |
| | 7,311 | | IDP Education Ltd. (Consumer Services) | | | 99,730 | |
| | 715 | | Macquarie Group Ltd. (Financial Services) | | | 89,505 | |
| | 2,820 | | National Australia Bank Ltd. (Banks) | | | 58,941 | |
| | 9,913 | | Northern Star Resources Ltd. (Materials) | | | 91,974 | |
| | 12,134 | | Perseus Mining Ltd. (Materials) | | | 15,262 | |
| | 3,407 | | Rio Tinto PLC ADR (Materials) | | | 253,685 | |
| | 292,271 | | Scentre Group REIT (Equity Real Estate Investment Trusts (REITs)) | | | 595,184 | |
| | 57,369 | | Stockland REIT (Equity Real Estate Investment Trusts (REITs)) | | | 173,979 | |
| | 24,663 | | Suncorp Group Ltd. (Insurance) | | | 233,543 | |
| | 167,928 | | Telstra Group Ltd. (Telecommunication Services) | | | 453,789 | |
| | 30,173 | | Woolworths Group Ltd. (Consumer Staples Distribution & Retail) | | | 765,488 | |
| | | | | | | | |
| | | | | | | 7,098,255 | |
| | | |
| |
| | Austria – 0.9% | |
| | 6,452 | | BAWAG Group AG (Banks)*(a) | | | 341,447 | |
| | 5,713 | | Erste Group Bank AG (Banks) | | | 231,405 | |
| | 8,027 | | Strabag SE (Capital Goods) | | | 366,862 | |
| | | | | | | | |
| | | | | | | 939,714 | |
| | | |
| |
| | Belgium – 0.3% | |
| | 2,847 | | Euronav NV (Energy) | | | 50,193 | |
| | 3,739 | | KBC Ancora (Banks) | | | 171,600 | |
| | 878 | | UCB SA (Pharmaceuticals, Biotechnology & Life Sciences) | | | 76,537 | |
| | | | | | | | |
| | | | | | | 298,330 | |
| | | |
| | | | | | | | |
| | | Shares | | Description | | Value | |
| |
| | Common Stocks – (continued) | |
| |
| | China – 0.8% | |
| | 27,285 | | Prosus NV (Consumer Discretionary Distribution & Retail)* | | $ | 812,823 | |
| | | |
| |
| | Denmark – 2.7% | |
| | 1,618 | | Genmab A/S (Pharmaceuticals, Biotechnology & Life Sciences)* | | | 515,904 | |
| | 19,575 | | Novo Nordisk A/S, Class B (Pharmaceuticals, Biotechnology & Life Sciences) | | | 2,028,580 | |
| | 2,111 | | Pandora A/S (Consumer Durables & Apparel) | | | 291,857 | |
| | 958 | | Sydbank AS (Banks) | | | 41,667 | |
| | | | | | | | |
| | | | | | | 2,878,008 | |
| | | |
| |
| | Finland – 1.0% | |
| | 20,335 | | Nokia OYJ (Technology Hardware & Equipment) | | | 69,260 | |
| | 78,835 | | Nordea Bank Abp (Banks) | | | 978,689 | |
| | | | | | | | |
| | | | | | | 1,047,949 | |
| | | |
| |
| | France – 9.6% | |
| | 7,636 | | Air Liquide SA (Materials) | | | 1,486,694 | |
| | 1,151 | | Airbus SE (Capital Goods) | | | 177,816 | |
| | 6,099 | | Cie de Saint-Gobain SA (Capital Goods) | | | 449,785 | |
| | 6,569 | | Cie Generale des Etablissements Michelin SCA (Automobiles & Components) | | | 236,002 | |
| | 2,770 | | Dassault Aviation SA (Capital Goods) | | | 548,821 | |
| | 18,708 | | Dassault Systemes (Software & Services) | | | 915,706 | |
| | 1,715 | | Edenred SE (Financial Services) | | | 102,634 | |
| | 6,278 | | Eiffage SA (Capital Goods) | | | 673,947 | |
| | 33,983 | | Engie SA (Utilities) | | | 598,655 | |
| | 996 | | Gecina SA REIT (Equity Real Estate Investment Trusts (REITs)) | | | 121,252 | |
| | 593 | | Hermes International SCA (Consumer Durables & Apparel) | | | 1,260,431 | |
| | 682 | | Kering (Consumer Durables & Apparel) | | | 302,057 | |
| | 8,975 | | Legrand SA (Capital Goods) | | | 934,623 | |
| | 523 | | LVMH Moet Hennessy Louis Vuitton SE (Consumer Durables & Apparel) | | | 424,957 | |
| | 2,315 | | Publicis Groupe SA (Media & Entertainment) | | | 215,091 | |
| | 10,571 | | Rexel SA (Capital Goods) | | | 290,134 | |
| | 3,011 | | Safran SA (Capital Goods) | | | 530,871 | |
| | 2,760 | | Thales SA (Capital Goods) | | | 408,681 | |
| | 12,039 | | Veolia Environnement SA (Utilities) | | | 380,513 | |
| | | | | | | | |
| | | | | | | 10,058,670 | |
| | | |
| |
| | Georgia – 0.1% | |
| | 3,731 | | TBC Bank Group PLC (Banks) | | | 134,587 | |
| | | |
| | |
| The accompanying notes are an integral part of these financial statements. | | 47 |
GOLDMAN SACHS VARIABLE INSURANCE TRUST INTERNATIONAL EQUITY INSIGHTS FUND
|
Schedule of Investments (continued) December 31, 2023 |
| | | | | | | | |
| | | Shares | | Description | | Value | |
| |
| | Common Stocks – (continued) | |
| |
| | Germany – 9.6% | |
| | 4,751 | | Allianz SE (Insurance) | | $ | 1,269,664 | |
| | 495 | | Atoss Software AG (Software & Services) | | | 114,172 | |
| | 1,238 | | Brenntag SE (Capital Goods) | | | 113,782 | |
| | 5,892 | | Commerzbank AG (Banks) | | | 70,031 | |
| | 1,412 | | Continental AG (Automobiles & Components) | | | 119,923 | |
| | 2,334 | | Deutsche Boerse AG (Financial Services) | | | 480,652 | |
| | 23,191 | | Deutsche Telekom AG (Telecommunication Services) | | | 557,588 | |
| | 829 | | DWS Group GmbH & Co. KGaA (Financial Services)(a) | | | 31,862 | |
| | 71,879 | | E.ON SE (Utilities) | | | 965,699 | |
| | 3,543 | | Fresenius SE & Co. KGaA (Health Care Equipment & Services) | | | 109,817 | |
| | 9,579 | | FUCHS SE (Materials) | | | 343,292 | |
| | 966 | | GEA Group AG (Capital Goods) | | | 40,161 | |
| | 2,465 | | Hannover Rueck SE (Insurance) | | | 589,391 | |
| | 321 | | Hapag-Lloyd AG (Transportation)(a)(b) | | | 47,802 | |
| | 7,881 | | Henkel AG & Co. KGaA (Household & Personal Products) | | | 565,451 | |
| | 12,700 | | Infineon Technologies AG (Semiconductors & Semiconductor Equipment) | | | 530,385 | |
| | 855 | | MTU Aero Engines AG (Capital Goods) | | | 184,206 | |
| | 2,457 | | Muenchener Rueckversicherungs- Gesellschaft AG in Muenchen (Insurance) | | | 1,019,198 | |
| | 12,694 | | SAP SE (Software & Services) | | | 1,953,881 | |
| | 4,988 | | Siemens AG (Capital Goods) | | | 935,796 | |
| | | | | | | | |
| | | | | | | 10,042,753 | |
| | | |
| |
| | Hong Kong – 1.8% | |
| | 153,600 | | AIA Group Ltd. (Insurance) | | | 1,336,763 | |
| | 5,900 | | Jardine Matheson Holdings Ltd. (Capital Goods) | | | 250,750 | |
| | 31,000 | | Swire Pacific Ltd., Class A (Real Estate Management & Development) | | | 262,559 | |
| | 35,000 | | Swire Pacific Ltd., Class B (Real Estate Management & Development) | | | 45,828 | |
| | | | | | | | |
| | | | | | | 1,895,900 | |
| | | |
| |
| | Italy – 2.2% | |
| | 64,697 | | Banca Mediolanum SpA (Financial Services) | | | 611,059 | |
| | 37,866 | | Banco BPM SpA (Banks) | | | 200,650 | |
| | 43,056 | | Enel SpA (Utilities) | | | 320,329 | |
| | 973 | | Prysmian SpA (Capital Goods) | | | 44,354 | |
| | 38,302 | | UniCredit SpA (Banks) | | | 1,042,952 | |
| | | | | | | | |
| | | Shares | | Description | | Value | |
| |
| | Common Stocks – (continued) | |
| |
| | Italy – (continued) | |
| | 23,614 | | Unipol Gruppo SpA (Insurance) | | $ | 134,765 | |
| | | | | | | | |
| | | | | | | 2,354,109 | |
| | | |
| |
| | Japan – 22.9% | |
| | 4,900 | | Advantest Corp. (Semiconductors & Semiconductor Equipment) | | | 165,108 | |
| | 6,900 | | Aisin Corp. (Automobiles & Components) | | | 240,543 | |
| | 7,700 | | Alfresa Holdings Corp. (Health Care Equipment & Services) | | | 130,717 | |
| | 3,300 | | Amada Co. Ltd. (Capital Goods) | | | 34,304 | |
| | 1,800 | | Asahi Group Holdings Ltd. (Food, Beverage & Tobacco) | | | 67,025 | |
| | 2,500 | | Brother Industries Ltd. (Technology Hardware & Equipment) | | | 39,812 | |
| | 5,000 | | Casio Computer Co. Ltd. (Consumer Durables & Apparel) | | | 43,296 | |
| | 17,200 | | Central Japan Railway Co. (Transportation) | | | 436,541 | |
| | 16,500 | | Chubu Electric Power Co., Inc. (Utilities) | | | 213,037 | |
| | 10,300 | | Computer Engineering & Consulting Ltd. (Software & Services) | | | 114,166 | |
| | 2,500 | | Dai Nippon Printing Co. Ltd. (Commercial & Professional Services) | | | 73,828 | |
| | 3,900 | | Daiichi Jitsugyo Co. Ltd. (Capital Goods) | | | 54,245 | |
| | 47,000 | | Daiwa Securities Group, Inc. (Financial Services) | | | 315,472 | |
| | 4,800 | | Doutor Nichires Holdings Co. Ltd. (Consumer Services) | | | 74,065 | |
| | 53,500 | | ENEOS Holdings, Inc. (Energy) | | | 212,194 | |
| | 14,700 | | Fujikura Kasei Co. Ltd. (Materials) | | | 44,536 | |
| | | 107,400 | | Honda Motor Co. Ltd. (Automobiles & Components) | | | 1,107,854 | |
| | 3,200 | | Icom, Inc. (Technology Hardware & Equipment) | | | 81,597 | |
| | 6,000 | | Inaba Seisakusho Co. Ltd. (Commercial & Professional Services) | | | 62,360 | |
| | 1,400 | | Itoki Corp. (Commercial & Professional Services) | | | 13,322 | |
| | 5,600 | | IwaiCosmo Holdings, Inc. (Financial Services) | | | 72,835 | |
| | 1,600 | | J Front Retailing Co. Ltd. (Consumer Discretionary Distribution & Retail) | | | 14,530 | |
| | 119 | | Japan Metropolitan Fund Invest REIT (Equity Real Estate Investment Trusts (REITs)) | | | 85,894 | |
| | 35,000 | | Japan Post Bank Co. Ltd. (Banks) | | | 356,193 | |
| | 40,900 | | JFE Holdings, Inc. (Materials) | | | 632,773 | |
| | |
| 48 | | The accompanying notes are an integral part of these financial statements. |
GOLDMAN SACHS VARIABLE INSURANCE TRUST INTERNATIONAL EQUITY INSIGHTS FUND
| | | | | | | | |
| | | Shares | | Description | | Value | |
| |
| | Common Stocks – (continued) | |
| |
| | Japan – (continued) | |
| | 1,900 | | J-Oil Mills, Inc. (Food, Beverage & Tobacco) | | $ | 26,030 | |
| | 15,800 | | JSP Corp. (Materials) | | | 205,082 | |
| | 18,300 | | KDDI Corp. (Telecommunication Services) | | | 580,449 | |
| | 4,000 | | Kitagawa Corp. (Capital Goods)* | | | 39,388 | |
| | 3,500 | | Kobayashi Pharmaceutical Co. Ltd. (Household & Personal Products) | | | 168,371 | |
| | 23,100 | | Kobe Steel Ltd. (Materials) | | | 297,747 | |
| | 8,100 | | Kokuyo Co. Ltd. (Commercial & Professional Services) | | | 131,499 | |
| | 4,600 | | Kurita Water Industries Ltd. (Capital Goods) | | | 179,424 | |
| | 13,200 | | Kyoei Steel Ltd. (Materials) | | | 186,591 | |
| | 9,100 | | Kyokuto Securities Co. Ltd. (Financial Services) | | | 62,013 | |
| | 11,000 | | Mars Group Holdings Corp. (Consumer Durables & Apparel) | | | 192,359 | |
| | 24,100 | | Marusan Securities Co. Ltd. (Financial Services) | | | 143,646 | |
| | 27,200 | | Mazda Motor Corp. (Automobiles & Components) | | | 290,743 | |
| | 7,100 | | Mimasu Semiconductor Industry Co. Ltd. (Semiconductors & Semiconductor Equipment) | | | 160,567 | |
| | 56,400 | | Mitsubishi Electric Corp.
(Capital Goods) | | | 797,726 | |
| | 29,600 | | Mitsubishi Estate Co. Ltd. (Real Estate Management & Development) | | | 405,759 | |
| | 56,500 | | Mitsubishi HC Capital, Inc. (Financial Services) | | | 378,539 | |
| | 4,900 | | Mitsubishi Logisnext Co. Ltd.
(Capital Goods) | | | 47,891 | |
| | 5,100 | | Mitsubishi Shokuhin Co. Ltd. (Consumer Staples Distribution & Retail) | | | 173,616 | |
| | 53,300 | | Mitsubishi UFJ Financial Group, Inc. (Banks) | | | 457,428 | |
| | 20,800 | | Mizuho Financial Group, Inc. (Banks) | | | 354,803 | |
| | 1,300 | | Mizuho Leasing Co. Ltd. (Financial Services) | | | 44,515 | |
| | 6,000 | | Mochida Pharmaceutical Co. Ltd. (Pharmaceuticals, Biotechnology & Life Sciences) | | | 138,896 | |
| | 16,000 | | MS&AD Insurance Group Holdings, Inc. (Insurance) | | | 629,101 | |
| | 2,200 | | Nakamoto Packs Co. Ltd. (Commercial & Professional Services) | | | 25,910 | |
| | 5,800 | | NEC Corp. (Software & Services) | | | 342,700 | |
| | 19,900 | | NGK Insulators Ltd.
(Capital Goods) | | | 237,325 | |
| | | | | | | | |
| | | Shares | | Description | | Value | |
| |
| | Common Stocks – (continued) | |
| |
| | Japan – (continued) | |
| | 4,300 | | Nihon Parkerizing Co. Ltd. (Materials) | | $ | 34,598 | |
| | 2,000 | | Nippon Sanso Holdings Corp. (Materials) | | | 53,405 | |
| | 28,300 | | Nippon Steel Corp. (Materials) | | | 646,479 | |
| | 403,400 | | Nippon Telegraph & Telephone Corp. (Telecommunication Services) | | | 492,585 | |
| | 8,400 | | Nippon Yusen KK (Transportation) | | | 259,421 | |
| | 2,400 | | Nisshin Oillio Group Ltd. (The) (Food, Beverage & Tobacco) | | | 72,980 | |
| | 14,400 | | Nisshin Seifun Group, Inc. (Food, Beverage & Tobacco) | | | 193,927 | |
| | 22,100 | | Nomura Real Estate Holdings, Inc. (Real Estate Management & Development) | | | 579,914 | |
| | 2,800 | | Okamura Corp. (Commercial & Professional Services) | | | 43,181 | |
| | 47,500 | | ORIX Corp. (Financial Services) | | | 892,106 | |
| | 1,800 | | Otsuka Corp. (Software & Services) | | | 74,079 | |
| | 14,000 | | Otsuka Holdings Co. Ltd. (Pharmaceuticals, Biotechnology & Life Sciences) | | | 523,558 | |
| | 7,800 | | Panasonic Holdings Corp. (Consumer Durables & Apparel) | | | 76,811 | |
| | 15,400 | | Renesas Electronics Corp. (Semiconductors & Semiconductor Equipment)* | | | 275,367 | |
| | 9,300 | | Sac’s Bar Holdings, Inc. (Consumer Discretionary Distribution & Retail) | | | 53,015 | |
| | 4,800 | | Sakata INX Corp. (Materials) | | | 46,077 | |
| | 10,300 | | SCREEN Holdings Co. Ltd. (Semiconductors & Semiconductor Equipment) | | | 868,195 | |
| | 20,200 | | SCSK Corp. (Software & Services) | | | 399,928 | |
| | 13,600 | | Sekisui House Ltd. (Consumer Durables & Apparel) | | | 301,461 | |
| | 2,500 | | Seven & i Holdings Co. Ltd. (Consumer Staples Distribution & Retail) | | | 98,874 | |
| | 24,900 | | Sintokogio Ltd. (Capital Goods) | | | 187,776 | |
| | 13,000 | | SoftBank Group Corp. (Telecommunication Services) | | | 573,800 | |
| | 2,600 | | Sompo Holdings, Inc. (Insurance) | | | 127,214 | |
| | 10,800 | | SPK Corp. (Consumer Discretionary Distribution & Retail) | | | 141,282 | |
| | 8,200 | | SRA Holdings (Software & Services) | | | 207,019 | |
| | 20,700 | | Subaru Corp. (Automobiles & Components) | | | 377,556 | |
| | |
| The accompanying notes are an integral part of these financial statements. | | 49 |
GOLDMAN SACHS VARIABLE INSURANCE TRUST INTERNATIONAL EQUITY INSIGHTS FUND
|
Schedule of Investments (continued) December 31, 2023 |
| | | | | | | | |
| | | Shares | | Description | | Value | |
| |
| | Common Stocks – (continued) | |
| |
| | Japan – (continued) | |
| | 36,300 | | Sumitomo Electric Industries Ltd. (Automobiles & Components) | | $ | 460,596 | |
| | 6,000 | | Sumitomo Mitsui Financial Group, Inc. (Banks) | | | 291,959 | |
| | 19,200 | | Sumitomo Realty & Development Co. Ltd. (Real Estate Management & Development) | | | 568,973 | |
| | 7,400 | | Suntory Beverage & Food Ltd. (Food, Beverage & Tobacco) | | | 243,311 | |
| | 1,400 | | Suzuken Co. Ltd. (Health Care Equipment & Services) | | | 46,299 | |
| | 13,400 | | Taiho Kogyo Co. Ltd. (Automobiles & Components) | | | 75,311 | |
| | 5,200 | | Takara & Co. Ltd. (Commercial & Professional Services) | | | 100,204 | |
| | 24,000 | | Takashimaya Co. Ltd. (Consumer Discretionary Distribution & Retail) | | | 326,581 | |
| | 91,800 | | Tokai Tokyo Financial Holdings, Inc. (Financial Services) | | | 341,700 | |
| | 14,700 | | Tokio Marine Holdings, Inc. (Insurance) | | | 366,045 | |
| | 5,200 | | Tokyo Century Corp. (Financial Services) | | | 56,146 | |
| | 2,900 | | Tokyo Electron Ltd. (Semiconductors & Semiconductor Equipment) | | | 515,446 | |
| | 4,300 | | Tokyo Tekko Co. Ltd. (Materials) | | | 125,368 | |
| | 76,700 | | Tokyu Fudosan Holdings Corp. (Real Estate Management & Development) | | | 488,764 | |
| | 9,600 | | TOPPAN Holdings, Inc. (Commercial & Professional Services) | | | 267,356 | |
| | 1,200 | | Torii Pharmaceutical Co. Ltd. (Pharmaceuticals, Biotechnology & Life Sciences) | | | 30,217 | |
| | 6,700 | | Toyo Tire Corp. (Automobiles & Components) | | | 111,769 | |
| | 8,700 | | Toyota Motor Corp. (Automobiles & Components) | | | 159,416 | |
| | 7,200 | | Trend Micro, Inc. (Software & Services) | | | 384,264 | |
| | 7,700 | | ZERIA Pharmaceutical Co. Ltd. (Pharmaceuticals, Biotechnology & Life Sciences) | | | 109,954 | |
| | | | | | | | |
| | | | | | | 24,054,652 | |
| | | |
| |
| | Luxembourg – 0.2% | |
| | 3,202 | | Eurofins Scientific SE (Pharmaceuticals, Biotechnology & Life Sciences) | | | 208,874 | |
| | | |
| | | | | | | | |
| | | Shares | | Description | | Value | |
| |
| | Common Stocks – (continued) | |
| |
| | Macau – 0.0% | |
| | 4,400 | | Sands China Ltd. (Consumer Services)* | | $ | 12,879 | |
| | | |
| |
| | Netherlands – 5.9% | |
| | 115 | | Adyen NV (Financial Services)*(a) | | | 148,458 | |
| | 568 | | ASM International NV (Semiconductors & Semiconductor Equipment) | | | 295,630 | |
| | 3,678 | | ASML Holding NV (Semiconductors & Semiconductor Equipment) | | | 2,776,476 | |
| | 491 | | BE Semiconductor Industries NV (Semiconductors & Semiconductor Equipment) | | | 74,129 | |
| | 4,250 | | Eurocommercial Properties NV REIT (Equity Real Estate Investment Trusts (REITs)) | | | 104,220 | |
| | 15,826 | | ING Groep NV (Banks) | | | 237,304 | |
| | 33,253 | | Koninklijke Ahold Delhaize NV (Consumer Staples Distribution & Retail) | | | 956,737 | |
| | 2,178 | | NSI NV REIT (Equity Real Estate Investment Trusts (REITs)) | | | 45,107 | |
| | 46,296 | | Shell PLC (Energy) | | | 1,523,291 | |
| | | | | | | | |
| | | | | | | 6,161,352 | |
| | | |
| |
| | New Zealand – 0.6% | |
| | 96,870 | | Spark New Zealand Ltd. (Telecommunication Services) | | | 317,204 | |
| | 3,925 | | Xero Ltd. (Software & Services)* | | | 299,433 | |
| | | | | | | | |
| | | | | | | 616,637 | |
| | | |
| |
| | Norway – 0.7% | |
| | 7,957 | | Kongsberg Gruppen ASA (Capital Goods) | | | 364,279 | |
| | 114,841 | | PGS ASA (Energy)* | | | 96,528 | |
| | 9,451 | | Protector Forsikring ASA (Insurance) | | | 167,441 | |
| | 3,980 | | SpareBank 1 SR-Bank ASA (Banks) | | | 50,474 | |
| | 4,300 | | TGS ASA (Energy) | | | 55,840 | |
| | 5,178 | | Wallenius Wilhelmsen ASA (Transportation) | | | 45,359 | |
| | | | | | | | |
| | | | | | | 779,921 | |
| | | |
| |
| | Portugal – 0.5% | |
| | 19,536 | | Jeronimo Martins SGPS SA (Consumer Staples Distribution & Retail) | | | 497,202 | |
| | | |
| |
| | Singapore – 0.6% | |
| | 34,200 | | Keppel Corp. Ltd. (Capital Goods) | | | 182,998 | |
| | 3,400 | | Oversea-Chinese Banking Corp. Ltd. (Banks) | | | 33,454 | |
| | |
| 50 | | The accompanying notes are an integral part of these financial statements. |
GOLDMAN SACHS VARIABLE INSURANCE TRUST INTERNATIONAL EQUITY INSIGHTS FUND
| | | | | | | | |
| | | Shares | | Description | | Value | |
| |
| | Common Stocks – (continued) | |
| |
| | Singapore – (continued) | |
| | 19,700 | | United Overseas Bank Ltd. (Banks) | | $ | 425,189 | |
| | | | | | | | |
| | | | | | | 641,641 | |
| | | |
| |
| | South Africa – 0.2% | |
| | 6,130 | | Anglo American PLC (Materials) | | | 153,414 | |
| | | |
| |
| | Spain – 2.7% | |
| | 10,624 | | Amadeus IT Group SA (Consumer Services) | | | 763,032 | |
| | 97,147 | | Banco Santander SA (Banks) | | | 406,335 | |
| | 54,638 | | Bankinter SA (Banks) | | | 350,429 | |
| | 45,116 | | CaixaBank SA (Banks) | | | 185,803 | |
| | 26,492 | | Industria de Diseno Textil SA (Consumer Discretionary Distribution & Retail) | | | 1,155,954 | |
| | | | | | | | |
| | | | | | | 2,861,553 | |
| | | |
| |
| | Sweden – 3.3% | |
| | 1,103 | | Epiroc AB, Class B (Capital Goods) | | | 19,344 | |
| | 3,096 | | Evolution AB (Consumer Services)(a) | | | 368,766 | |
| | 6,611 | | H & M Hennes & Mauritz AB, Class B (Consumer Discretionary Distribution & Retail) | | | 115,957 | |
| | 34,087 | | Investor AB, Class B (Financial Services) | | | 790,468 | |
| | 10,038 | | Nyfosa AB (Real Estate Management & Development) | | | 95,485 | |
| | 17,141 | | Skandinaviska Enskilda Banken AB, Class A (Banks) | | | 236,558 | |
| | 5,941 | | SKF AB, Class B (Capital Goods) | | | 119,061 | |
| | 43,024 | | SSAB AB, Class A (Materials) | | | 327,697 | |
| | 41,658 | | SSAB AB, Class B (Materials) | | | 318,955 | |
| | 634 | | Swedbank AB, Class A (Banks) | | | 12,818 | |
| | 5,576 | | Trelleborg AB, Class B (Capital Goods) | | | 187,153 | |
| | 29,778 | | Volvo AB, Class B (Capital Goods) | | | 774,824 | |
| | 9,347 | | Wihlborgs Fastigheter AB (Real Estate Management & Development) | | | 87,455 | |
| | | | | | | | |
| | | | | | | 3,454,541 | |
| | | |
| |
| | Switzerland – 6.6% | |
| | 31,255 | | ABB Ltd. (Capital Goods) | | | 1,387,665 | |
| | 6,277 | | Julius Baer Group Ltd. (Financial Services) | | | 352,128 | |
| | 3,198 | | Logitech International SA (Technology Hardware & Equipment) | | | 304,093 | |
| | 1,440 | | Lonza Group AG (Pharmaceuticals, Biotechnology & Life Sciences) | | | 607,084 | |
| | 18,632 | | Novartis AG (Pharmaceuticals, Biotechnology & Life Sciences) | | | 1,882,027 | |
| | | | | | | | |
| | | Shares | | Description | | Value | |
| |
| | Common Stocks – (continued) | |
| |
| | Switzerland – (continued) | |
| | 605 | | Sika AG (Materials) | | $ | 197,276 | |
| | 491 | | Sonova Holding AG (Health Care Equipment & Services) | | | 160,581 | |
| | 44,792 | | UBS Group AG (Financial Services) | | | 1,391,310 | |
| | 1,149 | | Zurich Insurance Group AG (Insurance) | | | 600,728 | |
| | | | | | | | |
| | | | | | | 6,882,892 | |
| | | |
| |
| | United Kingdom – 8.2% | |
| | 1,471 | | 3i Group PLC (Financial Services) | | | 45,277 | |
| | 13,060 | | AstraZeneca PLC ADR (Pharmaceuticals, Biotechnology & Life Sciences) | | | 879,591 | |
| | 90,989 | | Aviva PLC (Insurance) | | | 503,482 | |
| | 25,454 | | BAE Systems PLC (Capital Goods) | | | 360,301 | |
| | 38,115 | | Balfour Beatty PLC (Capital Goods) | | | 160,908 | |
| | 18,310 | | Beazley PLC (Insurance) | | | 121,681 | |
| | 3,067 | | Bellway PLC (Consumer Durables & Apparel) | | | 100,179 | |
| | 19,176 | | BP PLC ADR (Energy) | | | 678,830 | |
| | 38,787 | | British American Tobacco PLC (Food, Beverage & Tobacco) | | | 1,134,877 | |
| | 31,125 | | Centrica PLC (Utilities) | | | 55,798 | |
| | 29,500 | | CK Hutchison Holdings Ltd. (Capital Goods) | | | 158,492 | |
| | 13,016 | | Compass Group PLC (Consumer Services) | | | 356,161 | |
| | 23,790 | | Direct Line Insurance Group PLC (Insurance)* | | | 55,093 | |
| | 6,322 | | Dunelm Group PLC (Consumer Discretionary Distribution & Retail) | | | 88,218 | |
| | 100,483 | | HSBC Holdings PLC (Banks) | | | 812,905 | |
| | 24,572 | | Informa PLC (Media & Entertainment) | | | 244,403 | |
| | 5,648 | | Investec PLC (Financial Services) | | | 38,197 | |
| | 3,801 | | Lancashire Holdings Ltd. (Insurance) | | | 30,232 | |
| | 69,594 | | M&G PLC (Financial Services) | | | 196,959 | |
| | 13,797 | | Marks & Spencer Group PLC (Consumer Staples Distribution & Retail) | | | 47,815 | |
| | 82,454 | | National Grid PLC (Utilities) | | | 1,110,765 | |
| | 114,950 | | NatWest Group PLC (Banks) | | | 320,183 | |
| | 28,126 | | Redrow PLC (Consumer Durables & Apparel) | | | 220,662 | |
| | 157,464 | | Rolls-Royce Holdings PLC (Capital Goods)* | | | 600,626 | |
| | 6,689 | | Sage Group PLC (The) (Software & Services) | | | 99,859 | |
| | 3,634 | | Smiths Group PLC (Capital Goods) | | | 81,567 | |
| | 1,464 | | SSE PLC (Utilities) | | | 34,559 | |
| | |
| The accompanying notes are an integral part of these financial statements. | | 51 |
GOLDMAN SACHS VARIABLE INSURANCE TRUST INTERNATIONAL EQUITY INSIGHTS FUND
|
Schedule of Investments (continued) December 31, 2023 |
| | | | | | | | | | |
| | | Shares | | Description | | Value | |
| |
| | Common Stocks – (continued) | |
| |
| | United Kingdom – (continued) | |
| | 7,045 | | Vesuvius PLC (Capital Goods) | | $ | 43,201 | |
| | | | | | | | | | |
| | | | | | | | | 8,580,821 | |
| | | |
| |
| | United States – 8.9% | |
| | 6,217 | | CRH PLC (Materials) | | | 429,968 | |
| | 3,683 | | Ferguson PLC (Capital Goods) | | | 705,397 | |
| | 13,316 | | GSK PLC ADR (Pharmaceuticals, Biotechnology & Life Sciences) | | | 493,491 | |
| | 6,492 | | Holcim AG (Materials)* | | | 509,891 | |
| | 19,122 | | Nestle SA (Food, Beverage & Tobacco) | | | 2,216,620 | |
| | 7,014 | | Roche Holding AG (Pharmaceuticals, Biotechnology & Life Sciences) | | | 2,038,925 | |
| | 9,652 | | Sanofi SA (Pharmaceuticals, Biotechnology & Life Sciences) | | | 959,146 | |
| | 6,274 | | Schneider Electric SE (Capital Goods) | | | 1,262,995 | |
| | 22,452 | | Stellantis NV (Automobiles & Components) | | | 526,065 | |
| | 11,452 | | Tenaris SA (Energy) | | | 199,186 | |
| | | | | | | | | | |
| | | | | | | | | 9,341,684 | |
| | | |
| | TOTAL COMMON STOCKS (Cost $89,550,133) | | | 101,809,161 | |
| | | |
| | | | |
| | | Shares | | Description | | Rate | | Value | |
| |
| | Preferred Stocks – 0.7% | |
| |
| | Germany – 0.7% | |
| | 2,396 | | Bayerische Motoren Werke AG (Automobiles & Components) | | 9.48% | | | 238,409 | |
| | 921 | | FUCHS SE (Materials) | | 2.65 | | | 40,975 | |
| | 5,193 | | Henkel AG & Co. KGaA (Household & Personal Products) | | 2.54 | | | 417,735 | |
| | | |
| | TOTAL PREFERRED STOCKS (Cost $669,893) | | | 697,119 | |
| | | |
| | | | | | | | |
| | | Shares | | Dividend Rate | | Value | |
| |
| | Investment Company – 0.0%(c) | |
| | Goldman Sachs Financial Square Government Fund - Institutional Shares | | | | |
| | 824 | | 5.248% | | | 824 | |
| | (Cost $824) | | | | |
| | | |
| | TOTAL INVESTMENTS BEFORE SECURITIES | |
| | LENDING REINVESTMENT VEHICLE | |
| | (Cost $90,220,850) | | | 102,507,104 | |
| | | |
| | | | | | | | |
| | | Shares | | Dividend Rate | | Value | |
| |
| | Securities Lending Reinvestment Vehicle – 0.0%(c) | |
| | Goldman Sachs Financial Square Government Fund – Institutional Shares | | | | |
| | 46,704 | | 5.248% | | $ | 46,704 | |
| | (Cost $46,704) | | | | |
| | | |
| | TOTAL INVESTMENTS – 97.8% | |
| | (Cost $90,267,554) | | $ | 102,553,808 | |
| | | |
| | OTHER ASSETS IN EXCESS OF
LIABILITIES – 2.2% | | | 2,349,291 | |
| | | |
| | NET ASSETS – 100.0% | | $ | 104,903,099 | |
| | | |
The percentage shown for each investment category reflects the value of investments in that category as a percentage of net assets.
| | * | Non-income producing security. |
| | (a) | Exempt from registration under Rule 144A of the Securities Act of 1933. |
| | (b) | All or a portion of security is on loan. |
| | (c) | Represents an affiliated issuer. |
| | |
| |
| Investment Abbreviations: |
| ADR | | —American Depositary Receipt |
| PLC | | —Public Limited Company |
| REIT | | —Real Estate Investment Trust |
| | | | |
| Sector Name | | % of Market Value | |
Financials | | | 21.6 | % |
Industrials | | | 15.7 | |
Consumer Discretionary | | | 11.5 | |
Health Care | | | 11.2 | |
Information Technology | | | 10.8 | |
Materials | | | 8.2 | |
Consumer Staples | | | 7.5 | |
Real Estate | | | 3.9 | |
Utilities | | | 3.6 | |
Communication Services | | | 3.3 | |
Energy | | | 2.7 | |
Investment Company | | | 0.0 | |
Securities Lending Reinvestment Vehicle | | | 0.0 | |
| |
| TOTAL INVESTMENTS | | | 100.0 | % |
| | |
| 52 | | The accompanying notes are an integral part of these financial statements. |
GOLDMAN SACHS VARIABLE INSURANCE TRUST INTERNATIONAL EQUITY INSIGHTS FUND
| | | | | | | | |
|
ADDITIONAL INVESTMENT INFORMATION |
FUTURES CONTRACTS — At December 31, 2023, the Fund had the following futures contracts:
| | | | | | | | | | | | |
| | | | |
| Description | | Number of
Contracts | | Expiration
Date | | Notional Amount | | | Unrealized
Appreciation/
(Depreciation) | |
| | | | |
Long position contracts: | | | | | | | | | | | | |
| | | | |
EURO STOXX 50 Index | | 11 | | 03/15/24 | | $ | 551,677 | | | $ | (4,488) | |
| | | | |
FTSE 100 Index | | 4 | | 03/15/24 | | | 395,473 | | | | 8,674 | |
| | | | |
Hang Seng Index | | 1 | | 01/30/24 | | | 109,701 | | | | 3,473 | |
| | | | |
MSCI Singapore Index | | 1 | | 01/30/24 | | | 21,800 | | | | 1,048 | |
| | | | |
SPI 200 Index | | 1 | | 03/21/24 | | | 129,220 | | | | 842 | |
| | | | |
TOPIX Index | | 2 | | 03/07/24 | | | 335,603 | | | | 2,781 | |
|
| |
| | | | |
Total Futures Contracts | | | | | | | | | | $ | 12,330 | |
|
| |
| | |
| The accompanying notes are an integral part of these financial statements. | | 53 |
GOLDMAN SACHS VARIABLE INSURANCE TRUST LARGE CAP VALUE FUND
|
Schedule of Investments December 31, 2023 |
| | | | | | | | |
| | | Shares | | Description | | Value | |
| | |
| | Common Stocks – 99.7% | | | | |
| | |
| | Automobile Components – 1.1% | | | | |
| | 33,129 | | Aptiv PLC* | | $ | 2,972,334 | |
| | | |
| | |
| | Automobiles – 0.8% | | | | |
| | 60,455 | | General Motors Co. | | | 2,171,544 | |
| | | |
| | |
| | Banks – 7.5% | | | | |
| | 163,211 | | Bank of America Corp. | | | 5,495,314 | |
| | 23,271 | | East West Bancorp, Inc. | | | 1,674,349 | |
| | 55,596 | | JPMorgan Chase & Co. | | | 9,456,880 | |
| | 31,841 | | M&T Bank Corp. | | | 4,364,764 | |
| | | | | | | | |
| | | | | | | 20,991,307 | |
| | | |
| | |
| | Beverages – 1.4% | | | | |
| | 66,981 | | Coca-Cola Co. (The) | | | 3,947,190 | |
| | | |
| | |
| | Biotechnology – 2.1% | | | | |
| | 13,560 | | Amgen, Inc. | | | 3,905,551 | |
| | 3,980 | | Biogen, Inc.* | | | 1,029,905 | |
| | 3,003 | | Karuna Therapeutics, Inc.* | | | 950,479 | |
| | | | | | | | |
| | | | | | | 5,885,935 | |
| | | |
| | |
| | Capital Markets – 4.7% | | | | |
| | 7,084 | | BlackRock, Inc. | | | 5,750,791 | |
| | 47,364 | | KKR & Co., Inc. | | | 3,924,107 | |
| | 58,584 | | Nasdaq, Inc. | | | 3,406,074 | |
| | | | | | | | |
| | | | | | | 13,080,972 | |
| | | |
| | |
| | Chemicals – 3.2% | | | | |
| | 11,985 | | Linde PLC | | | 4,922,359 | |
| | 13,384 | | Sherwin-Williams Co. (The) | | | 4,174,470 | |
| | | | | | | | |
| | | | | | | 9,096,829 | |
| | | |
| | |
| | Commercial Services & Supplies – 1.1% | | | | |
| | 20,147 | | Waste Connections, Inc. | | | 3,007,343 | |
| | | |
| | |
| | Communications Equipment – 0.6% | | | | |
| | 7,814 | | Arista Networks, Inc.* | | | 1,840,275 | |
| | | |
| | |
| | Construction Materials – 1.5% | | | | |
| | 8,716 | | Martin Marietta Materials, Inc. | | | 4,348,500 | |
| | | |
| | |
| | Consumer Finance – 1.6% | | | | |
| | 24,467 | | American Express Co. | | | 4,583,648 | |
| | | |
| | |
| | Consumer Staples Distribution & Retail – 2.3% | | | | |
| | 41,001 | | Walmart, Inc. | | | 6,463,808 | |
| | | |
| | |
| | Containers & Packaging – 1.2% | | | | |
| | 57,677 | | Ball Corp. | | | 3,317,581 | |
| | | |
| | |
| | Diversified Telecommunication Services – 1.6% | | | | |
| | 119,698 | | Verizon Communications, Inc. | | | 4,512,615 | |
| | | |
| | |
| | Electric Utilities – 3.1% | | | | |
| | 71,404 | | Exelon Corp. | | | 2,563,404 | |
| | 58,056 | | NextEra Energy, Inc. | | | 3,526,321 | |
| | 44,319 | | Xcel Energy, Inc. | | | 2,743,789 | |
| | | | | | | | |
| | | | | | | 8,833,514 | |
| | | |
| | |
| | Electrical Equipment – 2.0% | | | | |
| | 23,449 | | Eaton Corp. PLC | | | 5,646,988 | |
| | | |
| | |
| | Financial Services – 3.5% | | | | |
| | 14,050 | | Berkshire Hathaway, Inc., Class B* | | | 5,011,073 | |
| | | | | | | | |
| | | Shares | | Description | | Value | |
| | |
| | Common Stocks – (continued) | | | | |
| | |
| | Financial Services – (continued) | | | | |
| | 45,947 | | Fidelity National Information Services, Inc. | | $ | 2,760,036 | |
| | 8,148 | | Visa, Inc., Class A | | | 2,121,332 | |
| | | | | | | | |
| | | | | | | 9,892,441 | |
| | | |
| | |
| | Food Products – 1.3% | | | | |
| | 52,311 | | Mondelez International, Inc., Class A | | | 3,788,886 | |
| | | |
| | |
| | Ground Transportation – 2.4% | | | | |
| | 17,690 | | Norfolk Southern Corp. | | | 4,181,562 | |
| | 6,070 | | Old Dominion Freight Line, Inc. | | | 2,460,353 | |
| | | | | | | | |
| | | | | | | 6,641,915 | |
| | | |
| | |
| | Health Care Equipment & Supplies – 4.4% | | | | |
| | 74,630 | | Boston Scientific Corp.* | | | 4,314,360 | |
| | 8,594 | | Cooper Cos., Inc. (The) | | | 3,252,314 | |
| | 40,320 | | Zimmer Biomet Holdings, Inc. | | | 4,906,944 | |
| | | | | | | | |
| | | | | | | 12,473,618 | |
| | | |
| | |
| | Health Care Providers & Services – 2.3% | | | | |
| | 81,889 | | CVS Health Corp. | | | 6,465,955 | |
| | | |
| | |
| | Household Products – 1.4% | | | | |
| | 51,214 | | Colgate-Palmolive Co. | | | 4,082,268 | |
| | | |
| | |
| | Industrial Conglomerates – 3.4% | | | | |
| | 42,526 | | General Electric Co. | | | 5,427,594 | |
| | 19,044 | | Honeywell International, Inc. | | | 3,993,717 | |
| | | | | | | | |
| | | | | | | 9,421,311 | |
| | | |
| | |
| | Industrial REITs – 1.6% | | | | |
| | 34,061 | | Prologis, Inc. REIT | | | 4,540,331 | |
| | | |
| | |
| | Insurance – 3.0% | | | | |
| | 30,841 | | Allstate Corp. (The) | | | 4,317,123 | |
| | 33,497 | | Globe Life, Inc. | | | 4,077,255 | |
| | | | | | | | |
| | | | | | | 8,394,378 | |
| | | |
| | |
| | Interactive Media & Services – 1.9% | | | | |
| | 37,344 | | Alphabet, Inc., Class A* | | | 5,216,583 | |
| | | |
| | |
| | Life Sciences Tools & Services – 2.2% | | | | |
| | 26,948 | | Danaher Corp. | | | 6,234,150 | |
| | | |
| | |
| | Machinery – 4.2% | | | | |
| | 15,875 | | Caterpillar, Inc. | | | 4,693,761 | |
| | 10,258 | | Illinois Tool Works, Inc. | | | 2,686,980 | |
| | 44,557 | | Stanley Black & Decker, Inc. | | | 4,371,042 | |
| | | | | | | | |
| | | | | | | 11,751,783 | |
| | | |
| | |
| | Media – 1.0% | | | | |
| | 31,397 | | Omnicom Group, Inc. | | | 2,716,154 | |
| | | |
| | |
| | Metals & Mining – 1.6% | | | | |
| | 103,065 | | Freeport-McMoRan, Inc. | | | 4,387,477 | |
| | | |
| | |
| | Multi-Utilities – 1.8% | | | | |
| | 41,112 | | Ameren Corp. | | | 2,974,042 | |
| | 35,366 | | CMS Energy Corp. | | | 2,053,704 | |
| | | | | | | | |
| | | | | | | 5,027,746 | |
| | | |
| | |
| | Oil, Gas & Consumable Fuels – 6.5% | | | | |
| | 36,298 | | Chesapeake Energy Corp. | | | 2,792,768 | |
| | 41,957 | | EOG Resources, Inc. | | | 5,074,699 | |
| | |
| 54 | | The accompanying notes are an integral part of these financial statements. |
GOLDMAN SACHS VARIABLE INSURANCE TRUST LARGE CAP VALUE FUND
| | | | | | | | |
| | | Shares | | Description | | Value | |
| | |
| | Common Stocks – (continued) | | | | |
| | |
| | Oil, Gas & Consumable Fuels – (continued) | | | | |
| | 102,635 | | Exxon Mobil Corp. | | $ | 10,261,448 | |
| | | | | | | | |
| | | | | | | 18,128,915 | |
| | | |
| | |
| | Personal Care Products – 1.3% | | | | |
| | 168,299 | | Kenvue, Inc. | | | 3,623,477 | |
| | | |
| | |
| | Pharmaceuticals – 4.6% | | | | |
| | 51,863 | | AstraZeneca PLC ADR (United Kingdom) | | | 3,492,973 | |
| | 101,194 | | Bristol-Myers Squibb Co. | | | 5,192,264 | |
| | 27,478 | | Johnson & Johnson | | | 4,306,902 | |
| | | | | | | | |
| | | | | | | 12,992,139 | |
| | | |
| | |
| | Residential REITs – 1.4% | | | | |
| | 20,428 | | AvalonBay Communities, Inc. REIT | | | 3,824,530 | |
| | | |
| |
| | Semiconductors & Semiconductor Equipment – 5.1% | |
| | 23,522 | | Advanced Micro Devices, Inc.* | | | 3,467,378 | |
| | 12,602 | | Applied Materials, Inc. | | | 2,042,406 | |
| | 2,877 | | KLA Corp. | | | 1,672,400 | |
| | 67,794 | | Marvell Technology, Inc. | | | 4,088,656 | |
| | 34,422 | | Micron Technology, Inc. | | | 2,937,574 | |
| | | | | | | | |
| | | | | | | 14,208,414 | |
| | | |
| | |
| | Software – 2.7% | | | | |
| | 35,656 | | Oracle Corp. | | | 3,759,212 | |
| | 14,177 | | Salesforce, Inc.* | | | 3,730,536 | |
| | | | | | | | |
| | | | | | | 7,489,748 | |
| | | |
| | |
| | Specialized REITs – 1.5% | | | | |
| | 10,631 | | American Tower Corp. REIT | | | 2,295,020 | |
| | 12,935 | | Extra Space Storage, Inc. REIT | | | 2,073,869 | |
| | | | | | | | |
| | | | | | | 4,368,889 | |
| | | |
| | |
| | Specialty Retail – 1.9% | | | | |
| | 70,989 | | Foot Locker, Inc. | | | 2,211,308 | |
| | | | | | | | |
| | | Shares | | Description | | Value | |
| | |
| | Common Stocks – (continued) | | | | |
| | |
| | Specialty Retail – (continued) | | | | |
| | 22,888 | | Ross Stores, Inc. | | $ | 3,167,470 | |
| | | | | | | | |
| | | | | | | 5,378,778 | |
| | | |
| |
| | Technology Hardware, Storage & Peripherals – 1.6% | |
| | 57,980 | | Dell Technologies, Inc., Class C | | | 4,435,470 | |
| | | |
| | |
| | Textiles, Apparel & Luxury Goods – 1.3% | | | | |
| | 33,626 | | NIKE, Inc., Class B | | | 3,650,775 | |
| | | |
| | TOTAL COMMON STOCKS
(Cost $219,542,688) | | | 279,836,514 | |
| | | |
| | | |
| | | Shares | | Dividend Rate | | Value | |
| | |
| | Investment Company – 0.2%(a) | | | | |
| | Goldman Sachs Financial Square Government
Fund - Institutional Shares | | | | |
| | 570,736 | | 5.248% | | | 570,736 | |
| | |
| | (Cost $570,736) | | | | |
| | | |
| | |
| | TOTAL INVESTMENTS – 99.9%
(Cost $220,113,424) | | $ | 280,407,250 | |
| | | |
| | |
| | OTHER ASSETS IN EXCESS OF
LIABILITIES – 0.1% | | | 290,323 | |
| | | |
| | |
| | NET ASSETS – 100.0% | | $ | 280,697,573 | |
| | | |
| | |
| The percentage shown for each investment category reflects the value of investments in that category as a percentage of net assets. |
| |
| * | | Non-income producing security. |
| |
| (a) | | Represents an affiliated issuer. |
| | |
|
|
| Investment Abbreviations: |
| ADR | | —American Depositary Receipt |
| PLC | | —Public Limited Company |
| REIT | | —Real Estate Investment Trust |
|
|
| | |
| The accompanying notes are an integral part of these financial statements. | | 55 |
GOLDMAN SACHS VARIABLE INSURANCE TRUST MID CAP GROWTH FUND
|
Schedule of Investments December 31, 2023 |
| | | | | | | | |
| | | Shares | | Description | | Value | |
| | |
| | Common Stocks – 99.4% | | | | |
| | |
| | Aerospace & Defense – 1.7% | | | | |
| | 2,979 | | L3Harris Technologies, Inc. | | $ | 627,437 | |
| | 3,109 | | Woodward, Inc. | | | 423,228 | |
| | | | | | | | |
| | | | | | | 1,050,665 | |
| | | |
| | |
| | Automobile Components – 0.6% | | | | |
| | 8,407 | | Mobileye Global, Inc., Class A (Israel)* | | | 364,191 | |
| | | |
| | |
| | Biotechnology – 5.5% | | | | |
| | 2,807 | | Alnylam Pharmaceuticals, Inc.* | | | 537,288 | |
| | 2,472 | | Biogen, Inc.* | | | 639,680 | |
| | 6,186 | | BioMarin Pharmaceutical, Inc.* | | | 596,454 | |
| | 7,082 | | Exact Sciences Corp.* | | | 523,926 | |
| | 1,441 | | Karuna Therapeutics, Inc.* | | | 456,091 | |
| | 4,846 | | Neurocrine Biosciences, Inc.* | | | 638,509 | |
| | | | | | | | |
| | | | | | | 3,391,948 | |
| | | |
| | |
| | Broadline Retail – 1.2% | | | | |
| | 8,909 | | Etsy, Inc.* | | | 722,075 | |
| | | |
| | |
| | Building Products – 1.8% | | | | |
| | 4,712 | | Trane Technologies PLC | | | 1,149,257 | |
| | | |
| | |
| | Capital Markets – 4.1% | | | | |
| | 9,146 | | KKR & Co., Inc. | | | 757,746 | |
| | 2,455 | | MSCI, Inc. | | | 1,388,671 | |
| | 4,710 | | Tradeweb Markets, Inc., Class A | | | 428,045 | |
| | | | | | | | |
| | | | | | | 2,574,462 | |
| | | |
| | |
| | Chemicals – 1.8% | | | | |
| | 9,516 | | Ashland, Inc. | | | 802,294 | |
| | 2,097 | | PPG Industries, Inc. | | | 313,606 | |
| | | | | | | | |
| | | | | | | 1,115,900 | |
| | | |
| | |
| | Communications Equipment – 1.2% | | | | |
| | 3,120 | | Arista Networks, Inc.* | | | 734,791 | |
| | | |
| | |
| | Construction Materials – 1.6% | | | | |
| | 1,984 | | Martin Marietta Materials, Inc. | | | 989,837 | |
| | | |
| | |
| | Consumer Finance – 1.1% | | | | |
| | 6,339 | | Discover Financial Services | | | 712,504 | |
| | | |
| | |
| | Containers & Packaging – 1.6% | | | | |
| | 17,301 | | Ball Corp. | | | 995,154 | |
| | | |
| | |
| | Electrical Equipment – 4.4% | | | | |
| | 5,391 | | AMETEK, Inc. | | | 888,922 | |
| | 6,030 | | Rockwell Automation, Inc. | | | 1,872,194 | |
| | | | | | | | |
| | | | | | | 2,761,116 | |
| | | |
| |
| | Electronic Equipment, Instruments & Components – 2.0% | |
| | 12,355 | | Amphenol Corp., Class A | | | 1,224,751 | |
| | | |
| | |
| | Entertainment – 1.0% | | | | |
| | 6,369 | | Live Nation Entertainment, Inc.* | | | 596,138 | |
| | | |
| | |
| | Financial Services – 1.1% | | | | |
| | 5,144 | | Fidelity National Information Services, Inc. | | | 309,000 | |
| | 2,398 | | Jack Henry & Associates, Inc. | | | 391,857 | |
| | | | | | | | |
| | | | | | | 700,857 | |
| | | |
| | |
| | Food Products – 1.3% | | | | |
| | 11,962 | | McCormick & Co., Inc. | | | 818,440 | |
| | | |
| | | | | | | | |
| | | Shares | | Description | | Value | |
| | |
| | Common Stocks – (continued) | | | | |
| | |
| | Ground Transportation – 2.8% | | | | |
| | 3,004 | | Old Dominion Freight Line, Inc. | | $ | 1,217,611 | |
| | 1,134 | | Saia, Inc.* | | | 496,942 | |
| | | | | | | | |
| | | | | | | 1,714,553 | |
| | | |
| | |
| | Health Care Equipment & Supplies – 8.4% | | | | |
| | 2,923 | | Align Technology, Inc.* | | | 800,902 | |
| | 1,635 | | Cooper Cos., Inc. (The) | | | 618,749 | |
| | 10,885 | | Dexcom, Inc.* | | | 1,350,720 | |
| | 6,705 | | Insulet Corp.* | | | 1,454,851 | |
| | 8,415 | | Zimmer Biomet Holdings, Inc. | | | 1,024,106 | |
| | | | | | | | |
| | | | | | | 5,249,328 | |
| | | |
| | |
| | Health Care Providers & Services – 2.2% | | | | |
| | 6,635 | | Cencora, Inc. | | | 1,362,696 | |
| | | |
| | |
| | Hotel & Resort REITs – 1.0% | | | | |
| | 5,840 | | Ryman Hospitality Properties, Inc. REIT | | | 642,750 | |
| | | |
| | |
| | Hotels, Restaurants & Leisure – 5.4% | | | | |
| | 2,538 | | Domino’s Pizza, Inc. | | | 1,046,240 | |
| | 7,650 | | Expedia Group, Inc.* | | | 1,161,193 | |
| | 8,850 | | Yum! Brands, Inc. | | | 1,156,341 | |
| | | | | | | | |
| | | | | | | 3,363,774 | |
| | | |
| | |
| | IT Services – 1.0% | | | | |
| | 3,630 | | Cloudflare, Inc., Class A* | | | 302,234 | |
| | 803 | | MongoDB, Inc.* | | | 328,307 | |
| | | | | | | | |
| | | | | | | 630,541 | |
| | | |
| | |
| | Life Sciences Tools & Services – 4.6% | | | | |
| | 7,149 | | Agilent Technologies, Inc. | | | 993,925 | |
| | 910 | | Mettler-Toledo International, Inc.* | | | 1,103,794 | |
| | 2,088 | | West Pharmaceutical Services, Inc. | | | 735,227 | |
| | | | | | | | |
| | | | | | | 2,832,946 | |
| | | |
| | |
| | Machinery – 5.6% | | | | |
| | 3,555 | | Chart Industries, Inc.* | | | 484,653 | |
| | 2,810 | | Cummins, Inc. | | | 673,192 | |
| | 9,594 | | Fortive Corp. | | | 706,406 | |
| | 5,527 | | ITT, Inc. | | | 659,482 | |
| | 8,611 | | Xylem, Inc. | | | 984,754 | |
| | | | | | | | |
| | | | | | | 3,508,487 | |
| | | |
| | |
| | Media – 2.0% | | | | |
| | 16,973 | | Trade Desk, Inc. (The), Class A* | | | 1,221,377 | |
| | | |
| | |
| | Oil, Gas & Consumable Fuels – 3.1% | | | | |
| | 5,205 | | Cheniere Energy, Inc. | | | 888,546 | |
| | 2,934 | | Chesapeake Energy Corp. | | | 225,742 | |
| | 3,524 | | Hess Corp. | | | 508,020 | |
| | 3,789 | | Targa Resources Corp. | | | 329,150 | |
| | | | | | | | |
| | | | | | | 1,951,458 | |
| | | |
| | |
| | Professional Services – 2.6% | | | | |
| | 4,227 | | Equifax, Inc. | | | 1,045,295 | |
| | 2,598 | | Paycom Software, Inc. | | | 537,059 | |
| | | | | | | | |
| | | | | | | 1,582,354 | |
| | | |
| | |
| | Real Estate Management & Development – 2.0% | | | | |
| | 14,565 | | CoStar Group, Inc.* | | | 1,272,835 | |
| | | |
| | |
| 56 | | The accompanying notes are an integral part of these financial statements. |
GOLDMAN SACHS VARIABLE INSURANCE TRUST MID CAP GROWTH FUND
| | | | | | | | |
| | | Shares | | Description | | Value | |
| | |
| | Common Stocks – (continued) | | | | |
| | |
| | Semiconductors & Semiconductor Equipment – 4.9% | | | | |
| | 5,630 | | ARM Holdings PLC ADR*(a) | | $ | 423,066 | |
| | 5,520 | | Enphase Energy, Inc.* | | | 729,413 | |
| | 3,148 | | Entegris, Inc. | | | 377,193 | |
| | 4,410 | | Lattice Semiconductor Corp.* | | | 304,246 | |
| | 16,202 | | Marvell Technology, Inc. | | | 977,143 | |
| | 2,597 | | MKS Instruments, Inc. | | | 267,153 | |
| | | | | | | | |
| | | | | | | 3,078,214 | |
| | | |
| | |
| | Software – 16.5% | | | | |
| | 2,984 | | ANSYS, Inc.* | | | 1,082,834 | |
| | 7,690 | | AppLovin Corp., Class A* | | | 306,446 | |
| | 6,537 | | Crowdstrike Holdings, Inc., Class A* | | | 1,669,027 | |
| | 10,425 | | Datadog, Inc., Class A* | | | 1,265,386 | |
| | 9,151 | | DocuSign, Inc.* | | | 544,027 | |
| | 17,595 | | Dynatrace, Inc.* | | | 962,271 | |
| | 974 | | Fair Isaac Corp.* | | | 1,133,746 | |
| | 1,544 | | HubSpot, Inc.* | | | 896,354 | |
| | 7,532 | | Klaviyo, Inc., Class A* | | | 209,239 | |
| | 2,859 | | Manhattan Associates, Inc.* | | | 615,600 | |
| | 1,625 | | Monday.com Ltd.* | | | 305,191 | |
| | 19,144 | | Palantir Technologies, Inc., Class A* | | | 328,702 | |
| | 4,419 | | Zscaler, Inc.* | | | 979,074 | |
| | | | | | | | |
| | | | | | | 10,297,897 | |
| | | |
| | |
| | Specialty Retail – 4.2% | | | | |
| | 12,097 | | Ross Stores, Inc. | | | 1,674,104 | |
| | 1,860 | | Ulta Beauty, Inc.* | | | 911,381 | |
| | | | | | | | |
| | | | | | | 2,585,485 | |
| | | |
| | |
| | Textiles, Apparel & Luxury Goods – 1.1% | | | | |
| | 1,360 | | Lululemon Athletica, Inc.* | | | 695,354 | |
| | | |
| | TOTAL COMMON STOCKS (Cost $47,949,120) | | | 61,892,135 | |
| | | |
| | | |
| | | Shares | | Dividend Rate | | Value | |
| | |
| | Investment Company – 0.5%(b) | | | | |
| | Goldman Sachs Financial Square Government Fund - Institutional Shares | | | | |
| | 342,086 | | 5.248% | | | 342,086 | |
| | |
| | (Cost $342,086) | | | | |
| | | |
| | |
| | TOTAL INVESTMENTS BEFORE SECURITIES LENDING REINVESTMENT VEHICLE (Cost $48,291,206) | | | 62,234,221 | |
| | | |
| | | | | | | | |
| | | Shares | | Dividend Rate | | Value | |
| |
| | Securities Lending Reinvestment Vehicle – 0.7%(b) | |
| | Goldman Sachs Financial Square Government Fund – Institutional Shares | | | | |
| | 423,829 | | 5.248% | | $ | 423,829 | |
| | |
| | (Cost $423,829) | | | | |
| | | |
| | |
| | TOTAL INVESTMENTS – 100.6% (Cost $48,715,035) | | $ | 62,658,050 | |
| | | |
| | |
| | LIABILITIES IN EXCESS OF
OTHER ASSETS – (0.6)% | | | (396,640 | ) |
| | | |
| | |
| | NET ASSETS – 100.0% | | $ | 62,261,410 | |
| | | |
| | |
| The percentage shown for each investment category reflects the value of investments in that category as a percentage of net assets. |
| |
| * | | Non-income producing security. |
| (a) | | All or a portion of security is on loan. |
| (b) | | Represents an affiliated issuer. |
| | |
|
|
| Investment Abbreviations: |
| ADR | | —American Depositary Receipt |
| PLC | | —Public Limited Company |
| REIT | | —Real Estate Investment Trust |
|
|
| | |
| The accompanying notes are an integral part of these financial statements. | | 57 |
GOLDMAN SACHS VARIABLE INSURANCE TRUST MID CAP VALUE FUND
|
Schedule of Investments December 31, 2023 |
| | | | | | | | |
| | | Shares | | Description | | Value | |
| | |
| | Common Stocks – 98.6% | | | | |
| | |
| | Aerospace & Defense – 2.1% | | | | |
| | 16,034 | | L3Harris Technologies, Inc. | | $ | 3,377,081 | |
| | 44,869 | | Woodward, Inc. | | | 6,108,017 | |
| | | | | | | | |
| | | | | | | 9,485,098 | |
| | | |
| | |
| | Automobiles – 0.7% | | | | |
| | 83,031 | | General Motors Co. | | | 2,982,474 | |
| | | |
| | |
| | Banks – 5.1% | | | | |
| | 94,815 | | Citizens Financial Group, Inc. | | | 3,142,169 | |
| | 91,131 | | East West Bancorp, Inc. | | | 6,556,876 | |
| | 51,104 | | M&T Bank Corp. | | | 7,005,336 | |
| | 70,018 | | Pinnacle Financial Partners, Inc. | | | 6,106,970 | |
| | | | | | | | |
| | | | | | | 22,811,351 | |
| | | |
| | |
| | Beverages – 0.9% | | | | |
| | 59,777 | | Coca-Cola Europacific Partners PLC (United Kingdom) | | | 3,989,517 | |
| | | |
| | |
| | Biotechnology – 1.4% | | | | |
| | 16,945 | | Biogen, Inc.* | | | 4,384,858 | |
| | 6,303 | | Karuna Therapeutics, Inc.* | | | 1,994,962 | |
| | | | | | | | |
| | | | | | | 6,379,820 | |
| | | |
| | |
| | Broadline Retail – 0.7% | | | | |
| | 40,008 | | Etsy, Inc.* | | | 3,242,648 | |
| | | |
| | |
| | Building Products – 2.1% | | | | |
| | 40,249 | | Allegion PLC | | | 5,099,146 | |
| | 17,323 | | Trane Technologies PLC | | | 4,225,080 | |
| | | | | | | | |
| | | | | | | 9,324,226 | |
| | | |
| | |
| | Capital Markets – 3.8% | | | | |
| | 63,128 | | KKR & Co., Inc. | | | 5,230,155 | |
| | 86,864 | | Nasdaq, Inc. | | | 5,050,273 | |
| | 60,232 | | Raymond James Financial, Inc. | | | 6,715,868 | |
| | | | | | | | |
| | | | | | | 16,996,296 | |
| | | |
| | |
| | Chemicals – 3.7% | | | | |
| | 80,032 | | Ashland, Inc. | | | 6,747,498 | |
| | 29,496 | | Celanese Corp. | | | 4,582,793 | |
| | 35,940 | | PPG Industries, Inc. | | | 5,374,827 | |
| | | | | | | | |
| | | | | | | 16,705,118 | |
| | | |
| | |
| | Communications Equipment – 0.6% | | | | |
| | 8,948 | | Motorola Solutions, Inc. | | | 2,801,529 | |
| | | |
| | |
| | Construction Materials – 1.9% | | | | |
| | 16,700 | | Martin Marietta Materials, Inc. | | | 8,331,797 | |
| | | |
| | |
| | Consumer Staples Distribution & Retail – 0.7% | | | | |
| | 47,395 | | Performance Food Group Co.* | | | 3,277,364 | |
| | | |
| | |
| | Containers & Packaging – 2.3% | | | | |
| | 15,599 | | Avery Dennison Corp. | | | 3,153,494 | |
| | 123,465 | | Ball Corp. | | | 7,101,707 | |
| | | | | | | | |
| | | | | | | 10,255,201 | |
| | | |
| | |
| | Electric Utilities – 3.3% | | | | |
| | 99,773 | | Eversource Energy | | | 6,157,990 | |
| | 99,748 | | FirstEnergy Corp. | | | 3,656,762 | |
| | 78,073 | | Xcel Energy, Inc. | | | 4,833,499 | |
| | | | | | | | |
| | | | | | | 14,648,251 | |
| | | |
| | |
| | Electrical Equipment – 2.8% | | | | |
| | 47,719 | | AMETEK, Inc. | | | 7,868,386 | |
| | | | | | | | |
| | | Shares | | Description | | Value | |
| | |
| | Common Stocks – (continued) | | | | |
| | |
| | Electrical Equipment – (continued) | | | | |
| | 14,572 | | Rockwell Automation, Inc. | | $ | 4,524,314 | |
| | | | | | | | |
| | | | | | | 12,392,700 | |
| | | |
| |
| | Electronic Equipment, Instruments & Components – 1.7% | |
| | 22,288 | | Keysight Technologies, Inc.* | | | 3,545,798 | |
| | 15,564 | | Zebra Technologies Corp., Class A* | | | 4,254,108 | |
| | | | | | | | |
| | | | | | | 7,799,906 | |
| | | |
| | |
| | Entertainment – 1.5% | | | | |
| | 33,682 | | Electronic Arts, Inc. | | | 4,608,034 | |
| | 182,915 | | Warner Bros Discovery, Inc.* | | | 2,081,573 | |
| | | | | | | | |
| | | | | | | 6,689,607 | |
| | | |
| | |
| | Financial Services – 2.5% | | | | |
| | 138,262 | | Fidelity National Information Services, Inc. | | | 8,305,398 | |
| | 45,439 | | Voya Financial, Inc. | | | 3,315,229 | |
| | | | | | | | |
| | | | | | | 11,620,627 | |
| | | |
| | |
| | Food Products – 1.8% | | | | |
| | 82,185 | | McCormick & Co., Inc. | | | 5,623,098 | |
| | 142,087 | | Utz Brands, Inc. | | | 2,307,493 | |
| | | | | | | | |
| | | | | | | 7,930,591 | |
| | | |
| | |
| | Ground Transportation – 0.9% | | | | |
| | 5,146 | | Old Dominion Freight Line, Inc. | | | 2,085,828 | |
| | 4,590 | | Saia, Inc.* | | | 2,011,430 | |
| | | | | | | | |
| | | | | | | 4,097,258 | |
| | | |
| | |
| | Health Care Equipment & Supplies – 3.3% | | | | |
| | 17,627 | | Cooper Cos., Inc. (The) | | | 6,670,762 | |
| | 68,554 | | Zimmer Biomet Holdings, Inc. | | | 8,343,022 | |
| | | | | | | | |
| | | | | | | 15,013,784 | |
| | | |
| | |
| | Health Care Providers & Services – 1.3% | | | | |
| | 28,810 | | Cencora, Inc. | | | 5,916,998 | |
| | | |
| | |
| | Health Care REITs – 1.0% | | | | |
| | 94,993 | | Ventas, Inc. REIT | | | 4,734,451 | |
| | | |
| | |
| | Hotels, Restaurants & Leisure – 3.3% | | | | |
| | 45,472 | | Royal Caribbean Cruises Ltd.* | | | 5,888,169 | |
| | 44,507 | | Wyndham Hotels & Resorts, Inc. | | | 3,578,808 | |
| | 41,360 | | Yum! Brands, Inc. | | | 5,404,098 | |
| | | | | | | | |
| | | | | | | 14,871,075 | |
| | | |
| | |
| | Household Durables – 1.6% | | | | |
| | 49,535 | | Lennar Corp., Class A | | | 7,382,696 | |
| | | |
| |
| | Independent Power and Renewable Electricity Producers – 0.8% | |
| | 186,402 | | AES Corp. (The) | | | 3,588,239 | |
| | | |
| | |
| | Industrial REITs – 1.0% | | | | |
| | 63,898 | | Americold Realty Trust, Inc. REIT | | | 1,934,193 | |
| | 15,095 | | EastGroup Properties, Inc. REIT | | | 2,770,536 | |
| | | | | | | | |
| | | | | | | 4,704,729 | |
| | | |
| | |
| | Insurance – 6.3% | | | | |
| | 46,449 | | Allstate Corp. (The) | | | 6,501,931 | |
| | 27,023 | | American Financial Group, Inc. | | | 3,212,765 | |
| | 55,836 | | Arch Capital Group Ltd.* | | | 4,146,940 | |
| | 21,740 | | Arthur J Gallagher & Co. | | | 4,888,891 | |
| | |
| 58 | | The accompanying notes are an integral part of these financial statements. |
GOLDMAN SACHS VARIABLE INSURANCE TRUST MID CAP VALUE FUND
| | | | | | | | |
| | | Shares | | Description | | Value | |
| | |
| | Common Stocks – (continued) | | | | |
| | |
| | Insurance – (continued) | | | | |
| | 47,651 | | Globe Life, Inc. | | $ | 5,800,080 | |
| | 82,902 | | Unum Group | | | 3,748,828 | |
| | | | | | | | |
| | | | | | | 28,299,435 | |
| | | |
| | |
| | Interactive Media & Services – 0.7% | | | | |
| | 82,663 | | Match Group, Inc.* | | | 3,017,199 | |
| | | |
| | |
| | Life Sciences Tools & Services – 1.2% | | | | |
| | 4,617 | | Mettler-Toledo International, Inc.* | | | 5,600,236 | |
| | | |
| | |
| | Machinery – 7.7% | | | | |
| | 9,621 | | Chart Industries, Inc.* | | | 1,311,631 | |
| | 21,406 | | Cummins, Inc. | | | 5,128,235 | |
| | 97,443 | | Fortive Corp. | | | 7,174,728 | |
| | 16,040 | | IDEX Corp. | | | 3,482,444 | |
| | 53,380 | | ITT, Inc. | | | 6,369,302 | |
| | 72,506 | | Stanley Black & Decker, Inc. | | | 7,112,839 | |
| | 36,979 | | Xylem, Inc. | | | 4,228,918 | |
| | | | | | | | |
| | | | | | | 34,808,097 | |
| | | |
| | |
| | Metals & Mining – 1.9% | | | | |
| | 70,580 | | Steel Dynamics, Inc. | | | 8,335,498 | |
| | | |
| | |
| | Multi-Utilities – 3.4% | | | | |
| | 88,286 | | CMS Energy Corp. | | | 5,126,768 | |
| | 169,308 | | NiSource, Inc. | | | 4,495,127 | |
| | 66,810 | | WEC Energy Group, Inc. | | | 5,623,398 | |
| | | | | | | | |
| | | | | | | 15,245,293 | |
| | | |
| | |
| | Office REITs – 1.5% | | | | |
| | 54,847 | | Alexandria Real Estate Equities, Inc. REIT | | | 6,952,954 | |
| | | |
| | |
| | Oil, Gas & Consumable Fuels – 4.8% | | | | |
| | 19,636 | | Cheniere Energy, Inc. | | | 3,352,062 | |
| | 45,984 | | Chesapeake Energy Corp. | | | 3,538,009 | |
| | 50,399 | | Devon Energy Corp. | | | 2,283,075 | |
| | 25,788 | | Diamondback Energy, Inc. | | | 3,999,203 | |
| | 245,278 | | Marathon Oil Corp. | | | 5,925,916 | |
| | 17,314 | | Phillips 66 | | | 2,305,186 | |
| | | | | | | | |
| | | | | | | 21,403,451 | |
| | | |
| | |
| | Passenger Airlines – 0.8% | | | | |
| | 84,673 | | United Airlines Holdings, Inc.* | | | 3,493,608 | |
| | | |
| | |
| | Residential REITs – 2.5% | | | | |
| | 34,044 | | AvalonBay Communities, Inc. REIT | | | 6,373,718 | |
| | 29,002 | | Equity LifeStyle Properties, Inc. REIT | | | 2,045,801 | |
| | 81,056 | | Invitation Homes, Inc. REIT | | | 2,764,820 | |
| | | | | | | | |
| | | | | | | 11,184,339 | |
| | | |
| | |
| | Retail REITs – 1.0% | | | | |
| | 63,787 | | Regency Centers Corp. REIT | | | 4,273,729 | |
| | | |
| | |
| | Semiconductors & Semiconductor Equipment – 4.2% | | | | |
| | 51,458 | | ARM Holdings PLC ADR*(a) | | | 3,866,811 | |
| | 186,025 | | Marvell Technology, Inc. | | | 11,219,168 | |
| | 36,637 | | MKS Instruments, Inc. | | | 3,768,848 | |
| | | | | | | | |
| | | | | | | 18,854,827 | |
| | | |
| | | | | | | | |
| | | Shares | | Description | | Value | |
| | |
| | Common Stocks – (continued) | | | | |
| | |
| | Software – 2.2% | | | | |
| | 11,593 | | ANSYS, Inc.* | | $ | 4,206,868 | |
| | 71,109 | | Dynatrace, Inc.* | | | 3,888,951 | |
| | 58,792 | | Klaviyo, Inc., Class A* | | | 1,633,242 | |
| | | | | | | | |
| | | | | | | 9,729,061 | |
| | | |
| | |
| | Specialized REITs – 2.1% | | | | |
| | 24,972 | | Extra Space Storage, Inc. REIT | | | 4,003,761 | |
| | 161,926 | | VICI Properties, Inc. REIT | | | 5,162,201 | |
| | | | | | | | |
| | | | | | | 9,165,962 | |
| | | |
| | |
| | Specialty Retail – 3.3% | | | | |
| | 102,356 | | Foot Locker, Inc. | | | 3,188,389 | |
| | 7,141 | | RH* | | | 2,081,459 | |
| | 46,577 | | Ross Stores, Inc. | | | 6,445,791 | |
| | 6,561 | | Ulta Beauty, Inc.* | | | 3,214,824 | |
| | | | | | | | |
| | | | | | | 14,930,463 | |
| | | |
| | |
| | Trading Companies & Distributors – 2.2% | | | | |
| | 33,202 | | Fastenal Co. | | | 2,150,494 | |
| | 13,210 | | United Rentals, Inc. | | | 7,574,878 | |
| | | | | | | | |
| | | | | | | 9,725,372 | |
| | | |
| | TOTAL COMMON STOCKS (Cost $363,637,798) | | | 442,992,875 | |
| | | |
| | | |
| | | Shares | | Dividend Rate | | Value | |
| | |
| | Investment Company – 1.2%(b) | | | | |
| | Goldman Sachs Financial Square Government Fund - Institutional Shares | | | | |
| | 5,349,937 | | 5.248% | | | 5,349,937 | |
| | (Cost $5,349,937) | | | | |
| | | |
| | TOTAL INVESTMENTS BEFORE SECURITIES LENDING REINVESTMENT VEHICLE (Cost $368,987,735) | | | 448,342,812 | |
| | | |
| | | | | | | | |
| | |
| | Securities Lending Reinvestment Vehicle – 0.9%(b) | | | | |
| | Goldman Sachs Financial Square Government Fund – Institutional Shares | | | | |
| | 3,873,716 | | 5.248% | | | 3,873,716 | |
| | (Cost $3,873,716) | | | | |
| | | |
| | TOTAL INVESTMENTS – 100.7% (Cost $372,861,451) | | $ | 452,216,528 | |
| | | |
| | LIABILITIES IN EXCESS OF
OTHER ASSETS – (0.7)% | | | (3,225,499) | |
| | | |
| | NET ASSETS – 100.0% | | $ | 448,991,029 | |
| | | |
| | |
| The percentage shown for each investment category reflects the value of investments in that category as a percentage of net assets. |
| |
| * | | Non-income producing security. |
| (a) | | All or a portion of security is on loan. |
| (b) | | Represents an affiliated issuer. |
| | |
| The accompanying notes are an integral part of these financial statements. | | 59 |
GOLDMAN SACHS VARIABLE INSURANCE TRUST MID CAP VALUE FUND
|
Schedule of Investments (continued) December 31, 2023 |
| | |
|
| Investment Abbreviations: |
| ADR | | —American Depositary Receipt |
| PLC | | —Public Limited Company |
| REIT | | —Real Estate Investment Trust |
|
|
| | |
| 60 | | The accompanying notes are an integral part of these financial statements. |
GOLDMAN SACHS VARIABLE INSURANCE TRUST SMALL CAP EQUITY INSIGHTS FUND
|
Schedule of Investments December 31, 2023 |
| | | | | | | | |
| | | Shares | | Description | | Value | |
| |
| | Common Stocks – 97.0% | |
| |
| | Aerospace & Defense – 0.5% | |
| | 3,408 | | AAR Corp.* | | $ | 212,659 | |
| | 2,629 | | National Presto Industries, Inc. | | | 211,056 | |
| | 8,851 | | Triumph Group, Inc.* | | | 146,750 | |
| | | | | | | | |
| | | | | | | 570,465 | |
| | | |
| |
| | Automobile Components – 2.0% | |
| | 13,996 | | Adient PLC* | | | 508,895 | |
| | 31,385 | | American Axle & Manufacturing Holdings, Inc.* | | | 276,502 | |
| | 15,801 | | Atmus Filtration Technologies, Inc.*(a) | | | 371,166 | |
| | 1,740 | | Dorman Products, Inc.* | | | 145,133 | |
| | 52,098 | | Goodyear Tire & Rubber Co. (The)* | | | 746,043 | |
| | 3,877 | | Modine Manufacturing Co.* | | | 231,457 | |
| | 1,393 | | Patrick Industries, Inc. | | | 139,787 | |
| | 752 | | XPEL, Inc.* | | | 40,495 | |
| | | | | | | | |
| | | | | | | 2,459,478 | |
| | | |
| |
| | Banks – 9.0% | |
| | 10,173 | | Amalgamated Financial Corp. | | | 274,061 | |
| | 10,179 | | Ameris Bancorp | | | 539,996 | |
| | 6,241 | | Axos Financial, Inc.* | | | 340,758 | |
| | 4,879 | | BancFirst Corp. | | | 474,873 | |
| | 11,484 | | Bancorp, Inc. (The)* | | | 442,823 | |
| | 5,911 | | BankUnited, Inc. | | | 191,694 | |
| | 3,325 | | Banner Corp. | | | 178,087 | |
| | 3,654 | | Business First Bancshares, Inc. | | | 90,071 | |
| | 5,551 | | Byline Bancorp, Inc. | | | 130,782 | |
| | 1,043 | | Capital City Bank Group, Inc. | | | 30,695 | |
| | 7,345 | | Central Pacific Financial Corp. | | | 144,550 | |
| | 1,035 | | Civista Bancshares, Inc. | | | 19,085 | |
| | 3,484 | | Community Trust Bancorp, Inc. | | | 152,808 | |
| | 23,633 | | CVB Financial Corp. | | | 477,150 | |
| | 349 | | Enterprise Financial Services Corp. | | | 15,583 | |
| | 2,297 | | Esquire Financial Holdings, Inc. | | | 114,758 | |
| | 2,569 | | Financial Institutions, Inc. | | | 54,720 | |
| | 584 | | First Bancorp, Inc. (The) | | | 16,480 | |
| | 29,709 | | First BanCorp. (Puerto Rico) | | | 488,713 | |
| | 23,282 | | First Commonwealth Financial Corp. | | | 359,474 | |
| | 3,431 | | First Financial Bancorp | | | 81,486 | |
| | 2,785 | | First Financial Bankshares, Inc. | | | 84,385 | |
| | 3,608 | | Fulton Financial Corp. | | | 59,388 | |
| | 8,182 | | Hancock Whitney Corp. | | | 397,563 | |
| | 17,146 | | Hanmi Financial Corp. | | | 332,632 | |
| | 2,495 | | Heartland Financial USA, Inc. | | | 93,837 | |
| | 4,644 | | Heritage Commerce Corp. | | | 46,068 | |
| | 18,260 | | Heritage Financial Corp. | | | 390,581 | |
| | 2,784 | | Home Bancorp, Inc. | | | 116,956 | |
| | 4,850 | | HomeTrust Bancshares, Inc. | | | 130,562 | |
| | 2,682 | | Hope Bancorp, Inc. | | | 32,399 | |
| | 9,686 | | International Bancshares Corp. | | | 526,144 | |
| | 1,192 | | Lakeland Bancorp, Inc. | | | 17,630 | |
| | 33,227 | | Macatawa Bank Corp. | | | 374,801 | |
| | 3,055 | | Metrocity Bankshares, Inc. | | | 73,381 | |
| | 10,504 | | National Bank Holdings Corp., Class A | | | 390,644 | |
| | | | | | | | |
| | | Shares | | Description | | Value | |
| |
| | Common Stocks – (continued) | |
| |
| | Banks – (continued) | |
| | 3,958 | | Northeast Community Bancorp, Inc. | | $ | 70,215 | |
| | 11,783 | | OFG Bancorp (Puerto Rico) | | | 441,627 | |
| | 8,188 | | Old Second Bancorp, Inc. | | | 126,423 | |
| | 7,744 | | Pathward Financial, Inc. | | | 409,890 | |
| | 2,227 | | Preferred Bank | | | 162,682 | |
| | 12,233 | | Provident Financial Services, Inc. | | | 220,561 | |
| | 2,199 | | Renasant Corp. | | | 74,062 | |
| | 1,919 | | Sierra Bancorp | | | 43,273 | |
| | 12,858 | | Southside Bancshares, Inc. | | | 402,713 | |
| | 8,020 | | Texas Capital Bancshares, Inc.* | | | 518,333 | |
| | 852 | | Timberland Bancorp, Inc. | | | 26,804 | |
| | 10,924 | | TrustCo Bank Corp. | | | 339,190 | |
| | 6,495 | | UMB Financial Corp. | | | 542,657 | |
| | 238 | | Westamerica BanCorp | | | 13,426 | |
| | | | | | | | |
| | | | | | | 11,077,474 | |
| | | |
| |
| | Beverages – 0.7% | |
| | 85 | | Coca-Cola Consolidated, Inc. | | | 78,914 | |
| | 49,365 | | Primo Water Corp. | | | 742,943 | |
| | | | | | | | |
| | | | | | | 821,857 | |
| | | |
| |
| | Biotechnology – 6.5% | |
| | 6,599 | | ACADIA Pharmaceuticals, Inc.* | | | 206,615 | |
| | 62,415 | | ADMA Biologics, Inc.* | | | 282,116 | |
| | 6,537 | | Aldeyra Therapeutics, Inc.* | | | 22,945 | |
| | 11,194 | | Alkermes PLC* | | | 310,521 | |
| | 2,970 | | Allogene Therapeutics, Inc.* | | | 9,534 | |
| | 2,010 | | Alpine Immune Sciences, Inc.* | | | 38,311 | |
| | 4,446 | | AnaptysBio, Inc.* | | | 95,233 | |
| | 855 | | Apogee Therapeutics, Inc.* | | | 23,889 | |
| | 428 | | Arcellx, Inc.* | | | 23,754 | |
| | 4,621 | | Arcturus Therapeutics Holdings, Inc.* | | | 145,700 | |
| | 9,778 | | Arcus Biosciences, Inc.* | | | 186,760 | |
| | 71,044 | | Aurinia Pharmaceuticals, Inc. (Canada)* | | | 638,685 | |
| | 13,036 | | BioCryst Pharmaceuticals, Inc.* | | | 78,086 | |
| | 3,548 | | Biohaven Ltd.* | | | 151,854 | |
| | 3,470 | | Bridgebio Pharma, Inc.* | | | 140,084 | |
| | 6,525 | | Cogent Biosciences, Inc.* | | | 38,367 | |
| | 24,484 | | Coherus Biosciences, Inc.* | | | 81,532 | |
| | 997 | | Day One Biopharmaceuticals, Inc.* | | | 14,556 | |
| | 19,623 | | Deciphera Pharmaceuticals, Inc.* | | | 316,519 | |
| | 9,173 | | Design Therapeutics, Inc.* | | | 24,308 | |
| | 5,968 | | Eagle Pharmaceuticals, Inc.* | | | 31,213 | |
| | 5,471 | | Enanta Pharmaceuticals, Inc.* | | | 51,482 | |
| | 6,409 | | Generation Bio Co.* | | | 10,575 | |
| | 9,827 | | Halozyme Therapeutics, Inc.* | | | 363,206 | |
| | 3,849 | | Inozyme Pharma, Inc.* | | | 16,397 | |
| | 22,887 | | Iovance Biotherapeutics, Inc.* | | | 186,071 | |
| | 8,300 | | Ironwood Pharmaceuticals, Inc.* | | | 94,952 | |
| | 10,901 | | iTeos Therapeutics, Inc.* | | | 119,366 | |
| | 26,450 | | Kiniksa Pharmaceuticals Ltd., Class A* | | | 463,933 | |
| | 17,823 | | Kodiak Sciences, Inc.* | | | 54,182 | |
| | 542 | | Krystal Biotech, Inc.* | | | 67,240 | |
| | 1,141 | | Kymera Therapeutics, Inc.* | | | 29,050 | |
| | |
| The accompanying notes are an integral part of these financial statements. | | 61 |
GOLDMAN SACHS VARIABLE INSURANCE TRUST SMALL CAP EQUITY INSIGHTS FUND
|
Schedule of Investments (continued) December 31, 2023 |
| | | | | | | | |
| | | Shares | | Description | | Value | |
| |
| | Common Stocks – (continued) | |
| |
| | Biotechnology – (continued) | |
| | 22,579 | | MacroGenics, Inc.* | | $ | 217,210 | |
| | 93,470 | | MannKind Corp.* | | | 340,231 | |
| | 2,347 | | Mural Oncology PLC* | | | 13,894 | |
| | 8,147 | | Nurix Therapeutics, Inc.* | | | 84,077 | |
| | 8,200 | | Olema Pharmaceuticals, Inc.* | | | 115,046 | |
| | 25,897 | | PMV Pharmaceuticals, Inc.* | | | 80,281 | |
| | 25,514 | | Poseida Therapeutics, Inc.* | | | 85,727 | |
| | 8,468 | | Precigen, Inc.* | | | 11,347 | |
| | 2,456 | | Relay Therapeutics, Inc.* | | | 27,040 | |
| | 3,226 | | REVOLUTION Medicines, Inc.* | | | 92,522 | |
| | 13,269 | | Rigel Pharmaceuticals, Inc.* | | | 19,240 | |
| | 5,370 | | Rocket Pharmaceuticals, Inc.* | | | 160,939 | |
| | 6,951 | | SpringWorks Therapeutics, Inc.* | | | 253,711 | |
| | 45,539 | | Sutro Biopharma, Inc.* | | | 195,362 | |
| | 17,795 | | TG Therapeutics, Inc.* | | | 303,939 | |
| | 12,876 | | Veracyte, Inc.* | | | 354,219 | |
| | 16,508 | | Vericel Corp.* | | | 587,850 | |
| | 7,963 | | Verve Therapeutics, Inc.* | | | 111,004 | |
| | 26,750 | | Viking Therapeutics, Inc.* | | | 497,817 | |
| | 28,624 | | Y-mAbs Therapeutics, Inc.* | | | 195,216 | |
| | | | | | | | |
| | | | | | | 8,063,708 | |
| | | |
| |
| | Broadline Retail – 0.1% | |
| | 343 | | Dillard’s, Inc., Class A | | | 138,452 | |
| | | |
| |
| | Building Products – 1.1% | |
| | 3,865 | | AAON, Inc. | | | 285,508 | |
| | 1,770 | | American Woodmark Corp.* | | | 164,344 | |
| | 22,760 | | Masterbrand, Inc.* | | | 337,986 | |
| | 11,526 | | PGT Innovations, Inc.* | | | 469,108 | |
| | 2,295 | | Quanex Building Products Corp. | | | 70,158 | |
| | 1,091 | | Resideo Technologies, Inc.* | | | 20,533 | |
| | | | | | | | |
| | | | | | | 1,347,637 | |
| | | |
| |
| | Capital Markets – 0.6% | |
| | 2,381 | | AssetMark Financial Holdings, Inc.* | | | 71,311 | |
| | 7,530 | | Moelis & Co., Class A | | | 422,659 | |
| | 6,804 | | Open Lending Corp.* | | | 57,902 | |
| | 559 | | Piper Sandler Cos. | | | 97,752 | |
| | 652 | | StoneX Group, Inc.* | | | 48,137 | |
| | | | | | | | |
| | | | | | | 697,761 | |
| | | |
| |
| | Chemicals – 1.5% | |
| | 847 | | HB Fuller Co. | | | 68,954 | |
| | 6,922 | | Innospec, Inc. | | | 853,067 | |
| | 694 | | Koppers Holdings, Inc. | | | 35,547 | |
| | 3,465 | | Mativ Holdings, Inc. | | | 53,049 | |
| | 8,080 | | Minerals Technologies, Inc. | | | 576,185 | |
| | 10,580 | | Orion SA (Germany) | | | 293,384 | |
| | | | | | | | |
| | | | | | | 1,880,186 | |
| | | |
| |
| | Commercial Services & Supplies – 0.8% | |
| | 613 | | Cimpress PLC (Ireland)* | | | 49,071 | |
| | 8,222 | | Deluxe Corp. | | | 176,362 | |
| | 15,944 | | Ennis, Inc. | | | 349,333 | |
| | 30,316 | | Healthcare Services Group, Inc.* | | | 314,377 | |
| | 3,627 | | Steelcase, Inc., Class A | | | 49,037 | |
| | | | | | | | |
| | | | | | | 938,180 | |
| | | |
| | | | | | | | |
| | | Shares | | Description | | Value | |
| |
| | Common Stocks – (continued) | |
| |
| | Communications Equipment – 0.9% | |
| | 16,855 | | NetScout Systems, Inc.* | | $ | 369,967 | |
| | 78,974 | | Viavi Solutions, Inc.* | | | 795,268 | |
| | | | | | | | |
| | | | | | | 1,165,235 | |
| | | |
| |
| | Construction & Engineering – 2.3% | |
| | 4,505 | | Comfort Systems USA, Inc. | | | 926,543 | |
| | 2,416 | | Dycom Industries, Inc.* | | | 278,057 | |
| | 7,569 | | Fluor Corp.* | | | 296,478 | |
| | 3,693 | | IES Holdings, Inc.* | | | 292,559 | |
| | 1,634 | | Northwest Pipe Co.* | | | 49,445 | |
| | 16,599 | | Primoris Services Corp. | | | 551,253 | |
| | 5,136 | | Sterling Infrastructure, Inc.* | | | 451,609 | |
| | | | | | | | |
| | | | | | | 2,845,944 | |
| | | |
| |
| | Construction Materials – 0.8% | |
| | 24,569 | | Summit Materials, Inc., Class A* | | | 944,924 | |
| | | |
| |
| | Consumer Finance – 0.3% | |
| | 986 | | Nelnet, Inc., Class A | | | 86,985 | |
| | 6,016 | | Regional Management Corp. | | | 150,881 | |
| | 1,925 | | Upstart Holdings, Inc.*(a) | | | 78,656 | |
| | 347 | | World Acceptance Corp.* | | | 45,294 | |
| | | | | | | | |
| | | | | | | 361,816 | |
| | | |
| |
| | Consumer Staples Distribution & Retail – 0.2% | |
| | 2,984 | | Natural Grocers by Vitamin | | | | |
| | | | Cottage, Inc. | | | 47,744 | |
| | 537 | | PriceSmart, Inc. | | | 40,694 | |
| | 2,483 | | Weis Markets, Inc. | | | 158,813 | |
| | | | | | | | |
| | | | | | | 247,251 | |
| | | |
| |
| | Distributors – 0.0% | |
| | 968 | | Weyco Group, Inc. | | | 30,357 | |
| | | |
| |
| | Diversified Consumer Services – 3.4% | |
| | 6,560 | | Adtalem Global Education, Inc.* | | | 386,712 | |
| | 42,038 | | Coursera, Inc.* | | | 814,276 | |
| | 4,659 | | Duolingo, Inc.* | | | 1,056,894 | |
| | 16,981 | | European Wax Center, Inc., Class A* | | | 230,772 | |
| | 18,791 | | Frontdoor, Inc.* | | | 661,819 | |
| | 115 | | Graham Holdings Co., Class B | | | 80,100 | |
| | 9,545 | | Laureate Education, Inc. | | | 130,862 | |
| | 11,752 | | Perdoceo Education Corp. | | | 206,365 | |
| | 7,339 | | Strategic Education, Inc. | | | 677,903 | |
| | | | | | | | |
| | | | | | | 4,245,703 | |
| | | |
| |
| | Diversified REITs – 0.1% | |
| | 6,361 | | American Assets Trust, Inc. REIT | | | 143,186 | |
| | | |
| |
| | Diversified Telecommunication Services – 0.2% | |
| | 27,600 | | Liberty Latin America Ltd., Class C (Puerto Rico)* | | | 202,584 | |
| | | |
| |
| | Electrical Equipment – 2.7% | |
| | 807 | | Allient, Inc. | | | 24,380 | |
| | 5,062 | | Atkore, Inc.* | | | 809,920 | |
| | 4,524 | | Encore Wire Corp. | | | 966,326 | |
| | 1,961 | | Enovix Corp.*(a) | | | 24,552 | |
| | 3,733 | | Fluence Energy, Inc.* | | | 89,032 | |
| | 52,518 | | FTC Solar, Inc.* | | | 36,385 | |
| | 4,792 | | NEXTracker, Inc., Class A* | | | 224,505 | |
| | |
| 62 | | The accompanying notes are an integral part of these financial statements. |
GOLDMAN SACHS VARIABLE INSURANCE TRUST SMALL CAP EQUITY INSIGHTS FUND
| | | | | | | | |
| | | Shares | | Description | | Value | |
| |
| | Common Stocks – (continued) | |
| |
| | Electrical Equipment – (continued) | |
| | 5,333 | | Powell Industries, Inc. | | $ | 471,437 | |
| | 1,054 | | Shoals Technologies Group, Inc., Class A* | | | 16,379 | |
| | 20,691 | | Thermon Group Holdings, Inc.* | | | 673,906 | |
| | | | | | | | |
| | | | | | | 3,336,822 | |
| | | |
| |
| | Electronic Equipment, Instruments & Components – 2.1% | |
| | 3,829 | | Badger Meter, Inc. | | | 591,083 | |
| | 613 | | Bel Fuse, Inc., Class B | | | 40,930 | |
| | 4,658 | | Belden, Inc. | | | 359,830 | |
| | 4,252 | | Benchmark Electronics, Inc. | | | 117,525 | |
| | 5,368 | | ePlus, Inc.* | | | 428,581 | |
| | 2,471 | | Fabrinet (Thailand)* | | | 470,305 | |
| | 3,252 | | Itron, Inc.* | | | 245,559 | |
| | 1,531 | | PC Connection, Inc. | | | 102,899 | |
| | 2,058 | | Sanmina Corp.* | | | 105,719 | |
| | 3,868 | | Vishay Precision Group, Inc.* | | | 131,783 | |
| | | | | | | | |
| | | | | | | 2,594,214 | |
| | | |
| |
| | Energy Equipment & Services – 1.6% | |
| | 18,358 | | Archrock, Inc. | | | 282,713 | |
| | 5,198 | | Atlas Energy Solutions, Inc. | | | 89,510 | |
| | 20,315 | | Borr Drilling Ltd. (Mexico)* | | | 149,518 | |
| | 406 | | ChampionX Corp. | | | 11,859 | |
| | 7,094 | | Dril-Quip, Inc.* | | | 165,077 | |
| | 4,609 | | Helix Energy Solutions Group, Inc.* | | | 47,381 | |
| | 1,519 | | Helmerich & Payne, Inc. | | | 55,018 | |
| | 4,905 | | Kodiak Gas Services, Inc. | | | 98,493 | |
| | 4,518 | | Nabors Industries Ltd.* | | | 368,804 | |
| | 18,034 | | Oil States International, Inc.* | | | 122,451 | |
| | 18,354 | | ProFrac Holding Corp., Class A* | | | 155,642 | |
| | 29,742 | | ProPetro Holding Corp.* | | | 249,238 | |
| | 23,160 | | RPC, Inc. | | | 168,605 | |
| | | | | | | | |
| | | | | | | 1,964,309 | |
| | | |
| |
| | Entertainment – 0.0% | |
| | 2,419 | | Cinemark Holdings, Inc.* | | | 34,084 | |
| | 1,099 | | Madison Square Garden Entertainment Corp.* | | | 34,937 | |
| | 3,179 | | Vivid Seats, Inc., Class A* | | | 20,091 | |
| | | | | | | | |
| | | | | | | 89,112 | |
| | | |
| |
| | Financial Services – 3.0% | |
| | 9,673 | | A-Mark Precious Metals, Inc. | | | 292,608 | |
| | 29,758 | | Banco Latinoamericano de Comercio Exterior SA, Class E (Panama) | | | 736,213 | |
| | 9,078 | | Essent Group Ltd. | | | 478,774 | |
| | 11,460 | | I3 Verticals, Inc., Class A* | | | 242,608 | |
| | 88,623 | | Marqeta, Inc., Class A* | | | 618,589 | |
| | 3,126 | | Merchants Bancorp | | | 133,105 | |
| | 1,954 | | NMI Holdings, Inc., Class A*(b) | | | 57,995 | |
| | 30,844 | | Pagseguro Digital Ltd., Class A (Brazil)* | | | 384,625 | |
| | 10,731 | | Payoneer Global, Inc.* | | | 55,908 | |
| | 5,826 | | Remitly Global, Inc.* | | | 113,141 | |
| | 42,409 | | StoneCo Ltd., Class A (Brazil)* | | | 764,634 | |
| | | | | | | | |
| | | | | | | 3,878,200 | |
| | | |
| | | | | | | | |
| | | Shares | | Description | | Value | |
| |
| | Common Stocks – (continued) | |
| |
| | Food Products – 0.2% | |
| | 462 | | Cal-Maine Foods, Inc. | | $ | 26,514 | |
| | 1,473 | | J & J Snack Foods Corp. | | | 246,197 | |
| | | | | | | | |
| | | | | | | 272,711 | |
| | | |
| |
| | Gas Utilities – 0.2% | |
| | 5,457 | | Northwest Natural Holding Co. | | | 212,496 | |
| | | |
| |
| | Ground Transportation – 0.2% | |
| | 185 | | ArcBest Corp. | | | 22,239 | |
| | 6,601 | | Marten Transport Ltd. | | | 138,489 | |
| | 3,699 | | PAM Transportation Services, Inc.* | | | 76,865 | |
| | | | | | | | |
| | | | | | | 237,593 | |
| | | |
| |
| | Health Care Equipment & Supplies – 1.7% | |
| | 11,571 | | Artivion, Inc.* | | | 206,890 | |
| | 6,452 | | AtriCure, Inc.* | | | 230,272 | |
| | 24,523 | | Embecta Corp. | | | 464,220 | |
| | 5,986 | | Inmode Ltd.* | | | 133,129 | |
| | 3,404 | | iRadimed Corp. | | | 161,588 | |
| | 238 | | LeMaitre Vascular, Inc. | | | 13,509 | |
| | 2,157 | | Merit Medical Systems, Inc.* | | | 163,846 | |
| | 4,689 | | Pulmonx Corp.* | | | 59,785 | |
| | 2,727 | | Surmodics, Inc.* | | | 99,126 | |
| | 1,834 | | Tactile Systems Technology, Inc.* | | | 26,226 | |
| | 429 | | TransMedics Group, Inc.* | | | 33,861 | |
| | 3,002 | | Utah Medical Products, Inc. | | | 252,828 | |
| | 14,124 | | Varex Imaging Corp.* | | | 289,542 | |
| | | | | | | | |
| | | | | | | 2,134,822 | |
| | | |
| |
| | Health Care Providers & Services – 3.1% | |
| | 18,915 | | Agiliti, Inc.* | | | 149,807 | |
| | 27,258 | | Alignment Healthcare, Inc.* | | | 234,691 | |
| | 48,119 | | Brookdale Senior Living, Inc.* | | | 280,053 | |
| | 5,296 | | Community Health Systems, Inc.* | | | 16,576 | |
| | 13,607 | | HealthEquity, Inc.* | | | 902,144 | |
| | 46,983 | | Hims & Hers Health, Inc.* | | | 418,149 | |
| | 24,024 | | Joint Corp. (The)* | | | 230,871 | |
| | 1,685 | | ModivCare, Inc.* | | | 74,123 | |
| | 20,839 | | OPKO Health, Inc.* | | | 31,467 | |
| | 3,418 | | Option Care Health, Inc.* | | | 115,152 | |
| | 4,279 | | Pediatrix Medical Group, Inc.* | | | 39,795 | |
| | 29,018 | | Pennant Group, Inc. (The)* | | | 403,931 | |
| | 7,035 | | PetIQ, Inc.* | | | 138,941 | |
| | 1,762 | | Progyny, Inc.* | | | 65,511 | |
| | 17,957 | | Select Medical Holdings Corp. | | | 421,989 | |
| | 8,507 | | Surgery Partners, Inc.* | | | 272,139 | |
| | | | | | | | |
| | | | | | | 3,795,339 | |
| | | |
| |
| | Health Care REITs – 0.1% | |
| | 2,506 | | LTC Properties, Inc. REIT | | | 80,493 | |
| | | |
| |
| | Health Care Technology – 0.4% | |
| | 11,111 | | American Well Corp., Class A* | | | 16,555 | |
| | 9,620 | | Health Catalyst, Inc.* | | | 89,081 | |
| | 4,078 | | Phreesia, Inc.* | | | 94,406 | |
| | 6,984 | | Schrodinger, Inc.* | | | 250,027 | |
| | | | | | | | |
| | | | | | | 450,069 | |
| | | |
| | |
| The accompanying notes are an integral part of these financial statements. | | 63 |
GOLDMAN SACHS VARIABLE INSURANCE TRUST SMALL CAP EQUITY INSIGHTS FUND
|
Schedule of Investments (continued) December 31, 2023 |
| | | | | | | | |
| | | Shares | | Description | | Value | |
| |
| | Common Stocks – (continued) | |
| |
| | Hotel & Resort REITs – 3.1% | |
| | 47,170 | | Chatham Lodging Trust REIT | | $ | 505,662 | |
| | 83,311 | | DiamondRock Hospitality Co. REIT | | | 782,290 | |
| | 68,965 | | RLJ Lodging Trust REIT | | | 808,270 | |
| | 9,888 | | Ryman Hospitality Properties, Inc. REIT | | | 1,088,273 | |
| | 77,773 | | Service Properties Trust REIT | | | 664,182 | |
| | 4,190 | | Xenia Hotels & Resorts, Inc. REIT | | | 57,068 | |
| | | | | | | | |
| | | | | | | 3,905,745 | |
| | | |
| |
| | Hotels, Restaurants & Leisure – 1.8% | |
| | 4,056 | | Cheesecake Factory, Inc. (The) | | | 142,000 | |
| | 13,410 | | Chuy’s Holdings, Inc.* | | | 512,664 | |
| | 4,258 | | Dine Brands Global, Inc. | | | 211,410 | |
| | 28,188 | | Everi Holdings, Inc.* | | | 317,679 | |
| | 6,299 | | International Game Technology PLC | | | 172,656 | |
| | 2,393 | | Life Time Group Holdings, Inc.* | | | 36,086 | |
| | 993 | | Monarch Casino & Resort, Inc. | | | 68,666 | |
| | 5,905 | | PlayAGS, Inc.* | | | 49,779 | |
| | 24,201 | | Portillo’s, Inc., Class A* | | | 385,522 | |
| | 2,329 | | Sabre Corp.* | | | 10,248 | |
| | 2,681 | | Shake Shack, Inc., Class A* | | | 198,716 | |
| | 10,207 | | Xponential Fitness, Inc., Class A* | | | 131,568 | |
| | | | | | | | |
| | | | | | | 2,236,994 | |
| | | |
| |
| | Household Durables – 2.1% | |
| | 4,522 | | Beazer Homes USA, Inc.*(b) | | | 152,798 | |
| | 1,148 | | Century Communities, Inc. | | | 104,629 | |
| | 4,990 | | Dream Finders Homes, Inc., Class A* | | | 177,295 | |
| | 6,418 | | Green Brick Partners, Inc.* | | | 333,351 | |
| | 410 | | Helen of Troy Ltd.* | | | 49,532 | |
| | 553 | | Hovnanian Enterprises, Inc., Class A* | | | 86,058 | |
| | 4,365 | | LGI Homes, Inc.* | | | 581,243 | |
| | 7,712 | | M/I Homes, Inc.* | | | 1,062,251 | |
| | 943 | | MDC Holdings, Inc. | | | 52,101 | |
| | | | | | | | |
| | | | | | | 2,599,258 | |
| | | |
| |
| | Household Products – 0.0% | |
| | 49 | | WD-40 Co. | | | 11,714 | |
| | | |
| |
| | Industrial REITs – 0.8% | |
| | 80,787 | | LXP Industrial Trust REIT | | | 801,407 | |
| | 4,767 | | Terreno Realty Corp. REIT | | | 298,748 | |
| | | | | | | | |
| | | | | | | 1,100,155 | |
| | | |
| |
| | Insurance – 2.3% | |
| | 12,981 | | Ambac Financial Group, Inc.* | | | 213,927 | |
| | 1,260 | | BRP Group, Inc., Class A* | | | 30,265 | |
| | 12,127 | | CNO Financial Group, Inc. | | | 338,343 | |
| | 27,976 | | Crawford & Co., Class A | | | 368,724 | |
| | 16,663 | | Employers Holdings, Inc. | | | 656,522 | |
| | 5,362 | | Genworth Financial, Inc., Class A* | | | 35,818 | |
| | 7,317 | | Goosehead Insurance, Inc., Class A* | | | 554,629 | |
| | 20,273 | | James River Group Holdings Ltd. | | | 187,323 | |
| | | | | | | | |
| | | Shares | | Description | | Value | |
| |
| | Common Stocks – (continued) | |
| |
| | Insurance – (continued) | |
| | 5,666 | | Palomar Holdings, Inc.* | | $ | 314,463 | |
| | 4,938 | | Universal Insurance Holdings, Inc. | | | 78,909 | |
| | | | | | | | |
| | | | | | | 2,778,923 | |
| | | |
| |
| | Interactive Media & Services – 1.8% | |
| | 32,098 | | Bumble, Inc., Class A* | | | 473,125 | |
| | 18,942 | | Cars.com, Inc.* | | | 359,330 | |
| | 23,658 | | Eventbrite, Inc., Class A* | | | 197,781 | |
| | 31,981 | | fuboTV, Inc.* | | | 101,700 | |
| | 21,384 | | Grindr, Inc. (Singapore)*(a) | | | 187,751 | |
| | 148,336 | | Vimeo, Inc.* | | | 581,477 | |
| | 4,320 | | Yelp, Inc.* | | | 204,509 | |
| | 12,465 | | ZipRecruiter, Inc., Class A* | | | 173,263 | |
| | | | | | | | |
| | | | | | | 2,278,936 | |
| | | |
| |
| | IT Services – 0.9% | |
| | 2,363 | | DigitalOcean Holdings, Inc.* | | | 86,698 | |
| | 18,086 | | Fastly, Inc., Class A* | | | 321,931 | |
| | 4,158 | | Information Services Group, Inc. | | | 19,584 | |
| | 1,272 | | Perficient, Inc.* | | | 83,723 | |
| | 17,100 | | Rackspace Technology, Inc.* | | | 34,200 | |
| | 29,372 | | Thoughtworks Holding, Inc.* | | | 141,279 | |
| | 660 | | Tucows, Inc., Class A* | | | 17,820 | |
| | 56,145 | | Unisys Corp.* | | | 315,535 | |
| | | | | | | | |
| | | | | | | 1,020,770 | |
| | | |
| |
| | Leisure Products – 0.5% | |
| | 1,034 | | Acushnet Holdings Corp. | | | 65,318 | |
| | 3,008 | | Clarus Corp. | | | 20,740 | |
| | 28,780 | | Funko, Inc., Class A* | | | 222,469 | |
| | 12,859 | | MasterCraft Boat Holdings, Inc.* | | | 291,128 | |
| | 931 | | Sturm Ruger & Co., Inc. | | | 42,314 | |
| | | | | | | | |
| | | | | | | 641,969 | |
| | | |
| |
| | Life Sciences Tools & Services – 0.5% | |
| | 5,505 | | Adaptive Biotechnologies Corp.* | | | 26,975 | |
| | 4,248 | | Mesa Laboratories, Inc. | | | 445,063 | |
| | 31,768 | | NanoString Technologies, Inc.* | | | 23,775 | |
| | 3,763 | | Quanterix Corp.* | | | 102,880 | |
| | | | | | | | |
| | | | | | | 598,693 | |
| | | |
| |
| | Machinery – 2.9% | |
| | 2,290 | | Chart Industries, Inc.* | | | 312,196 | |
| | 5,565 | | Douglas Dynamics, Inc. | | | 165,169 | |
| | 3,290 | | Federal Signal Corp. | | | 252,475 | |
| | 8,590 | | Franklin Electric Co., Inc. | | | 830,224 | |
| | 2,759 | | Gorman-Rupp Co. (The) | | | 98,027 | |
| | 502 | | John Bean Technologies Corp. | | | 49,924 | |
| | 530 | | Omega Flex, Inc. | | | 37,370 | |
| | 1,343 | | Proto Labs, Inc.* | | | 52,323 | |
| | 1,468 | | Standex International Corp. | | | 232,502 | |
| | 1,642 | | Terex Corp. | | | 94,349 | |
| | 20,909 | | Trinity Industries, Inc. | | | 555,970 | |
| | 24,298 | | Wabash National Corp. | | | 622,515 | |
| | 1,461 | | Watts Water Technologies, Inc., Class A | | | 304,385 | |
| | | | | | | | |
| | | | | | | 3,607,429 | |
| | | |
| |
| | Marine Transportation – 0.1% | |
| | 1,004 | | Costamare, Inc. (Monaco) | | | 10,451 | |
| | |
| 64 | | The accompanying notes are an integral part of these financial statements. |
GOLDMAN SACHS VARIABLE INSURANCE TRUST SMALL CAP EQUITY INSIGHTS FUND
| | | | | | | | |
| | | Shares | | Description | | Value | |
| |
| | Common Stocks – (continued) | |
| |
| | Marine Transportation – (continued) | |
| | 9,580 | | Golden Ocean Group Ltd. (Norway) | | $ | 93,501 | |
| | | | | | | | |
| | | | | | | 103,952 | |
| | | |
| |
| | Media – 0.6% | |
| | 3,233 | | AMC Networks, Inc., Class A* | | | 60,748 | |
| | 130 | | Daily Journal Corp.* | | | 44,307 | |
| | 11,975 | | EW Scripps Co. (The), Class A* | | | 95,680 | |
| | 17,648 | | Magnite, Inc.* | | | 164,832 | |
| | 708 | | TechTarget, Inc.* | | | 24,681 | |
| | 16,023 | | Thryv Holdings, Inc.* | | | 326,068 | |
| | 2,024 | | WideOpenWest, Inc.* | | | 8,197 | |
| | | | | | | | |
| | | | | | | 724,513 | |
| | | |
| |
| | Metals & Mining – 2.4% | |
| | 588 | | Alpha Metallurgical Resources, Inc. | | | 199,285 | |
| | 769 | | Arch Resources, Inc. | | | 127,608 | |
| | 19,029 | | ATI, Inc.* | | | 865,249 | |
| | 12,472 | | Carpenter Technology Corp. | | | 883,018 | |
| | 7,605 | | Coeur Mining, Inc.* | | | 24,792 | |
| | 8,192 | | Haynes International, Inc. | | | 467,353 | |
| | 2,514 | | Olympic Steel, Inc. | | | 167,684 | |
| | 4,731 | | Ryerson Holding Corp. | | | 164,071 | |
| | 7,955 | | SunCoke Energy, Inc. | | | 85,437 | |
| | | | | | | | |
| | | | | | | 2,984,497 | |
| | | |
| |
| | Mortgage Real Estate Investment Trusts (REITs) – 1.4% | |
| | 1,452 | | Angel Oak Mortgage REIT, Inc. REIT | | | 15,391 | |
| | 26,381 | | Arbor Realty Trust, Inc. REIT | | | 400,464 | |
| | 8,888 | | ARMOUR Residential REIT, Inc. REIT | | | 171,716 | |
| | 9,247 | | BrightSpire Capital, Inc. REIT | | | 68,798 | |
| | 27,262 | | Invesco Mortgage Capital, Inc. REIT | | | 241,541 | |
| | 14,456 | | Ladder Capital Corp. REIT | | | 166,389 | |
| | 9,925 | | PennyMac Mortgage Investment Trust REIT | | | 148,379 | |
| | 40,193 | | Two Harbors Investment Corp. REIT | | | 559,888 | |
| | | | | | | | |
| | | | | | | 1,772,566 | |
| | | |
| |
| | Multi-Utilities – 0.7% | |
| | 1,637 | | Avista Corp. | | | 58,506 | |
| | 14,443 | | Black Hills Corp. | | | 779,200 | |
| | | | | | | | |
| | | | | | | 837,706 | |
| | | |
| |
| | Office REITs – 0.2% | |
| | 13,519 | | Equity Commonwealth REIT | | | 259,565 | |
| | | |
| |
| | Oil, Gas & Consumable Fuels – 4.5% | |
| | 2,350 | | CONSOL Energy, Inc. | | | 236,246 | |
| | 1,317 | | CVR Energy, Inc. | | | 39,905 | |
| | 58,433 | | DHT Holdings, Inc. | | | 573,228 | |
| | 4,460 | | Encore Energy Corp. (Canada)* | | | 17,528 | |
| | 17,040 | | Equitrans Midstream Corp. | | | 173,467 | |
| | 3,055 | | Excelerate Energy, Inc., Class A | | | 47,230 | |
| | 18,957 | | Golar LNG Ltd. (Cameroon) | | | 435,821 | |
| | 9,480 | | International Seaways, Inc. | | | 431,150 | |
| | 52,455 | | Kosmos Energy Ltd. (Ghana)* | | | 351,973 | |
| | | | | | | | |
| | | Shares | | Description | | Value | |
| |
| | Common Stocks – (continued) | |
| |
| | Oil, Gas & Consumable Fuels – (continued) | |
| | 9,663 | | Magnolia Oil & Gas Corp., Class A | | $ | 205,725 | |
| | 1,613 | | Matador Resources Co. | | | 91,715 | |
| | 2,545 | | Murphy Oil Corp. | | | 108,570 | |
| | 153,773 | | Nordic American Tankers Ltd. | | | 645,847 | |
| | 4,523 | | PBF Energy, Inc., Class A | | | 198,831 | |
| | 8,517 | | Peabody Energy Corp. | | | 207,134 | |
| | 12,078 | | Scorpio Tankers, Inc. (Monaco) | | | 734,342 | |
| | 45,051 | | Teekay Corp. (Bermuda)* | | | 322,115 | |
| | 14,220 | | Teekay Tankers Ltd., Class A (Canada) | | | 710,573 | |
| | | | | | | | |
| | | | | | | 5,531,400 | |
| | | |
| |
| | Passenger Airlines – 0.1% | |
| | 3,339 | | SkyWest, Inc.* | | | 174,296 | |
| | | |
| |
| | Personal Care Products – 1.4% | |
| | 6,274 | | elf Beauty, Inc.* | | | 905,589 | |
| | 42,093 | | Herbalife Ltd.* | | | 642,339 | |
| | 1,221 | | Inter Parfums, Inc. | | | 175,837 | |
| | | | | | | | |
| | | | | | | 1,723,765 | |
| | | |
| |
| | Pharmaceuticals – 1.1% | |
| | 1,653 | | Amylyx Pharmaceuticals, Inc.* | | | 24,332 | |
| | 16,366 | | Assertio Holdings, Inc.* | | | 17,512 | |
| | 102 | | Axsome Therapeutics, Inc.* | | | 8,118 | |
| | 6,737 | | Intra-Cellular Therapies, Inc.* | | | 482,504 | |
| | 19,359 | | Phibro Animal Health Corp., Class A | | | 224,177 | |
| | 9,656 | | Prestige Consumer Healthcare, Inc.* | | | 591,140 | |
| | | | | | | | |
| | | | | | | 1,347,783 | |
| | | |
| |
| | Professional Services – 3.6% | |
| | 102,733 | | Alight, Inc., Class A* | | | 876,313 | |
| | 7,122 | | Asure Software, Inc.* | | | 67,801 | |
| | 13,300 | | CBIZ, Inc.* | | | 832,447 | |
| | 28,894 | | ExlService Holdings, Inc.* | | | 891,380 | |
| | 624 | | Exponent, Inc. | | | 54,937 | |
| | 4,776 | | Franklin Covey Co.* | | | 207,899 | |
| | 3,837 | | IBEX Holdings Ltd.* | | | 72,941 | |
| | 12,647 | | Parsons Corp.* | | | 793,093 | |
| | 46,855 | | Upwork, Inc.* | | | 696,734 | |
| | | | | | | | |
| | | | | | | 4,493,545 | |
| | | |
| |
| | Real Estate Management & Development – 0.6% | |
| | 14,490 | | Compass, Inc., Class A* | | | 54,482 | |
| | 26,984 | | Douglas Elliman, Inc. | | | 79,603 | |
| | 9,786 | | Forestar Group, Inc.* | | | 323,623 | |
| | 4,582 | | Newmark Group, Inc., Class A | | | 50,219 | |
| | 20,886 | | Redfin Corp.* | | | 215,543 | |
| | | | | | | | |
| | | | | | | 723,470 | |
| | | |
| |
| | Residential REITs – 0.8% | |
| | 3,202 | | Centerspace REIT | | | 186,356 | |
| | 17,245 | | NexPoint Residential Trust, Inc. REIT | | | 593,745 | |
| | 5,713 | | UMH Properties, Inc. REIT | | | 87,523 | |
| | | | | | | | |
| | | | | 867,624 | |
| | | |
| | |
| The accompanying notes are an integral part of these financial statements. | | 65 |
GOLDMAN SACHS VARIABLE INSURANCE TRUST SMALL CAP EQUITY INSIGHTS FUND
|
Schedule of Investments (continued) December 31, 2023 |
| | | | | | | | |
| | | Shares | | Description | | Value | |
| |
| | Common Stocks – (continued) | |
| |
| | Retail REITs – 1.2% | |
| | 941 | | Alexander’s, Inc. REIT | | $ | 200,969 | |
| | 24,102 | | Kite Realty Group Trust REIT | | | 550,972 | |
| | 5,516 | | Macerich Co. (The) REIT | | | 85,112 | |
| | 22,670 | | NETSTREIT Corp. REIT | | | 404,660 | |
| | 2,910 | | Tanger, Inc. REIT | | | 80,665 | |
| | 4,956 | | Urban Edge Properties REIT | | | 90,695 | |
| | | | | | | | |
| | | | | | | 1,413,073 | |
| | | |
| |
| | Semiconductors & Semiconductor Equipment – 1.8% | |
| | 1,389 | | ACM Research, Inc., Class A* | | | 27,141 | |
| | 626 | | Amkor Technology, Inc. | | | 20,827 | |
| | 5,463 | | Axcelis Technologies, Inc.* | | | 708,496 | |
| | 3,366 | | Cohu, Inc.* | | | 119,123 | |
| | 5,871 | | FormFactor, Inc.* | | | 244,879 | |
| | 6,037 | | Ichor Holdings Ltd.* | | | 203,024 | |
| | 745 | | Onto Innovation, Inc.* | | | 113,911 | |
| | 4,989 | | PDF Solutions, Inc.* | | | 160,346 | |
| | 1,226 | | Photronics, Inc.* | | | 38,460 | |
| | 4,799 | | Rambus, Inc.* | | | 327,532 | |
| | 1,390 | | SiTime Corp.* | | | 169,691 | |
| | 307 | | Synaptics, Inc.* | | | 35,023 | |
| | | | | | | | |
| | | | | | | 2,168,453 | |
| | | |
| |
| | Software – 6.8% | |
| | 3,674 | | A10 Networks, Inc. | | | 48,387 | |
| | 5,859 | | ACI Worldwide, Inc.* | | | 179,285 | |
| | 6,579 | | Alarm.com Holdings, Inc.* | | | 425,135 | |
| | 5,293 | | Amplitude, Inc., Class A* | | | 67,327 | |
| | 2,877 | | Appfolio, Inc., Class A* | | | 498,411 | |
| | 6,119 | | Asana, Inc., Class A* | | | 116,322 | |
| | 5,748 | | Braze, Inc., Class A* | | | 305,391 | |
| | 1,077 | | C3.ai, Inc., Class A*(a) | | | 30,921 | |
| | 13,579 | | Cleanspark, Inc.* | | | 149,776 | |
| | 36,151 | | Clear Secure, Inc., Class A | | | 746,518 | |
| | 6,600 | | Everbridge, Inc.* | | | 160,446 | |
| | 4,316 | | Expensify, Inc., Class A* | | | 10,661 | |
| | 5,735 | | Instructure Holdings, Inc.* | | | 154,902 | |
| | 4,782 | | Intapp, Inc.* | | | 181,812 | |
| | 4,758 | | LiveRamp Holdings, Inc.* | | | 180,233 | |
| | 4,473 | | Marathon Digital Holdings, Inc.*(a) | | | 105,071 | |
| | 655 | | MicroStrategy, Inc., Class A* | | | 413,711 | |
| | 11,033 | | Q2 Holdings, Inc.* | | | 478,943 | |
| | 4,878 | | Qualys, Inc.* | | | 957,454 | |
| | 2,301 | | Rapid7, Inc.* | | | 131,387 | |
| | 4,505 | | Red Violet, Inc.* | | | 89,965 | |
| | 12,500 | | Riot Platforms, Inc.* | | | 193,375 | |
| | 4,865 | | Sapiens International Corp. NV (Israel) | | | 140,793 | |
| | 19,513 | | SolarWinds Corp.* | | | 243,717 | |
| | 3,435 | | SPS Commerce, Inc.* | | | 665,840 | |
| | 12,232 | | Tenable Holdings, Inc.* | | | 563,406 | |
| | 20,553 | | Varonis Systems, Inc.* | | | 930,640 | |
| | 2,110 | | Weave Communications, Inc.* | | | 24,202 | |
| | 15,346 | | Yext, Inc.* | | | 90,388 | |
| | 5,718 | | Zeta Global Holdings Corp., Class A* | | | 50,433 | |
| | 9,029 | | Zuora, Inc., Class A* | | | 84,873 | |
| | | | | | | | |
| | | | | | | 8,419,725 | |
| | | |
| | | | | | | | |
| | | Shares | | Description | | Value | |
| |
| | Common Stocks – (continued) | |
| |
| | Specialized REITs – 0.3% | |
| | 10,281 | | Four Corners Property Trust, Inc. REIT | | $ | 260,109 | |
| | 23,161 | | Uniti Group, Inc. REIT | | | 133,871 | |
| | | | | | | | |
| | | | | | | 393,980 | |
| | | |
| |
| | Specialty Retail – 3.0% | |
| | 2,901 | | Aaron’s Co., Inc. (The) | | | 31,563 | |
| | 2,193 | | Abercrombie & Fitch Co., Class A* | | | 193,466 | |
| | 15,548 | | Academy Sports & Outdoors, Inc. | | | 1,026,168 | |
| | 6,659 | | American Eagle Outfitters, Inc. | | | 140,904 | |
| | 750 | | Boot Barn Holdings, Inc.* | | | 57,570 | |
| | 31,660 | | CarParts.com, Inc.* | | | 100,046 | |
| | 5,888 | | Carvana Co.* | | | 311,711 | |
| | 4,051 | | Cato Corp. (The), Class A | | | 28,924 | |
| | 18,111 | | Foot Locker, Inc. | | | 564,158 | |
| | 674 | | Group 1 Automotive, Inc. | | | 205,395 | |
| | 989 | | Haverty Furniture Cos., Inc. | | | 35,110 | |
| | 1,798 | | Sleep Number Corp.* | | | 26,664 | |
| | 1,676 | | Tilly’s, Inc., Class A* | | | 12,637 | |
| | 16,425 | | Urban Outfitters, Inc.* | | | 586,208 | |
| | 8,226 | | Warby Parker, Inc., Class A* | | | 115,987 | |
| | 143 | | Winmark Corp. | | | 59,710 | |
| | 7,321 | | Zumiez, Inc.* | | | 148,909 | |
| | | | | | | | |
| | | | | | | 3,645,130 | |
| | | |
| |
| | Technology Hardware, Storage & Peripherals – 1.6% | |
| | 14,852 | | Eastman Kodak Co.* | | | 57,923 | |
| | 4,612 | | Super Micro Computer, Inc.* | | | 1,311,007 | |
| | 35,114 | | Xerox Holdings Corp. | | | 643,640 | |
| | | | | | | | |
| | | | | | | 2,012,570 | |
| | | |
| |
| | Textiles, Apparel & Luxury Goods – 0.5% | |
| | 6,639 | | Oxford Industries, Inc. | | | 663,900 | |
| | | |
| |
| | Trading Companies & Distributors – 1.2% | |
| | 2,345 | | H&E Equipment Services, Inc. | | | 122,690 | |
| | 668 | | Herc Holdings, Inc. | | | 99,459 | |
| | 742 | | McGrath RentCorp | | | 88,758 | |
| | 26,298 | | MRC Global, Inc.* | | | 289,541 | |
| | 28,760 | | NOW, Inc.* | | | 325,563 | |
| | 9,714 | | Rush Enterprises, Inc., Class A | | | 488,614 | |
| | | | | | | | |
| | | | | | | 1,414,625 | |
| | | |
| |
| | Water Utilities – 0.0% | |
| | 535 | | York Water Co. (The) | | | 20,662 | |
| | | |
| |
| | Wireless Telecommunication Services – 0.1% | |
| | 3,458 | | Telephone and Data Systems, Inc. | | | 63,454 | |
| | | |
| | TOTAL COMMON STOCKS (Cost $103,338,825) | | | 119,769,218 | |
| | | |
| | |
| 66 | | The accompanying notes are an integral part of these financial statements. |
GOLDMAN SACHS VARIABLE INSURANCE TRUST SMALL CAP EQUITY INSIGHTS FUND
| | | | | | | | | | | | | | | | |
| | | Shares | | | Dividend Rate | | Value | |
| |
| | Investment Company – 1.7%(c) | |
| |
| | Goldman Sachs Financial Square Government Fund - Institutional Shares | |
| | | | | | 2,158,240 | | | 5.248% | | $ | 2,158,240 | |
| | (Cost $2,158,240) | |
| | | |
| | TOTAL INVESTMENTS BEFORE SECURITIES LENDING REINVESTMENT VEHICLE (Cost $105,497,065) | | | 121,927,458 | |
| | | |
| | | | | | | | | | | | | | | | |
| |
| | Securities Lending Reinvestment Vehicle – 0.6%(c) | |
| |
| | Goldman Sachs Financial Square Government Fund – Institutional Shares | |
| | | | | | 802,485 | | | 5.248% | | | 802,485 | |
| | (Cost $802,485) | |
| | | |
| | TOTAL INVESTMENTS – 99.3% (Cost $106,299,550) | | $ | 122,729,943 | |
| | | |
| | OTHER ASSETS IN EXCESS OF
LIABILITIES – 0.7% | | | 906,058 | |
| | | |
| | NET ASSETS – 100.0% | | $ | 123,636,001 | |
| | | |
| | |
| The percentage shown for each investment category reflects the value of investments in that category as a percentage of net assets. |
| | |
| |
| * | | Non-income producing security. |
| (a) | | All or a portion of security is on loan. |
| (b) | | All or portion of security is pledged as collateral for futures contracts. Total market value of securities pledged as collateral on futures contracts amounts to $210,793, which represents approximately 0.2% of net assets as of December 31, 2023. |
| (c) | | Represents an affiliated issuer. |
| | |
|
|
| Investment Abbreviations: |
| PLC | | —Public Limited Company |
| REIT | | —Real Estate Investment Trust |
|
|
|
|
ADDITIONAL INVESTMENT INFORMATION |
FUTURES CONTRACTS — At December 31, 2023, the Fund had the following futures contracts:
| | | | | | | | | | | | |
| Description | | Number of
Contracts | | Expiration
Date | | Notional
Amount | | | Unrealized
Appreciation/
(Depreciation) | |
| |
| | | | |
Long position contracts: | | | | | | | | | | | | |
Russell 2000 E-Mini Index | | 19 | | 03/15/24 | | $ | 1,945,315 | | | $ | 138,085 | |
|
| |
| | |
| The accompanying notes are an integral part of these financial statements. | | 67 |
GOLDMAN SACHS VARIABLE INSURANCE TRUST STRATEGIC GROWTH FUND
|
Schedule of Investments December 31, 2023 |
| | | | | | | | |
| | | Shares | | Description | | Value | |
| | |
| | Common Stocks – 99.0% | | | | |
| | |
| | Automobile Components – 0.2% | | | | |
| | 8,197 | | Aptiv PLC* | | $ | 735,435 | |
| | | |
| | |
| | Automobiles – 2.1% | | | | |
| | 30,519 | | Tesla, Inc.* | | | 7,583,361 | |
| | | |
| | |
| | Beverages – 0.3% | | | | |
| | 21,135 | | Coca-Cola Co. (The) | | | 1,245,486 | |
| | | |
| | |
| | Biotechnology – 2.9% | | | | |
| | 10,640 | | Alnylam Pharmaceuticals, Inc.* | | | 2,036,602 | |
| | 5,005 | | Argenx SE ADR (Netherlands)* | | | 1,904,052 | |
| | 11,252 | | Biogen, Inc.* | | | 2,911,680 | |
| | 22,630 | | Exact Sciences Corp.* | | | 1,674,168 | |
| | 6,655 | | Karuna Therapeutics, Inc.* | | | 2,106,374 | |
| | | | | | | | |
| | | | | | | 10,632,876 | |
| | | |
| | |
| | Broadline Retail – 6.5% | | | | |
| | 158,325 | | Amazon.com, Inc.* | | | 24,055,901 | |
| | | |
| | |
| | Capital Markets – 2.0% | | | | |
| | 54,216 | | Charles Schwab Corp. (The) | | | 3,730,061 | |
| | 6,495 | | MSCI, Inc. | | | 3,673,897 | |
| | | | | | | | |
| | | | | | | 7,403,958 | |
| | | |
| | |
| | Chemicals – 2.5% | | | | |
| | 9,719 | | Linde PLC | | | 3,991,691 | |
| | 16,589 | | Sherwin-Williams Co. (The) | | | 5,174,109 | |
| | | | | | | | |
| | | | | | | 9,165,800 | |
| | | |
| | |
| | Commercial Services & Supplies – 1.0% | | | | |
| | 23,994 | | Waste Connections, Inc. | | | 3,581,584 | |
| | | |
| | |
| | Construction Materials – 0.6% | | | | |
| | 4,431 | | Martin Marietta Materials, Inc. | | | 2,210,670 | |
| | | |
| | |
| | Electrical Equipment – 0.8% | | | | |
| | 10,105 | | Rockwell Automation, Inc. | | | 3,137,400 | |
| | | |
| | |
| | Financial Services – 4.4% | | | | |
| | 27,340 | | Mastercard, Inc., Class A | | | 11,660,783 | |
| | 16,335 | | Visa, Inc., Class A | | | 4,252,817 | |
| | | | | | | | |
| | | | | | | 15,913,600 | |
| | | |
| | |
| | Food Products – 1.0% | | | | |
| | 45,416 | | McCormick & Co., Inc. | | | 3,107,363 | |
| | 8,221 | | Mondelez International, Inc., Class A | | | 595,447 | |
| | | | | | | 3,702,810 | |
| | | |
| | |
| | Ground Transportation – 0.9% | | | | |
| | 8,311 | | Old Dominion Freight Line, Inc. | | | 3,368,698 | |
| | | |
| | |
| | Health Care Equipment & Supplies – 2.8% | | | | |
| | 56,269 | | Boston Scientific Corp.* | | | 3,252,911 | |
| | 15,091 | | Insulet Corp.* | | | 3,274,445 | |
| | 10,658 | | Intuitive Surgical, Inc.* | | | 3,595,583 | |
| | | | | | | | |
| | | | | | | 10,122,939 | |
| | | |
| | |
| | Health Care Providers & Services – 0.3% | | | | |
| | 2,212 | | Humana, Inc. | | | 1,012,676 | |
| | | |
| | |
| | Hotels, Restaurants & Leisure – 1.5% | | | | |
| | 725 | | Chipotle Mexican Grill, Inc.* | | | 1,658,046 | |
| | 12,610 | | McDonald’s Corp. | | | 3,738,991 | |
| | | | | | | | |
| | | | | | | 5,397,037 | |
| | �� | |
| | | | | | | | |
| | | Shares | | Description | | Value | |
| | |
| | Common Stocks – (continued) | | | | |
| | |
| | Household Products – 0.5% | | | | |
| | 12,099 | | Procter & Gamble Co. (The) | | $ | 1,772,987 | |
| | | |
| | |
| | Interactive Media & Services – 8.6% | | | | |
| | 113,382 | | Alphabet, Inc., Class A* | | | 15,838,332 | |
| | 70,366 | | Alphabet, Inc., Class C* | | | 9,916,680 | |
| | 6,955 | | Meta Platforms, Inc., Class A* | | | 2,461,792 | |
| | 193,458 | | Snap, Inc., Class A* | | | 3,275,244 | |
| | | | | | | | |
| | | | | | | 31,492,048 | |
| | | |
| | |
| | IT Services – 2.6% | | | | |
| | 17,784 | | Accenture PLC, Class A | | | 6,240,584 | |
| | 16,760 | | Snowflake, Inc., Class A* | | | 3,335,240 | |
| | | | | | | | |
| | | | | | | 9,575,824 | |
| | | |
| | |
| | Life Sciences Tools & Services – 0.7% | | | | |
| | 7,066 | | Illumina, Inc.* | | | 983,870 | |
| | 4,205 | | West Pharmaceutical Services, Inc. | | | 1,480,664 | |
| | | | | | | | |
| | | | | | | 2,464,534 | |
| | | |
| | |
| | Machinery – 1.1% | | | | |
| | 13,435 | | Caterpillar, Inc. | | | 3,972,326 | |
| | | |
| | |
| | Metals & Mining – 0.3% | | | | |
| | 28,852 | | Freeport-McMoRan, Inc. | | | 1,228,230 | |
| | | |
| | |
| | Oil, Gas & Consumable Fuels – 0.6% | | | | |
| | 13,735 | | Cheniere Energy, Inc. | | | 2,344,702 | |
| | | |
| | |
| | Personal Care Products – 0.8% | | | | |
| | 20,488 | | Estee Lauder Cos., Inc. (The), Class A | | | 2,996,370 | |
| | | |
| | |
| | Pharmaceuticals – 3.9% | | | | |
| | 50,799 | | AstraZeneca PLC ADR (United Kingdom) | | | 3,421,313 | |
| | 18,442 | | Eli Lilly & Co. | | | 10,750,210 | |
| | | | | | | | |
| | | | | | | 14,171,523 | |
| | | |
| | |
| | Professional Services – 0.8% | | | | |
| | 11,979 | | Equifax, Inc. | | | 2,962,287 | |
| | | |
| | |
| | Real Estate Management & Development – 0.7% | | | | |
| | 30,570 | | CoStar Group, Inc.* | | | 2,671,512 | |
| | | |
| | |
| | Semiconductors & Semiconductor Equipment – 11.1% | | | | |
| | 46,548 | | Advanced Micro Devices, Inc.* | | | 6,861,641 | |
| | 32,923 | | ARM Holdings PLC ADR*(a) | | | 2,473,999 | |
| | 12,204 | | Enphase Energy, Inc.* | | | 1,612,636 | |
| | 3,167 | | KLA Corp. | | | 1,840,977 | |
| | 106,919 | | Marvell Technology, Inc. | | | 6,448,285 | |
| | 34,083 | | NVIDIA Corp. | | | 16,878,583 | |
| | 26,259 | | Texas Instruments, Inc. | | | 4,476,109 | |
| | | | | | | | |
| | | | | | | 40,592,230 | |
| | | |
| | |
| | Software – 18.1% | | | | |
| | 2,052 | | Adobe, Inc.* | | | 1,224,223 | |
| | 1,117 | | Fair Isaac Corp.* | | | 1,300,199 | |
| | 10,921 | | Intuit, Inc. | | | 6,825,953 | |
| | 119,967 | | Microsoft Corp. | | | 45,112,391 | |
| | 38,391 | | Oracle Corp. | | | 4,047,563 | |
| | 18,354 | | Salesforce, Inc.* | | | 4,829,671 | |
| | 1,206 | | ServiceNow, Inc.* | | | 852,027 | |
| | |
| 68 | | The accompanying notes are an integral part of these financial statements. |
GOLDMAN SACHS VARIABLE INSURANCE TRUST STRATEGIC GROWTH FUND
| | | | | | | | |
| | | Shares | | Description | | Value | |
| |
| | Common Stocks – (continued) | |
| | | Software – (continued) | |
| | 7,603 | | Workday, Inc., Class A* | | $ | 2,098,884 | |
| | | | | | | | |
| | | | | | | 66,290,911 | |
| | | |
| | |
| | Specialized REITs – 1.6% | | | | |
| | 15,330 | | American Tower Corp. REIT | | | 3,309,441 | |
| | 3,329 | | Equinix, Inc. REIT | | | 2,681,143 | |
| | | | | | | | |
| | | | | | | 5,990,584 | |
| | | |
| | |
| | Specialty Retail – 3.0% | | | | |
| | 20,021 | | Lowe’s Cos., Inc. | | | 4,455,673 | |
| | 4,170 | | RH* | | | 1,215,472 | |
| | 38,635 | | Ross Stores, Inc. | | | 5,346,698 | |
| | | | | | | | |
| | | | | | | 11,017,843 | |
| | | |
| | |
| | Technology Hardware, Storage & Peripherals – 12.3% | | | | |
| | 234,252 | | Apple, Inc. | | | 45,100,538 | |
| | | |
| | |
| | Textiles, Apparel & Luxury Goods – 2.5% | | | | |
| | 8,825 | | Lululemon Athletica, Inc.* | | | 4,512,134 | |
| | 43,452 | | NIKE, Inc., Class B | | | 4,717,584 | |
| | | | | | | | |
| | | | | | | 9,229,718 | |
| | | |
| | |
| | TOTAL COMMON STOCKS (Cost $170,237,363) | | | 363,144,398 | |
| | | |
| | | |
| | | Shares | | Dividend Rate | | Value | |
| | |
| | Investment Company – 1.0%(b) | | | | |
| | Goldman Sachs Financial Square Government Fund - Institutional Shares | | | | |
| | 3,762,689 | | 5.248% | | | 3,762,689 | |
| | |
| | (Cost $3,762,689) | | | | |
| | | |
| | |
| | TOTAL INVESTMENTS BEFORE SECURITIES LENDING REINVESTMENT VEHICLE (Cost $174,000,052) | | | 366,907,087 | |
| | | |
| | | | | | | | |
| |
| | Securities Lending Reinvestment Vehicle – 0.7%(b) | |
| | Goldman Sachs Financial Square Government Fund – Institutional Shares | | | | |
| | 2,531,958 | | 5.248% | | | 2,531,958 | |
| | |
| | (Cost $2,531,958) | | | | |
| | | |
| | |
| | TOTAL INVESTMENTS – 100.7% (Cost $176,532,010) | | $ | 369,439,045 | |
| | | |
| | |
| | LIABILITIES IN EXCESS OF OTHER
ASSETS – (0.7)% | | | (2,688,035) | |
| | | |
| | |
| | NET ASSETS – 100.0% | | $ | 366,751,010 | |
| | | |
| | |
| The percentage shown for each investment category reflects the value of investments in that category as a percentage of net assets. |
| |
| * | | Non-income producing security. |
| (a) | | All or a portion of security is on loan. |
| (b) | | Represents an affiliated issuer. |
| | |
|
|
| Investment Abbreviations: |
| ADR | | —American Depositary Receipt |
| PLC | | —Public Limited Company |
| REIT | | —Real Estate Investment Trust |
|
|
| | |
| The accompanying notes are an integral part of these financial statements. | | 69 |
GOLDMAN SACHS VARIABLE INSURANCE TRUST U.S . EQUITY INSIGHTS FUND
|
Schedule of Investments December 31, 2023 |
| | | | | | | | |
| | | Shares | | Description | | Value | |
| |
| | Common Stocks – 99.3% | |
| |
| | Aerospace & Defense – 2.3% | |
| | 8,912 | | Lockheed Martin Corp. | | $ | 4,039,275 | |
| | 7,446 | | Northrop Grumman Corp. | | | 3,485,770 | |
| | | | | | | | |
| | | | | | | 7,525,045 | |
| | | |
| |
| | Air Freight & Logistics – 1.1% | |
| | 4,932 | | C.H. Robinson Worldwide, Inc. | | | 426,075 | |
| | 19,390 | | United Parcel Service, Inc., Class B | | | 3,048,690 | |
| | | | | | | | |
| | | | | | | 3,474,765 | |
| | | |
| |
| | Automobile Components – 1.1% | |
| | 5,629 | | Aptiv PLC* | | | 505,034 | |
| | 19,815 | | Lear Corp. | | | 2,798,076 | |
| | | | | | | | |
| | | | | | | 3,303,110 | |
| | | |
| |
| | Automobiles – 1.7% | |
| | 21,644 | | Tesla, Inc.* | | | 5,378,101 | |
| | | |
| |
| | Banks – 1.8% | |
| | 98,781 | | Bank of America Corp. | | | 3,325,956 | |
| | 9,424 | | Cullen/Frost Bankers, Inc. | | | 1,022,410 | |
| | 287 | | First Citizens BancShares, Inc., | | | | |
| | | | Class A | | | 407,244 | |
| | 5,128 | | JPMorgan Chase & Co. | | | 872,273 | |
| | 2,056 | | Prosperity Bancshares, Inc. | | | 139,253 | |
| | | | | | | | |
| | | | | | | 5,767,136 | |
| | | |
| |
| | Beverages – 0.4% | |
| | 20,521 | | Monster Beverage Corp.* | | | 1,182,215 | |
| | | |
| |
| | Biotechnology – 2.4% | |
| | 31,295 | | AbbVie, Inc. | | | 4,849,786 | |
| | 8,254 | | Moderna, Inc.* | | | 820,860 | |
| | 2,041 | | Neurocrine Biosciences, Inc.* | | | 268,922 | |
| | 4,668 | | Vertex Pharmaceuticals, Inc.* | | | 1,899,363 | |
| | | | | | | | |
| | | | | | | 7,838,931 | |
| | | |
| |
| | Broadline Retail – 3.9% | |
| | 83,511 | | Amazon.com, Inc.* | | | 12,688,661 | |
| | | |
| |
| | Building Products – 0.1% | |
| | 840 | | Lennox International, Inc. | | | 375,917 | |
| | | |
| |
| | Capital Markets – 2.7% | |
| | 13,371 | | CME Group, Inc. | | | 2,815,933 | |
| | 4,217 | | Coinbase Global, Inc., Class A* | | | 733,421 | |
| | 18,065 | | Interactive Brokers Group, Inc., | | | | |
| | | | Class A | | | 1,497,588 | |
| | 43,196 | | Northern Trust Corp. | | | 3,644,878 | |
| | | | | | | | |
| | | | | | | 8,691,820 | |
| | | |
| |
| | Chemicals – 2.4% | |
| | 6,404 | | Linde PLC | | | 2,630,187 | |
| | 8,312 | | PPG Industries, Inc. | | | 1,243,060 | |
| | 6,314 | | RPM International, Inc. | | | 704,832 | |
| | 10,416 | | Sherwin-Williams Co. (The) | | | 3,248,750 | |
| | | | | | | | |
| | | | | | | 7,826,829 | |
| | | |
| |
| | Communications Equipment – 2.0% | |
| | 8,735 | | Arista Networks, Inc.* | | | 2,057,180 | |
| | 38,701 | | Cisco Systems, Inc. | | | 1,955,175 | |
| | 7,469 | | Motorola Solutions, Inc. | | | 2,338,469 | |
| | | | | | | | |
| | | | | | | 6,350,824 | |
| | | |
| | | | | | | | |
| | | Shares | | Description | | Value | |
| |
| | Common Stocks – (continued) | |
| |
| | Construction Materials – 0.8% | |
| | 1,582 | | Martin Marietta Materials, Inc. | | $ | 789,276 | |
| | 8,704 | | Vulcan Materials Co. | | | 1,975,895 | |
| | | | | | | | |
| | | | | | | 2,765,171 | |
| | | |
| |
| | Consumer Finance – 1.4% | |
| | 29,414 | | Capital One Financial Corp. | | | 3,856,764 | |
| | 16,598 | | Synchrony Financial | | | 633,877 | |
| | | | | | | | |
| | | | | | | 4,490,641 | |
| | | |
| |
| | Consumer Staples Distribution & Retail – 1.4% | |
| | 7,058 | | Costco Wholesale Corp. | | | 4,658,845 | |
| | | |
| |
| | Distributors – 0.6% | |
| | 43,816 | | LKQ Corp. | | | 2,093,967 | |
| | | |
| |
| | Electric Utilities – 0.4% | |
| | 36,235 | | Exelon Corp. | | | 1,300,837 | |
| | | |
| |
| | Electrical Equipment – 1.6% | |
| | 22,828 | | AMETEK, Inc. | | | 3,764,109 | |
| | 21,680 | | nVent Electric PLC | | | 1,281,071 | |
| | | | | | | | |
| | | | | | | 5,045,180 | |
| | | |
| |
| | Energy Equipment & Services – 0.2% | |
| | 24,039 | | Baker Hughes Co. | | | 821,653 | |
| | | |
| |
| | Entertainment – 1.1% | |
| | 3,144 | | Electronic Arts, Inc. | | | 430,130 | |
| | 6,336 | | Netflix, Inc.* | | | 3,084,872 | |
| | | | | | | | |
| | | | | | | 3,515,002 | |
| | | |
| |
| | Financial Services – 4.9% | |
| | 24,196 | | Berkshire Hathaway, Inc., Class B* | | | 8,629,745 | |
| | 13,801 | | Equitable Holdings, Inc. | | | 459,573 | |
| | 26,286 | | Visa, Inc., Class A | | | 6,843,560 | |
| | | | | | | | |
| | | | | | | 15,932,878 | |
| | | |
| |
| | Food Products – 1.1% | |
| | 52,783 | | General Mills, Inc. | | | 3,438,285 | |
| | | |
| |
| | Health Care Equipment & Supplies – 0.5% | |
| | 26,403 | | Boston Scientific Corp.* | | | 1,526,357 | |
| | | |
| |
| | Health Care Providers & Services – 3.8% | |
| | 30,154 | | Centene Corp.* | | | 2,237,728 | |
| | 9,216 | | Elevance Health, Inc. | | | 4,345,897 | |
| | 11,772 | | Encompass Health Corp. | | | 785,428 | |
| | 7,444 | | UnitedHealth Group, Inc. | | | 3,919,043 | |
| | 7,349 | | Universal Health Services, Inc., | | | | |
| | | | Class B | | | 1,120,281 | |
| | | | | | | | |
| | | | | | | 12,408,377 | |
| | | |
| |
| | Health Care REITs – 0.2% | |
| | 5,416 | | Welltower, Inc. REIT | | | 488,361 | |
| | | |
| |
| | Health Care Technology – 0.4% | |
| | 6,946 | | Veeva Systems, Inc., Class A* | | | 1,337,244 | |
| | | |
| |
| | Hotel & Resort REITs – 1.6% | |
| | 194,943 | | Host Hotels & Resorts, Inc. | | | | |
| | | | REIT | | | 3,795,540 | |
| | 82,557 | | Park Hotels & Resorts, Inc. REIT | | | 1,263,122 | |
| | | | | | | | |
| | | | | | | 5,058,662 | |
| | | |
| | |
| 70 | | The accompanying notes are an integral part of these financial statements. |
GOLDMAN SACHS VARIABLE INSURANCE TRUST U.S. EQUITY INSIGHTS FUND
| | | | | | | | |
| | | Shares | | Description | | Value | |
| |
| | Common Stocks – (continued) | |
| |
| | Hotels, Restaurants & Leisure – 3.1% | |
| | 12,234 | | Airbnb, Inc., Class A* | | $ | 1,665,537 | |
| | 1,580 | | Chipotle Mexican Grill, Inc.* | | | 3,613,397 | |
| | 61,782 | | Las Vegas Sands Corp. | | | 3,040,292 | |
| | 18,061 | | Wynn Resorts Ltd. | | | 1,645,537 | |
| | | | | | | | |
| | | | | | | 9,964,763 | |
| | | |
| |
| | Household Durables – 1.1% | |
| | 22,566 | | D.R. Horton, Inc. | | | 3,429,581 | |
| | 1,328 | | PulteGroup, Inc. | | | 137,076 | |
| | | | | | | | |
| | | | | | | 3,566,657 | |
| | | |
| |
| | Household Products – 1.1% | |
| | 28,110 | | Kimberly-Clark Corp. | | | 3,415,646 | |
| | | |
| |
| | Industrial REITs – 0.3% | |
| | 18,575 | | Rexford Industrial Realty, Inc. | | | | |
| | | | REIT | | | 1,042,057 | |
| | | |
| |
| | Insurance – 2.2% | |
| | 2,490 | | Kinsale Capital Group, Inc. | | | 833,926 | |
| | 5,617 | | Principal Financial Group, Inc. | | | 441,890 | |
| | 25,462 | | Progressive Corp. (The) | | | 4,055,587 | |
| | 10,072 | | Travelers Cos., Inc. (The) | | | 1,918,615 | |
| | | | | | | | |
| | | | | | | 7,250,018 | |
| | | |
| |
| | Interactive Media & Services – 7.9% | |
| | 44,273 | | Alphabet, Inc., Class A* | | | 6,184,495 | |
| | 70,087 | | Alphabet, Inc., Class C* | | | 9,877,361 | |
| | 27,153 | | Meta Platforms, Inc., Class A* | | | 9,611,076 | |
| | | | | | | | |
| | | | | | | 25,672,932 | |
| | | |
| |
| | IT Services – 1.3% | |
| | 23,680 | | International Business Machines | | | | |
| | | | Corp. | | | 3,872,864 | |
| | 1,950 | | VeriSign, Inc.* | | | 401,622 | |
| | | | | | | | |
| | | | | | | 4,274,486 | |
| | | |
| |
| | Life Sciences Tools & Services – 1.2% | |
| | 4,764 | | Agilent Technologies, Inc. | | | 662,339 | |
| | 4,978 | | Bruker Corp. | | | 365,783 | |
| | 2,324 | | Mettler-Toledo International, | | | | |
| | | | Inc.* | | | 2,818,919 | |
| | | | | | | | |
| | | | | | | 3,847,041 | |
| | | |
| |
| | Machinery – 0.5% | |
| | 2,174 | | PACCAR, Inc. | | | 212,291 | |
| | 3,360 | | Parker-Hannifin Corp. | | | 1,547,952 | |
| | | | | | | | |
| | | | | | | 1,760,243 | |
| | | |
| |
| | Media – 0.2% | |
| | 524 | | Cable One, Inc. | | | 291,653 | |
| | 27,191 | | Paramount Global, Class B | | | 402,155 | |
| | | | | | | | |
| | | | | | | 693,808 | |
| | | |
| |
| | Oil, Gas & Consumable Fuels – 2.1% | |
| | 4,554 | | Antero Midstream Corp. | | | 57,062 | |
| | 44,246 | | Antero Resources Corp.* | | | 1,003,499 | |
| | 18,862 | | Cheniere Energy, Inc. | | | 3,219,932 | |
| | 6,106 | | ConocoPhillips | | | 708,723 | |
| | 449 | | Exxon Mobil Corp. | | | 44,891 | |
| | 103,484 | | Kinder Morgan, Inc. | | | 1,825,458 | |
| | | | | | | | |
| | | | | | | 6,859,565 | |
| | | |
| | | | | | | | |
| | | Shares | | Description | | Value | |
| |
| | Common Stocks – (continued) | |
| |
| | Pharmaceuticals – 1.3% | |
| | 1,089 | | Eli Lilly & Co. | | $ | 634,800 | |
| | 17,967 | | Zoetis, Inc. | | | 3,546,147 | |
| | | | | | | | |
| | | | | | | 4,180,947 | |
| | | |
| |
| | Professional Services – 0.2% | |
| | 2,040 | | Equifax, Inc. | | | 504,472 | |
| | | |
| |
| | Real Estate Management & Development – 0.1% | |
| | 2,060 | | CoStar Group, Inc.* | | | 180,023 | |
| | 5,130 | | Zillow Group, Inc., Class C* | | | 296,822 | |
| | | | | | | | |
| | | | | | | 476,845 | |
| | | |
| |
| | Residential REITs – 1.0% | |
| | 27,880 | | American Homes 4 Rent, Class | | | | |
| | | | A REIT | | | 1,002,565 | |
| | 4,903 | | AvalonBay Communities, Inc. | | | | |
| | | | REIT | | | 917,940 | |
| | 42,364 | | Invitation Homes, Inc. REIT | | | 1,445,036 | |
| | | | | | | | |
| | | | | | | 3,365,541 | |
| | | |
| |
| | Semiconductors & Semiconductor Equipment – 4.9% | |
| | 14,373 | | Applied Materials, Inc. | | | 2,329,432 | |
| | 403 | | Broadcom, Inc. | | | 449,849 | |
| | 17,043 | | NVIDIA Corp. | | | 8,440,034 | |
| | 27,369 | | Texas Instruments, Inc. | | | 4,665,320 | |
| | | | | | | | |
| | | | | | | 15,884,635 | |
| | | |
| |
| | Software – 13.4% | |
| | 3,126 | | Adobe, Inc.* | | | 1,864,971 | |
| | 3,899 | | Crowdstrike Holdings, Inc., | | | | |
| | | | Class A* | | | 995,493 | |
| | 53,287 | | Dropbox, Inc., Class A* | | | 1,570,901 | |
| | 14,804 | | Fortinet, Inc.* | | | 866,478 | |
| | 5,554 | | Intuit, Inc. | | | 3,471,416 | |
| | 70,050 | | Microsoft Corp. | | | 26,341,602 | |
| | 17,876 | | Oracle Corp. | | | 1,884,667 | |
| | 20,385 | | Salesforce, Inc.* | | | 5,364,109 | |
| | 1,436 | | ServiceNow, Inc.* | | | 1,014,520 | |
| | | | | | | | |
| | | | | | | 43,374,157 | |
| | | |
| |
| | Specialized REITs – 0.5% | |
| | 6,468 | | SBA Communications Corp. | | | | |
| | | | REIT | | | 1,640,867 | |
| | | |
| |
| | Specialty Retail – 1.6% | |
| | 4,658 | | Burlington Stores, Inc.* | | | 905,888 | |
| | 3,541 | | Home Depot, Inc. (The) | | | 1,227,134 | |
| | 21,921 | | Ross Stores, Inc. | | | 3,033,647 | |
| | | | | | | | |
| | | | | | | 5,166,669 | |
| | | |
| |
| | Technology Hardware, Storage & Peripherals – 10.3% | |
| | 135,891 | | Apple, Inc. | | | 26,163,094 | |
| | 45,919 | | Dell Technologies, Inc., Class C | | | 3,512,804 | |
| | 210,751 | | Hewlett Packard Enterprise Co. | | | 3,578,552 | |
| | | | | | | | |
| | | | | | | 33,254,450 | |
| | | |
| |
| | Textiles, Apparel & Luxury Goods – 1.0% | |
| | 606 | | Deckers Outdoor Corp.* | | | 405,068 | |
| | 4,954 | | Lululemon Athletica, Inc.* | | | 2,532,931 | |
| | 3,358 | | Skechers USA, Inc., Class A* | | | 209,338 | |
| | | | | | | | |
| | | | | | | 3,147,337 | |
| | | |
| | |
| The accompanying notes are an integral part of these financial statements. | | 71 |
GOLDMAN SACHS VARIABLE INSURANCE TRUST U.S. EQUITY INSIGHTS FUND
|
Schedule of Investments (continued) December 31, 2023 |
| | | | | | | | | | | | | | | | |
| | | Shares | | | Description | | Value | |
| |
| | Common Stocks – (continued) | |
| | Tobacco – 1.4% | |
| | | | | | | | | 46,623 | | | Philip Morris International, Inc. | | $ | 4,386,292 | |
| | | |
| | Trading Companies & Distributors – 0.7% | |
| | | | | | | | | 11,381 | | | Ferguson PLC | | | 2,197,330 | |
| | | |
| | TOTAL INVESTMENTS – 99.3% (Cost $237,942,519) | | $ | 321,211,572 | |
| | | |
| | OTHER ASSETS IN EXCESS OF
LIABILITIES – 0.7% | | | 2,377,581 | |
| | | |
| | NET ASSETS – 100.0% | | $ | 323,589,153 | |
| | | |
| | |
| The percentage shown for each investment category reflects the value of investments in that category as a percentage of net assets. |
| |
| * | | Non-income producing security. |
| | |
|
|
| Investment Abbreviations: |
| PLC | | —Public Limited Company |
| REIT | | —Real Estate Investment Trust |
|
|
| | |
| 72 | | The accompanying notes are an integral part of these financial statements. |
GOLDMAN SACHS VARIABLE INSURANCE TRUST EQUITY FUNDS
|
Statements of Assets and Liabilities December 31, 2023 |
| | | | | | | | | | | | | | | | | | | | |
| | | | | International Equity
Insights Fund | | Large Cap Value Fund | | Mid Cap Growth Fund | | Mid Cap Value Fund | | |
| | | | | | |
| | Assets: | | | | | | | | | | | | | | | | | | |
| | Investments in unaffiliated issuers, at value (cost $90,220,026, $219,542,688, $47,949,120 and $363,637,798, respectively)(a) | | $ | 102,506,280 | | | $ | 279,836,514 | | | $ | 61,892,135 | | | $ | 442,992,875 | | | |
| | Investments in affiliated issuers, at value (cost $824, $570,736, $342,086 and $5,349,937, respectively) | | | 824 | | | | 570,736 | | | | 342,086 | | | | 5,349,937 | | | |
| | Investments in affiliated securities lending reinvestment vehicle, at value which equals cost | | | 46,704 | | | | — | | | | 423,829 | | | | 3,873,716 | | | |
| | Cash | | | 725,910 | | | | 620,226 | | | | 43,722 | | | | 775,398 | | | |
| | Foreign Currency, at value (cost $1,165,024, $–, $– and $–,respectively) | | | 1,183,141 | | | | — | | | | — | | | | — | | | |
| | Receivables: | | | | | | | | | | | | | | | | | | |
| | Foreign tax reclaims | | | 459,943 | | | | 4,154 | | | | — | | | | — | | | |
| | Dividends | | | 117,062 | | | | 220,162 | | | | 17,799 | | | | 545,877 | | | |
| | Collateral on certain derivative contracts | | | 94,519 | | | | — | | | | — | | | | — | | | |
| | Reimbursement from investment adviser | | | 15,009 | | | | 7,521 | | | | 6,078 | | | | — | | | |
| | Fund shares sold | | | 1,097 | | | | 1,857 | | | | 175 | | | | 143,566 | | | |
| | Securities lending income | | | 618 | | | | — | | | | 184 | | | | 1,297 | | | |
| | Variation margin on futures contracts | | | 46,411 | | | | — | | | | — | | | | — | | | |
| | Other assets | | | 12,282 | | | | 346 | | | | 130,751 | | | | 2,718 | | | |
| | |
| | Total assets | | | 105,209,800 | | | | 281,261,516 | | | | 62,856,759 | | | | 453,685,384 | | | |
| | |
| | | | | | | | | | | | | | | | | | | | |
| | | | | | |
| | Liabilities: | | | | | | | | | | | | | | | | | | |
| | | | | | |
| | Payables: | | | | | | | | | | | | | | | | | | |
| | Management fees | | | 91,380 | | | | 158,679 | | | | 40,830 | | | | 278,703 | | | |
| | Payable upon return of securities loaned | | | 46,704 | | | | — | | | | 423,829 | | | | 3,873,716 | | | |
| | Fund shares redeemed | | | 40,446 | | | | 244,949 | | | | 8,525 | | | | 263,875 | | | |
| | Distribution and Service fees and Transfer Agency fees | | | 1,743 | | | | 43,075 | | | | 13,400 | | | | 30,688 | | | |
| | Accrued expenses | | | 126,428 | | | | 117,240 | | | | 108,765 | | | | 247,373 | | | |
| | |
| | Total liabilities | | | 306,701 | | | | 563,943 | | | | 595,349 | | | | 4,694,355 | | | |
| | |
| | | | | | |
| | Net Assets: | | | | | | | | | | | | | | | | | | |
| | | | | | |
| | Paid-in Capital | | | 99,913,463 | | | | 218,113,801 | | | | 48,414,624 | | | | 376,888,743 | | | |
| | Total distributable earnings (loss) | | | 4,989,636 | | | | 62,583,772 | | | | 13,846,786 | | | | 72,102,286 | | | |
| | |
| | NET ASSETS | | $ | 104,903,099 | | | $ | 280,697,573 | | | $ | 62,261,410 | | | $ | 448,991,029 | | | |
| | | | | | | | | | | | | | | | | | | | |
| | | Net Assets: | | | | | | | | | | | | | | | | | | |
| | | Institutional | | $ | 67,220,691 | | | $ | 80,218,892 | | | $ | 1,407,705 | | | $ | 326,257,033 | | | |
| | | Service | | | 37,682,408 | | | | 200,478,681 | | | | 60,853,705 | | | | 122,733,996 | | | |
| | | Total Net Assets | | $ | 104,903,099 | | | $ | 280,697,573 | | | $ | 62,261,410 | | | $ | 448,991,029 | | | |
| | | Shares Outstanding $0.001 par value (unlimited number of shares authorized): | | | | | | | | | | | | | | | | | | |
| | | Institutional | | | 7,590,910 | | | | 9,518,927 | | | | 128,116 | | | | 20,381,501 | | | |
| | | Service | | | 4,232,909 | | | | 23,757,903 | | | | 5,960,603 | | | | 7,569,570 | | | |
| | | Net asset value, offering and redemption price per share: | | | | | | | | | | | | | | | | | | |
| | | Institutional | | $ | 8.86 | | | $ | 8.43 | | | $ | 10.99 | | | $ | 16.01 | | | |
| | | Service | | | 8.90 | | | | 8.44 | | | | 10.21 | | | | 16.21 | | | |
| | (a) | Includes loaned securities having a market value of $44,675, $–, $401,875 and $3,673,463, respectively. |
| | |
| The accompanying notes are an integral part of these financial statements. | | 73 |
GOLDMAN SACHS VARIABLE INSURANCE TRUST EQUITY FUNDS
|
Statements of Assets and Liabilities (continued) December 31, 2023 |
| | | | | | | | | | | | | | | | |
| | | | | Small Cap Equity
Insights Fund | | Strategic Growth Fund | | U.S. Equity Insights
Fund | | |
| | | | | |
| | Assets: | | | | | | | | | | | | | | |
| | Investments in unaffiliated issuers, at value (cost $103,338,825, $170,237,363 and $237,942,519, respectively)(a) | | $ | 119,769,218 | | | $ | 363,144,398 | | | $ | 321,211,572 | | | |
| | Investments in affiliated issuers, at value (cost $2,158,240, $3,762,689 and $–, respectively) | | | 2,158,240 | | | | 3,762,689 | | | | — | | | |
| | Investments in affiliated securities lending reinvestment vehicle, at value which equals cost | | | 802,485 | | | | 2,531,958 | | | | — | | | |
| | Cash | | | 1,839,052 | | | | 259,378 | | | | 2,117,682 | | | |
| | Receivables: | | | | | | | | | | | | | | |
| | Dividends | | | 119,774 | | | | 65,160 | | | | 623,452 | | | |
| | Fund shares sold | | | 4,686 | | | | 10,081 | | | | 58,193 | | | |
| | Securities lending income | | | 3,945 | | | | 1,071 | | | | 31 | | | |
| | Foreign tax reclaims | | | 1,867 | | | | 2,219 | | | | 1,006 | | | |
| | Reimbursement from investment adviser | | | 1,022 | | | | 7,459 | | | | 7,168 | | | |
| | Other assets | | | 896 | | | | 311 | | | | 44,600 | | | |
| | |
| | Total assets | | | 124,701,185 | | | | 369,784,724 | | | | 324,063,704 | | | |
| | |
| | | | | | | | | | | | | | | | |
| | | | | |
| | Liabilities: | | | | | | | | | | | | | | |
| | Variation margin on futures contracts | | | 30,020 | | | | — | | | | — | | | |
| | Payables: | | | | | | | | | | | | | | |
| | Payable upon return of securities loaned | | | 802,485 | | | | 2,531,958 | | | | — | | | |
| | Management fees | | | 70,667 | | | | 217,322 | | | | 146,268 | | | |
| | Fund shares redeemed | | | 68,457 | | | | 121,441 | | | | 208,573 | | | |
| | Distribution and Service fees and Transfer Agency fees | | | 7,743 | | | | 49,326 | | | | 8,596 | | | |
| | Accrued expenses | | | 85,812 | | | | 113,667 | | | | 111,114 | | | |
| | |
| | Total liabilities | | | 1,065,184 | | | | 3,033,714 | | | | 474,551 | | | |
| | |
| | | | | |
| | Net Assets: | | | | | | | | | | | | | | |
| | Paid-in Capital | | | 118,334,978 | | | | 170,657,803 | | | | 239,326,186 | | | |
| | Total distributable earnings (loss) | | | 5,301,023 | | | | 196,093,207 | | | | 84,262,967 | | | |
| | |
| | NET ASSETS | | $ | 123,636,001 | | | $ | 366,751,010 | | | $ | 323,589,153 | | | |
| | | | | | | | | | | | | | | | |
| | | Net Assets: | | | | | | | | | | | | | | |
| | | Institutional | | $ | 95,809,389 | | | $ | 160,029,694 | | | $ | 279,958,276 | | | |
| | | Service | | | 27,826,612 | | | | 206,721,316 | | | | 43,630,877 | | | |
| | | Total Net Assets | | $ | 123,636,001 | | | $ | 366,751,010 | | | $ | 323,589,153 | | | |
| | | Shares Outstanding $0.001 par value (unlimited number of shares authorized): | | | | | | | | | | | | | | |
| | | Institutional | | | 7,804,797 | | | | 12,758,780 | | | | 14,331,285 | | | |
| | | Service | | | 2,295,595 | | | | 16,667,265 | | | | 2,213,610 | | | |
| | | Net asset value, offering and redemption price per share: | | | | | | | | | | | | | | |
| | | Institutional | | $ | 12.28 | | | $ | 12.54 | | | $ | 19.53 | | | |
| | | Service | | | 12.12 | | | | 12.40 | | | | 19.71 | | | |
| | (a) | Includes loaned securities having a market value of $754,036, $2,400,808 and $–, respectively. |
| | |
| 74 | | The accompanying notes are an integral part of these financial statements. |
GOLDMAN SACHS VARIABLE INSURANCE TRUST EQUITY FUNDS
|
Statements of Operations For the Fiscal Year Ended December 31, 2023 |
| | | | | | | | | | | | | | | | | | | | |
| | | | | International Equity
Insights Fund | | | Large Cap Value
Fund | | | Mid Cap Growth
Fund | | | Mid Cap Value Fund | | | |
| | | | | | |
| | Investment income: | | | | | | | | | | | | | | | | | | |
| | | | | | |
| | Dividends — unaffiliated issuers (net of foreign withholding taxes of $372,411, $2,890, $– and $–, respectively) | | $ | 3,257,860 | | | $ | 6,896,129 | | | $ | 351,924 | | | $ | 7,112,417 | | | |
| | Securities lending income, net of rebates received or paid to borrowers –affiliated issuer | | | 12,768 | | | | 185 | | | | 1,120 | | | | 2,099 | | | |
| | Dividends — affiliated issuers | | | 2,087 | | | | 94,961 | | | | 85,776 | | | | 236,468 | | | |
| | |
| | Total Investment Income | | | 3,272,715 | | | | 6,991,275 | | | | 438,820 | | | | 7,350,984 | | | |
| | |
| | | | | | | | | | | | | | | | | | | | |
| | | | | | |
| | Expenses: | | | | | | | | | | | | | | | | | | |
| | | | | | |
| | Management fees | | | 828,008 | | | | 2,456,099 | | | | 497,403 | | | | 3,155,299 | | | |
| | Custody, accounting and administrative services | | | 142,274 | | | | 25,202 | | | | 17,913 | | | | 57,480 | | | |
| | Distribution and/or Service (12b-1) fees | | | 92,857 | | | | 553,944 | | | | 139,809 | | | | 252,328 | | | |
| | Professional fees | | | 82,554 | | | | 83,240 | | | | 92,163 | | | | 83,258 | | | |
| | Trustee fees | | | 21,618 | | | | 21,919 | | | | 21,555 | | | | 22,058 | | | |
| | Transfer Agency fees(a) | | | 20,445 | | | | 68,225 | | | | 11,435 | | | | 81,955 | | | |
| | Printing and mailing costs | | | 7,865 | | | | 8,007 | | | | 5,964 | | | | 15,686 | | | |
| | Shareholder meeting expense | | | 4,012 | | | | 14,922 | | | | 2,301 | | | | 17,079 | | | |
| | Other | | | 20,428 | | | | 22,789 | | | | 10,483 | | | | 65,156 | | | |
| | |
| | Total expenses | | | 1,220,061 | | | | 3,254,347 | | | | 799,026 | | | | 3,750,299 | | | |
| | |
| | Less — expense reductions | | | (291,123 | ) | | | (331,417 | ) | | | (238,883 | ) | | | (60,889 | ) | | |
| | |
| | Net expenses | | | 928,938 | | | | 2,922,930 | | | | 560,143 | | | | 3,689,410 | | | |
| | |
| | NET INVESTMENT INCOME (LOSS) | | | 2,343,777 | | | | 4,068,345 | | | | (121,323 | ) | | | 3,661,574 | | | |
| | |
| | | | | | | | | | | | | | | | | | | | |
| | | | | | |
| | Realized and Unrealized gain (loss): | | | | | | | | | | | | | | | | | | |
| | | | | | |
| | Net realized gain (loss) from: | | | | | | | | | | | | | | | | | | |
| | Investments — unaffiliated issuers | | | 4,604,788 | | | | 16,204,514 | | | | 906,853 | | | | 7,137,229 | | | |
| | Futures contracts | | | 165,299 | | | | — | | | | — | | | | — | | | |
| | Foreign currency transactions | | | (66,443 | ) | | | 4 | | | | — | | | | (2,091 | ) | | |
| | Net change in unrealized gain (loss) on: | | | | | | | | | | | | | | | | | | |
| | Investments — unaffiliated issuers | | | 9,919,853 | | | | 16,350,668 | | | | 8,679,642 | | | | 27,802,122 | | | |
| | Futures contracts | | | 37,162 | | | | — | | | | — | | | | — | | | |
| | Foreign currency translations | | | 22,110 | | | | 100 | | | | — | | | | — | | | |
| | |
| | Net realized and unrealized gain | | | 14,682,769 | | | | 32,555,286 | | | | 9,586,495 | | | | 34,937,260 | | | |
| | |
| | NET INCREASE IN NET ASSETS RESULTING FROM OPERATIONS | | $ | 17,026,546 | | | $ | 36,623,631 | | | $ | 9,465,172 | | | $ | 38,598,834 | | | |
| | |
| | (a) | Class specific Transfer Agency fees were as follows: |
| | | | | | | | | | |
| | | | | Transfer Agency Fees | |
| | | Fund | | Institutional | | | Service | |
| | International Equity Insights Fund | | | $13,016 | | | | $7,429 | |
| | Large Cap Value Fund | | | 23,910 | | | | 44,315 | |
| | Mid Cap Growth Fund | | | 250 | | | | 11,185 | |
| | Mid Cap Value Fund | | | $61,769 | | | | $20,186 | |
| | |
| The accompanying notes are an integral part of these financial statements. | | 75 |
GOLDMAN SACHS VARIABLE INSURANCE TRUST EQUITY FUNDS
|
Statements of Operations (continued) For the Fiscal Year Ended December 31, 2023 |
| | | | | | | | | | | | | | | | |
| | | | | Small Cap Equity
Insights Fund | | | Strategic Growth
Fund | | | U.S. Equity Insights
Fund | | | |
| | | | | |
| | Investment income: | | | | | | | | | | | | | | |
| | | | | |
| | Dividends — unaffiliated issuers (net of foreign withholding taxes of $5,618, $3,246 and $41, respectively) | | $ | 1,737,653 | | | $ | 2,123,367 | | | $ | 4,211,375 | | | |
| | Dividends — affiliated issuers | | | 49,383 | | | | 119,273 | | | | 23,218 | | | |
| | Securities lending income, net of rebates received or paid to borrowers – affiliated issuer | | | 20,637 | | | | 1,363 | | | | 104 | | | |
| | |
| | Total Investment Income | | | 1,807,673 | | | | 2,244,003 | | | | 4,234,697 | | | |
| | |
| | | | | | | | | | | | | | | | |
| | | | | |
| | Expenses: | | | | | | | | | | | | | | |
| | | | | |
| | Management fees | | | 806,853 | | | | 2,303,124 | | | | 1,880,043 | | | |
| | Professional fees | | | 85,188 | | | | 84,279 | | | | 85,204 | | | |
| | Distribution and/or Service (12b-1) fees | | | 60,536 | | | | 451,691 | | | | 105,990 | | | |
| | Printing and mailing costs | | | 36,934 | | | | 7,483 | | | | 8,748 | | | |
| | Transfer Agency fees(a) | | | 23,053 | | | | 64,877 | | | | 60,646 | | | |
| | Trustee fees | | | 21,635 | | | | 21,925 | | | | 21,887 | | | |
| | Custody, accounting and administrative services | | | 11,624 | | | | 26,779 | | | | 11,978 | | | |
| | Shareholder meeting expense | | | 4,688 | | | | 13,717 | | | | 12,245 | | | |
| | Other | | | 14,917 | | | | 21,256 | | | | 20,776 | | | |
| | |
| | Total expenses | | | 1,065,428 | | | | 2,995,131 | | | | 2,207,517 | | | |
| | |
| | Less — expense reductions | | | (63,781 | ) | | | (120,362 | ) | | | (396,073 | ) | | |
| | |
| | Net expenses | | | 1,001,647 | | | | 2,874,769 | | | | 1,811,444 | | | |
| | |
| | NET INVESTMENT INCOME (LOSS) | | | 806,026 | | | | (630,766 | ) | | | 2,423,253 | | | |
| | |
| | | | | | | | | | | | | | | | |
| | | | | |
| | Realized and Unrealized gain (loss): | | | | | | | | | | | | | | |
| | Net realized gain (loss) from: | | | | | | | | | | | | | | |
| | Investments — unaffiliated issuers | | | 2,826,064 | | | | 17,652,511 | | | | 13,340,494 | | | |
| | Futures contracts | | | 28,352 | | | | — | | | | 478,012 | | | |
| | Foreign currency transactions | | | — | | | | 24 | | | | — | | | |
| | Net change in unrealized gain (loss) on: | | | | | | | | | | | | | | |
| | Investments — unaffiliated issuers | | | 16,250,729 | | | | 92,241,926 | | | | 48,912,283 | | | |
| | Futures contracts | | | 178,838 | | | | — | | | | 16,178 | | | |
| | Foreign currency translations | | | — | | | | 59 | | | | — | | | |
| | |
| | Net realized and unrealized gain | | | 19,283,983 | | | | 109,894,520 | | | | 62,746,967 | | | |
| | |
| | NET INCREASE IN NET ASSETS RESULTING FROM OPERATIONS | | $ | 20,090,009 | | | $ | 109,263,754 | | | $ | 65,170,220 | | | |
| | |
| | (a) | Class specific Transfer Agency fees were as follows: |
| | | | | | | | | | |
| | | | | Transfer Agency Fees | |
| | | Fund | | Institutional | | | Service | |
| | Small Cap Equity Insights Fund | | | $18,210 | | | | $4,843 | |
| | Strategic Growth Fund | | | 28,742 | | | | 36,135 | |
| | U.S. Equity Insights Fund | | | 52,167 | | | | 8,479 | |
| | |
| 76 | | The accompanying notes are an integral part of these financial statements. |
GOLDMAN SACHS VARIABLE INSURANCE TRUST EQUITY FUNDS
|
Statements of Changes in Net Assets |
| | | | | | | | | | | | |
| | | | | International Equity Insights Fund. | | | |
| | | | |
| | | | | For the Fiscal
Year Ended
December 31, 2023 | | | For the Fiscal
Year Ended
December 31, 2022 | | | |
| | | | |
| | From operations: | | | | | | | | | | |
| | | | |
| | Net investment income | | $ | 2,343,777 | | | $ | 2,825,395 | | | |
| | | | |
| | Net realized gain (loss) | | | 4,703,644 | | | | (11,194,236 | ) | | |
| | | | |
| | Net change in unrealized gain (loss) | | | 9,979,125 | | | | (6,519,448 | ) | | |
| | |
| | Net increase (decrease) in net assets resulting from operations | | | 17,026,546 | | | | (14,888,289 | ) | | |
| | |
| | | | | | | | | | | | |
| | | | |
| | Distributions to shareholders: | | | | | | | | | | |
| | | | |
| | From distributable earnings: | | | | | | | | | | |
| | Institutional Shares | | | (1,735,434 | ) | | | (1,971,488 | ) | | |
| | Service Shares | | | (836,056 | ) | | | (1,049,519 | ) | | |
| | |
| | Total distributions to shareholders | | | (2,571,490 | ) | | | (3,021,007 | ) | | |
| | |
| | | | | | | | | | | | |
| | | | |
| | From share transactions: | | | | | | | | | | |
| | | | |
| | Proceeds from sales of shares | | | 13,433,627 | | | | 15,434,881 | | | |
| | | | |
| | Reinvestment of distributions | | | 2,571,491 | | | | 3,021,007 | | | |
| | | | |
| | Cost of shares redeemed | | | (18,881,078 | ) | | | (14,773,365 | ) | | |
| | |
| | Net increase (decrease) in net assets resulting from share transactions | | | (2,875,960 | ) | | | 3,682,523 | | | |
| | |
| | TOTAL INCREASE (DECREASE) | | | 11,579,096 | | | | (14,226,773 | ) | | |
| | |
| | | | | | | | | | | | |
| | | | |
| | Net Assets: | | | | | | | | | | |
| | | | |
| | Beginning of year | | | 93,324,003 | | | | 107,550,776 | | | |
| | |
| | End of year | | $ | 104,903,099 | | | $ | 93,324,003 | | | |
| | |
| | |
| The accompanying notes are an integral part of these financial statements. | | 77 |
GOLDMAN SACHS VARIABLE INSURANCE TRUST EQUITY FUNDS
|
Statements of Changes in Net Assets (continued) |
| | | | | | | | | | | | | | | | | | | | |
| | | | | Large Cap Value Fund | | | Mid Cap Growth Fund |
| | | | | | |
| | | | | For the Fiscal
Year Ended
December 31, 2023 | | | For the Fiscal
Year Ended
December 31, 2022 | | | For the Fiscal
Year Ended
December 31, 2023 | | | For the Fiscal
Year Ended
December 31, 2022 | | | |
| | | | | | |
| | | From operations: | | | | | | | | | | | | | | | | | | |
| | | | | | |
| | Net investment income (loss) | | $ | 4,068,345 | | | $ | 5,142,633 | | | $ | (121,323 | ) | | $ | (199,882 | ) | | |
| | | | | | |
| | Net realized gain (loss) | | | 16,204,518 | | | | 42,900,507 | | | | 906,853 | | | | (375,140 | ) | | |
| | | | | | |
| | Net change in unrealized gain (loss) | | | 16,350,768 | | | | (79,174,841 | ) | | | 8,679,642 | | | | (18,870,736 | ) | | |
| | |
| | Net increase (decrease) in net assets resulting from operations | | | 36,623,631 | | | | (31,131,701 | ) | | | 9,465,172 | | | | (19,445,758 | ) | | |
| | |
| | | | | | | | | | | | | | | | | | | | |
| | | | | | |
| | Distributions to shareholders: | | | | | | | | | | | | | | | | | | |
| | | | | | |
| | From distributable earnings: | | | | | | | | | | | | | | | | | | |
| | | | | | |
| | Institutional Shares | | | (8,159,428 | ) | | | (16,379,536 | ) | | | (8,516 | ) | | | (39,168 | ) | | |
| | | | | | |
| | Service Shares | | | (19,903,003 | ) | | | (26,593,972 | ) | | | (381,393 | ) | | | (1,904,522 | ) | | |
| | |
| | Total distributions to shareholders | | | (28,062,431 | ) | | | (42,973,508 | ) | | | (389,909 | ) | | | (1,943,690 | ) | | |
| | |
| | | | | | | | | | | | | | | | | | | | |
| | | | | | |
| | From share transactions: | | | | | | | | | | | | | | | | | | |
| | | | | | |
| | Proceeds from sales of shares | | | 14,789,390 | | | | 18,097,425 | | | | 13,931,487 | | | | 7,276,149 | | | |
| | | | | | |
| | Reinvestment of distributions | | | 28,062,431 | | | | 42,973,507 | | | | 389,910 | | | | 1,943,690 | | | |
| | | | | | |
| | Cost of shares redeemed | | | (154,251,084 | ) | | | (90,692,163 | ) | | | (13,553,045 | ) | | | (12,881,102 | ) | | |
| | |
| | Net increase (decrease) in net assets resulting from share transactions | | | (111,399,263 | ) | | | (29,621,231 | ) | | | 768,352 | | | | (3,661,263 | ) | | |
| | |
| | TOTAL INCREASE (DECREASE) | | | (102,838,063 | ) | | | (103,726,440 | ) | | | 9,843,615 | | | | (25,050,711 | ) | | |
| | |
| | | | | | | | | | | | | | | | | | | | |
| | | | | | |
| | Net Assets: | | | | | | | | | | | | | | | | | | |
| | | | | | |
| | Beginning of year | | | 383,535,636 | | | | 487,262,076 | | | | 52,417,795 | | | | 77,468,506 | | | |
| | |
| | End of year | | $ | 280,697,573 | | | $ | 383,535,636 | | | $ | 62,261,410 | | | $ | 52,417,795 | | | |
| | |
| | |
| 78 | | The accompanying notes are an integral part of these financial statements. |
GOLDMAN SACHS VARIABLE INSURANCE TRUST EQUITY FUNDS
|
Statements of Changes in Net Assets (continued) |
| | | | | | | | | | | | | | | | | | | | |
| | | | | Mid Cap Value Fund | | | Small Cap Equity Insights Fund |
| | | | | | |
| | | | | For the Fiscal
Year Ended
December 31, 2023 | | | For the Fiscal
Year Ended
December 31, 2022 | | | For the Fiscal
Year Ended
December 31, 2023 | | | For the Fiscal
Year Ended
December 31, 2022 | | | |
| | | | | | |
| | From operations: | | | | | | | | | | | | | | | | | | |
| | | | | | |
| | Net investment income | | $ | 3,661,574 | | | $ | 3,521,135 | | | $ | 806,026 | | | $ | 701,104 | | | |
| | | | | | |
| | Net realized gain (loss) | | | 7,135,138 | | | | 41,579,679 | | | | 2,854,416 | | | | (13,710,495 | ) | | |
| | | | | | |
| | Net change in unrealized gain (loss) | | | 27,802,122 | | | | (104,300,273 | ) | | | 16,429,567 | | | | (12,850,682 | ) | | |
| | |
| | Net increase (decrease) in net assets resulting from operations | | | 38,598,834 | | | | (59,199,459 | ) | | | 20,090,009 | | | | (25,860,073 | ) | | |
| | |
| | | | | | | | | | | | | | | | | | | | |
| | | | | | |
| | Distributions to shareholders: | | | | | | | | | | | | | | | | | | |
| | | | | | |
| | From distributable earnings: | | | | | | | | | | | | | | | | | | |
| | | | | | |
| | Institutional Shares | | | (10,908,507 | ) | | | (50,260,812 | ) | | | (893,220 | ) | | | (1,287,501 | ) | | |
| | | | | | |
| | Service Shares | | | (2,909,258 | ) | | | (15,201,358 | ) | | | (205,539 | ) | | | (266,792 | ) | | |
| | |
| | Total distributions to shareholders | | | (13,817,765 | ) | | | (65,462,170 | ) | | | (1,098,759 | ) | | | (1,554,293 | ) | | |
| | |
| | | | | | | | | | | | | | | | | | | | |
| | | | | | |
| | From share transactions: | | | | | | | | | | | | | | | | | | |
| | | | | | |
| | Proceeds from sales of shares | | | 172,432,600 | | | | 93,206,792 | | | | 13,613,836 | | | | 21,488,587 | | | |
| | | | | | |
| | Reinvestment of distributions | | | 13,817,764 | | | | 65,462,169 | | | | 1,098,759 | | | | 1,554,293 | | | |
| | | | | | |
| | Cost of shares redeemed | | | (162,940,846 | ) | | | (185,704,513 | ) | | | (19,561,684 | ) | | | (16,964,615 | ) | | |
| | |
| | Net increase (decrease) in net assets resulting from share transactions | | | 23,309,518 | | | | (27,035,552 | ) | | | (4,849,089 | ) | | | 6,078,265 | | | |
| | |
| | TOTAL INCREASE (DECREASE) | | | 48,090,587 | | | | (151,697,181 | ) | | | 14,142,161 | | | | (21,336,101 | ) | | |
| | |
| | | | | | |
| | Net Assets: | | | | | | | | | | | | | | | | | | |
| | | | | | |
| | Beginning of year | | | 400,900,442 | | | | 552,597,623 | | | | 109,493,840 | | | | 130,829,941 | | | |
| | |
| | End of year | | $ | 448,991,029 | | | $ | 400,900,442 | | | $ | 123,636,001 | | | $ | 109,493,840 | | | |
| | |
| | |
| The accompanying notes are an integral part of these financial statements. | | 79 |
GOLDMAN SACHS VARIABLE INSURANCE TRUST EQUITY FUNDS
|
Statements of Changes in Net Assets (continued) |
| | | | | | | | | | | | | | | | | | | | |
| | | | | Strategic Growth Fund | | | U.S. Equity Insights Fund | | | |
| | | | | | |
| | | | | For the Fiscal
Year Ended
December 31, 2023 | | | For the Fiscal
Year Ended
December 31, 2022 | | | For the Fiscal
Year Ended
December 31, 2023 | | | For the Fiscal
Year Ended
December 31, 2022 | | | |
| | | | | | |
| | From operations: | | | | | | | | | | | | | | | | | | |
| | | | | | |
| | Net investment income (loss) | | $ | (630,766 | ) | | $ | (682,580 | ) | | $ | 2,423,253 | | | $ | 2,624,280 | | | |
| | | | | | |
| | Net realized gain (loss) | | | 17,652,535 | | | | 40,371,059 | | | | 13,818,506 | | | | (12,596,431 | ) | | |
| | | | | | |
| | Net change in unrealized gain (loss) | | | 92,241,985 | | | | (166,086,540 | ) | | | 48,928,461 | | | | (63,839,389 | ) | | |
| | |
| | Net increase (decrease) in net assets resulting from operations | | | 109,263,754 | | | | (126,398,061 | ) | | | 65,170,220 | | | | (73,811,540 | ) | | |
| | |
| | | | | | | | | | | | | | | | | | | | |
| | | | | | |
| | Distributions to shareholders: | | | | | | | | | | | | | | | | | | |
| | | | | | |
| | From distributable earnings: | | | | | | | | | | | | | | | | | | |
| | | | | | |
| | Institutional Shares | | | (6,080,406 | ) | | | (23,862,524 | ) | | | (1,793,960 | ) | | | (3,548,809 | ) | | |
| | | | | | |
| | Service Shares | | | (7,958,794 | ) | | | (22,574,843 | ) | | | (188,933 | ) | | | (509,957 | ) | | |
| | |
| | Total distributions to shareholders | | | (14,039,200 | ) | | | (46,437,367 | ) | | | (1,982,893 | ) | | | (4,058,766 | ) | | |
| | |
| | | | | | | | | | | | | | | | | | | | |
| | | | | | |
| | From share transactions: | | | | | | | | | | | | | | | | | | |
| | | | | | |
| | Proceeds from sales of shares | | | 93,672,409 | | | | 20,861,765 | | | | 17,073,247 | | | | 19,568,290 | | | |
| | | | | | |
| | Reinvestment of distributions | | | 14,039,200 | | | | 46,437,367 | | | | 1,982,893 | | | | 4,058,766 | | | |
| | | | | | |
| | Cost of shares redeemed | | | (73,467,060 | ) | | | (107,108,519 | ) | | | (42,762,672 | ) | | | (40,965,728 | ) | | |
| | |
| | Net increase (decrease) in net assets resulting from share transactions | | | 34,244,549 | | | | (39,809,387 | ) | | | (23,706,532 | ) | | | (17,338,672 | ) | | |
| | |
| | TOTAL INCREASE (DECREASE) | | | 129,469,103 | | | | (212,644,815 | ) | | | 39,480,795 | | | | (95,208,978 | ) | | |
| | |
| | | | | | |
| | Net Assets: | | | | | | | | | | | | | | | | | | |
| | | | | | |
| | Beginning of year | | | 237,281,907 | | | | 449,926,722 | | | | 284,108,358 | | | | 379,317,336 | | | |
| | |
| | End of year | | $ | 366,751,010 | | | $ | 237,281,907 | | | $ | 323,589,153 | | | $ | 284,108,358 | | | |
| | |
| | |
| 80 | | The accompanying notes are an integral part of these financial statements. |
GOLDMAN SACHS VARIABLE INSURANCE TRUST INTERNATIONAL EQUITY INSIGHTS FUND
|
Financial Highlights Selected Data for a Share Outstanding Throughout Each Year |
| | | | | | | | | | | | | | | | | | | | | | | | | | | |
| | | | | Goldman Sachs International Equity Insights Fund |
| | |
| | | | | Institutional Shares |
| | |
| | | | | Year Ended December 31, |
| | | | | | |
| | | | | 2023 | | 2022 | | 2021 | | 2020 | | 2019 |
| | | | | | |
| | Per Share Data | | | | | | | | | | | | | | | | | | | | | | | | | |
| | | | | | |
| | | Net asset value, beginning of year | | | $ | 7.66 | | | | $ | 9.16 | | | | $ | 8.62 | | | | $ | 8.19 | | | | $ | 7.08 | |
| | | |
| | | | | | |
| | Net investment income(a) | | | | 0.20 | (b) | | | | 0.25 | (c) | | | | 0.21 | | | | | 0.12 | | | | | 0.17 | |
| | | | | | |
| | Net realized and unrealized gain (loss) | | | | 1.23 | | | | | (1.49 | ) | | | | 0.83 | | | | | 0.43 | | | | | 1.14 | |
| | | |
| | | | | | |
| | Total from investment operations | | | | 1.43 | | | | | (1.24 | ) | | | | 1.04 | | | | | 0.55 | | | | | 1.31 | |
| | | |
| | | | | | |
| | Distributions to shareholders from net investment income | | | | (0.23 | ) | | | | (0.26 | ) | | | | (0.27 | ) | | | | (0.12 | ) | | | | (0.20) | |
| | | | | | |
| | Distributions to shareholders from net realized gains | | | | – | | | | | – | | | | | (0.23 | ) | | | | – | | | | | –(d) | |
| | | |
| | | | | | |
| | Total distributions | | | | (0.23 | ) | | | | (0.26 | ) | | | | (0.50 | ) | | | | (0.12 | ) | | | | (0.20) | |
| | | |
| | | | | | |
| | Net asset value, end of year | | | $ | 8.86 | | | | $ | 7.66 | | | | $ | 9.16 | | | | $ | 8.62 | | | | $ | 8.19 | |
| | | |
| | | | | | |
| | Total Return(e) | | | | 18.71 | % | | | | (13.55 | )% | | | | 12.17 | % | | | | 6.79 | % | | | | 18.45% | |
| | | |
| | | | | | |
| | Net assets, end of year (in 000’s) | | | $ | 67,221 | | | | $ | 59,170 | | | | $ | 63,179 | | | | $ | 50,114 | | | | $ | 43,632 | |
| | | | | | |
| | Ratio of net expenses to average net assets | | | | 0.82 | % | | | | 0.83 | % | | | | 0.85 | % | | | | 0.87 | % | | | | 0.90% | |
| | | | | | |
| | Ratio of total expenses to average net assets | | | | 1.10 | % | | | | 0.99 | % | | | | 1.14 | % | | | | 1.37 | % | | | | 1.31% | |
| | | | | | |
| | Ratio of net investment income to average net assets | | | | 2.38 | %(b) | | | | 3.09 | %(c) | | | | 2.22 | % | | | | 1.59 | % | | | | 3.21% | |
| | | | | | |
| | Portfolio turnover rate(f) | | | | 162 | % | | | | 164 | % | | | | 167 | % | | | | 175 | % | | | | 146% | |
| | | |
| | (a) | Calculated based on the average shares outstanding methodology. |
| | (b) | Reflects income recognized from special dividends which amounts to $0.03 per share and 0.33% of average net assets. |
| | (c) | Reflects income recognized from special dividends which amounts to $0.04 per share and 0.45% of average net assets. |
| | (d) | Amount is less than $0.005 per share. |
| | (e) | Assumes investment at the NAV at the beginning of the year, reinvestment of all dividends and distributions, a complete redemption of the investment at the NAV at the end of the year and no sales or redemption charges (if any). Total returns would be reduced if a sales or redemption charge was taken into account. Returns do not reflect the impact of taxes to shareholders relating to Fund distributions or the redemption of Fund shares. |
| | (f) | The Fund’s portfolio turnover rate is calculated in accordance with regulatory requirements, without regard to transactions involving short term investments and certain derivatives. If such transactions were included, the Fund’s portfolio turnover rate may be higher. |
| | |
| The accompanying notes are an integral part of these financial statements. | | 81 |
GOLDMAN SACHS VARIABLE INSURANCE TRUST INTERNATIONAL EQUITY INSIGHTS FUND
|
Financial Highlights (continued) Selected Data for a Share Outstanding Throughout Each Year |
| | | | | | | | | | | | | | | | | | | | | | | | | | | |
| | | | | Goldman Sachs International Equity Insights Fund |
| | |
| | | | | Service Shares |
| | |
| | | | | Year Ended December 31, |
| | | | | | |
| | | | | 2023 | | 2022 | | 2021 | | 2020 | | 2019 |
| | | | | | |
| | Per Share Data | | | | | | | | | | | | | | | | | | | | | | | | | |
| | | | | | |
| | | Net asset value, beginning of year | | | $ | 7.70 | | | | $ | 9.20 | | | | $ | 8.66 | | | | $ | 8.23 | | | | $ | 7.11 | |
| | | |
| | | | | | |
| | Net investment income(a) | | | | 0.18 | (b) | | | | 0.22 | (c) | | | | 0.19 | | | | | 0.10 | | | | | 0.15 | |
| | | | | | |
| | Net realized and unrealized gain (loss) | | | | 1.23 | | | | | (1.48 | ) | | | | 0.83 | | | | | 0.44 | | | | | 1.15 | |
| | | |
| | | | | | |
| | Total from investment operations | | | | 1.41 | | | | | (1.26 | ) | | | | 1.02 | | | | | 0.54 | | | | | 1.30 | |
| | | |
| | | | | | |
| | Distributions to shareholders from net investment income | | | | (0.21 | ) | | | | (0.24 | ) | | | | (0.25 | ) | | | | (0.11 | ) | | | | (0.18) | |
| | | | | | |
| | Distributions to shareholders from net realized gains | | | | – | | | | | – | | | | | (0.23 | ) | | | | – | | | | | –(d) | |
| | | |
| | | | | | |
| | Total distributions | | | | (0.21 | ) | | | | (0.24 | ) | | | | (0.48 | ) | | | | (0.11 | ) | | | | (0.18) | |
| | | |
| | | | | | |
| | Net asset value, end of year | | | $ | 8.90 | | | | $ | 7.70 | | | | $ | 9.20 | | | | $ | 8.66 | | | | $ | 8.23 | |
| | | |
| | | | | | |
| | Total Return(e) | | | | 18.43 | % | | | | (13.72 | )% | | | | 11.81 | % | | | | 6.53 | % | | | | 18.23% | |
| | | |
| | | | | | |
| | Net assets, end of year (in 000’s) | | | $ | 37,682 | | | | $ | 34,154 | | | | $ | 44,372 | | | | $ | 47,685 | | | | $ | 48,884 | |
| | | | | | |
| | Ratio of net expenses to average net assets | | | | 1.07 | % | | | | 1.09 | % | | | | 1.10 | % | | | | 1.12 | % | | | | 1.15% | |
| | | | | | |
| | Ratio of total expenses to average net assets | | | | 1.35 | % | | | | 1.25 | % | | | | 1.40 | % | | | | 1.61 | % | | | | 1.55% | |
| | | | | | |
| | Ratio of net investment income to average net assets | | | | 2.14 | %(b) | | | | 2.74 | %(c) | | | | 1.97 | % | | | | 1.30 | % | | | | 1.89% | |
| | | | | | |
| | Portfolio turnover rate(f) | | | | 162 | % | | | | 164 | % | | | | 167 | % | | | | 175 | % | | | | 146% | |
| | | |
| | (a) | Calculated based on the average shares outstanding methodology. |
| | (b) | Reflects income recognized from special dividends which amounts to $0.03 per share and 0.33% of average net assets. |
| | (c) | Reflects income recognized from special dividends which amounts to $0.04 per share and 0.45% of average net assets. |
| | (d) | Amount is less than $0.005 per share. |
| | (e) | Assumes investment at the NAV at the beginning of the year, reinvestment of all dividends and distributions, a complete redemption of the investment at the NAV at the end of the year and no sales or redemption charges (if any). Total returns would be reduced if a sales or redemption charge was taken into account. Returns do not reflect the impact of taxes to shareholders relating to Fund distributions or the redemption of Fund shares. |
| | (f) | The Fund’s portfolio turnover rate is calculated in accordance with regulatory requirements, without regard to transactions involving short term investments and certain derivatives. If such transactions were included, the Fund’s portfolio turnover rate may be higher. |
| | |
| 82 | | The accompanying notes are an integral part of these financial statements. |
GOLDMAN SACHS VARIABLE INSURANCE TRUST LARGE CAP VALUE FUND
|
Financial Highlights (continued) Selected Data for a Share Outstanding Throughout Each Year |
| | | | | | | | | | | | | | | | | | | | | | | | | | | |
| | | | | Goldman Sachs Large Cap Value Fund |
| | |
| | | | | Institutional Shares |
| | |
| | | | | Year Ended December 31, |
| | | | | | |
| | | | | 2023 | | 2022 | | 2021 | | 2020 | | 2019 |
| | | | | | |
| | Per Share Data | | | | | | | | | | | | | | | | | | | | | | | | | |
| | | | | | |
| | | Net asset value, beginning of year | | | $ | 8.34 | | | | $ | 9.97 | | | | $ | 9.27 | | | | $ | 9.19 | | | | $ | 7.67 | |
| | | |
| | | | | | |
| | Net investment income(a) | | | | 0.11 | | | | | 0.13 | | | | | 0.11 | | | | | 0.12 | | | | | 0.13 | |
| | | | | | |
| | Net realized and unrealized gain (loss) | | | | 0.93 | | | | | (0.72 | ) | | | | 2.09 | | | | | 0.24 | | | | | 1.86 | |
| | | |
| | | | | | |
| | Total from investment operations | | | | 1.04 | | | | | (0.59 | ) | | | | 2.20 | | | | | 0.36 | | | | | 1.99 | |
| | | |
| | | | | | |
| | Distributions to shareholders from net investment income | | | | (0.16 | ) | | | | (0.13 | ) | | | | (0.13 | ) | | | | (0.12 | ) | | | | (0.14) | |
| | | | | | |
| | Distributions to shareholders from net realized gains | | | | (0.79 | ) | | | | (0.91 | ) | | | | (1.37 | ) | | | | (0.16 | ) | | | | (0.33) | |
| | | |
| | | | | | |
| | Total distributions | | | | (0.95 | ) | | | | (1.04 | ) | | | | (1.50 | ) | | | | (0.28 | ) | | | | (0.47) | |
| | | |
| | | | | | |
| | Net asset value, end of year | | | $ | 8.43 | | | | $ | 8.34 | | | | $ | 9.97 | | | | $ | 9.27 | | | | $ | 9.19 | |
| | | |
| | | | | | |
| | Total Return(b) | | | | 13.01 | % | | | | (6.37 | )% | | | | 24.13 | % | | | | 3.97 | % | | | | 25.93% | |
| | | |
| | | | | | |
| | Net assets, end of year (in 000’s) | | | $ | 80,219 | | | | $ | 145,165 | | | | $ | 179,541 | | | | $ | 160,076 | | | | $ | 163,814 | |
| | | | | | |
| | Ratio of net expenses to average net assets | | | | 0.71 | % | | | | 0.70 | % | | | | 0.69 | % | | | | 0.71 | % | | | | 0.73% | |
| | | | | | |
| | Ratio of total expenses to average net assets | | | | 0.79 | % | | | | 0.80 | % | | | | 0.79 | % | | | | 0.81 | % | | | | 0.83% | |
| | | | | | |
| | Ratio of net investment income to average net assets | | | | 1.33 | % | | | | 1.38 | % | | | | 1.08 | % | | | | 1.44 | % | | | | 1.46% | |
| | | | | | |
| | Portfolio turnover rate(c) | | | | 58 | % | | | | 46 | % | | | | 54 | % | | | | 58 | % | | | | 58% | |
| | | |
| | (a) | Calculated based on the average shares outstanding methodology. |
| | (b) | Assumes investment at the NAV at the beginning of the year, reinvestment of all dividends and distributions, a complete redemption of the investment at the NAV at the end of the year and no sales or redemption charges (if any). Total returns would be reduced if a sales or redemption charge was taken into account. Returns do not reflect the impact of taxes to shareholders relating to Fund distributions or the redemption of Fund shares. |
| | (c) | The Fund’s portfolio turnover rate is calculated in accordance with regulatory requirements, without regard to transactions involving short term investments and certain derivatives. If such transactions were included, the Fund’s portfolio turnover rate may be higher. |
| | |
| The accompanying notes are an integral part of these financial statements. | | 83 |
GOLDMAN SACHS VARIABLE INSURANCE TRUST LARGE CAP VALUE FUND
|
Financial Highlights (continued) Selected Data for a Share Outstanding Throughout Each Year |
| | | | | | | | | | | | | | | | | | | | | | | | | | | |
| | | | | Goldman Sachs Large Cap Value Fund |
| | |
| | | | | Service Shares |
| | |
| | | | | Year Ended December 31, |
| | | | | | |
| | | | | 2023 | | 2022 | | 2021 | | 2020 | | 2019 |
| | | | | | |
| | Per Share Data | | | | | | | | | | | | | | | | | | | | | | | | | |
| | | | | | |
| | | Net asset value, beginning of year | | | $ | 8.35 | | | | $ | 9.98 | | | | $ | 9.27 | | | | $ | 9.19 | | | | $ | 7.67 | |
| | | |
| | | | | | |
| | Net investment income(a) | | | | 0.10 | | | | | 0.11 | | | | | 0.09 | | | | | 0.10 | | | | | 0.11 | |
| | | | | | |
| | Net realized and unrealized gain (loss) | | | | 0.91 | | | | | (0.72 | ) | | | | 2.09 | | | | | 0.24 | | | | | 1.85 | |
| | | |
| | | | | | |
| | Total from investment operations | | | | 1.01 | | | | | (0.61 | ) | | | | 2.18 | | | | | 0.34 | | | | | 1.96 | |
| | | |
| | | | | | |
| | Distributions to shareholders from net investment income | | | | (0.13 | ) | | | | (0.11 | ) | | | | (0.10 | ) | | | | (0.10 | ) | | | | (0.11) | |
| | | | | | |
| | Distributions to shareholders from net realized gains | | | | (0.79 | ) | | | | (0.91 | ) | | | | (1.37 | ) | | | | (0.16 | ) | | | | (0.33) | |
| | | |
| | | | | | |
| | Total distributions | | | | (0.92 | ) | | | | (1.02 | ) | | | | (1.47 | ) | | | | (0.26 | ) | | | | (0.44) | |
| | | |
| | | | | | |
| | Net asset value, end of year | | | $ | 8.44 | | | | $ | 8.35 | | | | $ | 9.98 | | | | $ | 9.27 | | | | $ | 9.19 | |
| | | |
| | | | | | |
| | Total Return(b) | | | | 12.71 | % | | | | (6.57 | )% | | | | 23.93 | % | | | | 3.73 | % | | | | 25.61% | |
| | | |
| | | | | | |
| | Net assets, end of year (in 000’s) | | | $ | 200,479 | | | | $ | 238,371 | | | | $ | 307,721 | | | | $ | 299,564 | | | | $ | 306,058 | |
| | | | | | |
| | Ratio of net expenses to average net assets | | | | 0.94 | % | | | | 0.93 | % | | | | 0.92 | % | | | | 0.94 | % | | | | 0.98% | |
| | | | | | |
| | Ratio of total expenses to average net assets | | | | 1.04 | % | | | | 1.05 | % | | | | 1.04 | % | | | | 1.06 | % | | | | 1.08% | |
| | | | | | |
| | Ratio of net investment income to average net assets | | | | 1.12 | % | | | | 1.15 | % | | | | 0.84 | % | | | | 1.21 | % | | | | 1.21% | |
| | | | | | |
| | Portfolio turnover rate(c) | | | | 58 | % | | | | 46 | % | | | | 54 | % | | | | 58 | % | | | | 58% | |
| | | |
| | (a) | Calculated based on the average shares outstanding methodology. |
| | (b) | Assumes investment at the NAV at the beginning of the year, reinvestment of all dividends and distributions, a complete redemption of the investment at the NAV at the end of the year and no sales or redemption charges (if any). Total returns would be reduced if a sales or redemption charge was taken into account. Returns do not reflect the impact of taxes to shareholders relating to Fund distributions or the redemption of Fund shares. |
| | (c) | The Fund’s portfolio turnover rate is calculated in accordance with regulatory requirements, without regard to transactions involving short term investments and certain derivatives. If such transactions were included, the Fund’s portfolio turnover rate may be higher. |
| | |
| 84 | | The accompanying notes are an integral part of these financial statements. |
GOLDMAN SACHS VARIABLE INSURANCE TRUST MID CAP GROWTH FUND
|
Financial Highlights (continued) Selected Data for a Share Outstanding Throughout Each Year |
| | | | | | | | | | | | | | | | | | | | | | | | | | | |
| | | | | Goldman Sachs Mid Cap Growth Fund |
| | |
| | | | | Institutional Shares |
| | |
| | | | | Year Ended December 31,(a) |
| | | | | | |
| | | | | 2023 | | 2022 | | 2021 | | 2020 | | 2019 |
| | | | | | |
| | Per Share Data | | | | | | | | | | | | | | | | | | | | | | | | | |
| | | | | | |
| | | Net asset value, beginning of year | | | $ | 9.32 | | | | $ | 13.05 | | | | $ | 13.93 | | | | $ | 11.50 | | | | $ | 10.51 | |
| | | |
| | | | | | |
| | Net investment loss(b) | | | | (0.01 | ) | | | | (0.02 | ) | | | | (0.07 | ) | | | | (0.04 | ) | | | | (0.01) | |
| | | | | | |
| | Net realized and unrealized gain (loss) | | | | 1.75 | | | | | (3.38 | ) | | | | 1.71 | | | | | 5.06 | | | | | 3.59 | |
| | | |
| | | | | | |
| | Total from investment operations | | | | 1.74 | | | | | (3.40 | ) | | | | 1.64 | | | | | 5.02 | | | | | 3.58 | |
| | | |
| | | | | | |
| | Distributions to shareholders from net realized gains | | | | (0.07 | ) | | | | (0.33 | ) | | | | (2.52 | ) | | | | (2.59 | ) | | | | (2.59) | |
| | | |
| | | | | | |
| | Net asset value, end of year | | | $ | 10.99 | | | | $ | 9.32 | | | | $ | 13.05 | | | | $ | 13.93 | | | | $ | 11.50 | |
| | | |
| | | | | | |
| | Total Return(c) | | | | 18.68 | % | | | | (26.20 | )% | | | | 11.65 | % | | | | 44.33 | % | | | | 34.35% | |
| | | |
| | | | | | |
| | Net assets, end of year (in 000’s) | | | $ | 1,408 | | | | $ | 1,132 | | | | $ | 483 | | | | $ | 151 | | | | $ | 94 | |
| | | | | | |
| | Ratio of net expenses to average net assets | | | | 0.83 | % | | | | 0.82 | % | | | | 0.83 | % | | | | 0.85 | % | | | | 0.88% | |
| | | | | | |
| | Ratio of total expenses to average net assets | | | | 1.15 | % | | | | 1.20 | % | | | | 1.33 | % | | | | 1.23 | % | | | | 1.26% | |
| | | | | | |
| | Ratio of net investment loss to average net assets | | | | (0.06 | )% | | | | (0.16 | )% | | | | (0.47 | )% | | | | (0.34 | )% | | | | (0.12)% | |
| | | | | | |
| | Portfolio turnover rate(d) | | | | 63 | % | | | | 59 | % | | | | 50 | % | | | | 71 | % | | | | 75% | |
| | | |
| | (a) | All per share amounts representing data prior to May 17, 2019 have been adjusted to reflect a 4 to 1 reverse stock split which occurred on that date. |
| | (b) | Calculated based on the average shares outstanding methodology. |
| | (c) | Assumes investment at the NAV at the beginning of the year, reinvestment of all dividends and distributions, a complete redemption of the investment at the NAV at the end of the year and no sales or redemption charges (if any). Total returns would be reduced if a sales or redemption charge was taken into account. Returns do not reflect the impact of taxes to shareholders relating to Fund distributions or the redemption of Fund shares. |
| | (d) | The Fund’s portfolio turnover rate is calculated in accordance with regulatory requirements, without regard to transactions involving short term investments and certain derivatives. If such transactions were included, the Fund’s portfolio turnover rate may be higher. |
| | |
| The accompanying notes are an integral part of these financial statements. | | 85 |
GOLDMAN SACHS VARIABLE INSURANCE TRUST MID CAP GROWTH FUND
|
Financial Highlights (continued) Selected Data for a Share Outstanding Throughout Each Year |
| | | | | | | | | | | | | | | | | | | | | | | | | | | |
| | | | | Goldman Sachs Mid Cap Growth Fund |
| | |
| | | | | Service Shares |
| | |
| | | | | Year Ended December 31,(a) |
| | | | | | |
| | | | | 2023 | | 2022 | | 2021 | | 2020 | | 2019 |
| | | | | | |
| | Per Share Data | | | | | | | | | | | | | | | | | | | | | | | | | |
| | | | | | |
| | | Net asset value, beginning of year | | | $ | 8.68 | | | | $ | 12.20 | | | | $ | 13.19 | | | | $ | 11.00 | | | | $ | 10.15 | |
| | | |
| | | | | | |
| | Net investment loss(b) | | | | (0.02 | ) | | | | (0.03 | ) | | | | (0.09 | ) | | | | (0.06 | ) | | | | (0.02) | |
| | | | | | |
| | Net realized and unrealized gain (loss) | | | | 1.62 | | | | | (3.16 | ) | | | | 1.62 | | | | | 4.84 | | | | | 3.46 | |
| | | |
| | | | | | |
| | Total from investment operations | | | | 1.60 | | | | | (3.19 | ) | | | | 1.53 | | | | | 4.78 | | | | | 3.44 | |
| | | |
| | | | | | |
| | Distributions to shareholders from net realized gains | | | | (0.07 | ) | | | | (0.33 | ) | | | | (2.52 | ) | | | | (2.59 | ) | | | | (2.59) | |
| | | |
| | | | | | |
| | Net asset value, end of year | | | $ | 10.21 | | | | $ | 8.68 | | | | $ | 12.20 | | | | $ | 13.19 | | | | $ | 11.00 | |
| | | |
| | | | | | |
| | Total Return(c) | | | | 18.45 | % | | | | (26.30 | )% | | | | 11.48 | % | | | | 44.16 | % | | | | 34.06% | |
| | | |
| | | | | | |
| | Net assets, end of year (in 000’s) | | | $ | 60,854 | | | | $ | 51,286 | | | | $ | 76,986 | | | | $ | 82,134 | | | | $ | 73,406 | |
| | | | | | |
| | Ratio of net expenses to average net assets | | | | 0.98 | % | | | | 0.98 | % | | | | 0.99 | % | | | | 1.01 | % | | | | 1.04% | |
| | | | | | |
| | Ratio of total expenses to average net assets | | | | 1.40 | % | | | | 1.51 | % | | | | 1.43 | % | | | | 1.48 | % | | | | 1.51% | |
| | | | | | |
| | Ratio of net investment loss to average net assets | | | | (0.22 | )% | | | | (0.36 | )% | | | | (0.62 | )% | | | | (0.50 | )% | | | | (0.28)% | |
| | | | | | |
| | Portfolio turnover rate(d) | | | | 63 | % | | | | 59 | % | | | | 50 | % | | | | 71 | % | | | | 75% | |
| | | |
| | (a) | All per share amounts representing data prior to May 17, 2019 have been adjusted to reflect a 4 to 1 reverse stock split which occurred on that date. |
| | (b) | Calculated based on the average shares outstanding methodology. |
| | (c) | Assumes investment at the NAV at the beginning of the year, reinvestment of all dividends and distributions, a complete redemption of the investment at the NAV at the end of the year and no sales or redemption charges (if any). Total returns would be reduced if a sales or redemption charge was taken into account. Returns do not reflect the impact of taxes to shareholders relating to Fund distributions or the redemption of Fund shares. |
| | (d) | The Fund’s portfolio turnover rate is calculated in accordance with regulatory requirements, without regard to transactions involving short term investments and certain derivatives. If such transactions were included, the Fund’s portfolio turnover rate may be higher. |
| | |
| 86 | | The accompanying notes are an integral part of these financial statements. |
GOLDMAN SACHS VARIABLE INSURANCE TRUST MID CAP VALUE FUND
|
Financial Highlights (continued) Selected Data for a Share Outstanding Throughout Each Year |
| | | | | | | | | | | | | | | | | | | | | | | | | | | |
| | | | | Goldman Sachs Mid Cap Value Fund |
| | |
| | | | | Institutional Shares |
| | |
| | | | | Year Ended December 31, |
| | | | | | |
| | | | | 2023 | | 2022 | | 2021 | | 2020 | | 2019 |
| | | | | | |
| | Per Share Data | | | | | | | | | | | | | | | | | | | | | | | | | |
| | | | | | |
| | | Net asset value, beginning of year | | | $ | 14.89 | | | | $ | 19.53 | | | | $ | 17.23 | | | | $ | 16.22 | | | | $ | 12.89 | |
| | | |
| | | | | | |
| | Net investment income(a) | | | | 0.14 | | | | | 0.16 | | | | | 0.09 | | | | | 0.10 | | | | | 0.13 | |
| | | | | | |
| | Net realized and unrealized gain (loss) | | | | 1.53 | | | | | (1.98 | ) | | | | 5.20 | | | | | 1.26 | | | | | 3.93 | |
| | | |
| | | | | | |
| | Total from investment operations | | | | 1.67 | | | | | (1.82 | ) | | | | 5.29 | | | | | 1.36 | | | | | 4.06 | |
| | | |
| | | | | | |
| | Distributions to shareholders from net investment income | | | | (0.16 | ) | | | | (0.13 | ) | | | | (0.10 | ) | | | | (0.10 | ) | | | | (0.13) | |
| | | | | | |
| | Distributions to shareholders from net realized gains | | | | (0.39 | ) | | | | (2.69 | ) | | | | (2.89 | ) | | | | (0.25 | ) | | | | (0.60) | |
| | | |
| | | | | | |
| | Total distributions | | | | (0.55 | ) | | | | (2.82 | ) | | | | (2.99 | ) | | | | (0.35 | ) | | | | (0.73) | |
| | | |
| | | | | | |
| | Net asset value, end of year | | | $ | 16.01 | | | | $ | 14.89 | | | | $ | 19.53 | | | | $ | 17.23 | | | | $ | 16.22 | |
| | | |
| | | | | | |
| | Total Return(b) | | | | 11.42 | % | | | | (9.99 | )% | | | | 30.95 | % | | | | 8.38 | % | | | | 31.53% | |
| | | |
| | | | | | |
| | Net assets, end of year (in 000’s) | | | $ | 326,257 | | | | $ | 311,440 | | | | $ | 383,315 | | | | $ | 327,376 | | | | $ | 335,229 | |
| | | | | | |
| | Ratio of net expenses to average net assets | | | | 0.84 | % | | | | 0.83 | % | | | | 0.83 | % | | | | 0.84 | % | | | | 0.87% | |
| | | | | | |
| | Ratio of total expenses to average net assets | | | | 0.85 | % | | | | 0.85 | % | | | | 0.85 | % | | | | 0.90 | % | | | | 0.90% | |
| | | | | | |
| | Ratio of net investment income to average net assets | | | | 0.96 | % | | | | 0.89 | % | | | | 0.46 | % | | | | 0.68 | % | | | | 0.85% | |
| | | | | | |
| | Portfolio turnover rate(c) | | | | 92 | % | | | | 75 | % | | | | 63 | % | | | | 111 | % | | | | 89% | |
| | | |
| | (a) | Calculated based on the average shares outstanding methodology. |
| | (b) | Assumes investment at the NAV at the beginning of the year, reinvestment of all dividends and distributions, a complete redemption of the investment at the NAV at the end of the year and no sales or redemption charges (if any). Total returns would be reduced if a sales or redemption charge was taken into account. Returns do not reflect the impact of taxes to shareholders relating to Fund distributions or the redemption of Fund shares. |
| | (c) | The Fund’s portfolio turnover rate is calculated in accordance with regulatory requirements, without regard to transactions involving short term investments and certain derivatives. If such transactions were included, the Fund’s portfolio turnover rate may be higher. |
| | |
| The accompanying notes are an integral part of these financial statements. | | 87 |
GOLDMAN SACHS VARIABLE INSURANCE TRUST MID CAP VALUE FUND
|
Financial Highlights (continued) Selected Data for a Share Outstanding Throughout Each Year |
| | | | | | | | | | | | | | | | | | | | | | | | | | | |
| | | | | Goldman Sachs Mid Cap Value Fund |
| | |
| | | | | Service Shares |
| | |
| | | | | Year Ended December 31, |
| | | | | | |
| | | | | 2023 | | 2022 | | 2021 | | 2020 | | 2019 |
| | | | | | |
| | Per Share Data | | | | | | | | | | | | | | | | | | | | | | | | | |
| | | | | | |
| | | Net asset value, beginning of year | | | $ | 15.07 | | | | $ | 19.73 | | | | $ | 17.39 | | | | $ | 16.37 | | | | $ | 13.01 | |
| | | |
| | | | | | |
| | Net investment income(a) | | | | 0.11 | | | | | 0.10 | | | | | 0.04 | | | | | 0.06 | | | | | 0.10 | |
| | | | | | |
| | Net realized and unrealized gain (loss) | | | | 1.54 | | | | | (1.99 | ) | | | | 5.24 | | | | | 1.28 | | | | | 3.95 | |
| | | |
| | | | | | |
| | Total from investment operations | | | | 1.65 | | | | | (1.89 | ) | | | | 5.28 | | | | | 1.34 | | | | | 4.05 | |
| | | |
| | | | | | |
| | Distributions to shareholders from net investment income | | | | (0.12 | ) | | | | (0.08 | ) | | | | (0.05 | ) | | | | (0.07 | ) | | | | (0.09) | |
| | | | | | |
| | Distributions to shareholders from net realized gains | | | | (0.39 | ) | | | | (2.69 | ) | | | | (2.89 | ) | | | | (0.25 | ) | | | | (0.60) | |
| | | |
| | | | | | |
| | Total distributions | | | | (0.51 | ) | | | | (2.77 | ) | | | | (2.94 | ) | | | | (0.32 | ) | | | | (0.69) | |
| | | |
| | | | | | |
| | Net asset value, end of year | | | $ | 16.21 | | | | $ | 15.07 | | | | $ | 19.73 | | | | $ | 17.39 | | | | $ | 16.37 | |
| | | |
| | | | | | |
| | Total Return(b) | | | | 11.11 | % | | | | (10.23 | )% | | | | 30.57 | % | | | | 8.17 | % | | | | 31.17% | |
| | | |
| | | | | | |
| | Net assets, end of year (in 000’s) | | | $ | 122,734 | | | | $ | 89,460 | | | | $ | 169,283 | | | | $ | 158,909 | | | | $ | 174,896 | |
| | | | | | |
| | Ratio of net expenses to average net assets | | | | 1.09 | % | | | | 1.08 | % | | | | 1.08 | % | | | | 1.09 | % | | | | 1.12% | |
| | | | | | |
| | Ratio of total expenses to average net assets | | | | 1.10 | % | | | | 1.10 | % | | | | 1.10 | % | | | | 1.14 | % | | | | 1.16% | |
| | | | | | |
| | Ratio of net investment income to average net assets | | | | 0.73 | % | | | | 0.56 | % | | | | 0.21 | % | | | | 0.39 | % | | | | 0.66% | |
| | | | | | |
| | Portfolio turnover rate(c) | | | | 92 | % | | | | 75 | % | | | | 63 | % | | | | 111 | % | | | | 89% | |
| | | |
| | (a) | Calculated based on the average shares outstanding methodology. |
| | (b) | Assumes investment at the NAV at the beginning of the year, reinvestment of all dividends and distributions, a complete redemption of the investment at the NAV at the end of the year and no sales or redemption charges (if any). Total returns would be reduced if a sales or redemption charge was taken into account. Returns do not reflect the impact of taxes to shareholders relating to Fund distributions or the redemption of Fund shares. |
| | (c) | The Fund’s portfolio turnover rate is calculated in accordance with regulatory requirements, without regard to transactions involving short term investments and certain derivatives. If such transactions were included, the Fund’s portfolio turnover rate may be higher. |
| | |
| 88 | | The accompanying notes are an integral part of these financial statements. |
GOLDMAN SACHS VARIABLE INSURANCE TRUST SMALL CAP EQUITY INSIGHTS FUND
|
Financial Highlights (continued) Selected Data for a Share Outstanding Throughout Each Year |
| | | | | | | | | | | | | | | | | | | | | | | | | | | |
| | | | | Goldman Sachs Small Cap Equity Insights Fund |
| | |
| | | | | Institutional Shares |
| | |
| | | | | Year Ended December 31, |
| | | | | | |
| | | | | 2023 | | 2022 | | 2021 | | 2020 | | 2019 |
| | | | | | |
| | Per Share Data | | | | | | | | | | | | | | | | | | | | | | | | | |
| | | | | | |
| | | Net asset value, beginning of year | | | $ | 10.40 | | | | $ | 13.08 | | | | $ | 13.51 | | | | $ | 12.62 | | | | $ | 10.37 | |
| | | |
| | | | | | |
| | Net investment income(a) | | | | 0.08 | (b) | | | | 0.07 | (c) | | | | 0.05 | (d) | | | | 0.05 | | | | | 0.06 | |
| | | | | | |
| | Net realized and unrealized gain (loss) | | | | 1.92 | | | | | (2.59 | ) | | | | 3.17 | | | | | 1.03 | | | | | 2.51 | |
| | | |
| | | | | | |
| | Total from investment operations | | | | 2.00 | | | | | (2.52 | ) | | | | 3.22 | | | | | 1.08 | | | | | 2.57 | |
| | | |
| | | | | | |
| | Distributions to shareholders from net investment income | | | | (0.12 | ) | | | | (0.04 | ) | | | | (0.08 | ) | | | | (0.03 | ) | | | | (0.06) | |
| | | | | | |
| | Distributions to shareholders from net realized gains | | | | – | | | | | (0.12 | ) | | | | (3.57 | ) | | | | (0.16 | ) | | | | (0.26) | |
| | | |
| | | | | | |
| | Total distributions | | | | (0.12 | ) | | | | (0.16 | ) | | | | (3.65 | ) | | | | (0.19 | ) | | | | (0.32) | |
| | | |
| | | | | | |
| | Net asset value, end of year | | | $ | 12.28 | | | | $ | 10.40 | | | | $ | 13.08 | | | | $ | 13.51 | | | | $ | 12.62 | |
| | | |
| | | | | | |
| | Total Return(e) | | | | 19.28 | % | | | | (19.38 | )% | | | | 23.79 | % | | | | 8.56 | % | | | | 24.84% | |
| | | |
| | | | | | |
| | Net assets, end of year (in 000’s) | | | $ | 95,809 | | | | $ | 87,877 | | | | $ | 108,716 | | | | $ | 84,887 | | | | $ | 79,791 | |
| | | | | | |
| | Ratio of net expenses to average net assets | | | | 0.82 | % | | | | 0.81 | % | | | | 0.81 | % | | | | 0.81 | % | | | | 0.86% | |
| | | | | | |
| | Ratio of total expenses to average net assets | | | | 0.87 | % | | | | 0.95 | % | | | | 0.93 | % | | | | 1.08 | % | | | | 1.05% | |
| | | | | | |
| | Ratio of net investment income to average net assets | | | | 0.75 | %(b) | | | | 0.65 | %(c) | | | | 0.34 | %(d) | | | | 0.46 | % | | | | 0.51% | |
| | | | | | |
| | Portfolio turnover rate(f) | | | | 152 | % | | | | 163 | % | | | | 172 | % | | | | 147 | % | | | | 125% | |
| | | |
| | (a) | Calculated based on the average shares outstanding methodology. |
| | (b) | Reflects income recognized from special dividends which amounts to $0.03 per share and 0.26% of average net assets. |
| | (c) | Reflects income recognized from special dividends which amounts to $0.02 per share and 0.21% of average net assets. |
| | (d) | Reflects income recognized from special dividends which amounts to $0.03 per share and 0.22% of average net assets. |
| | (e) | Assumes investment at the NAV at the beginning of the year, reinvestment of all dividends and distributions, a complete redemption of the investment at the NAV at the end of the year and no sales or redemption charges (if any). Total returns would be reduced if a sales or redemption charge was taken into account. Returns do not reflect the impact of taxes to shareholders relating to Fund distributions or the redemption of Fund shares. |
| | (f) | The Fund’s portfolio turnover rate is calculated in accordance with regulatory requirements, without regard to transactions involving short term investments and certain derivatives. If such transactions were included, the Fund’s portfolio turnover rate may be higher. |
| | |
| The accompanying notes are an integral part of these financial statements. | | 89 |
GOLDMAN SACHS VARIABLE INSURANCE TRUST SMALL CAP EQUITY INSIGHTS FUND
|
Financial Highlights (continued) Selected Data for a Share Outstanding Throughout Each Year |
| | | | | | | | | | | | | | | | | | | | | | | | | | | |
| | | | | Goldman Sachs Small Cap Equity Insights Fund |
| | |
| | | | | Service Shares |
| | |
| | | | | Year Ended December 31, |
| | | | | | |
| | | | | 2023 | | 2022 | | 2021 | | 2020 | | 2019 |
| | | | | | |
| | Per Share Data | | | | | | | | | | | | | | | | | | | | | | | | | |
| | | | | | |
| | | Net asset value, beginning of year | | | $ | 10.27 | | | | $ | 12.93 | | | | $ | 13.39 | | | | $ | 12.51 | | | | $ | 10.28 | |
| | | |
| | | | | | |
| | Net investment income(a) | | | | 0.06 | (b) | | | | 0.05 | (c) | | | | 0.01 | (d) | | | | 0.02 | | | | | 0.03 | |
| | | | | | |
| | Net realized and unrealized gain (loss) | | | | 1.88 | | | | | (2.58 | ) | | | | 3.14 | | | | | 1.02 | | | | | 2.49 | |
| | | |
| | | | | | |
| | Total from investment operations | | | | 1.94 | | | | | (2.53 | ) | | | | 3.15 | | | | | 1.04 | | | | | 2.52 | |
| | | |
| | | | | | |
| | Distributions to shareholders from net investment income | | | | (0.09 | ) | | | | (0.01 | ) | | | | (0.04 | ) | | | | – | | | | | (0.03) | |
| | | | | | |
| | Distributions to shareholders from net realized gains | | | | – | | | | | (0.12 | ) | | | | (3.57 | ) | | | | (0.16 | ) | | | | (0.26) | |
| | | |
| | | | | | |
| | Total distributions | | | | (0.09 | ) | | | | (0.13 | ) | | | | (3.61 | ) | | | | (0.16 | ) | | | | (0.29) | |
| | | |
| | | | | | |
| | Net asset value, end of year | | | $ | 12.12 | | | | $ | 10.27 | | | | $ | 12.93 | | | | $ | 13.39 | | | | $ | 12.51 | |
| | | |
| | | | | | |
| | Total Return(e) | | | | 18.95 | % | | | | (19.64 | )% | | | | 23.50 | % | | | | 8.34 | % | | | | 24.53% | |
| | | |
| | | | | | |
| | Net assets, end of year (in 000’s) | | | $ | 27,827 | | | | $ | 21,617 | | | | $ | 22,114 | | | | $ | 17,239 | | | | $ | 15,742 | |
| | | | | | |
| | Ratio of net expenses to average net assets | | | | 1.07 | % | | | | 1.06 | % | | | | 1.06 | % | | | | 1.06 | % | | | | 1.10% | |
| | | | | | |
| | Ratio of total expenses to average net assets | | | | 1.12 | % | | | | 1.20 | % | | | | 1.18 | % | | | | 1.33 | % | | | | 1.30% | |
| | | | | | |
| | Ratio of net investment income to average net assets | | | | 0.50 | %(b) | | | | 0.43 | %(c) | | | | 0.09 | %(d) | | | | 0.22 | % | | | | 0.27% | |
| | | | | | |
| | Portfolio turnover rate(f) | | | | 152 | % | | | | 163 | % | | | | 172 | % | | | | 147 | % | | | | 125% | |
| | | |
| | (a) | Calculated based on the average shares outstanding methodology. |
| | (b) | Reflects income recognized from special dividends which amounts to $0.03 per share and 0.26% of average net assets. |
| | (c) | Reflects income recognized from special dividends which amounts to $0.02 per share and 0.21% of average net assets. |
| | (d) | Reflects income recognized from special dividends which amounts to $0.03 per share and 0.22% of average net assets. |
| | (e) | Assumes investment at the NAV at the beginning of the year, reinvestment of all dividends and distributions, a complete redemption of the investment at the NAV at the end of the year and no sales or redemption charges (if any). Total returns would be reduced if a sales or redemption charge was taken into account. Returns do not reflect the impact of taxes to shareholders relating to Fund distributions or the redemption of Fund shares. |
| | (f) | The Fund’s portfolio turnover rate is calculated in accordance with regulatory requirements, without regard to transactions involving short term investments and certain derivatives. If such transactions were included, the Fund’s portfolio turnover rate may be higher. |
| | |
| 90 | | The accompanying notes are an integral part of these financial statements. |
GOLDMAN SACHS VARIABLE INSURANCE TRUST STRATEGIC GROWTH FUND
|
Financial Highlights (continued) Selected Data for a Share Outstanding Throughout Each Year |
| | | | | | | | | | | | | | | | | | | | | | | | | | | |
| | | | | Goldman Sachs Strategic Growth Fund |
| | |
| | | | | Institutional Shares |
| | |
| | | | | Year Ended December 31, |
| | | | | | |
| | | | | 2023 | | 2022 | | 2021 | | 2020 | | 2019 |
| | | | | | |
| | Per Share Data | | | | | | | | | | | | | | | | | | | | | | | | | |
| | | | | | |
| | | Net asset value, beginning of year | | | $ | 9.20 | | | | $ | 16.63 | | | | $ | 15.43 | | | | $ | 11.90 | | | | $ | 9.78 | |
| | | |
| | | | | | |
| | Net investment income (loss)(a) | | | | (0.01 | ) | | | | (0.01 | ) | | | | (0.05 | ) | | | | – | (b) | | | | 0.03 | |
| | | | | | |
| | Net realized and unrealized gain (loss) | | | | 3.84 | | | | | (5.24 | ) | | | | 3.46 | | | | | 4.79 | | | | | 3.43 | |
| | | |
| | | | | | |
| | Total from investment operations | | | | 3.83 | | | | | (5.25 | ) | | | | 3.41 | | | | | 4.79 | | | | | 3.46 | |
| | | |
| | | | | | |
| | Distributions to shareholders from net investment income | | | | – | | | | | – | | | | | – | | | | | (0.01 | ) | | | | (0.04) | |
| | | | | | |
| | Distributions to shareholders from net realized gains | | | | (0.49 | ) | | | | (2.18 | ) | | | | (2.21 | ) | | | | (1.25 | ) | | | | (1.30) | |
| | | |
| | | | | | |
| | Total distributions | | | | (0.49 | ) | | | | (2.18 | ) | | | | (2.21 | ) | | | | (1.26 | ) | | | | (1.34) | |
| | | |
| | | | | | |
| | Net asset value, end of year | | | $ | 12.54 | | | | $ | 9.20 | | | | $ | 16.63 | | | | $ | 15.43 | | | | $ | 11.90 | |
| | | |
| | | | | | |
| | Total Return(c) | | | | 41.94 | % | | | | (32.52 | )% | | | | 21.93 | % | | | | 40.37 | % | | | | 35.53% | |
| | | |
| | | | | | |
| | Net assets, end of year (in 000’s) | | | $ | 160,030 | | | | $ | 122,077 | | | | $ | 187,144 | | | | $ | 167,930 | | | | $ | 129,686 | |
| | | | | | |
| | Ratio of net expenses to average net assets | | | | 0.75 | % | | | | 0.74 | % | | | | 0.73 | % | | | | 0.74 | % | | | | 0.77% | |
| | | | | | |
| | Ratio of total expenses to average net assets | | | | 0.79 | % | | | | 0.82 | % | | | | 0.79 | % | | | | 0.81 | % | | | | 0.85% | |
| | | | | | |
| | Ratio of net investment income (loss) to average net assets | | | | (0.06 | )% | | | | (0.11 | )% | | | | (0.27 | )% | | | | (0.01 | )% | | | | 0.29% | |
| | | | | | |
| | Portfolio turnover rate(d) | | | | 47 | % | | | | 29 | % | | | | 20 | % | | | | 45 | % | | | | 44% | |
| | | |
| | (a) | Calculated based on the average shares outstanding methodology. |
| | (b) | Amount is less than $0.005 per share. |
| | (c) | Assumes investment at the NAV at the beginning of the year, reinvestment of all dividends and distributions, a complete redemption of the investment at the NAV at the end of the year and no sales or redemption charges (if any). Total returns would be reduced if a sales or redemption charge was taken into account. Returns do not reflect the impact of taxes to shareholders relating to Fund distributions or the redemption of Fund shares. |
| | (d) | The Fund’s portfolio turnover rate is calculated in accordance with regulatory requirements, without regard to transactions involving short term investments and certain derivatives. If such transactions were included, the Fund’s portfolio turnover rate may be higher. |
| | |
| The accompanying notes are an integral part of these financial statements. | | 91 |
GOLDMAN SACHS VARIABLE INSURANCE TRUST STRATEGIC GROWTH FUND
|
Financial Highlights (continued) Selected Data for a Share Outstanding Throughout Each Year |
| | | | | | | | | | | | | | | | | | | | | | | | | | | |
| | | | | Goldman Sachs Strategic Growth Fund |
| | |
| | | | | Service Shares |
| | |
| | | | | Year Ended December 31, |
| | | | | | |
| | | | | 2023 | | 2022 | | 2021 | | 2020 | | 2019 |
| | | | | | |
| | Per Share Data | | | | | | | | | | | | | | | | | | | | | | | | | |
| | | | | | |
| | | Net asset value, beginning of year | | | $ | 9.12 | | | | $ | 16.55 | | | | $ | 15.41 | | | | $ | 11.91 | | | | $ | 9.78 | |
| | | |
| | | | | | |
| | Net investment income (loss)(a) | | | | (0.03 | ) | | | | (0.05 | ) | | | | (0.09 | ) | | | | (0.03 | ) | | | | 0.01 | |
| | | | | | |
| | Net realized and unrealized gain (loss) | | | | 3.80 | | | | | (5.20 | ) | | | | 3.44 | | | | | 4.78 | | | | | 3.43 | |
| | | |
| | | | | | |
| | Total from investment operations | | | | 3.77 | | | | | (5.25 | ) | | | | 3.35 | | | | | 4.75 | | | | | 3.44 | |
| | | |
| | | | | | |
| | Distributions to shareholders from net investment income | | | | – | | | | | – | | | | | – | | | | | – | | | | | (0.01) | |
| | | | | | |
| | Distributions to shareholders from net realized gains | | | | (0.49 | ) | | | | (2.18 | ) | | | | (2.21 | ) | | | | (1.25 | ) | | | | (1.30) | |
| | | |
| | | | | | |
| | Total distributions | | | | (0.49 | ) | | | | (2.18 | ) | | | | (2.21 | ) | | | | (1.25 | ) | | | | (1.31) | |
| | | |
| | | | | | |
| | Net asset value, end of year | | | $ | 12.40 | | | | $ | 9.12 | | | | $ | 16.55 | | | | $ | 15.41 | | | | $ | 11.91 | |
| | | |
| | | | | | |
| | Total Return(b) | | | | 41.65 | % | | | | (32.68 | )% | | | | 21.56 | % | | | | 39.98 | % | | | | 35.32% | |
| | | |
| | | | | | |
| | Net assets, end of year (in 000’s) | | | $ | 206,721 | | | | $ | 115,205 | | | | $ | 262,782 | | | | $ | 257,714 | | | | $ | 241,375 | |
| | | | | | |
| | Ratio of net expenses to average net assets | | | | 1.00 | % | | | | 0.99 | % | | | | 0.98 | % | | | | 0.99 | % | | | | 1.02% | |
| | | | | | |
| | Ratio of total expenses to average net assets | | | | 1.03 | % | | | | 1.07 | % | | | | 1.04 | % | | | | 1.06 | % | | | | 1.10% | |
| | | | | | |
| | Ratio of net investment income (loss) to average net assets | | | | (0.31 | )% | | | | (0.38 | )% | | | | (0.52 | )% | | | | (0.24 | )% | | | | 0.04% | |
| | | | | | |
| | Portfolio turnover rate(c) | | | | 47 | % | | | | 29 | % | | | | 20 | % | | | | 45 | % | | | | 44% | |
| | | |
| | (a) | Calculated based on the average shares outstanding methodology. |
| | (b) | Assumes investment at the NAV at the beginning of the year, reinvestment of all dividends and distributions, a complete redemption of the investment at the NAV at the end of the year and no sales or redemption charges (if any). Total returns would be reduced if a sales or redemption charge was taken into account. Returns do not reflect the impact of taxes to shareholders relating to Fund distributions or the redemption of Fund shares. |
| | (c) | The Fund’s portfolio turnover rate is calculated in accordance with regulatory requirements, without regard to transactions involving short term investments and certain derivatives. If such transactions were included, the Fund’s portfolio turnover rate may be higher. |
| | |
| 92 | | The accompanying notes are an integral part of these financial statements. |
GOLDMAN SACHS VARIABLE INSURANCE TRUST U.S. EQUITY INSIGHTS FUND
|
Financial Highlights (continued) Selected Data for a Share Outstanding Throughout Each Year |
| | | | | | | | | | | | | | | | | | | | | | | | | | | |
| | | | | Goldman Sachs U.S. Equity Insights Fund |
| | |
| | | | | Institutional Shares |
| | |
| | | | | Year Ended December 31, |
| | | | | | |
| | | | | 2023 | | 2022 | | 2021 | | 2020 | | 2019 |
| | | | | | |
| | Per Share Data | | | | | | | | | | | | | | | | | | | | | | | | | |
| | | | | | |
| | | Net asset value, beginning of year | | | $ | 15.88 | | | | $ | 20.06 | | | | $ | 20.08 | | | | $ | 17.93 | | | | $ | 15.03 | |
| | | |
| | | | | | |
| | Net investment income(a) | | | | 0.15 | | | | | 0.15 | | | | | 0.18 | | | | | 0.15 | | | | | 0.21 | |
| | | | | | |
| | Net realized and unrealized gain (loss) | | | | 3.63 | | | | | (4.10 | ) | | | | 5.61 | | | | | 2.98 | | | | | 3.57 | |
| | | |
| | | | | | |
| | Total from investment operations | | | | 3.78 | | | | | (3.95 | ) | | | | 5.79 | | | | | 3.13 | | | | | 3.78 | |
| | | |
| | | | | | |
| | Distributions to shareholders from net investment income | | | | (0.13 | ) | | | | (0.14 | ) | | | | (0.19 | ) | | | | (0.16 | ) | | | | (0.23) | |
| | | | | | |
| | Distributions to shareholders from net realized gains | | | | – | | | | | (0.09 | ) | | | | (5.62 | ) | | | | (0.82 | ) | | | | (0.65) | |
| | | |
| | | | | | |
| | Total distributions | | | | (0.13 | ) | | | | (0.23 | ) | | | | (5.81 | ) | | | | (0.98 | ) | | | | (0.88) | |
| | | |
| | | | | | |
| | Net asset value, end of year | | | $ | 19.53 | | | | $ | 15.88 | | | | $ | 20.06 | | | | $ | 20.08 | | | | $ | 17.93 | |
| | | |
| | | | | | |
| | Total Return(b) | | | | 23.81 | % | | | | (19.74 | )% | | | | 29.41 | % | | | | 17.49 | % | | | | 25.21% | |
| | | |
| | | | | | |
| | Net assets, end of year (in 000’s) | | | $ | 279,958 | | | | $ | 242,239 | | | | $ | 317,468 | | | | $ | 267,592 | | | | $ | 256,930 | |
| | | | | | |
| | Ratio of net expenses to average net assets | | | | 0.57 | % | | | | 0.56 | % | | | | 0.55 | % | | | | 0.56 | % | | | | 0.58% | |
| | | | | | |
| | Ratio of total expenses to average net assets | | | | 0.69 | % | | | | 0.72 | % | | | | 0.71 | % | | | | 0.75 | % | | | | 0.76% | |
| | | | | | |
| | Ratio of net investment income to average net assets | | | | 0.83 | % | | | | 0.86 | % | | | | 0.81 | % | | | | 0.85 | % | | | | 1.24% | |
| | | | | | |
| | Portfolio turnover rate(c) | | | | 201 | % | | | | 203 | % | | | | 206 | % | | | | 203 | % | | | | 187% | |
| | | |
| | (a) | Calculated based on the average shares outstanding methodology. |
| | (b) | Assumes investment at the NAV at the beginning of the year, reinvestment of all dividends and distributions, a complete redemption of the investment at the NAV at the end of the year and no sales or redemption charges (if any). Total returns would be reduced if a sales or redemption charge was taken into account. Returns do not reflect the impact of taxes to shareholders relating to Fund distributions or the redemption of Fund shares. |
| | (c) | The Fund’s portfolio turnover rate is calculated in accordance with regulatory requirements, without regard to transactions involving short term investments and certain derivatives. If such transactions were included, the Fund’s portfolio turnover rate may be higher. |
| | |
| The accompanying notes are an integral part of these financial statements. | | 93 |
GOLDMAN SACHS VARIABLE INSURANCE TRUST U.S. EQUITY INSIGHTS FUND
|
Financial Highlights (continued) Selected Data for a Share Outstanding Throughout Each Year |
| | | | | | | | | | | | | | | | | | | | | | | | | | | |
| | | | | Goldman Sachs U.S. Equity Insights Fund |
| | |
| | | | | Service Shares |
| | |
| | | | | Year Ended December 31, |
| | | | | | |
| | | | | 2023 | | 2022 | | 2021 | | 2020 | | 2019 |
| | | | | | |
| | Per Share Data | | | | | | | | | | | | | | | | | | | | | | | | | |
| | | | | | |
| | | Net asset value, beginning of year | | | $ | 16.02 | | | | $ | 20.23 | | | | $ | 20.21 | | | | $ | 18.04 | | | | $ | 15.12 | |
| | | |
| | | | | | |
| | Net investment income(a) | | | | 0.11 | | | | | 0.11 | | | | | 0.14 | | | | | 0.12 | | | | | 0.18 | |
| | | | | | |
| | Net realized and unrealized gain (loss) | | | | 3.66 | | | | | (4.13 | ) | | | | 5.64 | | | | | 2.99 | | | | | 3.58 | |
| | | |
| | | | | | |
| | Total from investment operations | | | | 3.77 | | | | | (4.02 | ) | | | | 5.78 | | | | | 3.11 | | | | | 3.76 | |
| | | |
| | | | | | |
| | Distributions to shareholders from net investment income | | | | (0.08 | ) | | | | (0.10 | ) | | | | (0.14 | ) | | | | (0.12 | ) | | | | (0.19) | |
| | | | | | |
| | Distributions to shareholders from net realized gains | | | | – | | | | | (0.09 | ) | | | | (5.62 | ) | | | | (0.82 | ) | | | | (0.65) | |
| | | |
| | | | | | |
| | Total distributions | | | | (0.08 | ) | | | | (0.19 | ) | | | | (5.76 | ) | | | | (0.94 | ) | | | | (0.84) | |
| | | |
| | | | | | |
| | Net asset value, end of year | | | $ | 19.71 | | | | $ | 16.02 | | | | $ | 20.23 | | | | $ | 20.21 | | | | $ | 18.04 | |
| | | |
| | | | | | |
| | Total Return(b) | | | | 23.59 | % | | | | (19.90 | )% | | | | 29.11 | % | | | | 17.27 | % | | | | 24.93% | |
| | | |
| | | | | | |
| | Net assets, end of year (in 000’s) | | | $ | 43,631 | | | | $ | 41,870 | | | | $ | 61,849 | | | | $ | 54,149 | | | | $ | 55,201 | |
| | | | | | |
| | Ratio of net expenses to average net assets | | | | 0.78 | % | | | | 0.77 | % | | | | 0.77 | % | | | | 0.77 | % | | | | 0.79% | |
| | | | | | |
| | Ratio of total expenses to average net assets | | | | 0.94 | % | | | | 0.97 | % | | | | 0.93 | % | | | | 1.00 | % | | | | 1.01% | |
| | | | | | |
| | Ratio of net investment income to average net assets | | | | 0.62 | % | | | | 0.64 | % | | | | 0.60 | % | | | | 0.63 | % | | | | 1.03% | |
| | | | | | |
| | Portfolio turnover rate(c) | | | | 201 | % | | | | 203 | % | | | | 206 | % | | | | 203 | % | | | | 187% | |
| | | |
| | (a) | Calculated based on the average shares outstanding methodology. |
| | (b) | Assumes investment at the NAV at the beginning of the year, reinvestment of all dividends and distributions, a complete redemption of the investment at the NAV at the end of the year and no sales or redemption charges (if any). Total returns would be reduced if a sales or redemption charge was taken into account. Returns do not reflect the impact of taxes to shareholders relating to Fund distributions or the redemption of Fund shares. |
| | (c) | The Fund’s portfolio turnover rate is calculated in accordance with regulatory requirements, without regard to transactions involving short term investments and certain derivatives. If such transactions were included, the Fund’s portfolio turnover rate may be higher. |
| | |
| 94 | | The accompanying notes are an integral part of these financial statements. |
GOLDMAN SACHS VARIABLE INSURANCE TRUST FUNDS
|
Notes to Financial Statements December 31, 2023 |
Goldman Sachs Variable Insurance Trust (the “Trust” or “VIT”) is a Delaware statutory trust registered under the Investment Company Act of 1940, as amended (the “Act”), as an open-end management investment company. The following table lists those series of the Trust that are included in this report (collectively, the “Funds” or individually a “Fund”), along with their corresponding share classes and respective diversification status under the Act:
| | | | |
| Fund | | Share Classes Offered | | Diversified/ Non-diversified |
| | |
| International Equity Insights | | Institutional and Service | | Diversified |
| | |
| Large Cap Value | | Institutional and Service | | Diversified |
| | |
| Mid Cap Growth | | Institutional and Service | | Diversified |
| | |
| Mid Cap Value | | Institutional and Service | | Diversified |
| | |
| Small Cap Equity Insights | | Institutional and Service | | Diversified |
| | |
| Strategic Growth | | Institutional and Service | | Non-Diversified |
| | |
| U.S. Equity Insights | | Institutional and Service | | Diversified |
Shares of the Trust are offered to separate accounts of participating life insurance companies for the purpose of funding variable annuity contracts and variable life insurance policies.
Goldman Sachs Asset Management, L.P. (“GSAM” or the “Investment Adviser”), an affiliate of Goldman Sachs & Co. LLC (“Goldman Sachs”), serves as investment adviser to the Funds pursuant to management agreements (the “Agreements”) with the Trust.
|
|
2. SIGNIFICANT ACCOUNTING POLICIES |
The financial statements have been prepared in accordance with accounting principles generally accepted in the United States of America (“GAAP”) and require management to make estimates and assumptions that may affect the reported amounts and disclosures. Actual results may differ from those estimates and assumptions. Each Fund is an investment company under GAAP and follows the accounting and reporting guidance applicable to investment companies.
A. Investment Valuation — The Funds’ valuation policy is to value investments at fair value.
B. Investment Income and Investments — Investment income includes interest income, dividend income, and securities lending income, if any. Interest income is accrued daily and adjusted for amortization of premiums and accretion of discounts. Dividend income is recognized on ex-dividend date or, for certain foreign securities, as soon as such information is obtained subsequent to the ex-dividend date. Non-cash dividends, if any, are recorded at the fair market value of the securities received. Investment transactions are reflected on trade date. Realized gains and losses are calculated using identified cost. Investment transactions are recorded on the following business day for daily net asset value (“NAV”) calculations. Investment income is recorded net of any foreign withholding taxes, less any amounts reclaimable. The Funds may file withholding tax reclaims in certain jurisdictions to recover a portion of amounts previously withheld. Any foreign capital gains tax is accrued daily based upon net unrealized gains, and is payable upon sale of such investments. Distributions received from the Funds’ investments in United States (“U.S.”) real estate investment trusts (“REITs”) may be characterized as ordinary income, net capital gain and/or a return of capital. A return of capital is recorded by the Funds as a reduction to the cost basis of the REIT.
For derivative contracts, unrealized gains and losses are recorded daily and become realized gains and losses upon disposition or termination of the contract.
C. Class Allocations and Expenses — Investment income, realized and unrealized gain (loss), if any, and non-class specific expenses of each Fund are allocated daily based upon the proportion of net assets of each class. Non-class specific expenses directly incurred by a Fund are charged to that Fund, while such expenses incurred by the Trust are allocated across the applicable Funds on a straight-line and/or pro-rata basis depending upon the nature of the expenses. Class specific expenses, where applicable, are borne by the respective share classes and include Distribution and Service and Transfer Agency fees.
GOLDMAN SACHS VARIABLE INSURANCE TRUST FUNDS
|
Notes to Financial Statements (continued) December 31, 2023 |
|
|
2. SIGNIFICANT ACCOUNTING POLICIES (continued) |
D. Federal Taxes and Distributions to Shareholders — It is each Fund’s policy to comply with the requirements of the Internal Revenue Code of 1986, as amended (the “Code”), applicable to regulated investment companies and to distribute each year substantially all of its investment company taxable income and capital gains to its shareholders. Accordingly, each Fund is not required to make any provisions for the payment of federal income tax. Distributions to shareholders are recorded on the ex-dividend date. Income and capital gains distributions, if any, are declared and paid at least annually.
Net capital losses, if any, are carried forward to future fiscal years and may be used to the extent allowed by the Code to offset any future capital gains. Losses that are carried forward will retain their character as either short-term or long-term capital losses. Utilization of capital loss carryforwards will reduce the requirement of future capital gains distributions.
The characterization of distributions to shareholders for financial reporting purposes is determined in accordance with federal income tax rules, which may differ from GAAP. The source of each Fund’s distributions may be shown in the accompanying financial statements as either from distributable earnings or capital. Certain components of the Funds’ net assets on the Statements of Assets and Liabilities reflect permanent GAAP/tax differences based on the appropriate tax character.
E. Foreign Currency Translation — The accounting records and reporting currency of a Fund are maintained in U.S. dollars. Assets and liabilities denominated in foreign currencies are translated into U.S. dollars using the current exchange rates at the close of each business day. The effect of changes in foreign currency exchange rates on investments is included within net realized and unrealized gain (loss) on investments. Changes in the value of other assets and liabilities as a result of fluctuations in foreign exchange rates are included in the Statements of Operations within net change in unrealized gain (loss) on foreign currency translation. Transactions denominated in foreign currencies are translated into U.S. dollars on the date the transaction occurred, the effects of which are included within net realized gain (loss) on foreign currency transactions.
|
|
3. INVESTMENTS AND FAIR VALUE MEASUREMENTS |
U.S. GAAP defines the fair value of a financial instrument as the amount that would be received to sell an asset or paid to transfer a liability in an orderly transaction between market participants at the measurement date (i.e., the exit price); the Funds’ policy is to use the market approach. GAAP establishes a fair value hierarchy that prioritizes the inputs to valuation techniques used to measure fair value. The hierarchy gives the highest priority to unadjusted quoted prices in active markets for identical assets or liabilities (Level 1 measurements) and the lowest priority to unobservable inputs (Level 3 measurements). The level in the fair value hierarchy within which the fair value measurement in its entirety falls shall be determined based on the lowest level input that is significant to the fair value measurement in its entirety. The levels used for classifying investments are not necessarily an indication of the risk associated with investing in these investments. The three levels of the fair value hierarchy are described below:
Level 1 — Unadjusted quoted prices in active markets that are accessible at the measurement date for identical, unrestricted assets or liabilities;
Level 2 — Quoted prices in markets that are not active or financial instruments for which significant inputs are observable (including, but not limited to, quoted prices for similar investments, interest rates, foreign exchange rates, volatility and credit spreads), either directly or indirectly;
Level 3 — Prices or valuations that require significant unobservable inputs (including GSAM’s assumptions in determining fair value measurement).
The Board of Trustees (“Trustees”) has approved Valuation Procedures that govern the valuation of the portfolio investments held by the Funds, including investments for which market quotations are not readily available. With respect to the Funds’ investments that do not have readily available market quotations, the Trustees have designated the Adviser as the valuation designee to perform fair valuations pursuant to Rule 2a-5 under the Investment Company Act of 1940 (the “Valuation Designee”). GSAM has day-to-day responsibility for implementing and maintaining internal controls and procedures related to the valuation of the Funds’ investments. To assess the continuing appropriateness of pricing sources and methodologies, GSAM regularly performs price verification procedures and issues challenges as necessary to third party pricing vendors or brokers, and any differences are reviewed in accordance with the Valuation Procedures.
A. Level 1 and Level 2 Fair Value Investments — The valuation techniques and significant inputs used in determining the fair values for investments classified as Level 1 and Level 2 are as follows:
GOLDMAN SACHS VARIABLE INSURANCE TRUST FUNDS
|
|
3. INVESTMENTS AND FAIR VALUE MEASUREMENTS (continued) |
Equity Securities — Equity securities traded on a U.S. securities exchange or the NASDAQ system, or those located on certain foreign exchanges, including but not limited to the Americas, are valued daily at their last sale price or official closing price on the principal exchange or system on which they are traded. If there is no sale or official closing price or such price is believed by GSAM to not represent fair value, equity securities will be valued at the valid closing bid price for long positions and at the valid closing ask price for short positions (i.e. where there is sufficient volume, during normal exchange trading hours). If no valid bid/ask price is available, the equity security will be valued pursuant to the Valuation Procedures and consistent with applicable regulatory guidance. To the extent these investments are actively traded, they are classified as Level 1 of the fair value hierarchy, otherwise they are generally classified as Level 2. Certain equity securities containing unique attributes may be classified as Level 2.
Unlisted equity securities for which market quotations are available are valued at the last sale price on the valuation date, or if no sale occurs, at the last bid price for long positions or the last ask price for short positions, and are generally classified as Level 2. Securities traded on certain foreign securities exchanges are valued daily at fair value determined by an independent fair value service (if available) under the Valuation Procedures and consistent with applicable regulatory guidance. The independent fair value service takes into account multiple factors including, but not limited to, movements in the securities markets, certain depositary receipts, futures contracts and foreign currency exchange rates that have occurred subsequent to the close of the foreign securities exchange. These investments are generally classified as Level 2 of the fair value hierarchy.
Money Market Funds — Investments in the Goldman Sachs Financial Square Government Fund (“Underlying Money Market Fund”) are valued at the NAV per share of the Institutional Share class on the day of valuation. These investments are generally classified as Level 1 of the fair value hierarchy. For information regarding the Underlying Money Market Fund’s accounting policies and investment holdings, please see the Underlying Money Market Fund’s shareholder report.
Derivative Contracts — A derivative is an instrument whose value is derived from underlying assets, indices, reference rates or a combination of these factors. A Fund enters into derivative transactions to hedge against changes in interest rates, securities prices, and/or currency exchange rates, to increase total return, or to gain access to certain markets or attain exposure to other underliers. For financial reporting purposes, cash collateral that has been pledged to cover obligations of a Fund and cash collateral received, if any, is reported separately on the Statements of Assets and Liabilities as either due to broker/receivable for collateral on certain derivative contracts. Non-cash collateral pledged by a Fund, if any, is noted in the Schedules of Investments.
Exchange-traded derivatives, including futures and options contracts, are generally valued at the last sale or settlement price on the exchange where they are principally traded. Exchange-traded options without settlement prices are generally valued at the midpoint of the bid and ask prices on the exchange where they are principally traded (or, in the absence of two-way trading, at the last bid price for long positions and the last ask price for short positions). Exchange-traded derivatives typically fall within Level 1 of the fair value hierarchy. Over-the-counter (“OTC”) and centrally cleared derivatives are valued using market transactions and other market evidence, including market-based inputs to models, calibration to market-clearing transactions, broker or dealer quotations, or other alternative pricing sources. Where models are used, the selection of a particular model to value OTC and centrally cleared derivatives depends upon the contractual terms of, and specific risks inherent in, the instrument, as well as the availability of pricing information in the market. Valuation models require a variety of inputs, including contractual terms, market prices, yield curves, credit curves, measures of volatility, voluntary and involuntary prepayment rates, loss severity rates and correlations of such inputs. For OTC and centrally cleared derivatives that trade in liquid markets, model inputs can generally be verified and model selection does not involve significant management judgment. OTC and centrally cleared derivatives are classified within Level 2 of the fair value hierarchy when significant inputs are corroborated by market evidence.
i. Futures Contracts — Futures contracts are contracts to buy or sell a standardized quantity of a specified commodity or security. Upon entering into a futures contract, a Fund deposits cash or securities in an account on behalf of the broker in an amount sufficient to meet the initial margin requirement. Subsequent payments are made or received by a Fund equal to the daily change in the contract value and are recorded as variation margin receivable or payable with a corresponding offset to unrealized gains or losses.
B. Level 3 Fair Value Investments — To the extent that significant inputs to valuation models and other alternative pricing sources are unobservable, or if quotations are not readily available, or if GSAM believes that such quotations do not accurately reflect fair value, the fair value of a Fund’s investments may be determined under the Valuation Procedures. GSAM, consistent with its procedures and applicable regulatory guidance, may make an adjustment to the most recent valuation prices of either domestic or foreign securities in light of significant events to reflect what it believes to be the fair value of the securities at the time of determining a Fund’s NAV. To the extent investments are valued using single source broker quotations obtained directly from the broker or passed through from third party pricing vendors, such investments are classified as Level 3 investments.
GOLDMAN SACHS VARIABLE INSURANCE TRUST FUNDS
|
Notes to Financial Statements (continued) December 31, 2023 |
|
|
3. INVESTMENTS AND FAIR VALUE MEASUREMENTS (continued) |
C. Fair Value Hierarchy — The following is a summary of the Funds’ investments and derivatives classified in the fair value hierarchy as of December 31, 2023:
| | | | | | | | | | | | |
| International Equity Insights Fund | | | | | | | | | | | | |
| | | |
| Investment Type | | Level 1 | | | Level 2 | | | Level 3 | |
|
| |
| | | |
Assets | | | | | | | | | | | | |
Common Stock and/or Other Equity Investments(a) | | | | | | | | | | | | |
Africa | | $ | — | | | $ | 153,414 | | | $ | — | |
Asia | | | 1,198,160 | | | | 26,354,322 | | | | — | |
Europe | | | 3,005,486 | | | | 54,738,322 | | | | — | |
North America | | | 923,459 | | | | 8,418,225 | | | | — | |
Oceania | | | 570,889 | | | | 7,144,003 | | | | — | |
Investment Company | | | 824 | | | | — | | | | — | |
Securities Lending Reinvestment Vehicle | | | 46,704 | | | | — | | | | — | |
| |
| | | |
Total | | $ | 5,745,522 | | | $ | 96,808,286 | | | $ | — | |
|
| |
| | | |
Derivative Type | | | | | | | | | | | | |
|
| |
| | | |
Assets | | | | | | | | | | | | |
Futures Contracts(b) | | $ | 16,818 | | | $ | — | | | $ | — | |
| |
| | | |
Liabilities | | | | | | | | | | | | |
Futures Contracts(b) | | $ | (4,488 | ) | | $ | — | | | $ | — | |
| |
| | | |
| Large Cap Value Fund | | | | | | | | | | | | |
| | | |
| Investment Type | | Level 1 | | | Level 2 | | | Level 3 | |
|
| |
| | | |
Assets | | | | | | | | | | | | |
| | | |
Common Stock and/or Other Equity Investments(a) | | | | | | | | | | | | |
Europe | | $ | 3,492,973 | | | $ | — | | | $ | — | |
North America | | | 276,343,541 | | | | — | | | | — | |
Investment Company | | | 570,736 | | | | — | | | | — | |
| |
| | | |
Total | | $ | 280,407,250 | | | $ | — | | | $ | — | |
|
| |
| | | |
| Mid Cap Growth Fund | | | | | | | | | | | | |
| | | |
| Investment Type | | Level 1 | | | Level 2 | | | Level 3 | |
|
| |
| | | |
Assets | | | | | | | | | | | | |
| | | |
Common Stock and/or Other Equity Investments(a) | | | | | | | | | | | | |
Asia | | $ | 364,191 | | | $ | — | | | $ | — | |
North America | | | 61,527,944 | | | | — | | | | — | |
Investment Company | | | 342,086 | | | | — | | | | — | |
Securities Lending Reinvestment Vehicle | | | 423,829 | | | | — | | | | — | |
| |
| | | |
Total | | $ | 62,658,050 | | | $ | — | | | $ | — | |
|
| |
GOLDMAN SACHS VARIABLE INSURANCE TRUST FUNDS
|
|
3. INVESTMENTS AND FAIR VALUE MEASUREMENTS (continued) |
| | | | | | | | | | | | |
| Mid Cap Value Fund | | | | | | | | | | | | |
| | | |
| Investment Type | | Level 1 | | | Level 2 | | | Level 3 | |
|
| |
| | | |
Assets | | | | | | | | | | | | |
| | | |
Common Stock and/or Other Equity Investments(a) | | | | | | | | | | | | |
Europe | | $ | 3,989,517 | | | $ | — | | | $ | — | |
North America | | | 439,003,358 | | | | — | | | | — | |
Investment Company | | | 5,349,937 | | | | — | | | | — | |
Securities Lending Reinvestment Vehicle | | | 3,873,716 | | | | — | | | | — | |
| |
| | | |
Total | | $ | 452,216,528 | | | $ | — | | | $ | — | |
|
| |
| | | |
| Small Cap Equity Insights Fund | | | | | | | | | | | | |
| | | |
| Investment Type | | Level 1 | | | Level 2 | | | Level 3 | |
|
| |
| | | |
Assets | | | | | | | | | | | | |
| | | |
Common Stock and/or Other Equity Investments(a) | | | | | | | | | | | | |
Africa | | $ | 787,794 | | | $ | — | | | $ | — | |
Asia | | | 798,849 | | | | — | | | | — | |
Europe | | | 1,180,749 | | | | — | | | | — | |
North America | | | 115,852,567 | | | | — | | | | — | |
South America | | | 1,149,259 | | | | — | | | | — | |
Investment Company | | | 2,158,240 | | | | — | | | | — | |
Securities Lending Reinvestment Vehicle | | | 802,485 | | | | — | | | | — | |
| |
| | | |
Total | | $ | 122,729,943 | | | $ | — | | | $ | — | |
|
| |
| | | |
| Derivative Type | | | | | | | | | | | | |
|
| |
| | | |
Assets | | | | | | | | | | | | |
Futures Contracts(b) | | $ | 138,085 | | | $ | — | | | $ | — | |
| |
| | | |
| Strategic Growth Fund | | | | | | | | | | | | |
| | | |
| Investment Type | | Level 1 | | | Level 2 | | | Level 3 | |
|
| |
| | | |
Assets | | | | | | | | | | | | |
| | | |
Common Stock and/or Other Equity Investments(a) | | | | | | | | | | | | |
Europe | | $ | 5,325,365 | | | $ | — | | | $ | — | |
North America | | | 357,819,033 | | | | — | | | | — | |
Investment Company | | | 3,762,689 | | | | — | | | | — | |
Securities Lending Reinvestment Vehicle | | | 2,531,958 | | | | — | | | | — | |
| |
| | | |
Total | | $ | 369,439,045 | | | $ | — | | | $ | — | |
|
| |
| | | |
| U.S. Equity Insights Fund | | | | | | | | | | | | |
| | | |
| Investment Type | | Level 1 | | | Level 2 | | | Level 3 | |
|
| |
| | | |
Assets | | | | | | | | | | | | |
| | | |
Common Stock and/or Other Equity Investments(a) | | | | | | | | | | | | |
North America | | $ | 321,211,572 | | | $ | — | | | $ | — | |
| |
| | (a) | Amounts are disclosed by continent to highlight the impact of time zone differences between local market close and the calculation of NAV. Security valuations are based on the principal exchange or system on which they are traded, which may differ from country of domicile noted in table. The Fund utilizes fair value model prices provided by an independent third-party fair value service for certain international equity securities resulting in a level 2 classification. |
| | (b) | Amount shown represents unrealized gain (loss) at fiscal year end. |
For further information regarding security characteristics, see the Schedules of Investments.
GOLDMAN SACHS VARIABLE INSURANCE TRUST FUNDS
|
Notes to Financial Statements (continued) December 31, 2023 |
|
|
4. INVESTMENTS IN DERIVATIVES |
The following tables set forth, by certain risk types, the gross value of derivative contracts (not considered to be hedging instruments for accounting disclosure purposes) as of December 31, 2023. These instruments were used as part of the Funds’ investment strategies and to obtain and/or manage exposure related to the risks below. The values in the tables below exclude the effects of cash collateral received or posted pursuant to these derivative contracts, and therefore are not representative of the Funds’ net exposure.
| | | | | | | | | | | | |
| International Equity Insights Fund | | | | | | | | | | |
| | | | |
| Risk | | Statements for Assets and Liabilities | | Assets1 | | | Statements for Assets and Liabilities | | Liabilities1 | |
| | | | |
| Equity | | Variation margin on futures contracts | | $ | 16,818 | | | Variation margin on futures contracts | | $ | (4,488 | ) |
| | | |
| Small Cap Equity Insights Fund | | | | | | | | | | |
| | | | |
| Risk | | Statements for Assets and Liabilities | | Assets1 | | | Statements for Assets and Liabilities | | Liabilities1 | |
| | | | |
| Equity | | Variation margin on futures contracts | | $ | 138,085 | | | | | $ | — | |
| | 1 | Includes unrealized gain (loss) on futures contracts described in the Additional Investment Information sections of the Schedules of Investments. Only the variation margin as of December 31, 2023 is reported within the Statements of Assets and Liabilities. |
The following tables set forth, by certain risk types, the Funds’ gains (losses) related to these derivatives and their indicative volumes for the fiscal year ended December 31, 2023. These gains (losses) should be considered in the context that these derivative contracts may have been executed to create investment opportunities and/or economically hedge certain investments, and accordingly, certain gains (losses) on such derivative contracts may offset certain (losses) gains attributable to investments. These gains (losses) are included in “Net realized gain (loss)” or “Net change in unrealized gain (loss)” on the Statements of Operations:
| | | | | | | | | | |
| International Equity Insights | | | | | | | | |
| | | |
| Risk | | | | | | | | | Net Change in | |
| | | Statement of Operations | | Net Realized Gain (Loss) | | | Unrealized Gain (Loss) | |
| | | |
| Equity | | Net realized gain (loss) from futures contracts/Net change in unrealized gain (loss) on futures contracts | | $ | 165,299 | | | $ | 37,162 | |
| | |
| Small Cap Equity Insights | | | | | | | | |
| | | |
| Risk | | Statement of Operations | | Net Realized Gain (Loss) | | | Net Change in Unrealized Gain (Loss) | |
| | | |
| Equity | | Net realized gain (loss) from futures contracts/Net change in unrealized gain (loss) on futures contracts | | $ | 28,352 | | | $ | 178,838 | |
| | |
| U.S. Equity Insights | | | | | | | | |
| | | |
| Risk | | Statement of Operations | | Net Realized Gain (Loss) | | | Net Change in Unrealized Gain (Loss) | |
| | | |
| Equity | | Net realized gain (loss) from futures contracts/Net change in unrealized gain (loss) on futures contracts | | $ | 478,012 | | | $ | 16,178 | |
GOLDMAN SACHS VARIABLE INSURANCE TRUST FUNDS
|
|
4. INVESTMENTS IN DERIVATIVES (continued) |
For the fiscal year ended December 31, 2023, the relevant values for each derivative type were as follows:
| | |
| | | Average number of |
| | | Contracts(a) |
| | |
| Fund | | Futures Contracts |
| |
International Equity Insights Fund | | 10 |
| |
Small Cap Equity Insights Fund | | 19 |
| |
U.S. Equity Insights Fund | | 9 |
| | (a) | Amounts disclosed represent average number of contracts for futures contracts, based on absolute values, which is indicative of volume of this derivative type, for the months that the Fund held such derivatives during the fiscal year ended December 31, 2023. |
|
|
5. AGREEMENTS AND AFFILIATED TRANSACTIONS |
A. Management Agreement — Under the Agreement, GSAM manages the Funds, subject to the general supervision of the Trustees.
As compensation for the services rendered pursuant to the Agreement, the assumption of the expenses related thereto and administration of the Funds’ business affairs, including providing facilities, GSAM is entitled to a management fee, accrued daily and paid monthly, equal to an annual percentage rate of each Fund’s average daily net assets.
For the fiscal year ended December 31, 2023, contractual and effective net management fees with GSAM were at the following rates:
| | | | | | | | | | | | | | | | | | | | | | | | | | | | |
| | | Contractual Management Rate | | | | Effective Net Management Rate^ | |
| Fund | | First
$1 billion | | Next
$1 billion | | Next
$3 billion | | Next
$3 billion | | Over
$8 billion | | Effective Rate |
|
| |
| | | | | | | |
International Equity Insights | | | 0.81 | % | | | 0.73 | % | | | 0.69 | % | | | 0.68 | % | | | 0.67 | % | | | 0.81 | % | | | 0.79%* | |
|
| |
| | | | | | | |
Large Cap Value | | | 0.72 | | | | 0.65 | | | | 0.62 | | | | 0.60 | | | | 0.59 | | | | 0.72 | | | | 0.68* | |
|
| |
| | | | | | | |
Mid Cap Growth | | | 0.87 | | | | 0.87 | | | | 0.78 | | | | 0.74 | | | | 0.73 | | | | 0.87 | | | | 0.80* | |
|
| |
| | | | | | | |
Mid Cap Value | | | 0.77 | | | | 0.77 | | | | 0.69 | | | | 0.66 | | | | 0.65 | | | | 0.77 | | | | 0.77 | |
|
| |
| | | | | | | |
Small Cap Equity Insights | | | 0.70 | | | | 0.70 | | | | 0.63 | | | | 0.60 | | | | 0.59 | | | | 0.70 | | | | 0.70 | |
|
| |
| | | | | | | |
Strategic Growth | | | 0.71 | | | | 0.64 | | | | 0.61 | | | | 0.59 | | | | 0.58 | | | | 0.71 | | | | 0.71 | |
|
| |
| | | | | | | |
U.S. Equity Insights | | | 0.62 | | | | 0.59 | | | | 0.56 | | | | 0.55 | | | | 0.54 | | | | 0.62 | | | | 0.54* | |
|
| |
| | ^ | Effective Net Management Rate includes the impact of management fee waivers of affiliated Underlying Funds, if any. The Effective Net Management Rate may not correlate to the Contractual Management Rate as a result of management fee waivers that may be in effect from time to time. |
| | * | GSAM agreed to waive a portion of its management fee in order to achieve an effective net management rate as defined in the Funds’ most recent prospectus. This waiver will remain in effect through at least April 28, 2024, and prior to such date GSAM may not terminate the arrangement without approval of the Trustees. |
The International Equity Insights, Large Cap Value, Mid Cap Growth, Mid Cap Value, Small Cap Equity Insights, Strategic Growth and U.S. Equity Insights Funds invest in Institutional Shares of the Goldman Sachs Financial Square Government Fund, which is an affiliated Underlying Fund. GSAM has agreed to waive a portion of its management fee payable by the Funds in an amount equal to the management fee it earns as an investment adviser to the affiliated Underlying Fund in which the Funds invest, except those management fees it earns from the Funds’ investments of cash collateral received in connection with securities lending transactions in the Goldman Sachs Financial Square Government Fund. For the fiscal year ended December 31, 2023, with respect to the Funds’ investments in an affiliated Underlying Fund GSAM waived $27, $3,140, $2,865, $8,061, $1,598, $4,054 and $64 of the International Equity Insights, Large Cap Value, Mid Cap Growth, Mid Cap Value, Small Cap Equity Insights, Strategic Growth and U.S.Equity Insights Funds’ management fees, respectively.
B. Distribution and/or Service (12b-1) Plans — The Trust, on behalf of Service Shares of each Fund, has adopted a Distribution and Service Plan subject to Rule 12b-1 under the Act. Under the Distribution and Service Plan, Goldman Sachs, which serves as distributor (the “Distributor”), is entitled to a fee accrued daily and paid monthly for distribution services and personal and account maintenance services, which may then be paid by Goldman Sachs to authorized dealers, equal to, on an annual basis, 0.25% of the Funds’ average daily net assets attributable to Service Shares. For the fiscal year ended December 31, 2023 for the U.S.
GOLDMAN SACHS VARIABLE INSURANCE TRUST FUNDS
|
Notes to Financial Statements (continued) December 31, 2023 |
|
|
5. AGREEMENTS AND AFFILIATED TRANSACTIONS (continued) |
Equity Insights Fund, Goldman Sachs agreed to waive distribution and services fees so as not to exceed an annual rate of 0.21% of average daily net assets attributable to Service Shares. For the fiscal year ended December 31, 2023 for the Mid Cap Growth Fund, Goldman Sachs agreed to waive distribution and services fees so as not to exceed an annual rate of 0.15% of average daily net assets attributable to Service Shares. These distribution and service fee waivers will remain in place through at least April 28, 2024, and prior to such date Goldman Sachs may not terminate the arrangement without the approval of the Trustees.
C. Transfer Agency Agreement — Goldman Sachs also serves as the transfer agent of the Funds for a fee pursuant to the Transfer Agency Agreement. The fees charged for such transfer agency services are accrued daily and paid monthly at an annual rate of 0.02% of the average daily net assets of Institutional and Service Shares. Goldman Sachs has agreed to waive its transfer agency fee attributable to the Service Shares of the Large Cap Value Fund. This arrangement will remain in place through at least April 28, 2024, and prior to such date Goldman Sachs may not terminate the arrangement without approval of the Board of Trustees.
D. Other Expense Agreements and Affiliated Transactions — GSAM has agreed to reduce or limit certain “Other Expenses” of the Funds (excluding acquired fund fees and expenses, transfer agency fees and expenses, service fees and shareholder administration fees (as applicable), taxes, interest, brokerage fees, expenses of shareholder meetings, litigation and indemnification, and extraordinary expenses) to the extent such expenses exceed, on an annual basis, a percentage rate of the average daily net assets of each Fund. Such Other Expense reimbursements, if any, are accrued daily and paid monthly. In addition, the Funds are not obligated to reimburse GSAM for prior fiscal year expense reimbursements, if any. The Other Expense limitations as an annual percentage rate of average daily net assets for the International Equity Insights, Large Cap Value, Mid Cap Growth, Mid Cap Value, Small Cap Equity Insights, Strategic Growth and U.S. Equity Insights Funds are 0.004%, 0.004%, 0.004%, 0.054%, 0.094%, 0.014% and 0.004%, respectively. These Other Expense limitations will remain in place through at least April 28, 2024, and prior to such date GSAM may not terminate the arrangements without the approval of the Trustees. In addition, the Funds have entered into certain offset arrangements with the custodian and the transfer agent, which may result in a reduction of the Funds’ expenses and are received irrespective of the application of the “Other Expense” limitations described above.
For the fiscal year ended December 31, 2023, these expense reductions, including any fee waivers and Other Expense reimbursements, were as follows:
| | | | | | | | | | | | | | | | | | | | | | | | | |
| | | Management | | Transfer Agency | | Distribution and | | Other Expense | | Total Expense |
| Fund | | Fee Waiver | | Waiver/Credits | | Service Fee Waiver | | Reimbursements | | Reductions |
| | | | | |
International Equity Insights | | | $ | 20,472 | | | | $ | – | | | | $ | – | | | | $ | 270,651 | | | | $ | 291,123 | |
| | | | | |
Large Cap Value | | | | 139,590 | | | | | 44,315 | | | | | – | | | | | 147,512 | | | | | 331,417 | |
| | | | | |
Mid Cap Growth | | | | 37,169 | | | | | – | | | | | 55,924 | | | | | 145,790 | | | | | 238,883 | |
| | | | | |
Mid Cap Value | | | | 8,061 | | | | | – | | | | | – | | | | | 52,828 | | | | | 60,889 | |
| | | | | |
Small Cap Equity Insights | | | | 1,598 | | | | | – | | | | | – | | | | | 62,183 | | | | | 63,781 | |
| | | | | |
Strategic Growth | | | | 4,054 | | | | | – | | | | | – | | | | | 116,308 | | | | | 120,362 | |
| | | | | |
U.S. Equity Insights | | | | 242,650 | | | | | – | | | | | 16,959 | | | | | 136,464 | | | | | 396,073 | |
E. Line of Credit Facility — As of December 31, 2023, the Funds participated in a $1,110,000,000 committed, unsecured revolving line of credit facility (the “facility”) together with other funds of the Trust and certain registered investment companies having management agreements with GSAM or its affiliates. This facility is to be used for temporary emergency purposes, or to allow for an orderly liquidation of securities to meet redemption requests. The interest rate on borrowings is based on the federal funds rate. The facility also requires a fee to be paid by the Funds based on the amount of the commitment that has not been utilized. For the fiscal year ended December 31, 2023, the Funds did not have any borrowings under the facility. Prior to April 19, 2023, the facility was $1,250,000,000.
F. Other Transactions with Affiliates — For the fiscal year ended December 31, 2023, Goldman Sachs earned $9,537, $918, $3,169 and $2,421 in brokerage commissions from portfolio transactions, including futures transactions executed with Goldman Sachs as the Futures Commission Merchant, on behalf of the Large Cap Value, Mid Cap Growth, Mid Cap Value and Strategic Growth Funds, respectively.
GOLDMAN SACHS VARIABLE INSURANCE TRUST FUNDS
|
|
5. AGREEMENTS AND AFFILIATED TRANSACTIONS (continued) |
The following table provides information about the Funds’ investment in the Goldman Sachs Financial Square Government Fund as of and for the fiscal year ended December 31, 2023:
International Equity Insights Fund
| | | | | | | | | | | | | | | | | | | | | | | | |
| | | Beginning value | | | | | | | | | Ending value as | | | Shares as of | | | | |
| | | as of December | | | | | | Proceeds from | | | of December 31, | | | December 31, | | | | |
| Underlying Fund | | 31, 2022 | | | Purchases at Cost | | | Sales | | | 2023 | | | 2023 | | | Dividend Income | |
| |
|
Goldman Sachs Financial Square Government Fund - Institutional Shares | |
| | | | | | |
| | $ | – | | | $ | 4,039,694 | | | $ | (4,038,870 | ) | | $ | 824 | | | | 824 | | | $ | 2,087 | |
| |
| | | | | | |
| Large Cap Value Fund | | | | | | | | | | | | | | | | | | | | | | | | |
| | | | | | |
| | | Beginning value | | | | | | | | | Ending value as | | | Shares as of | | | | |
| | | as of December | | | | | | Proceeds from | | | of December 31, | | | December 31, | | | | |
| Underlying Fund | | 31, 2022 | | | Purchases at Cost | | | Sales | | | 2023 | | | 2023 | | | Dividend Income | |
| |
|
Goldman Sachs Financial Square Government Fund - Institutional Shares | |
| | | | | | |
| | $ | 394,821 | | | $ | 39,715,383 | | | $ | (39,539,468 | ) | | $ | 570,736 | | | | 570,736 | | | $ | 94,961 | |
| |
| | | | | | |
| Mid Cap Growth Fund | | | | | | | | | | | | | | | | | | | | | | | | |
| | | | | | |
| | | Beginning value | | | | | | | | | Ending value as | | | Shares as of | | | | |
| | | as of December | | | | | | Proceeds from | | | of December 31, | | | December 31, | | | | |
| Underlying Fund | | 31, 2022 | | | Purchases at Cost | | | Sales | | | 2023 | | | 2023 | | | Dividend Income | |
| |
|
Goldman Sachs Financial Square Government Fund - Institutional Shares | |
| | | | | | |
| | $ | 2,865,404 | | | $ | 20,746,498 | | | $ | (23,269,816 | ) | | $ | 342,086 | | | | 342,086 | | | $ | 85,776 | |
| |
| | | | | | |
| Mid Cap Value Fund | | | | | | | | | | | | | | | | | | | | | | | | |
| | | | | | |
| | | Beginning value | | | | | | | | | Ending value as | | | Shares as of | | | | |
| | | as of December | | | | | | Proceeds from | | | of December 31, | | | December 31, | | | | |
| Underlying Fund | | 31, 2022 | | | Purchases at Cost | | | Sales | | | 2023 | | | 2023 | | | Dividend Income | |
| |
|
Goldman Sachs Financial Square Government Fund - Institutional Shares | |
| | | | | | |
| | $ | 2,407,505 | | | $ | 186,340,794 | | | $ | (183,398,362 | ) | | $ | 5,349,937 | | | | 5,349,937 | | | $ | 236,468 | |
| |
| | |
| Small Cap Equity Insights Fund | | | | | | | | | |
| | | | | | |
| | | Beginning value | | | | | | | | | Ending value as | | | Shares as of | | | | |
| | | as of December | | | | | | Proceeds from | | | of December 31, | | | December 31, | | | | |
| Underlying Fund | | 31, 2022 | | | Purchases at Cost | | | Sales | | | 2023 | | | 2023 | | | Dividend Income | |
| |
|
Goldman Sachs Financial Square Government Fund - Institutional Shares | |
| | | | | | |
| | $ | 852,072 | | | $ | 13,561,774 | | | $ | (12,255,606 | ) | | $ | 2,158,240 | | | | 2,158,240 | | | $ | 49,383 | |
| |
| | | | | | |
| Strategic Growth Fund | | | | | | | | | | | | | | | | | | | | | | | | |
| | | | | | |
| | | Beginning value | | | | | | | | | Ending value as | | | Shares as of | | | | |
| | | as of December | | | | | | Proceeds from | | | of December 31, | | | December 31, | | | | |
| Underlying Fund | | 31, 2022 | | | Purchases at Cost | | | Sales | | | 2023 | | | 2023 | | | Dividend Income | |
| |
|
Goldman Sachs Financial Square Government Fund - Institutional Shares | |
| | | | | | |
| | $ | 2,849,066 | | | $ | 91,986,373 | | | $ | (91,072,750 | ) | | $ | 3,762,689 | | | | 3,762,689 | | | $ | 119,273 | |
| |
| | | |
| U.S. Equity Insights Fund | | | | | | | | | | | | | |
| | | | | | |
| | | Beginning value | | | | | | | | | Ending value as | | | Shares as of | | | | |
| | | as of December | | | | | | Proceeds from | | | of December 31, | | | December 31, | | | | |
| Underlying Fund | | 31, 2022 | | | Purchases at Cost | | | Sales | | | 2023 | | | 2023 | | | Dividend Income | |
| |
|
Goldman Sachs Financial Square Government Fund - Institutional Shares | |
| | | | | | |
| | $ | – | | | $ | 8,674,124 | | | $ | (8,674,124 | ) | | $ | – | | | | – | | | $ | 23,218 | |
| |
GOLDMAN SACHS VARIABLE INSURANCE TRUST FUNDS
|
Notes to Financial Statements (continued) December 31, 2023 |
|
|
6. PORTFOLIO SECURITIES TRANSACTIONS |
The cost of purchases and proceeds from sales and maturities of long-term securities for the year ended December 31, 2023, were as follows:
| | | | | | |
| Fund | | Purchases | | | Sales |
| | |
International Equity Insights | | $ | 161,953,055 | | | $ 165,589,815 |
| | |
Large Cap Value | | | 195,070,165 | | | 327,867,402 |
| | |
Mid Cap Growth | | | 37,784,823 | | | 35,115,479 |
| | |
Mid Cap Value | | | 383,018,042 | | | 374,812,023 |
| | |
Small Cap Equity Insights | | | 171,820,293 | | | 178,094,332 |
| | |
Strategic Growth | | | 168,953,661 | | | 150,044,007 |
| | |
U.S. Equity Insights | | | 603,986,397 | | | 626,955,128 |
The Large Cap Value, Mid Cap Growth, Mid Cap Value and Strategic Growth Funds may lend their securities through a securities lending agent, the Bank of New York Mellon (“BNYM”), to certain qualified borrowers. Pursuant to exemptive relief granted by the Securities and Exchange Commission (“SEC”) and the terms and conditions contained therein, the International Equity Insights, Small Cap Equity Insights and U. S. Equity Insights Funds may lend their securities through a securities lending agent, Goldman Sachs Agency Lending (“GSAL”), a wholly-owned subsidiary of Goldman Sachs, to certain qualified borrowers including Goldman Sachs and affiliates. In accordance with the Funds’ securities lending procedures, the Funds receive cash collateral at least equal to the market value of the securities on loan. The market value of the loaned securities is determined at the close of business of the Funds, at their last sale price or official closing price on the principal exchange or system on which they are traded, and any additional required collateral is delivered to the Funds on the next business day. As with other extensions of credit, the Funds may experience delay in the recovery of their securities or incur a loss should the borrower of the securities breach its agreement with the Funds or become insolvent at a time when the collateral is insufficient to cover the cost of repurchasing securities on loan. Dividend income received from securities on loan may not be subject to withholding taxes and therefore withholding taxes paid may differ from the amounts listed in the Statements of Operations. Loans of securities are terminable at any time and as such 1) the remaining contractual maturities of the outstanding securities lending transactions are considered to be overnight and continuous and 2) the borrower, after notice, is required to return borrowed securities within the standard time period for settlement of securities transactions.
The International Equity Insights, Large Cap Value, Mid Cap Growth, Mid Cap Value, Small Cap Equity Insights, Strategic Growth and U.S. Equity Insights Funds invest the cash collateral received in connection with securities lending transactions in the Goldman Sachs Financial Square Government Fund (“Government Money Market Fund”), an affiliated series of the Goldman Sachs Trust. The Government Money Market Fund is registered under the Act as an open end investment company, is subject to Rule 2a-7 under the Act, and is managed by GSAM, for which GSAM may receive a management fee of up to 0.16% on an annualized basis of the average daily net assets of the Government Money Market Fund.
In the event of a default by a borrower with respect to any loan, GSAL will, and BNYM may, exercise any and all remedies provided under the applicable borrower agreement to make the Funds whole. These remedies include purchasing replacement securities by applying the collateral held from the defaulting broker against the purchase cost of the replacement securities. If GSAL or BNYM are unable to purchase replacement securities, GSAL and/or BNYM will indemnify the Funds by paying the Funds an amount equal to the market value of the securities loaned minus the value of cash collateral received from the borrower for the loan, subject to an exclusion for any shortfalls resulting from a loss of value in such cash collateral due to reinvestment risk. The Funds’ master netting agreements with certain borrowers provide the right, in the event of a default (including bankruptcy or insolvency), for the non-defaulting party to liquidate the collateral and calculate net exposure to the defaulting party or request additional collateral. However, in the event of a default by a borrower, a resolution authority could determine that such rights
GOLDMAN SACHS VARIABLE INSURANCE TRUST FUNDS
|
|
7. SECURITIES LENDING (continued) |
are not enforceable due to the restrictions or prohibitions against the right of set-off that may be imposed in accordance with a particular jurisdiction’s bankruptcy or insolvency laws. The Funds’ loaned securities were all subject to enforceable Securities Lending Agreements and the value of the collateral was at least equal to the value of the cash received. The amounts of the Funds’ overnight and continuous agreements, which represent the gross amounts of recognized liabilities for securities lending transactions outstanding as of December 31, 2023, are disclosed as “Payable upon return of securities loaned” on the Statements of Assets and Liabilities, where applicable.
Each of the Funds, GSAL and BNYM received compensation relating to the lending of the Funds’ securities. The amounts earned, if any, by the Funds’ for the fiscal year ended December 31, 2023, are reported under Investment Income on the Statements of Operations.
The table below details securities lending activity with affiliates of Goldman Sachs:
| | | | | | | | | | | | |
| | | For the Fiscal Year Ended December 31, 2023 | | | | |
| | | | | | | | | Amounts Payable to | |
| | | Earnings of GSAL | | | Amounts Received | | | Goldman Sachs | |
| | | Relating to | | | by the Funds | | | Upon Return of | |
| | | Securities | | | from Lending to | | | Securities Loaned as of | |
| Fund | | Loaned | | | Goldman Sachs | | | December 31, 2023 | |
| | | |
International Equity Insights | | $ | 1,418 | | | $ | — | | | $ | — | |
| | | |
Small Cap Equity Insights | | | 2,336 | | | | 958 | | | | 49,555 | |
| | | |
U.S. Equity Insights | | | 12 | | | | — | | | | — | |
The following table provides information about the Funds’ investments in the Government Money Market Fund for the fiscal year ended December 31, 2023.
| | | | | | | | | | | | | | | | |
| | | Beginning value as | | | Purchases | | | Proceeds | | | Ending value as | |
| Fund | | of December 31, 2022 | | | at Cost | | | from Sales | | | of December 31, 2023 | |
| | | | |
International Equity Insights Fund | | $ | 166,392 | | | $ | 5,890,661 | | | $ | (6,010,349 | ) | | $ | 46,704 | |
| | | | |
Large Cap Value Fund | | | — | | | | 1,997,831 | | | | (1,997,831 | ) | | | — | |
| | | | |
Mid Cap Growth Fund | | | — | | | | 1,987,279 | | | | (1,563,450 | ) | | | 423,829 | |
| | | | |
Mid Cap Value Fund | | | — | | | | 9,590,315 | | | | (5,716,599 | ) | | | 3,873,716 | |
| | | | |
Small Cap Equity Insights Fund | | | 1,025,843 | | | | 9,869,557 | | | | (10,092,915 | ) | | | 802,485 | |
| | | | |
Strategic Growth Fund | | | — | | | | 5,471,113 | | | | (2,939,155 | ) | | | 2,531,958 | |
| | | | |
U.S. Equity Insights Fund | | | — | | | | 1,606,850 | | | | (1,606,850 | ) | | | — | |
The tax character of distributions paid during the year ended December 31, 2023 were as follows:
| | | | | | | | | | | | | | | | |
| | | International Equity | | | | | | | | | | |
| | | Insights | | | Large Cap Value | | | Mid Cap Growth | | | Mid Cap Value | |
| | | | |
Distributions paid from: | | | | | | | | | | | | | | | | |
| | | | |
Ordinary Income | | $ | 2,571,490 | | | $ | 8,407,577 | | | $ | — | | | $ | 3,812,681 | |
| | | | |
Net long-term capital gains | | | — | | | | 19,654,854 | | | | 389,909 | | | | 10,005,084 | |
| | | | |
Total distributions | | $ | 2,571,490 | | | $ | 28,062,431 | | | $ | 389,909 | | | $ | 13,817,765 | |
GOLDMAN SACHS VARIABLE INSURANCE TRUST FUNDS
|
Notes to Financial Statements (continued) December 31, 2023 |
|
|
8. TAX INFORMATION (continued) |
| | | | | | | | | | | | | | | | |
| | | | | | Small Cap Equity | | | | | | | |
| | | | | | Insights | | | Strategic Growth | | | U.S. Equity Insights | |
| | | | |
Distributions paid from: | | | | | | | | | | | | | | | | |
| | | | |
Ordinary Income | | | | | | $ | 1,098,759 | | | $ | 2,252,217 | | | $ | 1,982,893 | |
| | | | |
Net long-term capital gains | | | | | | | — | | | | 11,786,983 | | | | — | |
| | | | |
Total distributions | | | | | | $ | 1,098,759 | | | $ | 14,039,200 | | | $ | 1,982,893 | |
|
The tax character of distributions paid during the fiscal year ended December 31, 2022 were as follows: | |
| | | | |
| | | International Equity | | | | | | | | | | |
| | | Insights | | | Large Cap Value | | | Mid Cap Growth | | | Mid Cap Value | |
| | | | |
Distributions paid from: | | | | | | | | | | | | | | | | |
| | | | |
Ordinary Income | | $ | 3,021,007 | | | $ | 5,976,350 | | | $ | 55,910 | | | $ | 6,310,139 | |
| | | | |
Net long-term capital gains | | | — | | | | 36,997,158 | | | | 1,887,780 | | | | 59,152,031 | |
| | | | |
Total distributions | | $ | 3,021,007 | | | $ | 42,973,508 | | | $ | 1,943,690 | | | $ | 65,462,170 | |
| | | | |
| | | | | | Small Cap Equity | | | | | | | |
| | | | | | Insights | | | Strategic Growth | | | U.S. Equity Insights | |
| | | | |
Distributions paid from: | | | | | | | | | | | | | | | | |
| | | | |
Ordinary Income | | | | | | $ | 366,699 | | | $ | 2,117,812 | | | $ | 2,459,145 | |
| | | | |
Net long-term capital gains | | | | | | | 1,187,594 | | | | 44,319,555 | | | | 1,599,621 | |
| | | | |
Total distributions | | | | | | $ | 1,554,293 | | | $ | 46,437,367 | | | $ | 4,058,766 | |
As of December 31, 2023, the components of accumulated earnings (losses) on a tax basis were as follows:
| | | | | | | | | | | | | | | | |
| | | International | | | | | | | | | | |
| | | Equity Insights | | | Large Cap Value | | | Mid Cap Growth | | | Mid Cap Value | |
| | | | |
Undistributed ordinary income — net | | $ | 388,623 | | | $ | 1,419,355 | | | $ | — | | | $ | 1,035,568 | |
| | | | |
Undistributed long-term capital gains | | | — | | | | 3,281,746 | | | | 265,775 | | | | 327,008 | |
| | | | |
Total undistributed earnings | | $ | 388,623 | | | $ | 4,701,101 | | | $ | 265,775 | | | $ | 1,362,576 | |
| | | | |
Capital loss carryforwards: | | | | | | | | | | | | | | | | |
| | | | |
Perpetual Short-Term | | | (7,012,126 | ) | | | — | | | | — | | | | — | |
| | | | |
Timing differences — (Real Estate Investment Trusts, late year ordinary loss deferral, and post October loss deferral) | | | — | | | | — | | | | — | | | | (135,469) | |
| | | | |
Unrealized gains (losses) — net | | | 11,613,139 | | | | 57,882,671 | | | | 13,581,011 | | | | 70,875,179 | |
| | | | |
Total accumulated earnings (losses) — net | | $ | 4,989,636 | | | $ | 62,583,772 | | | $ | 13,846,786 | | | $ | 72,102,286 | |
GOLDMAN SACHS VARIABLE INSURANCE TRUST FUNDS
|
|
8. TAX INFORMATION (continued) |
| | | | | | | | | | | | |
| | | Small Cap Equity Insights | | | Strategic Growth | | | U.S. Equity Insights | |
| | | |
Undistributed ordinary income — net | | $ | 154,608 | | | $ | 1,250,758 | | | $ | 933,575 | |
| | | |
Undistributed long-term capital gains | | | — | | | | 4,596,366 | | | | 1,455,775 | |
| | | |
Total undistributed earnings | | $ | 154,608 | | | $ | 5,847,124 | | | $ | 2,389,350 | |
| | | |
Capital loss carryforwards: | | | | | | | | | | | | |
| | | |
Perpetual Short-Term | | | (10,658,539 | ) | | | — | | | | — | |
| | | |
Timing differences — (Real Estate Investment Trusts and post October loss deferral) | | | (196,458 | ) | | | — | | | | 5,771 | |
| | | |
Unrealized gains (losses) — net | | | 16,001,412 | | | | 190,246,083 | | | | 81,867,846 | |
| | | |
Total accumulated earnings (losses) — net | | $ | 5,301,023 | | | $ | 196,093,207 | | | $ | 84,262,967 | |
For the period ended December 31, 2023, the International Equity Insights, Mid Cap Growth, Small Cap Equity Insights and U.S. Equity Insights utilized $4,382,463, $184,177, $444,958 and $10,172,329, respectively, in Capital Loss Carryforwards.
As of December 31, 2023, the Funds’ aggregate security unrealized gains and losses based on cost for U.S. federal income tax purposes were as follows:
| | | | | | | | | | | | | | | | |
| | | International | | | | | | | | | | |
| | | Equity Insights | | | Large Cap Value | | | Mid Cap Growth | | | Mid Cap Value | |
| | | | |
Tax Cost | | $ | 91,000,464 | | | $ | 222,524,566 | | | $ | 49,077,039 | | | $ | 381,341,349 | |
| | | | |
Gross unrealized gain | | | 13,129,452 | | | | 62,744,267 | | | | 14,392,501 | | | | 75,824,720 | |
| | | | |
Gross unrealized loss | | | (1,516,313 | ) | | | (4,861,596 | ) | | | (811,490 | ) | | | (4,949,541) | |
| | | | |
| Net unrealized gain (loss) | | $ | 11,613,139 | | | $ | 57,882,671 | | | $ | 13,581,011 | | | $ | 70,875,179 | |
| | | | |
| | | | | | Small Cap Equity | | | | | | U.S. Equity | |
| | | | | | Insights | | | Strategic Growth | | | Insights | |
| | | | |
Tax Cost | | | | | | $ | 106,866,616 | | | $ | 179,193,020 | | | $ | 239,343,726 | |
| | | | |
Gross unrealized gain | | | | | | | 20,552,329 | | | | 193,216,624 | | | | 83,495,564 | |
| | | | |
Gross unrealized loss | | | | | | | (4,550,917 | ) | | | (2,970,541 | ) | | | (1,627,718) | |
| | | | |
| Net unrealized gain (loss) | | | | | | $ | 16,001,412 | | | $ | 190,246,083 | | | $ | 81,867,846 | |
The difference between GAAP-basis and tax-basis unrealized gains (losses) is attributable primarily to wash sales, net mark to market gains (losses) on regulated futures and foreign currency contracts, and differences in the tax treatment of passive foreign investment company investments.
The Mid Cap Growth Fund reclassed $121,323 from paid-in capital to distributable earnings. In order to present certain components of the Funds’ capital accounts on a tax-basis, certain reclassifications have been recorded to the Funds’ accounts. These reclassifications have no impact on the net asset value of the Funds and result primarily from net operating losses.
GSAM has reviewed the Funds’ tax positions for all open tax years (the current and prior three years, as applicable) and has concluded that no provision for income tax is required in the Funds’ financial statements. Such open tax years remain subject to examination and adjustment by tax authorities.
GOLDMAN SACHS VARIABLE INSURANCE TRUST FUNDS
|
Notes to Financial Statements (continued) December 31, 2023 |
The Funds’ risks include, but are not limited to, the following:
Foreign and Emerging Countries Risk — Investing in foreign markets may involve special risks and considerations not typically associated with investing in the U.S. Foreign securities may be subject to risk of loss because of more or less foreign government regulation; less public information; less stringent investor protections; less stringent accounting, corporate governance, financial reporting and disclosure standards; and less economic, political and social stability in the countries in which a Fund invests. The imposition of sanctions, exchange controls (including repatriation restrictions), confiscation of assets and property, trade restrictions (including tariffs) and other government restrictions by the U.S. or other governments, or from problems in registration, settlement or custody, may also result in losses. The type and severity of sanctions and other similar measures, including counter sanctions and other retaliatory actions, that may be imposed could vary broadly in scope, and their impact is impossible to predict. For example, the imposition of sanctions and other similar measures could, among other things, cause a decline in the value and/or liquidity of securities issued by the sanctioned country or companies located in or economically tied to the sanctioned country and increase market volatility and disruption in the sanctioned country and throughout the world. Sanctions and other similar measures could limit or prevent a Fund from buying and selling securities (in the sanctioned country and other markets), significantly delay or prevent the settlement of securities transactions, and significantly impact a Fund’s liquidity and performance. Foreign risk also involves the risk of negative foreign currency exchange rate fluctuations, which may cause the value of securities denominated in such foreign currency (or other instruments through which a Fund has exposure to foreign currencies) to decline in value. Currency exchange rates may fluctuate significantly over short periods of time. To the extent that a Fund also invests in securities of issuers located in, or economically tied to, emerging markets, these risks may be more pronounced.
Large Shareholder Transactions Risk — A Fund may experience adverse effects when certain large shareholders, such as other funds, participating insurance companies, accounts and Goldman Sachs affiliates, purchase or redeem large amounts of shares of a Fund. Such large shareholder redemptions, which may occur rapidly or unexpectedly, may cause a Fund to sell portfolio securities at times when it would not otherwise do so, which may negatively impact a Fund’s NAV and liquidity. These transactions may also accelerate the realization of taxable income to shareholders if such sales of investments resulted in gains, and may also increase transaction costs. In addition, a large redemption could result in a Fund’s current expenses being allocated over a smaller asset base, leading to an increase in the Fund’s expense ratio. Similarly, large Fund share purchases may adversely affect a Fund’s performance to the extent that the Fund is delayed in investing new cash or otherwise maintains a larger cash position than it ordinarily would.
Market Risk — The value of the securities in which the Fund invests may go up or down in response to the prospects of individual companies, particular sectors or governments and/or general economic conditions throughout the world due to increasingly interconnected global economies and financial markets. Events such as war, military conflict, acts of terrorism, social unrest, natural disasters, recessions, inflation, rapid interest rate changes, supply chain disruptions, sanctions, the spread of infectious illness or other public health threats could also significantly impact the Fund and its investments.
Mid-Cap and Small-Cap Risk — Investments in mid-capitalization and small-capitalization companies involve greater risks than those associated with larger, more established companies. These securities may be subject to more abrupt or erratic price movements and may lack sufficient market liquidity, and these issuers often face greater business risks.
Non-Diversification Risk — The Strategic Growth Fund is non-diversified, meaning that it is permitted to invest a larger percentage of its assets in one or more issuers or in fewer issuers than diversified mutual funds. Thus, the Fund may be more susceptible to adverse developments affecting any single issuer held in its portfolio, and may be more susceptible to greater losses because of these developments.
Under the Trust’s organizational documents, its Trustees, officers, employees and agents are indemnified, to the extent permitted by the Act and state law, against certain liabilities that may arise out of performance of their duties to the Funds. Additionally, in the course of business, the Funds enter into contracts that contain a variety of indemnification clauses. The Funds’ maximum exposure under these arrangements is unknown, as this would involve future claims that may be made against the Funds that have not yet occurred. However, GSAM believes the risk of loss under these arrangements to be remote.
GOLDMAN SACHS VARIABLE INSURANCE TRUST FUNDS
Pursuant to an effort to consolidate the membership of the Board of Trustees of the Trust (the “Board”) with the Board of Trustees of each of Goldman Sachs ETF Trust, Goldman Sachs ETF Trust II, Goldman Sachs Real Estate Diversified Income Fund, Goldman Sachs Trust II and Goldman Sachs Trust, in July 2023, the Board voted to nominate Cheryl K. Beebe, John G. Chou, Eileen H. Dowling, Lawrence Hughes, John F. Killian, Steven D. Krichmar, Michael Latham, Lawrence W. Stranghoener and Paul C. Wirth (the “Nominees”) for election as Trustees of the Trust. Messrs. Chou and Wirth and Ms. Dowling were serving as Trustees of the Trust at the time of their nominations. At a virtual special joint meeting of shareholders held on November 16, 2023, each of the Nominees (except Messrs. Chou and Wirth and Ms. Dowling) was elected to serve as Trustees alongside the then current Trustees of the Trust, effective January 1, 2024. Each of Messrs. Chou and Wirth and Ms. Dowling was also elected at the meeting and continue to serve as Trustees of the Trust.
All subsequent events after the Statements of Assets and Liabilities date have been evaluated, and GSAM has concluded that there is no impact requiring adjustment or disclosure in the financial statements.
|
|
13. SUMMARY OF SHARE TRANSACTIONS |
Share activity is as follows:
| | | | | | | | | | | | | | | | |
| | | International Equity Insights | |
| | |
| | | For the Fiscal Year Ended | | | For the Fiscal Year Ended | |
| | | December 31, 2023 | | | December 31, 2022 | |
| |
| | | | |
| | | | |
| | | Shares | | | Dollars | | | Shares | | | Dollars | |
| |
| | | | |
| | | | |
Institutional Shares | | | | | | | | | | | | | | | | |
| | | | |
Shares sold | | | 639,858 | | | $ | 5,219,587 | | | | 1,306,039 | | | $ | 10,885,092 | |
| | | | |
Reinvestment of distributions | | | 204,169 | | | | 1,735,435 | | | | 253,079 | | | | 1,971,488 | |
| | | | |
Shares redeemed | | | (975,499 | ) | | | (8,244,985 | ) | | | (733,445 | ) | | | (5,861,784 | ) |
|
| |
| | | | |
| | | (131,472 | ) | | | (1,289,963 | ) | | | 825,673 | | | | 6,994,796 | |
|
| |
| | | | |
Service Shares | | | | | | | | | | | | | | | | |
| | | | |
Shares sold | | | 983,126 | | | | 8,214,040 | | | | 522,850 | | | | 4,549,789 | |
| | | | |
Reinvestment of distributions | | | 97,899 | | | | 836,056 | | | | 134,038 | | | | 1,049,519 | |
| | | | |
Shares redeemed | | | (1,283,597 | ) | | | (10,636,093 | ) | | | (1,042,479 | ) | | | (8,911,581 | ) |
|
| |
| | | | |
| | | (202,572 | ) | | | (1,585,997 | ) | | | (385,591 | ) | | | (3,312,273 | ) |
|
| |
| | | | |
NET INCREASE (DECREASE) IN SHARES | | | (334,044 | ) | | $ | (2,875,960 | ) | | | 440,082 | | | $ | 3,682,523 | |
|
| |
| |
| | | Large Cap Value | |
| | |
| | | For the Fiscal Year Ended | | | For the Fiscal Year Ended | |
| | | December 31, 2023 | | | December 31, 2022 | |
| |
| | | | |
| | | | |
| | | Shares | | | Dollars | | | Shares | | | Dollars | |
| |
| | | | |
| | | | |
Institutional Shares | | | | | | | | | | | | | | | | |
| | | | |
Shares sold | | | 470,506 | | | $ | 3,979,459 | | | | 950,934 | | | $ | 8,789,990 | |
| | | | |
Reinvestment of distributions | | | 1,013,594 | | | | 8,159,428 | | | | 1,876,236 | | | | 16,379,536 | |
| | | | |
Shares redeemed | | | (9,369,532 | ) | | | (80,837,315 | ) | | | (3,426,119 | ) | | | (32,079,665 | ) |
|
| |
| | | | |
| | | (7,885,432 | ) | | | (68,698,428 | ) | | | (598,949 | ) | | | (6,910,139 | ) |
|
| |
GOLDMAN SACHS VARIABLE INSURANCE TRUST FUNDS
|
Notes to Financial Statements (continued) December 31, 2023 |
|
|
13. SUMMARY OF SHARE TRANSACTIONS (continued) |
| | | | | | | | | | | | | | | | |
|
| |
| | | Large Cap Value | |
| | |
| | | For the Fiscal Year Ended | | | For the Fiscal Year Ended | |
| | | December 31, 2023 | | | December 31, 2022 | |
| |
| | | | |
| | | | |
| | | Shares | | | Dollars | | | Shares | | | Dollars | |
| |
| | | | |
| | | | |
Service Shares | | | | | | | | | | | | | | | | |
| | | | |
Shares sold | | | 1,272,592 | | | $ | 10,809,931 | | | | 996,820 | | | $ | 9,307,435 | |
| | | | |
Reinvestment of distributions | | | 2,469,355 | | | | 19,903,003 | | | | 3,046,274 | | | | 26,593,971 | |
| | | | |
Shares redeemed | | | (8,547,313 | ) | | | (73,413,769 | ) | | | (6,321,557 | ) | | | (58,612,498 | ) |
|
| |
| | | | |
| | | (4,805,366 | ) | | | (42,700,835 | ) | | | (2,278,463 | ) | | | (22,711,092 | ) |
|
| |
| | | | |
NET DECREASE IN SHARES | | | (12,690,798 | ) | | $ | (111,399,263 | ) | | | (2,877,412 | ) | | $ | (29,621,231 | ) |
|
| |
| |
| | | Mid Cap Growth | |
| | |
| | | For the Fiscal Year Ended | | | For the Fiscal Year Ended | |
| | | December 31, 2023 | | | December 31, 2022 | |
| |
| | | | |
| | | | |
| | | Shares | | | Dollars | | | Shares | | | Dollars | |
| |
| | | | |
| | | | |
Institutional Shares | | | | | | | | | | | | | | | | |
| | | | |
Shares sold | | | 7,630 | | | $ | 75,000 | | | | 82,652 | | | $ | 879,904 | |
| | | | |
Reinvestment of distributions | | | 826 | | | | 8,516 | | | | 3,921 | | | | 39,168 | |
| | | | |
Shares redeemed | | | (1,848 | ) | | | (19,397 | ) | | | (2,047 | ) | | | (19,226 | ) |
|
| |
| | | | |
| | | 6,608 | | | | 64,119 | | | | 84,526 | | | | 899,846 | |
|
| |
| | | | |
Service Shares | | | | | | | | | | | | | | | | |
| | | | |
Shares sold | | | 1,487,928 | | | | 13,856,487 | | | | 689,640 | | | | 6,396,245 | |
| | | | |
Reinvestment of distributions | | | 39,811 | | | | 381,394 | | | | 204,787 | | | | 1,904,522 | |
| | | | |
Shares redeemed | | | (1,478,625 | ) | | | (13,533,648 | ) | | | (1,294,096 | ) | | | (12,861,876 | ) |
|
| |
| | | | |
| | | 49,114 | | | | 704,233 | | | | (399,669 | ) | | | (4,561,109 | ) |
|
| |
| | | | |
NET INCREASE (DECREASE) IN SHARES | | | 55,722 | | | $ | 768,352 | | | | (315,143 | ) | | $ | (3,661,263 | ) |
|
| |
| |
| | | Mid Cap Value | |
| | |
| | | For the Fiscal Year Ended | | | For the Fiscal Year Ended | |
| | | December 31, 2023 | | | December 31, 2022 | |
| |
| | | | |
| | | | |
| | | Shares | | | Dollars | | | Shares | | | Dollars | |
| |
| | | | |
| | | | |
Institutional Shares | | | | | | | | | | | | | | | | |
| | | | |
Shares sold | | | 1,087,704 | | | $ | 16,521,129 | | | | 644,665 | | | $ | 11,319,610 | |
| | | | |
Reinvestment of distributions | | | 716,251 | | | | 10,908,507 | | | | 3,213,607 | | | | 50,260,811 | |
| | | | |
Shares redeemed | | | (2,344,362 | ) | | | (35,660,701 | ) | | | (2,565,377 | ) | | | (45,341,378 | ) |
|
| |
| | | | |
| | | (540,407 | ) | | | (8,231,065 | ) | | | 1,292,895 | | | | 16,239,043 | |
|
| |
| | | | |
Service Shares | | | | | | | | | | | | | | | | |
| | | | |
Shares sold | | | 10,020,732 | | | | 155,911,471 | | | | 4,528,288 | | | | 81,887,182 | |
| | | | |
Reinvestment of distributions | | | 188,546 | | | | 2,909,257 | | | | 959,682 | | | | 15,201,358 | |
| | | | |
Shares redeemed | | | (8,576,722 | ) | | | (127,280,145 | ) | | | (8,132,136 | ) | | | (140,363,135 | ) |
|
| |
| | | | |
| | | 1,632,556 | | | | 31,540,583 | | | | (2,644,166 | ) | | | (43,274,595 | ) |
|
| |
| | | | |
NET INCREASE (DECREASE) IN SHARES | | | 1,092,149 | | | $ | 23,309,518 | | | | (1,351,271 | ) | | $ | (27,035,552 | ) |
|
| |
GOLDMAN SACHS VARIABLE INSURANCE TRUST FUNDS
|
|
13. SUMMARY OF SHARE TRANSACTIONS (continued) |
| | | | | | | | | | | | | | | | |
| | | Small Cap Equity Insights | |
| | |
| | | For the Fiscal Year Ended
December 31, 2023 | | | For the Fiscal Year Ended
December 31, 2022 | |
| |
| | | | |
| | | | |
| | | Shares | | | Dollars | | | Shares | | | Dollars | |
| |
| | | | |
| | | | |
Institutional Shares | | | | | | | | | | | | | | | | |
| | | | |
Shares sold | | | 790,133 | | | $ | 8,849,615 | | | | 1,292,071 | | | $ | 14,688,216 | |
| | | | |
Reinvestment of distributions | | | 77,874 | | | | 893,220 | | | | 116,516 | | | | 1,287,501 | |
| | | | |
Shares redeemed | | | (1,516,093 | ) | | | (16,664,420 | ) | | | (1,264,967 | ) | | | (14,195,917 | ) |
|
| |
| | | | |
| | | (648,086 | ) | | | (6,921,585 | ) | | | 143,620 | | | | 1,779,800 | |
|
| |
| | | | |
Service Shares | | | | | | | | | | | | | | | | |
| | | | |
Shares sold | | | 436,916 | | | | 4,764,221 | | | | 623,675 | | | | 6,800,371 | |
| | | | |
Reinvestment of distributions | | | 18,141 | | | | 205,539 | | | | 24,431 | | | | 266,792 | |
| | | | |
Shares redeemed | | | (264,510 | ) | | | (2,897,264 | ) | | | (253,528 | ) | | | (2,768,698 | ) |
|
| |
| | | | |
| | | 190,547 | | | | 2,072,496 | | | | 394,578 | | | | 4,298,465 | |
|
| |
| | | | |
NET INCREASE (DECREASE) IN SHARES | | | (457,539 | ) | | $ | (4,849,089 | ) | | | 538,198 | | | $ | 6,078,265 | |
|
| |
| |
| | | Strategic Growth | |
| | |
| | | For the Fiscal Year Ended
December 31, 2023 | | | For the Fiscal Year Ended
December 31, 2022 | |
| |
| | | | |
| | | | |
| | | Shares | | | Dollars | | | Shares | | | Dollars | |
| |
| | | | |
| | | | |
Institutional Shares | | | | | | | | | | | | | | | | |
| | | | |
Shares sold | | | 656,479 | | | $ | 7,335,814 | | | | 650,339 | | | $ | 8,099,060 | |
| | | | |
Reinvestment of distributions | | | 509,674 | | | | 6,080,406 | | | | 2,405,496 | | | | 23,862,524 | |
| | | | |
Shares redeemed | | | (1,682,938 | ) | | | (18,954,996 | ) | | | (1,036,439 | ) | | | (12,855,382 | ) |
|
| |
| | | | |
| | | (516,785 | ) | | | (5,538,776 | ) | | | 2,019,396 | | | | 19,106,202 | |
|
| |
| | | | |
Service Shares | | | | | | | | | | | | | | | | |
| | | | |
Shares sold | | | 8,395,060 | | | | 86,336,595 | | | | 1,076,390 | | | | 12,762,705 | |
| | | | |
Reinvestment of distributions | | | 674,474 | | | | 7,958,794 | | | | 2,294,192 | | | | 22,574,843 | |
| | | | |
Shares redeemed | | | (5,034,990 | ) | | | (54,512,064 | ) | | | (6,611,696 | ) | | | (94,253,137 | ) |
|
| |
| | | | |
| | | 4,034,544 | | | | 39,783,325 | | | | (3,241,114 | ) | | | (58,915,589 | ) |
|
| |
| | | | |
NET INCREASE (DECREASE) IN SHARES | | | 3,517,759 | | | $ | 34,244,549 | | | | (1,221,718 | ) | | $ | (39,809,387 | ) |
|
| |
| |
| | | U.S. Equity Insights | |
| | |
| | | For the Fiscal Year Ended
December 31, 2023 | | | For the Fiscal Year Ended
December 31, 2022 | |
| |
| | | | |
| | | | |
| | | Shares | | | Dollars | | | Shares | | | Dollars | |
| |
| | | | |
| | | | |
Institutional Shares | | | | | | | | | | | | | | | | |
| | | | |
Shares sold | | | 961,566 | | | $ | 16,446,636 | | | | 1,049,282 | | | $ | 18,219,119 | |
| | | | |
Reinvestment of distributions | | | 95,934 | | | | 1,793,960 | | | | 210,737 | | | | 3,548,809 | |
| | | | |
Shares redeemed | | | (1,984,079 | ) | | | (34,900,675 | ) | | | (1,826,212 | ) | | | (31,436,133 | ) |
|
| |
| | | | |
| | | (926,579 | ) | | | (16,660,079 | ) | | | (566,193 | ) | | | (9,668,205 | ) |
|
| |
GOLDMAN SACHS VARIABLE INSURANCE TRUST FUNDS
|
Notes to Financial Statements (continued) December 31, 2023 |
|
|
13. SUMMARY OF SHARE TRANSACTIONS (continued) |
| | | | | | | | | | | | | | | | |
|
| |
| | | U.S. Equity Insights | |
| | |
| | | For the Fiscal Year Ended
December 31, 2023 | | | For the Fiscal Year Ended
December 31, 2022 | |
| |
| | | | |
| | | | |
| | | Shares | | | Dollars | | | Shares | | | Dollars | |
| |
| | | | |
| | | | |
Service Shares | | | | | | | | | | | | | | | | |
| | | | |
Shares sold | | | 35,747 | | | $ | 626,611 | | | | 78,305 | | | $ | 1,349,171 | |
| | | | |
Reinvestment of distributions | | | 10,012 | | | | 188,933 | | | | 30,015 | | | | 509,957 | |
| | | | |
Shares redeemed | | | (446,132 | ) | | | (7,861,997 | ) | | | (550,922 | ) | | | (9,529,595 | ) |
|
| |
| | | | |
| | | (400,373 | ) | | | (7,046,453 | ) | | | (442,602 | ) | | | (7,670,467 | ) |
|
| |
| | | | |
NET DECREASE IN SHARES | | | (1,326,952 | ) | | $ | (23,706,532 | ) | | | (1,008,795 | ) | | $ | (17,338,672 | ) |
|
| |
Report of Independent Registered Public Accounting Firm
To the Board of Trustees of Goldman Sachs Variable Insurance Trust and Shareholders of Goldman Sachs International Equity Insights Fund, Goldman Sachs Large Cap Value Fund, Goldman Sachs Mid Cap Growth Fund, Goldman Sachs Mid Cap Value Fund, Goldman Sachs Small Cap Equity Insights Fund, Goldman Sachs Strategic Growth Fund, and Goldman Sachs U.S. Equity Insights Fund
Opinions on the Financial Statements
We have audited the accompanying statements of assets and liabilities, including the schedules of investments, of Goldman Sachs International Equity Insights Fund, Goldman Sachs Large Cap Value Fund, Goldman Sachs Mid Cap Growth Fund, Goldman Sachs Mid Cap Value Fund, Goldman Sachs Small Cap Equity Insights Fund, Goldman Sachs Strategic Growth Fund, and Goldman Sachs U.S. Equity Insights Fund (seven of the funds constituting Goldman Sachs Variable Insurance Trust, hereafter collectively referred to as the “Funds”) as of December 31, 2023, the related statements of operations for the year ended December 31, 2023, the statements of changes in net assets for each of the two years in the period ended December 31, 2023, including the related notes, and the financial highlights for each of the five years in the period ended December 31, 2023 (collectively referred to as the “financial statements”). In our opinion, the financial statements present fairly, in all material respects, the financial position of each of the Funds as of December 31, 2023, the results of each of their operations for the year then ended, the changes in each of their net assets for each of the two years in the period ended December 31, 2023 and each of the financial highlights for each of the five years in the period ended December 31, 2023 in conformity with accounting principles generally accepted in the United States of America.
Basis for Opinions
These financial statements are the responsibility of the Funds’ management. Our responsibility is to express an opinion on the Funds’ financial statements based on our audits. We are a public accounting firm registered with the Public Company Accounting Oversight Board (United States) (PCAOB) and are required to be independent with respect to the Funds in accordance with the U.S. federal securities laws and the applicable rules and regulations of the Securities and Exchange Commission and the PCAOB.
We conducted our audits of these financial statements in accordance with the standards of the PCAOB. Those standards require that we plan and perform the audit to obtain reasonable assurance about whether the financial statements are free of material misstatement, whether due to error or fraud.
Our audits included performing procedures to assess the risks of material misstatement of the financial statements, whether due to error or fraud, and performing procedures that respond to those risks. Such procedures included examining, on a test basis, evidence regarding the amounts and disclosures in the financial statements. Our audits also included evaluating the accounting principles used and significant estimates made by management, as well as evaluating the overall presentation of the financial statements. Our procedures included confirmation of securities owned as of December 31, 2023 by correspondence with the custodian, transfer agent and brokers; when replies were not received from brokers, we performed other auditing procedures. We believe that our audits provide a reasonable basis for our opinions.
/s/ PricewaterhouseCoopers LLP
Boston, Massachusetts
February 15, 2024
We have served as the auditor of one or more investment companies in the Goldman Sachs fund complex since 2000.
GOLDMAN SACHS VARIABLE INSURANCE TRUST EQUITY FUNDS
Fund Expenses — Six Month Period Ended December 31, 2023 (Unaudited)
As a shareholder of Institutional or Service Shares of the Funds, you incur ongoing costs, including management fees, distribution and/or service (12b-1) fees (with respect to Service Shares) and other Fund expenses. This example is intended to help you understand your ongoing costs (in dollars) of investing in the Institutional Shares and Service Shares of the Funds and to compare these costs with the ongoing costs of investing in other mutual funds.
The example is based on an investment of $1,000 invested at the beginning of the period and held for the entire period from July 1, 2023 through December 31, 2023, which represents a period of 184 days of a 365 day year.
Actual Expenses — The first line under each share class in the table below provides information about actual account values and actual expenses. You may use the information in this line, together with the amount you invested, to estimate the expenses that you paid over the period. Simply divide your account value by $1,000 (for example, an $8,600 account value divided by $1,000=8.6), then multiply the result by the number in the first line under the heading entitled “Expenses Paid” to estimate the expenses you paid on your account during this period.
Hypothetical Example for Comparison Purposes — The second line under each share class in the table below provides information about hypothetical account values and hypothetical expenses based on the Funds’ actual net expense ratio and an assumed rate of return of 5% per year before expenses, which is not the Funds’ actual return. The hypothetical account values and expenses may not be used to estimate the actual ending account balance or expenses you paid for the period. You may use this information to compare the ongoing costs of investing in the Funds and other funds. To do so, compare this 5% hypothetical example with the 5% hypothetical examples that appear in the shareholder reports of the other funds.
Please note that the expenses shown in the table are meant to highlight your ongoing costs only. As a shareholder of the Funds you do not incur any transaction costs, such as sales charges, redemption fees, or exchange fees, but shareholders of other funds may incur such costs. The second line of the table is useful in comparing ongoing costs only and will not help you determine the relative total costs of owning different funds whose shareholders may incur transaction costs.
| | | | | | | | | | | | | | | | | | | | | | | | | | | | | | | | | | | | | | | | | | | | | | | | | | | | | | | | | | | | |
| | | International Equity Insights Fund | | Large Cap Value Fund | | Mid Cap Growth Fund | | Mid Cap Value Fund |
| Share Class | | Beginning
Account Value 7/1/23 | | Ending
Account Value
12/31/23 | | Expenses
Paid for the 6 months ended 12/31/23* | | Beginning
Account Value 7/1/23 | | Ending
Account Value
12/31/23 | | Expenses Paid for the 6 months ended 12/31/23* | | Beginning
Account Value 7/1/23 | | Ending
Account Value
12/31/23 | | Expenses
Paid for the months ended 12/31/23* | | Beginning
Account Value 7/1/23 | | Ending
Account Value
12/31/23 | | Expenses
Paid for the 6 months ended 12/31/23* |
| Institutional | | | | | | | | | | | | | | | | | | | | | | | | | | | | | | | | | | | | | | | | | | | | | | | | | | | | | | | | | | | | |
Actual | | | | $1,000.00 | | | | | $1,059.80 | | | | | $4.26 | | | | | $1,000.00 | | | | | $1,072.30 | | | | | $3.71 | | | | | $1,000.00 | | | | | $1,055.50 | | | | | $4.35 | | | | | $1,000.00 | | | | | $1,057.40 | | | | | $4.36 | |
Hypothetical 5% return | | | | 1,000.00 | | | | | 1,021.07 | + | | | | 4.18 | | | | | 1,000.00 | | | | | 1,021.63 | + | | | | 3.62 | | | | | 1,000.00 | | | | | 1,020.97 | + | | | | 4.28 | | | | | 1,000.00 | | | | | 1,020.97 | + | | | | 4.28 | |
| Service | | | | | | | | | | | | | | | | | | | | | | | | | | | | | | | | | | | | | | | | | | | | | | | | | | | | | | | | | | | | |
Actual | | | | 1,000.00 | | | | | 1,059.10 | | | | | 5.55 | | | | | 1,000.00 | | | | | 1,070.70 | | | | | 4.91 | | | | | 1,000.00 | | | | | 1,054.50 | | | | | 4.61 | | | | | 1,000.00 | | | | | 1,055.70 | | | | | 5.65 | |
Hypothetical 5% return | | | | 1,000.00 | | | | | 1,019.81 | + | | | | 5.45 | | | | | 1,000.00 | | | | | 1,020.47 | + | | | | 4.79 | | | | | 1,000.00 | | | | | 1,020.72 | + | | | | 4.53 | | | | | 1,000.00 | | | | | 1,019.71 | + | | | | 5.55 | |
| + | Hypothetical expenses are based on each Fund’s actual annualized net expense ratios and an assumed rate of return of 5% per year before expenses. |
| * | Expenses are calculated using each Fund’s annualized net expense ratio for each class, which represents the ongoing expenses as a percentage of net assets for the six months ended December 31, 2023. Expenses are calculated by multiplying the annualized net expense ratio by the average account value for the period; then multiplying the result by the number of days in the most recent fiscal half year; and then dividing that result by the number of days in the fiscal year. |
The annualized net expense ratios for the period were as follows:
| | | | | | | | | | |
| Fund | | Institutional | | | Service | | | |
International Equity Insights Fund | | | 0.82% | | | | 1.07% | | | |
Large Cap Value Fund | | | 0.71 | | | | 0.94 | | | |
Mid Cap Growth Fund | | | 0.84 | | | | 0.99 | | | |
Mid Cap Value Fund | | | 0.84 | | | | 1.09 | | | |
114
GOLDMAN SACHS VARIABLE INSURANCE TRUST EQUITY FUNDS
Fund Expenses — Six Month Period Ended December 31, 2023 (Unaudited) (continued)
As a shareholder of Institutional or Service Shares of the Funds, you incur ongoing costs, including management fees, distribution and/or service (12b-1) fees (with respect to Service and Advisor Shares) and other Fund expenses. This example is intended to help you understand your ongoing costs (in dollars) of investing in the Institutional Shares and Service Shares of the Funds and to compare these costs with the ongoing costs of investing in other mutual funds.
The example is based on an investment of $1,000 invested at the beginning of the period and held for the entire period from July 1, 2023 through June 30, 2023, which represents a period of 184 days of a 365 day year.
Actual Expenses — The first line under each share class in the table below provides information about actual account values and actual expenses. You may use the information in this line, together with the amount you invested, to estimate the expenses that you paid over the period. Simply divide your account value by $1,000 (for example, an $8,600 account value divided by $1,000=8.6), then multiply the result by the number in the first line under the heading entitled “Expenses Paid” to estimate the expenses you paid on your account during this period.
Hypothetical Example for Comparison Purposes — The second line under each share class in the table below provides information about hypothetical account values and hypothetical expenses based on the Funds’ actual net expense ratio and an assumed rate of return of 5% per year before expenses, which is not the Funds’ actual return. The hypothetical account values and expenses may not be used to estimate the actual ending account balance or expenses you paid for the period. You may use this information to compare the ongoing costs of investing in the Funds and other funds. To do so, compare this 5% hypothetical example with the 5% hypothetical examples that appear in the shareholder reports of the other funds.
Please note that the expenses shown in the table are meant to highlight your ongoing costs only. As a shareholder of the Funds you do not incur any transaction costs, such as sales charges, redemption fees, or exchange fees, but shareholders of other funds may incur such costs. The second line of the table is useful in comparing ongoing costs only and will not help you determine the relative total costs of owning different funds whose shareholders may incur transaction costs.
| | | | | | | | | | | | | | | | | | | | | | | | | | | | | | | | | | | | | | | | | | | | | |
| | | Small Cap Equity Insights Fund | | Strategic Growth Fund | | U.S. Equity Insights Fund |
| Share Class | | Beginning
Account Value 7/1/23 | | Ending
Account Value
12/31/23 | | Expenses Paid for the 6 months ended 12/31/23* | | Beginning
Account Value 7/1/23 | | Ending
Account Value
12/31/23 | | Expenses Paid for the months ended 12/31/23* | | Beginning
Account Value 7/1/23 | | Ending
Account Value
12/31/23 | | Expenses Paid for the 6 months ended 12/31/23* |
| Institutional | | | | | | | | | | | | | | | | | | | | | | | | | | | | | | | | | | | | | | | | | | | | | |
Actual | | | | $1,000.00 | | | | | $1,078.70 | | | | | $4.30 | | | | | $1,000.00 | | | | | $1,090.90 | | | | | $3.95 | | | | | $1,000.00 | | | | | $1,082.00 | | | | | $2.99 | |
Hypothetical 5% return | | | | 1,000.00 | | | | | 1,021.07 | + | | | | 4.18 | | | | | 1,000.00 | | | | | 1,021.42 | + | | | | 3.82 | | | | | 1,000.00 | | | | | 1,022.33 | + | | | | 2.91 | |
| Service | | | | | | | | | | | | | | | | | | | | | | | | | | | | | | | | | | | | | | | | | | | | | |
Actual | | | | 1,000.00 | | | | | 1,076.30 | | | | | 5.60 | | | | | 1,000.00 | | | | | 1,090.20 | | | | | 5.27 | | | | | 1,000.00 | | | | | 1,081.30 | | | | | 3.88 | |
Hypothetical 5% return | | | | 1,000.00 | | | | | 1,019.81 | + | | | | 5.45 | | | | | 1,000.00 | | | | | 1,020.16 | + | | | | 5.09 | | | | | 1,000.00 | | | | | 1,021.48 | + | | | | 3.77 | |
| + | Hypothetical expenses are based on each Fund’s actual annualized net expense ratios and an assumed rate of return of 5% per year before expenses. |
| * | Expenses are calculated using each Fund’s annualized net expense ratio for each class, which represents the ongoing expenses as a percentage of net assets for the six months ended December 31, 2023. Expenses are calculated by multiplying the annualized net expense ratio by the average account value for the period; then multiplying the result by the number of days in the most recent fiscal half year; and then dividing that result by the number of days in the fiscal year. |
The annualized net expense ratios for the period were as follows:
| | | | | | | | | | |
| Fund | | Institutional | | | Service | | | |
Small Cap Equity Insights Fund | | | 0.82% | | | | 1.07% | | | |
Strategic Growth Fund | | | 0.75 | | | | 1.00 | | | |
U.S. Equity Insights Fund | | | 0.57 | | | | 0.78 | | | |
115
GOLDMAN SACHS VARIABLE INSURANCE TRUST FUNDS
Voting Results of Special Meeting of Shareholders (Unaudited)
A Special Meeting (the “Meeting”) of the Goldman Sachs Variable Insurance Trust (“the Trust”) was held on November 16, 2023 to consider and elect nominees to the Trust’s Board of Trustees. At the Meeting, Cheryl K. Beebe, Lawrence Hughes, John F. Killian, Steven D. Krichmar, Michael Latham and Lawrence W. Stranghoener were elected to the Trust’s Board of Trustees. In addition, at the Meeting, John G. Chou, Eileen H. Dowling and Paul C. Wirth, each of whom was previously appointed to the Trust’s Board of Trustees rather than elected by shareholders, were elected. In electing the nominees, the Trust’s shareholders voted as follows:
| | | | |
Proposal Election of Trustees | | For | | Withheld |
| | |
Cheryl K. Beebe | | 932,148,752 | | 26,776,872 |
| | |
John G. Chou | | 930,378,362 | | 28,547,262 |
| | |
Eileen H. Dowling | | 932,188,448 | | 26,737,175 |
| | |
Lawrence Hughes | | 932,346,926 | | 26,578,698 |
| | |
John F. Killian | | 931,754,574 | | 27,171,049 |
| | |
Steven D. Krichmar | | 932,002,203 | | 26,923,420 |
| | |
Michael Latham | | 931,832,553 | | 27,093,071 |
| | |
Lawrence W. Stranghoener | | 931,376,144 | | 27,549,480 |
| | |
Paul C. Wirth | | 932,041,013 | | 26,884,610 |
| | | | |
GOLDMAN SACHS VARIABLE INSURANCE TRUST EQUITY FUNDS
Trustees and Officers (Unaudited)
Independent Trustees
| | | | | | | | | | |
| | | | | |
Name, Address and Age1 | | Position(s) Held with the Trust | | Term of Office
and Length of
Time Served2 | | Principal Occupations During Past 5 Years | | Number of Portfolios in
Fund Complex
Overseen by
Trustee3 | | Other Directorships Held by Trustee4 |
| | | | | |
Gregory G. Weaver Age: 72 | | Chair of the Board of Trustees | | Since 2023 (Trustee since 2015) | | Mr. Weaver is retired. He is Director, Verizon Communications Inc. (2015-Present); and was formerly Chairman and Chief Executive Officer, Deloitte & Touche LLP (a professional services firm) (2001-2005 and 2012-2014); and Member of the Board of Directors, Deloitte & Touche LLP (2006-2012). Chair of the Board of Trustees — Goldman Sachs Variable Insurance Trust and Goldman Sachs Trust. | | 102 | | Verizon Communications Inc. |
| | | | | |
Dwight L. Bush Age: 66 | | Trustee | | Since 2020 | | The Honorable Dwight Bush is President and CEO of D.L. Bush & Associates (a financial advisory and private investment firm) (2002-2014 and 2017-Present); Director of MoneyLion, Inc. (an operator of a data-driven, digital financial platform) (2021-Present); and was formerly U.S. Ambassador to the Kingdom of Morocco (2014-2017) and a Member of the Board of Directors of Santander Bank, N.A. (2018-2019). Previously, he served as an Advisory Board Member of Goldman Sachs Trust and Goldman Sachs Variable Insurance Trust (October 2019-January 2020). Trustee — Goldman Sachs Variable Insurance Trust and Goldman Sachs Trust. | | 102 | | MoneyLion, Inc. (an operator of a datadriven, digital financial platform) |
| | | | | |
Kathryn A. Cassidy Age: 69 | | Trustee | | Since 2015 | | Ms. Cassidy is retired. She is Director, Vertical Aerospace Ltd. (an aerospace and technology company) (2021-Present). Formerly, Ms. Cassidy was Advisor to the Chairman (May 2014-December 2014); and Senior Vice President and Treasurer (2008-2014), General Electric Company & General Electric Capital Corporation (technology and financial services companies). Trustee — Goldman Sachs Variable Insurance Trust and Goldman Sachs Trust. | | 102 | | Vertical Aerospace Ltd. (an aerospace and technology company) |
| | | | | |
John G. Chou Age: 67 | | Trustee | | Since 2022 | | Mr. Chou is retired. Formerly, he was Executive Vice President and Special Advisor to the Chairman and CEO (2021-2022); Executive Vice President and Chief Legal Officer (2019-2021); Executive Vice President and Chief Legal & Business Officer (2017-2019); and Executive Vice President and General Counsel (2011-2017) of Cencora, Inc. (a pharmaceutical and healthcare company. Trustee — Goldman Sachs Variable Insurance Trust and Goldman Sachs Trust. | | 102 | | None |
| | | | | |
Joaquin Delgado Age: 63 | | Trustee | | Since 2020 | | Dr. Delgado is retired. He is Director, Stepan Company (a specialty chemical manufacturer) (2011-Present); and was formerly Director, Hexion Inc. (a specialty chemical manufacturer) (2019-2022); Executive Vice President, Consumer Business Group of 3M Company (July 2016-July 2019); and Executive Vice President, Health Care Business Group of 3M Company (October 2012-July 2016). Previously, Dr. Delgado served as an Advisory Board Member of Goldman Sachs Trust and Goldman Sachs Variable Insurance Trust (October 2019-January 2020). Trustee — Goldman Sachs Variable Insurance Trust and Goldman Sachs Trust. | | 102 | | Stepan Company (a specialty chemical manufacturer) |
| | | | | | | | | | |
GOLDMAN SACHS VARIABLE INSURANCE TRUST EQUITY FUNDS
Trustees and Officers (Unaudited) (continued)
Independent Trustees
| | | | | | | | | | |
| | | | | |
Name, Address and Age1 | | Position(s) Held with the Trust | | Term of Office
and Length of
Time Served2 | | Principal Occupations During Past 5 Years | | Number of Portfolios in
Fund Complex
Overseen by
Trustee3 | | Other Directorships Held by Trustee4 |
| | | | | |
Eileen H. Dowling Age: 61 | | Trustee | | Since 2021 | | Ms. Dowling is retired. Formerly, she was Senior Advisor (April 2021-September 2021); and Managing Director (2013-2021), BlackRock, Inc. (a financial services firm). As Managing Director, she held senior management positions, including Global Head of Global Consultant Relations (2017-2021), Multinational Corporations (2019-2021), the Institutional Product Group (2015-2019) and Institutional Marketing (2013-2016). Ms. Dowling was a member of the Global Operating Committee and Product Executive Committee of BlackRock. Trustee — Goldman Sachs Variable Insurance Trust and Goldman Sachs Trust. | | 102 | | None |
| | | | | |
Paul C. Wirth Age: 66 | | Trustee | | Since 2022 | | Mr. Wirth is retired. He is Executive Advisor, My Next Season LLC (a career transition advisory firm) (2023 – Present) Formerly, he was Deputy Chief Financial Officer and Principal Accounting Officer (2011-2020); Finance Director and Principal Accounting Officer (2010-2011); and Managing Director, Global Controller, and Chief Accounting Officer (2005-2010) of Morgan Stanley. Trustee — Goldman Sachs Variable Insurance Trust and Goldman Sachs Trust. | | 102 | | None |
| | | | | | | | | | |
GOLDMAN SACHS VARIABLE INSURANCE TRUST EQUITY FUNDS
Trustees and Officers (Unaudited) (continued)
Interested Trustee*
| | | | | | | | | | |
| | | | | |
Name, Address and Age1 | | Position(s) Held with the Trust | | Term of Office
and Length of
Time Served2 | | Principal Occupations During Past 5 Years | | Number of Portfolios in
Fund Complex
Overseen by
Trustee3 | | Other Directorships Held by Trustee4 |
| | | | | |
| James A. McNamara Age: 61 | | President and Trustee | | Since 2007 | | Advisory Director, Goldman Sachs (January 2018-Present); Managing Director, Goldman Sachs (January 2000-December 2017); Director of Institutional Fund Sales, GSAM (April 1998-December 2000); and Senior Vice President and Manager, Dreyfus Institutional Service Corporation (January 1993-April 1998). President and Trustee — Goldman Sachs Variable Insurance Trust; Goldman Sachs Trust; Goldman Sachs Trust II; Goldman Sachs ETF Trust; Goldman Sachs ETF Trust II; Goldman Sachs Credit Income Fund; and Goldman Sachs Real Estate Diversified Income Fund. | | 192 | | None |
| | | | | | | | | | |
| * | Mr. McNamara is considered to be an “Interested Trustee” because he holds positions with Goldman Sachs and owns securities issued by The Goldman Sachs Group, Inc. Mr. McNamara holds comparable positions with certain other companies of which Goldman Sachs, GSAM or an affiliate thereof is the investment adviser, administrator and/or distributor. |
| 1 | Each Trustee may be contacted by writing to the Trustee, c/o Goldman Sachs, 200 West Street, New York, New York, 10282, Attn: Robert Griffith. Information is provided as of December 31, 2023. |
| 2 | Subject to such policies as may be adopted by the Board from time-to-time, each Trustee holds office for an indefinite term, until the earliest of: (a) the election of his or her successor; (b) the date the Trustee resigns or is removed by the Board or shareholders, in accordance with the Trust’s Declaration of Trust; or (c) the termination of the Trust. The Board has adopted policies which provide that each Independent Trustee shall retire as of December 31st of the calendar year in which he or she reaches (a) his or her 75th birthday or (b) the 15th anniversary of the date he or she became a Trustee, whichever is earlier, unless a waiver of such requirements shall have been adopted by a majority of the other Trustees. These policies may be changed by the Trustees without shareholder vote. |
| 3 | The Goldman Sachs Fund Complex includes certain other companies listed above for each respective Trustee. As of December 31, 2023, Goldman Sachs Trust consisted of 87 portfolios; Goldman Sachs Variable Insurance Trust consisted of 15 portfolios (11 of which offered shares to the public); Goldman Sachs Trust II consisted of 18 portfolios (7 of which offered shares to the public); Goldman Sachs ETF Trust consisted of 68 portfolios (37 of which offered shares to the public); Goldman Sachs ETF Trust II consisted of 2 portfolios; and Goldman Sachs Credit Income Fund and Goldman Sachs Real Estate Diversified Income Fund each consisted of one portfolio. Goldman Sachs Credit Income Fund did not offer shares to the public. |
| 4 | This column includes only directorships of companies required to report to the Securities and Exchange Commission under the Securities Exchange Act of 1934 (i.e., “public companies”) or other investment companies registered under the Act. |
Additional information about the Trustees is available in the Funds’ Statement of Additional Information, which can be obtained from Goldman Sachs free of charge by calling this toll-free number (in the United States of America): 1-800-526-7384.
GOLDMAN SACHS VARIABLE INSURANCE TRUST EQUITY FUNDS
Trustees and Officers (Unaudited) (continued)
Officers of the Trust*
| | | | | | |
| | | |
| Name, Address and Age1 | | Position(s) Held with the Trust | | Term of Office and Length of Time Served2 | | Principal Occupations During Past 5 Years |
| | | |
James A. McNamara 200 West Street New York, NY 10282 Age: 61 | | Trustee and President | | Since 2007 | | Advisory Director, Goldman Sachs (January 2018-Present); Managing Director, Goldman Sachs (January 2000-December 2017); Director of Institutional Fund Sales, GSAM (April 1998-December 2000); and Senior Vice President and Manager, Dreyfus Institutional Service Corporation (January 1993-April 1998). President and Trustee — Goldman Sachs Variable Insurance Trust; Goldman Sachs Trust; Goldman Sachs Trust II; Goldman Sachs ETF Trust; Goldman Sachs ETF Trust II; Goldman Sachs Credit Income Fund; and Goldman Sachs Real Estate Diversified Income Fund. |
| | | |
Robert Griffith 200 West Street New York, NY 10282 Age: 49 | | Secretary | | Since 2023 | | Managing Director, Goldman Sachs (September 2022 – Present); General Counsel, Exchange Traded Concepts, LLC (October 2021 – September 2022); Vice President, Goldman Sachs (August 2011 – October 2021); Associate General Counsel, Goldman Sachs (December 2014 – Present); Assistant General Counsel, Goldman Sachs (August 2011 – December 2014); Vice President and Counsel, Nomura Holding America, Inc. (2010 – 2011); and Associate, Simpson Thacher & Bartlett LLP (2005 – 2010). Secretary— Goldman Sachs Variable Insurance Trust (previously Assistant Secretary (2022)); Goldman Sachs Trust; (previously Assistant Secretary (2022)); Goldman Sachs Trust II (previously Assistant Secretary (2022)); Goldman Sachs ETF Trust (previously Assistant Secretary (2022)); Goldman Sachs ETF Trust II; (previously Assistant Secretary (2022));and Goldman Sachs Real Estate Diversified Income Fund (previously Assistant Secretary (2022)). |
| | | |
Joseph F. DiMaria 30 Hudson Street Jersey City, NJ 07302 Age: 55 | | Treasurer, Principal Financial Officer and Principal Accounting Officer | | Since 2017 (Treasurer and Principal Financial Officer since 2019) | | Managing Director, Goldman Sachs (November 2015-Present) and Vice President — Mutual Fund Administration, Columbia Management Investment Advisers, LLC (May 2010-October 2015). Treasurer, Principal Financial Officer and Principal Accounting Officer — Goldman Sachs Variable Insurance Trust (previously Assistant Treasurer (2016)); Goldman Sachs Trust (previously Assistant Treasurer (2016)); Goldman Sachs Trust II (previously Assistant Treasurer (2017)); Goldman Sachs ETF Trust (previously Assistant Treasurer (2017)); Goldman Sachs ETF Trust II; Goldman Sachs Credit Income Fund; and Goldman Sachs Real Estate Diversified Income Fund. |
| | | | | | |
| * | Represents a partial list of officers of the Trust. Additional information about all the officers is available in the Funds’ Statement of Additional Information, which can be obtained from Goldman Sachs free of charge by calling this toll-free number (in the United States): 1-800-526-7384. |
| 1 | Information is provided as of December 31, 2023. |
| 2 | Officers hold office at the pleasure of the Board of Trustees or until their successors are duly elected and qualified. Each officer holds comparable positions with certain other companies of which Goldman Sachs, GSAM or an affiliate thereof is the investment adviser, administrator and/or distributor. |
Goldman Sachs Variable Insurance Trust — Tax Information (Unaudited)
For the year ended December 31, 2023, 74%, 100%, 100%, 50.33%, and 100%of the dividends paid from net investment company taxable income by the Large Cap Value, Mid Cap Value, Small Cap Equity Insights, Strategic Growth and U.S. Equity Insights Funds, respectively, qualified for the dividends received deduction available to corporations.
Pursuant to Section 852 of the Internal Revenue Code, the Large Cap Value, Mid Cap Growth, Mid Cap Value and Strategic Growth designated $19,654,854, $389,909, $10,005,084, and $11,786,983 respectively, or if different, the maximum amount allowable, as capital gain dividends paid during the fiscal year ended December 31, 2023.
For the year end December 31, 2023, the International Equity Insights Fund has elected to pass through a credit for taxes paid to foreign jurisdictions. The total amount of income received by the International Equity Insights Fund from sources within foreign countries and possessions of the United States was $0.2259 per share, all of which is attributable to qualified passive income. The percentage of net investment income dividends paid by the Fund during the year ended December 31, 2023 from foreign sources was 84.16%. The total amount of foreign taxes paid by the Fund was $0.0284 per share.
(This page intentionally left blank)
TRUSTEES TRUSTEES (continued) Gregory G. Weaver, Chair Michael Latham* Cheryl K. Beebe* James A. McNamara Dwight L. Bush Lawrence W. Stranghoener* Kathryn A. Cassidy Paul C. Wirth John G. Chou *Effective January 1, 2024 Joaquin Delgado Eileen H. Dowling OFFICERS Lawrence Hughes* James A. McNamara, President John F. Killian* Joseph F. DiMaria, Principal Financial Officer, Steven D. Kirchmar* Principal Accounting Officer and Treasurer Robert Griffith, Secretary GOLDMAN SACHS & CO. LLC GOLDMAN SACHS ASSET MANAGEMENT, L.P. Distributor and Transfer Agent Investment Adviser 200 West Street, New York New York 10282 Visit our website at www.GSAMFUNDS.com to obtain the most recent month-end returns. The reports concerning the Funds included in this shareholder report may contain certain forward-looking statements about the factors that may affect the performance of the Funds in the future. These statements are based on Fund management’s predictions and expectations concerning certain future events and their expected impact on the Funds, such as performance of the economy as a whole and of specific industry sectors, changes in the levels of interest rates, the impact of developing world events, and other factors that may influence the future performance of the Funds. Management believes these forward-looking statements to be reasonable, although they are inherently uncertain and difficult to predict. Actual events may cause adjustments in portfolio management strategies from those currently expected to be employed. A description of the policies and procedures that the Fund uses to determine how to vote proxies relating to portfolio securities and information regarding how the Fund voted proxies relating to portfolio securities during the most recent 12-month period ended June 30 is available (i) without charge, upon request by calling 1-800-621-2550; and (ii) on the Securities and Exchange Commission (“SEC”) web site at http://www.sec.gov. The Fund will file its portfolio holdings information for each month in a fiscal quarter within 60 days after the end of the relevant fiscal quarter on Form N-PORT. Portfolio holdings information for the third month of each fiscal quarter will be made available on the SEC’s web site at http://www.sec.gov. Portfolio holdings information may be obtained upon request and without charge by calling 1-800-526-7384 (for Retail Shareholders) or 1-800-621-2550 (for Institutional Shareholders). Views and opinions expressed are for informational purposes only and do not constitute a recommendation by GSAM to buy, sell, or hold any security. Views and opinions are current as of the date of this presentation and may be subject to change, they should not be construed as investment advice. Goldman Sachs & Co. LLC (“Goldman Sachs”) does not provide legal, tax or accounting advice. Any statement contained in this communication (including any attachments) concerning U.S. tax matters was not intended or written to be used, and cannot be used, for the purpose of avoiding penalties under the Internal Revenue Code, and was written to support the promotion or marketing of transaction or matter addressed. Clients of Goldman Sachs should obtain their own independent tax advice based on their particular circumstances. The website links provided are for your convenience only and are not an endorsement or recommendation by GSAM of any of these websites or the products or services offered. GSAM is not responsible for the accuracy and validity of the content of these websites. Economic and market forecasts presented herein reflect our judgment as of the date of this presentation and are subject to change without notice. These forecasts do not take into account the specific investment objectives, restrictions, tax and financial situation or other needs of any specific client. Actual data will vary and may not be reflected here. These forecasts are subject to high levels of uncertainty that may affect actual performance. Accordingly, these forecasts should be viewed as merely representative of a broad range of possible outcomes. These forecasts are estimated, based on assumptions, and are subject to significant revision and may change materially as economic and market conditions change. Goldman Sachs has no obligation to provide updates or changes to these forecasts. Case studies and examples are for illustrative purposes only. Fund holdings and allocations shown are as of December 31, 2023 and may not be representative of future investments. Fund holdings should not be relied on in making investment decisions and should not be construed as research or investment advice regarding particular securities. Current and future holdings are subject to risk. References to indices, benchmarks or other measures of relative market performance over a specified period of time are provided for your information only and do not imply that the portfolio will achieve similar results. The index composition may not reflect the manner in which a portfolio is constructed. While an adviser seeks to design a portfolio which reflects appropriate risk and return features, portfolio characteristics may deviate from those of the benchmark. The Global Industry Classification Standard (“GICS”) was developed by and is the exclusive property and a service mark of Morgan Stanley Capital International Inc. (“MSCI”) and Standard & Poor’s, a division of The McGraw-Hill Companies, Inc. (“S&P”) and is licensed for use by Goldman Sachs. Neither MSCI, S&P nor any other party involved in making or compiling the GICS or any GICS classifications makes any express or implied warranties or representations with respect to such standard or classification (or the results to be obtained by the use thereof), and all such parties hereby expressly disclaim all warranties of originality, accuracy, completeness, merchantability or fitness for a particular purpose with respect to any of such standard or classification. Without limiting any of the foregoing, in no event shall MSCI, S&P, any of their affiliates or any third party involved in making or compiling the GICS or any GICS classifications have any liability for any direct, indirect, special, punitive, consequential or any other damages (including lost profits) even if notified of the possibility of such damages. The portfolio risk management process includes an effort to monitor and manage risk, but does not imply low risk. Shares of the Goldman Sachs VIT Funds are offered to separate accounts of participating life insurance companies for the purpose of funding variable annuity contracts and variable life insurance policies. Shares of the Fund are not offered directly to the general public. The variable annuity contracts and variable life insurance policies are described in the separate prospectuses issued by participating insurance companies. You should refer to those prospectuses for information about surrender charges, mortality and expense risk fees and other charges that may be assessed by participating insurance companies under the variable annuity contracts or variable life insurance policies. Such fees or charges, if any, may affect the return you may realize with respect to your investments. Ask your representative for more complete information. Please consider a fund’s objectives, risks and charges and expenses, and read the prospectus carefully before investing. The prospectus contains this and other information about the Fund. This material is not authorized for distribution to prospective investors unless preceded or accompanied by a current prospectus or summary prospectus, if applicable. Investors should consider the Fund’s objective, risks, and charges and expenses, and read the summary prospectus, if available, and/or the prospectus carefully before investing or sending money. The summary prospectus, if available, and the prospectus contain this and other information about the Fund and may be obtained from your authorized dealer or from Goldman Sachs & Co. LLC by calling 1-800-621-2550. This report is prepared for the general information of contract owners and is not an offer of shares of the Goldman Sachs Variable Insurance Trust Funds. © 2024 Goldman Sachs. All rights reserved. VITEQTYAR-24/356077-OTU-1967989
Goldman
Sachs Variable Insurance Trust
Goldman Sachs Buffered S&P 500 Fund — Jan/Jul
Goldman Sachs Buffered S&P 500 Fund — Mar/Sep
Goldman Sachs Buffered S&P 500 Fund — May/Nov
Annual Report
December 31, 2023

Goldman Sachs Variable Insurance Trust
| ∎ | | GOLDMAN SACHS BUFFERED S&P 500 FUND — JAN/JUL |
| ∎ | | GOLDMAN SACHS BUFFERED S&P 500 FUND — MAR/SEP |
| ∎ | | GOLDMAN SACHS BUFFERED S&P 500 FUND — MAY/NOV |
Effective January 24, 2023, open-end mutual funds and exchange traded funds will be required to provide shareholders with streamlined annual and semi-annual shareholder reports (“Tailored Shareholder Reports”). Funds will be required to prepare a separate Tailored Shareholder Report for each share class of a fund that highlights key information to investors. Other information, including financial statements, will no longer appear in a fund’s shareholder report, but will be available online, delivered free of charge upon request, and filed with the SEC on a semi-annual basis on Form N-CSR. The new requirements have a compliance date of July 24, 2024.
| | | | |
| | | |
| NOT FDIC-INSURED | | May Lose Value | | No Bank Guarantee |
GOLDMAN SACHS BUFFERED S&P 500 FUND — JAN/JUL
INVESTMENT OBJECTIVE
The Fund seeks long-term capital appreciation.
Portfolio Management Discussion and Analysis
Below, the Goldman Sachs Quantitative Investment Strategies (“QIS”) Team discusses the Goldman Sachs Variable Insurance Trust — Goldman Sachs Buffered S&P 500 Fund-Jan/Jul’s (the “Fund”) performance and positioning for the 12-month period ended December 31, 2023 (the “Reporting Period”).
How did the Fund perform during the Reporting Period?
During the Reporting Period, the Fund’s Institutional and Service Shares generated average annual total returns, without sales charges, of 14.76% and 14.76%, respectively. These returns compare to the 25.67% average annual total return of the Fund’s benchmark, the S&P 500 Total Return Index (Net, USD, Unhedged), during the same period. The Fund’s secondary benchmark, a composite index comprised of the S&P 500 Total Return Index (70%) and the ICE BofA Three-Month U.S. Treasury Bill Index (30%), returned 19.76% for the same time period.
The S&P 500 Total Return Index is distinct from the S&P 500 Price Return Index (the Fund’s “Underlying Index”) because the Underlying Index only tracks the performance of the stock prices of the companies included in the index and does not include returns from dividends paid by companies included in the index.
What key factors were responsible for the Fund’s performance during the Reporting Period?
The Fund underperformed the S&P 500 Total Return Index during the Reporting Period, primarily driven by the limited upside participation in the U.S. equity market rally due to the Fund’s targeted outcome strategy.
The Fund seeks to provide equity exposure up to a Cap with a Buffer from downside risk. The Cap represents the maximum percentage return a Fund can achieve for the duration of an Outcome Period. The Buffer provides downside protection against approximately the first 5% of losses of the S&P 500 Price Return Index over each Outcome Period, before the deduction of Fund fees and expenses. If the value of the S&P 500 Price Return Index increases over an Outcome Period, the Fund seeks to provide investment returns that track the performance of the S&P 500 Price Return Index up to the Cap for the Outcome Period. If the value of the S&P 500 Price Return Index increases in excess of the Cap during an Outcome Period, the Fund, and therefore its investors, will not fully participate in those excess gains.
During the Reporting Period, the S&P 500 Price Return Index delivered strong performance that exceeded the Cap, leading to reduced upside participation of the Fund.
What were the Cap and Buffer for the Outcome Period that commenced on January 1, 2023 and ended on June 30, 2023?
As described in the Fund’s prospectus, the Fund’s performance is subject to a Cap that represents the maximum percentage return the Fund can achieve for the duration of a six-month Outcome Period. The Fund also seeks to provide a downside Buffer against certain losses over an Outcome Period.
The Fund’s initial Outcome Period commenced on January 1, 2023 and ended on June 30, 2023. The Fund’s Cap is based on the cost of providing the Buffer and will differ from one Outcome Period to the next.
GOLDMAN SACHS BUFFERED S&P 500 FUND — JAN/JUL
The Cap and Buffer for the Fund for the initial Outcome Period are listed in the tables below. The tables below show the Cap and Buffer before and after Fund Fees and Expenses for each share class. The Cap and Buffer were further reduced by any brokerage commissions, trading fees, taxes and non-routine or extraordinary expenses incurred by the Fund.
| | | | | | | | |
| | |
| Share Class | | Cap
(before Fund Fees and Expenses) | | | Cap
(after Fund Fees and Expenses)* | |
| Institutional Shares | | | 7.95 | % | | | 7.60 | % |
| Service Shares | | | 7.95 | % | | | 7.47 | % |
| | |
| Share Class | | Buffer
(before Fund Fees and Expenses) | | | Buffer
(after Fund Fees and Expenses)* | |
| Institutional Shares | | | 5.00 | % | | | 4.65 | % |
| Service Shares | | | 5.00 | % | | | 4.52 | % |
| * | Fund Fees and Expenses are derived from the “Annual Fund Operating Expenses” tables included in the Fund’s Prospectus dated October 5, 2022. Actual Fund Fees and Expenses may differ over the next Outcome Period. |
What were the Cap and Buffer for the Outcome Period that commenced on July 1, 2023 and ended on December 31, 2023?
The Fund’s next Outcome Period commenced on July 1, 2023 and ended on December 31, 2023. The Fund’s Cap is based on the cost of providing the Buffer and will differ from one Outcome Period to the next.
The Cap and Buffer for the Fund for this Outcome Period are listed in the tables below. The tables below show the Cap and Buffer before and after Fund Fees and Expenses for each share class. The Cap and Buffer were further reduced by any brokerage commissions, trading fees, taxes and non-routine or extraordinary expenses incurred by the Fund.
| | | | | | | | |
| | |
| Share Class | | Cap
(before Fund Fees and Expenses) | | | Cap
(after Fund Fees and Expenses)* | |
| Institutional Shares | | | 2.87 | % | | | 2.52 | % |
| Service Shares | | | 2.87 | % | | | 2.39 | % |
| | |
| Share Class | | Buffer
(before Fund Fees and Expenses) | | | Buffer
(after Fund Fees and Expenses)* | |
| Institutional Shares | | | 5.00 | % | | | 4.65 | % |
| Service Shares | | | 5.00 | % | | | 4.52 | % |
| * | Fund Fees and Expenses are derived from the “Annual Fund Operating Expenses” tables included in the Fund’s Prospectus dated April 28, 2023. Actual Fund Fees and Expenses may differ over the next Outcome Period. |
What are the Cap and Buffer for the Outcome Period that commenced on January 2, 2024 and will end on June 30, 2024?
The Fund’s next Outcome Period commenced on January 2, 2024 and will end on June 30, 2024. The Fund’s Cap is based on the cost of providing the Buffer and will differ from one Outcome Period to the next.
GOLDMAN SACHS BUFFERED S&P 500 FUND — JAN/JUL
The Cap and Buffer for the Fund for this Outcome Period are listed in the tables below. The tables below show the Cap and Buffer before and after Fund Fees and Expenses for each share class. The Cap and Buffer will be further reduced by any brokerage commissions, trading fees, taxes and non-routine or extraordinary expenses incurred by the Fund.
| | | | | | | | |
| | |
| Share Class | | Cap
(before Fund Fees and Expenses) | | | Cap
(after Fund Fees and Expenses)* | |
| Institutional Shares | | | 7.80 | % | | | 7.45 | % |
| Service Shares | | | 7.80 | % | | | 7.32 | % |
| | |
| Share Class | | Buffer
(before Fund Fees and Expenses) | | | Buffer
(after Fund Fees and Expenses)* | |
| Institutional Shares | | | 5.00 | % | | | 4.65 | % |
| Service Shares | | | 5.00 | % | | | 4.52 | % |
| * | Fund Fees and Expenses are derived from the “Annual Fund Operating Expenses” tables included in the Fund’s Prospectus dated April 28, 2023. Actual Fund Fees and Expenses may differ over the next Outcome Period. |
Does the Fund use derivatives and other similar instruments?
In order to implement the Buffer and Cap, the Fund primarily invests in FLexible EXchange® Options (“FLEX Options”) and over-the-counter (“OTC”) and listed options that reference the Underlying Index (together with FLEX Options, “S&P 500 Options”). FLEX Options are customized exchange-traded option contracts available through the Chicago Board Option Exchange. Through FLEX Options, the Fund could customize key contract terms such as exercise prices and expiration dates.
The Fund purchases and sells call and put S&P 500 Options to achieve two main targeted outcomes within the Fund’s portfolio. One set of options is designed to buffer the Fund from losses over an Outcome Period, while another set is designed to produce returns that track those of the Underlying Index over an Outcome Period, up to the Cap for that Outcome Period.
The first set of S&P 500 Options is designed to buffer the Fund from losses of up to approximately 5% if the Underlying Index experiences a loss at the end of an Outcome Period. The Fund generally creates this first set of options by employing at-the-money and/or out-of-the-money put S&P 500 Options. There is no guarantee that the Fund will be successful in its attempts to buffer against losses of the Underlying Index and an investor may lose their entire investment. The Buffer is operative only against approximately the first 5% of Underlying Index losses at the end of an Outcome Period. If the Underlying Index has decreased in value by more than the Buffer (approximately 5%) at the end of an Outcome Period, the Fund, and therefore its investors, will participate in those losses. The Buffer is calculated prior to taking into account Fund fees and expenses. After deducting Fund fees and expenses, the Buffer is expected to be approximately 4.65% and 4.52% for Institutional Shares and Service Shares, respectively, for each Outcome Period. Because the Buffer is designed to be in effect only at the end of an Outcome Period, an investor who sells Fund shares before the end of an Outcome Period may not experience the full effect of the Buffer.
The second set of S&P 500 Options is designed to produce returns that track those of the Underlying Index over an Outcome Period if the value of the Underlying Index increases during that Outcome Period. However, unlike other investment products, the potential returns an investor can receive from an investment in the Fund are subject to an upside return Cap. The Fund generally creates this second set of options by employing at-the-money and/or out-of-the-money call S&P 500 Options. This means that if the value of the Underlying Index increases over an Outcome Period beyond the level of the Cap, the Fund will not participate in those excess gains. Therefore, regardless of the performance of the Underlying Index, the Cap, before Fund fees and expenses, is the maximum return an investor can achieve from an investment in the Fund over an Outcome Period.
The Cap is based on the strike prices of the S&P 500 Options that the Fund has sold over an Outcome Period. The Cap is set on or before the first day of an Outcome Period based on the cost of providing the Buffer. The Cap may increase or decrease from one Outcome Period to the next.
As the S&P 500 Options mature at the end of each six-month Outcome Period, the Fund enters into a new set of S&P 500 Options, which may increase or decrease the Cap for the subsequent six-month Outcome Period. The Fund is a continuous investment vehicle. It does not terminate and distribute its assets at the conclusion of each Outcome Period.
GOLDMAN SACHS BUFFERED S&P 500 FUND — JAN/JUL
The Fund may invest in one or more underlying funds (including exchange-traded funds (“ETFs”)) that seek to track the Underlying Index and one or more money market funds, including ETFs and money market funds for which GSAM or an affiliate now or in the future acts as investment adviser or principal underwriter. The Fund intends to also invest directly in fixed income securities (bonds) and equity securities (stocks). These investments may be publicly traded, privately issued, or negotiated. The percentage of the Fund invested in equity and fixed income securities will vary from time to time as the Investment Adviser evaluates such securities’ relative attractiveness and determines the optimal option structure for the Outcome Period. The Fund may invest without restriction as to issuer capitalization, country, currency, maturity or credit rating.
In addition to S&P 500 Options, the Fund may invest in other derivatives, including credit default swaps (including credit default index swaps or “CDX”), total return swaps and equity futures, each of which can be used for both hedging purposes and to seek to increase total return. The Fund may also utilize various interest rate-related derivatives, including futures and swaps, to manage the duration of its fixed income positions.
The Fund also may hold cash or invest in cash equivalents in order to collateralize its derivatives positions. Certain underlying funds may invest in derivatives for both hedging purposes and to seek to increase total return.
During the Reporting Period, the Fund invested in S&P 500 Options and equity index futures in implementing its strategy, which contributed positively to its results.
How was the Fund positioned relative to its benchmark index at the end of the Reporting Period?
The Fund was invested in equity index futures and equity index options at the end of the Reporting Period. The Fund was also invested in various fixed income products, including U.S. Treasuries and money market funds for cash management purposes.
THE FUND IS NON-DIVERSIFIED UNDER THE INVESTMENT COMPANY ACT OF 1940, AS AMENDED, AND MAY INVEST A LARGER PERCENTAGE OF ITS ASSETS IN ONE OR MORE ISSUERS OR IN FEWER ISSUERS THAN DIVERSIFIED MUTUAL FUNDS.
GOLDMAN SACHS BUFFERED S&P 500 FUND — JAN/JUL
Percentage of Net Assets
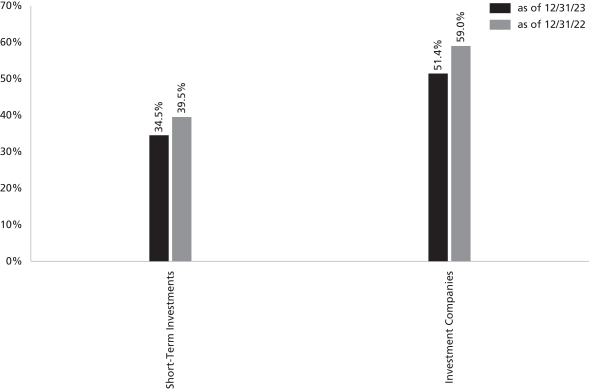
| † | The percentage shown for each investment category reflects the value of investments in that category as a percentage of net assets. Figures in the graph may not sum to 100% due to the exclusion of other assets and liabilities. The graph depicts the Fund’s investments but does not represent the Fund’s market exposure due to the exclusion of certain derivatives as listed in the Additional Investment Information section of the Consolidated Schedule of Investments. |
For more information about the Fund, please refer to www.GSAMFUNDS.com. There, you can learn more about the Fund’s Investment strategies, holdings, and performance.
GOLDMAN SACHS BUFFERED S&P 500 FUND — MAR/SEP
INVESTMENT OBJECTIVE
The Fund seeks long-term capital appreciation.
Portfolio Management Discussion and Analysis
The Goldman Sachs Variable Insurance Trust — Goldman Sachs Buffered S&P 500 Fund-Mar/Sep (the “Fund”) commenced operations on February 28, 2023. Below, the Goldman Sachs Quantitative Investment Strategies (“QIS”) Team discusses the Fund’s performance and positioning for the period from February 28, 2023 through December 31, 2023 (the “Reporting Period”).
How did the Fund perform during the Reporting Period?
During the Reporting Period, the Fund’s Institutional and Service Shares generated cumulative total returns, without sales charges, of 11.90% and 11.90%, respectively. These returns compare to the 21.30% total return of the Fund’s benchmark, the S&P 500 Total Return Index (Net, USD, Unhedged), during the same period. The Fund’s secondary benchmark, a composite index comprised of the S&P 500 Total Return Index (70%) and the ICE BofA Three-Month U.S. Treasury Bill Index (30%), returned 16.49% for the same time period.
The S&P 500 Total Return Index is distinct from the S&P 500 Price Return Index (the Fund’s “Underlying Index”) because the Underlying Index only tracks the performance of the stock prices of the companies included in the index and does not include returns from dividends paid by companies included in the index.
What key factors were responsible for the Fund’s performance during the Reporting Period?
The Fund underperformed the S&P 500® Total Return Index during the Reporting Period, primarily driven by the limited upside participation in the U.S. equity market rally due to the Fund’s targeted outcome strategy.
The Fund seeks to provide equity exposure up to a Cap with a Buffer from downside risk. The Cap represents the maximum percentage return a Fund can achieve for the duration of an Outcome Period. The Buffer provides downside protection against approximately the first 5% of losses of the S&P 500 Price Return Index over each Outcome Period, before the deduction of Fund fees and expenses. If the value of the S&P 500 Price Return Index increases over an Outcome Period, the Fund seeks to provide investment returns that track the performance of the S&P 500 Price Return Index up to the Cap for the Outcome Period. If the value of the S&P 500 Price Return Index increases in excess of the Cap during an Outcome Period, the Fund, and therefore its investors, will not fully participate in those excess gains.
During the Reporting Period, the S&P 500 Price Return Index delivered strong performance that exceeded the Cap, leading to reduced upside participation of the Fund.
What were the Cap and Buffer for the Outcome Period that commenced on March 1, 2023 and ended on August 31, 2023?
As described in the Fund’s prospectus, the Fund’s performance is subject to a Cap that represents the maximum percentage return the Fund can achieve for the duration of a six-month Outcome Period. The Fund also seeks to provide a downside Buffer against certain losses over an Outcome Period.
The Fund’s initial Outcome Period commenced on March 1, 2023 and ended on August 31, 2023. The Fund’s Cap is based on the cost of providing the Buffer and will differ from one Outcome Period to the next.
GOLDMAN SACHS BUFFERED S&P 500 FUND — MAR/SEP
The Cap and Buffer for the Fund for the initial Outcome Period are listed in the tables below. The tables below show the Cap and Buffer before and after Fund Fees and Expenses for each share class. The Cap and Buffer were further reduced by any brokerage commissions, trading fees, taxes and non-routine or extraordinary expenses incurred by the Fund.
| | | | | | | | |
| | |
| Share Class | | Cap
(before Fund Fees and Expenses) | | | Cap
(after Fund Fees and Expenses)* | |
| Institutional Shares | | | 5.50 | % | | | 5.15 | % |
| Service Shares | | | 5.50 | % | | | 5.03 | % |
| | | | | | | | |
| | |
| Share Class | | Buffer
(before Fund Fees and Expenses) | | | Buffer
(after Fund Fees and Expenses)* | |
| Institutional Shares | | | 5.00 | % | | | 4.65 | % |
| Service Shares | | | 5.00 | % | | | 4.53 | % |
| * | Fund Fees and Expenses are derived from the “Annual Fund Operating Expenses” tables included in the Fund’s Prospectus dated October 5, 2022. Actual Fund Fees and Expenses may differ over the next Outcome Period. |
What are the Cap and Buffer for the Outcome Period that commenced on September 1, 2023 and will end on February 29, 2024?
The Fund’s next Outcome Period commenced on September 1, 2023 and will end on February 29, 2024. The Fund’s Cap is based on the cost of providing the Buffer and will differ from one Outcome Period to the next.
The Cap and Buffer for the Fund for this Outcome Period are listed in the tables below. The tables below show the Cap and Buffer before and after Fund Fees and Expenses for each share class. The Cap and Buffer will be further reduced by any brokerage commissions, trading fees, taxes and non-routine or extraordinary expenses incurred by the Fund.
| | | | | | | | |
| | |
| Share Class | | Cap
(before Fund Fees and Expenses) | | | Cap
(after Fund Fees and Expenses)* | |
| Institutional Shares | | | 8.06 | % | | | 7.71 | % |
| Service Shares | | | 8.06 | % | | | 7.59 | % |
| | | | | | | | |
| | |
| Share Class | | Buffer
(before Fund Fees and Expenses) | | | Buffer
(after Fund Fees and Expenses)* | |
| Institutional Shares | | | 5.00 | % | | | 4.65 | % |
| Service Shares | | | 5.00 | % | | | 4.53 | % |
| * | Fund Fees and Expenses are derived from the “Annual Fund Operating Expenses” tables included in the Fund’s Prospectus dated April 28, 2023. Actual Fund Fees and Expenses may differ over the next Outcome Period. |
Does the Fund use derivatives and other similar instruments?
In order to implement the Buffer and Cap, the Fund primarily invests in FLexible EXchange® Options (“FLEX Options”) and over-the-counter (“OTC”) and listed options that reference the Underlying Index (together with FLEX Options, “S&P 500 Options”). FLEX Options are customized exchange-traded option contracts available through the Chicago Board Option Exchange. Through FLEX Options, the Fund could customize key contract terms such as exercise prices and expiration dates.
The Fund purchases and sells call and put S&P 500 Options to achieve two main targeted outcomes within the Fund’s portfolio. One set of options is designed to buffer the Fund from losses over an Outcome Period, while another set is designed to produce returns that track those of the Underlying Index over an Outcome Period, up to the Cap for that Outcome Period.
The first set of S&P 500 Options is designed to buffer the Fund from losses of up to approximately 5% if the Underlying Index experiences a loss at the end of an Outcome Period. The Fund generally creates this first set of options by employing at-the-money and/or out-of-the-money put S&P 500 Options. There is no guarantee that the Fund will be successful in its attempts to buffer against losses of the Underlying Index and an investor may lose their entire investment. The Buffer is operative only against approximately the first 5% of Underlying Index losses at the end of an Outcome Period. If the Underlying Index has decreased in value by more than the Buffer (approximately 5%) at the end of an Outcome Period, the Fund, and therefore its investors, will participate in those losses. The Buffer is calculated prior to taking into account Fund fees and expenses. After deducting Fund fees and expenses, the Buffer is expected to be approximately 4.65% and 4.53% for Institutional Shares and Service Shares,
GOLDMAN SACHS BUFFERED S&P 500 FUND — MAR/SEP
respectively, for each Outcome Period. Because the Buffer is designed to be in effect only at the end of an Outcome Period, an investor who sells Fund shares before the end of an Outcome Period may not experience the full effect of the Buffer.
The second set of S&P 500 Options is designed to produce returns that track those of the Underlying Index over an Outcome Period if the value of the Underlying Index increases during that Outcome Period. However, unlike other investment products, the potential returns an investor can receive from an investment in the Fund are subject to an upside return Cap. The Fund generally creates this second set of options by employing at-the-money and/or out-of-the-money call S&P 500 Options. This means that if the value of the Underlying Index increases over an Outcome Period beyond the level of the Cap, the Fund will not participate in those excess gains. Therefore, regardless of the performance of the Underlying Index, the Cap, before Fund fees and expenses, is the maximum return an investor can achieve from an investment in the Fund over an Outcome Period.
The Cap is based on the strike prices of the S&P 500 Options that the Fund has sold over an Outcome Period. The Cap is set on or before the first day of an Outcome Period based on the cost of providing the Buffer. The Cap may increase or decrease from one Outcome Period to the next.
As the S&P 500 Options mature at the end of each six-month Outcome Period, the Fund enters into a new set of S&P 500 Options, which may increase or decrease the Cap for the subsequent six-month Outcome Period. The Fund is a continuous investment vehicle. It does not terminate and distribute its assets at the conclusion of each Outcome Period.
The Fund may invest in one or more underlying funds (including exchange-traded funds (“ETFs”)) that seek to track the Underlying Index and one or more money market funds, including ETFs and money market funds for which GSAM or an affiliate now or in the future acts as investment adviser or principal underwriter. The Fund intends to also invest directly in fixed income securities (bonds) and equity securities (stocks). These investments may be publicly traded, privately issued, or negotiated. The percentage of the Fund invested in equity and fixed income securities will vary from time to time as the Investment Adviser evaluates such securities’ relative attractiveness and determines the optimal option structure for the Outcome Period. The Fund may invest without restriction as to issuer capitalization, country, currency, maturity or credit rating.
In addition to S&P 500 Options, the Fund may invest in other derivatives, including credit default swaps (including credit default index swaps or “CDX”), total return swaps and equity futures, each of which can be used for both hedging purposes and to seek to increase total return. The Fund may also utilize various interest rate-related derivatives, including futures and swaps, to manage the duration of its fixed income positions.
The Fund also may hold cash or invest in cash equivalents in order to collateralize its derivatives positions. Certain underlying funds may invest in derivatives for both hedging purposes and to seek to increase total return.
During the Reporting Period, the Fund invested in S&P 500 Options and equity index futures in implementing its strategy, which contributed positively to results.
How was the Fund positioned relative to its benchmark index at the end of the Reporting Period?
The Fund was invested in equity index futures and equity index options at the end of the Reporting Period. The Fund was also invested in various fixed income products, including U.S. Treasuries and money market funds for cash management purposes.
THE FUND IS NON-DIVERSIFIED UNDER THE INVESTMENT COMPANY ACT OF 1940, AS AMENDED, AND MAY INVEST A LARGER PERCENTAGE OF ITS ASSETS IN ONE OR MORE ISSUERS OR IN FEWER ISSUERS THAN DIVERSIFIED MUTUAL FUNDS.
GOLDMAN SACHS BUFFERED S&P 500 FUND — MAR/SEP
Percentage of Net Assets
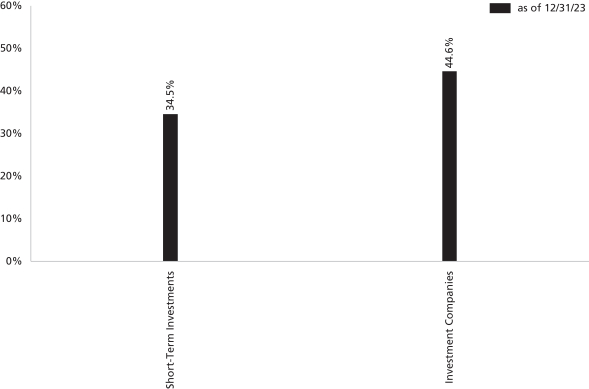
| † | The percentage shown for each investment category reflects the value of investments in that category as a percentage of net assets. Figures in the graph may not sum to 100% due to the exclusion of other assets and liabilities. The graph depicts the Fund’s investments but does not represent the Fund’s market exposure due to the exclusion of certain derivatives as listed in the Additional Investment Information section of the Consolidated Schedule of Investments. |
For more information about the Fund, please refer to www.GSAMFUNDS.com. There, you can learn more about the Fund’s Investment strategies, holdings, and performance.
GOLDMAN SACHS BUFFERED S&P 500 FUND — MAY/NOV
INVESTMENT OBJECTIVE
The Fund seeks long-term capital appreciation.
Portfolio Management Discussion and Analysis
The Goldman Sachs Variable Insurance Trust — Goldman Sachs Buffered S&P 500 Fund-May/Nov (the “Fund”) commenced operations on April 28, 2023. Below, the Goldman Sachs Quantitative Investment Strategies (“QIS”) Team discusses the Fund’s performance and positioning for the period from April 28, 2023 through December 31, 2023 (the “Reporting Period”).
How did the Fund perform during the Reporting Period?
During the Reporting Period, the Fund’s Institutional and Service Shares generated cumulative total returns, without sales charges, of 7.70% and 7.69%, respectively. These returns compare to the 15.29% total return of the Fund’s benchmark, the S&P 500 Total Return Index (Net, USD, Unhedged), during the same period. The Fund’s secondary benchmark, a composite index comprised of the S&P 500 Total Return Index (70%) and the ICE BofA Three-Month U.S. Treasury Bill Index (30%), returned 12.10% for the same time period.
The S&P 500 Total Return Index is distinct from the S&P 500 Price Return Index (the Fund’s “Underlying Index”) because the Underlying Index only tracks the performance of the stock prices of the companies included in the index and does not include returns from dividends paid by companies included in the index.
What key factors were responsible for the Fund’s performance during the Reporting Period?
The Fund underperformed the S&P 500® Total Return Index during the Reporting Period, primarily driven by the limited upside participation in the U.S. equity market rally due to the Fund’s targeted outcome strategy.
The Fund seeks to provide equity exposure up to a Cap with a Buffer from downside risk. The Cap represents the maximum percentage return a Fund can achieve for the duration of an Outcome Period. The Buffer provides downside protection against approximately the first 5% of losses of the S&P 500 Price Return Index over each Outcome Period, before the deduction of Fund fees and expenses. If the value of the S&P 500 Price Return Index increases over an Outcome Period, the Fund seeks to provide investment returns that track the performance of the S&P 500 Price Return Index up to the Cap for the Outcome Period. If the value of the S&P 500 Price Return Index increases in excess of the Cap during an Outcome Period, the Fund, and therefore its investors, will not fully participate in those excess gains.
During the Reporting Period, the S&P 500 Price Return Index delivered strong performance that exceeded the Cap, leading to reduced upside participation of the Fund.
What were the Cap and Buffer for the Outcome Period that commenced on May 1, 2023 and ended on October 31, 2023?
As described in the Fund’s prospectus, the Fund’s performance is subject to a Cap that represents the maximum percentage return the Fund can achieve for the duration of a six-month Outcome Period. The Fund also seeks to provide a downside Buffer against certain losses over an Outcome Period.
The Fund’s initial Outcome Period commenced on May 1, 2023 and ended on October 31, 2023. The Fund’s Cap is based on the cost of providing the Buffer and will differ from one Outcome Period to the next.
GOLDMAN SACHS BUFFERED S&P 500 FUND — MAY/NOV
The Cap and Buffer for the Fund for the initial Outcome Period are listed in the tables below. The tables below show the Cap and Buffer before and after Fund Fees and Expenses for each share class. The Cap and Buffer were further reduced by any brokerage commissions, trading fees, taxes and non-routine or extraordinary expenses incurred by the Fund.
| | | | | | | | |
| | |
| Share Class | | Cap
(before Fund Fees and Expenses) | | | Cap
(after Fund Fees and Expenses)* | |
| Institutional Shares | | | 4.70 | % | | | 4.35 | % |
| Service Shares | | | 4.70 | % | | | 4.23 | % |
| | | | | | | | |
| | |
| Share Class | | Buffer
(before Fund Fees and Expenses) | | | Buffer
(after Fund Fees and Expenses)* | |
| Institutional Shares | | | 5.00 | % | | | 4.65 | % |
| Service Shares | | | 5.00 | % | | | 4.52 | % |
| * | Fund Fees and Expenses are derived from the “Annual Fund Operating Expenses” tables included in the Fund’s Prospectus dated April 28, 2023. Actual Fund Fees and Expenses may differ over the next Outcome Period. |
What are the Cap and Buffer for the Outcome Period that commenced on November 1, 2023 and will end on April 30, 2024?
The Fund’s next Outcome Period commenced on November 1, 2023 and will end on April 30, 2024. The Fund’s Cap is based on the cost of providing the Buffer and will differ from one Outcome Period to the next.
The Cap and Buffer for the Fund for this Outcome Period are listed in the tables below. The tables below show the Cap and Buffer before and after Fund Fees and Expenses for each share class. The Cap and Buffer will be further reduced by any brokerage commissions, trading fees, taxes and non-routine or extraordinary expenses incurred by the Fund.
| | | | | | | | |
| | |
| Share Class | | Cap
(before Fund Fees and Expenses) | | | Cap
(after Fund Fees and Expenses)* | |
| Institutional Shares | | | 9.31 | % | | | 8.96 | % |
| Service Shares | | | 9.31 | % | | | 8.84 | % |
| | | | | | | | |
| | |
| Share Class | | Buffer
(before Fund Fees and Expenses) | | | Buffer
(after Fund Fees and Expenses)* | |
| Institutional Shares | | | 5.00 | % | | | 4.65 | % |
| Service Shares | | | 5.00 | % | | | 4.53 | % |
| * | Fund Fees and Expenses are derived from the “Annual Fund Operating Expenses” tables included in the Fund’s Prospectus dated April 28, 2023. Actual Fund Fees and Expenses may differ over the next Outcome Period. |
Does the Fund use derivatives and other similar instruments?
In order to implement the Buffer and Cap, the Fund primarily invests in FLexible EXchange® Options (“FLEX Options”) and over-the-counter (“OTC”) and listed options that reference the Underlying Index (together with FLEX Options, “S&P 500 Options”). FLEX Options are customized exchange-traded option contracts available through the Chicago Board Option Exchange. Through FLEX Options, the Fund could customize key contract terms such as exercise prices and expiration dates.
The Fund purchases and sells call and put S&P 500 Options to achieve two main targeted outcomes within the Fund’s portfolio. One set of options is designed to buffer the Fund from losses over an Outcome Period, while another set is designed to produce returns that track those of the Underlying Index over an Outcome Period, up to the Cap for that Outcome Period.
The first set of S&P 500 Options is designed to buffer the Fund from losses of up to approximately 5% if the Underlying Index experiences a loss at the end of an Outcome Period. The Fund generally creates this first set of options by employing at-the-money and/or out-of-the-money put S&P 500 Options. There is no guarantee that the Fund will be successful in its attempts to buffer against losses of the Underlying Index and an investor may lose their entire investment. The Buffer is operative only against approximately the first 5% of Underlying Index losses at the end of an Outcome Period. If the Underlying Index has decreased in value by more than the Buffer (approximately 5%) at the end of an Outcome Period, the Fund, and therefore its investors, will participate in those losses. The Buffer is calculated prior to taking into account Fund fees and expenses. After deducting Fund fees and expenses, the Buffer is expected to be approximately 4.65% and 4.53% for Institutional Shares and Service Shares, respectively, for each Outcome Period. Because the Buffer is designed to be in effect only at the end of an Outcome Period, an investor who sells Fund shares before the end of an Outcome Period may not experience the full effect of the Buffer.
GOLDMAN SACHS BUFFERED S&P 500 FUND — MAY/NOV
The second set of S&P 500 Options is designed to produce returns that track those of the Underlying Index over an Outcome Period if the value of the Underlying Index increases during that Outcome Period. However, unlike other investment products, the potential returns an investor can receive from an investment in the Fund are subject to an upside return Cap. The Fund generally creates this second set of options by employing at-the-money and/or out-of-the-money call S&P 500 Options. This means that if the value of the Underlying Index increases over an Outcome Period beyond the level of the Cap, the Fund will not participate in those excess gains. Therefore, regardless of the performance of the Underlying Index, the Cap, before Fund fees and expenses, is the maximum return an investor can achieve from an investment in the Fund over an Outcome Period.
The Cap is based on the strike prices of the S&P 500 Options that the Fund has sold over an Outcome Period. The Cap is set on or before the first day of an Outcome Period based on the cost of providing the Buffer. The Cap may increase or decrease from one Outcome Period to the next.
As the S&P 500 Options mature at the end of each six-month Outcome Period, the Fund enters into a new set of S&P 500 Options, which may increase or decrease the Cap for the subsequent six-month Outcome Period. The Fund is a continuous investment vehicle. It does not terminate and distribute its assets at the conclusion of each Outcome Period.
The Fund may invest in one or more underlying funds (including exchange-traded funds (“ETFs”)) that seek to track the Underlying Index and one or more money market funds, including ETFs and money market funds for which GSAM or an affiliate now or in the future acts as investment adviser or principal underwriter. The Fund intends to also invest directly in fixed income securities (bonds) and equity securities (stocks). These investments may be publicly traded, privately issued, or negotiated. The percentage of the Fund invested in equity and fixed income securities will vary from time to time as the Investment Adviser evaluates such securities’ relative attractiveness and determines the optimal option structure for the Outcome Period. The Fund may invest without restriction as to issuer capitalization, country, currency, maturity or credit rating.
In addition to S&P 500 Options, the Fund may invest in other derivatives, including credit default swaps (including credit default index swaps or “CDX”), total return swaps and equity futures, each of which can be used for both hedging purposes and to seek to increase total return. The Fund may also utilize various interest rate-related derivatives, including futures and swaps, to manage the duration of its fixed income positions.
The Fund also may hold cash or invest in cash equivalents in order to collateralize its derivatives positions. Certain underlying funds may invest in derivatives for both hedging purposes and to seek to increase total return.
During the Reporting Period, the Fund invested in S&P 500 Options and equity index futures in implementing its strategy, which contributed positively to results.
How was the Fund positioned relative to its benchmark index at the end of the Reporting Period?
The Fund was invested in equity index futures and equity index options at the end of the Reporting Period. The Fund was also invested in various fixed income products, including U.S. Treasuries and money market funds for cash management purposes.
THE FUND IS NON-DIVERSIFIED UNDER THE INVESTMENT COMPANY ACT OF 1940, AS AMENDED, AND MAY INVEST A LARGER PERCENTAGE OF ITS ASSETS IN ONE OR MORE ISSUERS OR IN FEWER ISSUERS THAN DIVERSIFIED MUTUAL FUNDS.
GOLDMAN SACHS BUFFERED S&P 500 FUND — MAY/NOV
Percentage of Net Assets
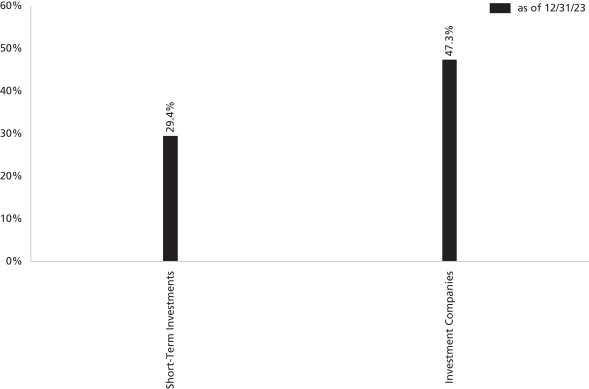
| † | The percentage shown for each investment category reflects the value of investments in that category as a percentage of net assets. Figures in the graph may not sum to 100% due to the exclusion of other assets and liabilities. The graph depicts the Fund’s investments but does not represent the Fund’s market exposure due to the exclusion of certain derivatives as listed in the Additional Investment Information section of the Consolidated Schedule of Investments. |
For more information about the Fund, please refer to www.GSAMFUNDS.com. There, you can learn more about the Fund’s Investment strategies, holdings, and performance.
GOLDMAN SACHS BUFFERED S&P 500 FUNDS
Index Definitions
ICE BofAML Three-Month U.S. Treasury Bill Index measures total return on cash, including price and interest income, based on short-term government Treasury Bills of about 90-day maturity, as reported by Bank of America Merrill Lynch.
S&P 500® Index is a U.S. stock market index based on the market capitalizations of 500 large companies having common stock listed on the New York Stock Exchange or NASDAQ. The S&P 500® Index components and their weightings are determined by S&P Dow Jones Indices.
S&P 500 Total Return Index is a type of equity index that tracks both the capital gains as well as any cash distributions, such as dividends or interest, attributed to the components of the index. A price return index takes into account only the capital appreciation of its components, while income generated, in the form of dividends or interest, is ignored.
S&P 500 Price Return Index is an unmanaged composite of 500 large capitalization companies. It only tracks the performance of the stock prices of the companies included in the index, and does not include returns from dividends paid by the companies included in the Price Return Index.
It is not possible to invest directly in an unmanaged index.
GOLDMAN SACHS BUFFERED S&P 500 FUND — JAN/JUL
Schedule of Investments
December 31, 2023
| | | | | | | | |
| Shares | | Distribution
Rate | | | Value | |
|
| Investment Companies(a) – 51.4% | |
Goldman Sachs Financial Square Government Fund — Institutional Class | |
| 717,585 | | | 5.248 | % | | $ | 717,585 | |
Goldman Sachs Financial Square Treasury Instruments Fund — Institutional Class | |
| 567,409 | | | 5.206 | | | | 567,409 | |
Goldman Sachs Financial Square Treasury Obligations Fund —Institutional Class | |
| 567,420 | | | 5.241 | | | | 567,420 | |
Goldman Sachs Financial Square Treasury Solutions Fund —Institutional Class | |
| 567,422 | | | 5.231 | | | | 567,422 | |
Goldman Sachs Variable Insurance Trust Government Money Market Fund — Institutional Class | |
| 525,360 | | | 5.270 | | | | 525,360 | |
| |
| TOTAL INVESTMENT COMPANIES | |
| (Cost $2,945,196) | | | $ | 2,945,196 | |
| |
| | | | | | | | | | | | | | |
Principal
Amount | | | Interest
Rate
| | | Maturity
Date | | | Value | |
|
| Short-term Investments(b) – 34.5% | |
| | Federal Home Loan Bank Discount Note | |
| $ | 500,000 | | | | 0.000 | % | | | 01/24/24 | | | $ | 498,057 | |
| | U.S. Treasury Bill | |
| | 1,500,000 | | | | 0.000 | | | | 03/21/24 | | | | 1,482,926 | |
| | |
| | TOTAL SHORT-TERM INVESTMENTS | | | | | |
| | (Cost $1,980,843) | | | $ | 1,980,983 | |
| | |
| | TOTAL INVESTMENTS – 85.9% | | | | | |
| | (Cost $4,926,039) | | | $ | 4,926,179 | |
| | |
| OTHER ASSETS IN EXCESS OF
LIABILITIES – 14.1% |
| | | 810,589 | |
| | |
| | NET ASSETS – 100.0% | | | $ | 5,736,768 | |
| | |
| | |
| The percentage shown for each investment category reflects the value of investments in that category as a percentage of net assets. |
| |
| (a) | | Represents an affiliated issuer. |
| |
| (b) | | Issued with a zero coupon. Income is recognized through the accretion of discount. |
ADDITIONAL INVESTMENT INFORMATION
FUTURES CONTRACTS — At December 31, 2023, the Fund had the following futures contracts:
| | | | | | | | | | | | | | |
| Type | | Number of
Contracts | | | Expiration
Date | | Notional
Amount | | | Unrealized
Gain (Loss) | |
|
Long position contracts: | |
| S&P 500 E-Mini Index | | | 23 | | | 03/15/24 | | $ | 5,543,000 | | | $ | 1,143 | |
| | |
| The accompanying notes are an integral part of these financial statements. | | 15 |
GOLDMAN SACHS BUFFERED S&P 500 FUND — JAN/JUL
Schedule of Investments (continued)
December 31, 2023
ADDITIONAL INVESTMENT INFORMATION (continued)
PURCHASED AND WRITTEN OPTIONS CONTRACTS — At December 31, 2023, the Fund had the following purchased and written options:
EXCHANGE TRADED OPTIONS ON EQUITIES
| | | | | | | | | | | | | | | | | | | | | | | | | | |
| Description | | Exercise
Price | | | Expiration
Date | | Number of
Contracts | | | Notional
Amount | | | Market
Value | | | Premiums
Paid
(Received)
by Fund | | | Unrealized
Appreciation/
(Depreciation) | |
|
Purchased option contracts | |
|
Puts | |
S&P 500 Index | | $ | 4,769.830 | | | 06/28/2024 | | | 12 | | | $ | 5,723,796 | | | $ | 169,244 | | | $ | 168,879 | | | $ | 365 | |
|
Written option contracts | |
|
Calls | |
S&P 500 Index | | | 5,141.880 | | | 06/28/2024 | | | (12 | ) | | | (6,170,256 | ) | | | (70,729 | ) | | | (66,945 | ) | | | (3,784 | ) |
|
Puts | |
S&P 500 Index | | | 4,531.340 | | | 06/28/2024 | | | (12 | ) | | | (5,437,608 | ) | | | (102,109 | ) | | | (101,853 | ) | | | (256 | ) |
| | | | | |
| Total written option contracts | | | (24 | ) | | $ | (11,607,864 | ) | | $ | (172,838 | ) | | $ | (168,798 | ) | | $ | (4,040 | ) |
| | | | | |
| TOTAL | | | (12 | ) | | $ | (5,884,068 | ) | | $ | (3,594 | ) | | $ | 81 | | | $ | (3,675 | ) |
| | |
| 16 | | The accompanying notes are an integral part of these financial statements. |
GOLDMAN SACHS BUFFERED S&P 500 FUND — MAR/SEP
Schedule of Investments
December 31, 2023
| | | | | | |
| Shares | | Distribution
Rate | | Value | |
|
| Investment Companies(a) – 44.6% | |
Goldman Sachs Financial Square Government Fund — Institutional Class | |
| 337,968 | | 5.248% | | $ | 337,968 | |
Goldman Sachs Financial Square Treasury Instruments Fund — Institutional Class | |
| 544,203 | | 5.206 | | | 544,203 | |
Goldman Sachs Financial Square Treasury Obligations Fund —Institutional Class | |
| 544,212 | | 5.241 | | | 544,212 | |
Goldman Sachs Financial Square Treasury Solutions Fund —Institutional Class | |
| 544,216 | | 5.231 | | | 544,216 | |
Goldman Sachs Variable Insurance Trust Government Money Market Fund — Institutional Class | |
| 521,517 | | 5.270 | | | 521,517 | |
| |
| TOTAL INVESTMENT COMPANIES | |
| (Cost $2,492,116) | | $ | 2,492,116 | |
| |
| | | | | | | | | | | | | | | | | | |
Principal
Amount | | | Interest
Rate | | | Maturity
Date | | | | | | Value | |
|
| Short-term Investments(b) – 34.5% | |
| | Federal Home Loan Bank Discount Note | |
| $ | 500,000 | | | | 0.000 | % | | | 02/28/24 | | | | | | | $ | 495,509 | |
| | U.S. Cash Management Bill | |
| | 317,100 | | | | 0.000 | | | | 02/15/24 | | | | | | | | 316,294 | |
| | U.S. Treasury Bills | |
| | 400,000 | | | | 0.000 | | | | 01/09/24 | | | | 399,532 | | | | 399,595 | |
| | 259,100 | | | | 0.000 | | | | 01/16/24 | | | | 258,533 | | | | 258,571 | |
| | 29,700 | | | | 0.000 | | | | 01/30/24 | | | | 29,587 | | | | 29,590 | |
| | 133,100 | | | | 0.000 | | | | 02/06/24 | | | | 132,398 | | | | 132,419 | |
| | 167,700 | | | | 0.000 | | | | 04/16/24 | | | | 165,125 | | | | 165,158 | |
| | 135,000 | | | | 0.000 | | | | 03/21/24 | | | | 133,429 | | | | 133,463 | |
| | |
| | TOTAL SHORT-TERM INVESTMENTS | |
| | (Cost $1,930,577) | | | $ | 1,930,599 | |
| | |
| | TOTAL INVESTMENTS – 79.1% | |
| | (Cost $4,422,693) | | | $ | 4,422,715 | |
| | |
| OTHER ASSETS IN EXCESS OF
LIABILITIES – 20.9% |
| | | 1,170,867 | |
| | |
| | NET ASSETS – 100.0% | | | $ | 5,593,582 | |
| | |
| | |
| The percentage shown for each investment category reflects the value of investments in that category as a percentage of net assets. |
| |
| (a) | | Represents an affiliated issuer. |
| |
| (b) | | Issued with a zero coupon. Income is recognized through the accretion of discount. |
ADDITIONAL INVESTMENT INFORMATION
FUTURES CONTRACTS — At December 31, 2023, the Fund had the following futures contracts:
| | | | | | | | | | | | | | |
| Type | | Number of
Contracts | | | Expiration
Date | | Notional
Amount | | | Unrealized
Gain (Loss) | |
Long position contracts: | |
| S&P 500 E-Mini Index | | | 23 | | | 03/15/24 | | $ | 5,543,000 | | | $ | 56,063 | |
| | |
| The accompanying notes are an integral part of these financial statements. | | 17 |
GOLDMAN SACHS BUFFERED S&P 500 FUND — MAR/SEP
Schedule of Investments (continued)
December 31, 2023
ADDITIONAL INVESTMENT INFORMATION (continued)
PURCHASED AND WRITTEN OPTIONS CONTRACTS — At December 31, 2023, the Fund had the following purchased and written options:
EXCHANGE TRADED OPTIONS ON EQUITIES
| | | | | | | | | | | | | | | | | | | | | | | | | | |
| Description | | Exercise
Price | | | Expiration
Date | | Number of
Contracts | | | Notional
Amount | | | Market
Value | | | Premiums
Paid
(Received)
by Fund | | | Unrealized
Appreciation/
(Depreciation) | |
| | | | | | | |
Purchased option contracts | | | | | | | | | | | | | | | | | | | | | | | | | | |
| | | | | | | |
Puts | | | | | | | | | | | | | | | | | | | | | | | | | | |
S&P 500 Index | | $ | 4,507.660 | | | 02/29/2024 | | | 12 | | | $ | 5,409,192 | | | $ | 27,558 | | | $ | 165,600 | | | $ | (138,042 | ) |
| | | | | | | |
Written option contracts | | | | | | | | | | | | | | | | | | | | | | | | | | |
| | | | | | | |
Calls | | | | | | | | | | | | | | | | | | | | | | | | | | |
S&P 500 Index | | | 4,870.980 | | | 02/29/2024 | | | (12 | ) | | | (5,845,176 | ) | | | (67,106 | ) | | | (69,600 | ) | | | 2,494 | |
| | | | | | | |
Puts | | | | | | | | | | | | | | | | | | | | | | | | | | |
S&P 500 Index | | | 4,282.280 | | | 02/29/2024 | | | (12 | ) | | | (5,138,736 | ) | | | (11,999 | ) | | | (96,000 | ) | | | 84,001 | |
| | | | | |
| Total written option contracts | | | (24 | ) | | $ | (10,983,912 | ) | | $ | (79,105 | ) | | $ | (165,600 | ) | | $ | 86,495 | |
| | | | | |
| TOTAL | | | (12 | ) | | $ | (5,574,720 | ) | | $ | (51,547 | ) | | $ | — | | | $ | (51,547 | ) |
| | |
| 18 | | The accompanying notes are an integral part of these financial statements. |
GOLDMAN SACHS BUFFERED S&P 500 FUND — MAY/NOV
Schedule of Investments
December 31, 2023
| | | | | | |
| Shares | | Distribution
Rate | | Value | |
|
| Investment Companies(a) – 47.3% | |
Goldman Sachs Financial Square Government Fund — Institutional Class | |
| 419,723 | | 5.248% | | $ | 419,723 | |
Goldman Sachs Financial Square Treasury Instruments Fund — Institutional Class | |
| 537,484 | | 5.206 | | | 537,484 | |
Goldman Sachs Financial Square Treasury Obligations Fund —Institutional Class | |
| 535,151 | | 5.241 | | | 535,151 | |
Goldman Sachs Financial Square Treasury Solutions Fund —Institutional Class | |
| 537,493 | | 5.231 | | | 537,493 | |
Goldman Sachs Variable Insurance Trust Government Money Market Fund — Institutional Class | |
| 517,481 | | 5.270 | | | 517,481 | |
| |
| TOTAL INVESTMENT COMPANIES | |
| (Cost $2,547,332) | | $ | 2,547,332 | |
| |
| | | | | | | | | | | | | | |
Principal
Amount | | | Interest
Rate | | | Maturity
Date | | | Value | |
|
| Short-term Investments(b) – 29.4% | |
| | Federal Home Loan Bank Discount Note | |
| $ | 450,000 | | | | 0.000 | % | | | 01/31/24 | | | $ | 447,784 | |
| | U.S. Treasury Bill | |
| | 1,150,000 | | | | 0.000 | | | | 03/21/24 | | | | 1,136,910 | |
| | |
| | TOTAL SHORT-TERM INVESTMENTS | |
| | (Cost $1,584,623) | | | $ | 1,584,694 | |
| | |
| | TOTAL INVESTMENTS – 76.7% | |
| | (Cost $4,131,955) | | | $ | 4,132,026 | |
| | |
| OTHER ASSETS IN EXCESS OF
LIABILITIES – 23.3% |
| | | 1,253,320 | |
| | |
| | NET ASSETS – 100.0% | | | $ | 5,385,346 | |
| | |
| | |
| The percentage shown for each investment category reflects the value of investments in that category as a percentage of net assets. |
| |
| (a) | | Represents an affiliated issuer. |
| |
| (b) | | Issued with a zero coupon. Income is recognized through the accretion of discount. |
ADDITIONAL INVESTMENT INFORMATION
FUTURES CONTRACTS — At December 31, 2023, the Fund had the following futures contracts:
| | | | | | | | | | | | | | |
| Type | | Number of
Contracts | | | Expiration
Date | | Notional
Amount | | | Unrealized
Gain (Loss) | |
Long position contracts: | |
| S&P 500 E-Mini Index | | | 22 | | | 03/15/24 | | $ | 5,302,000 | | | $ | 53,725 | |
| | |
| The accompanying notes are an integral part of these financial statements. | | 19 |
GOLDMAN SACHS BUFFERED S&P 500 FUND — MAY/NOV
Schedule of Investments (continued)
December 31, 2023
ADDITIONAL INVESTMENT INFORMATION (continued)
PURCHASED AND WRITTEN OPTIONS CONTRACTS — At December 31, 2023, the Fund had the following purchased and written options:
EXCHANGE TRADED OPTIONS ON EQUITIES
| | | | | | | | | | | | | | | | | | | | | | | | | | |
| Description | | Exercise
Price | | | Expiration
Date | | Number of
Contracts | | | Notional
Amount | | | Market
Value | | | Premiums
Paid
(Received)
by Fund | | | Unrealized
Appreciation/
(Depreciation) | |
| | | | | | | |
Purchased option contracts | | | | | | | | | | | | | | | | | | | | | | | | | | |
| | | | | | | |
Puts | | | | | | | | | | | | | | | | | | | | | | | | | | |
| | | | | | | |
S&P 500 Index | | $ | 4,193.800 | | | 04/30/2024 | | | 12 | | | $ | 5,032,560 | | | $ | 30,230 | | | $ | 197,280 | | | $ | (167,050 | ) |
| | | | | | | |
Written option contracts | | | | | | | | | | | | | | | | | | | | | | | | | | |
| | | | | | | |
Calls | | | | | | | | | | | | | | | | | | | | | | | | | | |
| | | | | | | |
S&P 500 Index | | | 4,584.240 | | | 04/30/2024 | | | (12 | ) | | | (5,501,088 | ) | | | (382,068 | ) | | | (71,460 | ) | | | (310,608 | ) |
| | | | | | | |
Puts | | | | | | | | | | | | | | | | | | | | | | | | | | |
| | | | | | | |
S&P 500 Index | | | 3,984.110 | | | 04/30/2024 | | | (12 | ) | | | (4,780,932 | ) | | | (19,412 | ) | | | (125,820 | ) | | | 106,408 | |
| | | | | | |
| Total written option contracts | | | | | | (24 | ) | | $ | (10,282,020 | ) | | $ | (401,480 | ) | | $ | (197,280 | ) | | $ | (204,200 | ) |
| | | | | | | |
| TOTAL | | | | | | | | | (12 | ) | | $ | (5,249,460 | ) | | $ | (371,250 | ) | | $ | — | | | $ | (371,250 | ) |
| | |
| 20 | | The accompanying notes are an integral part of these financial statements. |
GOLDMAN SACHS BUFFERED S&P 500 FUNDS
Statements of Assets and Liabilities
December 31, 2023
| | | | | | | | | | | | |
| | | Buffered S&P 500 Fund — Jan/Jul | | | Buffered S&P 500 Fund — Mar/Sep | | | Buffered S&P 500 Fund — May/Nov | |
| | | | | | | | | | | | |
| Assets: | | | | |
Investments, at value (cost $1,980,843, $1,930,577 and $1,584,623, respectively) | | $ | 1,980,983 | | | $ | 1,930,599 | | | $ | 1,584,694 | |
Investments of affiliated issuers, at value (cost $2,945,196, $2,492,116 and $2,547,332, respectively) | | | 2,945,196 | | | | 2,492,116 | | | | 2,547,332 | |
Purchased options, at value (premium paid $168,879, $165,600 and $197,280, respectively) | | | 169,244 | | | | 27,558 | | | | 30,230 | |
Cash | | | 108,877 | | | | 135,435 | | | | 90,603 | |
Receivables: | | | | | | | | | | | | |
Collateral on certain derivative contracts(a) | | | 924,827 | | | | 1,134,497 | | | | 1,552,249 | |
Investments sold | | | 552,138 | | | | — | | | | — | |
Reimbursement from investment adviser | | | — | | | | 7,245 | | | | 17,706 | |
Dividends and Interest | | | 14,909 | | | | 11,573 | | | | 2,312 | |
Deferred offering costs | | | — | | | | 12,085 | | | | 24,372 | |
Other assets | | | 22 | | | | 9 | | | | — | |
| | | |
| Total assets | | | 6,696,196 | | | | 5,751,117 | | | | 5,849,498 | |
| | | | | | | | | | | | |
| | | | | | | | | | | | |
| Liabilities: | | | | |
Written option contracts, at value (premium received $168,798, $165,600 and $197,280, respectively) | | | 172,838 | | | | 79,105 | | | | 401,480 | |
Variation margin on futures contracts | | | 297,397 | | | | 14,088 | | | | 14,666 | |
Payables: | | | | | | | | | | | | |
Investments purchased | | | 411,828 | | | | 12,032 | | | | 3,668 | |
Management fees | | | 2,003 | | | | 1,949 | | | | 1,931 | |
Distribution and Service fees and Transfer Agency fees | | | 97 | | | | 94 | | | | 91 | |
Accrued expenses | | | 75,265 | | | | 50,267 | | | | 42,316 | |
| | | |
| Total liabilities | | | 959,428 | | | | 157,535 | | | | 464,152 | |
| | | | | | | | | | | | |
| | | | | | | | | | | | |
| Net Assets: | | | | |
Paid-in capital | | | 5,472,945 | | | | 5,183,551 | | | | 5,148,968 | |
Total distributable earnings | | | 263,823 | | | | 410,031 | | | | 236,378 | |
| | | |
| NET ASSETS | | $ | 5,736,768 | | | $ | 5,593,582 | | | $ | 5,385,346 | |
Net Assets: | | | | | | | | | | | | |
Institutional | | $ | 5,679,402 | | | $ | 5,537,646 | | | $ | 5,331,493 | |
Service | | | 57,366 | | | | 55,936 | | | | 53,853 | |
| | | |
Total Net Assets | | $ | 5,736,768 | | | $ | 5,593,582 | | | $ | 5,385,346 | |
Shares Outstanding $0.001 par value (unlimited number of shares authorized): | | | | | | | | | | | | |
Institutional | | | 538,958 | | | | 511,918 | | | | 509,162 | |
Service | | | 5,444 | | | | 5,171 | | | | 5,143 | |
Net asset value, offering and redemption price per share: | | | | | | | | | | | | |
Institutional | | | $10.54 | | | | $10.82 | | | | $10.47 | |
Service | | | 10.54 | | | | 10.82 | | | | 10.47 | |
(a) Segregated for initial margin and/or collateral as follows
| | | | | | | | |
Fund | | Futures | | | Options | |
Buffered S&P 500 Fund — Jan/Jul | | $ | 298,540 | | | $ | 626,287 | |
Buffered S&P 500 Fund — Mar/Sep | | | 298,540 | | | | 835,957 | |
Buffered S&P 500 Fund — May/Nov | | | 285,560 | | | | 1,266,689 | |
| | |
| The accompanying notes are an integral part of these financial statements. | | 21 |
GOLDMAN SACHS BUFFERED S&P 500 FUNDS
Statements of Operations
For the Fiscal Year Ended December 31, 2023
| | | | | | | | | | | | |
| | | Buffered S&P 500 Fund — Jan/Jul | | | Buffered S&P 500 Fund — Mar/Sep(a) | | | Buffered S&P 500 Fund — May/Nov(b) | |
| | | | | | | | | | | | |
| Investment income: | | | | |
Dividends — affiliated issuers | | $ | 125,937 | | | $ | 102,065 | | | $ | 74,576 | |
Interest | | | 96,761 | | | | 84,467 | | | | 66,924 | |
| | | |
| Total investment income | | | 222,698 | | | | 186,532 | | | | 141,500 | |
| | | | | | | | | | | | |
| | | | | | | | | | | | |
| Expenses: | | | | |
Professional fees | | | 102,257 | | | | 90,264 | | | | 81,136 | |
Amortization of offering costs | | | 73,162 | | | | 61,433 | | | | 49,146 | |
Printing and mailing costs | | | 41,235 | | | | 25,756 | | | | 14,972 | |
Management fees | | | 27,061 | | | | 22,065 | | | | 17,460 | |
Trustee fees | | | 20,914 | | | | 21,413 | | | | 12,757 | |
Custody, accounting and administrative services | | | 15,604 | | | | 25,638 | | | | 20,523 | |
Transfer Agency fees(c) | | | 1,083 | | | | 883 | | | | 698 | |
Distribution and/or Service (12b-1) fees | | | 135 | | | | 110 | | | | 88 | |
Organization costs | | | — | | | | 12,000 | | | | 12,000 | |
Other | | | 9,923 | | | | 7,107 | | | | 5,699 | |
| | | |
| Total expenses | | | 291,374 | | | | 266,669 | | | | 214,479 | |
| | | |
Less — expense reductions | | | (257,003 | ) | | | (238,737 | ) | | | (192,106 | ) |
| | | |
| Net expenses | | | 34,371 | | | | 27,932 | | | | 22,373 | |
| | | |
| NET INVESTMENT INCOME | | | 188,327 | | | | 158,600 | | | | 119,127 | |
| | | | | | | | | | | | |
| | | | | | | | | | | | |
| Realized and unrealized gain (loss): | | | | |
Net realized gain (loss) from: | | | | | | | | | | | | |
Investments — unaffiliated issuers | | | (448 | ) | | | (1,456 | ) | | | (109 | ) |
Purchased options | | | 546,046 | | | | 368,446 | | | | (274,320 | ) |
Futures contracts | | | — | | | | 148,033 | | | | 554,598 | |
Written options | | | 3,892 | | | | (84,578 | ) | | | 303,504 | |
Net change in unrealized gain (loss) on: | | | | | | | | | | | | |
Investments — unaffiliated issuers | | | 93 | | | | 22 | | | | 71 | |
Purchased options | | | 3,586 | | | | (138,042 | ) | | | (167,050 | ) |
Futures contracts | | | 1,143 | | | | 56,063 | | | | 53,725 | |
Written options | | | (10,175 | ) | | | 86,495 | | | | (204,200 | ) |
| | | |
| Net realized and unrealized gain | | | 544,137 | | | | 434,983 | | | | 266,219 | |
| | | |
| NET INCREASE IN NET ASSETS RESULTING FROM OPERATIONS | | $ | 732,464 | | | $ | 593,583 | | | $ | 385,346 | |
(a) Commenced operations on February 28, 2023.
(b) Commenced operations on April 28, 2023.
(a) Class specific Transfer Agency fees were as follows:
| | | | | | | | |
| | | Transfer Agency Fees | |
| | | Institutional | | | Service Class | |
Buffered S&P 500 Fund — Jan/Jul | | $ | 1,072 | | | $ | 11 | |
Buffered S&P 500 Fund — Mar/Sep | | | 874 | | | | 9 | |
Buffered S&P 500 Fund — May/Nov | | | 691 | | | | 7 | |
| | |
| 22 | | The accompanying notes are an integral part of these financial statements. |
GOLDMAN SACHS BUFFERED S&P 500 FUNDS
Statements of Changes in Net Assets
| | | | | | | | |
| | | Buffered S&P 500 Fund — Jan/Jul | |
| | | For the
Fiscal Year Ended
December 31, 2023 | | | For the Period Ended December 31, 2022(a) | |
| | | | | | | | |
| From operations: | |
Net investment income | | $ | 188,327 | | | $ | 1,343 | |
Net realized gain | | | 549,490 | | | | — | |
Net change in unrealized gain (loss) | | | (5,353 | ) | | | 2,961 | |
| | |
| Net increase in net assets resulting from operations | | | 732,464 | | | | 4,304 | |
| | | | | | | | |
| | | | | | | | |
| Distributions to shareholders: | |
From distributable earnings: | | | | | | | | |
Institutional | | | (469,777 | ) | | | — | |
Service Shares | | | (4,745 | ) | | | — | |
| | |
| Total distributions to shareholders | | | (474,522 | ) | | | — | |
| | | | | | | | |
| | | | | | | | |
| From share transactions: | |
Proceeds from sales of shares | | | — | | | | 5,000,000 | |
Reinvestment of distributions | | | 474,522 | | | | — | |
| | |
| Net increase in net assets resulting from share transactions | | | 474,522 | | | | 5,000,000 | |
| | |
| TOTAL INCREASE | | | 732,464 | | | | 5,004,304 | |
| | | | | | | | |
| | | | | | | | |
| Net assets: | |
| | |
Beginning of year | | | 5,004,304 | | | | — | |
| | |
End of year | | $ | 5,736,768 | | | $ | 5,004,304 | |
(a) Commenced operations on December 30, 2022.
| | |
| The accompanying notes are an integral part of these financial statements. | | 23 |
GOLDMAN SACHS BUFFERED S&P 500 FUNDS
Statements of Changes in Net Assets (continued)
| | | | | | | | |
| | | Buffered S&P 500
Fund — Mar/Sep(a) | | | Buffered S&P 500
Fund — May/Nov(b) | |
| | | For the
Period Ended
December 31, 2023 | | | For the
Period Ended
December 31, 2023 | |
| | | | | | | | |
| From operations: | |
Net investment income | | $ | 158,600 | | | $ | 119,127 | |
Net realized gain | | | 430,445 | | | | 583,673 | |
Net change in unrealized gain (loss) | | | 4,538 | | | | (317,454 | ) |
| | |
| Net increase in net assets resulting from operations | | | 593,583 | | | | 385,346 | |
| | | | | | | | |
| | | | | | | | |
| Distributions to shareholders: | |
From distributable earnings: | | | | | | | | |
Institutional | | | (183,158 | ) | | | (148,709 | ) |
Service Shares | | | (1,850 | ) | | | (1,502 | ) |
| | |
| Total distributions to shareholders | | | (185,008 | ) | | | (150,211 | ) |
| | | | | | | | |
| | | | | | | | |
| From share transactions: | |
Proceeds from sales of shares | | | 5,000,020 | | | | 5,000,020 | |
Reinvestment of distributions | | | 185,008 | | | | 150,211 | |
Cost of shares redeemed | | | (21 | ) | | | (20 | ) |
| | |
| Net increase in net assets resulting from share transactions | | | 5,185,007 | | | | 5,150,211 | |
| | |
| TOTAL INCREASE | | | 5,593,582 | | | | 5,385,346 | |
| | | | | | | | |
| | | | | | | | |
| Net assets: | |
| | |
Beginning of period | | | — | | | | — | |
| | |
End of period | | $ | 5,593,582 | | | $ | 5,385,346 | |
(a) Commenced operations on February 28, 2023.
(b) Commenced operations on April 28, 2023.
| | |
| 24 | | The accompanying notes are an integral part of these financial statements. |
GOLDMAN SACHS BUFFERED S&P 500 FUND — JAN/JUL
Financial Highlights
Selected Share Data for a Share Outstanding Throughout each Period
| | | | | | | | |
| | | Goldman Sachs Buffered S&P 500
Fund — Jan/Jul | |
| | | Institutional Shares | |
| | | Year Ended
December 31, 2023 | | | Period Ended
December 31, 2022(a) | |
| | | | | | | | |
| Per Share Data | |
| | |
Net asset value, beginning of period | | $ | 10.00 | | | $ | 10.00 | |
| | |
Net investment income(b)(c) | | | 0.38 | | | | 0.00 | (d) |
| | |
Net realized and unrealized gain | | | 1.09 | | | | 0.00 | (d) |
| | |
Total from investment operations | | | 1.47 | | | | — | |
| | |
Distributions to shareholders from net investment income | | | (0.37 | ) | | | — | |
| | |
Distributions to shareholders from net realized gains | | | (0.56 | ) | | | — | |
| | |
Total distributions | | | (0.93 | ) | | | — | |
| | |
Net asset value, end of period | | $ | 10.54 | | | $ | 10.00 | |
| | |
Total return(e) | | | 14.76 | % | | | — | % |
| | |
Net assets, end of period (in 000s) | | $ | 5,679 | | | $ | 4,954 | |
| | |
Ratio of net expenses to average net assets(f) | | | 0.64 | % | | | 0.54 | %(g) |
| | |
Ratio of total expenses to average net assets(f) | | | 5.38 | % | | | 66.87 | %(g) |
| | |
Ratio of net investment income to average net assets(c) | | | 3.48 | % | | | 4.90 | %(g) |
| | |
Portfolio turnover rate(h) | | | — | % | | | — | % |
| (a) | Commenced operations on December 30, 2022. |
| (b) | Calculated based on the average shares outstanding methodology. |
| (c) | Recognition of net investment income by the Fund is affected by the timing of declaration of dividends by the Underlying Funds in which the Fund invests. |
| (d) | Amount is less than $0.005 per share. |
| (e) | Assumes investment at the NAV at the beginning of the year, reinvestment of all dividends and distributions, a complete redemption of the investment at the NAV at the end of the year and no sales or redemption charges (if any). Total returns would be reduced if a sales or redemption charge was taken into account. Returns do not reflect the impact of taxes to shareholders relating to Fund distributions or the redemption of Fund shares. Total returns for periods less than one full year are not annualized. |
| (f) | Expense ratios exclude the expenses of the Underlying Funds in which the Fund invests. |
| (h) | There were no long-term transactions for the fiscal year ended December 31, 2023 and period ended December 31, 2022, respectively. |
| | |
| The accompanying notes are an integral part of these financial statements. | | 25 |
GOLDMAN SACHS BUFFERED S&P 500 FUND — JAN/JUL
Financial Highlights (continued)
Selected Share Data for a Share Outstanding Throughout each Period
| | | | | | | | |
| | | Goldman Sachs Buffered S&P 500
Fund — Jan/Jul | |
| | | Service Shares | |
| | | Year Ended
December 31, 2023 | | | Period Ended
December 31, 2022(a) | |
| | | | | | | | |
| Per Share Data | |
| | |
Net asset value, beginning of period | | $ | 10.00 | | | $ | 10.00 | |
| | |
Net investment income(b)(c) | | | 0.38 | | | | 0.00 | (d) |
| | |
Net realized and unrealized gain (loss) | | | 1.09 | | | | (0.00 | )(d) |
| | |
Total from investment operations | | | 1.47 | | | | — | |
| | |
Distributions to shareholders from net investment income | | | (0.37 | ) | | | — | |
| | |
Distributions to shareholders from net realized gains | | | (0.56 | ) | | | — | |
| | |
Total distributions | | | (0.93 | ) | | | — | |
| | |
Net asset value, end of period | | $ | 10.54 | | | $ | 10.00 | |
| | |
Total return(e) | | | 14.76 | % | | | — | % |
| | |
Net assets, end of period (in 000s) | | $ | 57 | | | $ | 50 | |
| | |
Ratio of net expenses to average net assets(f) | | | 0.64 | % | | | 0.79 | %(g) |
| | |
Ratio of total expenses to average net assets(f) | | | 5.63 | % | | | 67.12 | %(g) |
| | |
Ratio of net investment income to average net assets(c) | | | 3.48 | % | | | 4.65 | %(g) |
| | |
Portfolio turnover rate(h) | | | — | % | | | — | % |
| (a) | Commenced operations on December 30, 2022. |
| (b) | Calculated based on the average shares outstanding methodology. |
| (c) | Recognition of net investment income by the Fund is affected by the timing of declaration of dividends by the Underlying Funds in which the Fund invests. |
| (d) | Amount is less than $0.005 per share. |
| (e) | Assumes investment at the NAV at the beginning of the year, reinvestment of all dividends and distributions, a complete redemption of the investment at the NAV at the end of the year and no sales or redemption charges (if any). Total returns would be reduced if a sales or redemption charge was taken into account. Returns do not reflect the impact of taxes to shareholders relating to Fund distributions or the redemption of Fund shares. Total returns for periods less than one full year are not annualized. |
| (f) | Expense ratios exclude the expenses of the Underlying Funds in which the Fund invests. |
| (h) | There were no long-term transactions for the fiscal year ended December 31, 2023 and period ended December 31, 2022, respectively. |
| | |
| 26 | | The accompanying notes are an integral part of these financial statements. |
GOLDMAN SACHS BUFFERED S&P 500 FUND — MAR/SEP
Financial Highlights (continued)
Selected Share Data for a Share Outstanding Throughout the Period
| | | | |
| | | Goldman Sachs Buffered S&P 500
Fund — Mar/Sep | |
| | | Institutional Shares | |
| | | Period Ended
December 31, 2023(a) | |
| | | | |
| Per Share Data | |
| |
Net asset value, beginning of period | | $ | 10.00 | |
| |
Net investment income(b)(c) | | | 0.32 | |
| |
Net realized and unrealized gain | | | 0.87 | |
| |
Total from investment operations | | | 1.19 | |
| |
Distributions to shareholders from net investment income | | | (0.32 | ) |
| |
Distributions to shareholders from net realized gains | | | (0.05 | ) |
| |
Total distributions | | | (0.37 | ) |
| |
Net asset value, end of period | | $ | 10.82 | |
| |
Total return(d) | | | 11.90 | % |
| |
Net assets, end of period (in 000s) | | $ | 5,538 | |
| |
Ratio of net expenses to average net assets(e) | | | 0.63 | %(f) |
| |
Ratio of total expenses to average net assets(e) | | | 5.82 | %(f) |
| |
Ratio of net investment income to average net assets(c) | | | 3.59 | %(f) |
| |
Portfolio turnover rate(g) | | | — | % |
| (a) | Commenced operations on February 28, 2023. |
| (b) | Calculated based on the average shares outstanding methodology. |
| (c) | Recognition of net investment income by the Fund is affected by the timing of declaration of dividends by the Underlying Funds in which the Fund invests. |
| (d) | Assumes investment at the NAV at the beginning of the year, reinvestment of all dividends and distributions, a complete redemption of the investment at the NAV at the end of the year and no sales or redemption charges (if any). Total returns would be reduced if a sales or redemption charge was taken into account. Returns do not reflect the impact of taxes to shareholders relating to Fund distributions or the redemption of Fund shares. Total returns for periods less than one full year are not annualized. |
| (e) | Expense ratios exclude the expenses of the Underlying Funds in which the Fund invests. |
| (g) | There were no long-term transactions for the period ended December 31, 2023. |
| | |
| The accompanying notes are an integral part of these financial statements. | | 27 |
GOLDMAN SACHS BUFFERED S&P 500 FUND — MAR/SEP
Financial Highlights (continued)
Selected Share Data for a Share Outstanding Throughout the Period
| | | | |
| | | Goldman Sachs Buffered S&P 500
Fund — Mar/Sep | |
| | | Service Shares | |
| | | Period Ended
December 31, 2023(a) | |
| | | | |
| Per Share Data | |
| |
Net asset value, beginning of period | | $ | 10.00 | |
| |
Net investment income(b)(c) | | | 0.32 | |
| |
Net realized and unrealized gain | | | 0.87 | |
| |
Total from investment operations | | | 1.19 | |
| |
Distributions to shareholders from net investment income | | | (0.32 | ) |
| |
Distributions to shareholders from net realized gains | | | (0.05 | ) |
| |
Total distributions | | | (0.37 | ) |
| |
Net asset value, end of period | | $ | 10.82 | |
| |
Total return(d) | | | 11.90 | % |
| |
Net assets, end of period (in 000s) | | $ | 56 | |
| |
Ratio of net expenses to average net assets(e) | | | 0.63 | %(f) |
| |
Ratio of total expenses to average net assets(e) | | | 6.07 | %(f) |
| |
Ratio of net investment income to average net assets(c) | | | 3.59 | %(f) |
| |
Portfolio turnover rate(g) | | | — | % |
| (a) | Commenced operations on February 28, 2023. |
| (b) | Calculated based on the average shares outstanding methodology. |
| (c) | Recognition of net investment income by the Fund is affected by the timing of declaration of dividends by the Underlying Funds in which the Fund invests. |
| (d) | Assumes investment at the NAV at the beginning of the year, reinvestment of all dividends and distributions, a complete redemption of the investment at the NAV at the end of the year and no sales or redemption charges (if any). Total returns would be reduced if a sales or redemption charge was taken into account. Returns do not reflect the impact of taxes to shareholders relating to Fund distributions or the redemption of Fund shares. Total returns for periods less than one full year are not annualized. |
| (e) | Expense ratios exclude the expenses of the Underlying Funds in which the Fund invests. |
| (g) | There were no long-term transactions for the period ended December 31, 2023. |
| | |
| 28 | | The accompanying notes are an integral part of these financial statements. |
GOLDMAN SACHS BUFFERED S&P 500 FUND — MAY/NOV
Financial Highlights (continued)
Selected Share Data for a Share Outstanding Throughout the Period
| | | | |
| | | Goldman Sachs Buffered S&P 500
Fund — May/Nov
| |
| | | Institutional Shares | |
| | | Period Ended
December 31, 2023(a) | |
| | | | |
| Per Share Data | |
| |
Net asset value, beginning of period | | $ | 10.00 | |
| |
Net investment income(b) (c) | | | 0.24 | |
| |
Net realized and unrealized gain | | | 0.53 | |
| |
Total from investment operations | | | 0.77 | |
| |
Distributions to shareholders from net investment income | | | (0.24 | ) |
| |
Distributions to shareholders from net realized gains | | | (0.06 | ) |
| |
Total distributions | | | (0.30 | ) |
| |
Net asset value, end of period | | $ | 10.47 | |
| |
Total return(d) | | | 7.70 | % |
| |
Net assets, end of period (in 000s) | | $ | 5,331 | |
| |
Ratio of net expenses to average net assets(e) | | | 0.63 | %(f) |
| |
Ratio of total expenses to average net assets(e) | | | 5.58 | %(f) |
| |
Ratio of net investment income to average net assets(c) | | | 3.41 | %(f) |
| |
Portfolio turnover rate(g) | | | — | % |
| (a) | Commenced operations on April 28, 2023. |
| (b) | Calculated based on the average shares outstanding methodology. |
| (c) | Recognition of net investment income by the Fund is affected by the timing of declaration of dividends by the Underlying Funds in which the Fund invests. |
| (d) | Assumes investment at the NAV at the beginning of the year, reinvestment of all dividends and distributions, a complete redemption of the investment at the NAV at the end of the year and no sales or redemption charges (if any). Total returns would be reduced if a sales or redemption charge was taken into account. Returns do not reflect the impact of taxes to shareholders relating to Fund distributions or the redemption of Fund shares. Total returns for periods less than one full year are not annualized. |
| (e) | Expense ratios exclude the expenses of the Underlying Funds in which the Fund invests |
| (g) | There were no long-term transactions for the period ended December 31, 2023. |
| | |
| The accompanying notes are an integral part of these financial statements. | | 29 |
GOLDMAN SACHS BUFFERED S&P 500 FUND — MAY/NOV
Financial Highlights (continued)
Selected Share Data for a Share Outstanding Throughout the Period
| | | | |
| | | Goldman Sachs Buffered S&P 500
Fund — May/Nov
| |
| | | Service Shares | |
| | | Period Ended December 31, 2023(a) | |
| | | | |
| Per Share Data | |
| |
Net asset value, beginning of period | | $ | 10.00 | |
| |
Net investment income(b) (c) | | | 0.24 | |
| |
Net realized and unrealized gain | | | 0.53 | |
| |
Total from investment operations | | | 0.77 | |
| |
Distributions to shareholders from net investment income | | | (0.24 | ) |
| |
Distributions to shareholders from net realized gains | | | (0.06 | ) |
| |
Total distributions | | | (0.30 | ) |
| |
Net asset value, end of period | | $ | 10.47 | |
| |
Total return(d) | | | 7.69 | % |
| |
Net assets, end of period (in 000s) | | $ | 54 | |
| |
Ratio of net expenses to average net assets(e) | | | 0.64 | %(f) |
| |
Ratio of total expenses to average net assets(e) | | | 5.83 | %(f) |
| |
Ratio of net investment income to average net assets(c) | | | 3.41 | %(f) |
| |
Portfolio turnover rate(g) | | | — | % |
| (a) | Commenced operations on April 28, 2023. |
| (b) | Calculated based on the average shares outstanding methodology. |
| (c) | Recognition of net investment income by the Fund is affected by the timing of declaration of dividends by the Underlying Funds in which the Fund invests. |
| (d) | Assumes investment at the NAV at the beginning of the year, reinvestment of all dividends and distributions, a complete redemption of the investment at the NAV at the end of the year and no sales or redemption charges (if any). Total returns would be reduced if a sales or redemption charge was taken into account. Returns do not reflect the impact of taxes to shareholders relating to Fund distributions or the redemption of Fund shares. Total returns for periods less than one full year are not annualized. |
| (e) | Expense ratios exclude the expenses of the Underlying Funds in which the Fund invests |
| (g) | There were no long-term transactions for the period ended December 31, 2023. |
| | |
| 30 | | The accompanying notes are an integral part of these financial statements. |
GOLDMAN SACHS VIT BUFFERED S&P 500 FUNDS
Notes to Financial Statements
December 31, 2023
1. ORGANIZATION
Goldman Sachs Variable Insurance Trust (the “Trust” or “VIT”) is a Delaware statutory trust registered under the Investment Company Act of 1940, as amended (the “Act”), as an open-end management investment company. The following table lists those series of the Trust that are included in this report (collectively, the “Funds” or individually a “Fund”), along with their corresponding share classes and respective diversification status under the Act:
| | | | | | | | |
| Fund | | Share Classes Offered | | | Diversified/
Non-diversified | |
| Buffered S&P 500 Fund — Jan/Jul | | | Institutional and Service | | | | Non-diversified | |
| Buffered S&P 500 Fund — Mar/Sep | | | Institutional and Service | | | | Non-diversified | |
| Buffered S&P 500 Fund — May/Nov | | | Institutional and Service | | | | Non-diversified | |
Shares of the Trust are offered to a separate account of participating life insurance companies for the purpose of funding variable annuity contracts and variable life insurance policies.
The Funds seek to achieve a total return for a specified Outcome Period that tracks the S&P 500 Price Return Index (the “Underlying Index”) up to a “cap” while providing a downside “buffer” against losses over a six-month Outcome Period. After the conclusion of an Outcome Period, another six-month Outcome Period will begin. In order to implement the buffer and cap, the Fund will primarily invest in FLexible EXchange® Options (“FLEX Options”) and over-the counter (“OTC”) and listed options that reference the Underlying Index (together with FLEX Options, “S&P 500 Options”). FLEX Options are customized exchange-traded option contracts available through the Chicago Board Option Exchange. Through FLEX Options, the Fund could customize key contract terms such as exercise prices and expiration dates.
Goldman Sachs Asset Management, L.P. (“GSAM”), an affiliate of Goldman Sachs & Co. LLC (“Goldman Sachs”), serves as investment adviser to the Funds pursuant to a management agreement (the “Agreement”) with the Trust.
2. SIGNIFICANT ACCOUNTING POLICIES
The financial statements have been prepared in accordance with accounting principles generally accepted in the United States of America (“GAAP”) and require management to make estimates and assumptions that may affect the reported amounts and disclosures. Actual results may differ from those estimates and assumptions. Each Fund is an investment company under GAAP and follows the accounting and reporting guidance applicable to investment companies.
A. Investment Valuation — The Funds’ valuation policy is to value investments at fair value.
B. Investment Income and Investments — Investment income includes interest income, dividend income and securities lending income, if any. Interest income is accrued daily and adjusted for amortization of premiums and accretion of discounts. Dividend income is recognized on ex-dividend date or, for certain foreign securities, as soon as such information is obtained subsequent to the ex-dividend date. Non-cash dividends, if any, are recorded at the fair market value of the securities received. Investment transactions are reflected on trade date. Realized gains and losses are calculated using identified cost. Investment transactions are recorded on the following business day for daily net asset value (“NAV”) calculations. For derivative contracts, unrealized gains and losses are recorded daily and become realized gains and losses upon disposition or termination of the contract.
C. Class Allocations and Expenses — Investment income, realized and unrealized gain (loss), if any, and non-class specific expenses of each Fund are allocated daily based upon the proportion of net assets of each class. Non-class specific expenses directly incurred by a Fund are charged to that Fund, while such expenses incurred by the Trust are allocated across the applicable Funds on a straight-line and/or pro-rata basis depending upon the nature of the expenses. Class specific expenses, where applicable, are borne by the respective share classes and include Distribution and Service and Transfer Agency fees.
GOLDMAN SACHS VIT BUFFERED S&P 500 FUNDS
Notes to Financial Statements (continued)
December 31, 2023
2. SIGNIFICANT ACCOUNTING POLICIES (continued)
D. Offering and Organization Costs — Offering costs paid in connection with the initial offering of shares of each Fund are being amortized on a straight-line basis over 12 months from the date of commencement of operations for the applicable Fund. Organization costs paid in connection with the organization of each Fund were expensed on the first day of operations for the applicable Fund.
E. Federal Taxes and Distributions to Shareholders — It is each Fund’s policy to comply with the requirements of the
Internal Revenue Code of 1986, as amended (the “Code”), applicable to regulated investment companies and to distribute each year substantially all of its investment company taxable income and capital gains to its shareholders. Accordingly, each Fund is not required to make any provisions for the payment of federal income tax. Distributions to shareholders are recorded on the ex-dividend date. Income and capital gains distributions, if any, are declared and paid according to the following schedule:
| | | | |
| Fund | | Income Distributions Declared/Paid | | Capital Gains Distributions Declared/Paid |
Buffered S&P 500 Fund — Jan/Jul | | Annually | | Annually |
Buffered S&P 500 Fund — Mar/Sep | | Annually | | Annually |
Buffered S&P 500 Fund — May/Nov | | Annually | | Annually |
Net capital losses, if any, are carried forward to future fiscal years and may be used to the extent allowed by the Code to offset any future capital gains. Losses that are carried forward will retain their character as either short-term or long-term capital losses. Utilization of capital loss carryforwards will reduce the requirement of future capital gains distributions.
The characterization of distributions to shareholders for financial reporting purposes is determined in accordance with federal income tax rules, which may differ from GAAP. The source of each Fund’s distributions may be shown in the accompanying financial statements as either from distributable earnings or capital. Certain components of the Funds’ net assets on the Statements of Assets and Liabilities reflect permanent GAAP/tax differences based on the appropriate tax character.
3. INVESTMENTS AND FAIR VALUE MEASUREMENTS
U.S. GAAP defines the fair value of a financial instrument as the amount that would be received to sell an asset or paid to transfer a liability in an orderly transaction between market participants at the measurement date (i.e., the exit price); the Funds’ policy is to use the market approach. GAAP establishes a fair value hierarchy that prioritizes the inputs to valuation techniques used to measure fair value. The hierarchy gives the highest priority to unadjusted quoted prices in active markets for identical assets or liabilities (Level 1 measurements) and the lowest priority to unobservable inputs (Level 3 measurements). The level in the fair value hierarchy within which the fair value measurement in its entirety falls shall be determined based on the lowest level input that is significant to the fair value measurement in its entirety. The levels used for classifying investments are not necessarily an indication of the risk associated with investing in these investments. The three levels of the fair value hierarchy are described below:
Level 1 — Unadjusted quoted prices in active markets that are accessible at the measurement date for identical, unrestricted assets or liabilities;
Level 2 — Quoted prices in markets that are not active or financial instruments for which significant inputs are observable (including, but not limited to, quoted prices for similar investments, interest rates, foreign exchange rates, volatility and credit spreads), either directly or indirectly;
Level 3 — Prices or valuations that require significant unobservable inputs (including GSAM’s assumptions in determining fair value measurement).
The Board of Trustees (“Trustees”) has approved Valuation Procedures that govern the valuation of the portfolio investments held by the Funds, including investments for which market quotations are not readily available. With respect to the Funds’ investments that do not have readily available market quotations, the Trustees have designated the Adviser as the valuation designee to perform fair valuations pursuant to Rule 2a-5 under the Investment Company Act of 1940 (the “Valuation Designee”). GSAM has
GOLDMAN SACHS VIT BUFFERED S&P 500 FUNDS
3. INVESTMENTS AND FAIR VALUE MEASUREMENTS (continued)
day-to-day responsibility for implementing and maintaining internal controls and procedures related to the valuation of the Funds’ investments. To assess the continuing appropriateness of pricing sources and methodologies, GSAM regularly performs price verification procedures and issues challenges as necessary to third party pricing vendors or brokers, and any differences are reviewed in accordance with the Valuation Procedures.
A. Level 1 and Level 2 Fair Value Investments — The valuation techniques and significant inputs used in determining the fair values for investments classified as Level 1 and Level 2 are as follows:
Debt Securities — Debt securities for which market quotations are readily available are valued daily on the basis of quotations supplied by dealers or an independent pricing service. The pricing services may use valuation models or matrix pricing, which consider: (i) yield or price with respect to bonds that are considered comparable in characteristics such as rating, interest rate and maturity date or (ii) quotations from securities dealers to determine current value. With the exception of treasury securities of G7 countries, which are generally classified as Level 1, these investments are generally classified as Level 2 of the fair value hierarchy.
Equity Securities — Equity securities traded on a United States (“U.S.”) securities exchange or the NASDAQ system, or those located on certain foreign exchanges, including but not limited to the Americas, are valued daily at their last sale price or official closing price on the principal exchange or system on which they are traded. If there is no sale or official closing price or such price is believed by GSAM to not represent fair value, equity securities will be valued at the valid closing bid price for long positions and at the valid closing ask price for short positions (i.e. where there is sufficient volume, during normal exchange trading hours). If no valid bid/ask price is available, the equity security will be valued pursuant to the Valuation Procedures and consistent with applicable regulatory guidance. To the extent these investments are actively traded, they are classified as Level 1 of the fair value hierarchy, otherwise they are generally classified as Level 2. Certain equity securities containing unique attributes may be classified as Level 2.
Unlisted equity securities for which market quotations are available are valued at the last sale price on the valuation date, or if no sale occurs, at the last bid price for long positions or the last ask price for short positions, and are generally classified as Level 2.
Money Market Funds — Investments in the Goldman Sachs Financial Square Government Fund, Goldman Sachs Financial Square Treasury Instruments Fund, Goldman Sachs Financial Square Treasury Obligations Fund, Goldman Sachs VIT Government Money Market Fund and Goldman Sachs Financial Square Treasury Solutions Fund (“Underlying Money Market Funds”) are valued at the NAV per share of the Institutional Share class on the day of valuation. These investments are generally classified as Level 1 of the fair value hierarchy. For information regarding the Underlying Money Market Funds’ accounting policies and investment holdings, please see the Underlying Money Market Funds’ shareholder report.
Derivative Contracts — A derivative is an instrument whose value is derived from underlying assets, indices, reference rates or a combination of these factors. The Fund enters into derivative transactions to hedge against changes in interest rates, securities prices, and/or currency exchange rates, to increase total return, or to gain access to certain markets or attain exposure to other underliers. For financial reporting purposes, cash collateral that has been pledged to cover obligations of a Fund and cash collateral received, if any, is reported separately on the Statement of Assets and Liabilities as either due to broker/receivable for collateral on certain derivative contracts. Non-cash collateral pledged by a Fund, if any, is noted in the Schedules of Investments.
Exchange-traded derivatives, including futures and options contracts, are generally valued at the last sale or settlement price on the exchange where they are principally traded. Exchange-traded options without settlement prices are generally valued at the midpoint of the bid and ask prices on the exchange where they are principally traded (or, in the absence of two-way trading, at the last bid price for long positions and the last ask price for short positions). Exchange-traded derivatives typically fall within Level 1 of the fair value hierarchy. Over-the-counter (“OTC”) and centrally cleared derivatives are valued using market transactions and other market evidence, including market-based inputs to models, calibration to market-clearing transactions, broker or dealer quotations, or other alternative pricing sources. Where models are used, the selection of a particular model to value OTC and centrally cleared derivatives depends upon the contractual terms of, and specific risks inherent in, the instrument, as well as the availability of pricing information in the market. Valuation models require a variety of inputs, including contractual terms, market
GOLDMAN SACHS VIT BUFFERED S&P 500 FUNDS
Notes to Financial Statements (continued)
December 31, 2023
3. INVESTMENTS AND FAIR VALUE MEASUREMENTS (continued)
prices, yield curves, credit curves, measures of volatility, voluntary and involuntary prepayment rates, loss severity rates and correlations of such inputs. For OTC and centrally cleared derivatives that trade in liquid markets, model inputs can generally be verified and model selection does not involve significant management judgment. OTC and centrally cleared derivatives are classified within Level 2 of the fair value hierarchy when significant inputs are corroborated by market evidence.
i. Futures Contracts — Futures contracts are contracts to buy or sell a standardized quantity of a specified commodity or security. Upon entering into a futures contract, a Fund deposits cash or securities in an account on behalf of the broker in an amount sufficient to meet the initial margin requirement. Subsequent payments are made or received by a Fund equal to the daily change in the contract value and are recorded as variation margin receivable or payable with a corresponding offset to unrealized gains or losses.
ii. Options — When a Fund writes call or put options, an amount equal to the premium received is recorded as a liability and is subsequently marked-to-market to reflect the current value of the option written. Swaptions are options on swap contracts.
Upon the purchase of a call option or a put option by a Fund, the premium paid is recorded as an investment and subsequently marked-to-market to reflect the current value of the option. Certain options may be purchased with premiums to be determined on a future date. The premiums for these options are based upon implied volatility parameters at specified terms.
B. Level 3 Fair Value Investments — To the extent that significant inputs to valuation models and other alternative pricing sources are unobservable, or if quotations are not readily available, or if GSAM believes that such quotations do not accurately reflect fair value, the fair value of a Fund’s investments may be determined under the Valuation Procedures. GSAM, consistent with its procedures and applicable regulatory guidance, may make an adjustment to the most recent valuation prices of either domestic or foreign securities in light of significant events to reflect what it believes to be the fair value of the securities at the time of determining a Fund’s NAV. To the extent investments are valued using single source broker quotations obtained directly from the broker or passed through from third party pricing vendors, such investments are classified as Level 3 investments.
C. Fair Value Hierarchy — The following is a summary of the Funds’ investments and derivatives classified in the fair value hierarchy as of December 31, 2023:
| | | | | | | | | | | | |
| | | |
| BUFFERED S&P 500 Fund — Jan/Jul | | | | | | | | | |
| Investment Type | | Level 1 | | | Level 2 | | | Level 3 | |
| | | |
| Assets | | | | | | | | | | | | |
| Investment Companies | | $ | 2,945,196 | | | $ | — | | | $ | — | |
| Short-Term Investments | | | 1,482,926 | | | | 498,057 | | | | — | |
| | | |
| Total | | $ | 4,428,122 | | | $ | 498,057 | | | $ | — | |
| | | |
| Derivative Type | | | | | | | | | |
| | | |
| Assets | | | | | | | | | | | | |
| Futures Contracts(a) | | $ | 1,143 | | | $ | — | | | $ | — | |
| Purchased Option Contracts | | | — | | | | 169,244 | | | | — | |
| | | |
| Total | | $ | 1,143 | | | $ | 169,244 | | | $ | — | |
| | | |
| Liabilities | | | | | | | | | | | | |
| Written Option Contracts | | $ | — | | | $ | (172,838 | ) | | $ | — | |
| (a) | Amount shown represents unrealized gain (loss) at period end. |
GOLDMAN SACHS VIT BUFFERED S&P 500 FUNDS
3. INVESTMENTS AND FAIR VALUE MEASUREMENTS (continued)
| | | | | | | | | | | | |
| | | |
| BUFFERED S&P 500 Fund — Mar/Sep | | | | | | | | | |
| Investment Type | | Level 1 | | | Level 2 | | | Level 3 | |
| | | |
| Assets | | | | | | | | | | | | |
| Investment Companies | | $ | 2,492,116 | | | $ | — | | | $ | — | |
| Short-term Investments | | | 1,435,090 | | | | 495,509 | | | | — | |
| | | |
| Total | | $ | 3,927,206 | | | $ | 495,509 | | | $ | — | |
| | | |
| Derivative Type | | | | | | | | | |
| | | |
| Assets | | | | | | | | | | | | |
| Futures Contracts(a) | | $ | 56,063 | | | $ | — | | | $ | — | |
| Purchased Option Contracts | | | — | | | | 27,558 | | | | — | |
| | | |
| Total | | $ | 56,063 | | | $ | 27,558 | | | $ | — | |
| | | |
| Liabilities | | | | | | | | | | | | |
| Written option contracts | | $ | — | | | $ | (79,105 | ) | | $ | — | |
| (a) | Amount shown represents unrealized gain (loss) at period end. |
| | | | | | | | | | | | |
| | | |
| BUFFERED S&P 500 Fund — May/Nov | | | | | | | | | |
| Investment Type | | Level 1 | | | Level 2 | | | Level 3 | |
| | | |
| Assets | | | | | | | | | | | | |
| Investment Companies | | $ | 2,547,332 | | | $ | — | | | $ | — | |
| Short-term Investments | | | 1,136,910 | | | | 447,784 | | | | — | |
| | | |
| Total | | $ | 3,684,242 | | | $ | 447,784 | | | $ | — | |
| | | |
| Derivative Type | | | | | | | | | |
| | | |
| Assets | | | | | | | | | | | | |
| Futures Contracts(a) | | $ | 53,725 | | | $ | — | | | $ | — | |
| Purchased Option Contracts | | | — | | | | 30,230 | | | | — | |
| | | |
| Total | | $ | 53,725 | | | $ | 30,230 | | | $ | — | |
| | | |
| Liabilities | | | | | | | | | | | | |
| Written option contracts | | $ | — | | | $ | (401,480 | ) | | $ | — | |
| (a) | Amount shown represents unrealized gain (loss) at period end. |
For further information regarding security characteristics, see Schedules of Investments.
GOLDMAN SACHS VIT BUFFERED S&P 500 FUNDS
Notes to Financial Statements (continued)
December 31, 2023
4. INVESTMENTS IN DERIVATIVES
The following tables set forth, by certain risk types, the gross value of derivative contracts (not considered to be hedging instruments for accounting disclosure purposes) as of December 31, 2023. These instruments were used as part of the Funds’ investment strategies and to obtain and/or manage exposure related to the risks below. The values in the tables below exclude the effects of cash collateral received or posted pursuant to these derivative contracts, and therefore are not representative of the Funds’ net exposure.
BUFFERED S&P 500 Fund — Jan/Jul
| | | | | | | | | | | | | | | | |
| Risk | | | Statement of Assets and Liabilities | | Assets | | | Statement of Assets and Liabilities | | | Liabilities | |
| | Equity | | | Variation margin on futures contracts (a);
Purchased options, at value | | $ | 170,387 | | | | Written options, at value | | | $ | (172,838 | ) |
BUFFERED S&P 500 Fund — Mar/Sep
| | | | | | | | | | | | | | | | |
| Risk | | | Statement of Assets and Liabilities | | Assets | | | Statement of Assets and Liabilities | | | Liabilities | |
| | Equity | | | Variation margin on futures contracts (a);
Purchased options, at value | | $ | 83,621 | | | | Written options, at value | | | $ | (79,105 | ) |
BUFFERED S&P 500 Fund — May/Nov
| | | | | | | | | | | | | | | | |
| Risk | | | Statement of Assets and Liabilities | | Assets | | | Statement of Assets and Liabilities | | | Liabilities | |
| | Equity | | | Variation margin on futures contracts (a);
Purchased options, at value | | $ | 83,955 | | | | Written options, at value | | | $ | (401,480 | ) |
| (a) | Includes unrealized gain (loss) on futures contracts described in the Additional Investment Information sections of the Schedule of Investments. Only the variation margin as of December 31, 2023 is reported within the Statement of Assets and Liabilities. |
The following tables set forth, by certain risk types, the Funds’ gains (losses) related to these derivatives and their indicative volumes for the fiscal year ended December 31, 2023. These gains (losses) should be considered in the context that these derivative contracts may have been executed to create investment opportunities and/or economically hedge certain investments, and accordingly, certain gains (losses) on such derivative contracts may offset certain (losses) gains attributable to investments. These gains (losses) are included in “Net realized gain (loss)” or “Net change in unrealized gain (loss)” on the Statements of Operations:
BUFFERED S&P 500 Fund — Jan/Jul
| | | | | | | | | | |
| Risk | | Statement of Operations | | Net Realized
Gain (Loss) | | | Net Change in
Unrealized
Gain (Loss) | |
| | | |
| Equity | | Net realized gain (loss) from futures contracts, purchased options and written options/Net change in unrealized gain on futures contracts, purchased options and written options | | $ | 549,938 | | | $ | (5,446 | ) |
BUFFERED S&P 500 Fund — Mar/Sep
| | | | | | | | | | |
| Risk | | Statement of Operations | | Net Realized
Gain (Loss) | | | Net Change in
Unrealized
Gain (Loss) | |
| | | |
| Equity | | Net realized gain (loss) from futures contracts, purchased options and written options/Net change in unrealized gain on future contracts, purchased options and written options | | $ | 431,901 | | | $ | 4,516 | |
BUFFERED S&P 500 Fund — May/Nov
| | | | | | | | | | |
| Risk | | Statement of Operations | | Net Realized
Gain (Loss) | | | Net Change in
Unrealized
Gain (Loss) | |
| | | |
| Equity | | Net realized gain (loss) from futures contracts, purchased options and written options/Net change in unrealized gain on futures contracts, purchased options and written options | | $ | 583,782 | | | $ | (317,525 | ) |
GOLDMAN SACHS VIT BUFFERED S&P 500 FUNDS
4. INVESTMENTS IN DERIVATIVES (continued)
For the year ended December 31, 2023, the relevant values for each derivative type was as follows:
| | | | | | | | | | | | |
| | | Average Number of Contracts, or
Shares/Units(a) | |
| Fund | | Futures
Contracts | | | Purchased
Options | | | Written
Options | |
| Buffered S&P 500 Fund — Jan/Jul | | | 23 | | | | 2,445 | | | | 2,483 | |
| Buffered S&P 500 Fund — Mar/Sep | | | 23 | | | | 2,500 | | | | 2,627 | |
| Buffered S&P 500 Fund — May/Nov | | | 23 | | | | 2,400 | | | | 2,700 | |
| (a) | Amounts disclosed represent average number of contracts for futures contracts, shares/units outstanding for purchased options and written options, based on absolute values, which is indicative of volume for this derivative type, for the months that the Fund held such derivatives during the year ended December 31, 2023. |
5. AGREEMENTS AND AFFILIATED TRANSACTIONS
A. Management Agreement — Under the Agreement, GSAM manages the Funds subject to the general supervision of the Trustees.
As compensation for the services rendered pursuant to the Agreement, the assumption of the expenses related thereto and administration of the Funds’ business affairs, including providing facilities, GSAM is entitled to a management fee, accrued daily and paid monthly, equal to an annual percentage rate of the Funds’ average daily net assets.
For the year ended December 31, 2023, contractual and effective net management fees with GSAM were at the following rates:
| | | | | | | | | | | | | | | | | | | | | | | | | | | | |
| | | Contractual Management Rate | | | Effective
Rate | | | Effective Net
Management
Rate^ | |
| Fund | | First
$1 billion | | | Next
$1 billion | | | Next
$3 billion | | | Next
$3 billion | | | Over
$8 billion | |
| Buffered S&P 500 Fund — Jan/Jul | | | 0.50 | % | | | 0.45 | % | | | 0.43 | % | | | 0.42 | % | | | 0.41 | % | | | 0.50 | % | | | 0.43 | % |
| Buffered S&P 500 Fund — Mar/Sep | | | 0.50 | | | | 0.45 | | | | 0.43 | | | | 0.42 | | | | 0.41 | | | | 0.50 | | | | 0.42 | |
| Buffered S&P 500 Fund—May/Nov | | | 0.50 | | | | 0.45 | | | | 0.43 | | | | 0.42 | | | | 0.41 | | | | 0.50 | | | | 0.43 | |
| ^ | The Effective Net Management Rate includes the impact of management fee waivers of affiliated underlying funds, if any. The Effective Net Management Rate may not correlate to the Contractual Management Rate as a result of management fee waivers that may be in effect from time to time. |
The Funds invest in Institutional Shares of the Goldman Sachs Financial Square Government Fund, Goldman Sachs Financial Square Treasury Instruments Fund, Goldman Sachs Financial Square Treasury Obligations Fund, Goldman Sachs VIT Government Money Market Fund and Goldman Sachs Financial Square Treasury Solutions Fund, which are affiliated Underlying Money Market Funds. GSAM has agreed to waive a portion of its management fee payable by the Fund in an amount equal to the management fee it earns as an investment adviser to the affiliated Underlying Money Market Funds in which the Funds invest.
For the year ended December 31, 2023, management fee waived by GSAM for each Fund was as follows:
| | | | |
| Fund Name | | Management Fee Waived | |
| Buffered S&P 500 Fund — Jan/Jul | | $ | 3,951 | |
| Buffered S&P 500 Fund — Mar/Sep | | | 3,509 | |
| Buffered S&P 500 Fund — May/Nov | | | 2,541 | |
GOLDMAN SACHS VIT BUFFERED S&P 500 FUNDS
Notes to Financial Statements (continued)
December 31, 2023
5. AGREEMENTS AND AFFILIATED TRANSACTIONS (continued)
B. Distribution and/or Service (12b-1) Plans — The Trust, on behalf of the Service Shares of each Fund, has adopted a Distribution and Service Plan subject to Rule 12b-1 under the Act (the “Plan”). Under the Plan, Goldman Sachs, which serves as distributor (the “Distributor”), is entitled to a fee accrued daily and paid monthly, for distribution services and personal and account maintenance services, which may then be paid by Goldman Sachs to authorized dealers, equal to, on an annual basis, 0.25% of the Funds’ average daily net assets attributable to Service Shares. Goldman Sachs has agreed to a voluntary temporary fee waiver equal to 0.25% of the Service Fees on the Service Shares of the Funds. Such voluntary waiver may be discontinued or modified at any time without notice.
C. Transfer Agency Agreement — Goldman Sachs also serves as the transfer agent of the Funds for a fee pursuant to the Transfer Agency Agreement. The fees charged for such transfer agency services are accrued daily and paid monthly at an annual rate of 0.02% of the average daily net assets of Institutional and Service Shares.
D. Line of Credit Facility — As of December 31, 2023, the Funds participated in a $1,110,000,000 committed, unsecured revolving line of credit facility (the “facility”) together with other funds of the Trust and certain registered investment companies having management agreements with GSAM or its affiliates. This facility is to be used for temporary emergency purposes, or to allow for an orderly liquidation of securities to meet redemption requests. The interest rate on borrowings is based on the federal funds rate. The facility also requires a fee to be paid by the Funds based on the amount of the commitment that has not been utilized. For the fiscal year ended December 31, 2023, the Funds did not have any borrowings under the facility. Prior to April 19, 2023, the facility was $1,250,000,000.
E. Other Expense Agreements and Affiliated Transactions — GSAM has agreed to reduce or limit certain “Other Expenses” of the Funds (excluding acquired fund fees and expenses, transfer agency fees and expenses, taxes, interest, brokerage fees, expenses of shareholder meetings, litigation and indemnification, and extraordinary expenses) to the extent such expenses exceed, on an annual basis, a percentage rate of the average daily net assets of each Fund. Such Other Expense reimbursements, if any, are accrued daily and paid monthly. In addition, the Funds are not obligated to reimburse GSAM for prior fiscal year expense reimbursements, if any. The Other Expense limitations as an annual percentage rate of average daily net assets for the Buffered S&P 500 Fund — Jan/Jul, Buffered S&P 500 Fund — Mar/Sep and Buffered S&P 500 Fund — May/Nov are 0.184%, 0.184%, and 0.184%, respectively. These Other Expense limitations will remain in place through at least April 28, 2024, and prior to such date GSAM may not terminate the arrangements without the approval of the Trustees. In addition, the Funds have entered into certain offset arrangements with the transfer agent, which may result in a reduction of the Funds’ expenses and are received irrespective of
the application of the “Other Expense” limitations described above.
For the year ended December 31, 2023, these expense reductions, including any fee waivers and Other Expense reimbursements, were as follows:
| | | | | | | | | | | | | | | | |
| Fund | | Management
Fee Waiver | | | Distribution and
Service Fee Waiver | | | Other Expense
Reimbursements | | | Total Expense
Reductions | |
| Buffered S&P 500 Fund — Jan/Jul | | $ | 3,951 | | | $ | 135 | | | $ | 252,917 | | | $ | 257,003 | |
| Buffered S&P 500 Fund — Mar/Sep | | | 3,509 | | | | 100 | | | | 235,128 | | | | 238,737 | |
| Buffered S&P 500 Fund — May/Nov | | | 2,541 | | | | 88 | | | | 189,477 | | | | 192,106 | |
GOLDMAN SACHS VIT BUFFERED S&P 500 FUNDS
5. AGREEMENTS AND AFFILIATED TRANSACTIONS (continued)
F. Other Transactions with Affiliates — The Funds invest primarily in Institutional Shares of the Underlying Money Market Funds. These Underlying Money Market Funds are considered to be affiliated with the Funds. The tables below show the transactions in and earnings from investments in these Underlying Money Market Funds for the year ended December 31, 2023:
Buffered S&P 500 Fund — Jan/Jul
| | | | | | | | | | | | | | | | | | | | | | | | |
| Underlying Fund | | Beginning Value as of December 31,
2022 | | | Purchases at Cost | | | Proceeds from Sales | | | Ending Value as of December 31,
2023 | | | Shares as of December 31,
2023 | | | Dividend Income | |
Goldman Sachs Financial Square Government Fund — Institutional Class | | $ | 949,142 | | | $ | 3,327,769 | | | $ | (3,559,326 | ) | | $ | 717,585 | | | | 717,585 | | | $ | 19,220 | |
Goldman Sachs Financial Square Treasury Instruments Fund — Institutional Class | | | 500,109 | | | | 78,706 | | | | (11,406 | ) | | | 567,409 | | | | 567,409 | | | | 27,029 | |
Goldman Sachs Financial Square Treasury Obligations Fund — Institutional Class | | | 500,114 | | | | 78,751 | | | | (11,445 | ) | | | 567,420 | | | | 567,420 | | | | 27,399 | |
Goldman Sachs Financial Square Treasury Solutions Fund — Institutional Class | | | 500,114 | | | | 78,748 | | | | (11,440 | ) | | | 567,422 | | | | 567,422 | | | | 27,402 | |
Goldman Sachs Variable Insurance Trust Government Money Market Fund — Institutional Class | | | 500,000 | | | | 25,360 | | | | — | | | | 525,360 | | | | 525,360 | | | | 24,887 | |
| | | | | | |
| Total | | $ | 2,949,479 | | | $ | 3,589,334 | | | $ | (3,593,617 | ) | | $ | 2,945,196 | | | | | | | $ | 125,937 | |
Buffered S&P 500 Fund — Mar/Sep
| | | | | | | | | | | | | | | | | | | | | | | | |
| Underlying Fund | | Beginning Value as of February 28,
2023 | | | Purchases at Cost | | | Proceeds from Sales | | | Ending Value as of December 31,
2023 | | | Shares as of December 31,
2023 | | | Dividend Income | |
Goldman Sachs Financial Square Government Fund — Institutional Class | | $ | — | | | $ | 5,285,233 | | | $ | (4,947,265 | ) | | $ | 337,968 | | | $ | 337,968 | | | $ | 15,534 | |
Goldman Sachs Financial Square Treasury Instruments Fund — Institutional Class | | | — | | | | 561,528 | | | | (17,325 | ) | | | 544,203 | | | | 544,203 | | | | 21,809 | |
Goldman Sachs Financial Square Treasury Obligations Fund — Institutional Class | | | — | | | | 561,576 | | | | (17,364 | ) | | | 544,212 | | | | 544,212 | | | | 21,619 | |
Goldman Sachs Financial Square Treasury Solutions Fund — Institutional Class | | | — | | | | 561,575 | | | | (17,359 | ) | | | 544,216 | | | | 544,216 | | | | 21,787 | |
Goldman Sachs Variable Insurance Trust Government Money Market Fund — Institutional Class | | | — | | | | 521,517 | | | | — | | | | 521,517 | | | | 521,517 | | | | 21,316 | |
| | | | | | |
| Total | | $ | — | | | $ | 7,491,429 | | | $ | (4,999,313 | ) | | $ | 2,492,116 | | | | | | | $ | 102,065 | |
GOLDMAN SACHS VIT BUFFERED S&P 500 FUNDS
Notes to Financial Statements (continued)
December 31, 2023
5. AGREEMENTS AND AFFILIATED TRANSACTIONS (continued)
Buffered S&P 500 Fund — May/Nov
| | | | | | | | | | | | | | | | | | | | | | | | |
| Underlying Fund | | Beginning Value as of April 28,
2023 | | | Purchases at Cost | | | Proceeds from Sales | | | Ending Value as of December 31,
2023 | | | Shares as of December 31,
2023 | | | Dividend Income | |
Goldman Sachs Financial Square Government Fund — Institutional Class | | $ | — | | | $ | 2,214,381 | | | $ | (1,794,658 | ) | | $ | 419,723 | | | | 419,723 | | | $ | 4,949 | |
Goldman Sachs Financial Square Treasury Instruments Fund — Institutional Class | | | — | | | | 545,426 | | | | (7,942 | ) | | | 537,484 | | | | 537,484 | | | | 17,492 | |
Goldman Sachs Financial Square Treasury Obligations Fund — Institutional Class | | | — | | | | 540,962 | | | | (5,811 | ) | | | 535,151 | | | | 535,151 | | | | 17,642 | |
Goldman Sachs Financial Square Treasury Solutions Fund — Institutional Class | | | — | | | | 545,460 | | | | (7,967 | ) | | | 537,493 | | | | 537,493 | | | | 17,434 | |
Goldman Sachs Variable Insurance Trust Government Money Market Fund — Institutional Class | | | — | | | | 517,481 | | | | — | | | | 517,481 | | | | 517,481 | | | | 17,059 | |
| | | | | | |
| Total | | $ | — | | | $ | 4,363,710 | | | $ | (1,816,378 | ) | | $ | 2,547,332 | | | | | | | $ | 74,576 | |
As of December 31, 2023, The Goldman Sachs Group, Inc. was the beneficial owner of approximately 100% of the Institutional and Service Shares for the Buffered S&P 500 Fund — Jan/Jul, Buffered S&P 500 Fund — Mar/Sep and Buffered S&P 500 Fund — May/Nov.
6. PORTFOLIO SECURITIES TRANSACTIONS
For the year ended December 31, 2023, there were no purchases and proceeds from sales and maturities of long-term securities for the Buffered S&P 500 Fund — Jan/Jul, Buffered S&P 500 Fund — Mar/Sep and Buffered S&P 500 Fund — May/Nov.
7. TAX INFORMATION
The tax character of distributions paid during the fiscal year ended December 31, 2023 was as follows:
| | | | | | | | | | | | |
| | | Buffered S&P 500 Fund — Jan/Jul | | | Buffered S&P 500 Fund — Mar/Sep | | | Buffered S&P 500 Fund — May/Nov | |
Distributions paid from: | | | | | | | | | | | | |
Ordinary income | | | 305,372 | | | | 169,708 | | | | 132,461 | |
Net long-term capital gains | | | 169,150 | | | | 15,300 | | | | 17,750 | |
| Total taxable distributions | | | 474,522 | | | | 185,008 | | | | 150,211 | |
GOLDMAN SACHS VIT BUFFERED S&P 500 FUNDS
7. TAX INFORMATION (continued)
As of December 31, 2023, the components of accumulated earnings (losses) on a tax basis were as follows:
| | | | | | | | | | | | |
| | | Buffered S&P 500 Fund — Jan/Jul | | | Buffered S&P 500 Fund — Mar/Sep | | | Buffered S&P 500 Fund — May/Nov | |
Undistributed ordinary income — net | | $ | 104,389 | | | $ | 163,477 | | | $ | 94,303 | |
Undistributed long-term capital gains | | | 159,294 | | | | 246,551 | | | | 142,004 | |
| Total Undistributed Earnings | | | 263,683 | | | | 410,028 | | | | 236,307 | |
Timing differences (Straddle Loss Deferral) | | | — | | | | — | | | | — | |
| Unrealized gains (losses) — net | | | 140 | | | | 3 | | | | 71 | |
| Total accumulated earnings (losses) — net | | $ | 263,823 | | | $ | 410,031 | | | $ | 236,378 | |
As of December 31, 2023, the Funds aggregate security unrealized gains and losses based on cost for U.S. federal income tax
purposes were as follows:
| | | | | | | | | | | | |
| | | Buffered S&P 500 Fund — Jan/Jul | | | Buffered S&P 500 Fund — Mar/Sep | | | Buffered S&P 500 Fund — May/Nov | |
| Tax cost | | $ | 5,092,386 | | | $ | 4,592,828 | | | $ | 4,011,710 | |
Gross unrealized gain | | | 381 | | | | 213 | | | | 292 | |
| Gross unrealized loss | | | (241 | ) | | | (210 | ) | | | (221 | ) |
| Net unrealized security gain | | | 140 | | | | 3 | | | | 71 | |
The difference between GAAP-basis and tax basis unrealized gains (losses) is attributable primarily to wash sales, net mark to market gains/(losses) on regulated futures contracts, and net mark to market gains/(losses) on regulated options contracts.
The Buffered S&P 500 Fund — Jan/Jul, Buffered S&P 500 Fund — Mar/Sep and Buffered S&P 500 Fund — May/Nov Funds reclassed $1,575, $1,456 and 1,243, respectively, from paid in capital to distributable earnings for the year ending December 31, 2023. In order to present certain components of the Fund’s capital accounts on a tax-basis, certain reclassifications have been recorded to the Fund’s accounts. These reclassifications have no impact on the net asset value of the Fund and result primarily from certain non-deductible expenses.
GSAM has reviewed the Funds’ tax positions for the open tax year (the current and prior year, as applicable) and has concluded that no provision for income tax is required in the Funds’ financial statements. Such open tax years remain subject to examination and adjustment by tax authorities.
8. OTHER RISKS
The Funds’ risks include, but are not limited to, the following:
Buffered Loss Risk — There can be no guarantee that the Funds will be successful in their strategy to provide buffered protection against losses if the value of the Underlying Index decreases over an Outcome Period. In the event an investor purchases shares after the commencement of the Outcome Period or redeems shares prior to the end of the Outcome Period, the investor may not experience the full effect of the Buffer that the Fund seeks to provide. The Funds do not provide principal protection and an investor may experience significant losses on their investment, including the loss of their entire investment.
Capped Upside Return Risk — A Fund’s strategy seeks to provide returns only up to the Cap over an Outcome Period before Fund fees and expenses. In the event that the value of the Underlying Index increases in excess of the Cap during an Outcome Period, the Fund will not participate in those gains beyond the Cap for that Outcome Period. In the event an investor purchases
GOLDMAN SACHS VIT BUFFERED S&P 500 FUNDS
Notes to Financial Statements (continued)
December 31, 2023
8. OTHER RISKS (continued)
shares after the commencement of an Outcome Period and the Fund has risen in value to a level near the Cap, there will likely be little or no ability for that investor to experience investment gains for the remainder of that Outcome Period. A new Cap is established on or before the first day of each Outcome Period and is dependent on prevailing market conditions. Accordingly, the Cap may increase or decrease from one Outcome Period to the next. The Cap is based on the market costs associated with a series of S&P Options (or other derivatives) that are purchased and sold in order to seek to obtain the relevant market exposure and the Buffer. The market conditions and other factors that influence the Cap can include, but are not limited to, interest rate levels, the volatility of the Underlying Index, and relationship of put and calls on the underlying S&P 500 Options. Depending on those factors, it is possible that the Cap will limit the Fund’s return during an Outcome Period to a level substantially less than an investor might expect from another comparable equity product that does not employ a Cap and Buffer. The Cap may decrease from one Outcome Period to the next.
Derivatives Risk — The Funds’ use of derivatives including FLEX Options, and other similar instruments (collectively referred to in this paragraph as “derivatives”) may result in loss, including due to adverse market movements. Derivatives, which may pose risks in addition to and greater than those associated with investing directly in securities, currencies or other assets and instruments, may increase market exposure and be illiquid or less liquid, volatile, difficult to price and leveraged so that small changes in the value of the underlying assets or instruments may produce disproportionate losses to the Funds. Certain derivatives are also subject to counterparty risk, which is the risk that the other party in the transaction will not, or lacks the capacity or authority to, fulfill its contractual obligations, liquidity risk, which includes the risk that the Funds will not be able to exit the derivative when it is advantageous to do so, and risks arising from margin requirements, which include the risk that the Funds will be required to pay additional margin or set aside additional collateral to maintain open derivative positions. The use of derivatives is a highly specialized activity that involves investment techniques and risks different from those associated with investments in more traditional securities and instruments. Losses from derivatives can also result from a lack of correlation between changes in the value of derivative instruments and the portfolio assets (if any) being hedged.
FLEX Options Risk — The Funds utilize FLEX Options guaranteed for settlement by the Options Clearing Corporation (the “OCC”), and bears the risk that the OCC will be unable or unwilling to perform its obligations under the FLEX Options contracts, which is a form of counterparty risk. Additionally, FLEX Options may be less liquid than certain other securities, such as standardized options. In a less liquid market, a Fund may have difficulty closing out certain FLEX Options positions at desired times and prices (and may have to pay a premium or accept a discounted price). The Funds may experience substantial downside from certain FLEX Option positions, and FLEX Option positions may expire worthless. The value of the FLEX Options will be affected by, among other things, changes in the value of the Underlying Index, changes in interest rates, changes in the actual and implied volatility of the Underlying Index and the remaining time until the FLEX Options expire. The value of FLEX Options does not increase or decrease at the same rate as the level of the Underlying Index (although they generally move in the same direction).
Investments in Other Investment Companies Risk — As a shareholder of another investment company, a Fund will
indirectly bear its proportionate share of any net management fees and other expenses paid by such other investment companies, in addition to the fees and expenses regularly borne by the Fund.
Investment Objective and Outcomes Risk — There is no guarantee that the Fund will be successful in its attempt to achieve its investment objective and/or its strategy to provide buffered protection against losses. An investor could lose some or all of their investment in the Fund. Certain circumstances under which the Fund might not achieve its objective and/or its strategy to provide buffered protection against losses include, but are not limited to: (i) if the Fund disposes of FLEX Options; (ii) if the Fund is unable to maintain the proportional relationship based on the number of FLEX Options in the Fund’s portfolio; (iii) significant accrual of Fund expenses in connection with effecting the Fund’s investment strategy; (iv) losses resulting from the investment strategy; or (v) adverse tax law changes affecting the treatment of FLEX Options.
Large Shareholder Transactions Risk — A Fund may experience adverse effects when certain large shareholders, such as other funds, participating insurance companies, accounts and Goldman Sachs affiliates, purchase or redeem large amounts of shares of a Fund. Such large shareholder redemptions, which may occur rapidly or unexpectedly, may cause a Fund to sell portfolio securities
GOLDMAN SACHS VIT BUFFERED S&P 500 FUNDS
8. OTHER RISKS (continued)
at times when it would not otherwise do so, which may negatively impact a Fund’s NAV and liquidity. These transactions may also accelerate the realization of taxable income to shareholders if such sales of investments resulted in gains, and may also increase transaction costs. In addition, a large redemption could result in a Fund’s current expenses being allocated over a smaller asset base, leading to an increase in the Fund’s expense ratio. Similarly, large Fund share purchases may adversely affect a Fund’s performance to the extent that the Fund is delayed in investing new cash or otherwise maintains a larger cash position than it ordinarily would.
Liquidity Risk — A Fund may make investments that are illiquid or that may become less liquid in response to market
developments or adverse investor perceptions. Illiquid investments may be more difficult to value. Liquidity risk may also refer to the risk that a Fund will not be able to pay redemption proceeds within the allowable time period or without significant dilution to remaining investors’ interests because of unusual market conditions, declining prices of the securities sold, an unusually high volume of redemption requests, or other reasons. To meet redemption requests, a Fund may be forced to sell investments at an unfavorable time and/or under unfavorable conditions. If a Fund is forced to sell securities at an unfavorable time and/or under unfavorable conditions, such sales may adversely affect a Fund’s NAV and dilute remaining investors’ interests. Liquidity risk may be the result of, among other things, the reduced number and capacity of traditional market participants to make a market in fixed income securities or the lack of an active market. The potential for liquidity risk may be magnified by a rising interest rate environment or other circumstances where investor redemptions from fixed income funds may be higher than normal, potentially causing increased supply in the market due to selling activity.
Market Risk — The value of the securities in which the Fund invests may go up or down in response to the prospects of individual companies, particular sectors or governments and/or general economic conditions throughout the world due to increasingly interconnected global economies and financial markets. Events such as war, military conflict, acts of terrorism, social unrest, natural disasters, recessions, inflation, rapid interest rate changes, supply chain disruptions, sanctions, the spread of infectious illness or other public health threats could also significantly impact the Fund and its investments.
Non-Diversification Risk — The Funds are non-diversified, meaning that they are permitted to invest a larger percentage of their assets in one or more issuers or in fewer issuers than diversified mutual funds. Thus, the Funds may be more susceptible to adverse developments affecting any single issuer held in their portfolios, and may be more susceptible to greater losses because of these developments.
Option Writing Risk — Writing (selling) options may limit the opportunity to profit from an increase or decrease in the market value of a reference security in exchange for up-front cash (the premium) at the time of selling the option. In a sharp rising or falling market, the Fund could significantly underperform the market or other portfolios without an option writing strategy. The Fund could also experience a sudden, significant permanent loss due to dramatic movements in the market value of reference security, which may far exceed the premiums received for writing the option. Such significant losses could cause significant deteriorations in the Fund’s NAV. Furthermore, the premium received from the Fund’s option writing strategies may not fully protect it against market movements because the Fund will continue to bear the risk of movements in the value of its portfolio investments.
Outcome Period Risk — The Fund’s investment strategy is designed to deliver returns that match the Underlying Index, subject to the Buffer and Cap, only if shares are bought by the first day of the Outcome Period and held until the end of the Outcome Period. If an investor purchases or sells shares during the Outcome Period, the returns realized by the investor will not match those that the Fund seeks to achieve. In addition, the Cap may change from one Outcome Period to the next and is unlikely to remain the same for consecutive Outcome Periods. Moreover, the Fund’s returns will be reduced by Fund fees and expenses as well as any brokerage commissions, trading fees, taxes and non-routine or extraordinary expenses incurred by the Fund throughout an Outcome Period. Accordingly, the maximum performance of the Fund over an Outcome Period is expected to be lower than the Cap by these fees and expenses and the performance of the Fund over an Outcome period will be reduced by these fees and expenses in addition to losses beyond the Buffer. When an investor purchases shares of the Fund after the commencement of an Outcome Period, the Fund will enter into additional S&P 500 Options positions in order to maintain the targeted outcomes for the Fund established at the
GOLDMAN SACHS VIT BUFFERED S&P 500 FUNDS
Notes to Financial Statements (continued)
December 31, 2023
10. SUBSEQUENT EVENTS
commencement of the Outcome Period. The Fund will incur additional expenses when entering into these new positions, which will further reduce the Fund’s returns.
9. INDEMNIFICATIONS
Under the Trust’s organizational documents, its Trustees, officers, employees and agents are indemnified, to the extent permitted by the Act and state law, against certain liabilities that may arise out of performance of their duties to the Funds. Additionally, in the course of business, the Funds enter into contracts that contain a variety of indemnification clauses. The Funds maximum exposure under these arrangements is unknown, as this would involve future claims that may be made against the Funds that have not yet occurred. However, GSAM believes the risk of loss under these arrangements to be remote.
Subsequent events after the Statements of Assets and Liabilities date have been evaluated, and GSAM has concluded that there is no impact requiring adjustment or disclosure in the financial statements.
11. OTHER MATTERS
Pursuant to an effort to consolidate the membership of the Board of Trustees of the Trust (the “Board”) with the Board of Trustees of each of Goldman Sachs ETF Trust, Goldman Sachs ETF Trust II, Goldman Sachs Real Estate Diversified Income Fund, Goldman Sachs Trust II and Goldman Sachs Trust, in July 2023, the Board voted to nominate Cheryl K. Beebe, John G. Chou, Eileen H. Dowling, Lawrence Hughes, John F. Killian, Steven D. Krichmar, Michael Latham, Lawrence W. Stranghoener and Paul C. Wirth (the “Nominees”) for election as Trustees of the Trust. Messrs. Chou and Wirth and Ms. Dowling were serving as Trustees of the Trust at the time of their nominations. At a virtual special joint meeting of shareholders held on November 16, 2023, each of the Nominees (except Messrs. Chou and Wirth and Ms. Dowling) was elected to serve as Trustees alongside the then current Trustees of the Trust, effective January 1, 2024. Each of Messrs. Chou and Wirth and Ms. Dowling was also elected at the meeting and continue to serve as Trustees of the Trust.
12. SUMMARY OF SHARE TRANSACTIONS
Share activity is as follows:
| | | | | | | | | | | | | | | | |
| | | Buffered S&P 500 Fund — Jan/Jul | |
| | | For the Fiscal Year Ended
December 31, 2023 | | | For the Period Ended
December 31, 2022(a) | |
| | | Shares | | | Dollars | | | Shares | | | Dollars | |
| Institutional Shares | | | | | | | | | | | | | | | | |
Shares sold | | | — | | | $ | — | | | | 495,000 | | | $ | 4,950,000 | |
| Reinvestment of distributions | | | 43,958 | | | | 469,777 | | | | — | | | | — | |
| | | | 43,958 | | | | 469,777 | | | | 495,000 | | | | 4,950,000 | |
| Service Shares | | | | | | | | | | | | | | | | |
Shares sold | | | — | | | | — | | | | 5,000 | | | | 50,000 | |
| Reinvestment of distributions | | | 444 | | | | 4,745 | | | | — | | | | — | |
| | | | 444 | | | | 4,745 | | | | 5,000 | | | | 50,000 | |
| | | | |
| NET INCREASE | | | 44,402 | | | $ | 474,522 | | | | 500,000 | | | $ | 5,000,000 | |
| (a) | Commenced operations on December 30, 2022. |
GOLDMAN SACHS VIT BUFFERED S&P 500 FUNDS
12. SUMMARY OF SHARE TRANSACTIONS (continued)
| | | | | | | | |
| | | Buffered S&P 500
Fund — Mar/Sep | |
| | | For the Fiscal Year Ended
December 31, 2023(a)
| |
| | | Shares | | | Dollars | |
| Class A Shares | | | | | | | | |
Shares sold | | | 495,001 | | | $ | 4,950,010 | |
Reinvestment of distributions | | | 16,918 | | | | 183,158 | |
| Shares redeemed | | | (1 | ) | | | (11 | ) |
| | | | 511,918 | | | | 5,133,157 | |
| Class C Shares | | | | | | | | |
Shares sold | | | 5,001 | | | | 50,010 | |
Reinvestment of distributions | | | 171 | | | | 1,850 | |
| Shares redeemed | | | (1 | ) | | | (10 | ) |
| | | | 5,171 | | | | 51,850 | |
| | |
| NET INCREASE | | | 517,089 | | | $ | 5,185,007 | |
| (a) | Commenced operations on February 28, 2023 |
| | | | | | | | |
| | | Buffered S&P 500
Fund — May/Nov | |
| | | For the Fiscal Year Ended
December 31, 2023(a)
| |
| | | Shares | | | Dollars | |
| Institutional Shares | | | | | | | | |
Shares sold | | | 495,001 | | | $ | 4,950,010 | |
Reinvestment of distributions | | | 14,162 | | | | 148,709 | |
| Shares redeemed | | | (1 | ) | | | (10 | ) |
| | | | 509,162 | | | | 5,098,709 | |
| Service Shares | | | | | | | | |
Shares sold | | | 5,001 | | | | 50,010 | |
Reinvestment of distributions | | | 143 | | | | 1,502 | |
| Shares redeemed | | | (1 | ) | | | (10 | ) |
| | | | 5,143 | | | | 51,502 | |
| | |
| NET INCREASE | | | 514,305 | | | $ | 5,150,211 | |
| (a) | Commenced operations on April 28, 2023 |
Report of Independent Registered Public Accounting Firm
To the Board of Trustees of Goldman Sachs Variable Insurance Trust and Shareholders of Goldman Sachs Buffered S&P 500 Fund — Jan/Jul, Goldman Sachs Buffered S&P 500 Fund — Mar/Sep and Goldman Sachs Buffered S&P 500 Fund — May/Nov
Opinions on the Financial Statements
We have audited the accompanying statements of assets and liabilities, including the schedules of investments, of each of the funds listed in the table below (three of the funds constituting Goldman Sachs Variable Insurance Trust, hereafter collectively referred to as the “Funds”) as of December 31, 2023, the related statements of operations and of changes in net assets for each of the periods indicated in the table below, including the related notes, and the financial highlights for each of the periods indicated in the table below (collectively referred to as the “financial statements”). In our opinion, the financial statements present fairly, in all material respects, the financial position of each of the Funds listed in the table below as of December 31, 2023, the results of each of their operations, the changes in each of their net assets, and each of the financial highlights for each of the periods indicated in the table below, in conformity with accounting principles generally accepted in the United States of America.
| | | | | | |
| Fund | | Statement of operations | | Statement of changes in net assets | | Financial highlights |
| Goldman Sachs Buffered S&P 500 Fund — Jan/Jul | | For the year ended December 31, 2023 | | For the year ended December 31, 2023, and for the period December 30, 2022 (commencement of operations) through December 31, 2022 | | For the year ended December 31, 2023, and for the period December 30, 2022 (commencement of operations) through December 31, 2022 |
| Goldman Sachs Buffered S&P 500 Fund — Mar/Sep | | For the period February 28, 2023 (commencement of operations) through December 31, 2023 |
| Goldman Sachs Buffered S&P 500 Fund — May/Nov | | For the period April 28, 2023 (commencement of operations) through December 31, 2023 |
Basis for Opinions
These financial statements are the responsibility of the Funds’ management. Our responsibility is to express an opinion on the Funds’ financial statements based on our audits. We are a public accounting firm registered with the Public Company Accounting Oversight Board (United States) (PCAOB) and are required to be independent with respect to the Funds in accordance with the U.S. federal securities laws and the applicable rules and regulations of the Securities and Exchange Commission and the PCAOB.
We conducted our audits of these financial statements in accordance with the standards of the PCAOB. Those standards require that we plan and perform the audit to obtain reasonable assurance about whether the financial statements are free of material misstatement, whether due to error or fraud.
Our audits included performing procedures to assess the risks of material misstatement of the financial statements, whether due to error or fraud, and performing procedures that respond to those risks. Such procedures included examining, on a test basis, evidence regarding the amounts and disclosures in the financial statements. Our audits also included evaluating the accounting principles used and significant estimates made by management, as well as evaluating the overall presentation of the financial statements. Our procedures included confirmation of securities owned as of December 31, 2023 by correspondence with the custodian, transfer agent and brokers; when replies were not received from brokers, we performed other auditing procedures. We believe that our audits provide a reasonable basis for our opinions.
/s/ PricewaterhouseCoopers LLP
Boston, Massachusetts
February 15, 2024
We have served as the auditor of one or more investment companies in the Goldman Sachs fund complex since 2000.
GOLDMAN SACHS VIT BUFFERED S&P 500 FUNDS
| | |
| Fund Expenses — Six Months Period Ended December 31, 2023 (unaudited) | | |
As a shareholder of Institutional or Service Shares of a Fund, you incur ongoing costs, including management fees, distribution and/or service (12b-1) fees (with respect to Service) and other Fund expenses. This example is intended to help you understand your ongoing costs (in dollars) of investing in the Institutional Shares and Service Shares of a Fund and to compare these costs with the ongoing costs of investing in other mutual funds.
The Example is intended to help you understand your ongoing costs (in dollars) of investing in of Institutional or Service Shares of a Fund and to compare these costs with the ongoing costs of investing in other mutual funds. The Example is based on an investment of $1,000 invested at the beginning of the period and held for the entire period from July 1, 2023 through December 31, 2023, which represents a period of 184 days of a 365 day year.
Actual Expenses — The first line under each share class in the table below provides information about actual account values and actual expenses. You may use the information in this line, together with the amount you invested, to estimate the expenses that you paid over the period. Simply divide your account value by $1,000 (for example, an $8,600 account value divided by $1,000=8.6), then multiply the result by the number in the first line under the heading entitled “Expenses Paid” to estimate the expenses you paid on your account during this period.
Hypothetical Example for Comparison Purposes — The second line under each share class in the table below provides information about hypothetical account values and hypothetical expenses based on the Funds’ actual net expense ratios and an assumed rate of return of 5% per year before expenses, which is not the Funds’ actual return. The hypothetical account values and expenses may not be used to estimate the actual ending account balance or expenses you paid for the period. You may use this information to compare the ongoing costs of investing in the Funds and other funds. To do so, compare this 5% hypothetical example with the 5% hypothetical examples that appear in the shareholder reports of the other funds.
Please note that the expenses shown in the table are meant to highlight your ongoing costs only and do not reflect any transactional costs, such as sales charges, redemption fees, or exchange fees and do not include expenses of Underlying Funds in which the Funds invest. Therefore, the second line of the table is useful in comparing ongoing costs only and will not help you determine the relative total costs of owning different funds. In addition, if these transactional costs were included, your costs would have been higher.
| | | | | | | | | | | | | | | | | | | | | | | | | | | | | | | | | | | | |
| | | Buffered S&P 500 Fund — Jan/Jul | | | Buffered S&P 500 Fund — Mar/Sep | | | Buffered S&P 500 Fund — May/Nov | |
| Share Class | | Beginning
Account
Value
7/1/23 | | | Ending
Account
Value
12/31/23 | | | Expenses
Paid for the
6 months
ended
12/31/23* | | | Beginning
Account
Value
7/1/23 | | | Ending
Account
Value
12/31/23 | | | Expenses
Paid for the
6 months
ended
12/31/23* | | | Beginning
Account
Value
7/1/23 | | | Ending
Account
Value
12/31/23 | | | Expenses
Paid for the
6 months
ended
12/31/23* | |
| | | | | | | | | | |
Institutional | | | | | | | | | | | | | | | | | | | | | | | | | | | | | | | | | | | | |
| | | | | | | | | | |
Actual | | $ | 1,000.00 | | | $ | 1,047.10 | | | $ | 3.20 | | | $ | 1,000.00 | | | $ | 1,052.70 | | | $ | 3.26 | | | $ | 1,000.00 | | | $ | 1,039.50 | | | $ | 3.24 | |
Hypothetical 5% return | | | 1,000.00 | | | | 1,022.08 | | | | 3.16 | | | | 1,000.00 | | | | 1,022.08 | | | | 3.21 | | | | 1,000.00 | | | | 1,022.03 | | | | 3.21 | |
| | | | | | | | | | |
Service | | | | | | | | | | | | | | | | | | | | | | | | | | | | | | | | | | | | |
| | | | | | | | | | |
Actual | | | 1,000.00 | | | | 1,047.10 | | | | 3.20 | | | | 1,000.00 | | | | 1,053.60 | | | | 3.26 | | | | 1,000.00 | | | | 1,039.50 | | | $ | 3.24 | |
Hypothetical 5% return | | | 1,000.00 | | | | 1,022.08 | | | | 3.16 | | | | 1,000.00 | | | | 1,025.21 | | | | 3.21 | | | | 1,000.00 | | | | 1,022.03 | | | | 3.21 | |
| | * | Expenses for each share class are calculated using the Fund’s annualized net expense ratio for each class, which represents the ongoing expenses as a percentage of net assets for the six months ended December 31, 2023. Expenses are calculated by multiplying the annualized net expense ratio by the average account value for the period; then multiplying the result by the number of days in the most recent fiscal half year; and then dividing that result by the number of days in the fiscal year. The annualized net expense ratios for the period were as follows: | |
| | | | | | | | |
| | |
| Fund | | Institutional | | | Service | |
Buffered S&P 500 Fund — Jan/Jul | | | 0.62 | % | | | 0.62 | % |
Buffered S&P 500 Fund — Mar/Sep | | | 0.63 | | | | 0.63 | |
| Buffered S&P 500 Fund — May/Nov | | | 0.63 | | | | 0.63 | |
47
GOLDMAN SACHS VIT BUFFERED S&P 500 FUNDS
Voting Results of Special Meeting of Shareholders (Unaudited)
A Special Meeting of Shareholders (the “Meeting”) of the Goldman Sachs Variable Insurance Trust (the “Trust”) was held on November 16, 2023 to consider and elect nominees to the Trust’s Board of Trustees. At the Meeting, Cheryl K. Beebe, Lawrence Hughes, John F. Killian, Steven D. Krichmar, Michael Latham and Lawrence W. Stranghoener were elected to the Trust’s Board of Trustees. In addition, at the Meeting, John G. Chou, Eileen H. Dowling and Paul C. Wirth, each of whom was previously appointed to the Trust’s Board of Trustees rather than elected by shareholders, were elected. In electing the nominees, the Trust’s shareholders voted as follows:
| | | | | | | | |
| | | |
Proposal Election of Trustees | | For | | | Withheld | |
| | | |
Cheryl K. Beebe | | | 932,148,752 | | | | 26,776,872 | |
| | | |
John G. Chou | | | 930,378,362 | | | | 28,547,262 | |
| | | |
Eileen H. Dowling | | | 932,188,448 | | | | 26,737,175 | |
| | | |
Lawrence Hughes | | | 932,346,926 | | | | 26,578,698 | |
| | | |
John F. Killian | | | 931,754,574 | | | | 27,171,049 | |
| | | |
Steven D. Krichmar | | | 932,002,203 | | | | 26,923,420 | |
| | | |
Michael Latham | | | 931,832,553 | | | | 27,093,071 | |
| | | |
Lawrence W. Stranghoener | | | 931,376,144 | | | | 27,549,480 | |
| | | |
Paul C. Wirth | | | 932,041,013 | | | | 26,884,610 | |
GOLDMAN SACHS VIT BUFFERED S&P 500 FUNDS
Trustees and Officers (Unaudited)
Independent Trustees
| | | | | | | | | | | | |
| | | | | |
Name,
Address and Age1 | | Position(s) Held
with the Trust | | Term of
Office and
Length of
Time Served2 | | Principal Occupations
During Past 5 Years | | Number of
Portfolios in
Fund Complex
Overseen by
Trustee3 | | | Other
Directorships
Held by Trustee4 |
Gregory G. Weaver Age: 72 | | Chair of the Board of Trustees | | Since 2023 (Trustee since 2015) | | Mr. Weaver is retired. He is Director, Verizon Communications Inc. (2015-Present); and was formerly Chairman and Chief Executive Officer, Deloitte & Touche LLP (a professional services firm) (2001-2005 and 2012-2014); and Member of the Board of Directors, Deloitte & Touche LLP (2006-2012). Chair of the Board of Trustees — Goldman Sachs Variable Insurance Trust and Goldman Sachs Trust. | | | 102 | | | Verizon Communications Inc. |
Dwight L. Bush Age: 66 | | Trustee | | Since 2020 | | The Honorable Dwight Bush is President and CEO of D.L. Bush & Associates (a financial advisory and private investment firm) (2002-2014 and 2017-Present); Director of MoneyLion, Inc. (an operator of a data-driven, digital financial platform) (2021-Present); and was formerly U.S. Ambassador to the Kingdom of Morocco (2014-2017) and a Member of the Board of Directors of Santander Bank, N.A. (2018-2019). Previously, he served as an Advisory Board Member of Goldman Sachs Trust and Goldman Sachs Variable Insurance Trust (October 2019-January 2020). Trustee — Goldman Sachs Variable Insurance Trust and Goldman Sachs Trust. | | | 102 | | | MoneyLion, Inc. (an operator of a data-driven, digital financial platform) |
Kathryn A. Cassidy Age: 69 | | Trustee | | Since 2015 | | Ms. Cassidy is retired. She is Director, Vertical Aerospace Ltd. (an aerospace and technology company) (2021-Present). Formerly, Ms. Cassidy was Advisor to the Chairman (May 2014-December 2014); and Senior Vice President and Treasurer (2008-2014), General Electric Company & General Electric Capital Corporation (technology and financial services companies). Trustee — Goldman Sachs Variable Insurance Trust and Goldman Sachs Trust. | | | 102 | | | Vertical Aerospace Ltd. (an aerospace and technology company) |
John G. Chou Age: 67 | | Trustee | | Since 2022 | | Mr. Chou is retired. Formerly, he was Executive Vice President and Special Advisor to the Chairman and CEO (2021-2022); Executive Vice President and Chief Legal Officer (2019-2021); Executive Vice President and Chief Legal & Business Officer (2017-2019); and Executive Vice President and General Counsel (2011-2017) of Cencora, Inc. (a pharmaceutical and healthcare company). Trustee — Goldman Sachs Variable Insurance Trust and Goldman Sachs Trust. | | | 102 | | | None |
Joaquin Delgado Age: 63 | | Trustee | | Since 2020 | | Dr. Delgado is retired. He is Director, Stepan Company (a specialty chemical manufacturer) (2011-Present); and was formerly Director, Hexion Inc. (a specialty chemical manufacturer) (2019-2022); Executive Vice President, Consumer Business Group of 3M Company (July 2016-July 2019); and Executive Vice President, Health Care Business Group of 3M Company (October 2012-July 2016). Previously, Dr. Delgado served as an Advisory Board Member of Goldman Sachs Trust and Goldman Sachs Variable Insurance Trust (October 2019-January 2020). Trustee — Goldman Sachs Variable Insurance Trust and Goldman Sachs Trust. | | | 102 | | | Stepan Company (a specialty chemical manufacturer) |
Eileen H. Dowling Age: 61 | | Trustee | | Since 2021 | | Ms. Dowling is retired. Formerly, she was Senior Advisor (April 2021-September 2021); and Managing Director (2013-2021), BlackRock, Inc. (a financial services firm). As Managing Director, she held senior management positions, including Global Head of Global Consultant Relations (2017-2021), Multinational Corporations (2019-2021), the Institutional Product Group (2015-2019) and Institutional Marketing (2013-2016). Ms. Dowling was a member of the Global Operating Committee and Product Executive Committee of BlackRock. Trustee — Goldman Sachs Variable Insurance Trust and Goldman Sachs Trust. | | | 102 | | | None |
| | | | | | | | | | | | |
GOLDMAN SACHS VIT BUFFERED S&P 500 FUNDS
Trustees and Officers (Unaudited) (continued)
Independent Trustees
| | | | | | | | | | | | |
| | | | | |
Name,
Address and Age1 | | Position(s) Held
with the Trust | | Term of
Office and
Length of
Time Served2 | | Principal Occupations
During Past 5 Years | | Number of
Portfolios in
Fund Complex
Overseen by
Trustee3 | | | Other
Directorships
Held by Trustee4 |
Paul C. Wirth Age: 66 | | Trustee | | Since 2022 | | Mr. Wirth is retired. He is Executive Advisor, My Next Season LLC (a career transition advisory firm) (2023-Present). Formerly, he was Deputy Chief Financial Officer and Principal Accounting Officer (2011-2020); Finance Director and Principal Accounting Officer (2010-2011); and Managing Director, Global Controller, and Chief Accounting Officer (2005-2010) of Morgan Stanley. Trustee — Goldman Sachs Variable Insurance Trust and Goldman Sachs Trust. | | | 102 | | | None |
| | | | | | | | | | | | |
Interested Trustee*
| | | | | | | | | | | | |
| | | | | |
Name,
Address and Age1 | | Position(s) Held
with the Trust | | Term of
Office and
Length of
Time Served2 | | Principal Occupations
During Past 5 Years | | Number of
Portfolios in
Fund Complex
Overseen by
Trustee | | | Other
Directorships
Held by Trustee4 |
James A. McNamara Age: 61 | | President and Trustee | | Since 2007 | | Advisory Director, Goldman Sachs (January 2018-Present); Managing Director, Goldman Sachs (January 2000-December 2017); Director of Institutional Fund Sales, GSAM (April 1998-December 2000); and Senior Vice President and Manager, Dreyfus Institutional Service Corporation (January 1993-April 1998). President and Trustee — Goldman Sachs Variable Insurance Trust; Goldman Sachs Trust; Goldman Sachs Trust II; Goldman Sachs ETF Trust; Goldman Sachs ETF Trust II; Goldman Sachs Credit Income Fund; and Goldman Sachs Real Estate Diversified Income Fund. | | | 192 | | | None |
| | | | | | | | | | | | |
| * | Mr. McNamara is considered to be an “Interested Trustee” because he holds positions with Goldman Sachs and owns securities issued by The Goldman Sachs Group, Inc. Mr. McNamara holds comparable positions with certain other companies of which Goldman Sachs, GSAM or an affiliate thereof is the investment adviser, administrator and/or distributor. |
| 1 | Each Trustee may be contacted by writing to the Trustee, c/o Goldman Sachs, 200 West Street, New York, New York, 10282, Attn: Robert Griffith. Information is provided as of November 30, 2023. |
| 2 | Subject to such policies as may be adopted by the Board from time-to-time, each Trustee holds office for an indefinite term, until the earliest of: (a) the election of his or her successor; (b) the date the Trustee resigns or is removed by the Board or shareholders, in accordance with the Trust’s Declaration of Trust; or (c) the termination of the Trust. The Board has adopted policies which provide that each Independent Trustee shall retire as of December 31st of the calendar year in which he or she reaches (a) his or her 75th birthday or (b) the 15th anniversary of the date he or she became a Trustee, whichever is earlier, unless a waiver of such requirements shall have been adopted by a majority of the other Trustees. These policies may be changed by the Trustees without shareholder vote. |
| 3 | The Goldman Sachs Fund Complex includes certain other companies listed above for each respective Trustee. As of November 30, 2023, Goldman Sachs Trust consisted of 87 portfolios; Goldman Sachs Variable Insurance Trust consisted of 15 portfolios (11 of which offered shares to the public); Goldman Sachs Trust II consisted of 18 portfolios (7 of which offered shares to the public); Goldman Sachs ETF Trust consisted of 68 portfolios (37 of which offered shares to the public); Goldman Sachs ETF Trust II consisted of 2 portfolios; and Goldman Sachs Credit Income Fund and Goldman Sachs Real Estate Diversified Income Fund each consisted of one portfolio. Goldman Sachs Credit Income Fund did not offer shares to the public. |
| 4 | This column includes only directorships of companies required to report to the Securities and Exchange Commission under the Securities Exchange Act of 1934 (i.e., “public companies”) or other investment companies registered under the Act. |
Information as of the date of this shareholder report. Additional information about the Trustees is available in the Fund’s Statement of Additional Information, which can be obtained from Goldman Sachs free of charge by calling this toll-free number (in the United States of America): 1-800-526-7384.
GOLDMAN SACHS VIT BUFFERED S&P 500 FUNDS
Trustees and Officers (Unaudited) (continued)
Officers of the Trust*
| | | | | | |
| | | |
| Name, Address and Age1 | | Position(s) Held with the Trust | | Term of
Office and
Length of
Time Served2 | | Principal Occupations During Past 5 Years |
James A. McNamara
200 West Street New York, NY 10282 Age: 61 | | President and
Trustee | | Since 2007 | | Advisory Director, Goldman Sachs (January 2018-Present); Managing Director, Goldman Sachs (January 2000-December 2017); Director of Institutional Fund Sales, GSAM (April 1998-December 2000); and Senior Vice President and Manager, Dreyfus Institutional Service Corporation (January 1993-April 1998). President and Trustee — Goldman Sachs Variable Insurance Trust; Goldman Sachs Trust; Goldman Sachs Trust II; Goldman Sachs ETF Trust; Goldman Sachs ETF Trust II; Goldman Sachs Credit Income Fund; and Goldman Sachs Real Estate Diversified Income Fund. |
Joseph F. DiMaria
30 Hudson Street Jersey City, NJ 07302 Age: 55 | | Treasurer, Principal
Financial Officer
and Principal
Accounting Officer | | Since 2017
(Treasurer and
Principal
Financial
Officer
since 2019) | | Managing Director, Goldman Sachs (November 2015-Present) and Vice President — Mutual Fund Administration, Columbia Management Investment Advisers, LLC (May 2010-October 2015). Treasurer, Principal Financial Officer and Principal Accounting Officer — Goldman Sachs Variable Insurance Trust (previously Assistant Treasurer (2016)); Goldman Sachs Trust (previously Assistant Treasurer (2016)); Goldman Sachs Trust II (previously Assistant Treasurer (2017)); Goldman Sachs ETF Trust (previously Assistant Treasurer (2017)); Goldman Sachs ETF Trust II; Goldman Sachs Credit Income Fund; and Goldman Sachs Real Estate Diversified Income Fund. |
Robert Griffith
200 West Street New York, NY 10282 Age: 49 | | Secretary | | Since 2023 | | Managing Director, Goldman Sachs (September 2022-Present); General Counsel, Exchange Traded Concepts, LLC (October 2021-September 2022); Vice President, Goldman Sachs (August 2011-October 2021); Associate General Counsel, Goldman Sachs (December 2014-Present); Assistant General Counsel, Goldman Sachs (August 2011-December 2014); Vice President and Counsel, Nomura Holding America, Inc. (2010-2011); and Associate, Simpson Thacher & Bartlett LLP (2005-2010). Secretary — Goldman Sachs Variable Insurance Trust (previously Assistant Secretary (2022)); Goldman Sachs Trust (previously Assistant Secretary (2022)); Goldman Sachs Trust II (previously Assistant Secretary (2022)); Goldman Sachs ETF Trust (previously Assistant Secretary (2022)); Goldman Sachs ETF Trust II (previously Assistant Secretary (2022)); and Goldman Sachs Real Estate Diversified Income Fund (previously Assistant Secretary (2022)). |
| | | | | | |
| * | Represents a partial list of officers of the Trust. Additional information about all the officers is available in the Fund’s Statement of Additional Information, which can be obtained from Goldman Sachs free of charge by calling this toll-free number (in the United States): 1-800-526-7384. |
| 1 | Information is provided as of December 31, 2023. |
| 2 | Officers hold office at the pleasure of the Board of Trustees or until their successors are duly elected and qualified. Each officer holds comparable positions with certain other companies of which Goldman Sachs, GSAM or an affiliate thereof is the investment adviser, administrator and/or distributor. |
Goldman Sachs VIT Buffered Funds — Tax Information (Unaudited)
Pursuant to Section 852 of the Internal Revenue Code, the Goldman Sachs Variable Insurance Trust - Goldman Sachs Buffered S&P 500 Fund - Jan/Jul, Goldman Sachs Variable Insurance Trust - Goldman Sachs Buffered S&P 500 Fund - Mar/Sep, and Goldman Sachs Variable Insurance Trust - Goldman Sachs Buffered S&P 500 Fund - May/Nov designates $169,150, $15,300, $17,750 respectively, or if different, the maximum amount allowable, as capital gain dividends paid during the fiscal year ended December 31, 2023.
| | |
| TRUSTEES | | OFFICERS |
Gregory G. Weaver, Chair | | James A. McNamara, President |
Cheryl K. Beebe* | | Joseph F. DiMaria, Principal Financial Officer, |
Dwight L. Bush | | Principal Accounting Officer and Treasurer |
Kathryn A. Cassidy | | Robert Griffith, Secretary |
John G. Chou | | |
Joaquin Delgado | | |
Eileen H. Dowling | | |
Lawrence Hughes* | | |
| John F. Killian* | | |
| Steven D. Krichmar* | | |
| Michael Latham* | | |
| James A. McNamara | | |
| Lawrence W. Stranghoener* | | |
| Paul C. Wirth | | |
| *Effective January 1, 2024 | | |
GOLDMAN SACHS & CO. LLC
Distributor and Transfer Agent
GOLDMAN SACHS ASSET MANAGEMENT, L.P.
Investment Adviser
200 West Street, New York,
New York 10282
Visit our web site at www.GSAMFUNDS.com to obtain the most recent month-end returns.
The reports concerning the Fund included in this shareholder report may contain certain forward-looking statements about the factors that may affect the performance of the Fund in the future. These statements are based on Fund management’s predictions and expectations concerning certain future events and their expected impact on the Fund, such as performance of the economy as a whole and of specific industry sectors, changes in the levels of interest rates, the impact of developing world events, and other factors that may influence the future performance of the Fund. Management believes these forward-looking statements to be reasonable, although they are inherently uncertain and difficult to predict. Actual events may cause adjustments in portfolio management strategies from those currently expected to be employed.
A description of the policies and procedures that the Fund use to determine how to vote proxies relating to portfolio securities and information regarding how the Fund voted proxies relating to portfolio securities for the 12-month period ended June 30 is available (i) without charge, upon request by calling 1-800-621-2550; and (ii) on the Securities and Exchange Commission (“SEC”) web site at http://www.sec.gov.
The Fund will file portfolio holdings information for each month in a fiscal quarter within 60 days after the end of the relevant fiscal quarter on Form N-PORT. Portfolio holdings information for the third month of each fiscal quarter will be made available on the SEC’s web site at http://www.sec.gov. Portfolio holdings information may be obtained upon request and without charge by calling 1-800-526-7384 (for Retail Shareholders) or 1-800-621-2550 (for Institutional Shareholders).
Views and opinions expressed are for informational purposes only and do not constitute a recommendation by GSAM to buy, sell, or hold any security. Views and opinions are current as of the date of this presentation and may be subject to change, they should not be construed as investment advice.
Goldman Sachs & Co. LLC (“Goldman Sachs”) does not provide legal, tax or accounting advice. Any statement contained in this communication (including any attachments) concerning U.S. tax matters was not intended or written to be used, and cannot be used, for the purpose of avoiding penalties under the Internal Revenue Code, and was written to support the promotion or marketing of transactions or matters addressed. Clients of Goldman Sachs should obtain their own independent tax advice based on their particular circumstances.
The website links provided are for your convenience only and are not an endorsement or recommendation by GSAM of any of these websites or the products or services offered. GSAM is not responsible for the accuracy and validity of the content of these websites.
Fund holdings and allocations shown are as of December 31, 2023 and may not be representative of future investments. Fund holdings should not be relied on in making investment decisions and should not be construed as research or investment advice regarding particular securities. Current and future holdings are subject to risk.
References to indices, benchmarks or other measures of relative market performance over a specified period of time are provided for your information only and do not imply that the portfolio will achieve similar results. The index composition may not reflect the manner in which a portfolio is constructed. While an adviser seeks to design a portfolio which reflects appropriate risk and return features, portfolio characteristics may deviate from those of the benchmark.
The portfolio risk management process includes an effort to monitor and manage risk, but does not imply low risk.
Shares of the Goldman Sachs VIT Funds are offered to separate accounts of participating life insurance companies for the purpose of funding variable annuity contracts and variable life insurance policies. Shares of the Fund are not offered directly to the general public. The variable annuity contracts and variable life insurance policies are described in the separate prospectuses issued by participating insurance companies. You should refer to those prospectuses for information about surrender charges, mortality and expense risk fees and other charges that may be assessed by participating insurance companies under the variable annuity contracts or variable life insurance policies. Such fees or charges, if any, may affect the return you may realize with respect to your investments. Ask your representative for more complete information. Please consider a fund’s objectives, risks and charges and expenses, and read the prospectus carefully before investing. The prospectus contains this and other information about the Fund.
This material is not authorized for distribution to prospective investors unless preceded or accompanied by a current prospectus or summary prospectus, if applicable. Investors should consider the Fund’s objective, risks, and charges and expenses, and read the summary prospectus, if available, and/or the prospectus carefully before investing or sending money. The summary prospectus, if available, and the prospectus contain this and other information about the Fund and may be obtained from your authorized dealer or from Goldman Sachs & Co. LLC by calling 1-800-621-2550.
This report is prepared for the general information of contract owners and is not an offer of shares of the Goldman Sachs Variable Insurance Trust Funds.
© 2024 Goldman Sachs. All rights reserved.
VITBSP500AR-24 356267-OTU-1967023
| | (a) | As of the end of the period covered by this report, the registrant has adopted a code of ethics that applies to the registrant’s principal executive officer, principal financial officer, principal accounting officer or controller, or persons performing similar functions, regardless of whether these individuals are employed by the registrant or a third party (the “Code of Ethics”). |
| | (c) | During the period covered by this report, no amendments were made to the provisions of the Code of Ethics. |
| | (d) | During the period covered by this report, the registrant did not grant any waivers, including an implicit waiver, from any provision of the Code of Ethics. |
| | (f) | A copy of the Code of Ethics is available as provided in Item 14(a)(1) of this report. |
| ITEM 3. | AUDIT COMMITTEE FINANCIAL EXPERT. |
| | The registrant’s board of trustees has determined that the registrant has at least one “audit committee financial expert” (as defined in Item 3 of Form N-CSR) serving on its audit committee. Kathryn A. Cassidy is the “audit committee financial expert” and is “independent” (as each term is defined in Item 3 of Form N-CSR). |
| ITEM 4. | PRINCIPAL ACCOUNTANT FEES AND SERVICES. |
Item 4 — Principal Accountant Fees and Services for the Goldman Sachs Variable Insurance Trust (“GSVIT”):
Table 1 – Items 4(a) - 4(d)
| | | | | | | | | | |
| | | 2023 | | | 2022 | | | Description of Services Rendered |
Audit Fees: | | | | | | | | | | |
• PricewaterhouseCoopers (“PwC”) | | $ | 438,129 | | | $ | 529,199 | | | Financial Statement audits. |
Audit-Related Fees | | | | | | | | | | |
PwC | | $ | 63,000 | | | $ | 38,900 | | | Other attest services. |
Tax Fees | | | | | | | | | | |
PwC | | $ | 0 | | | $ | 0 | | | |
Items 4(b)(c) & (d) Table 2. Non-Audit Services to the GSVIT’s* that were pre-approved by the GSVIT’s Audit Committee pursuant to Rule 2-01(c)(7)(ii) of Regulation S-X
| | | | | | | | | | |
| | | 2023 | | | 2022 | | | Description of Services Rendered |
Audit-Related Fees | | | | | | | | | | |
PwC | | $ | 2,122,312 | | | $ | 1,906,448 | | | Internal control review performed in accordance with Statement on Standards for Attestation Engagements No. 16 and semi-annual updates related to withholding tax accrual for non-US jurisdictions. These fees are borne by the Funds’ adviser. |
| * | These include the advisor (excluding sub-advisors) and any entity controlling, controlled by or under common control with the advisor that provides ongoing services to the registrant (hereinafter referred to as “service affiliates”). |
Item 4(e)(1) — Audit Committee Pre-Approval Policies and Procedures
Pre-Approval of Audit and Non-Audit Services Provided to the Funds of the Goldman Sachs Variable Insurance Trust. The Audit and Non-Audit Services Pre-Approval Policy (the “Policy”) adopted by the Audit Committee of GSVIT sets forth the procedures and the conditions pursuant to which services performed by an independent auditor for GSVIT may be pre-approved. Services may be pre-approved specifically by the Audit Committee as a whole or, in certain circumstances, by the Audit Committee Chairman or the person designated as the Audit Committee Financial Expert. In addition, subject to specified cost limitations, certain services may be pre-approved under the provisions of the Policy. The Policy provides that the Audit Committee will consider whether the services provided by an independent auditor are consistent with the Securities and Exchange Commission’s rules on auditor independence. The Policy provides for periodic review and pre-approval by the Audit Committee of the services that may be provided by the independent auditor.
De Minimis Waiver. The pre-approval requirements of the Policy may be waived with respect to the provision of non-audit services that are permissible for an independent auditor to perform, provided (1) the aggregate amount of all such services provided constitutes no more than five percent of the total amount of revenues subject to pre-approval that was paid to the independent auditors during the fiscal year in which the services are provided; (2) such services were not recognized by GSVIT at the time of the engagement to be non-audit services; and (3) such services are promptly brought to the attention of the Audit Committee and approved prior to the completion of the audit by the Audit Committee or by one or more members of the Audit Committee to whom authority to grant such approvals has been delegated by the Audit Committee, pursuant to the pre-approval provisions of the Policy.
Pre-Approval of Non-Audit Services Provided to GSVIT’s Investment Advisers. The Policy provides that, in addition to requiring pre-approval of audit and non-audit services provided to GSVIT, the Audit Committee will pre-approve those non-audit services provided to GSVIT’s investment advisers (and entities controlling, controlled by or under common control with the investment advisers that provide ongoing services to GSVIT) where the engagement relates directly to the operations or financial reporting of GSVIT.
Item 4(e)(2) — 0% of the audit-related fees, tax fees and other fees listed in Table 1 were approved by GSVIT’s Audit Committee pursuant to the “de minimis” exception of Rule 2-01(c)(7)(i)(C) of Regulation S-X. In addition, 0% of the non-audit services to the GSVIT’s service affiliates listed in Table 2 were approved by GSVIT’s Audit Committee pursuant to the “de minimis” exception of Rule 2-01(c)(7)(i)(C) of Regulation S-X.
Item 4(f) — Not applicable.
Items 4(g) Aggregate Non-Audit Fees Disclosure
The aggregate non-audit fees billed to GSVIT for the twelve months ended December 31, 2023 and December 31, 2022 by PwC were approximately $63,000 and $38,900, respectively.
The aggregate non-audit fees billed to GSVIT’s adviser and service affiliates for non-audit services for the twelve months ended December 31, 2022 and December 31, 2021 by PwC were approximately $17.1 million and $14.4 million, respectively. The figures for these entities are not yet available for the twelve months ended December 31, 2023. With regard to the aggregate non-audit fees billed to GSVIT’s adviser and service affiliates, the 2022 and 2021 amounts include fees for non-audit services required to be pre-approved [see Table 2] and fees for non-audit services that did not require pre-approval since they did not directly relate to GSVIT’s operations or financial reporting.
Items 4(h) — GSVIT’s Audit Committee has considered whether the provision of non-audit services to GSVIT’s investment adviser and service affiliates that did not require pre-approval pursuant to paragraph (c)(7)(ii) of Rule 2-01 of Regulation S-X is compatible with maintaining the auditor’s independence.
Item 4(i) — Not applicable.
Item 4(j) — Not applicable.
| ITEM 5. | AUDIT COMMITTEE OF LISTED REGISTRANTS. |
Not applicable.
| ITEM 6. | SCHEDULE OF INVESTMENTS. |
Schedule of Investments is included as part of the Reports to Shareholders filed under Item 1.
| ITEM 7. | DISCLOSURE OF PROXY VOTING POLICIES AND PROCEDURES FOR CLOSED-END MANAGEMENT INVESTMENT COMPANIES. |
Not applicable.
| ITEM 8. | PORTFOLIO MANAGERS OF CLOSED-END MANAGEMENT INVESTMENT COMPANIES. |
Not applicable.
| ITEM 9. | PURCHASES OF EQUITY SECURITIES BY CLOSED-END MANAGEMENT INVESTMENT COMPANY AND AFFILIATED PURCHASERS. |
Not applicable.
| ITEM 10. | SUBMISSION OF MATTERS TO A VOTE OF SECURITY HOLDERS. |
There have been no material changes to the procedures by which shareholders may recommend nominees to the registrant’s board of trustees.
| ITEM 11. | CONTROLS AND PROCEDURES. |
| | (a) | The registrant’s principal executive and principal financial officers or persons performing similar functions have concluded that the registrant’s disclosure controls and procedures (as defined in Rule 30a-3(c) under the Investment Company Act of 1940, as amended (the “1940 Act”)) are effective as of a date within 90 days of the filing date of this report that includes the disclosure required by this paragraph, based on the evaluation of these controls and procedures required by Rule 30a-3(b) under the 1940 Act and 15d-15(b) under the Securities Exchange Act of 1934, as amended. |
| | (b) | There were no changes in the registrant’s internal control over financial reporting (as defined in Rule 30a-3(d) under the 1940 Act) that occurred during the period covered by this report that have materially affected, or are reasonably likely to materially affect, the registrant’s internal control over financial reporting. |
| ITEM 12. | DISCLOSURE OF SECURITIES LENDING ACTIVITIES FOR CLOSED-END MANAGEMENT INVESTMENT COMPANIES. |
Not applicable.
| ITEM 13. | RECOVERY OF ERRONEOUSLY AWARDED COMPENSATION. |
SIGNATURES
Pursuant to the requirements of the Securities Exchange Act of 1934 and the Investment Company Act of 1940, the registrant has duly caused this report to be signed on its behalf by the undersigned, thereunto duly authorized.
Goldman Sachs Variable Insurance Trust
| | |
/s/ James A. McNamara |
By: James A. McNamara |
Chief Executive Officer of |
Goldman Sachs Variable Insurance Trust |
|
Date: February 26, 2024 |
Pursuant to the requirements of the Securities Exchange Act of 1934 and the Investment Company Act of 1940, the report has been signed below by the following persons on behalf of the registrant and in the capacities and on the dates indicated.
| | |
/s/ James A. McNamara |
By: James A. McNamara |
Chief Executive Officer of |
Goldman Sachs Variable Insurance Trust |
|
Date: February 26, 2024 |
|
/s/ Joseph F. DiMaria |
By: Joseph F. DiMaria |
Principal Financial Officer of |
Goldman Sachs Variable Insurance Trust |
|
Date: February 26, 2024 |