UNITED STATES
SECURITIES AND EXCHANGE COMMISSION
Washington, D.C. 20549
FORM N-CSR
CERTIFIED SHAREHOLDER REPORT OF REGISTERED
MANAGEMENT INVESTMENT COMPANIES
Investment Company Act file number 811-08361
Goldman Sachs Variable Insurance Trust
(Exact name of registrant as specified in charter)
71 South Wacker Drive, Chicago, Illinois 60606-6303
(Address of principal executive offices) (Zip code)
Caroline Kraus
Goldman Sachs & Co. LLC
200 West Street
New York, NY 10282
Copies to:
Stephen H. Bier, Esq.
Dechert LLP
1095 Avenue of the Americas
New York, NY 10036
(Name and address of agents for service)
Registrant’s telephone number, including area code: (312) 655-4400
Date of fiscal year end: December 31
Date of reporting period: December 31, 2022
| ITEM 1. | REPORTS TO STOCKHOLDERS. |
| | The Annual Report to Shareholders is filed herewith. |
Goldman
Sachs Variable Insurance Trust
Goldman Sachs Multi-Strategy Alternatives Portfolio
Goldman Sachs Trend Driven Allocation Fund
Annual Report
December 31, 2022

Goldman Sachs Variable Insurance Trust
| ∎ | | GOLDMAN SACHS VIT MULTI-STRATEGY ALTERNATIVES PORTFOLIO |
| ∎ | | GOLDMAN SACHS VIT TREND DRIVEN ALLOCATION FUND |
| | | | |
| | | |
| NOT FDIC-INSURED | | May Lose Value | | No Bank Guarantee |
MARKET REVIEW
Goldman Sachs Variable Insurance Trust Funds — Goldman Sachs VIT Multi Asset Strategies Funds
Market Review
Ongoing macroeconomic and geopolitical uncertainty created a challenging backdrop for the capital markets during the 12-month period ended December 31, 2022 (the “Reporting Period”). The Russia-Ukraine conflict and its impact on energy prices, COVID-19 flare-ups in China and pressure from rising wages in the U.S. led to sustained high inflation and hawkish, synchronized monetary policy responses from global central banks. (Hawkish suggests higher interest rates; opposite of dovish.)
During the first quarter of 2022, when the Reporting Period began, inflationary pressures intensified, with many developed nations experiencing their fastest price increases in decades. In February, geopolitical tensions added uncertainty to an already complex investment backdrop as energy and commodity prices spiked in response to Russia’s invasion of Ukraine late in the month. In response, global central banks, including the U.S. Federal Reserve (the “Fed”), took policy action. In March, the Fed raised interest rates, by 25 basis points, for the first time since 2018. (A basis point is 1/100th of a percentage point.) Fed Chair Jerome Powell provided guidance that policymakers were prepared to act even more aggressively to tackle inflation. In addition, a number of Fed governors indicated their openness to 50-basis-point rate hikes at the next meeting or two with the possibility of getting to neutral rate levels by the end of 2022. (The neutral rate is the theoretical federal funds rate at which the stance of Fed monetary policy is neither accommodative nor restrictive. It is the short-term real interest rate consistent with the economy maintaining full employment with associated price stability.) Global equities broadly declined during the first calendar quarter. Within fixed income, credit spreads (or, yield differentials) widened, as bond yields rose in response to inflationary pressures.
Global economic activity moderated noticeably in the second quarter of 2022 amid tighter financial conditions and COVID-19 outbreaks in China. Inflation accelerated, as food and energy prices continued to rise in the wake of Russia’s attack on Ukraine. Major central banks focused on taming inflation, signaling they would continue to tighten monetary policy until inflation came down toward their respective target levels. In the U.S., the Fed raised interest rates twice during the second calendar quarter, by 50 basis points in May and then by 75 basis points in June, and indicated there would be more rate increases into the end of 2022. Investor concerns around slower economic growth deepened, with worries about a potential policy miscalculation by the Fed increasing. As a result, global equities continued to sell off, led by a steep decline in the U.S. equity market. Emerging market equities also fell, though Chinese equities broadly recorded gains. Fixed income markets were mostly negative, as central bank interest rate hikes overall came faster than investors had previously anticipated. Rising short-term interest rates and expectations for further monetary policy tightening hurt duration-sensitive assets, while concerns about the economic outlook led to further credit spread widening. (Duration is a measure of a security’s sensitivity to changes in interest rates.)
The themes that had dominated the capital markets during the first half of 2022 persisted into the third calendar quarter. Higher-than-expected inflation data prompted the Fed to make two additional rate hikes, totaling 150 basis points, during the third quarter, increasing investor concern that Fed tightening might ultimately tip the U.S. economy into recession. In this environment, global equities and the fixed income market posted further losses. In the U.S., the S&P 500® Index recorded a third consecutive quarter of declines for the first time since the 2008 recession. Within fixed income, the Fed’s short-term rate hikes and rising longer-term yields weighed heavily on duration-sensitive assets. Higher perceived recession risk pushed credit spreads wider.
The fourth quarter of 2022 saw modest relief for risk assets, which recouped some of the losses suffered during the previous three calendar quarters. Although U.S. inflation surprised to the downside in October and November, helping to drive up equity markets, major central banks generally maintained their tightening stance and signaled additional tightening, though at a slower pace. The Fed hiked interest rates twice during the fourth quarter, with a 75-basis-point hike in November and a 50-basis-point hike in December, in line with market expectations. Meanwhile, China began reopening its economy as the government ended COVID-19 restrictions. In Europe, energy prices dropped, thanks to a warmer than usual winter.
Looking Ahead
At the end of the Reporting Period, we had a cautious outlook on the capital markets. In our view, the Fed was likely to continue tightening monetary policy until officials saw clear and consistent evidence of a sufficient and sustained decline in inflation. Although we acknowledged a growing investor narrative about the potential for a soft landing, we believed the Fed might find that difficult to achieve. (A soft landing, in economics, is a cyclical downturn that avoids recession. It typically describes attempts by central banks to raise interest rates just enough to stop an economy from overheating and experiencing high inflation, without causing a significant increase in unemployment, or a hard landing.) Furthermore, we thought that global central bank tightening cycles might diverge in terms of direction and speed based on each region’s household vulnerabilities, with some regions having more encumbered households than others.
GOLDMAN SACHS VARIABLE INSURANCE TRUST MULTI-STRATEGY ALTERNATIVES PORTFOLIO
INVESTMENT OBJECTIVE
The Portfolio seeks long-term growth of capital.
Portfolio Management Discussion and Analysis
Below, the Goldman Sachs Multi-Asset Solutions (“MAS”) Group discusses the Goldman Sachs Variable Insurance Trust — Goldman Sachs Multi-Strategy Alternatives Portfolio’s (the “Portfolio”) performance and positioning for the 12-month period ended December 31, 2022 (the “Reporting Period”).
How did the Portfolio perform during the Reporting Period?
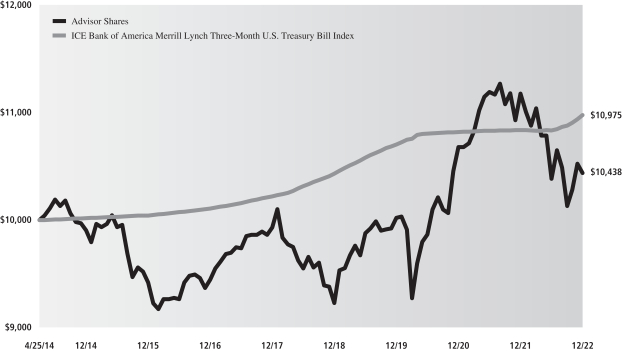
During the Reporting Period, the Portfolio’s Institutional, Service and Advisor Shares generated average annual total returns of -6.24%, -6.54% and -6.61%, respectively. These returns compare to the 1.47% average annual total return of the Portfolio’s benchmark, the ICE BofA 3-Month U.S. Treasury Bill Index during the same period.
Please note that the Portfolio’s benchmark being the ICE BofA 3-Month U.S. Treasury Bill Index is a means of emphasizing that the Portfolio has an unconstrained strategy. That said, this Portfolio employs a benchmark agnostic strategy and thus comparisons to a benchmark index are not particularly relevant.
What key factors were responsible for the Portfolio’s performance during the Reporting Period?
The Portfolio’s performance is driven by three sources of return: long-term strategic asset allocation to market exposures, medium-term and short-term dynamic allocations, and excess returns from investments in Underlying Funds. Long-term strategic asset allocation is the process by which the Portfolio’s assets are allocated across underlying asset classes and strategies in a way that considers the risks of each underlying asset class and strategy. Medium-term dynamic allocation is the process by which we adjust the portfolio for changes in the business or economic cycle, while short-term dynamic allocation is the implementation of tactical market views with the goal of improving the Portfolio’s risk-adjusted return. The risk-adjusted return on an investment takes into account the risk associated with that investment relative to other potential investments. Excess returns from investments in Underlying Funds is by how much the Underlying Funds outperform or underperform their respective benchmark indices.
During the Reporting Period, the Portfolio generated negative absolute returns, largely because of long-term strategic asset allocation. Security selection within the Underlying Funds overall also had a negative impact on performance. Conversely, short-term dynamic allocations contributed positively to the Portfolio’s returns, while medium-term dynamic allocations added modestly.
Long-term strategic asset allocation hampered the Portfolio’s performance during the Reporting Period. Within fixed income, the Portfolio’s strategic allocation to emerging markets debt detracted from results. Additionally, the Portfolio’s U.S. interest rate options strategy, which seeks to profit if interest rates fall, remain constant or rise less than anticipated, had a negative impact on performance as U.S. Treasury yields rose during the Reporting Period. (Our long U.S. interest rate options strategy is a macroeconomic hedge that buys options on short-term interest rates, including call options. A call option is an option that gives the holder the right to buy a certain quantity of an underlying security at an agreed-upon price at any time up to an agreed-upon date.) Within equities, the Portfolio’s strategic allocation to emerging markets equities detracted from performance. On the positive side, among liquid alternatives strategies, the Portfolio benefited from a strategic allocation to managed futures.
Medium-term dynamic allocation added modestly to the Portfolio’s performance during the Reporting Period. Specifically, the Portfolio benefited from its significant cash position and our decision to reduce its exposure to emerging markets equities.
Short-term dynamic allocations bolstered the Portfolio’s performance during the Reporting Period overall. From the beginning of the Reporting Period until January 17, 2022, the MAS Group expressed its short-term dynamic views through an allocation to the Goldman Sachs Tactical Tilt Overlay Fund (the “Underlying Tactical Fund”), which generated positive returns during that time period. Starting on January 17, 2022 through the end of the Reporting Period, the MAS Group implemented its short-term dynamic views directly, primarily through the use of derivatives and exchange-traded funds (“ETFs”). During that period, the Portfolio benefited most from its short-term dynamic allocations to the energy and health care sectors.
Overall, security selection within the Underlying Funds detracted from the Portfolio’s returns during the Reporting Period, with many fixed income and equity Underlying Funds underperforming their benchmark indices. The Goldman Sachs Strategic Income Fund and Goldman Sachs Emerging Markets Debt Fund underperformed their respective benchmark indices the most. Although the
GOLDMAN SACHS VARIABLE INSURANCE TRUST MULTI-STRATEGY ALTERNATIVES PORTFOLIO
performance of liquid alternative Underlying Funds was mixed, the Portfolio benefited from its investment in the Goldman Sachs Managed Futures Fund, which significantly outperformed its cash benchmark.
How was the Portfolio positioned at the beginning of the Reporting Period?
At the beginning of the Reporting Period, the Portfolio was positioned, in terms of its total net assets, with 56.6% in liquid alternative strategies, 32.4% in real assets/satellite asset classes, 13.8% in directional views and the balance in cash. Liquid alternatives strategies generally include, but are not limited to, momentum or trend trading strategies (investment decisions based on trends in asset prices over time), hedge fund beta (long term total returns consistent with investment results that approximate the return and risk patterns of a diversified universe of hedge funds), managed risk investment strategies (which seek to manage extreme risk scenarios by implementing daily and monthly risk targets across a diversified mix of asset classes) and unconstrained fixed income strategies (which have the ability to move across various fixed income sectors). Real assets/satellite asset classes generally include, but are not limited to, commodities, global real estate securities, global infrastructure securities, master limited partnerships, emerging markets equities and emerging markets debt. Directional views include more traditional beta investments, such as U.S. equities and non-U.S. developed markets equities. This above sector breakout is inclusive of derivative exposure across all asset classes.
How did you manage the Portfolio’s allocations during the Reporting Period?
No changes were made to the Portfolio’s long-term strategic asset allocations during the Reporting Period.
Within medium-term dynamic allocations, we decreased the Portfolio’s exposure to U.S. equities during March. In April, we reduced the Portfolio’s investments in 10-year U.S. Treasury futures and added investments in two-year U.S. Treasury futures. We also slightly increased the Portfolio’s medium-term dynamic allocation to the long U.S. interest rate options strategy. During May, we increased the Portfolio’s exposure to core fixed income, and we reduced its overall fixed income risk by decreasing exposure to high yield corporate bonds and high yield loans. In June, we reduced the Portfolio’s medium-term dynamic allocation to global infrastructure. During July, we decreased its exposure to emerging markets debt and increased its exposure to core fixed income. In August, we reduced the Portfolio’s medium-term dynamic exposure to emerging markets equities in favor of adding exposure to developed markets equities. During December, we increased the Portfolio’s exposure to emerging markets equities.
Regarding short-term dynamic allocations, we removed the Portfolio’s allocation to the Underlying Tactical Fund during January 2022 and began implementing our views directly, primarily through ETFs and derivatives. Using these instruments, we added tactical exposures to U.S. equities, non-U.S. developed markets equities, fixed income and currencies. In May, we slightly increased the Portfolio’s overall equity risk by increasing its exposure to U.S. large-cap equities. During July, we slightly increased the Portfolio’s tactical exposures to equities and fixed income. We reversed this short-term dynamic view in August, reducing the Portfolio’s allocations to equities and fixed income. In September, we increased the Portfolio’s overall equity risk by increasing its short-term dynamic allocations to U.S. large-cap equities. In December, we partially reduced the Portfolio’s short-term dynamic exposure to U.S. large-cap equities.
Regarding Underlying Funds, we removed the Goldman Sachs Absolute Return Tracker Fund as an Underlying Fund for the Portfolio during January 2022, reallocating the capital to other Underlying Funds with multi-strategy investment approaches. Also in January, we removed the Goldman Sachs Dynamic Global Equity Fund as an Underlying Fund for the Portfolio, reallocating the assets to other equity Underlying Funds. In February, in advance of its liquidation, we removed the Goldman Sachs Alternative Premia Fund as an Underlying Fund for the Portfolio. We reallocated the capital to the Goldman Sachs Long Short Credit Strategies Fund.
How was the Portfolio positioned at the end of the Reporting Period?
At the end of the Reporting Period, the Portfolio was positioned, in terms of its total net assets, with 35.7% in liquid alternative strategies, 29.5% in real assets/satellite asset classes, 16.19% in directional views and the balance in cash. This above sector breakout is inclusive of derivative exposure across all asset classes.
How did the Portfolio use derivatives and similar instruments during the Reporting Period?
During the Reporting Period, derivatives were used primarily to express views across developed and emerging markets equities as well as on U.S. interest rates. The Portfolio employed equity index futures to effect long exposures in U.S. large-cap equities, U.S. small-cap equities and emerging markets equities (each having a negative impact on performance). Within fixed income during the Reporting Period, the Portfolio used interest rate futures, specifically U.S. Treasury futures, to express views on the U.S. Treasury yield curve (negative impact). The Portfolio also used interest rate options in a macroeconomic hedge that seeks to profit if interest rates fall, remain constant or rise less than anticipated (negative impact). Finally, within short-term tactical views on currencies, the Portfolio employed forward foreign currency exchange contracts (neutral impact).
GOLDMAN SACHS VARIABLE INSURANCE TRUST MULTI-STRATEGY ALTERNATIVES PORTFOLIO
Additionally, some of the Underlying Funds used derivatives during the Reporting Period to apply their active investment views with greater versatility and potentially to afford greater risk management precision. As market conditions warranted during the Reporting Period, some of these Underlying Funds engaged in forward foreign currency exchange contracts, financial futures contracts, options, swap contracts and structured securities to attempt to enhance portfolio return and for hedging purposes.
Were there any changes to the Portfolio’s portfolio management team during the Reporting Period?
Effective January 3, 2022, Alexandra Wilson-Elizondo became a portfolio manager for the Portfolio, joining Neill Nuttall. By design, all investment decisions for the Portfolios are performed within a team structure, with multiple subject matter experts. This strategic decision making has been the cornerstone of our approach and ensures continuity in the Portfolio.
What is the Portfolio’s tactical view and strategy for the months ahead?
At the end of the Reporting Period, we remained cautious about the potential risk-reward of adding risk to the Portfolio. In addition, with short-term interest rates near 5%, we believed investors were not being adequately compensated for being pro-risk amid the prevailing uncertainty around earnings growth, geopolitical developments and global monetary policy. Until we saw more clarity in the inflation/economic growth mix, we expected to favor higher-yielding, high-quality fixed income over equities. Going forward, we continued to believe that a dynamic investment approach and careful risk management should help us identify attractive opportunities, both regionally and across asset classes.
FUND BASICS
OVERALL UNDERLYING FUND AND ETF WEIGHTINGS1
Percentage of Net Assets

| 1 | The Portfolio is actively managed and, as such, its composition may differ over time. The percentage shown for each Underlying Fund and ETF reflects the value of that Underlying Fund or ETF as a percentage of net assets of the Portfolio. Figures in the graph above may not sum to 100% due to rounding and/or exclusion of other assets and liabilities. Underlying sector allocations of exchange traded funds and investment companies held by the Portfolio are not reflected in the graph above. The graph depicts the Portfolio’s investments but may not represent the Portfolio’s market exposure due to the exclusion of certain derivatives, if any, as listed in the Additional Investment Information section of the Schedule of Investments. |
For more information about your Fund, please refer to www.GSAMFUNDS.com. There, you can learn more about your Fund’s investment strategies, holdings, and performance.
GOLDMAN SACHS VARIABLE INSURANCE TRUST MULTI-STRATEGY ALTERNATIVES PORTFOLIO
Performance Summary
December 31, 2022
The following graph shows the value, as of December 31, 2022, of a $10,000 investment made on April 25, 2014 (commencement of the Fund’s operations) in Advisor Shares at NAV. For comparative purposes, the performance of the Portfolio’s benchmark, the ICE Bank of America Merrill Lynch Three-Month U.S. Treasury Bill Index, is shown. Performance reflects applicable fee waivers and/or expense limitations in effect during the periods shown and, in their absence, performance would be reduced. Returns do not reflect the deduction of taxes that a shareholder would pay on Fund distributions or the redemption of Fund shares. The returns set forth below represent past performance. Past performance does not guarantee future results. The Fund’s investment return and principal value will fluctuate so that an investor’s shares, when redeemed, may be worth more or less than their original cost. Current performance may be lower or higher than the performance quoted below. Please visit our web site at www.GSAMFUNDS.com to obtain the most recent month-end returns.
Multi-Strategy Alternatives Portfolio’s Lifetime Performance
Performance of a $10,000 investment, with distributions reinvested, from April 25, 2014 through December 31, 2022.
| | | | | | |
| Average Annual Total Return through December 31, 2022 | | One Year | | Five Years | | Since Inception |
Institutional (Commenced April 25, 2014) | | -6.24% | | 1.41% | | 0.89% |
Service (Commenced April 25, 2014) | | -6.54% | | 1.15% | | 0.64% |
Advisor (Commenced April 25, 2014) | | -6.61% | | 1.00% | | 0.49% |
GOLDMAN SACHS VARIABLE INSURANCE TRUST TREND DRIVEN ALLOCATION FUND
INVESTMENT OBJECTIVE
The Fund seeks total return while seeking to provide volatility management.
Portfolio Management Discussion and Analysis
Effective after the close of business on January 31, 2022, the Goldman Sachs Variable Insurance Trust — Goldman Sachs Trend Driven Allocation Fund’s (the “Fund”) principal investment strategy changed. The Fund’s investment objective and benchmark indices remained the same. Below, the Goldman Sachs Quantitative Investment Strategies (“QIS”) Team discusses the Fund’s performance and positioning for the 12-month period ended December 31, 2022 (the “Reporting Period”).
How did the Fund perform during the Reporting Period?
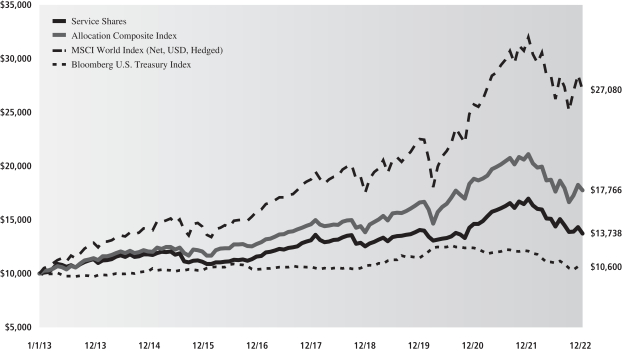
During the Reporting Period, the Fund’s Institutional and Service Shares generated average annual total returns of -19.00% and -19.16%, respectively. These returns compare to the -13.93% average annual total return of the Fund’s blended benchmark during the same time period. The components of the Fund’s blended benchmark, which is comprised 60% of the MSCI World Index (Net, USD, Hedged) and 40% of the Bloomberg U.S. Treasury Index (Total Return, Unhedged, USD), generated average annual total returns of -15.38% and -12.46%, respectively, during the same time period.
Importantly, during the Reporting Period, the Fund’s overall annualized volatility was 10.66%, less than the Fund’s blended benchmark’s annualized volatility of 12.17% during the same time period. By way of comparison, the S&P 500® Index’s annualized volatility was 24.13% during the Reporting Period.
How did the Fund’s investment strategy change after the close of business on January 31, 2022?
Before the close of business on January 31, 2022, the Fund primarily sought to achieve its investment objective by investing in a global portfolio of equity and fixed income asset classes, with at least 40% of its assets invested in equities and at least 20% of its assets invested in fixed income, assuming normal market conditions. Goldman Sachs Asset Management, L.P. (the “Investment Adviser”) made investment decisions based upon its analysis of the recent performance of market factors around the world, and might then allocate more of the Fund’s assets to investments with strong recent performance and allocate assets away from investments with poor recent performance.
Effective after the close of business on January 31, 2022, the Fund primarily seeks to achieve its investment objective by investing in a portfolio of equity and fixed income asset classes, with the expectation of investing at least 50% of its assets in equities and a minimum of 30% of its assets in fixed income, assuming normal market conditions. The Investment Adviser makes investment decisions based upon its analysis of macro factors, most notably “trends” from around the world. The trends analyzed by the Investment Adviser are based on, but are not limited to, relative considerations around the prices and volatility of the underlying markets. If recent prices are higher than measures of historical prices for an asset, the Investment Adviser generally considers there to be a positive (strong) trend for these assets, whereas recent prices below such measures generally indicate negative (poor) trends. If the current measure of volatility is elevated relative to historic realizations of this volatility measure for an asset, the Investment Adviser generally considers there to be a negative (poor) trend for this asset, whereas volatility that is less elevated indicates positive (strong) trends. As a result of the trends analysis, the Investment Adviser may allocate more of the Fund’s assets to investments with relatively strong recent trends and allocate assets away from investments with relatively poor recent trends.
In addition, as a continuing part of the Fund’s investment strategy, the Investment Adviser seeks to manage volatility and limit losses by allocating the Fund’s assets away from risky investments in distressed or volatile market environments. In this context, volatility is a statistical measurement of the magnitude of up and/or down fluctuations in the value of a financial instrument or index. While the Investment Adviser attempts to manage the Fund’s volatility, there can be no guarantee that the Fund will be successful.
What key factors were responsible for the Fund’s performance during the Reporting Period?
Because of heightened equity market volatility during the Reporting Period, the Fund’s drawdown control and volatility management mechanisms were activated multiple times, actively de-risking the Fund into cash, especially in early March, May/June, and September/October 2022. (A drawdown is a peak-to-trough decline during a specific time period and is a measure of downside volatility.)
GOLDMAN SACHS VARIABLE INSURANCE TRUST TREND DRIVEN ALLOCATION FUND
During the first and fourth quarters of 2022, the Fund underperformed its blended benchmark due to the Fund’s sizeable cash allocation, which kept the Fund from fully participating in the equity market rebound in the March and during a period from October into November. This was offset somewhat by the Fund’s cash allocation in the second and third calendar quarters, which bolstered relative performance amid the equity drawdown during that period.
From an absolute return perspective, the Fund benefited from its allocation to cash during the Reporting Period, as interest rates rose. Conversely, the Fund’s allocations to U.S. large-cap equities, European equities and Japanese equities, each of which posted negative returns, detracted from its absolute performance during the Reporting Period. The largest detractor was the Fund’s allocation to U.S. large-cap equities.
What was the Fund’s volatility during the Reporting Period?
As part of our investment approach, we seek to mitigate the Fund’s volatility. As mentioned earlier, for the Reporting Period overall, the Fund’s overall annualized volatility was 10.66%, less than its blended benchmark’s annualized volatility of 12.17%. By way of comparison, the S&P 500® Index’s annualized volatility was 24.13% during the Reporting Period.
How was the Fund positioned during the Reporting Period?
During the Reporting Period, we managed the Fund’s allocations across equity and fixed income markets based upon an analysis of market factors and, after the close of business on January 31, 2022, upon an analysis of trends from around the world. At the beginning of the Reporting Period, the Fund’s total assets were allocated 80.0% to equities, 20.0% to fixed income and 0% to cash. (Many of these positions were implemented through the use of exchanged-traded index future contracts.) Within the equity category, the Fund had allocations to U.S. large-cap equities, European equities, U.K. equities and Japanese equities. It did not have allocations to U.S. small-cap equities or emerging markets equities. As for fixed income, the Fund had allocations to Japanese and German government bonds at the start of the Reporting Period. It did not have an allocation to U.S. Treasury securities.
During the first quarter of 2022, as market equity volatility increased, we trimmed the Fund’s allocations to U.S. large-cap equities, European equities, U.K. equities and Japanese equities, while increasing its allocations to U.S. Treasury securities and cash. We reversed this positioning somewhat near quarter-end as equity markets rebounded. At the end of the first quarter, the Fund did not hold any German and Japanese government bonds. The equity market rebound at the end of the first quarter proved to be short-lived, and equity markets resumed their declines during the second quarter and into the summer months, though they experienced occasional brief rallies. In May 2022, we increased the Fund’s allocation to equities, most notably U.S. equities, and then trimmed it during June following a spike in volatility, which had reversed the previous trend. As markets stabilized somewhat in July and August, we steadily reduced the Fund’s cash position to almost zero and increased its allocations to equities and U.S. Treasury securities. In September, during a time of risk-off, or heightened risk aversion, sentiment, we significantly increased the Fund’s cash position. We started the fourth quarter of 2022 by increasing the Fund’s allocations to equities and U.S. Treasuries, reducing its cash position back to zero.
Overall, the Fund was dynamically positioned in equities, U.S. Treasury securities and cash during the first half of the Reporting Period. During the second half of the Reporting Period, there were distinct periods when the Fund held a nearly zero cash position. Throughout the Reporting Period, U.S. equities and U.S. Treasury securities were the Fund’s largest allocations.
How did the Fund use derivatives and similar instruments during the Reporting Period?
During the Reporting Period, the Fund employed exchange-traded equity index futures to gain exposure to U.S. large-cap stocks and to European, Japanese and U.K. equities. The use of these instruments had a negative impact overall on absolute returns. In addition, the Fund used bond futures to gain exposure to U.S. Treasury securities and to Japanese and German government bonds. On an absolute basis, the use of these instruments had a negative impact overall on the Fund’s performance.
Were there any changes to the Fund’s portfolio management team during the Reporting Period?
Effective at the close of business on June 23, 2022, Federico Gilly no longer served as a portfolio manager for the Fund, and James Park became a portfolio manager for the Fund. As of September 22, 2022, James Park no longer served as a portfolio manager for the Fund, and Momoko Ono and Jay Seo became portfolio managers for the Fund. At the end of the Reporting Period, Oliver Bunn, Momoko Ono and Jay Seo served as portfolio managers of the Fund. By design, all investment decisions for the Fund are performed within a team structure, with multiple subject matter experts. This strategic decision making has been a cornerstone of our approach and helps ensure continuity in the Fund.
GOLDMAN SACHS VARIABLE INSURANCE TRUST TREND DRIVEN ALLOCATION FUND
What is the Fund’s tactical asset allocation view and strategy for the months ahead?
At the end of the Reporting Period, the Fund’s total assets were allocated 69.5% to equities, 30.5% to fixed income and 0% to cash. (Many of these positions were implemented through the use of exchanged-traded index future contracts.) Within the equity allocation, the Fund had significant exposure to U.S. large-cap equities and, to a lesser extent, to European, Japanese and U.K. equities. It had no exposure to emerging markets equities or U.S. small-cap stocks at the end of the Reporting Period. Within the fixed income allocation, the Fund had exposure to U.S. Treasury securities at the end of the Reporting Period and no exposure to Japanese and German government bonds.
Going forward, we intend to position the Fund based on analyses of trends from around the world, while dynamically managing the volatility, or risk, of the overall portfolio. In general, the Fund will seek to invest at least 50% of its assets in equity investments and at least 30% of its assets in fixed income investments. The Fund may deviate from these strategic allocations in order to allocate more of the Fund’s assets to investments with relatively strong recent trends and allocate assets away from investments with relatively poor recent trends. When volatility increases, our goal is to preserve capital by proportionally increasing the Fund’s cash exposure and reducing its exposure to riskier asset classes. There is no guarantee the Fund’s dynamic management strategy will cause it to achieve its investment objective.
FUND BASICS
Trend Driven Allocation Fund
as of December 31, 2022
FUND COMPOSITION1
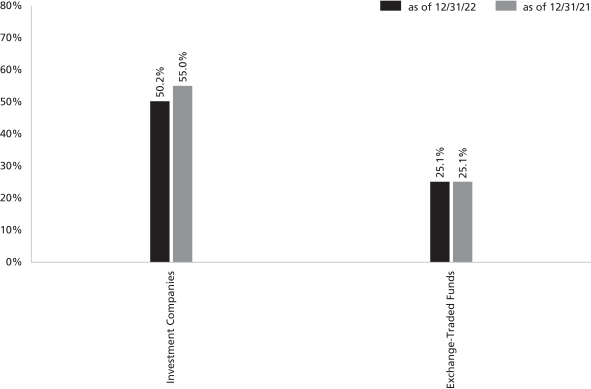
| 1 | The percentage shown for each investment category reflects the value of investments in that category as a percentage of net assets. Figures in the above graph may not sum to 100% due to the exclusion of other assets and liabilities. The underlying composition of exchange traded funds and investment companies held by the Fund are not reflected in the graph above. Consequently, the Fund’s overall composition may differ from the percentages contained in the graph above. The graph depicts the Fund’s investments but may not represent the Fund’s market exposure due to the exclusion of certain derivatives, if any, as listed in the Additional Investment Information section of the Schedule of Investments. |
For more information about your Fund, please refer to www.GSAMFUNDS.com. There, you can learn more about your Fund’s investment strategies, holdings, and performance.
GOLDMAN SACHS VARIABLE INSURANCE TRUST TREND DRIVEN ALLOCATION FUND
Performance Summary
December 31, 2022
The following graph shows the value, as of December 31, 2022, of a $10,000 investment made on January 1, 2013 in Service Shares at NAV. For comparative purposes, the performance of the Fund’s blended benchmark, the Allocation Composite Index, (comprised of the Morgan Stanley Capital International (MSCI) World Index (Net, USD, Hedged) (60%) and the Bloomberg U.S. Treasury Index (Total Return, USD, Unhedged) (40%)) is shown. Performance reflects applicable fee waivers and/or expense limitations in effect during the periods shown and, in their absence, performance would be reduced. Returns do not reflect the deduction of taxes that a shareholder would pay on Fund distributions or the redemption of Fund shares. The returns set forth below represent past performance. Past performance does not guarantee future results. The Fund’s investment return and principal value will fluctuate so that an investor’s shares, when redeemed, may be worth more or less than their original cost. Current performance may be lower or higher than the performance quoted below. Please visit our web site at www.GSAMFUNDS.com to obtain the most recent month-end returns.
Trend Driven Allocation Fund’s 10 Year Performance
Performance of a $10,000 investment, with distributions reinvested, from January 1, 2013 through December 31, 2022.
| | | | | | | | |
| Average Annual Total Return through December 31, 2022 | | One Year | | Five Years | | Ten Years | | Since Inception |
Institutional (Commenced October 16, 2013) | | -19.00% | | 1.18% | | N/A | | 2.68% |
Service | | -19.16% | | 0.92% | | 3.22% | | — |
GOLDMAN SACHS VARIABLE INSURANCE TRUST MULTI-ASSET STRATEGIES FUNDS
Index Definitions
ICE BofAML Three-Month T-Bill Index measures total return on cash, including price and interest income, based on short-term government Treasury Bills of about 90-day maturity, as reported by Bank of America Merrill Lynch.
MSCI ACWI Investable Market Index captures large, mid and small cap representation across 23 developed markets and 27 emerging markets countries.
MSCI Emerging Markets Index captures large-cap and mid-cap representation across 26 emerging markets countries. The index covers approximately 85% of the free float-adjusted market capitalization in each country.
Bloomberg U.S. Treasury Index measures U.S. dollar-denominated, fixed-rate, nominal debt issued by the U.S. Treasury. Treasury bills are excluded by the maturity constraint.
MSCI World Index is a broad global equity index that represents large and mid-cap equity performance across 23 developed markets countries. It covers approximately 85% of the free float-adjusted market capitalization in each country.
S&P 500® Index is a U.S. stock market index based on the market capitalizations of 500 large companies having common stock listed on the New York Stock Exchange or NASDAQ. The S&P 500® Index components and their weightings are determined by S&P Dow Jones Indices.
It is not possible to invest directly in an unmanaged index.
| | | | | | | | |
| Shares | | |
Description | | Value | |
|
| Underlying Funds (Class R6 Shares)(a) – 63.7% | |
| Equity – 11.2% | |
| | 208,599 | | | Goldman Sachs Global Infrastructure Fund | | $ | 2,544,911 | |
| | 187,878 | | | Goldman Sachs Emerging Markets Equity Insights Fund | | | 1,401,569 | |
| | 15,680 | | | Goldman Sachs Energy Infrastructure Fund | | | 166,361 | |
| | | | | | | | |
| | | | | | | 4,112,841 | |
| | |
| Fixed Income – 52.5% | |
| | 931,023 | | | Goldman Sachs Long Short Credit Strategies Fund | | | 7,094,397 | |
| | 482,432 | | | Goldman Sachs Managed Futures Strategy Fund | | | 4,930,459 | |
| | 287,214 | | | Goldman Sachs Emerging Markets Debt Fund | | | 2,550,458 | |
| | 386,754 | | | Goldman Sachs High Yield Fund | | | 2,057,530 | |
| | 177,750 | | | Goldman Sachs High Yield Floating Rate Fund | | | 1,539,318 | |
| | 129,972 | | | Goldman Sachs Strategic Income Fund | | | 1,146,354 | |
| | | | | | | | |
| | | | | | | 19,318,516 | |
| | |
| | TOTAL UNDERLYING FUNDS (CLASS R6 SHARES) | |
| | (Cost $24,144,238) | | $ | 23,431,357 | |
| | |
| | | | | | | | |
|
| Exchange Traded Funds – 8.5% | |
| | 42,308 | | | Goldman Sachs MarketBeta US Equity ETF | | $ | 2,196,208 | |
| | 19,779 | | | Goldman Sachs MarketBeta International Equity ETF(b) | | | 928,624 | |
| | |
| | TOTAL EXCHANGE TRADED FUNDS | |
| | (Cost $3,181,225) | | $ | 3,124,832 | |
| | |
| Shares | | Dividend
Rate | | | Value | |
|
| Investment Companies (Institutional Shares)(a) – 26.0% | |
Goldman Sachs Financial Square Government Fund | |
| 3,276,259 | | | 4.159 | % | | $ | 3,276,259 | |
Goldman Sachs VIT Government Money Market Fund | |
| 6,285,567 | | | 4.183 | % | | $ | 6,285,567 | |
| |
| TOTAL INVESTMENT COMPANIES | |
| (Cost $9,561,826) | | | | 9,561,826 | |
| |
| TOTAL INVESTMENTS BEFORE SECURITIES LENDING REINVESTMENT VEHICLE | |
| (Cost $36,887,289) | | | $ | 36,118,015 | |
| |
| | | | | | | | |
|
| Securities Lending Reinvestment Vehicle(a) – 2.5% | |
Goldman Sachs Financial Square Government Fund — Institutional Shares | |
| 911,315 | | | 4.159 | % | | $ | 911,315 | |
(Cost $911,315) | |
| |
| TOTAL INVESTMENTS – 100.7% | |
| (Cost $37,798,604) | | | $ | 37,029,330 | |
| |
LIABILITIES IN EXCESS OF OTHER ASSETS – (0.7)% | | | | (270,140 | ) |
| |
| NET ASSETS – 100.0% | | | $ | 36,759,190 | |
| |
| | |
| The percentage shown for each investment category reflects the value of investments in that category as a percentage of net assets. |
| |
| (a) | | Represents an affiliated issuer. |
| |
| (b) | | All or a portion of security is on loan. |
| | |
| |
| Currency Abbreviations: |
| CHF | | —Swiss Franc |
| EUR | | —Euro |
| USD | | —United States Dollar |
ADDITIONAL INVESTMENT INFORMATION
FORWARD FOREIGN CURRENCY EXCHANGE CONTRACTS — As of December 31, 2022, the Portfolio had the following forward foreign currency exchange contracts:
FORWARD FOREIGN CURRENCY EXCHANGE CONTRACTS WITH UNREALIZED GAIN
| | | | | | | | | | | | | | | | |
| Counterparty | | Currency
Purchased | | | Currency
Sold | | | Settlement
Date | | | Unrealized
Gain | |
| UBS Financial Services | | | CHF 30,000 | | | | USD 32,319 | | | | 3/15/2023 | | | $ | 383 | |
| | |
| The accompanying notes are an integral part of these financial statements. | | 13 |
GOLDMAN SACHS VARIABLE INSURANCE TRUST MULTI-STRATEGY ALTERNATIVES PORTFOLIO
Schedule of Investments
December 31, 2022
GOLDMAN SACHS VARIABLE INSURANCE TRUST MULTI-STRATEGY ALTERNATIVES PORTFOLIO
Schedule of Investments (continued)
December 31, 2022
ADDITIONAL INVESTMENT INFORMATION (continued)
FORWARD FOREIGN CURRENCY EXCHANGE CONTRACTS WITH UNREALIZED LOSS
| | | | | | | | | | | | | | | | |
| Counterparty | | Currency
Purchased | | | Currency
Sold | | | Settlement
Date | | | Unrealized
Loss | |
| UBS Financial Services | | | USD 31,741 | | | | EUR 30,000 | | | | 3/15/2023 | | | $ | (533 | ) |
FUTURES CONTRACTS — As of December 31, 2022, the Portfolio had the following futures contracts:
| | | | | | | | | | | | | | | | |
| Description | | Number of
Contracts | | | Expiration
Date | | | Notional
Amount | | | Unrealized
Appreciation/
(Depreciation) | |
| | | | |
Long position contracts: | | | | | | | | | | | | | | | | |
| EURO STOXX Bank Index | | | 35 | | | | 03/17/23 | | | $ | 180,304 | | | $ | 5,229 | |
| MSCI Emerging Markets E-Mini Index | | | 7 | | | | 03/17/23 | | | | 335,790 | | | | (3,794 | ) |
| U.S. Treasury 10 Year Note | | | 10 | | | | 03/22/23 | | | | 1,121,406 | | | | (7,494 | ) |
U.S. Treasury 2 Year Note | | | 8 | | | | 03/31/23 | | | | 1,640,000 | | | | (162 | ) |
| | | | |
| Total Futures Contracts | | | | | | | | | | | | | | $ | (6,221 | ) |
PURCHASED OPTIONS CONTRACTS — As of December 31, 2022, the Portfolio had the following purchased option contracts:
| | | | | | | | | | | | | | | | | | | | | | | | | | | | |
| Description | | Exercise
Price | | | Expiration
Date | | | Number of
Contracts | | | Notional
Amount | | | Value | | | Premiums
Paid
(Received)
by the
Portfolio | | | Unrealized
Appreciation/
(Depreciation) | |
|
Purchased options contracts: | |
| | | | | | | |
Calls | | | | | | | | | | | | | | | | | | | | | | | | | | | | |
3 Month Eurodollar | | | 95.00 USD | | | | 09/18/2023 | | | | 3 | | | $ | 711,938 | | | $ | 2,569 | | | $ | 6,982 | | | $ | (4,413 | ) |
3 Month Eurodollar | | | 94.75 USD | | | | 12/18/2023 | | | | 8 | | | | 1,904,200 | | | | 14,900 | | | | 16,194 | | | | (1,294 | ) |
3 Month Eurodollar | | | 95.00 USD | | | | 12/18/2023 | | | | 4 | | | | 952,100 | | | | 5,975 | | | | 11,559 | | | | (5,584 | ) |
3 Month Eurodollar | | | 97.25 USD | | | | 12/19/2023 | | | | 18 | | | | 4,284,450 | | | | 3,600 | | | | 20,533 | | | | (16,933 | ) |
3 Month Eurodollar | | | 94.75 USD | | | | 03/18/2024 | | | | 8 | | | | 1,912,000 | | | | 21,850 | | | | 23,250 | | | | (1,400 | ) |
3 Month Eurodollar | | | 97.50 USD | | | | 03/19/2024 | | | | 46 | | | | 10,994,000 | | | | 15,525 | | | | 54,257 | | | | (38,732 | ) |
3 Month Eurodollar | | | 97.00 USD | | | | 06/17/2024 | | | | 8 | | | | 1,919,400 | | | | 6,650 | | | | 7,603 | | | | (953 | ) |
3 Month Eurodollar | | | 97.50 USD | | | | 06/17/2024 | | | | 40 | | | | 9,597,000 | | | | 22,750 | | | | 53,230 | | | | (30,480 | ) |
3 Month Eurodollar | | | 97.00 USD | | | | 09/16/2024 | | | | 12 | | | | 2,887,200 | | | | 13,275 | | | | 15,853 | | | | (2,578 | ) |
3 Month Eurodollar | | | 95.00 USD | | | | 09/16/2024 | | | | 4 | | | | 962,400 | | | | 15,100 | | | | 15,909 | | | | (809 | ) |
3 Month Eurodollar | | | 97.00 USD | | | | 12/16/2024 | | | | 21 | | | | 5,061,000 | | | | 28,481 | | | | 33,277 | | | | (4,796 | ) |
3 Month Eurodollar | | | 97.00 USD | | | | 03/17/2025 | | | | 18 | | | | 4,341,825 | | | | 27,563 | | | | 32,449 | | | | (4,886 | ) |
3 Month Eurodollar | | | 95.88 USD | | | | 09/18/2023 | | | | 12 | | | | 2,847,750 | | | | 3,525 | | | | 30,603 | | | | (27,078 | ) |
3 Month Eurodollar | | | 95.88 USD | | | | 06/20/2023 | | | | 12 | | | | 2,845,050 | | | | 1,275 | | | | 24,853 | | | | (23,578 | ) |
3 Month Eurodollar | | | 95.88 USD | | | | 03/13/2023 | | | | 8 | | | | 1,898,500 | | | | 300 | | | | 14,244 | | | | (13,944 | ) |
3 Month Eurodollar | | | 95.13 USD | | | | 03/18/2024 | | | | 5 | | | | 1,195,000 | | | | 10,719 | | | | 15,824 | | | | (5,105 | ) |
3 Month Eurodollar | | | 95.13 USD | | | | 06/17/2024 | | | | 5 | | | | 1,199,625 | | | | 14,812 | | | | 18,261 | | | | (3,449 | ) |
3 Month Eurodollar | | | 95.13 USD | | | | 09/16/2024 | | | | 5 | | | | 1,203,000 | | | | 17,750 | | | | 20,262 | | | | (2,512 | ) |
3 Month Eurodollar | | | 94.88 USD | | | | 06/17/2024 | | | | 4 | | | | 959,700 | | | | 13,500 | | | | 14,034 | | | | (534 | ) |
3 Month Eurodollar | | | 97.75 USD | | | | 03/13/2023 | | | | 7 | | | | 1,661,188 | | | | 44 | | | | 19,248 | | | | (19,204 | ) |
3 Month Eurodollar | | | 97.75 USD | | | | 06/19/2023 | | | | 4 | | | | 948,350 | | | | 125 | | | | 16,312 | | | | (16,187 | ) |
| | | | | | | |
| TOTAL | | | | | | | | | | | | | | $ | 60,285,676 | | | $ | 240,288 | | | $ | 464,737 | | | $ | (224,449 | ) |
| | |
| 14 | | The accompanying notes are an integral part of these financial statements. |
GOLDMAN SACHS VARIABLE INSURANCE TRUST TREND DRIVEN ALLOCATION FUND
Schedule of Investments
December 31, 2022
| | | | | | | | |
| Shares | | |
Description | | Value | |
|
| Exchange Traded Funds – 25.1% | |
| | 90,765 | | | iShares Core S&P 500 ETF | | $ | 34,872,821 | |
| | 91,600 | | | Vanguard S&P 500 ETF | | | 32,182,744 | |
| | |
| | TOTAL EXCHANGE TRADED FUNDS | |
| | (Cost $50,719,973) | | $ | 67,055,565 | |
| | |
| | | | | | | | |
| | | | | | | | |
| Shares | | Dividend
Rate | | | Value | |
|
| Investment Companies (Institutional Shares)(a) – 50.2% | |
Goldman Sachs Financial Square Government Fund | |
| 53,931,471 | | | 4.138 | % | | $ | 53,931,471 | |
Goldman Sachs Financial Square Treasury Instruments Fund | |
| 26,776,391 | | | 3.932 | | | | 26,776,391 | |
Goldman Sachs Financial Square Treasury Obligations Fund | |
| 26,777,206 | | | 4.144 | | | | 26,777,206 | |
Goldman Sachs Financial Square Treasury Solutions Fund | |
| 26,776,391 | | | 4.127 | | | | 26,776,391 | |
| |
| TOTAL INVESTMENT COMPANIES | |
| (Cost $134,261,459) | | | $ | 134,261,459 | |
| |
| TOTAL INVESTMENTS – 75.3% | |
| (Cost $184,981,432) | | | $ | 201,317,024 | |
| |
OTHER ASSETS IN EXCESS OF LIABILITIES – 24.7% | | | | 66,122,451 | |
| |
| NET ASSETS – 100.0% | | | $ | 267,439,475 | |
| |
| | |
| The percentage shown for each investment category reflects the value of investments in that category as a percentage of net assets. |
| |
| (a) | | Represents an affiliated issuer. |
ADDITIONAL INVESTMENT INFORMATION
FUTURES CONTRACTS — As of December 31, 2022, the Fund had the following futures contracts:
| | | | | | | | | | | | | | | | |
| Description | | Number of
Contracts | | | Expiration
Date | | | Notional
Amount | | | Unrealized
Appreciation/
(Depreciation) | |
| | | | |
Long position contracts: | | | | | | | | | | | | | | | | |
| EURO STOXX 50 Index | | | 461 | | | | 03/17/23 | | | $ | 18,678,133 | | | $ | (945,697 | ) |
| FTSE 100 Index | | | 101 | | | | 03/17/23 | | | | 9,116,282 | | | | (42,644 | ) |
| S&P 500 E-Mini Index | | | 407 | | | | 03/17/23 | | | | 78,571,350 | | | | (3,064,189 | ) |
| TOPIX Index | | | 85 | | | | 03/09/23 | | | | 12,250,648 | | | | (307,791 | ) |
U.S. Treasury 10 Year Note | | | 728 | | | | 03/22/23 | | | | 81,638,375 | | | | (882,879 | ) |
| | | | |
| Total Futures Contracts | | | | | | | | | | | | | | $ | (5,243,200 | ) |
| | |
| The accompanying notes are an integral part of these financial statements. | | 15 |
GOLDMAN SACHS VARIABLE INSURANCE TRUST MULTI-ASSET STRATEGIES FUNDS
Statements of Assets and Liabilities
December 31, 2022
| | | | | | | | |
| | | Multi-Strategy
Alternatives Portfolio | | | Trend Driven
Allocation Fund | |
| | | | | | | | |
| Assets: | | | | | | |
Investments in unaffiliated issuers, at value (cost $— and $50,719,973, respectively) | | $ | — | | | $ | 67,055,565 | |
Investments in affiliated issuers, at value (cost $36,887,289 and $134,261,459, respectively)(a) | | | 36,118,015 | | | | 134,261,459 | |
Investments in affiliated securities lending reinvestment vehicle, at value which equals cost | | | 911,315 | | | | — | |
Purchased Options, at value (premiums paid $464,737 and $—, respectively) | | | 240,288 | | | | — | |
Cash | | | 559,127 | | | | 57,473,870 | |
Foreign currency, at value (cost $— and $201,779, respectively) | | | — | | | | 205,391 | |
Receivables: | | | | | | | | |
Collateral on future contracts | | | 41,600 | | | | — | |
Dividends | | | 13,152 | | | | 260,244 | |
Fund shares sold | | | 13,070 | | | | 30,372 | |
Securities lending income | | | 551 | | | | — | |
Due from broker | | | — | | | | 9,474,089 | |
Reimbursement from investment adviser | | | 17,042 | | | | 22,459 | |
Unrealized gain on forward foreign currency exchange contracts | | | 383 | | | | — | |
Other assets | | | 67 | | | | 96 | |
| | |
| Total assets | | | 37,914,610 | | | | 268,783,545 | |
| | | | | | | | |
| | | | | | | | |
| Liabilities: | | | | | | |
Variation margin on futures contracts | | | 9,008 | | | | 957,607 | |
Unrealized loss on forward foreign currency exchange contracts | | | 533 | | | | — | |
Payables: | | | | | | | | |
Payable upon return of securities loaned | | | 911,315 | | | | — | |
Fund shares redeemed | | | 73,669 | | | | 74,511 | |
Distribution and Service fees and Transfer Agency fees | | | 67,313 | | | | 69,505 | |
Management fees | | | 4,708 | | | | 147,680 | |
Accrued expenses | | | 88,874 | | | | 94,767 | |
| | |
| Total liabilities | | | 1,155,420 | | | | 1,344,070 | |
| | | | | | | | |
| | | | | | | | |
| Net Assets: | | | | | | |
Paid-in capital | | | 41,049,722 | | | | 299,892,684 | |
Total distributable earnings (loss) | | | (4,290,532 | ) | | | (32,453,209 | ) |
| | |
| NET ASSETS | | $ | 36,759,190 | | | $ | 267,439,475 | |
Net Assets: | | | | | | | | |
Advisor | | $ | 23,200,142 | | | $ | — | |
Institutional | | | 2,203,322 | | | | 505,791 | |
Service | | | 11,355,726 | | | | 266,933,684 | |
| | |
Total Net Assets | | $ | 36,759,190 | | | $ | 267,439,475 | |
Shares outstanding $0.001 par value (unlimited number of shares authorized): | | | | | | | | |
Advisor | | | 2,646,539 | | | | — | |
Institutional | | | 250,158 | | | | 50,281 | |
Service | | | 1,288,333 | | | | 26,726,720 | |
Net asset value, offering and redemption price per share: | | | | | | | | |
Advisor | | | $8.77 | | | | $— | |
Institutional | | | 8.81 | | | | 10.06 | |
Service | | | 8.81 | | | | 9.99 | |
(a) Includes loaned securities having a market value of $882,191 and $–, respectively.
| | |
| 16 | | The accompanying notes are an integral part of these financial statements. |
GOLDMAN SACHS VARIABLE INSURANCE TRUST MULTI-ASSET STRATEGIES FUNDS
Statements of Operations
For the Fiscal Year Ended December 31, 2022
| | | | | | | | |
| | | Multi-Strategy
Alternatives Portfolio | | | Trend Driven
Allocation Fund | |
| | | | | | | | |
| Investment income: | | | | | | |
Dividends — affiliated Underlying Funds | | $ | 1,752,128 | | | $ | 2,206,619 | |
Dividends — unaffiliated issuers | | | 21,433 | | | | 931,651 | |
Securities lending income — affiliated issuer | | | 1,127 | | | | 6,390 | |
| | |
| Total investment income | | | 1,774,688 | | | | 3,144,660 | |
| | | | | | | | |
| | | | | | | | |
| Expenses: | | | | | | |
Distribution and/or Service (12b-1) fees(a) | | | 131,264 | | | | 752,332 | |
Professional fees | | | 94,179 | | | | 181,377 | |
Custody, accounting and administrative services | | | 71,454 | | | | 64,360 | |
Management fees | | | 63,034 | | | | 2,381,158 | |
Trustee fees | | | 27,295 | | | | 35,263 | |
Printing and mailing costs | | | 13,053 | | | | 37,779 | |
Transfer Agency fees(a) | | | 8,405 | | | | 60,282 | |
Other | | | 1,509 | | | | 5,884 | |
| | |
| Total expenses | | | 410,193 | | | | 3,518,435 | |
| | |
Less — expense reductions | | | (194,634 | ) | | | (778,094 | ) |
| | |
| Net expenses | | | 215,559 | | | | 2,740,341 | |
| | |
| NET INVESTMENT INCOME | | | 1,559,129 | | | | 404,319 | |
| | | | | | | | |
| | | | | | | | |
| Realized and unrealized gain (loss): | | | | | | |
Net realized gain (loss) from: | | | | | | | | |
Investments — unaffiliated issuers | | | 430,726 | | | | 4,646,782 | |
Investments — affiliated Underlying Funds | | | (3,366,417 | ) | | | — | |
Futures contracts | | | (552,257 | ) | | | (37,545,427 | ) |
Purchased options | | | (267,112 | ) | | �� | — | |
Foreign currency transactions | | | 11,413 | | | | (1,072,748 | ) |
Net change in unrealized gain (loss) on: | | | | | | | | |
Investments — unaffiliated issuers | | | — | | | | (25,809,077 | ) |
Investments — affiliated Underlying Funds | | | (1,125,104 | ) | | | — | |
Futures contracts | | | (27,832 | ) | | | (8,086,440 | ) |
Purchased Options | | | (168,602 | ) | | | — | |
Forward foreign currency exchange contracts | | | (150 | ) | | | — | |
Foreign currency translations | | | 6,564 | | | | 1,180,323 | |
| | |
| Net realized and unrealized loss | | | (5,058,772 | ) | | | (66,686,587 | ) |
| | |
| NET DECREASE IN NET ASSETS RESULTING FROM OPERATIONS | | $ | (3,499,642 | ) | | $ | (66,282,268 | ) |
(a) Class specific Distribution and/or Service and Transfer Agency fees were as follows:
| | | | | | | | | | | | | | | | | | | | |
| | | Distribution and/or
Service (12b-1) Fees | | | Transfer Agency Fees | |
Fund | | Advisor | | | Service | | | Advisor | | | Institutional | | | Service | |
Multi-Strategy Alternatives Portfolio | | $ | 85,620 | | | $ | 45,644 | | | $ | 4,281 | | | $ | 472 | | | $ | 3,652 | |
Trend Driven Allocation Fund | | | — | | | | 752,332 | | | | — | | | | 96 | | | | 60,186 | |
| | |
| The accompanying notes are an integral part of these financial statements. | | 17 |
GOLDMAN SACHS VARIABLE INSURANCE TRUST MULTI-ASSET STRATEGIES FUNDS
Statements of Changes in Net Assets
| | | | | | | | | | | | | | | | |
| | | Multi-Strategy Alternatives Portfolio | | | Trend Driven Allocation Fund | |
| | | For the
Fiscal Year Ended
December 31, 2022 | | | For the
Fiscal Year Ended
December 31, 2021 | | | For the
Fiscal Year Ended
December 31, 2022 | | | For the
Fiscal Year Ended
December 31, 2021 | |
| | | | | | | | | | | | | | | | |
| From operations: | | | | | | | | | | | | |
Net investment income (loss) | | $ | 1,559,129 | | | $ | 519,664 | | | $ | 404,319 | | | $ | (2,029,491 | ) |
Net realized gain (loss) | | | (3,743,647 | ) | | | 460,329 | | | | (33,971,393 | ) | | | 44,004,366 | |
Net change in unrealized gain (loss) | | | (1,315,124 | ) | | | 137,496 | | | | (32,715,194 | ) | | | 10,247,601 | |
| | | | |
| Net increase (decrease) in net assets resulting from operations | | | (3,499,642 | ) | | | 1,117,489 | | | | (66,282,268 | ) | | | 52,222,476 | |
| | | | | | | | | | | | | | | | |
| | | | | | | | | | | | | | | | |
| Distributions to shareholders: | | | | | | | | | | | | |
From distributable earnings: | | | | | | | | | | | | | | | | |
Advisor Shares | | | (806,855 | ) | | | (268,995 | ) | | | — | | | | — | |
Institutional Shares | | | (84,430 | ) | | | (41,966 | ) | | | (20,604 | ) | | | (40,198 | ) |
Service Shares | | | (388,859 | ) | | | (96,854 | ) | | | (10,871,371 | ) | | | (43,019,719 | ) |
| | | | |
| Total distributions to shareholders | | | (1,280,144 | ) | | | (407,815 | ) | | | (10,891,975 | ) | | | (43,059,917 | ) |
| | | | | | | | | | | | | | | | |
| | | | | | | | | | | | | | | | |
| From share transactions: | | | | | | | | | | | | |
Proceeds from sales of shares | | | 76,038,713 | | | | 9,602,512 | | | | 25,924,207 | | | | 16,311,964 | |
Reinvestment of distributions | | | 1,280,144 | | | | 407,815 | | | | 10,891,975 | | | | 43,059,917 | |
Cost of shares redeemed | | | (65,417,529 | ) | | | (3,772,014 | ) | | | (49,855,165 | ) | | | (46,955,103 | ) |
| | | | |
| Net increase (decrease) in net assets resulting from share transactions | | | 11,901,328 | | | | 6,238,313 | | | | (13,038,983 | ) | | | 12,416,778 | |
| | | | |
| TOTAL INCREASE (DECREASE) | | | 7,121,542 | | | | 6,947,987 | | | | (90,213,226 | ) | | | 21,579,337 | |
| | | | | | | | | | | | | | | | |
| | | | | | | | | | | | | | | | |
| Net Assets: | | | | | | | | | | | | |
| | | | |
Beginning of year | | | 29,637,648 | | | | 22,689,661 | | | | 357,652,701 | | | | 336,073,364 | |
| | | | |
End of year | | $ | 36,759,190 | | | $ | 29,637,648 | | | $ | 267,439,475 | | | $ | 357,652,701 | |
| | |
| 18 | | The accompanying notes are an integral part of these financial statements. |
GOLDMAN SACHS VARIABLE INSURANCE TRUST MULTI-STRATEGY ALTERNATIVES PORTFOLIO
Financial Highlights
Selected Data for a Share Outstanding Throughout Each Year
| | | | | | | | | | | | | | | | | | | | |
| | | Goldman Sachs Multi-Strategy Alternatives Portfolio | |
| | | Institutional Shares | |
| | | Year Ended December 31, | |
| | 2022 | | | 2021 | | | 2020 | | | 2019 | | | 2018 | |
| | | | | | | | | | | | | | | | | | | | |
| Per Share Data | | | | | | | | | | | | | | | |
| | | | | |
Net asset value, beginning of year | | $ | 9.77 | | | $ | 9.46 | | | $ | 9.02 | | | $ | 8.51 | | | $ | 9.39 | |
| | | | | |
Net investment income(a)(b) | | | 0.38 | | | | 0.23 | | | | 0.25 | | | | 0.30 | | | | 0.24 | |
| | | | | |
Net realized and unrealized gain (loss) | | | (0.99 | ) | | | 0.25 | | | | 0.39 | | | | 0.48 | | | | (0.87 | ) |
| | | | | |
Total from investment operations | | | (0.61 | ) | | | 0.48 | | | | 0.64 | | | | 0.78 | | | | (0.63 | ) |
| | | | | |
Distributions to shareholders from net investment income | | | (0.35 | ) | | | (0.17 | ) | | | (0.20 | ) | | | (0.27 | ) | | | (0.25 | ) |
| | | | | |
Net asset value, end of year | | $ | 8.81 | | | $ | 9.77 | | | $ | 9.46 | | | $ | 9.02 | | | $ | 8.51 | |
| | | | | |
Total Return(c) | | | (6.24 | )% | | | 5.03 | % | | | 7.05 | % | | | 9.11 | % | | | (6.74 | )% |
| | | | | |
Net assets, end of year (in 000’s) | | $ | 2,203 | | | $ | 2,515 | | | $ | 1,520 | | | $ | 1,309 | | | $ | 745 | |
| | | | | |
Ratio of net expenses to average net assets(d) | | | 0.20 | % | | | 0.22 | % | | | 0.21 | % | | | 0.25 | % | | | 0.22 | % |
| | | | | |
Ratio of total expenses to average net assets(d) | | | 0.69 | % | | | 1.02 | % | | | 1.39 | % | | | 1.60 | % | | | 1.57 | % |
| | | | | |
Ratio of net investment income to average net assets | | | 4.08 | % | | | 2.29 | % | | | 2.73 | % | | | 3.30 | % | | | 2.62 | % |
| | | | | |
Portfolio turnover rate(e) | | | 199 | % | | | 25 | % | | | 5 | % | | | 26 | % | | | 61 | % |
| (a) | Calculated based on the average shares outstanding methodology. |
| (b) | Recognition of net investment income by the Portfolio is affected by the timing of declaration of dividends by the Underlying Funds in which the Portfolio invests. |
| (c) | Assumes investment at the NAV at the beginning of the year, reinvestment of all dividends and distributions, a complete redemption of the investment at the NAV at the end of the year and no sales or redemption charges (if any). Total returns would be reduced if a sales or redemption charge was taken into account. Returns do not reflect the impact of taxes to shareholders relating to Fund distributions or the redemption of Fund shares. |
| (d) | Expense ratios exclude the expenses of the Underlying Funds in which the Portfolio invests. |
| (e) | The Fund’s portfolio turnover rate is calculated in accordance with regulatory requirements, without regard to transactions involving short term investments and certain derivatives. If such transactions were included, the Fund’s portfolio turnover rate may be higher. |
| | |
| The accompanying notes are an integral part of these financial statements. | | 19 |
GOLDMAN SACHS VARIABLE INSURANCE TRUST MULTI-STRATEGY ALTERNATIVES PORTFOLIO
Financial Highlights (continued)
Selected Data for a Share Outstanding Throughout Each Year
| | | | | | | | | | | | | | | | | | | | |
| | | Goldman Sachs Multi-Strategy Alternatives Portfolio | |
| | | Service Shares | |
| | | Year Ended December 31, | |
| | 2022 | | | 2021 | | | 2020 | | | 2019 | | | 2018 | |
| | | | | | | | | | | | | | | | | | | | |
| Per Share Data | | | | | | | | | | | | | | | |
| | | | | |
Net asset value, beginning of year | | $ | 9.76 | | | $ | 9.45 | | | $ | 9.02 | | | $ | 8.52 | | | $ | 9.41 | |
| | | | | |
Net investment income(a)(b) | | | 0.31 | | | | 0.20 | | | | 0.23 | | | | 0.32 | | | | 0.28 | |
| | | | | |
Net realized and unrealized gain (loss) | | | (0.95 | ) | | | 0.26 | | | | 0.38 | | | | 0.43 | | | | (0.93 | ) |
| | | | | |
Total from investment operations | | | (0.64 | ) | | | 0.46 | | | | 0.61 | | | | 0.75 | | | | (0.65 | ) |
| | | | | |
Distributions to shareholders from net investment income | | | (0.31 | ) | | | (0.15 | ) | | | (0.18 | ) | | | (0.25 | ) | | | (0.24 | ) |
| | | | | |
Net asset value, end of year | | $ | 8.81 | | | $ | 9.76 | | | $ | 9.45 | | | $ | 9.02 | | | $ | 8.52 | |
| | | | | |
Total Return(c) | | | (6.54 | )% | | | 4.84 | % | | | 6.70 | % | | | 8.82 | % | | | (6.93 | )% |
| | | | | |
Net assets, end of year (in 000’s) | | $ | 11,356 | | | $ | 6,538 | | | $ | 3,472 | | | $ | 2,857 | | | $ | 811 | |
| | | | | |
Ratio of net expenses to average net assets(d) | | | 0.45 | % | | | 0.47 | % | | | 0.46 | % | | | 0.51 | % | | | 0.47 | % |
| | | | | |
Ratio of total expenses to average net assets(d) | | | 0.88 | % | | | 1.28 | % | | | 1.65 | % | | | 1.86 | % | | | 1.95 | % |
| | | | | |
Ratio of net investment income to average net assets | | | 3.34 | % | | | 2.04 | % | | | 2.51 | % | | | 3.54 | % | | | 3.08 | % |
| | | | | |
Portfolio turnover rate(e) | | | 199 | % | | | 25 | % | | | 5 | % | | | 26 | % | | | 61 | % |
| (a) | Calculated based on the average shares outstanding methodology. |
| (b) | Recognition of net investment income by the Portfolio is affected by the timing of declaration of dividends by the Underlying Funds in which the Portfolio invests. |
| (c) | Assumes investment at the NAV at the beginning of the year, reinvestment of all dividends and distributions, a complete redemption of the investment at the NAV at the end of the year and no sales or redemption charges (if any). Total returns would be reduced if a sales or redemption charge was taken into account. Returns do not reflect the impact of taxes to shareholders relating to Fund distributions or the redemption of Fund shares. |
| (d) | Expense ratios exclude the expenses of the Underlying Funds in which the Portfolio invests. |
| (e) | The Fund’s portfolio turnover rate is calculated in accordance with regulatory requirements, without regard to transactions involving short term investments and certain derivatives. If such transactions were included, the Fund’s portfolio turnover rate may be higher. |
| | |
| 20 | | The accompanying notes are an integral part of these financial statements. |
GOLDMAN SACHS VARIABLE INSURANCE TRUST MULTI-STRATEGY ALTERNATIVES PORTFOLIO
Financial Highlights (continued)
Selected Data for a Share Outstanding Throughout Each Year
| | | | | | | | | | | | | | | | | | | | |
| | | Goldman Sachs Multi-Strategy Alternatives Portfolio | |
| | | Advisor Shares | |
| | | Year Ended December 31, | |
| | 2022 | | | 2021 | | | 2020 | | | 2019 | | | 2018 | |
| | | | | | | | | | | | | | | | | | | | |
| Per Share Data | | | | | | | | | | | | | | | |
| | | | | |
Net asset value, beginning of year | | $ | 9.73 | | | $ | 9.42 | | | $ | 8.99 | | | $ | 8.49 | | | $ | 9.36 | |
| | | | | |
Net investment income(a)(b) | | | 0.37 | | | | 0.18 | | | | 0.20 | | | | 0.24 | | | | 0.17 | |
| | | | | |
Net realized and unrealized gain (loss) | | | (1.01 | ) | | | 0.26 | | | | 0.39 | | | | 0.49 | | | | (0.83 | ) |
| | | | | |
Total from investment operations | | | (0.64 | ) | | | 0.44 | | | | 0.59 | | | | 0.73 | | | | (0.66 | ) |
| | | | | |
Distributions to shareholders from net investment income | | | (0.32 | ) | | | (0.13 | ) | | | (0.16 | ) | | | (0.23 | ) | | | (0.21 | ) |
| | | | | |
Net asset value, end of year | | $ | 8.77 | | | $ | 9.73 | | | $ | 9.42 | | | $ | 8.99 | | | $ | 8.49 | |
| | | | | |
Total Return(c) | | | (6.61 | )% | | | 4.66 | % | | | 6.56 | % | | | 8.60 | % | | | (7.09 | )% |
| | | | | |
Net assets, end of year (in 000’s) | | $ | 23,200 | | | $ | 20,585 | | | $ | 17,698 | | | $ | 15,410 | | | $ | 13,460 | |
| | | | | |
Ratio of net expenses to average net assets(d) | | | 0.60 | % | | | 0.62 | % | | | 0.61 | % | | | 0.64 | % | | | 0.62 | % |
| | | | | |
Ratio of total expenses to average net assets(d) | | | 1.09 | % | | | 1.44 | % | | | 1.79 | % | | | 2.01 | % | | | 1.93 | % |
| | | | | |
Ratio of net investment income to average net assets | | | 3.99 | % | | | 1.89 | % | | | 2.28 | % | | | 2.61 | % | | | 1.92 | % |
| | | | | |
Portfolio turnover rate(e) | | | 199 | % | | | 25 | % | | | 5 | % | | | 26 | % | | | 61 | % |
| (a) | Calculated based on the average shares outstanding methodology. |
| (b) | Recognition of net investment income by the Portfolio is affected by the timing of declaration of dividends by the Underlying Funds in which the Portfolio invests. |
| (c) | Assumes investment at the NAV at the beginning of the year, reinvestment of all dividends and distributions, a complete redemption of the investment at the NAV at the end of the year and no sales or redemption charges (if any). Total returns would be reduced if a sales or redemption charge was taken into account. Returns do not reflect the impact of taxes to shareholders relating to Fund distributions or the redemption of Fund shares. |
| (d) | Expense ratios exclude the expenses of the Underlying Funds in which the Portfolio invests. |
| (e) | The Fund’s portfolio turnover rate is calculated in accordance with regulatory requirements, without regard to transactions involving short term investments and certain derivatives. If such transactions were included, the Fund’s portfolio turnover rate may be higher. |
| | |
| The accompanying notes are an integral part of these financial statements. | | 21 |
GOLDMAN SACHS VARIABLE INSURANCE TRUST TREND DRIVEN ALLOCATION FUND
Financial Highlights (continued)
Selected Data for a Share Outstanding Throughout Each Year
| | | | | | | | | | | | | | | | | | | | |
| | | Goldman Sachs Trend Driven Allocation Fund | |
| | | Institutional Shares | |
| | | Year Ended December 31, | |
| | 2022 | | | 2021 | | | 2020 | | | 2019 | | | 2018 | |
| | | | | | | | | | | | | | | | | | | | |
| Per Share Data | | | | | | | | | | | | | | | |
| | | | | |
Net asset value, beginning of year | | $ | 12.92 | | | $ | 12.61 | | | $ | 12.32 | | | $ | 11.65 | | | $ | 12.46 | |
| | | | | |
Net investment income (loss)(a) | | | 0.07 | | | | (0.04 | ) | | | 0.02 | | | | 0.15 | | | | 0.14 | |
| | | | | |
Net realized and unrealized gain (loss) | | | (2.51 | ) | | | 2.10 | | | | 0.52 | | | | 1.28 | | | | (0.64 | ) |
| | | | | |
Total from investment operations | | | (2.44 | ) | | | 2.06 | | | | 0.54 | | | | 1.43 | | | | (0.50 | ) |
| | | | | |
Distributions to shareholders from net investment income | | | — | | | | — | | | | (0.07 | ) | | | (0.22 | ) | | | (0.12 | ) |
| | | | | |
Distributions to shareholders from net realized gains | | | (0.42 | ) | | | (1.75 | ) | | | (0.18 | ) | | | (0.54 | ) | | | (0.19 | ) |
| | | | | |
Total distributions | | | (0.42 | ) | | | (1.75 | ) | | | (0.25 | ) | | | (0.76 | ) | | | (0.31 | ) |
| | | | | |
Net asset value, end of year | | $ | 10.06 | | | $ | 12.92 | | | $ | 12.61 | | | $ | 12.32 | | | $ | 11.65 | |
| | | | | |
Total Return(b) | | | (19.00 | )% | | | 16.46 | % | | | 4.35 | % | | | 12.29 | % | | | (4.08 | )% |
| | | | | |
Net assets, end of year (in 000’s) | | $ | 506 | | | $ | 337 | | | $ | 289 | | | $ | 277 | | | $ | 247 | |
| | | | | |
Ratio of net expenses to average net assets | | | 0.66 | % | | | 0.65 | % | | | 0.60 | % | | | 0.59 | % | | | 0.51 | % |
| | | | | |
Ratio of total expenses to average net assets | | | 0.92 | % | | | 0.87 | % | | | 0.90 | % | | | 0.89 | % | | | 0.86 | % |
| | | | | |
Ratio of net investment income (loss) to average net assets | | | 0.63 | % | | | (0.32 | )% | | | 0.13 | % | | | 1.18 | % | | | 1.13 | % |
| | | | | |
Portfolio turnover rate(c) | | | 344 | % | | | 12 | % | | | 168 | % | | | 61 | % | | | 60 | % |
| (a) | Calculated based on the average shares outstanding methodology. |
| (b) | Assumes investment at the NAV at the beginning of the year, reinvestment of all dividends and distributions, a complete redemption of the investment at the NAV at the end of the year and no sales or redemption charges (if any). Total returns would be reduced if a sales or redemption charge was taken into account. Returns do not reflect the impact of taxes to shareholders relating to Fund distributions or the redemption of Fund shares. |
| (c) | The Fund’s portfolio turnover rate is calculated in accordance with regulatory requirements, without regard to transactions involving short term investments and certain derivatives. If such transactions were included, the Fund’s portfolio turnover rate may be higher. |
| | |
| 22 | | The accompanying notes are an integral part of these financial statements. |
GOLDMAN SACHS VARIABLE INSURANCE TRUST TREND DRIVEN ALLOCATION FUND
Financial Highlights (continued)
Selected Data for a Share Outstanding Throughout Each Year
| | | | | | | | | | | | | | | | | | | | |
| | | Goldman Sachs Trend Driven Allocation Fund | |
| | | Service Shares | |
| | | Year Ended December 31, | |
| | 2022 | | | 2021 | | | 2020 | | | 2019 | | | 2018 | |
| | | | | | | | | | | | | | | | | | | | |
| Per Share Data | | | | | | | | | | | | | | | |
| | | | | |
Net asset value, beginning of year | | $ | 12.86 | | | $ | 12.59 | | | $ | 12.30 | | | $ | 11.64 | | | $ | 12.45 | |
| | | | | |
Net investment income (loss)(a) | | | 0.02 | | | | (0.08 | ) | | | (0.01 | ) | | | 0.11 | | | | 0.08 | |
| | | | | |
Net realized and unrealized gain (loss) | | | (2.47 | ) | | | 2.10 | | | | 0.51 | | | | 1.28 | | | | (0.62 | ) |
| | | | | |
Total from investment operations | | | (2.45 | ) | | | 2.02 | | | | 0.50 | | | | 1.39 | | | | (0.54 | ) |
| | | | | |
Distributions to shareholders from net investment income | | | — | | | | — | | | | (0.03 | ) | | | (0.19 | ) | | | (0.08 | ) |
| | | | | |
Distributions to shareholders from net realized gains | | | (0.42 | ) | | | (1.75 | ) | | | (0.18 | ) | | | (0.54 | ) | | | (0.19 | ) |
| | | | | |
Total distributions | | | (0.42 | ) | | | (1.75 | ) | | | (0.21 | ) | | | (0.73 | ) | | | (0.27 | ) |
| | | | | |
Net asset value, end of year | | $ | 9.99 | | | $ | 12.86 | | | $ | 12.59 | | | $ | 12.30 | | | $ | 11.64 | |
| | | | | |
Total Return(b) | | | (19.16 | )% | | | 16.17 | % | | | 4.10 | % | | | 11.94 | % | | | (4.34 | )% |
| | | | | |
Net assets, end of year (in 000’s) | | $ | 266,934 | | | $ | 357,316 | | | $ | 335,784 | | | $ | 345,219 | | | $ | 395,842 | |
| | | | | |
Ratio of net expenses to average net assets | | | 0.91 | % | | | 0.92 | % | | | 0.85 | % | | | 0.84 | % | | | 0.81 | % |
| | | | | |
Ratio of total expenses to average net assets | | | 1.17 | % | | | 1.14 | % | | | 1.15 | % | | | 1.14 | % | | | 1.11 | % |
| | | | | |
Ratio of net investment income (loss) to average net assets | | | 0.13 | % | | | (0.58 | )% | | | (0.12 | )% | | | 0.91 | % | | | 0.63 | % |
| | | | | |
Portfolio turnover rate(c) | | | 344 | % | | | 12 | % | | | 168 | % | | | 61 | % | | | 60 | % |
| (a) | Calculated based on the average shares outstanding methodology. |
| (b) | Assumes investment at the NAV at the beginning of the year, reinvestment of all dividends and distributions, a complete redemption of the investment at the NAV at the end of the year and no sales or redemption charges (if any). Total returns would be reduced if a sales or redemption charge was taken into account. Returns do not reflect the impact of taxes to shareholders relating to Fund distributions or the redemption of Fund shares. |
| (c) | The Fund’s portfolio turnover rate is calculated in accordance with regulatory requirements, without regard to transactions involving short term investments and certain derivatives. If such transactions were included, the Fund’s portfolio turnover rate may be higher. |
| | |
| The accompanying notes are an integral part of these financial statements. | | 23 |
GOLDMAN SACHS VARIABLE INSURANCE TRUST MULTI-ASSET STRATEGIES FUNDS
Notes to Financial Statements
December 31, 2022
1. ORGANIZATION
Goldman Sachs Variable Insurance Trust (the “Trust” or “VIT”) is a Delaware statutory trust registered under the Investment Company Act of 1940, as amended (the “Act”), as an open-end management investment company. The following table lists those series of the Trust that are included in this report (collectively, the “Funds” or individually a “Fund”), along with their corresponding share classes and respective diversification status under the Act:
| | | | |
| Fund | | Share Classes Offered | | Diversified/ Non-diversified |
Multi-Strategy Alternatives | | Institutional, Service and Advisor | | Diversified |
Trend Driven Allocation | | Institutional and Service | | Diversified |
Goldman Sachs Asset Management, L.P. (“GSAM”), an affiliate of Goldman Sachs & Co. LLC (“Goldman Sachs”), serves as investment adviser to the Funds pursuant to management agreements (the “Agreements”) with the Trust.
The Multi-Strategy Alternatives Portfolio invests primarily in a combination of domestic and international equity and fixed income underlying funds (“Underlying Funds”) which are registered under the Act, for which GSAM acts as investment adviser. Additionally, the Multi-Strategy Alternatives Portfolio may invest a portion of its assets directly in other securities and instruments, including unaffiliated exchange traded funds (“Unaffiliated Funds”). The Trend Driven Allocation Fund may invest in one or a combination of the following securities and instruments: pooled investment vehicles, including exchange-traded funds (“ETFs”) and other investment companies; equity securities of U.S. and non-U.S. issuers; U.S. fixed income securities; and derivatives that provide exposure to a broad spectrum of asset classes and geographic regions.
2. SIGNIFICANT ACCOUNTING POLICIES
The financial statements have been prepared in accordance with accounting principles generally accepted in the United States of America (“GAAP”) and require management to make estimates and assumptions that may affect the reported amounts and disclosures. Actual results may differ from those estimates and assumptions. Each Fund is an investment company under GAAP and follows the accounting and reporting guidance applicable to investment companies.
A. Investment Valuation — The valuation policy of the Funds and Underlying Funds is to value investments at fair value.
B. Investment Income and Investments — Investment income includes interest income, dividend income, and securities lending income, if any. Interest income is accrued daily and adjusted for amortization of premiums and accretion of discounts. Dividend income is recognized on ex-dividend date or, for certain foreign securities, as soon as such information is obtained subsequent to the ex-dividend date. Non-cash dividends, if any, are recorded at the fair market value of the securities received. Investment transactions are reflected on trade date. Realized gains and losses are calculated using identified cost. Investment transactions are recorded on the following business day for daily net asset value (“NAV”) calculations. Investment income is recorded net of any foreign withholding taxes, less any amounts reclaimable. The Funds may file withholding tax reclaims in certain jurisdictions to recover a portion of amounts previously withheld.
For derivative contracts, unrealized gains and losses are recorded daily and become realized gains and losses upon disposition or termination of the contract.
C. Class Allocations and Expenses — Investment income, realized and unrealized gain (loss), if any, and non-class specific expenses of each Fund are allocated daily based upon the proportion of net assets of each class. Non-class specific expenses directly incurred by a Fund are charged to that Fund, while such expenses incurred by the Trust are allocated across the applicable Funds on a straight-line and/or pro-rata basis depending upon the nature of the expenses. Class specific expenses, where applicable, are borne by the respective share classes and include Distribution and Service and Transfer Agency fees. Expenses included in the accompanying financial statements reflect the expenses of each Fund and do not include any expenses associated with the
GOLDMAN SACHS VARIABLE INSURANCE TRUST MULTI-ASSET STRATEGIES FUNDS
2. SIGNIFICANT ACCOUNTING POLICIES (continued)
Underlying Funds. Because the Underlying Funds have varied expense and fee levels and each Fund may own different proportions of the Underlying Funds at different times, the amount of fees and expenses incurred indirectly by the Funds will vary.
D. Federal Taxes and Distributions to Shareholders — It is each Fund’s policy to comply with the requirements of the Internal Revenue Code of 1986, as amended (the “Code”), applicable to regulated investment companies and to distribute each year substantially all of its investment company taxable income and capital gains to its shareholders. Accordingly, each Fund is not required to make any provisions for the payment of federal income tax. Distributions to shareholders are recorded on the ex-dividend date. Income and capital gains distributions, if any, are declared and paid at least annually.
Net capital losses, if any, are carried forward to future fiscal years and may be used to the extent allowed by the Code to offset any future capital gains. Losses that are carried forward will retain their character as either short-term or long-term capital losses. Utilization of capital loss carryforwards will reduce the requirement of future capital gains distributions.
The characterization of distributions to shareholders for financial reporting purposes is determined in accordance with federal income tax rules, which may differ from GAAP. The source of each Fund’s distributions may be shown in the accompanying financial statements as either from distributable earnings or capital. Certain components of the Funds’ net assets on the Statements of Assets and Liabilities reflect permanent GAAP/tax differences based on the appropriate tax character.
E. Foreign Currency Translation — The accounting records and reporting currency of a Fund are maintained in U.S. dollars. Assets and liabilities denominated in foreign currencies are translated into U.S. dollars using the current exchange rates at the close of each business day. The effect of changes in foreign currency exchange rates on investments is included within net realized and unrealized gain (loss) on investments. Changes in the value of other assets and liabilities as a result of fluctuations in foreign exchange rates are included in the Statements of Operations within net change in unrealized gain (loss) on foreign currency translation. Transactions denominated in foreign currencies are translated into U.S. dollars on the date the transaction occurred, the effects of which are included within net realized gain (loss) on foreign currency transactions.
3. INVESTMENTS AND FAIR VALUE MEASUREMENTS
U.S. GAAP defines the fair value of a financial instrument as the amount that would be received to sell an asset or paid to transfer a liability in an orderly transaction between market participants at the measurement date (i.e., the exit price); the Funds’ policy is to use the market approach. GAAP establishes a fair value hierarchy that prioritizes the inputs to valuation techniques used to measure fair value. The hierarchy gives the highest priority to unadjusted quoted prices in active markets for identical assets or liabilities (Level 1 measurements) and the lowest priority to unobservable inputs (Level 3 measurements). The level in the fair value hierarchy within which the fair value measurement in its entirety falls shall be determined based on the lowest level input that is significant to the fair value measurement in its entirety. The levels used for classifying investments are not necessarily an indication of the risk associated with investing in these investments. The three levels of the fair value hierarchy are described below:
Level 1 — Unadjusted quoted prices in active markets that are accessible at the measurement date for identical, unrestricted assets or liabilities;
Level 2 — Quoted prices in markets that are not active or financial instruments for which significant inputs are observable (including, but not limited to, quoted prices for similar investments, interest rates, foreign exchange rates, volatility and credit spreads), either directly or indirectly;
Level 3 — Prices or valuations that require significant unobservable inputs (including GSAM’s assumptions in determining fair value measurement).
The Board of Trustees (“Trustees”) has approved Valuation Procedures that govern the valuation of the portfolio investments held by the Funds, including investments for which market quotations are not readily available. With respect to the Funds’ investments that do not have readily available market quotations, the Trustees have designated the Adviser as the valuation designee to perform fair valuations pursuant to Rule 2a-5 under the Investment Company Act of 1940 (the “Valuation Designee”). GSAM has day-to-day responsibility for implementing and maintaining internal controls and procedures related to the valuation of the Funds’
GOLDMAN SACHS VARIABLE INSURANCE TRUST MULTI-ASSET STRATEGIES FUNDS
Notes to Financial Statements (continued)
December 31, 2022
3. INVESTMENTS AND FAIR VALUE MEASUREMENTS (continued)
investments. To assess the continuing appropriateness of pricing sources and methodologies, GSAM regularly performs price verification procedures and issues challenges as necessary to third party pricing vendors or brokers, and any differences are reviewed in accordance with the Valuation Procedures.
A. Level 1 and Level 2 Fair Value Investments — The valuation techniques and significant inputs used in determining the fair values for investments classified as Level 1 and Level 2 are as follows:
Equity Securities — Equity securities traded on a United States (“U.S.”) securities exchange or the NASDAQ system, or those located on certain foreign exchanges, including but not limited to the Americas, are valued daily at their last sale price or official closing price on the principal exchange or system on which they are traded. If there is no sale or official closing price or such price is believed by GSAM to not represent fair value, equity securities will be valued at the valid closing bid price for long positions and at the valid closing ask price for short positions (i.e., where there is sufficient volume, during normal exchange trading hours). If no valid bid/ask price is available, the equity security will be valued pursuant to the Valuation Procedures approved by the Trustees and consistent with applicable regulatory guidance. To the extent these investments are actively traded, they are classified as Level 1 of the fair value hierarchy, otherwise they are generally classified as Level 2. Certain equity securities containing unique attributes may be classified as Level 2.
Unlisted equity securities for which market quotations are available are valued at the last sale price on the valuation date, or if no sale occurs, at the last bid price for long positions or the last ask price for short positions, and are generally classified as Level 2. Securities traded on certain foreign securities exchanges are valued daily at fair value determined by an independent fair value service (if available) under Fair Valuation Procedures approved by the Trustees and consistent with applicable regulatory guidance. The independent fair value service takes into account multiple factors including, but not limited to, movements in the securities markets, certain depositary receipts, futures contracts and foreign currency exchange rates that have occurred subsequent to the close of the foreign securities exchange. These investments are generally classified as Level 2 of the fair value hierarchy.
Underlying Funds (including Money Market Funds) — Underlying Funds include other investment companies and exchange-traded funds (“ETFs”). Investments in the Underlying Funds (except ETFs) are valued at the NAV per share on the day of valuation. ETFs are valued daily at the last sale price or official closing price on the principal exchange or system on which the investment is traded. Because the Funds invest in Underlying Funds that fluctuate in value, each Fund’s shares will correspondingly fluctuate in value. Underlying Funds are generally classified as Level 1 of the fair value hierarchy. To the extent that underlying ETFs are actively traded, they are classified as Level 1 of the fair value hierarchy, otherwise they are generally classified as Level 2. For information regarding an Underlying Fund’s accounting policies and investment holdings, please see the Underlying Fund’s shareholder report.
Derivative Contracts — A derivative is an instrument whose value is derived from underlying assets, indices, reference rates or a combination of these factors. A Fund enters into derivative transactions to hedge against changes in interest rates, securities prices, and/or currency exchange rates, to increase total return, or to gain access to certain markets or attain exposure to other underliers. For financial reporting purposes, cash collateral that has been pledged to cover obligations of a Fund and cash collateral received, if any, is reported separately on the Statements of Assets and Liabilities as receivables/payables for collateral on certain derivatives contracts. Non-cash collateral pledged by a Fund, if any, is noted in the Schedules of Investments.
Exchange-traded derivatives, including futures and options contracts, are generally valued at the last sale or settlement price on the exchange where they are principally traded. Exchange-traded options without settlement prices are generally valued at the midpoint of the bid and ask prices on the exchange where they are principally traded (or, in the absence of two-way trading, at the last bid price for long positions and the last ask price for short positions). Exchange-traded derivatives typically fall within Level 1 of the fair value hierarchy. Over-the-counter (“OTC”) and centrally cleared derivatives are valued using market transactions and other market evidence, including market-based inputs to models, calibration to market-clearing transactions, broker or dealer quotations, or other alternative pricing sources. Where models are used, the selection of a particular model to value OTC and centrally cleared derivatives depends upon the contractual terms of, and specific risks inherent in, the instrument, as well as the availability of pricing information in the market. Valuation models require a variety of inputs, including contractual terms, market
GOLDMAN SACHS VARIABLE INSURANCE TRUST MULTI-ASSET STRATEGIES FUNDS
3. INVESTMENTS AND FAIR VALUE MEASUREMENTS (continued)
prices, yield curves, credit curves, measures of volatility, voluntary and involuntary prepayment rates, loss severity rates and correlations of such inputs. For OTC and centrally cleared derivatives that trade in liquid markets, model inputs can generally be verified and model selection does not involve significant management judgment. OTC and centrally cleared derivatives are classified within Level 2 of the fair value hierarchy when significant inputs are corroborated by market evidence.
i. Futures Contracts — Futures contracts are contracts to buy or sell a standardized quantity of a specified commodity or security. Upon entering into a futures contract, a Fund deposits cash or securities in an account on behalf of the broker in an amount sufficient to meet the initial margin requirement. Subsequent payments are made or received by a Fund equal to the daily change in the contract value and are recorded as variation margin receivable or payable with a corresponding offset to unrealized gains or losses.
ii. Options — When the Multi-Strategy Alternatives Portfolio writes call or put options, an amount equal to the premium received is recorded as a liability and is subsequently marked-to-market to reflect the current value of the option written. Swaptions are options on swap contracts.
Upon the purchase of a call option or a put option by the Multi-Strategy Alternatives Portfolio, the premium paid is recorded as an investment and subsequently marked-to-market to reflect the current value of the option. Certain options may be purchased with premiums to be determined on a future date. The premiums for these options are based upon implied volatility parameters at specified terms.
B. Level 3 Fair Value Investments — To the extent that significant inputs to valuation models and other alternative pricing sources are unobservable, or if quotations are not readily available, or if GSAM believes that such quotations do not accurately reflect fair value, the fair value of a Fund’s investments may be determined under Valuation Procedures approved by the Trustees. GSAM, consistent with its procedures and applicable regulatory guidance, may make an adjustment to the most recent valuation prices of either domestic or foreign securities in light of significant events to reflect what it believes to be the fair value of the securities at the time of determining a Fund’s NAV. To the extent investments are valued using single source broker quotations obtained directly from the broker or passed through from third party pricing vendors, such investments are classified as Level 3 investments.
C. Fair Value Hierarchy — The following is a summary of the Funds’ investments and derivatives classified in the fair value hierarchy as of December 31, 2022:
| | | | | | | | | | | | |
| | | |
| MULTI-STRATEGY ALTERNATIVES PORTFOLIO | | | | | | | | | |
| Investment Type | | Level 1 | | | Level 2 | | | Level 3 | |
| | | |
| Assets | | | | | | | | | | | | |
| Fixed Income Underlying Funds | | $ | 19,318,516 | | | $ | — | | | $ | — | |
| Investment Companies | | | 9,561,826 | | | | — | | | | — | |
| Equity Underlying Funds | | | 4,112,841 | | | | — | | | | — | |
| Exchange Traded Funds | | | 3,124,832 | | | | — | | | | — | |
| Securities Lending Reinvestment Vehicle | | | 911,315 | | | | — | | | | — | |
| | | |
| Total | | $ | 37,029,330 | | | $ | — | | | $ | — | |
| | | |
| Derivative Type | | | | | | | | | |
| | | |
| Assets | | | | | | | | | | | | |
| Forward Foreign Currency Contracts(a) | | $ | — | | | $ | 383 | | | $ | — | |
| Futures Contracts(a) | | | 5,229 | | | | — | | | | — | |
| Purchased Option Contracts | | | 240,288 | | | | — | | | | — | |
| | | |
| Total | | $ | 245,517 | | | $ | 383 | | | $ | — | |
| (a) | Amount shown represents unrealized gain (loss) at fiscal year end. |
GOLDMAN SACHS VARIABLE INSURANCE TRUST MULTI-ASSET STRATEGIES FUNDS
Notes to Financial Statements (continued)
December 31, 2022
3. INVESTMENTS AND FAIR VALUE MEASUREMENTS (continued)
| | | | | | | | | | | | |
| | | |
| MULTI-STRATEGY ALTERNATIVES PORTFOLIO (continued) | | | | | | | | | |
| Derivative Type | | Level 1 | | | Level 2 | | | Level 3 | |
| | | |
| Liabilities(a) | | | | | | | | | | | | |
| Forward Foreign Currency Contracts | | $ | — | | | $ | (533 | ) | | $ | — | |
| Futures Contracts | | | (11,450 | ) | | | — | | | | — | |
| | | |
| Total | | $ | (11,450 | ) | | $ | (533 | ) | | $ | — | |
| | | |
| TREND DRIVEN ALLOCATION FUND | | | | | | | | | |
| Investment Type | | Level 1 | | | Level 2 | | | Level 3 | |
| | | |
| Assets | | | | | | | | | | | | |
| Exchange Traded Funds | | $ | 67,055,565 | | | $ | — | | | $ | — | |
| Investment Companies | | | 134,261,459 | | | | — | | | | — | |
| | | |
| Total | | $ | 201,317,024 | | | $ | — | | | $ | — | |
| | | |
| Derivative Type | | | | | | | | | |
| | | |
| Liabilities(a) | | | | | | | | | | | | |
| Futures Contracts | | $ | (5,243,200 | ) | | $ | — | | | $ | — | |
| | | |
| Total | | $ | (5,243,200 | ) | | $ | — | | | $ | — | |
| (a) | Amount shown represents unrealized gain (loss) at fiscal year end. |
4. INVESTMENTS IN DERIVATIVES
The following tables set forth, by certain risk types, the gross value of derivative contracts (not considered to be hedging instruments for accounting disclosure purposes) as of December 31, 2022. These instruments were used as part of the Funds’ investment strategies and to obtain and/or manage exposure related to the risks below. The values in the tables below exclude the effects of cash collateral received or posted pursuant to these derivative contracts, and therefore are not representative of the Funds’ net exposure.
Multi-Strategy Alternatives
| | | | | | | | | | | | | | |
| Risk | | | | Statements of Assets and Liabilities | | Assets | | | Statements of Assets and Liabilities | | Liabilities | |
| Equity | | | | Variation margin on futures contracts | | $ | 5,229 | (a) | | Variation margin on futures contracts | | $ | (3,794 | )(a) |
| Currency | | | | Receivable for unrealized gain on forward foreign currency exchange contracts | | | 383 | | | Payable for unrealized loss on forward foreign currency exchange contracts | | | (533 | ) |
| Interest Rate | | | | Purchased options contracts, at value | | | 240,288 | | | Variation margin on futures contracts | | | (7,656 | )(a) |
| | | | | |
| Total | | | | | | $ | 245,900 | | | | | $ | (11,983 | ) |
GOLDMAN SACHS VARIABLE INSURANCE TRUST MULTI-ASSET STRATEGIES FUNDS
4. INVESTMENTS IN DERIVATIVES (continued)
Trend Driven Allocation
| | | | | | | | | | | | | | |
| Risk | | | | Statements of Assets and Liabilities | | Assets | | | Statements of Assets and Liabilities | | Liabilities | |
| Equity | | | | | | $ | — | | | Variation margin on futures contracts | | $ | (4,360,321 | )(a) |
| Interest Rate | | | | | | | — | | | Variation margin on futures contracts | | | (882,879 | )(a) |
| | | | | |
| Total | | | | | | $ | — | | | | | $ | (5,243,200 | ) |
| (a) | Includes unrealized gain (loss) on futures contracts described in the Additional Investment Information sections of the Schedules of Investments. Only the variation margin as of December 31, 2022, is reported within the Statements of Assets and Liabilities. |
The following tables set forth, by certain risk types, the Funds’ gains (losses) related to these derivatives and their indicative volumes for the year ended December 31, 2022. These gains (losses) should be considered in the context that these derivative contracts may have been executed to create investment opportunities and/or economically hedge certain investments, and accordingly, certain gains (losses) on such derivative contracts may offset certain (losses) gains attributable to investments. These gains (losses) are included in “Net realized gain (loss)” or “Net change in unrealized gain (loss)” on the Statements of Operations:
Multi-Strategy Alternatives
| | | | | | | | | | |
| Risk | | Statement of Operations | | Net
Realized
Gain (Loss) | | | Net Change in
Unrealized
Gain (Loss) | |
| Currency | | Net realized gain (loss) from forward foreign currency exchange contracts/Net change in unrealized gain (loss) on forward foreign currency exchange contracts | | $ | 11,413 | | | $ | 150 | |
| Equity | | Net realized gain (loss) from futures contracts/Net change in unrealized gain (loss) on futures contracts | | | (251,908 | ) | | | (2,924 | ) |
| Interest Rate | | Net realized gain (loss) from futures contracts and Purchased options/Net change in unrealized gain (loss) on futures contracts | | | (567,461 | ) | | | (193,510 | ) |
| | | |
| Total | | | | $ | (819,369 | ) | | $ | (196,584 | ) |
Trend Driven Allocation
| | | | | | | | | | |
| Risk | | Statement of Operations | | Net
Realized
Gain (Loss) | | | Net Change in
Unrealized
Gain (Loss) | |
| Equity | | Net realized gain (loss) from futures contracts/Net change in unrealized gain (loss) on futures contracts | | $ | (25,662,822 | ) | | $ | (7,281,348 | ) |
| Interest Rate | | Net realized gain (loss) from futures contracts/Net change in unrealized gain (loss) on futures contracts | | | (11,882,605 | ) | | | (805,092 | ) |
| | | |
| Total | | | | $ | (37,545,427 | ) | | $ | (8,086,440 | ) |
For the fiscal year ended December 31, 2022, the relevant values for each derivative type were as follows:
| | | | | | | | | | | | |
| | | Average Number of Contracts(1) | |
| Fund | | Futures Contracts | | | Forward Contracts | | | Purchased Options | |
| Multi-Strategy Alternatives | | | 55 | | | | 99,046 | | | | 221 | |
| Trend Driven Allocation | | | 1,292 | | | | — | | | | — | |
| (1) | Amounts disclosed represent average number of contracts for futures and purchased options contracts and notional amounts for forward contracts, based on absolute values, which is indicative of volume of this derivative type, for the months that the Funds held such derivatives during the fiscal year ended December 31, 2022. |
GOLDMAN SACHS VARIABLE INSURANCE TRUST MULTI-ASSET STRATEGIES FUNDS
Notes to Financial Statements (continued)
December 31, 2022
5. AGREEMENTS AND AFFILIATED TRANSACTIONS
A. Management Agreement — Under the Agreement, GSAM manages the Funds, subject to the general supervision of the Trustees.
As compensation for the services rendered pursuant to the Agreement, the assumption of the expenses related thereto and administration of the Funds’ business affairs, including providing facilities, GSAM is entitled to a management fee, accrued daily and paid monthly, equal to an annual percentage rate of each Fund’s average daily net assets.
For the fiscal year ended December 31, 2022, contractual and effective net management fees with GSAM were at the following rates:
| | | | | | | | | | | | | | | | | | | | | | | | | | | | |
| Contractual Management Rate | | | | | | | |
| Fund | | First
$1 billion | | | Next
$1 billion | | | Next
$3 billion | | | Next
$3 billion | | | Over
$8 billion | | | Effective
Rate | | | Effective Net
Management Rate^ | |
| Multi-Strategy Alternatives | | | 0.15 | % | | | 0.15 | % | | | 0.15 | % | | | 0.15 | % | | | 0.15 | % | | | 0.15 | % | | | 0.00 | %* |
| Trend Driven Allocation | | | 0.79 | % | | | 0.71 | % | | | 0.68 | % | | | 0.66 | % | | | 0.65 | % | | | 0.79 | % | | | 0.64 | %** |
| ^ | Effective Net Management Rate includes the impact of management fee waivers of affiliated Underlying Funds, if any. |
| * | GSAM agreed to waive a portion of its management fees in order to achieve a net management rate, as defined in the Fund’s most recent prospectus. This waiver will be effective through at least April 29, 2023, and prior to such date GSAM may not terminate the arrangement without approval of the trustees. For the fiscal year ended December 31,2022, GSAM waived $63,034 of its management fee. |
| ** | GSAM agreed to waive a portion of its management fees in order to achieve a net management rate, as defined in the Fund’s most recent prospectus. This waiver will be effective through at least April 29, 2023, and prior to such date GSAM may not terminate the arrangement without approval of the trustees. For the fiscal year ended December 31,2022, GSAM waived $361,696 of its management fee. |
The Multi-Strategy Alternatives Portfolio invests in Institutional Shares of the Goldman Sachs Financial Square Government and Goldman Sachs VIT Government Money Market Funds and Trend Driven Allocation Fund invests in Institutional Shares of the Goldman Sachs Financial Square Government, Goldman Sachs Financial Square Treasury Instruments, Goldman Sachs Financial Square Treasury Obligations, and Goldman Sachs Financial Square Treasury Solutions Funds, which are affiliated Underlying Funds. GSAM has agreed to waive a portion of its management fee payable by the Funds in an amount equal to the management fee it earns as an investment adviser to the affiliated Underlying Fund in which the Funds invest, except those management fees it earns from the Funds’ investments of cash collateral received in connection with securities lending transactions in the Goldman Sachs Financial Square Government Fund. For the fiscal year ended December 31, 2022, GSAM waived $8,862 and $103,791 of the Multi-Strategy Alternatives Portfolio’s and Trend Driven Allocation Fund’s management fee, respectively.
B. Distribution and/or Service (12b-1) Plans — The Trust, on behalf of Service Shares of the Funds has adopted a Distribution and Service Plan subject to Rule 12b-1 under the Act. Under the Distribution and Service Plan, Goldman Sachs, which serves as distributor (the “Distributor”), is entitled to a fee accrued daily and paid monthly, for distribution services and personal and account maintenance services, which may then be paid by Goldman Sachs to authorized dealers, equal to, on an annual basis, 0.25% of the Funds’ average daily net assets attributable to Service Shares.
The Trust, on behalf of Advisor Shares of the Multi-Strategy Alternatives Portfolio, has adopted a Distribution Plan subject to Rule 12b-1 under the Act. Under the Distribution Plan, Goldman Sachs as Distributor is entitled to a fee accrued daily and paid monthly for distribution services, which may then be paid by Goldman Sachs to authorized dealers, equal to, on an annual basis, 0.15% of the Multi-Strategy Alternatives Portfolio’s average daily net assets attributable to Advisor Shares.
C. Service Plans — The Trust, on behalf of Advisor Shares of the Multi-Strategy Alternatives Portfolio, has adopted a Service Plan to allow Advisor Shares to compensate service organizations (including Goldman Sachs) for providing varying levels of personal and account maintenance and administration services to their customers who are beneficial owners of such shares. The Service Plans each provide for compensation to the service organizations equal to 0.25% of the average daily net assets attributable to Advisor Shares of the Multi-Strategy Alternatives Portfolio.
GOLDMAN SACHS VARIABLE INSURANCE TRUST MULTI-ASSET STRATEGIES FUNDS
5. AGREEMENTS AND AFFILIATED TRANSACTIONS (continued)
D. Transfer Agency Agreement — Goldman Sachs also serves as the transfer agent of the Funds for a fee pursuant to the Transfer Agency Agreement. The fees charged for such transfer agency services are accrued daily and paid monthly at an annual rate of 0.02% of the average daily net assets of Institutional, Service and Advisor Shares.
E. Other Expense Agreements and Affiliated Transactions — GSAM has agreed to reduce or limit certain “Other Expenses” of the Funds (excluding acquired fund fees and expenses, transfer agency fees and expenses, service fees and shareholder administration fees (as applicable), taxes, interest, brokerage fees, expenses of shareholder meetings, litigation and indemnification, and extraordinary expenses) to the extent such expenses exceed, on an annual basis, a percentage rate of the average daily net assets of each Fund. Such Other Expense reimbursements, if any, are accrued daily and paid monthly. In addition, the Funds are not obligated to reimburse GSAM for prior fiscal year expense reimbursements, if any. The Other Expense limitations as an annual percentage rate of average daily net assets for the Multi-Strategy Alternatives Portfolio and Trend Driven Allocation Fund are 0.204% and 0.004%, respectively. These Other Expense limitations will remain in place through at least April 29, 2023, and prior to such date GSAM may not terminate the arrangements without the approval of the Trustees. In addition, the Funds have entered into certain offset arrangements with the custodian and the transfer agent, which may result in a reduction of the Funds’ expenses and are received irrespective of the application of the “Other Expense” limitations described above.
For the fiscal year ended December 31, 2022, these expense reductions, including any fee waivers and Other Expense reimbursements, were as follows:
| | | | | | | | | | | | |
| Fund | | Management
Fee Waiver | | | Other Expense
Reimbursement | | | Total
Expense
Reductions | |
| Multi-Strategy Alternatives | | $ | 71,896 | | | $ | 122,738 | | | $ | 194,634 | |
| Trend Driven Allocation | | $ | 465,487 | | | $ | 312,607 | | | $ | 778,094 | |
F. Line of Credit Facility — As of December 31, 2022, the Funds participated in a $1,250,000,000 committed, unsecured revolving line of credit facility (the “facility”) together with other funds of the Trust and certain registered investment companies having management agreements with GSAM or its affiliates. This facility is to be used for temporary emergency purposes, or to allow for an orderly liquidation of securities to meet redemption requests. The interest rate on borrowings is based on the federal funds rate. The facility also requires a fee to be paid by the Funds based on the amount of the commitment that has not been utilized. For the fiscal year ended December 31, 2022, the Funds did not have any borrowings under the facility. Prior to April 22, 2022, the facility was $1,000,000,000.
G. Other Transactions with Affiliates — The following table provides information about Goldman Sachs Variable Insurance Trust Trend Driven Allocation Fund’s investments in the Goldman Sachs Financial Square Government, Goldman Sachs Financial Square Treasury Instruments, Goldman Sachs Financial Square Treasury Obligations, and Goldman Sachs Financial Square Treasury Solutions Funds as of and for the year ended December 31, 2022.
| | | | | | | | | | | | | | | | | | | | | | | | |
| Investment Companies | | Beginning
Value as of
December 31,
2021 | | | Purchases
at Cost | | | Proceeds
from Sales | | | Ending Value
as of
December 31,
2022 | | | Shares as of
December 31,
2022 | | | Dividend
Income | |
Goldman Sachs Financial Square Government Fund | | $ | 107,548,515 | | | $ | 32,799,572 | | | $ | (86,416,616 | ) | | $ | 53,931,471 | | | | 53,931,471 | | | $ | 892,814 | |
Goldman Sachs Financial Square Treasury Instruments Fund | | | 17,641,672 | | | | 15,596,999 | | | | (6,462,280 | ) | | | 26,776,391 | | | | 26,776,391 | | | | 416,747 | |
Goldman Sachs Financial Square Treasury Obligations Fund | | | 35,780,380 | | | | — | | | | (9,003,174 | ) | | | 26,777,206 | | | | 26,777,206 | | | | 444,736 | |
Goldman Sachs Financial Square Treasury Solutions Fund | | | 35,779,565 | | | | — | | | | (9,003,174 | ) | | | 26,776,391 | | | | 26,776,391 | | | | 452,322 | |
| | | | | | |
| Total | | $ | 196,750,132 | | | $ | 48,396,571 | | | $ | (110,885,244 | ) | | $ | 134,261,459 | | | | | | | $ | 2,206,619 | |
GOLDMAN SACHS VARIABLE INSURANCE TRUST MULTI-ASSET STRATEGIES FUNDS
Notes to Financial Statements (continued)
December 31, 2022
5. AGREEMENTS AND AFFILIATED TRANSACTIONS (continued)
As of December 31, 2022, The Goldman Sachs Group, Inc. was the beneficial owner of approximately 12% of the Institutional Shares of the Trend Driven Allocation Fund.
The Multi-Strategy Alternatives Portfolio invests primarily in Class R6 and Institutional Shares of the Underlying Funds. These Underlying Funds are considered to be affiliated with the Multi-Strategy Alternatives Portfolio. The tables below show the transactions in and earnings from investments in these Underlying Funds for the year ended December 31, 2022:
| | | | | | | | | | | | | | | | | | | | | | | | | | | | | | | | |
| Underlying Funds | | Beginning
Value as of
December 31,
2021 | | | Purchases
at Cost | | | Proceeds
from
Sales | | | Net
Realized
Gain
(Loss) | | | Change in
Unrealized
Gain (Loss) | | | Market
Value
December 31,
2022 | | | Shares as of
December 31,
2022 | | | Dividend
Income | |
Goldman Sachs Absolute Return Tracker Fund | | $ | 2,125,889 | | | $ | — | | | $ | (2,123,715 | ) | | $ | 81,069 | | | $ | (83,243 | ) | | $ | — | | | | — | | | $ | — | |
Goldman Sachs Alternative Premia Fund | | | 2,688,531 | | | | — | | | | (2,600,514 | ) | | | (359,303 | ) | | | 271,286 | | | | — | | | | — | | | | — | |
Goldman Sachs Dynamic Global Equity Fund | | | 2,391,987 | | | | — | | | | (2,374,414 | ) | | | 49,017 | | | | (66,590 | ) | | | — | | | | — | | | | — | |
Goldman Sachs Emerging Markets Debt Fund | | | 2,551,140 | | | | 6,516,734 | | | | (5,480,000 | ) | | | (1,046,510 | ) | | | 9,094 | | | | 2,550,458 | | | | 287,214 | | | | 206,734 | |
Goldman Sachs Emerging Markets Equity Insights Fund | | | 501,367 | | | | 4,302,300 | | | | (2,990,000 | ) | | | (306,182 | ) | | | (105,916 | ) | | | 1,401,569 | | | | 187,878 | | | | 36,130 | |
Goldman Sachs Energy Infrastructure Fund | | | — | | | | 279,553 | | | | (125,000 | ) | | | 4,903 | | | | 6,905 | | | | 166,361 | | | | 15,680 | | | | 8,063 | |
Goldman Sachs Financial Square Government Fund (Institutional Shares) | | | 1,042,574 | | | | 65,495,900 | | | | (63,262,215 | ) | | | — | | | | — | | | | 3,276,259 | | | | 3,276,259 | | | | 83,144 | |
Goldman Sachs Global Infrastructure Fund | | | 2,503,260 | | | | 5,383,500 | | | | (4,850,000 | ) | | | (289,889 | ) | | | (200,483 | ) | | | 2,544,911 | | | | 208,599 | | | | 72,023 | |
Goldman Sachs High Yield Floating Rate Fund | | | 1,514,507 | | | | 3,879,389 | | | | (3,660,000 | ) | | | (170,942 | ) | | | (23,636 | ) | | | 1,539,318 | | | | 177,750 | | | | 115,469 | |
Goldman Sachs High Yield Fund | | | 1,960,245 | | | | 4,315,516 | | | | (3,705,000 | ) | | | (426,657 | ) | | | (77,536 | ) | | | 2,057,530 | | | | 386,754 | | | | 126,478 | |
Goldman Sachs Long Short Credit Strategies Fund | | | 2,101,630 | | | | 16,317,082 | | | | (10,150,000 | ) | | | (781,675 | ) | | | (392,640 | ) | | | 7,094,397 | | | | 931,023 | | | | 401,275 | |
Goldman Sachs Managed Futures Strategy Fund | | | 2,991,500 | | | | 10,054,915 | | | | (8,200,000 | ) | | | 286,599 | | | | (202,555 | ) | | | 4,930,459 | | | | 482,432 | | | | 513,344 | |
Goldman Sachs MarketBeta US Equity ETF | | | — | | | | 7,075,790 | | | | (4,452,589 | ) | | | (331,117 | ) | | | (95,876 | ) | | | 2,196,208 | | | | 42,308 | | | | 39,820 | |
Goldman Sachs MarketBeta International Equity ETF | | | — | | | | 3,468,493 | | | | (2,333,597 | ) | | | (245,755 | ) | | | 39,483 | | | | 928,624 | | | | 19,779 | | | | 29,386 | |
Goldman Sachs Strategic Income Fund | | | 905,551 | | | | 1,822,617 | | | | (1,500,000 | ) | | | (57,048 | ) | | | (21,854 | ) | | | 1,146,354 | | | | 129,972 | | | | 34,705 | |
Goldman Sachs Tactical Tilt Overlay Fund | | | 5,839,260 | | | | — | | | | (5,884,790 | ) | | | 227,073 | | | | (181,543 | ) | | | — | | | | — | | | | — | |
Goldman Sachs VIT Government Money Market Fund (Institutional Shares) Overlay Fund | | | — | | | | 6,285,567 | | | | — | | | | — | | | | — | | | | 6,285,567 | | | | 6,285,567 | | | | 85,557 | |
| | | | | | | | |
| Total | | $ | 29,117,441 | | | $ | 135,197,356 | | | $ | (123,691,834 | ) | | $ | (3,366,417 | ) | | $ | (1,125,104 | ) | | $ | 36,118,015 | | | | | | | $ | 1,752,128 | |
GOLDMAN SACHS VARIABLE INSURANCE TRUST MULTI-ASSET STRATEGIES FUNDS
6. PORTFOLIO SECURITIES TRANSACTIONS
The cost of purchases and proceeds from sales and maturities of long-term securities for the fiscal year ended December 31, 2022, were as follows:
| | | | | | | | | | |
| Fund | | | | Purchases | | | Sales and
Maturities | |
| Multi-Strategy Alternatives | | | | $ | 66,972,320 | | | $ | 64,074,148 | |
| Trend Driven Allocation | | | | | 241,934,119 | | | | 244,000,535 | |
7. SECURITIES LENDING
The Multi-Strategy Alternatives Portfolio may lend its securities through a securities lending agent, the Bank of New York Mellon (“BNYM”), to certain qualified borrowers. Pursuant to exemptive relief granted by the Securities and Exchange Commission (“SEC”) and the terms and conditions contained therein, the Trend Driven Allocation Fund may lend its securities through a securities lending agent, Goldman Sachs Agency Lending (“GSAL”), a wholly-owned subsidiary of Goldman Sachs, to certain qualified borrowers including Goldman Sachs and affiliates. In accordance with the Funds’ securities lending procedures, the Funds receive cash collateral at least equal to the market value of the securities on loan. The market value of the loaned securities is determined at the close of business of the Funds at their last sale price or official closing price on the principal exchange or system on which they are traded, and any additional required collateral is delivered to the Funds on the next business day. As with other extensions of credit, the Funds may experience delay in the recovery of their securities or incur a loss should the borrower of the securities breach its agreement with the Funds or become insolvent at a time when the collateral is insufficient to cover the cost of repurchasing securities on loan. Dividend income received from securities on loan may not be subject to withholding taxes and therefore withholding taxes paid may differ from the amounts listed in the Statements of Operations. Loans of securities are terminable at any time and as such 1) the remaining contractual maturities of the outstanding securities lending transactions are considered to be overnight and continuous and 2) the borrower, after notice, is required to return borrowed securities within the standard time period for settlement of securities transactions.
The Funds invest the cash collateral received in connection with securities lending transactions in the Goldman Sachs Financial Square Government Fund (“Government Money Market Fund”), an affiliated series of the Goldman Sachs Trust. The Government Money Market Fund is registered under the Act as an open end investment company, is subject to Rule 2a-7 under the Act, and is managed by GSAM, for which GSAM may receive a management fee of up to 0.16% on an annualized basis of the average daily net assets of the Government Money Market Fund.
In the event of a default by a borrower with respect to any loan, GSAL will, and BNYM may, exercise any and all remedies provided under the applicable borrower agreement to make the Funds whole. These remedies include purchasing replacement securities by applying the collateral held from the defaulting broker against the purchase cost of the replacement securities. If GSAL or BNYM are unable to purchase replacement securities, GSAL and/or BNYM will indemnify the Funds by paying the Funds an amount equal to the market value of the securities loaned minus the value of cash collateral received from the borrower for the loan, subject to an exclusion for any shortfalls resulting from a loss of value in such cash collateral due to reinvestment risk. The Funds’ master netting agreements with certain borrowers provide the right, in the event of a default (including bankruptcy or insolvency), for the non-defaulting party to liquidate the collateral and calculate net exposure to the defaulting party or request additional collateral. However, in the event of a default by a borrower, a resolution authority could determine that such rights are not enforceable due to the restrictions or prohibitions against the right of set-off that may be imposed in accordance with a particular jurisdiction’s bankruptcy or insolvency laws. The Funds’ loaned securities were all subject to enforceable Securities Lending Agreements and the value of the collateral was at least equal to the value of the cash received. The amounts of the Funds’ overnight and continuous agreements, which represent the gross amounts of recognized liabilities for securities lending transactions
GOLDMAN SACHS VARIABLE INSURANCE TRUST MULTI-ASSET STRATEGIES FUNDS
Notes to Financial Statements (continued)
December 31, 2022
7. SECURITIES LENDING (continued)
outstanding as of December 31, 2022, are disclosed as “Payable upon return of securities loaned” on the Statements of Assets and Liabilities, where applicable. The Funds did not have securities on loan as of December 31, 2022.
The Funds, GSAL and BNYM received compensation relating to the lending of the Funds’ securities. The amounts earned, if any, by the Funds for the fiscal year ended December 31, 2022, are reported under Investment Income on the Statements of Operations.
The table below details securities lending activity with affiliates of Goldman Sachs:
| | | | | | | | | | |
| | | | | For the fiscal year ended December 31, 2022 | |
| | | | | Earnings of GSAL Relating
to Securities Loaned | | | Amounts Received by
the Fund from Lending
to Goldman Sachs | |
| | | Trend Driven Allocation | | $ | 710 | | | $ | 3,050 | |
The following table provides information about the Funds’ investment in the Government Money Market Fund for the fiscal year ended December 31, 2022.
| | | | | | | | | | | | | | | | |
| Fund | | Beginning
Value as of
December 31,
2021 | | | Purchases
at Cost | | | Proceeds
from Sales | | | Ending
value as of
December 31,
2022 | |
| Multi-Strategy Alternatives | | $ | — | | | $ | 6,655,136 | | | $ | (5,743,821 | ) | | $ | 911,315 | |
| Trend Driven Allocation | | | — | | | | 51,815,546 | | | | (51,815,546 | ) | | | — | |
8. TAX INFORMATION
The tax character of distributions paid during the fiscal year ended December 31, 2022 was as follows:
| | | | | | | | |
| | | Multi-Strategy
Alternatives | | | Trend Driven
Allocation | |
| Distributions paid from: | | | | | | | | |
| Ordinary income | | $ | 1,280,144 | | | $ | 4,200,089 | |
| Net long-term capital gains | | | — | | | | 6,691,886 | |
| Total taxable distributions | | $ | 1,280,144 | | | $ | 10,891,975 | |
The tax character of distributions paid during the fiscal year ended December 31, 2021 was as follows:
| | | | | | | | |
| | | Multi-Strategy
Alternatives | | | Trend Driven
Allocation | |
| Distributions paid from: | | | | | | | | |
| Ordinary income | | $ | 407,815 | | | $ | 27,527,213 | |
| Net long-term capital gains | | | — | | | | 15,532,704 | |
| Total taxable distributions | | $ | 407,815 | | | $ | 43,059,917 | |
GOLDMAN SACHS VARIABLE INSURANCE TRUST MULTI-ASSET STRATEGIES FUNDS
8. TAX INFORMATION (continued)
As of December 31, 2022, the components of accumulated earnings (losses) on a tax-basis were as follows:
| | | | | | | | |
| | | Multi-Strategy
Alternatives | | | Trend Driven
Allocation | |
| Undistributed ordinary income — net | | $ | 1,267,128 | | | $ | — | |
| Undistributed long-term capital gains | | | | | | | — | |
| Total undistributed earnings | | $ | 1,267,128 | | | $ | — | |
| Capital loss carryforwards: | | | | | | | | |
| Perpetual Short-term | | | (1,748,216 | ) | | | (7,200,950 | ) |
| Perpetual Long-term | | | (1,812,000 | ) | | | (30,925,043 | ) |
| Total Capital loss carryforwards | | | (3,560,216 | ) | | | (38,125,993 | ) |
Timing differences (Qualified late year ordinary loss deferral and Straddle loss deferral) | | | — | | | | (4,120,292 | ) |
| Unrealized gain (loss) — net | | | (1,997,444 | ) | | | 9,793,076 | |
| Total accumulated earnings — net | | $ | (4,290,532 | ) | | $ | (32,453,209 | ) |
As of December 31, 2022, the Funds’ aggregate security unrealized gains and losses based on cost for U.S. federal income tax purposes were as follows:
| | | | | | | | |
| | | Multi-Strategy
Alternatives | | | Trend Driven
Allocation | |
| Tax cost | | $ | 39,268,388 | | | $ | 186,929,812 | |
| Gross unrealized gain | | | 492,624 | | | | 10,494,615 | |
| Gross unrealized loss | | | (2,490,068 | ) | | | (701,539 | ) |
| Net unrealized gain (loss) | | $ | (1,997,444 | ) | | $ | 9,793,076 | |
The difference between GAAP-basis and tax-basis unrealized gains (losses) is attributable primarily to wash sales, net mark to market gains (losses) on regulated futures, options contracts and foreign currency contracts.
The Trend Driven Allocation Fund reclassed $1,463,121 from paid-in capital to distributable earnings. In order to present certain components of the Funds’ capital accounts on a tax-basis, certain reclassifications have been recorded to the Funds’ accounts. These reclassifications have no impact on the net asset value of the Funds’ and result primarily from net operating losses.
GSAM has reviewed the Funds’ tax positions for all open tax years (the current and prior three years, as applicable) and has concluded that no provision for income tax is required in the Funds’ financial statements. Such open tax years remain subject to examination and adjustment by tax authorities.
9. OTHER RISK
The Funds’ and Underlying Fund’s risks include, but are not limited to, the following:
Derivatives Risk — The Funds’ use of derivatives and other similar instruments (collectively referred to in this paragraph as “derivatives”) may result in loss, including due to adverse market movements. Derivatives, which may pose risks in addition to and greater than those associated with investing directly in securities, currencies or other assets and instruments, may increase market exposure and be illiquid or less liquid, volatile, difficult to price and leveraged so that small changes in the value of the underlying assets or instruments may produce disproportionate losses to the Funds. Certain derivatives are also subject to counterparty risk, which is the risk that the other party in the transaction will not, or lacks the capacity or authority to, fulfill its contractual obligations, liquidity risk, which includes the risk that the Funds will not be able to exit the derivative when it is advantageous to do so, and risks arising from margin requirements, which include the risk that the Funds will be required to pay additional margin or set aside additional collateral to
GOLDMAN SACHS VARIABLE INSURANCE TRUST MULTI-ASSET STRATEGIES FUNDS
Notes to Financial Statements (continued)
December 31, 2022
9. OTHER RISK (continued)
maintain open derivative positions. The use of derivatives is a highly specialized activity that involves investment techniques and risks different from those associated with investments in more traditional securities and instruments. Losses from derivatives can also result from a lack of correlation between changes in the value of derivative instruments and the portfolio assets (if any) being hedged.
Foreign and Emerging Countries Risk — Investing in foreign markets may involve special risks and considerations not typically associated with investing in the U.S. Foreign securities may be subject to risk of loss because of more or less foreign government regulation; less public information; less stringent investor protections; less stringent accounting, corporate governance, financial reporting and disclosure standards; and less economic, political and social stability in the countries in which the Funds or an Underlying Fund invests. The imposition of sanctions, exchange controls (including repatriation restrictions), confiscations of assets and property, trade restrictions (including tariffs) and other government restrictions by the U.S. or other governments, or problems with registration, settlement or custody, may also result in losses. The type and severity of sanctions and other similar measures, including counter sanctions and other retaliatory actions, that may be imposed could vary broadly in scope, and their impact is impossible to predict. For example, the imposition of sanctions and other similar measures could, among other things, cause a decline in the value and/or liquidity of securities issued by the sanctioned country or companies located in or economically tied to the sanction country and increase market volatility and disruption in the sanctioned country and throughout the world. Sanctions and other similar measures could limit or prevent a Fund or an Underlying Fund from buying and selling securities (in the sanctioned country and other markets), significantly delay or prevent the settlement of securities transactions, and significantly impact a Fund or Underlying Fund’s liquidity and performance. Foreign risk also involves the risk of negative foreign currency rate fluctuations, which may cause the value of securities denominated in such foreign currency (or other instruments through which the Funds or an Underlying Fund has exposure to foreign currencies) to decline in value. Currency exchange rates may fluctuate significantly over short periods of time. To the extent that the Funds or an Underlying Fund also invests in securities of issuers located in, or economically tied to, emerging markets, these risks may be more pronounced.
Interest Rate Risk — When interest rates increase, fixed income securities or instruments held by a Fund will generally decline in value. The Fund may face a heightened level of interest rate risk in connection with the type and extent of certain monetary policy changes made by the Federal Reserve, such as target interest rate changes. Long-term fixed income securities or instruments will normally have more price volatility because of this risk than short-term fixed income securities or instruments. A wide variety of market factors can cause interest rates to rise, including central bank monetary policy, rising inflation and changes in general economic conditions. The risks associated with changing interest rates may have unpredictable effects on the markets and the Fund’s investments. Fluctuations in interest rates may also affect the liquidity of fixed income securities and instruments held by the Fund. A sudden or unpredictable increase in interest rates may cause volatility in the market and may decrease the liquidity of the Fund’s investments, which would make it harder for the Fund to sell its investments at an advantageous time.
Investments in Other Investment Companies Risk — As a shareholder of another investment company, including an ETF, the Funds will indirectly bear its proportionate share of any net management fees and other expenses paid by such other investment companies, in addition to the fees and expenses regularly borne by the Fund. ETFs are subject to risks that do not apply to conventional mutual funds, including but not limited to the following: (i) the market price of the ETF’s shares may trade at a premium or a discount to their NAV; and (ii) an active trading market for an ETF’s shares may not develop or be maintained.
Investments in the Underlying Funds Risk — The investments of the Multi-Strategy Alternatives Portfolio may be concentrated in one or more Underlying Funds (including ETFs and other registered investment companies) subject to statutory limitations prescribed by the Act or exemptive relief or regulations thereunder. The Multi-Strategy Alternatives Portfolio’s investment performance is directly related to the investment performance of the Underlying Funds it holds. The Multi-Strategy Alternatives Portfolio is subject to the risk factors associated with the investments of the Underlying Funds and will be affected by the investment policies and practices of the Underlying Funds in direct proportion to the amount of assets allocated to each. If the Multi-Strategy Alternatives Portfolio has a relative concentration of its portfolio in a single Underlying Fund, it may be more susceptible to adverse developments affecting that Underlying Fund, and may be more susceptible to losses because of these developments. A strategy used by the Underlying Funds may fail to produce the intended results.
GOLDMAN SACHS VARIABLE INSURANCE TRUST MULTI-ASSET STRATEGIES FUNDS
9. OTHER RISK (continued)
Large Shareholder Transactions Risk — A Fund or an Underlying Fund may experience adverse effects when certain large shareholders, such as other funds, participating insurance companies, accounts and Goldman Sachs affiliates, purchase or redeem large amounts of shares of the Fund or an Underlying Fund. Such large shareholder redemptions, which may occur rapidly or unexpectedly, may cause a Fund or an Underlying Fund to sell portfolio securities at times when it would not otherwise do so, which may negatively impact a Fund’s or Underlying Fund’s NAV and liquidity. These transactions may also accelerate the realization of taxable income to shareholders if such sales of investments resulted in gains, and may also increase transaction costs. In addition, a large redemption could result in a Fund’s or Underlying Fund’s current expenses being allocated over a smaller asset base, leading to an increase in the Fund’s or Underlying Fund’s expense ratio. Similarly, large Fund or an Underlying Fund share purchases may adversely affect a Fund’s or Underlying Fund’s performance to the extent that the Fund or an Underlying Fund is delayed in investing new cash or otherwise maintains a larger cash position than it ordinarily would.
Liquidity Risk — A Fund or an Underlying Fund may make investments that are illiquid or that may become less liquid in response to market developments or adverse investor perceptions. Illiquid investments may be more difficult to value. Liquidity risk may also refer to the risk that a Fund or an Underlying Fund will not be able to pay redemption proceeds within the allowable time period or without significant dilution to remaining investors’ interests because of unusual market conditions, an unusually high volume of redemption requests, or other reasons. To meet redemption requests, a Fund or an Underlying Fund may be forced to sell investments at an unfavorable time and/or under unfavorable conditions. If a Fund or an Underlying Fund is forced to sell securities at an unfavorable time and/or under unfavorable conditions, such sales may adversely affect the Fund’s or Underlying Fund’s NAV and dilute remaining investors’ interests. Liquidity risk may be the result of, among other things, the reduced number and capacity of traditional market participants to make a market in fixed income securities or the lack of an active market. The potential for liquidity risk may be magnified by a rising interest rate environment or other circumstances where investor redemptions from fixed income funds may be higher than normal, potentially causing increased supply in the market due to selling activity. These risks may be more pronounced in connection with the Funds’ investments in securities of issuers located in emerging market countries. Redemptions by large shareholders may have a negative impact on a Fund’s or Underlying Fund’s liquidity.
Market and Credit Risks — In the normal course of business, a Fund or an Underlying Fund trades financial instruments and enters into financial transactions where risk of potential loss exists due to changes in the market (market risk). The value of the securities in which a Fund or an Underlying Fund invests may go up or down in response to the prospects of individual companies, particular sectors or governments and/or general economic conditions throughout the world due to increasingly interconnected global economies and financial markets. Events such as war, acts of terrorism, social unrest, natural disasters, the spread of infectious illness or other public health threats could also significantly impact a Fund and/or an Underlying Fund and their investments. Additionally, a Fund and/or an Underlying Fund may also be exposed to credit risk in the event that an issuer or guarantor fails to perform or that an institution or entity with which the Fund and the Underlying Fund has unsettled or open transactions defaults.
10. INDEMNIFICATIONS
Under the Trust’s organizational documents, its Trustees, officers, employees and agents are indemnified, to the extent permitted by the Act and state law, against certain liabilities that may arise out of performance of their duties to the Funds. Additionally, in the course of business, the Funds enter into contracts that contain a variety of indemnification clauses. The Funds’ maximum exposure under these arrangements is unknown, as this would involve future claims that may be made against the Funds that have not yet occurred. However, GSAM believes the risk of loss under these arrangements to be remote.
11. SUBSEQUENT EVENTS
Subsequent events after the Statements of Assets and Liabilities date have been evaluated, and GSAM has concluded that there is no impact requiring adjustment or disclosure in the financial statements.
GOLDMAN SACHS VARIABLE INSURANCE TRUST MULTI-ASSET STRATEGIES FUNDS
Notes to Financial Statements (continued)
December 31, 2022
12. SUMMARY OF SHARE TRANSACTIONS
Share activity is as follows:
| | | | | | | | | | | | | | | | |
| | | Multi-Strategy Alternatives Portfolio | |
| | | For the Fiscal Year Ended
December 31, 2022 | | | For the Fiscal Year Ended
December 31, 2021 | |
| | | Shares | | | Dollars | | | Shares | | | Dollars | |
| Institutional Shares | | | | | | | | | | | | | | | | |
| Shares sold | | | 27,388 | | | $ | 258,170 | | | | 154,388 | | | $ | 1,520,126 | |
| Reinvestment of distributions | | | 9,562 | | | | 84,430 | | | | 4,291 | | | | 41,966 | |
| Shares redeemed | | | (44,143 | ) | | | (411,218 | ) | | | (62,051 | ) | | | (611,039 | ) |
| | | | (7,193 | ) | | | (68,618 | ) | | | 96,628 | | | | 951,053 | |
| Service Shares | | | | | | | | | | | | | | | | |
| Shares sold | | | 7,434,585 | | | | 69,525,534 | | | | 428,346 | | | | 4,203,235 | |
| Reinvestment of distributions | | | 43,989 | | | | 388,859 | | | | 9,924 | | | | 96,854 | |
| Shares redeemed | | | (6,859,851 | ) | | | (62,785,354 | ) | | | (136,031 | ) | | | (1,336,716 | ) |
| | | | 618,723 | | | | 7,129,039 | | | | 302,239 | | | | 2,963,373 | |
| Advisor Share | | | | | | | | | | | | | | | | |
| Shares sold | | | 680,336 | | | | 6,255,009 | | | | 396,642 | | | | 3,879,151 | |
| Reinvestment of distributions | | | 91,792 | | | | 806,855 | | | | 27,617 | | | | 268,995 | |
| Shares redeemed | | | (240,786 | ) | | | (2,220,957 | ) | | | (187,371 | ) | | | (1,824,259 | ) |
| | | | 531,342 | | | | 4,840,907 | | | | 236,888 | | | | 2,323,887 | |
| | | | |
| NET INCREASE | | | 1,142,872 | | | $ | 11,901,328 | | | | 635,755 | | | $ | 6,238,313 | |
| |
| | | Trend Driven Allocation Fund | |
| | | For the Fiscal Year Ended
December 31, 2022 | | | For the Fiscal Year Ended
December 31, 2021 | |
| | | Shares | | | Dollars | | | Shares | | | Dollars | |
| Institutional Shares | | | | | | | | | | | | | | | | |
| Shares sold | | | 25,026 | | | $ | 296,816 | | | | — | | | $ | — | |
| Reinvestment of distributions | | | 1,959 | | | | 20,604 | | | | 3,134 | | | | 40,198 | |
| Shares redeemed | | | (2,759 | ) | | | (30,602 | ) | | | — | | | | — | |
| | | | 24,226 | | | | 286,818 | | | | 3,134 | | | | 40,198 | |
| Service Shares | | | | | | | | | | | | | | | | |
| Shares sold | | | 2,260,227 | | | | 25,627,391 | | | | 1,197,442 | | | | 16,311,964 | |
| Reinvestment of distributions | | | 1,041,319 | | | | 10,871,371 | | | | 3,368,811 | | | | 43,019,719 | |
| Shares redeemed | | | (4,360,235 | ) | | | (49,824,563 | ) | | | (3,449,473 | ) | | | (46,955,103 | ) |
| | | | (1,058,689 | ) | | | (13,325,801 | ) | | | 1,116,780 | | | | 12,376,580 | |
| | | | |
| NET INCREASE (DECREASE) | | | (1,034,463 | ) | | $ | (13,038,983 | ) | | | 1,119,914 | | | $ | 12,416,778 | |
Report of Independent Registered Public Accounting Firm
To the Board of Trustees of Goldman Sachs Variable Insurance Trust and Shareholders of
Goldman Sachs Multi-Strategy Alternatives Portfolio and Goldman Sachs Trend Driven Allocation Fund
Opinions on the Financial Statements
We have audited the accompanying statements of assets and liabilities, including the schedules of investments, of Goldman Sachs Multi-Strategy Alternatives Portfolio and Goldman Sachs Trend Driven Allocation Fund (two of the Funds constituting Goldman Sachs Variable Insurance Trust, referred to hereafter as the “Funds”) as of December 31, 2022, the related statements of operations for the year ended December 31, 2022, the statements of changes in net assets for each of the two years in the period ended December 31, 2022, including the related notes, and the financial highlights for each of the five years in the period ended December 31, 2022 (collectively referred to as the “financial statements”). In our opinion, the financial statements present fairly, in all material respects, the financial position of each of the Funds as of December 31, 2022, the results of each of their operations for the year then ended, the changes in their net assets for each of the two years in the period ended December 31, 2022 and each of the financial highlights for each of the five years in the period ended December 31, 2022 in conformity with accounting principles generally accepted in the United States of America.
Basis for Opinions
These financial statements are the responsibility of the Funds’ management. Our responsibility is to express an opinion on the Funds’ financial statements based on our audits. We are a public accounting firm registered with the Public Company Accounting Oversight Board (United States) (PCAOB) and are required to be independent with respect to the Funds in accordance with the U.S. federal securities laws and the applicable rules and regulations of the Securities and Exchange Commission and the PCAOB.
We conducted our audits of these financial statements in accordance with the standards of the PCAOB. Those standards require that we plan and perform the audit to obtain reasonable assurance about whether the financial statements are free of material misstatement, whether due to error or fraud.
Our audits included performing procedures to assess the risks of material misstatement of the financial statements, whether due to error or fraud, and performing procedures that respond to those risks. Such procedures included examining, on a test basis, evidence regarding the amounts and disclosures in the financial statements. Our audits also included evaluating the accounting principles used and significant estimates made by management, as well as evaluating the overall presentation of the financial statements. Our procedures included confirmation of securities owned as of December 31, 2022 by correspondence with the custodian, transfer agent and brokers; when replies were not received from brokers, we performed other auditing procedures. We believe that our audits provide a reasonable basis for our opinions.
/s/ PricewaterhouseCoopers LLP
Boston, Massachusetts
February 14, 2023
We have served as the auditor of one or more investment companies in the Goldman Sachs Fund complex since 2000.
GOLDMAN SACHS VARIABLE INSURANCE TRUST MULTI-ASSET STRATEGIES FUNDS
| | |
| Fund Expenses — Six Month Period Ended December 31, 2022 (Unaudited) | | |
As a shareholder of Institutional, Service or Advisor Shares of the Funds, you incur ongoing costs, including management fees, distribution and/or service (12b-1) fees (with respect to Service and Advisor Shares) and other Fund expenses. This example is intended to help you understand your ongoing costs (in dollars) of investing in the Institutional Shares, Service Shares and Advisor Shares of the Funds and to compare these costs with the ongoing costs of investing in other mutual funds.
The example is based on an investment of $1,000 invested at the beginning of the period and held for the entire period from July 1, 2022 through December 31, 2022, which represents a period of 184 days of a 365 day year.
Actual Expenses — The first line under each share class in the table below provides information about actual account values and actual expenses. You may use the information in this line, together with the amount you invested, to estimate the expenses that you paid over the period. Simply divide your account value by $1,000 (for example, an $8,600 account value divided by $1,000=8.6), then multiply the result by the number in the first line under the heading entitled “Expenses Paid” to estimate the expenses you paid on your account during this period.
Hypothetical Example for Comparison Purposes — The second line under each share class in the table below provides information about hypothetical account values and hypothetical expenses based on the Funds’ actual net expense ratio and an assumed rate of return of 5% per year before expenses, which is not the Funds’ actual return. The hypothetical account values and expenses may not be used to estimate the actual ending account balance or expenses you paid for the period. You may use this information to compare the ongoing costs of investing in the Funds and other funds. To do so, compare this 5% hypothetical example with the 5% hypothetical examples that appear in the shareholder reports of the other funds.
Please note that the expenses shown in the table are meant to highlight your ongoing costs only. As a shareholder of the Funds you do not incur any transaction costs, such as sales charges, redemption fees, or exchange fees, but shareholders of other funds may incur such costs. The second line of the table is useful in comparing ongoing costs only and will not help you determine the relative total costs of owning different funds whose shareholders may incur transaction costs.
| | | | | | | | | | | | | | | | | | | | | | | | |
| | | Multi-Strategy Alternatives Portfolio | | | Trend Driven Allocation Fund | |
| Share Class | | Beginning
Account
Value
7/1/22 | | | Ending
Account
Value
12/31/22 | | | Expenses
Paid for the
6 months
ended
12/31/2022* | | | Beginning
Account
Value
7/1/22 | | | Ending
Account
Value
12/31/22 | | | Expenses
Paid for the
6 months
ended
12/31/2022* | |
| Institutional | | | | | | | | | | | | | | | | | | | | | | | | |
| | | | | | | |
Actual | | $ | 1,000.00 | | | $ | 1,007.70 | | | $ | 1.01 | | | $ | 1,000.00 | | | $ | 955.75 | | | $ | 3.25 | |
Hypothetical 5% return | | | 1,000.00 | | | | 1,024.20 | + | | | 1.02 | | | | 1,000.00 | | | | 1,021.88 | + | | | 3.36 | |
| Service | | | | | | | | | | | | | | | | | | | | | | | | |
| | | | | | | |
Actual | | | 1,000.00 | | | | 1,005.74 | | | | 2.28 | | | | 1,000.00 | | | | 954.61 | | | | 4.48 | |
Hypothetical 5% return | | | 1,000.00 | | | | 1,022.94 | + | | | 2.29 | | | | 1,000.00 | | | | 1,020.62 | + | | | 4.63 | |
| Advisor | | | | | | | | | | | | | | | | | | | | | | | | |
| | | | | | | |
Actual | | | 1,000.00 | | | | 1,005.18 | | | | 3.03 | | | | 1,000.00 | | | | N/A | | | | N/A | |
Hypothetical 5% return | | | 1,000.00 | | | | 1,022.18 | + | | | 3.06 | | | | 1,000.00 | | | | N/A | | | | N/A | |
| | + | Hypothetical expenses are based on each Fund’s actual annualized net expense ratios and an assumed rate of return of 5% per year before expenses. | |
| | * | Expenses are calculated using each Fund’s annualized net expense ratio for each class, which represents the ongoing expenses as a percentage of net assets for the six months ended December 31, 2022. Expenses are calculated by multiplying the annualized net expense ratio by the average account value for the period; then multiplying the result by the number of days in the most recent fiscal half year; and then dividing that result by the number of days in the fiscal year. The annualized net expense ratios for the period were as follows: | |
| | | | | | | | | | | | |
| | | |
| Fund | | Institutional
Shares | | | Service
Shares | | | Advisor
Shares | |
| Multi-Strategy Alternatives Portfolio | | | 0.20 | % | | | 0.45 | % | | | 0.60 | % |
| Trend Driven Allocation Fund | | | 0.66 | | | | 0.91 | | | | N/A | |
40
GOLDMAN SACHS VARIABLE INSURANCE TRUST MULTI-ASSET STRATEGIES FUNDS
Trustees and Officers (Unaudited)
Independent Trustees
| | | | | | | | | | | | |
| | | | | |
Name, Address and Age1 | | Position(s) Held
with the Trust | | Term of
Office and
Length of
Time Served2 | | Principal Occupation(s) During Past 5 Years | | Number of
Portfolios in
Fund Complex
Overseen by
Trustee3 | | | Other
Directorships
Held by Trustee4 |
Jessica Palmer5 Age: 73 | | Chair of the Board of Trustees | | Since 2018 (Trustee since 2007) | | Ms. Palmer is retired. She was formerly Consultant, Citigroup Human Resources Department (2007-2008); Managing Director, Citigroup Corporate and Investment Banking (previously, Salomon Smith Barney/Salomon Brothers) (1984-2006). Ms. Palmer was a Member of the Board of Trustees of Indian Mountain School (private elementary and secondary school) (2004-2009). Chair of the Board of Trustees — Goldman Sachs Variable Insurance Trust and Goldman Sachs Trust. | | | 103 | | | None |
Dwight L. Bush Age: 65 | | Trustee | | Since 2020 | | Ambassador Bush is President and CEO of D.L. Bush & Associates (a financial advisory and private investment firm) (2002-2014 and 2017-Present); Director of MoneyLion, Inc. (an operator of a data-driven, digital financial platform) (2021-Present); and was formerly U.S. Ambassador to the Kingdom of Morocco (2014-2017) and a Member of the Board of Directors of Santander Bank, N.A. (2018-2019). Previously, Ambassador Bush served as an Advisory Board Member of Goldman Sachs Trust and Goldman Sachs Variable Insurance Trust (October 2019-January 2020). Trustee — Goldman Sachs Variable Insurance Trust and Goldman Sachs Trust. | | | 103 | | | MoneyLion, Inc. (an operator of a data-driven, digital financial platform) |
Kathryn A. Cassidy Age: 68 | | Trustee | | Since 2015 | | Ms. Cassidy is retired. She is Director, Vertical Aerospace Ltd. (an aerospace and technology company) (2021-Present). Formerly, Ms. Cassidy was Advisor to the Chairman (May 2014-December 2014); and Senior Vice President and Treasurer (2008-2014), General Electric Company & General Electric Capital Corporation (technology and financial services companies). Trustee — Goldman Sachs Variable Insurance Trust and Goldman Sachs Trust. | | | 103 | | | Vertical Aerospace Ltd. (an aerospace and technology company) |
John G. Chou Age: 66 | | Trustee | | Since 2022 | | Mr. Chou is Executive Vice President and Special Advisor to the Chairman and CEO of AmerisourceBergen Corporation (a pharmaceutical and healthcare company) (2021-Present); and formerly held various executive management positions with AmerisourceBergen Corporation, including Executive Vice President and Chief Legal Officer (2019-2021); Executive Vice President and Chief Legal & Business Officer (2017-2019); and Executive Vice President and General Counsel (2011-2017). Trustee — Goldman Sachs Variable Insurance Trust and Goldman Sachs Trust. | | | 103 | | | None |
Diana M. Daniels5 Age: 73 | | Trustee | | Since 2007 | | Ms. Daniels is retired. Formerly, she was Vice President, General Counsel and Secretary, The Washington Post Company (1991-2006). Ms. Daniels is a Trustee Emeritus and serves as a Presidential Councillor of Cornell University (2013-Present); Director of 1735 NY Investments, LLC (oversees an investment fund that supports the mission of the American Institute of Architects) (2022-Present); former Member of the Legal Advisory Board, New York Stock Exchange (2003-2006) and of the Corporate Advisory Board, Standish Mellon Management Advisors (2006-2007). Trustee — Goldman Sachs Variable Insurance Trust and Goldman Sachs Trust. | | | 103 | | | None |
| | | | | | | | | | | | |
GOLDMAN SACHS VARIABLE INSURANCE TRUST MULTI-ASSET STRATEGIES FUNDS
Trustees and Officers (Unaudited) (continued)
Independent Trustees
| | | | | | | | | | | | |
| | | | | |
Name, Address and Age1 | | Position(s) Held
with the Trust | | Term of
Office and
Length of
Time Served2 | | Principal Occupation(s) During Past 5 Years | | Number of
Portfolios in
Fund Complex
Overseen by
Trustee3 | | | Other
Directorships
Held by Trustee4 |
Joaquin Delgado Age: 62 | | Trustee | | Since 2020 | | Dr. Delgado is retired. He is Director, Stepan Company (a specialty chemical manufacturer) (2011-Present); and was formerly Director, Hexion Inc. (a specialty chemical manufacturer) (2019-2022); Executive Vice President, Consumer Business Group of 3M Company (July 2016-July 2019); and Executive Vice President, Health Care Business Group of 3M Company (October 2012-July 2016). Previously, Dr. Delgado served as an Advisory Board Member of Goldman Sachs Trust and Goldman Sachs Variable Insurance Trust (October 2019-January 2020). Trustee — Goldman Sachs Variable Insurance Trust and Goldman Sachs Trust. | | | 103 | | | Stepan Company (a specialty chemical manufacturer) |
Eileen H. Dowling Age: 60 | | Trustee | | Since 2021 | | Ms. Dowling is retired. Formerly, she was Senior Advisor (April 2021-September 2021); and Managing Director (2013-2021), BlackRock, Inc. (a financial services firm). Trustee — Goldman Sachs Variable Insurance Trust and Goldman Sachs Trust. | | | 103 | | | None |
Gregory G. Weaver Age: 71 | | Trustee | | Since 2015 | | Mr. Weaver is retired. He is Director, Verizon Communications Inc. (2015-Present); and was formerly Chairman and Chief Executive Officer, Deloitte & Touche LLP (a professional services firm) (2001-2005 and 2012-2014); and Member of the Board of Directors, Deloitte & Touche LLP (2006-2012). Trustee — Goldman Sachs Variable Insurance Trust and Goldman Sachs Trust. | | | 103 | | | Verizon Communications Inc. |
Paul C. Wirth Age: 65 | | Trustee | | Since 2022 | | Mr. Wirth is retired. Formerly, he was Deputy Chief Financial Officer and Principal Accounting Officer (2011-2020); Finance Director and Principal Accounting Officer (2010-2011); and Managing Director, Global Controller, and Chief Accounting Officer (2005-2010) of Morgan Stanley. Trustee — Goldman Sachs Variable Insurance Trust and Goldman Sachs Trust. | | | 103 | | | None |
GOLDMAN SACHS VARIABLE INSURANCE TRUST MULTI-ASSET STRATEGIES FUNDS
Trustees and Officers (Unaudited) (continued)
Interested Trustee*
| | | | | | | | | | | | |
| | | | | |
Name, Address and Age1 | | Position(s) Held
with the Trust | | Term of
Office and
Length of
Time Served2 | | Principal Occupation(s) During Past 5 Years | | Number of
Portfolios in
Fund Complex
Overseen by
Trustee3 | | | Other Directorships
Held by Trustee4 |
James A. McNamara Age: 60 | | President and Trustee | | Since 2007 | | Advisory Director, Goldman Sachs (January 2018-Present); Managing Director, Goldman Sachs (January 2000-December 2017); Director of Institutional Fund Sales, GSAM (April 1998-December 2000); and Senior Vice President and Manager, Dreyfus Institutional Service Corporation (January 1993-April 1998). President and Trustee — Goldman Sachs Variable Insurance Trust; Goldman Sachs Trust; Goldman Sachs Trust II; Goldman Sachs MLP and Energy Renaissance Fund; Goldman Sachs ETF Trust; Goldman Sachs ETF Trust II; Goldman Sachs Credit Income Fund; and Goldman Sachs Real Estate Diversified Income Fund. | | | 172 | | | None |
| | | | | | | | | | | | |
| * | Mr. McNamara is considered to be an “Interested Trustee” because he holds positions with Goldman Sachs and owns securities issued by The Goldman Sachs Group, Inc. Mr. McNamara holds comparable positions with certain other companies of which Goldman Sachs, GSAM or an affiliate thereof is the investment adviser, administrator and/or distributor. |
| 1 | Each Trustee may be contacted by writing to the Trustee, c/o Goldman Sachs, 200 West Street, New York, New York, 10282, Attn: Caroline Kraus. Information is provided as of December 31, 2022. |
| 2 | Subject to such policies as may be adopted by the Board from time-to-time, each Trustee holds office for an indefinite term, until the earliest of: (a) the election of his or her successor; (b) the date the Trustee resigns or is removed by the Board or shareholders, in accordance with the Trust’s Declaration of Trust; or (c) the termination of the Trust. The Board has adopted policies which provide that each Independent Trustee shall retire as of December 31st of the calendar year in which he or she reaches (a) his or her 75th birthday or (b) the 15th anniversary of the date he or she became a Trustee, whichever is earlier, unless a waiver of such requirements shall have been adopted by a majority of the other Trustees. These policies may be changed by the Trustees without shareholder vote. |
| 3 | The Goldman Sachs Fund Complex includes certain other companies listed above for each respective Trustee. As of December 31, 2022, Goldman Sachs Variable Insurance Trust consisted of 15 portfolios (12 of which offered shares to the public); Goldman Sachs Trust consisted of 88 portfolios; Goldman Sachs Trust II consisted of 18 portfolios (7 of which offered shares to the public); Goldman Sachs ETF Trust consisted of 45 portfolios (29 of which offered shares to the public); Goldman Sachs ETF Trust II consisted of 2 portfolios (1 of which offered shares to the public); and Goldman Sachs MLP and Energy Renaissance Fund, Goldman Sachs Credit Income Fund and Goldman Sachs Real Estate Diversified Income Fund each consisted of one portfolio. Goldman Sachs Credit Income Fund did not offer shares to the public. |
| 4 | This column includes only directorships of companies required to report to the Securities and Exchange Commission under the Securities Exchange Act of 1934 (i.e., “public companies”) or other investment companies registered under the Act. |
| 5 | Ms. Daniels and Ms. Palmer retired as Independent Trustees effective January 1, 2023. |
Additional information about the Trustees is available in the Funds’ Statement of Additional Information, which can be obtained from Goldman Sachs free of charge by calling this toll-free number (in the United States of America): 1-800-526-7384.
GOLDMAN SACHS VARIABLE INSURANCE TRUST MULTI-ASSET STRATEGIES FUNDS
Trustees and Officers (Unaudited) (continued)
Officers of the Trust*
| | | | | | |
| | | |
| Name, Address and Age1 | | Positions Held
with the Trust | | Term of Office
and Length of
Time Served2 | | Principal Occupation(s) During Past 5 Years |
James A. McNamara
200 West Street New York, NY 10282 Age: 60 | | Trustee and
President | | Since 2007 | | Advisory Director, Goldman Sachs (January 2018-Present); Managing Director, Goldman Sachs (January 2000-December 2017); Director of Institutional Fund Sales, GSAM (April 1998-December 2000); and Senior Vice President and Manager, Dreyfus Institutional Service Corporation (January 1993-April 1998). President and Trustee — Goldman Sachs Variable Insurance Trust; Goldman Sachs Trust; Goldman Sachs Trust II; Goldman Sachs MLP and Energy Renaissance Fund; Goldman Sachs ETF Trust; Goldman Sachs ETF Trust II; Goldman Sachs Credit Income Fund; and Goldman Sachs Real Estate Diversified Income Fund. |
Joseph F. DiMaria
30 Hudson Street Jersey City, NJ 07302 Age: 54 | | Treasurer,
Principal
Financial Officer
and Principal
Accounting
Officer | | Since 2017 (Treasurer and Principal Financial Officer since 2019) | | Managing Director, Goldman Sachs (November 2015-Present) and Vice President-Mutual Fund Administration, Columbia Management Investment Advisers, LLC (May 2010-October 2015). Treasurer, Principal Financial Officer and Principal Accounting Officer — Goldman Sachs Variable Insurance Trust (previously Assistant Treasurer (2016)); Goldman Sachs Trust (previously Assistant Treasurer (2016)); Goldman Sachs Trust II (previously Assistant Treasurer (2017)); Goldman Sachs MLP and Energy Renaissance Fund (previously Assistant Treasurer (2017)); Goldman Sachs ETF Trust (previously Assistant Treasurer (2017)); Goldman Sachs ETF Trust II; Goldman Sachs Credit Income Fund; and Goldman Sachs Real Estate Diversified Income Fund. |
Caroline L. Kraus
200 West Street New York, NY 10282 Age: 45 | | Secretary | | Since 2012 | | Managing Director, Goldman Sachs (January 2016-Present); Vice President, Goldman Sachs (August 2006-December 2015); Senior Counsel, Goldman Sachs (January 2020-Present); Associate General Counsel, Goldman Sachs (2012-December 2019); Assistant General Counsel, Goldman Sachs (August 2006-December 2011); and Associate, Weil, Gotshal & Manges, LLP (2002-2006). Secretary — Goldman Sachs Variable Insurance Trust (previously Assistant Secretary (2012)); Goldman Sachs Trust (previously Assistant Secretary (2012)); Goldman Sachs Trust II; Goldman Sachs BDC, Inc.; Goldman Sachs Private Middle Market Credit LLC; Goldman Sachs Private Middle Market Credit II LLC; Goldman Sachs Middle Market Lending Corp.; Goldman Sachs MLP and Energy Renaissance Fund; Goldman Sachs ETF Trust; Goldman Sachs ETF Trust II; Goldman Sachs Credit Income Fund; and Goldman Sachs Real Estate Diversified Income Fund. |
| | | | | | |
| * | Represents a partial list of officers of the Trust. Additional information about all the officers is available in the Funds’ Statement of Additional Information, which can be obtained from Goldman Sachs free of charge by calling this toll-free number (in the United States): 1-800-526-7384. |
| 1 | Information is provided as of December 31, 2022. |
| 2 | Officers hold office at the pleasure of the Board of Trustees or until their successors are duly elected and qualified. Each officer holds comparable positions with certain other companies of which Goldman Sachs, GSAM or an affiliate thereof is the investment adviser, administrator and/or distributor. |
Goldman Sachs Variable Insurance Trust — Tax Information (Unaudited)
For the year ended December 31, 2022, 3.28% and 5.23% of the dividends paid from net investment company taxable income by the Goldman Sachs Multi-Strategy Alternatives Portfolio and Goldman Sachs Trend Driven Allocation Fund, respectively, qualify for the dividends received deduction available to corporations.
For the year ended December 31, 2022, the Goldman Sachs Multi-Strategy Alternatives Portfolio elected to pass through a credit for taxes paid to foreign jurisdictions. The total amount of income received by the Goldman Sachs Multi-Strategy Alternatives Portfolio from sources within foreign countries and possessions of the United States was $0.0152 per share, all of which was attributable to qualified passive income. The percentage of net investment income dividends paid by the Goldman Sachs Multi-Strategy Alternatives Portfolio during the year ended December 31, 2022 from foreign sources was 2.08%. The total amount of foreign taxes paid by the Goldman Sachs Multi-Strategy Alternatives Portfolio was $0.0030 per share.
Pursuant to Section 852 of the Internal Revenue Code, the Goldman Sachs Trend Driven Allocation Fund designated $6,691,886 or, if different, the maximum amount allowable, as capital gain dividends paid during the fiscal year ended December 31, 2022.
| | |
| TRUSTEES | | OFFICERS |
| Gregory G. Weaver, Chair | | James A. McNamara, President |
| Dwight L. Bush | | Joseph F. DiMaria, Principal Financial Officer, |
| Kathryn A. Cassidy | | Principal Accounting Officer and Treasurer |
| John G. Chou | | Caroline L. Kraus, Secretary |
Joaquin Delgado | | |
| Eileen H. Dowling | | |
| James A. McNamara | | |
| Paul C. Wirth | | |
GOLDMAN SACHS & CO. LLC
Distributor and Transfer Agent
GOLDMAN SACHS ASSET MANAGEMENT, L.P.
Investment Adviser
200 West Street, New York
New York 10282
Visit our web site at www.GSAMFUNDS.com to obtain the most recent month-end returns.
The reports concerning the Fund included in this shareholder report may contain certain forward-looking statements about the factors that may affect the performance of the Fund in the future. These statements are based on Fund management’s predictions and expectations concerning certain future events and their expected impact on the Fund, such as performance of the economy as a whole and of specific industry sectors, changes in the levels of interest rates, the impact of developing world events, and other factors that may influence the future performance of the Fund. Management believes these forward-looking statements to be reasonable, although they are inherently uncertain and difficult to predict. Actual events may cause adjustments in portfolio management strategies from those currently expected to be employed.
A description of the policies and procedures that the Fund uses to determine how to vote proxies relating to portfolio securities and information regarding how the Fund voted proxies relating to portfolio securities for the 12-month period ended June 30 is available (i) without charge, upon request by calling 1-800-621-2550; and (ii) on the Securities and Exchange Commission (“SEC”) web site at http://www.sec.gov.
The Fund will file its portfolio holdings information for each month in a fiscal quarter within 60 days after the end of the relevant fiscal quarter on Form N-PORT. Portfolio holdings information for the third month of each fiscal quarter will be made available on the SEC’s web site at http://www.sec.gov. Portfolio holdings information may be obtained upon request and without charge by calling 1-800-526-7384 (for Retail Shareholders) or 1-800-621-2550 (for Institutional Shareholders).
Views and opinions expressed are for informational purposes only and do not constitute a recommendation by GSAM to buy, sell, or hold any security. Views and opinions are current as of the date of this presentation and may be subject to change, they should not be construed as investment advice.
Goldman Sachs & Co. LLC (“Goldman Sachs”) does not provide legal, tax or accounting advice. Any statement contained in this communication (including any attachments) concerning U.S. tax matters was not intended or written to be used, and cannot be used, for the purpose of avoiding penalties under the Internal Revenue Code, and was written to support the promotion or marketing of transaction or matter addressed. Clients of Goldman Sachs should obtain their own independent tax advice based on their particular circumstances.
The website links provided are for your convenience only and are not an endorsement or recommendation by GSAM of any of these websites or the products or services offered. GSAM is not responsible for the accuracy and validity of the content of these websites.
Fund holdings and allocations shown are as of December 31, 2022 and may not be representative of future investments. Fund holdings should not be relied on in making investment decisions and should not be construed as research or investment advice regarding particular securities. Current and future holdings are subject to risk.
References to indices, benchmarks or other measures of relative market performance over a specified period of time are provided for your information only and do not imply that the portfolio will achieve similar results. The index composition may not reflect the manner in which a portfolio is constructed. While an adviser seeks to design a portfolio which reflects appropriate risk and return features, portfolio characteristics may deviate from those of the benchmark.
The portfolio risk management process includes an effort to monitor and manage risk, but does not imply low risk.
Shares of the Goldman Sachs VIT Funds are offered to separate accounts of participating life insurance companies for the purpose of funding variable annuity contracts and variable life insurance policies. Shares of the Fund are not offered directly to the general public. The variable annuity contracts and variable life insurance policies are described in the separate prospectuses issued by participating insurance companies. You should refer to those prospectuses for information about surrender charges, mortality and expense risk fees and other charges that may be assessed by participating insurance companies under the variable annuity contracts or variable life insurance policies. Such fees or charges, if any, may affect the return you may realize with respect to your investments. Ask your representative for more complete information. Please consider a fund’s objectives, risks and charges and expenses, and read the prospectus carefully before investing. The prospectus contains this and other information about the Fund.
This material is not authorized for distribution to prospective investors unless preceded or accompanied by a current prospectus or summary prospectus, if applicable. Investors should consider the Fund’s objective, risks, and charges and expenses, and read the summary prospectus, if available, and/or the prospectus carefully before investing or sending money. The summary prospectus, if available, and the prospectus contain this and other information about the Fund and may be obtained from your authorized dealer or from Goldman Sachs & Co. LLC by calling 1-800-621-2550.
This report is prepared for the general information of contract owners and is not an offer of shares of the Goldman Sachs Variable Insurance Trust — Goldman Sachs Global Trends Allocation Fund.
© 2023 Goldman Sachs. All rights reserved.
VITFOFAR-23 268095-OTU-1554694
Goldman
Sachs Variable Insurance Trust
Goldman Sachs Core Fixed Income Fund
Annual Report
December 31, 2022

Goldman Sachs Variable Insurance Trust
| ∎ | | GOLDMAN SACHS CORE FIXED INCOME FUND |
| | | | |
| | | |
| NOT FDIC-INSURED | | May Lose Value | | No Bank Guarantee |
GOLDMAN SACHS VARIABLE INSURANCE TRUST CORE FIXED INCOME FUND
INVESTMENT OBJECTIVE
The Fund seeks a total return consisting of capital appreciation and income that exceeds the total return of the Bloomberg U.S. Aggregate Bond Index.
Portfolio Management Discussion and Analysis
Below, the Goldman Sachs Fixed Income Portfolio Management Team discusses the Goldman Sachs Variable Insurance Trust — Goldman Sachs Core Fixed Income Fund’s (the “Fund”) performance and positioning for the 12-month period ended December 31, 2022 (the “Reporting Period”).
How did the Fund perform during the Reporting Period?
During the Reporting Period, the Fund’s Institutional and Service Shares generated average annual total returns of -14.03% and -14.28%, respectively. This compares to the -13.01% average annual total return of the Fund’s benchmark, the Bloomberg U.S. Aggregate Bond Index (the “Bloomberg Index”), during the same time period.
What economic and market factors most influenced the U.S. fixed income market and the Fund during the Reporting Period?
During the Reporting Period, the U.S. fixed income market and the Fund were influenced most by the Federal Reserve’s (the “Fed”) hawkish policy, including interest rates hikes and quantitative tightening. (Hawkish tends to suggest higher interest rates; opposite of dovish. Quantitative tightening refers to the reduction in the size of the Fed’s balance sheet.) Other factors included the Russia/Ukraine conflict, persistent inflation and the strong jobs market, the potential of a U.S. recession, global economic growth concerns, and the U.K. budget and the so-called “Gilt crisis.” (Gilts are U.K. government bonds.)
In the first quarter of 2022, when the Reporting Period began, the U.S. fixed income market broadly reflected the impact of inflationary pressures and generally hawkish monetary policy developments. At their January policy meeting, Fed officials kept short-term interest rates on hold but hinted they might implement a rate hike in March. During February, geopolitical tensions added uncertainty to an already complex investment backdrop. Inflation surged to new multi-decade highs, as energy and commodity prices in particular jumped in response to Russia’s invasion of Ukraine late in the month. The Fed accelerated the pace of its asset purchase tapering, which it had started in November 2021, and ended it entirely in March 2022. Also in March, after the onset of the Russia/Ukraine war and against the backdrop of tightening financial conditions, the Fed raised short-term interest rates by 25 basis points, the first rate hike since the end of 2018. (A basis point is 1/100th of a percentage point.) Credit spreads widened, as bond yields rose in response to inflationary pressures and Fed policy action (Credit spreads or yield differentials between corporate bonds and U.S. Treasury securities of similar maturity).
During the second quarter of 2022, rising inflation, the Fed’s policy response and recession worries were at the core of the market narrative. In May 2022, U.S. consumer inflation reached its highest level in nearly four decades and then hit a new high in June, as rising energy and food costs pushed up prices. Supply-chain disruptions, high energy prices and uncertainty related to the Russia/Ukraine war appeared to increase the risk of recession. The Fed accelerated its pace of tightening, raising short-term interest rates by 50 basis points in May and then by 75 basis points in June. Rising short-term yields and expectations for continued Fed tightening hurt duration-sensitive securities, while concerns about the U.S. economic outlook led to credit spread widening. (Duration is a measure of a security’s sensitivity to changes in interest rates.)
In the third quarter of 2022, noticeable tightening of financial conditions, guided by investor expectations for a more aggressive Fed interest rate hiking cycle, was the major story. The Fed’s hawkish policy was supported by higher than consensus expected core Consumer Price Index (“CPI”) data and a still-tight labor market that showed only moderate signs of cooling. (Core CPI data excludes food and energy prices.) Indeed, during July, Fed officials raised short-term interest rates by 75 basis points. That same month, the U.S. Treasury yield curve, or spectrum of maturities, inverted between two-year and 10-year maturities, meaning two-year yields were higher than 10-year yields. (Historically, an inverted U.S. Treasury yield curve often precedes an economic recession.) The Fed hiked short-term interest rates again in September, by another 75 basis points. In the U.K., the government unveiled a budget intended to support growth through personal and corporate tax cuts combined with supply-side reforms. After this expansionary fiscal policy was announced, U.K. bonds sold off sharply and 10-year and 30-year U.K. Gilt yields rose significantly. Subsequently, both 10-year U.S. Treasury and German government bond yields rose to their highest levels in more than a decade.
GOLDMAN SACHS VARIABLE INSURANCE TRUST CORE FIXED INCOME FUND
During the fourth quarter of 2022, investor optimism about a drop in inflationary pressures gave way to worries about the scope of Fed tightening and the potential of a recession. In October, Fed officials began to contend that inflation would likely decline in the upcoming months should demand weaken and supply-chain issues soften as policymakers anticipated. However, policymakers also suggested they would end their current tightening cycle with short-term interest rates at a higher level than many market participants had expected. In this environment, the U.S. Treasury yield curve inversion increased, as two-year yields rose in anticipation of additional upcoming Fed action. In early November, the Fed raised short-term interest rates by another 75 basis points. Broad messaging from policymakers suggested a strong preference to slow the pace of interest rate hikes to allow them to evaluate the impact of the significant tightening during 2022 year to date. Ten-year U.S. Treasury yields fell in response. In December, the release of November’s inflation numbers surprised to the downside, suggesting inflationary pressures were easing. The Fed raised short-term interest rates by 50 basis points, but policymakers indicated they were determined to continue their fight to tame inflation and that ongoing rate hikes would likely be “appropriate.” Elsewhere, the controversial U.K. budget was withdrawn in mid-October, reducing investor concerns about U.K. fiscal policy and its inflationary implications. A new U.K. budget was announced in November, which was seen more positively by markets, as it included tax increases and spending cuts that sought to fill a substantial funding gap.
During the Reporting Period overall, spread, or non-government bond, sectors generated negative absolute returns. High yield corporate bonds and sovereign emerging markets debt performed the worst and also underperformed U.S. Treasury securities. Mortgage-backed securities, commercial mortgage-backed securities, asset-backed securities and investment grade corporate bonds also recorded negative returns and underperformed U.S. Treasury securities. Higher quality securities broadly outperformed those of lower quality.
U.S. Treasury yields rose during the Reporting Period, with shorter-term yields rising more than longer-term yields. In addition, as mentioned previously, the Fed’s continued, aggressive rate hiking cycle, along with persistent inflation and worries about global economic growth, led the U.S. Treasury yield curve to invert. The yield on the bellwether 10-year U.S. Treasury rose approximately 236 basis points to end the Reporting Period at 3.88%. (A basis point is 1/100th of a percentage point.)
What key factors were responsible for the Fund’s performance during the Reporting Period?
During the Reporting Period, the Fund’s cross-sector strategy detracted from its relative returns. In our cross-sector strategy, we invest Fund assets across a variety of fixed income sectors, including some that may not be included in the Bloomberg Index. In addition, security selection, which capitalizes on our fundamental research capabilities, hampered the Fund’s performance. Our currency strategy did not have a material impact on the Fund’s results during the Reporting Period.
The Fund’s combined tactical duration and yield curve positioning contributed positively to its relative performance during the Reporting Period.
Which fixed income market sectors most affected Fund performance during the Reporting Period?
During the Reporting Period, the Fund’s overweight position relative to the Bloomberg Index in corporate credit detracted from its relative returns. In addition, the Fund was hindered by our credit-interest rate paired strategy, which we used to hedge the Fund’s overweight in corporate credit, as interest rates rose and credit spreads widened during the Reporting Period. Overweight positions in collateralized loan obligations (“CLOs”) and commercial mortgage-backed securities (“CMBS”) also subtracted from relative returns. On the positive side, the Fund benefited from its tactical positioning versus the Bloomberg Index in agency mortgage-backed securities. At the beginning of the Reporting Period, the Fund had an underweight position, as we did not consider agency mortgage-backed securities attractively valued and we expected the Fed to end its purchases of mortgage-backed securities. Subsequently, as interest rates rose and volatility increased, mortgage-backed securities spreads widened, and we moved the Fund from an underweight to an overweight position. Collectively, these tactical decisions bolstered Fund performance. Finally, the Fund was helped by our decision to increase exposure to investment grade corporate bonds during the third quarter of 2022 in response to strong corporate fundamentals and earnings resiliency.
As for individual issue selection, the Fund’s investments in emerging markets debt detracted from relative performance. The Fund had a small position in Russian investment grade corporate bonds, specifically in Russian gas producer Gazprom and Russian oil and gas company Lukoil, which dampened performance. We sold the Fund’s investments in Gazprom and Lukoil as a result of geopolitical uncertainty in the wake of Russia’s invasion of Ukraine. In the securitized sector, selection of CLOs had a negative impact on the Fund’s relative returns. In the government sector, the Fund was aided by security selection among U.S. Treasury securities and agency securities. Among pass-through mortgage securities, the Fund’s investments in Government National Mortgage Association (“GNMA”) mortgage-backed securities detracted from the Fund’s relative returns. (Pass-through mortgage securities consist of a pool of residential mortgage loans in which homeowners’ monthly payments of principal, interest and prepayments pass from the mortgage servicer through a government agency or investment bank to investors.)
GOLDMAN SACHS VARIABLE INSURANCE TRUST CORE FIXED INCOME FUND
Regarding country selection, the Fund’s long positions in Australia, Switzerland and Europe overall versus its short positions in the U.K., Sweden and New Zealand detracted from relative performance.
Did the Fund’s duration and yield curve positioning help or hurt its results during the Reporting Period?
During the Reporting Period, the Fund’s duration positioning contributed positively to relative performance. More specifically, the Fund benefited from our active duration management, wherein we made small tactical shifts relative to the Bloomberg Index over the course of the Reporting Period. The Fund’s yield curve positioning did not have a material impact on its performance during the Reporting Period.
How did the Fund use derivatives and similar instruments during the Reporting Period?
As market conditions warranted during the Reporting Period, currency transactions were carried out using forward foreign exchange contracts. Currency transactions were used as we sought both to enhance returns and to hedge the Fund’s portfolio against currency exchange rate fluctuations. Forward foreign exchange contracts had a positive impact on Fund performance during the Reporting Period. In addition, futures contracts were employed as warranted to facilitate specific duration, yield curve and country strategies. During the Reporting Period, futures contracts overall had a negative impact on the Fund’s results.
Swaptions (options on interest rate swap contracts), which were used to express our interest rate views and to hedge volatility and yield curve risks in the Fund, did not have a meaningful impact on the Fund’s performance during the Reporting Period. Interest rate swaps, which were used to manage exposure to fluctuations in interest rates, had a negative impact on the Fund’s performance. Additionally, the Fund employed index credit default swaps as well as individual credit default swaps to implement specific credit-related investment strategies, including management of the Fund’s exposure to credit spreads, which collectively had a negative impact on the Fund’s results during the Reporting Period overall.
We employ derivatives and similar instruments to efficiently management of the Fund. Derivatives and similar instruments allow us to manage interest rate, credit and currency risks more effectively by allowing us both to hedge and to apply active investment views with greater versatility and to afford greater risk management precision than we would otherwise be able to implement.
Were there any notable changes in the Fund’s weightings during the Reporting Period?
During the Reporting Period, we increased the Fund’s overweight position compared to the Bloomberg Index in pass-through mortgage securities. Additionally, we increased the Fund’s underweight versus the Bloomberg Index in U.S. government securities.
Were there any changes to the Fund’s portfolio management team during the Reporting Period?
Effective October 25, 2022, Ron Arons became a portfolio manager for the Fund, joining Ashish Shah. By design, all investment decisions for the Fund are performed within a team structure, with multiple subject matter experts. This strategic decision making has been a cornerstone of our approach and helps ensures continuity in the Fund.
What is the Fund’s tactical view and strategy for the months ahead?
At the end of the Reporting Period, we believed five factors would dominate fixed income market sentiment in 2023. The first, in our view, is Fed policy and its possible impact on overall financial stability, with investors considering how high short-term interest rates might go and how long they would stay elevated before the Fed began easing. An ongoing tightening regime has the potential, historically speaking, to increase the risk of financial instability, including exacerbating poor liquidity conditions in the U.S. Treasury market and creating challenges for corporate borrowers due to a higher cost of capital. We thought the second key factor is the uncertain outlook for inflation and economic growth, and the third is related to labor market rebalancing and how a decline in job openings might ease pressures on wage growth and, in turn, overall inflation. In our opinion, the fourth factor is likely to be geopolitical events, including the possible escalation of the Russia/Ukraine war and the growing tensions between the U.S. and China. And finally, we believed the fifth key factor is the impact of China’s exit from its “zero-COVID” policy, including the reopening of that country’s economy and financial markets.
Under the circumstances, and given continued economic uncertainty, we favored an up-in-quality bias among spread sectors at the end of the Reporting Period. In terms of positioning, the Fund was overweight corporate credit and asset-backed securities compared to the Bloomberg Index. At the end of the Reporting Period, the Fund was also overweight pass-through mortgage securities and underweight U.S. government securities.
FUND BASICS
FUND COMPOSITION1
As of December 31, 2022

| 1 | The percentage shown for each investment category reflects the value of investments in that category as a percentage of net assets. Figures in the above graph may not sum to 100% due to the exclusion of other assets and liabilities. Short-Term Investments represent investments in commercial paper. Underlying sector allocations of investment companies held by the Fund are not reflected in the graph above. The graph depicts the Fund’s investments but may not represent the Fund’s market exposure due to the exclusion of certain derivatives, if any, as listed in the Additional Investment Information section of the Schedule of Investments. |
| 2 | “U.S. Government Agency Security” include agency securities offered by companies such as Federal Farm Credit Bank (“FFCB”) and the Federal National Mortgage Association (“FNMA”) which operate under a government charter. While they are required to report to a government regulator, their assets are not explicitly guaranteed by the government and they otherwise operate like any other publicly traded company. |
| 3 | Mortgage-backed securities guaranteed by the GNMA, FNMA or the Federal Home Loan Mortgage Corp. (“FHLMC”). GNMA instruments are backed by the full faith and credit of the United States Government. |
For more information about your Fund, please refer to www.GSAMFUNDS.com. There, you can learn more about your Fund’s investment strategies, holdings, and performance.
GOLDMAN SACHS VARIABLE INSURANCE TRUST CORE FIXED INCOME FUND
Performance Summary
December 31, 2022
The following graph shows the value, as of December 31, 2022, of a $10,000 investment made on January 1, 2013 in Service Shares at NAV. For comparative purposes, the performance of the Fund’s benchmark, the Bloomberg U.S. Aggregate Bond Index, is shown. Performance reflects applicable fee waivers and/or expense limitations in effect during the periods shown and, in their absence, performance would be reduced. Returns do not reflect the deduction of taxes that a shareholder would pay on Fund distributions or the redemption of Fund shares. The returns set forth below represent past performance. Past performance does not guarantee future results. The Fund’s investment return and principal value will fluctuate so that an investor’s shares, when redeemed, may be worth more or less than their original cost. Current performance may be lower or higher than the performance quoted below. Please visit our web site at www.GSAMFUNDS.com to obtain the most recent month-end returns.
Core Fixed Income Fund’s 10 Year Performance
Performance of a $10,000 investment, with distributions reinvested, from January 1, 2013 through December 31, 2022.
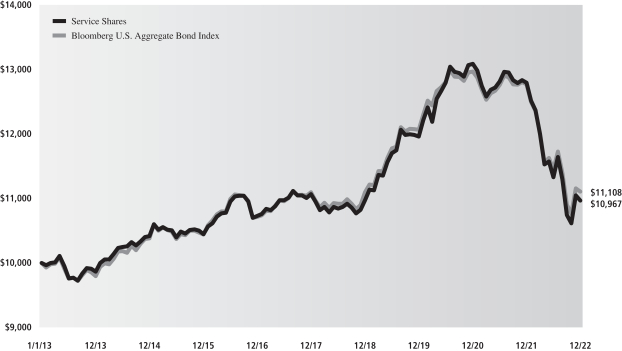
| | | | | | | | |
| Average Annual Total Return through December 31, 2022 | | One Year | | Five Years | | Ten Years | | Since Inception |
Institutional (Commenced April 30, 2013) | | -14.03% | | 0.06% | | N/A | | 1.10% |
Service | | -14.28% | | -0.18% | | 0.93% | | — |
GOLDMAN SACHS VARIABLE INSURANCE TRUST CORE FIXED INCOME FUND
Index Definitions
Bloomberg U.S. Aggregate Bond Index represents an unmanaged diversified portfolio of fixed income securities, including U.S. Treasuries, investment-grade corporate bonds and mortgage-backed and asset-backed securities.
It is not possible to invest directly in an unmanaged index.
GOLDMAN SACHS VARIABLE INSURANCE TRUST CORE FIXED INCOME FUND
Schedule of Investments
December 31, 2022
| | | | | | | | | | | | | | |
Principal
Amount | | | Interest
Rate | | | Maturity
Date | | | Value | |
|
| Mortgage-Backed Securities – 57.4% | |
| | FHLMC | |
| $ | 3,605 | | | | 7.500 | % | | | 12/01/29 | | | $ | 3,806 | |
| | 1,110 | | | | 5.000 | | | | 10/01/33 | | | | 1,115 | |
| | 1,489 | | | | 5.000 | | | | 07/01/35 | | | | 1,497 | |
| | 2,231 | | | | 5.000 | | | | 12/01/35 | | | | 2,250 | |
| | 432 | | | | 5.000 | | | | 03/01/38 | | | | 437 | |
| | 916 | | | | 5.000 | | | | 06/01/41 | | | | 927 | |
| | 5,026 | | | | 4.500 | | | | 08/01/48 | | | | 4,923 | |
| | 5,649 | | | | 4.500 | | | | 11/01/48 | | | | 5,507 | |
| | 620,005 | | | | 3.000 | | | | 09/01/49 | | | | 555,788 | |
| | 453,123 | | | | 4.000 | | | | 03/01/50 | | | | 433,621 | |
| | 949,576 | | | | 4.500 | | | | 03/01/50 | | | | 932,812 | |
| | 312,733 | | | | 3.000 | | | | 10/01/50 | | | | 279,071 | |
| | 957,724 | | | | 2.500 | | | | 05/01/51 | | | | 814,146 | |
| | 961,945 | | | | 2.500 | | | | 05/01/51 | | | | 826,919 | |
| | 899,303 | | | | 2.500 | | | | 09/01/51 | | | | 768,292 | |
| | 3,999,997 | | | | 2.000 | | | | 03/01/52 | | | | 3,268,049 | |
| | 2,000,000 | | | | 2.000 | | | | 04/01/52 | | | | 1,634,026 | |
| | 783,002 | | | | 4.500 | | | | 04/01/52 | | | | 757,434 | |
| | 612,061 | | | | 4.500 | | | | 06/01/52 | | | | 593,705 | |
| | 358,080 | | | | 4.500 | | | | 06/01/52 | | | | 349,185 | |
| | 443,963 | | | | 6.000 | | | | 12/01/52 | | | | 459,808 | |
| | FNMA | |
| | 162 | | | | 5.500 | | | | 09/01/23 | | | | 162 | |
| | 106 | | | | 5.500 | | | | 09/01/23 | | | | 106 | |
| | 96 | | | | 5.500 | | | | 10/01/23 | | | | 96 | |
| | 321 | | | | 4.500 | | | | 07/01/24 | | | | 318 | |
| | 1,348 | | | | 9.000 | | | | 11/01/25 | | | | 1,365 | |
| | 11,075 | | | | 7.000 | | | | 08/01/26 | | | | 11,271 | |
| | 3,700 | | | | 8.000 | | | | 10/01/29 | | | | 3,869 | |
| | 871 | | | | 8.500 | | | | 04/01/30 | | | | 932 | |
| | 1,639 | | | | 8.000 | | | | 05/01/30 | | | | 1,687 | |
| | 3,303 | | | | 8.000 | | | | 08/01/32 | | | | 3,537 | |
| | 4,309 | | | | 4.500 | | | | 08/01/39 | | | | 4,265 | |
| | 14,080 | | | | 3.000 | | | | 01/01/43 | | | | 12,842 | |
| | 7,574 | | | | 3.000 | | | | 01/01/43 | | | | 6,908 | |
| | 9,017 | | | | 3.000 | | | | 03/01/43 | | | | 8,224 | |
| | 21,867 | | | | 3.000 | | | | 03/01/43 | | | | 19,944 | |
| | 67,049 | | | | 3.000 | | | | 03/01/43 | | | | 61,152 | |
| | 16,128 | | | | 3.000 | | | | 04/01/43 | | | | 14,709 | |
| | 19,581 | | | | 3.000 | | | | 04/01/43 | | | | 17,859 | |
| | 82,055 | | | | 3.000 | | | | 04/01/43 | | | | 74,838 | |
| | 11,595 | | | | 3.000 | | | | 04/01/43 | | | | 10,575 | |
| | 8,859 | | | | 3.000 | | | | 04/01/43 | | | | 8,080 | |
| | 10,844 | | | | 3.000 | | | | 05/01/43 | | | | 9,891 | |
| | 41,348 | | | | 3.000 | | | | 05/01/43 | | | | 37,711 | |
| | 45,752 | | | | 3.000 | | | | 05/01/43 | | | | 41,728 | |
| | 299,244 | | | | 4.000 | | | | 12/01/44 | | | | 289,334 | |
| | 255,191 | | | | 4.500 | | | | 04/01/45 | | | | 253,616 | |
| | 30,793 | | | | 4.500 | | | | 05/01/45 | | | | 30,584 | |
| | 913,834 | | | | 3.500 | | | | 07/01/45 | | | | 852,286 | |
| | 598,235 | | | | 4.000 | | | | 08/01/45 | | | | 578,423 | |
| | 454,286 | | | | 4,000 | | | | 01/01/46 | | | | 437,680 | |
| | 143,175 | | | | 4.000 | | | | 02/01/48 | | | | 137,583 | |
| | 170,283 | | | | 4.000 | | | | 03/01/48 | | | | 163,632 | |
| | 3,349 | | | | 4.000 | | | | 07/01/48 | | | | 3,215 | |
| | 10,769 | | | | 4.000 | | | | 07/01/48 | | | | 10,369 | |
| | |
|
| Mortgage-Backed Securities – (continued) | |
| | FNMA – (continued) | |
| 293,049 | | | | 4.500 | | | | 07/01/48 | | | | 287,028 | |
| | 189,525 | | | | 4.000 | | | | 08/01/48 | | | | 181,827 | |
| | 157,250 | | | | 5.000 | | | | 11/01/48 | | | | 159,321 | |
| | 624,875 | | | | 3.000 | | | | 10/01/50 | | | | 557,615 | |
| | 478,181 | | | | 3.000 | | | | 10/01/50 | | | | 427,906 | |
| | 626,589 | | | | 3.000 | | | | 10/01/50 | | | | 560,711 | |
| | 79,543 | | | | 2.500 | | | | 03/01/51 | | | | 68,526 | |
| | 101,260 | | | | 2.500 | | | | 09/01/51 | | | | 87,078 | |
| | 403,091 | | | | 2.500 | | | | 10/01/51 | | | | 345,382 | |
| | 234,782 | | | | 2.500 | | | | 11/01/51 | | | | 201,051 | |
| | 181,325 | | | | 2.500 | | | | 11/01/51 | | | | 155,816 | |
| | 1,999,999 | | | | 2.000 | | | | 03/01/52 | | | | 1,634,025 | |
| | 5,999,405 | | | | 2.000 | | | | 04/01/52 | | | | 4,901,591 | |
| | 1,999,801 | | | | 2.000 | | | | 06/01/52 | | | | 1,633,238 | |
| | 970,448 | | | | 4.500 | | | | 08/01/52 | | | | 946,038 | |
| | 1,556,964 | | | | 6.000 | | | | 11/01/52 | | | | 1,607,668 | |
| | 3,000,000 | | | | 2.500 | | | | TBA-30yr | (a) | | | 2,537,412 | |
| | 1,000,000 | | | | 3.000 | | | | TBA-30yr | (a) | | | 876,846 | |
| | 1,000,000 | | | | 3.500 | | | | TBA-30yr | (a) | | | 907,751 | |
| | 3,000,000 | | | | 5.000 | | | | TBA-30yr | (a) | | | 2,955,249 | |
| | 2,000,000 | | | | 5.500 | | | | TBA-30yr | (a) | | | 2,005,340 | |
| | 2,000,000 | | | | 6.000 | | | | TBA-30yr | (a) | | | 2,030,938 | |
| | 1,000,000 | | | | 6.500 | | | | TBA-30yr | (a) | | | 1,024,530 | |
| | FNMA Series 2012-111, Class B | |
| | 5,483 | | | | 7.000 | | | | 10/25/42 | | | | 5,819 | |
| | FNMA Series 2012-153, Class B | |
| | 14,699 | | | | 7.000 | | | | 07/25/42 | | | | 15,715 | |
| | GNMA | |
| | 187 | | | | 7.000 | | | | 10/15/25 | | | | 187 | |
| | 1,796 | | | | 7.000 | | | | 11/15/25 | | | | 1,807 | |
| | 83 | | | | 7.000 | | | | 02/15/26 | | | | 83 | |
| | 602 | | | | 7.000 | | | | 04/15/26 | | | | 608 | |
| | 644 | | | | 7.000 | | | | 04/15/26 | | | | 647 | |
| | 714 | | | | 7.000 | | | | 03/15/27 | | | | 718 | |
| | 314 | | | | 7.000 | | | | 11/15/27 | | | | 316 | |
| | 1,581 | | | | 7.000 | | | | 11/15/27 | | | | 1,619 | |
| | 3,840 | | | | 7.000 | | | | 02/15/28 | | | | 3,899 | |
| | 585 | | | | 7.000 | | | | 04/15/28 | | | | 588 | |
| | 76 | | | | 7.000 | | | | 05/15/28 | | | | 78 | |
| | 1,586 | | | | 7.000 | | | | 06/15/28 | | | | 1,620 | |
| | 1,689 | | | | 7.000 | | | | 07/15/28 | | | | 1,724 | |
| | 667 | | | | 7.000 | | | | 07/15/28 | | | | 684 | |
| | 6,833 | | | | 7.000 | | | | 09/15/28 | | | | 6,984 | |
| | 48,918 | | | | 6.000 | | | | 08/20/34 | | | | 51,142 | |
| | 40,949 | | | | 5.000 | | | | 06/15/40 | | | | 41,843 | |
| | 175,183 | | | | 4.000 | | | | 08/20/43 | | | | 170,157 | |
| | 66,119 | | | | 4.000 | | | | 10/20/45 | | | | 64,057 | |
| | 198,590 | | | | 3.500 | | | | 04/20/47 | | | | 185,281 | |
| | 245,747 | | | | 3.500 | | | | 12/20/47 | | | | 229,278 | |
| | 34,305 | | | | 5.000 | | | | 08/20/48 | | | | 34,507 | |
| | 110,605 | | | | 4.500 | | | | 09/20/48 | | | | 108,602 | |
| | 116,978 | | | | 5.000 | | | | 10/20/48 | | | | 117,595 | |
| | 331,668 | | | | 5.000 | | | | 11/20/48 | | | | 333,419 | |
| | 41,623 | | | | 5.000 | | | | 12/20/48 | | | | 41,843 | |
| | 256,588 | | | | 4.500 | | | | 01/20/49 | | | | 252,101 | |
| | |
| | |
| The accompanying notes are an integral part of these financial statements. | | 7 |
GOLDMAN SACHS VARIABLE INSURANCE TRUST CORE FIXED INCOME FUND
Schedule of Investments (continued)
December 31, 2022
| | | | | | | | | | | | | | |
Principal
Amount | | | Interest
Rate | | | Maturity
Date | | | Value | |
|
| Mortgage-Backed Securities – (continued) | |
| | GNMA – (continued) | |
| $ | 35,521 | | | | 4.500 | % | | | 03/20/49 | | | $ | 34,900 | |
| | 712,735 | | | | 3.000 | | | | 08/20/49 | | | | 641,786 | |
| | 232,513 | | | | 4.500 | | | | 10/20/49 | | | | 228,203 | |
| | 460,317 | | | | 3.000 | | | | 03/20/50 | | | | 414,594 | |
| | 233,096 | | | | 4.500 | | | | 03/20/50 | | | | 227,490 | |
| | 715,029 | | | | 3.500 | | | | 02/20/51 | | | | 664,229 | |
| | 898,477 | | | | 3.000 | | | | 11/20/51 | | | | 801,646 | |
| | 539,682 | | | | 3.000 | | | | 02/20/52 | | | | 481,901 | |
| | 994,966 | | | | 4.500 | | | | 09/20/52 | | | | 965,674 | |
| | 984,955 | | | | 4.500 | | | | 10/20/52 | | | | 955,957 | |
| | 1,000,000 | | | | 2.500 | | | | TBA-30yr | (a) | | | 863,748 | |
| | 2,000,000 | | | | 3.000 | | | | TBA-30yr | (a) | | | 1,777,216 | |
| | 1,000,000 | | | | 4.000 | | | | TBA-30yr | (a) | | | 945,252 | |
| | 6,000,000 | | | | 5.000 | | | | TBA-30yr | (a) | | | 5,938,332 | |
| | 5,000,000 | | | | 5.500 | | | | TBA-30yr | (a) | | | 5,025,328 | |
| | 1,000,000 | | | | 6.000 | | | | TBA-30yr | (a) | | | 1,015,845 | |
| | |
| | TOTAL MORTGAGE-BACKED SECURITIES | |
| | (Cost $65,217,825) | | | | | | | $ | 63,550,018 | |
| | |
| | | | | | | | | | | | | | |
|
| Corporate Bonds – 25.1% | |
| Aerospace/Defense – 0.6% | | | | |
| | Boeing Co. (The) | |
| $ | 50,000 | | | | 3.450 | %(b) | | | 11/01/28 | | | $ | 44,829 | |
| | 25,000 | | | | 5.150 | (b) | | | 05/01/30 | | | | 24,381 | |
| | 25,000 | | | | 3.250 | (b) | | | 02/01/35 | | | | 18,987 | |
| | 100,000 | | | | 5.805 | (b) | | | 05/01/50 | | | | 93,040 | |
| | Lockheed Martin Corp. | |
| | 150,000 | | | | 5.250 | % | | | 01/15/33 | | | | 155,078 | |
| | Northrop Grumman Corp. | |
| | 50,000 | | | | 2.930 | (b) | | | 01/15/25 | | | | 47,986 | |
| | 75,000 | | | | 3.250 | (b) | | | 01/15/28 | | | | 69,363 | |
| | 25,000 | | | | 4.750 | | | | 06/01/43 | | | | 23,110 | |
| | 50,000 | | | | 5.250 | (b) | | | 05/01/50 | | | | 49,453 | |
| | Raytheon Technologies Corp. | |
| | 50,000 | | | | 3.950 | (b) | | | 08/16/25 | | | | 48,873 | |
| | 50,000 | | | | 4.125 | (b) | | | 11/16/28 | | | | 47,916 | |
| | 25,000 | | | | 4.050 | (b) | | | 05/04/47 | | | | 20,501 | |
| | | | | | | | | | | | | | |
| | | | | | | | | | | | | 643,517 | |
| | |
| Agriculture – 0.2% | |
| | Archer-Daniels-Midland Co. | |
| | 25,000 | | | | 3.250 | (b) | | | 03/27/30 | | | | 22,479 | |
| | 100,000 | | | | 2.900 | (b) | | | 03/01/32 | | | | 85,955 | |
| | Philip Morris International, Inc. | |
| | 50,000 | | | | 5.625 | (b) | | | 11/17/29 | | | | 50,923 | |
| | 100,000 | | | | 5.750 | (b) | | | 11/17/32 | | | | 102,283 | |
| | | | | | | | | | | | | | |
| | | | | | | | | | | | | 261,640 | |
| | |
| Auto Manufacturers – 0.3% | |
| | General Motors Co. | |
| | 25,000 | | | | 4.000 | | | | 04/01/25 | | | | 24,418 | |
| | General Motors Financial Co., Inc. | |
| | 125,000 | | | | 4.300 | (b) | | | 07/13/25 | | | | 121,268 | |
| | |
|
| Corporate Bonds – (continued) | |
| Auto Manufacturers – (continued) | |
| | General Motors Financial Co., Inc. – (continued) | |
| 125,000 | | | | 1.500 | %(b) | | | 06/10/26 | | | | 108,503 | |
| | 125,000 | | | | 2.350 | (b) | | | 01/08/31 | | | | 94,410 | |
| | | | | | | | | | | | | | |
| | | | | | | | | | | | | 348,599 | |
| | |
| Banks – 5.5% | |
| | Bank of America Corp. | |
| | (SOFR + 1.05%) | |
| | 400,000 | | | | 2.551 | (b)(c) | | | 02/04/28 | | | | 355,235 | |
| | (3 Mo. LIBOR + 1.04%) | |
| | 85,000 | | | | 3.419 | (b)(c) | | | 12/20/28 | | | | 77,098 | |
| | (SOFR + 2.15%) | |
| | 175,000 | | | | 2.592 | (b)(c) | | | 04/29/31 | | | | 142,756 | |
| | (SOFR + 1.22%) | |
| | 110,000 | | | | 2.299 | (b)(c) | | | 07/21/32 | | | | 84,684 | |
| | (SOFR + 1.33%) | |
| | 75,000 | | | | 2.972 | (b)(c) | | | 02/04/33 | | | | 60,474 | |
| | (SOFR + 1.83%) | |
| | 290,000 | | | | 4.571 | (b)(c) | | | 04/27/33 | | | | 265,712 | |
| | (SOFR + 2.16%) | |
| | 165,000 | | | | 5.015 | (b)(c) | | | 07/22/33 | | | | 156,549 | |
| | (US Treasury Yield Curve Rate T-Note Constant Maturity + 1.20%) | |
| | 100,000 | | | | 2.482 | (b)(c) | | | 09/21/36 | | | | 73,722 | |
| | Bank of America Corp.(c), GMTN | |
| | (3 Mo. LIBOR + 1.37%) | |
| | 25,000 | | | | 3.593 | | | | 07/21/28 | | | | 23,024 | |
| | Bank of America Corp., Series L | |
| | 25,000 | | | | 4.183 | | | | 11/25/27 | | | | 23,745 | |
| | Bank of America Corp., MTN | |
| | 75,000 | | | | 4.125 | | | | 01/22/24 | | | | 74,329 | |
| | 65,000 | | | | 4.200 | | | | 08/26/24 | | | | 63,996 | |
| | 45,000 | | | | 3.248 | (b) | | | 10/21/27 | | | | 41,591 | |
| | (3 Mo. LIBOR + 1.58%) | |
| | 75,000 | | | | 3.824 | (b)(c) | | | 01/20/28 | | | | 70,016 | |
| | (3 Mo. LIBOR + 1.31%) | |
| | 50,000 | | | | 4.271 | (b)(c) | | | 07/23/29 | | | | 46,703 | |
| | (3 Mo. LIBOR + 1.19%) | |
| | 50,000 | | | | 2.884 | (b)(c) | | | 10/22/30 | | | | 42,000 | |
| | (SOFR + 1.53%) | |
| | 50,000 | | | | 1.898 | (b)(c) | | | 07/23/31 | | | | 38,442 | |
| | Bank of New York Mellon Corp. (The)(c) | |
| | (SOFR + 1.76%) | |
| | 20,000 | | | | 4.596 | | | | 07/26/30 | | | | 19,422 | |
| | Citigroup, Inc. | |
| | 220,000 | | | | 3.400 | | | | 05/01/26 | | | | 208,864 | |
| | 150,000 | | | | 4.450 | | | | 09/29/27 | | | | 143,278 | |
| | 25,000 | | | | 4.125 | | | | 07/25/28 | | | | 23,308 | |
| | (SOFR + 1.42%) | |
| | 75,000 | | | | 2.976 | (b)(c) | | | 11/05/30 | | | | 63,043 | |
| | (SOFR + 1.35%) | |
| | 200,000 | | | | 3.057 | (b)(c) | | | 01/25/33 | | | | 161,491 | |
| | (SOFR + 2.09%) | |
| | 165,000 | | | | 4.910 | (b) | | | 05/24/33 | | | | 154,683 | |
| | Fifth Third Bancorp | |
| | 30,000 | | | | 2.375 | | | | 01/28/25 | | | | 28,452 | |
| | |
| | |
| 8 | | The accompanying notes are an integral part of these financial statements. |
GOLDMAN SACHS VARIABLE INSURANCE TRUST CORE FIXED INCOME FUND
| | | | | | | | | | | | | | |
Principal
Amount | | | Interest
Rate | | | Maturity
Date | | | Value | |
|
| Corporate Bonds – (continued) | |
| Banks – (continued) | |
| | Huntington Bancshares, Inc. | |
| $ | 50,000 | | | | 4.000 | % | | | 05/15/25 | | | $ | 48,746 | |
| | JPMorgan Chase & Co. | |
| | (3 Mo. LIBOR + 0.73%) | |
| | 25,000 | | | | 3.559 | (b)(c) | | | 04/23/24 | | | | 24,840 | |
| | (3 Mo. LIBOR + 0.89%) | |
| | 25,000 | | | | 3.797 | (b)(c) | | | 07/23/24 | | | | 24,761 | |
| | (3 Mo. LIBOR + 1.00%) | |
| | 50,000 | | | | 4.023 | (b)(c) | | | 12/05/24 | | | | 49,269 | |
| | (SOFR + 1.16%) | |
| | 125,000 | | | | 2.301 | (b)(c) | | | 10/15/25 | | | | 117,668 | |
| | (3 Mo. LIBOR + 1.25%) | |
| | 100,000 | | | | 3.960 | (b)(c) | | | 01/29/27 | | | | 95,462 | |
| | 15,000 | | | | 3.625 | (b) | | | 12/01/27 | | | | 13,928 | |
| | (3 Mo. LIBOR + 1.34%) | |
| | 972,000 | | | | 3.782 | (b)(c) | | | 02/01/28 | | | | 909,165 | |
| | (3 Mo. LIBOR + 0.95%) | |
| | 45,000 | | | | 3.509 | (b)(c) | | | 01/23/29 | | | | 40,815 | |
| | (SOFR + 3.79%) | |
| | 25,000 | | | | 4.493 | (b)(c) | | | 03/24/31 | | | | 23,379 | |
| | (SOFR + 2.04%) | |
| | 25,000 | | | | 2.522 | (b)(c) | | | 04/22/31 | | | | 20,453 | |
| | (SOFR + 1.26%) | |
| | 150,000 | | | | 2.963 | (b)(c) | | | 01/25/33 | | | | 121,941 | |
| | (SOFR + 2.08%) | |
| | 165,000 | | | | 4.912 | (b)(c) | | | 07/25/33 | | | | 156,965 | |
| | JPMorgan Chase & Co., Series HH | |
| | (SOFR + 3.13%) | |
| | 74,000 | | | | 4.600 | | | | 08/01/69 | | | | 65,707 | |
| | Morgan Stanley | |
| | (3 Mo. LIBOR + 0.85%) | |
| | 25,000 | | | | 3.737 | (b)(c) | | | 04/24/24 | | | | 24,853 | |
| | 25,000 | | | | 3.625 | | | | 01/20/27 | | | | 23,600 | |
| | 20,000 | | | | 3.950 | | | | 04/23/27 | | | | 18,925 | |
| | (SOFR + 1.00%) | |
| | 200,000 | | | | 2.475 | (b)(c) | | | 01/21/28 | | | | 177,668 | |
| | (SOFR + 2.08%) | |
| | 165,000 | | | | 4.889 | (b) | | | 07/20/33 | | | | 154,965 | |
| | (SOFR + 1.36%) | |
| | 150,000 | | | | 2.484 | (b)(c) | | | 09/16/36 | | | | 109,415 | |
| | Morgan Stanley, Series F | |
| | 25,000 | | | | 3.875 | | | | 04/29/24 | | | | 24,619 | |
| | Morgan Stanley, GMTN | |
| | 225,000 | | | | 3.700 | | | | 10/23/24 | | | | 219,776 | |
| | (3 Mo. LIBOR + 1.63%) | |
| | 25,000 | | | | 4.431 | (b)(c) | | | 01/23/30 | | | | 23,339 | |
| | (SOFR + 1.14%) | |
| | 400,000 | | | | 2.699 | (b)(c) | | | 01/22/31 | | | | 331,032 | |
| | Morgan Stanley, MTN | |
| | (SOFR + 1.15%) | |
| | 75,000 | | | | 2.720 | (b)(c) | | | 07/22/25 | | | | 71,748 | |
| | (SOFR + 3.12%) | |
| | 50,000 | | | | 3.622 | (b)(c) | | | 04/01/31 | | | | 43,740 | |
| | (SOFR + 1.03%) | |
| | 75,000 | | | | 1.794 | (b)(c) | | | 02/13/32 | | | | 56,216 | |
| | |
|
| Corporate Bonds – (continued) | |
| Banks – (continued) | |
| | Wells Fargo & Co. | |
| 175,000 | | | | 3.000 | | | | 10/23/26 | | | | 161,758 | |
| | Wells Fargo & Co., GMTN | |
| | 50,000 | | | | 4.300 | | | | 07/22/27 | | | | 48,156 | |
| | Wells Fargo & Co., MTN | |
| | 25,000 | | | | 3.750 | (b) | | | 01/24/24 | | | | 24,678 | |
| | (SOFR + 2.10%) | |
| | 445,000 | | | | 4.897 | (b)(c) | | | 07/25/33 | | | | 421,419 | |
| | (SOFR + 4.50%) | |
| | 25,000 | | | | 5.013 | (b)(c) | | | 04/04/51 | | | | 22,238 | |
| | | | | | | | | | | | | | |
| | | | | | | | | | | | | 6,113,861 | |
| | |
| Beverages – 0.3% | |
| | Constellation Brands, Inc. | |
| | 50,000 | | | | 4.400 | (b) | | | 11/15/25 | | | | 49,162 | |
| | 50,000 | | | | 3.600 | (b) | | | 02/15/28 | | | | 46,256 | |
| | 25,000 | | | | 3.150 | (b) | | | 08/01/29 | | | | 21,907 | |
| | 100,000 | | | | 2.250 | (b) | | | 08/01/31 | | | | 79,375 | |
| | 90,000 | | | | 4.750 | (b) | | | 05/09/32 | | | | 86,258 | |
| | Keurig Dr Pepper, Inc. | |
| | 25,000 | | | | 3.800 | (b) | | | 05/01/50 | | | | 18,797 | |
| | 100,000 | | | | 4.500 | (b) | | | 04/15/52 | | | | 83,796 | |
| | | | | | | | | | | | | | |
| | | | | | | | | | | | | 385,551 | |
| | |
| Biotechnology – 0.2% | |
| | Amgen, Inc. | |
| | 70,000 | | | | 3.125 | (b) | | | 05/01/25 | | | | 67,216 | |
| | 100,000 | | | | 4.200 | (b) | | | 03/01/33 | | | | 92,797 | |
| | Royalty Pharma PLC | |
| | 75,000 | | | | 1.200 | | | | 09/02/25 | | | | 67,144 | |
| | | | | | | | | | | | | | |
| | | | | | | | | | | | | 227,157 | |
| | |
| Building Materials – 0.3% | |
| | Carrier Global Corp. | |
| | 150,000 | | | | 2.493 | (b) | | | 02/15/27 | | | | 135,304 | |
| | 75,000 | | | | 2.722 | (b) | | | 02/15/30 | | | | 63,205 | |
| Johnson Controls International PLC / Tyco Fire & Security
Finance SCA |
|
| | 25,000 | | | | 4.900 | | | | 12/01/32 | | | | 24,572 | |
| | Martin Marietta Materials, Inc. | |
| | 175,000 | | | | 3.200 | | | | 07/15/51 | | | | 118,508 | |
| | Masco Corp. | |
| | 50,000 | | | | 1.500 | | | | 02/15/28 | | | | 41,462 | |
| | | | | | | | | | | | | | |
| | | | | | | | | | | | | 383,051 | |
| | |
| Chemicals – 0.3% | |
| | DuPont de Nemours, Inc. | |
| | 50,000 | | | | 4.493 | | | | 11/15/25 | | | | 49,202 | |
| | Ecolab, Inc. | |
| | 4,000 | | | | 2.750 | | | | 08/18/55 | | | | 2,410 | |
| | Huntsman International LLC | |
| | 25,000 | | | | 4.500 | | | | 05/01/29 | | | | 22,464 | |
| | International Flavors & Fragrances, Inc. | |
| | 75,000 | | | | 1.832 | (b)(d) | | | 10/15/27 | | | | 62,873 | |
| | 150,000 | | | | 2.300 | (b)(d) | | | 11/01/30 | | | | 118,840 | |
| | 50,000 | | | | 3.268 | (b)(d) | | | 11/15/40 | | | | 35,638 | |
| | |
| | |
| The accompanying notes are an integral part of these financial statements. | | 9 |
GOLDMAN SACHS VARIABLE INSURANCE TRUST CORE FIXED INCOME FUND
Schedule of Investments (continued)
December 31, 2022
| | | | | | | | | | | | | | |
Principal
Amount | | | Interest
Rate | | | Maturity
Date | | | Value | |
|
| Corporate Bonds – (continued) | |
| Chemicals – (continued) | |
| | Sherwin-Williams Co. (The) | |
| $ | 25,000 | | | | 3.450 | %(b) | | | 06/01/27 | | | $ | 23,457 | |
| | 50,000 | | | | 2.950 | (b) | | | 08/15/29 | | | | 43,803 | |
| | | | | | | | | | | | | | |
| | | | | | | | | | | | | 358,687 | |
| | |
| Commercial Services – 0.5% | |
| | CoStar Group, Inc.(d) | |
| | 100,000 | | | | 2.800 | | | | 07/15/30 | | | | 81,926 | |
| | Emory University, Series 2020 | |
| | 140,000 | | | | 2.143 | | | | 09/01/30 | | | | 115,844 | |
| | Global Payments, Inc. | |
| | 50,000 | | | | 2.650 | | | | 02/15/25 | | | | 47,080 | |
| | PayPal Holdings, Inc. | |
| | 150,000 | | | | 1.650 | (b) | | | 06/01/25 | | | | 139,084 | |
| | 75,000 | | | | 2.650 | (b) | | | 10/01/26 | | | | 69,275 | |
| | 25,000 | | | | 2.850 | (b) | | | 10/01/29 | | | | 21,769 | |
| | S&P Global, Inc.(d) | |
| | 75,000 | | | | 4.250 | | | | 05/01/29 | | | | 71,575 | |
| | | | | | | | | | | | | | |
| | | | | | | | | | | | | 546,553 | |
| | |
| Computers – 0.7% | |
| | Apple, Inc. | |
| | 325,000 | | | | 2.450 | | | | 08/04/26 | | | | 301,777 | |
| | Dell International LLC / EMC Corp. | |
| | 18,000 | | | | 5.450 | (b) | | | 06/15/23 | | | | 18,002 | |
| | 52,000 | | | | 5.850 | (b) | | | 07/15/25 | | | | 52,648 | |
| | 125,000 | | | | 6.020 | (b) | | | 06/15/26 | | | | 127,611 | |
| | 25,000 | | | | 5.300 | (b) | | | 10/01/29 | | | | 24,401 | |
| | Hewlett Packard Enterprise Co. | |
| | 150,000 | | | | 4.450 | (b) | | | 10/02/23 | | | | 149,093 | |
| | 45,000 | | | | 4.900 | (b) | | | 10/15/25 | | | | 44,552 | |
| | | | | | | | | | | | | | |
| | | | | | | | | | | | | 718,084 | |
| | |
| Cosmetics / Personal Care – 0.1% | |
| | Colgate-Palmolive Co. | |
| | 100,000 | | | | 3.250 | | | | 08/15/32 | | | | 90,479 | |
| | |
| Diversified Financial Services – 0.6% | |
| | Air Lease Corp. | |
| | 75,000 | | | | 2.300 | (b) | | | 02/01/25 | | | | 69,922 | |
| | 75,000 | | | | 3.375 | (b) | | | 07/01/25 | | | | 70,731 | |
| | Air Lease Corp., GMTN | |
| | 75,000 | | | | 3.750 | | | | 06/01/26 | | | | 70,261 | |
| | Air Lease Corp., MTN | |
| | 75,000 | | | | 2.875 | | | | 01/15/26 | | | | 69,445 | |
| | Ally Financial, Inc. | |
| | 25,000 | | | | 1.450 | | | | 10/02/23 | | | | 24,217 | |
| | American Express Co. | |
| | 20,000 | | | | 2.500 | (b) | | | 07/30/24 | | | | 19,246 | |
| | 25,000 | | | | 3.625 | (b) | | | 12/05/24 | | | | 24,357 | |
| | Aviation Capital Group LLC(d) | |
| | 50,000 | | | | 1.950 | | | | 01/30/26 | | | | 43,558 | |
| | Capital One Financial Corp. | |
| | 25,000 | | | | 3.500 | | | | 06/15/23 | | | | 24,830 | |
| | 45,000 | | | | 3.300 | (b) | | | 10/30/24 | | | | 43,431 | |
| | |
|
| Corporate Bonds – (continued) | |
| Diversified Financial Services – (continued) | |
| | Discover Financial Services | |
| 75,000 | | | | 3.750 | | | | 03/04/25 | | | | 72,228 | |
| | Intercontinental Exchange, Inc. | |
| | 50,000 | | | | 3.000 | | | | 06/15/50 | | | | 33,461 | |
| | Mastercard, Inc. | |
| | 25,000 | | | | 3.300 | | | | 03/26/27 | | | | 23,826 | |
| | Nuveen LLC(d) | |
| | 25,000 | | | | 4.000 | | | | 11/01/28 | | | | 23,300 | |
| | Raymond James Financial, Inc. | |
| | 25,000 | | | | 4.650 | | | | 04/01/30 | | | | 24,063 | |
| | | | | | | | | | | | | | |
| | | | | | | | | | | | | 636,876 | |
| | |
| Electric – 1.3% | |
| | Alliant Energy Finance LLC(d) | |
| | 25,000 | | | | 3.750 | | | | 06/15/23 | | | | 24,801 | |
| | American Electric Power Co., Inc. | |
| | 50,000 | | | | 2.300 | | | | 03/01/30 | | | | 40,933 | |
| | Arizona Public Service Co. | |
| | 45,000 | | | | 2.950 | | | | 09/15/27 | | | | 40,806 | |
| | Avangrid, Inc. | |
| | 25,000 | | | | 3.200 | | | | 04/15/25 | | | | 23,898 | |
| | Berkshire Hathaway Energy Co. | |
| | 25,000 | | | | 3.250 | (b) | | | 04/15/28 | | | | 23,165 | |
| | 50,000 | | | | 3.700 | (b) | | | 07/15/30 | | | | 45,772 | |
| | Dominion Energy, Inc.(e) | |
| | 50,000 | | | | 3.071 | | | | 08/15/24 | | | | 48,179 | |
| | Dominion Energy, Inc., Series C | |
| | 25,000 | | | | 3.375 | | | | 04/01/30 | | | | 22,026 | |
| | Entergy Corp. | |
| | 45,000 | | | | 2.950 | | | | 09/01/26 | | | | 41,886 | |
| | Exelon Corp. | |
| | 50,000 | | | | 4.050 | (b) | | | 04/15/30 | | | | 46,567 | |
| | 25,000 | | | | 4.700 | (b) | | | 04/15/50 | | | | 21,960 | |
| | FirstEnergy Corp. | |
| | 100,000 | | | | 2.650 | | | | 03/01/30 | | | | 81,884 | |
| | FirstEnergy Corp., Series B | |
| | 50,000 | | | | 2.250 | | | | 09/01/30 | | | | 39,565 | |
| | Florida Power & Light Co. | |
| | 68,000 | | | | 4.125 | | | | 02/01/42 | | | | 58,896 | |
| | MidAmerican Energy Co. | |
| | 25,000 | | | | 3.650 | | | | 04/15/29 | | | | 23,442 | |
| | NextEra Energy Capital Holdings, Inc. | |
| | 70,000 | | | | 1.900 | | | | 06/15/28 | | | | 59,905 | |
| | NRG Energy, Inc.(d) | |
| | 75,000 | | | | 3.750 | | | | 06/15/24 | | | | 72,228 | |
| | Ohio Power Co., Series P | |
| | 25,000 | | | | 2.600 | | | | 04/01/30 | | | | 21,217 | |
| | Pacific Gas and Electric Co. | |
| | 25,000 | | | | 2.100 | (b) | | | 08/01/27 | | | | 21,406 | |
| | 50,000 | | | | 2.500 | (b) | | | 02/01/31 | | | | 38,874 | |
| | 25,000 | | | | 3.300 | (b) | | | 08/01/40 | | | | 16,954 | |
| | 25,000 | | | | 3.500 | (b) | | | 08/01/50 | | | | 15,736 | |
| | Progress Energy, Inc. | |
| | 95,000 | | | | 7.000 | | | | 10/30/31 | | | | 103,553 | |
| | |
| | |
| 10 | | The accompanying notes are an integral part of these financial statements. |
GOLDMAN SACHS VARIABLE INSURANCE TRUST CORE FIXED INCOME FUND
| | | | | | | | | | | | | | |
Principal
Amount | | | Interest
Rate | | | Maturity
Date | | | Value | |
|
| Corporate Bonds – (continued) | |
| Electric – (continued) | |
| | Southern California Edison Co., Series A | |
| $ | 50,000 | | | | 4.200 | % | | | 03/01/29 | | | $ | 47,566 | |
| | Southern Co. (The) | |
| | 60,000 | | | | 3.250 | | | | 07/01/26 | | | | 56,520 | |
| | Virginia Electric and Power Co. | |
| | 75,000 | | | | 2.450 | | | | 12/15/50 | | | | 44,710 | |
| | Vistra Operations Co. LLC(d) | |
| | 125,000 | | | | 3.550 | | | | 07/15/24 | | | | 119,956 | |
| | Xcel Energy, Inc. | |
| | 250,000 | | | | 3.350 | | | | 12/01/26 | | | | 235,317 | |
| | | | | | | | | | | | | | |
| | | | | | | | | | | | | 1,437,722 | |
| | |
| Entertainment – 0.2% | |
| | Magallanes, Inc.(d) | |
| | 250,000 | | | | 4.054 | | | | 03/15/29 | | | | 216,677 | |
| | |
| Environmental Control – 0.3% | |
| | Republic Services, Inc. | |
| | 75,000 | | | | 2.500 | (b) | | | 08/15/24 | | | | 71,891 | |
| | 100,000 | | | | 1.750 | (b) | | | 02/15/32 | | | | 76,872 | |
| | Waste Connections, Inc. | |
| | 51,000 | | | | 4.200 | | | | 01/15/33 | | | | 47,379 | |
| | Waste Management, Inc. | |
| | 75,000 | | | | 3.150 | (b) | | | 11/15/27 | | | | 69,994 | |
| | 50,000 | | | | 1.150 | (b) | | | 03/15/28 | | | | 41,703 | |
| | 50,000 | | | | 4.150 | (b) | | | 04/15/32 | | | | 47,539 | |
| | | | | | | | | | | | | | |
| | | | | | | | | | | | | 355,378 | |
| | |
| Food – 0.3% | |
| | General Mills, Inc. | |
| | 75,000 | | | | 4.200 | | | | 04/17/28 | | | | 72,489 | |
| | Kraft Heinz Foods Co. | |
| | 95,000 | | | | 3.750 | | | | 04/01/30 | | | | 86,582 | |
| | Mars, Inc. | |
| | 25,000 | | | | 2.700 | (b)(d) | | | 04/01/25 | | | | 23,801 | |
| | 25,000 | | | | 3.200 | (b)(d) | | | 04/01/30 | | | | 22,277 | |
| | Sysco Corp. | |
| | 25,000 | | | | 6.600 | | | | 04/01/50 | | | | 27,232 | |
| | Tyson Foods, Inc. | |
| | 50,000 | | | | 3.900 | | | | 09/28/23 | | | | 49,520 | |
| | | | | | | | | | | | | | |
| | | | | | | | | | | | | 281,901 | |
| | |
| Gas – 0.1% | |
| | East Ohio Gas Co. (The) | |
| | 25,000 | | | | 1.300 | (b)(d) | | | 06/15/25 | | | | 22,656 | |
| | 25,000 | | | | 2.000 | (b)(d) | | | 06/15/30 | | | | 19,644 | |
| | NiSource, Inc. | |
| | 95,000 | | | | 3.490 | (b) | | | 05/15/27 | | | | 89,543 | |
| | 25,000 | | | | 3.600 | (b) | | | 05/01/30 | | | | 22,289 | |
| | | | | | | | | | | | | | |
| | | | | | | | | | | | | 154,132 | |
| | |
| Hand/Machine Tools – 0.0% | |
| | Stanley Black & Decker, Inc. | |
| | 50,000 | | | | 4.250 | | | | 11/15/28 | | | | 47,733 | |
| | |
|
| Corporate Bonds – (continued) | |
| Healthcare – Products – 0.2% | |
| | Baxter International, Inc. | |
| 100,000 | | | | 2.272 | | | | 12/01/28 | | | | 85,355 | |
| | GE HealthCare Technologies, Inc.(d) | |
| | 100,000 | | | | 6.377 | | | | 11/22/52 | | | | 107,221 | |
| | | | | | | | | | | | | | |
| | | | | | | | | | | | | 192,576 | |
| | |
| Healthcare – Services – 0.9% | |
| | Centene Corp. | |
| | 110,000 | | | | 2.625 | | | | 08/01/31 | | | | 86,399 | |
| | CommonSpirit Health | |
| | 225,000 | | | | 6.461 | | | | 11/01/52 | | | | 239,427 | |
| | HCA, Inc. | |
| | 80,000 | | | | 3.500 | | | | 09/01/30 | | | | 68,832 | |
| | UnitedHealth Group, Inc. | |
| | 275,000 | | | | 5.300 | (b) | | | 02/15/30 | | | | 284,011 | |
| | 250,000 | | | | 5.350 | (b) | | | 02/15/33 | | | | 258,939 | |
| | 100,000 | | | | 5.875 | (b) | | | 02/15/53 | | | | 108,574 | |
| | | | | | | | | | | | | | |
| | | | | | | | | | | | | 1,046,182 | |
| | |
| Healthcare-Products – 0.3% | |
| | DH Europe Finance II Sarl | |
| | 75,000 | | | | 2.200 | (b) | | | 11/15/24 | | | | 71,410 | |
| | 25,000 | | | | 2.600 | (b) | | | 11/15/29 | | | | 21,872 | |
| | 75,000 | | | | 3.250 | (b) | | | 11/15/39 | | | | 60,152 | |
| | STERIS Irish FinCo UnLtd Co. | |
| | 75,000 | | | | 2.700 | | | | 03/15/31 | | | | 60,934 | |
| | Stryker Corp. | |
| | 100,000 | | | | 1.950 | | | | 06/15/30 | | | | 81,376 | |
| | Thermo Fisher Scientific, Inc. | |
| | 25,000 | | | | 1.750 | | | | 10/15/28 | | | | 21,200 | |
| | | | | | | | | | | | | | |
| | | | | | | | | | | | | 316,944 | |
| | |
| Healthcare-Services – 0.4% | |
| | Adventist Health System | |
| | 30,000 | | | | 2.952 | | | | 03/01/29 | | | | 25,683 | |
| | Banner Health | |
| | 120,000 | | | | 2.338 | | | | 01/01/30 | | | | 100,898 | |
| | Baylor Scott & White Holdings, Series 2021 | |
| | 40,000 | | | | 1.777 | | | | 11/15/30 | | | | 30,894 | |
| | Centene Corp. | |
| | 150,000 | | | | 4.250 | | | | 12/15/27 | | | | 140,857 | |
| | Rush Obligated Group, Series 2020 | |
| | 60,000 | | | | 3.922 | | | | 11/15/29 | | | | 55,132 | |
| | Stanford Health Care, Series 2020 | |
| | 40,000 | | | | 3.310 | | | | 08/15/30 | | | | 35,744 | |
| | Sutter Health, Series 20A | |
| | 40,000 | | | | 2.294 | | | | 08/15/30 | | | | 32,349 | |
| | | | | | | | | | | | | | |
| | | | | | | | | | | | | 421,557 | |
| | |
| Home Builders – 0.1% | |
| | Lennar Corp. | |
| | 70,000 | | | | 4.750 | | | | 11/29/27 | | | | 67,309 | |
| | |
| Insurance – 0.3% | |
| | American International Group, Inc. | |
| | 25,000 | | | | 3.400 | | | | 06/30/30 | | | | 22,058 | |
| | |
| | |
| The accompanying notes are an integral part of these financial statements. | | 11 |
GOLDMAN SACHS VARIABLE INSURANCE TRUST CORE FIXED INCOME FUND
Schedule of Investments (continued)
December 31, 2022
| | | | | | | | | | | | | | |
Principal
Amount | | | Interest
Rate | | | Maturity
Date | | | Value | |
|
| Corporate Bonds – (continued) | |
| Insurance – (continued) | |
| | Arch Capital Group US, Inc. | |
| $ | 36,000 | | | | 5.144 | % | | | 11/01/43 | | | $ | 32,147 | |
| | Berkshire Hathaway Finance Corp. | |
| | 75,000 | | | | 1.850 | | | | 03/12/30 | | | | 62,526 | |
| | Marsh & McLennan Cos., Inc. | |
| | 50,000 | | | | 4.375 | | | | 03/15/29 | | | | 48,329 | |
| | Principal Financial Group, Inc. | |
| | 50,000 | | | | 3.100 | (b) | | | 11/15/26 | | | | 46,426 | |
| | 75,000 | | | | 2.125 | (b) | | | 06/15/30 | | | | 61,282 | |
| | Willis North America, Inc. | |
| | 25,000 | | | | 2.950 | | | | 09/15/29 | | | | 21,024 | |
| | | | | | | | | | | | | | |
| | | | | | | | | | | | | 293,792 | |
| | |
| Internet – 0.8% | |
| | Amazon.com, Inc. | |
| | 335,000 | | | | 5.200 | (b) | | | 12/03/25 | | | | 341,176 | |
| | 45,000 | | | | 4.800 | (b) | | | 12/05/34 | | | | 45,013 | |
| | 15,000 | | | | 3.875 | (b) | | | 08/22/37 | | | | 13,305 | |
| | 50,000 | | | | 3.100 | (b) | | | 05/12/51 | | | | 35,829 | |
| | Expedia Group, Inc. | |
| | 25,000 | | | | 4.625 | (b) | | | 08/01/27 | | | | 23,997 | |
| | 35,000 | | | | 3.800 | (b) | | | 02/15/28 | | | | 32,132 | |
| | 14,000 | | | | 2.950 | (b) | | | 03/15/31 | | | | 11,272 | |
| | Meta Platforms, Inc. | |
| | 250,000 | | | | 3.500 | (b) | | | 08/15/27 | | | | 232,808 | |
| | 88,000 | | | | 3.850 | (b) | | | 08/15/32 | | | | 77,730 | |
| | Netflix, Inc.(d) | |
| | 90,000 | | | | 4.875 | | | | 06/15/30 | | | | 84,167 | |
| | | | | | | | | | | | | | |
| | | | | | | | | | | | | 897,429 | |
| | |
| Iron/Steel – 0.1% | |
| | Steel Dynamics, Inc. | |
| | 20,000 | | | | 2.400 | (b) | | | 06/15/25 | | | | 18,736 | |
| | 50,000 | | | | 1.650 | (b) | | | 10/15/27 | | | | 41,895 | |
| | | | | | | | | | | | | | |
| | | | | | | | | | | | | 60,631 | |
| | |
| Lodging – 0.3% | |
| | Hyatt Hotels Corp. | |
| | 75,000 | | | | 1.800 | | | | 10/01/24 | | | | 70,274 | |
| | Marriott International, Inc. | |
| | 125,000 | | | | 5.000 | | | | 10/15/27 | | | | 123,468 | |
| | Marriott International, Inc., Series HH | |
| | 125,000 | | | | 2.850 | | | | 04/15/31 | | | | 101,261 | |
| | | | | | | | | | | | | | |
| | | | | | | | | | | | | 295,003 | |
| | |
| Machinery-Diversified – 0.1% | |
| | Otis Worldwide Corp. | |
| | 25,000 | | | | 2.293 | (b) | | | 04/05/27 | | | | 22,448 | |
| | 150,000 | | | | 2.565 | (b) | | | 02/15/30 | | | | 126,108 | |
| | | | | | | | | | | | | | |
| | | | | | | | | | | | | 148,556 | |
| | |
| Media – 0.9% | |
| Charter Communications Operating LLC / Charter
Communications Operating Capital |
|
| | 320,000 | | | | 4.908 | | | | 07/23/25 | | | | 313,824 | |
| | |
|
| Corporate Bonds – (continued) | |
| Media – (continued) | |
| | Comcast Corp. | |
| 25,000 | | | | 3.700 | %(b) | | | 04/15/24 | | | | 24,617 | |
| | 45,000 | | | | 3.375 | (b) | | | 08/15/25 | | | | 43,406 | |
| | 50,000 | | | | 3.950 | (b) | | | 10/15/25 | | | | 48,949 | |
| | 25,000 | | | | 3.300 | (b) | | | 02/01/27 | | | | 23,598 | |
| | 75,000 | | | | 3.300 | (b) | | | 04/01/27 | | | | 70,704 | |
| | 225,000 | | | | 3.150 | (b) | | | 02/15/28 | | | | 207,933 | |
| | 125,000 | | | | 4.150 | (b) | | | 10/15/28 | | | | 120,144 | |
| | 25,000 | | | | 3.750 | (b) | | | 04/01/40 | | | | 20,642 | |
| | 25,000 | | | | 4.700 | (b) | | | 10/15/48 | | | | 22,511 | |
| | Fox Corp. | |
| | 25,000 | | | | 4.030 | (b) | | | 01/25/24 | | | | 24,701 | |
| | 25,000 | | | | 4.709 | (b) | | | 01/25/29 | | | | 24,199 | |
| | Walt Disney Co. (The) | |
| | 25,000 | | | | 3.700 | | | | 09/15/24 | | | | 24,488 | |
| | | | | | | | | | | | | | |
| | | | | | | | | | | | | 969,716 | |
| | |
| Mining – 0.1% | |
| | Newmont Corp. | |
| | 75,000 | | | | 2.250 | | | | 10/01/30 | | | | 60,293 | |
| | |
| Miscellaneous Manufacturing – 0.2% | |
| | Eaton Corp. | |
| | 175,000 | | | | 4.150 | | | | 03/15/33 | | | | 163,043 | |
| | General Electric Co., MTN | |
| | 50,000 | | | | 6.750 | | | | 03/15/32 | | | | 55,409 | |
| | | | | | | | | | | | | | |
| | | | | | | | | | | | | 218,452 | |
| | |
| Oil & Gas – 0.0% | |
| | Continental Resources, Inc. | |
| | 31,000 | | | | 4.500 | | | | 04/15/23 | | | | 30,891 | |
| | Phillips 66 | |
| | 25,000 | | | | 1.300 | | | | 02/15/26 | | | | 22,352 | |
| | | | | | | | | | | | | | |
| | | | | | | | | | | | | 53,243 | |
| | |
| Packaging & Containers – 0.0% | |
| | Berry Global, Inc. | |
| | 50,000 | | | | 1.570 | | | | 01/15/26 | | | | 44,645 | |
| | |
| Pharmaceuticals – 1.1% | |
| | AbbVie, Inc. | |
| | 125,000 | | | | 4.050 | (b) | | | 11/21/39 | | | | 107,053 | |
| | 200,000 | | | | 4.250 | (b) | | | 11/21/49 | | | | 168,113 | |
| | AmerisourceBergen Corp. | |
| | 75,000 | | | | 3.450 | | | | 12/15/27 | | | | 70,066 | |
| | Becton Dickinson and Co. | |
| | 12,000 | | | | 3.363 | (b) | | | 06/06/24 | | | | 11,707 | |
| | 100,000 | | | | 2.823 | (b) | | | 05/20/30 | | | | 85,720 | |
| | Bristol-Myers Squibb Co. | |
| | 75,000 | | | | 2.950 | (b) | | | 03/15/32 | | | | 65,430 | |
| | 25,000 | | | | 4.250 | (b) | | | 10/26/49 | | | | 21,622 | |
| | Cigna Corp. | |
| | 50,000 | | | | 2.400 | (b) | | | 03/15/30 | | | | 41,897 | |
| | 75,000 | | | | 4.900 | (b) | | | 12/15/48 | | | | 68,084 | |
| | 150,000 | | | | 3.400 | (b) | | | 03/15/50 | | | | 106,433 | |
| | |
| | |
| 12 | | The accompanying notes are an integral part of these financial statements. |
GOLDMAN SACHS VARIABLE INSURANCE TRUST CORE FIXED INCOME FUND
| | | | | | | | | | | | | | |
Principal
Amount | | | Interest
Rate | | | Maturity
Date | | | Value | |
|
| Corporate Bonds – (continued) | |
| Pharmaceuticals – (continued) | |
| | CVS Health Corp. | |
| $ | 25,000 | | | | 2.625 | %(b) | | | 08/15/24 | | | $ | 24,003 | |
| | 75,000 | | | | 1.875 | (b) | | | 02/28/31 | | | | 58,738 | |
| | 125,000 | | | | 2.125 | (b) | | | 09/15/31 | | | | 99,062 | |
| | 25,000 | | | | 5.125 | (b) | | | 07/20/45 | | | | 22,779 | |
| | Pfizer, Inc. | |
| | 75,000 | | | | 3.450 | | | | 03/15/29 | | | | 70,657 | |
| | Zoetis, Inc. | |
| | 45,000 | | | | 3.000 | (b) | | | 09/12/27 | | | | 41,604 | |
| | 150,000 | | | | 2.000 | (b) | | | 05/15/30 | | | | 121,789 | |
| | | | | | | | | | | | | | |
| | | | | | | | | | | | | 1,184,757 | |
| | |
| Pipelines – 0.6% | |
| | Energy Transfer LP | |
| | 15,000 | | | | 4.250 | (b) | | | 04/01/24 | | | | 14,729 | |
| | 50,000 | | | | 2.900 | (b) | | | 05/15/25 | | | | 47,111 | |
| | 25,000 | | | | 5.250 | (b) | | | 04/15/29 | | | | 24,237 | |
| | 5,000 | | | | 6.000 | (b) | | | 06/15/48 | | | | 4,510 | |
| | Energy Transfer LP, Series 5Y | |
| | 75,000 | | | | 4.200 | | | | 09/15/23 | | | | 74,362 | |
| | MPLX LP | |
| | 75,000 | | | | 2.650 | (b) | | | 08/15/30 | | | | 60,850 | |
| | 35,000 | | | | 4.500 | (b) | | | 04/15/38 | | | | 29,417 | |
| | 25,000 | | | | 5.500 | (b) | | | 02/15/49 | | | | 22,114 | |
| | Plains All American Pipeline LP / PAA Finance Corp. | |
| | 35,000 | | | | 3.850 | (b) | | | 10/15/23 | | | | 34,508 | |
| | 25,000 | | | | 3.800 | (b) | | | 09/15/30 | | | | 21,735 | |
| | Sabine Pass Liquefaction LLC | |
| | 75,000 | | | | 5.625 | (b) | | | 03/01/25 | | | | 75,177 | |
| | 75,000 | | | | 5.000 | (b) | | | 03/15/27 | | | | 73,575 | |
| | Targa Resources Corp. | |
| | 55,000 | | | | 4.200 | | | | 02/01/33 | | | | 47,352 | |
| | Western Midstream Operating LP | |
| | 75,000 | | | | 3.350 | (b) | | | 02/01/25 | | | | 70,967 | |
| | 25,000 | | | | 5.450 | (b) | | | 04/01/44 | | | | 20,880 | |
| | 20,000 | | | | 5.300 | (b) | | | 03/01/48 | | | | 16,560 | |
| | Williams Cos., Inc. (The) | |
| | 25,000 | | | | 3.900 | (b) | | | 01/15/25 | | | | 24,361 | |
| | 35,000 | | | | 4.000 | (b) | | | 09/15/25 | | | | 34,009 | |
| | | | | | | | | | | | | | |
| | | | | | | | | | | | | 696,454 | |
| | |
| Real Estate Investment Trusts – 1.6% | |
| | Agree LP | |
| | 170,000 | | | | 4.800 | | | | 10/01/32 | | | | 156,337 | |
| | Alexandria Real Estate Equities, Inc. | |
| | 25,000 | | | | 3.375 | | | | 08/15/31 | | | | 21,829 | |
| | American Homes 4 Rent LP | |
| | 50,000 | | | | 4.900 | (b) | | | 02/15/29 | | | | 47,286 | |
| | 30,000 | | | | 2.375 | (b) | | | 07/15/31 | | | | 23,073 | |
| | American Tower Corp. | |
| | 75,000 | | | | 3.375 | (b) | | | 05/15/24 | | | | 72,999 | |
| | 100,000 | | | | 2.400 | (b) | | | 03/15/25 | | | | 94,075 | |
| | 75,000 | | | | 2.100 | (b) | | | 06/15/30 | | | | 59,457 | |
| | Crown Castle, Inc. | |
| | 85,000 | | | | 3.150 | (b) | | | 07/15/23 | | | | 84,025 | |
| | 60,000 | | | | 3.650 | (b) | | | 09/01/27 | | | | 55,792 | |
| | |
|
| Corporate Bonds – (continued) | |
| Real Estate Investment Trusts – (continued) | |
| | CubeSmart LP | |
| 45,000 | | | | 4.000 | %(b) | | | 11/15/25 | | | | 43,391 | |
| | 60,000 | | | | 2.500 | (b) | | | 02/15/32 | | | | 45,946 | |
| | Essex Portfolio LP | |
| | 50,000 | | | | 3.000 | | | | 01/15/30 | | | | 42,272 | |
| | Healthcare Realty Holdings LP | |
| | 25,000 | | | | 2.050 | | | | 03/15/31 | | | | 18,227 | |
| | Host Hotels & Resorts LP, Series J | |
| | 75,000 | | | | 2.900 | | | | 12/15/31 | | | | 57,417 | |
| | Invitation Homes Operating Partnership LP | |
| | 75,000 | | | | 2.300 | (b) | | | 11/15/28 | | | | 61,980 | |
| | 195,000 | | | | 2.000 | (b) | | | 08/15/31 | | | | 143,924 | |
| | Kilroy Realty LP | |
| | 25,000 | | | | 4.750 | | | | 12/15/28 | | | | 22,726 | |
| | Mid-America Apartments L.P. | |
| | 50,000 | | | | 1.700 | | | | 02/15/31 | | | | 39,072 | |
| | National Retail Properties, Inc. | |
| | 35,000 | | | | 3.900 | (b) | | | 06/15/24 | | | | 34,197 | |
| | 45,000 | | | | 4.000 | (b) | | | 11/15/25 | | | | 43,355 | |
| | Prologis L.P. | |
| | 25,000 | | | | 1.750 | (b) | | | 07/01/30 | | | | 19,768 | |
| | 125,000 | | | | 4.625 | (b) | | | 01/15/33 | | | | 121,085 | |
| | Realty Income Corp. | |
| | 25,000 | | | | 3.950 | (b) | | | 08/15/27 | | | | 23,891 | |
| | 50,000 | | | | 2.850 | (b) | | | 12/15/32 | | | | 40,613 | |
| | Regency Centers LP | |
| | 100,000 | | | | 2.950 | | | | 09/15/29 | | | | 83,845 | |
| | Spirit Realty LP | |
| | 75,000 | | | | 3.400 | | | | 01/15/30 | | | | 62,423 | |
| | UDR, Inc., MTN | |
| | 25,000 | | | | 2.100 | (b) | | | 08/01/32 | | | | 18,567 | |
| | 100,000 | | | | 1.900 | (b) | | | 03/15/33 | | | | 71,168 | |
| | Ventas Realty LP | |
| | 45,000 | | | | 3.500 | | | | 02/01/25 | | | | 43,240 | |
| | WP Carey, Inc. | |
| | 20,000 | | | | 4.600 | (b) | | | 04/01/24 | | | | 19,812 | |
| | 30,000 | | | | 4.000 | (b) | | | 02/01/25 | | | | 29,256 | |
| | 25,000 | | | | 3.850 | (b) | | | 07/15/29 | | | | 22,477 | |
| | 25,000 | | | | 2.400 | (b) | | | 02/01/31 | | | | 19,925 | |
| | | | | | | | | | | | | | |
| | | | | | | | | | | | | 1,743,450 | |
| | |
| Retail – 1.2% | |
| | 7-Eleven, Inc.(d) | |
| | 100,000 | | | | 1.300 | | | | 02/10/28 | | | | 83,104 | |
| | Autonation, Inc. | |
| | 83,000 | | | | 4.500 | | | | 10/01/25 | | | | 80,574 | |
| | AutoNation, Inc. | |
| | 25,000 | | | | 1.950 | | | | 08/01/28 | | | | 19,973 | |
| | Dollar Tree, Inc. | |
| | 50,000 | | | | 4.000 | (b) | | | 05/15/25 | | | | 48,831 | |
| | 50,000 | | | | 4.200 | (b) | | | 05/15/28 | | | | 47,974 | |
| | Home Depot, Inc. (The) | |
| | 25,000 | | | | 3.900 | (b) | | | 12/06/28 | | | | 24,088 | |
| | 100,000 | | | | 4.500 | (b) | | | 09/15/32 | | | | 97,992 | |
| | 25,000 | | | | 4.250 | (b) | | | 04/01/46 | | | | 21,767 | |
| | |
| | |
| The accompanying notes are an integral part of these financial statements. | | 13 |
GOLDMAN SACHS VARIABLE INSURANCE TRUST CORE FIXED INCOME FUND
Schedule of Investments (continued)
December 31, 2022
| | | | | | | | | | | | | | |
Principal
Amount | | | Interest
Rate | | | Maturity
Date | | | Value | |
|
| Corporate Bonds – (continued) | |
| Retail – (continued) | |
| | Lowe’s Cos., Inc. | |
| $ | 25,000 | | | | 3.100 | %(b) | | | 05/03/27 | | | $ | 23,296 | |
| | 75,000 | | | | 1.700 | (b) | | | 09/15/28 | | | | 62,998 | |
| | 300,000 | | | | 3.750 | (b) | | | 04/01/32 | | | | 267,373 | |
| | 100,000 | | | | 5.000 | (b) | | | 04/15/33 | | | | 97,848 | |
| | 25,000 | | | | 3.000 | (b) | | | 10/15/50 | | | | 16,031 | |
| | 50,000 | | | | 4.250 | (b) | | | 04/01/52 | | | | 40,044 | |
| | McDonald’s Corp. | |
| | 79,000 | | | | 4.600 | | | | 09/09/32 | | | | 77,346 | |
| | McDonald’s Corp., MTN | |
| | 25,000 | | | | 4.200 | | | | 04/01/50 | | | | 20,907 | |
| | Starbucks Corp. | |
| | 75,000 | | | | 3.800 | (b) | | | 08/15/25 | | | | 73,368 | |
| | 100,000 | | | | 4.000 | (b) | | | 11/15/28 | | | | 95,283 | |
| | 100,000 | | | | 3.000 | (b) | | | 02/14/32 | | | | 85,497 | |
| | Tractor Supply Co. | |
| | 50,000 | | | | 1.750 | | | | 11/01/30 | | | | 38,409 | |
| | Walgreens Boots Alliance, Inc. | |
| | 41,000 | | | | 4.100 | | | | 04/15/50 | | | | 30,169 | |
| | | | | | | | | | | | | | |
| | | | | | | | | | | | | 1,352,872 | |
| | |
| Semiconductors – 0.4% | |
| | Applied Materials, Inc. | |
| | 25,000 | | | | 1.750 | | | | 06/01/30 | | | | 20,382 | |
| | Broadcom, Inc. | |
| | 125,000 | | | | 4.150 | (b)(d) | | | 04/15/32 | | | | 109,877 | |
| | 100,000 | | | | 3.419 | (b)(d) | | | 04/15/33 | | | | 80,268 | |
| | 162,000 | | | | 3.137 | (b)(d) | | | 11/15/35 | | | | 118,852 | |
| | 100,000 | | | | 3.500 | (b)(d) | | | 02/15/41 | | | | 71,592 | |
| | Intel Corp. | |
| | 75,000 | | | | 3.050 | | | | 08/12/51 | | | | 48,747 | |
| | Micron Technology, Inc. | |
| | 50,000 | | | | 2.703 | | | | 04/15/32 | | | | 37,510 | |
| | | | | | | | | | | | | | |
| | | | | | | | | | | | | 487,228 | |
| | |
| Software – 1.1% | |
| | Adobe, Inc. | |
| | 50,000 | | | | 2.150 | (b) | | | 02/01/27 | | | | 45,558 | |
| | 75,000 | | | | 2.300 | (b) | | | 02/01/30 | | | | 63,973 | |
| | Fiserv, Inc. | |
| | 100,000 | | | | 2.750 | (b) | | | 07/01/24 | | | | 96,452 | |
| | 25,000 | | | | 4.200 | (b) | | | 10/01/28 | | | | 23,662 | |
| | Intuit, Inc. | |
| | 25,000 | | | | 1.350 | | | | 07/15/27 | | | | 21,636 | |
| | Oracle Corp. | |
| | 34,000 | | | | 2.950 | (b) | | | 04/01/30 | | | | 29,022 | |
| | 275,000 | | | | 2.875 | (b) | | | 03/25/31 | | | | 228,149 | |
| | 225,000 | | | | 6.900 | (b) | | | 11/09/52 | | | | 243,481 | |
| | 50,000 | | | | 3.850 | (b) | | | 04/01/60 | | | | 33,452 | |
| | Roper Technologies, Inc. | |
| | 50,000 | | | | 4.200 | | | | 09/15/28 | | | | 48,235 | |
| | ServiceNow, Inc. | |
| | 125,000 | | | | 1.400 | | | | 09/01/30 | | | | 95,246 | |
| | Take-Two Interactive Software, Inc. | |
| | 85,000 | | | | 3.700 | | | | 04/14/27 | | | | 80,012 | |
| | |
|
| Corporate Bonds – (continued) | |
| Software – (continued) | |
| | VMware, Inc. | |
| 25,000 | | | | 1.800 | %(b) | | | 08/15/28 | | | | 20,410 | |
| | 100,000 | | | | 2.200 | (b) | | | 08/15/31 | | | | 75,817 | |
| | Workday, Inc. | |
| | 75,000 | | | | 3.500 | (b) | | | 04/01/27 | | | | 70,149 | |
| | 25,000 | | | | 3.800 | (b) | | | 04/01/32 | | | | 22,063 | |
| | | | | | | | | | | | | | |
| | | | | | | | | | | | | 1,197,317 | |
| | |
| Telecommunications – 2.1% | |
| | AT&T, Inc. | |
| | 288,000 | | | | 2.300 | (b) | | | 06/01/27 | | | | 256,646 | |
| | 150,000 | | | | 4.350 | (b) | | | 03/01/29 | | | | 142,753 | |
| | 50,000 | | | | 2.750 | (b) | | | 06/01/31 | | | | 41,518 | |
| | 128,000 | | | | 2.550 | (b) | | | 12/01/33 | | | | 98,432 | |
| | 25,000 | | | | 4.900 | (b) | | | 08/15/37 | | | | 23,022 | |
| | 60,000 | | | | 4.850 | (b) | | | 03/01/39 | | | | 53,709 | |
| | 75,000 | | | | 3.500 | (b) | | | 06/01/41 | | | | 55,974 | |
| | 25,000 | | | | 4.350 | (b) | | | 06/15/45 | | | | 20,196 | |
| | 25,000 | | | | 5.150 | (b) | | | 11/15/46 | | | | 22,544 | |
| | 25,000 | | | | 4.500 | (b) | | | 03/09/48 | | | | 20,346 | |
| | 25,000 | | | | 3.650 | (b) | | | 06/01/51 | | | | 17,682 | |
| | 25,000 | | | | 3.500 | (b) | | | 09/15/53 | | | | 17,009 | |
| | T-Mobile USA, Inc. | |
| | 75,000 | | | | 3.500 | (b) | | | 04/15/25 | | | | 72,201 | |
| | 75,000 | | | | 1.500 | (b) | | | 02/15/26 | | | | 67,203 | |
| | 150,000 | | | | 3.750 | (b) | | | 04/15/27 | | | | 141,428 | |
| | 175,000 | | | | 2.050 | (b) | | | 02/15/28 | | | | 150,551 | |
| | 83,000 | | | | 3.875 | (b) | | | 04/15/30 | | | | 75,341 | |
| | 75,000 | | | | 2.875 | (b) | | | 02/15/31 | | | | 61,920 | |
| | 75,000 | | | | 3.500 | (b) | | | 04/15/31 | | | | 64,955 | |
| | 225,000 | | | | 5.200 | (b) | | | 01/15/33 | | | | 222,778 | |
| | 25,000 | | | | 3.000 | (b) | | | 02/15/41 | | | | 17,649 | |
| | Verizon Communications, Inc. | |
| | 145,000 | | | | 4.329 | | | | 09/21/28 | | | | 139,575 | |
| | 200,000 | | | | 3.875 | (b) | | | 02/08/29 | | | | 187,807 | |
| | 50,000 | | | | 3.150 | (b) | | | 03/22/30 | | | | 44,050 | |
| | 125,000 | | | | 2.550 | (b) | | | 03/21/31 | | | | 102,875 | |
| | 153,000 | | | | 2.355 | (b) | | | 03/15/32 | | | | 121,336 | |
| | 50,000 | | | | 4.862 | | | | 08/21/46 | | | | 45,291 | |
| | 90,000 | | | | 2.987 | (b) | | | 10/30/56 | | | | 55,233 | |
| | | | | | | | | | | | | | |
| | | | | | | | | | | | | 2,340,024 | |
| | |
| Transportation – 0.5% | |
| | Burlington Northern Santa Fe LLC | |
| | 25,000 | | | | 4.050 | | | | 06/15/48 | | | | 20,919 | |
| | CSX Corp. | |
| | 175,000 | | | | 3.800 | (b) | | | 03/01/28 | | | | 166,883 | |
| | 100,000 | | | | 4.100 | (b) | | | 11/15/32 | | | | 93,673 | |
| | FedEx Corp. | |
| | 45,000 | | | | 3.400 | (b) | | | 02/15/28 | | | | 41,613 | |
| | 75,000 | | | | 5.250 | (b) | | | 05/15/50 | | | | 68,919 | |
| | Union Pacific Corp. | |
| | 125,000 | | | | 2.800 | | | | 02/14/32 | | | | 107,429 | |
| | | | | | | | | | | | | | |
| | | | | | | | | | | | | 499,436 | |
| | |
| | TOTAL CORPORATE BONDS | |
| | (Cost $30,931,908) | | | | | | | $ | 27,795,464 | |
| | |
| | |
| 14 | | The accompanying notes are an integral part of these financial statements. |
GOLDMAN SACHS VARIABLE INSURANCE TRUST CORE FIXED INCOME FUND
| | | | | | | | | | | | | | |
Principal
Amount | | | Interest
Rate | | | Maturity
Date | | | Value | |
|
| Foreign Bonds – 5.4% | |
| Agriculture – 0.1% | | | | |
| | BAT Capital Corp. (United Kingdom) | |
| $ | 25,000 | | | | 3.222 | % | | | 08/15/24 | | | $ | 24,104 | |
| | 100,000 | | | | 2.259 | | | | 03/25/28 | | | | 83,229 | |
| | 25,000 | | | | 4.540 | | | | 08/15/47 | | | | 17,770 | |
| | | | | | | | | | | | | | |
| | | | | | | | | | | | | 125,103 | |
| | |
| Banks – 2.3% | |
| | Banco Santander SA (Spain) | |
| | 200,000 | | | | 2.746 | | | | 05/28/25 | | | | 187,252 | |
| | Barclays PLC(c) (United Kingdom) | |
| | (SOFR + 2.71%) | |
| | 200,000 | | | | 2.852 | | | | 05/07/26 | | | | 185,689 | |
| | BNP Paribas SA (France) | |
| | 200,000 | | | | 3.375 | (d) | | | 01/09/25 | | | | 192,714 | |
| | (SOFR + 1.00%) | |
| | 200,000 | | | | 1.323 | (c)(d) | | | 01/13/27 | | | | 174,793 | |
| | BPCE SA(c)(d) (France) | |
| | (SOFR + 1.73%) | |
| | 250,000 | | | | 3.116 | | | | 10/19/32 | | | | 182,259 | |
| | Credit Suisse AG (Switzerland) | |
| | 250,000 | | | | 1.250 | | | | 08/07/26 | | | | 201,837 | |
| | Credit Suisse Group AG (Switzerland) | |
| | 250,000 | | | | 4.550 | | | | 04/17/26 | | | | 222,426 | |
| | (SOFR + 5.02%) | |
| | 250,000 | | | | 9.016 | (c)(d) | | | 11/15/33 | | | | 257,176 | |
| | Deutsche Bank AG(c) (Germany) | |
| | (SOFR + 2.16%) | |
| | 150,000 | | | | 2.222 | | | | 09/18/24 | | | | 144,839 | |
| | HSBC Holdings PLC(c) (United Kingdom) | |
| | (SOFR + 1.54%) | |
| | 200,000 | | | | 1.645 | | | | 04/18/26 | | | | 180,592 | |
| | ING Groep NV(c)(d) (Netherlands) | |
| | (US 1 Year CMT T-Note + 1.10%) | |
| | 200,000 | | | | 1.400 | | | | 07/01/26 | | | | 179,626 | |
| | Macquarie Group Ltd.(c)(d) (Australia) | |
| | (SOFR + 1.07%) | |
| | 50,000 | | | | 1.340 | | | | 01/12/27 | | | | 43,446 | |
| | Toronto-Dominion Bank (The) (Canada) | |
| | 175,000 | | | | 4.456 | | | | 06/08/32 | | | | 166,359 | |
| | UBS Group AG(c)(d) (Switzerland) | |
| | (US 1 Year CMT T-Note + 1.10%) | |
| | 200,000 | | | | 2.746 | | | | 02/11/33 | | | | 154,714 | |
| | Westpac Banking Corp.(c) (Australia) | |
| (US Treasury Yield Curve Rate T-Note Constant Maturity +
2.00%) |
|
| | 25,000 | | | | 4.110 | | | | 07/24/34 | | | | 21,414 | |
| | Westpac Banking Corp.(c), GMTN (Australia) | |
| | (5 Year USD Swap + 2.24%) | |
| | 25,000 | | | | 4.322 | | | | 11/23/31 | | | | 23,431 | |
| | | | | | | | | | | | | | |
| | | | | | | | | | | | | 2,518,567 | |
| | |
| Beverages – 0.7% | |
| Anheuser-Busch Cos. LLC / Anheuser-Busch InBev Worldwide,
Inc. (Belgium) |
|
| | 35,000 | | | | 4.700 | | | | 02/01/36 | | | | 32,997 | |
| | 192,000 | | | | 4.900 | | | | 02/01/46 | | | | 175,699 | |
| | |
|
| Foreign Bonds – (continued) | |
| Beverages – (continued) | |
| | Anheuser-Busch InBev Worldwide, Inc. (Belgium) | |
| 175,000 | | | | 4.750 | | | | 01/23/29 | | | | 172,972 | |
| | 100,000 | | | | 3.500 | | | | 06/01/30 | | | | 90,951 | |
| | 25,000 | | | | 4.950 | | | | 01/15/42 | | | | 23,433 | |
| | 100,000 | | | | 4.600 | | | | 04/15/48 | | | | 88,026 | |
| | 25,000 | | | | 5.550 | | | | 01/23/49 | | | | 24,916 | |
| | 25,000 | | | | 4.500 | | | | 06/01/50 | | | | 22,094 | |
| | JDE Peet’s NV(d) (Netherlands) | |
| | 150,000 | | | | 1.375 | | | | 01/15/27 | | | | 126,703 | |
| | | | | | | | | | | | | | |
| | | | | | | | | | | | | 757,791 | |
| | |
| Biotechnology – 0.1% | |
| | CSL Finance PLC (Australia) | |
| | 25,000 | | | | 3.850 | (d) | | | 04/27/27 | | | | 23,917 | |
| | 125,000 | | | | 4.250 | (d) | | | 04/27/32 | | | | 117,681 | |
| | | | | | | | | | | | | | |
| | | | | | | | | | | | | 141,598 | |
| | |
| Commercial Services – 0.2% | |
| | DP World Crescent Ltd., Series EMTN (United Arab Emirates) | |
| | 200,000 | | | | 3.875 | | | | 07/18/29 | | | | 186,600 | |
| | |
| Diversified Financial Services – 0.5% | |
| AerCap Ireland Capital DAC / AerCap Global Aviation Trust
(Ireland) |
|
| | 250,000 | | | | 2.450 | | | | 10/29/26 | | | | 218,639 | |
| | 225,000 | | | | 3.000 | | | | 10/29/28 | | | | 188,840 | |
| | Avolon Holdings Funding Ltd. (Ireland) | |
| | 25,000 | | | | 3.950 | (d) | | | 07/01/24 | | | | 23,962 | |
| | 100,000 | | | | 2.875 | (d) | | | 02/15/25 | | | | 92,391 | |
| | 25,000 | | | | 4.250 | (d) | | | 04/15/26 | | | | 22,683 | |
| | | | | | | | | | | | | | |
| | | | | | | | | | | | | 546,515 | |
| | |
| Electric – 0.2% | |
| | Korea Hydro & Nuclear Power Co. Ltd.(d) (South Korea) | |
| | 220,000 | | | | 4.250 | | | | 07/27/27 | | | | 211,422 | |
| | |
| Engineering & Construction – 0.1% | |
| | Cellnex Finance Co. SA, Series EMTN (Spain) | |
| | 100,000 | | | | 1.250 | | | | 01/15/29 | | | | 85,705 | |
| | |
| Machinery-Construction & Mining – 0.1% | |
| | Weir Group PLC (The)(d) (United Kingdom) | |
| | 200,000 | | | | 2.200 | | | | 05/13/26 | | | | 178,076 | |
| | |
| Mining – 0.3% | |
| | Glencore Funding LLC (Australia) | |
| | 75,000 | | | | 4.125 | (d) | | | 03/12/24 | | | | 73,712 | |
| | 25,000 | | | | 4.625 | (d) | | | 04/29/24 | | | | 24,685 | |
| | 75,000 | | | | 1.625 | (d) | | | 04/27/26 | | | | 66,379 | |
| | 150,000 | | | | 2.625 | (d) | | | 09/23/31 | | | | 119,578 | |
| | Newcrest Finance Pty Ltd.(d) (Australia) | |
| | 25,000 | | | | 3.250 | | | | 05/13/30 | | | | 20,910 | |
| | Teck Resources Ltd. (Canada) | |
| | 25,000 | | | | 3.900 | | | | 07/15/30 | | | | 22,436 | |
| | | | | | | | | | | | | | |
| | | | | | | | | | | | | 327,700 | |
| | |
| | |
| The accompanying notes are an integral part of these financial statements. | | 15 |
GOLDMAN SACHS VARIABLE INSURANCE TRUST CORE FIXED INCOME FUND
Schedule of Investments (continued)
December 31, 2022
| | | | | | | | | | | | | | |
Principal
Amount | | | Interest
Rate | | | Maturity
Date | | | Value | |
|
| Foreign Bonds – (continued) | |
| Oil & Gas – 0.2% | |
| | Saudi Arabian Oil Co. (Saudi Arabia) | |
| $ | 220,000 | | | | 3.500 | % | | | 04/16/29 | | | $ | 200,860 | |
| | |
| Pharmaceuticals – 0.2% | |
| | Bayer US Finance II LLC(d) (Germany) | |
| | 200,000 | | | | 3.875 | | | | 12/15/23 | | | | 196,903 | |
| | |
| Pipelines – 0.2% | |
| | Enbridge, Inc. (Canada) | |
| | 125,000 | | | | 2.500 | | | | 08/01/33 | | | | 96,294 | |
| | Galaxy Pipeline Assets Bidco Ltd. (United Arab Emirates) | |
| | 193,306 | | | | 2.940 | | | | 09/30/40 | | | | 154,621 | |
| | | | | | | | | | | | | | |
| | | | | | | | | | | | | 250,915 | |
| | |
| Semiconductors – 0.2% | |
| | NXP BV / NXP Funding LLC / NXP USA, Inc. (China) | |
| | 25,000 | | | | 3.400 | | | | 05/01/30 | | | | 21,574 | |
| | 125,000 | | | | 2.500 | | | | 05/11/31 | | | | 98,793 | |
| | 125,000 | | | | 2.650 | | | | 02/15/32 | | | | 97,772 | |
| | | | | | | | | | | | | | |
| | | | | | | | | | | | | 218,139 | |
| | |
| Transportation – 0.0% | |
| | Canadian Pacific Railway Co. (Canada) | |
| | 25,000 | | | | 2.050 | | | | 03/05/30 | | | | 20,487 | |
| | 50,000 | | | | 2.450 | | | | 12/02/31 | | | | 41,617 | |
| | | | | | | | | | | | | | |
| | | | | | | | | | | | | 62,104 | |
| | |
| | TOTAL FOREIGN BONDS | |
| | (Cost $6,791,848) | | | | | | | $ | 6,007,998 | |
| | |
| | | | | | | | | | | | | | |
|
| Asset-Backed Securities – 3.7% | |
| Collateralized Loan Obligations – 3.3% | |
| | Cathedral Lake VIII Ltd., Series 2021-8A, Class C(c)(d) | |
| | (3 Mo. LIBOR + 2.620%) (Cayman Islands) | |
| $ | 200,000 | | | | 6.863 | % | | | 01/20/35 | | | $ | 184,681 | |
| | CBAM Ltd., Series 2018-5A, Class A(c)(d) | |
| | (3 Mo. LIBOR + 1.020%) (Cayman Islands) | |
| | 525,000 | | | | 5.099 | | | | 04/17/31 | | | | 516,150 | |
| | CFIP CLO Ltd., Series 2021-1A, Class A(c)(d) | |
| | (3 Mo. LIBOR + 1.220%) (Cayman Islands) | |
| | 700,000 | | | | 5.463 | | | | 01/20/35 | | | | 673,077 | |
| | CFIP CLO Ltd., Series 2021-1A, Class C1(c)(d) | |
| | (3 Mo. LIBOR + 2.400%) (Cayman Islands) | |
| | 300,000 | | | | 6.643 | | | | 01/20/35 | | | | 274,221 | |
| | Crown City CLO I, Series 2020-1A, Class A1AR(c)(d) | |
| | (3 Mo. LIBOR + 1.190%) (Cayman Islands) | |
| | 250,000 | | | | 5.433 | | | | 07/20/34 | | | | 241,842 | |
| | Diameter Capital CLO 1 Ltd., Series 2021-1A, Class A1A(c)(d) | |
| | (3 Mo. LIBOR + 1.240%) | |
| | 425,000 | | | | 5.319 | | | | 07/15/36 | | | | 411,108 | |
| | HalseyPoint CLO 3 Ltd., Series 2020-3A, Class A1A(c)(d) | |
| | (3 Mo. LIBOR + 1.450%) (Cayman Islands) | |
| | 250,000 | | | | 5.865 | | | | 11/30/32 | | | | 246,663 | |
| | Jamestown CLO XV Ltd., Series 2020-15A, Class A(c)(d) | |
| | (3 Mo. LIBOR + 1.340%) (Cayman Islands) | |
| | 300,000 | | | | 5.419 | | | | 04/15/33 | | | | 293,779 | |
| | |
|
| Asset-Backed Securities – (continued) | |
| Collateralized Loan Obligations – (continued) | |
| | Marble Point CLO XVII Ltd., Series 2020-1A, Class A(c)(d) | |
| | (3 Mo. LIBOR + 1.300%) (Cayman Islands) | |
| 500,000 | | | | 5.543 | | | | 04/20/33 | | | | 486,650 | |
| | Venture 39 CLO Ltd., Series 2020-39A, Class A1(c)(d) | |
| | (3 Mo. LIBOR + 1.280%) (Cayman Islands) | |
| | 275,000 | | | | 5.359 | | | | 04/15/33 | | | | 267,655 | |
| | | | | | | | | | | | | | |
| | | | | | | | | | | | | 3,595,826 | |
| | |
| Diversified Financial Services – 0.2% | |
| | Lcm 38 Ltd., Series 2022-38A, Class A1A(c)(d) | |
| | (TSFR3M + 2.100%) (United Kingdom) | |
| | 250,000 | | | | 4.592 | | | | 07/15/34 | | | | 247,951 | |
| | |
| Collateralized Debt Obligations – 0.2% | |
| Arbor Realty Commercial Real Estate Notes Ltd.,
Series 2022-FL1, Class A(c)(d) |
|
| | (SOFR + 1.450%) (Cayman Islands) | |
| | 250,000 | | | | 5.257 | | | | 01/15/37 | | | | 242,007 | |
| | |
| | TOTAL ASSET-BACKED SECURITIES | |
| | (Cost $4,221,650) | | | | | | | $ | 4,085,784 | |
| | |
| | | | | | | | | | | | | | |
|
| U.S. Government Agency Securities – 2.8% | |
| | Federal Farm Credit Banks Funding Corp. | | | | | |
| $ | 460,000 | | | | 2.900 | %(f) | | | 04/12/32 | | | $ | 403,722 | |
| | 230,000 | | | | 3.300 | (f) | | | 05/19/32 | | | | 207,213 | |
| | 130,000 | | | | 3.500 | (f) | | | 09/01/32 | | | | 118,463 | |
| | 600,000 | | | | 2.850 | (f) | | | 03/28/34 | | | | 502,620 | |
| | 340,000 | | | | 3.080 | (f) | | | 03/30/37 | | | | 278,322 | |
| | Federal Home Loan Banks | | | | | |
| | 100,000 | | | | 3.375 | (f) | | | 12/08/23 | | | | 98,574 | |
| | 250,000 | | | | 3.375 | (f) | | | 09/10/32 | | | | 225,416 | |
| | 430,000 | | | | 4.750 | (f) | | | 12/10/32 | | | | 437,632 | |
| | Federal National Mortgage Associations | | | | | |
| | 400,000 | | | | 1.875 | (f) | | | 09/24/26 | | | | 368,735 | |
| | 400,000 | | | | 6.250 | (f) | | | 05/15/29 | | | | 446,634 | |
| | |
| | TOTAL U.S. GOVERNMENT AGENCY SECURITIES | |
| | (Cost $3,430,888) | | | | | | | $ | 3,087,331 | |
| | |
| | | | | | | | | | | | | | |
|
| Commercial Mortgage-Backed Securities – 1.7% | |
| | 3650R Commercial Mortgage Trust Series 2021-PF1, Class AS(c) | |
| $ | 150,000 | | | | 2.778 | % | | | 11/15/54 | | | $ | 115,537 | |
| Banc of America Commercial Mortgage Trust Series 2016-UB10,
Class D(d) |
|
| | 100,000 | | | | 3.000 | | | | 07/15/49 | | | | 76,344 | |
| | BANK Series 2019-BN21, Class A5 | |
| | 150,000 | | | | 2.851 | | | | 10/17/52 | | | | 129,494 | |
| | BANK Series 2021-BN32, Class A5 | |
| | 150,000 | | | | 2.643 | | | | 04/15/54 | | | | 124,979 | |
| | BANK Series 2022-BNK43, Class A5 | |
| | 200,000 | | | | 4.399 | | | | 08/15/55 | | | | 189,516 | |
| | BBCMS Mortgage Trust Series 2022-C17, Class A5 | |
| | 450,000 | | | | 4.441 | | | | 09/15/55 | | | | 428,784 | |
| | |
| | |
| 16 | | The accompanying notes are an integral part of these financial statements. |
GOLDMAN SACHS VARIABLE INSURANCE TRUST CORE FIXED INCOME FUND
| | | | | | | | | | | | | | |
Principal
Amount | | | Interest
Rate | | | Maturity
Date | | | Value | |
|
| Commercial Mortgage-Backed Securities – (continued) | |
| | Bx Trust Series 2022-PSB, Class A(c) (TSFR1M + 2.451%)(d) | |
| $ | 98,856 | | | | 6.787 | % | | | 08/15/39 | | | $ | 98,008 | |
| BX Trust Series 2021-ARIA, Class C(c) (1 Mo. LIBOR +
1.646%)(d) |
|
| | 150,000 | | | | 5.964 | | | | 10/15/36 | | | | 139,942 | |
| Cantor Commercial Real Estate Lending Series 2019-CF3,
Class A4 |
|
| | 100,000 | | | | 3.006 | | | | 01/15/53 | | | | 86,351 | |
| | DOLP Trust Series 2021-NYC, Class A(d) | |
| | 200,000 | | | | 2.956 | | | | 05/10/41 | | | | 159,542 | |
| EQUS Mortgage Trust Series 2021-EQAZ, Class A(c) (1 Mo.
LIBOR + 0.755%)(d) |
|
| | 199,996 | | | | 5.073 | | | | 10/15/38 | | | | 192,564 | |
| Taubman Centers Commercial Mortgage Trust Series 2022-DPM,
Class A(c) (TSFR1M + 2.186%)(d) |
|
| | 150,000 | | | | 6.522 | | | | 05/15/37 | | | | 145,459 | |
| | |
| | TOTAL COMMERCIAL MORTGAGE-BACKED SECURITIES | |
| | (Cost $2,133,694) | | | | | | | $ | 1,886,520 | |
| | |
| | | | | | | | | | | | | | |
|
| Municipal Bonds – 1.2% | |
| Arizona – 0.0% | |
| | City of Tucson AZ | |
| $ | 25,000 | | | | 1.932 | % | | | 07/01/31 | | | $ | 19,011 | |
| | |
| California – 0.6% | |
| | Bay Area Toll Authority | |
| | 30,000 | | | | 1.633 | | | | 04/01/28 | | | | 25,654 | |
| | California Health Facilities Financing Authority | |
| | 125,000 | | | | 3.478 | | | | 06/01/29 | | | | 114,489 | |
| | 100,000 | | | | 3.790 | | | | 06/01/32 | | | | 90,053 | |
| | California Statewide Communities Development Authority | |
| | 50,000 | | | | 1.877 | | | | 02/01/31 | | | | 37,983 | |
| | Municipal Improvement Corp. of Los Angeles | |
| | 35,000 | | | | 1.648 | | | | 11/01/28 | | | | 28,919 | |
| | 80,000 | | | | 2.074 | | | | 11/01/30 | | | | 63,769 | |
| | Port of Oakland | |
| | 80,000 | | | | 2.199 | | | | 05/01/31 | | | | 63,198 | |
| | San Francisco Municipal Transportation Agency | |
| | 30,000 | | | | 1.302 | | | | 03/01/28 | | | | 24,716 | |
| | San Jose Financing Authority | |
| | 25,000 | | | | 1.812 | | | | 06/01/29 | | | | 20,374 | |
| | 25,000 | | | | 1.862 | | | | 06/01/30 | | | | 19,809 | |
| | State of California | |
| | 105,000 | | | | 7.625 | | | | 03/01/40 | | | | 132,603 | |
| | | | | | | | | | | | | | |
| | | | | | | | | | | | | 621,567 | |
| | |
| Florida – 0.1% | |
| | State Board of Administration Finance Corp. | |
| | 70,000 | | | | 2.154 | | | | 07/01/30 | | | | 57,317 | |
| | |
| Illinois – 0.2% | |
| | Chicago O’Hare International Airport | |
| | 85,000 | | | | 2.346 | | | | 01/01/30 | | | | 71,040 | |
| | |
|
| Municipal Bonds – (continued) | |
| Illinois – (continued) | |
| | State of Illinois GO Bonds | |
| 25,000 | | | | 5.100 | | | | 06/01/33 | | | | 23,993 | |
| | 92,857 | | | | 7.350 | | | | 07/01/35 | | | | 97,688 | |
| | | | | | | | | | | | | | |
| | | | | | | | | | | | | 192,721 | |
| | |
| Louisiana – 0.1% | |
| | City of New Orleans LA Water System Revenue | |
| | 25,000 | | | | 1.008 | | | | 12/01/26 | | | | 21,360 | |
| Louisiana Local Government Environmental Facilities &
Community Development Auth, Series 2022-ELL A |
|
| | 140,000 | | | | 4.275 | | | | 02/01/36 | | | | 130,171 | |
| | | | | | | | | | | | | | |
| | | | | | | | | | | | | 151,531 | |
| | |
| New York – 0.0% | |
| | City of New York NY | |
| | 40,000 | | | | 1.940 | | | | 03/01/29 | | | | 33,470 | |
| | Metropolitan Transportation Authority | |
| | 25,000 | | | | 5.989 | | | | 11/15/30 | | | | 25,861 | |
| New York City Transitional Finance Authority Future Tax
Secured Revenue |
|
| | 10,000 | | | | 3.590 | | | | 08/01/27 | | | | 9,341 | |
| | | | | | | | | | | | | | |
| | | | | | | | | | | | | 68,672 | |
| | |
| Ohio – 0.1% | |
| | American Municipal Power, Inc. | |
| | 100,000 | | | | 6.270 | | | | 02/15/50 | | | | 105,717 | |
| | |
| Texas – 0.1% | |
| | City of Houston TX Airport System Revenue | |
| | 30,000 | | | | 2.235 | | | | 07/01/29 | | | | 25,226 | |
| | 40,000 | | | | 2.285 | | | | 07/01/30 | | | | 32,900 | |
| | | | | | | | | | | | | | |
| | | | | | | | | | | | | 58,126 | |
| | |
| | TOTAL MUNICIPAL BONDS | |
| | (Cost $1,399,478) | | | | | | | $ | 1,274,662 | |
| | |
| | | | | | | | | | | | | | |
|
| Foreign Government Securities – 1.1% | |
| Sovereign – 1.1% | |
| | Indonesia Government International Bond | |
| $ | 200,000 | | | | 3.050 | % | | | 03/12/51 | | | $ | 144,522 | |
| | Israel Government AID Bonds(g) | | | | | |
| | 200,000 | | | | 5.500 | (f) | | | 12/04/23 | | | | 201,052 | |
| | 100,000 | | | | 5.500 | (f) | | | 04/26/24 | | | | 100,745 | |
| | Mexico Government International Bond(b) | |
| | 400,000 | | | | 3.250 | | | | 04/16/30 | | | | 347,700 | |
| | 110,000 | | | | 1.450 | | | | 10/25/33 | | | | 83,257 | |
| | 200,000 | | | | 4.280 | | | | 08/14/41 | | | | 154,637 | |
| | Peruvian Government International Bond(b) | |
| | 50,000 | | | | 3.230 | | | | 07/28/21 | | | | 29,150 | |
| | Romanian Government International Bond(d) | |
| | 40,000 | | | | 3.000 | | | | 02/27/27 | | | | 35,422 | |
| | 10,000 | | | | 2.124 | | | | 07/16/31 | | | | 7,355 | |
| | 30,000 | | | | 2.625 | | | | 12/02/40 | | | | 17,839 | |
| | 10,000 | | | | 4.625 | | | | 04/03/49 | | | | 7,729 | |
| | Romanian Government International Bond, Series EMTN | |
| | 50,000 | | | | 2.875 | | | | 03/11/29 | | | | 44,166 | |
| | |
| | |
| The accompanying notes are an integral part of these financial statements. | | 17 |
GOLDMAN SACHS VARIABLE INSURANCE TRUST CORE FIXED INCOME FUND
Schedule of Investments (continued)
December 31, 2022
| | | | | | | | | | | | | | |
Principal
Amount | | | Interest
Rate | | | Maturity
Date | | | Value | |
|
| Foreign Government Securities – (continued) | |
| Sovereign – (continued) | |
| | Uruguay Government International Bond(b) | |
| $ | 50,000 | | | | 4.375 | % | | | 01/23/31 | | | $ | 49,689 | |
| | |
| | TOTAL FOREIGN GOVERNMENT SECURITIES | |
| | (Cost $1,496,202) | | | | | | | $ | 1,223,263 | |
| | |
| | | | | | | | | | | | | | |
|
| Collateralized Mortgage Obligations – 0.4% | |
| Alternative Loan Trust Series 2005-38, Class A1(c) (1 Year CMT
+ 1.500%) |
|
| $ | 41,620 | | | | 3.548 | % | | | 09/25/35 | | | $ | 36,496 | |
| Connecticut Avenue Securities Trust Series 2021-R01,
Class 1M2(c) (SOFR + 1.550%)(d) |
|
| | 44,000 | | | | 5.478 | | | | 10/25/41 | | | | 42,878 | |
| Connecticut Avenue Securities Trust Series 2021-R03,
Class 1M2(c) (SOFR + 1.650%)(d) |
|
| | 42,000 | | | | 5.578 | | | | 12/25/41 | | | | 39,594 | |
| Connecticut Avenue Securities Trust Series 2022-R05,
Class 2M1(c) (SOFR + 1.900%)(d) |
|
| | 42,627 | | | | 5.828 | | | | 04/25/42 | | | | 42,317 | |
| Connecticut Avenue Securities Trust Series 2022-R05,
Class 2M2(c) (SOFR + 3.000%)(d) |
|
| | 36,000 | | | | 6.928 | | | | 04/25/42 | | | | 34,832 | |
| Federal Home Loan Mortgage Corporation Series 2020-DNA5,
Class M2(c) (SOFR + 2.800%)(d) |
|
| | 14,186 | | | | 6.728 | | | | 10/25/50 | | | | 14,254 | |
| Federal Home Loan Mortgage Corporation Series 2021-DNA5,
Class M2(c) (SOFR + 1.650%)(d) |
|
| | 24,333 | | | | 5.578 | | | | 01/25/34 | | | | 23,957 | |
| Federal Home Loan Mortgage Corporation Series 2022-DNA1,
Class M1A(c) (SOFR + 1.000%)(d) |
|
| | 88,685 | | | | 4.928 | | | | 01/25/42 | | | | 86,565 | |
| Federal Home Loan Mortgage Corporation Series 2022-DNA3,
Class M1A(c) (SOFR + 2.000%)(d) |
|
| | 35,105 | | | | 5.928 | | | | 04/25/42 | | | | 35,027 | |
| | JPMorgan Mortgage Trust Series 2021-6, Class A3(c)(d) | |
| | 93,482 | | | | 2.500 | | | | 10/25/51 | | | | 75,333 | |
| Wells Fargo Mortgage Backed Securities Trust Series 2019-3,
Class A1(c)(d) |
|
| | 6,317 | | | | 3.500 | | | | 07/25/49 | | | | 5,595 | |
| | |
| | TOTAL COLLATERALIZED MORTGAGE OBLIGATIONS | |
| | (Cost $469,999) | | | | | | | $ | 436,848 | |
| | |
| | | | | | | | | | | | | | |
|
| U.S. Treasury Obligations – 20.9% | |
| | U.S. Treasury Bonds | | | | | |
| $ | 1,640,000 | | | | 3.125 | %(f) | | | 11/15/41 | | | $ | 1,417,575 | |
| | 1,550,000 | | | | 2.750 | (f) | | | 08/15/42 | | | | 1,248,477 | |
| | 2,310,000 | | | | 2.750 | (f) | | | 11/15/42 | | | | 1,854,858 | |
| | 420,000 | | | | 2.250 | (f) | | | 08/15/49 | | | | 296,953 | |
| | 2,930,000 | | | | 2.375 | (f) | | | 11/15/49 | | | | 2,131,575 | |
| | |
|
| U.S. Treasury Obligations – (continued) | |
| 3,200,000 | | | | 2.000 | (f) | | | 02/15/50 | | | | 2,124,500 | |
| | 640,000 | | | | 2.375 | (f) | | | 05/15/51 | | | | 461,400 | |
| | 170,000 | | | | 2.000 | (f) | | | 08/15/51 | | | | 111,881 | |
| | 170,000 | | | | 1.875 | (f) | | | 11/15/51 | | | | 108,216 | |
| | U.S. Treasury Notes | | | | | |
| | 1,185,000 | | | | 0.125 | (f) | | | 01/31/23 | | | | 1,180,973 | |
| | 720,000 | | | | 0.125 | (f) | | | 03/31/23 | | | | 712,434 | |
| | 1,030,000 | | | | 0.375 | (f) | | | 12/31/25 | | | | 920,482 | |
| | 4,050,000 | | | | 0.750 | (f) | | | 03/31/26 | | | | 3,631,078 | |
| | 2,030,000 | | | | 0.750 | (f) | | | 04/30/26 | | | | 1,814,947 | |
| | 1,720,000 | | | | 0.625 | (f) | | | 07/31/26 | | | | 1,519,513 | |
| | 140,000 | | | | 1.250 | (f) | | | 03/31/28 | | | | 121,723 | |
| | 970,000 | | | | 2.875 | (f) | | | 05/15/28 | | | | 915,513 | |
| | 1,180,000 | | | | 1.250 | (f) | | | 06/30/28 | | | | 1,020,147 | |
| | 250,000 | | | | 3.125 | (f) | | | 11/15/28 | | | | 238,359 | |
| | 1,370,000 | | | | 3.875 | (f) | | | 12/31/29 | | | | 1,361,894 | |
| | |
| | TOTAL U.S. TREASURY OBLIGATIONS | |
| | (Cost $27,683,201) | | | | | | | $ | 23,192,498 | |
| | |
| | | | | | | | | | | | | | |
| Shares | | | Dividend
Rate | | | | | | Value | |
|
| Investment Company – 5.2%(h) | |
| Goldman Sachs Financial Square Government Fund —
Institutional Shares |
|
| | 5,716,986 | | | | 4.159 | % | | | | | | $ | 5,716,986 | |
| | (Cost $5,716,986) | | | | | | | | | |
| | |
| | | | | | | | | | | | | | |
|
| Short-Term Investments – 1.2% | |
| Commercial Paper – 0.8% | |
| | Macquarie Bank Ltd. (SOFR + 0.450%) | |
| | 500,000 | | | | 4.760 | % | | | 04/06/23 | | | $ | 500,120 | |
| | Walt Disney Co./The | |
| | 393,000 | | | | 4.190 | | | | 02/02/23 | | | | 391,365 | |
| | |
| | | | | | | | | | | | | | |
| Certificate of Deposit – 0.4% | |
| | Mizuho Bank (SOFR + 0.36%) | | | | | |
| $ | 437,000 | | | | 4.670 | %(f) | | | 02/01/23 | | | $ | 437,083 | |
| | |
| | TOTAL SHORT-TERM INVESTMENTS | |
| | (Cost $1,328,634) | | | | | | | $ | 1,328,568 | |
| | |
| | TOTAL INVESTMENTS – 126.1% | |
| | (Cost $150,822,314) | | | | | | | $ | 139,585,940 | |
| | |
| LIABILITIES IN EXCESS OF
ASSETS – (26.1)% |
| | | (28,888,797 | ) |
| | |
| | NET ASSETS – 100.0% | | | $ | 110,697,143 | |
| | |
| | |
| 18 | | The accompanying notes are an integral part of these financial statements. |
GOLDMAN SACHS VARIABLE INSURANCE TRUST CORE FIXED INCOME FUND
| | |
| The percentage shown for each investment category reflects the value of investments in that category as a percentage of net assets. |
| |
| (a) | | TBA (To Be Announced) Securities are purchased on a forward commitment basis with an approximate principal amount and no defined maturity date. The actual principal and maturity date will be determined upon settlement when the specific mortgage pools are assigned. Total market value of TBA securities (excluding forward sales contracts, if any) amounts to $3,439,865 which represents approximately 3.1% of the Fund’s net assets as of December 31, 2022. |
| |
| (b) | | Securities with “Call” features. Maturity dates disclosed are the final maturity date. |
| |
| (c) | | Variable rate security. Except for floating rate notes (for which final maturity is disclosed), maturity date disclosed is the next interest reset date. Interest rate disclosed is that which is in effect on December 31, 2022. |
| |
| (d) | | Exempt from registration under Rule 144A of the Securities Act of 1933. |
| |
| (e) | | Step coupon. |
| |
| (f) | | Interest rates represent either the stated coupon rate, annualized yield on date of purchase for discounted securities, or, for floating rate securities, the current reset rate, which is based upon current interest rate indices. |
| |
| (g) | | Guaranteed by the United States Government. Total market value of $301,797, which represents 0.3% of net assets as of December 31, 2022. |
| |
| (h) | | Represents an affiliated issuer. |
| | |
| |
| Investment Abbreviations: |
| CLO | | —Collateralized Loan Obligation |
| CMT | | —Constant Maturity Treasury Index |
| EMTN | | —Euro Medium Term Note |
| FHLMC | | —Federal Home Loan Mortgage Corp. |
| FNMA | | —Federal National Mortgage Association |
| GNMA | | —Government National Mortgage Association |
| GMTN | | —Global Medium Term Note |
| GO | | —General Obligation |
| LIBOR | | —London Interbank Offered Rate |
| LP | | —Limited Partnership |
| MTN | | —Medium Term Note |
| PLC | | —Public Limited Company |
| SOFR | | —Secured Overnight Financing Rate |
|
| Currency Abbreviations: |
| AUD | | —Australian Dollar |
| CAD | | —Canadian Dollar |
| EUR | | —Euro |
| GBP | | —British Pound |
| JPY | | —Japanese Yen |
| NOK | | —Norwegian Krone |
| SEK | | —Swedish Krona |
| USD | | —United States Dollar |
ADDITIONAL INVESTMENT INFORMATION
FORWARD FOREIGN CURRENCY EXCHANGE CONTRACTS — As of December 31, 2022, the Fund had the following forward foreign currency exchange contracts:
FORWARD FOREIGN CURRENCY EXCHANGE CONTRACTS WITH UNREALIZED GAIN
| | | | | | | | | | | | | | | | |
| Counterparty | | Currency Purchased | | | Currency Sold | | | Settlement
Date | | | Unrealized
Gain | |
JPMorgan Chase Bank, N.A | | EUR | 673,533 | | | USD | 668,616 | | | | 1/6/2023 | | | $ | 52,577 | |
JPMorgan Chase Bank, N.A | | USD | 158,869 | | | SEK | 1,623,002 | | | | 3/6/2023 | | | | 2,769 | |
Morgan Stanley Co., Inc. | | CAD | 258,925 | | | USD | 189,510 | | | | 3/8/2023 | | | | 1,814 | |
Morgan Stanley Co., Inc. | | JPY | 11,613,652 | | | USD | 88,657 | | | | 3/16/2023 | | | | 716 | |
RBC Capital Markets, LLC | | USD | 249,523 | | | GBP | 202,413 | | | | 2/23/2023 | | | | 4,487 | |
| | | |
| TOTAL | | | | | | | | | | | $ | 62,363 | |
| | |
| The accompanying notes are an integral part of these financial statements. | | 19 |
GOLDMAN SACHS VARIABLE INSURANCE TRUST CORE FIXED INCOME FUND
Schedule of Investments (continued)
December 31, 2022
ADDITIONAL INVESTMENT INFORMATION (continued)
FORWARD FOREIGN CURRENCY EXCHANGE CONTRACTS WITH UNREALIZED LOSS
| | | | | | | | | | | | | | | | |
| Counterparty | | Currency
Purchased | | | Currency Sold | | | Settlement
Date | | | Unrealized
Loss | |
Bank of America | | SEK | 1,653,000 | | | USD | 161,802 | | | | 3/6/2023 | | | $ | (2,817 | ) |
Citigroup Global Markets | | USD | 80,494 | | | AUD | 120,366 | | | | 3/14/2023 | | | | (1,694 | ) |
Deutsche Bank Securities | | USD | 68,321 | | | JPY | 8,925,683 | | | | 3/16/2023 | | | | (367 | ) |
JPMorgan Chase Bank, N.A | | USD | 920,706 | | | EUR | 927,476 | | | | 1/6/2023 | | | | (72,401 | ) |
Morgan Stanley Co., Inc. | | USD | 210,827 | | | CAD | 288,050 | | | | 3/8/2023 | | | | (2,017 | ) |
RBC Capital Markets, LLC | | GBP | 324,627 | | | USD | 400,182 | | | | 2/23/2023 | | | | (7,196 | ) |
| | | | |
| TOTAL | | | | | | | | | | | | | | $ | (86,492 | ) |
FORWARD SALES CONTRACTS — As of December 31, 2022, the Fund had the following forward sales contracts:
| | | | | | | | | | | | | | | | | | | | |
| Description | | Interest
Rate | | | Maturity
Date(a) | | | Settlement
Date | | | Principal
Amount | | | Value | |
| Federal National Mortgage Association | | | 2.000 | % | | | TBA-30yr | | | | 01/15/53 | | | $ | (12,000,000 | ) | | $ | (9,794,626 | ) |
| Federal National Mortgage Association | | | 4.000 | | | | TBA-30yr | | | | 01/15/53 | | | | (2,000,000 | ) | | | (1,874,752 | ) |
| Federal National Mortgage Association | | | 4.500 | | | | TBA-30yr | | | | 01/15/53 | | | | (5,000,000 | ) | | | (4,812,770 | ) |
| Federal National Mortgage Association | | | 5.000 | | | | TBA-30yr | | | | 01/15/53 | | | | (3,000,000 | ) | | | (2,955,249 | ) |
| Federal National Mortgage Association | | | 5.500 | | | | TBA-30yr | | | | 01/15/53 | | | | (4,000,000 | ) | | | (4,010,680 | ) |
Government National Mortgage Association | | | 6.000 | | | | TBA-30yr | | | | 01/15/53 | | | | (1,000,000 | ) | | | (1,015,845 | ) |
| | | |
| Total (Proceed Receivable $(24,778,984)) | | | | | | | | | | | $ | (24,463,922 | ) |
| (a) | TBA (To Be Announced) Securities are purchased on a forward commitment basis with an approximate principal amount and no defined maturity date. The actual principal and maturity date will be determined upon settlement when the specific mortgage pools are assigned. |
FUTURES CONTRACTS — As of December 31, 2022, the Fund had the following futures contracts:
| | | | | | | | | | | | | | | | |
| Description | | Number of
Contracts | | | Expiration
Date | | | Notional
Amount | | | Unrealized
Appreciation/
(Depreciation) | |
| |
Long position contracts: | | | | | |
| | | | |
| U.S. Treasury 10 Year Note | | | 16 | | | | 03/22/23 | | | $ | 1,794,250 | | | $ | (10,185 | ) |
| U.S. Treasury 10 Year Ultra Note | | | 5 | | | | 03/22/23 | | | | 589,453 | | | | (12,415 | ) |
| U.S. Treasury 2 Year Note | | | 31 | | | | 03/31/23 | | | | 6,355,000 | | | | (1,039 | ) |
| U.S. Treasury 5 Year Note | | | 50 | | | | 03/31/23 | | | | 5,391,406 | | | | (21,586 | ) |
| U.S. Treasury Long Bond | | | 1 | | | | 03/22/23 | | | | 124,688 | | | | (221 | ) |
U.S. Treasury Ultra Bond | | | 5 | | | | 03/22/23 | | | | 667,656 | | | | (28,447 | ) |
| | | | |
| Total | | | | | | | | | | | | | | | (73,893 | ) |
| |
Short position contracts: | | | | | |
Long Gilt Future | | | (1 | ) | | | 03/29/23 | | | | (120,774 | ) | | | 6,666 | |
| | | | |
| Total Futures Contracts | | | | | | | | | | | | | | $ | (67,227 | ) |
| | |
| 20 | | The accompanying notes are an integral part of these financial statements. |
GOLDMAN SACHS VARIABLE INSURANCE TRUST CORE FIXED INCOME FUND
ADDITIONAL INVESTMENT INFORMATION (continued)
SWAP CONTRACTS — As of December 31, 2022, the Fund had the following swap contracts:
OVER THE COUNTER CREDIT DEFAULT SWAP CONTRACTS
| | | | | | | | | | | | | | | | | | | | | | | | | | | | | | | | |
| Reference Obligation/Index(a) | | Financing
Rate
Received
(Paid) by
the Fund | | | Credit
Spread at
December 31,
2022(b) | | | Counterparty | | | Termination
Date | | | Notional
Amount (000’s) | | | Value | | | Upfront
Premium
(Received)
Paid | | | Unrealized
Appreciation/
(Depreciation) | |
Protection Sold: | |
| General Electric Co. | | | 1.000 | % | | | 0.636 | % | | | Bank of America NA | | | | 06/20/2026 | | | USD | 175 | | | $ | 1,113 | | | $ | — | | | $ | 1,113 | |
| Nordstrom, Inc. | | | 1.000 | | | | 2.332 | | | | Bank of America NA | | | | 06/20/2024 | | | USD | 225 | | | | (5,248 | ) | | | (320 | ) | | | (4,928 | ) |
| ICE CD JWN | | | 1.000 | | | | 3.776 | | | | Bank of America NA | | | | 12/20/2024 | | | USD | 100 | | | | (3,777 | ) | | | (1,928 | ) | | | (1,849 | ) |
| Prudential Financial, Inc. | | | 1.000 | | | | 0.870 | | | | Bank of America NA | | | | 06/20/2027 | | | USD | 75 | | | | 653 | | | | 244 | | | | 409 | |
| Republic of Indonesia | | | 1.000 | | | | 0.082 | | | | Bank of America NA | | | | 12/20/2027 | | | USD | 200 | | | | (163 | ) | | | (1,750 | ) | | | 1,587 | |
| ICE CD US | | | 1.000 | | | | 1.318 | | | | Bank of America NA | | | | 12/20/2027 | | | USD | 210 | | | | (2,768 | ) | | | (6,281 | ) | | | 3,513 | |
| Republic of Chile | | | 1.000 | | | | 0.312 | | | | Bank of America NA | | | | 12/20/2027 | | | USD | 90 | | | | (281 | ) | | | (1,768 | ) | | | 1,487 | |
| Markit CDX North America Investment Grade Index | | | 1.000 | | | | 0.642 | | | | Bank of America NA | | | | 06/20/2025 | | | USD | 4,500 | | | | 28,883 | | | | 11,037 | | | | 17,846 | |
| Markit CDX North America Investment Grade Index | | | 1.000 | | | | 1.273 | | | | Bank of America NA | | | | 12/20/2025 | | | USD | 575 | | | | 7,319 | | | | — | | | | 7,319 | |
| Markit CDX North America Investment Grade Index | | | 1.000 | | | | 1.238 | | | | Bank of America NA | | | | 06/20/2026 | | | USD | 7,025 | | | | 86,991 | | | | 67,197 | | | | 19,794 | |
| ICE CDX Investment Grade Index | | | 1.000 | | | | 1.137 | | | | Bank of America NA | | | | 12/20/2026 | | | USD | (11,950) | | | | 135,879 | | | | 207,040 | | | | (71,161 | ) |
| ICE CDX Investment Grade Index | | | 1.000 | | | | 1.079 | | | | Bank of America NA | | | | 06/20/2027 | | | USD | (2,600) | | | | 28,061 | | | | 12,807 | | | | 15,254 | |
| | | | | | | | |
| TOTAL | | | | | | | | | | | | | | | | | | | | | | $ | 276,662 | | | $ | 286,278 | | | $ | (9,616 | ) |
| (a) | Payments received quarterly. |
| (b) | Credit spread on the referenced obligation, together with the period of expiration, are indicators of payment/performance risk. The likelihood of a credit event occurring which would require a fund or its counterparty to make a payment or otherwise be required to perform under the swap contract is generally greater as the credit spread and term of the swap contract increase. |
| | |
| The accompanying notes are an integral part of these financial statements. | | 21 |
GOLDMAN SACHS VARIABLE INSURANCE TRUST CORE FIXED INCOME FUND
Schedule of Investments (continued)
December 31, 2022
ADDITIONAL INVESTMENT INFORMATION (continued)
CENTRALLY CLEARED INTEREST RATE SWAP CONTRACTS
| | | | | | | | | | | | | | | | | | | | | | | | |
Payments
Made by
the Fund(a) | | Payments
Received by
the Fund | | | Termination
Date | | | Notional
Amounts
(000’s) | | | Value | | | Upfront
Premium
Paid | | | Unrealized
Appreciation | |
| 0.000%(b) | | | 1 Day SOFR | | | | 12/31/2024 | | | USD | 1,460 | | | $ | (416 | ) | | $ | 1,264 | | | $ | (1,680 | ) |
| 3 Month BBR(c) | | | 4.000% | | | | 03/15/2025 | | | AUD | 1,610 | | | | 5,854 | | | | (158 | ) | | | 6,012 | |
| 4.000(c) | | | 3 Month BA | | | | 03/15/2025 | | | CAD | 1,420 | | | | (8,063 | ) | | | 1,005 | | | | (9,068 | ) |
| 1.730(b) | | | 1 Day SOFR | | | | 02/08/2026 | | | USD | 6,200 | | | | 206,631 | | | | 61,981 | | | | 144,650 | |
| 0.000(b) | | | 1 Day SONIO | | | | 03/15/2028 | | | GBP | 300 | | | | (9,336 | ) | | | (2,870 | ) | | | (6,466 | ) |
| 1 Day ESTRON(b) | | | 3.000 | | | | 03/15/2028 | | | EUR | 20 | | | | 270 | | | | (400 | ) | | | 670 | |
| 12 Month BOJDTR(b) | | | 0.250 | | | | 03/15/2028 | | | JPY | 277,240 | | | | 40,817 | | | | 11,488 | | | | 29,329 | |
| 3 Month BA(b) | | | 3.500 | | | | 03/15/2028 | | | NOK | 5,250 | | | | (6,256 | ) | | | (6,122 | ) | | | (134 | ) |
| 1 Day ESTRON(b) | | | 2.350 | | | | 07/04/2029 | | | EUR | 100 | | | | 3,626 | | | | 166 | | | | 3,460 | |
| 0.000(b) | | | 1 Day SONIO | | | | 03/15/2033 | | | GBP | 70 | | | | (5,085 | ) | | | (1,456 | ) | | | (3,629 | ) |
| 1 Day ESTRON(b) | | | 3.000 | | | | 03/15/2033 | | | EUR | 130 | | | | 2,561 | | | | (1,757 | ) | | | 4,318 | |
| 12 Month BOJDTR(b) | | | 0.500 | | | | 03/15/2033 | | | JPY | 49,000 | | | | 15,651 | | | | 11,084 | | | | 4,567 | |
| 3 Month BA(c) | | | 3.500 | | | | 03/15/2033 | | | CAD | 480 | | | | 6,503 | | | | (6,581 | ) | | | 13,084 | |
| 3 Month STIBOR(b) | | | 3.000 | | | | 03/15/2033 | | | SEK | 520 | | | | 603 | | | | (1,994 | ) | | | 2,597 | |
| 3.750(b) | | | 1 Day SOFR | | | | 03/15/2033 | | | USD | 360 | | | | 6,536 | | | | 13,765 | | | | (7,229 | ) |
| 4.500(c) | | | 1 Day SOFR | | | | 03/15/2033 | | | AUD | 1,090 | | | | (4,593 | ) | | | 23,669 | | | | (28,262 | ) |
| 6 Month NIBOR(b) | | | 3.500 | | | | 03/15/2033 | | | NOK | 3,630 | | | | (6,824 | ) | | | (12,966 | ) | | | 6,142 | |
| 2.855(b) | | | 1 Day ESTRON | | | | 07/04/2037 | | | EUR | 380 | | | | (5,668 | ) | | | 2,322 | | | | (7,990 | ) |
| 1 Day ESTRON(b) | | | 1.560 | | | | 07/06/2052 | | | EUR | 270 | | | | 3,202 | | | | 809 | | | | 2,393 | |
| | | | | | |
| TOTAL | | | | | | | | | | | | | | $ | 246,013 | | | $ | 93,249 | | | $ | 152,764 | |
| (a) | Represents forward starting interest rate swaps whose effective dates of commencement of accruals and cash flows occur subsequent to December 31, 2022. |
| (b) | Payments made annually. |
| (c) | Payments made semi-annually. |
OVER THE COUNTER INTEREST RATE SWAPTIONS — As of December 31, 2022, the Fund had the following swaptions contracts:
| | | | | | | | | | | | | | | | | | | | | | | | | | | | | | |
| Description | | Counterparty | | Exercise
rate | | | Expiration
Date | | | Number of
Contracts | | | Notional
Amount | | | Value | | | Premiums
Paid (Received)
by Fund | | | Unrealized
Appreciation/
(Depreciation) | |
|
Purchased Option Contracts | |
|
Puts | |
| 6M IRS | | Morgan Stanley Co., Inc. | | | EUR2.518 | | | | 10/30/2023 | | | | 390,000 | | | $ | 390,000 | | | $ | 5,099 | | | $ | 10,358 | | | $ | (5,259 | ) |
| | | | | |
| Total Purchased Option Contracts | | | | 390,000 | | | | | | | $ | 5,099 | | | $ | 10,358 | | | $ | (5,259 | ) |
|
Written Option Contracts | |
|
Puts | |
6M IRS | | Morgan Stanley Co., Inc. | | | EUR1.945 | | | | 10/30/2023 | | | | (160,000 | ) | | $ | (160,000 | ) | | $ | (5,864 | ) | | $ | (10,111 | ) | | $ | 4,247 | |
| | | | | |
| Total Written Option Contracts | | | | (160,000 | ) | | | | | | $ | (5,864 | ) | | $ | (10,111 | ) | | $ | 4,247 | |
Abbreviations:
6M IRS —6 Months Interest Rate Swaptions
| | |
| 22 | | The accompanying notes are an integral part of these financial statements. |
GOLDMAN SACHS VARIABLE INSURANCE TRUST CORE FIXED INCOME FUND
Statement of Assets and Liabilities
December 31, 2022
| | | | |
| | | | |
| Assets: | | | |
Investments in unaffiliated issuers, at value (cost $145,105,328) | | $ | 133,868,954 | |
Investments in affiliated issuers, at value (cost $5,716,986) | | | 5,716,986 | |
Purchased Options, at value (premiums paid $10,358) | | | 5,099 | |
Cash | | | 1,704,742 | |
Foreign currency, at value (cost $26,187) | | | 26,983 | |
Receivables: | | | | |
Investments sold on an extended-settlement basis | | | 34,161,043 | |
Collateral on certain derivative contracts(a) | | | 1,132,425 | |
Interest and Dividends | | | 670,945 | |
Fund shares sold | | | 149,518 | |
Reimbursement from investment adviser | | | 15,480 | |
Unrealized gain on forward foreign currency exchange contracts | | | 62,363 | |
Variation margin on swap contracts | | | 4,822 | |
Other assets | | | 150 | |
| |
| Total assets | | | 177,519,510 | |
| | | | |
| | | | |
| Liabilities: | | | |
Forward sale contracts, at value (proceeds received $24,778,984) | | | 24,463,922 | |
Variation margin on futures contracts | | | 21,247 | |
Unrealized loss on forward foreign currency exchange contracts | | | 86,492 | |
Written options, at value (premiums received $10,111) | | | 5,864 | |
Payables: | | | | |
Investments purchased | | | 41,973,276 | |
Management fees | | | 36,225 | |
Fund shares redeemed | | | 25,691 | |
Distribution and Service fees and Transfer Agency fees | | | 19,828 | |
Accrued expenses | | | 189,822 | |
| |
| Total liabilities | | | 66,822,367 | |
| | | | |
| | | | |
| Net Assets: | | | |
Paid-in capital | | | 126,885,176 | |
Total distributable earnings (loss) | | | (16,188,033 | ) |
| |
| NET ASSETS | | $ | 110,697,143 | |
Net Assets: | | | | |
Institutional | | $ | 38,157,209 | |
Service | | | 72,539,934 | |
| |
Total Net Assets | | $ | 110,697,143 | |
Shares outstanding $0.001 par value (unlimited number of shares authorized): | | | | |
Institutional | | | 4,054,231 | |
Service | | | 7,717,504 | |
Net asset value, offering and redemption price per share: | | | | |
Institutional | | | $9.41 | |
Service | | | 9.40 | |
(a) Segregated for initial margin and/or collateral as follows:
| | | | | | | | |
| Fund | | Futures | | | Swaps | |
| | |
Core Fixed Income | | $ | 208,086 | | | $ | 924,339 | |
| | |
| The accompanying notes are an integral part of these financial statements. | | 23 |
GOLDMAN SACHS VARIABLE INSURANCE TRUST CORE FIXED INCOME FUND
Statement of Operations
For the Fiscal Year Ended December 31, 2022
| | | | |
| | | | |
| Investment income: | | | |
Interest | | $ | 2,419,151 | |
Dividends — affiliated issuers | | | 100,263 | |
| |
| Total investment income | | | 2,519,414 | |
| | | | |
| | | | |
| Expenses: | | | |
Management fees | | | 406,046 | |
Distribution and Service fees — Service Shares | | | 177,496 | |
Professional fees | | | 139,051 | |
Custody, accounting and administrative services | | | 95,323 | |
Trustee fees | | | 27,480 | |
Transfer Agency fees(a) | | | 20,302 | |
Printing and mailing costs | | | 18,853 | |
Other | | | 7,472 | |
| |
| Total expenses | | | 892,023 | |
| |
Less — expense reductions | | | (294,396 | ) |
| |
| Net expenses | | | 597,627 | |
| |
| NET INVESTMENT INCOME | | | 1,921,787 | |
| | | | |
| | | | |
| Realized and unrealized gain (loss): | | | |
Net realized gain (loss) from: | | | | |
Investments — unaffiliated issuers | | | (3,540,137 | ) |
Futures contracts | | | (1,945,450 | ) |
Swap contracts | | | 243,115 | |
Written options | | | 878 | |
Purchased options | | | (10,797 | ) |
Forward foreign currency exchange contracts | | | 58,844 | |
Foreign currency transactions | | | 1,962 | |
Net change in unrealized gain (loss) on: | | | | |
Investments — unaffiliated issuers | | | (12,167,993 | ) |
Forward Sales Contracts | | | 316,828 | |
Futures contracts | | | (119,157 | ) |
Written options | | | (1,111 | ) |
Purchased Options | | | 4,318 | |
Swap contracts | | | (103,917 | ) |
Forward foreign currency exchange contracts | | | (26,894 | ) |
Foreign currency translations | | | (3,692 | ) |
| |
| Net realized and unrealized loss | | | (17,293,203 | ) |
| |
| NET DECREASE IN NET ASSETS RESULTING FROM OPERATIONS | | $ | (15,371,416 | ) |
(a) Class specific and Transfer Agency fees were as follows:
| | | | | | | | |
| | | Transfer Agency Fees | |
Fund | | Institutional | | | Service | |
Core Fixed Income | | $ | 6,103 | | | $ | 14,199 | |
| | |
| 24 | | The accompanying notes are an integral part of these financial statements. |
GOLDMAN SACHS VARIABLE INSURANCE TRUST CORE FIXED INCOME FUND
Statements of Changes in Net Assets
| | | | | | | | |
| | | For the
Fiscal Year Ended
December 31, 2022 | | | For the
Fiscal Year Ended
December 31, 2021 | |
| | | | | | | | |
| From operations: | | | | | | |
Net investment income | | $ | 1,921,787 | | | $ | 769,313 | |
Net realized loss | | | (5,191,585 | ) | | | (403,832 | ) |
Net change in unrealized loss | | | (12,101,618 | ) | | | (1,969,524 | ) |
| | |
| Net decrease in net assets resulting from operations | | | (15,371,416 | ) | | | (1,604,043 | ) |
| | | | | | | | |
| | | | | | | | |
| Distributions to shareholders: | | | | | | |
From distributable earnings: | | | | | | | | |
Institutional Shares | | | (498,802 | ) | | | (368,886 | ) |
Service Shares | | | (1,038,833 | ) | | | (758,578 | ) |
| | |
| Total distributions to shareholders | | | (1,537,635 | ) | | | (1,127,464 | ) |
| | | | | | | | |
| | | | | | | | |
| From share transactions: | | | | | | |
Proceeds from sales of shares | | | 33,277,943 | | | | 46,513,298 | |
Reinvestment of distributions | | | 1,537,635 | | | | 1,127,464 | |
Cost of shares redeemed | | | (10,255,336 | ) | | | (13,688,105 | ) |
| | |
| Net increase in net assets resulting from share transactions | | | 24,560,242 | | | | 33,952,657 | |
| | |
| TOTAL INCREASE | | | 7,651,191 | | | | 31,221,150 | |
| | | | | | | | |
| | | | | | | | |
| Net Assets: | | | | | | |
| | |
Beginning of year | | | 103,045,952 | | | | 71,824,802 | |
| | |
End of year | | $ | 110,697,143 | | | $ | 103,045,952 | |
| | |
| The accompanying notes are an integral part of these financial statements. | | 25 |
GOLDMAN SACHS VARIABLE INSURANCE TRUST CORE FIXED INCOME FUND
Financial Highlights
Selected Data for a Share Outstanding Throughout Each Year
| | | | | | | | | | | | | | | | | | | | |
| | | Goldman Sachs Core Fixed Income Fund | |
| | | Institutional Shares | |
| | | Year Ended December 31, | |
| | 2022 | | | 2021 | | | 2020 | | | 2019 | | | 2018 | |
| | | | | | | | | | | | | | | | | | | | |
| Per Share Data | | | | | | | | | | | | | | | |
| | | | | |
Net asset value, beginning of year | | $ | 11.13 | | | $ | 11.53 | | | $ | 10.85 | | | $ | 10.20 | | | $ | 10.66 | |
| | | | | |
Net investment income(a) | | | 0.21 | | | | 0.12 | | | | 0.18 | | | | 0.26 | | | | 0.29 | |
| | | | | |
Net realized and unrealized gain (loss) | | | (1.77 | ) | | | (0.36 | ) | | | 0.86 | | | | 0.69 | | | | (0.37 | ) |
| | | | | |
Total from investment operations | | | (1.56 | ) | | | (0.24 | ) | | | 1.04 | | | | 0.95 | | | | (0.08 | ) |
| | | | | |
Distributions to shareholders from net investment income | | | (0.16 | ) | | | (0.14 | ) | | | (0.26 | ) | | | (0.30 | ) | | | (0.38 | ) |
| | | | | |
Distributions to shareholders from net realized gains | | | — | | | | (0.02 | ) | | | (0.10 | ) | | | — | | | | — | |
| | | | | |
Total distributions | | | (0.16 | ) | | | (0.16 | ) | | | (0.36 | ) | | | (0.30 | ) | | | (0.38 | ) |
| | | | | |
Net asset value, end of year | | $ | 9.41 | | | $ | 11.13 | | | $ | 11.53 | | | $ | 10.85 | | | $ | 10.20 | |
| | | | | |
Total Return(b) | | | (14.03 | )% | | | (2.06 | )% | | | 9.64 | % | | | 9.28 | % | | | (0.58 | )% |
| | | | | |
Net assets, end of year (in 000’s) | | $ | 38,157 | | | $ | 31,179 | | | $ | 25,194 | | | $ | 17,421 | | | $ | 2,657 | |
| | | | | |
Ratio of net expenses to average net assets | | | 0.41 | % | | | 0.41 | % | | | 0.41 | % | | | 0.44 | % | | | 0.42 | % |
| | | | | |
Ratio of total expenses to average net assets | | | 0.70 | % | | | 0.81 | % | | | 0.93 | % | | | 1.08 | % | | | 1.06 | % |
| | | | | |
Ratio of net investment income to average net assets | | | 2.07 | % | | | 1.09 | % | | | 1.61 | % | | | 2.41 | % | | | 2.88 | % |
| | | | | |
Portfolio turnover rate(c) | | | 693 | % | | | 513 | % | | | 501 | % | | | 556 | % | | | 406 | % |
| (a) | Calculated based on the average shares outstanding methodology. |
| (b) | Assumes investment at the NAV at the beginning of the year, reinvestment of all dividends and distributions, a complete redemption of the investment at the NAV at the end of the year and no sales or redemption charges (if any). Total returns would be reduced if a sales or redemption charge was taken into account. Returns do not reflect the impact of taxes to shareholders relating to Fund distributions or the redemption of Fund shares. |
| (c) | The Fund’s portfolio turnover rate is calculated in accordance with regulatory requirements, without regard to transactions involving short term investments and certain derivatives. If such transactions were included, the Fund’s portfolio turnover rate may be higher. |
| | |
| 26 | | The accompanying notes are an integral part of these financial statements. |
GOLDMAN SACHS VARIABLE INSURANCE TRUST CORE FIXED INCOME FUND
Financial Highlights (continued)
Selected Data for a Share Outstanding Throughout Each Year
| | | | | | | | | | | | | | | | | | | | |
| | | Goldman Sachs Core Fixed Income Fund | |
| | | Service Shares | |
| | | Year Ended December 31, | |
| | 2022 | | | 2021 | | | 2020 | | | 2019 | | | 2018 | |
| | | | | | | | | | | | | | | | | | | | |
| Per Share Data | | | | | | | | | | | | | | | |
| | | | | |
Net asset value, beginning of year | | $ | 11.13 | | | $ | 11.53 | | | $ | 10.85 | | | $ | 10.21 | | | $ | 10.65 | |
| | | | | |
Net investment income(a) | | | 0.18 | | | | 0.09 | | | | 0.16 | | | | 0.25 | | | | 0.25 | |
| | | | | |
Net realized and unrealized gain (loss) | | | (1.77 | ) | | | (0.34 | ) | | | 0.85 | | | | 0.66 | | | | (0.34 | ) |
| | | | | |
Total from investment operations | | | (1.59 | ) | | | (0.25 | ) | | | 1.01 | | | | 0.91 | | | | (0.09 | ) |
| | | | | |
Distributions to shareholders from net investment income | | | (0.14 | ) | | | (0.13 | ) | | | (0.23 | ) | | | (0.27 | ) | | | (0.35 | ) |
| | | | | |
Distributions to shareholders from net realized gains | | | — | | | | (0.02 | ) | | | (0.10 | ) | | | — | | | | — | |
| | | | | |
Total distributions | | | (0.14 | ) | | | (0.15 | ) | | | (0.33 | ) | | | (0.27 | ) | | | (0.35 | ) |
| | | | | |
Net asset value, end of year | | $ | 9.40 | | | $ | 11.13 | | | $ | 11.53 | | | $ | 10.85 | | | $ | 10.21 | |
| | | | | |
Total Return(b) | | | (14.28 | )% | | | (2.23 | )% | | | 9.37 | % | | | 9.00 | % | | | (0.83 | )% |
| | | | | |
Net assets, end of year (in 000’s) | | $ | 72,540 | | | $ | 71,867 | | | $ | 46,631 | | | $ | 37,524 | | | $ | 36,416 | |
| | | | | |
Ratio of net expenses to average net assets | | | 0.66 | % | | | 0.66 | % | | | 0.66 | % | | | 0.68 | % | | | 0.67 | % |
| | | | | |
Ratio of total expenses to average net assets | | | 0.95 | % | | | 1.06 | % | | | 1.18 | % | | | 1.35 | % | | | 1.18 | % |
| | | | | |
Ratio of net investment income to average net assets | | | 1.82 | % | | | 0.85 | % | | | 1.39 | % | | | 2.33 | % | | | 2.46 | % |
| | | | | |
Portfolio turnover rate(c) | | | 693 | % | | | 513 | % | | | 501 | % | | | 556 | % | | | 406 | % |
| (a) | Calculated based on the average shares outstanding methodology. |
| (b) | Assumes investment at the NAV at the beginning of the year, reinvestment of all dividends and distributions, a complete redemption of the investment at the NAV at the end of the year and no sales or redemption charges (if any). Total returns would be reduced if a sales or redemption charge was taken into account. Returns do not reflect the impact of taxes to shareholders relating to Fund distributions or the redemption of Fund shares. |
| (c) | The Fund’s portfolio turnover rate is calculated in accordance with regulatory requirements, without regard to transactions involving short term investments and certain derivatives. If such transactions were included, the Fund’s portfolio turnover rate may be higher. |
| | |
| The accompanying notes are an integral part of these financial statements. | | 27 |
GOLDMAN SACHS VARIABLE INSURANCE TRUST CORE FIXED INCOME FUND
Notes to Financial Statements
December 31, 2022
1. ORGANIZATION
Goldman Sachs Variable Insurance Trust (the “Trust” or “VIT”) is a Delaware statutory trust registered under the Investment Company Act of 1940, as amended (the “Act”), as an open-end management investment company. The following table lists the series of the Trust that is included in this report (the “Fund”), along with its corresponding share classes and respective diversification status under the Act:
| | | | |
| Fund | | Share Classes Offered | | Diversified/ Non-diversified |
Core Fixed Income | | Institutional and Service | | Diversified |
Shares of the Trust are offered to a separate account of participating life insurance companies for the purpose of funding variable annuity contracts and variable life insurance policies.
Goldman Sachs Asset Management, L.P. (“GSAM”), an affiliate of Goldman Sachs & Co. LLC (“Goldman Sachs”), serves as investment adviser to the Fund pursuant to a management agreement (the “Agreement”) with the Trust.
2. SIGNIFICANT ACCOUNTING POLICIES
The financial statements have been prepared in accordance with accounting principles generally accepted in the United States of America (“GAAP”) and require management to make estimates and assumptions that may affect the reported amounts and disclosures. Actual results may differ from those estimates and assumptions. The Fund is an investment company under GAAP and follows the accounting and reporting guidance applicable to investment companies.
A. Investment Valuation — The Fund’s valuation policy is to value investments at fair value.
B. Investment Income and Investments — Investment income includes interest income, dividend income, and securities lending income, if any. Interest income is accrued daily and adjusted for amortization of premiums and accretion of discounts. Dividend income is recognized on ex-dividend date or, for certain foreign securities, as soon as such information is obtained subsequent to the ex-dividend date. Non-cash dividends, if any, are recorded at the fair market value of the securities received. Investment transactions are reflected on trade date. Realized gains and losses are calculated using identified cost. Investment transactions are recorded on the following business day for daily net asset value (“NAV”) calculations.
For derivative contracts, unrealized gains and losses are recorded daily and become realized gains and losses upon disposition or termination of the contract. Upfront payments, if any, are made or received upon entering into a swap agreement and are reflected in the Statements of Assets and Liabilities. Upfront payments are recognized over the contract’s term/event as realized gains or losses, with the exception of forward starting swap contracts whose realized gains or losses are recognized from the effective start date. For securities with paydown provisions, principal payments received are treated as a proportionate reduction to the cost basis of the securities, and excess or shortfall amounts are recorded as income. For treasury inflation protected securities (“TIPS”), adjustments to principal due to inflation/ deflation are reflected as increases/decreases to interest income with a corresponding adjustment to cost.
C. Class Allocations and Expenses — Investment income, realized and unrealized gain (loss), if any, and non-class specific expenses of the Fund are allocated daily based upon the proportion of net assets of each class. Non-class specific expenses directly incurred by the Fund are charged to the Fund, while such expenses incurred by the Trust are allocated across the Fund on a straight-line and/or pro-rata basis depending upon the nature of the expenses. Class specific expenses, where applicable, are borne by the respective share classes and include Distribution and Service and Transfer Agency fees.
D. Federal Taxes and Distributions to Shareholders — It is the Fund’s policy to comply with the requirements of the Internal Revenue Code of 1986, as amended (the “Code”), applicable to regulated investment companies and to distribute each year substantially all of its investment company taxable income and capital gains to its shareholders. Accordingly, the Fund is not
GOLDMAN SACHS VARIABLE INSURANCE TRUST CORE FIXED INCOME FUND
2. SIGNIFICANT ACCOUNTING POLICIES (continued)
required to make any provisions for the payment of federal income tax. Distributions to shareholders are recorded on the ex-dividend date. Income and capital gains distributions, if any, are declared and paid according to the following schedule:
| | | | |
| Fund | | Income Distributions Declared/Paid | | Capital Gains Distributions Declared/Paid |
Core Fixed Income | | Quarterly | | Annually |
Net capital losses, if any, are carried forward to future fiscal years and may be used to the extent allowed by the Code to offset any future capital gains. Losses that are carried forward will retain their character as either short-term or long-term capital losses. Utilization of capital loss carryforwards will reduce the requirement of future capital gains distributions.
The characterization of distributions to shareholders for financial reporting purposes is determined in accordance with federal income tax rules, which may differ from GAAP. The source of the Fund’s distributions may be shown in the accompanying financial statements as either from distributable earnings or capital. Certain components of the Fund’s net assets on the Statement of Assets and Liabilities reflect permanent GAAP/tax differences based on the appropriate tax character.
E. Foreign Currency Translation — The accounting records and reporting currency of the Fund are maintained in U.S. dollars. Assets and liabilities denominated in foreign currencies are translated into U.S. dollars using the current exchange rates at the close of each business day. The effect of changes in foreign currency exchange rates on investments is included within net realized and unrealized gain (loss) on investments. Changes in the value of other assets and liabilities as a result of fluctuations in foreign exchange rates are included in the Statement of Operations within net change in unrealized gain (loss) on foreign currency translation. Transactions denominated in foreign currencies are translated into U.S. dollars on the date the transaction occurred, the effects of which are included within net realized gain (loss) on foreign currency transactions.
3. INVESTMENTS AND FAIR VALUE MEASUREMENTS
U.S. GAAP defines the fair value of a financial instrument as the amount that would be received to sell an asset or paid to transfer a liability in an orderly transaction between market participants at the measurement date (i.e., the exit price); the Fund’s policy is to use the market approach. GAAP establishes a fair value hierarchy that prioritizes the inputs to valuation techniques used to measure fair value. The hierarchy gives the highest priority to unadjusted quoted prices in active markets for identical assets or liabilities (Level 1 measurements) and the lowest priority to unobservable inputs (Level 3 measurements). The level in the fair value hierarchy within which the fair value measurement in its entirety falls shall be determined based on the lowest level input that is significant to the fair value measurement in its entirety. The levels used for classifying investments are not necessarily an indication of the risk associated with investing in these investments. The three levels of the fair value hierarchy are described below:
Level 1 — Unadjusted quoted prices in active markets that are accessible at the measurement date for identical, unrestricted assets or liabilities;
Level 2 — Quoted prices in markets that are not active or financial instruments for which significant inputs are observable
(including, but not limited to, quoted prices for similar investments, interest rates, foreign exchange rates, volatility and credit spreads), either directly or indirectly;
Level 3 — Prices or valuations that require significant unobservable inputs (including GSAM’s assumptions in determining fair value measurement).
The Board of Trustees (“Trustees”) has approved Valuation Procedures that govern the valuation of the portfolio investments held by the Fund, including investments for which market quotations are not readily available. With respect to the Fund’s investments that do not have readily available market quotations, the Trustees have designated the Adviser as the valuation designee to perform fair valuations pursuant to Rule 2a-5 under the Investment Company Act of 1940 (the “Valuation Designee”). GSAM has day-to-day responsibility for implementing and maintaining internal controls and procedures related to the valuation of the Fund’s investments. To assess the continuing appropriateness of pricing sources and methodologies, GSAM regularly performs price verification procedures and issues challenges as necessary to third party pricing vendors or brokers, and any differences are reviewed in accordance with the Valuation Procedures.
GOLDMAN SACHS VARIABLE INSURANCE TRUST CORE FIXED INCOME FUND
Notes to Financial Statements (continued)
December 31, 2022
3. INVESTMENTS AND FAIR VALUE MEASUREMENTS (continued)
A. Level 1 and Level 2 Fair Value Investments — The valuation techniques and significant inputs used in determining the fair values for investments classified as Level 1 and Level 2 are as follows:
Money Market Funds — Investments in the Goldman Sachs Financial Square Government Fund (“Underlying Money Market Fund”) are valued at the NAV per share of the Institutional Share class on the day of valuation. These investments are generally classified as Level 1 of the fair value hierarchy. For information regarding the Underlying Money Market Fund’s accounting policies and investment holdings, please see the Underlying Money Market Fund’s shareholder report.
Debt Securities — Debt securities for which market quotations are readily available are valued daily on the basis of quotations supplied by dealers or an independent pricing service. The pricing services may use valuation models or matrix pricing, which consider: (i) yield or price with respect to bonds that are considered comparable in characteristics such as rating, interest rate and maturity date or (ii) quotations from securities dealers to determine current value. With the exception of treasury securities of G7 countries, which are generally classified as Level 1, these investments are generally classified as Level 2 of the fair value hierarchy.
i. Mortgage-Backed and Asset-Backed Securities — Mortgage-backed securities represent direct or indirect participations in, or are collateralized by and payable from, mortgage loans secured by residential and/or commercial real estate property. Asset-backed securities include securities whose principal and interest payments are collateralized by pools of other assets or receivables. The value of certain mortgage-backed and asset-backed securities (including adjustable rate mortgage loans) may be particularly sensitive to changes in prevailing interest rates. The value of these securities may also fluctuate in response to the market’s perception of the creditworthiness of the issuers.
Asset-backed securities may present credit risks that are not presented by mortgage-backed securities because they generally do not have the benefit of a security interest in collateral that is comparable to mortgage assets. Some asset-backed securities may only have a subordinated claim on collateral.
Stripped mortgage-backed securities are usually structured with two different classes: one that receives substantially all interest payments (interest-only, or “IO” and/or high coupon rate with relatively low principal amount, or “IOette”), and the other that receives substantially all principal payments (principal-only, or “PO”) from a pool of mortgage loans. Little to no principal will be received at the maturity of an IO; as a result, periodic adjustments are recorded to reduce the cost of the security until maturity. These adjustments are included in interest income.
ii. Treasury Inflation Protected Securities — TIPS are treasury securities in which the principal amount is adjusted daily to keep pace with inflation, as measured by the U.S. Consumer Pricing Index for Urban Consumers. The repayment of the original bond principal upon maturity is guaranteed by the full faith and credit of the U.S. Government.
iii. When-Issued Securities and Forward Commitments — When-issued securities, including TBA (“To Be Announced”) securities, are securities that are authorized but not yet issued in the market and purchased in order to secure what is considered to be an advantageous price or yield to the Fund. A forward commitment involves entering into a contract to purchase or sell securities, typically on an extended settlement basis, for a fixed price at a future date. The purchase of securities on a when-issued or forward commitment basis involves a risk of loss if the value of the security to be purchased declines before the settlement date. Conversely, the sale of securities on a forward commitment basis involves the risk that the value of the securities sold may increase before the settlement date. Although the Fund will generally purchase securities on a when-issued or forward commitment basis with the intention of acquiring the securities for its portfolio, the Fund may dispose of when-issued securities or forward commitments prior to settlement, which may result in a realized gain or loss. For financial reporting purposes, cash collateral that has been pledged to cover obligations of the Fund and cash collateral received, if any, is reported separately on the Statement of Assets and Liabilities as receivables/payables for collateral on other investments. Non-cash collateral pledged by the Fund, if any, is noted in the Schedules of Investments.
Derivative Contracts — A derivative is an instrument whose value is derived from underlying assets, indices, reference rates or a combination of these factors. The Fund enters into derivative transactions to hedge against changes in interest rates, securities prices, and/or currency exchange rates, to increase total return, or to gain access to certain markets or attain exposure to other
GOLDMAN SACHS VARIABLE INSURANCE TRUST CORE FIXED INCOME FUND
3. INVESTMENTS AND FAIR VALUE MEASUREMENTS (continued)
underliers. For financial reporting purposes, cash collateral that has been pledged to cover obligations of the Fund and cash collateral received, if any, is reported separately on the Statement of Assets and Liabilities as either due to broker/receivable for collateral on certain derivatives contracts. Non-cash collateral pledged by the Fund, if any, is noted in the Schedules of Investments.
Exchange-traded derivatives, including futures and options contracts, are generally valued at the last sale or settlement price on the exchange where they are principally traded. Exchange-traded options without settlement prices are generally valued at the midpoint of the bid and ask prices on the exchange where they are principally traded (or, in the absence of two-way trading, at the last bid price for long positions and the last ask price for short positions). Exchange-traded derivatives typically fall within Level 1 of the fair value hierarchy. Over-the-counter (“OTC”) and centrally cleared derivatives are valued using market transactions and other market evidence, including market-based inputs to models, calibration to market-clearing transactions, broker or dealer quotations, or other alternative pricing sources. Where models are used, the selection of a particular model to value OTC and centrally cleared derivatives depends upon the contractual terms of, and specific risks inherent in, the instrument, as well as the availability of pricing information in the market. Valuation models require a variety of inputs, including contractual terms, market prices, yield curves, credit curves, measures of volatility, voluntary and involuntary prepayment rates, loss severity rates and correlations of such inputs. For OTC and centrally cleared derivatives that trade in liquid markets, model inputs can generally be verified and model selection does not involve significant management judgment. OTC and centrally cleared derivatives are classified within Level 2 of the fair value hierarchy when significant inputs are corroborated by market evidence.
i. Forward Contracts — A forward contract is a contract between two parties to buy or sell an asset at a specified price on a future date. A forward contract settlement can occur on a cash or delivery basis. Forward contracts are marked-to-market daily using independent vendor prices, and the change in value, if any, is recorded as an unrealized gain or loss. Cash and certain investments may be used to collateralize forward contracts.
A forward foreign currency exchange contract is a forward contract in which the Fund agrees to receive or deliver a fixed quantity of one currency for another, at a pre-determined price at a future date. All forward foreign currency exchange contracts are marked to market daily by using the outright forward rates or interpolating based upon maturity dates, where available. Non-deliverable forward foreign currency exchange contracts are settled with the counterparty in cash without the delivery of foreign currency.
ii. Futures Contracts — Futures contracts are contracts to buy or sell a standardized quantity of a specified commodity or security. Upon entering into a futures contract, the Fund deposits cash or securities in an account on behalf of the broker in an amount sufficient to meet the initial margin requirement. Subsequent payments are made or received by the Fund equal to the daily change in the contract value and are recorded as variation margin receivable or payable with a corresponding offset to unrealized gains or losses.
iii. Options — When the Fund writes call or put options, an amount equal to the premium received is recorded as a liability and is subsequently marked-to-market to reflect the current value of the option written. Swaptions are options on swap contracts.
Upon the purchase of a call option or a put option by the Fund, the premium paid is recorded as an investment and subsequently marked-to-market to reflect the current value of the option. Certain options may be purchased with premiums to be determined on a future date. The premiums for these options are based upon implied volatility parameters at specified terms.
iv. Swap Contracts — Bilateral swap contracts are agreements in which the Fund and a counterparty agree to exchange periodic payments on a specified notional amount or make a net payment upon termination. Bilateral swap transactions are privately negotiated in the OTC market and payments are settled through direct payments between the Fund and the counterparty. By contrast, certain swap transactions are subject to mandatory central clearing. These swaps are executed through a derivatives clearing member (“DCM”), acting in an agency capacity, and submitted to a central counterparty (“CCP”) (“centrally cleared swaps”), in which case all payments are settled with the CCP through the DCM. Swaps are marked-to-market daily using pricing vendor quotations, counterparty or clearinghouse prices or model prices, and the change
GOLDMAN SACHS VARIABLE INSURANCE TRUST CORE FIXED INCOME FUND
Notes to Financial Statements (continued)
December 31, 2022
3. INVESTMENTS AND FAIR VALUE MEASUREMENTS (continued)
in value, if any, is recorded as an unrealized gain or loss. Upon entering into a swap contract, the Fund is required to satisfy an initial margin requirement by delivering cash or securities to the counterparty (or in some cases, segregated in a triparty account on behalf of the counterparty), which can be adjusted by any mark-to-market gains or losses pursuant to bilateral or centrally cleared arrangements. For centrally cleared swaps the daily change in valuation, if any, is recorded as a receivable or payable for variation margin.
An interest rate swap is an agreement that obligates two parties to exchange a series of cash flows at specified intervals, based upon or calculated by reference to changes in interest rates on a specified notional principal amount. The payment flows are usually netted against each other, with the difference being paid by one party to the other.
A credit default swap is an agreement that involves one party (the buyer of protection) making a stream of payments to another party (the seller of protection) in exchange for the right to receive protection on a reference security or obligation, including a group of assets or exposure to the performance of an index. The Fund’s investment in credit default swaps may involve greater risks than if the Fund had invested in the referenced obligation directly. Credit events are contract specific but may include bankruptcy, failure to pay, restructuring and obligation acceleration. If the Fund buys protection through a credit default swap and no credit event occurs, its payments are limited to the periodic payments previously made to the counterparty. Upon the occurrence of a specified credit event, the Fund, as a buyer of credit protection, is entitled to receive an amount equal to the notional amount of the swap and deliver to the seller the defaulted reference obligation in a physically settled trade. The Fund may also receive a net settlement amount in the form of cash or securities equal to the notional amount of the swap reduced by the recovery value of the reference obligation in a cash settled trade.
As a seller of protection, the Fund generally receives a payment stream throughout the term of the swap, provided that there is no credit event. In addition, if the Fund sells protection through a credit default swap, the Fund could suffer a loss because the value of the referenced obligation and the premium payments received may be less than the notional amount of the swap paid to the buyer of protection. Upon the occurrence of a specified credit event, the Fund, as a seller of credit protection, may be required to take possession of the defaulted reference obligation and pay the buyer an amount equal to the notional amount of the swap in a physically settled trade. The Fund may also pay a net settlement amount in the form of cash or securities equal to the notional amount of the swap reduced by the recovery value of the reference obligation in a cash settled trade. Recovery values are at times established through the credit event auction process in which market participants are ensured that a transparent price has been set for the defaulted security or obligation. In addition, the Fund is entitled to a return of any assets, which have been pledged as collateral to the counterparty upon settlement.
The maximum potential amount of future payments (undiscounted) that the Fund as seller of protection could be required to make under a credit default swap would be an amount equal to the notional amount of the agreement. These potential amounts would be partially offset by any recovery values of the respective referenced obligations or net amounts received from a settlement of a credit default swap for the same reference security or obligation where the Fund bought credit protection.
B. Level 3 Fair Value Investments — To the extent that significant inputs to valuation models and other alternative pricing sources are unobservable, or if quotations are not readily available, or if GSAM believes that such quotations do not accurately reflect fair value, the fair value of the Fund’s investments may be determined under the Valuation Procedures. GSAM, consistent with its procedures and applicable regulatory guidance, may make an adjustment to the most recent valuation prices of either domestic or foreign securities in light of significant events to reflect what it believes to be the fair value of the securities at the time of determining the Fund’s NAV. To the extent investments are valued using single source broker quotations obtained directly from the broker or passed through from third party pricing vendors, such investments are classified as Level 3 investments.
GOLDMAN SACHS VARIABLE INSURANCE TRUST CORE FIXED INCOME FUND
3. INVESTMENTS AND FAIR VALUE MEASUREMENTS (continued)
C. Fair Value Hierarchy — The following is a summary of the Fund’s investments and derivatives classified in the fair value hierarchy as of December 31, 2022:
| | | | | | | | | | | | |
| | | |
| CORE FIXED INCOME FUND | | | | | | | | | |
| Investment Type | | Level 1 | | | Level 2 | | | Level 3 | |
| | | |
| Assets | | | | | | | | | | | | |
| Fixed Income | | | | | | | | | | | | |
Mortgage-Backed Securities | | $ | — | | | $ | 63,550,018 | | | $ | — | |
Corporate Bonds | | | — | | | | 27,795,464 | | | | — | |
U.S. Treasury Obligations | | | 23,192,498 | | | | — | | | | — | |
Foreign Bonds | | | — | | | | 6,007,998 | | | | — | |
Asset- Backed Securities | | | — | | | | 4,085,784 | | | | — | |
U.S. Government Agency Securities | | | — | | | | 3,389,128 | | | | — | |
Commercial Mortgage-Backed Securities | | | — | | | | 1,886,520 | | | | — | |
Municipal Bonds | | | — | | | | 1,274,662 | | | | — | |
Foreign Government Securities | | | — | | | | 921,466 | | | | — | |
Collateralized Mortgage Obligations | | | — | | | | 436,848 | | | | — | |
| Investment Company | | | 5,716,986 | | | | — | | | | — | |
| Short-Term Investments | | | — | | | | 1,328,568 | | | | — | |
| | | |
| Total | | $ | 28,909,484 | | | $ | 110,676,456 | | | $ | — | |
| | | |
| Liabilities | | | | | | | | | | | | |
| Forward Sales Contracts | | $ | — | | | $ | (24,463,922 | ) | | $ | — | |
| | | |
| Derivative Type | | | | | | | | | |
| | | |
| Assets | | | | | | | | | | | | |
| Credit Default Swap Contracts(a) | | $ | — | | | $ | 68,322 | | | $ | — | |
| Forward Foreign Currency Contracts(a) | | | — | | | | 62,363 | | | | — | |
| Futures Contracts(a) | | | 6,666 | | | | — | | | | — | |
| Interest Rate Swap Contracts(a) | | | — | | | | 217,222 | | | | — | |
| Purchased Option Contracts | | | — | | | | 5,099 | | | | — | |
| | | |
| Total | | $ | 6,666 | | | $ | 353,006 | | | $ | — | |
| | | |
| Derivative Type | | | | | | | | | |
| | | |
| Liabilities | | | | | | | | | | | | |
| Credit Default Swap Contracts(a) | | $ | — | | | $ | (77,938 | ) | | $ | — | |
| Forward Foreign Currency Contracts(a) | | | — | | | | (86,492 | ) | | | — | |
| Futures Contracts(a) | | | (73,893 | ) | | | — | | | | — | |
| Interest Rate Swap Contracts(a) | | | — | | | | (64,458 | ) | | | — | |
| Written Option Contracts | | | — | | | | (5,864 | ) | | | — | |
| | | |
| Total | | $ | (73,893 | ) | | $ | (234,752 | ) | | $ | — | |
| (a) | Amount shown represents unrealized gain (loss) at fiscal year end. |
For further information regarding security characteristics, see the Schedules of Investments.
GOLDMAN SACHS VARIABLE INSURANCE TRUST CORE FIXED INCOME FUND
Notes to Financial Statements (continued)
December 31, 2022
4. INVESTMENTS IN DERIVATIVES
The following tables set forth, by certain risk types, the gross value of derivative contracts (not considered to be hedging instruments for accounting disclosure purposes) as of December 31, 2022. These instruments were used as part of the Fund’s investment strategies and to obtain and/or manage exposure related to the risks below. The values in the tables below exclude the effects of cash collateral received or posted pursuant to these derivative contracts, and therefore are not representative of the Fund’s net exposure.
Core Fixed Income Fund
| | | | | | | | | | | | | | |
| Risk | | | |
Statements of Assets and Liabilities | | Assets | | | Statements of Assets and Liabilities | | Liabilities | |
| Interest Rate | | | | Variation margin on futures and swaps contracts | | $ | 223,888 | (a) | | Variation margin on futures and swaps contracts | | $ | (138,351 | )(a) |
| Credit | | | | Unrealized gain on swap contracts | | | 68,322 | (a) | | Unrealized loss on swap contracts | | | (77,938 | )(a) |
| Currency | | | | Receivables for unrealized gain on forward foreign currency exchange contracts and purchased options at value | | | 67,462 | | | Payable for unrealized loss on forward foreign currency exchange contracts and written options at value | | | (92,356 | ) |
| | | | | |
| Total | | | | | | $ | 359,672 | | | | | $ | (308,645 | ) |
| (a) | Includes unrealized gain (loss) on futures contracts and centrally cleared swap contracts described in the Additional Investment Information sections of the Consolidated Schedule of Investments. Only the variation margin as of December 31, 2022, is reported within the Consolidated Statement of Assets and Liabilities. |
The following tables set forth, by certain risk types, the Fund’s gains (losses) related to these derivatives and their indicative volumes for the fiscal year ended December 31, 2022. These gains (losses) should be considered in the context that these derivative contracts may have been executed to create investment opportunities and/or economically hedge certain investments, and accordingly, certain gains (losses) on such derivative contracts may offset certain (losses) gains attributable to investments. These gains (losses) are included in “Net realized gain (loss)” or “Net change in unrealized gain (loss)” on the Statement of Operations:
Core Fixed Income Fund
| | | | | | | | | | |
| Risk | | Statement of Operations | | Net Realized
Gain (Loss) | | | Net Change in
Unrealized
Gain (Loss) | |
| Credit | | Net realized gain (loss) from swap contracts/Net change in unrealized gain (loss) on swap contracts | | $ | (5,074 | ) | | $ | (240,795 | ) |
| Currency | | Net realized gain (loss) from forward foreign currency exchange contracts/Net change in unrealized gain (loss) on forward foreign currency exchange contracts, written option contracts and purchased options contracts | | | 58,844 | | | | (27,906 | ) |
| Interest Rate | | Net realized gain (loss) from futures contracts, written option, and purchased options/Net change in unrealized gain (loss) on futures contracts and swap contracts | | | (1,707,180 | ) | | | 21,940 | |
| | | |
| Total | | | | $ | (1,653,410 | ) | | $ | (246,761 | ) |
| | | | | | | | | | | | | | | | | | | | | | |
| | | | | Average number of Contracts or Notional Amounts(1) | |
| Risk | | | | Futures Contracts | | | Forward Contracts | | | Swap Agreements | | | Purchased Options | | | Written Options | |
| Core Fixed Income Fund | | | | | 86 | | | $ | 30,327,180 | | | $ | 629,058,750 | | | $ | 3,895,833 | | | $ | 436,670 | |
| (1) | Amounts disclosed represent average number of contracts for futures contracts, purchased options and written options, notional amounts for forward contracts and swap contracts, based on absolute values, which is indicative of volume of this derivative type, for the months that each Fund held such derivatives during the fiscal year ended December 31, 2022. |
GOLDMAN SACHS VARIABLE INSURANCE TRUST CORE FIXED INCOME FUND
5. AGREEMENTS AND AFFILIATED TRANSACTIONS
A. Management Agreement — Under the Agreement, GSAM manages the Fund, subject to the general supervision of the Trustees.
As compensation for the services rendered pursuant to the Agreement, the assumption of the expenses related thereto and administration of the Fund’s business affairs, including providing facilities, GSAM is entitled to a management fee, accrued daily and paid monthly, equal to an annual percentage rate of the Fund’s average daily net assets.
For the fiscal year ended December 31, 2022, contractual and effective net management fees with GSAM were at the following rates:
| | | | | | | | | | | | | | | | | | | | | | | | | | | | |
| | | Contractual Management Rate | | | | | | Effective Net
Management
Rate^ | |
| Fund | | First
$1 billion | | | Next
$1 billion | | | Next
$3 billion | | | Next
$3 billion | | | Over
$8 billion | | | Effective
Rate | |
| Core Fixed Income Fund | | | 0.40 | % | | | 0.36 | % | | | 0.34 | % | | | 0.33 | % | | | 0.32 | % | | | 0.40 | % | | | 0.39 | % |
| ^ | Effective Net Management Rate includes the impact of management fee waivers of affiliated underlying funds, if any. The Effective Net Management Rate may not correlate to the Contractual Management Rate as a result of management fee waivers that may be in effect from time to time. |
The Fund invests in Institutional Shares of the Goldman Sachs Financial Square Government Fund, which is an affiliated Underlying Fund. GSAM has agreed to waive a portion of its management fee payable by the Fund in an amount equal to the management fee it earns as an investment adviser to the affiliated Underlying Fund in which the Fund invest. For the fiscal year ended December 31, 2022, GSAM waived $10,277 of the Fund’s management fee.
B. Distribution and/or Service (12b-1) Plans — The Trust, on behalf of Service Shares of the Fund, has adopted a Distribution and Service Plan subject to Rule 12b-1 under the Act. Under the Distribution and Service Plan, Goldman Sachs, which serves as distributor (the “Distributor”), is entitled to a fee accrued daily and paid monthly for distribution services and personal and account maintenance services, which may then be paid by Goldman Sachs to authorized dealers, equal to, on an annual basis, 0.25% of the Fund’s average daily net assets attributable to Service Shares.
C. Transfer Agency Agreement — Goldman Sachs also serves as the transfer agent of the Fund for a fee pursuant to the Transfer Agency Agreement. The fees charged for such transfer agency services are accrued daily and paid monthly at an annual rate of 0.02% of the average daily net assets of Institutional and Service Shares.
D. Other Expense Agreements and Affiliated Transactions — GSAM has agreed to reduce or limit certain “Other Expenses” of the Fund (excluding acquired fund fees and expenses, transfer agency fees and expenses, service fees and shareholder administration fees (as applicable), taxes, interest, brokerage fees, expenses of shareholder meetings, litigation and indemnification, and extraordinary expenses) to the extent such expenses exceed, on an annual basis, a percentage rate of the average daily net assets of the Fund. Such Other Expense reimbursements, if any, are accrued daily and paid monthly. In addition, the Fund is not obligated to reimburse GSAM for prior fiscal year expense reimbursements, if any. The Other Expense limitations as an annual percentage rate of average daily net assets for the Fund is 0.004%. These Other Expense limitations will remain in place through at least April 29, 2023, and prior to such date GSAM may not terminate the arrangements without the approval of the Trustees. In addition, the Fund has entered into certain offset arrangements with the custodian and the transfer agent, which may result in a reduction of the Fund’s expenses and are received irrespective of the application of the “Other Expense” limitations described above.
For the fiscal year ended December 31, 2022, these expense reductions, including any fee waivers and Other Expense reimbursements, were as follows:
| | | | | | | | | | | | |
| Fund | | Management
Fee Waiver | | | Other Expense
Reimbursement | | | Total Expense
Reductions | |
| Core Fixed Income Fund | | $ | 10,277 | | | $ | 284,119 | | | $ | 294,396 | |
GOLDMAN SACHS VARIABLE INSURANCE TRUST CORE FIXED INCOME FUND
Notes to Financial Statements (continued)
December 31, 2022
5. AGREEMENTS AND AFFILIATED TRANSACTIONS (continued)
E. Line of Credit Facility — As of December 31, 2022, the Fund participated in a $1,250,000,000 committed, unsecured revolving line of credit facility (the “facility”) together with other funds of the Trust and certain registered investment companies having management agreements with GSAM or its affiliates. This facility is to be used for temporary emergency purposes, or to allow for an orderly liquidation of securities to meet redemption requests. The interest rate on borrowings is based on the federal funds rate. The facility also requires a fee to be paid by the Fund based on the amount of the commitment that has not been utilized. For the six months ended December 31, 2022, the Fund did not have any borrowings under the facility. Prior to April 22, 2022, the facility was $1,000,000,000.
F. Other Transactions with Affiliates — The following table provides information about the Fund’s investment in the Goldman Sachs Financial Square Government Fund as of and for the fiscal year ended December 31, 2022:
| | | | | | | | | | | | | | | | | | | | | | | | |
| Fund | | Beginning
Value as of
December 31,
2021 | | | Purchases
at Cost | | | Proceeds
from Sales | | | Ending
Value as of
December 31,
2022 | | | Shares as of
December 31,
2022 | | | Dividend
Income | |
| Core Fixed Income Fund | | $ | 7,004,192 | | | $ | 82,419,936 | | | $ | (83,707,142 | ) | | $ | 5,716,986 | | | | 5,716,986 | | | $ | 100,263 | |
6. PORTFOLIO SECURITIES TRANSACTIONS
The cost of purchases and proceeds from sales and maturities of long-term securities for the fiscal year ended December 31, 2022, were as follows:
| | | | | | | | | | | | | | | | | | | | |
| Fund | | | | | Purchases of U.S.
Government and
Agency Obligations | | | Purchases
(Excluding U.S.
Government and
Agency Obligations) | | | Sales and
Maturities of U.S.
Government and
Agency Obligations | | | Sales and
Maturities
(Excluding U.S.
Government and
Agency Obligations) | |
| Core Fixed Income Fund | | | | | | $ | 678,257,455 | | | $ | 144,514,973 | | | $ | 662,006,877 | | | $ | 114,482,609 | |
7. TAX INFORMATION
The tax character of distributions paid during the fiscal year ended December 31, 2022 was as follows:
| | | | |
| | | Core Fixed
Income Fund | |
| Distributions paid from: | | | | |
Ordinary income | | $ | 1,537,635 | |
| Total taxable distributions | | $ | 1,537,635 | |
The tax character of distributions paid during the fiscal year ended December 31, 2021 was as follows:
| | | | |
| | | Core Fixed
Income Fund | |
| Distributions paid from: | | | | |
Ordinary income | | $ | 1,127,464 | |
| Total taxable distributions | | $ | 1,127,464 | |
GOLDMAN SACHS VARIABLE INSURANCE TRUST CORE FIXED INCOME FUND
7. TAX INFORMATION (continued)
As of the Fund’s most recent fiscal year end, December 31, 2022, the Fund’s capital loss carryforwards and certain timing differences, on a tax-basis were as follows:
| | | | |
| | | Core Fixed
Income Fund | |
| Undistributed ordinary income — net | | $ | 116,753 | |
| Total undistributed earnings | | $ | 116,753 | |
| Capital loss carryforwards: | | | | |
Perpetual Short-term | | $ | (3,676,602 | ) |
Perpetual Long-term | | | (2,032,083 | ) |
| Total Capital loss carryforwards | | $ | (5,708,685 | ) |
| Timing differences (Post October loss deferral, and straddle loss deferrals) | | $ | (92,755 | ) |
| Unrealized gains — net | | | (10,503,346 | ) |
| Total accumulated earnings (losses) net | | $ | (16,188,033 | ) |
As of December 31, 2022, the Fund’s aggregate security unrealized gains and losses based on cost for U.S. federal income tax purposes were as follows:
| | | | |
| | | Core Fixed
Income Fund | |
| Tax cost | | $ | 150,459,746 | |
| Gross unrealized gain | | | 739,823 | |
| Gross unrealized loss | | | (11,243,169 | ) |
| Net unrealized gain (loss) | | $ | (10,503,346 | ) |
The difference between GAAP-basis and tax-basis unrealized gains (losses) is attributable primarily to wash sales, net mark to market gains (losses) on regulated futures and foreign currency contracts, and differences in the tax treatment of market discount accretion and premium amortization and swap transactions.
GSAM has reviewed the Fund’s tax positions for all open tax years (the current and prior three years, as applicable) and has concluded that no provision for income tax is required in the Fund’s financial statements. Such open tax years remain subject to examination and adjustment by tax authorities.
8. OTHER RISKS
The Fund’s risks include, but are not limited to, the following:
Derivatives Risk — The Fund’s use of derivatives and other similar instruments (collectively referred to in this paragraph as “derivatives”) may result in loss, including due to adverse market movements. Derivatives, which may pose risks in addition to and greater than those associated with investing directly in securities, currencies or other assets and instruments, may increase market exposure and be illiquid or less liquid, volatile, difficult to price and leveraged so that small changes in the value of the underlying assets or instruments may produce disproportionate losses to the Fund. Certain derivatives are also subject to counterparty risk, which is the risk that the other party in the transaction will not, or lacks the capacity or authority to, fulfill its contractual obligations, liquidity risk, which includes the risk that the Fund will not be able to exit the derivative when it is advantageous to do
GOLDMAN SACHS VARIABLE INSURANCE TRUST CORE FIXED INCOME FUND
Notes to Financial Statements (continued)
December 31, 2022
8. OTHER RISKS (continued)
so, and risks arising from margin requirements, which include the risk that the Fund will be required to pay additional margin or set aside additional collateral to maintain open derivative positions. The use of derivatives is a highly specialized activity that involves investment techniques and risks different from those associated with investments in more traditional securities and instruments. Losses from derivatives can also result from a lack of correlation between changes in the value of derivative instruments and the portfolio assets (if any) being hedged.
Floating and Variable Rate Obligations Risk — Floating rate and variable rate obligations are debt instruments issued by companies or other entities with interest rates that reset periodically (typically, daily, monthly, quarterly, or semiannually) in response to changes in the market rate of interest on which the interest rate is based. Such market rates are generally the Secured Overnight Financing Rate, London Interbank Offered Rate (“LIBOR”), the Prime Rate of a designated U.S. bank, the Federal Funds Rate, or another base lending rate used by commercial lenders. For floating and variable rate obligations, there may be a lag between an actual change in the underlying interest rate benchmark and the reset time for an interest payment of such an obligation, which could harm or benefit the Fund, depending on the interest rate environment or other circumstances. In a rising interest rate environment, for example, a floating or variable rate obligation that does not reset immediately would prevent the Fund from taking full advantage of rising interest rates in a timely manner. However, in a declining interest rate environment, the Fund may benefit from a lag due to an obligation’s interest rate payment not being immediately impacted by a decline in interest rates.
At the end of 2021, certain LIBORs were discontinued, but the most widely used LIBORs may continue to be provided on a representative basis until June, 2023. The unavailability or replacement of LIBOR may affect the value, liquidity or return on certain Fund investments and may result in costs incurred in connection with closing out positions and entering into new trades. Any pricing adjustments to the Fund’s investments resulting from a substitute reference rate may also adversely affect the Fund’s performance and/or NAV.
Interest Rate Risk — When interest rates increase, fixed income securities or instruments held by the Fund will generally decline in value. The Fund may face a heightened level of interest rate risk in connection with the type and extent of certain monetary policy changes made by the Federal Reserve, such as target interest rate changes. Long-term fixed income securities or instruments will normally have more price volatility because of this risk than short-term fixed income securities or instruments. A wide variety of market factors can cause interest rates to rise, including central bank monetary policy, rising inflation and changes in general economic conditions. The risks associated with changing interest rates may have unpredictable effects on the markets and the Fund’s investments. Fluctuations in interest rates may also affect the liquidity of fixed income securities and instruments held by the Fund. A sudden or unpredictable increase in interest rates may cause volatility in the market and may decrease the liquidity of the Fund’s investments, which would make it harder for the Fund to sell its investments at an advantageous time.
Investments in Other Investment Companies Risk — As a shareholder of another investment company, the Fund will indirectly bear its proportionate share of any net management fees and other expenses paid by such other investment companies, in addition to the fees and expenses regularly borne by the Fund.
Large Shareholder Transactions Risk — The Fund may experience adverse effects when certain large shareholders, such as other funds, institutional investors (including those trading by use of non-discretionary mathematical formulas), financial intermediaries (who may make investment decisions on behalf of underlying clients and/or include the Fund in their investment model), individuals, accounts and Goldman Sachs affiliates, purchase or redeem large amounts of shares of the Fund. Such large shareholder redemptions, which may occur rapidly or unexpectedly, may cause the Fund to sell portfolio securities at times when it would not otherwise do so, which may negatively impact the Fund’s NAV and liquidity. These transactions may also accelerate the realization of taxable income to shareholders if such sales of investments resulted in gains, and may also increase transaction costs. In addition, a large redemption could result in the Fund’s current expenses being allocated over a smaller asset base, leading to an increase in the Fund’s expense ratio. Similarly, large Fund share purchases may adversely affect the Fund’s performance to the extent that the Fund is delayed in investing new cash or otherwise maintains a larger cash position than it ordinarily would.
GOLDMAN SACHS VARIABLE INSURANCE TRUST CORE FIXED INCOME FUND
8. OTHER RISKS (continued)
Liquidity Risk — The Fund may make investments that are illiquid or that may become less liquid in response to market developments or adverse investor perceptions. Illiquid investments may be more difficult to value. Liquidity risk may also refer to the risk that the Fund will not be able to pay redemption proceeds within the allowable time period or without significant dilution to remaining investors’ interests because of unusual market conditions, an unusually high volume of redemption requests, or other reasons. To meet redemption requests, the Fund may be forced to sell investments at an unfavorable time and/or under unfavorable conditions. If the Fund is forced to sell securities at an unfavorable time and/or under unfavorable conditions, such sales may adversely affect the Fund’s NAV and dilute remaining investors’ interests. Liquidity risk may be the result of, among other things, the reduced number and capacity of traditional market participants to make a market in fixed income securities or the lack of an active market. The potential for liquidity risk may be magnified by a rising interest rate environment or other circumstances where investor redemptions from fixed income funds may be higher than normal, potentially causing increased supply in the market due to selling activity. Redemptions by large shareholders may have a negative impact on the Fund’s liquidity.
Market and Credit Risks — In the normal course of business, the Fund trades financial instruments and enters into financial transactions where risk of potential loss exists due to changes in the market (market risk). The value of the securities in which the Fund invests may go up or down in response to the prospects of individual companies, particular sectors or governments and/or general economic conditions throughout the world due to increasingly interconnected global economies and financial markets. Events such as war, acts of terrorism, social unrest, natural disasters, the spread of infectious illness or other public health threats could also significantly impact the Fund and its investments. Additionally, the Fund may also be exposed to credit risk in the event that an issuer or guarantor fails to perform or that an institution or entity with which the Fund has unsettled or open transactions defaults.
11. SUBSEQUENT EVENTS
Subsequent events after the Statement of Assets and Liabilities date have been evaluated, and GSAM has concluded that there is no impact requiring adjustment or disclosure in the financial statements.
12. SUMMARY OF SHARE TRANSACTIONS
Share activity is as follows:
| | | | | | | | | | | | | | | | |
| | | Core Fixed Income Fund | |
| | | For the Fiscal Year Ended
December 31, 2022 | | | For the Fiscal Year Ended
December 31, 2021 | |
| | | Shares | | | Dollars | | | Shares | | | Dollars | |
| Institutional Shares | | | | | | | | | | | | | | | | |
| Shares sold | | | 1,549,382 | | | $ | 15,081,809 | | | | 1,500,925 | | | $ | 16,820,030 | |
| Reinvestment of distributions | | | 51,565 | | | | 498,802 | | | | 33,172 | | | | 368,886 | |
| Shares redeemed | | | (346,895 | ) | | | (3,639,227 | ) | | | (919,193 | ) | | | (10,321,960 | ) |
| | | | 1,254,052 | | | | 11,941,384 | | | | 614,904 | | | | 6,866,956 | |
| Service Shares | | | | | | | | | | | | | | | | |
| Shares sold | | | 1,821,761 | | | | 18,196,134 | | | | 2,646,702 | | | | 29,693,268 | |
| Reinvestment of distributions | | | 107,310 | | | | 1,038,833 | | | | 68,220 | | | | 758,578 | |
| Shares redeemed | | | (669,929 | ) | | | (6,616,109 | ) | | | (300,466 | ) | | | (3,366,145 | ) |
| | | | 1,259,142 | | | | 12,618,858 | | | | 2,414,456 | | | | 27,085,701 | |
| | | | |
| NET INCREASE | | | 2,513,194 | | | $ | 24,560,242 | | | | 3,029,360 | | | $ | 33,952,657 | |
Report of Independent Registered Public
Accounting Firm
To the Board of Trustees of Goldman Sachs Variable Insurance Trust and Shareholders of Goldman Sachs Core Fixed Income Fund
Opinion on the Financial Statements
We have audited the accompanying statement of assets and liabilities, including the schedule of investments, of Goldman Sachs Core Fixed Income Fund (one of the funds constituting Goldman Sachs Variable Insurance Trust, referred to hereafter as the “Fund”) as of December 31, 2022, the related statement of operations for the year ended December 31, 2022, the statements of changes in net assets for each of the two years in the period ended December 31, 2022, including the related notes, and the financial highlights for each of the five years in the period ended December 31, 2022 (collectively referred to as the “financial statements”). In our opinion, the financial statements present fairly, in all material respects, the financial position of the Fund as of December 31, 2022, the results of its operations for the year then ended, the changes in its net assets for each of the two years in the period ended December 31, 2022 and the financial highlights for each of the five years in the period ended December 31, 2022 in conformity with accounting principles generally accepted in the United States of America.
Basis for Opinion
These financial statements are the responsibility of the Fund’s management. Our responsibility is to express an opinion on the Fund’s financial statements based on our audits. We are a public accounting firm registered with the Public Company Accounting Oversight Board (United States) (PCAOB) and are required to be independent with respect to the Fund in accordance with the U.S. federal securities laws and the applicable rules and regulations of the Securities and Exchange Commission and the PCAOB.
We conducted our audits of these financial statements in accordance with the standards of the PCAOB. Those standards require that we plan and perform the audit to obtain reasonable assurance about whether the financial statements are free of material misstatement, whether due to error or fraud.
Our audits included performing procedures to assess the risks of material misstatement of the financial statements, whether due to error or fraud, and performing procedures that respond to those risks. Such procedures included examining, on a test basis, evidence regarding the amounts and disclosures in the financial statements. Our audits also included evaluating the accounting principles used and significant estimates made by management, as well as evaluating the overall presentation of the financial statements. Our procedures included confirmation of securities owned as of December 31, 2022 by correspondence with the custodian, transfer agent and brokers; when replies were not received from brokers, we performed other auditing procedures. We believe that our audits provide a reasonable basis for our opinion.
/s/ PricewaterhouseCoopers LLP
Boston, Massachusetts
February 14, 2023
We have served as the auditor of one or more investment companies in the Goldman Sachs fund complex since 2000.
GOLDMAN SACHS VARIABLE INSURANCE TRUST CORE FIXED INCOME FUND
| | |
| Fund Expenses — Six Month Period Ended December 31, 2022 (Unaudited) | | |
As a shareholder of Institutional Shares and Service Shares of the Fund, you incur ongoing costs, including management fees; distribution and service (12b-1) fees (with respect to Service Shares); and other Fund expenses. This example is intended to help you understand your ongoing costs (in dollars) of investing in the Fund and to compare these costs with the ongoing costs of investing in other mutual funds.
The example is based on an investment of $1,000 invested at the beginning of the period and held for the entire period from July 1, 2022 through December 31, 2022, which represents a period of 184 days of a 365 day year
Actual Expenses — The first line in the table below provides information about actual account values and actual expenses. You may use the information in this line, together with the amount you invested, to estimate the expenses that you paid over the period. Simply divide your account value by $1,000 (for example, an $8,600 account value divided by $1,000=8.6), then multiply the result by the number in the first line under the heading entitled “Expenses Paid” to estimate the expenses you paid on your account during this period.
Hypothetical Example for Comparison Purposes — The second line in the table below provides information about hypothetical account values and hypothetical expenses based on the Fund’s actual net expense ratio and an assumed rate of return of 5% per year before expenses, which is not the Fund’s actual return. The hypothetical account values and expenses may not be used to estimate the actual ending account balance or expenses you paid for the period. You may use this information to compare the ongoing costs of investing in the Fund and other funds. To do so, compare this 5% hypothetical example with the 5% hypothetical examples that appear in the shareholder reports of the other funds.
Please note that the expenses shown in the table are meant to highlight your ongoing costs only and do not reflect any transactional costs, such as sales charges, redemption fees, or exchange fees. Therefore, the second line of the table is useful in comparing ongoing costs only and will not help you determine the relative total costs of owning different funds. In addition, if these transactional costs were included, your costs would have been higher.
| | | | | | | | | | | | |
| Share Class | | Beginning
Account Value
7/1/22 | | | Ending
Account Value
12/31/22 | | | Expenses Paid
for the
6 Months
Ended
12/31/22* | |
| Institutional Shares | | | | | | | | | | | | |
| | | | |
| Actual | | $ | 1,000.00 | | | $ | 968.69 | | | $ | 2.03 | |
| Hypothetical 5% return | | | 1,000.00 | | | | 1,023.14 | + | | | 2.09 | |
| Service Shares | | | | | | | | | | | | |
| | | | |
| Actual | | | 1,000.00 | | | | 968.03 | | | | 3.27 | |
| Hypothetical 5% return | | | 1,000.00 | | | | 1,021.88 | + | | | 3.36 | |
| | * | Expenses are calculated using the Fund’s annualized net expense ratio for each class, which represents the ongoing expenses as a percentage of net assets for the six months ended December 31, 2022. Expenses are calculated by multiplying the annualized net expense ratio by the average account value for the period; then multiplying the result by the number of days in the most recent fiscal half year (or, since inception, if shorter); and then dividing that result by the number of days in the period. The annualized net expense ratios for the period were 0.41% and 0.66% for Institutional Shares and Service Shares, respectively. | |
| | + | Hypothetical expenses are based on the Fund’s actual annualized net expense ratio and an assumed rate of return of 5% per year before expenses. | |
GOLDMAN SACHS VARIABLE INSURANCE TRUST CORE FIXED INCOME FUND
Trustees and Officers (Unaudited)
Independent Trustees
| | | | | | | | | | | | |
| | | | | |
Name, Address and Age1 | | Position(s) Held
with the Trust | | Term of
Office and
Length of
Time Served2 | | Principal Occupation(s)
During Past 5 Years | | Number of
Portfolios in
Fund Complex
Overseen by
Trustee3 | | | Other
Directorships
Held by Trustee4 |
Jessica Palmer5 Age: 73 | | Chair of the Board of Trustees | | Since 2018 (Trustee since 2007) | | Ms. Palmer is retired. She was formerly Consultant, Citigroup Human Resources Department (2007-2008); Managing Director, Citigroup Corporate and Investment Banking (previously, Salomon Smith Barney/Salomon Brothers) (1984-2006). Ms. Palmer was a Member of the Board of Trustees of Indian Mountain School (private elementary and secondary school) (2004-2009). Chair of the Board of Trustees — Goldman Sachs Variable Insurance Trust and Goldman Sachs Trust. | | | 103 | | | None |
Dwight L. Bush Age: 65 | | Trustee | | Since 2020 | | Ambassador Bush is President and CEO of D.L. Bush & Associates (a financial advisory and private investment firm) (2002-2014 and 2017-Present); Director of MoneyLion, Inc. (an operator of a data-driven, digital financial platform) (2021-Present); and was formerly U.S. Ambassador to the Kingdom of Morocco (2014-2017) and a Member of the Board of Directors of Santander Bank, N.A. (2018-2019). Previously, Ambassador Bush served as an Advisory Board Member of Goldman Sachs Trust and Goldman Sachs Variable Insurance Trust (October 2019-January 2020). Trustee — Goldman Sachs Variable Insurance Trust and Goldman Sachs Trust. | | | 103 | | | MoneyLion, Inc. (an operator of a data-driven, digital financial platform) |
Kathryn A. Cassidy Age: 68 | | Trustee | | Since 2015 | | Ms. Cassidy is retired. She is Director, Vertical Aerospace Ltd. (an aerospace and technology company) (2021-Present). Formerly, Ms. Cassidy was Advisor to the Chairman (May 2014-December 2014); and Senior Vice President and Treasurer (2008-2014), General Electric Company & General Electric Capital Corporation (technology and financial services companies). Trustee — Goldman Sachs Variable Insurance Trust and Goldman Sachs Trust. | | | 103 | | | Vertical Aerospace Ltd. (an aerospace and technology company) |
John G. Chou Age: 66 | | Trustee | | Since 2022 | | Mr. Chou is Executive Vice President and Special Advisor to the Chairman and CEO of AmerisourceBergen Corporation (a pharmaceutical and healthcare company) (2021-Present); and formerly held various executive management positions with AmerisourceBergen Corporation, including Executive Vice President and Chief Legal Officer (2019-2021); Executive Vice President and Chief Legal & Business Officer (2017-2019); and Executive Vice President and General Counsel (2011-2017). Trustee — Goldman Sachs Variable Insurance Trust and Goldman Sachs Trust. | | | 103 | | | None |
Diana M. Daniels5 Age: 73 | | Trustee | | Since 2007 | | Ms. Daniels is retired. Formerly, she was Vice President, General Counsel and Secretary, The Washington Post Company (1991-2006). Ms. Daniels is a Trustee Emeritus and serves as a Presidential Councillor of Cornell University (2013-Present); Director of 1735 NY Investments, LLC (oversees an investment fund that supports the mission of the American Institute of Architects) (2022-Present); former Member of the Legal Advisory Board, New York Stock Exchange (2003-2006) and of the Corporate Advisory Board, Standish Mellon Management Advisors (2006-2007). Trustee — Goldman Sachs Variable Insurance Trust and Goldman Sachs Trust. | | | 103 | | | None |
GOLDMAN SACHS VARIABLE INSURANCE TRUST CORE FIXED INCOME FUND
Trustees and Officers (Unaudited) (continued)
Independent Trustees
| | | | | | | | | | | | |
| | | | | |
Name, Address and Age1 | | Position(s) Held
with the Trust | | Term of
Office and
Length of
Time Served2 | | Principal Occupation(s)
During Past 5 Years | | Number of
Portfolios in
Fund Complex
Overseen by
Trustee3 | | | Other
Directorships
Held by Trustee4 |
Joaquin Delgado Age: 62 | | Trustee | | Since 2020 | | Dr. Delgado is retired. He is Director, Stepan Company (a specialty chemical manufacturer) (2011-Present); and was formerly Director, Hexion Inc. (a specialty chemical manufacturer) (2019-2022); Executive Vice President, Consumer Business Group of 3M Company (July 2016-July 2019); and Executive Vice President, Health Care Business Group of 3M Company (October 2012-July 2016). Previously, Dr. Delgado served as an Advisory Board Member of Goldman Sachs Trust and Goldman Sachs Variable Insurance Trust (October 2019-January 2020). Trustee — Goldman Sachs Variable Insurance Trust and Goldman Sachs Trust. | | | 103 | | | Stepan Company (a specialty chemical manufacturer) |
Eileen H. Dowling Age: 60 | | Trustee | | Since 2021 | | Ms. Dowling is retired. Formerly, she was Senior Advisor (April 2021-September 2021); and Managing Director (2013-2021), BlackRock, Inc. (a financial services firm). Trustee — Goldman Sachs Variable Insurance Trust and Goldman Sachs Trust. | | | 103 | | | None |
Gregory G. Weaver Age: 71 | | Trustee | | Since 2015 | | Mr. Weaver is retired. He is Director, Verizon Communications Inc. (2015-Present); and was formerly Chairman and Chief Executive Officer, Deloitte & Touche LLP (a professional services firm) (2001-2005 and 2012-2014); and Member of the Board of Directors, Deloitte & Touche LLP (2006-2012). Trustee — Goldman Sachs Variable Insurance Trust and Goldman Sachs Trust. | | | 103 | | | Verizon Communications Inc. |
Paul C. Wirth Age: 65 | | Trustee | | Since 2022 | | Mr. Wirth is retired. Formerly, he was Deputy Chief Financial Officer and Principal Accounting Officer (2011-2020); Finance Director and Principal Accounting Officer (2010-2011); and Managing Director, Global Controller, and Chief Accounting Officer (2005-2010) of Morgan Stanley. Trustee — Goldman Sachs Variable Insurance Trust and Goldman Sachs Trust. | | | 103 | | | None |
| | | | | | | | | | | | |
GOLDMAN SACHS VARIABLE INSURANCE TRUST CORE FIXED INCOME FUND
Trustees and Officers (Unaudited) (continued)
Interested Trustee*
| | | | | | | | | | | | |
| | | | | |
Name, Address and Age1 | | Position(s) Held
with the Trust | | Term of Office
and Length of
Time Served2 | | Principal Occupation(s) During Past 5 Years | | Number of
Portfolios in
Fund Complex
Overseen by
Trustee3 | | | Other
Directorships
Held by Trustee4 |
James A. McNamara Age: 60 | | President and Trustee | | Since 2007 | | Advisory Director, Goldman Sachs (January 2018-Present); Managing Director, Goldman Sachs (January 2000-December 2017); Director of Institutional Fund Sales, GSAM (April 1998-December 2000); and Senior Vice President and Manager, Dreyfus Institutional Service Corporation (January 1993-April 1998). President and Trustee — Goldman Sachs Variable Insurance Trust; Goldman Sachs Trust; Goldman Sachs Trust II; Goldman Sachs MLP and Energy Renaissance Fund; Goldman Sachs ETF Trust; Goldman Sachs ETF Trust II; Goldman Sachs Credit Income Fund; and Goldman Sachs Real Estate Diversified Income Fund. | | | 172 | | | None |
| | | | | | | | | | | | |
| * | Mr. McNamara is considered to be an “Interested Trustee” because he holds positions with Goldman Sachs and owns securities issued by The Goldman Sachs Group, Inc. Mr. McNamara holds comparable positions with certain other companies of which Goldman Sachs, GSAM or an affiliate thereof is the investment adviser, administrator and/or distributor. |
| 1 | Each Trustee may be contacted by writing to the Trustee, c/o Goldman Sachs, 200 West Street, New York, New York, 10282, Attn: Caroline Kraus. Information is provided as of December 31, 2022. |
| 2 | Subject to such policies as may be adopted by the Board from time-to-time, each Trustee holds office for an indefinite term, until the earliest of: (a) the election of his or her successor; (b) the date the Trustee resigns or is removed by the Board or shareholders, in accordance with the Trust’s Declaration of Trust; or (c) the termination of the Trust. The Board has adopted policies which provide that each Independent Trustee shall retire as of December 31st of the calendar year in which he or she reaches (a) his or her 75th birthday or (b) the 15th anniversary of the date he or she became a Trustee, whichever is earlier, unless a waiver of such requirements shall have been adopted by a majority of the other Trustees. These policies may be changed by the Trustees without shareholder vote. |
| 3 | The Goldman Sachs Fund Complex includes certain other companies listed above for each respective Trustee. As of December 31, 2022, Goldman Sachs Variable Insurance Trust consisted of 15 portfolios (12 of which offered shares to the public); Goldman Sachs Trust consisted of 88 portfolios; Goldman Sachs Trust II consisted of 18 portfolios (7 of which offered shares to the public); Goldman Sachs ETF Trust consisted of 45 portfolios (29 of which offered shares to the public); Goldman Sachs ETF Trust II consisted of 2 portfolios (1 of which offered shares to the public); and Goldman Sachs MLP and Energy Renaissance Fund, Goldman Sachs Credit Income Fund and Goldman Sachs Real Estate Diversified Income Fund each consisted of one portfolio. Goldman Sachs Credit Income Fund did not offer shares to the public. |
| 4 | This column includes only directorships of companies required to report to the Securities and Exchange Commission under the Securities Exchange Act of 1934 (i.e., “public companies”) or other investment companies registered under the Act. |
| 5 | Ms. Daniels and Ms. Palmer retired as Independent Trustees effective January 1, 2023. |
Additional information about the Trustees is available in the Fund’s Statement of Additional Information, which can be obtained from Goldman Sachs free of charge by calling this toll-free number (in the United States of America): 1-800-526-7384.
GOLDMAN SACHS VARIABLE INSURANCE TRUST CORE FIXED INCOME FUND
Trustees and Officers (Unaudited) (continued)
Officers of the Trust*
| | | | | | |
| | | |
| Name, Address and Age1 | | Positions Held
with the Trust | | Term of
Office and
Length of
Time Served2 | | Principal Occupation(s) During Past 5 Years |
James A. McNamara
200 West Street New
York, NY 10282 Age: 60 | | Trustee and
President | | Since 2007 | | Advisory Director, Goldman Sachs (January 2018-Present); Managing Director, Goldman Sachs (January 2000-December 2017); Director of Institutional Fund Sales, GSAM (April 1998-December 2000); and Senior Vice President and Manager, Dreyfus Institutional Service Corporation (January 1993-April 1998). President and Trustee — Goldman Sachs Variable Insurance Trust; Goldman Sachs Trust; Goldman Sachs Trust II; Goldman Sachs MLP and Energy Renaissance Fund; Goldman Sachs ETF Trust; Goldman Sachs ETF Trust II; Goldman Sachs Credit Income Fund; and Goldman Sachs Real Estate Diversified Income Fund. |
Joseph F. DiMaria
30 Hudson Street Jersey
City, NJ 07302 Age: 54 | | Treasurer,
Principal
Financial
Officer and
Principal
Accounting
Officer | | Since 2017
(Treasurer
and
Principal
Financial
Officer
since 2019) | | Managing Director, Goldman Sachs (November 2015-Present) and Vice President-Mutual Fund Administration, Columbia Management Investment Advisers, LLC (May 2010 - October 2015). Treasurer, Principal Financial Officer and Principal Accounting Officer — Goldman Sachs Variable Insurance Trust (previously Assistant Treasurer (2016)); Goldman Sachs Trust (previously Assistant Treasurer (2016)); Goldman Sachs Trust II (previously Assistant Treasurer (2017)); Goldman Sachs MLP and Energy Renaissance Fund (previously Assistant Treasurer (2017)); Goldman Sachs ETF Trust (previously Assistant Treasurer (2017)); Goldman Sachs ETF Trust II; Goldman Sachs Credit Income Fund; and Goldman Sachs Real Estate Diversified Income Fund. |
Caroline L. Kraus
200 West Street New
York, NY 10282 Age: 45 | | Secretary | | Since 2012 | | Managing Director, Goldman Sachs (January 2016 - Present); Vice President, Goldman Sachs (August 2006-December 2015); Senior Counsel, Goldman Sachs (January 2020-Present); Associate General Counsel, Goldman Sachs (2012-December 2019); Assistant General Counsel, Goldman Sachs (August 2006-December 2011); and Associate, Weil, Gotshal & Manges, LLP (2002-2006). Secretary — Goldman Sachs Variable Insurance Trust (previously Assistant Secretary (2012)); Goldman Sachs Trust (previously Assistant Secretary (2012)); Goldman Sachs Trust II; Goldman Sachs BDC, Inc.; Goldman Sachs Private Middle Market Credit LLC; Goldman Sachs Private Middle Market Credit II LLC; Goldman Sachs Middle Market Lending Corp.; Goldman Sachs MLP and Energy Renaissance Fund; Goldman Sachs ETF Trust; Goldman Sachs ETF Trust II; Goldman Sachs Credit Income Fund; and Goldman Sachs Real Estate Diversified Income Fund. |
| | | | | | |
| * | Represents a partial list of officers of the Trust. Additional information about all the officers is available in the Fund’s Statement of Additional Information, which can be obtained from Goldman Sachs free of charge by calling this toll-free number (in the United States): 1-800-526-7384. |
| 1 | Information is provided as of December 31, 2022. |
| 2 | Officers hold office at the pleasure of the Board of Trustees or until their successors are duly elected and qualified. Each officer holds comparable positions with certain other companies of which Goldman Sachs, GSAM or an affiliate thereof is the investment adviser, administrator and/or distributor. |
Goldman Sachs Variable Insurance Trust — Tax Information (Unaudited)
For the year ended December 31, 2022, the Core Fixed Income Fund designated 100% of the dividends paid from net investment company taxable income as section 163(j) Interest Dividends.
| | |
| TRUSTEES | | OFFICERS |
| Gregory G. Weaver, Chair | | James A. McNamara, President |
| Dwight L. Bush | | Joseph F. DiMaria, Principal Financial Officer, |
| Kathryn A. Cassidy | | Principal Accounting Officer and Treasurer |
| John G. Chou | | Caroline L. Kraus, Secretary |
Joaquin Delgado | | |
| Eileen H. Dowling | | |
| James A. McNamara | | |
| Paul C. Wirth | | |
GOLDMAN SACHS & CO. LLC
Distributor and Transfer Agent
GOLDMAN SACHS ASSET MANAGEMENT, L.P.
Investment Adviser
200 West Street, New York,
New York 10282
Visit our web site at www.GSAMFUNDS.com to obtain the most recent month-end returns.
The reports concerning the Funds included in this shareholder report may contain certain forward-looking statements about the factors that may affect the performance of the Funds in the future. These statements are based on Fund management’s predictions and expectations concerning certain future events and their expected impact on the Funds, such as performance of the economy as a whole and of specific industry sectors, changes in the levels of interest rates, the impact of developing world events, and other factors that may influence the future performance of the Funds. Management believes these forward-looking statements to be reasonable, although they are inherently uncertain and difficult to predict. Actual events may cause adjustments in portfolio management strategies from those currently expected to be employed.
A description of the policies and procedures that the Funds use to determine how to vote proxies relating to portfolio securities and information regarding how the Funds voted proxies relating to portfolio securities for the 12-month period ended June 30 is available (i) without charge, upon request by calling 1-800-621-2550; and (ii) on the Securities and Exchange Commission (“SEC”) web site at http://www.sec.gov.
The Funds will file portfolio holdings information for each month in a fiscal quarter within 60 days after the end of the relevant fiscal quarter on Form N-PORT. Portfolio holdings information for the third month of each fiscal quarter will be made available on the SEC’s web site at http://www.sec.gov. Portfolio holdings information may be obtained upon request and without charge by calling 1-800-526-7384 (for Retail Shareholders) or 1-800-621-2550 (for Institutional Shareholders).
Views and opinions expressed are for informational purposes only and do not constitute a recommendation by GSAM to buy, sell, or hold any security. Views and opinions are current as of the date of this presentation and may be subject to change, they should not be construed as investment advice.
Goldman Sachs & Co. LLC (“Goldman Sachs”) does not provide legal, tax or accounting advice. Any statement contained in this communication (including any attachments) concerning U.S. tax matters was not intended or written to be used, and cannot be used, for the purpose of avoiding penalties under the Internal Revenue Code, and was written to support the promotion or marketing of transactions or matters addressed. Clients of Goldman Sachs should obtain their own independent tax advice based on their particular circumstances.
The website links provided are for your convenience only and are not an endorsement or recommendation by GSAM of any of these websites or the products or services offered. GSAM is not responsible for the accuracy and validity of the content of these websites.
Fund holdings and allocations shown are as of December 31, 2022 and may not be representative of future investments. Fund holdings should not be relied on in making investment decisions and should not be construed as research or investment advice regarding particular securities. Current and future holdings are subject to risk.
References to indices, benchmarks or other measures of relative market performance over a specified period of time are provided for your information only and do not imply that the portfolio will achieve similar results. The index composition may not reflect the manner in which a portfolio is constructed. While an adviser seeks to design a portfolio which reflects appropriate risk and return features, portfolio characteristics may deviate from those of the benchmark.
The Global Industry Classification Standard (“GICS”) was developed by and is the exclusive property and a service mark of Morgan Stanley Capital International Inc. (“MSCI”) and Standard & Poor’s, a division of The McGraw-Hill Companies, Inc. (“S&P”) and is licensed for use by Goldman Sachs. Neither MSCI, S&P nor any other party involved in making or compiling the GICS or any GICS classifications makes any express or implied warranties or representations with respect to such standard or classification (or the results to be obtained by the use thereof), and all such parties hereby expressly disclaim all warranties of originality, accuracy, completeness, merchantability or fitness for a particular purpose with respect to any of such standard or classification. Without limiting any of the foregoing, in no event shall MSCI, S&P, any of their affiliates or any third party involved in making or compiling the GICS or any GICS classifications have any liability for any direct, indirect, special, punitive, consequential or any other damages (including lost profits) even if notified of the possibility of such damages.
The portfolio risk management process includes an effort to monitor and manage risk, but does not imply low risk.
Shares of the Goldman Sachs VIT Funds are offered to separate accounts of participating life insurance companies for the purpose of funding variable annuity contracts and variable life insurance policies. Shares of the Funds are not offered directly to the general public. The variable annuity contracts and variable life insurance policies are described in the separate prospectuses issued by participating insurance companies. You should refer to those prospectuses for information about surrender charges, mortality and expense risk fees and other charges that may be assessed by participating insurance companies under the variable annuity contracts or variable life insurance policies. Such fees or charges, if any, may affect the return you may realize with respect to your investments. Ask your representative for more complete information. Please consider a fund’s objectives, risks and charges and expenses, and read the prospectus carefully before investing. The prospectus contains this and other information about the Funds.
This material is not authorized for distribution to prospective investors unless preceded or accompanied by a current prospectus or summary prospectus, if applicable. Investors should consider the Funds’ objective, risks, and charges and expenses, and read the summary prospectus, if available, and/or the prospectus carefully before investing or sending money. The summary prospectus, if available, and the prospectus contain this and other information about the Funds and may be obtained from your authorized dealer or from Goldman Sachs & Co. LLC by calling 1-800-621-2550.
This report is prepared for the general information of contract owners and is not an offer of shares of the Goldman Sachs Variable Insurance Trust Funds.
© 2023 Goldman Sachs. All rights reserved.
VITFIAR-23/268097-OTU-1554763
Goldman
Sachs Variable Insurance Trust
Goldman Sachs Equity Index Fund
Goldman Sachs International Equity Insights Fund
Goldman Sachs Large Cap Value Fund
Goldman Sachs Mid Cap Growth Fund*
Goldman Sachs Mid Cap Value Fund
Goldman Sachs Small Cap Equity Insights Fund
Goldman Sachs Strategic Growth Fund
Goldman Sachs U.S. Equity Insights Fund
* Effective after the close of business on April 29, 2022, the Goldman Sachs Growth Opportunities Fund was renamed the Goldman Sachs Mid Cap Growth Fund.
Annual Report
December 31, 2022

Goldman Sachs Variable Insurance Trust
| ∎ | | GOLDMAN SACHS EQUITY INDEX FUND |
| ∎ | | GOLDMAN SACHS INTERNATIONAL EQUITY INSIGHTS FUND |
| ∎ | | GOLDMAN SACHS LARGE CAP VALUE FUND |
| ∎ | | GOLDMAN SACHS MID CAP GROWTH FUND |
| ∎ | | GOLDMAN SACHS MID CAP VALUE FUND |
| ∎ | | GOLDMAN SACHS SMALL CAP EQUITY INSIGHTS FUND |
| ∎ | | GOLDMAN SACHS STRATEGIC GROWTH FUND |
| ∎ | | GOLDMAN SACHS U.S. EQUITY INSIGHTS FUND |
| | | | |
| | | |
| NOT FDIC-INSURED | | May Lose Value | | No Bank Guarantee |
MARKET REVIEW
Goldman Sachs Variable Insurance Trust Funds
Market Review
U.S. Equities
Representing the U.S. equity market, the S&P 500® Index (“S&P 500 Index”) returned –18.11% during the 12 months ended December 31, 2022 (the “Reporting Period”). The U.S. equity market fell in each of the first three quarters of 2022 before breaking the streak of losses with a gain in the fourth quarter. Still, it was the worst calendar year for the S&P 500 Index since 2008, when it returned –37.00%, and it was the seventh-worst performance for an annual period since the S&P 500 Index’s inception. The market decline was driven by aggressive Federal Reserve (“Fed”) interest rate hikes to combat inflation, persistent recession worries, supply-chain disruptions, geopolitical tensions and elevated concerns around China’s zero-COVID policy.
In the first quarter of 2022, the S&P 500 Index declined, marking its first quarterly decline since the first quarter of 2020. Among the major economic and geopolitical developments were the dramatic repricing of the Fed’s interest rate hike path and accelerated expectations for a more aggressive balance sheet runoff phase due to concerns about elevated and persistent inflation pressures. The hawkish Fed policy shift drove a large increase in bond yields, and U.S. Treasuries suffered one of their worst quarters on record. (Hawkish suggests higher interest rates; opposite of dovish.) COVID-19, and more specifically, the Omicron variant, was still an overhang, with resurgent cases bringing back supply-chain issues and worker shortages. Tensions arising from geopolitical conflict, most dominantly Russia’s late-February invasion of Ukraine, also brought about concern, as commodity prices became volatile and the global supply chain came into question. Amid this backdrop, dampened corporate earnings momentum played into the bearish narrative for the U.S. equities markets. (Bearish refers to an expected downward movement in the prices of securities.) Growth equities meaningfully lagged value equities as a potential by-product of anticipated higher interest rates in the near term.
The S&P 500 Index fell more dramatically in the second quarter of 2022, as inflation, the Fed’s policy response and recession worries were at the core of investors’ narratives, resulting in a broad risk-off, or heightened risk aversion, atmosphere. Geopolitical overhang also remained a concern, as it affected energy prices, leading to low consumer sentiment and potentially changing consumer spending trends. On the other hand, equity inflows, buyback strength, insider buying, resilient consumer spending and some hints of cooling in the labor market were seen by the consensus as tailwinds. In late May/early June 2022, it remained unclear whether a rebound seen in the U.S. equity markets from the May 20, 2022 year-to-date low represented the start of a recovery or a bear market rally. This question was quickly answered later in the month after the release of a higher than consensus expected May Consumer Price Index report, which sent the S&P 500 Index to a new year-to-date low. Moreover, following a 25 basis point hike in March 2022 and a 50 basis point increase in May 2022, the Fed agreed to a 75 basis point interest rate hike during its June 2022 meeting, wherein Fed Chair Powell asserted the Fed’s unconditional commitment to price stability with a policy response evolving based on incoming data. (A basis point is 1/100th of a percentage point.) At the end of the quarter, investors were looking ahead to the second quarter corporate earnings reporting season with some caution, as input price pressures and consumption trends factored into analyst arguments for downward revisions to earnings estimates.
The S&P 500 Index declined again in the third quarter of 2022, marking its longest losing streak since 2008. Through the third calendar quarter, the S&P 500 Index had its third-worst performance since the 1950s. The noticeable tightening of financial conditions, guided by expectations for a more aggressive global interest rate hike cycle, was the major story for the quarter. The Fed increased its “raise and hold” messaging, and its hawkish policy received support on the back of higher than consensus expected August core inflation data and a still-tight labor market that showed only moderate proof of cooling. Geopolitical tensions remained heightened due to the possible weaponization of energy flows, which, in turn, caused energy prices to stay relatively high. From an equities perspective, there appeared to be a great deal of concern that corporate earnings could be next in line to suffer given the combination of profit margin pressures, demand destruction, higher labor costs, slower economic activity and a stronger U.S. dollar eroding overseas sales.
In the fourth quarter of 2022, the S&P 500 Index solidly increased, attributable primarily to gains in October and November. Investors continued to witness a variety of contradictory macroeconomic developments, highlighted by a noticeably hawkish Fed, consumer resilience, and economic data supporting the themes of slowing economic growth. There was a dovish tilt surrounding consensus expectations for a reduction in the pace of monetary policy tightening, which was realized when the Fed announced a 50 basis point interest rate hike in December, following four successive 75 basis point increases. Positive inflation developments
MARKET REVIEW
further supported aspirations for a peak in the Fed tightening cycle, with October and November inflation data coming in lower than anticipated by most. Despite the smaller interest rate hike, the Fed maintained its hawkish tone with its relentless higher-for-longer messaging that continued to be a headwind for the U.S. equities market. Although the third quarter 2022 corporate earnings season provided disappointing results, companies emphasized a strong demand environment even against a backdrop of heightened macroeconomic uncertainty. Companies also focused on cost-cutting measures, as headlines of layoffs remained in the spotlight, especially within the technology sector. On the geopolitical front, the most constructive takeaways came from China’s zero-COVID pivot and pro-growth focus as well as Europe’s warmer than anticipated weather that helped settle concerns about an energy crisis there.
For the Reporting Period overall, only two of the 11 sectors in the S&P 500 Index posted positive absolute returns. Energy was by far the best performing sector in the S&P 500 Index, as measured by total return, followed at some distance by utilities. The weakest performing sectors in the S&P 500 Index during the Reporting Period were information technology, consumer discretionary and communication services.
Within the U.S. equity market, all capitalization segments posted double-digit negative returns, with small-cap stocks, as measured by the Russell 2000® Index, the weakest, followed by large-cap stocks, as measured by the Russell 1000® Index, and then mid-cap stocks, as measured by the Russell Midcap® Index. From a style perspective, value-oriented stocks materially outperformed growth-oriented stocks across the capitalization spectrum. (All as measured by the FTSE Russell indices.)
International Equities
International equities struggled but outperformed the U.S. equity market, during the Reporting Period. The MSCI Europe, Australasia, Far East (EAFE) Index (Net, USD, Unhedged) (the “MSCI EAFE Index”) posted a return of –14.45%.*
During the first quarter of 2022, international equities fell, facing pressures from global concerns around rising inflation, planned interest rate hikes by the U.S. Federal Reserve (the “Fed”), rising bond yields, valuation concerns, and Russia’s invasion of Ukraine. Major countries around the world took a public stance condemning Russia’s action and imposed various economic sanctions, including removal of Russian financial institutions from bank connectivity network SWIFT, banning transactions with the Russian central bank and halting trading of Russian securities. Such sanctions boosted the price of crude oil in the global markets. Driven by increased market volatility, the U.S. Fed signaled a slower than anticipated pace of monetary policy tightening while retaining a cautionary focus on rising inflation. Hopes around the success of diplomatic talks and peaceful negotiations between Russia and Ukraine led to some market recovery toward the end of the quarter. Still, beyond the broader concerns around the geopolitical crisis, the impact on commodity prices reinforced concerns around supply-side inflation and led markets to worry about a potential stagflation scenario — particularly in Europe. (Stagflation is characterized by slow economic growth and high inflation.) However, the corporate earnings season retained its overall strength. Other macroeconomic uncertainties included those around regulation in China, the status of Chinese shares listed in the U.S., and slowing economic growth in China, all exacerbated by the imposition of lockdowns and manufacturing halts due to a rise in COVID-19 cases, leading, in turn, to further supply-chain issues. European equities declined in line with other global market equities due to the ongoing geopolitical crisis and the region’s dependence on Russian oil and gas. Japanese equities similarly fell on concerns around rising interest rates and the spread of Omicron but outperformed other developed markets due to limited economic exposure to Russia and Ukraine.
International equities declined more significantly in the second quarter of 2022, with all major regions — Europe, Japan and Asia Pacific ex-Japan — performing roughly in line with each other. Inflationary pressures and concerns persisted throughout the quarter, and odds of a U.S. recession continued to grow. Supply-chain issues worsened as China initially instituted lockdowns following a surge in COVID-19 cases. However, as the quarter progressed, China began easing its restrictions, therefore mitigating the disruption. In Europe, the geopolitical crisis persisted with the ongoing war in Ukraine and potential gas shortages due to reduced supply from Russia. This was particularly concerning for countries with a high energy dependence, such as Italy, France, Spain and Germany. Japanese equities fell as the yen significantly weakened against the U.S. dollar.
During the third quarter of 2022, international equities continued to decline. As in the prior quarter, all major regions performed similarly, as markets continued to be volatile and under pressure from macroeconomic headwinds, including inflationary pressures
| * | All index returns are expressed in U.S. dollar terms. |
MARKET REVIEW
and interest rate hikes as the chances of a recession grew. European economies remained depressed by accelerating inflation, rising interest rates and strained supply chains. Europe also continued to battle with the energy crisis and subsequent mobile network blackouts during the quarter. The European Central Bank (“ECB”) raised interest rates in July and September, heightening concerns around slowing economic growth and leading to the depreciation of the euro against the U.S. dollar. The Bank of Japan revised its economic growth projections lower due to weakened global economies but left its monetary policy unchanged. The sharply widening differential between Japanese and U.S. interest rates during the quarter was a significant factor in the consistent weakening of the yen. Beyond the broader concerns of inflation, China’s zero-COVID policy continued to slow its economy and strain global supply chains.
International equities then rallied across the major regions in the fourth quarter of 2022 overall. Markets remained volatile and under pressure from macroeconomic headwinds, including inflationary pressures and interest rate hikes. However, investors began to focus on improving inflationary indicators across the globe, and increased confidence the Fed could pull off a soft economic landing allowed both U.S. and international equities to rally. (A soft landing, in economics, is a cyclical downturn that avoids recession. It typically describes attempts by central banks to raise interest rates just enough to stop an economy from overheating and experiencing high inflation, without causing a significant increase in unemployment, or a hard landing.) In Europe, equities also benefited from resilient third quarter 2022 corporate earnings reports as well as from optimism that the pace of interest rate increases could soon slow. In Japan, the yen continued to weaken against the U.S. dollar, especially in the first half of October, and Bank of Japan Governor Kuroda remained downbeat on the sustainability of inflation numbers into 2023, citing the negative output gap in particular, and kept its interest rates low. Asia ex-Japan equities were flat in October, pressured by sharp sell-offs in China and Hong Kong following confirmation that Chinese Premier Xi Jinping would remain as leader for a historic third five-year term. But increasing indications that China was prepared to stray from some of its more restrictive COVID-19 procedures resulted in stronger Asia ex-Japan equities in November, even as fears of an economic slowdown within China persisted. In December, inflationary indicators continued to show signs of improvement but remained well above central bank targets, causing the U.S. Fed and the ECB to maintain their hawkish strategy. In Europe, economic activity showed signs of a rebound following the inflation peak in October. Thus, although Europe remained in a recession, optimism that the recession would not be as deep as initially feared grew during the last weeks of the calendar year. Also in December, China began to relax its zero-COVID policies in an ongoing effort to boost its economy through increased domestic spending and international travel. Investors responded positively to this news despite the near-term surge in COVID-19 cases in China caused by the re-opening.
For the Reporting Period overall, only one of the 11 sectors of the MSCI EAFE Index gained, namely energy. Financials, materials and health care posted negative absolute returns but also outperformed the MSCI EAFE Index during the Reporting Period. Information technology was the weakest performer on the basis of total return during the Reporting Period, followed by consumer discretionary, real estate and industrials.
From a country perspective, Portugal was the only individual country constituent of the MSCI EAFE Index to post a positive, albeit modest, return during the Reporting Period. Hong Kong, Denmark, the U.K. and Australia posted negative absolute returns but also significantly outperformed the MSCI EAFE Index during the Reporting Period. Sweden, the Netherlands, Israel, Austria and Ireland most significantly lagged the MSCI EAFE Index on a relative basis during the Reporting Period.
GOLDMAN SACHS VARIABLE INSURANCE TRUST EQUITY INDEX FUND
INVESTMENT OBJECTIVE
The Fund seeks to achieve investment results that correspond to the aggregate price and yield performance of a benchmark index that measures the investment returns of large capitalization stocks.
Portfolio Management Discussion and Analysis
Below, SSgA Funds Management, Inc. (“SSgA”), the Fund’s Subadvisor, discusses the Goldman Sachs Variable Insurance Trust — Goldman Sachs Equity Index Fund’s (the “Fund”) performance and positioning for the 12-month period ended December 31, 2022 (the “Reporting Period”).
How did the Fund perform during the Reporting Period?
During the Reporting Period, the Fund’s Service Shares generated an average annual total return of -18.55%. This compares to the -18.11% average annual total return of the Fund’s benchmark, the Standard & Poor’s 500® Index (with dividends reinvested) (the “S&P 500® Index”), during the same time period.
During the Reporting Period, which sectors and industries in the S&P 500® Index were the weakest contributors to the Fund’s performance?
Nine of the 11 sectors in the S&P 500® Index produced negative absolute returns during the Reporting Period. In terms of total return, the weakest performing sectors in the S&P 500® Index and in the Fund were communication services, consumer discretionary and information technology. The largest sector by weighting in the S&P 500® Index at the end of the Reporting Period was information technology at a weighting of 25.74%. The industries with the weakest performance in terms of total return were interactive media and services; automobiles; Internet and direct market retail; entertainment; and leisure products.
On the basis of impact (which takes both total returns and weightings into account), the sectors that made the weakest contributions to the S&P 500® Index and to the Fund during the Reporting Period were information technology, consumer discretionary and communication services. The industries with the weakest performance on the basis of impact were interactive media and services; software; semiconductors and semiconductor equipment; technology hardware storage and peripherals; and automobiles.
Which sectors and which industries in the S&P 500® Index were the strongest contributors to the Fund’s performance?
In terms of total return, the sectors that made the strongest positive contributions to the S&P 500® Index and to the Fund were energy and, to a lesser extent, utilities. The industries with the strongest performance in terms of total return were oil, gas and consumable fuels; energy equipment and services; construction and engineering; independent power and renewable electricity producers; and wireless telecommunication services.
On the basis of impact, the strongest performing sectors were energy and, to a lesser extent, health care. The strongest performing industries on the basis of impact were oil, gas and consumable fuels; pharmaceuticals; biotechnology; health care providers and services; and aerospace and defense.
Which individual stocks were the top detractors, and which were the greatest positive contributors?
On the basis of impact, the stocks that made the weakest contributions to the Fund were Apple, Amazon.com, Tesla, Microsoft and Meta Platforms. The strongest positive contributors during the Reporting Period were ExxonMobil, Chevron, Merck, Eli Lilly & Co. and AbbVie.
How did the Fund use derivatives and similar instruments during the Reporting Period?
During the Reporting Period, the Fund did not use derivatives as part of an active management strategy to add value to the Fund’s results. However, equity index futures were used to equitize the Fund’s cash holdings. In other words, we put the Fund’s cash holdings to work by using them as collateral for the purchase of equity index futures. We also used these equity index futures to provide liquidity for daily cash flow requirements. Equity index futures had a neutral impact on the Fund’s performance during the Reporting Period.
Were there any changes to the Fund’s portfolio management team during the Reporting Period?
Effective June 16, 2022, Melissa Kapitulik no longer served as a portfolio manager for the Fund. As of that same date, John Law became a portfolio manager for the Fund, joining Michael Feehily and Michael Finocchi. By design, all investment decisions for the Fund are performed within a co-lead or team structure.
GOLDMAN SACHS VARIABLE INSURANCE TRUST EQUITY INDEX FUND
What changes were made to the makeup of the S&P 500® Index during the Reporting Period?
Twenty-two stocks were removed from the S&P 500® Index during the Reporting Period. Among them were Abiomed, Citrix Systems, Duke Realty, The Gap, Twitter, Under Armour and Xilinx. There were 20 stocks added to the S&P 500® Index during the Reporting Period, including Constellation Energy, EQT, First Solar, Keurig Dr. Pepper, ON Semiconductor, PG&E and Warner Brothers Discovery.
The source of the data included in the above Portfolio Management Discussion and Analysis with respect to the Goldman Sachs Equity Index Fund is FactSet as of 12/31/2022.
Characteristics presented are calculated using the month end market value of holdings, except for beta and standard deviation, if shown, which use month end return values. Averages reflect the market weight of securities in the portfolio. Market data, prices, and dividend estimates for characteristics calculations provided by FactSet Research Systems, Inc. All other portfolio data provided by SSgA. Characteristics are as of the date indicated, are subject to change, and should not be relied upon as current thereafter.
Past performance is not a guarantee of future results.
Index returns are unmanaged and do not reflect the deduction of any fees or expenses. Index returns reflect all items of income, gain and loss and the reinvestment of dividends and other income.
SSgA may have or may seek investment management or other business relationships with companies discussed in this material or affiliates of those companies, such as their officers, directors and pension plans.
The views expressed in this material are the views of SSgA’s Global Equity Beta Solutions Team through the period ended December 31, 2022 and are subject to change based on market and other conditions. All information has been obtained from sources believed to be reliable, but its accuracy is not guaranteed. There is no representation or warranty as to the current accuracy, reliability or completeness of, nor liability for, decisions based on such information and it should not be relied on as such. This document contains certain statements that may be deemed forward-looking statements. Please note that any such statements are not guarantees of any future performance and actual results or developments may differ materially from those projected.
Liquidation of the Goldman Sachs Equity Index Fund
At a meeting held on December 13-14, 2022, upon the recommendation of Goldman Sachs Asset Management, L.P., the Board of Trustees (the “Board”) of the Goldman Sachs Trust (the “Trust”) approved a proposal to liquidate the Fund. After careful consideration of a number of factors, the Board concluded that it is advisable and in the best interest of the Fund and its shareholders to liquidate the Fund. The Fund will be liquidated on or about April 21, 2023 (the “Liquidation Date”), pursuant to a Plan of Liquidation approved by the Board. The Liquidation Date may be changed without notice at the discretion of the Trust’s officers.
FUND BASICS
Equity Index Fund
as of December 31, 2022
TOP TEN HOLDINGS AS OF 12/31/221
| | | | | | |
| | |
| Holding | | % of Net Assets | | | Line of Business |
| Apple, Inc. | | | 6.0% | | | Technology Hardware & Equipment |
| Microsoft Corp. | | | 5.6 | | | Software & Services |
| Amazon.com, Inc. | | | 2.3 | | | Retailing |
| Berkshire Hathaway, Inc., Class B | | | 1.7 | | | Diversified Financials |
| Alphabet, Inc., Class A | | | 1.6 | | | Media & Entertainment |
| UnitedHealth Group, Inc. | | | 1.5 | | | Health Care Equipment & Services |
| Alphabet, Inc., Class C | | | 1.5 | | | Media & Entertainment |
| Johnson & Johnson | | | 1.4 | | | Pharmaceuticals, Biotechnology & Life Sciences |
| Exxon Mobil Corp. | | | 1.4 | | | Energy |
| JPMorgan Chase & Co. | | | 1.2 | | | Banks |
| 1 | The top 10 holdings may not be representative of the Fund’s future investments. |
FUND BASICS
FUND VS. BENCHMARK SECTOR ALLOCATIONS2
As of December 31, 2022
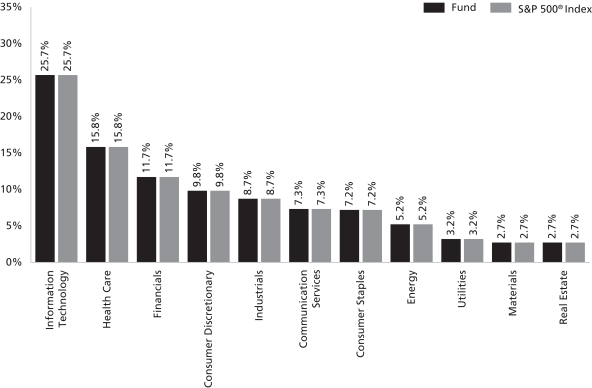
| 2 | The Fund is actively managed and, as such, its composition may differ over time. Consequently, the Fund’s overall sector allocations may differ from percentages contained in the graph above. The graph categorizes investments using Global Industry Classification Standard (“GICS”); however, the sector classifications used by the portfolio management team may differ from GICS. The percentage shown for each investment category reflects the value of investments in that category as a percentage of market value (excluding investments in the securities lending reinvestment vehicle, if any). The graph depicts the Fund’s investments but may not represent the Fund’s market exposure due to the exclusion of certain derivatives, if any, as listed in the Additional Investment Information section of the Schedule of Investments. |
For more information about your Fund, please refer to www.GSAMFUNDS.com. There, you can learn more about your Fund’s investment strategies, holdings, and performance.
GOLDMAN SACHS VARIABLE INSURANCE TRUST EQUITY INDEX FUND
Performance Summary
December 31, 2022
The following graph shows the value, as of December 31, 2022, of a $10,000 investment made in the Service Shares of Fund on January 1, 2013 at NAV. For comparative purposes, the performance of the Fund’s benchmark, the S&P 500® Index (with distributions reinvested), is shown. Performance reflects applicable fee waivers and/or expense limitations in effect during the periods shown and, in their absence, performance would be reduced. Returns do not reflect the deduction of taxes that a shareholder would pay on Fund distributions or the redemption of Fund shares. The returns set forth below represent past performance. Past performance does not guarantee future results. The Fund’s investment return and principal value will fluctuate so that an investor’s shares, when redeemed, may be worth more or less than their original cost. Current performance may be lower or higher than the performance quoted below. Please visit our web site at www.GSAMFUNDS.com to obtain the most recent month-end returns.
Equity Index Fund’s 10 Year Performance
Performance of a $10,000 investment, with distributions reinvested, from January 1, 2013 through December 31, 2022.
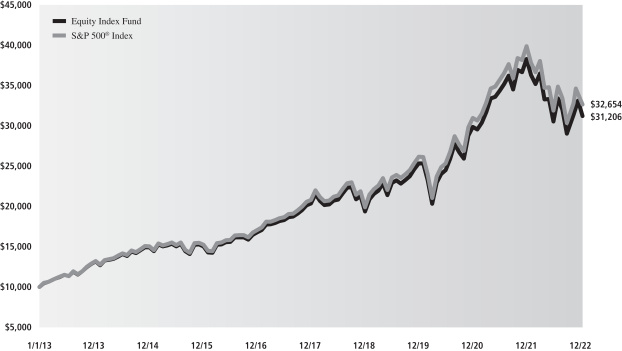
| | | | | | |
| Average Annual Total Return through December 31, 2022 | | One Year | | Five Years | | Ten Years |
Equity Index Fund | | -18.55% | | 8.91% | | 12.05% |
GOLDMAN SACHS VARIABLE INSURANCE TRUST INTERNATIONAL EQUITY INSIGHTS FUND
INVESTMENT OBJECTIVE
The Fund seeks long-term growth of capital.
Portfolio Management Discussion and Analysis
Below, the Goldman Sachs Quantitative Investment Strategies Team discuss the Goldman Sachs Variable Insurance Trust — Goldman Sachs International Equity Insights Fund’s (the “Fund”) performance and positioning for the 12-month period ended December 31, 2022 (the “Reporting Period”).
How did the Fund perform during the Reporting Period?
During the Reporting Period, the Fund’s Institutional and Service Shares generated average annual total returns of -13.55% and -13.72%, respectively. These returns compare to the -14.45% average annual total return of the Fund’s benchmark, the MSCI Europe, Australasia, Far East (EAFE) Index (net, USD, unhedged) (the “MSCI EAFE Index”), during the same time period.
What key factors were responsible for the Fund’s performance during the Reporting Period?
The Fund uses a quantitative style of management, in combination with a qualitative overlay, that emphasizes fundamentally-based stock selection, careful portfolio construction and efficient implementation.
During the Reporting Period, the Fund outperformed the MSCI EAFE Index on a relative basis, with two of our quantitative model’s four investment themes contributing positively to results. Stock selection overall, driven by these investment themes, boosted relative performance.
Which investment themes helped and which hurt within the Team’s stock selection strategy?
In keeping with our investment approach, we use our quantitative model and four investment themes to take a long-term view of market patterns and look for inefficiencies, selecting stocks for the Fund and overweighting or underweighting the ones chosen by the model. Over time and by design, the performance of any one of the model’s investment themes tends to have a low correlation with the model’s other themes, demonstrating the diversification benefit of the Fund’s theme-driven quantitative model. The variance in performance supports our research indicating that the diversification provided by the Fund’s different investment themes is a significant investment advantage over the long term, even though the Fund may experience underperformance in the short term. Of course, diversification does not protect an investor from market risk nor does it ensure a profit.
As mentioned, during the Reporting Period, two of our investment themes contributed positively to the Fund’s relative returns. Fundamental Mispricings added most, followed by Sentiment Analysis. Market Themes & Trends had a rather neutral effect on relative results during the Reporting Period, and High Quality Business Models detracted. Fundamental Mispricings seeks to identify high quality businesses trading at a fair price, which we believe may lead to strong performance over the long run. Sentiment Analysis seeks to identify stocks experiencing improvements in their overall market sentiment. Market Themes & Trends seeks to identify companies positively positioned to benefit from themes and trends in the market and macroeconomic environment. High Quality Business Models seeks to identify companies that are generating high quality revenues with sustainable business models and aligned management incentives.
How did the Fund’s sector and industry allocations affect relative performance during the Reporting Period?
In constructing the Fund’s portfolio, we focus on picking stocks rather than making sector or industry bets. Consequently, the Fund is similar to its benchmark, the MSCI EAFE Index, in terms of its sector and industry allocations and style. Relative performance is primarily driven by stock selection, not by sector or industry allocations.
Did stock selection help or hurt Fund performance during the Reporting Period?
We seek to outpace the MSCI EAFE Index by overweighting stocks that we expect to outperform and underweighting those that we think may lag. At the same time, we strive to maintain a risk profile similar to the MSCI EAFE Index. The Fund’s investments are selected using fundamental research and a variety of quantitative techniques based on our investment themes. For example, the Fund aims to hold a basket of stocks with better Fundamental Mispricings characteristics than the benchmark index.
During the Reporting Period, stock selection overall helped the Fund’s performance, with investments in the industrials, materials and consumer staples sectors contributing most positively to results relative to the MSCI EAFE Index. Holdings in health care and consumer discretionary detracted — the only two sectors to detract from relative results during the Reporting Period.
GOLDMAN SACHS VARIABLE INSURANCE TRUST INTERNATIONAL EQUITY INSIGHTS FUND
Which individual stock positions contributed the most to the Fund’s relative returns during the Reporting Period?
The Fund benefited most from an underweight position in Japan-based electronics products manufacturer and distributor Sony Group and from overweight positions in U.K.-based bulk-liquid global transportation and logistics provider Stolt-Nielsen and Norway-based energy company Aker BP. The underweight in Sony Group was fueled mainly by our Market Themes & Trends and Fundamental Mispricings investment themes. The overweight in Stolt-Nielsen was similarly based primarily on our Market Themes & Trends and Fundamental Mispricings investment themes. The overweight in Aker BP was driven by our High Quality Business Models, Market Themes & Trends and Fundamental Mispricings investment themes.
Which individual positions detracted from the Fund’s results during the Reporting Period?
Detracting most from the Fund’s results relative to the MSCI EAFE Index were underweight positions in British-Swedish pharmaceutical company AstraZeneca and French energy company TotalEnergies and an overweight position in Swiss laboratory instruments provider Tecan Group. The underweight in AstraZeneca was implemented because of negative scores across all four investment themes, but primarily High Quality Business Models. The underweight in TotalEnergies was based primarily on our Sentiment Analysis investment theme. The overweight in Tecan Group was driven primarily by our High Quality Business Models and Sentiment Analysis investment themes.
Which countries helped or hurt the Fund’s relative performance during the Reporting Period?
Compared to the MSCI EAFE Index, the Fund was helped most by its positioning in Japan, Norway and Sweden. Positioning in France, Switzerland and Australia detracted most from the Fund’s relative results during the Reporting Period.
How did the Fund use derivatives during the Reporting Period?
During the Reporting Period, we used equity index futures contracts, on an opportunistic basis, to equitize the Fund’s cash holdings. In other words, we put the Fund’s cash holdings to work by using them as collateral for the purchase of stock futures. We also used foreign currency exchange contracts to avoid unintended local currency exposure when buying and selling stocks. The use of these derivatives did not have a material impact on Fund results during the Reporting Period.
Did you make any enhancements to your quantitative models during the Reporting Period?
We continuously look for ways to improve our investment process. During the first half of the Reporting Period, we enhanced a signal within our Market Themes & Trends investment theme. We believe that patterns exist in the market, and thus the past can provide an indication of market cycles and their effect on future market states. We enhanced this signal to give it more predictive power in terms of identifying and assessing similarities in returns between current and previous market environments for both individual stocks and countries for our strategies that have country tilts. Additionally, within our Sentiment Analysis investment theme, we introduced two new signals in the Japan region. The first signal looks at aggregated significant short positions across market participants. We believe that significant short positions established right ahead of earnings announcements are more reflective of investors’ views of the stock, assuming that investors have access to private information. The second signal analyzes credit card data to arrive at sales figures for companies, thereby helping us track corporate revenue patterns.
We introduced several new signals into our models in the second half of 2022. For example, we introduced a new signal within our Sentiment Analysis investment theme across all regions except Japan. The signal aims to improve our sentiment identification in earnings call reports by utilizing many of the latest developments in machine learning and natural language processing. We introduced a signal in our High Quality Business Models investment theme in all regions except the U.S. The signal aims to apply U.S. consumer spending data to non-U.S. companies to help predict their future returns. Finally, we introduced two new signals within our Market Themes & Trends investment theme across all regions. The first signal leverages advanced machine learning algorithms to capture nuanced behavior of our existing suite of more than a hundred alpha factors. The second signal aims to apply natural language processing techniques to account for fine-grained linguistic meaning of documents when quantifying company linkages for text-based cross-stock momentum factors.
What changes did you make to the Fund’s country weightings during the Reporting Period?
During the Reporting Period, we increased the Fund’s positions relative to the MSCI EAFE Index in Sweden, Australia, Italy and Switzerland. We decreased the Fund’s positions relative to the MSCI EAFE Index in Japan, Hong Kong and Germany.
What were the Fund’s sector and country weightings at the end of the Reporting Period?
As of December 31, 2022, the Fund was overweight the industrials, health care and consumer discretionary sectors relative to the MSCI EAFE Index. The Fund was underweight communication services, materials, consumer staples and energy and was rather neutral to the MSCI EAFE Index in information technology, utilities, financials and real estate on the same date.
GOLDMAN SACHS VARIABLE INSURANCE TRUST INTERNATIONAL EQUITY INSIGHTS FUND
In terms of countries, the Fund was overweight relative to the MSCI EAFE Index in Sweden, Australia, France, Norway and Denmark at the end of the Reporting Period. Compared to the MSCI EAFE Index, the Fund was underweight in Switzerland, Germany, the U.K. and Hong Kong and was relatively neutral compared to the MSCI EAFE Index in the remaining constituents of the MSCI EAFE Index at the end of the Reporting Period.
Were there any changes to the Fund’s portfolio management team during the Reporting Period?
There were no changes to the Fund’s portfolio management team during the Reporting Period.
What is your strategy going forward for the Fund?
Looking ahead, we continue to believe that less expensive stocks should outpace more expensive stocks, and stocks with good momentum are likely to outperform those with poor momentum. We intend to maintain our focus on seeking companies about which fundamental research analysts are becoming more positive as well as profitable companies with sustainable earnings and a track record of using their capital to enhance shareholder value. As such, we anticipate remaining fully invested with long-term performance likely to be the result of stock selection rather than sector or capitalization allocations.
We stand behind our investment philosophy that sound economic investment principles, coupled with a disciplined quantitative approach, can provide strong, uncorrelated returns over the long term. Our research agenda is robust, and we continue to enhance our existing models, add new proprietary forecasting signals and improve our trading execution as we seek to provide the most value to our shareholders.
FUND BASICS
International Equity Insights Fund
as of December 31, 2022
TOP TEN HOLDINGS AS OF 12/31/221
| | | | | | | | |
| | | |
| Holding | | % of
Net Assets | | | Line of Business | | Country |
| Roche Holding AG | | | 2.1% | | | Pharmaceuticals, Biotechnology & Life Sciences | | United States |
| ASML Holding NV | | | 2.1 | | | Semiconductors & Semiconductor Equipment | | Netherlands |
| Novo Nordisk A/S, Class B | | | 2.1 | | | Pharmaceuticals, Biotechnology & Life Sciences | | Denmark |
| LVMH Moet Hennessy Louis Vuitton SE | | | 2.0 | | | Consumer Durables & Apparel | | France |
| BHP Group Ltd. ADR | | | 1.7 | | | Materials | | Australia |
| Commonwealth Bank of Australia | | | 1.5 | | | Banks | | Australia |
| Shell PLC | | | 1.4 | | | Energy | | Netherlands |
| Sanofi | | | 1.4 | | | Pharmaceuticals, Biotechnology & Life Sciences | | France |
| Diageo PLC | | | 1.4 | | | Food, Beverage & Tobacco | | United Kingdom |
| Novartis AG | | | 1.3 | | | Pharmaceuticals, Biotechnology & Life Sciences | | Switzerland |
| 1 | The top 10 holdings may not be representative of the Fund’s future investments. |
FUND VS. BENCHMARK SECTOR ALLOCATIONS2
As of December 31, 2022
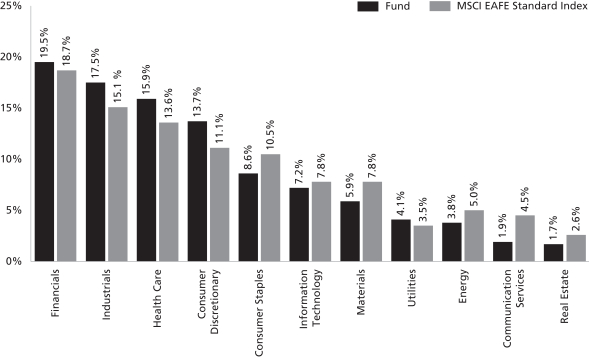
| 2 | The Fund is actively managed and, as such, its composition may differ over time. Consequently, the Fund’s overall sector allocations may differ from percentages contained in the graph above. The graph categorizes investments using Global Industry Classification Standard (“GICS”); however, the sector classifications used by the portfolio management team may differ from GICS. The percentage shown for each investment category reflects the value of investments in that category as a percentage of market value. The graph depicts the Fund’s investments but may not represent the Fund’s market exposure due to the exclusion of certain derivatives, if any, as listed in the Additional Investment Information section of the Schedule of Investments. |
For more information about your Fund, please refer to www.GSAMFUNDS.com. There, you can learn more about
your Fund’s investment strategies, holdings, and performance.
GOLDMAN SACHS VARIABLE INSURANCE TRUST INTERNATIONAL EQUITY INSIGHTS FUND
Performance Summary
December 31, 2022
The following graph shows the value, as of December 31, 2022, of a $10,000 investment made on January 1, 2013 in Institutional Shares at NAV. For comparative purposes, the performance of the Fund’s benchmark, the MSCI EAFE Standard Index (Net, USD, Unhedged), is shown. Performance reflects applicable fee waivers and/or expense limitations in effect during the periods shown and, in their absence, performance would be reduced. Returns do not reflect the deduction of taxes that a shareholder would pay on Fund distributions or the redemption of Fund shares. The returns set forth below represent past performance. Past performance does not guarantee future results. The Fund’s investment return and principal value will fluctuate so that an investor’s shares, when redeemed, may be worth more or less than their original cost. Current performance may be lower or higher than the performance quoted below. Please visit our web site at www.GSAMFUNDS.com to obtain the most recent month-end returns.
International Equity Insights Fund’s 10 Year Performance
Performance of a $10,000 investment, with distributions reinvested, from January 1, 2013 through December 31, 2022.
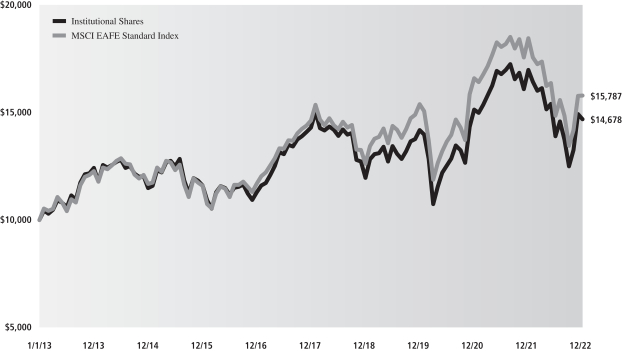
| | | | | | |
| Average Annual Total Return through December 31, 2022 | | One Year | | Five Years | | Ten Years |
Institutional | | -13.55% | | 0.54% | | 3.91% |
Service | | -13.72% | | 0.28% | | 3.64% |
GOLDMAN SACHS VARIABLE INSURANCE TRUST LARGE CAP VALUE FUND
INVESTMENT OBJECTIVE
The Fund seeks long-term capital appreciation.
Portfolio Management Discussion and Analysis
Below, the Goldman Sachs Fundamental Equity U.S. Equity Portfolio Management Team discusses the Goldman Sachs Variable Insurance Trust — Goldman Sachs Large Cap Value Fund’s (the “Fund”) performance and positioning for the 12-month period ended December 31, 2022 (the “Reporting Period”).
How did the Fund perform during the Reporting Period?
During the Reporting Period, the Fund’s Institutional and Service Shares generated average annual total returns of -6.37% and -6.57%, respectively. These returns compare to the -7.54% average annual total return of the Fund’s benchmark, the Russell 1000® Value Index (with dividends reinvested) (the “Russell Index”) during the same time period.
What key factors were responsible for the Fund’s performance during the Reporting Period?
The Fund posted negative absolute returns but outperformed the Russell Index on a relative basis during the Reporting Period due to a combination of stock selection and sector allocation decisions overall.
Which equity market sectors most significantly affected Fund performance?
Stock selection in the financials, health care and consumer discretionary sectors contributed most positively to the Fund’s relative results during the Reporting Period. Only partially offsetting these positive contributors was stock selection in the materials, industrials and communication services sectors, which detracted from the Fund’s relative results during the Reporting Period.
What were some of the Fund’s best-performing individual stocks?
Relative to the Russell Index, the Fund benefited most from positions in Devon Energy, ConocoPhillips and Hess — each an oil and natural gas exploration and production company within the energy sector.
Devon Energy’s fourth quarter 2021 earnings, reported early in the Reporting Period, featured strong results, with earnings and dividends higher than consensus expectations. Further, Devon Energy maintained its focus during the Reporting Period on 2022 production and its industry-leading variable dividend policy. Each of Devon Energy’s earnings reports during the Reporting Period featured results above consensus expectations, largely due to strong production and execution metrics as well as rising energy price dynamics. Our investment thesis continued to revolve around a better than consensus expected variable dividend, increased buybacks and what we considered to be a good line of sight to significant capital returns. We ultimately decided to sell the Fund’s position in Devon Energy in November 2022 due to the underperformance of the company’s newly-acquired assets as well as on our concerns around its valuation being potentially too high.
Shares of ConocoPhillips appreciated in the first quarter of 2022, as it announced fourth quarter 2021 earnings higher than consensus expectations and increased its cash return guidance for 2022. The company also benefited from the broader rally in energy stocks during the Reporting Period, as crude oil prices rose in the wake of geopolitical tensions. In the second calendar quarter, ConocoPhillips increased its 2022 cash return guidance from $2 billion to $10 billion. A significant expansion of its global liquid natural gas (“LNG”) business through investment in new facilities was also viewed favorably by investors. In the later months of 2022, the trends of increased capital return continued along with satisfactory earnings reports. At the end of the Reporting Period, we remained optimistic on ConocoPhillips, as the company continued, in our view, to have a high level of execution with disciplined investments, consistent return of cash to shareholders and a high quality portfolio that we believe may deliver free cash flow growth.
Early in the Reporting Period, Hess reported a strong fourth quarter 2021 earnings release, with earnings surpassing consensus expectation and capital expenditures well below its previous guidance. Hess also announced several new discoveries in Guyana at the beginning of 2022 and benefited from the operating environment there. Its production was further expanded later in 2022 in what we saw as an efficient manner thanks to further reserve discoveries in Guyana, though its North Dakota operations offset some of that progress. At the end of the Reporting Period, we remained optimistic on Hess’ prospects given a fairly significant inflection in its cash flow profile that may lead to dividend increases and further shareholder returns.
GOLDMAN SACHS VARIABLE INSURANCE TRUST LARGE CAP VALUE FUND
Which stocks detracted significantly from the Fund’s performance during the Reporting Period?
Among those companies detracting most from the Fund’s results relative to the Russell Index were positions in Exxon Mobil, Salesforce and Ball.
We initiated a Fund position in integrated energy company Exxon Mobil in July 2022. However, Exxon Mobil proved a detractor from relative results because the Fund held an underweight position in its positively performing stock. Its shares benefited during the Reporting Period from the increase in crude oil pricing and from supply/demand dynamics. In February 2022, it had been announced that sweeping restructuring would be taking place across its global operations. Examples of changes included cost cutting and a new headquarters location in Houston. Its earnings releases during the summer of 2022 featured significant beats of consensus estimates on both net income and earnings per share. Further, its results from its LNG segment proved favorable. At the end of the Reporting Period, we continued to see positive trends in the operations of Exxon Mobil, and we will look to see if further capital distributions are put in place.
Salesforce provides cloud-based software solutions for customer relationship management. Despite its management’s moderately optimistic forward guidance during the Reporting Period, as Slack, the proprietary communication platform of Slack Technologies, was being integrated into the business, lofty market expectations kept the bar high. Salesforce’s earnings results later in the calendar year continued to underwhelm, though there was an improvement on margins, which demonstrated, in our view, a commitment by its management to operate more efficiently. At the end of the Reporting Period, we believed its management remained diligent on operating margin expansion, and we believed synergies among the company’s business arms could continue to drive further efficiency.
Shares of metal packaging provider Ball came under pressure early in the Reporting Period, with its first quarter earnings per share falling below consensus expectations. The miss was mostly driven by a significant volume decline in its Latin American business due to flooding in the area. Then, its earnings report release in early August 2022 featured surprisingly weak results due to a sizeable slowdown in its Americas business, as consumers came under cost pressures. Further, Ball announced the sale of its Russian beverage packaging business following heightened geopolitical tensions, which caused the company to lower its shareholder capital return target. There was a rebound in Ball’s stock in November 2022 thanks to stronger than consensus expected results coming from its North America segment. At the end of the Reporting Period, we believed our longer-term investment thesis for the company remained intact, as we continued to see a multi-year growth story for aluminum products, of which Ball should be a primary beneficiary. Also, its management team remained, in our opinion, best in class, and we believed there was a good line of sight for the business to get back on track in terms of sales volume growth.
How did the Fund use derivatives and similar instruments during the Reporting Period?
During the Reporting Period, we did not use derivatives as part of an active management strategy.
Did the Fund make any significant purchases or sales during the Reporting Period?
During the Reporting Period, in addition to the purchase of Exxon Mobil, mentioned earlier, we established a Fund position in retailing giant Walmart. Our motivation for the purchase revolved around our belief that Walmart’s value proposition may help it perform well and even gain market share in a challenged consumer environment. Diligent inventory management was also an attractive consideration for us.
Conversely, we sold the Fund’s position in Chevron, a global integrated energy, chemical and petroleum company, during the Reporting Period. Chevron has approximately 22% of its production in Kazakhstan, which we viewed as a high regional risk, not appropriate for the Fund’s investment strategy.
We exited the Fund’s position in rail freight transportation company Union Pacific. Concerns arose regarding network fluidity, as the risk for west coast port disruptions increased. After our analysis, we ultimately decided to eliminate the Fund’s position in Union Pacific in favor of a competitor with what we believed to be a more attractive risk/reward opportunity.
Were there any notable changes in the Fund’s weightings during the Reporting Period?
In constructing the Fund’s portfolio, we focus on picking stocks rather than on making industry or sector bets. We seek to outpace the benchmark index by overweighting stocks that we expect to outperform and underweighting those that we think may lag. Consequently, changes in its sector weights are generally the direct result of individual stock selection or of stock appreciation or depreciation. That said, during the Reporting Period, the Fund’s exposure compared to the Russell Index to communication services, consumer discretionary, health care and industrials increased. The Fund’s allocations compared to the Russell Index in consumer staples, energy, financials and real estate decreased.
GOLDMAN SACHS VARIABLE INSURANCE TRUST LARGE CAP VALUE FUND
How was the Fund positioned relative to its benchmark index at the end of the Reporting Period?
At the end of December 2022, the Fund had overweighted positions relative to the Russell Index in the information technology, materials and consumer discretionary sectors. On the same date, the Fund had underweighted positions compared to the Russell Index in financials, real estate and communication services and was rather neutrally weighted to the Russell Index in the consumer staples, energy, health care, industrials and utilities sectors.
Were there any changes to the Fund’s portfolio management team during the Reporting Period?
There were no changes to the Fund’s portfolio management team during the Reporting Period.
What is the Fund’s tactical view and strategy for the months ahead?
At the end of 2022, we believed the primary focus of the U.S. equity market in the months ahead would be on whether the U.S. economy will tip into a recession or not. The Fed’s devotion to a higher-for-longer policy fueled concerns it may overtighten monetary policy and prompt a recession. Despite this backdrop of heightened uncertainty, we expected it to become clear by early 2023 if inflation is decelerating and will or will not lead the Fed to eventually cease tightening. While supply-chain disruptions should ease, in our view, as COVID-19-related restrictions and shortages fade out, pressures of digitization, deglobalization and geopolitical destabilization are likely, we feel, to endure for some time. In our opinion, companies will need to continue coping with wage pressures, higher input pricing and potential demand fluctuations if the U.S. consumer becomes less resilient.
Regardless of market direction, we intend to stay true to our quality-first investment approach and seek to invest in businesses with healthy balance sheets, relatively stable cash flows and differentiated business models aligned to secular tailwinds. We continue to test our models and re-evaluate our assumptions with increasing information, remain focused on the long-term investment horizon and believe this fundamental approach can generate added value in the long run. As always, we maintain our focus on undervalued companies that we believe have comparatively greater control of their own destiny, such as innovators with differentiated products, companies with low cost structures or companies that have been investing in their own businesses and may be poised to gain market share.
FUND BASICS
Large Cap Value Fund
as of December 31, 2022
TOP TEN HOLDINGS AS OF 12/31/221
| | | | | | |
| | |
| Holding | | % of Net Assets | | | Line of Business |
| Johnson & Johnson | | | 3.5% | | | Pharmaceuticals, Biotechnology & Life Sciences |
| Exxon Mobil Corp. | | | 3.2 | | | Energy |
| JPMorgan Chase & Co. | | | 3.2 | | | Banks |
| Bank of America Corp. | | | 2.3 | | | Banks |
| Bristol-Myers Squibb Co. | | | 2.2 | | | Pharmaceuticals, Biotechnology & Life Sciences |
| Walmart, Inc. | | | 2.1 | | | Food & Staples Retailing |
| ConocoPhillips | | | 2.1 | | | Energy |
| Morgan Stanley | | | 2.0 | | | Diversified Financials |
| CVS Health Corp. | | | 2.0 | | | Health Care Equipment & Services |
| NextEra Energy, Inc. | | | 1.9 | | | Utilities |
| 1 | The top 10 holdings may not be representative of the Fund’s future investments. |
FUND BASICS
FUND VS. BENCHMARK SECTOR ALLOCATIONS2
As of December 31, 2022
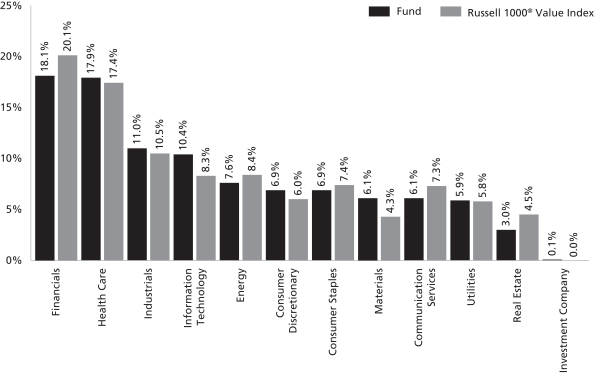
| 2 | The Fund is actively managed and, as such, its composition may differ over time. Consequently, the Fund’s overall sector allocations may differ from percentages contained in the graph above. The graph categorizes investments using Global Industry Classification Standard (“GICS”); however, the sector classifications used by the portfolio management team may differ from GICS. The percentage shown for each investment category reflects the value of investments in that category as a percentage of market value. Underlying sector allocations of exchange traded funds and investment companies held by the Fund are not reflected in the graph above. |
For more information about your Fund, please refer to www.GSAMFUNDS.com. There, you can learn more about your Fund’s investment strategies, holdings, and performance.
GOLDMAN SACHS VARIABLE INSURANCE TRUST LARGE CAP VALUE FUND
Performance Summary
December 31, 2022
The following graph shows the value, as of December 31, 2022, of a $10,000 investment made on January 1, 2013 in Service Shares at NAV. For comparative purposes, the performance of the Fund’s benchmark, the Russell 1000® Value Index (with distributions reinvested), is shown. Performance reflects applicable fee waivers and/or expense limitations in effect during the periods shown and, in their absence, performance would be reduced. Returns do not reflect the deduction of taxes that a shareholder would pay on Fund distributions or the redemption of Fund shares. The returns set forth below represent past performance. Past performance does not guarantee future results. The Fund’s investment return and principal value will fluctuate so that an investor’s shares, when redeemed, may be worth more or less than their original cost. Current performance may be lower or higher than the performance quoted below. Please visit our web site at www.GSAMFUNDS.com to obtain the most recent month-end returns.
Large Cap Value Fund’s 10 Year Performance
Performance of a $10,000 investment, with distributions reinvested, from January 1, 2013 through December 31, 2022.
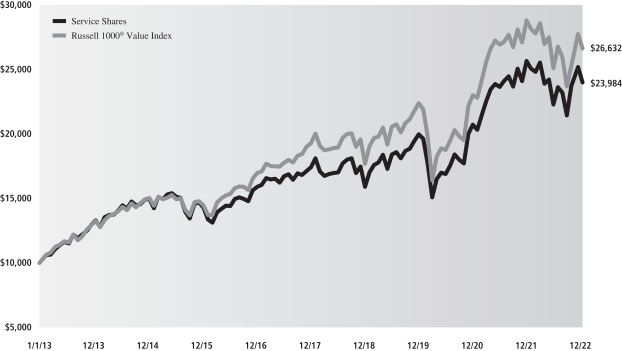
| | | | | | |
| Average Annual Total Return through December 31, 2022 | | One Year | | Five Years | | Ten Years |
Institutional | | -6.37% | | 6.85% | | 9.40% |
Service | | -6.57% | | 6.61% | | 9.14% |
GOLDMAN SACHS VARIABLE INSURANCE TRUST MID CAP GROWTH FUND
INVESTMENT OBJECTIVE
The Fund seeks long-term growth of capital.
Portfolio Management Discussion and Analysis
Effective after the close of business on April 29, 2022, the Board of Trustees of the Goldman Sachs Variable Insurance Trust approved changes to the Goldman Sachs Variable Insurance Trust — Goldman Sachs Growth Opportunities Fund’s name and principal investment strategy. The name changed to the Goldman Sachs Variable Insurance Trust — Goldman Sachs Mid Cap Growth Fund (the “Fund”). No modification was made to the Fund’s investment objective in connection with this change. Below, the Goldman Sachs Fundamental Equity U.S. Equity Portfolio Management Team discusses the Fund’s performance and positioning for the 12-month period ended December 31, 2022 (the “Reporting Period”).
How did the Fund perform during the Reporting Period?
During the Reporting Period, the Fund’s Institutional and Service Shares generated average annual total returns of -26.20% and -26.30%, respectively. These returns compare to the -26.72% average annual total return of the Fund’s benchmark, the Russell Midcap® Growth Index (with dividends reinvested) (the “Russell Index”), during the same time period.
How did the Fund’s investment process change after the close of business on April 29, 2022?
Before the close of business on April 29, 2022, the Fund invested, under normal circumstances, at least 90% of its total assets measured at the time of purchase in equity investments with a primary focus on mid-cap companies. Effective after the close of business on April 29, 2022, the Fund invests, under normal circumstances, at least 80% of its net assets plus any borrowings for investment purposes (measured at the time of purchase) in a diversified portfolio of equity investments in mid-cap issuers.
What key factors were responsible for the Fund’s performance during the Reporting Period?
During the Reporting Period, the Fund generated double-digit negative absolute returns but modestly outperformed the Russell Index on a relative basis. Sector positioning contributed positively to relative performance, while stock selection detracted.
Which equity market sectors helped and hurt Fund performance?
Our bottom-up approach focuses on security selection, and therefore, we do not make active sector-level investment decisions. The Fund’s sector positioning is a result of our stock selection. That said, on a sector level, stock selection in the health care sector and, to a lesser extent, in the consumer staples sector added to relative performance. Stock selection in the information technology, energy and financials sectors detracted from relative returns during the Reporting Period.
Which individual stocks added to the Fund’s relative performance during the Reporting Period?
During the Reporting Period, the Fund was helped most versus the Russell Index by investments in Insulet, Neurocrine Biosciences and Cummins.
Insulet, which develops, manufactures and markets insulin delivery systems for people with insulin-dependent diabetes, was the Fund’s leading contributor. The company’s stock price soared following the release of a third quarter earnings report in which the company beat consensus estimates and added a record number of new customers, leading its management to raise its full-year revenue forecast. Insulet’s Omnipod 5 insulin pump has been a major success since its launch in August 2022, and the product is expected to remain in high demand for several years. At the end of the Reporting Period, we remained optimistic about Insulet given that Omnipod 5 was scheduled to expand to Europe in mid-2023 and would be made available to a wider range of ages. In addition, we noted the company has a number of exciting products set to release during the next two years.
Neurocrine Biosciences focuses on the development and marketing of pharmaceuticals for the treatment of neurological, endocrine and psychiatric-based diseases and disorders. Neurocrine Biosciences’ stock price appreciated significantly during the Reporting Period, highlighted by strong growth in the company’s tardive dyskinesia treatment, Ingrezza, which was responsible for first, second and third quarter 2022 earnings beats. At the end of the Reporting Period, we believed the commercial expansion supporting Ingrezza would continue to strengthen Neurocrine Biosciences’ outlook in 2023, and we expected investors’ focus to continue shifting toward the assets in the company’s product pipeline.
GOLDMAN SACHS VARIABLE INSURANCE TRUST MID CAP GROWTH FUND
Cummins, a maker of diesel and natural gas engines, benefited from both a broad-based spike in demand that impacted the entire machinery industry and stronger global demand overall for generator technologies and oil and gas applications. At the end of the Reporting Period, we believed Cummins was well positioned in the business cycle, given that truck demand remained high, an increase in infrastructure spending was expected during 2023, power demand continued to rise, and we saw potential for a new mining cycle. (A mining cycle refers to the various steps in a mine’s operation, from its inception to the depletion of its resources.) In addition, we were optimistic that Cummins had the ability to expand within the hydrogen power market and improve its share in the engine market given that the company has expertise in both hydrogen technology and emissions regulation-compliant diesel engines.
Which individual stocks detracted from the Fund’s relative performance during the Reporting Period?
The Fund’s investments in Zscaler, AZEK and Snap detracted most from its relative performance during the Reporting Period.
The top Fund detractor was Zscaler, which provides a cloud-based Internet security platform. Despite posting strong financial results in its fiscal 2022 second, third and fourth quarter earnings reports, Zscaler’s stock price plummeted as the combination of Federal Reserve (“Fed”) interest rate hikes, rising inflation, supply-chain shortages and heightened geopolitical tensions hurt cybersecurity companies broadly. At the end of the Reporting Period, we continued to view Zscaler as the provider with the most compelling technology, platform and consolidation opportunity in the cybersecurity industry, and we expected additional large deal momentum in the near term. We also believed the market was underestimating the company’s ability to sustain its growth rate, and we anticipated positive performance from the company in 2023.
AZEK is a manufacturer of premium building products that replace traditional materials and provide value through lower maintenance, refined aesthetics and reduced total cost. AZEK’s stock price declined consistently during the Reporting Period on the back of Fed rate hikes, which led indirectly to higher mortgage interest rates that, in turn, made construction projects more expensive and home buyers more hesitant to purchase. We ultimately decided to sell the Fund’s position in AZEK, as the higher interest rate environment continued to be an overhang on residential demand, in our view.
Snap is a camera and social media company and the parent company of Snapchat. Snap’s stock price depreciated during the first half of the Reporting Period after the company issued guidance contradicting previous revenue and profit targets, as the macroeconomic environment deteriorated more than anticipated. The company’s shares declined further following the release of its third quarter 2022 earnings, which revealed a surprise drop in U.S. customer engagement. At the end of the Reporting Period, we remained confident about Snap because of the company’s strong user growth, and we believed the company’s new projects could be successful in growing overall customer engagement.
Did the Fund make any significant purchases or sales during the Reporting Period?
Among Fund positions established during the Reporting Period was an investment in medical device manufacturing company DexCom. The company’s glucose monitoring systems are generally considered “best in class” amongst comparable products. In addition, our outlook for the company is favorable going into 2023 given the expected launch of a new product called G7, which has the potential, in our view, to double DexCom’s available market.
We also initiated a Fund position in Mettler-Toledo International, an analytical laboratory instrument manufacturing company, during the Reporting Period. The company is experiencing good growth in China and also continues to deliver on earnings per share despite a challenging macroeconomic backdrop and foreign exchange pressures.
Conversely, among notable sales during the Reporting Period was the Fund’s position in data analytics provider Verisk Analytics. A combination of decelerating organic revenue growth and transaction revenue headwinds in the company’s insurance business contributed to our decision to exit the Fund’s position in favor of what we considered to be more attractive risk/reward opportunities.
In addition, during the Reporting Period, we exited the Fund’s position in IDEXX Laboratories, a veterinary, livestock, poultry, dairy and water testing manufacturing company. In our view, the current environment, with softness in veterinary visits and increased pricing risk, was not favorable for the company, and so we decided to sell the Fund’s investment and reallocate capital to what we viewed as more compelling risk/reward opportunities.
Were there any notable changes in the Fund’s weightings during the Reporting Period?
Changes to the Fund’s sector weightings relative to the Russell Index are due to our stock selection. As a result of these decisions during the Reporting Period, the Fund’s overweight positions versus the Russell Index in the health care and materials sectors increased. Its underweights in the information technology and financials sectors also increased, while its underweight in the
GOLDMAN SACHS VARIABLE INSURANCE TRUST MID CAP GROWTH FUND
consumer discretionary sector decreased. Compared to the Russell Index, the Fund shifted from an overweight in consumer staples and an underweight in real estate to rather neutral positions during the Reporting Period.
How did the Fund use derivatives and similar instruments during the Reporting Period?
The Fund did not use derivatives or similar instruments within its investment process during the Reporting Period.
Were there any changes to the Fund’s portfolio management team during the Reporting Period?
There were no changes to the Fund’s portfolio management team during the Reporting Period.
How was the Fund positioned relative to the Russell Index at the end of the Reporting Period?
As mentioned, the Fund’s sector positioning relative to the Russell Index is the result of our stock selection, as we take a pure bottom-up, research-intensive approach to investing. From that perspective, then, at the end of the Reporting Period, the Fund’s portfolio was broadly diversified with overweight positions compared to the Russell Index in the health care, materials and industrials sectors. The Fund had smaller weightings than the Russell Index in the information technology, financials and consumer discretionary sectors. At the end of the Reporting Period, the Fund was relatively neutral compared to the Russell Index in the communication services, consumer staples, energy and real estate sectors. It had no exposure to the utilities sector at the end of the Reporting Period.
What is the Fund’s tactical view and strategy for the months ahead?
At the end of the Reporting Period, the Fed’s devotion to higher-for-longer interest rates continued to fuel concerns that policymakers might overtighten monetary policy and prompt a recession. Accordingly, we believed the primary focus of most investors in the near term would be on whether or not the U.S. economy tipped into recession. In our view, it should become clear in early 2023 if inflation is decelerating, which may eventually lead the Fed to cease tightening. Meanwhile, we expected supply disruptions to ease as COVID-19-related restrictions and shortages faded, though we believed the pressures of digitization, deglobalization and geopolitical destabilization would endure for some period of time. In our view, companies will have to continue coping with wage pressures, higher input pricing, and potential demand fluctuations if the U.S. consumer becomes less resilient.
Regardless of market direction, we intend to stay true to our quality-first investment approach and seek to invest in businesses with healthy balance sheets, relatively stable cash flows and differentiated business models aligned to secular tailwinds. We continue to test our models and re-evaluate our assumptions with increasing information; remain focused on the long-term investment horizon; and believe this fundamental approach can generate added value in the long run. As always, we maintain our focus on seeking companies that we believe will generate long-term growth in today’s ever-changing market conditions.
FUND BASICS
Mid Cap Growth Fund
as of December 31, 2022
TOP TEN HOLDINGS AS OF 12/31/221
| | | | | | |
| | |
| Holding | | % of Net Assets | | | Line of Business |
| Rockwell Automation, Inc. | | | 2.9% | | | Capital Goods |
| Dexcom, Inc. | | | 2.9 | | | Health Care Equipment & Services |
| Cadence Design Systems, Inc. | | | 2.7 | | | Software & Services |
| Insulet Corp. | | | 2.5 | | | Health Care Equipment & Services |
| Lululemon Athletica, Inc. | | | 2.4 | | | Consumer Durables & Apparel |
| Keysight Technologies, Inc. | | | 2.4 | | | Technology Hardware & Equipment |
| Mettler-Toledo International, Inc. | | | 2.3 | | | Pharmaceuticals, Biotechnology & Life Sciences |
| Burlington Stores, Inc. | | | 2.2 | | | Retailing |
| AmerisourceBergen Corp. | | | 2.0 | | | Health Care Equipment & Services |
| Veeva Systems, Inc., Class A | | | 2.0 | | | Health Care Equipment & Services |
| 1 | The top 10 holdings may not be representative of the Fund’s future investments. |
FUND BASICS
FUND VS. BENCHMARK SECTOR ALLOCATIONS2
As of December 31, 2022
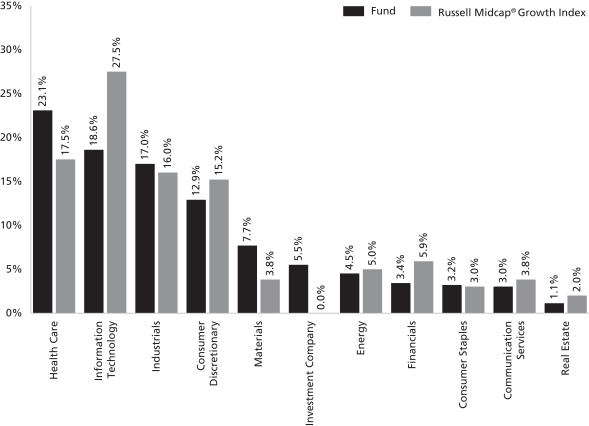
| 2 | The Fund is actively managed and, as such, its composition may differ over time. Consequently, the Fund’s overall sector allocations may differ from percentages contained in the graph above. The graph categorizes investments using Global Industry Classification Standard (“GICS”); however, the sector classifications used by the portfolio management team may differ from GICS. The percentage shown for each investment category reflects the value of investments in that category as a percentage of market value (excluding investments in the securities lending reinvestment vehicle, if any). Underlying sector allocations of exchange traded funds and investment companies held by the Fund are not reflected in the graph above. |
For more information about your Fund, please refer to www.GSAMFUNDS.com. There, you can learn more about your Fund’s investment strategies, holdings, and performance.
GOLDMAN SACHS VARIABLE INSURANCE TRUST MID CAP GROWTH FUND
Performance Summary
December 31, 2022
The following graph shows the value, as of December 31, 2022, of a $10,000 investment made on January 1, 2013 in Service Shares at NAV. For comparative purposes, the performance of the Fund’s benchmark, the Russell Midcap® Growth Index (with distributions reinvested), is shown. Performance reflects applicable fee waivers and/or expense limitations in effect during the periods shown and, in their absence, performance would be reduced. Returns do not reflect the deduction of taxes that a shareholder would pay on Fund distributions or the redemption of Fund shares. The returns set forth below represent past performance. Past performance does not guarantee future results. The Fund’s investment return and principal value will fluctuate so that an investor’s shares, when redeemed, may be worth more or less than their original cost. Current performance may be lower or higher than the performance quoted below. Please visit our web site at www.GSAMFUNDS.com to obtain the most recent month-end returns.
Mid Cap Growth Fund’s 10 Year Performance
Performance of a $10,000 investment, with distributions reinvested, from January 1, 2013 through December 31, 2022.
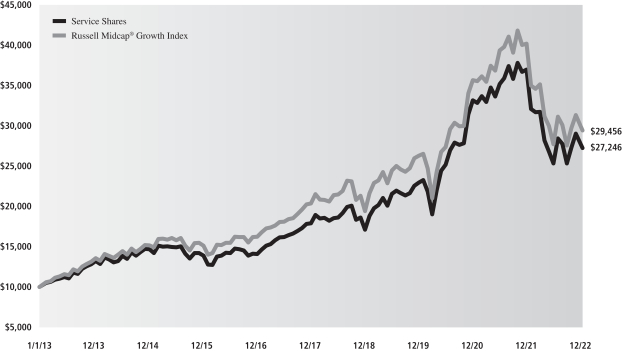
| | | | | | | | |
| Average Annual Total Return through December 31, 2022 | | One Year | | Five Years | | Ten Years | | Since Inception |
Institutional (Commenced April 30, 2013) | | -26.20% | | 8.91% | | N/A | | 9.95% |
Service | | -26.30% | | 8.74% | | 10.54% | | — |
GOLDMAN SACHS VARIABLE INSURANCE TRUST MID CAP VALUE FUND
INVESTMENT OBJECTIVE
The Fund seeks long-term capital appreciation.
Portfolio Management Discussion and Analysis
Below, the Goldman Sachs Fundamental Equity U.S. Equity Portfolio Management Team discusses the Goldman Sachs Variable Insurance Trust — Goldman Sachs Mid Cap Value Fund’s (the “Fund”) performance and positioning for the 12-month period ended December 31, 2022 (the “Reporting Period”).
How did the Fund perform during the Reporting Period?
During the Reporting Period, the Fund’s Institutional and Service Shares generated average annual total returns of -9.99% and -10.23%, respectively. These returns compare to the -12.03% average annual total return of the Fund’s benchmark, the Russell Midcap® Value Index (with dividends reinvested) (the “Russell Index”), during the same time period.
What key factors were responsible for the Fund’s performance during the Reporting Period?
The Fund posted negative absolute returns but outperformed the Russell Index on a relative basis during the Reporting Period due to a combination of stock selection and sector allocation decisions overall.
Which equity market sectors most significantly affected Fund performance?
Contributing most positively to the Fund’s relative results during the Reporting Period was effective stock selection in the financials, consumer discretionary and health care sectors. Detracting most from the Fund’s relative results during the Reporting Period were the materials, communication services and consumer staples sectors, wherein stock selection proved especially challenging.
What were some of the Fund’s best-performing individual stocks?
The Fund benefited most relative to the Russell Index from positions in Hess, Devon Energy and Diamondback Energy — each an oil and natural gas exploration and production company within the energy sector.
Early in the Reporting Period, Hess reported a strong fourth quarter 2021 earnings release, with earnings surpassing consensus expectation and capital expenditures well below its previous guidance. Hess also announced several new discoveries in Guyana at the beginning of 2022 and benefited from the operating environment there. Its production was further expanded later in 2022 in what we saw as an efficient manner thanks to further reserve discoveries in Guyana, though its North Dakota operations offset some of that progress. Ultimately, we exited the Fund’s position in Hess to reallocate profits in pursuit of better risk/reward opportunities in the energy sector, as, in our view, the company held up well during the Reporting Period but skewed more growth leaning for a value strategy.
Devon Energy’s fourth quarter 2021 earnings, reported early in the Reporting Period, featured strong results, with earnings and dividends higher than consensus expectations. Further, Devon Energy maintained its focus during the Reporting Period on 2022 production and its industry-leading variable dividend policy. Each of Devon Energy’s earnings reports during the Reporting Period featured results above consensus expectations, largely due to strong production and execution metrics as well as rising energy price dynamics. Our investment thesis continued to revolve around a better than consensus expected variable dividend, increased buybacks and what we considered to be a good line of sight to significant capital returns.
Shares of Diamondback Energy appreciated during the Reporting Period largely due to an increase in commodity prices but was further driven by solid execution, as the company repeatedly surpassed consensus earnings expectations. We exited the Fund’s position in Diamondback Energy, as the company ultimately outgrew the intended market capitalization size for the Fund’s portfolio, and we decided to reallocate the profits to what we viewed as better risk/reward opportunities.
Which stocks detracted significantly from the Fund’s performance during the Reporting Period?
Detracting from the Fund’s results relative to the Russell Index were positions in Ball, MKS Instruments and Expedia Group.
Shares of metal packaging provider Ball came under pressure early in the Reporting Period, with its first quarter earnings per share falling below consensus expectations. The miss was mostly driven by a significant volume decline in its Latin American business due to flooding in the area. Then, its earnings report release in early August 2022 featured surprisingly weak results due to a
GOLDMAN SACHS VARIABLE INSURANCE TRUST MID CAP VALUE FUND
sizeable slowdown in its Americas business, as consumers came under cost pressures. Further, Ball announced the sale of its Russian beverage packaging business following heightened geopolitical tensions, which caused the company to lower its shareholder capital return target. There was a rebound in Ball’s stock in November 2022 thanks to stronger than consensus expected results coming from its North America segment. At the end of the Reporting Period, we believed our longer-term investment thesis for the company remained intact, as we continued to see a multi-year growth story for aluminum products, of which Ball should be a primary beneficiary. Also, its management team remained, in our opinion, best in class, and we believed there was a good line of sight for the business to get back on track in terms of sales volume growth.
MKS Instruments is a provider of instruments and subsystems for manufacturing processes. Its stock traded lower, as the semiconductor industry as a whole showed weakness during the Reporting Period. Still, at the end of the Reporting Period, we continued to view MKS Instruments as a leader in the semiconductor manufacturing process instruments industry and believed its stock depreciation was largely due to multiple, or price/earnings ratio, compression rather than a breakdown of fundamentals. Indeed, the company continued to beat consensus earnings estimates during the Reporting Period. We believed it may well be able to take advantage of secular growth and the overarching theme of onshoring in the months ahead. Thus, we added to the Fund’s position in its stock.
Expedia Group engages in online travel services. The company’s stock price depreciated as investors became what we saw as overly concerned about weaker than consensus expected hotel occupancy rates reflecting reduced market share for the company. Furthermore, Expedia Group leaned into advertising spending even as demand picked up, which gave some investors pause about whether or not the company would continue to expand its margins. Also, concerns about travel demand slowing in the second half of 2022 increased. At the end of the Reporting Period, we believed Expedia Group remained a long-term top competitor, as the company benefits, in our view, from its increase in speed of innovation for travelers and its efficiency as a company. We were also optimistic, as Expedia Group was focused on building long-term value customers and building out new tools for customers.
How did the Fund use derivatives and similar instruments during the Reporting Period?
During the Reporting Period, we did not use derivatives as part of an active management strategy.
Did the Fund make any significant purchases or sales during the Reporting Period?
We initiated a Fund position in Steel Dynamics, which is engaged in the manufacture of steel products and metal recycling. Relative to other commodities within the materials sector, we believe the odds of a longer than consensus expected steel cycle have been moving upward. We view the company as being in an advantaged position relative to global prices and able to price its products effectively given import/export dynamics.
We established a Fund position in financial services and stock exchange operating company NASDAQ. We are optimistic about the company, as, in our view, it has made progress in its strategic pivot towards more recurring data, analytics and software-as-a-service-based services, driving growth both organically and through acquisitions. We believe the company, at the time of purchase, was trading at an attractive valuation relative to its peers, and we believe NASDAQ has the potential to perform well over the long term.
Conversely, in addition to the sales already mentioned, we exited the Fund’s position in semiconductor manufacturer Marvell Technology during the Reporting Period. On the back of stronger than consensus anticipated earnings and performance compared with those companies with exposure to the autos and industrial end-markets, we decided to realize some of the gains from Marvell Technology and reallocate the proceeds to what we viewed as investments with more attractive risk/reward profiles.
We sold the Fund’s position in Advance Auto Parts during the Reporting Period. Overall, automotive aftermarket retail names held up relatively well during the Reporting Period. The auto parts retail industry has traditionally been viewed as a safe haven within retail during times of high inflation, but elevated gas prices have depressed multiples, or price/earnings ratios, during the Reporting Period. We ultimately decided to exit the position in favor of names with what we saw as better risk/reward opportunity.
Were there any notable changes in the Fund’s weightings during the Reporting Period?
In constructing the Fund’s portfolio, we focus on picking stocks rather than on making industry or sector bets. We seek to outpace the benchmark index by overweighting stocks that we expect to outperform and underweighting those that we think may lag. Consequently, changes in its sector weights are generally the direct result of individual stock selection or of stock appreciation or depreciation. That said, during the Reporting Period, the Fund’s exposure to materials increased and its exposure to energy, industrials and utilities decreased compared to the Russell Index.
GOLDMAN SACHS VARIABLE INSURANCE TRUST MID CAP VALUE FUND
How was the Fund positioned relative to its benchmark index at the end of the Reporting Period?
At the end of December 2022, the Fund had overweighted positions relative to the Russell Index in materials, industrials and health care. On the same date, the Fund had underweighted positions compared to the Russell Index in financials, energy, communication services, real estate and consumer discretionary and was rather neutrally weighted to the Russell Index in consumer staples, information technology and utilities.
Were there any changes to the Fund’s portfolio management team during the Reporting Period?
There were no changes to the Fund’s portfolio management team during the Reporting Period.
What is the Fund’s tactical view and strategy for the months ahead?
At the end of 2022, we believed the primary focus of the U.S. equity market in the months ahead would be on whether the U.S. economy will tip into a recession or not. The Fed’s devotion to a higher-for-longer policy fueled concerns it may overtighten monetary policy and prompt a recession. Despite this backdrop of heightened uncertainty, we expected it to become clear by early 2023 if inflation is decelerating and will or will not lead the Fed to eventually cease tightening. While supply-chain disruptions should ease, in our view, as COVID-19-related restrictions and shortages fade out, pressures of digitization, deglobalization and geopolitical destabilization are likely, we feel, to endure for some time. In our opinion, companies will need to continue coping with wage pressures, higher input pricing and potential demand fluctuations if the U.S. consumer becomes less resilient.
Regardless of market direction, we intend to stay true to our quality-first investment approach and seek to invest in businesses with healthy balance sheets, relatively stable cash flows and differentiated business models aligned to secular tailwinds. We continue to test our models and re-evaluate our assumptions with increasing information, remain focused on the long-term investment horizon and believe this fundamental approach can generate added value in the long run. As always, we maintain our focus on undervalued companies that we believe have comparatively greater control of their own destiny, such as innovators with differentiated products, companies with low cost structures or companies that have been investing in their own businesses and may be poised to gain market share.
FUND BASICS
Mid Cap Value Fund
as of December 31, 2022
TOP TEN HOLDINGS AS OF 12/31/221
| | | | | | |
| | |
| Holding | | % of Net Assets | | | Line of Business |
| Motorola Solutions, Inc. | | | 2.2% | | | Technology Hardware & Equipment |
| Zimmer Biomet Holdings, Inc. | | | 2.1 | | | Health Care Equipment & Services |
| Martin Marietta Materials, Inc. | | | 2.0 | | | Materials |
| Cummins, Inc. | | | 2.0 | | | Capital Goods |
| Alexandria Real Estate Equities, Inc. REIT | | | 2.0 | | | Real Estate |
| Ameren Corp. | | | 1.9 | | | Utilities |
| Steel Dynamics, Inc. | | | 1.9 | | | Materials |
| Ball Corp. | | | 1.7 | | | Materials |
| ITT, Inc. | | | 1.7 | | | Capital Goods |
| CMS Energy Corp. | | | 1.7 | | | Utilities |
| 1 | The top 10 holdings may not be representative of the Fund’s future investments. |
FUND vs. BENCHMARK SECTOR ALLOCATIONS2
As of December 31, 2022
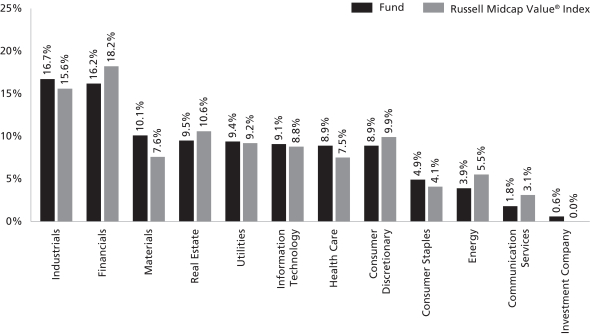
| 2 | The Fund is actively managed and, as such, its composition may differ over time. Consequently, the Fund’s overall sector allocations may differ from percentages contained in the graph above. The graph categorizes investments using Global Industry Classification Standard (“GICS”); however, the sector classifications used by the portfolio management team may differ from GICS. The percentage shown for each investment category reflects the value of investments in that category as a percentage of market value (excluding investments in the securities lending reinvestment vehicle, if any). Underlying sector allocations of exchange traded funds and investment companies held by the Fund are not reflected in the graph above. |
For more information about your Fund, please refer to www.GSAMFUNDS.com. There, you can learn more about your Fund’s investment strategies, holdings, and performance.
GOLDMAN SACHS VARIABLE INSURANCE TRUST MID CAP VALUE FUND
Performance Summary
December 31, 2022
The following graph shows the value, as of December 31, 2022, of a $10,000 investment made on January 1, 2013 in Institutional Shares at NAV. For comparative purposes, the performance of the Fund’s benchmark, the Russell Midcap Value® Index (with distributions reinvested), is shown. Performance reflects applicable fee waivers and/or expense limitations in effect during the periods shown and, in their absence, performance would be reduced. Returns do not reflect the deduction of taxes that a shareholder would pay on Fund distributions or the redemption of Fund shares. The returns set forth below represent past performance. Past performance does not guarantee future results. The Fund’s investment return and principal value will fluctuate so that an investor’s shares, when redeemed, may be worth more or less than their original cost. Current performance may be lower or higher than the performance quoted below. Please visit our web site at www.GSAMFUNDS.com to obtain the most recent month-end returns.
Mid Cap Value Fund’s 10 Year Performance
Performance of a $10,000 investment, with distributions reinvested, from January 1, 2013 through December 31, 2022.
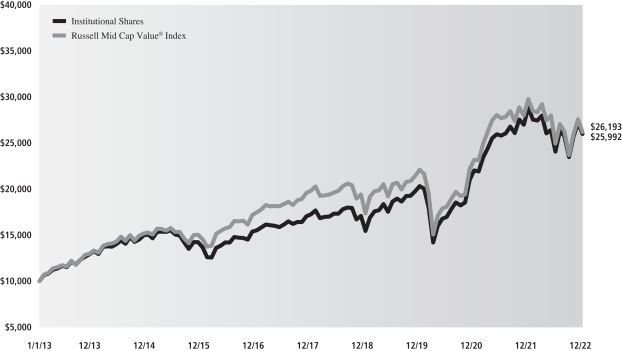
| | | | | | |
| Average Annual Total Return through December 31, 2022 | | One Year | | Five Years | | Ten Years |
Institutional | | -9.99% | | 8.51% | | 10.02% |
Service | | -10.23% | | 8.23% | | 9.74% |
GOLDMAN SACHS VARIABLE INSURANCE TRUST SMALL CAP EQUITY INSIGHTS FUND
INVESTMENT OBJECTIVE
The Fund seeks long-term growth of capital.
Portfolio Management Discussion and Analysis
Below, the Goldman Sachs Quantitative Investment Strategies Team discusses the Goldman Sachs Variable Insurance Trust — Goldman Sachs Small Cap Equity Insights Fund’s (the “Fund”) performance and positioning for the 12-month period ended December 31, 2022 (the “Reporting Period”).
How did the Fund perform during the Reporting Period?
During the Reporting Period, the Fund’s Institutional and Service Shares generated average annual total returns of -19.38% and -19.64%, respectively. These returns compare to the -20.44% average annual total return of the Fund’s benchmark, the Russell 2000® Index (with dividends reinvested) (the “Russell Index”) during the same time period.
What key factors were responsible for the Fund’s performance during the Reporting Period?
The Fund uses a quantitative style of management, in combination with a qualitative overlay, that emphasizes fundamentally-based stock selection, careful portfolio construction and efficient implementation. The Fund’s investments are selected using fundamental research and a variety of quantitative techniques based on certain investment themes, namely Fundamental Mispricings, High Quality Business Models, Sentiment Analysis and Market Themes & Trends.
During the Reporting Period, the Fund outperformed the Russell Index on a relative basis, with all four of our quantitative model’s investment themes contributing positively. Stock selection overall, driven by these investment themes, boosted relative performance.
What impact did the Fund’s investment themes have on performance during the Reporting Period?
In keeping with our investment approach, we use our quantitative model and four investment themes to take a long-term view of market patterns and look for inefficiencies, selecting stocks for the Fund and overweighting or underweighting the ones chosen by the model. Over time and by design, the performance of any one of the model’s investment themes tends to have a low correlation with the model’s other themes, demonstrating the diversification benefit of the Fund’s theme-driven quantitative model. The variance in performance supports our research indicating that the diversification provided by the Fund’s different investment themes is a significant investment advantage over the long term, even though the Fund may experience underperformance in the short term. Of course, diversification does not protect an investor from market risk nor does it ensure a profit.
During the Reporting Period, each of our four investment themes contributed positively to the Fund’s relative performance. High Quality Business Models and Sentiment Analysis bolstered relative results most, followed by Fundamental Mispricings and Market Themes & Trends. High Quality Business Models seeks to identify companies that are generating high quality revenues with sustainable business models and aligned management incentives. Sentiment Analysis seeks to identify stocks experiencing improvements in their overall market sentiment. Fundamental Mispricings seeks to identify high quality businesses trading at a fair price, which we believe may lead to strong performance over the long run. Market Themes & Trends seeks to identify companies positively positioned to benefit from themes and trends in the market and macroeconomic environment.
How did the Fund’s sector and industry allocations affect relative performance?
In constructing the Fund’s portfolio, our quantitative model focuses on stock selection rather than making sector or industry bets. Consequently, the Fund is similar to its benchmark, the Russell Index, in terms of its sector and industry allocations and style. Relative performance is primarily driven by stock selection, not by sector or industry allocations.
Did stock selection help or hurt Fund performance during the Reporting Period?
We seek to outpace the Russell Index by overweighting stocks that we expect to outperform and underweighting those that we think may lag. At the same time, we strive to maintain a risk profile similar to the Russell Index. The Fund’s investments are selected using fundamental research and a variety of quantitative techniques based on our investment themes. For example, the Fund aims to hold a basket of stocks with better Fundamental Mispricings characteristics than the Russell Index.
GOLDMAN SACHS VARIABLE INSURANCE TRUST SMALL CAP EQUITY INSIGHTS FUND
During the Reporting Period, stock selection overall helped. Stock selection in the information technology, industrials and financials sectors contributed the most positively to the Fund’s relative returns during the Reporting Period. Conversely, certain individual stock positions, especially in the utilities, communication services and consumer staples sectors, detracted from the Fund’s relative returns.
Which individual stock positions contributed the most to the Fund’s relative returns during the Reporting Period?
The Fund benefited most from overweight positions in oil and gas exploration and production companies Range Resources and Antero Resources and in gasoline and convenience merchandise retailer Murphy USA. The overweight in Range Resources was established predominantly due to our Market Themes & Trends and High Quality Business Models investment themes. The Fund was overweight Antero Resources largely because of our Sentiment Analysis and Market Themes & Trends investment themes. The overweight in Murphy USA was driven by our High Quality Business Models and Market Themes & Trends investment themes.
Which individual positions detracted from the Fund’s results during the Reporting Period?
Detracting most from the Fund’s results relative to the Russell Index were overweight positions in insurance company Goosehead Insurance, enzyme engineering company Codexis and data security and analytics solutions provider Rapid7. The overweight in Goosehead Insurance was established primarily as a result of our Fundamental Mispricings investment theme. The Fund was overweight Codexis largely because of our Sentiment Analysis investment theme. The Fund’s overweight in Rapid7 was driven primarily by our High Quality Business Models investment theme.
How did the Fund use derivatives during the Reporting Period?
During the Reporting Period, we used equity index futures contracts, on an opportunistic basis, to equitize the Fund’s cash holdings. In other words, we put the Fund’s cash holdings to work by using them as collateral for the purchase of futures contracts. The use of these derivatives did not have a material impact on the Fund’s performance during the Reporting Period.
Did you make any enhancements to your quantitative models during the Reporting Period?
We continuously look for ways to improve our investment process. During the first half of the Reporting Period, we enhanced a signal within our Market Themes & Trends investment theme. We believe that patterns exist in the market, and thus the past can provide an indication of market cycles and their effect on future market states. We enhanced this signal to give it more predictive power in terms of identifying and assessing similarities in returns between current and previous market environments.
During the second half of the Reporting Period, we introduced several new signals into our models. For example, we introduced a couple of new signals within our Sentiment Analysis investment theme. The first enhancement implemented aims to improve our sentiment identification in earnings call reports by utilizing many of the latest developments in machine learning and natural language processing. The second signal introduced in the U.S. region aims to capitalize upon price dislocations that are caused by uninformed exchange-traded fund trading. Finally, we introduced two new signals within our Market Themes & Trends investment theme. The first signal leverages advanced machine learning algorithms to capture nuanced behavior of our existing suite of more than a hundred alpha factors. The second signal aims to apply natural language processing techniques to account for fine-grained linguistic meaning of documents when quantifying company linkages for text-based cross-stock momentum factors.
What was the Fund’s sector positioning relative to its benchmark index at the end of the Reporting Period?
As of December 31, 2022, the Fund was overweight the information technology and energy sectors relative to the Russell Index. The Fund was underweight utilities and industrials and was rather neutrally weighted in financials, health care, consumer discretionary, communication services, materials, real estate and consumer staples compared to the Russell Index on the same date.
Were there any changes to the Fund’s portfolio management team during the Reporting Period?
There were no changes to the Fund’s portfolio management team during the Reporting Period.
What is your strategy going forward for the Fund?
Looking ahead, we continue to believe that less expensive stocks should outpace more expensive stocks, and stocks with good momentum are likely to outperform those with poor momentum. We intend to maintain our focus on seeking companies about which fundamental research analysts are becoming more positive as well as profitable companies with sustainable earnings and a track record of using their capital to enhance shareholder value. As such, we anticipate remaining fully invested with long-term performance likely to be the result of stock selection rather than sector or capitalization allocations.
GOLDMAN SACHS VARIABLE INSURANCE TRUST SMALL CAP EQUITY INSIGHTS FUND
We stand behind our investment philosophy that sound economic investment principles, coupled with a disciplined quantitative approach, can provide strong, uncorrelated returns over the long term. Our research agenda is robust, and we continue to enhance our existing models, add new proprietary forecasting signals and improve our trading execution as we seek to provide the most value to our shareholders.
FUND BASICS
Small Cap Equity Insights Fund
as of December 31, 2022
TOP TEN HOLDINGS AS OF 12/31/221,2
| | | | | | |
| | |
| Holding | | % of Net Assets | | | Line of Business |
| Murphy USA, Inc. | | | 0.9% | | | Retailing |
| Atkore, Inc. | | | 0.8 | | | Capital Goods |
| American Equity Investment Life Holding Co. | | | 0.8 | | | Insurance |
| STAG Industrial, Inc. REIT | | | 0.8 | | | Real Estate |
| Alkermes PLC | | | 0.8 | | | Pharmaceuticals, Biotechnology & Life Sciences |
| Maximus, Inc. | | | 0.8 | | | Software & Services |
| Magnolia Oil & Gas Corp., Class A | | | 0.7 | | | Energy |
| CNO Financial Group, Inc. | | | 0.7 | | | Insurance |
| Encore Wire Corp. | | | 0.7 | | | Capital Goods |
| Mueller Industries, Inc. | | | 0.7 | | | Capital Goods |
| 1 | The top 10 holdings may not be representative of the Fund’s future investments. |
| 2 | The Fund’s overall top ten holdings differ from the table above due to the exclusion of the Goldman Sachs Financial Square Government Fund (a short-term investment fund) which represents 0.8% of the Fund’s net assets as of December 31, 2022. |
FUND BASICS
FUND VS. BENCHMARK SECTOR ALLOCATIONS3
As of December 31, 2022
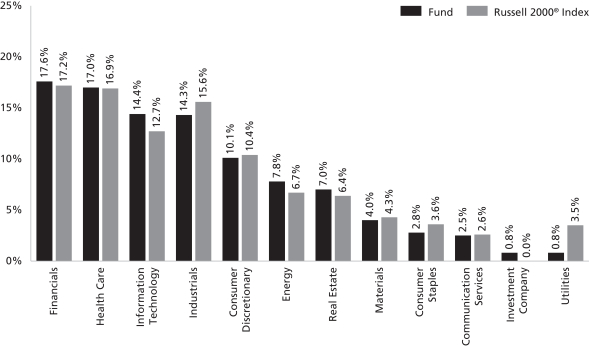
| 3 | The Fund is actively managed and, as such, its composition may differ over time. Consequently, the Fund’s overall sector allocations may differ from percentages contained in the graph above. The graph categorizes investments using Global Industry Classification Standard (“GICS”); however, the sector classifications used by the portfolio management team may differ from GICS. The percentage shown for each investment category reflects the value of investments in that category as a percentage of market value (excluding investments in the securities lending reinvestment vehicle, if any). Underlying sector allocations of exchange traded funds and investment companies held by the Fund are not reflected in the graph above. Investments in the securities lending reinvestment vehicle represented 0.9% of the Fund’s net assets at December 31, 2022. The graph depicts the Fund’s investments but may not represent the Fund’s market exposure due to the exclusion of certain derivatives, if any, as listed in the Additional Investment Information section of the Schedule of Investments. |
For more information about your Fund, please refer to www.GSAMFUNDS.com. There, you can learn more about your Fund’s investment strategies, holdings, and performance.
GOLDMAN SACHS VARIABLE INSURANCE TRUST SMALL CAP EQUITY INSIGHTS FUND
Performance Summary
December 31, 2022
The following graph shows the value, as of December 31, 2022, of a $10,000 investment made on January 1, 2013 in Institutional Shares at NAV. For comparative purposes, the performance of the Fund’s benchmark, the Russell 2000® Index (with distributions reinvested), is shown. Performance reflects applicable fee waivers and/or expense limitations in effect during the periods shown and, in their absence, performance would be reduced. Returns do not reflect the deduction of taxes that a shareholder would pay on Fund distributions or the redemption of Fund shares. The returns set forth below represent past performance. Past performance does not guarantee future results. The Fund’s investment return and principal value will fluctuate so that an investor’s shares, when redeemed, may be worth more or less than their original cost. Current performance may be lower or higher than the performance quoted below. Please visit our web site at www.GSAMFUNDS.com to obtain the most recent month-end returns.
Small Cap Equity Insights Fund’s 10 Year Performance
Performance of a $10,000 investment, with distributions reinvested, from January 1, 2013 through December 31, 2022.
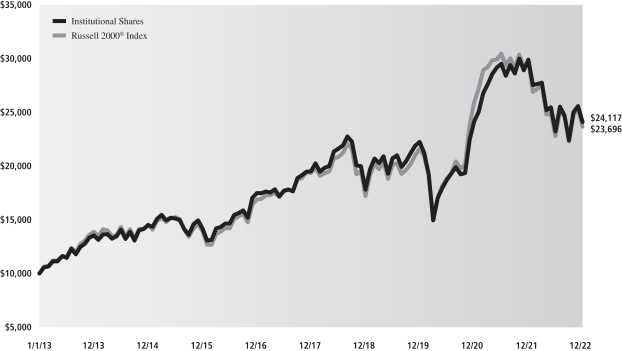
| | | | | | |
| Average Annual Total Return through December 31, 2022 | | One Year | | Five Years | | Ten Years |
Institutional | | -19.38% | | 4.33% | | 9.20% |
Service | | -19.64% | | 4.07% | | 8.93% |
GOLDMAN SACHS VARIABLE INSURANCE TRUST STRATEGIC GROWTH FUND
INVESTMENT OBJECTIVE
The Fund seeks long-term growth of capital.
Portfolio Management Discussion and Analysis
Below, the Goldman Sachs Fundamental Equity U.S. Equity Portfolio Management Team discusses the Goldman Sachs Variable Insurance Trust — Goldman Sachs Strategic Growth Fund’s (the “Fund”) performance and positioning for the 12-month period ended December 31, 2022 (the “Reporting Period”).
How did the Fund perform during the Reporting Period?
During the Reporting Period, the Fund’s Institutional and Service Shares generated average annual total returns of -32.52% and -32.68%, respectively. These returns compare to the -29.14% average annual total return of the Fund’s benchmark, the Russell 1000® Growth Index (with dividends reinvested) (the “Russell Index”), during the same time period.
What key factors were responsible for the Fund’s performance during the Reporting Period?
The Fund generated double-digit negative absolute returns that underperformed the Russell Index on a relative basis during the Reporting Period. Stock selection overall detracted most from the Fund’s relative results. Sector allocation as a whole also detracted, albeit modestly.
Which equity market sectors most significantly affected Fund performance?
Detracting most from the Fund’s relative results during the Reporting Period was weak stock selection in the information technology and communication services sectors. Having no allocation to energy, which was, by far, the strongest performing sector in the Russell Index during the Reporting Period, also hurt. Partially offsetting these detractors was effective stock selection in the health care, materials and financials sectors, which contributed positively to relative results during the Reporting Period. Having an overweighted allocation to health care, which posted negative absolute returns but significantly outperformed the Russell Index during the Reporting Period, also helped.
Which stocks detracted significantly from the Fund’s performance during the Reporting Period?
Detracting from the Fund’s results relative to the Russell Index were positions in Netflix, Marvell Technology and PayPal Holdings.
Shares of entertainment content streaming company Netflix declined in January 2022 on a disappointing miss on subscriber numbers in the fourth quarter of 2021, and the company cut its first quarter 2022 guidance for customer additions, as streaming competition became more intense. We exited the Fund’s position in Netflix during the second calendar quarter. While we continued to like the company, we saw some near-term headwinds facing the business, such as increased competition and macroeconomic pressures. We sold the Fund position in favor of what we considered to be better risk/reward profiles, but we intend to keep monitoring the name for a longer-term opportunity.
Semiconductor manufacturer Marvell Technology noted supply-chain concerns were a primary cause of enterprise networking weakness during the second quarter of 2022. In addition, risks associated with unfulfilled backlog continued as demand outpaced supply. The need for greater working capital investments to support faster growth limited the company’s free cash flow generation in the short term, in our opinion. In October 2022, the company’s share price depreciated again. No company-specific news caused the stock price to drop, but instead, the chips sector as a group faced considerably weaker demand, driven by high inflation, rising interest rates and geopolitical tensions. Top chip-producing companies, such as Samsung and Advanced Micro Devices, released discouraging preliminary results early in the month, which instilled fears that the semiconductor demand slump could be worse than consensus expected and drove forecasts down throughout the industry. At the end of the Reporting Period, we maintained a positive outlook on Marvell Technology given its management’s history of execution and the company’s exposure to structural growth trends in cloud, autos and fifth-generation technologies.
Digital payments platform provider PayPal Holdings saw its share price decline in January 2022 following the company’s fourth quarter 2021 earnings announcement, wherein it issued disappointing forward guidance amid supply-chain issues, inflation, labor shortages and weaker consumer sentiment. In August 2022, the company’s share price began to rebound on the back of cooler inflation data, a strong second calendar quarter earnings beat of consensus expectations, and the announcement of its launch of a
GOLDMAN SACHS VARIABLE INSURANCE TRUST STRATEGIC GROWTH FUND
share buyback policy. However, PayPal Holdings ultimately returned its gains in September 2022 due to its European/UK exposure, missteps in discretionary spending and headlines regarding its new policy to fine customers for spreading misinformation. At the end of the Reporting Period, we maintained our view that PayPal Holdings contains the resources and capabilities to expand its active customer base as it prioritizes user engagement and operational efficiency.
What were some of the Fund’s best-performing individual stocks?
Among those stocks the Fund benefited most from relative to the Russell Index were positions in Eli Lilly and Company, Boston Scientific and Ross Stores.
Eli Lilly and Company engages in the discovery, development, manufacturing and sale of pharmaceutical products. In April 2022, the company’s stock appreciated as a result of reporting a strong earnings beat of consensus expectations for the first calendar quarter as well as positive obesity trial data. During the second quarter of 2022, the company’s shares rose as there were several positive pipeline developments, and all of its key products performed well with the then-most recent results coming in ahead of consensus expectations. In addition, positive momentum continued regarding the company’s drug pipeline and product development. At the end of the Reporting Period, we continued to view Eli Lilly and Company as one of the fastest growing pharmaceutical companies with no major patent concerns until 2030 and a robust new product pipeline with multi-billion-dollar potential opportunities ahead.
Boston Scientific develops, manufactures and markets medical devices used in interventional medical specialties. The company’s share price appreciated throughout the Reporting Period due, in our view, to its ability to deliver earnings beats of consensus expectations in each quarter. Additionally, Boston Scientific was the only medical device company to exceed consensus earnings expectations during the second calendar quarter. In our view at the end of the Reporting Period, Boston Scientific remained a category leader in each of the seven markets in which it operates, and the company continues to innovate and have a strong new product cycle. At the end of the Reporting Period, we believed the company would continue to expand its separation from its peer group going forward.
Off-price apparel and home accessories retailer Ross Stores performed well during the Reporting Period overall. Its second quarter 2022 earnings results were mixed, with a miss on gross margin estimates, driven by higher price markdowns. But Ross Stores still managed to surpass earnings per share consensus expectations thanks to a better earnings before interest and taxes margin. Its management continued to cite ample inventory levels, which proved favorable, as many consumers began trading down to cheaper alternatives given the anticipated market environment of the months ahead. During the fourth quarter of 2022, the company’s stock appreciated on the back of a significant earnings beat of consensus expectations and raised its guidance. The company also reported cleaner inventories relative to its peers and cited that logistics costs had already reached their peak and started to come down. At the end of the Reporting Period, we continued to like the off-price retail industry as our favored way to maintain defensive retail exposure as we head into 2023.
How did the Fund use derivatives and similar instruments during the Reporting Period?
During the Reporting Period, we did not use derivatives as part of an active management strategy.
Did the Fund make any significant purchases or sales during the Reporting Period?
We initiated a position in health care and insurance company UnitedHealth Group during the Reporting Period. We believe the company is likely to benefit from its recent acquisition of health care provider EMIS, as it should provide synergy opportunities and increase product exposure in the U.K. We also believe in the robust growth strategy of UnitedHealth Group’s Optum unit, a diversified health services company, as it has generated strong double-digit sales and provides geographical diversification. Overall, we are constructive on the managed care organization portion of the health care sector and believe UnitedHealth Group is well positioned as it has continued to execute ahead of consensus expectations.
We established a Fund position in consumer staples giant Procter & Gamble. The company’s focus on driving product category growth has brought about further market share for Procter & Gamble, and many of its products are considered relatively inelastic, making consumers less sensitive to potential price increases.
Conversely, in addition to the sale of Netflix, mentioned earlier, we exited the Fund’s position in social media and Facebook parent company Meta Platforms during the Reporting Period. The company has struggled with macroeconomic headwinds, as rising interest rates and inflation have impacted its profitability. In response, the firm strategically froze hiring and cut expenses for the near future to preserve operating profit. Despite its capital intensive investments within the metaverse space, we ultimately decided to sell the position in favor of what we saw as better risk/reward opportunities.
GOLDMAN SACHS VARIABLE INSURANCE TRUST STRATEGIC GROWTH FUND
Were there any notable changes in the Fund’s weightings during the Reporting Period?
In constructing the Fund’s portfolio, we focus on picking stocks rather than on making industry or sector bets. We seek to outpace the benchmark index by overweighting stocks that we expect to outperform and underweighting those that we think may lag. Consequently, changes in its sector weights are generally the direct result of individual stock selection or of stock appreciation or depreciation. That said, during the Reporting Period, the Fund’s exposure to consumer discretionary, health care, information technology and materials increased compared to the Russell Index. The Fund’s allocations compared to the Russell Index in communication services and industrials decreased.
How was the Fund positioned relative to its benchmark index at the end of the Reporting Period?
At the end of December 2022, the Fund had overweighted positions relative to the Russell Index in the health care and materials sectors. On the same date, the Fund had underweighted positions compared to the Russell Index in industrials, financials, information technology and communication services and was rather neutrally weighted to the Russell Index in consumer discretionary, consumer staples and real estate. The Fund had no exposure to the utilities and energy sectors at the end of the Reporting Period.
Were there any changes to the Fund’s portfolio management team during the Reporting Period?
There were no changes to the Fund’s portfolio management team during the Reporting Period.
What is the Fund’s tactical view and strategy for the months ahead?
At the end of 2022, we believed the primary focus of the U.S. equity market in the months ahead would be on whether the U.S. economy will tip into a recession or not. The Fed’s devotion to a higher-for-longer policy fueled concerns it may overtighten monetary policy and prompt a recession. Despite this backdrop of heightened uncertainty, we expected it to become clear by early 2023 if inflation is decelerating and will or will not lead the Fed to eventually cease tightening. While supply-chain disruptions should ease, in our view, as COVID-19-related restrictions and shortages fade out, pressures of digitization, deglobalization and geopolitical destabilization are likely, we feel, to endure for some time. In our opinion, companies will need to continue coping with wage pressures, higher input pricing and potential demand fluctuations if the U.S. consumer becomes less resilient.
Regardless of market direction, we intend to stay true to our quality-first investment approach and seek to invest in businesses with healthy balance sheets, relatively stable cash flows and differentiated business models aligned to secular tailwinds. We continue to test our models and re-evaluate our assumptions with increasing information, remain focused on the long-term investment horizon and believe this fundamental approach can generate added value in the long run. As always, we maintain our focus on seeking companies that we believe will generate long-term growth in today’s ever-changing market conditions.
FUND BASICS
Strategic Growth Fund
as of December 31, 2022
TOP TEN HOLDINGS AS OF 12/31/221
| | | | | | |
| | |
| Holding | | % of Net Assets | | | Line of Business |
| Microsoft Corp. | | | 11.1% | | | Software & Services |
| Apple, Inc. | | | 10.5 | | | Technology Hardware & Equipment |
| Amazon.com, Inc. | | | 5.0 | | | Retailing |
| NVIDIA Corp. | | | 3.5 | | | Semiconductors & Semiconductor Equipment |
| Mastercard, Inc., Class A | | | 3.1 | | | Software & Services |
| UnitedHealth Group, Inc. | | | 2.9 | | | Health Care Equipment & Services |
| Eli Lilly & Co. | | | 2.5 | | | Pharmaceuticals, Biotechnology & Life Sciences |
| Alphabet, Inc., Class C | | | 2.5 | | | Media & Entertainment |
| Alphabet, Inc., Class A | | | 2.4 | | | Media & Entertainment |
| Procter & Gamble Co. (The) | | | 2.0 | | | Household & Personal Products |
| 1 | The top 10 holdings may not be representative of the Fund’s future investments. |
FUND BASICS
FUND vs. BENCHMARK SECTOR ALLOCATIONS2
As of December 31, 2022
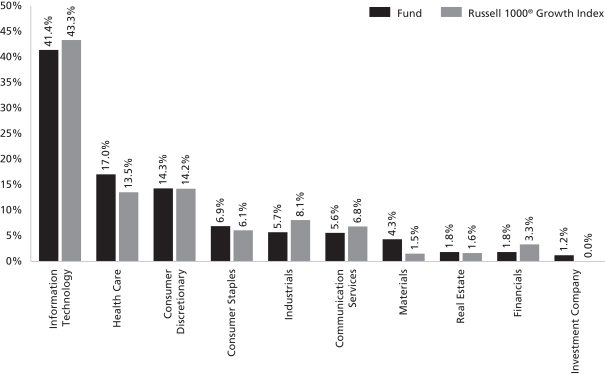
| 2 | The Fund is actively managed and, as such, its composition may differ over time. Consequently, the Fund’s overall sector allocations may differ from percentages contained in the graph above. The graph categorizes investments using Global Industry Classification Standard (“GICS”); however, the sector classifications used by the portfolio management team may differ from GICS. The percentage shown for each investment category reflects the value of investments in that category as a percentage of market value (excluding investments in the securities lending reinvestment vehicle, if any). Underlying sector allocations of exchange traded funds and investment companies held by the Fund are not reflected in the graph above. |
For more information about your Fund, please refer to www.GSAMFUNDS.com. There, you can learn more about your Fund’s investment strategies, holdings, and performance.
GOLDMAN SACHS VARIABLE INSURANCE TRUST STRATEGIC GROWTH FUND
Performance Summary
December 31, 2022
The following graph shows the value, as of December 31, 2022, of a $10,000 investment made on January 1, 2013 in Service Shares at NAV. For comparative purposes, the performance of the Fund’s benchmark, the Russell 1000® Growth Index (with distributions reinvested), is shown. Performance reflects applicable fee waivers and/or expense limitations in effect during the periods shown and, in their absence, performance would be reduced. Returns do not reflect the deduction of taxes that a shareholder would pay on Fund distributions or the redemption of Fund shares. The returns set forth below represent past performance. Past performance does not guarantee future results. The Fund’s investment return and principal value will fluctuate so that an investor’s shares, when redeemed, may be worth more or less than their original cost. Current performance may be lower or higher than the performance quoted below. Please visit our web site at www.GSAMFUNDS.com to obtain the most recent month-end returns.
Strategic Growth Fund’s 10 Year Performance
Performance of a $10,000 investment, with distributions reinvested, from January 1, 2013 through December 31, 2022.
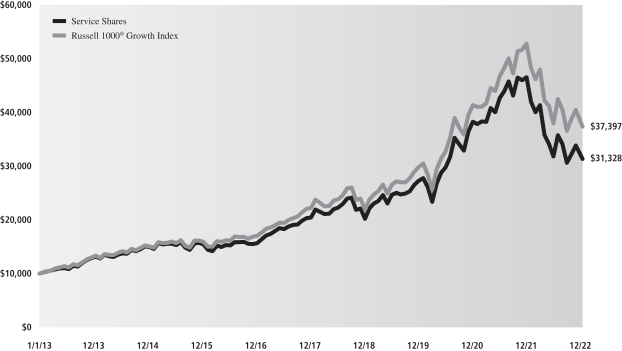
| | | | | | |
| Average Annual Total Return through December 31, 2022 | | One Year | | Five Years | | Ten Years |
Institutional | | -32.52% | | 9.16% | | 12.38% |
Service | | -32.68% | | 8.89% | | 12.09% |
GOLDMAN SACHS VARIABLE INSURANCE TRUST U.S. EQUITY INSIGHTS FUND
INVESTMENT OBJECTIVE
The Fund seeks long-term growth of capital and dividend income.
Portfolio Management Discussion and Analysis
Below, the Goldman Sachs Quantitative Investment Strategies Team discusses the Goldman Sachs Variable Insurance Trust — Goldman Sachs U.S. Equity Insights Fund’s (the “Fund”) performance and positioning for the 12-month period ended December 31, 2022 (the “Reporting Period”).
How did the Fund perform during the Reporting Period?
During the Reporting Period, the Fund’s Institutional and Service Shares generated average annual total returns of -19.74% and -19.90%, respectively. These returns compare to the -18.11% average annual total return of the Fund’s benchmark, the Standard & Poor’s 500® Index (with dividends reinvested) (the “S&P 500® Index”) during the same time period.
What key factors were responsible for the Fund’s performance during the Reporting Period?
The Fund uses a quantitative style of management, in combination with a qualitative overlay, that emphasizes fundamentally-based stock selection, careful portfolio construction and efficient implementation. The Fund’s investments are selected using fundamental research and a variety of quantitative techniques based on certain investment themes, namely Fundamental Mispricings, High Quality Business Models, Sentiment Analysis and Market Themes & Trends.
During the Reporting Period, the Fund underperformed the S&P 500® Index on a relative basis, with all four of our quantitative model’s investment themes detracting from results. Stock selection overall, driven by these investment themes, also dampened relative performance.
What impact did the Fund’s investment themes have on performance during the Reporting Period?
In keeping with our investment approach, we use our quantitative model and four investment themes to take a long-term view of market patterns and look for inefficiencies, selecting stocks for the Fund and overweighting or underweighting the ones chosen by the model. Over time and by design, the performance of any one of the model’s investment themes tends to have a low correlation with the model’s other themes, demonstrating the diversification benefit of the Fund’s theme-driven quantitative model. The variance in performance supports our research indicating that the diversification provided by the Fund’s different investment themes is a significant investment advantage over the long term, even though the Fund may experience underperformance in the short term. Of course, diversification does not protect an investor from market risk nor does it ensure a profit.
During the Reporting Period, all four of our investment themes detracted from the Fund’s relative performance, with Sentiment Analysis hurting most, followed at some distance by Market Themes & Trends, Fundamental Mispricings and High Quality Business Models. Sentiment Analysis seeks to identify stocks experiencing improvements in their overall market sentiment. Market Themes & Trends seeks to identify companies positively positioned to benefit from themes and trends in the market and macroeconomic environment. Fundamental Mispricings seeks to identify high quality businesses trading at a fair price, which we believe may lead to strong performance over the long run. High Quality Business Models seeks to identify companies that are generating high quality revenues with sustainable business models and aligned management incentives.
How did the Fund’s sector and industry allocations affect relative performance?
In constructing the Fund’s portfolio, our quantitative model focuses on stock selection rather than making sector or industry bets. Consequently, the Fund is similar to its benchmark, the S&P 500® Index, in terms of its sector and industry allocations and style. Relative performance is primarily driven by stock selection, not by sector or industry allocations.
Did stock selection help or hurt Fund performance during the Reporting Period?
We seek to outpace the S&P 500® Index by overweighting stocks that we expect to outperform and underweighting those that we think may lag. At the same time, we strive to maintain a risk profile similar to the S&P 500® Index. The Fund’s investments are selected using fundamental research and a variety of quantitative techniques based on our investment themes. For example, the Fund aims to hold a basket of stocks with better Fundamental Mispricings characteristics than the benchmark index.
GOLDMAN SACHS VARIABLE INSURANCE TRUST U.S. EQUITY INSIGHTS FUND
During the Reporting Period, stock selection detracted from the Fund’s performance, with investments in the energy, real estate and financials sectors hurting most relative to the S&P 500® Index. Stock selection in the health care, information technology and materials sectors contributed positively to the Fund’s results relative to the S&P 500® Index during the Reporting Period.
Which individual positions detracted from the Fund’s results during the Reporting Period?
Detracting most from the Fund’s results relative to the S&P 500® Index were underweight positions in integrated energy companies Exxon Mobil and Chevron and an overweight position in social media behemoth and Facebook parent company Meta Platforms. The Fund had an underweight position in Exxon Mobil based primarily on our Sentiment Analysis and Market Themes & Trends investment themes. The Fund’s underweight in Chevron was due to our Sentimental Analysis, Fundamental Mispricings and Market Themes & Trends investment themes. The overweight in Meta Platforms was established primarily because of our Sentiment Analysis and High Quality Business Models investment themes.
Which individual stock positions contributed the most to the Fund’s relative returns during the Reporting Period?
The Fund benefited most from an underweight position in Google parent company Alphabet and from overweight positions in biopharmaceutical company Gilead Sciences and agricultural products producer and processor Archer-Daniels-Midland. The underweight in Alphabet was established primarily because of our High Quality Business Models investment theme. The Fund was overweight Gilead Sciences due mostly to our Sentiment Analysis investment theme. The Fund’s overweight in Archer-Daniels-Midland was driven primarily by our Market Themes & Trends investment theme.
How did the Fund use derivatives during the Reporting Period?
During the Reporting Period, we used equity index futures contracts, on an opportunistic basis, to equitize the Fund’s cash holdings. In other words, we put the Fund’s cash holdings to work by using them as collateral for the purchase of futures contracts. The use of these derivatives did not have a material impact on the Fund’s performance during the Reporting Period.
Did you make any enhancements to your quantitative models during the Reporting Period?
We continuously look for ways to improve our investment process. During the first half of the Reporting Period, we enhanced a signal within our Market Themes & Trends investment theme. We believe that patterns exist in the market, and thus the past can provide an indication of market cycles and their effect on future market states. We enhanced this signal to give it more predictive power in terms of identifying and assessing similarities in returns between current and previous market environments.
During the second half of the Reporting Period, we introduced several new signals into our models. For example, we introduced a couple of new signals within our Sentiment Analysis investment theme. The first enhancement implemented aims to improve our sentiment identification in earnings call reports by utilizing many of the latest developments in machine learning and natural language processing. The second signal introduced in the U.S. region aims to capitalize upon price dislocations that are caused by uninformed exchange-traded fund trading. Finally, we introduced two new signals within our Market Themes & Trends investment theme. The first signal leverages advanced machine learning algorithms to capture nuanced behavior of our existing suite of more than a hundred alpha factors. The second signal aims to apply natural language processing techniques to account for fine-grained linguistic meaning of documents when quantifying company linkages for text-based cross-stock momentum factors.
What was the Fund’s sector positioning relative to its benchmark index at the end of the Reporting Period?
As of December 31, 2022, the Fund was overweight the health care, real estate, industrials and information technology sectors relative to the S&P 500® Index. The Fund was underweight utilities, consumer staples, communication services and consumer discretionary and was rather neutrally weighted in materials, financials and energy compared to the benchmark index on the same date.
Were there any changes to the Fund’s portfolio management team during the Reporting Period?
There were no changes to the Fund’s portfolio management team during the Reporting Period.
What is your strategy going forward for the Fund?
Looking ahead, we continue to believe that less expensive stocks should outpace more expensive stocks, and stocks with good momentum are likely to outperform those with poor momentum. We intend to maintain our focus on seeking companies about which fundamental research analysts are becoming more positive as well as profitable companies with sustainable earnings and a track record of using their capital to enhance shareholder value. As such, we anticipate remaining fully invested with long-term performance likely to be the result of stock selection rather than sector or capitalization allocations.
GOLDMAN SACHS VARIABLE INSURANCE TRUST U.S. EQUITY INSIGHTS FUND
We stand behind our investment philosophy that sound economic investment principles, coupled with a disciplined quantitative approach, can provide strong, uncorrelated returns over the long term. Our research agenda is robust, and we continue to enhance our existing models, add new proprietary forecasting signals and improve our trading execution as we seek to provide the most value to our shareholders.
FUND BASICS
U.S. Equity Insights Fund
as of December 31, 2022
TOP TEN HOLDINGS AS OF 12/31/221
| | | | | | |
| | |
| Holding | | % of Net Assets | | | Line of Business |
| Apple, Inc. | | | 5.1% | | | Technology Hardware & Equipment |
| Microsoft Corp. | | | 4.6 | | | Software & Services |
| Amazon.com, Inc. | | | 3.3 | | | Retailing |
| Johnson & Johnson | | | 2.5 | | | Pharmaceuticals, Biotechnology & Life Sciences |
| Alphabet, Inc., Class C | | | 2.2 | | | Media & Entertainment |
| Berkshire Hathaway, Inc., Class B | | | 2.1 | | | Diversified Financials |
| Adobe, Inc. | | | 1.6 | | | Software & Services |
| Union Pacific Corp. | | | 1.5 | | | Transportation |
| Cisco Systems, Inc. | | | 1.5 | | | Technology Hardware & Equipment |
| Elevance Health, Inc. | | | 1.5 | | | Health Care Equipment & Services |
| 1 | The top 10 holdings may not be representative of the Fund’s future investments. |
FUND BASICS
FUND vs. BENCHMARK SECTOR ALLOCATIONS2
As of December 31, 2022
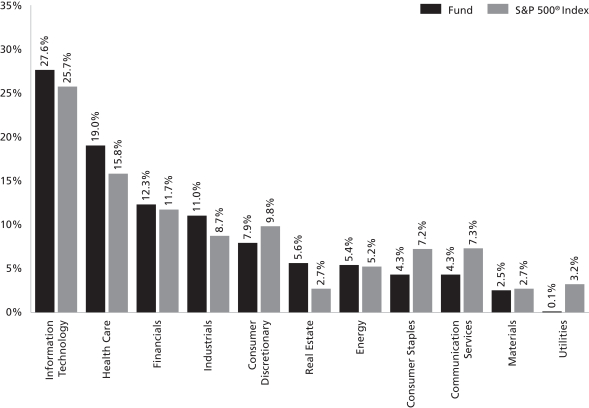
| 2 | The Fund is actively managed and, as such, its composition may differ over time. Consequently, the Fund’s overall sector allocations may differ from percentages contained in the graph above. The graph categorizes investments using Global Industry Classification Standard (“GICS”); however, the sector classifications used by the portfolio management team may differ from GICS. The percentage shown for each investment category reflects the value of investments in that category as a percentage of market value. |
For more information about your Fund, please refer to www.GSAMFUNDS.com. There, you can learn more about your Portfolio’s investment strategies, holdings, and performance.
GOLDMAN SACHS VARIABLE INSURANCE TRUST U.S. EQUITY INSIGHTS FUND
Performance Summary
December 31, 2022
The following graph shows the value, as of December 31, 2022, of a $10,000 investment made on January 1, 2013 in Institutional Shares at NAV. For comparative purposes, the performance of the Fund’s benchmark, the S&P 500® Index, is shown. Performance reflects applicable fee waivers and/or expense limitations in effect during the periods shown and, in their absence, performance would be reduced. Returns do not reflect the deduction of taxes that a shareholder would pay on Fund distributions or the redemption of Fund shares. The returns set forth below represent past performance. Past performance does not guarantee future results. The Fund’s investment return and principal value will fluctuate so that an investor’s shares, when redeemed, may be worth more or less than their original cost. Current performance may be lower or higher than the performance quoted below. Please visit our web site at www.GSAMFUNDS.com to obtain the most recent month-end returns.
U.S. Equity Insights Fund’s 10 Year Performance
Performance of a $10,000 investment, with distributions reinvested, from January 1, 2013 through December 31, 2022.
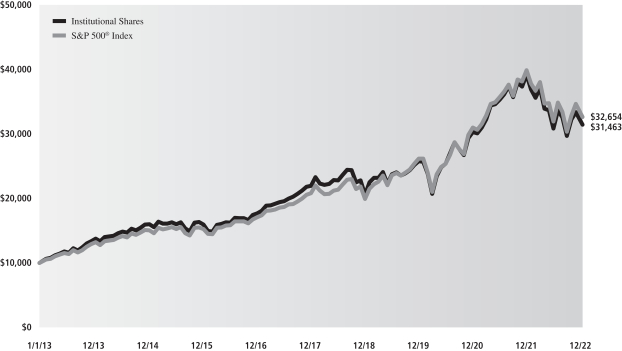
| | | | | | |
| Average Annual Total Return through December 31, 2022 | | One Year | | Five Years | | Ten Years |
Institutional | | -19.74% | | 7.47% | | 12.14% |
Service | | -19.90% | | 7.25% | | 11.91% |
GOLDMAN SACHS VARIABLE INSURANCE TRUST FUNDS
Index Definitions
S&P 500® Index is the Standard & Poor’s composite index of 500 stocks, an unmanaged index of common stock prices. The figures for the index do not include any deduction for fees, expenses or taxes.
Russell 2000® Index is an unmanaged index of common stock prices that measures the performance of the 2000 smallest companies in the Russell 3000® Index. The figures for the index do not include any deduction for fees, expenses or taxes.
Russell Midcap® Index measures the performance of the 800 smallest companies in the Russell 1000® Index, which represents approximately 25% of the total market capitalization of the Russell 1000® Index.
Russell 1000® Index measures the performance of the 1,000 largest companies in the Russell 3000® Index, which represents approximately 92% of the total market capitalization of the Russell 3000® Index.
The Russell 1000® Value Index is an unmanaged market capitalization weighted index of the 1000 largest U.S. companies with lower price-to-book ratios and lower forecasted growth values. The figures for the index do not include any deduction for fees, expenses or taxes.
Russell Midcap® Growth Index is an unmanaged index that measures the performance of those companies in the Russell Midcap® Index with higher price-to-book ratios and higher forecasted growth values.
The Russell Midcap Value® Index is an unmanaged index of common stock prices that measures the performance of those
Russell Midcap companies with lower price-to-book ratios and lower forecasted growth values. The index figures do not reflect any deduction for fees, expenses or taxes
The Russell 1000® Growth Index is an unmanaged market capitalization weighted index of the 1000 largest U.S. companies with higher price-to-book ratios and higher forecasted growth values. The figures for the index do not include any deduction for fees, expenses or taxes.
It is not possible to invest directly in an index.
GOLDMAN SACHS VARIABLE INSURANCE TRUST EQUITY INDEX FUND
Schedule of Investments
December 31, 2022
| | | | | | | | |
| Shares | | | Description | | Value | |
|
| Common Stocks – 99.9% | |
| Automobiles & Components – 1.4% | |
| | 1,351 | | | Aptiv PLC* | | $ | 125,819 | |
| | 1,171 | | | BorgWarner, Inc. | | | 47,133 | |
| | 19,593 | | | Ford Motor Co. | | | 227,866 | |
| | 7,116 | | | General Motors Co. | | | 239,382 | |
| | 13,445 | | | Tesla, Inc.* | | | 1,656,155 | |
| | | | | | | | |
| | | | | | | 2,296,355 | |
| | |
| Banks – 3.8% | |
| | 34,826 | | | Bank of America Corp. | | | 1,153,437 | |
| | 9,633 | | | Citigroup, Inc. | | | 435,701 | |
| | 2,243 | | | Citizens Financial Group, Inc. | | | 88,307 | |
| | 682 | | | Comerica, Inc. | | | 45,592 | |
| | 3,506 | | | Fifth Third Bancorp | | | 115,032 | |
| | 904 | | | First Republic Bank | | | 110,189 | |
| | 7,207 | | | Huntington Bancshares, Inc. | | | 101,619 | |
| | 14,628 | | | JPMorgan Chase & Co. | | | 1,961,615 | |
| | 4,638 | | | KeyCorp | | | 80,794 | |
| | 865 | | | M&T Bank Corp. | | | 125,477 | |
| | 2,020 | | | PNC Financial Services Group, Inc. (The) | | | 319,039 | |
| | 4,763 | | | Regions Financial Corp. | | | 102,690 | |
| | 333 | | | Signature Bank | | | 38,368 | |
| | 296 | | | SVB Financial Group* | | | 68,121 | |
| | 6,645 | | | Truist Financial Corp. | | | 285,934 | |
| | 6,763 | | | US Bancorp | | | 294,934 | |
| | 18,868 | | | Wells Fargo & Co. | | | 779,060 | |
| | 739 | | | Zions Bancorp NA | | | 36,329 | |
| | | | | | | | |
| | | | | | | 6,142,238 | |
| | |
| Capital Goods – 6.1% | |
| | 2,734 | | | 3M Co. | | | 327,861 | |
| | 647 | | | A O Smith Corp. | | | 37,034 | |
| | 426 | | | Allegion PLC | | | 44,841 | |
| | 1,163 | | | AMETEK, Inc. | | | 162,494 | |
| | 2,795 | | | Boeing Co. (The)* | | | 532,420 | |
| | 4,264 | | | Carrier Global Corp. | | | 175,890 | |
| | 2,607 | | | Caterpillar, Inc. | | | 624,533 | |
| | 706 | | | Cummins, Inc. | | | 171,057 | |
| | 1,376 | | | Deere & Co. | | | 589,974 | |
| | 703 | | | Dover Corp. | | | 95,193 | |
| | 1,997 | | | Eaton Corp. PLC | | | 313,429 | |
| | 2,963 | | | Emerson Electric Co. | | | 284,626 | |
| | 2,901 | | | Fastenal Co. | | | 137,275 | |
| | 1,798 | | | Fortive Corp. | | | 115,522 | |
| | 318 | | | Generac Holdings, Inc.* | | | 32,010 | |
| | 1,133 | | | General Dynamics Corp. | | | 281,109 | |
| | 5,455 | | | General Electric Co. | | | 457,074 | |
| | 3,375 | | | Honeywell International, Inc. | | | 723,263 | |
| | 1,821 | | | Howmet Aerospace, Inc. | | | 71,766 | |
| | 196 | | | Huntington Ingalls Industries, Inc. | | | 45,213 | |
| | 386 | | | IDEX Corp. | | | 88,135 | |
| | 1,411 | | | Illinois Tool Works, Inc. | | | 310,843 | |
| | 2,032 | | | Ingersoll Rand, Inc. | | | 106,172 | |
| | 3,461 | | | Johnson Controls International PLC | | | 221,504 | |
| | 959 | | | L3Harris Technologies, Inc. | | | 199,673 | |
| | 1,168 | | | Lockheed Martin Corp. | | | 568,220 | |
| | |
|
| Common Stocks – (continued) | |
| Capital Goods – (continued) | |
| | 1,105 | | | Masco Corp. | | | 51,570 | |
| | 267 | | | Nordson Corp. | | | 63,471 | |
| | 731 | | | Northrop Grumman Corp. | | | 398,841 | |
| | 2,103 | | | Otis Worldwide Corp. | | | 164,686 | |
| | 1,734 | | | PACCAR, Inc. | | | 171,614 | |
| | 649 | | | Parker-Hannifin Corp. | | | 188,859 | |
| | 807 | | | Pentair PLC | | | 36,299 | |
| | 732 | | | Quanta Services, Inc. | | | 104,310 | |
| | 7,355 | | | Raytheon Technologies Corp. | | | 742,267 | |
| | 576 | | | Rockwell Automation, Inc. | | | 148,360 | |
| | 268 | | | Snap-on, Inc. | | | 61,235 | |
| | 728 | | | Stanley Black & Decker, Inc. | | | 54,687 | |
| | 1,033 | | | Textron, Inc. | | | 73,136 | |
| | 1,164 | | | Trane Technologies PLC | | | 195,657 | |
| | 258 | | | TransDigm Group, Inc. | | | 162,450 | |
| | 349 | | | United Rentals, Inc.* | | | 124,042 | |
| | 891 | | | Westinghouse Air Brake Technologies Corp. | | | 88,931 | |
| | 216 | | | W.W. Grainger, Inc. | | | 120,150 | |
| | 900 | | | Xylem, Inc. | | | 99,513 | |
| | | | | | | | |
| | | | | | | 9,767,209 | |
| | |
| Commercial & Professional Services – 0.9% | |
| | 430 | | | Cintas Corp. | | | 194,196 | |
| | 2,136 | | | Copart, Inc.* | | | 130,061 | |
| | 1,956 | | | CoStar Group, Inc.* | | | 151,160 | |
| | 616 | | | Equifax, Inc. | | | 119,726 | |
| | 654 | | | Jacobs Solutions, Inc. | | | 78,526 | |
| | 678 | | | Leidos Holdings, Inc. | | | 71,319 | |
| | 1,013 | | | Republic Services, Inc. | | | 130,667 | |
| | 552 | | | Robert Half International, Inc. | | | 40,754 | |
| | 1,137 | | | Rollins, Inc. | | | 41,546 | |
| | 787 | | | Verisk Analytics, Inc. | | | 138,842 | |
| | 1,868 | | | Waste Management, Inc. | | | 293,052 | |
| | | | | | | | |
| | | | | | | 1,389,849 | |
| | |
| Consumer Durables & Apparel – 0.9% | |
| | 1,580 | | | D.R. Horton, Inc. | | | 140,841 | |
| | 765 | | | Garmin Ltd. | | | 70,602 | |
| | 665 | | | Hasbro, Inc. | | | 40,571 | |
| | 1,268 | | | Lennar Corp., Class A | | | 114,754 | |
| | 277 | | | Mohawk Industries, Inc.* | | | 28,315 | |
| | 1,773 | | | Newell Brands, Inc. | | | 23,191 | |
| | 6,294 | | | NIKE, Inc., Class B | | | 736,461 | |
| | 15 | | | NVR, Inc.* | | | 69,189 | |
| | 1,130 | | | PulteGroup, Inc. | | | 51,449 | |
| | 200 | | | Ralph Lauren Corp. | | | 21,134 | |
| | 1,259 | | | Tapestry, Inc. | | | 47,943 | |
| | 1,636 | | | VF Corp. | | | 45,170 | |
| | 281 | | | Whirlpool Corp. | | | 39,750 | |
| | | | | | | | |
| | | | | | | 1,429,370 | |
| | |
| Consumer Services – 2.0% | |
| | 194 | | | Booking Holdings, Inc.* | | | 390,964 | |
| | 1,118 | | | Caesars Entertainment, Inc.* | | | 46,509 | |
| | 4,349 | | | Carnival Corp.* | | | 35,053 | |
| | |
| | |
| 50 | | The accompanying notes are an integral part of these financial statements. |
GOLDMAN SACHS VARIABLE INSURANCE TRUST EQUITY INDEX FUND
| | | | | | | | |
| Shares | | | Description | | Value | |
|
| Common Stocks – (continued) | |
| Consumer Services – (continued) | |
| | 136 | | | Chipotle Mexican Grill, Inc.* | | $ | 188,699 | |
| | 609 | | | Darden Restaurants, Inc. | | | 84,243 | |
| | 183 | | | Domino’s Pizza, Inc. | | | 63,391 | |
| | 764 | | | Expedia Group, Inc.* | | | 66,926 | |
| | 1,369 | | | Hilton Worldwide Holdings, Inc. | | | 172,987 | |
| | 1,671 | | | Las Vegas Sands Corp.* | | | 80,325 | |
| | 1,348 | | | Marriott International, Inc., Class A | | | 200,704 | |
| | 3,662 | | | McDonald’s Corp. | | | 965,047 | |
| | 1,605 | | | MGM Resorts International | | | 53,816 | |
| | 2,072 | | | Norwegian Cruise Line Holdings Ltd.* | | | 25,361 | |
| | 1,087 | | | Royal Caribbean Cruises Ltd.* | | | 53,730 | |
| | 5,695 | | | Starbucks Corp. | | | 564,944 | |
| | 517 | | | Wynn Resorts Ltd.* | | | 42,637 | |
| | 1,439 | | | Yum! Brands, Inc. | | | 184,307 | |
| | | | | | | | |
| | | | | | | 3,219,643 | |
| | |
| Diversified Financials – 5.4% | |
| | 2,984 | | | American Express Co. | | | 440,886 | |
| | 541 | | | Ameriprise Financial, Inc. | | | 168,451 | |
| | 3,670 | | | Bank of New York Mellon Corp. (The) | | | 167,058 | |
| | 9,008 | | | Berkshire Hathaway, Inc., Class B* | | | 2,782,571 | |
| | 748 | | | BlackRock, Inc. | | | 530,055 | |
| | 1,930 | | | Capital One Financial Corp. | | | 179,413 | |
| | 525 | | | Cboe Global Markets, Inc. | | | 65,872 | |
| | 7,603 | | | Charles Schwab Corp. (The) | | | 633,026 | |
| | 1,802 | | | CME Group, Inc. | | | 303,024 | |
| | 1,389 | | | Discover Financial Services | | | 135,886 | |
| | 189 | | | FactSet Research Systems, Inc. | | | 75,829 | |
| | 1,440 | | | Franklin Resources, Inc. | | | 37,987 | |
| | 1,700 | | | Goldman Sachs Group, Inc. (The)(a) | | | 583,746 | |
| | 2,793 | | | Intercontinental Exchange, Inc. | | | 286,534 | |
| | 1,729 | | | Invesco Ltd. | | | 31,105 | |
| | 190 | | | MarketAxess Holdings, Inc. | | | 52,989 | |
| | 792 | | | Moody’s Corp. | | | 220,667 | |
| | 6,648 | | | Morgan Stanley | | | 565,213 | |
| | 402 | | | MSCI, Inc. | | | 186,998 | |
| | 1,728 | | | Nasdaq, Inc. | | | 106,013 | |
| | 1,045 | | | Northern Trust Corp. | | | 92,472 | |
| | 973 | | | Raymond James Financial, Inc. | | | 103,965 | |
| | 1,668 | | | S&P Global, Inc. | | | 558,680 | |
| | 1,847 | | | State Street Corp. | | | 143,272 | |
| | 2,257 | | | Synchrony Financial | | | 74,165 | |
| | 1,125 | | | T. Rowe Price Group, Inc. | | | 122,693 | |
| | | | | | | | |
| | | | | | | 8,648,570 | |
| | |
| Energy – 5.2% | |
| | 1,609 | | | APA Corp. | | | 75,108 | |
| | 4,625 | | | Baker Hughes Co. | | | 136,576 | |
| | 8,911 | | | Chevron Corp. | | | 1,599,435 | |
| | 6,242 | | | ConocoPhillips | | | 736,556 | |
| | 3,962 | | | Coterra Energy, Inc. | | | 97,346 | |
| | 3,092 | | | Devon Energy Corp. | | | 190,189 | |
| | 873 | | | Diamondback Energy, Inc. | | | 119,409 | |
| | 2,940 | | | EOG Resources, Inc. | | | 380,789 | |
| | 1,869 | | | EQT Corp. | | | 63,228 | |
| | 20,628 | | | Exxon Mobil Corp. | | | 2,275,268 | |
| | |
|
| Common Stocks – (continued) | |
| Energy – (continued) | |
| | 4,528 | | | Halliburton Co. | | | 178,177 | |
| | 1,393 | | | Hess Corp. | | | 197,555 | |
| | 10,017 | | | Kinder Morgan, Inc. | | | 181,107 | |
| | 3,181 | | | Marathon Oil Corp. | | | 86,110 | |
| | 2,348 | | | Marathon Petroleum Corp. | | | 273,284 | |
| | 3,642 | | | Occidental Petroleum Corp. | | | 229,410 | |
| | 2,222 | | | ONEOK, Inc. | | | 145,985 | |
| | 2,386 | | | Phillips 66 | | | 248,335 | |
| | 1,196 | | | Pioneer Natural Resources Co. | | | 273,155 | |
| | 7,079 | | | Schlumberger Ltd. | | | 378,443 | |
| | 1,144 | | | Targa Resources Corp. | | | 84,084 | |
| | 1,931 | | | Valero Energy Corp. | | | 244,967 | |
| | 6,134 | | | Williams Cos., Inc. (The) | | | 201,809 | |
| | | | | | | | |
| | | | | | | 8,396,325 | |
| | |
| Food & Staples Retailing – 1.5% | |
| | 2,206 | | | Costco Wholesale Corp. | | | 1,007,039 | |
| | 3,261 | | | Kroger Co. (The) | | | 145,376 | |
| | 2,522 | | | Sysco Corp. | | | 192,807 | |
| | 3,584 | | | Walgreens Boots Alliance, Inc. | | | 133,898 | |
| | 7,070 | | | Walmart, Inc. | | | 1,002,455 | |
| | | | | | | | |
| | | | | | | 2,481,575 | |
| | |
| Food, Beverage & Tobacco – 3.9% | |
| | 8,912 | | | Altria Group, Inc. | | | 407,368 | |
| | 2,752 | | | Archer-Daniels-Midland Co. | | | 255,523 | |
| | 944 | | | Brown-Forman Corp., Class B | | | 62,002 | |
| | 1,039 | | | Campbell Soup Co. | | | 58,963 | |
| | 19,406 | | | Coca-Cola Co. (The) | | | 1,234,416 | |
| | 2,395 | | | Conagra Brands, Inc. | | | 92,686 | |
| | 800 | | | Constellation Brands, Inc., Class A | | | 185,400 | |
| | 2,988 | | | General Mills, Inc. | | | 250,544 | |
| | 737 | | | Hershey Co. (The) | | | 170,667 | |
| | 1,469 | | | Hormel Foods Corp. | | | 66,913 | |
| | 549 | | | J M Smucker Co. (The) | | | 86,995 | |
| | 1,291 | | | Kellogg Co. | | | 91,971 | |
| | 4,198 | | | Keurig Dr Pepper, Inc. | | | 149,701 | |
| | 3,988 | | | Kraft Heinz Co. (The) | | | 162,351 | |
| | 724 | | | Lamb Weston Holdings, Inc. | | | 64,697 | |
| | 1,250 | | | McCormick & Co., Inc. | | | 103,612 | |
| | 949 | | | Molson Coors Beverage Co., Class B | | | 48,892 | |
| | 6,862 | | | Mondelez International, Inc., Class A | | | 457,352 | |
| | 1,934 | | | Monster Beverage Corp.* | | | 196,359 | |
| | 6,876 | | | PepsiCo, Inc. | | | 1,242,218 | |
| | 7,708 | | | Philip Morris International, Inc. | | | 780,127 | |
| | 1,435 | | | Tyson Foods, Inc., Class A | | | 89,329 | |
| | | | | | | | |
| | | | | | | 6,258,086 | |
| | |
| Health Care Equipment & Services – 6.5% | |
| | 8,714 | | | Abbott Laboratories | | | 956,710 | |
| | 375 | | | Align Technology, Inc.* | | | 79,088 | |
| | 754 | | | AmerisourceBergen Corp. | | | 124,945 | |
| | 2,509 | | | Baxter International, Inc. | | | 127,884 | |
| | 1,430 | | | Becton Dickinson and Co. | | | 363,649 | |
| | 7,162 | | | Boston Scientific Corp.* | | | 331,386 | |
| | 1,313 | | | Cardinal Health, Inc. | | | 100,930 | |
| | |
| | |
| The accompanying notes are an integral part of these financial statements. | | 51 |
GOLDMAN SACHS VARIABLE INSURANCE TRUST EQUITY INDEX FUND
Schedule of Investments (continued)
December 31, 2022
| | | | | | | | |
| Shares | | | Description | | Value | |
|
| Common Stocks – (continued) | |
| Health Care Equipment & Services – (continued) | |
| | 2,878 | | | Centene Corp.* | | $ | 236,025 | |
| | 1,518 | | | Cigna Corp. | | | 502,974 | |
| | 254 | | | Cooper Cos., Inc. (The) | | | 83,990 | |
| | 6,577 | | | CVS Health Corp. | | | 612,911 | |
| | 264 | | | DaVita, Inc.* | | | 19,713 | |
| | 1,041 | | | DENTSPLY SIRONA, Inc. | | | 33,146 | |
| | 1,935 | | | Dexcom, Inc.* | | | 219,119 | |
| | 3,099 | | | Edwards Lifesciences Corp.* | | | 231,216 | |
| | 1,195 | | | Elevance Health, Inc. | | | 612,999 | |
| | 1,062 | | | HCA Healthcare, Inc. | | | 254,838 | |
| | 677 | | | Henry Schein, Inc.* | | | 54,072 | |
| | 1,241 | | | Hologic, Inc.* | | | 92,839 | |
| | 633 | | | Humana, Inc. | | | 324,216 | |
| | 417 | | | IDEXX Laboratories, Inc.* | | | 170,119 | |
| | 1,769 | | | Intuitive Surgical, Inc.* | | | 469,404 | |
| | 450 | | | Laboratory Corp. of America Holdings | | | 105,966 | |
| | 720 | | | McKesson Corp. | | | 270,086 | |
| | 6,588 | | | Medtronic PLC | | | 512,019 | |
| | 294 | | | Molina Healthcare, Inc.* | | | 97,085 | |
| | 576 | | | Quest Diagnostics, Inc. | | | 90,110 | |
| | 733 | | | ResMed, Inc. | | | 152,559 | |
| | 500 | | | STERIS PLC | | | 92,345 | |
| | 1,689 | | | Stryker Corp. | | | 412,944 | |
| | 243 | | | Teleflex, Inc. | | | 60,660 | |
| | 4,668 | | | UnitedHealth Group, Inc. | | | 2,474,880 | |
| | 336 | | | Universal Health Services, Inc., Class B | | | 47,339 | |
| | 1,053 | | | Zimmer Biomet Holdings, Inc. | | | 134,258 | |
| | | | | | | | |
| | | | | | | 10,452,424 | |
| | |
| Household & Personal Products – 1.7% | |
| | 1,241 | | | Church & Dwight Co., Inc. | | | 100,037 | |
| | 615 | | | Clorox Co. (The) | | | 86,303 | |
| | 4,179 | | | Colgate-Palmolive Co. | | | 329,263 | |
| | 1,141 | | | Estee Lauder Cos., Inc. (The), Class A | | | 283,094 | |
| | 1,705 | | | Kimberly-Clark Corp. | | | 231,454 | |
| | 11,870 | | | Procter & Gamble Co. (The) | | | 1,799,017 | |
| | | | | | | | |
| | | | | | | 2,829,168 | |
| | |
| Insurance – 2.5% | |
| | 2,873 | | | Aflac, Inc. | | | 206,684 | |
| | 1,350 | | | Allstate Corp. (The) | | | 183,060 | |
| | 3,722 | | | American International Group, Inc. | | | 235,379 | |
| | 1,036 | | | Aon PLC, Class A | | | 310,945 | |
| | 1,858 | | | Arch Capital Group Ltd.* | | | 116,645 | |
| | 1,053 | | | Arthur J Gallagher & Co. | | | 198,533 | |
| | 273 | | | Assurant, Inc. | | | 34,141 | |
| | 1,163 | | | Brown & Brown, Inc. | | | 66,256 | |
| | 2,091 | | | Chubb Ltd. | | | 461,275 | |
| | 760 | | | Cincinnati Financial Corp. | | | 77,816 | |
| | 202 | | | Everest Re Group Ltd. | | | 66,917 | |
| | 443 | | | Globe Life, Inc. | | | 53,404 | |
| | 1,610 | | | Hartford Financial Services Group, Inc. (The) | | | 122,086 | |
| | 752 | | | Lincoln National Corp. | | | 23,101 | |
| | 1,037 | | | Loews Corp. | | | 60,488 | |
| | |
|
| Common Stocks – (continued) | |
| Insurance – (continued) | |
| | 2,470 | | | Marsh & McLennan Cos., Inc. | | | 408,736 | |
| | 3,357 | | | MetLife, Inc. | | | 242,946 | |
| | 1,147 | | | Principal Financial Group, Inc. | | | 96,256 | |
| | 2,934 | | | Progressive Corp. (The) | | | 380,569 | |
| | 1,858 | | | Prudential Financial, Inc. | | | 184,797 | |
| | 1,193 | | | Travelers Cos., Inc. (The) | | | 223,676 | |
| | 1,013 | | | W R Berkley Corp. | | | 73,513 | |
| | 542 | | | Willis Towers Watson PLC | | | 132,562 | |
| | | | | | | | |
| | | | | | | 3,959,785 | |
| | |
| Materials – 2.7% | |
| | 1,110 | | | Air Products and Chemicals, Inc. | | | 342,169 | |
| | 590 | | | Albemarle Corp. | | | 127,947 | |
| | 7,523 | | | Amcor PLC | | | 89,599 | |
| | 415 | | | Avery Dennison Corp. | | | 75,115 | |
| | 1,552 | | | Ball Corp. | | | 79,369 | |
| | 485 | | | Celanese Corp. | | | 49,586 | |
| | 1,013 | | | CF Industries Holdings, Inc. | | | 86,308 | |
| | 3,592 | | | Corteva, Inc. | | | 211,138 | |
| | 3,593 | | | Dow, Inc. | | | 181,051 | |
| | 2,501 | | | DuPont de Nemours, Inc. | | | 171,644 | |
| | 638 | | | Eastman Chemical Co. | | | 51,959 | |
| | 1,226 | | | Ecolab, Inc. | | | 178,456 | |
| | 621 | | | FMC Corp. | | | 77,501 | |
| | 7,192 | | | Freeport-McMoRan, Inc. | | | 273,296 | |
| | 1,286 | | | International Flavors & Fragrances, Inc. | | | 134,824 | |
| | 1,793 | | | International Paper Co. | | | 62,092 | |
| | 2,479 | | | Linde PLC (United Kingdom) | | | 808,600 | |
| | 1,262 | | | LyondellBasell Industries NV, Class A | | | 104,784 | |
| | 313 | | | Martin Marietta Materials, Inc. | | | 105,785 | |
| | 1,756 | | | Mosaic Co. (The) | | | 77,036 | |
| | 3,972 | | | Newmont Corp. | | | 187,478 | |
| | 1,310 | | | Nucor Corp. | | | 172,671 | |
| | 464 | | | Packaging Corp. of America | | | 59,350 | |
| | 1,186 | | | PPG Industries, Inc. | | | 149,128 | |
| | 712 | | | Sealed Air Corp. | | | 35,515 | |
| | 1,186 | | | Sherwin-Williams Co. (The) | | | 281,473 | |
| | 834 | | | Steel Dynamics, Inc. | | | 81,482 | |
| | 667 | | | Vulcan Materials Co. | | | 116,798 | |
| | 1,288 | | | Westrock Co. | | | 45,286 | |
| | | | | | | | |
| | | | | | | 4,417,440 | |
| | |
| Media & Entertainment – 6.1% | |
| | 3,568 | | | Activision Blizzard, Inc. | | | 273,130 | |
| | 29,930 | | | Alphabet, Inc., Class A* | | | 2,640,724 | |
| | 26,522 | | | Alphabet, Inc., Class C* | | | 2,353,297 | |
| | 538 | | | Charter Communications, Inc., Class A* | | | 182,436 | |
| | 21,609 | | | Comcast Corp., Class A | | | 755,667 | |
| | 1,329 | | | DISH Network Corp., Class A* | | | 18,659 | |
| | 1,306 | | | Electronic Arts, Inc. | | | 159,567 | |
| | 1,501 | | | Fox Corp., Class A | | | 45,585 | |
| | 729 | | | Fox Corp., Class B | | | 20,740 | |
| | 1,937 | | | Interpublic Group of Cos., Inc. (The) | | | 64,522 | |
| | 692 | | | Live Nation Entertainment, Inc.* | | | 48,260 | |
| | |
| | |
| 52 | | The accompanying notes are an integral part of these financial statements. |
GOLDMAN SACHS VARIABLE INSURANCE TRUST EQUITY INDEX FUND
| | | | | | | | |
| Shares | | | Description | | Value | |
|
| Common Stocks – (continued) | |
| Media & Entertainment – (continued) | |
| | 1,428 | | | Match Group, Inc.* | | $ | 59,248 | |
| | 11,264 | | | Meta Platforms, Inc., Class A* | | | 1,355,510 | |
| | 2,215 | | | Netflix, Inc.* | | | 653,159 | |
| | 2,000 | | | News Corp., Class A | | | 36,400 | |
| | 566 | | | News Corp., Class B | | | 10,437 | |
| | 1,042 | | | Omnicom Group, Inc. | | | 84,996 | |
| | 2,568 | | | Paramount Global, Class B | | | 43,348 | |
| | 788 | | | Take-Two Interactive Software, Inc.* | | | 82,054 | |
| | 9,070 | | | Walt Disney Co. (The)* | | | 788,002 | |
| | 11,156 | | | Warner Bros Discovery, Inc.* | | | 105,759 | |
| | | | | | | | |
| | | | | | | 9,781,500 | |
| | |
| Pharmaceuticals, Biotechnology & Life Sciences – 9.3% | |
| | 8,812 | | | AbbVie, Inc. | | | 1,424,107 | |
| | 1,480 | | | Agilent Technologies, Inc. | | | 221,482 | |
| | 2,663 | | | Amgen, Inc. | | | 699,410 | |
| | 725 | | | Biogen, Inc.* | | | 200,767 | |
| | 105 | | | Bio-Rad Laboratories, Inc., Class A* | | | 44,152 | |
| | 776 | | | Bio-Techne Corp. | | | 64,315 | |
| | 10,640 | | | Bristol-Myers Squibb Co. | | | 765,548 | |
| | 930 | | | Catalent, Inc.* | | | 41,859 | |
| | 252 | | | Charles River Laboratories International, Inc.* | | | 54,911 | |
| | 3,257 | | | Danaher Corp. | | | 864,473 | |
| | 3,931 | | | Eli Lilly & Co. | | | 1,438,117 | |
| | 6,235 | | | Gilead Sciences, Inc. | | | 535,275 | |
| | 793 | | | Illumina, Inc.* | | | 160,345 | |
| | 953 | | | Incyte Corp.* | | | 76,545 | |
| | 934 | | | IQVIA Holdings, Inc.* | | | 191,367 | |
| | 13,096 | | | Johnson & Johnson | | | 2,313,408 | |
| | 12,624 | | | Merck & Co., Inc. | | | 1,400,633 | |
| | 112 | | | Mettler-Toledo International, Inc.* | | | 161,890 | |
| | 1,655 | | | Moderna, Inc.* | | | 297,271 | |
| | 1,257 | | | Organon & Co. | | | 35,108 | |
| | 632 | | | PerkinElmer, Inc. | | | 88,619 | |
| | 27,971 | | | Pfizer, Inc. | | | 1,433,234 | |
| | 533 | | | Regeneron Pharmaceuticals, Inc.* | | | 384,554 | |
| | 1,951 | | | Thermo Fisher Scientific, Inc. | | | 1,074,396 | |
| | 1,284 | | | Vertex Pharmaceuticals, Inc.* | | | 370,794 | |
| | 6,183 | | | Viatris, Inc. | | | 68,817 | |
| | 298 | | | Waters Corp.* | | | 102,089 | |
| | 367 | | | West Pharmaceutical Services, Inc. | | | 86,374 | |
| | 2,326 | | | Zoetis, Inc. | | | 340,875 | |
| | | | | | | | |
| | | | | | | 14,940,735 | |
| | |
| Real Estate – 2.7% | |
| | 752 | | | Alexandria Real Estate Equities, Inc. REIT | | | 109,544 | |
| | 2,332 | | | American Tower Corp. REIT | | | 494,057 | |
| | 704 | | | AvalonBay Communities, Inc. REIT | | | 113,710 | |
| | 705 | | | Boston Properties, Inc. REIT | | | 47,644 | |
| | 543 | | | Camden Property Trust REIT | | | 60,751 | |
| | 1,606 | | | CBRE Group, Inc., Class A* | | | 123,598 | |
| | 2,171 | | | Crown Castle, Inc. REIT | | | 294,474 | |
| | 1,438 | | | Digital Realty Trust, Inc. REIT | | | 144,188 | |
| | 456 | | | Equinix, Inc. REIT | | | 298,694 | |
| | |
|
| Common Stocks – (continued) | |
| Real Estate – (continued) | |
| | 1,685 | | | Equity Residential REIT | | | 99,415 | |
| | 321 | | | Essex Property Trust, Inc. REIT | | | 68,026 | |
| | 658 | | | Extra Space Storage, Inc. REIT | | | 96,844 | |
| | 378 | | | Federal Realty Investment Trust REIT | | | 38,193 | |
| | 2,791 | | | Healthpeak Properties, Inc. REIT | | | 69,970 | |
| | 3,710 | | | Host Hotels & Resorts, Inc. REIT | | | 59,545 | |
| | 2,949 | | | Invitation Homes, Inc. REIT | | | 87,408 | |
| | 1,482 | | | Iron Mountain, Inc. REIT | | | 73,878 | |
| | 3,188 | | | Kimco Realty Corp. REIT | | | 67,522 | |
| | 578 | | | Mid-America Apartment Communities, Inc. REIT | | | 90,740 | |
| | 4,593 | | | Prologis, Inc. REIT | | | 517,769 | |
| | 773 | | | Public Storage REIT | | | 216,587 | |
| | 2,992 | | | Realty Income Corp. REIT | | | 189,783 | |
| | 784 | | | Regency Centers Corp. REIT | | | 49,000 | |
| | 545 | | | SBA Communications Corp. REIT | | | 152,769 | |
| | 1,658 | | | Simon Property Group, Inc. REIT | | | 194,782 | |
| | 1,468 | | | UDR, Inc. REIT | | | 56,856 | |
| | 1,994 | | | Ventas, Inc. REIT | | | 89,830 | |
| | 4,859 | | | VICI Properties, Inc. REIT | | | 157,432 | |
| | 862 | | | Vornado Realty Trust REIT | | | 17,938 | |
| | 2,269 | | | Welltower, Inc. REIT | | | 148,733 | |
| | 3,691 | | | Weyerhaeuser Co. REIT | | | 114,421 | |
| | | | | | | | |
| | | | | | | 4,344,101 | |
| | |
| Retailing – 5.5% | |
| | 302 | | | Advance Auto Parts, Inc. | | | 44,403 | |
| | 44,457 | | | Amazon.com, Inc.* | | | 3,734,388 | |
| | 95 | | | AutoZone, Inc.* | | | 234,287 | |
| | 1,167 | | | Bath & Body Works, Inc. | | | 49,177 | |
| | 980 | | | Best Buy Co., Inc. | | | 78,606 | |
| | 817 | | | CarMax, Inc.* | | | 49,747 | |
| | 1,140 | | | Dollar General Corp. | | | 280,725 | |
| | 1,073 | | | Dollar Tree, Inc.* | | | 151,765 | |
| | 2,737 | | | eBay, Inc. | | | 113,503 | |
| | 632 | | | Etsy, Inc.* | | | 75,701 | |
| | 710 | | | Genuine Parts Co. | | | 123,192 | |
| | 5,124 | | | Home Depot, Inc. (The) | | | 1,618,467 | |
| | 1,321 | | | LKQ Corp. | | | 70,555 | |
| | 3,109 | | | Lowe’s Cos., Inc. | | | 619,437 | |
| | 313 | | | O’Reilly Automotive, Inc.* | | | 264,181 | |
| | 199 | | | Pool Corp. | | | 60,164 | |
| | 1,753 | | | Ross Stores, Inc. | | | 203,471 | |
| | 2,326 | | | Target Corp. | | | 346,667 | |
| | 5,816 | | | TJX Cos., Inc. (The) | | | 462,954 | |
| | 552 | | | Tractor Supply Co. | | | 124,183 | |
| | 257 | | | Ulta Beauty, Inc.* | | | 120,551 | |
| | | | | | | | |
| | | | | | | 8,826,124 | |
| | |
| Semiconductors & Semiconductor Equipment – 5.1% | |
| | 8,037 | | | Advanced Micro Devices, Inc.* | | | 520,557 | |
| | 2,573 | | | Analog Devices, Inc. | | | 422,049 | |
| | 4,309 | | | Applied Materials, Inc. | | | 419,610 | |
| | 2,011 | | | Broadcom, Inc. | | | 1,124,410 | |
| | 678 | | | Enphase Energy, Inc.* | | | 179,643 | |
| | 497 | | | First Solar, Inc.* | | | 74,446 | |
| | 20,443 | | | Intel Corp. | | | 540,308 | |
| | |
| | |
| The accompanying notes are an integral part of these financial statements. | | 53 |
GOLDMAN SACHS VARIABLE INSURANCE TRUST EQUITY INDEX FUND
Schedule of Investments (continued)
December 31, 2022
| | | | | | | | |
| Shares | | | Description | | Value | |
|
| Common Stocks – (continued) | |
| Semiconductors & Semiconductor Equipment – (continued) | |
| | 709 | | | KLA Corp. | | $ | 267,314 | |
| | 680 | | | Lam Research Corp. | | | 285,804 | |
| | 2,735 | | | Microchip Technology, Inc. | | | 192,134 | |
| | 5,474 | | | Micron Technology, Inc. | | | 273,591 | |
| | 228 | | | Monolithic Power Systems, Inc. | | | 80,623 | |
| | 12,492 | | | NVIDIA Corp. | | | 1,825,581 | |
| | 1,298 | | | NXP Semiconductors NV (China) | | | 205,123 | |
| | 2,190 | | | ON Semiconductor Corp.* | | | 136,590 | |
| | 504 | | | Qorvo, Inc.* | | | 45,683 | |
| | 5,626 | | | QUALCOMM, Inc. | | | 618,522 | |
| | 821 | | | Skyworks Solutions, Inc. | | | 74,818 | |
| | 269 | | | SolarEdge Technologies, Inc.* | | | 76,200 | |
| | 773 | | | Teradyne, Inc. | | | 67,522 | |
| | 4,543 | | | Texas Instruments, Inc. | | | 750,594 | |
| | | | | | | | |
| | | | | | | 8,181,122 | |
| | |
| Software & Services – 12.8% | |
| | 3,148 | | | Accenture PLC, Class A | | | 840,012 | |
| | 2,327 | | | Adobe, Inc.* | | | 783,105 | |
| | 797 | | | Akamai Technologies, Inc.* | | | 67,187 | |
| | 437 | | | ANSYS, Inc.* | | | 105,575 | |
| | 1,076 | | | Autodesk, Inc.* | | | 201,072 | |
| | 2,081 | | | Automatic Data Processing, Inc. | | | 497,068 | |
| | 584 | | | Broadridge Financial Solutions, Inc. | | | 78,332 | |
| | 1,369 | | | Cadence Design Systems, Inc.* | | | 219,916 | |
| | 740 | | | Ceridian HCM Holding, Inc.* | | | 47,471 | |
| | 2,632 | | | Cognizant Technology Solutions Corp., Class A | | | 150,524 | |
| | 1,107 | | | DXC Technology Co.* | | | 29,336 | |
| | 287 | | | EPAM Systems, Inc.* | | | 94,061 | |
| | 2,972 | | | Fidelity National Information Services, Inc. | | | 201,650 | |
| | 3,206 | | | Fiserv, Inc.* | | | 324,030 | |
| | 371 | | | FleetCor Technologies, Inc.* | | | 68,145 | |
| | 3,265 | | | Fortinet, Inc.* | | | 159,626 | |
| | 395 | | | Gartner, Inc.* | | | 132,775 | |
| | 3,011 | | | Gen Digital, Inc. | | | 64,526 | |
| | 1,382 | | | Global Payments, Inc. | | | 137,260 | |
| | 4,498 | | | International Business Machines Corp. | | | 633,723 | |
| | 1,413 | | | Intuit, Inc. | | | 549,968 | |
| | 370 | | | Jack Henry & Associates, Inc. | | | 64,957 | |
| | 4,253 | | | Mastercard, Inc., Class A | | | 1,478,896 | |
| | 37,292 | | | Microsoft Corp. | | | 8,943,368 | |
| | 7,542 | | | Oracle Corp. | | | 616,483 | |
| | 1,584 | | | Paychex, Inc. | | | 183,047 | |
| | 247 | | | Paycom Software, Inc.* | | | 76,647 | |
| | 5,710 | | | PayPal Holdings, Inc.* | | | 406,666 | |
| | 520 | | | PTC, Inc.* | | | 62,421 | |
| | 525 | | | Roper Technologies, Inc. | | | 226,847 | |
| | 4,955 | | | Salesforce, Inc.* | | | 656,984 | |
| | 999 | | | ServiceNow, Inc.* | | | 387,882 | |
| | 765 | | | Synopsys, Inc.* | | | 244,257 | |
| | 205 | | | Tyler Technologies, Inc.* | | | 66,094 | |
| | 461 | | | VeriSign, Inc.* | | | 94,708 | |
| | 8,153 | | | Visa, Inc., Class A | | | 1,693,867 | |
| | | | | | | | |
| | | | | | | 20,588,486 | |
| | |
|
| Common Stocks – (continued) | |
| Technology Hardware & Equipment – 7.8% | |
| | 2,973 | | | Amphenol Corp., Class A | | | 226,364 | |
| | 74,808 | | | Apple, Inc. | | | 9,719,803 | |
| | 1,133 | | | Arista Networks, Inc.* | | | 137,490 | |
| | 679 | | | CDW Corp. | | | 121,256 | |
| | 20,614 | | | Cisco Systems, Inc. | | | 982,051 | |
| | 3,791 | | | Corning, Inc. | | | 121,085 | |
| | 303 | | | F5, Inc.* | | | 43,484 | |
| | 6,496 | | | Hewlett Packard Enterprise Co. | | | 103,676 | |
| | 4,434 | | | HP, Inc. | | | 119,142 | |
| | 1,635 | | | Juniper Networks, Inc. | | | 52,255 | |
| | 902 | | | Keysight Technologies, Inc.* | | | 154,305 | |
| | 827 | | | Motorola Solutions, Inc. | | | 213,126 | |
| | 1,106 | | | NetApp, Inc. | | | 66,426 | |
| | 1,009 | | | Seagate Technology Holdings PLC | | | 53,083 | |
| | 1,598 | | | TE Connectivity Ltd. (Switzerland) | | | 183,450 | |
| | 239 | | | Teledyne Technologies, Inc.* | | | 95,579 | |
| | 1,274 | | | Trimble, Inc.* | | | 64,413 | |
| | 1,631 | | | Western Digital Corp.* | | | 51,458 | |
| | 268 | | | Zebra Technologies Corp., Class A* | | | 68,718 | |
| | | | | | | | |
| | | | | | | 12,577,164 | |
| | |
| Telecommunication Services – 1.2% | |
| | 35,489 | | | AT&T, Inc. | | | 653,353 | |
| | 4,795 | | | Lumen Technologies, Inc. | | | 25,030 | |
| | 2,992 | | | T-Mobile US, Inc.* | | | 418,880 | |
| | 20,881 | | | Verizon Communications, Inc. | | | 822,711 | |
| | | | | | | | |
| | | | | | | 1,919,974 | |
| | |
| Transportation – 1.7% | |
| | 618 | | | Alaska Air Group, Inc.* | | | 26,537 | |
| | 3,269 | | | American Airlines Group, Inc.* | | | 41,582 | |
| | 590 | | | C.H. Robinson Worldwide, Inc. | | | 54,020 | |
| | 10,637 | | | CSX Corp. | | | 329,534 | |
| | 3,215 | | | Delta Air Lines, Inc.* | | | 105,645 | |
| | 797 | | | Expeditors International of Washington, Inc. | | | 82,824 | |
| | 1,208 | | | FedEx Corp. | | | 209,226 | |
| | 409 | | | J.B. Hunt Transport Services, Inc. | | | 71,313 | |
| | 1,165 | | | Norfolk Southern Corp. | | | 287,079 | |
| | 452 | | | Old Dominion Freight Line, Inc. | | | 128,269 | |
| | 2,920 | | | Southwest Airlines Co.* | | | 98,316 | |
| | 3,080 | | | Union Pacific Corp. | | | 637,776 | |
| | 1,662 | | | United Airlines Holdings, Inc.* | | | 62,657 | |
| | 3,645 | | | United Parcel Service, Inc., Class B | | | 633,647 | |
| | | | | | | | |
| | | | | | | 2,768,425 | |
| | |
| Utilities – 3.2% | |
| | 3,430 | | | AES Corp. (The) | | | 98,647 | |
| | 1,246 | | | Alliant Energy Corp. | | | 68,792 | |
| | 1,293 | | | Ameren Corp. | | | 114,974 | |
| | 2,570 | | | American Electric Power Co., Inc. | | | 244,022 | |
| | 908 | | | American Water Works Co., Inc. | | | 138,397 | |
| | 682 | | | Atmos Energy Corp. | | | 76,432 | |
| | 3,208 | | | CenterPoint Energy, Inc. | | | 96,208 | |
| | 1,434 | | | CMS Energy Corp. | | | 90,815 | |
| | 1,767 | | | Consolidated Edison, Inc. | | | 168,413 | |
| | |
| | |
| 54 | | The accompanying notes are an integral part of these financial statements. |
GOLDMAN SACHS VARIABLE INSURANCE TRUST EQUITY INDEX FUND
| | | | | | | | |
| Shares | | | Description | | Value | |
|
| Common Stocks – (continued) | |
| Utilities – (continued) | |
| | 1,634 | | | Constellation Energy Corp. | | $ | 140,867 | |
| | 4,116 | | | Dominion Energy, Inc. | | | 252,393 | |
| | 962 | | | DTE Energy Co. | | | 113,064 | |
| | 3,861 | | | Duke Energy Corp. | | | 397,644 | |
| | 1,918 | | | Edison International | | | 122,023 | |
| | 1,022 | | | Entergy Corp. | | | 114,975 | |
| | 1,166 | | | Evergy, Inc. | | | 73,376 | |
| | 1,710 | | | Eversource Energy | | | 143,366 | |
| | 4,959 | | | Exelon Corp. | | | 214,378 | |
| | 2,712 | | | FirstEnergy Corp. | | | 113,741 | |
| | 9,954 | | | NextEra Energy, Inc. | | | 832,154 | |
| | 2,089 | | | NiSource, Inc. | | | 57,280 | |
| | 1,164 | | | NRG Energy, Inc. | | | 37,038 | |
| | 8,134 | | | PG&E Corp.* | | | 132,259 | |
| | 601 | | | Pinnacle West Capital Corp. | | | 45,700 | |
| | 3,663 | | | PPL Corp. | | | 107,033 | |
| | 2,519 | | | Public Service Enterprise Group, Inc. | | | 154,339 | |
| | 1,559 | | | Sempra Energy | | | 240,928 | |
| | 5,330 | | | Southern Co. (The) | | | 380,615 | |
| | 1,585 | | | WEC Energy Group, Inc. | | | 148,610 | |
| | 2,743 | | | Xcel Energy, Inc. | | | 192,312 | |
| | | | | | | | |
| | | | | | | 5,110,795 | |
| | |
| | TOTAL INVESTMENTS – 99.9% | |
| | (Cost $45,620,083) | | $ | 160,726,463 | |
| | |
| OTHER ASSETS IN EXCESS OF
LIABILITIES – 0.1% | | | 212,001 | |
| | |
| | NET ASSETS – 100.0% | | $ | 160,938,464 | |
| | |
| | |
| The percentage shown for each investment category reflects the value of investments in that category as a percentage of net assets. |
| |
| * | | Non-income producing security. |
| |
| (a) | | Represents an affiliated issuer. |
| | |
| |
| Investment Abbreviations: |
| PLC | | —Public Limited Company |
| REIT | | —Real Estate Investment Trust |
ADDITIONAL INVESTMENT INFORMATION
FUTURES CONTRACTS — As of December 31, 2022, the Fund had the following futures contracts:
| | | | | | | | | | | | | | | | |
| Description | | Number of
Contracts | | | Expiration
Date | | | Notional
Amount | | | Unrealized
Appreciation/
(Depreciation) | |
| | | | |
Long position contracts: | | | | | | | | | | | | | | | | |
S&P 500 E- MINI FUTURES | | | 2 | | | | 03/17/23 | | | $ | 386,100 | | | $ | (16,431 | ) |
| | |
| The accompanying notes are an integral part of these financial statements. | | 55 |
GOLDMAN SACHS VARIABLE INSURANCE TRUST INTERNATIONAL EQUITY INSIGHTS FUND
Schedule of Investments
December 31, 2022
| | | | | | | | |
Shares | | | Description | | Value | |
|
| Common Stocks – 97.7% | |
| Australia – 9.1% | |
| | 10,630 | | | AGL Energy Ltd. (Utilities) | | $ | 58,190 | |
| | 50,140 | | | ANZ Group Holdings Ltd. (Banks)* | | | 807,701 | |
| | 6,525 | | | ASX Ltd. (Diversified Financials) | | | 300,517 | |
| | 221,604 | | | Aurizon Holdings Ltd. (Transportation) | | | 561,421 | |
| | 51,297 | | | BHP Group Ltd. (Materials) | | | 1,589,025 | |
| | 340 | | | Cochlear Ltd. (Health Care Equipment & Services) | | | 46,956 | |
| | 19,827 | | | Commonwealth Bank of Australia (Banks) | | | 1,377,082 | |
| | 3,335 | | | Glencore PLC (Materials) | | | 22,240 | |
| | 18,231 | | | IDP Education Ltd. (Consumer Services) | | | 335,984 | |
| | 8,726 | | | IGO Ltd. (Materials) | | | 79,820 | |
| | 44,178 | | | Incitec Pivot Ltd. (Materials) | | | 112,461 | |
| | 6,777 | | | Macquarie Group Ltd. (Diversified Financials) | | | 765,045 | |
| | 39,478 | | | National Australia Bank Ltd. (Banks) | | | 801,546 | |
| | 25,665 | | | Northern Star Resources Ltd. (Materials) | | | 192,059 | |
| | 29,678 | | | Orica Ltd. (Materials) | | | 303,440 | |
| | 15,596 | | | Pilbara Minerals Ltd. (Materials)* | | | 39,493 | |
| | 2,540 | | | Rio Tinto PLC ADR (Materials) | | | 180,848 | |
| | 58,735 | | | Westpac Banking Corp. (Banks) | | | 929,864 | |
| | | | | | | | |
| | | | | | | 8,503,692 | |
| | |
| Belgium – 0.7% | |
| | 2,106 | | | D’ieteren Group (Retailing) | | | 404,169 | |
| | 1,969 | | | KBC Ancora (Banks) | | | 88,734 | |
| | 1,869 | | | UCB SA (Pharmaceuticals, Biotechnology & Life Sciences) | | | 147,265 | |
| | | | | | | | |
| | | | | | | 640,168 | |
| | |
| Canada – 0.3% | |
| | 26,676 | | | International Petroleum Corp. (Energy)* | | | 299,672 | |
| | |
| China – 0.5% | |
| | 128,500 | | | BOC Hong Kong Holdings Ltd. (Banks) | | | 436,231 | |
| | 5,600 | | | Chow Tai Fook Jewellery Group Ltd. (Retailing) | | | 11,380 | |
| | | | | | | | |
| | | | | | | 447,611 | |
| | |
| Denmark – 4.3% | |
| | 206 | | | AP Moller – Maersk A/S, Class A (Transportation) | | | 453,995 | |
| | 2,073 | | | Carlsberg AS, Class B (Food, Beverage & Tobacco) | | | 274,977 | |
| | 1,928 | | | D/S Norden A/S (Transportation) | | | 116,191 | |
| | 1,949 | | | Genmab A/S (Pharmaceuticals, Biotechnology & Life Sciences)* | | | 824,027 | |
| | 2,941 | | | Jyske Bank A/S (Banks)* | | | 190,700 | |
| | 691 | | | NKT A/S (Capital Goods)* | | | 39,009 | |
| | 14,064 | | | Novo Nordisk A/S, Class B (Pharmaceuticals, Biotechnology & Life Sciences) | | | 1,910,110 | |
| | |
|
| Common Stocks – (continued) | |
| Denmark – (continued) | |
| | 10,027 | | | Spar Nord Bank A/S (Banks) | | | 153,546 | |
| | | | | | | | |
| | | | | | | 3,962,555 | |
| | |
| Finland – 1.7% | |
| | 3,142 | | | Kesko OYJ, Class B (Food & Staples Retailing) | | | 69,426 | |
| | 26,193 | | | Nokia OYJ (Technology Hardware & Equipment) | | | 121,685 | |
| | 75,139 | | | Nordea Bank Abp (Banks) | | | 804,886 | |
| | 4,710 | | | Outokumpu OYJ (Materials) | | | 23,904 | |
| | 5,201 | | | Sampo OYJ, Class A (Insurance) | | | 271,646 | |
| | 19,661 | | | Stora Enso OYJ, Class R (Materials) | | | 277,211 | |
| | | | | | | | |
| | | | | | | 1,568,758 | |
| | |
| France – 13.3% | |
| | 12,649 | | | Adevinta ASA (Media & Entertainment)* | | | 83,758 | |
| | 9,389 | | | Airbus SE (Capital Goods) | | | 1,116,376 | |
| | 6,579 | | | Carrefour SA (Food & Staples Retailing) | | | 110,040 | |
| | 650 | | | Christian Dior SE (Consumer Durables & Apparel) | | | 473,618 | |
| | 3,737 | | | Cie de Saint-Gobain (Capital Goods) | | | 182,817 | |
| | 3,329 | | | Dassault Aviation SA (Capital Goods) | | | 564,576 | |
| | 18,708 | | | Dassault Systemes (Software & Services) | | | 672,734 | |
| | 9,598 | | | Edenred (Software & Services) | | | 522,375 | |
| | 3,915 | | | Eiffage SA (Capital Goods) | | | 385,096 | |
| | 472 | | | Eramet SA (Materials) | | | 42,473 | |
| | 563 | | | Gecina SA REIT (Real Estate) | | | 57,359 | |
| | 627 | | | Hermes International (Consumer Durables & Apparel) | | | 970,504 | |
| | 1,366 | | | Kering (Consumer Durables & Apparel) | | | 695,196 | |
| | 2,603 | | | LVMH Moet Hennessy Louis Vuitton SE (Consumer Durables & Apparel) | | | 1,894,187 | |
| | 1,855 | | | Pernod Ricard SA (Food, Beverage & Tobacco) | | | 364,921 | |
| | 10,822 | | | Publicis Groupe SA (Media & Entertainment) | | | 691,335 | |
| | 7,121 | | | Rexel SA (Capital Goods)* | | | 140,843 | |
| | 6,735 | | | Safran SA (Capital Goods) | | | 843,586 | |
| | 13,737 | | | Sanofi (Pharmaceuticals, Biotechnology & Life Sciences) | | | 1,324,613 | |
| | 7,973 | | | SCOR SE (Insurance) | | | 183,708 | |
| | 28,135 | | | Societe Generale SA (Banks) | | | 705,729 | |
| | 3,217 | | | Thales SA (Capital Goods) | | | 411,033 | |
| | | | | | | | |
| | | | | | | 12,436,877 | |
| | |
| Germany – 5.9% | |
| | 17,119 | | | Bayer AG (Pharmaceuticals, Biotechnology & Life Sciences) | | | 881,117 | |
| | 2,374 | | | Beiersdorf AG (Household & Personal Products) | | | 271,282 | |
| | 79,284 | | | E.ON SE (Utilities) | | | 788,243 | |
| | 1,052 | | | Hapag-Lloyd AG (Transportation)(a)(b) | | | 198,748 | |
| | |
| | |
| 56 | | The accompanying notes are an integral part of these financial statements. |
GOLDMAN SACHS VARIABLE INSURANCE TRUST INTERNATIONAL EQUITY INSIGHTS FUND
| | | | | | | | |
Shares | | | Description | | Value | |
|
| Common Stocks – (continued) | |
| Germany – (continued) | |
| | 1,983 | | | HUGO BOSS AG (Consumer Durables & Apparel) | | $ | 114,638 | |
| | 24,098 | | | Infineon Technologies AG (Semiconductors & Semiconductor Equipment) | | | 732,385 | |
| | 20,510 | | | K+S AG (Materials) | | | 404,333 | |
| | 3,111 | | | Knorr-Bremse AG (Capital Goods) | | | 169,246 | |
| | 4,204 | | | Merck KGaA (Pharmaceuticals, Biotechnology & Life Sciences) | | | 811,122 | |
| | 2,373 | | | MTU Aero Engines AG (Capital Goods) | | | 510,516 | |
| | 2,066 | | | Rheinmetall AG (Capital Goods) | | | 411,292 | |
| | 545 | | | Siltronic AG (Semiconductors & Semiconductor Equipment) | | | 39,643 | |
| | 1,327 | | | SUESS MicroTec SE (Semiconductors & Semiconductor Equipment) | | | 21,483 | |
| | 1,040 | | | Wacker Chemie AG (Materials) | | | 132,536 | |
| | | | | | | | |
| | | | | | | 5,486,584 | |
| | |
| Hong Kong – 0.9% | |
| | 31,800 | | | Bank of East Asia Ltd. (The) (Banks) | | | 38,443 | |
| | 8,400 | | | Hong Kong Exchanges & Clearing Ltd. (Diversified Financials) | | | 360,950 | |
| | 3,000 | | | Jardine Matheson Holdings Ltd. (Capital Goods) | | | 153,000 | |
| | 24,000 | | | Sun Hung Kai Properties Ltd. (Real Estate) | | | 327,825 | |
| | | | | | | | |
| | | | | | | 880,218 | |
| | |
| Italy – 1.9% | |
| | 18,194 | | | Azimut Holding SpA (Diversified Financials) | | | 407,106 | |
| | 104,947 | | | Banco BPM SpA (Banks) | | | 374,134 | |
| | 24,321 | | | Leonardo SpA (Capital Goods) | | | 209,763 | |
| | 736 | | | Prysmian SpA (Capital Goods) | | | 27,346 | |
| | 549 | | | Reply SpA (Software & Services) | | | 62,980 | |
| | 50,094 | | | UniCredit SpA (Banks) | | | 710,812 | |
| | | | | | | | |
| | | | | | | 1,792,141 | |
| | |
| Japan – 20.5% | |
| | 21,600 | | | Air Water, Inc. (Materials) | | | 250,786 | |
| | 5,100 | | | ANA Holdings, Inc. (Transportation)* | | | 108,007 | |
| | 5,700 | | | Aoyama Trading Co. Ltd. (Retailing) | | | 39,541 | |
| | 1,000 | | | Asahi Group Holdings Ltd. (Food, Beverage & Tobacco) | | | 31,128 | |
| | 15,000 | | | Astellas Pharma, Inc. (Pharmaceuticals, Biotechnology & Life Sciences) | | | 228,085 | |
| | 9,900 | | | Canon Marketing Japan, Inc. (Technology Hardware & Equipment) | | | 224,171 | |
| | 5,600 | | | Central Japan Railway Co. (Transportation) | | | 687,566 | |
| | 26,200 | | | Chugai Pharmaceutical Co. Ltd. (Pharmaceuticals, Biotechnology & Life Sciences) | | | 668,278 | |
| | |
|
| Common Stocks – (continued) | |
| Japan – (continued) | |
| | 13,500 | | | Coca-Cola Bottlers Japan Holdings, Inc. (Food, Beverage & Tobacco) | | | 146,560 | |
| | 8,700 | | | Daiichi Sankyo Co. Ltd. (Pharmaceuticals, Biotechnology & Life Sciences) | | | 280,024 | |
| | 2,400 | | | Eagle Industry Co. Ltd. (Automobiles & Components) | | | 19,498 | |
| | 47,600 | | | ENEOS Holdings, Inc. (Energy) | | | 162,098 | |
| | 24,500 | | | Fujikura Ltd. (Capital Goods) | | | 184,167 | |
| | 3,400 | | | H2O Retailing Corp. (Retailing) | | | 33,105 | |
| | 1,000 | | | Hanwa Co. Ltd. (Capital Goods) | | | 28,255 | |
| | 5,800 | | | Heiwa Corp. (Consumer Services) | | | 109,344 | |
| | 6,800 | | | Hisamitsu Pharmaceutical Co., Inc. (Pharmaceuticals, Biotechnology & Life Sciences) | | | 201,855 | |
| | 10,100 | | | Honda Motor Co. Ltd. (Automobiles & Components) | | | 230,371 | |
| | 1,300 | | | Inui Global Logistics Co. Ltd. (Commercial & Professional Services) | | | 19,533 | |
| | 1,300 | | | IPS, Inc. (Telecommunication Services) | | | 27,450 | |
| | 26,600 | | | ITOCHU Corp. (Capital Goods) | | | 834,515 | |
| | 1,600 | | | J Front Retailing Co. Ltd. (Retailing) | | | 14,520 | �� |
| | 192 | | | Japan Metropolitan Fund Invest REIT (Real Estate) | | | 152,738 | |
| | 40,800 | | | JGC Holdings Corp. (Capital Goods) | | | 517,180 | |
| | 2,400 | | | KDDI Corp. (Telecommunication Services) | | | 72,785 | |
| | 3,900 | | | Komatsu Ltd. (Capital Goods) | | | 84,295 | |
| | 6,900 | | | Komori Corp. (Capital Goods) | | | 41,990 | |
| | 400 | | | Kose Corp. (Household & Personal Products) | | | 43,461 | |
| | 28,500 | | | Mandom Corp. (Household & Personal Products) | | | 315,357 | |
| | 70,100 | | | Marubeni Corp. (Capital Goods) | | | 803,062 | |
| | 5,100 | | | Mimasu Semiconductor Industry Co. Ltd. (Semiconductors & Semiconductor Equipment) | | | 90,192 | |
| | 1,500 | | | Miraial Co. Ltd. (Semiconductors & Semiconductor Equipment) | | | 16,182 | |
| | 26,600 | | | Mitsubishi Corp. (Capital Goods) | | | 863,564 | |
| | 3,200 | | | Mitsubishi Gas Chemical Co., Inc. (Materials) | | | 43,989 | |
| | 135,500 | | | Mitsubishi HC Capital, Inc. (Diversified Financials) | | | 666,464 | |
| | 2,500 | | | Mitsubishi Heavy Industries Ltd. (Capital Goods) | | | 98,791 | |
| | 1,500 | | | Mitsubishi Kakoki Kaisha Ltd. (Capital Goods) | | | 23,371 | |
| | 1,200 | | | Mitsubishi Shokuhin Co. Ltd. (Food & Staples Retailing) | | | 28,398 | |
| | 30,400 | | | Mitsui & Co. Ltd. (Capital Goods) | | | 885,422 | |
| | 16,600 | | | Mitsui Fudosan Co. Ltd. (Real Estate) | | | 303,398 | |
| | 10,400 | | | MS&AD Insurance Group Holdings, Inc. (Insurance) | | | 332,486 | |
| | |
| | |
| The accompanying notes are an integral part of these financial statements. | | 57 |
GOLDMAN SACHS VARIABLE INSURANCE TRUST INTERNATIONAL EQUITY INSIGHTS FUND
Schedule of Investments (continued)
December 31, 2022
| | | | | | | | |
Shares | | | Description | | Value | |
|
| Common Stocks – (continued) | |
| Japan – (continued) | |
| | 16,500 | | | NGK Spark Plug Co. Ltd. (Automobiles & Components) | | $ | 302,397 | |
| | 13,700 | | | Nippon Kayaku Co. Ltd. (Materials) | | | 117,974 | |
| | 3,800 | | | Nippon Soda Co. Ltd. (Materials) | | | 124,283 | |
| | 6,100 | | | Nippon Telegraph & Telephone Corp. (Telecommunication Services) | | | 173,963 | |
| | 2,400 | | | Nisshin Oillio Group Ltd. (The) (Food, Beverage & Tobacco) | | | 59,910 | |
| | 4,100 | | | Nissui Corp. (Food, Beverage & Tobacco) | | | 17,076 | |
| | 7,100 | | | Obayashi Corp. (Capital Goods) | | | 53,630 | |
| | 5,200 | | | Oriental Land Co. Ltd. (Consumer Services) | | | 756,726 | |
| | 43,600 | | | ORIX Corp. (Diversified Financials) | | | 697,890 | |
| | 6,100 | | | QB Net Holdings Co. Ltd. (Consumer Services)* | | | 62,185 | |
| | 29,500 | | | Round One Corp. (Consumer Services) | | | 106,769 | |
| | 2,700 | | | Saibu Gas Holdings Co. Ltd. (Utilities) | | | 34,890 | |
| | 1,000 | | | Sankyu, Inc. (Transportation) | | | 36,586 | |
| | 68,200 | | | Santen Pharmaceutical Co. Ltd. (Pharmaceuticals, Biotechnology & Life Sciences) | | | 555,723 | |
| | 5,700 | | | SBI Holdings, Inc. (Diversified Financials) | | | 108,601 | |
| | 4,000 | | | SCREEN Holdings Co. Ltd. (Semiconductors & Semiconductor Equipment) | | | 255,070 | |
| | 6,900 | | | Shikoku Electric Power Co., Inc. (Utilities) | | | 40,005 | |
| | 500 | | | Shin-Etsu Chemical Co. Ltd. (Materials) | | | 61,056 | |
| | 4,900 | | | Shionogi & Co. Ltd. (Pharmaceuticals, Biotechnology & Life Sciences) | | | 244,477 | |
| | 4,900 | | | Shiseido Co. Ltd. (Household & Personal Products) | | | 240,167 | |
| | 2,700 | | | SoftBank Group Corp. (Telecommunication Services) | | | 114,191 | |
| | 32,100 | | | Sojitz Corp. (Capital Goods) | | | 611,621 | |
| | 2,000 | | | Sompo Holdings, Inc. (Insurance) | | | 88,486 | |
| | 41,100 | | | SUMCO Corp. (Semiconductors & Semiconductor Equipment) | | | 544,517 | |
| | 42,300 | | | Sumitomo Corp. (Capital Goods) | | | 703,157 | |
| | 1,100 | | | Sumitomo Heavy Industries Ltd. (Capital Goods) | | | 21,961 | |
| | 52,600 | | | Sumitomo Pharma Co. Ltd. (Pharmaceuticals, Biotechnology & Life Sciences) | | | 398,689 | |
| | 1,400 | | | Taisho Pharmaceutical Holdings Co. Ltd. (Pharmaceuticals, Biotechnology & Life Sciences) | | | 61,581 | |
| | 13,200 | | | Takeda Pharmaceutical Co. Ltd. (Pharmaceuticals, Biotechnology & Life Sciences) | | | 412,456 | |
| | 8,900 | | | Takuma Co. Ltd. (Capital Goods) | | | 82,947 | |
| | 10,100 | | | Toho Gas Co. Ltd. (Utilities) | | | 192,235 | |
| | |
|
| Common Stocks – (continued) | |
| Japan – (continued) | |
| | 6,800 | | | Tohoku Electric Power Co., Inc. (Utilities) | | | 35,619 | |
| | 15,200 | | | Tokyo Century Corp. (Diversified Financials) | | | 512,350 | |
| | 400 | | | Tokyo Electron Ltd. (Semiconductors & Semiconductor Equipment) | | | 117,531 | |
| | 36,400 | | | Tokyo Gas Co. Ltd. (Utilities) | | | 712,705 | |
| | 80,800 | | | Tokyu Fudosan Holdings Corp. (Real Estate) | | | 383,164 | |
| | 3,300 | | | Toyota Motor Corp. (Automobiles & Components) | | | 45,020 | |
| | 1,400 | | | Transcosmos, Inc. (Software & Services) | | | 34,380 | |
| | 10,300 | | | Xebio Holdings Co. Ltd. (Retailing) | | | 71,636 | |
| | 2,500 | | | Yamaichi Electronics Co. Ltd. (Semiconductors & Semiconductor Equipment) | | | 32,100 | |
| | | | | | | | |
| | | | | | | 19,137,706 | |
| | |
| Macau – 0.1% | |
| | 20,000 | | | Sands China Ltd. (Consumer Services)* | | | 65,605 | |
| | |
| Netherlands – 5.5% | |
| | 3,639 | | | ASML Holding NV (Semiconductors & Semiconductor Equipment) | | | 1,984,174 | |
| | 7,381 | | | Heineken NV (Food, Beverage & Tobacco) | | | 695,233 | |
| | 71,878 | | | ING Groep NV (Banks) | | | 875,558 | |
| | 7,769 | | | OCI NV (Materials) | | | 277,761 | |
| | 47,276 | | | Shell PLC (Energy) | | | 1,340,625 | |
| | | | | | | | |
| | | | | | | 5,173,351 | |
| | |
| Norway – 2.1% | |
| | 33,859 | | | Aker Solutions ASA (Energy) | | | 130,407 | |
| | 1,328 | | | DNB Bank ASA (Banks) | | | 26,228 | |
| | 15,816 | | | Elkem ASA (Materials)*(b) | | | 56,927 | |
| | 21,259 | | | Equinor ASA (Energy) | | | 764,055 | |
| | 14,027 | | | Kongsberg Gruppen ASA (Capital Goods) | | | 597,042 | |
| | 62,845 | | | MPC Container Ships ASA (Transportation) | | | 103,653 | |
| | 65,486 | | | Odfjell Drilling Ltd. (Energy)* | | | 177,738 | |
| | 104,579 | | | PGS ASA (Energy)* | | | 76,168 | |
| | | | | | | | |
| | | | | | | 1,932,218 | |
| | |
| Singapore – 0.8% | |
| | 84,200 | | | Oversea-Chinese Banking Corp. Ltd. (Banks) | | | 765,886 | |
| | |
| South Africa – 0.9% | |
| | 22,036 | | | Anglo American PLC (Materials) | | | 862,927 | |
| | |
| | |
| 58 | | The accompanying notes are an integral part of these financial statements. |
GOLDMAN SACHS VARIABLE INSURANCE TRUST INTERNATIONAL EQUITY INSIGHTS FUND
| | | | | | | | |
Shares | | | Description | | Value | |
|
| Common Stocks – (continued) | |
| Spain – 2.4% | |
| | 12,367 | | | Bankinter SA (Banks) | | $ | 82,853 | |
| | 20,161 | | | Ence Energia y Celulosa SA (Materials) | | | 60,651 | |
| | 67,062 | | | Iberdrola SA (Utilities) | | | 782,849 | |
| | 22,357 | | | Industria de Diseno Textil SA (Retailing) | | | 593,826 | |
| | 36,266 | | | Merlin Properties Socimi SA REIT (Real Estate) | | | 340,135 | |
| | 17,579 | | | Red Electrica Corp. SA (Utilities) | | | 305,667 | |
| | 34,696 | | | Unicaja Banco SA (Banks)(b) | | | 38,232 | |
| | | | | | | | |
| | | | | | | 2,204,213 | |
| | |
| Sweden – 5.1% | |
| | 6,038 | | | Epiroc AB, Class B (Capital Goods) | | | 97,135 | |
| | 4,732 | | | Evolution AB (Consumer Services)(b) | | | 460,918 | |
| | 39,908 | | | Investor AB, Class B (Diversified Financials) | | | 722,373 | |
| | 52,259 | | | Skandinaviska Enskilda Banken AB, Class A (Banks) | | | 601,651 | |
| | 27,882 | | | SSAB AB, Class B (Materials) | | | 145,239 | |
| | 46,591 | | | Swedbank AB, Class A (Banks) | | | 792,470 | |
| | 24,663 | | | Swedish Orphan Biovitrum AB (Pharmaceuticals, Biotechnology & Life Sciences)* | | | 510,449 | |
| | 92,864 | | | Telefonaktiebolaget LM Ericsson, Class B (Technology Hardware & Equipment) | | | 544,128 | |
| | 7,193 | | | Trelleborg AB, Class B (Capital Goods) | | | 166,148 | |
| | 39,056 | | | Volvo AB, Class B (Capital Goods) | | | 705,492 | |
| | | | | | | | |
| | | | | | | 4,746,003 | |
| | |
| Switzerland – 5.1% | |
| | 404 | | | Bucher Industries AG (Capital Goods) | | | 168,601 | |
| | 28 | | | Chocoladefabriken Lindt & Spruengli AG (Food, Beverage & Tobacco) | | | 285,321 | |
| | 4 | | | Chocoladefabriken Lindt & Spruengli AG (Food, Beverage & Tobacco) | | | 411,534 | |
| | 8,770 | | | Cie Financiere Richemont SA (Consumer Durables & Apparel) | | | 1,137,118 | |
| | 1,709 | | | DKSH Holding AG (Commercial & Professional Services) | | | 129,599 | |
| | 937 | | | Implenia AG (Capital Goods)* | | | 38,654 | |
| | 13,148 | | | Novartis AG (Pharmaceuticals, Biotechnology & Life Sciences) | | | 1,189,860 | |
| | 535 | | | Schindler Holding AG (Capital Goods) | | | 96,488 | |
| | 5,290 | | | Swatch Group AG (The) – Registered (Consumer Durables & Apparel) | | | 275,064 | |
| | 56,731 | | | UBS Group AG (Diversified Financials) | | | 1,054,415 | |
| | | | | | | | |
| | | | | | | 4,786,654 | |
| | |
| United Kingdom – 10.0% | |
| | 3,120 | | | AstraZeneca PLC ADR (Pharmaceuticals, Biotechnology & Life Sciences) | | | 211,536 | |
| | 109,003 | | | Aviva PLC (Insurance) | | | 578,222 | |
| | |
|
| Common Stocks – (continued) | |
| United Kingdom – (continued) | |
| | 1,367 | | | BAE Systems PLC (Capital Goods) | | | 14,119 | |
| | 15,198 | | | BP PLC ADR (Energy) | | | 530,866 | |
| | 30,013 | | | British American Tobacco PLC (Food, Beverage & Tobacco) | | | 1,187,259 | |
| | 21,000 | | | CK Hutchison Holdings Ltd. (Capital Goods) | | | 125,808 | |
| | 33,084 | | | Compass Group PLC (Consumer Services) | | | 763,977 | |
| | 907 | | | DCC PLC (Capital Goods) | | | 44,599 | |
| | 29,104 | | | Diageo PLC (Food, Beverage & Tobacco) | | | 1,273,937 | |
| | 14,609 | | | DS Smith PLC (Materials) | | | 56,353 | |
| | 33,369 | | | Imperial Brands PLC (Food, Beverage & Tobacco) | | | 831,260 | |
| | 3,743 | | | Inchcape PLC (Retailing) | | | 36,956 | |
| | 1,579 | | | Intermediate Capital Group PLC (Diversified Financials) | | | 21,801 | |
| | 1,298 | | | Intertek Group PLC (Commercial & Professional Services) | | | 63,151 | |
| | 9,089 | | | M&G PLC (Diversified Financials) | | | 20,553 | |
| | 62,189 | | | NatWest Group PLC (Banks) | | | 198,335 | |
| | 8,859 | | | Next PLC (Retailing) | | | 620,757 | |
| | 45,828 | | | Pearson PLC (Consumer Services) | | | 517,481 | |
| | 4,512 | | | Reckitt Benckiser Group PLC (Household & Personal Products) | | | 312,755 | |
| | 26,756 | | | Smiths Group PLC (Capital Goods) | | | 513,503 | |
| | 37,547 | | | SSE PLC (Utilities) | | | 772,227 | |
| | 61,591 | | | Vodafone Group PLC ADR (Telecommunication Services) | | | 623,301 | |
| | | | | | | | |
| | | | | | | 9,318,756 | |
| | |
| United States – 6.6% | |
| | 34,183 | | | Computershare Ltd. (Software & Services) | | | 602,169 | |
| | 2,762 | | | CSL Ltd. (Pharmaceuticals, Biotechnology & Life Sciences) | | | 538,574 | |
| | 30,041 | | | GSK PLC ADR (Pharmaceuticals, Biotechnology & Life Sciences) | | | 1,055,641 | |
| | 8,394 | | | Nestle SA (Food, Beverage & Tobacco) | | | 969,586 | |
| | 6,324 | | | Roche Holding AG (Pharmaceuticals, Biotechnology & Life Sciences) | | | 1,987,238 | |
| | 161 | | | Roche Holding AG (Pharmaceuticals, Biotechnology & Life Sciences) | | | 62,387 | |
| | 122,400 | | | Samsonite International SA (Consumer Durables & Apparel)*(b) | | | 321,387 | |
| | 42,709 | | | Stellantis NV (Automobiles & Components)* | | | 606,911 | |
| | | | | | | | |
| | | | | | | 6,143,893 | |
| | |
| | TOTAL COMMON STOCKS | |
| | (Cost $88,615,453) | | $ | 91,155,488 | |
| | |
| | |
| The accompanying notes are an integral part of these financial statements. | | 59 |
GOLDMAN SACHS VARIABLE INSURANCE TRUST INTERNATIONAL EQUITY INSIGHTS FUND
Schedule of Investments (continued)
December 31, 2022
| | | | | | | | | | | | |
Shares | | | Description | | Rate | | | Value | |
|
| Preferred Stock – 0.5% | |
| Germany – 0.5% | | | | |
| | 8,714 | | | Porsche Automobil Holding SE (Automobiles & Components) | | | | | | | | |
| | (Cost $648,860) | | | 4.66% | | | $ | 475,226 | |
| | |
| TOTAL INVESTMENTS BEFORE SECURITIES LENDING
REINVESTMENT VEHICLE |
|
| | (Cost $89,264,313) | | | | | | $ | 91,630,714 | |
| | |
| | | | | | | | |
| Shares | | | Dividend
Rate | | Value | |
|
| Securities Lending Reinvestment Vehicle – 0.2%(c) | |
| Goldman Sachs Financial Square Government Fund —
Institutional Shares |
|
| | 166,392 | | | 4.159% | | $ | 166,392 | |
| | (Cost $166,392) | |
| | |
| | TOTAL INVESTMENTS – 98.4% | |
| | (Cost $89,430,705) | | $ | 91,797,106 | |
| | |
| OTHER ASSETS IN EXCESS OF
LIABILITIES – 1.6% | | | 1,526,897 | |
| | |
| | NET ASSETS – 100.0% | | $ | 93,324,003 | |
| | |
| | |
| The percentage shown for each investment category reflects the value of investments in that category as a percentage of net assets. |
| |
| * | | Non-income producing security. |
| |
| (a) | | All or a portion of security is on loan. |
| |
| (b) | | Exempt from registration under Rule 144A of the Securities Act of 1933. |
| |
| (c) | | Represents an affiliated issuer. |
| | |
| |
| Investment Abbreviations: |
| ADR | | —American Depositary Receipt |
| PLC | | —Public Limited Company |
| REIT | | —Real Estate Investment Trust |
| | | | |
| Sector Name | | % of Market
Value | |
Financials | | | 19.5 | % |
Industrials | | | 17.5 | |
Health Care | | | 15.9 | |
Consumer Discretionary | | | 13.7 | |
Consumer Staples | | | 8.6 | |
Information Technology | | | 7.2 | |
Materials | | | 5.9 | |
Utilities | | | 4.1 | |
Energy | | | 3.8 | |
Communication Services | | | 1.9 | |
Real Estate | | | 1.7 | |
Securities Lending Reinvestment Vehicle | | | 0.2 | |
| |
| TOTAL INVESTMENTS | | | 100.0 | % |
ADDITIONAL INVESTMENT INFORMATION
FUTURES CONTRACTS — As of December 31, 2022, the Fund had the following futures contracts:
| | | | | | | | | | | | | | | | |
| Description | | Number of
Contracts | | | Expiration
Date | | | Notional
Amount | | | Unrealized
Appreciation/
(Depreciation) | |
| | | | |
Long position contracts: | | | | | | | | | | | | | | | | |
| EURO STOXX 50 Index | | | 10 | | | | 03/17/23 | | | $ | 405,166 | | | $ | (15,246 | ) |
| FTSE 100 Index | | | 2 | | | | 03/17/23 | | | | 180,520 | | | | 321 | |
| MSCI Singapore Index | | | 1 | | | | 01/30/23 | | | | 21,693 | | | | 50 | |
| SPI 200 Index | | | 1 | | | | 03/16/23 | | | | 119,013 | | | | (2,131 | ) |
TOPIX Index | | | 2 | | | | 03/09/23 | | | | 288,251 | | | | (7,826 | ) |
| | | |
| Total Futures Contracts | | | | | | | | | | | $ | (24,832 | ) |
| | |
| 60 | | The accompanying notes are an integral part of these financial statements. |
GOLDMAN SACHS VARIABLE INSURANCE TRUST LARGE CAP VALUE FUND
Schedule of Investments
December 31, 2022
| | | | | | | | |
Shares | | | Description | | Value | |
|
| Common Stocks – 99.1% | |
| Automobiles & Components – 1.4% | |
| | 164,947 | | | General Motors Co. | | $ | 5,548,817 | |
| | |
| Banks – 6.5% | |
| | 269,382 | | | Bank of America Corp. | | | 8,921,932 | |
| | 17,329 | | | First Republic Bank | | | 2,112,232 | |
| | 90,534 | | | JPMorgan Chase & Co. | | | 12,140,609 | |
| | 13,428 | | | M&T Bank Corp. | | | 1,947,866 | |
| | | | | | | | |
| | | | | | | 25,122,639 | |
| | |
| Capital Goods – 7.4% | |
| | 22,521 | | | Caterpillar, Inc. | | | 5,395,131 | |
| | 33,547 | | | Eaton Corp. PLC | | | 5,265,202 | |
| | 60,380 | | | General Electric Co. | | | 5,059,240 | |
| | 9,521 | | | Illinois Tool Works, Inc. | | | 2,097,476 | |
| | 26,583 | | | L3Harris Technologies, Inc. | | | 5,534,846 | |
| | 65,171 | | | Stanley Black & Decker, Inc. | | | 4,895,646 | |
| | | | | | | | |
| | | | | | | 28,247,541 | |
| | |
| Commercial & Professional Services – 0.6% | |
| | 17,413 | | | Waste Connections, Inc. | | | 2,308,267 | |
| | |
| Consumer Services – 1.2% | |
| | 17,495 | | | McDonald’s Corp. | | | 4,610,457 | |
| | |
| Diversified Financials – 7.1% | |
| | 14,790 | | | Berkshire Hathaway, Inc., Class B* | | | 4,568,631 | |
| | 9,255 | | | BlackRock, Inc. | | | 6,558,371 | |
| | 48,278 | | | Charles Schwab Corp. (The) | | | 4,019,626 | |
| | 91,616 | | | Morgan Stanley | | | 7,789,192 | |
| | 68,596 | | | Nasdaq, Inc. | | | 4,208,365 | |
| | | | | | | | |
| | | | | | | 27,144,185 | |
| | |
| Energy – 7.5% | |
| | 26,071 | | | Chesapeake Energy Corp. | | | 2,460,320 | |
| | 66,576 | | | ConocoPhillips | | | 7,855,968 | |
| | 18,029 | | | EOG Resources, Inc. | | | 2,335,116 | |
| | 111,990 | | | Exxon Mobil Corp. | | | 12,352,497 | |
| | 27,901 | | | Hess Corp. | | | 3,956,920 | |
| | | | | | | | |
| | | | | | | 28,960,821 | |
| | |
| Food & Staples Retailing – 2.1% | |
| | 57,981 | | | Walmart, Inc. | | | 8,221,126 | |
| | |
| Food, Beverage & Tobacco – 2.9% | |
| | 26,886 | | | Archer-Daniels-Midland Co. | | | 2,496,365 | |
| | 49,457 | | | Coca-Cola Co. (The) | | | 3,145,960 | |
| | 29,505 | | | General Mills, Inc. | | | 2,473,994 | |
| | 74,416 | | | Kraft Heinz Co. (The) | | | 3,029,476 | |
| | | | | | | | |
| | | | | | | 11,145,795 | |
| | |
| Health Care Equipment & Services – 9.1% | |
| | 126,836 | | | Boston Scientific Corp.* | | | 5,868,702 | |
| | 44,970 | | | Centene Corp.* | | | 3,687,990 | |
| | 8,839 | | | Cooper Cos., Inc. (The) | | | 2,922,792 | |
| | 82,902 | | | CVS Health Corp. | | | 7,725,638 | |
| | 26,302 | | | Edwards Lifesciences Corp.* | | | 1,962,392 | |
| | 4,564 | | | Humana, Inc. | | | 2,337,635 | |
| | 49,246 | | | Medtronic PLC | | | 3,827,399 | |
| | |
|
| Common Stocks – (continued) | |
| Health Care Equipment & Services – (continued) | |
| | 51,180 | | | Zimmer Biomet Holdings, Inc. | | | 6,525,450 | |
| | | | | | | | |
| | | | | | | 34,857,998 | |
| | |
| Household & Personal Products – 1.8% | |
| | 57,907 | | | Colgate-Palmolive Co. | | | 4,562,493 | |
| | 15,502 | | | Procter & Gamble Co. (The) | | | 2,349,483 | |
| | | | | | | | |
| | | | | | | 6,911,976 | |
| | |
| Insurance – 4.3% | |
| | 20,755 | | | Chubb Ltd. | | | 4,578,553 | |
| | 33,586 | | | Globe Life, Inc. | | | 4,048,792 | |
| | 68,384 | | | MetLife, Inc. | | | 4,948,950 | |
| | 22,197 | | | Progressive Corp. (The) | | | 2,879,173 | |
| | | | | | | | |
| | | | | | | 16,455,468 | |
| | |
| Materials – 6.1% | |
| | 31,323 | | | Ashland, Inc. | | | 3,368,162 | |
| | 59,200 | | | Ball Corp. | | | 3,027,488 | |
| | 145,452 | | | Freeport-McMoRan, Inc. | | | 5,527,176 | |
| | 19,909 | | | Linde PLC (United Kingdom) | | | 6,493,918 | |
| | 14,252 | | | Martin Marietta Materials, Inc. | | | 4,816,748 | |
| | | | | | | | |
| | | | | | | 23,233,492 | |
| | |
| Media & Entertainment – 4.2% | |
| | 25,339 | | | Alphabet, Inc., Class A* | | | 2,235,660 | |
| | 22,077 | | | Electronic Arts, Inc. | | | 2,697,368 | |
| | 32,309 | | | Meta Platforms, Inc., Class A* | | | 3,888,065 | |
| | 112,213 | | | New York Times Co. (The), Class A | | | 3,642,434 | |
| | 24,533 | | | Omnicom Group, Inc. | | | 2,001,157 | |
| | 191,066 | | | Snap, Inc., Class A* | | | 1,710,040 | |
| | | | | | | | |
| | | | | | | 16,174,724 | |
| | |
| Pharmaceuticals, Biotechnology & Life Sciences – 8.7% | |
| | 3,983 | | | Argenx SE ADR (Netherlands)* | | | 1,508,880 | |
| | 28,270 | | | AstraZeneca PLC ADR (United Kingdom) | | | 1,916,706 | |
| | 118,039 | | | Bristol-Myers Squibb Co. | | | 8,492,906 | |
| | 74,377 | | | Gilead Sciences, Inc. | | | 6,385,265 | |
| | 75,223 | | | Johnson & Johnson | | | 13,288,143 | |
| | 15,357 | | | Neurocrine Biosciences, Inc.* | | | 1,834,240 | |
| | | | | | | | |
| | | | | | | 33,426,140 | |
| | |
| Real Estate – 3.0% | |
| | 20,340 | | | Alexandria Real Estate Equities, Inc. REIT | | | 2,962,928 | |
| | 15,695 | | | American Tower Corp. REIT | | | 3,325,143 | |
| | 18,699 | | | AvalonBay Communities, Inc. REIT | | | 3,020,262 | |
| | 31,223 | | | Boston Properties, Inc. REIT | | | 2,110,050 | |
| | | | | | | | |
| | | | | | | 11,418,383 | |
| | |
| Retailing – 4.2% | |
| | 17,283 | | | Amazon.com, Inc.* | | | 1,451,772 | |
| | 82,993 | | | Foot Locker, Inc. | | | 3,136,306 | |
| | 59,829 | | | Ross Stores, Inc. | | | 6,944,352 | |
| | 31,552 | | | Target Corp. | | | 4,702,510 | |
| | | | | | | | |
| | | | | | | 16,234,940 | |
| | |
| | |
| The accompanying notes are an integral part of these financial statements. | | 61 |
GOLDMAN SACHS VARIABLE INSURANCE TRUST LARGE CAP VALUE FUND
Schedule of Investments (continued)
December 31, 2022
| | | | | | | | |
Shares | | | Description | | Value | |
|
| Common Stocks – (continued) | |
| Semiconductors & Semiconductor Equipment – 2.2% | |
| | 11,648 | | | KLA Corp. | | $ | 4,391,646 | |
| | 62,112 | | | ON Semiconductor Corp.* | | | 3,873,925 | |
| | | | | | | | |
| | | | | | | 8,265,571 | |
| | |
| Software & Services – 6.0% | |
| | 8,764 | | | Adobe, Inc.* | | | 2,949,349 | |
| | 57,289 | | | Fidelity National Information Services, Inc. | | | 3,887,059 | |
| | 25,007 | | | International Business Machines Corp. | | | 3,523,236 | |
| | 72,015 | | | PayPal Holdings, Inc.* | | | 5,128,908 | |
| | 43,791 | | | Salesforce, Inc.* | | | 5,806,249 | |
| | 15,944 | | | Zscaler, Inc.* | | | 1,784,133 | |
| | | | | | | | |
| | | | | | | 23,078,934 | |
| | |
| Technology Hardware & Equipment – 2.1% | |
| | 120,171 | | | Cisco Systems, Inc. | | | 5,724,946 | |
| | 13,651 | | | Keysight Technologies, Inc.* | | | 2,335,277 | |
| | | | | | | | |
| | | | | | | 8,060,223 | |
| | |
| Telecommunication Services – 1.8% | |
| | 373,449 | | | AT&T, Inc. | | | 6,875,196 | |
| | |
| Transportation – 3.0% | |
| | 23,336 | | | Norfolk Southern Corp. | | | 5,750,457 | |
| | 10,959 | | | Old Dominion Freight Line, Inc. | | | 3,109,945 | |
| | 69,294 | | | United Airlines Holdings, Inc.* | | | 2,612,384 | |
| | | | | | | | |
| | | | | | | 11,472,786 | |
| | |
| Utilities – 5.9% | |
| | 60,958 | | | Ameren Corp. | | | 5,420,385 | |
| | 31,378 | | | Atmos Energy Corp. | | | 3,516,533 | |
| | 34,991 | | | CMS Energy Corp. | | | 2,215,980 | |
| | 86,141 | | | NextEra Energy, Inc. | | | 7,201,388 | |
| | 58,984 | | | Xcel Energy, Inc. | | | 4,135,368 | |
| | | | | | | | |
| | | | | | | 22,489,654 | |
| | |
| | TOTAL COMMON STOCKS | |
| | (Cost $336,321,975) | | $ | 380,265,133 | |
| | |
| | | | | | |
| Shares | | Dividend
Rate | | Value | |
|
| Investment Company – 0.1%(a) | |
Goldman Sachs Financial Square Government Fund — Institutional Shares | |
| 394,821 | | 4.159% | | $ | 394,821 | |
| (Cost $394,821) | |
| |
| TOTAL INVESTMENTS – 99.2% | |
| (Cost $336,716,796) | | $ | 380,659,954 | |
| |
OTHER ASSETS IN EXCESS OF LIABILITIES – 0.8% | | | 2,875,682 | |
| |
| NET ASSETS – 100.0% | | $ | 383,535,636 | |
| |
| | |
| The percentage shown for each investment category reflects the value of investments in that category as a percentage of net assets. |
| |
| * | | Non-income producing security. |
| |
| (a) | | Represents an affiliated issuer. |
| | |
| |
| Investment Abbreviations: |
| ADR | | —American Depositary Receipt |
| PLC | | —Public Limited Company |
| REIT | | —Real Estate Investment Trust |
| | |
| 62 | | The accompanying notes are an integral part of these financial statements. |
GOLDMAN SACHS VARIABLE INSURANCE TRUST MID CAP GROWTH FUND
Schedule of Investments
December 31, 2022
| | | | | | | | |
| Shares | | |
Description | | Value | |
|
| Common Stocks – 94.7% | |
| Automobiles & Components – 1.8% | |
| | 9,955 | | | Aptiv PLC* | | $ | 927,109 | |
| | |
| Banks – 1.3% | |
| | 5,484 | | | First Republic Bank | | | 668,445 | |
| | |
| Capital Goods – 13.5% | |
| | 6,138 | | | AMETEK, Inc. | | | 857,601 | |
| | 5,264 | | | Chart Industries, Inc.* | | | 606,571 | |
| | 3,971 | | | Cummins, Inc. | | | 962,134 | |
| | 7,724 | | | Fortive Corp. | | | 496,267 | |
| | 7,393 | | | ITT, Inc. | | | 599,572 | |
| | 5,986 | | | Rockwell Automation, Inc. | | | 1,541,814 | |
| | 5,718 | | | Trane Technologies PLC | | | 961,139 | |
| | 5,663 | | | Woodward, Inc. | | | 547,102 | |
| | 4,776 | | | Xylem, Inc. | | | 528,082 | |
| | | | | | | | |
| | | | | | | 7,100,282 | |
| | |
| Commercial & Professional Services – 1.4% | |
| | 9,724 | | | CoStar Group, Inc.* | | | 751,471 | |
| | |
| Consumer Durables & Apparel – 2.4% | |
| | 3,985 | | | Lululemon Athletica, Inc.* | | | 1,276,714 | |
| | |
| Consumer Services – 3.0% | |
| | 2,089 | | | Domino’s Pizza, Inc. | | | 723,630 | |
| | 9,877 | | | Expedia Group, Inc.* | | | 865,225 | |
| | | | | | | | |
| | | | | | | 1,588,855 | |
| | |
| Diversified Financials – 2.1% | |
| | 2,792 | | | Discover Financial Services | | | 273,141 | |
| | 1,249 | | | MSCI, Inc. | | | 580,997 | |
| | 3,779 | | | Tradeweb Markets, Inc., Class A | | | 245,371 | |
| | | | | | | | |
| | | | | | | 1,099,509 | |
| | |
| Energy – 4.5% | |
| | 5,948 | | | Cheniere Energy, Inc. | | | 891,962 | |
| | 7,107 | | | Devon Energy Corp. | | | 437,152 | |
| | 4,256 | | | Hess Corp. | | | 603,586 | |
| | 5,837 | | | Targa Resources Corp. | | | 429,019 | |
| | | | | | | | |
| | | | | | | 2,361,719 | |
| | |
| Food, Beverage & Tobacco – 3.2% | |
| | 9,848 | | | McCormick & Co., Inc. | | | 816,301 | |
| | 55,070 | | | Utz Brands, Inc. | | | 873,410 | |
| | | | | | | | |
| | | | | | | 1,689,711 | |
| | |
| Health Care Equipment & Services – 11.8% | |
| | 1,025 | | | Align Technology, Inc.* | | | 216,173 | |
| | 6,364 | | | AmerisourceBergen Corp. | | | 1,054,578 | |
| | 836 | | | Cooper Cos., Inc. (The) | | | 276,440 | |
| | 13,325 | | | Dexcom, Inc.* | | | 1,508,923 | |
| | 4,424 | | | Insulet Corp.* | | | 1,302,381 | |
| | 6,415 | | | Veeva Systems, Inc., Class A* | | | 1,035,253 | |
| | 6,382 | | | Zimmer Biomet Holdings, Inc. | | | 813,705 | |
| | | | | | | | |
| | | | | | | 6,207,453 | |
| | |
| Materials – 7.7% | |
| | 5,647 | | | Ashland, Inc. | | | 607,222 | |
| | |
|
| Common Stocks – (continued) | |
| Materials – (continued) | |
| | 1,499 | | | Avery Dennison Corp. | | | 271,319 | |
| | 18,246 | | | Ball Corp. | | | 933,100 | |
| | 14,050 | | | Freeport-McMoRan, Inc. | | | 533,900 | |
| | 2,487 | | | Martin Marietta Materials, Inc. | | | 840,531 | |
| | 6,675 | | | PPG Industries, Inc. | | | 839,315 | |
| | | | | | | | |
| | | | | | | 4,025,387 | |
| | |
| Media & Entertainment – 3.1% | |
| | 8,785 | | | Live Nation Entertainment, Inc.* | | | 612,666 | |
| | 27,257 | | | Snap, Inc., Class A* | | | 243,950 | |
| | 10,892 | | | Trade Desk, Inc. (The), Class A* | | | 488,289 | |
| | 27,750 | | | Warner Bros Discovery, Inc.* | | | 263,070 | |
| | | | | | | | |
| | | | | | | 1,607,975 | |
| | |
| Pharmaceuticals, Biotechnology & Life Sciences – 11.3% | |
| | 2,843 | | | Alnylam Pharmaceuticals, Inc.* | | | 675,639 | |
| | 678 | | | Argenx SE ADR (Netherlands)* | | | 256,847 | |
| | 3,998 | | | BioMarin Pharmaceutical, Inc.* | | | 413,753 | |
| | 12,774 | | | Catalent, Inc.* | | | 574,958 | |
| | 831 | | | Mettler-Toledo International, Inc.* | | | 1,201,169 | |
| | 6,362 | | | Neurocrine Biosciences, Inc.* | | | 759,877 | |
| | 4,470 | | | Sarepta Therapeutics, Inc.* | | | 579,223 | |
| | 5,052 | | | Seagen, Inc.* | | | 649,232 | |
| | 3,389 | | | West Pharmaceutical Services, Inc. | | | 797,601 | |
| | | | | | | | |
| | | | | | | 5,908,299 | |
| | |
| Real Estate – 1.2% | |
| | 4,748 | | | Ryman Hospitality Properties, Inc. REIT | | | 388,291 | |
| | 795 | | | SBA Communications Corp. REIT | | | 222,847 | |
| | | | | | | | |
| | | | | | | 611,138 | |
| | |
| Retailing – 5.7% | |
| | 5,624 | | | Burlington Stores, Inc.* | | | 1,140,322 | |
| | 6,882 | | | Etsy, Inc.* | | | 824,326 | |
| | 1,337 | | | RH* | | | 357,233 | |
| | 1,396 | | | Ulta Beauty, Inc.* | | | 654,822 | |
| | | | | | | | |
| | | | | | | 2,976,703 | |
| | |
| Semiconductors & Semiconductor Equipment – 4.3% | |
| | 3,111 | | | Enphase Energy, Inc.* | | | 824,291 | |
| | 7,121 | | | Entegris, Inc. | | | 467,066 | |
| | 4,868 | | | MKS Instruments, Inc. | | | 412,466 | |
| | 8,974 | | | ON Semiconductor Corp.* | | | 559,708 | |
| | | | | | | | |
| | | | | | | 2,263,531 | |
| | |
| Software & Services – 10.3% | |
| | 4,170 | | | Bill.com Holdings, Inc.* | | | 454,363 | |
| | 8,773 | | | Cadence Design Systems, Inc.* | | | 1,409,295 | |
| | 5,524 | | | Datadog, Inc., Class A* | | | 406,014 | |
| | 16,732 | | | Dynatrace, Inc.* | | | 640,836 | |
| | 2,033 | | | HubSpot, Inc.* | | | 587,801 | |
| | 2,268 | | | Jack Henry & Associates, Inc. | | | 398,170 | |
| | 1,370 | | | Palo Alto Networks, Inc.* | | | 191,170 | |
| | 2,170 | | | Paycom Software, Inc.* | | | 673,373 | |
| | 5,726 | | | Zscaler, Inc.* | | | 640,739 | |
| | | | | | | | |
| | | | | | | 5,401,761 | |
| | |
| | |
| The accompanying notes are an integral part of these financial statements. | | 63 |
GOLDMAN SACHS VARIABLE INSURANCE TRUST MID CAP GROWTH FUND
Schedule of Investments (continued)
December 31, 2022
| | | | | | | | |
| Shares | | |
Description | | Value | |
|
| Common Stocks – (continued) | |
| Technology Hardware & Equipment – 4.0% | |
| | 10,818 | | | Amphenol Corp., Class A | | $ | 823,683 | |
| | 7,446 | | | Keysight Technologies, Inc.* | | | 1,273,787 | |
| | | | | | | | |
| | | | | | | 2,097,470 | |
| | |
| Transportation – 2.1% | |
| | 2,628 | | | Old Dominion Freight Line, Inc. | | | 745,774 | |
| | 1,608 | | | Saia, Inc.* | | | 337,165 | |
| | | | | | | | |
| | | | | | | 1,082,939 | |
| | |
| | TOTAL COMMON STOCKS | |
| | (Cost $44,383,098) | | $ | 49,646,471 | |
| | |
| | | | | | |
| Shares | | Dividend
Rate | | Value | |
|
| Investment Company – 5.5%(a) | |
Goldman Sachs Financial Square Government Fund — Institutional Shares | |
| 2,865,404 | | 4.159% | | $ | 2,865,404 | |
| (Cost $2,865,404) | |
| |
| TOTAL INVESTMENTS – 100.2% | |
| (Cost $47,248,502) | | $ | 52,511,875 | |
| |
LIABILITIES IN EXCESS OF OTHER ASSETS – (0.2)% | | | (94,080 | ) |
| |
| NET ASSETS – 100.0% | | $ | 52,417,795 | |
| |
| | |
| The percentage shown for each investment category reflects the value of investments in that category as a percentage of net assets. |
| |
| * | | Non-income producing security. |
| |
| (a) | | Represents an affiliated issuer. |
| | |
| |
| Investment Abbreviations: |
| ADR | | —American Depositary Receipt |
| PLC | | —Public Limited Company |
| REIT | | —Real Estate Investment Trust |
| | |
| 64 | | The accompanying notes are an integral part of these financial statements. |
GOLDMAN SACHS VARIABLE INSURANCE TRUST MID CAP VALUE FUND
Schedule of Investments
December 31, 2022
| | | | | | | | |
Shares | | | Description | | Value | |
|
| Common Stocks – 99.9% | |
| Automobiles & Components – 0.4% | |
| | 18,564 | | | Aptiv PLC* | | $ | 1,728,865 | |
| | |
| Banks – 4.5% | |
| | 52,006 | | | Citizens Financial Group, Inc. | | | 2,047,476 | |
| | 79,922 | | | East West Bancorp, Inc. | | | 5,266,860 | |
| | 28,097 | | | First Republic Bank | | | 3,424,744 | |
| | 31,533 | | | M&T Bank Corp. | | | 4,574,177 | |
| | 39,603 | | | Pinnacle Financial Partners, Inc. | | | 2,906,860 | |
| | | | | | | | |
| | | | | | | 18,220,117 | |
| | |
| Capital Goods – 14.7% | |
| | 30,522 | | | Allegion PLC | | | 3,212,746 | |
| | 37,312 | | | AMETEK, Inc. | | | 5,213,233 | |
| | 22,018 | | | Chart Industries, Inc.* | | | 2,537,134 | |
| | 33,421 | | | Cummins, Inc. | | | 8,097,574 | |
| | 40,298 | | | Fastenal Co. | | | 1,906,901 | |
| | 78,710 | | | Fortive Corp. | | | 5,057,118 | |
| | 82,357 | | | ITT, Inc. | | | 6,679,153 | |
| | 20,275 | | | L3Harris Technologies, Inc. | | | 4,221,458 | |
| | 21,718 | | | Rockwell Automation, Inc. | | | 5,593,905 | |
| | 60,395 | | | Stanley Black & Decker, Inc. | | | 4,536,873 | |
| | 22,381 | | | Trane Technologies PLC | | | 3,762,022 | |
| | 4,516 | | | TransDigm Group, Inc. | | | 2,843,499 | |
| | 55,940 | | | Woodward, Inc. | | | 5,404,363 | |
| | | | | | | | |
| | | | | | | 59,065,979 | |
| | |
| Consumer Durables & Apparel – 2.6% | |
| | 50,566 | | | Capri Holdings Ltd.* | | | 2,898,443 | |
| | 5,556 | | | Deckers Outdoor Corp.* | | | 2,217,733 | |
| | 59,040 | | | Lennar Corp., Class A | | | 5,343,120 | |
| | | | | | | | |
| | | | | | | 10,459,296 | |
| | |
| Consumer Services – 2.0% | |
| | 7,527 | | | Domino’s Pizza, Inc. | | | 2,607,353 | |
| | 27,684 | | | Expedia Group, Inc.* | | | 2,425,118 | |
| | 22,594 | | | Yum! Brands, Inc. | | | 2,893,840 | |
| | | | | | | | |
| | | | | | | 7,926,311 | |
| | |
| Diversified Financials – 4.2% | |
| | 34,451 | | | Apollo Global Management, Inc. | | | 2,197,629 | |
| | 90,808 | | | Carlyle Group, Inc. (The) | | | 2,709,711 | |
| | 5,121 | | | MSCI, Inc. | | | 2,382,136 | |
| | 84,892 | | | Nasdaq, Inc. | | | 5,208,124 | |
| | 41,650 | | | Raymond James Financial, Inc. | | | 4,450,302 | |
| | | | | | | | |
| | | | | | | 16,947,902 | |
| | |
| Energy – 3.9% | |
| | 17,475 | | | Cheniere Energy, Inc. | | | 2,620,551 | |
| | 45,574 | | | Chesapeake Energy Corp. | | | 4,300,818 | |
| | 74,066 | | | Devon Energy Corp. | | | 4,555,800 | |
| | 155,261 | | | Marathon Oil Corp. | | | 4,202,915 | |
| | | | | | | | |
| | | | | | | 15,680,084 | |
| | |
| Food & Staples Retailing – 1.9% | |
| | 115,627 | | | Grocery Outlet Holding Corp.* | | | 3,375,152 | |
| | 69,144 | | | Performance Food Group Co.* | | | 4,037,318 | |
| | | | | | | | |
| | | | | | | 7,412,470 | |
| | |
|
| Common Stocks – (continued) | |
| Food, Beverage & Tobacco – 3.1% | |
| | 68,182 | | | Coca-Cola Europacific Partners PLC (United Kingdom) | | | 3,771,828 | |
| | 74,700 | | | McCormick & Co., Inc. | | | 6,191,883 | |
| | 153,717 | | | Utz Brands, Inc. | | | 2,437,952 | |
| | | | | | | | |
| | | | | | | 12,401,663 | |
| | |
| Health Care Equipment & Services – 6.0% | |
| | 28,155 | | | AmerisourceBergen Corp. | | | 4,665,565 | |
| | 24,311 | | | Centene Corp.* | | | 1,993,745 | |
| | 19,306 | | | Cooper Cos., Inc. (The) | | | 6,383,915 | |
| | 16,713 | | | Quest Diagnostics, Inc. | | | 2,614,582 | |
| | 65,982 | | | Zimmer Biomet Holdings, Inc. | | | 8,412,705 | |
| | | | | | | | |
| | | | | | | 24,070,512 | |
| | |
| Insurance – 7.5% | |
| | 35,761 | | | Allstate Corp. (The) | | | 4,849,192 | |
| | 16,991 | | | American Financial Group, Inc. | | | 2,332,524 | |
| | 77,866 | | | Arch Capital Group Ltd.* | | | 4,888,427 | |
| | 23,400 | | | Arthur J Gallagher & Co. | | | 4,411,836 | |
| | 37,526 | | | Globe Life, Inc. | | | 4,523,759 | |
| | 1,250 | | | Markel Corp.* | | | 1,646,863 | |
| | 66,502 | | | Principal Financial Group, Inc. | | | 5,580,848 | |
| | 40,522 | | | Unum Group | | | 1,662,618 | |
| | | | | | | | |
| | | | | | | 29,896,067 | |
| | |
| Materials – 10.2% | |
| | 53,306 | | | Ashland, Inc. | | | 5,731,994 | |
| | 76,512 | | | ATI, Inc.* | | | 2,284,648 | |
| | 134,139 | | | Ball Corp. | | | 6,859,868 | |
| | 64,461 | | | Corteva, Inc. | | | 3,789,018 | |
| | 77,995 | | | Freeport-McMoRan, Inc. | | | 2,963,810 | |
| | 24,066 | | | Martin Marietta Materials, Inc. | | | 8,133,586 | |
| | 26,151 | | | PPG Industries, Inc. | | | 3,288,227 | |
| | 78,897 | | | Steel Dynamics, Inc. | | | 7,708,237 | |
| | | | | | | | |
| | | | | | | 40,759,388 | |
| | |
| Media & Entertainment – 1.8% | |
| | 33,779 | | | Electronic Arts, Inc. | | | 4,127,118 | |
| | 43,891 | | | Live Nation Entertainment, Inc.* | | | 3,060,959 | |
| | | | | | | | |
| | | | | | | 7,188,077 | |
| | |
| Pharmaceuticals, Biotechnology & Life Sciences – 2.9% | |
| | 3,340 | | | Argenx SE ADR (Netherlands)* | | | 1,265,292 | |
| | 9,011 | | | Biogen, Inc.* | | | 2,495,326 | |
| | 24,616 | | | BioMarin Pharmaceutical, Inc.* | | | 2,547,510 | |
| | 49,744 | | | Catalent, Inc.* | | | 2,238,978 | |
| | 13,458 | | | West Pharmaceutical Services, Inc. | | | 3,167,340 | |
| | | | | | | | |
| | | | | | | 11,714,446 | |
| | |
| Real Estate – 9.6% | |
| | 53,740 | | | Alexandria Real Estate Equities, Inc. REIT | | | 7,828,306 | |
| | 90,133 | | | Americold Realty Trust, Inc. REIT | | | 2,551,665 | |
| | 32,581 | | | AvalonBay Communities, Inc. REIT | | | 5,262,483 | |
| | 19,579 | | | EastGroup Properties, Inc. REIT | | | 2,898,867 | |
| | |
| | |
| The accompanying notes are an integral part of these financial statements. | | 65 |
GOLDMAN SACHS VARIABLE INSURANCE TRUST MID CAP VALUE FUND
Schedule of Investments (continued)
December 31, 2022
| | | | | | | | |
Shares | | | Description | | Value | |
|
| Common Stocks – (continued) | |
| Real Estate – (continued) | |
| | 44,559 | | | Equity LifeStyle Properties, Inc. REIT | | $ | 2,878,512 | |
| | 13,458 | | | Essex Property Trust, Inc. REIT | | | 2,852,019 | |
| | 18,309 | | | Extra Space Storage, Inc. REIT | | | 2,694,719 | |
| | 80,110 | | | Invitation Homes, Inc. REIT | | | 2,374,460 | |
| | 45,570 | | | Regency Centers Corp. REIT | | | 2,848,125 | |
| | 71,339 | | | Ventas, Inc. REIT | | | 3,213,822 | |
| | 89,278 | | | VICI Properties, Inc. REIT | | | 2,892,607 | |
| | | | | | | | |
| | | | | | | 38,295,585 | |
| | |
| Retailing – 3.9% | |
| | 26,941 | | | Burlington Stores, Inc.* | | | 5,462,557 | |
| | 25,719 | | | Etsy, Inc.* | | | 3,080,622 | |
| | 60,246 | | | Foot Locker, Inc. | | | 2,276,696 | |
| | 65,522 | | | National Vision Holdings, Inc.* | | | 2,539,633 | |
| | 8,581 | | | RH* | | | 2,292,757 | |
| | | | | | | | |
| | | | | | | 15,652,265 | |
| | |
| Semiconductors & Semiconductor Equipment – 1.5% | |
| | 36,589 | | | MKS Instruments, Inc. | | | 3,100,186 | |
| | 43,888 | | | ON Semiconductor Corp.* | | | 2,737,295 | |
| | | | | | | | |
| | | | | | | 5,837,481 | |
| | |
| Software & Services – 2.6% | |
| | 17,458 | | | Bill.com Holdings, Inc.* | | | 1,902,224 | |
| | 66,522 | | | Dynatrace, Inc.* | | | 2,547,793 | |
| | 31,064 | | | Global Payments, Inc. | | | 3,085,276 | |
| | 17,458 | | | Jack Henry & Associates, Inc. | | | 3,064,926 | |
| | | | | | | | |
| | | | | | | 10,600,219 | |
| | |
| Technology Hardware & Equipment – 5.1% | |
| | 73,598 | | | Juniper Networks, Inc. | | | 2,352,192 | |
| | 19,426 | | | Keysight Technologies, Inc.* | | | 3,323,206 | |
| | 34,893 | | | Motorola Solutions, Inc. | | | 8,992,275 | |
| | 548,714 | | | Viavi Solutions, Inc.* | | | 5,766,984 | |
| | | | | | | | |
| | | | | | | 20,434,657 | |
| | |
| Transportation – 2.1% | |
| | 16,067 | | | Old Dominion Freight Line, Inc. | | | 4,559,493 | |
| | 9,150 | | | Saia, Inc.* | | | 1,918,572 | |
| | 49,743 | | | United Airlines Holdings, Inc.* | | | 1,875,311 | |
| | | | | | | | |
| | | | | | | 8,353,376 | |
| | |
| Utilities – 9.4% | |
| | 223,400 | | | AES Corp. (The) | | | 6,424,984 | |
| | 86,712 | | | Ameren Corp. | | | 7,710,431 | |
| | 18,193 | | | American Water Works Co., Inc. | | | 2,772,977 | |
| | 105,107 | | | CMS Energy Corp. | | | 6,656,426 | |
| | 26,396 | | | NextEra Energy Partners LP | | | 1,850,096 | |
| | 61,362 | | | WEC Energy Group, Inc. | | | 5,753,301 | |
| | 92,966 | | | Xcel Energy, Inc. | | | 6,517,846 | |
| | | | | | | | |
| | | | | | | 37,686,061 | |
| | |
| | TOTAL COMMON STOCKS | |
| | (Cost $348,777,866) | | $ | 400,330,821 | |
| | |
| | | | | | |
| Shares | | Dividend
Rate | | Value | |
|
| Investment Company – 0.6%(a) | |
Goldman Sachs Financial Square Government Fund — Institutional Shares | |
| 2,407,505 | | 4.159% | | $ | 2,407,505 | |
| (Cost $2,407,505) | |
| |
| TOTAL INVESTMENTS – 100.5% | |
| (Cost $351,185,371) | | $ | 402,738,326 | |
| |
LIABILITIES IN EXCESS OF OTHER ASSETS – (0.5)% | | | (1,837,884 | ) |
| |
| NET ASSETS – 100.0% | | $ | 400,900,442 | |
| |
| | |
| The percentage shown for each investment category reflects the value of investments in that category as a percentage of net assets. |
| |
| * | | Non-income producing security. |
| |
| (a) | | Represents an affiliated issuer. |
| | |
| |
| Investment Abbreviations: |
| ADR | | —American Depositary Receipt |
| LP | | —Limited Partnership |
| PLC | | —Public Limited Company |
| REIT | | —Real Estate Investment Trust |
| | |
| 66 | | The accompanying notes are an integral part of these financial statements. |
GOLDMAN SACHS VARIABLE INSURANCE TRUST SMALL CAP EQUITY INSIGHTS FUND
Schedule of Investments
December 31, 2022
| | | | | | | | |
Shares | | | Description | | Value | |
|
| Common Stocks – 97.9% | |
| Automobiles & Components – 0.8% | |
| | 15,624 | | | Adient PLC* | | $ | 541,997 | |
| | 2,154 | | | American Axle & Manufacturing Holdings, Inc.* | | | 16,844 | |
| | 8,717 | | | Holley, Inc.* | | | 18,480 | |
| | 2,193 | | | LCI Industries | | | 202,743 | |
| | 2,727 | | | Luminar Technologies, Inc.*(a) | | | 13,499 | |
| | 2,899 | | | Modine Manufacturing Co.* | | | 57,574 | |
| | | | | | | | |
| | | | | | | 851,137 | |
| | |
| Banks – 9.1% | |
| | 2,753 | | | Amalgamated Financial Corp. | | | 63,429 | |
| | 14,593 | | | Ameris Bancorp | | | 687,914 | |
| | 8,803 | | | Associated Banc-Corp. | | | 203,261 | |
| | 12,248 | | | Axos Financial, Inc.* | | | 468,119 | |
| | 1,555 | | | BancFirst Corp. | | | 137,120 | |
| | 3,572 | | | Bank of NT Butterfield & Son Ltd. (The) (Bermuda) | | | 106,481 | |
| | 6,116 | | | Business First Bancshares, Inc. | | | 135,408 | |
| | 4,576 | | | Byline Bancorp, Inc. | | | 105,111 | |
| | 8,321 | | | Cadence Bank | | | 205,196 | |
| | 6,726 | | | Capital Bancorp, Inc. | | | 158,330 | |
| | 42,999 | | | Capitol Federal Financial, Inc. | | | 371,941 | |
| | 2,291 | | | Carter Bankshares, Inc.* | | | 38,008 | |
| | 19,396 | | | Central Pacific Financial Corp. | | | 393,351 | |
| | 2,567 | | | Community Bank System, Inc. | | | 161,593 | |
| | 1,063 | | | CrossFirst Bankshares, Inc.* | | | 13,192 | |
| | 38,693 | | | First BanCorp. (Puerto Rico) | | | 492,175 | |
| | 6,489 | | | First Bancorp, Inc. (The) | | | 194,281 | |
| | 10,637 | | | First Financial Bankshares, Inc. | | | 365,913 | |
| | 390 | | | Great Southern Bancorp, Inc. | | | 23,201 | |
| | 8,614 | | | Guaranty Bancshares, Inc. | | | 298,389 | |
| | 15,173 | | | Hancock Whitney Corp. | | | 734,221 | |
| | 19,820 | | | Hanmi Financial Corp. | | | 490,545 | |
| | 3,125 | | | Home Bancorp, Inc. | | | 125,094 | |
| | 2,425 | | | HomeTrust Bancshares, Inc. | | | 58,612 | |
| | 37,011 | | | Hope Bancorp, Inc. | | | 474,111 | |
| | 1,462 | | | Independent Bank Corp. | | | 34,971 | |
| | 14,562 | | | International Bancshares Corp. | | | 666,357 | |
| | 24,649 | | | Luther Burbank Corp. | | | 273,850 | |
| | 12,927 | | | Macatawa Bank Corp. | | | 142,585 | |
| | 13,190 | | | Merchants Bancorp | | | 320,781 | |
| | 8,604 | | | Metrocity Bankshares, Inc. | | | 186,105 | |
| | 2,991 | | | Northeast Bank | | | 125,921 | |
| | 562 | | | Origin Bancorp, Inc. | | | 20,625 | |
| | 9,077 | | | PCB Bancorp | | | 160,572 | |
| | 501 | | | Peoples Financial Services Corp. | | | 25,972 | |
| | 4,441 | | | Provident Bancorp, Inc. | | | 32,331 | |
| | 2,199 | | | Renasant Corp. | | | 82,660 | |
| | 652 | | | Silvergate Capital Corp., Class A* | | | 11,345 | |
| | 3,783 | | | Southern First Bancshares, Inc.* | | | 173,072 | |
| | 4,470 | | | SouthState Corp. | | | 341,329 | |
| | 16,717 | | | TrustCo Bank Corp. | | | 628,392 | |
| | 216 | | | UMB Financial Corp. | | | 18,040 | |
| | 1,410 | | | United Community Banks, Inc. | | | 47,658 | |
| | |
|
| Common Stocks – (continued) | |
| Banks – (continued) | |
| | 1,299 | | | USCB Financial Holdings, Inc.* | | | 15,848 | |
| | 5,799 | | | Veritex Holdings, Inc. | | | 162,836 | |
| | | | | | | | |
| | | | | | | 9,976,246 | |
| | |
| Capital Goods – 10.6% | |
| | 194 | | | Applied Industrial Technologies, Inc. | | | 24,450 | |
| | 3,692 | | | Arcosa, Inc. | | | 200,623 | |
| | 11,210 | | | Array Technologies, Inc.* | | | 216,689 | |
| | 7,815 | | | Atkore, Inc.* | | | 886,377 | |
| | 2,290 | | | Chart Industries, Inc.* | | | 263,877 | |
| | 1,982 | | | CIRCOR International, Inc.* | | | 47,489 | |
| | 5,757 | | | Columbus McKinnon Corp. | | | 186,930 | |
| | 3,083 | | | Comfort Systems USA, Inc. | | | 354,792 | |
| | 1,914 | | | Douglas Dynamics, Inc. | | | 69,210 | |
| | 3,293 | | | Dycom Industries, Inc.* | | | 308,225 | |
| | 5,841 | | | Encore Wire Corp. | | | 803,488 | |
| | 4,383 | | | Enerpac Tool Group Corp. | | | 111,547 | |
| | 6,010 | | | Evoqua Water Technologies Corp.* | | | 237,996 | |
| | 11,037 | | | Fluor Corp.* | | | 382,542 | |
| | 4,160 | | | Franklin Electric Co., Inc. | | | 331,760 | |
| | 13,221 | | | FTC Solar, Inc.* | | | 35,432 | |
| | 28,028 | | | GrafTech International Ltd. | | | 133,413 | |
| | 16,277 | | | H&E Equipment Services, Inc. | | | 738,976 | |
| | 862 | | | Herc Holdings, Inc. | | | 113,413 | |
| | 724 | | | Hudson Technologies, Inc.* | | | 7,327 | |
| | 10,103 | | | Kennametal, Inc. | | | 243,078 | |
| | 14,898 | | | Kratos Defense & Security Solutions, Inc.* | | | 153,747 | |
| | 1,312 | | | Manitowoc Co., Inc. (The)* | | | 12,018 | |
| | 8,859 | | | Miller Industries, Inc. | | | 236,181 | |
| | 1,602 | | | Moog, Inc., Class A | | | 140,592 | |
| | 32,714 | | | MRC Global, Inc.* | | | 378,828 | |
| | 13,613 | | | Mueller Industries, Inc. | | | 803,167 | |
| | 4,190 | | | National Presto Industries, Inc. | | | 286,847 | |
| | 2,854 | | | Northwest Pipe Co.* | | | 96,180 | |
| | 42,280 | | | NOW, Inc.* | | | 536,956 | |
| | 10,988 | | | Parsons Corp.* | | | 508,195 | |
| | 10,660 | | | Powell Industries, Inc. | | | 375,019 | |
| | 17,351 | | | Primoris Services Corp. | | | 380,681 | |
| | 6,112 | | | Shoals Technologies Group, Inc., Class A* | | | 150,783 | |
| | 11,439 | | | Stem, Inc.* | | | 102,265 | |
| | 1,569 | | | SunPower Corp.* | | | 28,289 | |
| | 2,337 | | | Thermon Group Holdings, Inc.* | | | 46,927 | |
| | 8,805 | | | Titan International, Inc.* | | | 134,893 | |
| | 6,430 | | | Titan Machinery, Inc.* | | | 255,464 | |
| | 6,497 | | | TPI Composites, Inc.* | | | 65,880 | |
| | 31,953 | | | Triumph Group, Inc.* | | | 336,146 | |
| | 5,885 | | | Tutor Perini Corp.* | | | 44,432 | |
| | 267 | | | V2X, Inc.* | | | 11,024 | |
| | 221 | | | Veritiv Corp. | | | 26,898 | |
| | 23,139 | | | Wabash National Corp. | | | 522,941 | |
| | 10,482 | | | Zurn Elkay Water Solutions Corp. | | | 221,694 | |
| | | | | | | | |
| | | | | | | 11,553,681 | |
| | |
| | |
| The accompanying notes are an integral part of these financial statements. | | 67 |
GOLDMAN SACHS VARIABLE INSURANCE TRUST SMALL CAP EQUITY INSIGHTS FUND
Schedule of Investments (continued)
December 31, 2022
| | | | | | | | |
Shares | | | Description | | Value | |
|
| Common Stocks – (continued) | |
| Commercial & Professional Services – 1.9% | |
| | 875 | | | Aris Water Solution, Inc., Class A | | $ | 12,609 | |
| | 2,121 | | | Brady Corp., Class A | | | 99,899 | |
| | 11,591 | | | BrightView Holdings, Inc.* | | | 79,862 | |
| | 5,845 | | | CBIZ, Inc.* | | | 273,838 | |
| | 14,498 | | | Ennis, Inc. | | | 321,276 | |
| | 8,079 | | | Exponent, Inc. | | | 800,548 | |
| | 1,982 | | | First Advantage Corp.* | | | 25,766 | |
| | 347 | | | Forrester Research, Inc.* | | | 12,409 | |
| | 4,998 | | | Franklin Covey Co.* | | | 233,756 | |
| | 3,199 | | | Heritage-Crystal Clean, Inc.* | | | 103,904 | |
| | 4,505 | | | Red Violet, Inc.*(a) | | | 103,705 | |
| | | | | | | | |
| | | | | | | 2,067,572 | |
| | |
| Consumer Durables & Apparel – 3.1% | |
| | 891 | | | Cavco Industries, Inc.* | | | 201,589 | |
| | 3,263 | | | Crocs, Inc.* | | | 353,807 | |
| | 17,053 | | | Dream Finders Homes, Inc., Class A*(a) | | | 147,679 | |
| | 14,396 | | | Fossil Group, Inc.* | | | 62,047 | |
| | 6,972 | | | Installed Building Products, Inc. | | | 596,803 | |
| | 250 | | | iRobot Corp.* | | | 12,033 | |
| | 5,514 | | | Landsea Homes Corp.* | | | 28,728 | |
| | 4,138 | | | LGI Homes, Inc.* | | | 383,179 | |
| | 10,456 | | | M/I Homes, Inc.* | | | 482,858 | |
| | 8,571 | | | Malibu Boats, Inc., Class A* | | | 456,834 | |
| | 4,059 | | | MasterCraft Boat Holdings, Inc.* | | | 105,006 | |
| | 2,903 | | | Meritage Homes Corp.* | | | 267,657 | |
| | 747 | | | Movado Group, Inc. | | | 24,091 | |
| | 407 | | | Oxford Industries, Inc. | | | 37,924 | |
| | 5,134 | | | Skyline Champion Corp.* | | | 264,452 | |
| | | | | | | | |
| | | | | | | 3,424,687 | |
| | |
| Consumer Services – 3.5% | |
| | 1,202 | | | Biglari Holdings, Inc., Class B* | | | 166,838 | |
| | 8,044 | | | Chuy’s Holdings, Inc.* | | | 227,645 | |
| | 12,213 | | | Dave & Buster’s Entertainment, Inc.* | | | 432,829 | |
| | 13,882 | | | Denny’s Corp.* | | | 127,853 | |
| | 2,876 | | | Duolingo, Inc.* | | | 204,570 | |
| | 11,778 | | | Everi Holdings, Inc.* | | | 169,014 | |
| | 15,112 | | | First Watch Restaurant Group, Inc.* | | | 204,465 | |
| | 52 | | | Graham Holdings Co., Class B | | | 31,419 | |
| | 11,144 | | | Hilton Grand Vacations, Inc.* | | | 429,490 | |
| | 8,987 | | | International Game Technology PLC | | | 203,825 | |
| | 390 | | | Kura Sushi USA, Inc., Class A* | | | 18,595 | |
| | 26,862 | | | Laureate Education, Inc. | | | 258,412 | |
| | 1,414 | | | Perdoceo Education Corp.* | | | 19,655 | |
| | 8,828 | | | Portillo’s, Inc., Class A* | | | 144,073 | |
| | 12,907 | | | Red Rock Resorts, Inc., Class A | | | 516,409 | |
| | 669 | | | Shake Shack, Inc., Class A* | | | 27,783 | |
| | 11,024 | | | Stride, Inc.* | | | 344,831 | |
| | 6,143 | | | Target Hospitality Corp.* | | | 93,005 | |
| | 2,164 | | | Texas Roadhouse, Inc. | | | 196,816 | |
| | | | | | | | |
| | | | | | | 3,817,527 | |
| | |
|
| Common Stocks – (continued) | |
| Diversified Financials – 3.8% | |
| | 974 | | | Alerus Financial Corp. | | | 22,743 | |
| | 11,678 | | | A-Mark Precious Metals, Inc. | | | 405,577 | |
| | 21,442 | | | Banco Latinoamericano de Comercio Exterior SA, Class E (Panama) | | | 347,360 | |
| | 15,517 | | | BrightSpire Capital, Inc. REIT | | | 96,671 | |
| | 50,929 | | | Chimera Investment Corp. REIT | | | 280,110 | |
| | 31,818 | | | EZCORP, Inc., Class A* | | | 259,317 | |
| | 8,711 | | | FirstCash Holdings, Inc. | | | 757,073 | |
| | 6,232 | | | Focus Financial Partners, Inc., Class A* | | | 232,267 | |
| | 1,102 | | | Hamilton Lane, Inc., Class A | | | 70,396 | |
| | 2,117 | | | Hannon Armstrong Sustainable Infrastructure Capital, Inc. REIT | | | 61,351 | |
| | 1,845 | | | LendingClub Corp.* | | | 16,236 | |
| | 1,292 | | | LendingTree, Inc.* | | | 27,558 | |
| | 2,702 | | | MFA Financial, Inc. REIT | | | 26,615 | |
| | 251 | | | Nelnet, Inc., Class A | | | 22,778 | |
| | 12,090 | | | Nexpoint Real Estate Finance, Inc. REIT | | | 192,110 | |
| | 4,628 | | | Oppenheimer Holdings, Inc., Class A | | | 195,903 | |
| | 9,762 | | | PennyMac Mortgage Investment Trust REIT | | | 120,951 | |
| | 4,528 | | | PJT Partners, Inc., Class A | | | 333,668 | |
| | 5,338 | | | Regional Management Corp. | | | 149,891 | |
| | 14,043 | | | TPG RE Finance Trust, Inc. REIT | | | 95,352 | |
| | 17,535 | | | Victory Capital Holdings, Inc., Class A | | | 470,464 | |
| | | | | | | | |
| | | | | | | 4,184,391 | |
| | |
| Energy – 7.7% | |
| | 18,597 | | | Ardmore Shipping Corp. (Ireland)* | | | 267,983 | |
| | 2,602 | | | Cactus, Inc., Class A | | | 130,777 | |
| | 2,138 | | | Chord Energy Corp. | | | 292,500 | |
| | 12,329 | | | Civitas Resources, Inc. | | | 714,219 | |
| | 12,432 | | | Comstock Resources, Inc. | | | 170,443 | |
| | 1,324 | | | CONSOL Energy, Inc. | | | 86,060 | |
| | 4,186 | | | Dril-Quip, Inc.* | | | 113,734 | |
| | 22,458 | | | Equitrans Midstream Corp. | | | 150,469 | |
| | 6,436 | | | Frontline PLC (Norway) *(a) | | | 78,133 | |
| | 28,942 | | | Golar LNG Ltd. (Cameroon)* | | | 659,588 | |
| | 2,216 | | | Helix Energy Solutions Group, Inc.* | | | 16,354 | |
| | 5,390 | | | International Seaways, Inc. | | | 199,538 | |
| | 27,723 | | | Kosmos Energy Ltd. (Ghana)* | | | 176,318 | |
| | 3,754 | | | Laredo Petroleum, Inc.* | | | 193,031 | |
| | 17,831 | | | Liberty Energy, Inc. | | | 285,474 | |
| | 34,589 | | | Magnolia Oil & Gas Corp., Class A | | | 811,112 | |
| | 5,124 | | | Matador Resources Co.(c) | | | 293,298 | |
| | 3,999 | | | Murphy Oil Corp. | | | 171,997 | |
| | 1,440 | | | Nabors Industries Ltd.* | | | 223,013 | |
| | 27,101 | | | NexTier Oilfield Solutions, Inc.* | | | 250,413 | |
| | 15,774 | | | Nordic American Tankers Ltd. | | | 48,268 | |
| | 3,871 | | | Oceaneering International, Inc.* | | | 67,704 | |
| | 24,081 | | | Oil States International, Inc.* | | | 179,644 | |
| | 1,756 | | | Patterson-UTI Energy, Inc. | | | 29,571 | |
| | |
| | |
| 68 | | The accompanying notes are an integral part of these financial statements. |
GOLDMAN SACHS VARIABLE INSURANCE TRUST SMALL CAP EQUITY INSIGHTS FUND
| | | | | | | | |
Shares | | | Description | | Value | |
|
| Common Stocks – (continued) | |
| Energy – (continued) | |
| | 4,273 | | | PBF Energy, Inc., Class A | | $ | 174,253 | |
| | 2,408 | | | Peabody Energy Corp.* | | | 63,619 | |
| | 37,294 | | | RPC, Inc. | | | 331,544 | |
| | 14,068 | | | Scorpio Tankers, Inc. (Monaco) | | | 756,436 | |
| | 1,784 | | | Select Energy Services, Inc., Class A | | | 16,484 | |
| | 47,349 | | | SFL Corp. Ltd. (Norway) | | | 436,558 | |
| | 13,097 | | | SM Energy Co. | | | 456,168 | |
| | 8,905 | | | Talos Energy, Inc.* | | | 168,126 | |
| | 4,225 | | | Teekay Corp. (Bermuda)* | | | 19,181 | |
| | 8,739 | | | Teekay Tankers Ltd., Class A (Canada)* | | | 269,249 | |
| | 9,382 | | | TETRA Technologies, Inc.* | | | 32,462 | |
| | 1,012 | | | US Silica Holdings, Inc.* | | | 12,650 | |
| | 22,910 | | | W&T Offshore, Inc.* | | | 127,838 | |
| | | | | | | | |
| | | | | | | 8,474,209 | |
| | |
| Food & Staples Retailing – 0.4% | |
| | 9,501 | | | Chefs’ Warehouse, Inc. (The)* | | | 316,193 | |
| | 592 | | | Ingles Markets, Inc., Class A | | | 57,104 | |
| | 4,556 | | | Natural Grocers by Vitamin Cottage, Inc. | | | 41,642 | |
| | | | | | | | |
| | | | | | | 414,939 | |
| | |
| Food, Beverage & Tobacco – 2.2% | |
| | 635 | | | B&G Foods, Inc. | | | 7,080 | |
| | 5,721 | | | Cal-Maine Foods, Inc. | | | 311,508 | |
| | 943 | | | Celsius Holdings, Inc.* | | | 98,110 | |
| | 865 | | | Coca-Cola Consolidated, Inc. | | | 443,191 | |
| | 2,129 | | | Fresh Del Monte Produce, Inc. | | | 55,758 | |
| | 5,825 | | | Hostess Brands, Inc.* | | | 130,713 | |
| | 7,296 | | | John B Sanfilippo & Son, Inc. | | | 593,311 | |
| | 47,488 | | | Primo Water Corp. | | | 737,964 | |
| | 2,098 | | | Turning Point Brands, Inc. | | | 45,380 | |
| | | | | | | | |
| | | | | | | 2,423,015 | |
| | |
| Health Care Equipment & Services – 7.8% | |
| | 3,979 | | | AdaptHealth Corp.* | | | 76,476 | |
| | 569 | | | Addus HomeCare Corp.* | | | 56,610 | |
| | 18,629 | | | AirSculpt Technologies, Inc.(a) | | | 68,927 | |
| | 5,542 | | | AMN Healthcare Services, Inc.* | | | 569,829 | |
| | 6,561 | | | AngioDynamics, Inc.* | | | 90,345 | |
| | 4,245 | | | Artivion, Inc.* | | | 51,449 | |
| | 4,747 | | | AtriCure, Inc.* | | | 210,672 | |
| | 11,137 | | | Avanos Medical, Inc.* | | | 301,367 | |
| | 8,565 | | | Axonics, Inc.* | | | 535,570 | |
| | 10,244 | | | Brookdale Senior Living, Inc.* | | | 27,966 | |
| | 30,375 | | | Cano Health, Inc.* | | | 41,614 | |
| | 2,758 | | | Cardiovascular Systems, Inc.* | | | 37,564 | |
| | 4,668 | | | Castle Biosciences, Inc.* | | | 109,885 | |
| | 17,045 | | | Cerus Corp.* | | | 62,214 | |
| | 52,362 | | | Community Health Systems, Inc.* | | | 226,204 | |
| | 519 | | | CorVel Corp.* | | | 75,426 | |
| | 3,641 | | | Cross Country Healthcare, Inc.* | | | 96,741 | |
| | 1,113 | | | Ensign Group, Inc. (The) | | | 105,301 | |
| | 10,164 | | | Figs, Inc., Class A* | | | 68,404 | |
| | |
|
| Common Stocks – (continued) | |
| Health Care Equipment & Services – (continued) | |
| | 411 | | | Glaukos Corp.* | | | 17,953 | |
| | 24,558 | | | Health Catalyst, Inc.* | | | 261,052 | |
| | 791 | | | HealthEquity, Inc.* | | | 48,757 | |
| | 7,017 | | | HealthStream, Inc.* | | | 174,302 | |
| | 21,269 | | | Hims & Hers Health, Inc.* | | | 136,334 | |
| | 6,242 | | | Inari Medical, Inc.* | | | 396,742 | |
| | 3,147 | | | Inspire Medical Systems, Inc.* | | | 792,666 | |
| | 3,942 | | | iRadimed Corp. | | | 111,519 | |
| | 2,620 | | | Joint Corp. (The)* | | | 36,628 | |
| | 2,619 | | | LeMaitre Vascular, Inc. | | | 120,526 | |
| | 7,582 | | | LivaNova PLC* | | | 421,104 | |
| | 2,435 | | | National HealthCare Corp. | | | 144,883 | |
| | 6,290 | | | Nevro Corp.* | | | 249,084 | |
| | 4,288 | | | NuVasive, Inc.* | | | 176,837 | |
| | 29,769 | | | OPKO Health, Inc.* | | | 37,211 | |
| | 12,501 | | | Option Care Health, Inc.* | | | 376,155 | |
| | 4,386 | | | Owens & Minor, Inc.* | | | 85,659 | |
| | 2,535 | | | Pennant Group, Inc. (The)* | | | 27,834 | |
| | 20,415 | | | PetIQ, Inc.* | | | 188,226 | |
| | 3,208 | | | Phreesia, Inc.* | | | 103,811 | |
| | 401 | | | Progyny, Inc.* | | | 12,491 | |
| | 331 | | | RadNet, Inc.* | | | 6,233 | |
| | 7,635 | | | Select Medical Holdings Corp. | | | 189,577 | |
| | 2,999 | | | Shockwave Medical, Inc.* | | | 616,624 | |
| | 5,478 | | | Surgery Partners, Inc.* | | | 152,617 | |
| | 5,532 | | | Surmodics, Inc.* | | | 188,752 | |
| | 2,165 | | | Tactile Systems Technology, Inc.* | | | 24,854 | |
| | 1,397 | | | TransMedics Group, Inc.* | | | 86,223 | |
| | 3,384 | | | Utah Medical Products, Inc. | | | 340,194 | |
| | 7,018 | | | Varex Imaging Corp.* | | | 142,465 | |
| | 19,571 | | | ViewRay, Inc.* | | | 87,678 | |
| | | | | | | | |
| | | | | | | 8,567,555 | |
| | |
| Household & Personal Products – 0.1% | |
| | 11,490 | | | Beauty Health Co. (The)* | | | 104,559 | |
| | 3,474 | | | Herbalife Nutrition Ltd.* | | | 51,693 | |
| | | | | | | | |
| | | | | | | 156,252 | |
| | |
| Insurance – 4.6% | |
| | 19,214 | | | American Equity Investment Life Holding Co. | | | 876,543 | |
| | 11,577 | | | AMERISAFE, Inc. | | | 601,657 | |
| | 1,334 | | | BRP Group, Inc., Class A* | | | 33,537 | |
| | 35,479 | | | CNO Financial Group, Inc. | | | 810,695 | |
| | 29,733 | | | Crawford & Co., Class A | | | 165,315 | |
| | 16,663 | | | Employers Holdings, Inc. | | | 718,675 | |
| | 8,511 | | | Genworth Financial, Inc., Class A* | | | 45,023 | |
| | 15,880 | | | Goosehead Insurance, Inc., Class A* | | | 545,319 | |
| | 887 | | | Investors Title Co. | | | 130,877 | |
| | 278 | | | Kinsale Capital Group, Inc. | | | 72,703 | |
| | 7,099 | | | Palomar Holdings, Inc.* | | | 320,591 | |
| | 9,156 | | | ProAssurance Corp. | | | 159,955 | |
| | 12,313 | | | Stewart Information Services Corp. | | | 526,134 | |
| | 1,254 | | | Universal Insurance Holdings, Inc. | | | 13,280 | |
| | | | | | | | |
| | | | | | | 5,020,304 | |
| | |
| | |
| The accompanying notes are an integral part of these financial statements. | | 69 |
GOLDMAN SACHS VARIABLE INSURANCE TRUST SMALL CAP EQUITY INSIGHTS FUND
Schedule of Investments (continued)
December 31, 2022
| | | | | | | | |
Shares | | | Description | | Value | |
|
| Common Stocks – (continued) | |
| Materials – 4.0% | |
| | 2,208 | | | Alpha Metallurgical Resources, Inc. | | $ | 323,229 | |
| | 9,411 | | | Aspen Aerogels, Inc.* | | | 110,956 | |
| | 988 | | | ATI, Inc.* | | | 29,502 | |
| | 79,754 | | | Coeur Mining, Inc.* | | | 267,974 | |
| | 11,905 | | | Constellium SE* | | | 140,836 | |
| | 42,880 | | | Diversey Holdings Ltd.* | | | 182,669 | |
| | 4,951 | | | Innospec, Inc. | | | 509,260 | |
| | 9,241 | | | LSB Industries, Inc.* | | | 122,905 | |
| | 11,425 | | | Minerals Technologies, Inc. | | | 693,726 | |
| | 2,313 | | | Piedmont Lithium, Inc.* | | | 101,818 | |
| | 26,715 | | | Summit Materials, Inc., Class A* | | | 758,439 | |
| | 2,065 | | | Sylvamo Corp. | | | 100,338 | |
| | 13,423 | | | TimkenSteel Corp.* | | | 243,896 | |
| | 7,003 | | | Tronox Holdings PLC | | | 96,011 | |
| | 857 | | | United States Lime & Minerals, Inc. | | | 120,631 | |
| | 16,908 | | | Warrior Met Coal, Inc. | | | 585,693 | |
| | | | | | | | |
| | | | | | | 4,387,883 | |
| | |
| Media & Entertainment – 2.2% | |
| | 7,105 | | | Bumble, Inc., Class A* | | | 149,560 | |
| | 1,494 | | | Cardlytics, Inc.* | | | 8,636 | |
| | 29,161 | | | Clear Channel Outdoor Holdings, Inc.* | | | 30,619 | |
| | 130 | | | Daily Journal Corp.* | | | 32,567 | |
| | 7,491 | | | DHI Group, Inc.* | | | 39,628 | |
| | 23,090 | | | EW Scripps Co. (The), Class A* | | | 304,557 | |
| | 15,579 | | | Gray Television, Inc. | | | 174,329 | |
| | 2,040 | | | Integral Ad Science Holding Corp.* | | | 17,932 | |
| | 3,470 | | | Magnite, Inc.* | | | 36,747 | |
| | 9,357 | | | Scholastic Corp. | | | 369,227 | |
| | 3,610 | | | Shutterstock, Inc. | | | 190,319 | |
| | 5,526 | | | Sinclair Broadcast Group, Inc., Class A | | | 85,708 | |
| | 7,505 | | | TechTarget, Inc.* | | | 330,670 | |
| | 12,065 | | | Thryv Holdings, Inc.* | | | 229,235 | |
| | 48,798 | | | Vimeo, Inc.* | | | 167,377 | |
| | 13,748 | | | ZipRecruiter, Inc., Class A* | | | 225,742 | |
| | | | | | | | |
| | | | | | | 2,392,853 | |
| | |
| Pharmaceuticals, Biotechnology & Life Sciences – 9.2% | |
| | 7,933 | | | 2seventy bio, Inc.* | | | 74,332 | |
| | 12,451 | | | ACADIA Pharmaceuticals, Inc.* | | | 198,220 | |
| | 4,438 | | | Aclaris Therapeutics, Inc.* | | | 69,898 | |
| | 25,105 | | | Adaptive Biotechnologies Corp.* | | | 191,802 | |
| | 13,320 | | | Alector, Inc.* | | | 122,943 | |
| | 32,422 | | | Alkermes PLC* | | | 847,187 | |
| | 3,920 | �� | | ALX Oncology Holdings, Inc.* | | | 44,178 | |
| | 39,257 | | | Amicus Therapeutics, Inc.* | | | 479,328 | |
| | 4,207 | | | Amphastar Pharmaceuticals, Inc.* | | | 117,880 | |
| | 7,257 | | | Anavex Life Sciences Corp.*(a) | | | 67,200 | |
| | 4,966 | | | Apellis Pharmaceuticals, Inc.* | | | 256,792 | |
| | 2,887 | | | Arcus Biosciences, Inc.* | | | 59,703 | |
| | 4,070 | | | Arrowhead Pharmaceuticals, Inc.* | | | 165,079 | |
| | 6,214 | | | Arvinas, Inc.* | | | 212,581 | |
| | |
|
| Common Stocks – (continued) | |
| Pharmaceuticals, Biotechnology & Life Sciences – (continued) | |
| | 5,177 | | | Athira Pharma, Inc.* | | | 16,411 | |
| | 6,695 | | | Aurinia Pharmaceuticals, Inc. (Canada)* | | | 28,922 | |
| | 252 | | | Axsome Therapeutics, Inc.* | | | 19,437 | |
| | 12,616 | | | BioCryst Pharmaceuticals, Inc.* | | | 144,832 | |
| | 5,212 | | | Bridgebio Pharma, Inc.* | | | 39,715 | |
| | 1,679 | | | Cassava Sciences, Inc.*(a) | | | 49,598 | |
| | 8,206 | | | Catalyst Pharmaceuticals, Inc.* | | | 152,632 | |
| | 1,025 | | | Celldex Therapeutics, Inc.* | | | 45,684 | |
| | 25,244 | | | Codexis, Inc.* | | | 117,637 | |
| | 5,270 | | | CTI BioPharma Corp.* | | | 31,673 | |
| | 3,117 | | | Deciphera Pharmaceuticals, Inc.* | | | 51,088 | |
| | 11,354 | | | Denali Therapeutics, Inc.* | | | 315,755 | |
| | 2,505 | | | Design Therapeutics, Inc.*(a) | | | 25,701 | |
| | 3,399 | | | DICE Therapeutics, Inc.* | | | 106,049 | |
| | 3,249 | | | Eagle Pharmaceuticals, Inc.* | | | 94,968 | |
| | 3,908 | | | Edgewise Therapeutics, Inc.* | | | 34,937 | |
| | 3,660 | | | Enanta Pharmaceuticals, Inc.* | | | 170,263 | |
| | 6,717 | | | Erasca, Inc.* | | | 28,950 | |
| | 7,855 | | | Esperion Therapeutics, Inc.* | | | 48,937 | |
| | 7,145 | | | Fate Therapeutics, Inc.* | | | 72,093 | |
| | 16,126 | | | Generation Bio Co.* | | | 63,375 | |
| | 19,933 | | | Gossamer Bio, Inc.*(a) | | | 43,255 | |
| | 5,188 | | | Harmony Biosciences Holdings, Inc.* | | | 285,859 | |
| | 3,817 | | | Heron Therapeutics, Inc.*(a) | | | 9,542 | |
| | 5,262 | | | IGM Biosciences, Inc.* | | | 89,507 | |
| | 18,109 | | | ImmunoGen, Inc.* | | | 89,821 | |
| | 312 | | | Inhibrx, Inc.* | | | 7,688 | |
| | 10,151 | | | Insmed, Inc.* | | | 202,817 | |
| | 6,376 | | | Intercept Pharmaceuticals, Inc.* | | | 78,871 | |
| | 38,525 | | | Iovance Biotherapeutics, Inc.* | | | 246,175 | |
| | 3,224 | | | iTeos Therapeutics, Inc.* | | | 62,965 | |
| | 751 | | | IVERIC bio, Inc.* | | | 16,079 | |
| | 14,134 | | | KalVista Pharmaceuticals, Inc.* | | | 95,546 | |
| | 1,901 | | | Karuna Therapeutics, Inc.* | | | 373,546 | |
| | 3,593 | | | Keros Therapeutics, Inc.* | | | 172,536 | |
| | 10,249 | | | Kiniksa Pharmaceuticals Ltd., Class A* | | | 153,530 | |
| | 10,687 | | | Kodiak Sciences, Inc.* | | | 76,519 | |
| | 1,814 | | | Kura Oncology, Inc.* | | | 22,512 | |
| | 684 | | | Madrigal Pharmaceuticals, Inc.* | | | 198,531 | |
| | 3,521 | | | Medpace Holdings, Inc.*(c) | | | 747,896 | |
| | 8,952 | | | MeiraGTx Holdings PLC* | | | 58,367 | |
| | 2,573 | | | Morphic Holding, Inc.* | | | 68,828 | |
| | 1,761 | | | Myriad Genetics, Inc.* | | | 25,552 | |
| | 8,909 | | | NanoString Technologies, Inc.* | | | 71,005 | |
| | 11,953 | | | Nurix Therapeutics, Inc.* | | | 131,244 | |
| | 23,919 | | | Organogenesis Holdings, Inc.* | | | 64,342 | |
| | 3,968 | | | Phathom Pharmaceuticals, Inc.*(a) | | | 44,521 | |
| | 24,321 | | | Phibro Animal Health Corp., Class A | | | 326,145 | |
| | 11,834 | | | PMV Pharmaceuticals, Inc.* | | | 102,956 | |
| | 36,356 | | | Praxis Precision Medicines, Inc.* | | | 86,527 | |
| | 1,055 | | | Prometheus Biosciences, Inc.* | | | 116,050 | |
| | 11,041 | | | PTC Therapeutics, Inc.* | | | 421,435 | |
| | |
| | |
| 70 | | The accompanying notes are an integral part of these financial statements. |
GOLDMAN SACHS VARIABLE INSURANCE TRUST SMALL CAP EQUITY INSIGHTS FUND
| | | | | | | | |
Shares | | | Description | | Value | |
|
| Common Stocks – (continued) | |
| Pharmaceuticals, Biotechnology & Life Sciences – (continued) | |
| | 2,871 | | | Rallybio Corp.* | | $ | 18,862 | |
| | 2,931 | | | RAPT Therapeutics, Inc.* | | | 58,034 | |
| | 3,203 | | | Sage Therapeutics, Inc.* | | | 122,162 | |
| | 15,200 | | | Sana Biotechnology, Inc.*(a) | | | 60,040 | |
| | 5,129 | | | SIGA Technologies, Inc. | | | 37,749 | |
| | 37,795 | | | Sutro Biopharma, Inc.* | | | 305,384 | |
| | 38,305 | | | Vanda Pharmaceuticals, Inc.* | | | 283,074 | |
| | 588 | | | Vaxcyte, Inc.* | | | 28,195 | |
| | 1,581 | | | Vir Biotechnology, Inc.* | | | 40,015 | |
| | 528 | | | Xencor, Inc.* | | | 13,749 | |
| | | | | | | | |
| | | | | | | 10,023,211 | |
| | |
| Real Estate – 7.0% | |
| | 22,763 | | | Brandywine Realty Trust REIT | | | 139,993 | |
| | 47,170 | | | Chatham Lodging Trust REIT | | | 578,776 | |
| | 7,931 | | | Community Healthcare Trust, Inc. REIT | | | 283,930 | |
| | 71,748 | | | DiamondRock Hospitality Co. REIT | | | 587,616 | |
| | 24,830 | | | Equity Commonwealth REIT | | | 620,005 | |
| | 8,510 | | | Essential Properties Realty Trust, Inc. REIT | | | 199,730 | |
| | 2,842 | | | Four Corners Property Trust, Inc. REIT | | | 73,693 | |
| | 1,644 | | | Global Medical REIT, Inc. REIT | | | 15,585 | |
| | 14,258 | | | Hersha Hospitality Trust, Class A REIT | | | 121,478 | |
| | 20,281 | | | Independence Realty Trust, Inc. REIT | | | 341,938 | |
| | 61,362 | | | LXP Industrial Trust REIT | | | 614,847 | |
| | 5,516 | | | Macerich Co. (The) REIT | | | 62,110 | |
| | 14,721 | | | Newmark Group, Inc., Class A | | | 117,326 | |
| | 13,904 | | | NexPoint Residential Trust, Inc. REIT | | | 605,102 | |
| | 40,467 | | | Outfront Media, Inc. REIT | | | 670,943 | |
| | 61,556 | | | RLJ Lodging Trust REIT | | | 651,878 | |
| | 15,322 | | | Service Properties Trust REIT | | | 111,697 | |
| | 14,001 | | | St Joe Co. (The) | | | 541,139 | |
| | 26,571 | | | STAG Industrial, Inc. REIT | | | 858,509 | |
| | 1,852 | | | Tanger Factory Outlet Centers, Inc. REIT | | | 33,225 | |
| | 4,071 | | | Terreno Realty Corp. REIT | | | 231,518 | |
| | 34,157 | | | Uniti Group, Inc. REIT | | | 188,888 | |
| | | | | | | | |
| | | | | | | 7,649,926 | |
| | |
| Retailing – 2.7% | |
| | 3,416 | | | Aaron’s Co., Inc. (The) | | | 40,821 | |
| | 9,497 | | | Abercrombie & Fitch Co., Class A* | | | 217,576 | |
| | 25,650 | | | aka Brands Holding Corp.*(a) | | | 32,575 | |
| | 4,433 | | | American Eagle Outfitters, Inc. | | | 61,885 | |
| | 6,850 | | | Arko Corp. | | | 59,321 | |
| | 624 | | | Asbury Automotive Group, Inc.* | | | 111,852 | |
| | 3,453 | | | Boot Barn Holdings, Inc.* | | | 215,882 | |
| | 7,638 | | | Buckle, Inc. (The) | | | 346,383 | |
| | 18,349 | | | CarParts.com, Inc.* | | | 114,865 | |
| | 615 | | | Children’s Place, Inc. (The)* | | | 22,398 | |
| | 55 | | | Dillard’s, Inc., Class A | | | 17,776 | |
| | 3,340 | | | Murphy USA, Inc.(c) | | | 933,664 | |
| | |
|
| Common Stocks – (continued) | |
| Retailing – (continued) | |
| | 1,126 | | | Overstock.com, Inc.* | | | 21,799 | |
| | 1,327 | | | PetMed Express, Inc. | | | 23,488 | |
| | 103,948 | | | RealReal, Inc. (The)* | | | 129,935 | |
| | 8,199 | | | Revolve Group, Inc.* | | | 182,510 | |
| | 6,086 | | | Sally Beauty Holdings, Inc.* | | | 76,197 | |
| | 6,257 | | | Urban Outfitters, Inc.* | | | 149,229 | |
| | 143 | | | Winmark Corp. | | | 33,724 | |
| | 3,941 | | | Xometry, Inc., Class A* | | | 127,018 | |
| | | | | | | | |
| | | | | | | 2,918,898 | |
| | |
| Semiconductors & Semiconductor Equipment – 2.0% | |
| | 392 | | | Ambarella, Inc.* | | | 32,234 | |
| | 9,215 | | | Axcelis Technologies, Inc.* | | | 731,302 | |
| | 748 | | | Cohu, Inc.* | | | 23,973 | |
| | 5,961 | | | Diodes, Inc.* | | | 453,871 | |
| | 6,935 | | | FormFactor, Inc.* | | | 154,165 | |
| | 909 | | | Ichor Holdings Ltd.* | | | 24,379 | |
| | 12,743 | | | MaxLinear, Inc.* | | | 432,625 | |
| | 3,266 | | | Power Integrations, Inc. | | | 234,238 | |
| | 2,716 | | | Semtech Corp.* | | | 77,922 | |
| | 816 | | | Synaptics, Inc.* | | | 77,651 | |
| | | | | | | | |
| | | | | | | 2,242,360 | |
| | |
| Software & Services – 9.3% | |
| | 11,851 | | | A10 Networks, Inc. | | | 197,082 | |
| | 8,043 | | | Alarm.com Holdings, Inc.* | | | 397,968 | |
| | 3,901 | | | Altair Engineering, Inc., Class A* | | | 177,378 | |
| | 14,997 | | | American Software, Inc., Class A | | | 220,156 | |
| | 16,382 | | | Amplitude, Inc., Class A* | | | 197,895 | |
| | 11,981 | | | Asana, Inc., Class A* | | | 164,978 | |
| | 3,464 | | | Blackbaud, Inc.* | | | 203,891 | |
| | 1,900 | | | Box, Inc., Class A* | | | 59,147 | |
| | 2,937 | | | Cass Information Systems, Inc. | | | 134,573 | |
| | 12,762 | | | Clear Secure, Inc., Class A | | | 350,062 | |
| | 11,653 | | | CommVault Systems, Inc.* | | | 732,275 | |
| | 3,107 | | | Conduent, Inc.* | | | 12,583 | |
| | 4,528 | | | Consensus Cloud Solutions, Inc.* | | | 243,425 | |
| | 1,621 | | | Domo, Inc., Class B* | | | 23,083 | |
| | 27,699 | | | Duck Creek Technologies, Inc.* | | | 333,773 | |
| | 2,241 | | | Ebix, Inc. | | | 44,730 | |
| | 2,171 | | | EngageSmart, Inc.* | | | 38,210 | |
| | 93 | | | Envestnet, Inc.* | | | 5,738 | |
| | 15,313 | | | EVERTEC, Inc. (Puerto Rico) | | | 495,835 | |
| | 4,727 | | | ExlService Holdings, Inc.* | | | 800,896 | |
| | 3,581 | | | Hackett Group, Inc. (The) | | | 72,945 | |
| | 10,427 | | | I3 Verticals, Inc., Class A* | | | 253,793 | |
| | 2,141 | | | Information Services Group, Inc. | | | 9,849 | |
| | 12,936 | | | Instructure Holdings, Inc.*(a) | | | 303,220 | |
| | 11,230 | | | Maximus, Inc. | | | 823,496 | |
| | 124 | | | MicroStrategy, Inc., Class A* | | | 17,555 | |
| | 4,729 | | | Model N, Inc.* | | | 191,808 | |
| | 6,448 | | | Momentive Global, Inc.* | | | 45,136 | |
| | 5,847 | | | PagerDuty, Inc.* | | | 155,296 | |
| | 4,357 | | | Perficient, Inc.* | | | 304,249 | |
| | 1,333 | | | PowerSchool Holdings, Inc., Class A* | | | 30,766 | |
| | |
| | |
| The accompanying notes are an integral part of these financial statements. | | 71 |
GOLDMAN SACHS VARIABLE INSURANCE TRUST SMALL CAP EQUITY INSIGHTS FUND
Schedule of Investments (continued)
December 31, 2022
| | | | | | | | |
Shares | | | Description | | Value | |
|
| Common Stocks – (continued) | |
| Software & Services – (continued) | |
| | 9,005 | | | PROS Holdings, Inc.* | | $ | 218,461 | |
| | 13,086 | | | Q2 Holdings, Inc.* | | | 351,621 | |
| | 1,183 | | | Qualys, Inc.* | | | 132,768 | |
| | 5,701 | | | Rapid7, Inc.* | | | 193,720 | |
| | 13,397 | | | Sabre Corp.* | | | 82,793 | |
| | 4,349 | | | Sapiens International Corp. NV (Israel) | | | 80,370 | |
| | 784 | | | Sprout Social, Inc., Class A* | | | 44,265 | |
| | 6,105 | | | SPS Commerce, Inc.* | | | 784,065 | |
| | 13,287 | | | StoneCo Ltd., Class A (Brazil)* | | | 125,429 | |
| | 16,068 | | | Tenable Holdings, Inc.* | | | 612,994 | |
| | 1,171 | | | Tucows, Inc., Class A*(a) | | | 39,720 | |
| | 5,751 | | | Unisys Corp.* | | | 29,388 | |
| | 3,030 | | | Verint Systems, Inc.* | | | 109,928 | |
| | 1,817 | | | Workiva, Inc.* | | | 152,573 | |
| | 9,794 | | | Yext, Inc.* | | | 63,955 | |
| | 18,949 | | | Zuora, Inc., Class A* | | | 120,516 | |
| | | | | | | | |
| | | | | | | 10,184,357 | |
| | |
| Technology Hardware & Equipment – 3.0% | |
| | 1,293 | | | Belden, Inc. | | | 92,967 | |
| | 3,955 | | | Benchmark Electronics, Inc. | | | 105,559 | |
| | 2,691 | | | Clearfield, Inc.* | | | 253,331 | |
| | 4,382 | | | Corsair Gaming, Inc.*(a) | | | 59,464 | |
| | 9,531 | | | ePlus, Inc.* | | | 422,033 | |
| | 9,456 | | | Extreme Networks, Inc.* | | | 173,139 | |
| | 4,138 | | | Fabrinet (Thailand)* | | | 530,574 | |
| | 2,780 | | | Identiv, Inc.* | | | 20,127 | |
| | 5,011 | | | NetScout Systems, Inc.* | | | 162,908 | |
| | 2,401 | | | PC Connection, Inc. | | | 112,607 | |
| | 2,676 | | | Sanmina Corp.* | | | 153,308 | |
| | 9,072 | | | Super Micro Computer, Inc.* | | | 744,811 | |
| | 4,193 | | | TTM Technologies, Inc.* | | | 63,230 | |
| | 10,574 | | | Vishay Intertechnology, Inc. | | | 228,081 | |
| | 5,234 | | | Vishay Precision Group, Inc.* | | | 202,294 | |
| | | | | | | | |
| | | | | | | 3,324,433 | |
| | |
| Telecommunication Services – 0.3% | |
| | 40,720 | | | Globalstar, Inc.* | | | 54,158 | |
| | 6,076 | | | Iridium Communications, Inc.* | | | 312,306 | |
| | | | | | | | |
| | | | | | | 366,464 | |
| | |
| Transportation – 1.8% | |
| | 412 | | | ArcBest Corp. | | | 28,856 | |
| | 63,127 | | | Costamare, Inc. (Monaco) | | | 585,818 | |
| | 3,507 | | | Eagle Bulk Shipping, Inc. | | | 175,140 | |
| | 18,884 | | | Golden Ocean Group Ltd. (Norway)(a) | | | 164,102 | |
| | 29,664 | | | Marten Transport Ltd. | | | 586,754 | |
| | 5,232 | | | PAM Transportation Services, Inc.* | | | 135,509 | |
| | 93,121 | | | Safe Bulkers, Inc. (Greece) | | | 270,982 | |
| | | | | | | | |
| | | | | | | 1,947,161 | |
| | |
|
| Common Stocks – (continued) | |
| Utilities – 0.8% | |
| | 8,796 | | | Montauk Renewables, Inc.* | | | 97,020 | |
| | 9,936 | | | ONE Gas, Inc. | | | 752,354 | |
| | | | | | | | |
| | | | | | | 849,374 | |
| | |
| | TOTAL COMMON STOCKS | |
| | (Cost $107,038,771) | | $ | 107,218,435 | |
| | |
| | | | | | |
| Shares | | Dividend
Rate | | Value | |
|
| Investment Company – 0.8%(b) | |
Goldman Sachs Financial Square Government Fund — Institutional Shares | |
| 852,072 | | 4.159% | | $ | 852,072 | |
| (Cost $852,072) | |
| |
| TOTAL INVESTMENTS BEFORE SECURITIES LENDING REINVESTMENT VEHICLE | |
| (Cost $107,890,843) | | $ | 108,070,507 | |
| |
| | | | | | |
|
| Securities Lending Reinvestment Vehicle – 0.9%(b) | |
Goldman Sachs Financial Square Government Fund — Institutional Shares | |
| 1,025,843 | | 4.159% | | $ | 1,025,843 | |
| (Cost $1,025,843) | |
| |
| TOTAL INVESTMENTS – 99.6% | |
| (Cost $108,916,686) | | $ | 109,096,350 | |
| |
OTHER ASSETS IN EXCESS OF LIABILITIES – 0.4% | | | 397,490 | |
| |
| NET ASSETS – 100.0% | | $ | 109,493,840 | |
| |
| | |
| The percentage shown for each investment category reflects the value of investments in that category as a percentage of net assets. |
| |
| * | | Non-income producing security. |
| |
| (a) | | All or a portion of security is on loan. |
| |
| (b) | | Represents an affiliated issuer. |
| |
| (c) | | All or portion of security is pledged as collateral for futures contracts. Total market value of securities pledged as collateral on futures contracts amounts to $704,050, which represents approximately 0.6% of net assets as of December 31, 2022. |
| | |
| |
| Investment Abbreviations: |
| PLC | | —Public Limited Company |
| REIT | | —Real Estate Investment Trust |
| | |
| 72 | | The accompanying notes are an integral part of these financial statements. |
GOLDMAN SACHS VARIABLE INSURANCE TRUST SMALL CAP EQUITY INSIGHTS FUND
ADDITIONAL INVESTMENT INFORMATION
FUTURES CONTRACTS — As of December 31, 2022, the Fund had the following futures contracts:
| | | | | | | | | | | | | | | | |
| Description | | Number of
Contracts | | | Expiration
Date | | | Notional
Amount | | | Unrealized
Appreciation/
(Depreciation) | |
| | | | |
Long position contracts: | | | | | | | | | | | | | | | | |
Russell 2000 E-Mini Index | | | 20 | | | | 03/17/23 | | | $ | 1,770,900 | | | $ | (40,753 | ) |
| | |
| The accompanying notes are an integral part of these financial statements. | | 73 |
GOLDMAN SACHS VARIABLE INSURANCE TRUST STRATEGIC GROWTH FUND
Schedule of Investments
December 31, 2022
| | | | | | | | |
Shares | | | Description | | Value | |
|
| Common Stocks – 98.8% | |
| Automobiles & Components – 2.2% | |
| | 14,661 | | | Aptiv PLC* | | $ | 1,365,379 | |
| | 30,945 | | | Tesla, Inc.* | | | 3,811,805 | |
| | | | | | | | |
| | | | | | | 5,177,184 | |
| | |
| Capital Goods – 2.1% | |
| | 11,520 | | | Boeing Co. (The)* | | | 2,194,445 | |
| | 6,713 | | | Deere & Co. | | | 2,878,266 | |
| | | | | | | | |
| | | | | | | 5,072,711 | |
| | |
| Commercial & Professional Services – 1.3% | |
| | 10,325 | | | Verisk Analytics, Inc. | | | 1,821,536 | |
| | 9,444 | | | Waste Connections, Inc. | | | 1,251,897 | |
| | | | | | | | |
| | | | | | | 3,073,433 | |
| | |
| Consumer Durables & Apparel – 2.6% | |
| | 6,220 | | | Lululemon Athletica, Inc.* | | | 1,992,763 | |
| | 34,571 | | | NIKE, Inc., Class B | | | 4,045,153 | |
| | | | | | | | |
| | | | | | | 6,037,916 | |
| | |
| Consumer Services – 2.0% | |
| | 1,249 | | | Chipotle Mexican Grill, Inc.* | | | 1,732,975 | |
| | 11,453 | | | McDonald’s Corp. | | | 3,018,209 | |
| | | | | | | | |
| | | | | | | 4,751,184 | |
| | |
| Diversified Financials – 1.8% | |
| | 40,345 | | | Charles Schwab Corp. (The) | | | 3,359,125 | |
| | 8,046 | | | Intercontinental Exchange, Inc. | | | 825,439 | |
| | | | | | | | |
| | | | | | | 4,184,564 | |
| | |
| Food, Beverage & Tobacco – 4.1% | |
| | 57,376 | | | Coca-Cola Co. (The) | | | 3,649,688 | |
| | 34,170 | | | McCormick & Co., Inc. | | | 2,832,351 | |
| | 15,802 | | | Mondelez International, Inc., Class A | | | 1,053,203 | |
| | 22,425 | | | Monster Beverage Corp.* | | | 2,276,810 | |
| | | | | | | | |
| | | | | | | 9,812,052 | |
| | |
| Health Care Equipment & Services – 8.4% | |
| | 71,262 | | | Boston Scientific Corp.* | | | 3,297,293 | |
| | 5,556 | | | Humana, Inc. | | | 2,845,728 | |
| | 6,263 | | | Insulet Corp.* | | | 1,843,764 | |
| | 13,642 | | | Intuitive Surgical, Inc.* | | | 3,619,905 | |
| | 13,083 | | | UnitedHealth Group, Inc. | | | 6,936,345 | |
| | 8,946 | | | Veeva Systems, Inc., Class A* | | | 1,443,705 | |
| | | | | | | | |
| | | | | | | 19,986,740 | |
| | |
| Household & Personal Products – 2.8% | |
| | 7,715 | | | Estee Lauder Cos., Inc. (The), Class A | | | 1,914,169 | |
| | 30,748 | | | Procter & Gamble Co. (The) | | | 4,660,167 | |
| | | | | | | | |
| | | | | | | 6,574,336 | |
| | |
| Materials – 4.3% | |
| | 26,817 | | | Freeport-McMoRan, Inc. | | | 1,019,046 | |
| | 8,890 | | | Linde PLC (United Kingdom) | | | 2,899,740 | |
| | 5,290 | | | Martin Marietta Materials, Inc. | | | 1,787,862 | |
| | 19,010 | | | Sherwin-Williams Co. (The) | | | 4,511,643 | |
| | | | | | | | |
| | | | | | | 10,218,291 | |
| | |
|
| Common Stocks – (continued) | |
| Media & Entertainment – 5.6% | |
| | 63,129 | | | Alphabet, Inc., Class A* | | | 5,569,872 | |
| | 66,102 | | | Alphabet, Inc., Class C* | | | 5,865,230 | |
| | 17,878 | | | Live Nation Entertainment, Inc.* | | | 1,246,812 | |
| | 59,253 | | | Snap, Inc., Class A* | | | 530,314 | |
| | | | | | | | |
| | | | | | | 13,212,228 | |
| | |
| Pharmaceuticals, Biotechnology & Life Sciences – 8.6% | |
| | 5,018 | | | Alnylam Pharmaceuticals, Inc.* | | | 1,192,528 | |
| | 3,150 | | | Argenx SE ADR (Netherlands)* | | | 1,193,315 | |
| | 21,347 | | | AstraZeneca PLC ADR (United Kingdom) | | | 1,447,327 | |
| | 15,472 | | | BioMarin Pharmaceutical, Inc.* | | | 1,601,197 | |
| | 26,143 | | | Catalent, Inc.* | | | 1,176,696 | |
| | 8,255 | | | Danaher Corp. | | | 2,191,042 | |
| | 16,332 | | | Eli Lilly & Co. | | | 5,974,899 | |
| | 14,091 | | | Gilead Sciences, Inc. | | | 1,209,712 | |
| | 7,971 | | | Sarepta Therapeutics, Inc.* | | | 1,032,882 | |
| | 17,972 | | | Seagen, Inc.* | | | 2,309,582 | |
| | 4,788 | | | West Pharmaceutical Services, Inc. | | | 1,126,856 | |
| | | | | | | | |
| | | | | | | 20,456,036 | |
| | |
| Real Estate – 1.8% | |
| | 10,852 | | | American Tower Corp. REIT | | | 2,299,105 | |
| | 3,038 | | | Equinix, Inc. REIT | | | 1,989,981 | |
| | | | | | | | |
| | | | | | | 4,289,086 | |
| | |
| Retailing – 7.6% | |
| | 140,644 | | | Amazon.com, Inc.* | | | 11,814,096 | |
| | 12,427 | | | Etsy, Inc.* | | | 1,488,506 | |
| | 5,438 | | | RH* | | | 1,452,979 | |
| | 28,159 | | | Ross Stores, Inc. | | | 3,268,415 | |
| | | | | | | | |
| | | | | | | 18,023,996 | |
| | |
| Semiconductors & Semiconductor Equipment – 6.4% | |
| | 7,580 | | | KLA Corp. | | | 2,857,887 | |
| | 66,477 | | | Marvell Technology, Inc. | | | 2,462,308 | |
| | 57,547 | | | NVIDIA Corp. | | | 8,409,919 | |
| | 15,578 | | | ON Semiconductor Corp.* | | | 971,600 | |
| | 6,676 | | | Wolfspeed, Inc.* | | | 460,911 | |
| | | | | | | | |
| | | | | | | 15,162,625 | |
| | |
| Software & Services – 23.6% | |
| | 14,480 | | | Accenture PLC, Class A | | | 3,863,843 | |
| | 4,171 | | | Adobe, Inc.* | | | 1,403,667 | |
| | 7,582 | | | Atlassian Corp., Class A* | | | 975,652 | |
| | 10,875 | | | Bill.com Holdings, Inc.* | | | 1,184,940 | |
| | 2,370 | | | HubSpot, Inc.* | | | 685,238 | |
| | 21,205 | | | Mastercard, Inc., Class A | | | 7,373,615 | |
| | 109,466 | | | Microsoft Corp. | | | 26,252,136 | |
| | 26,979 | | | PayPal Holdings, Inc.* | | | 1,921,444 | |
| | 31,978 | | | Salesforce, Inc.* | | | 4,239,963 | |
| | 7,220 | | | ServiceNow, Inc.* | | | 2,803,309 | |
| | 10,594 | | | Snowflake, Inc., Class A* | | | 1,520,663 | |
| | 15,190 | | | Visa, Inc., Class A | | | 3,155,874 | |
| | 5,654 | | | Zscaler, Inc.* | | | 632,683 | |
| | | | | | | | |
| | | | | | | 56,013,027 | |
| | |
| | |
| 74 | | The accompanying notes are an integral part of these financial statements. |
GOLDMAN SACHS VARIABLE INSURANCE TRUST STRATEGIC GROWTH FUND
| | | | | | | | |
Shares | | | Description | | Value | |
|
| Common Stocks – (continued) | |
| Technology Hardware & Equipment – 11.4% | |
| | 27,156 | | | Amphenol Corp., Class A | | $ | 2,067,658 | |
| | 191,805 | | | Apple, Inc. | | | 24,921,223 | |
| | | | | | | | |
| | | | | | | 26,988,881 | |
| | |
| Transportation – 2.2% | |
| | 10,630 | | | Old Dominion Freight Line, Inc. | | | 3,016,581 | |
| | 6,209 | | | Union Pacific Corp. | | | 1,285,698 | |
| | 5,825 | | | United Parcel Service, Inc., Class B | | | 1,012,618 | |
| | | | | | | | |
| | | | | | | 5,314,897 | |
| | |
| | TOTAL COMMON STOCKS | |
| | (Cost $133,684,078) | | $ | 234,349,187 | |
| | |
| | | | | | |
| Shares | | Dividend
Rate | | Value | |
|
| Investment Company – 1.2%(a) | |
Goldman Sachs Financial Square Government Fund — Institutional Shares | |
| 2,849,066 | | 4.159% | | $ | 2,849,066 | |
| (Cost $2,849,066) | |
| |
| TOTAL INVESTMENTS – 100.0% | |
| (Cost $136,533,144) | | $ | 237,198,253 | |
| |
OTHER ASSETS IN EXCESS OF LIABILITIES – 0.0% | | | 83,654 | |
| |
| NET ASSETS – 100.0% | | $ | 237,281,907 | |
| |
| | |
| The percentage shown for each investment category reflects the value of investments in that category as a percentage of net assets. |
| |
| * | | Non-income producing security. |
| |
| (a) | | Represents an affiliated issuer. |
| | |
| |
| Investment Abbreviations: |
| ADR | | —American Depositary Receipt |
| PLC | | —Public Limited Company |
| REIT | | —Real Estate Investment Trust |
| | |
| The accompanying notes are an integral part of these financial statements. | | 75 |
GOLDMAN SACHS VARIABLE INSURANCE TRUST U.S. EQUITY INSIGHTS FUND
Schedule of Investments
December 31, 2022
| | | | | | | | |
| Shares | | | Description | | Value | |
|
| Common Stocks – 99.3% | |
| Automobiles & Components – 2.3% | |
| | 14,646 | | | Aptiv PLC* | | $ | 1,363,982 | |
| | 92,590 | | | General Motors Co. | | | 3,114,728 | |
| | 16,514 | | | Tesla, Inc.* | | | 2,034,194 | |
| | | | | | | | |
| | | | | | | 6,512,904 | |
| | |
| Banks – 1.2% | |
| | 35,828 | | | East West Bancorp, Inc. | | | 2,361,065 | |
| | 1,773 | | | JPMorgan Chase & Co. | | | 237,759 | |
| | 15,773 | | | Webster Financial Corp. | | | 746,694 | |
| | 3,792 | | | Western Alliance Bancorp | | | 225,852 | |
| | | | | | | | |
| | | | | | | 3,571,370 | |
| | |
| Capital Goods – 6.9% | |
| | 25,222 | | | AMETEK, Inc. | | | 3,524,018 | |
| | 4,878 | | | Fastenal Co. | | | 230,827 | |
| | 13,813 | | | General Dynamics Corp. | | | 3,427,143 | |
| | 73,500 | | | Howmet Aerospace, Inc. | | | 2,896,635 | |
| | 51,838 | | | Johnson Controls International PLC | | | 3,317,632 | |
| | 8,407 | | | Lockheed Martin Corp. | | | 4,089,921 | |
| | 19,344 | | | nVent Electric PLC | | | 744,164 | |
| | 6,188 | | | Trane Technologies PLC | | | 1,040,141 | |
| | 895 | | | United Rentals, Inc.* | | | 318,101 | |
| | | | | | | | |
| | | | | | | 19,588,582 | |
| | |
| Commercial & Professional Services – 0.8% | |
| | 17,692 | | | Republic Services, Inc. | | | 2,282,091 | |
| | |
| Consumer Durables & Apparel – 0.1% | |
| | 2,459 | | | Whirlpool Corp. | | | 347,850 | |
| | |
| Consumer Services – 0.9% | |
| | 1,608 | | | Boyd Gaming Corp. | | | 87,684 | |
| | 12,877 | | | Marriott International, Inc., Class A | | | 1,917,257 | |
| | 5,760 | | | Wynn Resorts Ltd.* | | | 475,027 | |
| | | | | | | | |
| | | | | | | 2,479,968 | |
| | |
| Diversified Financials – 7.7% | |
| | 3,201 | | | Ameriprise Financial, Inc. | | | 996,695 | |
| | 75,339 | | | Bank of New York Mellon Corp. (The) | | | 3,429,431 | |
| | 18,979 | | | Berkshire Hathaway, Inc., Class B* | | | 5,862,613 | |
| | 16,688 | | | Capital One Financial Corp. | | | 1,551,317 | |
| | 19,979 | | | CME Group, Inc. | | | 3,359,669 | |
| | 14,674 | | | Corebridge Financial, Inc. | | | 294,360 | |
| | 2,815 | | | Discover Financial Services | | | 275,391 | |
| | 8,925 | | | Equitable Holdings, Inc. | | | 256,148 | |
| | 3,258 | | | MSCI, Inc. | | | 1,515,524 | |
| | 29,016 | | | Stifel Financial Corp. | | | 1,693,664 | |
| | 77,422 | | | Synchrony Financial | | | 2,544,087 | |
| | | | | | | | |
| | | | | | | 21,778,899 | |
| | |
| Energy – 5.4% | |
| | 4,971 | | | APA Corp. | | | 232,046 | |
| | 10,602 | | | EOG Resources, Inc. | | | 1,373,171 | |
| | 9,045 | | | Exxon Mobil Corp. | | | 997,664 | |
| | 27,541 | | | Halliburton Co. | | | 1,083,738 | |
| | 3,185 | | | Hess Corp. | | | 451,697 | |
| | |
|
| Common Stocks – (continued) | |
| Energy – (continued) | |
| | 114,414 | | | Kinder Morgan, Inc. | | | 2,068,605 | |
| | 21,441 | | | Marathon Oil Corp. | | | 580,408 | |
| | 11,844 | | | Marathon Petroleum Corp. | | | 1,378,523 | |
| | 14,316 | | | Pioneer Natural Resources Co. | | | 3,269,631 | |
| | 19,262 | | | Schlumberger Ltd. | | | 1,029,747 | |
| | 84,347 | | | Williams Cos., Inc. (The) | | | 2,775,016 | |
| | | | | | | | |
| | | | | | | 15,240,246 | |
| | |
| Food & Staples Retailing – 0.5% | |
| | 2,908 | | | Costco Wholesale Corp. | | | 1,327,502 | |
| | |
| Food, Beverage & Tobacco – 3.4% | |
| | 6,314 | | | Altria Group, Inc. | | | 288,613 | |
| | 60,150 | | | Mondelez International, Inc., Class A | | | 4,008,997 | |
| | 14,580 | | | PepsiCo, Inc. | | | 2,634,023 | |
| | 27,417 | | | Philip Morris International, Inc. | | | 2,774,875 | |
| | | | | | | | |
| | | | | | | 9,706,508 | |
| | |
| Health Care Equipment & Services – 9.1% | |
| | 78,659 | | | Boston Scientific Corp.* | | | 3,639,552 | |
| | 36,961 | | | Centene Corp.* | | | 3,031,172 | |
| | 2,971 | | | Cigna Corp. | | | 984,411 | |
| | 39,669 | | | CVS Health Corp. | | | 3,696,754 | |
| | 8,037 | | | Elevance Health, Inc. | | | 4,122,740 | |
| | 6,783 | | | Humana, Inc. | | | 3,474,185 | |
| | 5,305 | | | Intuitive Surgical, Inc.* | | | 1,407,682 | |
| | 50,606 | | | Medtronic PLC | | | 3,933,098 | |
| | 2,788 | | | UnitedHealth Group, Inc. | | | 1,478,142 | |
| | 607 | | | Universal Health Services, Inc., Class B | | | 85,520 | |
| | | | | | | | |
| | | | | | | 25,853,256 | |
| | |
| Household & Personal Products – 0.4% | |
| | 9,167 | | | Kimberly-Clark Corp. | | | 1,244,420 | |
| | |
| Insurance – 3.2% | |
| | 10,203 | | | American Financial Group, Inc. | | | 1,400,668 | |
| | 18,645 | | | Chubb Ltd. | | | 4,113,087 | |
| | 4,193 | | | Lincoln National Corp. | | | 128,809 | |
| | 21,658 | | | Marsh & McLennan Cos., Inc. | | | 3,583,966 | |
| | | | | | | | |
| | | | | | | 9,226,530 | |
| | |
| Materials – 2.5% | |
| | 3,802 | | | Eagle Materials, Inc. | | | 505,096 | |
| | 8,260 | | | Element Solutions, Inc. | | | 150,249 | |
| | 803 | | | International Flavors & Fragrances, Inc. | | | 84,187 | |
| | 6,430 | | | Linde PLC (United Kingdom) | | | 2,097,337 | |
| | 27,745 | | | Mosaic Co. (The) | | | 1,217,173 | |
| | 1,344 | | | Nucor Corp. | | | 177,153 | |
| | 10,923 | | | Sherwin-Williams Co. (The) | | | 2,592,356 | |
| | 1,192 | | | Vulcan Materials Co. | | | 208,731 | |
| | | | | | | | |
| | | | | | | 7,032,282 | |
| | |
| Media & Entertainment – 4.1% | |
| | 70,087 | | | Alphabet, Inc., Class C* | | | 6,218,819 | |
| | 5,856 | | | Charter Communications, Inc., Class A* | | | 1,985,770 | |
| | |
| | |
| 76 | | The accompanying notes are an integral part of these financial statements. |
GOLDMAN SACHS VARIABLE INSURANCE TRUST U.S. EQUITY INSIGHTS FUND
��
| | | | | | | | |
| Shares | | | Description | | Value | |
|
| Common Stocks – (continued) | |
| Media & Entertainment – (continued) | |
| | 16,309 | | | Live Nation Entertainment, Inc.* | | $ | 1,137,390 | |
| | 6,778 | | | Meta Platforms, Inc., Class A* | | | 815,665 | |
| | 305 | | | Netflix, Inc.* | | | 89,938 | |
| | 52,722 | | | News Corp., Class A | | | 959,540 | |
| | 9,734 | | | Trade Desk, Inc. (The), Class A* | | | 436,375 | |
| | | | | | | | |
| | | | | | | 11,643,497 | |
| | |
| Pharmaceuticals, Biotechnology & Life Sciences – 9.8% | |
| | 355 | | | AbbVie, Inc. | | | 57,371 | |
| | 69,063 | | | Avantor, Inc.* | | | 1,456,539 | |
| | 4,834 | | | Biogen, Inc.* | | | 1,338,631 | |
| | 51,663 | | | Bristol-Myers Squibb Co. | | | 3,717,153 | |
| | 17,303 | | | Elanco Animal Health, Inc.* | | | 211,443 | |
| | 45,257 | | | Gilead Sciences, Inc. | | | 3,885,313 | |
| | 29,002 | | | Incyte Corp.* | | | 2,329,441 | |
| | 39,418 | | | Johnson & Johnson | | | 6,963,190 | |
| | 6,346 | | | Merck & Co., Inc. | | | 704,089 | |
| | 508 | | | Mettler-Toledo International, Inc.* | | | 734,288 | |
| | 7,853 | | | Pfizer, Inc. | | | 402,388 | |
| | 1,967 | | | Regeneron Pharmaceuticals, Inc.* | | | 1,419,171 | |
| | 19,528 | | | Royalty Pharma PLC, Class A | | | 771,746 | |
| | 354 | | | United Therapeutics Corp.* | | | 98,444 | |
| | 12,596 | | | Vertex Pharmaceuticals, Inc.* | | | 3,637,473 | |
| | | | | | | | |
| | | | | | | 27,726,680 | |
| | |
| Real Estate – 5.6% | |
| | 16,616 | | | Camden Property Trust REIT | | | 1,858,998 | |
| | 5,272 | | | Crown Castle, Inc. REIT | | | 715,094 | |
| | 12,594 | | | CubeSmart REIT | | | 506,908 | |
| | 108,180 | | | Host Hotels & Resorts, Inc. REIT | | | 1,736,289 | |
| | 12,131 | | | Life Storage, Inc. REIT | | | 1,194,904 | |
| | 12,852 | | | Mid-America Apartment Communities, Inc. REIT | | | 2,017,635 | |
| | 43,822 | | | National Storage Affiliates Trust REIT | | | 1,582,851 | |
| | 43,872 | | | Park Hotels & Resorts, Inc. REIT | | | 517,251 | |
| | 11,888 | | | Public Storage REIT | | | 3,330,899 | |
| | 8,348 | | | SBA Communications Corp. REIT | | | 2,340,028 | |
| | | | | | | | |
| | | | | | | 15,800,857 | |
| | |
| Retailing – 4.5% | |
| | 110,393 | | | Amazon.com, Inc.* | | | 9,273,012 | |
| | 1,217 | | | AutoZone, Inc.* | | | 3,001,341 | |
| | 3,901 | | | Chewy, Inc., Class A* | | | 144,649 | |
| | 3,767 | | | LKQ Corp. | | | 201,195 | |
| | 10,501 | | | Macy’s, Inc. | | | 216,846 | |
| | | | | | | | |
| | | | | | | 12,837,043 | |
| | |
| Semiconductors & Semiconductor Equipment – 3.4% | |
| | 2,104 | | | Analog Devices, Inc. | | | 345,119 | |
| | 5,427 | | | Applied Materials, Inc. | | | 528,481 | |
| | 5,497 | | | Broadcom, Inc. | | | 3,073,538 | |
| | 3,201 | | | Lam Research Corp. | | | 1,345,380 | |
| | 15,138 | | | Microchip Technology, Inc. | | | 1,063,445 | |
| | 4,194 | | | Micron Technology, Inc. | | | 209,616 | |
| | 923 | | | Monolithic Power Systems, Inc. | | | 326,382 | |
| | |
|
| Common Stocks – (continued) | |
| Semiconductors & Semiconductor Equipment – (continued) | |
| | 6,456 | | | NVIDIA Corp. | | | 943,480 | |
| | 6,647 | | | NXP Semiconductors NV (China) | | | 1,050,425 | |
| | 13,141 | | | ON Semiconductor Corp.* | | | 819,604 | |
| | | | | | | | |
| | | | | | | 9,705,470 | |
| | |
| Software & Services – 15.4% | |
| | 12,338 | | | Accenture PLC, Class A | | | 3,292,272 | |
| | 13,376 | | | Adobe, Inc.* | | | 4,501,425 | |
| | 2,002 | | | Autodesk, Inc.* | | | 374,114 | |
| | 16,980 | | | Cognizant Technology Solutions Corp., Class A | | | 971,086 | |
| | 21,861 | | | Fortinet, Inc.* | | | 1,068,784 | |
| | 4,178 | | | Gartner, Inc.* | | | 1,404,393 | |
| | 7,629 | | | International Business Machines Corp. | | | 1,074,850 | |
| | 4,933 | | | Intuit, Inc. | | | 1,920,022 | |
| | 54,158 | | | Microsoft Corp. | | | 12,988,172 | |
| | 7,737 | | | NCR Corp.* | | | 181,123 | |
| | 18,992 | | | Palo Alto Networks, Inc.* | | | 2,650,144 | |
| | 2,794 | | | Paycom Software, Inc.* | | | 867,006 | |
| | 34,435 | | | PayPal Holdings, Inc.* | | | 2,452,461 | |
| | 4,432 | | | Roper Technologies, Inc. | | | 1,915,023 | |
| | 1,687 | | | Salesforce, Inc.* | | | 223,679 | |
| | 6,438 | | | ServiceNow, Inc.* | | | 2,499,682 | |
| | 9,767 | | | Snowflake, Inc., Class A* | | | 1,401,955 | |
| | 15,797 | | | VeriSign, Inc.* | | | 3,245,336 | |
| | 1,828 | | | Visa, Inc., Class A | | | 379,785 | |
| | 6,120 | | | Zoom Video Communications, Inc., Class A* | | | 414,569 | |
| | | | | | | | |
| | | | | | | 43,825,881 | |
| | |
| Technology Hardware & Equipment – 8.6% | |
| | 111,423 | | | Apple, Inc. | | | 14,477,190 | |
| | 1,257 | | | Arista Networks, Inc.* | | | 152,537 | |
| | 90,057 | | | Cisco Systems, Inc. | | | 4,290,316 | |
| | 89,940 | | | Hewlett Packard Enterprise Co. | | | 1,435,442 | |
| | 7,468 | | | Pure Storage, Inc., Class A* | | | 199,844 | |
| | 8,729 | | | TE Connectivity Ltd. (Switzerland) | | | 1,002,089 | |
| | 7,017 | | | Teledyne Technologies, Inc.* | | | 2,806,169 | |
| | | | | | | | |
| | | | | | | 24,363,587 | |
| | |
| Telecommunication Services – 0.2% | |
| | 30,425 | | | Liberty Global PLC, Class C (United Kingdom)* | | | 591,158 | |
| | |
| Transportation – 3.2% | |
| | 120,659 | | | CSX Corp. | | | 3,738,016 | |
| | 12,685 | | | Knight-Swift Transportation Holdings, Inc. | | | 664,821 | |
| | 5,528 | | | Ryder System, Inc. | | | 461,975 | |
| | 20,765 | | | Union Pacific Corp. | | | 4,299,808 | |
| | | | | | | | |
| | | | | | | 9,164,620 | |
| | |
| | |
| The accompanying notes are an integral part of these financial statements. | | 77 |
GOLDMAN SACHS VARIABLE INSURANCE TRUST U.S. EQUITY INSIGHTS FUND
Schedule of Investments (continued)
December 31, 2022
| | | | | | | | |
| Shares | | | Description | | Value | |
|
| Common Stocks – (continued) | |
| Utilities – 0.1% | |
| | 5,102 | | | Brookfield Renewable Corp., Class A | | $ | 140,509 | |
| | 3,971 | | | CMS Energy Corp. | | | 251,483 | |
| | | | | | | | |
| | | | | | | 391,992 | |
| | |
| | TOTAL INVESTMENTS – 99.3% | |
| | (Cost $247,886,423) | | $ | 282,243,193 | |
| | |
| OTHER ASSETS IN EXCESS OF
LIABILITIES – 0.7% | | | 1,865,165 | |
| | |
| | NET ASSETS – 100.0% | | $ | 284,108,358 | |
| | |
| | |
| The percentage shown for each investment category reflects the value of investments in that category as a percentage of net assets. |
| |
| * | | Non-income producing security. |
| | |
| |
| Investment Abbreviations: |
| PLC | | —Public Limited Company |
| REIT | | —Real Estate Investment Trust |
ADDITIONAL INVESTMENT INFORMATION
FUTURES CONTRACTS — As of December 31, 2022, the Fund had the following futures contracts:
| | | | | | | | | | | | | | | | |
| Description | | Number of
Contracts | | | Expiration
Date | | | Notional
Amount | | | Unrealized
Appreciation/
(Depreciation) | |
| | | | |
Long position contracts: | | | | | | | | | | | | | | | | |
S&P 500 E-Mini Index | | | 3 | | | | 03/17/23 | | | $ | 579,150 | | | $ | (16,178 | ) |
| | |
| 78 | | The accompanying notes are an integral part of these financial statements. |
GOLDMAN SACHS VARIABLE INSURANCE TRUST EQUITY FUNDS
Statements of Assets and Liabilities
December 31, 2022
| | | | | | | | | | | | | | | | |
| | | Equity
Index Fund | | | International
Equity Insights
Fund | | | Large Cap
Value Fund | | | Mid Cap
Growth Fund | |
| | | | | | | | | | | | | | | | |
| Assets: | | | | | | | | | | | | |
| | | | |
Investments in unaffiliated issuers, at value (cost $45,445,384, $89,264,313, $336,321,975 and $44,383,098, respectively)(a) | | $ | 160,142,717 | | | $ | 91,630,714 | | | $ | 380,265,133 | | | $ | 49,646,471 | |
Investments in affiliated issuers, at value (cost $174,699, $—, $394,821 and $2,865,404, respectively) | | | 583,746 | | | | — | | | | 394,821 | | | | 2,865,404 | |
Investments in affiliated securities lending reinvestment vehicle, at value which equals cost | | | — | | | | 166,392 | | | | — | | | | — | |
Cash | | | 200,138 | | | | 471,196 | | | | 501,073 | | | | 88,766 | |
Foreign currency, at value (cost $–, $1,077,587, $– and $–, respectively) | | | — | | | | 1,089,749 | | | | — | | | | — | |
Receivables: | | | | | | | | | | | | | | | | |
Dividends | | | 139,526 | | | | 54,358 | | | | 316,712 | | | | 11,970 | |
Investments sold | | | 23,339 | | | | — | | | | 2,763,923 | | | | — | |
Collateral on certain derivative contracts | | | 21,210 | | | | 77,695 | | | | — | | | | — | |
Reimbursement from investment adviser | | | 11,624 | | | | 7,189 | | | | 2,322 | | | | 13,370 | |
Fund shares sold | | | 9,228 | | | | 1,878 | | | | 88,925 | | | | 91 | |
Securities lending income | | | 3 | | | | 934 | | | | — | | | | — | |
Foreign tax reclaims | | | — | | | | 343,284 | | | | 1,920 | | | | — | |
Variation margin on futures contracts | | | 8,286 | | | | — | | | | — | | | | — | |
Other assets | | | 355 | | | | 10,221 | | | | 649 | | | | 74,860 | |
| | | | |
| Total assets | | | 161,140,172 | | | | 93,853,610 | | | | 384,335,478 | | | | 52,700,932 | |
| | | | | | | | | | | | | | | | |
| | | | | | | | | | | | | | | | |
| Liabilities: | | | | | | | | | | | | |
| | | | |
Variation margin on futures contracts | | | — | | | | 6,263 | | | | — | | | | — | |
Payables: | | | | | | | | | | | | | | | | |
Distribution and Service fees and Transfer Agency fees | | | 41,950 | | | | 8,928 | | | | 60,609 | | | | 13,044 | |
Management fees | | | 32,879 | | | | 85,731 | | | | 226,516 | | | | 36,641 | |
Fund shares redeemed | | | 1,422 | | | | 49,202 | | | | 317,542 | | | | 73,376 | |
Payable upon return of securities loaned | | | — | | | | 166,392 | | | | — | | | | — | |
Due to custodian | | | — | | | | — | | | | — | | | | 1,096 | |
Accrued expenses | | | 125,457 | | | | 213,091 | | | | 195,175 | | | | 158,980 | |
| | | | |
| Total liabilities | | | 201,708 | | | | 529,607 | | | | 799,842 | | | | 283,137 | |
| | | | | | | | | | | | | | | | |
| | | | | | | | | | | | | | | | |
| Net Assets: | | | | | | | | | | | | |
| | | | |
Paid-in capital | | | 47,750,825 | | | | 102,789,423 | | | | 329,513,064 | | | | 47,767,595 | |
Total distributable earnings (loss) | | | 113,187,639 | | | | (9,465,420 | ) | | | 54,022,572 | | | | 4,650,200 | |
| | | | |
| NET ASSETS | | $ | 160,938,464 | | | $ | 93,324,003 | | | $ | 383,535,636 | | | $ | 52,417,795 | |
Net Assets: | | | | | | | | | | | | | | | | |
Institutional | | $ | — | | | $ | 59,170,293 | | | $ | 145,165,059 | | | $ | 1,132,280 | |
Service | | | 160,938,464 | | | | 34,153,710 | | | | 238,370,577 | | | | 51,285,515 | |
| | | | |
Total Net Assets | | $ | 160,938,464 | | | $ | 93,324,003 | | | $ | 383,535,636 | | | $ | 52,417,795 | |
Shares outstanding $0.001 par value (unlimited number of shares authorized): | | | | | | | | | | | | | | | | |
Institutional | | | — | | | | 7,722,382 | | | | 17,404,359 | | | | 121,508 | |
Service | | | 9,488,800 | | | | 4,435,481 | | | | 28,563,269 | | | | 5,911,489 | |
Net asset value, offering and redemption price per share: | | | | | | | | | | | | | | | | |
Institutional | | | $— | | | | $7.66 | | | | $8.34 | | | | $9.32 | |
Service | | | 16.96 | | | | 7.70 | | | | 8.35 | | | | 8.68 | |
| (a) | Includes loaned securities having a market value of $–, $151,139, $– and $–, for the Equity Index, International Equity Insights, Large Cap Value and Mid Cap Growth Funds respectively. |
| | |
| The accompanying notes are an integral part of these financial statements. | | 79 |
GOLDMAN SACHS VARIABLE INSURANCE TRUST EQUITY FUNDS
Statements of Assets and Liabilities (continued)
December 31, 2022
| | | | | | | | | | | | | | | | |
| | | Mid Cap
Value Fund | | | Small Cap
Equity Insights
Fund | | | Strategic
Growth Fund | | | U.S. Equity
Insights Fund | |
| | | | | | | | | | | | | | | | |
| Assets: | | | | | | | | | | | | |
| | | | |
Investments in unaffiliated issuers, at value (cost $348,777,866, $107,038,771, $133,684,078 and $247,886,423, respectively)(a) | | $ | 400,330,821 | | | $ | 107,218,435 | | | $ | 234,349,187 | | | $ | 282,243,193 | |
Investments in affiliated issuers, at value (cost $2,407,505, $852,072, $2,849,066 and $—, respectively) | | | 2,407,505 | | | | 852,072 | | | | 2,849,066 | | | | — | |
Investments in affiliated securities lending reinvestment vehicle, at value which equals cost | | | — | | | | 1,025,843 | | | | — | | | | — | |
Cash | | | — | | | | 1,545,255 | | | | 493,939 | | | | 1,803,222 | |
Receivables: | | | | | | | | | | | | | | | | |
Dividends | | | 509,170 | | | | 103,233 | | | | 56,537 | | | | 400,959 | |
Fund shares sold | | | 92,967 | | | | 81,583 | | | | 21,253 | | | | 88,903 | |
Collateral on certain derivative contracts | | | — | | | | — | | | | — | | | | 34,809 | |
Securities lending income | | | — | | | | 1,436 | | | | — | | | | — | |
Foreign tax reclaims | | | — | | | | 333 | | | | — | | | | 1,006 | |
Reimbursement from investment adviser | | | — | | | | — | | | | 1,814 | | | | 3,368 | |
Other assets | | | 64,393 | | | | 790 | | | | 472 | | | | 26,552 | |
| | | | |
| Total assets | | | 403,404,856 | | | | 110,828,980 | | | | 237,772,268 | | | | 284,602,012 | |
| | | | | | | | | | | | | | | | |
| | | | | | | | | | | | | | | | |
| Liabilities: | | | | | | | | | | | | |
| | | | |
Variation margin on futures contracts | | | — | | | | 6,200 | | | | — | | | | 1,613 | |
Payables: | | | | | | | | | | | | | | | | |
Fund shares redeemed | | | 1,636,083 | | | | 68,706 | | | | 113,556 | | | | 124,053 | |
Management fees | | | 272,188 | | | | 66,172 | | | | 147,667 | | | | 133,879 | |
Due to Custodian (Overdraft) | | | 202,487 | | | | — | | | | — | | | | — | |
Distribution and Service fees and Transfer Agency fees | | | 32,072 | | | | 6,975 | | | | 34,722 | | | | 17,292 | |
Payable upon return of securities loaned | | | — | | | | 1,025,843 | | | | — | | | | — | |
Accrued expenses | | | 361,584 | | | | 161,244 | | | | 194,416 | | | | 216,817 | |
| | | | |
| Total liabilities | | | 2,504,414 | | | | 1,335,140 | | | | 490,361 | | | | 493,654 | |
| | | | | | | | | | | | | | | | |
| | | | | | | | | | | | | | | | |
| Net Assets: | | | | | | | | | | | | |
| | | | |
Paid-in capital | | | 353,579,225 | | | | 123,184,067 | | | | 136,413,254 | | | | 263,032,718 | |
Total distributable earnings (loss) | | | 47,321,217 | | | | (13,690,227 | ) | | | 100,868,653 | | | | 21,075,640 | |
| | | | |
| NET ASSETS | | $ | 400,900,442 | | | $ | 109,493,840 | | | $ | 237,281,907 | | | $ | 284,108,358 | |
Net Assets: | | | | | | | | | | | | | | | | |
Institutional | | $ | 311,440,444 | | | $ | 87,877,132 | | | $ | 122,076,728 | | | $ | 242,238,617 | |
Service | | | 89,459,998 | | | | 21,616,708 | | | | 115,205,179 | | | | 41,869,741 | |
| | | | |
Total Net Assets | | $ | 400,900,442 | | | $ | 109,493,840 | | | $ | 237,281,907 | | | $ | 284,108,358 | |
Shares outstanding $0.001 par value (unlimited number of shares authorized): | | | | | | | | | | | | | | | | |
Institutional | | | 20,921,908 | | | | 8,452,883 | | | | 13,275,565 | | | | 15,257,864 | |
Service | | | 5,937,014 | | | | 2,105,048 | | | | 12,632,721 | | | | 2,613,983 | |
Net asset value, offering and redemption price per share: | | | | | | | | | | | | | | | | |
Institutional | | | $14.89 | | | | $10.40 | | | | $9.20 | | | | $15.88 | |
Service | | | 15.07 | | | | 10.27 | | | | 9.12 | | | | 16.02 | |
| (a) | Includes loaned securities having a market value of $–, $971,328, $– and $–, for the Mid Cap Value, Small Cap Equity Insights, Strategic Growth and U.S. Equity Insights Funds respectively. |
| | |
| 80 | | The accompanying notes are an integral part of these financial statements. |
GOLDMAN SACHS VARIABLE INSURANCE TRUST EQUITY FUNDS
Statements of Operations
For the Fiscal Year Ended December 31, 2022
| | | | | | | | | | | | | | | | |
| | | Equity Index Fund | | | International
Equity Insights
Fund | | | Large Cap
Value Fund | | | Mid Cap
Growth Fund | |
| | | | | | | | | | | | | | | | |
| Investment income: | | | | | | | | | | | | |
| | | | |
Dividends — unaffiliated issuers (net of foreign withholding taxes of $704, $350,030, $— and $—, respectively) | | $ | 2,866,128 | | | $ | 3,694,289 | | | $ | 8,630,966 | | | $ | 308,107 | |
Securities lending income — affiliated issuer | | | 50 | | | | 18,933 | | | | 664 | | | | 1,476 | |
Dividends — affiliated issuers | | | 15,832 | | | | 312 | | | | 32,584 | | | | 42,543 | |
| | | | |
| Total investment income | | | 2,882,010 | | | | 3,713,534 | | | | 8,664,214 | | | | 352,126 | |
| | | | | | | | | | | | | | | | |
| | | | | | | | | | | | | | | | |
| Expenses: | | | | | | | | | | | | |
| | | | |
Management fees | | | 541,090 | | | | 774,313 | | | | 2,992,977 | | | | 492,164 | |
Distribution and/or Service (12b-1) fees | | | 450,908 | | | | 89,841 | | | | 650,852 | | | | 138,659 | |
Professional fees | | | 117,596 | | | | 25,778 | | | | 107,738 | | | | 107,779 | |
Custody, accounting and administrative services | | | 68,802 | | | | 90,585 | | | | 82,058 | | | | 65,838 | |
Transfer Agency fees(a) | | | 36,073 | | | | 19,119 | | | | 83,138 | | | | 11,314 | |
Printing and mailing costs | | | 33,956 | | | | 13,697 | | | | 18,263 | | | | 6,421 | |
Trustee fees | | | 27,538 | | | | 27,461 | | | | 27,952 | | | | 27,302 | |
Other | | | 1,740 | | | | 815 | | | | 2,280 | | | | 761 | |
| | | | |
| Total expenses | | | 1,277,703 | | | | 1,041,609 | | | | 3,965,258 | | | | 850,238 | |
| | | | |
Less — expense reductions | | | (404,739 | ) | | | (153,470 | ) | | | (443,677 | ) | | | (298,230 | ) |
| | | | |
| Net expenses | | | 872,964 | | | | 888,139 | | | | 3,521,581 | | | | 552,008 | |
| | | | |
| NET INVESTMENT INCOME (LOSS) | | | 2,009,046 | | | | 2,825,395 | | | | 5,142,633 | | | | (199,882 | ) |
| | | | | | | | | | | | | | | | |
| | | | | | | | | | | | | | | | |
| Realized and unrealized gain (loss): | | | | | | | | | | | | |
| | | | |
Net realized gain (loss) from: | | | | | | | | | | | | | | | | |
Investments — unaffiliated issuers | | | 12,213,495 | | | | (11,016,843 | ) | | | 42,901,100 | | | | (375,140 | ) |
Investments — affiliated issuers | | | 24,205 | | | | — | | | | — | | | | — | |
Futures contracts | | | (159,530 | ) | | | (5,602 | ) | | | — | | | | — | |
Foreign currency transactions | | | — | | | | (171,791 | ) | | | (593 | ) | | | — | |
Net change in unrealized gain (loss) on: | | | | | | | | | | | | | | | | |
Investments — unaffiliated issuers | | | (53,558,459 | ) | | | (6,503,922 | ) | | | (79,174,727 | ) | | | (18,870,736 | ) |
Investments — affiliated issuers | | | (98,831 | ) | | | — | | | | — | | | | — | |
Futures contracts | | | (30,334 | ) | | | (27,620 | ) | | | — | | | | — | |
Foreign currency translations | | | — | | | | 12,094 | | | | (114 | ) | | | — | |
| | | | |
| Net realized and unrealized loss | | | (41,609,454 | ) | | | (17,713,684 | ) | | | (36,274,334 | ) | | | (19,245,876 | ) |
| | | | |
| NET DECREASE IN NET ASSETS RESULTING FROM OPERATIONS | | $ | (39,600,408 | ) | | $ | (14,888,289 | ) | | $ | (31,131,701 | ) | | $ | (19,445,758 | ) |
(a) Class specific Transfer Agency fees were as follows:
| | | | | | | | |
| | | Transfer Agency Fees | |
Fund | | Institutional | | | Service | |
Equity Index Fund | | $ | — | | | $ | 36,073 | |
International Equity Insights Fund | | | 11,932 | | | | 7,187 | |
Large Cap Value Fund | | | 31,070 | | | | 52,068 | |
Mid Cap Growth Fund | | | 221 | | | | 11,093 | |
| | |
| The accompanying notes are an integral part of these financial statements. | | 81 |
GOLDMAN SACHS VARIABLE INSURANCE TRUST EQUITY FUNDS
Statements of Operations (continued)
For the Fiscal Year Ended December 31, 2022
| | | | | | | | | | | | | | | | |
| | | Mid Cap
Value Fund | | | Small Cap
Equity Insights
Fund | | | Strategic
Growth Fund | | | U.S. Equity
Insights Fund | |
| | | | | | | | | | | | | | | | |
| Investment income: | | | | | | | | | | | | |
| | | | |
Dividends — unaffiliated issuers (net of foreign withholding taxes of $—, $3,005, $600 and $5,217, respectively) | | $ | 7,312,743 | | | $ | 1,617,232 | | | $ | 1,672,355 | | | $ | 4,514,105 | |
Dividends — affiliated issuers | | | 108,363 | | | | 14,945 | | | | 64,408 | | | | 116 | |
Securities lending income — affiliated issuer | | | 230 | | | | 48,700 | | | | 1,837 | | | | 110 | |
| | | | |
| Total investment income | | | 7,421,336 | | | | 1,680,877 | | | | 1,738,600 | | | | 4,514,331 | |
| | | | | | | | | | | | | | | | |
| | | | | | | | | | | | | | | | |
| Expenses: | | | | | | | | | | | | |
Management fees | | | 3,360,036 | | | | 800,932 | | | | 1,986,424 | | | | 1,965,150 | |
Distribution and/or Service (12b-1) fees | | | 266,778 | | | | 52,667 | | | | 345,447 | | | | 121,907 | |
Professional fees | | | 107,843 | | | | 111,952 | | | | 117,053 | | | | 111,596 | |
Transfer Agency fees(a) | | | 87,274 | | | | 22,884 | | | | 55,956 | | | | 63,392 | |
Custody, accounting and administrative services | | | 74,080 | | | | 105,993 | | | | 78,577 | | | | 89,854 | |
Printing and mailing costs | | | 38,769 | | | | 20,482 | | | | 17,411 | | | | 15,011 | |
Trustee fees | | | 28,020 | | | | 27,420 | | | | 27,716 | | | | 27,798 | |
Other | | | 4,039 | | | | 822 | | | | 2,338 | | | | 1,705 | |
| | | | |
| Total expenses | | | 3,966,839 | | | | 1,143,152 | | | | 2,630,922 | | | | 2,396,413 | |
| | | | |
Less — expense reductions | | | (66,638 | ) | | | (163,379 | ) | | | (209,742 | ) | | | (506,362 | ) |
| | | | |
| Net expenses | | | 3,900,201 | | | | 979,773 | | | | 2,421,180 | | | | 1,890,051 | |
| | | | |
| NET INVESTMENT INCOME (LOSS) | | | 3,521,135 | | | | 701,104 | | | | (682,580 | ) | | | 2,624,280 | |
| | | | | | | | | | | | | | | | |
| | | | | | | | | | | | | | | | |
| Realized and unrealized gain (loss): | | | | | | | | | | | | |
Net realized gain (loss) from: | | | | | | | | | | | | | | | | |
Investments — unaffiliated issuers | | | 41,579,679 | | | | (13,507,565 | ) | | | 40,371,065 | | | | (12,667,828 | ) |
Futures contracts | | | — | | | | (202,930 | ) | | | — | | | | 71,397 | |
Foreign currency transactions | | | — | | | | — | | | | (6 | ) | | | — | |
Net change in unrealized gain (loss) on: | | | | | | | | | | | | | | | | |
Investments — unaffiliated issuers | | | (104,300,273 | ) | | | (12,799,754 | ) | | | (166,086,540 | ) | | | (63,823,211 | ) |
Futures contracts | | | — | | | | (50,928 | ) | | | — | | | | (16,178 | ) |
| | | | |
| Net realized and unrealized loss | | | (62,720,594 | ) | | | (26,561,177 | ) | | | (125,715,481 | ) | | | (76,435,820 | ) |
| | | | |
| NET DECREASE IN NET ASSETS RESULTING FROM OPERATIONS | | $ | (59,199,459 | ) | | $ | (25,860,073 | ) | | $ | (126,398,061 | ) | | $ | (73,811,540 | ) |
(a) Class specific Transfer Agency fees were as follows:
| | | | | | | | |
| | | Transfer Agency Fees | |
Fund | | Institutional | | | Service | |
Mid Cap Value Fund | | $ | 65,932 | | | $ | 21,342 | |
Small Cap Equity Insights Fund | | | 18,670 | | | | 4,214 | |
Strategic Growth Fund | | | 28,320 | | | | 27,636 | |
U.S. Equity Insights Fund | | | 53,639 | | | | 9,753 | |
| | |
| 82 | | The accompanying notes are an integral part of these financial statements. |
GOLDMAN SACHS VARIABLE INSURANCE TRUST EQUITY FUNDS
Statements of Changes in Net Assets
| | | | | | | | | | | | | | | | |
| | | Equity Index Fund | | | International Equity Insights Fund | |
| | | For the
Fiscal Year Ended
December 31, 2022 | | | For the
Fiscal Year Ended
December 31, 2021 | | | For the
Fiscal Year Ended
December 31, 2022 | | | For the
Fiscal Year Ended
December 31, 2021 | |
| | | | | | | | | | | | | | | | |
| From operations: | | | | | | | | | | | | |
Net investment income | | $ | 2,009,046 | | | $ | 1,849,037 | | | $ | 2,825,395 | | | $ | 2,199,515 | |
Net realized gain (loss) | | | 12,078,170 | | | | 12,272,760 | | | | (11,194,236 | ) | | | 14,733,699 | |
Net change in unrealized gain (loss) | | | (53,687,624 | ) | | | 36,594,319 | | | | (6,519,448 | ) | | | (5,336,245 | ) |
| | | | |
| Net increase (decrease) in net assets resulting from operations | | | (39,600,408 | ) | | | 50,716,116 | | | | (14,888,289 | ) | | | 11,596,969 | |
| | | | | | | | | | | | | | | | |
| | | | | | | | | | | | | | | | |
| Distributions to shareholders: | | | | | | | | | | | | |
From distributable earnings: | | | | | | | | | | | | | | | | |
Institutional Shares | | | — | | | | — | | | | (1,971,488 | ) | | | (3,288,959 | ) |
Service Shares | | | (13,438,499 | ) | | | (16,050,234 | ) | | | (1,049,519 | ) | | | (2,232,384 | ) |
| | | | |
| Total distributions to shareholders | | | (13,438,499 | ) | | | (16,050,234 | ) | | | (3,021,007 | ) | | | (5,521,343 | ) |
| | | | | | | | | | | | | | | | |
| | | | | | | | | | | | | | | | |
| From share transactions: | | | | | | | | | | | | |
Proceeds from sales of shares | | | 849,405 | | | | 8,243,921 | | | | 15,434,881 | | | | 14,541,209 | |
Reinvestment of distributions | | | 13,438,499 | | | | 16,050,234 | | | | 3,021,007 | | | | 5,521,343 | |
Cost of shares redeemed | | | (21,222,827 | ) | | | (23,750,642 | ) | | | (14,773,365 | ) | | | (16,387,138 | ) |
| | | | |
| Net increase (decrease) in net assets resulting from share transactions | | | (6,934,923 | ) | | | 543,513 | | | | 3,682,523 | | | | 3,675,414 | |
| | | | |
| TOTAL INCREASE (DECREASE) | | | (59,973,830 | ) | | | 35,209,395 | | | | (14,226,773 | ) | | | 9,751,040 | |
| | | | | | | | | | | | | | | | |
| | | | | | | | | | | | | | | | |
| Net Assets: | | | | | | | | | | | | |
| | | | |
Beginning of year | | | 220,912,294 | | | | 185,702,899 | | | | 107,550,776 | | | | 97,799,736 | |
| | | | |
End of year | | $ | 160,938,464 | | | $ | 220,912,294 | | | $ | 93,324,003 | | | $ | 107,550,776 | |
| | |
| The accompanying notes are an integral part of these financial statements. | | 83 |
GOLDMAN SACHS VARIABLE INSURANCE TRUST EQUITY FUNDS
Statements of Changes in Net Assets (continued)
| | | | | | | | | | | | | | | | |
| | | Large Cap Value Fund | | | Mid Cap Growth Fund | |
| | | For the
Fiscal Year Ended
December 31, 2022 | | | For the
Fiscal Year Ended
December 31, 2021 | | | For the
Fiscal Year Ended
December 31, 2022 | | | For the
Fiscal Year Ended
December 31, 2021 | |
| | | | | | | | | | | | | | | | |
| From operations: | | | | | | | | | | | | |
Net investment income (loss) | | $ | 5,142,633 | | | $ | 4,451,628 | | | $ | (199,882 | ) | | $ | (494,618 | ) |
Net realized gain (loss) | | | 42,900,507 | | | | 71,561,668 | | | | (375,140 | ) | | | 13,222,693 | |
Net change in unrealized gain (loss) | | | (79,174,841 | ) | | | 26,553,600 | | | | (18,870,736 | ) | | | (3,912,879 | ) |
| | | | |
| Net increase (decrease) in net assets resulting from operations | | | (31,131,701 | ) | | | 102,566,896 | | | | (19,445,758 | ) | | | 8,815,196 | |
| | | | | | | | | | | | | | | | |
| | | | | | | | | | | | | | | | |
| Distributions to shareholders: | | | | | | | | | | | | |
From distributable earnings: | | | | | | | | | | | | | | | | |
Institutional Shares | | | (16,379,536 | ) | | | (23,694,892 | ) | | | (39,168 | ) | | | (67,989 | ) |
Service Shares | | | (26,593,972 | ) | | | (40,039,323 | ) | | | (1,904,522 | ) | | | (13,375,264 | ) |
| | | | |
| Total distributions to shareholders | | | (42,973,508 | ) | | | (63,734,215 | ) | | | (1,943,690 | ) | | | (13,443,253 | ) |
| | | | | | | | | | | | | | | | |
| | | | | | | | | | | | | | | | |
| From share transactions: | | | | | | | | | | | | |
Proceeds from sales of shares | | | 18,097,425 | | | | 16,916,259 | | | | 7,276,149 | | | | 3,372,373 | |
Reinvestment of distributions | | | 42,973,507 | | | | 63,734,215 | | | | 1,943,690 | | | | 13,443,253 | |
Cost of shares redeemed | | | (90,692,163 | ) | | | (91,861,106 | ) | | | (12,881,102 | ) | | | (17,004,840 | ) |
| | | | |
| Net decrease in net assets resulting from share transactions | | | (29,621,231 | ) | | | (11,210,632 | ) | | | (3,661,263 | ) | | | (189,214 | ) |
| | | | |
| TOTAL INCREASE (DECREASE) | | | (103,726,440 | ) | | | 27,622,049 | | | | (25,050,711 | ) | | | (4,817,271 | ) |
| | | | | | | | | | | | | | | | |
| | | | | | | | | | | | | | | | |
| Net Assets: | | | | | | | | | | | | |
| | | | |
Beginning of year | | | 487,262,076 | | | | 459,640,027 | | | | 77,468,506 | | | | 82,285,777 | |
| | | | |
End of year | | $ | 383,535,636 | | | $ | 487,262,076 | | | $ | 52,417,795 | | | $ | 77,468,506 | |
| | |
| 84 | | The accompanying notes are an integral part of these financial statements. |
GOLDMAN SACHS VARIABLE INSURANCE TRUST EQUITY FUNDS
Statements of Changes in Net Assets (continued)
| | | | | | | | | | | | | | | | |
| | | Mid Cap Value Fund | | | Small Cap Equity Insights Fund | |
| | | For the
Fiscal Year Ended
December 31, 2022 | | | For the
Fiscal Year Ended
December 31, 2021 | | | For the
Fiscal Year Ended
December 31, 2022 | | | For the
Fiscal Year Ended
December 31, 2021 | |
| | | | | | | | | | | | | | | | |
| From operations: | | | | | | | | | | | | |
Net investment income | | $ | 3,521,135 | | | $ | 2,016,725 | | | $ | 701,104 | | | $ | 374,184 | |
Net realized gain (loss) | | | 41,579,679 | | | | 99,516,679 | | | | (13,710,495 | ) | | | 26,133,672 | |
Net change in unrealized gain (loss) | | | (104,300,273 | ) | | | 38,869,211 | | | | (12,850,682 | ) | | | (1,898,924 | ) |
| | | | |
| Net increase (decrease) in net assets resulting from operations | | | (59,199,459 | ) | | | 140,402,615 | | | | (25,860,073 | ) | | | 24,608,932 | |
| | | | | | | | | | | | | | | | |
| | | | | | | | | | | | | | | | |
| Distributions to shareholders: | | | | | | | | | | | | |
From distributable earnings: | | | | | | | | | | | | | | | | |
Institutional Shares | | | (50,260,812 | ) | | | (51,237,122 | ) | | | (1,287,501 | ) | | | (23,948,283 | ) |
Service Shares | | | (15,201,358 | ) | | | (22,180,324 | ) | | | (266,792 | ) | | | (4,659,058 | ) |
| | | | |
| Total distributions to shareholders | | | (65,462,170 | ) | | | (73,417,446 | ) | | | (1,554,293 | ) | | | (28,607,341 | ) |
| | | | | | | | | | | | | | | | |
| | | | | | | | | | | | | | | | |
| From share transactions: | | | | | | | | | | | | |
Proceeds from sales of shares | | | 93,206,792 | | | | 13,454,928 | | | | 21,488,587 | | | | 30,972,672 | |
Reinvestment of distributions | | | 65,462,169 | | | | 73,417,446 | | | | 1,554,293 | | | | 28,607,341 | |
Cost of shares redeemed | | | (185,704,513 | ) | | | (87,544,935 | ) | | | (16,964,615 | ) | | | (26,877,758 | ) |
| | | | |
| Net increase (decrease) in net assets resulting from share transactions | | | (27,035,552 | ) | | | (672,561 | ) | | | 6,078,265 | | | | 32,702,255 | |
| | | | |
| TOTAL INCREASE (DECREASE) | | | (151,697,181 | ) | | | 66,312,608 | | | | (21,336,101 | ) | | | 28,703,846 | |
| | | | | | | | | | | | | | | | |
| | | | | | | | | | | | | | | | |
| Net Assets: | | | | | | | | | | | | |
| | | | |
Beginning of year | | | 552,597,623 | | | | 486,285,015 | | | | 130,829,941 | | | | 102,126,095 | |
| | | | |
End of year | | $ | 400,900,442 | | | $ | 552,597,623 | | | $ | 109,493,840 | | | $ | 130,829,941 | |
| | |
| The accompanying notes are an integral part of these financial statements. | | 85 |
GOLDMAN SACHS VARIABLE INSURANCE TRUST EQUITY FUNDS
Statements of Changes in Net Assets (continued)
| | | | | | | | | | | | | | | | |
| | | Strategic Growth Fund | | | U.S. Equity Insights Fund | |
| | | For the
Fiscal Year Ended
December 31, 2022 | | | For the
Fiscal Year Ended
December 31, 2021 | | | For the
Fiscal Year Ended
December 31, 2022 | | | For the
Fiscal Year Ended
December 31, 2021 | |
| | | | | | | | | | | | | | | | |
| From operations: | | | | | | | | | | | | |
Net investment income (loss) | | $ | (682,580 | ) | | $ | (1,856,695 | ) | | $ | 2,624,280 | | | $ | 2,738,157 | |
Net realized gain (loss) | | | 40,371,059 | | | | 54,667,136 | | | | (12,596,431 | ) | | | 77,080,399 | |
Net change in unrealized gain (loss) | | | (166,086,540 | ) | | | 33,677,090 | | | | (63,839,389 | ) | | | 10,800,923 | |
| | | | |
| Net increase (decrease) in net assets resulting from operations | | | (126,398,061 | ) | | | 86,487,531 | | | | (73,811,540 | ) | | | 90,619,479 | |
| | | | | | | | | | | | | | | | |
| | | | | | | | | | | | | | | | |
| Distributions to shareholders: | | | | | | | | | | | | |
From distributable earnings: | | | | | | | | | | | | | | | | |
Institutional Shares | | | (23,862,524 | ) | | | (22,122,701 | ) | | | (3,548,809 | ) | | | (71,715,395 | ) |
Service Shares | | | (22,574,843 | ) | | | (31,302,896 | ) | | | (509,957 | ) | | | (13,647,143 | ) |
| | | | |
| Total distributions to shareholders | | | (46,437,367 | ) | | | (53,425,597 | ) | | | (4,058,766 | ) | | | (85,362,538 | ) |
| | | | | | | | | | | | | | | | |
| | | | | | | | | | | | | | | | |
| From share transactions: | | | | | | | | | | | | |
Proceeds from sales of shares | | | 20,861,765 | | | | 14,745,884 | | | | 19,568,290 | | | | 24,061,285 | |
Reinvestment of distributions | | | 46,437,367 | | | | 53,425,597 | | | | 4,058,766 | | | | 85,362,538 | |
Cost of shares redeemed | | | (107,108,519 | ) | | | (76,950,698 | ) | | | (40,965,728 | ) | | | (57,104,159 | ) |
| | | | |
| Net increase (decrease) in net assets resulting from share transactions | | | (39,809,387 | ) | | | (8,779,217 | ) | | | (17,338,672 | ) | | | 52,319,664 | |
| | | | |
| TOTAL INCREASE (DECREASE) | | | (212,644,815 | ) | | | 24,282,717 | | | | (95,208,978 | ) | | | 57,576,605 | |
| | | | | | | | | | | | | | | | |
| | | | | | | | | | | | | | | | |
| Net Assets: | | | | | | | | | | | | |
| | | | |
Beginning of year | | | 449,926,722 | | | | 425,644,005 | | | | 379,317,336 | | | | 321,740,731 | |
| | | | |
End of year | | $ | 237,281,907 | | | $ | 449,926,722 | | | $ | 284,108,358 | | | $ | 379,317,336 | |
| | |
| 86 | | The accompanying notes are an integral part of these financial statements. |
GOLDMAN SACHS VARIABLE INSURANCE TRUST EQUITY INDEX FUND
Financial Highlights
Selected Data for a Share Outstanding Throughout Each Year
| | | | | | | | | | | | | | | | | | | | |
| | | Goldman Sachs Equity Index Fund | |
| | | Service Shares | |
| | | Year Ended December 31, | |
| | | 2022 | | | 2021 | | | 2020 | | | 2019 | | | 2018 | |
| | | | | | | | | | | | | | | | | | | | |
| Per Share Data | | | | | | | | | | | | | | | |
| | | | | |
Net asset value, beginning of year | | $ | 22.59 | | | $ | 19.01 | | | $ | 17.50 | | | $ | 14.43 | | | $ | 16.60 | |
| | | | | |
Net investment income(a) | | | 0.22 | | | | 0.20 | | | | 0.22 | | | | 0.25 | | | | 0.25 | |
| | | | | |
Net realized and unrealized gain (loss) | | | (4.33 | ) | | | 5.14 | | | | 2.89 | | | | 4.18 | | | | (1.04 | ) |
| | | | | |
Total from investment operations | | | (4.11 | ) | | | 5.34 | | | | 3.11 | | | | 4.43 | | | | (0.79 | ) |
| | | | | |
Distributions to shareholders from net investment income | | | (0.21 | ) | | | (0.22 | ) | | | (0.23 | ) | | | (0.26 | ) | | | (0.27 | ) |
| | | | | |
Distributions to shareholders from net realized gains | | | (1.31 | ) | | | (1.54 | ) | | | (1.37 | ) | | | (1.10 | ) | | | (1.11 | ) |
| | | | | |
Total distributions | | | (1.52 | ) | | | (1.76 | ) | | | (1.60 | ) | | | (1.36 | ) | | | (1.38 | ) |
| | | | | |
Net asset value, end of year | | $ | 16.96 | | | $ | 22.59 | | | $ | 19.01 | | | $ | 17.50 | | | $ | 14.43 | |
| | | | | |
Total Return(b) | | | (18.55 | )% | | | 28.20 | % | | | 17.84 | % | | | 30.85 | % | | | (4.87 | )% |
| | | | | |
Net assets, end of year (in 000’s) | | $ | 160,938 | | | $ | 220,912 | | | $ | 185,703 | | | $ | 179,542 | | | $ | 155,098 | |
| | | | | |
Ratio of net expenses to average net assets | | | 0.48 | % | | | 0.48 | % | | | 0.48 | % | | | 0.50 | % | | | 0.48 | % |
| | | | | |
Ratio of total expenses to average net assets | | | 0.71 | % | | | 0.70 | % | | | 0.76 | % | | | 0.78 | % | | | 0.72 | % |
| | | | | |
Ratio of net investment income to average net assets | | | 1.11 | % | | | 0.91 | % | | | 1.28 | % | | | 1.48 | % | | | 1.48 | % |
| | | | | |
Portfolio turnover rate(c) | | | 1 | % | | | 4 | % | | | 4 | % | | | 3 | % | | | 4 | % |
| (a) | Calculated based on the average shares outstanding methodology. |
| (b) | Assumes investment at the NAV at the beginning of the year, reinvestment of all dividends and distributions, a complete redemption of the investment at the NAV at the end of the year and no sales or redemption charges (if any). Total returns would be reduced if a sales or redemption charge was taken into account. Returns do not reflect the impact of taxes to shareholders relating to Fund distributions or the redemption of Fund shares. |
| (c) | The Fund’s portfolio turnover rate is calculated in accordance with regulatory requirements, without regard to transactions involving short term investments and certain derivatives. If such transactions were included, the Fund’s portfolio turnover rate may be higher. |
| | |
| The accompanying notes are an integral part of these financial statements. | | 87 |
GOLDMAN SACHS VARIABLE INSURANCE TRUST INTERNATIONAL EQUITY INSIGHTS FUND
Financial Highlights (continued)
Selected Data for a Share Outstanding Throughout Each Year
| | | | | | | | | | | | | | | | | | | | |
| | | Goldman Sachs International Equity Insights Fund | |
| | | Institutional Shares | |
| | | Year Ended December 31, | |
| | | 2022 | | | 2021 | | | 2020 | | | 2019 | | | 2018 | |
| | | | | | | | | | | | | | | | | | | | |
| Per Share Data | | | | | | | | | | | | | | | |
| | | | | |
Net asset value, beginning of year | | $ | 9.16 | | | $ | 8.62 | | | $ | 8.19 | | | $ | 7.08 | | | $ | 10.88 | |
| | | | | |
Net investment income(a) | | | 0.25 | (b) | | | 0.21 | | | | 0.12 | | | | 0.17 | | | | 0.19 | |
| | | | | |
Net realized and unrealized gain (loss) | | | (1.49 | ) | | | 0.83 | | | | 0.43 | | | | 1.14 | | | | (1.94 | ) |
| | | | | |
Total from investment operations | | | (1.24 | ) | | | 1.04 | | | | 0.55 | | | | 1.31 | | | | (1.75 | ) |
| | | | | |
Distributions to shareholders from net investment income | | | (0.26 | ) | | | (0.27 | ) | | | (0.12 | ) | | | (0.20 | ) | | | (0.21 | ) |
| | | | | |
Distributions to shareholders from net realized gains | | | — | | | | (0.23 | ) | | | — | | | | — | (c) | | | (1.84 | ) |
| | | | | |
Total distributions | | | (0.26 | ) | | | (0.50 | ) | | | (0.12 | ) | | | (0.20 | ) | | | (2.05 | ) |
| | | | | |
Net asset value, end of year | | $ | 7.66 | | | $ | 9.16 | | | $ | 8.62 | | | $ | 8.19 | | | $ | 7.08 | |
| | | | | |
Total Return(d) | | | (13.55 | )% | | | 12.17 | % | | | 6.79 | % | | | 18.45 | % | | | (16.28 | )% |
| | | | | |
Net assets, end of year (in 000’s) | | $ | 59,170 | | | $ | 63,179 | | | $ | 50,114 | | | $ | 43,632 | | | $ | 37,829 | |
| | | | | |
Ratio of net expenses to average net assets | | | 0.83 | % | | | 0.85 | % | | | 0.87 | % | | | 0.90 | % | | | 0.87 | % |
| | | | | |
Ratio of total expenses to average net assets | | | 0.99 | % | | | 1.14 | % | | | 1.37 | % | | | 1.31 | % | | | 1.23 | % |
| | | | | |
Ratio of net investment income to average net assets | | | 3.09 | %(b) | | | 2.22 | % | | | 1.59 | % | | | 3.21 | % | | | 1.79 | % |
| | | | | |
Portfolio turnover rate(e) | | | 164 | % | | | 167 | % | | | 175 | % | | | 146 | % | | | 156 | % |
| (a) | Calculated based on the average shares outstanding methodology. |
| (b) | Reflects income recognized from special dividends which amounted to $0.04 per share and 0.45% of average net assets. |
| (c) | Amount is less than $0.005 per share. |
| (d) | Assumes investment at the NAV at the beginning of the year, reinvestment of all dividends and distributions, a complete redemption of the investment at the NAV at the end of the year and no sales or redemption charges (if any). Total returns would be reduced if a sales or redemption charge was taken into account. Returns do not reflect the impact of taxes to shareholders relating to Fund distributions or the redemption of Fund shares. |
| (e) | The Fund’s portfolio turnover rate is calculated in accordance with regulatory requirements, without regard to transactions involving short term investments and certain derivatives. If such transactions were included, the Fund’s portfolio turnover rate may be higher. |
| | |
| 88 | | The accompanying notes are an integral part of these financial statements. |
GOLDMAN SACHS VARIABLE INSURANCE TRUST INTERNATIONAL EQUITY INSIGHTS FUND
Financial Highlights (continued)
Selected Data for a Share Outstanding Throughout Each Year
| | | | | | | | | | | | | | | | | | | | |
| | | Goldman Sachs International Equity Insights Fund | |
| | | Service Shares | |
| | | Year Ended December 31, | |
| | | 2022 | | | 2021 | | | 2020 | | | 2019 | | | 2018 | |
| | | | | | | | | | | | | | | | | | | | |
| Per Share Data | | | | | | | | | | | | | | | |
| | | | | |
Net asset value, beginning of year | | $ | 9.20 | | | $ | 8.66 | | | $ | 8.23 | | | $ | 7.11 | | | $ | 10.91 | |
| | | | | |
Net investment income(a) | | | 0.22 | (b) | | | 0.19 | | | | 0.10 | | | | 0.15 | | | | 0.14 | |
| | | | | |
Net realized and unrealized gain (loss) | | | (1.48 | ) | | | 0.83 | | | | 0.44 | | | | 1.15 | | | | (1.93 | ) |
| | | | | |
Total from investment operations | | | (1.26 | ) | | | 1.02 | | | | 0.54 | | | | 1.30 | | | | (1.79 | ) |
| | | | | |
Distributions to shareholders from net investment income | | | (0.24 | ) | | | (0.25 | ) | | | (0.11 | ) | | | (0.18 | ) | | | (0.17 | ) |
| | | | | |
Distributions to shareholders from net realized gains | | | — | | | | (0.23 | ) | | | — | | | | — | (c) | | | (1.84 | ) |
| | | | | |
Total distributions | | | (0.24 | ) | | | (0.48 | ) | | | (0.11 | ) | | | (0.18 | ) | | | (2.01 | ) |
| | | | | |
Net asset value, end of year | | $ | 7.70 | | | $ | 9.20 | | | $ | 8.66 | | | $ | 8.23 | | | $ | 7.11 | |
| | | | | |
Total Return(d) | | | (13.72 | )% | | | 11.81 | % | | | 6.53 | % | | | 18.23 | % | | | (16.55 | )% |
| | | | | |
Net assets, end of year (in 000’s) | | $ | 34,154 | | | $ | 44,372 | | | $ | 47,685 | | | $ | 48,884 | | | $ | 43,923 | |
| | | | | |
Ratio of net expenses to average net assets | | | 1.09 | % | | | 1.10 | % | | | 1.12 | % | | | 1.15 | % | | | 1.12 | % |
| | | | | |
Ratio of total expenses to average net assets | | | 1.25 | % | | | 1.40 | % | | | 1.61 | % | | | 1.55 | % | | | 1.43 | % |
| | | | | |
Ratio of net investment income to average net assets | | | 2.74 | %(b) | | | 1.97 | % | | | 1.30 | % | | | 1.89 | % | | | 1.30 | % |
| | | | | |
Portfolio turnover rate(e) | | | 164 | % | | | 167 | % | | | 175 | % | | | 146 | % | | | 156 | % |
| (a) | Calculated based on the average shares outstanding methodology. |
| (b) | Reflects income recognized from special dividends which amounted to $0.04 per share and 0.45% of average net assets. |
| (c) | Amount is less than $0.005 per share. |
| (d) | Assumes investment at the NAV at the beginning of the year, reinvestment of all dividends and distributions, a complete redemption of the investment at the NAV at the end of the year and no sales or redemption charges (if any). Total returns would be reduced if a sales or redemption charge was taken into account. Returns do not reflect the impact of taxes to shareholders relating to Fund distributions or the redemption of Fund shares. |
| (e) | The Fund’s portfolio turnover rate is calculated in accordance with regulatory requirements, without regard to transactions involving short term investments and certain derivatives. If such transactions were included, the Fund’s portfolio turnover rate may be higher. |
| | |
| The accompanying notes are an integral part of these financial statements. | | 89 |
GOLDMAN SACHS VARIABLE INSURANCE TRUST LARGE CAP VALUE FUND
Financial Highlights (continued)
Selected Data for a Share Outstanding Throughout Each Year
| | | | | | | | | | | | | | | | | | | | |
| | | Goldman Sachs Large Cap Value Fund | |
| | | Institutional Shares | |
| | | Year Ended December 31, | |
| | | 2022 | | | 2021 | | | 2020 | | | 2019 | | | 2018 | |
| | | | | | | | | | | | | | | | | | | | |
| Per Share Data | | | | | | | | | | | | | | | |
| | | | | |
Net asset value, beginning of year | | $ | 9.97 | | | $ | 9.27 | | | $ | 9.19 | | | $ | 7.67 | | | $ | 9.06 | |
| | | | | |
Net investment income(a) | | | 0.13 | | | | 0.11 | | | | 0.12 | | | | 0.13 | | | | 0.12 | |
| | | | | |
Net realized and unrealized gain (loss) | | | (0.72 | ) | | | 2.09 | | | | 0.24 | | | | 1.86 | | | | (0.88 | ) |
| | | | | |
Total from investment operations | | | (0.59 | ) | | | 2.20 | | | | 0.36 | | | | 1.99 | | | | (0.76 | ) |
| | | | | |
Distributions to shareholders from net investment income | | | (0.13 | ) | | | (0.13 | ) | | | (0.12 | ) | | | (0.14 | ) | | | (0.12 | ) |
| | | | | |
Distributions to shareholders from net realized gains | | | (0.91 | ) | | | (1.37 | ) | | | (0.16 | ) | | | (0.33 | ) | | | (0.51 | ) |
| | | | | |
Total distributions | | | (1.04 | ) | | | (1.50 | ) | | | (0.28 | ) | | | (0.47 | ) | | | (0.63 | ) |
| | | | | |
Net asset value, end of year | | $ | 8.34 | | | $ | 9.97 | | | $ | 9.27 | | | $ | 9.19 | | | $ | 7.67 | |
| | | | | |
Total Return(b) | | | (6.37 | )% | | | 24.13 | % | | | 3.97 | % | | | 25.93 | % | | | (8.46 | )% |
| | | | | |
Net assets, end of year (in 000’s) | | $ | 145,165 | | | $ | 179,541 | | | $ | 160,076 | | | $ | 163,814 | | | $ | 150,963 | |
| | | | | |
Ratio of net expenses to average net assets | | | 0.70 | % | | | 0.69 | % | | | 0.71 | % | | | 0.73 | % | | | 0.71 | % |
| | | | | |
Ratio of total expenses to average net assets | | | 0.80 | % | | | 0.79 | % | | | 0.81 | % | | | 0.83 | % | | | 0.81 | % |
| | | | | |
Ratio of net investment income to average net assets | | | 1.38 | % | | | 1.08 | % | | | 1.44 | % | | | 1.46 | % | | | 1.32 | % |
| | | | | |
Portfolio turnover rate(c) | | | 46 | % | | | 54 | % | | | 58 | % | | | 58 | % | | | 125 | % |
| (a) | Calculated based on the average shares outstanding methodology. |
| (b) | Assumes investment at the NAV at the beginning of the year, reinvestment of all dividends and distributions, a complete redemption of the investment at the NAV at the end of the year and no sales or redemption charges (if any). Total returns would be reduced if a sales or redemption charge was taken into account. Returns do not reflect the impact of taxes to shareholders relating to Fund distributions or the redemption of Fund shares. |
| (c) | The Fund’s portfolio turnover rate is calculated in accordance with regulatory requirements, without regard to transactions involving short term investments. If such transactions were included, the Fund’s portfolio turnover rate may be higher. |
| | |
| 90 | | The accompanying notes are an integral part of these financial statements. |
GOLDMAN SACHS VARIABLE INSURANCE TRUST LARGE CAP VALUE FUND
Financial Highlights (continued)
Selected Data for a Share Outstanding Throughout Each Year
| | | | | | | | | | | | | | | | | | | | |
| | | Goldman Sachs Large Cap Value Fund | |
| | | Service Shares | |
| | | Year Ended December 31, | |
| | | 2022 | | | 2021 | | | 2020 | | | 2019 | | | 2018 | |
| | | | | | | | | | | | | | | | | | | | |
| Per Share Data | | | | | | | | | | | | | | | |
| | | | | |
Net asset value, beginning of year | | $ | 9.98 | | | $ | 9.27 | | | $ | 9.19 | | | $ | 7.67 | | | $ | 9.06 | |
| | | | | |
Net investment income(a) | | | 0.11 | | | | 0.09 | | | | 0.10 | | | | 0.11 | | | | 0.10 | |
| | | | | |
Net realized and unrealized gain (loss) | | | (0.72 | ) | | | 2.09 | | | | 0.24 | | | | 1.85 | | | | (0.88 | ) |
| | | | | |
Total from investment operations | | | (0.61 | ) | | | 2.18 | | | | 0.34 | | | | 1.96 | | | | (0.78 | ) |
| | | | | |
Distributions to shareholders from net investment income | | | (0.11 | ) | | | (0.10 | ) | | | (0.10 | ) | | | (0.11 | ) | | | (0.10 | ) |
| | | | | |
Distributions to shareholders from net realized gains | | | (0.91 | ) | | | (1.37 | ) | | | (0.16 | ) | | | (0.33 | ) | | | (0.51 | ) |
| | | | | |
Total distributions | | | (1.02 | ) | | | (1.47 | ) | | | (0.26 | ) | | | (0.44 | ) | | | (0.61 | ) |
| | | | | |
Net asset value, end of year | | $ | 8.35 | | | $ | 9.98 | | | $ | 9.27 | | | $ | 9.19 | | | $ | 7.67 | |
| | | | | |
Total Return(b) | | | (6.57 | )% | | | 23.93 | % | | | 3.73 | % | | | 25.61 | % | | | (8.72 | )% |
| | | | | |
Net assets, end of year (in 000’s) | | $ | 238,371 | | | $ | 307,721 | | | $ | 299,564 | | | $ | 306,058 | | | $ | 282,891 | |
| | | | | |
Ratio of net expenses to average net assets | | | 0.93 | % | | | 0.92 | % | | | 0.94 | % | | | 0.98 | % | | | 0.96 | % |
| | | | | |
Ratio of total expenses to average net assets | | | 1.05 | % | | | 1.04 | % | | | 1.06 | % | | | 1.08 | % | | | 1.06 | % |
| | | | | |
Ratio of net investment income to average net assets | | | 1.15 | % | | | 0.84 | % | | | 1.21 | % | | | 1.21 | % | | | 1.07 | % |
| | | | | |
Portfolio turnover rate(c) | | | 46 | % | | | 54 | % | | | 58 | % | | | 58 | % | | | 125 | % |
| (a) | Calculated based on the average shares outstanding methodology. |
| (b) | Assumes investment at the NAV at the beginning of the year, reinvestment of all dividends and distributions, a complete redemption of the investment at the NAV at the end of the year and no sales or redemption charges (if any). Total returns would be reduced if a sales or redemption charge was taken into account. Returns do not reflect the impact of taxes to shareholders relating to Fund distributions or the redemption of Fund shares. |
| (c) | The Fund’s portfolio turnover rate is calculated in accordance with regulatory requirements, without regard to transactions involving short term investments. If such transactions were included, the Fund’s portfolio turnover rate may be higher. |
| | |
| The accompanying notes are an integral part of these financial statements. | | 91 |
GOLDMAN SACHS VARIABLE INSURANCE TRUST MID CAP GROWTH FUND
Financial Highlights (continued)
Selected Data for a Share Outstanding Throughout Each Year
| | | | | | | | | | | | | | | | | | | | |
| | | Goldman Sachs Mid Cap Growth Fund | |
| | | Institutional Shares | |
| | | Year Ended December 31,(a) | |
| | | 2022 | | | 2021 | | | 2020 | | | 2019 | | | 2018 | |
| | | | | | | | | | | | | | | | | | | | |
| Per Share Data | | | | | | | | | | | | | | | |
| | | | | |
Net asset value, beginning of year | | $ | 13.05 | | | $ | 13.93 | | | $ | 11.50 | | | $ | 10.51 | | | $ | 31.13 | |
| | | | | |
Net investment loss(b) | | | (0.02 | ) | | | (0.07 | ) | | | (0.04 | ) | | | (0.01 | ) | | | (0.02 | ) |
| | | | | |
Net realized and unrealized gain (loss) | | | (3.38 | ) | | | 1.71 | | | | 5.06 | | | | 3.59 | | | | (1.30 | ) |
| | | | | |
Total from investment operations | | | (3.40 | ) | | | 1.64 | | | | 5.02 | | | | 3.58 | | | | (1.32 | ) |
| | | | | |
Distributions to shareholders from net realized gains | | | (0.33 | ) | | | (2.52 | ) | | | (2.59 | ) | | | (2.59 | ) | | | (19.30 | ) |
| | | | | |
Net asset value, end of year | | $ | 9.32 | | | $ | 13.05 | | | $ | 13.93 | | | $ | 11.50 | | | $ | 10.51 | |
| | | | | |
Total Return(c) | | | (26.20 | )% | | | 11.65 | % | | | 44.33 | % | | | 34.35 | % | | | (4.17 | )% |
| | | | | |
Net assets, end of year (in 000’s) | | $ | 1,132 | | | $ | 483 | | | $ | 151 | | | $ | 94 | | | $ | 59 | |
| | | | | |
Ratio of net expenses to average net assets | | | 0.82 | % | | | 0.83 | % | | | 0.85 | % | | | 0.88 | % | | | 0.85 | % |
| | | | | |
Ratio of total expenses to average net assets | | | 1.20 | % | | | 1.33 | % | | | 1.23 | % | | | 1.26 | % | | | 1.20 | % |
| | | | | |
Ratio of net investment loss to average net assets | | | (0.16 | )% | | | (0.47 | )% | | | (0.34 | )% | | | (0.12 | )% | | | (0.08 | )% |
| | | | | |
Portfolio turnover rate(d) | | | 59 | % | | | 50 | % | | | 71 | % | | | 75 | % | | | 59 | % |
| (a) | All per share amounts representing data prior to May 17, 2019 have been adjusted to reflect a 4 to 1 reverse stock split which occurred on that date. |
| (b) | Calculated based on the average shares outstanding methodology. |
| (c) | Assumes investment at the NAV at the beginning of the year, reinvestment of all dividends and distributions, a complete redemption of the investment at the NAV at the end of the year and no sales or redemption charges (if any). Total returns would be reduced if a sales or redemption charge was taken into account. Returns do not reflect the impact of taxes to shareholders relating to Fund distributions or the redemption of Fund shares. |
| (d) | The Fund’s portfolio turnover rate is calculated in accordance with regulatory requirements, without regard to transactions involving short term investments. If such transactions were included, the Fund’s portfolio turnover rate may be higher. |
| | |
| 92 | | The accompanying notes are an integral part of these financial statements. |
GOLDMAN SACHS VARIABLE INSURANCE TRUST MID CAP GROWTH FUND
Financial Highlights (continued)
Selected Data for a Share Outstanding Throughout Each Year
| | | | | | | | | | | | | | | | | | | | |
| | | Goldman Sachs Mid Cap Growth Fund | |
| | | Service Shares | |
| | | Year Ended December 31,(a) | |
| | | 2022 | | | 2021 | | | 2020 | | | 2019 | | | 2018 | |
| | | | | | | | | | | | | | | | | | | | |
| Per Share Data | | | | | | | | | | | | | | | |
| | | | | |
Net asset value, beginning of year | | $ | 12.20 | | | $ | 13.19 | | | $ | 11.00 | | | $ | 10.15 | | | $ | 30.80 | |
| | | | | |
Net investment loss(b) | | | (0.03 | ) | | | (0.09 | ) | | | (0.06 | ) | | | (0.02 | ) | | | (0.07 | ) |
| | | | | |
Net realized and unrealized gain (loss) | | | (3.16 | ) | | | 1.62 | | | | 4.84 | | | | 3.46 | | | | (1.28 | ) |
| | | | | |
Total from investment operations | | | (3.19 | ) | | | 1.53 | | | | 4.78 | | | | 3.44 | | | | (1.35 | ) |
| | | | | |
Distributions to shareholders from net realized gains | | | (0.33 | ) | | | (2.52 | ) | | | (2.59 | ) | | | (2.59 | ) | | | (19.30 | ) |
| | | | | |
Net asset value, end of year | | $ | 8.68 | | | $ | 12.20 | | | $ | 13.19 | | | $ | 11.00 | | | $ | 10.15 | |
| | | | | |
Total Return(c) | | | (26.30 | )% | | | 11.48 | % | | | 44.16 | % | | | 34.06 | % | | | (4.34 | )% |
| | | | | |
Net assets, end of year (in 000’s) | | $ | 51,286 | | | $ | 76,986 | | | $ | 82,134 | | | $ | 73,406 | | | $ | 59,910 | |
| | | | | |
Ratio of net expenses to average net assets | | | 0.98 | % | | | 0.99 | % | | | 1.01 | % | | | 1.04 | % | | | 1.01 | % |
| | | | | |
Ratio of total expenses to average net assets | | | 1.51 | % | | | 1.43 | % | | | 1.48 | % | | | 1.51 | % | | | 1.44 | % |
| | | | | |
Ratio of net investment loss to average net assets | | | (0.36 | )% | | | (0.62 | )% | | | (0.50 | )% | | | (0.28 | )% | | | (0.24 | )% |
| | | | | |
Portfolio turnover rate(d) | | | 59 | % | | | 50 | % | | | 71 | % | | | 75 | % | | | 59 | % |
| (a) | All per share amounts representing data prior to May 17, 2019 have been adjusted to reflect a 4 to 1 reverse stock split which occurred on that date. |
| (b) | Calculated based on the average shares outstanding methodology. |
| (c) | Assumes investment at the NAV at the beginning of the year, reinvestment of all dividends and distributions, a complete redemption of the investment at the NAV at the end of the year and no sales or redemption charges (if any). Total returns would be reduced if a sales or redemption charge was taken into account. Returns do not reflect the impact of taxes to shareholders relating to Fund distributions or the redemption of Fund shares. |
| (d) | The Fund’s portfolio turnover rate is calculated in accordance with regulatory requirements, without regard to transactions involving short term investments. If such transactions were included, the Fund’s portfolio turnover rate may be higher. |
| | |
| The accompanying notes are an integral part of these financial statements. | | 93 |
GOLDMAN SACHS VARIABLE INSURANCE TRUST MID CAP VALUE FUND
Financial Highlights (continued)
Selected Data for a Share Outstanding Throughout Each Year
| | | | | | | | | | | | | | | | | | | | |
| | | Goldman Sachs Mid Cap Value Fund | |
| | | Institutional Shares | |
| | | Year Ended December 31, | |
| | | 2022 | | | 2021 | | | 2020 | | | 2019 | | | 2018 | |
| | | | | | | | | | | | | | | | | | | | |
| Per Share Data | | | | | | | | | | | | | | | |
| | | | | |
Net asset value, beginning of year | | $ | 19.53 | | | $ | 17.23 | | | $ | 16.22 | | | $ | 12.89 | | | $ | 16.93 | |
| | | | | |
Net investment income(a) | | | 0.16 | | | | 0.09 | | | | 0.10 | | | | 0.13 | | | | 0.13 | |
| | | | | |
Net realized and unrealized gain (loss) | | | (1.98 | ) | | | 5.20 | | | | 1.26 | | | | 3.93 | | | | (1.86 | ) |
| | | | | |
Total from investment operations | | | (1.82 | ) | | | 5.29 | | | | 1.36 | | | | 4.06 | | | | (1.73 | ) |
| | | | | |
Distributions to shareholders from net investment income | | | (0.13 | ) | | | (0.10 | ) | | | (0.10 | ) | | | (0.13 | ) | | | (0.23 | ) |
| | | | | |
Distributions to shareholders from net realized gains | | | (2.69 | ) | | | (2.89 | ) | | | (0.25 | ) | | | (0.60 | ) | | | (2.08 | ) |
| | | | | |
Total distributions | | | (2.82 | ) | | | (2.99 | ) | | | (0.35 | ) | | | (0.73 | ) | | | (2.31 | ) |
| | | | | |
Net asset value, end of year | | $ | 14.89 | | | $ | 19.53 | | | $ | 17.23 | | | $ | 16.22 | | | $ | 12.89 | |
| | | | | |
Total Return(b) | | | (9.99 | )% | | | 30.95 | % | | | 8.38 | % | | | 31.53 | % | | | (10.46 | )% |
| | | | | |
Net assets, end of year (in 000’s) | | $ | 311,440 | | | $ | 383,315 | | | $ | 327,376 | | | $ | 335,229 | | | $ | 300,056 | |
| | | | | |
Ratio of net expenses to average net assets | | | 0.83 | % | | | 0.83 | % | | | 0.84 | % | | | 0.87 | % | | | 0.84 | % |
| | | | | |
Ratio of total expenses to average net assets | | | 0.85 | % | | | 0.85 | % | | | 0.90 | % | | | 0.90 | % | | | 0.86 | % |
| | | | | |
Ratio of net investment income to average net assets | | | 0.89 | % | | | 0.46 | % | | | 0.68 | % | | | 0.85 | % | | | 0.75 | % |
| | | | | |
Portfolio turnover rate(c) | | | 75 | % | | | 63 | % | | | 111 | % | | | 89 | % | | | 109 | % |
| (a) | Calculated based on the average shares outstanding methodology. |
| (b) | Assumes investment at the NAV at the beginning of the year, reinvestment of all dividends and distributions, a complete redemption of the investment at the NAV at the end of the year and no sales or redemption charges (if any). Total returns would be reduced if a sales or redemption charge was taken into account. Returns do not reflect the impact of taxes to shareholders relating to Fund distributions or the redemption of Fund shares. |
| (c) | The Fund’s portfolio turnover rate is calculated in accordance with regulatory requirements, without regard to transactions involving short term investments and certain derivatives. If such transactions were included, the Fund’s portfolio turnover rate may be higher. |
| | |
| 94 | | The accompanying notes are an integral part of these financial statements. |
GOLDMAN SACHS VARIABLE INSURANCE TRUST MID CAP VALUE FUND
Financial Highlights (continued)
Selected Data for a Share Outstanding Throughout Each Year
| | | | | | | | | | | | | | | | | | | | |
| | | Goldman Sachs Mid Cap Value Fund | |
| | | Service Shares | |
| | | Year Ended December 31, | |
| | | 2022 | | | 2021 | | | 2020 | | | 2019 | | | 2018 | |
| | | | | | | | | | | | | | | | | | | | |
| Per Share Data | | | | | | | | | | | | | | | |
| | | | | |
Net asset value, beginning of year | | $ | 19.73 | | | $ | 17.39 | | | $ | 16.37 | | | $ | 13.01 | | | $ | 16.95 | |
| | | | | |
Net investment income(a) | | | 0.10 | | | | 0.04 | | | | 0.06 | | | | 0.10 | | | | 0.07 | |
| | | | | |
Net realized and unrealized gain (loss) | | | (1.99 | ) | | | 5.24 | | | | 1.28 | | | | 3.95 | | | | (1.84 | ) |
| | | | | |
Total from investment operations | | | (1.89 | ) | | | 5.28 | | | | 1.34 | | | | 4.05 | | | | (1.77 | ) |
| | | | | |
Distributions to shareholders from net investment income | | | (0.08 | ) | | | (0.05 | ) | | | (0.07 | ) | | | (0.09 | ) | | | (0.09 | ) |
| | | | | |
Distributions to shareholders from net realized gains | | | (2.69 | ) | | | (2.89 | ) | | | (0.25 | ) | | | (0.60 | ) | | | (2.08 | ) |
| | | | | |
Total distributions | | | (2.77 | ) | | | (2.94 | ) | | | (0.32 | ) | | | (0.69 | ) | | | (2.17 | ) |
| | | | | |
Net asset value, end of year | | $ | 15.07 | | | $ | 19.73 | | | $ | 17.39 | | | $ | 16.37 | | | $ | 13.01 | |
| | | | | |
Total Return(b) | | | (10.23 | )% | | | 30.57 | % | | | 8.17 | % | | | 31.17 | % | | | (10.70 | )% |
| | | | | |
Net assets, end of year (in 000’s) | | $ | 89,460 | | | $ | 169,283 | | | $ | 158,909 | | | $ | 174,896 | | | $ | 76,835 | |
| | | | | |
Ratio of net expenses to average net assets | | | 1.08 | % | | | 1.08 | % | | | 1.09 | % | | | 1.12 | % | | | 1.09 | % |
| | | | | |
Ratio of total expenses to average net assets | | | 1.10 | % | | | 1.10 | % | | | 1.14 | % | | | 1.16 | % | | | 1.11 | % |
| | | | | |
Ratio of net investment income to average net assets | | | 0.56 | % | | | 0.21 | % | | | 0.39 | % | | | 0.66 | % | | | 0.42 | % |
| | | | | |
Portfolio turnover rate(c) | | | 75 | % | | | 63 | % | | | 111 | % | | | 89 | % | | | 109 | % |
| (a) | Calculated based on the average shares outstanding methodology. |
| (b) | Assumes investment at the NAV at the beginning of the year, reinvestment of all dividends and distributions, a complete redemption of the investment at the NAV at the end of the year and no sales or redemption charges (if any). Total returns would be reduced if a sales or redemption charge was taken into account. Returns do not reflect the impact of taxes to shareholders relating to Fund distributions or the redemption of Fund shares. |
| (c) | The Fund’s portfolio turnover rate is calculated in accordance with regulatory requirements, without regard to transactions involving short term investments and certain derivatives. If such transactions were included, the Fund’s portfolio turnover rate may be higher. |
| | |
| The accompanying notes are an integral part of these financial statements. | | 95 |
GOLDMAN SACHS VARIABLE INSURANCE TRUST SMALL CAP EQUITY INSIGHTS FUND
Financial Highlights (continued)
Selected Data for a Share Outstanding Throughout Each Year
| | | | | | | | | | | | | | | | | | | | |
| | | Goldman Sachs Small Cap Equity Insights Fund | |
| | | Institutional Shares | |
| | | Year Ended December 31, | |
| | | 2022 | | | 2021 | | | 2020 | | | 2019 | | | 2018 | |
| | | | | | | | | | | | | | | | | | | | |
| Per Share Data | | | | | | | | | | | | | | | |
| | | | | |
Net asset value, beginning of year | | $ | 13.08 | | | $ | 13.51 | | | $ | 12.62 | | | $ | 10.37 | | | $ | 13.66 | |
| | | | | |
Net investment income(a) | | | 0.07 | (b) | | | 0.05 | (c) | | | 0.05 | | | | 0.06 | | | | 0.07 | (d) |
| | | | | |
Net realized and unrealized gain (loss) | | | (2.59 | ) | | | 3.17 | | | | 1.03 | | | | 2.51 | | | | (1.21 | ) |
| | | | | |
Total from investment operations | | | (2.52 | ) | | | 3.22 | | | | 1.08 | | | | 2.57 | | | | (1.14 | ) |
| | | | | |
Distributions to shareholders from net investment income | | | (0.04 | ) | | | (0.08 | ) | | | (0.03 | ) | | | (0.06 | ) | | | (0.07 | ) |
| | | | | |
Distributions to shareholders from net realized gains | | | (0.12 | ) | | | (3.57 | ) | | | (0.16 | ) | | | (0.26 | ) | | | (2.08 | ) |
| | | | | |
Total distributions | | | (0.16 | ) | | | (3.65 | ) | | | (0.19 | ) | | | (0.32 | ) | | | (2.15 | ) |
| | | | | |
Net asset value, end of year | | $ | 10.40 | | | $ | 13.08 | | | $ | 13.51 | | | $ | 12.62 | | | $ | 10.37 | |
| | | | | |
Total Return(e) | | | (19.38 | )% | | | 23.79 | % | | | 8.56 | % | | | 24.84 | % | | | (8.62 | )% |
| | | | | |
Net assets, end of year (in 000’s) | | $ | 87,877 | | | $ | 108,716 | | | $ | 84,887 | | | $ | 79,791 | | | $ | 68,951 | |
| | | | | |
Ratio of net expenses to average net assets | | | 0.81 | % | | | 0.81 | % | | | 0.81 | % | | | 0.86 | % | | | 0.81 | % |
| | | | | |
Ratio of total expenses to average net assets | | | 0.95 | % | | | 0.93 | % | | | 1.08 | % | | | 1.05 | % | | | 0.98 | % |
| | | | | |
Ratio of net investment income to average net assets | | | 0.65 | %(b) | | | 0.34 | %(c) | | | 0.46 | % | | | 0.51 | % | | | 0.46 | %(d) |
| | | | | |
Portfolio turnover rate(f) | | | 163 | % | | | 172 | % | | | 147 | % | | | 125 | % | | | 116 | % |
| (a) | Calculated based on the average shares outstanding methodology. |
| (b) | Reflects income recognized from special dividends which amounted to $0.02 per share and 0.21% of average net assets. |
| (c) | Reflects income recognized from special dividends which amounted to $0.03 per share and 0.22% of average net assets. |
| (d) | Reflects income recognized from special dividends which amounted to $0.02 per share and 0.17% of average net assets. |
| (e) | Assumes investment at the NAV at the beginning of the year, reinvestment of all dividends and distributions, a complete redemption of the investment at the NAV at the end of the year and no sales or redemption charges (if any). Total returns would be reduced if a sales or redemption charge was taken into account. Returns do not reflect the impact of taxes to shareholders relating to Fund distributions or the redemption of Fund shares. |
| (f) | The Fund’s portfolio turnover rate is calculated in accordance with regulatory requirements, without regard to transactions involving short term investments and certain derivatives. If such transactions were included, the Fund’s portfolio turnover rate may be higher. |
| | |
| 96 | | The accompanying notes are an integral part of these financial statements. |
GOLDMAN SACHS VARIABLE INSURANCE TRUST SMALL CAP EQUITY INSIGHTS FUND
Financial Highlights (continued)
Selected Data for a Share Outstanding Throughout Each Year
| | | | | | | | | | | | | | | | | | | | |
| | | Goldman Sachs Small Cap Equity Insights Fund | |
| | | Service Shares | |
| | | Year Ended December 31, | |
| | | 2022 | | | 2021 | | | 2020 | | | 2019 | | | 2018 | |
| | | | | | | | | | | | | | | | | | | | |
| Per Share Data | | | | | | | | | | | | | | | |
| | | | | |
Net asset value, beginning of year | | $ | 12.93 | | | $ | 13.39 | | | $ | 12.51 | | | $ | 10.28 | | | $ | 13.55 | |
| | | | | |
Net investment income(a) | | | 0.05 | (b) | | | 0.01 | (c) | | | 0.02 | | | | 0.03 | | | | 0.03 | (d) |
| | | | | |
Net realized and unrealized gain (loss) | | | (2.58 | ) | | | 3.14 | | | | 1.02 | | | | 2.49 | | | | (1.19 | ) |
| | | | | |
Total from investment operations | | | (2.53 | ) | | | 3.15 | | | | 1.04 | | | | 2.52 | | | | (1.16 | ) |
| | | | | |
Distributions to shareholders from net investment income | | | (0.01 | ) | | | (0.04 | ) | | | — | | | | (0.03 | ) | | | (0.03 | ) |
| | | | | |
Distributions to shareholders from net realized gains | | | (0.12 | ) | | | (3.57 | ) | | | (0.16 | ) | | | (0.26 | ) | | | (2.08 | ) |
| | | | | |
Total distributions | | | (0.13 | ) | | | (3.61 | ) | | | (0.16 | ) | | | (0.29 | ) | | | (2.11 | ) |
| | | | | |
Net asset value, end of year | | $ | 10.27 | | | $ | 12.93 | | | $ | 13.39 | | | $ | 12.51 | | | $ | 10.28 | |
| | | | | |
Total Return(e) | | | (19.64 | )% | | | 23.50 | % | | | 8.34 | % | | | 24.53 | % | | | (8.82 | )% |
| | | | | |
Net assets, end of year (in 000’s) | | $ | 21,617 | | | $ | 22,114 | | | $ | 17,239 | | | $ | 15,742 | | | $ | 16,537 | |
| | | | | |
Ratio of net expenses to average net assets | | | 1.06 | % | | | 1.06 | % | | | 1.06 | % | | | 1.10 | % | | | 1.06 | % |
| | | | | |
Ratio of total expenses to average net assets | | | 1.20 | % | | | 1.18 | % | | | 1.33 | % | | | 1.30 | % | | | 1.23 | % |
| | | | | |
Ratio of net investment income to average net assets | | | 0.43 | %(b) | | | 0.09 | %(c) | | | 0.22 | % | | | 0.27 | % | | | 0.19 | %(d) |
| | | | | |
Portfolio turnover rate(f) | | | 163 | % | | | 172 | % | | | 147 | % | | | 125 | % | | | 116 | % |
| (a) | Calculated based on the average shares outstanding methodology. |
| (b) | Reflects income recognized from special dividends which amounted to $0.02 per share and 0.21% of average net assets. |
| (c) | Reflects income recognized from special dividends which amounted to $0.03 per share and 0.22% of average net assets. |
| (d) | Reflects income recognized from special dividends which amounted to $0.02 per share and 0.17% of average net assets. |
| (e) | Assumes investment at the NAV at the beginning of the year, reinvestment of all dividends and distributions, a complete redemption of the investment at the NAV at the end of the year and no sales or redemption charges (if any). Total returns would be reduced if a sales or redemption charge was taken into account. Returns do not reflect the impact of taxes to shareholders relating to Fund distributions or the redemption of Fund shares. |
| (f) | The Fund’s portfolio turnover rate is calculated in accordance with regulatory requirements, without regard to transactions involving short term investments and certain derivatives. If such transactions were included, the Fund’s portfolio turnover rate may be higher. |
| | |
| The accompanying notes are an integral part of these financial statements. | | 97 |
GOLDMAN SACHS VARIABLE INSURANCE TRUST STRATEGIC GROWTH FUND
Financial Highlights (continued)
Selected Data for a Share Outstanding Throughout Each Year
| | | | | | | | | | | | | | | | | | | | |
| | | Goldman Sachs Strategic Growth Fund | |
| | | Institutional Shares | |
| | | Year Ended December 31, | |
| | | 2022 | | | 2021 | | | 2020 | | | 2019 | | | 2018 | |
| | | | | | | | | | | | | | | | | | | | |
| Per Share Data | | | | | | | | | | | | | | | |
| | | | | |
Net asset value, beginning of year | | $ | 16.63 | | | $ | 15.43 | | | $ | 11.90 | | | $ | 9.78 | | | $ | 19.73 | |
| | | | | |
Net investment income (loss)(a) | | | (0.01 | ) | | | (0.05 | ) | | | — | (b) | | | 0.03 | | | | 0.06 | |
| | | | | |
Net realized and unrealized gain (loss) | | | (5.24 | ) | | | 3.46 | | | | 4.79 | | | | 3.43 | | | | (0.18 | ) |
| | | | | |
Total from investment operations | | | (5.25 | ) | | | 3.41 | | | | 4.79 | | | | 3.46 | | | | (0.12 | ) |
| | | | | |
Distributions to shareholders from net investment income | | | — | | | | — | | | | (0.01 | ) | | | (0.04 | ) | | | (0.10 | ) |
| | | | | |
Distributions to shareholders from net realized gains | | | (2.18 | ) | | | (2.21 | ) | | | (1.25 | ) | | | (1.30 | ) | | | (9.73 | ) |
| | | | | |
Total distributions | | | (2.18 | ) | | | (2.21 | ) | | | (1.26 | ) | | | (1.34 | ) | | | (9.83 | ) |
| | | | | |
Net asset value, end of year | | $ | 9.20 | | | $ | 16.63 | | | $ | 15.43 | | | $ | 11.90 | | | $ | 9.78 | |
| | | | | |
Total Return(c) | | | (32.52 | )% | | | 21.93 | % | | | 40.37 | % | | | 35.53 | % | | | (1.04 | )% |
| | | | | |
Net assets, end of year (in 000’s) | | $ | 122,077 | | | $ | 187,144 | | | $ | 167,930 | | | $ | 129,686 | | | $ | 102,199 | |
| | | | | |
Ratio of net expenses to average net assets | | | 0.74 | % | | | 0.73 | % | | | 0.74 | % | | | 0.77 | % | | | 0.74 | % |
| | | | | |
Ratio of total expenses to average net assets | | | 0.82 | % | | | 0.79 | % | | | 0.81 | % | | | 0.85 | % | | | 0.82 | % |
| | | | | |
Ratio of net investment income (loss) to average net assets | | | (0.11 | )% | | | (0.27 | )% | | | (0.01 | )% | | | 0.29 | % | | | 0.30 | % |
| | | | | |
Portfolio turnover rate(d) | | | 29 | % | | | 20 | % | | | 45 | % | | | 44 | % | | | 41 | % |
| (a) | Calculated based on the average shares outstanding methodology. |
| (b) | Amount is less than $0.005 per share. |
| (c) | Assumes investment at the NAV at the beginning of the year, reinvestment of all dividends and distributions, a complete redemption of the investment at the NAV at the end of the year and no sales or redemption charges (if any). Total returns would be reduced if a sales or redemption charge was taken into account. Returns do not reflect the impact of taxes to shareholders relating to Fund distributions or the redemption of Fund shares. |
| (d) | The Fund’s portfolio turnover rate is calculated in accordance with regulatory requirements, without regard to transactions involving short term investments. If such transactions were included, the Fund’s portfolio turnover rate may be higher. |
| | |
| 98 | | The accompanying notes are an integral part of these financial statements. |
GOLDMAN SACHS VARIABLE INSURANCE TRUST STRATEGIC GROWTH FUND
Financial Highlights (continued)
Selected Data for a Share Outstanding Throughout Each Year
| | | | | | | | | | | | | | | | | | | | |
| | | Goldman Sachs Strategic Growth Fund | |
| | | Service Shares | |
| | | Year Ended December 31, | |
| | | 2022 | | | 2021 | | | 2020 | | | 2019 | | | 2018 | |
| | | | | | | | | | | | | | | | | | | | |
| Per Share Data | | | | | | | | | | | | | | | |
| | | | | |
Net asset value, beginning of year | | $ | 16.55 | | | $ | 15.41 | | | $ | 11.91 | | | $ | 9.78 | | | $ | 19.68 | |
| | | | | |
Net investment income (loss)(a) | | | (0.05 | ) | | | (0.09 | ) | | | (0.03 | ) | | | 0.01 | | | | 0.01 | |
| | | | | |
Net realized and unrealized gain (loss) | | | (5.20 | ) | | | 3.44 | | | | 4.78 | | | | 3.43 | | | | (0.18 | ) |
| | | | | |
Total from investment operations | | | (5.25 | ) | | | 3.35 | | | | 4.75 | | | | 3.44 | | | | (0.17 | ) |
| | | | | |
Distributions to shareholders from net investment income | | | — | | | | — | | | | — | | | | (0.01 | ) | | | — | |
| | | | | |
Distributions to shareholders from net realized gains | | | (2.18 | ) | | | (2.21 | ) | | | (1.25 | ) | | | (1.30 | ) | | | (9.73 | ) |
| | | | | |
Total distributions | | | (2.18 | ) | | | (2.21 | ) | | | (1.25 | ) | | | (1.31 | ) | | | (9.73 | ) |
| | | | | |
Net asset value, end of year | | $ | 9.12 | | | $ | 16.55 | | | $ | 15.41 | | | $ | 11.91 | | | $ | 9.78 | |
| | | | | |
Total Return(b) | | | (32.68 | )% | | | 21.56 | % | | | 39.98 | % | | | 35.32 | % | | | (1.32 | )% |
| | | | | |
Net assets, end of year (in 000’s) | | $ | 115,205 | | | $ | 262,782 | | | $ | 257,714 | | | $ | 241,375 | | | $ | 139,414 | |
| | | | | |
Ratio of net expenses to average net assets | | | 0.99 | % | | | 0.98 | % | | | 0.99 | % | | | 1.02 | % | | | 0.99 | % |
| | | | | |
Ratio of total expenses to average net assets | | | 1.07 | % | | | 1.04 | % | | | 1.06 | % | | | 1.10 | % | | | 1.07 | % |
| | | | | |
Ratio of net investment income (loss) to average net assets | | | (0.38 | )% | | | (0.52 | )% | | | (0.24 | )% | | | 0.04 | % | | | 0.04 | % |
| | | | | |
Portfolio turnover rate(c) | | | 29 | % | | | 20 | % | | | 45 | % | | | 44 | % | | | 41 | % |
| (a) | Calculated based on the average shares outstanding methodology. |
| (b) | Assumes investment at the NAV at the beginning of the year, reinvestment of all dividends and distributions, a complete redemption of the investment at the NAV at the end of the year and no sales or redemption charges (if any). Total returns would be reduced if a sales or redemption charge was taken into account. Returns do not reflect the impact of taxes to shareholders relating to Fund distributions or the redemption of Fund shares. |
| (c) | The Fund’s portfolio turnover rate is calculated in accordance with regulatory requirements, without regard to transactions involving short term investments. If such transactions were included, the Fund’s portfolio turnover rate may be higher. |
| | |
| The accompanying notes are an integral part of these financial statements. | | 99 |
GOLDMAN SACHS VARIABLE INSURANCE TRUST U.S. EQUITY INSIGHTS FUND
Financial Highlights (continued)
Selected Data for a Share Outstanding Throughout Each Year
| | | | | | | | | | | | | | | | | | | | |
| | | Goldman Sachs U.S. Equity Insights Fund | |
| | | Institutional Shares | |
| | | Year Ended December 31, | |
| | | 2022 | | | 2021 | | | 2020 | | | 2019 | | | 2018 | |
| | | | | | | | | | | | | | | | | | | | |
| Per Share Data | | | | | | | | | | | | | | | |
| | | | | |
Net asset value, beginning of year | | $ | 20.06 | | | $ | 20.08 | | | $ | 17.93 | | | $ | 15.03 | | | $ | 19.41 | |
| | | | | |
Net investment income(a) | | | 0.15 | | | | 0.18 | | | | 0.15 | | | | 0.21 | | | | 0.22 | |
| | | | | |
Net realized and unrealized gain (loss) | | | (4.10 | ) | | | 5.61 | | | | 2.98 | | | | 3.57 | | | | (1.38 | ) |
| | | | | |
Total from investment operations | | | (3.95 | ) | | | 5.79 | | | | 3.13 | | | | 3.78 | | | | (1.16 | ) |
| | | | | |
Distributions to shareholders from net investment income | | | (0.14 | ) | | | (0.19 | ) | | | (0.16 | ) | | | (0.23 | ) | | | (0.25 | ) |
| | | | | |
Distributions to shareholders from net realized gains | | | (0.09 | ) | | | (5.62 | ) | | | (0.82 | ) | | | (0.65 | ) | | | (2.97 | ) |
| | | | | |
Total distributions | | | (0.23 | ) | | | (5.81 | ) | | | (0.98 | ) | | | (0.88 | ) | | | (3.22 | ) |
| | | | | |
Net asset value, end of year | | $ | 15.88 | | | $ | 20.06 | | | $ | 20.08 | | | $ | 17.93 | | | $ | 15.03 | |
| | | | | |
Total Return(b) | | | (19.74 | )% | | | 29.41 | % | | | 17.49 | % | | | 25.21 | % | | | (6.19 | )% |
| | | | | |
Net assets, end of year (in 000’s) | | $ | 242,239 | | | $ | 317,468 | | | $ | 267,592 | | | $ | 256,930 | | | $ | 235,553 | |
| | | | | |
Ratio of net expenses to average net assets | | | 0.56 | % | | | 0.55 | % | | | 0.56 | % | | | 0.58 | % | | | 0.58 | % |
| | | | | |
Ratio of total expenses to average net assets | | | 0.72 | % | | | 0.71 | % | | | 0.75 | % | | | 0.76 | % | | | 0.73 | % |
| | | | | |
Ratio of net investment income to average net assets | | | 0.86 | % | | | 0.81 | % | | | 0.85 | % | | | 1.24 | % | | | 1.12 | % |
| | | | | |
Portfolio turnover rate(c) | | | 203 | % | | | 206 | % | | | 203 | % | | | 187 | % | | | 160 | % |
| (a) | Calculated based on the average shares outstanding methodology. |
| (b) | Assumes investment at the NAV at the beginning of the year, reinvestment of all dividends and distributions, a complete redemption of the investment at the NAV at the end of the year and no sales or redemption charges (if any). Total returns would be reduced if a sales or redemption charge was taken into account. Returns do not reflect the impact of taxes to shareholders relating to Fund distributions or the redemption of Fund shares. |
| (c) | The Fund’s portfolio turnover rate is calculated in accordance with regulatory requirements, without regard to transactions involving short term investments and certain derivatives. If such transactions were included, the Fund’s portfolio turnover rate may be higher. |
| | |
| 100 | | The accompanying notes are an integral part of these financial statements. |
GOLDMAN SACHS VARIABLE INSURANCE TRUST U.S. EQUITY INSIGHTS FUND
Financial Highlights (continued)
Selected Data for a Share Outstanding Throughout Each Year
| | | | | | | | | | | | | | | | | | | | |
| | | Goldman Sachs U.S. Equity Insights Fund | |
| | | Service Shares | |
| | | Year Ended December 31, | |
| | | 2022 | | | 2021 | | | 2020 | | | 2019 | | | 2018 | |
| | | | | | | | | | | | | | | | | | | | |
| Per Share Data | | | | | | | | | | | | | | | |
| | | | | |
Net asset value, beginning of year | | $ | 20.23 | | | $ | 20.21 | | | $ | 18.04 | | | $ | 15.12 | | | $ | 19.48 | |
| | | | | |
Net investment income(a) | | | 0.11 | | | | 0.14 | | | | 0.12 | | | | 0.18 | | | | 0.18 | |
| | | | | |
Net realized and unrealized gain (loss) | | | (4.13 | ) | | | 5.64 | | | | 2.99 | | | | 3.58 | | | | (1.37 | ) |
| | | | | |
Total from investment operations | | | (4.02 | ) | | | 5.78 | | | | 3.11 | | | | 3.76 | | | | (1.19 | ) |
| | | | | |
Distributions to shareholders from net investment income | | | (0.10 | ) | | | (0.14 | ) | | | (0.12 | ) | | | (0.19 | ) | | | (0.20 | ) |
| | | | | |
Distributions to shareholders from net realized gains | | | (0.09 | ) | | | (5.62 | ) | | | (0.82 | ) | | | (0.65 | ) | | | (2.97 | ) |
| | | | | |
Total distributions | | | (0.19 | ) | | | (5.76 | ) | | | (0.94 | ) | | | (0.84 | ) | | | (3.17 | ) |
| | | | | |
Net asset value, end of year | | $ | 16.02 | | | $ | 20.23 | | | $ | 20.21 | | | $ | 18.04 | | | $ | 15.12 | |
| | | | | |
Total Return(b) | | | (19.90 | )% | | | 29.11 | % | | | 17.27 | % | | | 24.93 | % | | | (6.36 | )% |
| | | | | |
Net assets, end of year (in 000’s) | | $ | 41,870 | | | $ | 61,849 | | | $ | 54,149 | | | $ | 55,201 | | | $ | 53,208 | |
| | | | | |
Ratio of net expenses to average net assets | | | 0.77 | % | | | 0.77 | % | | | 0.77 | % | | | 0.79 | % | | | 0.79 | % |
| | | | | |
Ratio of total expenses to average net assets | | | 0.97 | % | | | 0.93 | % | | | 1.00 | % | | | 1.01 | % | | | 0.97 | % |
| | | | | |
Ratio of net investment income to average net assets | | | 0.64 | % | | | 0.60 | % | | | 0.63 | % | | | 1.03 | % | | | 0.88 | % |
| | | | | |
Portfolio turnover rate(c) | | | 203 | % | | | 206 | % | | | 203 | % | | | 187 | % | | | 160 | % |
| (a) | Calculated based on the average shares outstanding methodology. |
| (b) | Assumes investment at the NAV at the beginning of the year, reinvestment of all dividends and distributions, a complete redemption of the investment at the NAV at the end of the year and no sales or redemption charges (if any). Total returns would be reduced if a sales or redemption charge was taken into account. Returns do not reflect the impact of taxes to shareholders relating to Fund distributions or the redemption of Fund shares. |
| (c) | The Fund’s portfolio turnover rate is calculated in accordance with regulatory requirements, without regard to transactions involving short term investments and certain derivatives. If such transactions were included, the Fund’s portfolio turnover rate may be higher. |
| | |
| The accompanying notes are an integral part of these financial statements. | | 101 |
GOLDMAN SACHS VARIABLE INSURANCE TRUST EQUITY FUNDS
Notes to Financial Statements
December 31, 2022
1. ORGANIZATION
Goldman Sachs Variable Insurance Trust (the “Trust” or “VIT”) is a Delaware statutory trust registered under the Investment Company Act of 1940, as amended (the “Act”), as an open-end management investment company. The following table lists those series of the Trust that are included in this report (collectively, the “Funds” or individually a “Fund”), along with their corresponding share classes and respective diversification status under the Act:
| | | | |
| Fund | | Share Classes Offered | | Diversified/ Non-diversified |
Equity Index | | Service | | Diversified |
International Equity Insights | | Institutional and Service | | Diversified |
Large Cap Value | | Institutional and Service | | Diversified |
Mid Cap Growth* | | Institutional and Service | | Diversified |
Mid Cap Value | | Institutional and Service | | Diversified |
Small Cap Equity Insights | | Institutional and Service | | Diversified |
Strategic Growth | | Institutional and Service | | Non-Diversified |
U.S. Equity Insights | | Institutional and Service | | Diversified |
| * | Effective April 29, 2022, the Fund changed its name from Growth Opportunities to Mid Cap Growth. |
Shares of the Trust are offered to separate accounts of participating life insurance companies for the purpose of funding variable annuity contracts and variable life insurance policies.
Goldman Sachs Asset Management, L.P. (“GSAM” or the “Investment Adviser”), an affiliate of Goldman Sachs & Co. LLC (“Goldman Sachs”), serves as investment adviser to the Funds pursuant to management agreements (the “Agreements”) with the Trust.
At a meeting held on December 13-14, 2022, upon the recommendation of Goldman Sachs Asset Management, L.P., the Board of Trustees (the “Board”) of the Goldman Sachs Variable Insurance Trust (the “Trust”) approved a proposal to liquidate the Goldman Sachs Equity Index Fund (the “Fund”), a series of the Trust. The Fund will be liquidated on or about April 21, 2023 (the “Liquidation Date”), pursuant to a Plan of Liquidation approved by the Board. The Liquidation Date may be changed without notice at the discretion of the Trust’s officers. As such, shares of the Fund were no longer be available for purchase by new insurance company separate account or other shareholders as of the close of business on January 16, 2023. Existing variable annuity and variable insurance contract owners and others who are shareholders of the Fund may continue to purchase shares of the Fund until April 18, 2023. To the extent there are any dividend or distribution payments made prior to the Liquidation Date, they will continue to be paid either in cash or in additional shares of the Fund, depending on each shareholder’s current election, as disclosed in the Prospectus.
2. SIGNIFICANT ACCOUNTING POLICIES
The financial statements have been prepared in accordance with accounting principles generally accepted in the United States of America (“GAAP”) and require management to make estimates and assumptions that may affect the reported amounts and disclosures. Actual results may differ from those estimates and assumptions. Each Fund is an investment company under GAAP and follows the accounting and reporting guidance applicable to investment companies.
A. Investment Valuation — The Funds’ valuation policy is to value investments at fair value.
B. Investment Income and Investments — Investment income includes interest income, dividend income, and securities lending income, if any. Interest income is accrued daily and adjusted for amortization of premiums and accretion of discounts. Dividend income is recognized on ex-dividend date or, for certain foreign securities, as soon as such information is obtained subsequent to the ex-dividend date. Non-cash dividends, if any, are recorded at the fair market value of the securities received. Investment transactions are reflected on trade date. Realized gains and losses are calculated using identified cost. Investment transactions are recorded on the following business day for daily net asset value (“NAV”) calculations. Investment income is recorded net of any foreign withholding taxes, less any amounts reclaimable. The Funds may file withholding tax reclaims in
GOLDMAN SACHS VARIABLE INSURANCE TRUST EQUITY FUNDS
2. SIGNIFICANT ACCOUNTING POLICIES (continued)
certain jurisdictions to recover a portion of amounts previously withheld. Any foreign capital gains tax is accrued daily based upon net unrealized gains, and is payable upon sale of such investments. Distributions received from the Funds’ investments in United States (“U.S.”) real estate investment trusts (“REITs”) may be characterized as ordinary income, net capital gain and/or a return of capital. A return of capital is recorded by the Funds as a reduction to the cost basis of the REIT.
For derivative contracts, unrealized gains and losses are recorded daily and become realized gains and losses upon disposition or termination of the contract.
C. Class Allocations and Expenses — Investment income, realized and unrealized gain (loss), if any, and non-class specific expenses of each Fund are allocated daily based upon the proportion of net assets of each class. Non-class specific expenses directly incurred by a Fund are charged to that Fund, while such expenses incurred by the Trust are allocated across the applicable Funds on a straight-line and/or pro-rata basis depending upon the nature of the expenses. Class specific expenses, where applicable, are borne by the respective share classes and include Distribution and Service and Transfer Agency fees.
D. Federal Taxes and Distributions to Shareholders — It is each Fund’s policy to comply with the requirements of the Internal Revenue Code of 1986, as amended (the “Code”), applicable to regulated investment companies and to distribute each year substantially all of its investment company taxable income and capital gains to its shareholders. Accordingly, each Fund is not required to make any provisions for the payment of federal income tax. Distributions to shareholders are recorded on the ex-dividend date. Income and capital gains distributions, if any, are declared and paid at least annually.
Net capital losses, if any, are carried forward to future fiscal years and may be used to the extent allowed by the Code to offset any future capital gains. Losses that are carried forward will retain their character as either short-term or long-term capital losses. Utilization of capital loss carryforwards will reduce the requirement of future capital gains distributions.
The characterization of distributions to shareholders for financial reporting purposes is determined in accordance with federal income tax rules, which may differ from GAAP. The source of each Fund’s distributions may be shown in the accompanying financial statements as either from distributable earnings or capital. Certain components of the Funds’ net assets on the Statements of Assets and Liabilities reflect permanent GAAP/tax differences based on the appropriate tax character.
E. Foreign Currency Translation — The accounting records and reporting currency of a Fund are maintained in U.S. dollars. Assets and liabilities denominated in foreign currencies are translated into U.S. dollars using the current exchange rates at the close of each business day. The effect of changes in foreign currency exchange rates on investments is included within net realized and unrealized gain (loss) on investments. Changes in the value of other assets and liabilities as a result of fluctuations in foreign exchange rates are included in the Statements of Operations within net change in unrealized gain (loss) on foreign currency translation. Transactions denominated in foreign currencies are translated into U.S. dollars on the date the transaction occurred, the effects of which are included within net realized gain (loss) on foreign currency transactions.
3. INVESTMENTS AND FAIR VALUE MEASUREMENTS
U.S. GAAP defines the fair value of a financial instrument as the amount that would be received to sell an asset or paid to transfer a liability in an orderly transaction between market participants at the measurement date (i.e., the exit price); the Funds’ policy is to use the market approach. GAAP establishes a fair value hierarchy that prioritizes the inputs to valuation techniques used to measure fair value. The hierarchy gives the highest priority to unadjusted quoted prices in active markets for identical assets or liabilities (Level 1 measurements) and the lowest priority to unobservable inputs (Level 3 measurements). The level in the fair value hierarchy within which the fair value measurement in its entirety falls shall be determined based on the lowest level input that is significant to the fair value measurement in its entirety. The levels used for classifying investments are not necessarily an indication of the risk associated with investing in these investments. The three levels of the fair value hierarchy are described below:
Level 1 — Unadjusted quoted prices in active markets that are accessible at the measurement date for identical, unrestricted assets or liabilities;
Level 2 — Quoted prices in markets that are not active or financial instruments for which significant inputs are observable
(including, but not limited to, quoted prices for similar investments, interest rates, foreign exchange rates, volatility and credit spreads), either directly or indirectly;
GOLDMAN SACHS VARIABLE INSURANCE TRUST EQUITY FUNDS
Notes to Financial Statements (continued)
December 31, 2022
3. INVESTMENTS AND FAIR VALUE MEASUREMENTS (continued)
Level 3 — Prices or valuations that require significant unobservable inputs (including GSAM’s assumptions in determining fair value measurement).
The Board of Trustees (“Trustees”) has approved Valuation Procedures that govern the valuation of the portfolio investments held by the Funds, including investments for which market quotations are not readily available. With respect to the Funds’ investments that do not have readily available market quotations, the Trustees have designated the Adviser as the valuation designee to perform fair valuations pursuant to Rule 2a-5 under the Investment Company Act of 1940 (the “Valuation Designee”). GSAM has day-to-day responsibility for implementing and maintaining internal controls and procedures related to the valuation of the Funds’ investments. To assess the continuing appropriateness of pricing sources and methodologies, GSAM regularly performs price verification procedures and issues challenges as necessary to third party pricing vendors or brokers, and any differences are reviewed in accordance with the Valuation Procedures.
A. Level 1 and Level 2 Fair Value Investments — The valuation techniques and significant inputs used in determining the fair values for investments classified as Level 1 and Level 2 are as follows:
Equity Securities — Equity securities traded on a U.S. securities exchange or the NASDAQ system, or those located on certain foreign exchanges, including but not limited to the Americas, are valued daily at their last sale price or official closing price on the principal exchange or system on which they are traded. If there is no sale or official closing price or such price is believed by GSAM to not represent fair value, equity securities will be valued at the valid closing bid price for long positions and at the valid closing ask price for short positions (i.e. where there is sufficient volume, during normal exchange trading hours). If no valid bid/ask price is available, the equity security will be valued pursuant to the Valuation Procedures and consistent with applicable regulatory guidance. To the extent these investments are actively traded, they are classified as Level 1 of the fair value hierarchy, otherwise they are generally classified as Level 2. Certain equity securities containing unique attributes may be classified as Level 2.
Unlisted equity securities for which market quotations are available are valued at the last sale price on the valuation date, or if no sale occurs, at the last bid price for long positions or the last ask price for short positions, and are generally classified as Level 2. Securities traded on certain foreign securities exchanges are valued daily at fair value determined by an independent fair value service (if available) under the Valuation Procedures and consistent with applicable regulatory guidance. The independent fair value service takes into account multiple factors including, but not limited to, movements in the securities markets, certain depositary receipts, futures contracts and foreign currency exchange rates that have occurred subsequent to the close of the foreign securities exchange. These investments are generally classified as Level 2 of the fair value hierarchy.
Money Market Funds — Investments in the Goldman Sachs Financial Square Government Fund (“Underlying Money Market Fund”) are valued at the NAV per share of the Institutional Share class on the day of valuation. These investments are generally classified as Level 1 of the fair value hierarchy. For information regarding the Underlying Money Market Fund’s accounting policies and investment holdings, please see the Underlying Money Market Fund’s shareholder report.
Derivative Contracts — A derivative is an instrument whose value is derived from underlying assets, indices, reference rates or a combination of these factors. A Fund enters into derivative transactions to hedge against changes in interest rates, securities prices, and/or currency exchange rates, to increase total return, or to gain access to certain markets or attain exposure to other underliers. For financial reporting purposes, cash collateral that has been pledged to cover obligations of a Fund and cash collateral received, if any, is reported separately on the Statements of Assets and Liabilities as either due to broker/receivable for collateral on certain derivative contracts. Non-cash collateral pledged by a Fund, if any, is noted in the Schedules of Investments.
Exchange-traded derivatives, including futures and options contracts, are generally valued at the last sale or settlement price on the exchange where they are principally traded. Exchange-traded options without settlement prices are generally valued at the midpoint of the bid and ask prices on the exchange where they are principally traded (or, in the absence of two-way trading, at the last bid price for long positions and the last ask price for short positions). Exchange-traded derivatives typically fall within Level 1 of the fair value hierarchy. Over-the-counter (“OTC”) and centrally cleared derivatives are valued using market transactions and other market evidence, including market-based inputs to models, calibration to market-clearing transactions, broker or dealer quotations, or other alternative pricing sources. Where models are used, the selection of a particular model to value OTC and centrally cleared derivatives depends upon the contractual terms of, and specific risks inherent in, the instrument, as well as the
GOLDMAN SACHS VARIABLE INSURANCE TRUST EQUITY FUNDS
3. INVESTMENTS AND FAIR VALUE MEASUREMENTS (continued)
availability of pricing information in the market. Valuation models require a variety of inputs, including contractual terms, market prices, yield curves, credit curves, measures of volatility, voluntary and involuntary prepayment rates, loss severity rates and correlations of such inputs. For OTC and centrally cleared derivatives that trade in liquid markets, model inputs can generally be verified and model selection does not involve significant management judgment. OTC and centrally cleared derivatives are classified within Level 2 of the fair value hierarchy when significant inputs are corroborated by market evidence.
i. Futures Contracts — Futures contracts are contracts to buy or sell a standardized quantity of a specified commodity or security. Upon entering into a futures contract, a Fund deposits cash or securities in an account on behalf of the broker in an amount sufficient to meet the initial margin requirement. Subsequent payments are made or received by a Fund equal to the daily change in the contract value and are recorded as variation margin receivable or payable with a corresponding offset to unrealized gains or losses.
B. Level 3 Fair Value Investments — To the extent that significant inputs to valuation models and other alternative pricing sources are unobservable, or if quotations are not readily available, or if GSAM believes that such quotations do not accurately reflect fair value, the fair value of a Fund’s investments may be determined under the Valuation Procedures. GSAM, consistent with its procedures and applicable regulatory guidance, may make an adjustment to the most recent valuation prices of either domestic or foreign securities in light of significant events to reflect what it believes to be the fair value of the securities at the time of determining a Fund’s NAV. To the extent investments are valued using single source broker quotations obtained directly from the broker or passed through from third party pricing vendors, such investments are classified as Level 3 investments.
C. Fair Value Hierarchy — The following is a summary of the Funds’ investments and derivatives classified in the fair value hierarchy as of December 31, 2022:
| | | | | | | | | | | | |
| | | |
| EQUITY INDEX FUND | | | | | | | | | |
| Investment Type | | Level 1 | | | Level 2 | | | Level 3 | |
| | | |
| Assets | | | | | | | | | | | | |
| Common Stock and/or Other Equity Investments(a) | | | | | | | | | | | | |
Asia | | $ | 205,123 | | | $ | — | | | $ | — | |
Europe | | | 992,050 | | | | — | | | | — | |
North America | | | 159,529,290 | | | | — | | | | — | |
| | | |
| Total | | $ | 160,726,463 | | | $ | — | | | $ | — | |
| | | |
| Derivative Type | | | | | | | | | |
| | | |
| Liabilities(b) | | | | | | | | | | | | |
| Futures Contracts | | $ | (16,431 | ) | | $ | — | | | $ | — | |
| | | |
| INTERNATIONAL EQUITY INSIGHTS FUND | | | | | | | | | |
| Investment Type | | Level 1 | | | Level 2 | | | Level 3 | |
| | | |
| Assets | | | | | | | | | | | | |
| Common Stock and/or Other Equity Investments(a) | | | | | | | | | | | | |
Africa | | $ | — | | | $ | 862,927 | | | $ | — | |
Asia | | | 153,000 | | | | 21,144,026 | | | | — | |
Europe | | | 1,365,703 | | | | 53,157,801 | | | | — | |
North America | | | 1,055,641 | | | | 5,387,924 | | | | — | |
Oceania | | | 988,549 | | | | 7,515,143 | | | | — | |
| Securities Lending Reinvestment Vehicle | | | 166,392 | | | | — | | | | — | |
| | | |
| Total | | $ | 3,729,285 | | | $ | 88,067,821 | | | $ | — | |
| (a) | Amounts are disclosed by continent to highlight the impact of time zone differences between local market close and the calculation of NAV. Security valuations are based on the principal exchange or system on which they are traded, which may differ from country of domicile noted in table. The Fund utilizes fair value model prices provided by an independent third party fair value service for certain international equity securities resulting in a Level 2 classification. |
| (b) | Amount shown represents unrealized gain (loss) at fiscal year end. |
GOLDMAN SACHS VARIABLE INSURANCE TRUST EQUITY FUNDS
Notes to Financial Statements (continued)
December 31, 2022
3. INVESTMENTS AND FAIR VALUE MEASUREMENTS (continued)
| | | | | | | | | | | | |
| | | |
| INTERNATIONAL EQUITY INSIGHTS FUND (continued) | | | | | | | | | |
| Derivative Type | | Level 1 | | | Level 2 | | | Level 3 | |
| | | |
| Assets(b) | | | | | | | | | | | | |
| Futures Contracts | | $ | 371 | | | $ | — | | | $ | — | |
| | | |
| Liabilities(b) | | | | | | | | | | | | |
| Futures Contracts | | $ | (25,203 | ) | | $ | — | | | $ | — | |
| | | |
| LARGE CAP VALUE FUND | | | | | | | | | |
| Investment Type | | Level 1 | | | Level 2 | | | Level 3 | |
| | | |
| Assets | | | | | | | | | | | | |
| Common Stock and/or Other Equity Investments(a) | | | | | | | | | | | | |
Europe | | $ | 9,919,504 | | | $ | — | | | $ | — | |
North America | | | 370,345,629 | | | | — | | | | — | |
| Investment Company | | | 394,821 | | | | — | | | | — | |
| | | |
| Total | | $ | 380,659,954 | | | $ | — | | | $ | — | |
| | | |
| MID CAP GROWTH FUND | | | | | | | | | |
| Investment Type | | Level 1 | | | Level 2 | | | Level 3 | |
| | | |
| Assets | | | | | | | | | | | | |
| Common Stock and/or Other Equity Investments(a) | | | | | | | | | | | | |
Europe | | $ | 256,847 | | | $ | — | | | $ | — | |
North America | | | 49,389,624 | | | | — | | | | — | |
| Investment Company | | | 2,865,404 | | | | — | | | | — | |
| | | |
| Total | | $ | 52,511,875 | | | $ | — | | | $ | — | |
| | | |
| MID CAP VALUE FUND | | | | | | | | | |
| Investment Type | | Level 1 | | | Level 2 | | | Level 3 | |
| | | |
| Assets | | | | | | | | | | | | |
| Common Stock and/or Other Equity Investments(a) | | | | | | | | | | | | |
Europe | | $ | 5,037,120 | | | $ | — | | | $ | — | |
North America | | | 395,293,701 | | | | — | | | | — | |
| Investment Company | | | 2,407,505 | | | | — | | | | — | |
| | | |
| Total | | $ | 402,738,326 | | | $ | — | | | $ | — | |
| (a) | Amounts are disclosed by continent to highlight the impact of time zone differences between local market close and the calculation of NAV. Security valuations are based on the principal exchange or system on which they are traded, which may differ from country of domicile noted in table. |
| (b) | Amount shown represents unrealized gain (loss) at fiscal year end. |
GOLDMAN SACHS VARIABLE INSURANCE TRUST EQUITY FUNDS
3. INVESTMENTS AND FAIR VALUE MEASUREMENTS (continued)
| | | | | | | | | | | | |
| | | |
| SMALL CAP EQUITY INSIGHTS FUND | | | | | | | | | |
| Investment Type | | Level 1 | | | Level 2 | | | Level 3 | |
| | | |
| Assets | | | | | | | | | | | | |
| Common Stock and/or Other Equity Investments(a) | | | | | | | | | | | | |
Africa | | $ | 176,318 | | | $ | — | | | $ | — | |
Asia | | | 610,944 | | | | — | | | | — | |
Europe | | | 2,560,012 | | | | — | | | | — | |
North America | | | 103,745,732 | | | | — | | | | — | |
South America | | | 125,429 | | | | — | | | | — | |
| Investment Company | | | 852,072 | | | | — | | | | — | |
| Securities Lending Reinvestment Vehicle | | | 1,025,843 | | | | — | | | | — | |
| | | |
| Total | | $ | 109,096,350 | | | $ | — | | | $ | — | |
| | | |
| Derivative Type | | | | | | | | | |
| | | |
| Liabilities(b) | | | | | | | | | | | | |
| Futures Contracts | | $ | (40,753 | ) | | $ | — | | | $ | — | |
| | | |
| STRATEGIC GROWTH FUND | | | | | | | | | |
| Investment Type | | Level 1 | | | Level 2 | | | Level 3 | |
| | | |
| Assets | | | | | | | | | | | | |
| Common Stock and/or Other Equity Investments(a) | | | | | | | | | | | | |
Europe | | $ | 5,540,382 | | | $ | — | | | $ | — | |
North America | | | 228,808,805 | | | | — | | | | — | |
| Investment Company | | | 2,849,066 | | | | — | | | | — | |
| | | |
| Total | | $ | 237,198,253 | | | $ | — | | | $ | — | |
| | | |
| U.S. EQUITY INSIGHTS FUND | | | | | | | | | |
| Investment Type | | Level 1 | | | Level 2 | | | Level 3 | |
| | | |
| Assets | | | | | | | | | | | | |
| Common Stock and/or Other Equity Investments(a) | | | | | | | | | | | | |
Asia | | $ | 1,050,425 | | | $ | — | | | $ | — | |
Europe | | | 3,690,584 | | | | — | | | | — | |
North America | | | 277,502,184 | | | | — | | | | — | |
| | | |
| Total | | $ | 282,243,193 | | | $ | — | | | $ | — | |
| | | |
| Derivative Type | | | | | | | | | |
| | | |
| Liabilities(b) | | | | | | | | | | | | |
| Futures Contracts | | $ | (16,178 | ) | | $ | — | | | $ | — | |
| (a) | Amounts are disclosed by continent to highlight the impact of time zone differences between local market close and the calculation of NAV. Security valuations are based on the principal exchange or system on which they are traded, which may differ from country of domicile noted in table. |
| (b) | Amount shown represents unrealized gain (loss) at fiscal year end. |
For further information regarding security characteristics, see the Schedules of Investments.
GOLDMAN SACHS VARIABLE INSURANCE TRUST EQUITY FUNDS
Notes to Financial Statements (continued)
December 31, 2022
4. INVESTMENTS IN DERIVATIVES
The following table sets forth, by certain risk types, the gross value of derivative contracts (not considered to be hedging instruments for accounting disclosure purposes) as of December 31, 2022. These instruments were used as part of the Funds’ investment strategies and to obtain and/or manage exposure related to the risks below. The values in the tables below exclude the effects of cash collateral received or posted pursuant to these derivative contracts, and therefore are not representative of the Funds’ net exposure.
| | | | | | | | | | | | | | |
| Fund | | Risk | | Statements of Assets and Liabilities | | Assets(a) | | | Statements of Assets and Liabilities | | Liabilities(a) | |
| Equity Index | | Equity | | | | $ | — | | | Variation margin on futures contracts | | $ | (16,431 | ) |
| International Equity Insights | | Equity | | Variation margin on futures contracts | | | 371 | | | Variation margin on futures contracts | | | (25,203 | ) |
| Small Cap Equity Insights | | Equity | | — | | | — | | | Variation margin on futures contracts | | | (40,753 | ) |
| U.S. Equity Insights | | Equity | | — | | | — | | | Variation margin on futures contracts | | | (16,178 | ) |
| (a) | Includes unrealized gain (loss) on futures contracts described in the Additional Investment Information sections of the Schedules of Investments. Only the variation margin as of December 31, 2022 is reported within the Statements of Assets and Liabilities. |
The following tables set forth, by certain risk types, the Funds’ gains (losses) related to these derivatives and their indicative volumes for the fiscal year ended December 31, 2022. These gains (losses) should be considered in the context that these derivative contracts may have been executed to create investment opportunities and/or economically hedge certain investments, and accordingly, certain gains (losses) on such derivative contracts may offset certain (losses) gains attributable to investments. These gains (losses) are included in “Net realized gain (loss)” or “Net change in unrealized gain (loss)” on the Statements of Operations:
Equity Index
| | | | | | | | |
| Risk | | Statement of Operations | | Net
Realized
Gain (Loss) | | Net Change in
Unrealized
Gain (Loss) | |
| | | |
| Equity | | Net realized gain (loss) from futures contracts/Net change in unrealized gain (loss) on futures contracts | | $(159,530) | | $ | (30,334 | ) |
International Equity Insights
| | | | | | | | |
| Risk | | Statement of Operations | | Net
Realized
Gain (Loss) | | Net Change in
Unrealized
Gain (Loss) | |
| | | |
| Equity | | Net realized gain (loss) from futures contracts/Net change in unrealized gain (loss) on futures contracts | | $(5,602) | | $ | (27,620 | ) |
Small Cap Equity Insights
| | | | | | | | |
| Risk | | Statement of Operations | | Net
Realized
Gain (Loss) | | Net Change in
Unrealized
Gain (Loss) | |
| | | |
| Equity | | Net realized gain (loss) from futures contracts/Net change in unrealized gain (loss) on futures contracts | | $(202,930) | | $ | (50,928 | ) |
U.S. Equity Insights
| | | | | | | | |
| Risk | | Statement of Operations | | Net
Realized
Gain (Loss) | | Net Change in
Unrealized
Gain (Loss) | |
| | | |
| Equity | | Net realized gain (loss) from futures contracts/Net change in unrealized gain (loss) on futures contracts | | $71,397 | | $ | (16,178 | ) |
GOLDMAN SACHS VARIABLE INSURANCE TRUST EQUITY FUNDS
4. INVESTMENTS IN DERIVATIVES (continued)
For the fiscal year ended December 31, 2022, the relevant values for each derivative type were as follows:
| | | | |
| | | Average Number
of Contracts(1) | |
| Fund | | Futures
Contracts | |
| Equity Index | | | 4 | |
| International Equity Insights | | | 23 | |
| Small Cap Equity Insights | | | 18 | |
| U.S. Equity Insights | | | 4 | |
| (1) | Amounts disclosed represent average number of contracts for futures contracts, based on absolute values, which is indicative of volume of this derivative type, for the months that the Fund held such derivatives during the fiscal year ended December 31, 2022. |
5. AGREEMENTS AND AFFILIATED TRANSACTIONS
A. Management Agreements — Under the Agreements, GSAM manages the Funds, subject to the general supervision of the Trustees.
As compensation for the services rendered pursuant to the Agreements, the assumption of the expenses related thereto and administration of the Funds’ business affairs, including providing facilities, GSAM is entitled to a management fee, accrued daily and paid monthly, equal to an annual percentage rate of each Fund’s average daily net assets.
For the fiscal year ended December 31, 2022, contractual and effective net management fees with GSAM were at the following rates:
| | | | | | | | | | | | | | | | | | | | | | | | | | | | |
| | | Contractual Management Rate | | | Effective
Rate | | | Effective Net
Management
Rate^ | |
| Fund | | First
$1 billion | | | Next
$1 billion | | | Next
$3 billion | | | Next
$3 billion | | | Over
$8 billion | |
| International Equity Insights | | | 0.81 | % | | | 0.73 | % | | | 0.69 | % | | | 0.68 | % | | | 0.67 | % | | | 0.81 | % | | | 0.80 | %*# |
| Large Cap Value | | | 0.72 | | | | 0.65 | | | | 0.62 | | | | 0.60 | | | | 0.59 | | | | 0.72 | | | | 0.68 | * |
| Mid Cap Growth | | | 0.87 | | | | 0.87 | | | | 0.78 | | | | 0.74 | | | | 0.73 | | | | 0.87 | | | | 0.81 | * |
| Mid Cap Value | | | 0.77 | | | | 0.77 | | | | 0.69 | | | | 0.66 | | | | 0.65 | | | | 0.77 | | | | 0.77 | |
| Small Cap Equity Insights | | | 0.70 | | | | 0.70 | | | | 0.63 | | | | 0.60 | | | | 0.59 | | | | 0.70 | | | | 0.70 | |
| Strategic Growth | | | 0.71 | | | | 0.64 | | | | 0.61 | | | | 0.59 | | | | 0.58 | | | | 0.71 | | | | 0.71 | |
| U.S. Equity Insights | | | 0.62 | | | | 0.59 | | | | 0.56 | | | | 0.55 | | | | 0.54 | | | | 0.62 | | | | 0.54 | * |
| ^ | Effective Net Management Rate includes the impact of management fee waivers of affiliated Underlying Funds, if any. The Effective Net Management Rate may not correlate to the Contractual Management Rate as a result of management fee waivers that may be in effect from time to time. |
| * | GSAM agreed to waive a portion of its management fee in order to achieve an effective net management rate as defined in the Funds’ most recent prospectus. This waiver will remain in effect through at least April 29, 2023, and prior to such date GSAM may not terminate the arrangement without approval of the Trustees. |
| # | GSAM began waiving management fees on International Equity Insights to 0.79% effective April 29, 2022. |
The International Equity Insights, Large Cap Value, Mid Cap Growth, Mid Cap Value, Small Cap Equity Insights, Strategic Growth and U.S. Equity Insights Funds invest in Institutional Shares of the Goldman Sachs Financial Square Government Fund, which is an affiliated Underlying Fund. GSAM has agreed to waive a portion of its management fee payable by the Funds in an amount equal to the management fee it earns as an investment adviser to the affiliated Underlying Fund in which the Funds invest, except those management fees it earns from the Funds’ investments of cash collateral received in connection with securities lending transactions in the Goldman Sachs Financial Square Government Fund. For the fiscal year ended December 31, 2022, with respect
GOLDMAN SACHS VARIABLE INSURANCE TRUST EQUITY FUNDS
Notes to Financial Statements (continued)
December 31, 2022
5. AGREEMENTS AND AFFILIATED TRANSACTIONS (continued)
to the Funds’ investments in an affiliated Underlying Fund GSAM waived $3,666, $3,754, $8,717, $1,403, and $5,817 of the Large Cap Value, Mid Cap Growth, Mid Cap Value, Small Cap Equity Insights, and Strategic Growth Funds’ management fees, respectively.
The Agreement for the Equity Index Fund provides for a contractual management fee at an annual rate equal to 0.30% of the Fund’s average daily net assets. The Investment Adviser has agreed to waive a portion of the management fee equal to 0.09% of the annual contractual rate applicable to the Equity Index Fund’s average daily net assets between $0 and $400 million and 0.10% of the annual contractual rate applicable to the Fund’s average daily net assets in excess of $400 million. This management fee waiver will remain in effect through at least April 29, 2023, and prior to such date the Investment Adviser may not terminate the arrangement without the approval of the Board of Trustees. For the fiscal year ended December 31, 2022, the Fund paid GSAM an Effective Net Management Rate of 0.21%.
As authorized by the Agreement for the Equity Index Fund, GSAM has entered into a Sub-advisory Agreement with SSgA Funds Management, Inc. (“SSgA”) which serves as the sub-adviser to the Fund and provides the day-to-day advice regarding the Fund’s portfolio transactions. As compensation for its services, SSgA is entitled to a fee, accrued daily and paid monthly by GSAM, at the following annual rates of the Fund’s average daily net assets: 0.03% on the first $50 million, 0.02% on the next $200 million, 0.01% on the next $750 million and 0.008% over $1 billion. The effective Sub-advisory fee was 0.02% for the fiscal year ended December 31, 2022.
B. Distribution and/or Service (12b-1) Plans — The Trust, on behalf of Service Shares of each Fund, has adopted a Distribution and Service Plan subject to Rule 12b-1 under the Act. Under the Distribution and Service Plan, Goldman Sachs, which serves as distributor (the “Distributor”), is entitled to a fee accrued daily and paid monthly for distribution services and personal and account maintenance services, which may then be paid by Goldman Sachs to authorized dealers, equal to, on an annual basis, 0.25% of the Funds’ average daily net assets attributable to Service Shares. For the fiscal year ended December 31, 2022 for the U.S. Equity Insights Fund, Goldman Sachs agreed to waive distribution and services fees so as not to exceed an annual rate of 0.21% of average daily net assets of the Fund. For the fiscal year ended December 31, 2022 for the Mid Cap Growth Fund, Goldman Sachs agreed to waive distribution and services fees so as not to exceed an annual rate of 0.15% of average daily net assets of the Fund. These distribution and service fee waivers will remain in place through at least April 29, 2023, and prior to such date Goldman Sachs may not terminate the arrangement without the approval of the Trustees.
C. Transfer Agency Agreement — Goldman Sachs also serves as the transfer agent of the Funds for a fee pursuant to the Transfer Agency Agreement. The fees charged for such transfer agency services are accrued daily and paid monthly at an annual rate of 0.02% of the average daily net assets of Institutional and Service Shares. Goldman Sachs has agreed to waive its transfer agency fee attributable to the Service Shares of the Large Cap Value Fund. This arrangement will remain in place through at least April 29, 2023, and prior to such date Goldman Sachs may not terminate the arrangement without approval of the Board of Trustees.
D. Other Expense Agreements and Affiliated Transactions — GSAM has agreed to reduce or limit certain “Other Expenses” of the Funds (excluding acquired fund fees and expenses, transfer agency fees and expenses, service fees and shareholder administration fees (as applicable), taxes, interest, brokerage fees, expenses of shareholder meetings, litigation and indemnification, and extraordinary expenses) to the extent such expenses exceed, on an annual basis, a percentage rate of the average daily net assets of each Fund. Such Other Expense reimbursements, if any, are accrued daily and paid monthly. In addition, the Funds are not obligated to reimburse GSAM for prior fiscal year expense reimbursements, if any. The Other Expense limitations as an annual percentage rate of average daily net assets for the Equity Index, International Equity Insights, Large Cap Value, Mid Cap Growth, Mid Cap Value, Small Cap Equity Insights, Strategic Growth and U.S. Equity Insights Funds are 0.004%, 0.004%, 0.004%, 0.004%, 0.054%, 0.094%, 0.014% and 0.004%, respectively. Prior to April 29, 2022, the Other Expense limitation was 0.044% for the International Equity Insights Fund. These Other Expense limitations will remain in place through at least April 29, 2023, and prior to such date GSAM may not terminate the arrangements without the approval of the Trustees. In
GOLDMAN SACHS VARIABLE INSURANCE TRUST EQUITY FUNDS
5. AGREEMENTS AND AFFILIATED TRANSACTIONS (continued)
addition, the Funds have entered into certain offset arrangements with the custodian and the transfer agent, which may result in a reduction of the Funds’ expenses and are received irrespective of the application of the “Other Expense” limitations described above.
For the fiscal year ended December 31, 2022, these expense reductions, including any fee waivers and Other Expense reimbursements, were as follows:
| | | | | | | | | | | | | | | | | | | | |
| Fund | | Management
Fee Waiver | | | Distribution and
Service Fee Waiver | | | Transfer Agency
Waiver/Credits | | | Other Expense
Reimbursement | | | Total Expense
Reductions | |
| Equity Index | | $ | 162,327 | | | $ | — | | | $ | — | | | $ | 242,412 | | | $ | 404,739 | |
| International Equity Insights | | | 12,398 | | | | — | | | | — | | | | 141,072 | | | | 153,470 | |
| Large Cap Value | | | 169,945 | | | | — | | | | 52,068 | | | | 221,664 | | | | 443,677 | |
| Mid Cap Growth | | | 37,698 | | | | 55,463 | | | | — | | | | 205,069 | | | | 298,230 | |
| Mid Cap Value | | | 8,717 | | | | — | | | | — | | | | 57,921 | | | | 66,638 | |
| Small Cap Equity Insights | | | 1,403 | | | | — | | | | — | | | | 161,976 | | | | 163,379 | |
| Strategic Growth | | | 5,817 | | | | — | | | | — | | | | 203,925 | | | | 209,742 | |
| U.S. Equity Insights | | | 253,572 | | | | 19,505 | | | | — | | | | 233,285 | | | | 506,362 | |
E. Line of Credit Facility — As of December 31, 2022, the Funds participated in a $1,250,000,000 committed, unsecured revolving line of credit facility (the “facility”) together with other funds of the Trust and certain registered investment companies having management agreements with GSAM or its affiliates. This facility is to be used for temporary emergency purposes, or to allow for an orderly liquidation of securities to meet redemption requests. The interest rate on borrowings is based on the federal funds rate. The facility also requires a fee to be paid by the Funds based on the amount of the commitment that has not been utilized. For the fiscal year ended December 31, 2022, the Funds did not have any borrowings under the facility. Prior to April 22, 2022, the facility was $1,000,000,000.
F. Other Transactions with Affiliates — For the fiscal year ended December 31, 2022, Goldman Sachs earned $1,440 and $928 in brokerage commissions from portfolio transactions, including futures transactions executed with Goldman Sachs as the Futures Commission Merchant, on behalf of the Large Cap Value and Mid Cap Growth Funds, respectively.
The following table provides information about the investment in shares of issuers of which a Fund is an affiliate as of and for the fiscal year ended December 31, 2022:
| | | | | | | | | | | | | | | | | | | | | | | | | | | | | | | | | | |
| Fund | | Name of Affiliated Issuer | | Beginning
Value as of
December 31, 2021 | | | Purchases
at Cost | | | Proceeds
from Sales | | | Net
Realized
Gain
(Loss) | | | Change in
Unrealized
Appreciation
(Depreciation) | | | Ending
Value as of
December 31,
2022 | | | Shares as of
December 31, 2022 | | | Dividend
Income | |
| Equity Index | | Goldman Sachs Group, Inc. (The) | | $ | 711,926 | | | $ | — | | | $ | (53,554 | ) | | $ | 24,205 | | | $ | (98,831 | ) | | $ | 583,746 | | | | 1,700 | | | $ | 15,832 | |
GOLDMAN SACHS VARIABLE INSURANCE TRUST EQUITY FUNDS
Notes to Financial Statements (continued)
December 31, 2022
5. AGREEMENTS AND AFFILIATED TRANSACTIONS (continued)
The following table provides information about the Funds’ investment in the Goldman Sachs Financial Square Government Fund as of and for the fiscal year ended December 31, 2022:
| | | | | | | | | | | | | | | | | | | | | | | | |
| Fund | | Beginning
Value as of
December 31, 2021 | | | Purchases
at Cost | | | Proceeds
from Sales | | | Ending
Value as of
December 31, 2022 | | | Shares as of
December 31, 2022 | | | Dividend
Income | |
| International Equity Insights | | $ | — | | | $ | 7,401,345.00 | | | $ | (7,401,345.00 | ) | | $ | — | | | | — | | | $ | 312.00 | |
| Large Cap Value | | | 2,751,464 | | | | 66,763,577 | | | | (69,120,220 | ) | | | 394,821 | | | | 394,821.00 | | | | 32,584 | |
| Mid Cap Growth | | | 933,690 | | | | 18,788,670 | | | | (16,856,956 | ) | | | 2,865,404 | | | | 2,865,404.00 | | | | 42,543 | |
| Mid Cap Value | | | 4,761,405 | | | | 136,843,157 | | | | (139,197,057 | ) | | | 2,407,505 | | | | 2,407,505.00 | | | | 108,363 | |
| Small Cap Equity Insights | | | — | | | | 20,014,170 | | | | (19,162,098 | ) | | | 852,072 | | | | 852,072.00 | | | | 14,945 | |
| Strategic Growth | | | 4,509,290 | | | | 40,774,048 | | | | (42,434,272 | ) | | | 2,849,066 | | | | 2,849,066.00 | | | | 64,408 | |
| U.S. Equity Insights | | | — | | | | 4,853,670 | | | | (4,853,670 | ) | | | — | | | | — | | | | 116 | |
6. PORTFOLIO SECURITIES TRANSACTIONS
The cost of purchases and proceeds from sales and maturities of long-term securities for the fiscal year ended December 31, 2022, were as follows:
| | | | | | | | | | | | | | | | | | | | | | | | |
| Fund | | | | | | | | | | | | | | Purchases | | | Sales and
Maturities | |
| Equity Index | | | | | | | | | | | | | | | | | | $ | 2,321,694 | | | $ | 20,696,435 | |
| International Equity Insights | | | | | | | | | | | | | | | | | | | 157,517,843 | | | | 153,373,467 | |
| Large Cap Value | | | | | | | | | | | | | | | | | | | 189,618,468 | | | | 257,535,781 | |
| Mid Cap Growth | | | | | | | | | | | | | | | | | | | 32,779,554 | | | | 40,412,172 | |
| Mid Cap Value | | | | | | | | | | | | | | | | | | | 328,048,849 | | | | 412,561,443 | |
| Small Cap Equity Insights | | | | | | | | | | | | | | | | | | | 188,421,000 | | | | 183,669,058 | |
| Strategic Growth | | | | | | | | | | | | | | | | | | | 81,736,304 | | | | 166,466,310 | |
| U.S. Equity Insights | | | | | | | | | | | | | | | | | | | 642,206,371 | | | | 661,285,524 | |
7. SECURITIES LENDING
The Large Cap Value, Mid Cap Growth, Mid Cap Value and Strategic Growth Funds may lend their securities through a securities lending agent, the Bank of New York Mellon (“BNYM”), to certain qualified borrowers. Pursuant to exemptive relief granted by the Securities and Exchange Commission (“SEC”) and the terms and conditions contained therein, the Equity Index, International Equity Insights, Small Cap Equity Insights and U. S. Equity Insights Funds may lend their securities through a securities lending agent, Goldman Sachs Agency Lending (“GSAL”), a wholly-owned subsidiary of Goldman Sachs, to certain qualified borrowers including Goldman Sachs and affiliates. In accordance with the Funds’ securities lending procedures, the Funds receive cash collateral at least equal to the market value of the securities on loan. The market value of the loaned securities is determined at the
GOLDMAN SACHS VARIABLE INSURANCE TRUST EQUITY FUNDS
7. SECURITIES LENDING (continued)
close of business of the Funds, at their last sale price or official closing price on the principal exchange or system on which they are traded, and any additional required collateral is delivered to the Funds on the next business day. As with other extensions of credit, the Funds may experience delay in the recovery of their securities or incur a loss should the borrower of the securities breach its agreement with the Funds or become insolvent at a time when the collateral is insufficient to cover the cost of repurchasing securities on loan. Dividend income received from securities on loan may not be subject to withholding taxes and therefore withholding taxes paid may differ from the amounts listed in the Statements of Operations. Loans of securities are terminable at any time and as such 1) the remaining contractual maturities of the outstanding securities lending transactions are considered to be overnight and continuous and 2) the borrower, after notice, is required to return borrowed securities within the standard time period for settlement of securities transactions.
The Equity Index, International Equity Insights, Large Cap Value, Mid Cap Growth, Mid Cap Value, Small Cap Equity Insights, Strategic Growth and U.S. Equity Insights Funds invest the cash collateral received in connection with securities lending transactions in the Goldman Sachs Financial Square Government Fund (“Government Money Market Fund”), an affiliated series of the Goldman Sachs Trust. The Government Money Market Fund is registered under the Act as an open end investment company, is subject to Rule 2a-7 under the Act, and is managed by GSAM, for which GSAM may receive a management fee of up to 0.16% on an annualized basis of the average daily net assets of the Government Money Market Fund.
In the event of a default by a borrower with respect to any loan, GSAL will, and BNYM may, exercise any and all remedies provided under the applicable borrower agreement to make the Funds whole. These remedies include purchasing replacement securities by applying the collateral held from the defaulting broker against the purchase cost of the replacement securities. If GSAL or BNYM are unable to purchase replacement securities, GSAL and/or BNYM will indemnify the Funds by paying the Funds an amount equal to the market value of the securities loaned minus the value of cash collateral received from the borrower for the loan, subject to an exclusion for any shortfalls resulting from a loss of value in such cash collateral due to reinvestment risk. The Funds’ master netting agreements with certain borrowers provide the right, in the event of a default (including bankruptcy or insolvency), for the non-defaulting party to liquidate the collateral and calculate net exposure to the defaulting party or request additional collateral. However, in the event of a default by a borrower, a resolution authority could determine that such rights are not enforceable due to the restrictions or prohibitions against the right of set-off that may be imposed in accordance with a particular jurisdiction’s bankruptcy or insolvency laws. The Funds’ loaned securities were all subject to enforceable Securities Lending Agreements and the value of the collateral was at least equal to the value of the cash received. The amounts of the Funds’ overnight and continuous agreements, which represent the gross amounts of recognized liabilities for securities lending transactions outstanding as of December 31, 2022, are disclosed as “Payable upon return of securities loaned” on the Statements of Assets and Liabilities, where applicable.
Each of the Funds, GSAL and BNYM received compensation relating to the lending of the Funds’ securities. The amounts earned, if any, by the Funds’ for the fiscal year ended December 31, 2022, are reported under Investment Income on the Statements of Operations.
The table below details securities lending activity with affiliates of Goldman Sachs:
| | | | | | | | | | | | |
| | | For the fiscal year ended December 31, 2022 | | | Amounts payable to
Goldman Sachs Upon
Return of Securities Loaned
as of December 31, 2022 | |
| Fund | | Earnings of GSAL Relating
to Securities Loaned | | | Amounts Received by
the Funds from Lending
to Goldman Sachs | |
| Equity Index | | $ | 5 | | | $ | 20 | | | $ | — | |
| International Equity Insights | | | 2,111 | | | | — | | | | — | |
| Small Cap Equity Insights | | | 5,412 | | | | 6,832 | | | | 122,851 | |
| U.S. Equity Insights | | | 12 | | | | — | | | | — | |
GOLDMAN SACHS VARIABLE INSURANCE TRUST EQUITY FUNDS
Notes to Financial Statements (continued)
December 31, 2022
7. SECURITIES LENDING (continued)
The following table provides information about the Funds’ investment in the Government Money Market Fund for the fiscal year ended December 31, 2022:
| | | | | | | | | | | | | | | | |
| Fund | | Beginning
Value as of
December 31, 2021 | | | Purchases
at Cost | | | Proceeds
from Sales | | | Ending Value as of
December 31, 2022 | |
| Equity Index | | $ | — | | | $ | 616,980 | | | $ | (616,980 | ) | | $ | — | |
| International Equity Insights | | | — | | | | 14,009,072 | | | | (13,842,680 | ) | | | 166,392 | |
| Large Cap Value | | | — | | | | 5,872,633 | | | | (5,872,633 | ) | | | — | |
| Mid Cap Growth | | | 688,836 | | | | 6,903,891 | | | | (7,592,727 | ) | | | — | |
| Mid Cap Value | | | — | | | | 13,997,207 | | | | (13,997,207 | ) | | | — | |
| Small Cap Equity Insights | | | 1,845,983 | | | | 17,778,838 | | | | (18,598,978 | ) | | | 1,025,843 | |
| Strategic Growth | | | 858,041 | | | | 5,245,409 | | | | (6,103,450 | ) | | | — | |
| U.S. Equity Insights | | | — | | | | 1,152,350 | | | | (1,152,350 | ) | | | — | |
8. TAX INFORMATION
The tax character of distributions paid during the fiscal year ended December 31, 2022 was as follows:
| | | | | | | | | | | | | | | | |
| | | Equity Index | | | International Equity Insights | | | Large Cap Value | | | Mid Cap Growth | |
| Distributions paid from: | | | | | | | | | | | | | | | | |
Ordinary income | | $ | 1,927,957 | | | $ | 3,021,007 | | | $ | 5,976,350 | | | $ | 55,910 | |
Net long-term capital gains | | | 11,510,542 | | | | — | | | | 36,997,158 | | | | 1,887,780 | |
| Total taxable distributions | | $ | 13,438,499 | | | $ | 3,021,007 | | | $ | 42,973,508 | | | $ | 1,943,690 | |
| | | | | | | | | | | | | | | | |
| | | | |
| | | Mid Cap Value | | | Small Cap Equity Insights | | | Strategic Growth | | | U.S. Equity Insights | |
| Distributions paid from: | | | | | | | | | | | | | | | | |
Ordinary income | | $ | 6,310,139 | | | $ | 366,699 | | | $ | 2,117,812 | | | $ | 2,459,145 | |
Net long-term capital gains | | | 59,152,031 | | | | 1,187,594 | | | | 44,319,555 | | | | 1,599,621 | |
| Total taxable distributions | | $ | 65,462,170 | | | $ | 1,554,293 | | | $ | 46,437,367 | | | $ | 4,058,766 | |
The tax character of distributions paid during the fiscal year ended December 31, 2021 was as follows:
| | | | | | | | | | | | | | | | |
| | | Equity Index | | | International Equity Insights | | | Large Cap Value | | | Mid Cap Growth | |
| Distributions paid from: | | | | | | | | | | | | | | | | |
Ordinary income | | $ | 2,333,133 | | | $ | 3,833,918 | | | $ | 26,797,602 | | | $ | 4,251,002 | |
Net long-term capital gains | | | 13,717,101 | | | | 1,687,425 | | | | 36,936,613 | | | | 9,192,251 | |
| Total taxable distributions | | $ | 16,050,234 | | | $ | 5,521,343 | | | $ | 63,734,215 | | | $ | 13,443,253 | |
GOLDMAN SACHS VARIABLE INSURANCE TRUST EQUITY FUNDS
8. TAX INFORMATION (continued)
| | | | | | | | | | | | | | | | |
| | | Mid Cap Value | | | Small Cap Equity Insights | | | Strategic Growth | | | U.S. Equity Insights | |
| Distributions paid from: | | | | | | | | | | | | | | | | |
Ordinary income | | $ | 44,797,367 | | | $ | 18,532,560 | | | $ | 13,427,087 | | | $ | 50,715,107 | |
Net long-term capital gains | | | 28,620,079 | | | | 10,074,781 | | | | 39,998,510 | | | | 34,647,431 | |
| Total taxable distributions | | $ | 73,417,446 | | | $ | 28,607,341 | | | $ | 53,425,597 | | | $ | 85,362,538 | |
As of December 31, 2022, the components of accumulated earnings (losses) on a tax-basis were as follows:
| | | | | | | | | | | | | | | | |
| | | Equity Index | | | International Equity Insights | | | Large Cap Value | | | Mid Cap Growth | |
Undistributed ordinary income — net | | $ | 303,458 | | | $ | 257,238 | | | $ | 863,067 | | | $ | — | |
| Undistributed long-term capital gains | | | 1,375,000 | | | | — | | | | 11,134,752 | | | | — | |
| Total undistributed earnings | | $ | 1,678,458 | | | $ | 257,238 | | | $ | 11,997,819 | | | $ | — | |
Capital loss carryforwards | | | | | | | | | | | | | | | | |
Perpetual short-term | | $ | — | | | $ | (11,394,712 | ) | | $ | — | | | $ | (184,177 | ) |
| Total capital loss carryforwards | | $ | — | | | $ | (11,394,712 | ) | | $ | — | | | $ | (184,177 | ) |
| Timing differences (Real Estate Investment Trusts, late year ordinary loss deferral, post October loss deferral, and straddle loss deferrals) | | $ | 52 | | | $ | (181,062 | ) | | $ | 54,783 | | | $ | (102,750 | ) |
| Unrealized gains — net | | | 111,509,129 | | | | 1,853,116 | | | | 41,969,970 | | | | 4,937,127 | |
| Total accumulated earnings (losses) — net | | $ | 113,187,639 | | | $ | (9,465,420 | ) | | $ | 54,022,572 | | | $ | 4,650,200 | |
| | | | | | | | | | | | | | | | |
| | | Mid Cap Value | | | Small Cap Equity Insights | | | Strategic Growth | | | U.S. Equity Insights | |
Undistributed ordinary income— net | | $ | 1,220,127 | | | $ | 441,427 | | | $ | — | | | $ | 481,712 | |
| Undistributed long-term capital gains | | | 486,918 | | | | — | | | | 2,137,768 | | | | — | |
| Total undistributed earnings | | $ | 1,707,045 | | | $ | 441,427 | | | $ | 2,137,768 | | | $ | 481,712 | |
Capital loss carryforwards | | | | | | | | | | | | | | | | |
Perpetual short-term | | $ | — | | | $ | (11,118,251 | ) | | $ | — | | | $ | (10,171,033 | ) |
| Total capital loss carryforwards | | $ | — | | | $ | (11,118,251 | ) | | $ | — | | | $ | (10,171,033 | ) |
| Timing differences (Real Estate Investment Trusts, late year ordinary loss deferral, post October loss deferral, and straddle loss deferrals) | | $ | (861,362 | ) | | $ | (2,297,849 | ) | | $ | (532,698 | ) | | $ | 4,606 | |
| Unrealized gain (loss) — net | | | 46,475,534 | | | | (715,554 | ) | | | 99,263,583 | | | | 30,760,355 | |
| Total accumulated earnings (losses) — net | | $ | 47,321,217 | | | $ | (13,690,227 | ) | | $ | 100,868,653 | | | $ | 21,075,640 | |
GOLDMAN SACHS VARIABLE INSURANCE TRUST EQUITY FUNDS
Notes to Financial Statements (continued)
December 31, 2022
8. TAX INFORMATION (continued)
As of December 31, 2022, the Funds’ aggregate security unrealized gains and losses based on cost for U.S. federal income tax purposes were as follows:
| | | | | | | | | | | | | | | | |
| | | Equity Index | | | International Equity Insights | | | Large Cap Value | | | Mid Cap Growth | |
| Tax cost | | $ | 49,140,122 | | | $ | 89,944,513 | | | $ | 338,689,871 | | | $ | 47,574,748 | |
Gross unrealized gain | | | 115,532,895 | | | | 6,760,372 | | | | 69,744,439 | | | | 8,971,113 | |
| Gross unrealized loss | | | (4,023,766 | ) | | | (4,907,256 | ) | | | (27,774,469 | ) | | | (4,033,986 | ) |
| Net unrealized gain (loss) | | $ | 111,509,129 | | | $ | 1,853,116 | | | $ | 41,969,970 | | | $ | 4,937,127 | |
| | | | | | | | | | | | | | | | |
| | | Mid Cap Value | | | Small Cap Equity Insights | | | Strategic Growth | | | U.S. Equity Insights | |
| Tax cost | | $ | 356,262,792 | | | $ | 109,771,151 | | | $ | 137,934,670 | | | $ | 251,466,660 | |
Gross unrealized gain | | | 63,766,574 | | | | 10,994,642 | | | | 110,281,429 | | | | 43,146,803 | |
| Gross unrealized loss | | | (17,291,040 | ) | | | (11,710,196 | ) | | | (11,017,846 | ) | | | (12,386,448 | ) |
| Net unrealized gain (loss) | | $ | 46,475,534 | | | $ | (715,554 | ) | | $ | 99,263,583 | | | $ | 30,760,355 | |
The difference between GAAP-basis and tax-basis unrealized gains (losses) is attributable primarily to wash sales, net mark to market gains (losses) on regulated futures and foreign currency contracts, and differences in the tax treatment of real estate investment trust investments and passive foreign investment company investments.
The Mid Cap Growth Fund reclassed $197,480 and Strategic Growth Fund reclassed $682,580 from paid-in capital to distributable earnings. In order to present certain components of the Funds’ capital accounts on a tax-basis, certain reclassifications have been recorded to the Funds’ accounts. These reclassifications have no impact on the net asset value of the Funds and result primarily from taxable overdistributions and net operating losses.
GSAM has reviewed the Funds’ tax positions for all open tax years (the current and prior three years, as applicable) and has concluded that no provision for income tax is required in the Funds’ financial statements. Such open tax years remain subject to examination and adjustment by tax authorities.
9. OTHER RISKS
The Funds’ risks include, but are not limited to, the following:
Derivatives Risk — The Funds’ use of derivatives and other similar instruments (collectively referred to in this paragraph as “derivatives”) may result in loss, including due to adverse market movements. Derivatives, which may pose risks in addition to and greater than those associated with investing directly in securities, currencies or other assets and instruments, may increase market exposure and be illiquid or less liquid, volatile, difficult to price and leveraged so that small changes in the value of the underlying assets or instruments may produce disproportionate losses to the Funds. Certain derivatives are also subject to counterparty risk, which is the risk that the other party in the transaction will not, or lacks the capacity or authority to, fulfill its contractual obligations, liquidity risk, which includes the risk that the Funds will not be able to exit the derivative when it is advantageous to do so, and risks arising from margin requirements, which include the risk that the Funds will be required to pay additional margin or set aside additional collateral to maintain open derivative positions. The use of derivatives is a highly specialized activity that involves investment techniques and risks different from those associated with investments in more traditional securities and instruments. Losses from derivatives can also result from a lack of correlation between changes in the value of derivative instruments and the portfolio assets (if any) being hedged.
Foreign and Emerging Countries Risk — Investing in foreign markets may involve special risks and considerations not typically associated with investing in the U.S. Foreign securities may be subject to risk of loss because of more or less foreign government regulation; less public information; less stringent investor protections; less stringent accounting, corporate governance,
GOLDMAN SACHS VARIABLE INSURANCE TRUST EQUITY FUNDS
9. OTHER RISKS (continued)
financial reporting and disclosure standards; and less economic, political and social stability in the countries in which a Fund invests. The imposition of sanctions, exchange controls (including repatriation restrictions), confiscation of assets and property, trade restrictions (including tariffs) and other government restrictions by the U.S. or other governments, or from problems in registration, settlement or custody, may also result in losses. The type and severity of sanctions and other similar measures, including counter sanctions and other retaliatory actions, that may be imposed could vary broadly in scope, and their impact is impossible to predict. For example, the imposition of sanctions and other similar measures could, among other things, cause a decline in the value and/or liquidity of securities issued by the sanctioned country or companies located in or economically tied to the sanctioned country and increase market volatility and disruption in the sanctioned country and throughout the world. Sanctions and other similar measures could limit or prevent a Fund from buying and selling securities (in the sanctioned country and other markets), significantly delay or prevent the settlement of securities transactions, and significantly impact a Fund’s liquidity and performance. Foreign risk also involves the risk of negative foreign currency exchange rate fluctuations, which may cause the value of securities denominated in such foreign currency (or other instruments through which a Fund has exposure to foreign currencies) to decline in value. Currency exchange rates may fluctuate significantly over short periods of time. To the extent that a Fund also invests in securities of issuers located in, or economically tied to, emerging markets, these risks may be more pronounced.
Foreign Custody Risk — A Fund invests in foreign securities, and as such the Fund may hold such securities and cash with foreign banks, agents, and securities depositories appointed by the Fund’s custodian (each a “Foreign Custodian”). Some foreign custodians may be recently organized or new to the foreign custody business. In some countries, Foreign Custodians may be subject to little or no regulatory oversight over, or independent evaluation of, their operations. Further, the laws of certain countries may place limitations on a Fund’s ability to recover its assets if a Foreign Custodian enters bankruptcy. Investments in emerging markets may be subject to even greater custody risks than investments in more developed markets. Custody services in emerging market countries are very often undeveloped and may be considerably less well regulated than in more developed countries, and thus may not afford the same level of investor protection as would apply in developed countries.
Investments in Other Investment Companies Risk — As a shareholder of another investment company, a Fund will indirectly bear its proportionate share of any net management fees and other expenses paid by such other investment companies, in addition to the fees and expenses regularly borne by the Fund.
Large Shareholder Transactions Risk — A Fund may experience adverse effects when certain large shareholders, such as other funds, institutional investors (including those trading by use of non-discretionary mathematical formulas), financial intermediaries (who may make investment decisions on behalf of underlying clients and/or include a Fund in their investment model), individuals, accounts and Goldman Sachs affiliates, purchase or redeem large amounts of shares of a Fund. Such large shareholder redemptions, which may occur rapidly or unexpectedly, may cause a Fund to sell portfolio securities at times when it would not otherwise do so, which may negatively impact a Fund’s NAV and liquidity. These transactions may also accelerate the realization of taxable income to shareholders if such sales of investments resulted in gains, and may also increase transaction costs. In addition, a large redemption could result in a Fund’s current expenses being allocated over a smaller asset base, leading to an increase in the Fund’s expense ratio. Similarly, large Fund share purchases may adversely affect a Fund’s performance to the extent that the Fund is delayed in investing new cash or otherwise maintains a larger cash position than it ordinarily would.
Liquidity Risk — A Fund may make investments that are illiquid or that may become less liquid in response to market developments or adverse investor perceptions. Illiquid investments may be more difficult to value. Liquidity risk may also refer to the risk that a Fund will not be able to pay redemption proceeds within the allowable time period or without significant dilution to remaining investors’ interests because of unusual market conditions, an unusually high volume of redemption requests, or other reasons. To meet redemption requests, a Fund may be forced to sell investments at an unfavorable time and/or under unfavorable conditions. If a Fund is forced to sell securities at an unfavorable time and/or under unfavorable conditions, such sales may adversely affect the Fund’s NAV and dilute remaining investors’ interests. Liquidity risk may be the result of, among other things, the reduced number and capacity of traditional market participants to make a market in fixed income securities or the lack of an active market. The potential for liquidity risk may be magnified by a rising interest rate environment or other circumstances where
GOLDMAN SACHS VARIABLE INSURANCE TRUST EQUITY FUNDS
Notes to Financial Statements (continued)
December 31, 2022
9. OTHER RISKS (continued)
investor redemptions from fixed income funds may be higher than normal, potentially causing increased supply in the market due to selling activity. These risks may be more pronounced in connection with a Fund’s investments in securities of issuers located in emerging market countries. Redemptions by large shareholders may have a negative impact on a Fund’s liquidity.
Market and Credit Risks — In the normal course of business, a Fund trades financial instruments and enters into financial transactions where risk of potential loss exists due to changes in the market (market risk). The value of the securities in which a Fund invests may go up or down in response to the prospects of individual companies, particular sectors or governments and/or general economic conditions throughout the world due to increasingly interconnected global economies and financial markets. Events such as war, acts of terrorism, social unrest, natural disasters, the spread of infectious illness or other public health threats could also significantly impact a Fund and its investments. Additionally, a Fund may also be exposed to credit risk in the event that an issuer or guarantor fails to perform or that an institution or entity with which the Fund has unsettled or open transactions defaults.
Non-Diversification Risk — The Strategic Growth Fund is non-diversified, meaning that it is permitted to invest a larger percentage of its assets in one or more issuers or in fewer issuers than diversified mutual funds. Thus, the Fund may be more susceptible to adverse developments affecting any single issuer held in its portfolio, and may be more susceptible to greater losses because of these developments.
10. IDEMNIFICATIONS
Under the Trust’s organizational documents, its Trustees, officers, employees and agents are indemnified, to the extent permitted by the Act and state law, against certain liabilities that may arise out of performance of their duties to the Funds. Additionally, in the course of business, the Funds enter into contracts that contain a variety of indemnification clauses. The Funds’ maximum exposure under these arrangements is unknown, as this would involve future claims that may be made against the Funds that have not yet occurred. However, GSAM believes the risk of loss under these arrangements to be remote.
11. SUBSEQUENT EVENTS
At a meeting held on December 13-14, 2022, upon the recommendation of Goldman Sachs Asset Management, L.P., the Board approved a proposal to liquidate the Goldman Sachs Equity Index Fund (the “Fund”), a series of the Trust. The Fund will be liquidated on or about April 21, 2023 (the “Liquidation Date”), pursuant to a Plan of Liquidation approved by the Board. The Liquidation Date may be changed without notice at the discretion of the Trust’s officers. As such, shares of the Fund were no longer be available for purchase by new insurance company separate account or other shareholders as of the close of business on January 16, 2023. Existing variable annuity and variable insurance contract owners and others who are shareholders of the Fund may continue to purchase shares of the Fund until April 18, 2023. To the extent there are any dividend or distribution payments made prior to the Liquidation Date, they will continue to be paid either in cash or in additional shares of the Fund, depending on each shareholder’s current election, as disclosed in the Prospectus.
All other subsequent events after the Statements of Assets and Liabilities date have been evaluated, and GSAM has concluded that there is no impact requiring adjustment or disclosure in the financial statements.
GOLDMAN SACHS VARIABLE INSURANCE TRUST EQUITY FUNDS
12. SUMMARY OF SHARE TRANSACTIONS
Share activity is as follows:
| | | | | | | | | | | | | | | | |
| | | Equity Index Fund | |
| | | For the Fiscal Year Ended
December 31, 2022 | | | For the Fiscal Year Ended
December 31, 2021 | |
| | | Shares | | | Dollars | | | Shares | | | Dollars | |
| Service Shares | | | | | | | | | | | | | | | | |
| Shares sold | | | 43,437 | | | $ | 849,405 | | | | 361,708 | | | $ | 8,243,921 | |
| Reinvestment of distributions | | | 747,414 | | | | 13,438,499 | | | | 720,711 | | | | 16,050,234 | |
| Shares redeemed | | | (1,081,712 | ) | | | (21,222,827 | ) | | | (1,070,042 | ) | | | (23,750,642 | ) |
| | | | |
| NET INCREASE (DECREASE) | | | (290,861 | ) | | $ | (6,934,923 | ) | | | 12,377 | | | $ | 543,513 | |
| | | International Equity Insights Fund | |
| | | For the Fiscal Year Ended
December 31, 2022 | | | For the Fiscal Year Ended
December 31, 2021 | |
| | | Shares | | | Dollars | | | Shares | | | Dollars | |
| Institutional Shares | | | | | | | | | | | | | | | | |
| Shares sold | | | 1,306,039 | | | $ | 10,885,092 | | | | 1,279,391 | | | $ | 12,019,024 | |
| Reinvestment of distributions | | | 253,079 | | | | 1,971,488 | | | | 363,020 | | | | 3,288,959 | |
| Shares redeemed | | | (733,445 | ) | | | (5,861,784 | ) | | | (559,940 | ) | | | (5,229,023 | ) |
| | | | 825,673 | | | | 6,994,796 | | | | 1,082,471 | | | | 10,078,960 | |
| Service Shares | | | | | | | | | | | | | | | | |
| Shares sold | | | 522,850 | | | | 4,549,789 | | | | 272,671 | | | | 2,522,185 | |
| Reinvestment of distributions | | | 134,038 | | | | 1,049,519 | | | | 245,317 | | | | 2,232,384 | |
| Shares redeemed | | | (1,042,479 | ) | | | (8,911,581 | ) | | | (1,206,056 | ) | | | (11,158,115 | ) |
| | | | (385,591 | ) | | | (3,312,273 | ) | | | (688,068 | ) | | | (6,403,546 | ) |
| | | | |
| NET INCREASE | | | 440,082 | | | $ | 3,682,523 | | | | 394,403 | | | $ | 3,675,414 | |
| | | | | | | | | | | | | | | | |
| | | Large Cap Value Fund | |
| | | For the Fiscal Year Ended
December 31, 2022 | | | For the Fiscal Year Ended
December 31, 2021 | |
| | | Shares | | | Dollars | | | Shares | | | Dollars | |
| Institutional Shares | | | | | | | | | | | | | | | | |
| Shares sold | | | 950,934 | | | $ | 8,789,990 | | | | 1,017,136 | | | $ | 10,601,007 | |
| Reinvestment of distributions | | | 1,876,236 | | | | 16,379,536 | | | | 2,432,740 | | | | 23,694,892 | |
| Shares redeemed | | | (3,426,119 | ) | | | (32,079,665 | ) | | | (2,709,781 | ) | | | (28,139,387 | ) |
| | | | (598,949 | ) | | | (6,910,139 | ) | | | 740,095 | | | | 6,156,512 | |
| Service Shares | | | | | | | | | | | | | | | | |
| Shares sold | | | 996,820 | | | | 9,307,435 | | | | 603,933 | | | | 6,315,252 | |
| Reinvestment of distributions | �� | | 3,046,274 | | | | 26,593,971 | | | | 4,106,597 | | | | 40,039,323 | |
| Shares redeemed | | | (6,321,557 | ) | | | (58,612,498 | ) | | | (6,168,949 | ) | | | (63,721,719 | ) |
| | | | (2,278,463 | ) | | | (22,711,092 | ) | | | (1,458,419 | ) | | | (17,367,144 | ) |
| | | | |
| NET DECREASE | | | (2,877,412 | ) | | $ | (29,621,231 | ) | | | (718,324 | ) | | $ | (11,210,632 | ) |
GOLDMAN SACHS VARIABLE INSURANCE TRUST EQUITY FUNDS
Notes to Financial Statements (continued)
December 31, 2022
12. SUMMARY OF SHARE TRANSACTIONS (continued)
| | | | | | | | | | | | | | | | |
| | | Mid Cap Growth Fund | |
| | | For the Fiscal Year Ended
December 31, 2022 | | | For the Fiscal Year Ended
December 31, 2021 | |
| | | Shares | | | Dollars | | | Shares | | | Dollars | |
| Institutional Shares | | | | | | | | | | | | | | | | |
| Shares sold | | | 82,652 | | | $ | 879,904 | | | | 20,939 | | | $ | 308,042 | |
| Reinvestment of distributions | | | 3,921 | | | | 39,168 | | | | 5,182 | | | | 67,989 | |
| Shares redeemed | | | (2,047 | ) | | | (19,226 | ) | | | — | | | | — | |
| | | | 84,526 | | | | 899,846 | | | | 26,121 | | | | 376,031 | |
| Service Shares | | | | | | | | | | | | | | | | |
| Shares sold | | | 689,640 | | | $ | 6,396,245 | | | | 231,649 | | | $ | 3,064,331 | |
| Reinvestment of distributions | | | 204,787 | | | | 1,904,522 | | | | 1,090,968 | | | | 13,375,264 | |
| Shares redeemed | | | (1,294,096 | ) | | | (12,861,876 | ) | | | (1,240,070 | ) | | | (17,004,840 | ) |
| | | | (399,669 | ) | | | (4,561,109 | ) | | | 82,547 | | | | (565,245 | ) |
| | | | |
| NET INCREASE (DECREASE) | | | (315,143 | ) | | $ | (3,661,263 | ) | | | 108,668 | | | $ | (189,214 | ) |
| | | | | | | | | | | | | | | | |
| | | Mid Cap Value Fund | |
| | | For the Fiscal Year Ended
December 31, 2022 | | | For the Fiscal Year Ended
December 31, 2021 | |
| | | Shares | | | Dollars | | | Shares | | | Dollars | |
| Institutional Shares | | | | | | | | | | | | | | | | |
| Shares sold | | | 644,665 | | | $ | 11,319,610 | | | | 543,557 | | | $ | 10,751,501 | |
| Reinvestment of distributions | | | 3,213,607 | | | | 50,260,811 | | | | 2,669,991 | | | | 51,237,122 | |
| Shares redeemed | | | (2,565,377 | ) | | | (45,341,378 | ) | | | (2,580,959 | ) | | | (51,043,863 | ) |
| | | | 1,292,895 | | | | 16,239,043 | | | | 632,589 | | | | 10,944,760 | |
| Service Shares | | | | | | | | | | | | | | | | |
| Shares sold | | | 4,528,288 | | | | 81,887,182 | | | | 135,902 | | | | 2,703,427 | |
| Reinvestment of distributions | | | 959,682 | | | | 15,201,358 | | | | 1,143,905 | | | | 22,180,324 | |
| Shares redeemed | | | (8,132,136 | ) | | | (140,363,135 | ) | | | (1,838,658 | ) | | | (36,501,072 | ) |
| | | | (2,644,166 | ) | | | (43,274,595 | ) | | | (558,851 | ) | | | (11,617,321 | ) |
| | | | |
| NET INCREASE (DECREASE) | | | (1,351,271 | ) | | $ | (27,035,552 | ) | | | 73,738 | | | $ | (672,561 | ) |
| | | | | | | | | | | | | | | | |
| | | Small Cap Equity Insights Fund | |
| | | For the Fiscal Year Ended
December 31, 2022 | | | For the Fiscal Year Ended
December 31, 2021 | |
| | | Shares | | | Dollars | | | Shares | | | Dollars | |
| Institutional Shares | | | | | | | | | | | | | | | | |
| Shares sold | | | 1,292,071 | | | $ | 14,688,216 | | | | 1,618,659 | | | $ | 25,450,651 | |
| Reinvestment of distributions | | | 116,516 | | | | 1,287,501 | | | | 1,829,510 | | | | 23,948,283 | |
| Shares redeemed | | | (1,264,967 | ) | | | (14,195,917 | ) | | | (1,420,214 | ) | | | (22,244,412 | ) |
| | | | 143,620 | | | | 1,779,800 | | | | 2,027,955 | | | | 27,154,522 | |
GOLDMAN SACHS VARIABLE INSURANCE TRUST EQUITY FUNDS
12. SUMMARY OF SHARE TRANSACTIONS (continued)
| | | | | | | | | | | | | | | | |
| | | Small Cap Equity Insights Fund | |
| | | For the Fiscal Year Ended
December 31, 2022 | | | For the Fiscal Year Ended
December 31, 2021 | |
| | | Shares | | | Dollars | | | Shares | | | Dollars | |
| Service Shares | | | | | | | | | | | | | | | | |
| Shares sold | | | 623,675 | | | | 6,800,371 | | | | 362,412 | | | | 5,522,021 | |
| Reinvestment of distributions | | | 24,431 | | | | 266,792 | | | | 360,051 | | | | 4,659,058 | |
| Shares redeemed | | | (253,528 | ) | | | (2,768,698 | ) | | | (299,332 | ) | | | (4,633,346 | ) |
| | | | 394,578 | | | | 4,298,465 | | | | 423,131 | | | | 5,547,733 | |
| | | | |
| NET INCREASE | | | 538,198 | | | $ | 6,078,265 | | | | 2,451,086 | | | $ | 32,702,255 | |
| | | | | | | | | | | | | | | | |
| | | Strategic Growth Fund | |
| | | For the Fiscal Year Ended
December 31, 2022 | | | For the Fiscal Year Ended
December 31, 2021 | |
| | | Shares | | | Dollars | | | Shares | | | Dollars | |
| Institutional Shares | | | | | | | | | | | | | | | | |
| Shares sold | | | 650,339 | | | $ | 8,099,060 | | | | 481,598 | | | $ | 7,976,739 | |
| Reinvestment of distributions | | | 2,405,496 | | | | 23,862,524 | | | | 1,313,700 | | | | 22,122,701 | |
| Shares redeemed | | | (1,036,439 | ) | | | (12,855,382 | ) | | | (1,421,500 | ) | | | (24,042,181 | ) |
| | | | 2,019,396 | | | | 19,106,202 | | | | 373,798 | | | | 6,057,259 | |
| Service Shares | | | | | | | | | | | | | | | | |
| Shares sold | | | 1,076,390 | | | | 12,762,705 | | | | 406,058 | | | | 6,769,145 | |
| Reinvestment of distributions | | | 2,294,192 | | | | 22,574,843 | | | | 1,866,601 | | | | 31,302,896 | |
| Shares redeemed | | | (6,611,696 | ) | | | (94,253,137 | ) | | | (3,121,407 | ) | | | (52,908,517 | ) |
| | | | (3,241,114 | ) | | | (58,915,589 | ) | | | (848,748 | ) | | | (14,836,476 | ) |
| | | | |
| NET DECREASE | | | (1,221,718 | ) | | $ | (39,809,387 | ) | | | (474,950 | ) | | $ | (8,779,217 | ) |
| | | | | | | | | | | | | | | | |
| | | U.S. Equity Insights Fund | |
| | | For the Fiscal Year Ended
December 31, 2022 | | | For the Fiscal Year Ended
December 31, 2021 | |
| | | Shares | | | Dollars | | | Shares | | | Dollars | |
| Institutional Shares | | | | | | | | | | | | | | | | |
| Shares sold | | | 1,049,282 | | | $ | 18,219,119 | | | | 887,900 | | | $ | 20,340,436 | |
| Reinvestment of distributions | | | 210,737 | | | | 3,548,809 | | | | 3,644,075 | | | | 71,715,395 | |
| Shares redeemed | | | (1,826,212 | ) | | | (31,436,133 | ) | | | (2,036,401 | ) | | | (46,216,943 | ) |
| | | | (566,193 | ) | | | (9,668,205 | ) | | | 2,495,574 | | | | 45,838,888 | |
| Service Shares | | | | | | | | | | | | | | | | |
| Shares sold | | | 78,305 | | | | 1,349,171 | | | | 163,388 | | | | 3,720,849 | |
| Reinvestment of distributions | | | 30,015 | | | | 509,957 | | | | 687,514 | | | | 13,647,143 | |
| Shares redeemed | | | (550,922 | ) | | | (9,529,595 | ) | | | (474,227 | ) | | | (10,887,216 | ) |
| | | | (442,602 | ) | | | (7,670,467 | ) | | | 376,675 | | | | 6,480,776 | |
| | | | |
| NET INCREASE (DECREASE) | | | (1,008,795 | ) | | $ | (17,338,672 | ) | | | 2,872,249 | | | $ | 52,319,664 | |
Report of Independent Registered Public Accounting Firm
To the Board of Trustees of Goldman Sachs Variable Insurance Trust and Shareholders of Goldman Sachs Equity Index Fund, Goldman Sachs Mid Cap Growth Fund, Goldman Sachs International Equity Insights Fund, Goldman Sachs Large Cap Value Fund, Goldman Sachs Mid Cap Value Fund, Goldman Sachs Small Cap Equity Insights Fund, Goldman Sachs Strategic Growth Fund, and Goldman Sachs U.S. Equity Insights Fund
Opinions on the Financial Statements
We have audited the accompanying statements of assets and liabilities, including the schedules of investments, of Goldman Sachs Equity Index Fund, Goldman Sachs Mid Cap Growth Fund, Goldman Sachs International Equity Insights Fund, Goldman Sachs Large Cap Value Fund, Goldman Sachs Mid Cap Value Fund, Goldman Sachs Small Cap Equity Insights Fund, Goldman Sachs Strategic Growth Fund, and Goldman Sachs U.S. Equity Insights Fund (eight of the Funds constituting Goldman Sachs Variable Insurance Trust, referred to hereafter as the “Funds”) as of December 31, 2022, the related statements of operations for the year ended December 31, 2022, the statements of changes in net assets for each of the two years in the period ended December 31, 2022, including the related notes, and the financial highlights for each of the five years in the period ended December 31, 2022 (collectively referred to as the “financial statements”). In our opinion, the financial statements present fairly, in all material respects, the financial position of each of the Funds as of December 31, 2022, the results of each of their operations for the year then ended, the changes in their net assets for each of the two years in the period ended December 31, 2022 and each of the financial highlights for each of the five years in the period ended December 31, 2022 in conformity with accounting principles generally accepted in the United States of America.
Basis for Opinions
These financial statements are the responsibility of the Funds’ management. Our responsibility is to express an opinion on the Funds’ financial statements based on our audits. We are a public accounting firm registered with the Public Company Accounting Oversight Board (United States) (PCAOB) and are required to be independent with respect to the Funds in accordance with the U.S. federal securities laws and the applicable rules and regulations of the Securities and Exchange Commission and the PCAOB.
We conducted our audits of these financial statements in accordance with the standards of the PCAOB. Those standards require that we plan and perform the audit to obtain reasonable assurance about whether the financial statements are free of material misstatement, whether due to error or fraud.
Our audits included performing procedures to assess the risks of material misstatement of the financial statements, whether due to error or fraud, and performing procedures that respond to those risks. Such procedures included examining, on a test basis, evidence regarding the amounts and disclosures in the financial statements. Our audits also included evaluating the accounting principles used and significant estimates made by management, as well as evaluating the overall presentation of the financial statements. Our procedures included confirmation of securities owned as of December 31, 2022 by correspondence with the custodian, transfer agent and brokers; when replies were not received from brokers, we performed other auditing procedures. We believe that our audits provide a reasonable basis for our opinions.
/s/PricewaterhouseCoopers LLP
Boston, Massachusetts
February 14, 2023
We have served as the auditor of one or more investment companies in the Goldman Sachs fund complex since 2000.
GOLDMAN SACHS VARIABLE INSURANCE TRUST EQUITY FUNDS
| | |
| Fund Expenses — Six Month Period Ended December 31, 2022 (Unaudited) | | |
As a shareholder of Institutional or Service Shares of the Funds, you incur ongoing costs, including management fees, distribution and/or service (12b-1) fees (with respect to Service Shares) and other Fund expenses. This example is intended to help you understand your ongoing costs (in dollars) of investing in the Institutional Shares and Service Shares of the Funds and to compare these costs with the ongoing costs of investing in other mutual funds.
The example is based on an investment of $1,000 invested at the beginning of the period and held for the entire period from July 1, 2022 through December 31, 2022, which represents a period of 184 days of a 365 day year.
Actual Expenses — The first line under each share class in the table below provides information about actual account values and actual expenses. You may use the informationinthis line, together with the amount you invested, to estimate the expenses that you paid over the period. Simply divide your account value by $1,000 (for example, an $8,600 account value divided by $1,000=8.6), then multiply the result by the number in the first line under the heading entitled “Expenses Paid” to estimate the expenses you paid on your account during this period.
Hypothetical Example for Comparison Purposes — The second line under each share class in the table below provides information about hypothetical account values and hypothetical expenses based on the Funds’ actual net expense ratio and an assumed rate of return of 5% per year before expenses, which is not the Funds’ actual return. The hypothetical account values and expenses may not be used to estimate the actual ending account balance or expenses you paid for the period. You may use this information to compare the ongoing costs of investing in the Funds and other funds. To do so, compare this 5% hypothetical example with the 5% hypothetical examples that appear in the shareholder reports of the other funds.
Please note that the expenses shown in the table are meant to highlight your ongoing costs only. As a shareholder of the Funds you do not incur any transaction costs, such as sales charges, redemption fees, or exchange fees, but shareholders of other funds may incur such costs. The second line of the table is useful in comparing ongoing costs only and will not help you determine the relative total costs of owning different funds whose shareholders may incur transaction costs.
| | | | | | | | | | | | | | | | | | | | | | | | | | | | | | | | | | | | | | | | | | | | | | | | |
| | | Equity Index Fund | | | International Equity Insights Fund | | | Large Cap Value Fund | | | Mid Cap Growth Fund | |
| Share Class | | Beginning
Account
Value
7/1/22 | | | Ending
Account
Value
12/31/22 | | | Expenses
Paid for the
6 months
ended
12/31/2022* | | | Beginning
Account
Value
7/1/22 | | | Ending
Account
Value
12/31/22 | | | Expenses
Paid for the
6 months
ended
12/31/2022* | | | Beginning
Account
Value
7/1/22 | | | Ending
Account
Value
12/31/22 | | | Expenses
Paid for the
6 months
ended
12/31/2022* | | | Beginning
Account
Value
7/1/22 | | | Ending
Account
Value
12/31/22 | | | Expenses
Paid for the
6 months
ended
12/31/2022* | |
| Institutional | | | | | | | | | | | | | | | | | | | | | | | | | | | | | | | | | | | | | | | | | | | | | | | | |
| | | | | | | | | | | | | |
Actual | | | N/A | | | | N/A | | | | N/A | | | $ | 1,000.00 | | | $ | 1,055.79 | | | $ | 4.20 | | | $ | 1,000.00 | | | $ | 1,076.70 | | | $ | 3.66 | | | $ | 1,000.00 | | | $ | 1,074.86 | | | $ | 4.24 | |
Hypothetical 5% return | | | N/A | | | | N/A | | | | N/A | | | | 1,000.00 | | | | 1,021.12 | + | | | 4.13 | | | | 1,000.00 | | | | 1,021.68 | + | | | 3.57 | | | | 1,000.00 | | | | 1,021.12 | + | | | 4.13 | |
| Service | | | | | | | | | | | | | | | | | | | | | | | | | | | | | | | | | | | | | | | | | | | | | | | | |
| | | | | | | | | | | | | |
Actual | | $ | 1,000.00 | | | | 1,021.12 | | | | 2.45 | | | | 1,000.00 | | | | 1,054.19 | | | | 5.49 | | | | 1,000.00 | | | | 1,076.69 | | | | 4.87 | | | | 1,000.00 | | | | 1,074.18 | | | $ | 5.12 | |
Hypothetical 5% return | | | 1,000.00 | | | | 1,022.79 | + | | | 2.45 | | | | 1,000.00 | | | | 1,019.86 | + | | | 5.40 | | | | 1,000.00 | | | | 1,020.52 | + | | | 4.74 | | | | 1,000.00 | | | | 1,020.27 | + | | | 4.99 | |
| | + | Hypothetical expenses are based on each Fund’s actual annualized net expense ratios and an assumed rate of return of 5% per year before expenses. | |
| | * | Expenses are calculated using each Fund’s annualized net expense ratio for each class, which represents the ongoing expenses as a percentage of net assets for the six months ended December 31, 2022. Expenses are calculated by multiplying the annualized net expense ratio by the average account value for the period; then multiplying the result by the number of days in the most recent fiscal half year; and then dividing that result by the number of days in the fiscal year. The annualized net expense ratios for the period were as follows: | |
| | | | | | |
| | |
| Fund | | Institutional
Shares | | Service
Shares | |
| Equity Index Fund | | N/A | | | 0.48 | % |
| International Equity Insights Fund | | 0.81% | | | 1.06 | |
| Large Cap Value Fund | | 0.70 | | | 0.93 | |
| Mid Cap Growth Fund | | 0.81 | | | 0.98 | |
123
GOLDMAN SACHS VARIABLE INSURANCE TRUST EQUITY FUNDS
| | |
| Fund Expenses — Six Month Period Ended December 31, 2022 (Unaudited) (continued) | | |
As a shareholder of Institutional or Service Shares of the Funds, you incur ongoing costs, including management fees, distribution and/or service (12b-1) fees (with respect to Service and Advisor Shares) and other Fund expenses. This example is intended to help you understand your ongoing costs (in dollars) of investing in the Institutional Shares and Service Shares of the Funds and to compare these costs with the ongoing costs of investing in other mutual funds.
The example is based on an investment of $1,000 invested at the beginning of the period and held for the entire period from July 1, 2022 through December 31, 2022, which represents a period of 184 days of a 365 day year.
Actual Expenses — The first line under each share class in the table below provides information about actual account values and actual expenses. You may use the information in this line, together with the amount you invested, to estimate the expenses that you paid over the period. Simply divide your account value by $1,000 (for example, an $8,600 account value divided by $1,000=8.6), then multiply the result by the number in the first line under the heading entitled “Expenses Paid” to estimate the expenses you paid on your account during this period.
Hypothetical Example for Comparison Purposes — The second line under each share class in the table below provides information about hypothetical account values and hypothetical expenses based on the Funds’ actual net expense ratio and an assumed rate of return of 5% per year before expenses, which is not the Funds’ actual return. The hypothetical account values and expenses may not be used to estimate the actual ending account balance or expenses you paid for the period. You may use this information to compare the ongoing costs of investing in the Funds and other funds. To do so, compare this 5% hypothetical example with the 5% hypothetical examples that appear in the shareholder reports of the other funds.
Please note that the expenses shown in the table are meant to highlight your ongoing costs only. As a shareholder of the Funds you do not incur any transaction costs, such as sales charges, redemption fees, or exchange fees, but shareholders of other funds may incur such costs. The second line of the table is useful in comparing ongoing costs only and will not help you determine the relative total costs of owning different funds whose shareholders may incur transaction costs.
| | | | | | | | | | | | | | | | | | | | | | | | | | | | | | | | | | | | | | | | | | | | | | | | |
| | | Mid Cap Value Fund | | | Small Cap Equity Insights Fund | | | Strategic Growth Fund | | | U.S. Equity Insights Fund | |
| Share Class | | Beginning
Account
Value
7/1/22 | | | Ending
Account
Value
12/31/22 | | | Expenses
Paid for the
6 months
ended
12/31/2022* | | | Beginning
Account
Value
7/1/22 | | | Ending
Account
Value
12/31/22 | | | Expenses
Paid for the
6 months
ended
12/31/2022* | | | Beginning
Account
Value
7/1/22 | | | Ending
Account
Value
12/31/22 | | | Expenses
Paid for the
6 months
ended
12/31/2022* | | | Beginning
Account
Value
7/1/22 | | | Ending
Account
Value
12/31/22 | | | Expenses
Paid for the
6 months
ended
12/31/2022* | |
| Institutional | | | | | | | | | | | | | | | | | | | | | | | | | | | | | | | | | | | | | | | | | | | | | | | | |
| | | | | | | | | | | | | |
Actual | | $ | 1,000.00 | | | $ | 1,078.60 | | | $ | 4.51 | | | $ | 1,000.00 | | | $ | 1,037.90 | | | $ | 4.16 | | | $ | 1,000.00 | | | $ | 984.44 | | | $ | 3.70 | | | $ | 1,000.00 | | | $ | 1,020.30 | | | $ | 2.85 | |
Hypothetical 5% return | | | 1,000.00 | | | | 1,020.87 | + | | | 4.38 | | | | 1,000.00 | | | | 1,021.12 | + | | | 4.13 | | | | 1,000.00 | | | | 1,021.48 | + | | | 3.77 | | | | 1,000.00 | | | | 1,022.38 | + | | | 2.85 | |
| Service | | | | | | | | | | | | | | | | | | | | | | | | | | | | | | | | | | | | | | | | | | | | | | | | |
| | | | | | | | | | | | | |
Actual | | | 1,000.00 | | | | 1,076.79 | | | | 5.76 | | | | 1,000.00 | | | | 1,036.01 | | | | 5.44 | | | | 1,000.00 | | | | 983.35 | | | | 4.95 | | | | 1,000.00 | | | | 1,019.08 | | | | 3.92 | |
Hypothetical 5% return | | | 1,000.00 | | | | 1,019.66 | + | | | 5.60 | | | | 1,000.00 | | | | 1,019.86 | + | | | 5.40 | | | | 1,000.00 | | | | 1,020.21 | + | | | 5.04 | | | | 1,000.00 | | | | 1,021.32 | + | | | 3.92 | |
| | + | Hypothetical expenses are based on each Fund’s actual annualized net expense ratios and an assumed rate of return of 5% per year before expenses. | |
| | * | Expenses are calculated using each Fund’s annualized net expense ratio for each class, which represents the ongoing expenses as a percentage of net assets for the six months ended December 31, 2022. Expenses are calculated by multiplying the annualized net expense ratio by the average account value for the period; then multiplying the result by the number of days in the most recent fiscal half year; and then dividing that result by the number of days in the fiscal year. The annualized net expense ratios for the period were as follows: | |
| | | | | | |
| | |
| Fund | | Institutional
Shares | | Service
Shares | |
| Mid Cap Value Fund | | 0.86% | | | 1.10 | % |
| Small Cap Equity Insights Fund | | 0.81 | | | 1.06 | |
| Strategic Growth Fund | | 0.74 | | | 0.99 | |
| U.S. Equity Insights Fund | | 0.56 | | | 0.77 | |
124
GOLDMAN SACHS VARIABLE INSURANCE TRUST EQUITY FUNDS
Trustees and Officers (Unaudited)
Independent Trustees
| | | | | | | | | | | | |
| | | | | |
Name, Address and Age1 | | Position(s) Held with the Trust | | Term of Office and Length of Time Served2 | | Principal Occupation(s) During Past 5 Years | | Number of Portfolios in Fund Complex Overseen by Trustee3 | | | Other
Directorships
Held by Trustee4 |
Jessica Palmer5 Age: 73 | | Chair of the Board of Trustees | | Since 2018 (Trustee since 2007) | | Ms. Palmer is retired. She was formerly Consultant, Citigroup Human Resources Department (2007-2008); Managing Director, Citigroup Corporate and Investment Banking (previously, Salomon Smith Barney/Salomon Brothers) (1984-2006). Ms. Palmer was a Member of the Board of Trustees of Indian Mountain School (private elementary and secondary school) (2004-2009). Chair of the Board of Trustees — Goldman Sachs Variable Insurance Trust and Goldman Sachs Trust. | | | 103 | | | None |
Dwight L. Bush Age: 65 | | Trustee | | Since 2020 | | Ambassador Bush is President and CEO of D.L. Bush & Associates (a financial advisory and private investment firm) (2002-2014 and 2017-Present); Director of MoneyLion, Inc. (an operator of a data-driven, digital financial platform) (2021-Present); and was formerly U.S. Ambassador to the Kingdom of Morocco (2014-2017) and a Member of the Board of Directors of Santander Bank, N.A. (2018-2019). Previously, Ambassador Bush served as an Advisory Board Member of Goldman Sachs Trust and Goldman Sachs Variable Insurance Trust (October 2019-January 2020). Trustee — Goldman Sachs Variable Insurance Trust and Goldman Sachs Trust. | | | 103 | | | MoneyLion, Inc. (an operator of a data-driven, digital financial platform) |
Kathryn A. Cassidy Age: 68 | | Trustee | | Since 2015 | | Ms. Cassidy is retired. She is Director, Vertical Aerospace Ltd. (an aerospace and technology company) (2021-Present). Formerly, Ms. Cassidy was Advisor to the Chairman (May 2014-December 2014); and Senior Vice President and Treasurer (2008-2014), General Electric Company & General Electric Capital Corporation (technology and financial services companies). Trustee — Goldman Sachs Variable Insurance Trust and Goldman Sachs Trust. | | | 103 | | | Vertical Aerospace Ltd. (an aerospace and technology company) |
John G. Chou Age: 66 | | Trustee | | Since 2022 | | Mr. Chou is Executive Vice President and Special Advisor to the Chairman and CEO of AmerisourceBergen Corporation (a pharmaceutical and healthcare company) (2021-Present); and formerly held various executive management positions with AmerisourceBergen Corporation, including Executive Vice President and Chief Legal Officer (2019-2021); Executive Vice President and Chief Legal & Business Officer (2017-2019); and Executive Vice President and General Counsel (2011-2017). Trustee — Goldman Sachs Variable Insurance Trust and Goldman Sachs Trust. | | | 103 | | | None |
Diana M. Daniels5 Age: 73 | | Trustee | | Since 2007 | | Ms. Daniels is retired. Formerly, she was Vice President, General Counsel and Secretary, The Washington Post Company (1991-2006). Ms. Daniels is a Trustee Emeritus and serves as a Presidential Councillor of Cornell University (2013-Present); Director of 1735 NY Investments, LLC (oversees an investment fund that supports the mission of the American Institute of Architects) (2022-Present); former Member of the Legal Advisory Board, New York Stock Exchange (2003-2006) and of the Corporate Advisory Board, Standish Mellon Management Advisors (2006-2007). Trustee — Goldman Sachs Variable Insurance Trust and Goldman Sachs Trust. | | | 103 | | | None |
| | | | | | | | | | | | |
GOLDMAN SACHS VARIABLE INSURANCE TRUST EQUITY FUNDS
Trustees and Officers (Unaudited) (continued)
Independent Trustees
| | | | | | | | | | | | |
| | | | | |
Name, Address and Age1 | | Position(s) Held with the Trust | | Term of Office and Length of Time Served2 | | Principal Occupation(s) During Past 5 Years | | Number of Portfolios in Fund Complex Overseen by Trustee3 | | | Other
Directorships
Held by Trustee4 |
Joaquin Delgado Age: 62 | | Trustee | | Since 2020 | | Dr. Delgado is retired. He is Director, Stepan Company (a specialty chemical manufacturer) (2011-Present); and was formerly Director, Hexion Inc. (a specialty chemical manufacturer) (2019-2022); Executive Vice President, Consumer Business Group of 3M Company (July 2016-July 2019); and Executive Vice President, Health Care Business Group of 3M Company (October 2012-July 2016). Previously, Dr. Delgado served as an Advisory Board Member of Goldman Sachs Trust and Goldman Sachs Variable Insurance Trust (October 2019- January 2020). Trustee — Goldman Sachs Variable Insurance Trust and Goldman Sachs Trust. | | | 103 | | | Stepan Company (a specialty chemical manufacturer) |
Eileen H. Dowling Age: 60 | | Trustee | | Since 2021 | | Ms. Dowling is retired. Formerly, she was Senior Advisor (April 2021-September 2021); and Managing Director (2013-2021), BlackRock, Inc. (a financial services firm). Trustee — Goldman Sachs Variable Insurance Trust and Goldman Sachs Trust. | | | 103 | | | None |
Gregory G. Weaver Age: 71 | | Trustee | | Since 2015 | | Mr. Weaver is retired. He is Director, Verizon Communications Inc. (2015-Present); and was formerly Chairman and Chief Executive Officer, Deloitte & Touche LLP (a professional services firm) (2001-2005 and 2012-2014); and Member of the Board of Directors, Deloitte & Touche LLP (2006-2012). Trustee — Goldman Sachs Variable Insurance Trust and Goldman Sachs Trust. | | | 103 | | | Verizon Communications Inc. |
Paul C. Wirth Age: 65 | | Trustee | | Since 2022 | | Mr. Wirth is retired. Formerly, he was Deputy Chief Financial Officer and Principal Accounting Officer (2011-2020); Finance Director and Principal Accounting Officer (2010-2011); and Managing Director, Global Controller, and Chief Accounting Officer (2005-2010) of Morgan Stanley. Trustee — Goldman Sachs Variable Insurance Trust and Goldman Sachs Trust. | | | 103 | | | None |
| | | | | | | | | | | | |
GOLDMAN SACHS VARIABLE INSURANCE TRUST EQUITY FUNDS
Trustees and Officers (Unaudited) (continued)
Interested Trustee*
| | | | | | | | | | | | |
| | | | | |
Name, Address and Age1 | | Position(s) Held
with the Trust | | Term of
Office and
Length of
Time Served2 | | Principal Occupation(s)
During Past 5 Years | | Number of
Portfolios in
Fund Complex
Overseen by
Trustee3 | | | Other
Directorships
Held by Trustee4 |
James A. McNamara Age: 60 | | President and Trustee | | Since 2007 | | Advisory Director, Goldman Sachs (January 2018-Present); Managing Director, Goldman Sachs (January 2000-December 2017); Director of Institutional Fund Sales, GSAM (April 1998-December 2000); and Senior Vice President and Manager, Dreyfus Institutional Service Corporation (January 1993-April 1998). President and Trustee — Goldman Sachs Variable Insurance Trust and Goldman Sachs Trust; Goldman Sachs Trust II; Goldman Sachs MLP and Energy Renaissance Fund; Goldman Sachs ETF Trust; Goldman Sachs ETF Trust II; Goldman Sachs Credit Income Fund; and Goldman Sachs Real Estate Diversified Income Fund. | | | 172 | | | None |
| | | | | | | | | | | | |
| * | Mr. McNamara is considered to be an “Interested Trustee” because he holds positions with Goldman Sachs and owns securities issued by The Goldman Sachs Group, Inc. Mr. McNamara holds comparable positions with certain other companies of which Goldman Sachs, GSAM or an affiliate thereof is the investment adviser, administrator and/or distributor. |
| 1 | Each Trustee may be contacted by writing to the Trustee, c/o Goldman Sachs, 200 West Street, New York, New York, 10282, Attn: Caroline Kraus. Information is provided as of December 31, 2022. |
| 2 | Subject to such policies as may be adopted by the Board from time-to-time, each Trustee holds office for an indefinite term, until the earliest of: (a) the election of his or her successor; (b) the date the Trustee resigns or is removed by the Board or shareholders, in accordance with the Trust’s Declaration of Trust; or (c) the termination of the Trust. The Board has adopted policies which provide that each Independent Trustee shall retire as of December 31st of the calendar year in which he or she reaches (a) his or her 75th birthday or (b) the 15th anniversary of the date he or she became a Trustee, whichever is earlier, unless a waiver of such requirements shall have been adopted by a majority of the other Trustees. These policies may be changed by the Trustees without shareholder vote. |
| 3 | The Goldman Sachs Fund Complex includes certain other companies listed above for each respective Trustee. As of December 31, 2022, Goldman Sachs Variable Insurance Trust consisted of 15 portfolios (12 of which offered shares to the public); Goldman Sachs Trust consisted of 88 portfolios; Goldman Sachs Trust II consisted of 18 portfolios (7 of which offered shares to the public); Goldman Sachs ETF Trust consisted of 45 portfolios (29 of which offered shares to the public); Goldman Sachs ETF Trust II consisted of 2 portfolios (1 of which offered shares to the public); and Goldman Sachs MLP and Energy Renaissance Fund, Goldman Sachs Credit Income Fund and Goldman Sachs Real Estate Diversified Income Fund each consisted of one portfolio. Goldman Sachs Credit Income Fund did not offer shares to the public. |
| 4 | This column includes only directorships of companies required to report to the Securities and Exchange Commission under the Securities Exchange Act of 1934 (i.e., “public companies”) or other investment companies registered under the Act. |
| 5 | Ms. Daniels and Ms. Palmer retired as Independent Trustees effective January 1, 2023. |
Additional information about the Trustees is available in the Funds’ Statement of Additional Information, which can be obtained from Goldman Sachs free of charge by calling this toll-free number (in the United States of America): 1-800-526-7384.
GOLDMAN SACHS VARIABLE INSURANCE TRUST EQUITY FUNDS
Trustees and Officers (Unaudited) (continued)
Officers of the Trust*
| | | | | | |
| | | |
| Name, Address and Age1 | | Positions Held with the Trust | | Term of
Office and
Length of
Time Served2 | | Principal Occupation(s) During Past 5 Years |
James A. McNamara
200 West Street New York, NY 10282 Age: 60 | | Trustee and
President | | Since 2007 | | Advisory Director, Goldman Sachs (January 2018-Present); Managing Director, Goldman Sachs (January 2000-December 2017); Director of Institutional Fund Sales, GSAM (April 1998-December 2000); and Senior Vice President and Manager, Dreyfus Institutional Service Corporation (January 1993-April 1998). President and Trustee — Goldman Sachs Variable Insurance Trust; Goldman Sachs Trust; Goldman Sachs Trust II; Goldman Sachs MLP and Energy Renaissance Fund; Goldman Sachs ETF Trust; Goldman Sachs ETF Trust II; Goldman Sachs Credit Income Fund; and Goldman Sachs Real Estate Diversified Income Fund. |
Joseph F. DiMaria
30 Hudson Street Jersey City, NJ 07302 Age: 54 | | Treasurer, Principal
Financial Officer
and Principal
Accounting Officer | | Since 2017
(Treasurer
and
Principal
Financial
Officer
since 2019) | | Managing Director, Goldman Sachs (November 2015-Present) and Vice President-Mutual Fund Administration, Columbia Management Investment Advisers, LLC (May 2010-October 2015). Treasurer, Principal Financial Officer and Principal Accounting Officer — Goldman Sachs Variable Insurance Trust (previously Assistant Treasurer (2016)); Goldman Sachs Principal Accounting Officer - Trust (previously Assistant Treasurer (2016)); Goldman Sachs Trust II (previously Assistant Treasurer (2017)); Goldman Sachs MLP and Energy Renaissance Fund (previously Assistant Treasurer (2017)); Goldman Sachs ETF Trust (previously Assistant Treasurer (2017)); Goldman Sachs ETF Trust II; Goldman Sachs Credit Income Fund; and Goldman Sachs Real Estate Diversified Income Fund. |
Caroline L. Kraus
200 West Street New York, NY 10282 Age: 45 | | Secretary | | Since 2012 | | Managing Director, Goldman Sachs (January 2016-Present); Vice President, Goldman Sachs (August 2006-December 2015); Senior Counsel, Goldman Sachs (January 2020-Present); Associate General Counsel, Goldman Sachs (2012-December 2019); Assistant General Counsel, Goldman Sachs (August 2006-December 2011); and Associate, Weil, Gotshal & Manges, LLP (2002–2006). Secretary — Goldman Sachs Variable Insurance Trust (previously Assistant Secretary (2012)); Goldman Sachs Trust (previously Assistant Secretary (2012)); Goldman Sachs Trust II; Goldman Sachs BDC, Inc.; Goldman Sachs Private Middle Market Credit LLC; Goldman Sachs Private Middle Market Credit II LLC; Goldman Sachs Middle Market Lending Corp.; Goldman Sachs MLP and Energy Renaissance Fund; Goldman Sachs ETF Trust; Goldman Sachs ETF Trust II; Goldman Sachs Credit Income Fund; and Goldman Sachs Real Estate Diversified Income Fund. |
| | | | | | |
| * | Represents a partial list of officers of the Trust. Additional information about all the officers is available in the Funds’ Statement of Additional Information, which can be obtained from Goldman Sachs free of charge by calling this toll-free number (in the United States): 1-800-526-7384. |
| 1 | Information is provided as of December 31, 2022. |
| 2 | Officers hold office at the pleasure of the Board of Trustees or until their successors are duly elected and qualified. Each officer holds comparable positions with certain other companies of which Goldman Sachs, GSAM or an affiliate thereof is the investment adviser, administrator and/or distributor. |
Goldman Sachs Variable Insurance Trust — Tax Information (Unaudited)
For the year ended December 31, 2022, 100%, 43.52%, 7.45%, 79.28%, 77.57%, 14.34% and 88.43% of the dividends paid from net investment company taxable income by the Equity Index, Mid Cap Value, Mid Cap Growth, Large Cap Value, Small Cap Equity Insights, Strategic Growth and U.S. Equity Insights Funds, respectively, qualified for the dividends received deduction available to corporations.
Pursuant to Section 852 of the Internal Revenue Code, the Equity Index, Mid Cap Value, Mid Cap Growth, Large Cap Value, Small Cap Equity Insights, Strategic Growth and U.S. Equity Insights Funds designated $11,510,542, $59,152,031, $1,887,780, $36,997,158, $1,187,594, $44,319,555, and $1,599,621 respectively, or if different, the maximum amount allowable, as capital gain dividends paid during the fiscal year ended December 31, 2022.
For the year end December 31, 2022, the International Equity Insights Fund has elected to pass through a credit for taxes paid to foreign jurisdictions. The total amount of income received by the International Equity Insights Fund from sources within foreign countries and possessions of the United States was $0.2967 per share, all of which is attributable to qualified passive income. The percentage of net investment income dividends paid by the Fund during the year ended December 31, 2022 from foreign sources was 96.24%. The total amount of foreign taxes paid by the Fund was $0.0265 per share.
| | |
| TRUSTEES | | OFFICERS |
| Gregory G. Weaver, Chair | | James A. McNamara, President |
| Dwight L. Bush | | Joseph F. DiMaria, Principal Financial Officer, |
| Kathryn A. Cassidy | | Principal Accounting Officer and Treasurer |
| John G. Chou | | Caroline L. Kraus, Secretary |
| Joaquin Delgado | | |
| Eileen H. Dowling | | |
| James A. McNamara | | |
| Paul C. Wirth | | |
GOLDMAN SACHS & CO. LLC
Distributor and Transfer Agent
GOLDMAN SACHS ASSET MANAGEMENT, L.P.
Investment Adviser
200 West Street, New York
New York 10282
Visit our web site at www.GSAMFUNDS.com to obtain the most recent month-end returns.
The reports concerning the Fund included in this shareholder report may contain certain forward-looking statements about the factors that may affect the performance of the Fund in the future. These statements are based on Fund management’s predictions and expectations concerning certain future events and their expected impact on the Fund, such as performance of the economy as a whole and of specific industry sectors, changes in the levels of interest rates, the impact of developing world events, and other factors that may influence the future performance of the Fund. Management believes these forward-looking statements to be reasonable, although they are inherently uncertain and difficult to predict. Actual events may cause adjustments in portfolio management strategies from those currently expected to be employed.
A description of the policies and procedures that the Fund uses to determine how to vote proxies relating to portfolio securities and information regarding how the Fund voted proxies relating to portfolio securities during the most recent 12-month period ended June 30 is available (i) without charge, upon request by calling 1-800-621-2550; and (ii) on the Securities and Exchange Commission (“SEC”) web site at http://www.sec.gov.
The Fund will file its portfolio holdings information for each month in a fiscal quarter within 60 days after the end of the relevant fiscal quarter on Form N-PORT. Portfolio holdings information for the third month of each fiscal quarter will be made available on the SEC’s web site at http://www.sec.gov. Portfolio holdings information may be obtained upon request and without charge by calling 1-800-526-7384 (for Retail Shareholders) or 1-800-621-2550 (for Institutional Shareholders).
Views and opinions expressed are for informational purposes only and do not constitute a recommendation by GSAM to buy, sell, or hold any security. Views and opinions are current as of the date of this presentation and may be subject to change, they should not be construed as investment advice.
Goldman Sachs & Co. LLC (“Goldman Sachs”) does not provide legal, tax or accounting advice. Any statement contained in this communication (including any attachments) concerning U.S. tax matters was not intended or written to be used, and cannot be used, for the purpose of avoiding penalties under the Internal Revenue Code, and was written to support the promotion or marketing of transaction or matter addressed. Clients of Goldman Sachs should obtain their own independent tax advice based on their particular circumstances.
The website links provided are for your convenience only and are not an endorsement or recommendation by GSAM of any of these websites or the products or services offered. GSAM is not responsible for the accuracy and validity of the content of these websites.
Economic and market forecasts presented herein reflect our judgment as of the date of this presentation and are subject to change without notice. These forecasts do not take into account the specific investment objectives, restrictions, tax and financial situation or other needs of any specific client. Actual data will vary and may not be reflected here. These forecasts are subject to high levels of uncertainty that may affect actual performance. Accordingly, these forecasts should be viewed as merely representative of a broad range of possible outcomes. These forecasts are estimated, based on assumptions, and are subject to significant revision and may change materially as economic and market conditions change. Goldman Sachs has no obligation to provide updates or changes to these forecasts. Case studies and examples are for illustrative purposes only.
Fund holdings and allocations shown are as of December 31, 2022 and may not be representative of future investments. Fund holdings should not be relied on in making investment decisions and should not be construed as research or investment advice regarding particular securities. Current and future holdings are subject to risk.
References to indices, benchmarks or other measures of relative market performance over a specified period of time are provided for your information only and do not imply that the portfolio will achieve similar results. The index composition may not reflect the manner in which a portfolio is constructed. While an adviser seeks to design a portfolio which reflects appropriate risk and return features, portfolio characteristics may deviate from those of the benchmark.
The Global Industry Classification Standard (“GICS”) was developed by and is the exclusive property and a service mark of Morgan Stanley Capital International Inc. (“MSCI”) and Standard & Poor’s, a division of The McGraw-Hill Companies, Inc. (“S&P”) and is licensed for use by Goldman Sachs. Neither MSCI, S&P nor any other party involved in making or compiling the GICS or any GICS classifications makes any express or implied warranties or representations with respect to such standard or classification (or the results to be obtained by the use thereof), and all such parties hereby expressly disclaim all warranties of originality, accuracy, completeness, merchantability or fitness for a particular purpose with respect to any of such standard or classification. Without limiting any of the foregoing, in no event shall MSCI, S&P, any of their affiliates or any third party involved in making or compiling the GICS or any GICS classifications have any liability for any direct, indirect, special, punitive, consequential or any other damages (including lost profits) even if notified of the possibility of such damages.
The portfolio risk management process includes an effort to monitor and manage risk, but does not imply low risk.
Shares of the Goldman Sachs VIT Funds are offered to separate accounts of participating life insurance companies for the purpose of funding variable annuity contracts and variable life insurance policies. Shares of the Fund are not offered directly to the general public. The variable annuity contracts and variable life insurance policies are described in the separate prospectuses issued by participating insurance companies. You should refer to those prospectuses for information about surrender charges, mortality and expense risk fees and other charges that may be assessed by participating insurance companies under the variable annuity contracts or variable life insurance policies. Such fees or charges, if any, may affect the return you may realize with respect to your investments. Ask your representative for more complete information. Please consider a fund’s objectives, risks and charges and expenses, and read the prospectus carefully before investing. The prospectus contains this and other information about the Fund.
This material is not authorized for distribution to prospective investors unless preceded or accompanied by a current prospectus or summary prospectus, if applicable. Investors should consider the Fund’s objective, risks, and charges and expenses, and read the summary prospectus, if available, and/or the prospectus carefully before investing or sending money. The summary prospectus, if available, and the prospectus contain this and other information about the Fund and may be obtained from your authorized dealer or from Goldman Sachs & Co. LLC by calling 1-800-621-2550.
This report is prepared for the general information of contract owners and is not an offer of shares of the Goldman Sachs Variable Insurance Trust Funds.
© 2023 Goldman Sachs. All rights reserved.
VITEQTYAR-23/306019-OTU-1739700
Goldman
Sachs Variable Insurance Trust
Goldman Sachs Government
Money Market Fund
Annual Report
December 31, 2022

Goldman Sachs Government Money Market Fund
You could lose money by investing in the Fund. Although the Fund seeks to preserve the value of your investment at $1.00 per share, it cannot guarantee it will do so. An investment in the Fund is not a deposit of the bank and is not insured or guaranteed by the Federal Deposit Insurance Corporation or any other government agency. The Fund’s sponsor has no legal obligation to provide financial support to the Fund, and you should not expect that the sponsor will provide financial support to the Fund at any time.
GOLDMAN SACHS VARIABLE INSURANCE TRUST GOVERNMENT MONEY MARKET FUND
INVESTMENT OBJECTIVE
The Fund seeks to maximize current income to the extent consistent with the preservation of capital and the maintenance of liquidity by investing exclusively in high quality money market instruments.
Portfolio Management Discussion and Analysis
Below, the Goldman Sachs Money Market Portfolio Management Team discusses the Goldman Sachs Variable Insurance Trust — Goldman Sachs Government Money Market Fund’s (the “Fund") performance and positioning for the 12-month period ended December 31, 2022 (the “Reporting Period”).
How did the Fund perform during the Reporting Period?
The Fund’s Institutional Shares’ standardized 7-day current yield was 4.18% and their standardized 7-day effective yield was 4.26% as of December 31, 2022. The Institutional Shares’ one-month simple average yield was 3.97% as of December 31, 2022. The Institutional Shares’ 7-day distribution yield as of December 31, 2022 was 4.18%.
The Fund’s Service Shares’ standardized 7-day current yield was 3.93% and their standardized 7-day effective yield was 4.00% as of December 31, 2022. The Service Shares’ one-month simple average yield was 3.72% as of December 31, 2022. The Service Shares’ 7-day distribution yield as of December 31, 2022 was 3.93%.
The yields represent past performance. Past performance does not guarantee future results. Current performance may be lower or higher than the performance quoted above.
Yields will fluctuate as market conditions change. The yield quotations more closely reflect the current earnings of the Fund than total return quotations.
What economic and market factors most influenced the money markets as a whole during the Reporting Period?
During the Reporting Period, the money markets were most influenced by Federal Reserve (“Fed”) policy, inflationary trends and U.S. economic data.
In January 2022, when the Reporting Period began, the Federal Open Market Committee (“FOMC”) kept the targeted federal funds (“fed funds”) rate unchanged in a range between zero and 25 basis points but hinted that a rate hike might come in March. (A basis point is 1/100th of a percentage point.) In February, inflation surged to multi-decade highs, as energy and commodity prices in particular jumped in response to Russia’s invasion of Ukraine late that month. Following the onset of the Russia/Ukraine war and against the backdrop of tightening financial conditions, a number of developed markets’ central banks, including the Fed, took policy action. The FOMC raised the targeted fed funds rate by 25 basis points in March, the first rate hike since the end of 2018.
Inflation continued to rise during the spring, with the core U.S. Consumer Price Index (“CPI”) reaching its highest level in nearly four decades in May 2022 and hitting a new high in June, as rising energy and food costs pushed up prices. (Core CPI data excludes food and energy prices.) Against this backdrop, the FOMC hiked the targeted fed funds rate by 50 basis points in May and then by another 75 basis points in June, the latter being the largest single rate increase since 1994. Policymakers also signaled they would continue tightening monetary policy at an aggressive pace. On June 1st, the Fed began to reduce the size of its balance sheet.
During July 2022, the Fed raised the targeted fed funds rate by 75 basis points, though comments by Fed Chair Jerome Powell suggested a potential deceleration in the pace of future rate hikes. In August, at the Fed’s Jackson Hole symposium, Powell dispelled near-term prospects of a policy pivot, stressing that Fed officials remained committed to “restoring price stability” and acknowledging this might require “a restrictive policy stance for some time.” At its September policy meeting, the FOMC increased the targeted fed funds rate another 75 basis points.
In October 2022, Fed officials began to contend that inflation was likely to decline in the near term should demand weaken and supply-chain issues soften as they anticipated. However, policymakers also suggested they would end their current tightening cycle with short-term interest rates at a higher level than many market participants had expected. Near the beginning of November, the FOMC hiked the targeted fed funds rate by 75 basis points to a range of between 3.75% and 4.00%.
In December 2022, the Fed stepped down the pace of its interest rate hikes, implementing a 50 basis point increase in the targeted fed funds rate, but emphasized that policymakers were not stepping back from the task of taming inflation. The median policymaker projection at the end of the Reporting Period signaled a higher peak funds rate of 5.00% to 5.25% and a higher-for-longer rate environment.
GOLDMAN SACHS VARIABLE INSURANCE TRUST GOVERNMENT MONEY MARKET FUND
In this environment, the yields of taxable and tax-exempt money market funds increased significantly. Investments in U.S. taxable money market funds remained rather flat during the Reporting Period, at approximately $4.6 trillion, according to iMoneyNet. As for U.S. tax-exempt money market funds, investments increased during the Reporting Period from $86 billion to $108 billion, according to iMoneyNet.
Interestingly, while record high inflation and hawkish implications from U.S. labor market and inflation data led front-end, or short-term, rates to rise across the money market maturity spectrum, the taxable money market yield curve actually remained rather stable in a moderately steepened position during the Reporting Period overall. (Yield curve is a spectrum of interest rates based on maturities of varying lengths. A steepened yield curve is one wherein the yields on longer-term maturities are higher than yields on shorter-term maturities; opposite of a flat yield curve.)
Money market funds overall remained a viable investment for investors seeking stability, liquidity and/or yield amid ongoing uncertainty and elevated volatility in the financial markets broadly.
What key factors were responsible for the Fund’s performance during the Reporting Period?
The Fund’s yields increased during the Reporting Period, largely because of the economic and market factors discussed above. The Fund remained highly liquid throughout the Reporting Period.
The Fund continued to be flexibly guided by shifting marketing conditions, and we positioned the Fund to seek to take advantage of the Fed’s tightening monetary policy. During the Reporting Period, the Fund’s positioning along the money market yield curve and in specific securities was predicated on market expectations around interest rates and Fed rate hikes in the near term. The overall strategy of the Fund focused on shorter weighted average maturities and longer weighted average life, as we sought to take advantage of the unprecedented rise in interest rates.
Indeed, duration management and duration positioning play a key role in our management philosophy. (Duration is a measure of a fund’s sensitivity to changes in interest rates.) That said, it should be noted that regardless of interest rate conditions, we manage the Fund consistently. Our investment approach has always been tri-fold — to seek preservation of capital, daily liquidity and maximization of yield potential. We manage interest, liquidity and credit risk daily. Whether interest rates are historically low, high or in-between, we intend to continue to use our actively managed approach to provide the best possible return within the framework of the Fund’s guidelines and objectives.
How did you manage the Fund’s weighted average maturity during the Reporting Period?
On December 31, 2021, the Fund’s weighted average maturity was 7 days. At any given time, the Fund’s weighted average maturity is based on how market interest rates compare with our near-term expectations, including supply dynamics and monetary policy. At the end of the Reporting Period, the Fund’s weighted average maturity was 6 days. Maintaining weighted average maturities on the lower end of historical ranges during most of the Reporting Period was additive to Fund performance overall given the rising rate environment.
Throughout the Reporting Period, we focused on U.S. government agency repurchase agreements, U.S. Treasuries, U.S. government agency securities, U.S. Treasury repurchase agreements and floating rate, or variable rate, demand notes when and where we saw what we considered to be attractive opportunities. The Fund primarily held instruments with a maturity of one year or less.
The weighted average maturity of a money market fund is a measure of its price sensitivity to changes in interest rates. Also known as effective maturity, weighted average maturity measures the weighted average of the maturity date of bonds held by the Fund taking into consideration any available maturity shortening features.
How did you manage the Fund’s weighted average life during the Reporting Period?
During the Reporting Period, we managed the weighted average life of the Fund between 33 days and 110 days. The weighted average life of the Fund was 113 days as of December 31, 2021, and was 42 days on December 31, 2022. The weighted average life of a money market fund is a measure of a money market fund’s price sensitivity to changes in liquidity and/or credit risk.
Under amendments to SEC Rule 2a-7 that became effective in May 2010, the maximum allowable weighted average life of a money market fund is 120 days. While one of the goals of the SEC’s money market fund rule is to reinforce conservative investment practices across the money market fund industry, our security selection process has long emphasized conservative investment choices.
GOLDMAN SACHS VARIABLE INSURANCE TRUST GOVERNMENT MONEY MARKET FUND
How was the Fund invested during the Reporting Period?
The Fund had investments in U.S. government agency repurchase agreements, U.S. Treasury securities, U.S. government agency securities, U.S. Treasury repurchase agreements and floating rate, or variable rate, demand notes during the Reporting Period.
Adding most to Fund performance during the Reporting Period tended to be its floating rate exposure and its overnight repurchase agreement positions, which benefited in the rising rate environment. Conversely, the Fund’s fixed rate positions, albeit a modest percentage of Fund assets, detracted from performance during the Reporting Period.
Throughout, we stayed true to our investment discipline, favoring liquidity and high quality credits over added yield. The primary focal points for our team are consistently managing interest rate risk and credit risk. We were able to navigate interest rate risk by adjusting the Fund’s weighted average maturity longer or shorter as market conditions shifted and to mitigate potential credit risk by buying high quality, creditworthy names, strategies which added to the Fund’s performance during the Reporting Period. Throughout the Reporting Period, we managed the Fund’s allocations to different sub-sectors of the money market depending on their relative value. We also adapted a flexible approach to our duration management and positioning so that we could take advantage of opportunities wherever they may arise.
Did you make any changes in the Fund’s portfolio during the Reporting Period?
We made adjustments to the Fund’s weighted average maturity, weighted average life and specific security type composition allocations based on then-current market conditions, our near-term view, and anticipated and actual Fed monetary policy statements. During the Reporting Period, we generally increased the Fund’s exposure to Treasury floating rate securities and reduced its exposure to fixed rate securities.
Were there any changes to the Fund’s portfolio management team during the Reporting Period?
David Fishman, managing director and head of liquidity solutions at Goldman Sachs Asset Management retired on December 31, 2022. Shaun Cullinan, head of U.S. Money Market Portfolio Management at Goldman Sachs Asset Management remains the portfolio manager of the Fund. By design, all investment decisions for the Fund are performed within a team structure, with multiple subject matter experts. This strategic decision making has been a cornerstone of our approach and helps ensure continuity in the Fund.
What is the Fund’s tactical view and strategy for the months ahead?
At the end of the Reporting Period, inflationary pressures appeared to be easing, albeit from elevated levels, as goods and energy prices — the key drivers of the sharp acceleration in 2021 and most of 2022 — began to ease. Annual U.S. headline and core inflation fell in the last months of the calendar year, reaching 6.5% and 5.7%, respectively, at the end of the calendar year, suggesting the U.S. may be entering a phase of disinflation required for a potential soft landing. (A soft landing, in economics, is a cyclical downturn that avoids recession. It typically describes attempts by central banks to raise interest rates just enough to stop an economy from overheating and experiencing high inflation, without causing a significant increase in unemployment, or a hard landing.)
After unprecedented tightening in 2022, we anticipate three interest rate hikes of 25 basis points each by the Fed in 2023 for a terminal rate of 5.0% to 5.25%, in line with the median Fed policymaker projection in December 2022.
Looking ahead, our strategy continues to be flexibly guided by shifting market conditions, positioning the Fund and its duration to seek to take advantage of anticipated interest rate movements or lack thereof. As always, we intend to continue to use our actively managed approach to seek the best possible return within the framework of the Fund’s investment guidelines and objectives. In addition, we will continue to manage interest, liquidity and credit risk daily.
We will, of course, continue to closely monitor economic data, Fed policy, and any shifts in the money market yield curve, as we strive to strategically navigate the interest rate environment.
FUND BASICS
FUND COMPOSITION†
Security Type
(Percentage of Net Assets)

| † | The Fund is actively managed and, as such, its portfolio composition may differ over time. The percentage shown for each investment category reflects the value (based on amortized cost) of investments in that category as a percentage of net assets. Figures in the above chart may not sum to 100% due to the exclusion of other assets and liabilities. |
For more information about your Fund, please refer to www.GSAMFUNDS.com. There, you can learn more about your Fund’s investment strategies, holdings, and performance.
GOLDMAN SACHS VARIABLE INSURANCE TRUST GOVERNMENT MONEY MARKET FUND
Schedule of Investments
December 31, 2022
| | | | | | | | | | | | | | |
Principal Amount | | | Interest
Rate | | | Maturity
Date | | | Amortized
Cost | |
|
| U.S. Government Agency Obligations – 3.2% | |
| | Federal Farm Credit Banks Funding Corp. (SOFR + 0.06%) | |
| $ | 2,500,000 | | | | 4.490 | %(a)(b) | | | 01/03/23 | | | $ | 2,500,000 | |
| | 2,100,000 | | | | 4.465 | (a) | | | 04/05/24 | | | | 2,099,948 | |
| | 500,000 | | | | 4.370 | (a) | | | 04/29/24 | | | | 499,408 | |
| | 4,300,000 | | | | 4.475 | (a) | | | 06/27/24 | | | | 4,299,750 | |
| | 500,000 | | | | 4.370 | (a) | | | 07/22/24 | | | | 499,232 | |
| | 1,300,000 | | | | 4.405 | (a) | | | 09/13/24 | | | | 1,298,377 | |
| | 700,000 | | | | 4.470 | (a) | | | 09/17/24 | | | | 699,988 | |
| | 4,300,000 | | | | 4.490 | (a) | | | 10/16/24 | | | | 4,300,000 | |
| | 200,000 | | | | 4.470 | (a) | | | 11/14/24 | | | | 199,927 | |
| | 2,400,000 | | | | 4.500 | (a) | | | 11/25/24 | | | | 2,400,000 | |
| | 2,100,000 | | | | 4.490 | (a) | | | 12/19/24 | | | | 2,100,000 | |
| | 5,300,000 | | | | 4.500 | (a) | | | 12/27/24 | | | | 5,300,000 | |
| Federal Farm Credit Banks Funding Corp. (3 Mo. U.S. T-Bill
MMY + 0.02%) |
|
| | 900,000 | | | | 4.480 | (a) | | | 04/05/23 | | | | 899,994 | |
| | 500,000 | | | | 4.482 | (a) | | | 05/12/23 | | | | 500,000 | |
| Federal Farm Credit Banks Funding Corp. (3 Mo. U.S. T-Bill
MMY + 0.04%) |
|
| | 1,500,000 | | | | 4.495 | (a) | | | 10/23/23 | | | | 1,499,951 | |
| | 3,000,000 | | | | 4.500 | (a) | | | 10/30/23 | | | | 2,999,925 | |
| Federal Farm Credit Banks Funding Corp. (3 Mo. U.S. T-Bill
MMY + 0.06%) |
|
| | 200,000 | | | | 4.515 | (a) | | | 01/31/23 | | | | 200,006 | |
| | Federal Farm Credit Banks Funding Corp. (Prime Rate - 3.13%) | |
| | 500,000 | | | | 4.375 | (a) | | | 02/01/23 | | | | 500,000 | |
| | Federal Farm Credit Banks Funding Corp. (Prime Rate - 3.15%) | |
| | 900,000 | | | | 4.355 | (a) | | | 04/13/23 | | | | 899,992 | |
| | Federal Home Loan Bank Discount Notes | |
| | 700,000 | | | | 3.164 | | | | 02/21/23 | | | | 696,956 | |
| | 3,400,000 | | | | 4.711 | | | | 05/19/23 | | | | 3,340,829 | |
| | 2,800,000 | | | | 4.770 | | | | 05/24/23 | | | | 2,748,893 | |
| | Federal Home Loan Banks (SOFR + 0.08%) | |
| | 5,230,000 | | | | 4.660 | | | | 11/14/23 | | | | 5,229,688 | |
| | 2,400,000 | | | | 4.660 | | | | 11/15/23 | | | | 2,399,352 | |
| | 2,400,000 | | | | 4.670 | | | | 11/17/23 | | | | 2,399,457 | |
| | 1,800,000 | | | | 4.700 | | | | 11/24/23 | | | | 1,799,353 | |
| | 2,200,000 | | | | 4.750 | | | | 11/24/23 | | | | 2,199,695 | |
| | 2,100,000 | | | | 4.680 | | | | 11/29/23 | | | | 2,099,807 | |
| | 3,600,000 | | | | 4.460 | (a) | | | 02/23/24 | | | | 3,600,000 | |
| | 400,000 | | | | 4.385 | (a) | | | 03/01/24 | | | | 399,675 | |
| | 200,000 | | | | 4.370 | (a) | | | 07/01/24 | | | | 199,703 | |
| | 14,400,000 | | | | 4.500 | (a) | | | 11/22/24 | | | | 14,400,000 | |
| U.S. International Development Finance Corp. (3 Mo. U.S. T-Bill
+ 0.00%) |
|
| | 3,400,765 | | | | 4.500 | (a) | | | 01/07/23 | | | | 3,400,764 | |
| | 2,925,000 | | | | 4.555 | (a) | | | 01/07/23 | | | | 2,925,000 | |
| | |
| TOTAL U.S. GOVERNMENT AGENCY
OBLIGATIONS |
| | $ | 81,535,670 | |
| | |
| | | | | | | | | | | | | | |
|
| U.S. Treasury Obligations – 10.4% | |
| | United States Treasury Bills | |
| $ | 2,700,000 | | | | 2.887 | % | | | 01/19/23 | | | $ | 2,696,206 | |
| | 1,800,000 | | | | 2.913 | | | | 01/19/23 | | | | 1,797,449 | |
| | |
|
| U.S. Treasury Obligations – (continued) | |
| | United States Treasury Bills – (continued) | |
| 200,000 | | | | 2.969 | | | | 01/19/23 | | | | 199,711 | |
| | 1,011,000 | | | | 2.990 | | | | 01/19/23 | | | | 1,009,529 | |
| | 900,000 | | | | 2.995 | | | | 01/19/23 | | | | 898,688 | |
| | 21,389,000 | | | | 3.005 | | | | 01/26/23 | | | | 21,345,628 | |
| | 2,000,000 | | | | 4.605 | | | | 05/18/23 | | | | 1,966,207 | |
| | United States Treasury Floating Rate Note | |
| | 36,000,000 | | | | 4.600 | (a) | | | 10/31/24 | | | | 35,935,790 | |
| United States Treasury Floating Rate Note (3 Mo. U.S. T-Bill
MMY - 0.02%) |
|
| | 2,000,000 | | | | 4.445 | (a) | | | 01/31/24 | | | | 2,000,000 | |
| United States Treasury Floating Rate Note (3 Mo. U.S. T-Bill
MMY + 0.03%) |
|
| | 60,000,000 | | | | 4.494 | (a) | | | 04/30/23 | | | | 60,000,789 | |
| | 28,300,000 | | | | 4.489 | (a) | | | 07/31/23 | | | | 28,300,928 | |
| United States Treasury Floating Rate Note (3 Mo. U.S. T-Bill
MMY + 0.04%) |
|
| | 70,400,000 | | | | 4.495 | (a) | | | 10/31/23 | | | | 70,401,336 | |
| United States Treasury Floating Rate Note (3 Mo. U.S. T-Bill
MMY + 0.05%) |
|
| | 28,600,000 | | | | 4.509 | (a) | | | 01/31/23 | | | | 28,600,376 | |
| | United States Treasury Notes | |
| | 1,500,000 | | | | 0.125 | | | | 01/31/23 | | | | 1,499,038 | |
| | 400,000 | | | | 1.375 | | | | 02/15/23 | | | | 399,802 | |
| | 2,500,000 | | | | 2.000 | | | | 02/15/23 | | | | 2,503,596 | |
| | 500,000 | | | | 0.125 | | | | 02/28/23 | | | | 499,351 | |
| | 600,000 | | | | 2.625 | | | | 02/28/23 | | | | 601,677 | |
| | |
| TOTAL U.S. TREASURY
OBLIGATIONS |
| | $ | 260,656,101 | |
| | |
| TOTAL INVESTMENTS BEFORE
REPURCHASE AGREEMENTS |
| | $ | 342,191,771 | |
| | |
| | | | | | | | | | | | | | |
|
| Repurchase Agreements(c) – 86.2% | |
| | BNP Paribas | |
| $ | 2,500,000 | | | | 4.260 | % | | | 01/03/23 | | | $ | 2,500,000 | |
| | Maturity Value: $2,501,183 | |
| Collateralized by a U.S. Treasury Floating Rate Note, 4.323%, due
04/30/24 and U.S. Treasury Interest-Only Stripped Securities,
0.000%, due 02/15/37 to 11/15/45. The market value of the
collateral, including accrued interest, was $2,550,000. |
|
| | |
| | Joint Account III | |
| | 2,162,900,000 | | | | 4.303 | | | | 01/03/23 | | | | 2,162,900,000 | |
| | Maturity Value: $2,163,934,073 | |
| | |
| | TOTAL REPURCHASE AGREEMENTS | | | $ | 2,165,400,000 | |
| | |
| | TOTAL INVESTMENTS – 99.8% | | | $ | 2,507,591,771 | |
| | |
| OTHER ASSETS IN EXCESS OF
LIABILITIES – 0.2% |
| | | 5,168,522 | |
| | |
| | NET ASSETS – 100.0% | | | $ | 2,512,760,293 | |
| | |
| | |
| The accompanying notes are an integral part of these financial statements. | | 5 |
GOLDMAN SACHS VARIABLE INSURANCE TRUST GOVERNMENT MONEY MARKET FUND
Schedule of Investments (continued)
December 31, 2022
| | |
| The percentage shown for each investment category reflects the value of investments in that category as a percentage of net assets. |
| |
| (a) | | Variable or floating rate security. Except for floating rate notes (for which final maturity is disclosed), maturity date disclosed is the next interest reset date. Interest rate disclosed is that which is in effect on December 30, 2022. |
| |
| (b) | | The instrument is subject to a demand feature. |
| |
| (c) | | Unless noted, all repurchase agreements were entered into on December 30, 2022. Additional information on Joint Repurchase Agreement Account III appears in the Additional Investment Information section. |
| Interest rates represent either the stated coupon rate, annualized yield on date of purchase for discounted securities, or, for floating rate securities, the current reset rate, which is based upon current interest rate indices. |
|
| Maturity dates represent either the final legal maturity date on the security, the demand date for puttable securities, the date of the next interest rate reset for variable rate securities, or the prerefunded date for those types of securities. |
| | |
| |
| Investment Abbreviations: |
| MMY | | —Money Market Yield |
| Prime | | —Federal Reserve Bank Prime Loan Rate US |
| SOFR | | —Secured Overnight Financing Rate |
| T-Bill | | —Treasury Bill |
ADDITIONAL INVESTMENT INFORMATION
JOINT REPURCHASE AGREEMENT ACCOUNT III — At December 31, 2022, the Fund had undivided interests in the Joint Repurchase Agreement Account III, with a maturity date of January 3, 2023, as follows:
| | | | | | | | | | | | | |
| Principal Amount | | Maturity Value | | Collateral Value |
| | | $2,162,900,000 | | | | $ | 2,163,934,073 | | | | $ | 2,222,739,198 | |
REPURCHASE AGREEMENTS — At December 31, 2022, the Principal Amounts of the Fund’s interest in the Joint Repurchase Agreement Account III were as follows:
| | | | | | | | |
| Counterparty | | Interest Rate | | | Principal Amount | |
ABN Amro Bank N.V. | | | 4.300 | % | | $ | 463,478,571 | |
Bank of America, N.A. | | | 4.300 | | | | 386,232,143 | |
Bank of Montreal | | | 4.300 | | | | 154,492,857 | |
BofA Securities, Inc. | | | 4.300 | | | | 386,232,143 | |
Credit Agricole Corporate and Investment Bank | | | 4.300 | | | | 154,492,857 | |
Wells Fargo Securities LLC | | | 4.310 | | | | 617,971,429 | |
| | |
| TOTAL | | | | | | $ | 2,162,900,000 | |
At December 31, 2022, the Joint Repurchase Agreement Account III was fully collateralized by:
| | | | | | |
| Issuer | | Interest Rates | | | Maturity Dates |
| Federal Home Loan Mortgage Corp. | | | 2.000 to 6.500 | % | | 04/01/36 to 01/01/53 |
| Federal National Mortgage Association | | | 1.500 to 7.000 | | | 09/01/23 to 02/01/57 |
| Government National Mortgage Association | | | 2.500 to 5.000 | | | 02/20/45 to 08/20/52 |
| U.S. Treasury Bill | | | 0.000 | | | 03/23/23 |
| U.S. Treasury Bond | | | 2.250 | | | 08/15/46 |
| U.S. Treasury Notes | | | 0.625 to 3.875 | | | 03/31/24 to 08/15/31 |
| | |
| 6 | | The accompanying notes are an integral part of these financial statements. |
GOLDMAN SACHS VARIABLE INSURANCE TRUST GOVERNMENT MONEY MARKET FUND
Statement of Assets and Liabilities
December 31, 2022
| | | | |
| | | | |
| Assets: | | | |
Investments based on amortized cost | | $ | 342,191,771 | |
Repurchase agreements based on amortized cost | | | 2,165,400,000 | |
Cash | | | 46,319 | |
Receivables: | | | | |
Fund shares sold | | | 5,849,551 | |
Interest | | | 2,590,133 | |
Reimbursement from investment advisor | | | 20,509 | |
Other assets | | | 19,945 | |
| |
| Total assets | | | 2,516,118,228 | |
| | | | |
| | | | |
| Liabilities: | | | |
Payables: | | | | |
Investments purchased | | | 2,500,000 | |
Fund shares redeemed | | | 360,418 | |
Management fees | | | 269,672 | |
Distribution and Service fees and Transfer Agency fees | | | 176,086 | |
Dividend distribution | | | 958 | |
Accrued expenses | | | 50,801 | |
| |
| Total liabilities | | | 3,357,935 | |
| | | | |
| | | | |
| Net Assets: | | | |
Paid-in capital | | | 2,512,770,147 | |
Total distributable earnings (loss) | | | (9,854 | ) |
| |
| NET ASSETS | | $ | 2,512,760,293 | |
| |
Net asset value, offering and redemption price per share | | $ | 1.00 | |
Net Assets: | | | | |
Institutional Shares | | $ | 1,834,292,675 | |
Service Shares | | | 678,467,618 | |
| |
Total Net Assets | | $ | 2,512,760,293 | |
Shares outstanding $0.001 par value (unlimited number of shares authorized): | | | | |
Institutional Shares | | | 1,834,299,864 | |
Service Shares | | | 678,470,264 | |
| | |
| The accompanying notes are an integral part of these financial statements. | | 7 |
GOLDMAN SACHS VARIABLE INSURANCE TRUST GOVERNMENT MONEY MARKET FUND
Statement of Operations
For the Year Ended December 31, 2022
| | | | |
| | | | |
| Investment Income: | | | |
| |
Interest income | | $ | 31,778,292 | |
| | | | |
| | | | |
| Expenses: | | | |
Management fees | | | 2,537,165 | |
Distribution and Service fees — Service Shares | | | 1,515,217 | |
Transfer Agency fees(a) | | | 317,117 | |
Professional fees | | | 163,769 | |
Custody, accounting and administrative services | | | 65,143 | |
Printing and mailing fees | | | 55,660 | |
Trustee fees | | | 31,189 | |
| |
Other | | | 9,853 | |
| |
| Total expenses | | | 4,695,113 | |
| |
Less — expense reductions | | | (680,298 | ) |
| |
| Net expenses | | | 4,014,815 | |
| |
| NET INVESTMENT INCOME | | $ | 27,763,477 | |
| |
| Net realized loss from investment transactions | | | (219,781 | ) |
| |
| NET INCREASE IN NET ASSETS RESULTING FROM OPERATIONS | | $ | 27,543,696 | |
(a) Institutional and Service Shares incurred Transfer Agency fees of $195,909 and $121,208, respectively.
| | |
| 8 | | The accompanying notes are an integral part of these financial statements. |
GOLDMAN SACHS VARIABLE INSURANCE TRUST GOVERNMENT MONEY MARKET FUND
Statements of Changes in Net Assets
| | | | | | | | |
| | | For the
Fiscal Year Ended
December 31, 2022 | | | For the
Fiscal Year Ended
December 31, 2021 | |
| | | | | | | | |
| From operations: | | | | | | |
Net investment income | | $ | 27,763,477 | | | $ | 49,734 | |
Net realized gain (loss) from investment transactions | | | (219,781 | ) | | | 5,853 | |
| | |
| Net increase in net assets resulting from operations | | | 27,543,696 | | | | 55,587 | |
| | | | | | | | |
| | | | | | | | |
| Distributions to shareholders: | | | | | | |
From distributable earnings: | | | | | | | | |
Institutional Shares | | | (18,642,223 | ) | | | (34,324 | ) |
Service Shares | | | (8,911,722 | ) | | | (32,088 | ) |
| | |
| Total distributions to shareholders | | | (27,553,945 | ) | | | (66,412 | ) |
| | | | | | | | |
| | | | | | | | |
| From share transactions (at $1.00 per share): | | | | | | |
Proceeds from sales of shares | | | 2,307,084,458 | | | | 690,873,762 | |
Reinvestment of distributions | | | 27,550,932 | | | | 66,343 | |
Cost of shares redeemed | | | (846,623,441 | ) | | | (827,803,075 | ) |
| | |
| Net increase (decrease) in net assets resulting from share transactions | | | 1,488,011,949 | | | | (136,862,970 | ) |
| | |
| TOTAL INCREASE (DECREASE) | | | 1,488,001,700 | | | | (136,873,795 | ) |
| | | | | | | | |
| | | | | | | | |
| Net assets: | | | | | | |
| | |
Beginning of year | | | 1,024,758,593 | | | | 1,161,632,388 | |
| | |
End of year | | $ | 2,512,760,293 | | | $ | 1,024,758,593 | |
| | |
| The accompanying notes are an integral part of these financial statements. | | 9 |
GOLDMAN SACHS VARIABLE INSURANCE TRUST GOVERNMENT MONEY MARKET FUND
Financial Highlights
Selected Data for a Share Outstanding Throughout Each Year
| | | | | | | | | | | | | | | | | | | | |
| | | Goldman Sachs Government Money Market Fund | |
| | | Institutional Shares | |
| | | Year Ended December 31, | |
| | | 2022 | | | 2021 | | | 2020 | | | 2019 | | | 2018 | |
| | | | | | | | | | | | | | | | | | | | |
| Per Share Data: | | | | | | | | | | | | | | | |
| | | | | |
Net asset value, beginning of year | | $ | 1.00 | | | $ | 1.00 | | | $ | 1.00 | | | $ | 1.00 | | | $ | 1.00 | |
| | | | | |
Net investment income(a) | | | 0.016 | | | | — | (b) | | | 0.004 | | | | 0.021 | | | | 0.017 | |
| | | | | |
Distributions to shareholders from net investment income(c) | | | (0.016 | ) | | | — | (b) | | | (0.004 | ) | | | (0.021 | ) | | | (0.017 | ) |
| | | | | |
Net asset value, end of year | | $ | 1.00 | | | $ | 1.00 | | | $ | 1.00 | | | $ | 1.00 | | | $ | 1.00 | |
| | | | | |
Total return(d) | | | 1.58 | % | | | 0.01 | % | | | 0.43 | % | | | 2.11 | % | | | 1.74 | % |
| | | | | |
Net assets, end of year (in 000’s) | | $ | 1,834,293 | | | $ | 523,751 | | | $ | 582,216 | | | $ | 363,783 | | | $ | 411,447 | |
| | | | | |
Ratio of net expenses to average net assets | | | 0.17 | % | | | 0.09 | % | | | 0.18 | % | | | 0.18 | % | | | 0.18 | % |
| | | | | |
Ratio of total expenses to average net assets | | | 0.20 | % | | | 0.21 | % | | | 0.20 | % | | | 0.21 | % | | | 0.23 | % |
| | | | | |
Ratio of net investment income to average net assets | | | 1.92 | % | | | — | %(e) | | | 0.35 | % | | | 2.06 | % | | | 1.73 | % |
| (a) | Calculated based on the average shares outstanding methodology. |
| (b) | Amount is less than $0.0005 per share. |
| (c) | Distributions may not coincide with the current year net investment income or net realized gains as distributions may be paid from current or prior year earnings. |
| (d) | Assumes reinvestment of all distributions. Returns do not reflect the deduction of taxes that a shareholder would pay on Fund distributions. |
| (e) | Amount is less than 0.005%. |
| | |
| 10 | | The accompanying notes are an integral part of these financial statements. |
GOLDMAN SACHS VARIABLE INSURANCE TRUST GOVERNMENT MONEY MARKET FUND
Financial Highlights (continued)
Selected Data for a Share Outstanding Throughout Each Year
| | | | | | | | | | | | | | | | | | | | |
| | | Goldman Sachs Government Money Market Fund | |
| | | Service Shares | |
| | | Year Ended December 31, | |
| | | 2022 | | | 2021 | | | 2020 | | | 2019 | | | 2018 | |
| | | | | | | | | | | | | | | | | | | | |
| Per Share Data: | | | | | | | | | | | | | | | |
| | | | | |
Net asset value, beginning of year | | $ | 1.00 | | | $ | 1.00 | | | $ | 1.00 | | | $ | 1.00 | | | $ | 1.00 | |
| | | | | |
Net investment income(a) | | | 0.014 | | | | — | (b) | | | 0.003 | | | | 0.018 | | | | 0.015 | |
| | | | | |
Distributions to shareholders from net investment income(c) | | | (0.014 | ) | | | — | (b) | | | (0.003 | ) | | | (0.018 | ) | | | (0.015 | ) |
| | | | | |
Net asset value, end of year | | $ | 1.00 | | | $ | 1.00 | | | $ | 1.00 | | | $ | 1.00 | | | $ | 1.00 | |
| | | | | |
Total return(d) | | | 1.37 | % | | | 0.01 | % | | | 0.27 | % | | | 1.86 | % | | | 1.48 | % |
| | | | | |
Net assets, end of year (in 000’s) | | $ | 678,468 | | | $ | 501,008 | | | $ | 579,416 | | | $ | 350,112 | | | $ | 368,652 | |
| | | | | |
Ratio of net expenses to average net assets | | | 0.38 | % | | | 0.09 | % | | | 0.33 | % | | | 0.43 | % | | | 0.43 | % |
| | | | | |
Ratio of total expenses to average net assets | | | 0.45 | % | | | 0.46 | % | | | 0.45 | % | | | 0.46 | % | | | 0.48 | % |
| | | | | |
Ratio of net investment income to average net assets | | | 1.48 | % | | | — | %(e) | | | 0.19 | % | | | 1.81 | % | | | 1.48 | % |
| (a) | Calculated based on the average shares outstanding methodology. |
| (b) | Amount is less than $0.0005 per share. |
| (c) | Distributions may not coincide with the current year net investment income or net realized gains as distributions may be paid from current or prior year earnings. |
| (d) | Assumes reinvestment of all distributions. Returns do not reflect the deduction of taxes that a shareholder would pay on Fund distributions. |
| (e) | Amount is less than 0.005%. |
| | |
| The accompanying notes are an integral part of these financial statements. | | 11 |
GOLDMAN SACHS VARIABLE INSURANCE TRUST GOVERNMENT MONEY MARKET FUND
Notes to Financial Statements
December 31, 2022
1. ORGANIZATION
Goldman Sachs Variable Insurance Trust (the “Trust” or “VIT”) is a Delaware statutory trust registered under the Investment Company Act of 1940, as amended (the “Act”), as an open-end management investment company. The Trust includes the Goldman Sachs Government Money Market Fund (the “Fund”). The Fund is a diversified portfolio under the Act offering two classes of shares — Institutional and Service Shares. Shares of the Trust are offered to separate accounts of participating life insurance companies for the purpose of funding variable annuity contracts and variable life insurance policies.
Goldman Sachs Asset Management, L.P. (“GSAM”), an affiliate of Goldman Sachs & Co. LLC (“Goldman Sachs”), serves as investment adviser to the Fund pursuant to a management agreement (the “Agreement”) with the Trust.
2. SIGNIFICANT ACCOUNTING POLICIES
The financial statements have been prepared in accordance with accounting principles generally accepted in the United States of America (“GAAP”) and require management to make estimates and assumptions that may affect the reported amounts and disclosures. Actual results may differ from those estimates and assumptions. The Fund is an investment company under GAAP and follows the accounting and reporting guidance applicable to investment companies.
A. Investment Valuation — The investment valuation policy of the Fund is to use the amortized-cost method permitted by Rule 2a-7 under the Act for valuing portfolio securities. The amortized-cost method of valuation involves valuing a security at its cost and thereafter applying a constant accretion or amortization to maturity of any discount or premium. Normally, a security’s amortized cost will approximate its market value. Under procedures and tolerances approved by the Board of Trustees (“Trustees”), GSAM evaluates daily the difference between the Fund’s net asset value (“NAV”) per share using the amortized costs of its portfolio securities and the Fund’s NAV per share using market-based values of its portfolio securities. The market-based value of a portfolio security is determined, where readily available, on the basis of market quotations provided by pricing services or securities dealers, or, where accurate market quotations are not readily available, on the basis of the security’s fair value as determined in accordance with the Valuation Procedures. The pricing services may use valuation models or matrix pricing, which may consider (among other things): (i) yield or price with respect to debt securities that are considered comparable in characteristics such as rating, interest rate and maturity date or (ii) quotations from securities dealers to determine current value.
B. Investment Income and Investments — Interest income is accrued daily and adjusted for amortization of premiums and accretion of discounts. Investment transactions are reflected on trade date. Realized gains and losses are calculated using identified cost.
C. Class Allocations and Expenses — Investment income, realized and unrealized gain (loss), if any, and non-class specific expenses of the Fund are allocated daily based upon the proportion of net assets of each class. Class specific expenses, where applicable, are borne by the respective share classes and include Distribution and Service and Transfer Agency fees. Non-class specific expenses directly incurred by the Fund are charged to the Fund, while such expenses incurred by the Trust are allocated across the Fund on a straight-line and/or pro-rata basis depending upon the nature of the expenses.
D. Federal Taxes and Distributions to Shareholders — It is the Fund’s policy to comply with the requirements of the Internal Revenue Code of 1986, as amended (the “Code”), applicable to regulated investment companies (mutual funds) and to distribute each year substantially all of its investment company taxable and tax-exempt income and capital gains to its shareholders. Accordingly, the Fund is not required to make any provisions for the payment of federal income tax. Distributions to shareholders are declared and recorded daily and paid monthly by the Fund and may include short-term capital gains. Long-term capital gain distributions, if any, are declared and paid annually. The Fund may defer or accelerate the timing of the distribution of short-term capital gains (or any portion thereof).
The characterization of distributions to shareholders for financial reporting purposes is determined in accordance with federal income tax rules, which may differ from GAAP. The source of the Fund’s distributions may be shown in the accompanying financial statements as either from distributable earnings or capital. Certain components of the Fund’s net assets on the Statement of Assets and Liabilities reflect permanent GAAP/tax differences based on the appropriate tax character.
GOLDMAN SACHS VARIABLE INSURANCE TRUST GOVERNMENT MONEY MARKET FUND
2. SIGNIFICANT ACCOUNTING POLICIES (continued)
The tax character of distributions paid during the fiscal years ended December 31, 2022 and December 31, 2021 were as follows:
| | | | | | | | |
| | | 2022 | | | 2021 | |
| Distribution paid from: | | | | | | | | |
| Ordinary income | | $ | 27,553,945 | | | $ | 66,412 | |
| | |
| Total taxable distributions | | $ | 27,553,945 | | | $ | 66,412 | |
As of December 31, 2022, the components of accumulated earnings (losses) on a tax basis were as follows:
| | | | |
| Undistributed ordinary income — net | | $ | 210,888 | |
| Capital loss carryforward: Perpetual Short-Term | | | (210,225 | ) |
| Timing differences (Distributions Payable and Post-October Capital Loss Deferral) | | | (10,517 | ) |
| Total accumulated earnings (losses) — net | | $ | (9,854 | ) |
The amortized cost for the Fund stated in the accompanying Statement of Assets and Liabilities also represents aggregate cost for U.S. federal income tax purposes.
GSAM has reviewed the Fund’s tax positions for all open tax years (the current and prior three years, as applicable) and has concluded that no provision for income tax is required in the Fund’s financial statements. Such open tax years remain subject to examination and adjustment by tax authorities.
E. Forward Commitments — A forward commitment involves entering into a contract to purchase or sell securities, typically on an extended settlement basis, for a fixed price at a future date. The purchase of securities on a forward commitment basis involves a risk of loss if the value of the security to be purchased declines before the settlement date. Conversely, the sale of securities on a forward commitment basis involves the risk that the value of the securities sold may increase before the settlement date. Although the Fund will generally purchase securities on a forward commitment basis with the intention of acquiring the securities for its portfolio, the Fund may dispose of forward commitments prior to settlement which may result in a realized gain or loss.
F. Repurchase Agreements — Repurchase agreements involve the purchase of securities subject to the seller’s agreement to repurchase the securities at a mutually agreed upon date and price, under the terms of a Master Repurchase Agreement (“MRA”). During the term of a repurchase agreement, the value of the underlying securities held as collateral on behalf of the Fund, including accrued interest, is required to exceed the value of the repurchase agreement, including accrued interest. The gross value of repurchase agreements is included in the Statement of Assets and Liabilities for financial reporting purposes. The underlying securities for all repurchase agreements are held at the Fund’s custodian or designated sub-custodians under tri-party repurchase agreements.
An MRA governs transactions between the Fund and select counterparties. An MRA contains provisions for, among other things, initiation of the transaction, income payments, events of default, and maintenance of securities for repurchase agreements. An MRA also permits offsetting with collateral to create one single net payment in the event of default or similar events, including the bankruptcy or insolvency of a counterparty.
If the seller defaults, the Fund could suffer a loss to the extent that the proceeds from the sale of the underlying securities and other collateral held by the Fund are less than the repurchase price and the Fund’s costs associated with delay and enforcement of the repurchase agreement. In addition, in the event of default or insolvency of the seller, a court could determine that the Fund’s interest in the collateral is not enforceable, resulting in additional losses to the Fund.
GOLDMAN SACHS VARIABLE INSURANCE TRUST GOVERNMENT MONEY MARKET FUND
Notes to Financial Statements (continued)
December 31, 2022
2. SIGNIFICANT ACCOUNTING POLICIES (continued)
Pursuant to exemptive relief granted by the Securities and Exchange Commission (“SEC”) and terms and conditions contained therein, the Fund, together with other funds of the Trust and registered investment companies having management agreements with GSAM or its affiliates, may transfer uninvested cash into joint accounts, the daily aggregate balance of which is invested in one or more repurchase agreements. Under these joint accounts, the Fund maintains pro-rata credit exposure to the underlying repurchase agreements’ counterparties. With the exception of certain transaction fees, the Fund is not subject to any expenses in relation to these investments.
3. INVESTMENTS AND FAIR VALUE MEASUREMENTS
U.S. GAAP defines the fair value of a financial instrument as the amount that would be received to sell an asset or paid to transfer a liability in an orderly transaction between market participants at the measurement date (i.e., the exit price); the Fund’s policy is to use the market approach. GAAP establishes a fair value hierarchy that prioritizes the inputs to valuation techniques used to measure fair value. The hierarchy gives the highest priority to unadjusted quoted prices in active markets for identical assets or liabilities (Level 1 measurements) and the lowest priority to unobservable inputs (Level 3 measurements). The level in the fair value hierarchy within which the fair value measurement in its entirety falls shall be determined based on the lowest level input that is significant to the fair value measurement in its entirety. The levels used for classifying investments are not necessarily an indication of the risk associated with investing in these investments. The three levels of the fair value hierarchy are described below:
Level 1 — Unadjusted quoted prices in active markets that are accessible at the measurement date for identical, unrestricted assets or liabilities;
Level 2 — Quoted prices in markets that are not active or financial instruments for which significant inputs are observable (including, but not limited to, quoted prices for similar investments, interest rates, foreign exchange rates, volatility and credit spreads), either directly or indirectly;
Level 3 — Prices or valuations that require significant unobservable inputs (including GSAM’s assumptions in determining fair value measurement).
The Trustees have approved Valuation Procedures that govern the valuation of the portfolio investments held by the Fund, including investments for which market quotations are not readily available. With respect to the Funds’ investments that do not have readily available market quotations, the Trustees have designated the Adviser as the valuation designee to perform fair valuations pursuant to Rule 2a-5 under the Investment Company Act of 1940 (the “Valuation Designee”). GSAM has day-to-day responsibility for implementing and maintaining internal controls and procedures related to the valuation (including both the amortized cost and market-based methods of valuation) of the Fund’s investments. To assess the continuing appropriateness of pricing sources and methodologies related to the market-based method of valuation, GSAM regularly performs price verification procedures and issues challenges as necessary to third party pricing vendors or brokers, and any differences are reviewed in accordance with the Valuation Procedures.
As of December 31, 2022, all investments, including repurchase agreements, are classified as Level 2 of the fair value hierarchy. Please refer to the Schedule of Investments for further detail.
4. AGREEMENTS AND AFFILIATED TRANSACTIONS
A. Management Agreement — Under the Agreement, GSAM manages the Fund, subject to the general supervision of the Trustees.
As compensation for the services rendered pursuant to the Agreement, the assumption of the expenses related thereto and administration of the Fund’s business affairs, including providing facilities, GSAM is entitled to a management fee, accrued daily and paid monthly, equal to an annual percentage rate of the Fund’s average daily net assets.
B. Distribution and Service (12b-1) Plan — The Trust, on behalf of the Service Shares of the Fund, has adopted a Distribution and Service Plan subject to Rule 12b-1 under the Act. Under the Distribution and Service Plan, Goldman Sachs, which serves as
GOLDMAN SACHS VARIABLE INSURANCE TRUST GOVERNMENT MONEY MARKET FUND
4. AGREEMENTS AND AFFILIATED TRANSACTIONS (continued)
distributor (the “Distributor”), is entitled to a fee accrued daily and paid monthly, for distribution services and personal and account maintenance services, which may then be paid by Goldman Sachs to authorized dealers, equal to, on an annual basis, 0.25% of the Fund’s average daily net assets attributable to Service Shares.
C. Transfer Agency Agreement — Goldman Sachs also serves as the transfer agent of the Fund for a fee pursuant to a Transfer Agency Agreement. The fee charged for such transfer agency services is accrued daily and paid monthly at an annual rate of 0.02% of the Fund’s average daily net assets of Institutional Shares and Service Shares.
D. Other Expense Agreements — GSAM has agreed to limit certain “Other Expenses” of the Fund (excluding acquired fund fees and expenses, transfer agency fees and expenses, taxes, interest, brokerage fees, expenses of shareholder meetings, litigation and indemnification, and extraordinary expenses) to the extent that such expenses exceed, on an annual basis, 0.004% of the average daily net assets of the Fund. Such Other Expense reimbursements, if any, are accrued daily and paid monthly. In addition, the Fund is not obligated to reimburse GSAM for prior fiscal year expense reimbursements, if any. This Other Expense limitation will remain in place through at least April 29, 2023, and prior to such date GSAM may not terminate the arrangement without the approval of the Trustees. In addition, the Fund has entered into certain offset arrangements with the custodian and the transfer agent, which may result in a reduction of the Fund’s expenses and are received irrespective of the application of the “Other Expense” limitation described above. For the year ended December 31, 2022, these expense reductions, including any fee waiver and Other Expense reimbursements, were as follows:
| | | | | | | | | | | | | | | | | | |
Management
Fee Waivers | | | Distribution,
Administration,
Service and/or
Shareholder
Administration
Plans Fee Waivers | | | Transfer Agency
Waiver | | | Other
Expense
Reimbursements | | | Total
Expense
Reductions | |
| | | | |
| $ | 121,035 | | | $ | 257,929 | | | $ | 39,149 | | | $ | 262,185 | | | $ | 680,298 | |
E. Contractual and Net Fund Expenses — The investment adviser may contractually agree to waive or reimburse certain fees and expenses until a specified date. The investment adviser or transfer agent may also voluntarily waive certain fees and expenses, and such voluntary waivers may be discontinued or modified at any time without notice. The following table outlines such fees (net of waivers) and Other Expenses (net of reimbursements and custodian and transfer agency fee credit reductions) in order to determine the Fund’s net annualized expenses for the fiscal year. The Fund is not obligated to reimburse GSAM or Goldman Sachs for prior fiscal year fee waivers and/or expense reimbursements, if any.
| | | | | | | | | | | | | | | | |
| | | Institutional Shares | | | Service Shares | |
| Fee/Expense Type | | Contractual rate,
if any | | | Ratio of net expenses to
average net assets
for the year ended
December 31, 2022 | | | Contractual rate,
if any | | | Ratio of net expenses to
average net assets
for the year ended
December 31, 2022 | |
| Management Fee | | | 0.16 | % | | | 0.15 | % | | | 0.16 | % | | | 0.15 | % |
| Distribution and Service Fees | | | N/A | | | | N/A | | | | 0.25 | | | | 0.21 | |
| Transfer Agency Fees | | | 0.02 | | | | 0.02 | | | | 0.02 | | | | 0.02 | |
| Other Expenses | | | — | | | | — | (a) | | | — | | | | — | (a) |
| Net Expenses | | | | | | | 0.17 | % | | | | | | | 0.38 | % |
| (a) | Amount is less than 0.005% of average net assets. |
N/A — Fees not applicable to respective share class.
F. Other Transactions with Affiliates — The Fund may purchase securities from, or sell securities to, an affiliated fund provided the affiliation is solely due to having a common investment adviser, common officers, or common Trustees.
For the fiscal year ended December 31, 2022, there were no purchase and sale transactions with affiliated funds.
GOLDMAN SACHS VARIABLE INSURANCE TRUST GOVERNMENT MONEY MARKET FUND
Notes to Financial Statements (continued)
December 31, 2022
4. AGREEMENTS AND AFFILIATED TRANSACTIONS (continued)
G. Line of Credit Facility — As of December 31, 2022, the Fund participated in a $1,250,000,000 committed, unsecured revolving line of credit facility (the “facility”) together with other funds of the Trust and certain registered investment companies having management agreements with GSAM or its affiliates. This facility is to be used for temporary emergency purposes, or to allow for an orderly liquidation of securities to meet redemption requests. The interest rate on borrowings is based on the federal funds rate. The facility also requires a fee to be paid by the Fund based on the amount of the commitment that has not been utilized. For the fiscal year ended December 31, 2022, the Fund did not have any borrowings under the facility. Prior to April 22, 2022, the facility was $1,000,000,000.
5. OTHER RISKS
The Fund’s risks include, but are not limited to, the following:
Floating and Variable Rate Obligations Risk — Floating rate and variable rate obligations are debt instruments issued by companies or other entities with interest rates that reset periodically (typically, daily, monthly, quarterly, or semiannually) in response to changes in the market rate of interest on which the interest rate is based. Such market rates are generally the Secured Overnight Financing Rate, London Interbank Offered Rate (“LIBOR”), the Prime Rate of a designated U.S. bank, the Federal Funds Rate, or another base lending rate used by commercial lenders. For floating and variable rate obligations, there may be a lag between an actual change in the underlying interest rate benchmark and the reset time for an interest payment of such an obligation, which could harm or benefit the Fund, depending on the interest rate environment or other circumstances. In a rising interest rate environment, for example, a floating or variable rate obligation that does not reset immediately would prevent the Fund from taking full advantage of rising interest rates in a timely manner. However, in a declining interest rate environment, the Fund may benefit from a lag due to an obligation’s interest rate payment not being immediately impacted by a decline in interest rates.
At the end of 2021, certain LIBORs were discontinued, but the most widely used LIBORs may continue to be provided on a representative basis until June 2023. The unavailability or replacement of LIBOR may affect the value, liquidity or return on certain Fund investments and may result in costs incurred in connection with closing out positions and entering into new trades. Any pricing adjustments to the Fund’s investments resulting from a substitute reference rate may also adversely affect the Fund’s performance and/or NAV.
Interest Rate Risk — When interest rates increase, the Fund’s yield will tend to be lower than prevailing market rates, and the market value of its investments will generally decline. The Fund may face a heightened level of interest rate risk in connection with the type and extent of certain monetary policy changes made by the Federal Reserve, such as target interest rate changes. A wide variety of market factors can cause interest rates to rise, including central bank monetary policy, rising inflation and changes in general economic conditions. The risks associated with changing interest rates may have unpredictable effects on the markets and the Fund’s investments. A low interest rate environment poses additional risks to the Fund because low yields on the Fund’s portfolio holdings may have an adverse impact on the Fund’s ability to provide a positive yield to its shareholders, pay expenses out of current income, or minimize the volatility of the Fund’s NAV per share and/ or achieve its investment objective. Fluctuations in interest rates may also affect the liquidity of the Fund’s investments. A sudden or unpredictable increase in interest rates may cause volatility in the market and may decrease the liquidity of the Fund’s investments, which would make it harder for the Fund to sell its investments at an advantageous time.
Large Shareholder Transactions Risk — The Fund may experience adverse effects when certain large shareholders, such as other funds, participating insurance companies, accounts and Goldman Sachs affiliates, purchase or redeem large amounts of shares of the Fund. Such large shareholder redemptions, which may occur rapidly or unexpectedly, may cause the Fund to sell portfolio securities at times when it would not otherwise do so, which may negatively impact the Fund’s NAV and liquidity. Similarly, large Fund share purchases may adversely affect a Fund’s performance to the extent that the Fund is delayed in investing new cash or otherwise maintains a larger cash position than it ordinarily would. These transactions may also accelerate the realization of taxable income to shareholders if such sales of investments resulted in gains, and may also increase transaction costs. In addition, a large redemption could result in the Fund’s current expenses being allocated over a smaller asset base, leading to an increase in the Fund’s expense ratio.
GOLDMAN SACHS VARIABLE INSURANCE TRUST GOVERNMENT MONEY MARKET FUND
5. OTHER RISKS (continued)
Market and Credit Risks — In the normal course of business, the Fund trades financial instruments and enter into financial transactions where risk of potential loss exists due to changes in the market (market risk). The value of the securities in which the Fund invests may go up or down in response to the prospects of individual companies, particular sectors or governments and/or general economic conditions throughout the world due to increasingly interconnected global economies and financial markets. Events such as war, acts of terrorism, social unrest, natural disasters, the spread of infectious illness or other public health threats could also significantly impact the Fund and its investments. Additionally, the Fund may also be exposed to credit risk in the event that an issuer or guarantor fails to perform or that an institution or entity with which the Fund has unsettled or open transactions defaults.
6. IDEMNIFICATIONS
Under the Trust’s organizational documents, its Trustees, officers, employees and agents are indemnified, to the extent permitted by the Act and state law, against certain liabilities that may arise out of performance of their duties to the Fund. Additionally, in the course of business, the Fund enters into contracts that contain a variety of indemnification clauses. The Fund’s maximum exposure under these arrangements is unknown, as this would involve future claims that may be made against the Fund that have not yet occurred. However, GSAM believes the risk of loss under these arrangements to be remote.
7. SUBSEQUENT EVENTS
Subsequent events after the Statement of Assets and Liabilities date have been evaluated and GSAM has concluded that there is no impact requiring adjustment or disclosure in the financial statements.
8. SUMMARY OF SHARE TRANSACTIONS
Share activity is as follows:
| | | | | | | | |
| | | For the Fiscal Year Ended
December 31, 2022 | | | For the Fiscal Year Ended
December 31, 2021 | |
| Institutional Shares* | | | | | | | | |
| Shares sold | | | 1,919,889,511 | | | | 496,281,091 | |
| Reinvestment of distributions | | | 18,639,420 | | | | 34,294 | |
| Shares redeemed | | | (627,979,771 | ) | | | (554,775,442 | ) |
| | | | 1,310,549,160 | | | | (58,460,057 | ) |
| Service Shares* | | | | | | | | |
| Shares sold | | | 387,194,947 | | | | 194,592,671 | |
| Reinvestment of distributions | | | 8,911,512 | | | | 32,049 | |
| Shares redeemed | | | (218,643,670 | ) | | | (273,027,633 | ) |
| | | | 177,462,789 | | | | (78,402,913 | ) |
| | |
| NET INCREASE (DECREASE) IN SHARES | | | 1,488,011,949 | | | | (136,862,970 | ) |
| * | Valued at $1.00 per share. |
Report of Independent Registered Public Accounting Firm
To the Board of Trustees of Goldman Sachs Variable Insurance Trust and Shareholders of
Goldman Sachs Government Money Market Fund
Opinion on the Financial Statements
We have audited the accompanying statement of assets and liabilities, including the schedule of investments, of Goldman Sachs Government Money Market Fund (one of the funds constituting Goldman Sachs Variable Insurance Trust, referred to hereafter as the “Fund”) as of December 31, 2022, the related statement of operations for the year ended December 31, 2022, the statements of changes in net assets for each of the two years in the period ended December 31, 2022, including the related notes, and the financial highlights for each of the five years in the period ended December 31, 2022 (collectively referred to as the “financial statements”). In our opinion, the financial statements present fairly, in all material respects, the financial position of the Fund as of December 31, 2022, the results of its operations for the year then ended, the changes in its net assets for each of the two years in the period ended December 31, 2022 and the financial highlights for each of the five years in the period ended December 31, 2022 in conformity with accounting principles generally accepted in the United States of America.
Basis for Opinion
These financial statements are the responsibility of the Fund’s management. Our responsibility is to express an opinion on the Fund’s financial statements based on our audits. We are a public accounting firm registered with the Public Company Accounting Oversight Board (United States) (PCAOB) and are required to be independent with respect to the Fund in accordance with the U.S. federal securities laws and the applicable rules and regulations of the Securities and Exchange Commission and the PCAOB.
We conducted our audits of these financial statements in accordance with the standards of the PCAOB. Those standards require that we plan and perform the audit to obtain reasonable assurance about whether the financial statements are free of material misstatement, whether due to error or fraud.
Our audits included performing procedures to assess the risks of material misstatement of the financial statements, whether due to error or fraud, and performing procedures that respond to those risks. Such procedures included examining, on a test basis, evidence regarding the amounts and disclosures in the financial statements. Our audits also included evaluating the accounting principles used and significant estimates made by management, as well as evaluating the overall presentation of the financial statements. Our procedures included confirmation of securities owned as of December 31, 2022 by correspondence with the custodian and brokers; when replies were not received from brokers, we performed other auditing procedures. We believe that our audits provide a reasonable basis for our opinion.
/s/ PricewaterhouseCoopers LLP
Boston, Massachusetts
February 14, 2023
We have served as the auditor of one or more investment companies in the Goldman Sachs fund complex since 2000.
GOLDMAN SACHS VARIABLE INSURANCE TRUST GOVERNMENT MONEY MARKET FUND
| | |
| Fund Expenses — Six Month Period Ended December 31, 2022 (Unaudited) | | |
As a shareholder of Institutional Shares and Service Shares of the Fund, you incur ongoing costs, including management fees; distribution and service (12b-1) fees (with respect to Service Shares); and other Fund expenses. This example is intended to help you understand your ongoing costs (in dollars) of investing in the Fund and to compare these costs with the ongoing costs of investing in other mutual funds.
The example is based on an investment of $1,000 invested at the beginning of the period and held for the entire period from July 1, 2022, through December 31, 2022, which represents a period of 184 days of a 365 day year.
Actual Expenses — The first line in the table below provides information about actual account values and actual expenses. You may use the information in this line, together with the amount you invested, to estimate the expenses that you paid over the period. Simply divide your account value by $1,000 (for example, an $8,600 account value divided by $1,000=8.6), then multiply the result by the number in the first line under the heading entitled “Expenses Paid” to estimate the expenses you paid on your account during this period.
Hypothetical Example for Comparison Purposes — The second line in the table below provides information about hypothetical account values and hypothetical expenses based on the Fund’s actual net expense ratio and an assumed rate of return of 5% per year before expenses, which is not the Fund’s actual return. The hypothetical account values and expenses may not be used to estimate the actual ending account balance or expenses you paid for the period. You may use this information to compare the ongoing costs of investing in the Fund and other funds. To do so, compare this 5% hypothetical example with the 5% hypothetical examples that appear in the shareholder reports of the other funds.
Please note that the expenses shown in the table are meant to highlight your ongoing costs only and do not reflect any transactional costs, such as sales charges, redemption fees, or exchange fees. Therefore, the second line of the table is useful in comparing ongoing costs only and will not help you determine the relative total costs of owning different funds. In addition, if these transactional costs were included, your costs would have been higher.
| | | | | | | | | | | | |
| Share Class | | Beginning
Account Value
7/1/22 | | | Ending
Account Value
12/31/22 | | | Expenses Paid
for the
6 Months
Ended 12/31/22* | |
| Institutional Shares | | | | | | | | | | | | |
| | | | |
| Actual | | $ | 1,000.00 | | | $ | 1,014.02 | | | $ | 0.91 | |
| Hypothetical 5% return | | $ | 1,000.00 | | | $ | 1,024.30 | + | | $ | 0.92 | |
| Service Shares | | | | | | | | | | | | |
| | | | |
| Actual | | $ | 1,000.00 | | | $ | 1,012.74 | | | $ | 2.18 | |
| Hypothetical 5% return | | $ | 1,000.00 | | | $ | 1,023.04 | + | | $ | 2.19 | |
| | * | Expenses are calculated using the Fund’s annualized net expense ratio for each class, which represents the ongoing expenses as a percentage of net assets for the six months ended December 31, 2022. Expenses are calculated by multiplying the annualized net expense ratio by the average account value for the period; then multiplying the result by the number of days in the most recent fiscal half year (or, since inception, if shorter); and then dividing that result by the number of days in the period. The annualized net expense ratios for the period were 0.18% and 0.43% for Institutional Shares and Service Shares, respectively. | |
| | + | Hypothetical expenses are based on the Fund’s actual annualized net expense ratio and an assumed rate of return of 5% per year before expenses. | |
GOLDMAN SACHS VARIABLE INSURANCE TRUST GOVERNMENT MONEY MARKET FUND
Trustees and Officers (Unaudited)
Independent Trustees
| | | | | | | | | | | | |
| | | | | |
Name, Address and Age1 | | Position(s) Held
with the Trust | | Term of
Office and
Length of
Time Served2 | | Principal Occupation(s)
During Past 5 Years | | Number of
Portfolios in
Fund Complex
Overseen by
Trustee3 | | | Other
Directorships
Held by Trustee4 |
Jessica Palmer5 Age: 73 | | Chair of the Board of Trustees | | Since 2018 (Trustee since 2007) | | Ms. Palmer is retired. She was formerly Consultant, Citigroup Human Resources Department (2007-2008); Managing Director, Citigroup Corporate and Investment Banking (previously, Salomon Smith Barney/Salomon Brothers) (1984-2006). Ms. Palmer was a Member of the Board of Trustees of Indian Mountain School (private elementary and secondary school) (2004-2009). Chair of the Board of Trustees — Goldman Sachs Variable Insurance Trust and Goldman Sachs Trust. | | | 103 | | | None |
Dwight L. Bush Age: 65 | | Trustee | | Since 2020 | | Ambassador Bush is President and CEO of D.L. Bush & Associates (a financial advisory and private investment firm) (2002-2014 and 2017- Present); Director of MoneyLion, Inc. (an operator of a data-driven, digital financial platform) (2021- Present); and was formerly U.S. Ambassador to the Kingdom of Morocco (2014-2017) and a Member of the Board of Directors of Santander Bank, N.A. (2018-2019). Previously, Ambassador Bush served as an Advisory Board Member of Goldman Sachs Trust and Goldman Sachs Variable Insurance Trust (October 2019-January 2020). Trustee — Goldman Sachs Variable Insurance Trust and Goldman Sachs Trust. | | | 103 | | | MoneyLion, Inc. (an operator of a data-driven, digital financial platform) |
Kathryn A. Cassidy Age: 68 | | Trustee | | Since 2015 | | Ms. Cassidy is retired. She is Director, Vertical Aerospace Ltd. (an aerospace and technology company) (2021-Present). Formerly, Ms. Cassidy was Advisor to the Chairman (May 2014-December 2014); and Senior Vice President and Treasurer (2008-2014), General Electric Company & General Electric Capital Corporation (technology and financial services companies). Trustee — Goldman Sachs Variable Insurance Trust and Goldman Sachs Trust. | | | 103 | | | Vertical Aerospace Ltd. (an aerospace and technology company) |
John G. Chou Age: 66 | | Trustee | | Since 2022 | | Mr. Chou is Executive Vice President and Special Advisor to the Chairman and CEO of AmerisourceBergen Corporation (a pharmaceutical and healthcare company) (2021-Present); and formerly held various executive management positions with AmerisourceBergen Corporation, including Executive Vice President and Chief Legal Officer (2019-2021); Executive Vice President and Chief Legal & Business Officer (2017-2019); and Executive Vice President and General Counsel (2011-2017). Trustee — Goldman Sachs Variable Insurance Trust and Goldman Sachs Trust. | | | 103 | | | None |
Diana M. Daniels5 Age: 73 | | Trustee | | Since 2007 | | Ms. Daniels is retired. Formerly, she was Vice President, General Counsel and Secretary, The Washington Post Company (1991-2006). Ms. Daniels is a Trustee Emeritus and serves as a Presidential Councillor of Cornell University (2013-Present); Director of 1735 NY Investments, LLC (oversees an investment fund that supports the mission of the American Institute of Architects) (2022-Present); former Member of the Legal Advisory Board, New York Stock Exchange (2003-2006) and of the Corporate Advisory Board, Standish Mellon Management Advisors (2006-2007). Trustee — Goldman Sachs Variable Insurance Trust and Goldman Sachs Trust. | | | 103 | | | None |
| | | | | | | | | | | | |
GOLDMAN SACHS VARIABLE INSURANCE TRUST GOVERNMENT MONEY MARKET FUND
Trustees and Officers (Unaudited) (continued)
Independent Trustees
| | | | | | | | | | | | |
| | | | | |
Name, Address and Age1 | | Position(s) Held
with the Trust | | Term of
Office and
Length of
Time Served2 | | Principal Occupation(s)
During Past 5 Years | | Number of
Portfolios in
Fund Complex
Overseen by
Trustee3 | | | Other
Directorships
Held by Trustee4 |
Joaquin Delgado Age: 62 | | Trustee | | Since 2020 | | Dr. Delgado is retired. He is Director, Stepan Company (a specialty chemical manufacturer) (2011-Present); and was formerly Director, Hexion Inc. (a specialty chemical manufacturer) (2019-2022); Executive Vice President, Consumer Business Group of 3M Company (July 2016-July 2019); and Executive Vice President, Health Care Business Group of 3M Company (October 2012-July 2016). Previously, Dr. Delgado served as an Advisory Board Member of Goldman Sachs Trust and Goldman Sachs Variable Insurance Trust (October 2019-January 2020). Trustee — Goldman Sachs Variable Insurance Trust and Goldman Sachs Trust. | | | 103 | | | Stepan Company (a specialty chemical manufacturer) |
Eileen H. Dowling Age: 60 | | Trustee | | Since 2021 | | Ms. Dowling is retired. Formerly, she was Senior Advisor (April 2021-September 2021); and Managing Director (2013-2021), BlackRock, Inc. (a financial services firm). Trustee — Goldman Sachs Variable Insurance Trust and Goldman Sachs Trust. | | | 103 | | | None |
Gregory G. Weaver Age: 71 | | Trustee | | Since 2015 | | Mr. Weaver is retired. He is Director, Verizon Communications Inc. (2015-Present); and was formerly Chairman and Chief Executive Officer, Deloitte & Touche LLP (a professional services firm) (2001-2005 and 2012-2014); and Member of the Board of Directors, Deloitte & Touche LLP (2006-2012). Trustee — Goldman Sachs Variable Insurance Trust and Goldman Sachs Trust. | | | 103 | | | Verizon Communications Inc. |
Paul C. Wirth Age: 65 | | Trustee | | Since 2022 | | Mr. Wirth is retired. Formerly, he was Deputy Chief Financial Officer and Principal Accounting Officer (2011-2020); Finance Director and Principal Accounting Officer (2010-2011); and Managing Director, Global Controller, and Chief Accounting Officer (2005-2010) of Morgan Stanley. Trustee — Goldman Sachs Variable Insurance Trust and Goldman Sachs Trust. | | | 103 | | | None |
| | | | | | | | | | | | |
GOLDMAN SACHS VARIABLE INSURANCE TRUST GOVERNMENT MONEY MARKET FUND
Trustees and Officers (Unaudited) (continued)
Interested Trustee*
| | | | | | | | | | | | |
| | | | | |
Name, Address and Age1 | | Position(s) Held
with the Trust | | Term of
Office and
Length of
Time Served2 | | Principal Occupation(s)
During Past 5 Years | | Number of
Portfolios in
Fund Complex
Overseen by
Trustee3 | | | Other
Directorships
Held by Trustee4 |
James A. McNamara Age: 60 | | President and Trustee | | Since 2007 | | Advisory Director, Goldman Sachs (January 2018-Present); Managing Director, Goldman Sachs (January 2000-December 2017); Director of Institutional Fund Sales, GSAM (April 1998-December 2000); and Senior Vice President and Manager, Dreyfus Institutional Service Corporation (January 1993-April 1998). President and Trustee — Goldman Sachs Variable Insurance Trust; Goldman Sachs Trust; Goldman Sachs Trust II; Goldman Sachs MLP and Energy Renaissance Fund; Goldman Sachs ETF Trust; Goldman Sachs ETF Trust II; Goldman Sachs Credit Income Fund; and Goldman Sachs Real Estate Diversified Income Fund. | | | 172 | | | None |
| | | | | | | | | | | | |
| * | Mr. McNamara is considered to be an “Interested Trustee” because he holds positions with Goldman Sachs and owns securities issued by The Goldman Sachs Group, Inc. Mr. McNamara holds comparable positions with certain other companies of which Goldman Sachs, GSAM or an affiliate thereof is the investment adviser, administrator and/or distributor. |
| 1 | Each Trustee may be contacted by writing to the Trustee, c/o Goldman Sachs, 200 West Street, New York, New York, 10282, Attn: Caroline Kraus. Information is provided as of December 31, 2022. |
| 2 | Subject to such policies as may be adopted by the Board from time-to-time, each Trustee holds office for an indefinite term, until the earliest of: (a) the election of his or her successor; (b) the date the Trustee resigns or is removed by the Board or shareholders, in accordance with the Trust’s Declaration of Trust; or (c) the termination of the Trust. The Board has adopted policies which provide that each Independent Trustee shall retire as of December 31st of the calendar year in which he or she reaches (a) his or her 75th birthday or (b) the 15th anniversary of the date he or she became a Trustee, whichever is earlier, unless a waiver of such requirements shall have been adopted by a majority of the other Trustees. These policies may be changed by the Trustees without shareholder vote. |
| 3 | The Goldman Sachs Fund Complex includes certain other companies listed above for each respective Trustee. As of December 31, 2022, Goldman Sachs Trust consisted of 88 portfolios; Goldman Sachs Variable Insurance Trust consisted of 15 portfolios (12 of which offered shares to the public); Goldman Sachs Trust II consisted of 18 portfolios (7 of which offered shares to the public); Goldman Sachs ETF Trust consisted of 46 portfolios (29 of which offered shares to the public); Goldman Sachs ETF Trust II consisted of 2 portfolios (1 of which offered shares to the public); and Goldman Sachs MLP and Energy Renaissance Fund, Goldman Sachs Credit Income Fund and Goldman Sachs Real Estate Diversified Income Fund each consisted of one portfolio. Goldman Sachs Credit Income Fund did not offer shares to the public. |
| 4 | This column includes only directorships of companies required to report to the Securities and Exchange Commission under the Securities Exchange Act of 1934 (i.e., “public companies”) or other investment companies registered under the Act. |
| 5 | Ms. Daniels and Ms. Palmer retired as Independent Trustees effective January 1, 2023. |
Additional information about the Trustees is available in the Funds’ Statement of Additional Information, which can be obtained from Goldman Sachs free of charge by calling this toll-free number (in the United States of America): 1-800-621-2550.
GOLDMAN SACHS VARIABLE INSURANCE TRUST GOVERNMENT MONEY MARKET FUND
Trustees and Officers (Unaudited) (continued)
Officers of the Trust*
| | | | | | |
| | | |
| Name, Address and Age1 | | Positions Held with the Trust | | Term of
Office and
Length of
Time Served2 | | Principal Occupation(s) During Past 5 Years |
James A. McNamara
200 West Street
New York, NY 10282
Age: 60 | | Trustee and President | | Since 2007 | | Advisory Director, Goldman Sachs (January 2018-Present); Managing Director, Goldman Sachs (January 2000-December 2017); Director of Institutional Fund Sales, GSAM (April 1998-December 2000); and Senior Vice President and Manager, Dreyfus Institutional Service Corporation (January 1993-April 1998). President and Trustee — Goldman Sachs Variable Insurance Trust; Goldman Sachs Trust; Goldman Sachs Trust II; Goldman Sachs MLP and Energy Renaissance Fund; Goldman Sachs ETF Trust; Goldman Sachs ETF Trust II; Goldman Sachs Credit Income Fund; and Goldman Sachs Real Estate Diversified Income Fund. |
Caroline L. Kraus
200 West Street
New York, NY 10282
Age: 45 | | Secretary | | Since 2012 | | Managing Director, Goldman Sachs (January 2016-Present); Vice President, Goldman Sachs (August 2006-December 2015); Senior Counsel, Goldman Sachs (January 2020-Present); Associate General Counsel, Goldman Sachs (2012-December 2019); Assistant General Counsel, Goldman Sachs (August 2006-December 2011); and Associate, Weil, Gotshal & Manges, LLP (2002-2006). Secretary — Goldman Sachs Variable Insurance Trust (previously Assistant Secretary (2012)); Goldman Sachs Trust (previously Assistant Secretary (2012)); Goldman Sachs Trust II; Goldman Sachs BDC, Inc.; Goldman Sachs Private Middle Market Credit LLC; Goldman Sachs Private Middle Market Credit II LLC; Goldman Sachs Middle Market Lending Corp.; Goldman Sachs MLP and Energy Renaissance Fund; Goldman Sachs ETF Trust; Goldman Sachs ETF Trust II; Goldman Sachs Credit Income Fund; and Goldman Sachs Real Estate Diversified Income Fund. |
Joseph F. DiMaria
30 Hudson Street
Jersey City, NJ 07302
Age: 54 | | Treasurer, Principal
Financial Officer and
Principal Accounting
Officer | | Since 2017
(Treasurer
and
Principal
Financial
Officer
since 2019) | | Managing Director, Goldman Sachs (November 2015-Present) and Vice President — Mutual Fund Administration, Columbia Management Investment Advisers, LLC (May 2010-October 2015). Treasurer, Principal Financial Officer and Principal Accounting Officer — Goldman Sachs Variable Insurance Trust (previously Assistant Treasurer (2016)); Goldman Sachs Trust (previously Assistant Treasurer (2016)); Goldman Sachs Trust II (previously Assistant Treasurer (2017)); Goldman Sachs MLP and Energy Renaissance Fund (previously Assistant Treasurer (2017)); Goldman Sachs ETF Trust (previously Assistant Treasurer (2017)); Goldman Sachs ETF Trust II; Goldman Sachs Credit Income Fund; and Goldman Sachs Real Estate Diversified Income Fund. |
| | | | | | |
| * | Represents a partial list of officers of the Trust. Additional information about all the officers is available in the Fund’s Statement of Additional Information, which can be obtained from Goldman Sachs free of charge by calling this toll-free number (in the United States): 1-800-621-2550. |
| 1 | Information is provided as of December 31, 2022. |
| 2 | Officers hold office at the pleasure of the Board of Trustees or until their successors are duly elected and qualified. Each officer holds comparable positions with certain other companies of which Goldman Sachs, GSAM or an affiliate thereof is the investment adviser, administrator and/or distributor. |
Goldman Sachs Variable Insurance Trust — Tax Information (Unaudited)
For the year ended December 31, 2022, the Government Money Market Fund designated 100.00% of the dividends paid from net investment company taxable income as section 163(j) Interest Dividends.
| | |
TRUSTEES Gregory G. Weaver, Chair Dwight L. Bush Kathryn A. Cassidy John G. Chou Joaquin Delgado Eileen H. Dowling James A. McNamara Paul C. Wirth | | OFFICERS James A. McNamara, President Joseph F. DiMaria, Principal Financial Officer, Principal Accounting Officer and Treasurer Caroline L. Kraus, Secretary |
GOLDMAN SACHS & CO. LLC
Distributor and Transfer Agent
GOLDMAN SACHS ASSET MANAGEMENT, L.P.
Investment Adviser
200 West Street, New York
New York 10282
Visit our web site at www.GSAMFUNDS.com to obtain the most recent month-end returns.
The reports concerning the Fund included in this shareholder report may contain certain forward-looking statements about the factors that may affect the performance of the Fund in the future. These statements are based on Fund management’s predictions and expectations concerning certain future events and their expected impact on the Fund, such as performance of the economy as a whole and of specific industry sectors, changes in the levels of interest rates, the impact of developing world events, and other factors that may influence the future performance of the Fund. Management believes these forward-looking statements to be reasonable, although they are inherently uncertain and difficult to predict. Actual events may cause adjustments in portfolio management strategies from those currently expected to be employed.
A description of the policies and procedures that the Fund uses to determine how to vote proxies relating to portfolio securities and information regarding how the Fund voted proxies relating to portfolio securities during the most recent 12-month period ended December 31 is available (i) without charge, upon request by calling 1-800-621-2550; and (ii) on the Securities and Exchange Commission (“SEC”) Web site at http://www.sec.gov.
Views and opinions expressed are for informational purposes only and do not constitute a recommendation by GSAM to buy, sell, or hold any security. Views and opinions are current as of the date of this presentation and may be subject to change, they should not be construed as investment advice.
Goldman Sachs & Co. LLC (“Goldman Sachs”) does not provide legal, tax or accounting advice. Any statement contained in this communication (including any attachments) concerning U.S. tax matters was not intended or written to be used, and cannot be used, for the purpose of avoiding penalties under the Internal Revenue Code, and was written to support the promotion or marketing of transaction or matter addressed. Clients of Goldman Sachs should obtain their own independent tax advice based on their particular circumstances.
The web site links provided are for your convenience only and are not an endorsement or recommendation by GSAM of any of these web sites or the products or services offered. GSAM is not responsible for the accuracy and validity of the content of these web sites.
Fund holdings and allocations shown are as of December 31, 2022 and may not be representative of future investments. Fund holdings should not be relied on in making investment decisions and should not be construed as research or investment advice regarding particular securities. Current and future holdings are subject to risk.
The portfolio risk management process includes an effort to monitor and manage risk, but does not imply low risk.
Shares of the Goldman Sachs VIT Funds are offered to separate accounts of participating life insurance companies for the purpose of funding variable annuity contracts and variable life insurance policies. Shares of the Fund are not offered directly to the general public. The variable annuity contracts and variable life insurance policies are described in the separate prospectuses issued by participating insurance companies. You should refer to those prospectuses for information about surrender charges, mortality and expense risk fees and other charges that may be assessed by participating insurance companies under the variable annuity contracts or variable life insurance policies. Such fees or charges, if any, may affect the return you may realize with respect to your investments. Ask your representative for more complete information. Please consider a fund’s objectives, risks and charges and expenses, and read the prospectus carefully before investing. The prospectus contains this and other information about the Fund.
This material is not authorized for distribution to prospective investors unless preceded or accompanied by a current prospectus or summary prospectus, if applicable. Investors should consider the Fund’s objective, risks, and charges and expenses, and read the summary prospectus, if available, and/or the prospectus carefully before investing or sending money. The summary prospectus, if available, and the prospectus contain this and other information about the Fund and may be obtained from your authorized dealer or from Goldman Sachs & Co. LLC by calling 1-800-621-2550.
This report is prepared for the general information of contract owners and is not an offer of shares of the Goldman Sachs Variable Insurance Trust — Goldman Sachs Government Money Market Fund.
© 2023 Goldman Sachs. All rights reserved.
VITMMAR-23 306022-OTU-1739754
Goldman
Sachs Variable Insurance Trust
Goldman Sachs Buffered S&P 500 Fund — Jan/Jul
Annual Report
December 31, 2022

Goldman Sachs Variable Insurance Trust
| ∎ | | GOLDMAN SACHS BUFFERED S&P 500 FUND — JAN/JUL |
| | | | |
| | | |
| NOT FDIC-INSURED | | May Lose Value | | No Bank Guarantee |
GOLDMAN SACHS BUFFERED S&P 500 FUND - JAN/JUL
INVESTMENT OBJECTIVE
The Fund seeks long-term capital appreciation.
Portfolio Management Discussion and Analysis
The Goldman Sachs Variable Insurance Trust-Goldman Sachs Buffered S&P 500 Fund-Jan/Jul (the “Fund”) launched on December 30, 2022. As such, there is no performance to report for this December 31, 2022 shareholder report. Below, the Goldman Sachs Quantitative Investment Strategies (“QIS”) Team discusses the Fund.
What is the Fund’s Investment Strategy?
The Fund seeks to achieve a total return, for a six-month period from January 1 to June 30 or July 1 to December 31 (an “Outcome Period”), that tracks the S&P 500 Price Return Index (the “Underlying Index”) up to a “cap” while providing a downside “buffer” against losses over the Outcome Period. In order to implement the buffer and cap, the Fund will primarily invest in FLexible EXchange® Options (“FLEX Options”) and over-the-counter (“OTC”) and listed options that reference the Underlying Index (together with FLEX Options, “S&P 500 Options”). FLEX Options are customized exchange-traded option contracts available through the Chicago Board Option Exchange. Through FLEX Options, the Fund could customize key contract terms such as exercise prices and expiration dates.
Although the Fund seeks to implement a targeted outcome strategy, there is no guarantee that the Fund will successfully achieve its investment objective or any targeted outcome. Due to the unique mechanics of the Fund’s strategy, the return an investor can expect to receive from an investment in the Fund has characteristics that are distinct from many other investment vehicles. Please refer to the Fund’s Prospectus for more information regarding the Fund’s Investment Objective and Strategy as well as risks related to investing in the Fund.
How did the Fund perform during the Reporting Period?
The Fund commenced operations on December 30, 2022 for the Fund’s initial Outcome Period, which is for the six-month period from January 1, 2023 to June 30, 2023. As such, there is no performance to report for the period ending December 31, 2022.
GOLDMAN SACHS BUFFERED S&P 500 FUND - JAN/JUL
Percentage of Net Assets
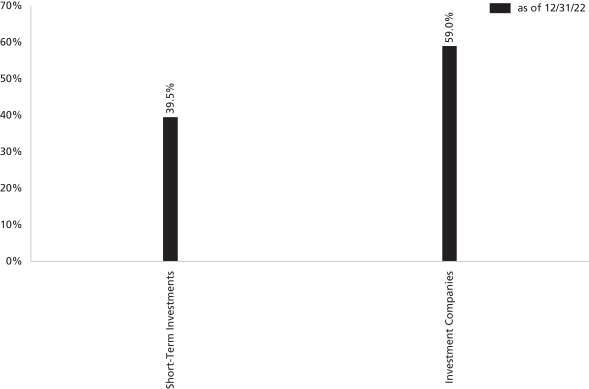
| † | The percentage shown for each investment category reflects the value of investments in that category as a percentage of net assets. Short-term investments represent commercial paper. Figures in the graph may not sum to 100% due to the exclusion of other assets and liabilities. The graph depicts the Fund’s investments but does not represent the Fund’s market exposure due to the exclusion of certain derivatives as listed in the Additional Investment Information section of the Consolidated Schedule of Investments. |
For more information about the Fund, please refer to www.GSAMFUNDS.com. There, you can learn more about the Fund’s Investment strategies, holdings, and performance.
GOLDMAN SACHS BUFFERED S&P 500 FUND - JAN/JUL
Index Definitions
ICE BofAML Three-Month U.S. Treasury Bill Index measures total return on cash, including price and interest income, based on short-term government Treasury Bills of about 90-day maturity, as reported by Bank of America Merrill Lynch.
S&P 500® Index is a U.S. stock market index based on the market capitalizations of 500 large companies having common stock listed on the New York Stock Exchange or NASDAQ. The S&P 500® Index components and their weightings are determined by S&P Dow Jones Indices.
S&P 500 Total Return Index is a type of equity index that tracks both the capital gains as well as any cash distributions, such as dividends or interest, attributed to the components of the index. A price return index takes into account only the capital appreciation of its components, while income generated, in the form of dividends or interest, is ignored.
S&P 500 Price Return Index is an unmanaged composite of 500 large capitalization companies. It only tracks the performance of the stock prices of the companies included in the index, and does not include returns from dividends paid by the companies included in the Price Return Index.
It is not possible to invest directly in an unmanaged index.
GOLDMAN SACHS BUFFERED S&P 500 FUND - JAN/JUL
Schedule of Investments
December 31, 2022
| | | | | | | | | | | | |
Principal
Amount | | | Interest
Rate | | Maturity
Date | | | Value | |
|
| | Short-Term Investments(a) – 39.5% | |
| | FHLB | |
| | $ 500,000 | | | 0.000% | | | 02/08/23 | | | $ | 497,580 | |
| | United States Treasury Bill | |
| | 1,500,000 | | | 0.000 | | | 04/25/23 | | | | 1,479,030 | |
| | |
| | TOTAL SHORT-TERM INVESTMENTS | | | | | |
| | (Cost $1,976,563) | | | $ | 1,976,610 | |
| | |
| | | | | | | | | | | | |
| Shares | | | Distribution
Rate | | | | | Value | |
|
| | Investment Companies(b) – 59.0% | |
| Goldman Sachs Financial Square Treasury Instruments Fund —
Institutional Class |
|
| | 500,109 | | | 4.183% | | | | | | $ | 500,109 | |
| Goldman Sachs Financial Square Government Fund —
Institutional Shares — Institutional Class |
|
| | 949,142 | | | 4.159 | | | | | | | 949,142 | |
| Goldman Sachs Financial Square Treasury Obligations Fund —
Institutional Class |
|
| | 500,114 | | | 4.162 | | | | | | | 500,114 | |
| Goldman Sachs Financial Square Treasury Solutions Fund —
Institutional Class |
|
| | 500,114 | | | 4.150 | | | | | | | 500,114 | |
| Goldman Sachs Government Money Market Fund — Institutional
Class |
|
| | 500,000 | | | 4.183 | | | | | | | 500,000 | |
| | |
| | TOTAL INVESTMENT COMPANIES
| | | | | |
| | (Cost $2,949,479) | | | $ | 2,949,479 | |
| | |
| | TOTAL INVESTMENTS – 98.5%
| | | | | |
| | (Cost $4,926,042) | | | $ | 4,926,089 | |
| | |
| OTHER ASSETS IN EXCESS OF
LIABILITIES – 1.5% |
| | | 78,215 | |
| | |
| | NET ASSETS – 100.0% | | | $ | 5,004,304 | |
| | |
| | |
| The percentage shown for each investment category reflects the value of investments in that category as a percentage of net assets. |
| |
| (a) | | Issued with a zero coupon. Income is recognized through the accretion of discount. |
| |
| (b) | | Represents an affiliated issuer. |
| | |
| |
| Investment Abbreviation: |
| FHLB—Federal Home Loan Bank |
| | |
| 4 | | The accompanying notes are an integral part of these financial statements. |
GOLDMAN SACHS BUFFERED S&P 500 FUND - JAN/JUL
ADDITIONAL INVESTMENT INFORMATION
PURCHASED AND WRITTEN OPTIONS CONTRACTS — At December 31, 2022, the Fund had the following purchased and written options:
| | | | | | | | | | | | | | | | | | | | | | | | | | |
| Description | | Exercise
Rate | | | Expiration
Date | | Number of
Contracts | | | Notional
Amount | | | Market
Value | | | Premiums
Paid (Received)
by Fund | | | Unrealized
Appreciation/
(Depreciation) | |
| |
Purchased option contracts | | | | | |
| |
Calls | | | | | |
| | | | | | | |
S&P 500 Index | | $ | 3,839.500 | | | 06/30/2023 | | | 13 | | | $ | 1,300 | | | $ | 361,169 | | | $ | 364,390 | | | $ | (3,221 | ) |
| |
Written option contracts | | | | | |
| |
Calls | | | | | |
| | | | | | | |
S&P 500 Index | | | 4,144.740 | | | 06/30/2023 | | | (13 | ) | | | (1,300 | ) | | $ | (162,848 | ) | | | (164,684 | ) | | | 1,836 | |
| |
Puts | | | | | |
| | | | | | | |
S&P 500 Index | | | 3,647.530 | | | 06/30/2023 | | | (13 | ) | | | (1,300 | ) | | $ | (195,329 | ) | | | (199,628 | ) | | | 4,299 | |
| | | | | | |
| Total written option contracts | | | | | | (26 | ) | | $ | (2,600 | ) | | $ | (358,177 | ) | | $ | (364,312 | ) | | $ | 6,135 | |
| | | | | | | |
| TOTAL | | | | | | | | | (13 | ) | | $ | (1,300 | ) | | $ | 2,992 | | | $ | 78 | | | $ | 2,914 | |
| | |
| The accompanying notes are an integral part of these financial statements. | | 5 |
GOLDMAN SACHS BUFFERED S&P 500 FUND - JAN/JUL
Statement of Assets and Liabilities
December 31, 2022
| | | | |
| | | | |
| Assets: | | | |
Investments in unaffiliated issuers, at value (cost $1,976,563) | | $ | 1,976,610 | |
Investments in affiliated issuers, at value (cost $2,949,479) | | | 2,949,479 | |
Purchased options contracts, at value (premium paid $364,390) | | | 361,169 | |
Cash | | | 75,000 | |
Receivables: | | | | |
Investments sold | | | 364,312 | |
Deferred offering costs | | | 64,644 | |
Reimbursement from investment adviser | | | 49,953 | |
Dividends and interest | | | 2,141 | |
| |
| Total assets | | | 5,843,308 | |
| | | | |
| | | | |
| Liabilities: | | | |
Written option contracts, at value (premium received $364,312) | | | 358,177 | |
Payables: | |
Investments purchased | | | 364,943 | |
Offering expense | | | 65,000 | |
Organization costs | | | 12,000 | |
Management fees | | | 93 | |
Distribution and Service fees and Transfer Agency fees | | | 6 | |
Accrued expenses | | | 38,785 | |
| |
| Total liabilities | | | 839,004 | |
| |
| | | | |
| Net Assets: | | | |
Paid-in capital | | | 4,999,998 | |
Total distributable earnings | | | 4,306 | |
| |
| NET ASSETS | | $ | 5,004,304 | |
Net Assets: | | | | |
Institutional | | $ | 4,954,261 | |
Service | | | 50,043 | |
| |
Total Net Assets | | $ | 5,004,304 | |
Shares Outstanding $0.001 par value (unlimited number of shares authorized): | | | | |
Institutional | | | 495,000 | |
Service | | | 5,000 | |
Net asset value, offering and redemption price per share: | | | | |
Institutional | | | $10.00 | |
Service | | | 10.00 | (a) |
(a) NAV per share is calculated using unrounded outstanding shares.
| | |
| 6 | | The accompanying notes are an integral part of these financial statements. |
GOLDMAN SACHS BUFFERED S&P 500 FUND - JAN/JUL
Statement of Operations
For the Period Ended December 31, 2022(a)
| | | | |
| | | | |
| Investment income: | | | |
Dividends — affiliated issuers | | $ | 1,003 | |
Interest | | | 489 | |
| |
| Total investment income | | | 1,492 | |
| |
| | | | |
| Expenses: | | | |
Professional fees | | | 23,000 | |
Organization costs | | | 12,000 | |
Printing and mailing costs | | | 8,000 | |
Custody, accounting and administrative services | | | 5,003 | |
Registration fees | | | 600 | |
Trustee fees | | | 500 | |
Amortization of offering costs | | | 356 | |
Management fees | | | 137 | |
Transfer Agency fees(b) | | | 5 | |
Shareholder Administration fees — Service Class | | | 1 | |
Other | | | 544 | |
| |
| Total expenses | | | 50,146 | |
| |
Less — expense reductions | | | (49,997 | ) |
| |
| Net expenses | | | 149 | |
| |
| NET INVESTMENT INCOME | | | 1,343 | |
| |
| | | | |
| Realized and unrealized gain (loss): | | | |
Net change in unrealized gain on: | | | | |
Investments | | | 47 | |
Purchased options | | | (3,221 | ) |
Written options | | | 6,135 | |
| |
| Net realized and unrealized gain | | | 2,961 | |
| |
| NET INCREASE IN NET ASSETS RESULTING FROM OPERATIONS | | $ | 4,304 | |
(a) Commenced operations on December 30, 2022. | | | | |
(b) Class specific Distribution and Service and Transfer Agency fees were as follows: | | | | |
| | | | | | |
| Transfer Agency Fees | |
Institutional | | | Service Class | |
| $ | 5 | | | | — | |
| | |
| The accompanying notes are an integral part of these financial statements. | | 7 |
GOLDMAN SACHS BUFFERED S&P 500 FUND - JAN/JUL
Statement of Changes in Net Assets
| | | | |
| | | For the
Period Ended
December 31, 2022(a) | |
| | | | |
| From operations: | | | |
Net investment income | | $ | 1,343 | |
Net change in unrealized gain | | | 2,961 | |
| |
| Net increase in net assets resulting from operations | | | 4,304 | |
| |
| | | | |
| From share transactions: | | | |
Proceeds from sales of shares | | | 5,000,000 | |
| |
| Net increase in net assets resulting from share transactions | | | 5,000,000 | |
| |
| TOTAL INCREASE | | | 5,004,304 | |
| |
| | | | |
| Net assets: | | | |
| |
Beginning of period | | | — | |
| |
End of period | | $ | 5,004,304 | |
(a) Commenced operations on December 30, 2022.
| | |
| 8 | | The accompanying notes are an integral part of these financial statements. |
GOLDMAN SACHS BUFFERED S&P 500 FUND - JAN/JUL
Financial Highlights
Selected Data for a Share Outstanding Throughout the Period
| | | | |
| | | Goldman Sachs Buffered S&P 500
Fund - Jan/Jul | |
| | | Institutional Shares | |
| | | Period Ended
December 31, 2022(a) | |
| | | | |
| Per Share Data | | | |
| |
Net asset value, beginning of period | | $ | 10.00 | |
| |
Net investment loss(b)(c) | | | 0.00 | (d) |
| |
Net realized and unrealized gain | | | 0.00 | (d) |
| |
Total from investment operations | | | — | |
| |
Net asset value, end of period | | $ | 10.00 | |
| |
Total return(e) | | | — | % |
| |
Net assets, end of period (in 000s) | | $ | 4,954 | |
| |
Ratio of net expenses to average net assets(f) | | | 0.54 | %(g) |
| |
Ratio of total expenses to average net assets(f) | | | 66.87 | %(g) |
| |
Ratio of net investment loss to average net assets(c) | | | 4.90 | %(g) |
| |
Portfolio turnover rate | | | — | % |
| (a) | Commenced operations on December 30, 2022. |
| (b) | Calculated based on the average shares outstanding methodology. |
| (c) | Recognition of net investment income by the Fund is affected by the timing of declaration of dividends by the Underlying Funds in which the Fund invests. |
| (d) | Amount is less than $0.005 per share. |
| (e) | Assumes investment at the NAV at the beginning of the year, reinvestment of all dividends and distributions, a complete redemption of the investment at the NAV at the end of the year and no sales or redemption charges (if any). Total returns would be reduced if a sales or redemption charge was taken into account. Returns do not reflect the impact of taxes to shareholders relating to Fund distributions or the redemption of Fund shares. Total returns for periods less than one full year are not annualized. |
| (f) | Expense ratios exclude the expenses of the Underlying Funds in which the Fund invests. |
| | |
| The accompanying notes are an integral part of these financial statements. | | 9 |
GOLDMAN SACHS BUFFERED S&P 500 FUND - JAN/JUL
Financial Highlights (continued)
Selected Share Data for a Share Outstanding Throughout the Period
| | | | |
| | | Goldman Sachs Buffered S&P 500
Fund - Jan/Jul | |
| | | Service Shares | |
| | | Period Ended
December 31, 2022(a) | |
| | | | |
| Per Share Data | | | |
| |
Net asset value, beginning of period | | $ | 10.00 | |
| |
Net investment loss(b)(c) | | | 0.00 | (d) |
| |
Net realized and unrealized gain (loss) | | | (0.00 | )(d) |
| |
Total from investment operations | | | — | |
| |
Net asset value, end of period | | $ | 10.00 | |
| |
Total return(e) | | | — | % |
| |
Net assets, end of period (in 000s) | | $ | 50 | |
| |
Ratio of net expenses to average net assets(f) | | | 0.79 | %(g) |
| |
Ratio of total expenses to average net assets(f) | | | 67.12 | %(g) |
| |
Ratio of net investment loss to average net assets(c) | | | 4.65 | %(g) |
| |
Portfolio turnover rate | | | — | % |
| (a) | Commenced operations on December 30, 2022. |
| (b) | Calculated based on the average shares outstanding methodology. |
| (c) | Recognition of net investment income by the Fund is affected by the timing of declaration of dividends by the Underlying Funds in which the Fund invests. |
| (d) | Amount is less than $0.005 per share. |
| (e) | Assumes investment at the NAV at the beginning of the year, reinvestment of all dividends and distributions, a complete redemption of the investment at the NAV at the end of the year and no sales or redemption charges (if any). Total returns would be reduced if a sales or redemption charge was taken into account. Returns do not reflect the impact of taxes to shareholders relating to Fund distributions or the redemption of Fund shares. Total returns for periods less than one full year are not annualized. |
| (f) | Expense ratios exclude the expenses of the Underlying Funds in which the Fund invests. |
| | |
| 10 | | The accompanying notes are an integral part of these financial statements. |
GOLDMAN SACHS BUFFERED S&P 500 FUND - JAN/JUL
Notes to Financial Statements
December 31, 2022
1. ORGANIZATION
Goldman Sachs Variable Insurance Trust (the “Trust” or “VIT”) is a Delaware statutory trust registered under the Investment Company Act of 1940, as amended (the “Act”), as an open-end management investment company. The following table lists the series of the Trust that is included in this report (the “Fund”), along with its corresponding share classes and respective diversification status under the Act:
| | | | | | | | |
| Fund | | Share Classes Offered | | | Diversified/Non-diversified | |
| Buffered S&P 500 Fund — Jan/Jul | | | Institutional and Service | | | | Non-diversified | |
Shares of the Trust are offered to a separate account of participating life insurance companies for the purpose of funding variable annuity contracts and variable life insurance policies.
The Fund seeks to achieve a total return for a specified Outcome Period that tracks the S&P 500 Price Return Index (the “Underlying Index”) up to a “cap” while providing a downside “buffer” against losses over the Outcome Period. The Fund’s initial Outcome Period is the six-month period from January 1, 2023 to June 30, 2023. After the conclusion of an Outcome Period, another six-month Outcome Period will begin. Shares of the Fund may not be purchased during the initial Outcome Period. In order to implement the buffer and cap, the Fund will primarily invest in FLexible EXchange® Options (“FLEX Options”) and over-the-counter (“OTC”) and listed options that reference the Underlying Index (together with FLEX Options, “S&P 500 Options”). FLEX Options are customized exchange-traded option contracts available through the Chicago Board Option Exchange. Through FLEX Options, the Fund could customize key contract terms such as exercise prices and expiration dates.
Goldman Sachs Asset Management, L.P. (“GSAM”), an affiliate of Goldman Sachs & Co. LLC (“Goldman Sachs”), serves as investment adviser to the Fund pursuant to a management agreement (the “Agreement”) with the Trust.
2. SIGNIFICANT ACCOUNTING POLICIES
The financial statements have been prepared in accordance with accounting principles generally accepted in the United States of America (“GAAP”) and require management to make estimates and assumptions that may affect the reported amounts and disclosures. Actual results may differ from those estimates and assumptions. The Fund is an investment company under GAAP and follows the accounting and reporting guidance applicable to investment companies.
A. Investment Valuation — The Fund’s valuation policy is to value investments at fair value.
B. Investment Income and Investments — Investment income includes interest income, dividend income, and securities lending income, if any. Interest income is accrued daily and adjusted for amortization of premiums and accretion of discounts. Dividend income is recognized on ex-dividend date or, for certain foreign securities, as soon as such information is obtained subsequent to the ex-dividend date. Non-cash dividends, if any, are recorded at the fair market value of the securities received. Investment transactions are reflected on trade date. Realized gains and losses are calculated using identified cost. Investment transactions are recorded on the following business day for daily net asset value (“NAV”) calculations.
For derivative contracts, unrealized gains and losses are recorded daily and become realized gains and losses upon disposition or termination of the contract.
C. Class Allocations and Expenses — Investment income, realized and unrealized gain (loss), if any, and non-class specific expenses of the Fund are allocated daily based upon the proportion of net assets of each class. Non-class specific expenses directly incurred by the Fund are charged to the Fund, while such expenses incurred by the Trust are allocated across the Fund on a straight-line and/or pro-rata basis depending upon the nature of the expenses. Class specific expenses, where applicable, are borne by the respective share classes and include Distribution and Service and Transfer Agency fees.
D. Offering and Organization Costs — Offering costs paid in connection with the initial offering of shares of the Fund are being amortized on a straight-line basis over 12 months from the date of commencement of operations. Organization costs paid in connection with the organization of the Fund were expensed on the first day of operations.
GOLDMAN SACHS BUFFERED S&P 500 FUND - JAN/JUL
Notes to Financial Statements (continued)
December 31, 2022
2. SIGNIFICANT ACCOUNTING POLICIES (continued)
E. Federal Taxes and Distributions to Shareholders — It is the Fund’s policy to comply with the requirements of the Internal Revenue Code of 1986, as amended (the “Code”), applicable to regulated investment companies and to distribute each year substantially all of its investment company taxable income and capital gains to its shareholders. Accordingly, the Fund is not required to make any provisions for the payment of federal income tax. Distributions to shareholders are recorded on the ex-dividend date. Income and capital gains distributions, if any, are declared and paid annually.
Net capital losses, if any, are carried forward to future fiscal years and may be used to the extent allowed by the Code to offset any future capital gains. Losses that are carried forward will retain their character as either short-term or long-term capital losses. Utilization of capital loss carryforwards will reduce the requirement of future capital gains distributions.
The characterization of distributions to shareholders for financial reporting purposes is determined in accordance with federal income tax rules, which may differ from GAAP. The source of the Fund’s distributions may be shown in the accompanying financial statements as either from distributable earnings or capital. Certain components of the Fund’s net assets on the Statement of Assets and Liabilities reflect permanent GAAP/tax differences based on the appropriate tax character.
3. INVESTMENTS AND FAIR VALUE MEASUREMENTS
U.S. GAAP defines the fair value of a financial instrument as the amount that would be received to sell an asset or paid to transfer a liability in an orderly transaction between market participants at the measurement date (i.e., the exit price); the Fund’s policy is to use the market approach. GAAP establishes a fair value hierarchy that prioritizes the inputs to valuation techniques used to measure fair value. The hierarchy gives the highest priority to unadjusted quoted prices in active markets for identical assets or liabilities (Level 1 measurements) and the lowest priority to unobservable inputs (Level 3 measurements). The Level in the fair value hierarchy within which the fair value measurement in its entirety falls shall be determined based on the lowest Level input that is significant to the fair value measurement in its entirety. The levels used for classifying investments are not necessarily an indication of the risk associated with investing in these investments. The three levels of the fair value hierarchy are described below:
Level 1 — Unadjusted quoted prices in active markets that are accessible at the measurement date for identical, unrestricted assets or liabilities;
Level 2 — Quoted prices in markets that are not active or financial instruments for which significant inputs are observable (including, but not limited to, quoted prices for similar investments, interest rates, foreign exchange rates, volatility and credit spreads), either directly or indirectly;
Level 3 — Prices or valuations that require significant unobservable inputs (including GSAM’s assumptions in determining fair value measurement).
The Board of Trustees (“Trustees”) has approved Valuation Procedures that govern the valuation of the portfolio investments held by the Fund, including investments for which market quotations are not readily available. With respect to the Fund’s investments that do not have readily available market quotations, the Trustees have designated the Adviser as the valuation designee to perform fair valuations pursuant to Rule 2a-5 under the Investment Company Act of 1940 (the “Valuation Designee”). GSAM has day-to-day responsibility for implementing and maintaining internal controls and procedures related to the valuation of the Fund’s investments. To assess the continuing appropriateness of pricing sources and methodologies, GSAM regularly performs price verification procedures and issues challenges as necessary to third party pricing vendors or brokers, and any differences are reviewed in accordance with the Valuation Procedures.
A. Level 1 and Level 2 Fair Value Investments — The valuation techniques and significant inputs used in determining the fair values for investments classified as Level 1 and Level 2 are as follows:
Debt Securities — Debt securities for which market quotations are readily available are valued daily on the basis of quotations supplied by dealers or an independent pricing service. The pricing services may use valuation models or matrix pricing, which consider: (i) yield or price with respect to bonds that are considered comparable in characteristics such as rating, interest rate and maturity date or (ii) quotations from securities dealers to determine current value. With the exception of treasury securities of G7 countries, which are generally classified as Level 1, these investments are generally classified as Level 2 of the fair value hierarchy.
GOLDMAN SACHS BUFFERED S&P 500 FUND - JAN/JUL
3. INVESTMENTS AND FAIR VALUE MEASUREMENTS (continued)
Equity Securities — Equity securities traded on a United States (“U.S.”) securities exchange or the NASDAQ system, or those located on certain foreign exchanges, including but not limited to the Americas, are valued daily at their last sale price or official closing price on the principal exchange or system on which they are traded. If there is no sale or official closing price or such price is believed by GSAM to not represent fair value, equity securities will be valued at the valid closing bid price for long positions and at the valid closing ask price for short positions (i.e. where there is sufficient volume, during normal exchange trading hours). If no valid bid/ask price is available, the equity security will be valued pursuant to the Valuation Procedures and consistent with applicable regulatory guidance. To the extent these investments are actively traded, they are classified as Level 1 of the fair value hierarchy, otherwise they are generally classified as Level 2. Certain equity securities containing unique attributes may be classified as Level 2.
Unlisted equity securities for which market quotations are available are valued at the last sale price on the valuation date, or if no sale occurs, at the last bid price for long positions or the last ask price for short positions, and are generally classified as Level 2.
Money Market Funds — Investments in the Goldman Sachs Financial Square Government Fund, Goldman Sachs Financial Square Treasury Instruments Fund, Goldman Sachs Financial Square Treasury Obligations Fund, Goldman Sachs VIT Government Money Market Fund and Goldman Sachs Financial Square Treasury Solutions Fund (“Underlying Money Market Funds”) are valued at the NAV per share of the Institutional Share class on the day of valuation. These investments are generally classified as Level 1 of the fair value hierarchy. For information regarding the Underlying Money Market Funds’ accounting policies and investment holdings, please see the Underlying Money Market Funds’ shareholder report.
Derivative Contracts — A derivative is an instrument whose value is derived from underlying assets, indices, reference rates or a combination of these factors. The Fund enters into derivative transactions to hedge against changes in interest rates, securities prices, and/or currency exchange rates, to increase total return, or to gain access to certain markets or attain exposure to other underliers. For financial reporting purposes, cash collateral that has been pledged to cover obligations of a Fund and cash collateral received, if any, is reported separately on the Statement of Assets and Liabilities as receivables/payables for collateral on certain derivatives contracts. Non-cash collateral pledged by a Fund, if any, is noted in the Schedules of Investments.
Exchange-traded derivatives, including futures and options contracts, are generally valued at the last sale or settlement price on the exchange where they are principally traded. Exchange-traded options without settlement prices are generally valued at the midpoint of the bid and ask prices on the exchange where they are principally traded (or, in the absence of two-way trading, at the last bid price for long positions and the last ask price for short positions). Exchange-traded derivatives typically fall within Level 1 of the fair value hierarchy. Over-the-counter (“OTC”) and centrally cleared derivatives are valued using market transactions and other market evidence, including market-based inputs to models, calibration to market-clearing transactions, broker or dealer quotations, or other alternative pricing sources. Where models are used, the selection of a particular model to value OTC and centrally cleared derivatives depends upon the contractual terms of, and specific risks inherent in, the instrument, as well as the availability of pricing information in the market. Valuation models require a variety of inputs, including contractual terms, market prices, yield curves, credit curves, measures of volatility, voluntary and involuntary prepayment rates, loss severity rates and correlations of such inputs. For OTC and centrally cleared derivatives that trade in liquid markets, model inputs can generally be verified and model selection does not involve significant management judgment. OTC and centrally cleared derivatives are classified within Level 2 of the fair value hierarchy when significant inputs are corroborated by market evidence.
i. Options — When a Fund writes call or put options, an amount equal to the premium received is recorded as a liability and is subsequently marked-to-market to reflect the current value of the option written. Swaptions are options on swap contracts.
Upon the purchase of a call option or a put option by a Fund, the premium paid is recorded as an investment and subsequently marked-to-market to reflect the current value of the option. Certain options may be purchased with premiums to be determined on a future date. The premiums for these options are based upon implied volatility parameters at specified terms.
B. Level 3 Fair Value Investments — To the extent that significant inputs to valuation models and other alternative pricing sources are unobservable, or if quotations are not readily available, or if GSAM believes that such quotations do not accurately reflect fair value, the fair value of the Fund’s investments may be determined under the Valuation Procedures. GSAM, consistent with its
GOLDMAN SACHS BUFFERED S&P 500 FUND - JAN/JUL
Notes to Financial Statements (continued)
December 31, 2022
3. INVESTMENTS AND FAIR VALUE MEASUREMENTS (continued)
procedures and applicable regulatory guidance, may make an adjustment to the most recent valuation prices of either domestic or foreign securities in light of significant events to reflect what it believes to be the fair value of the securities at the time of determining the Fund’s NAV. To the extent investments are valued using single source broker quotations obtained directly from the broker or passed through from third party pricing vendors, such investments are classified as Level 3 investments.
C. Fair Value Hierarchy — The following is a summary of the Fund’s investments and derivatives classified in the fair value hierarchy as of December 31, 2022:
| | | | | | | | | | | | |
| Investment Type | | Level 1 | | | Level 2 | | | Level 3 | |
| | | |
| Assets | | | | | | | | | | | | |
| Short-Term Investments | | $ | 1,976,610 | | | $ | | | | $ | | |
| Investment Company | | | 2,949,479 | | | | — | | | | — | |
| | | |
| Total | | $ | 4,926,089 | | | $ | — | | | $ | — | |
| | | |
| Derivative Type | | | | | | | | | |
| | | |
| Assets | | | | | | | | | | | | |
| Purchased option contracts | | | — | | | | 361,169 | | | | — | |
| | | |
| Liabilities | | | | | | | | | | | | |
| Written option contracts | | | — | | | | (358,177 | ) | | | — | |
For further information regarding security characteristics, see the Schedule of Investments.
4. INVESTMENTS IN DERIVATIVES
The following tables set forth, by certain risk types, the gross value of derivative contracts (not considered to be hedging instruments for accounting disclosure purposes) as of December 31, 2022. These instruments were used as part of the Fund’s investment strategy and to obtain and/or manage exposure related to the risks below. The values in the tables below exclude the effects of cash collateral received or posted pursuant to these derivative contracts, and therefore are not representative of the Fund’s net exposure.
| | | | | | | | | | | | | | | | | | |
| Risk | | | Statement of Assets and Liabilities | | | Assets | | | Statement of Assets and Liabilities | | | Liabilities | |
| | Equity | | | | Purchased options contracts, at value | | | $ | 361,169 | | | | Written options contracts, at value | | | $ | 358,177 | |
The following tables set forth, by certain risk types, the Fund’s gains (losses) related to these derivatives and their indicative volumes for the period ended December 31, 2022. These gains (losses) should be considered in the context that these derivative contracts may have been executed to create investment opportunities and/or economically hedge certain investments, and accordingly, certain gains (losses) on such derivative contracts may offset certain (losses) gains attributable to investments. These gains (losses) are included in “Net realized gain (loss)” or “Net change in unrealized gain (loss)” on the Statement of Operations:
| | | | | | |
| Risk | | Statement of Operations | | Net Change in
Unrealized
Gain (Loss) | |
| | |
| Equity | | Net change in unrealized gain (loss) on purchased options and written options | | $ | 2,914 | |
GOLDMAN SACHS BUFFERED S&P 500 FUND - JAN/JUL
4. INVESTMENTS IN DERIVATIVES (continued)
For the period ended December 31, 2022, the relevant values for each derivative type was as follows:
| | | | | | | | |
| | | Average
Notional Amounts(a) | |
| | | Purchased Options | | | Written Options | |
| Buffered S&P 500 Fund - Jan/Jul | | $ | 1,300 | | | $ | 2,600 | |
| (a) | Amounts disclosed represent average number of contracts for shares/units outstanding for purchased options and written options, based on absolute values, which is indicative of volume for this derivative type, for the months that the Fund held such derivatives during the period ended December 31, 2022. |
5. AGREEMENTS AND AFFILIATED TRANSACTIONS
A. Management Agreement — Under the Agreement, GSAM manages the Fund subject to the general supervision of the Trustees.
As compensation for the services rendered pursuant to the Agreement, the assumption of the expenses related thereto and administration of the Fund’s business affairs, including providing facilities, GSAM is entitled to a management fee, accrued daily and paid monthly, equal to an annual percentage rate of the Fund’s average daily net assets.
For the period ended December 31, 2022, contractual and effective net management fees with GSAM were at the following rates:
| | | | | | | | | | | | | | | | | | | | | | | | | | | | |
| | | Contractual Management Rate | | | | | | | |
| Fund | | First
$1 billion | | | Next
$1 billion | | | Next
$3 billion | | | Next
$3 billion | | | Over
$8 billion | | | Effective
Rate | | | Effective Net
Management
Rate^ | |
| Buffered S&P 500 Fund -Jan/Jul | | | 0.50 | % | | | 0.45 | % | | | 0.43 | % | | | 0.42 | % | | | 0.41 | % | | | 0.50 | % | | | 0.34 | % |
| ^ | The Effective Net Management Rate includes the impact of management fee waivers of affiliated underlying funds, if any. The Effective Net Management Rate may not correlate to the Contractual Management Rate as a result of management fee waivers that may be in effect from time to time. |
The Fund invests in Institutional Shares of the Goldman Sachs Financial Square Government Fund, Goldman Sachs Financial Square Treasury Instruments Fund, Goldman Sachs Financial Square Treasury Obligations Fund, Goldman Sachs VIT Government Money Market Fund and Goldman Sachs Financial Square Treasury Solutions Fund, which are affiliated Underlying Money Market Funds. GSAM has agreed to waive a portion of its management fee payable by the Fund in an amount equal to the management fee it earns as an investment adviser to the affiliated Underlying Money Market Funds in which the Fund invests.
For the period ended December 31, 2022, the management fee waived by GSAM was for the Fund as follows:
| | | | |
| Fund | | Management Fee
Waived | |
| Buffered S&P 500 Fund - Jan/Jul | | $ | 44 | |
B. Distribution and/or Service (12b-1) Plans — The Trust, on behalf of Service Shares of the Fund, has adopted a Distribution and Service Plan subject to Rule 12b-1 under the Act. Under the Distribution and Service Plan, Goldman Sachs, which serves as distributor (the “Distributor”), is entitled to a fee accrued daily and paid monthly for distribution services and personal and account maintenance services, which may then be paid by Goldman Sachs to authorized dealers, equal to, on an annual basis, 0.25% of the Fund’s average daily net assets attributable to Service Shares.
C. Transfer Agency Agreement — Goldman Sachs also serves as the transfer agent of the Fund for a fee pursuant to the Transfer Agency Agreement. The fees charged for such transfer agency services are accrued daily and paid monthly at an annual rate of 0.02% of the average daily net assets of Institutional and Service Shares.
GOLDMAN SACHS BUFFERED S&P 500 FUND - JAN/JUL
Notes to Financial Statements (continued)
December 31, 2022
5. AGREEMENTS AND AFFILIATED TRANSACTIONS (continued)
D. Other Expense Agreements and Affiliated Transactions — GSAM has agreed to reduce or limit certain “Other Expenses” of the Fund (excluding acquired fund fees and expenses, transfer agency fees and expenses, service fees and shareholder administration fees (as applicable), taxes, interest, brokerage fees, expenses of shareholder meetings, litigation and indemnification, and extraordinary expenses) to the extent such expenses exceed, on an annual basis, a percentage rate of the average daily net assets of the Fund. Such Other Expense reimbursements, if any, are accrued daily and paid monthly. In addition, the Fund is not obligated to reimburse GSAM for prior period expense reimbursements, if any. The Other Expense limitation as an annual percentage rate of average daily net assets for the Fund is 0.184%. These Other Expense limitations will remain in place through at least October 5, 2023, and prior to such date GSAM may not terminate the arrangements without the approval of the Trustees. In addition, the Fund has entered into certain offset arrangements with the transfer agent, which may result in a reduction of the Fund’s expenses and are received irrespective of the application of the “Other Expense” limitations described above.
For the period ended December 31, 2022, these expense reductions, including any fee waivers and Other Expense reimbursements, were as follows:
| | | | |
| Fund | | Other Expense
Reimbursements | |
| Buffered S&P 500 Fund - Jan/Jul | | $ | 49,997 | |
E. Other Transactions with Affiliates — The Funds invest primarily in Institutional Shares of the Underlying Money Market Funds. These Underlying Money Market Funds are considered to be affiliated with the Fund. The tables below show the transactions in and earnings from investments in these Underlying Money Market Funds for the period ended December 31, 2022:
| | | | | | | | | | | | | | | | | | | | | | | | |
| Underlying Fund | | Beginning
Value as of
December 31,
2021 | | | Purchases at Cost | | | Proceeds from Sales | | | Ending
Value as of
December 31,
2022 | | | Shares as of December 31,
2022 | | | Dividend Income | |
Goldman Sachs Financial Square Treasury Obligations Fund — Institutional Class | | $ | — | | | $ | 500,114 | | | $ | — | | | $ | 500,114 | | | | 500,114 | | | $ | 114 | |
Goldman Sachs Financial Square Treasury Solutions Fund — Institutional Class | | | — | | | | 500,114 | | | | — | | | | 500,114 | | | | 500,114 | | | | 114 | |
Goldman Sachs Financial Square Treasury Instruments Fund — Institutional Class | | | — | | | | 500,109 | | | | — | | | | 500,109 | | | | 500,109 | | | | 108 | |
Goldman Sachs Government Money Market Fund — Institutional Class | | | — | | | | 500,000 | | | | — | | | | 500,000 | | | | 500,000 | | | | — | |
Goldman Sachs Financial Square Government Fund — Institutional Class | | | — | | | | 949,142 | | | | — | | | | 949,142 | | | | 949,142 | | | | 667 | |
| | | | | | |
| Total | | $ | — | | | $ | 2,949,479 | | | $ | — | | | $ | 2,949,479 | | | | | | | $ | 1,003 | |
As of December 31, 2022, The Goldman Sachs Group, Inc. was the beneficial owner of approximately 100% of the Institutional and Service Shares of the Fund.
6. PORTFOLIO SECURITIES TRANSACTIONS
For the period ended December 31, 2022, there were no purchases and proceeds from sales and maturities of long-term securities for the Fund.
GOLDMAN SACHS BUFFERED S&P 500 FUND - JAN/JUL
7. TAX INFORMATION
There were no distributions by the Fund during the period ended December 31, 2022.
As of December 31, 2022, the components of accumulated earnings (losses) on a tax basis were as follows:
| | | | |
| Undistributed ordinary income — net | | $ | 2,511 | |
| Undistributed long-term capital gains | | | 1,748 | |
| Total undistributed earnings | | $ | 4,259 | |
| Unrealized gains (losses) — net | | $ | 47 | |
| Total accumulated earnings (losses) net | | $ | 4,306 | |
As of December 31, 2022, the Fund’s aggregate security unrealized gains and losses based on cost for U.S. federal income tax purposes were as follows:
| | | | |
| Tax cost | | | 5,293,346 | |
| Gross unrealized gain | | | 255 | |
| Gross unrealized loss | | | (208 | ) |
| Net unrealized gain (loss) | | | 47 | |
The difference between GAAP-basis and tax basis unrealized gains (losses) is attributable primarily to net mark to market gains/(losses) on regulated options contracts.
The Fund reclassed $2 from paid in capital to distributable earnings for the period ending December 31, 2022. In order to present certain components of the Fund’s capital accounts on a tax-basis, certain reclassifications have been recorded to the Fund’s accounts. These reclassifications have no impact on the net asset value of the Fund and result primarily from certain non-deductible expenses.
GSAM has reviewed the Fund’s tax positions for the open tax year (the current year, as applicable) and has concluded that no provision for income tax is required in the Fund’s financial statements. Such open tax years remain subject to examination and adjustment by tax authorities.
8. OTHER RISKS
The Fund’s risks include, but are not limited to, the following:
Buffered Loss Risk — The Fund seeks to provide a downside Buffer against losses of the Underlying Index over a specified Outcome Period and will implement the Buffer by primarily investing in S&P 500 Options. There can be no guarantee that the Fund will be successful in its strategy to provide buffered protection against losses if the value of the Underlying Index decreases over an Outcome Period. A shareholder may lose their entire investment. The Fund’s strategy seeks to deliver returns that match the Underlying Index (up to the Cap before Fund fees and expenses), while limiting downside losses, if shares are bought on the day on which the Fund enters into the S&P Options and held until those S&P Options expire at the end of the Outcome Period. In the event an investor sells shares prior to the expiration of the S&P Options, the Buffer that the Fund seeks to provide may not be fully available. The Fund does not provide principal protection and an investor may experience significant losses on their investment, including the loss of their entire investment. The Buffer is not guaranteed and may not be achieved.
Capped Upside Return Risk — The Fund’s strategy seeks to provide returns only up to the Cap over an Outcome Period before Fund fees and expenses. In the event that the value of the Underlying Index increases in excess of the Cap during an Outcome Period, the Fund will not participate in those gains beyond the Cap. A new Cap is established on or before the first day of each Outcome Period and is dependent on prevailing market conditions. Accordingly, the Cap may increase or decrease from one
GOLDMAN SACHS BUFFERED S&P 500 FUND - JAN/JUL
Notes to Financial Statements (continued)
December 31, 2022
8. OTHER RISKS (continued)
Outcome Period to the next. The Cap is based on the market costs associated with a series of S&P Options that are purchased and sold in order to seek to obtain the relevant market exposure and the Buffer. The market conditions and other factors that influence the Cap can include, but are not limited to, interest rate levels, the volatility of the Underlying Index, and relationship of put and calls on the underlying S&P 500 Options. Depending on those factors, it is possible that the Cap will limit the Fund’s return during an Outcome Period to a level substantially less than an investor might expect from another comparable equity product that does not employ a Cap and Buffer.
Derivatives Risk — The Fund’s use of derivatives, including FLEX Options, and other similar instruments (collectively referred to in this paragraph as “derivatives”) may result in loss, including due to adverse market movements. Derivatives, which may pose risks in addition to and greater than those associated with investing directly in securities, currencies or other assets and instruments, may increase market exposure and be illiquid or less liquid, volatile, difficult to price and leveraged so that small changes in the value of the underlying assets or instruments may produce disproportionate losses to the Fund. Certain derivatives are also subject to counterparty risk, which is the risk that the other party in the transaction will not, or lacks the capacity or authority to, fulfill its contractual obligations, liquidity risk, which includes the risk that the Fund will not be able to exit the derivative when it is advantageous to do so, and risks arising from margin requirements, which include the risk that the Fund will be required to pay additional margin or set aside additional collateral to maintain open derivative positions. The use of derivatives is a highly specialized activity that involves investment techniques and risks different from those associated with investments in more traditional securities and instruments. Losses from derivatives can also result from a lack of correlation between changes in the value of derivative instruments and the portfolio assets (if any) being hedged.
FLEX Options Risk — The Fund utilizes FLEX Options guaranteed for settlement by the Options Clearing Corporation (the “OCC”), and bears the risk that the OCC will be unable or unwilling to perform its obligations under the FLEX Options contracts, which is a form of counterparty risk. Additionally, FLEX Options may be less liquid than certain other securities, such as standardized options. In a less liquid market, the Fund may have difficulty closing out certain FLEX Options positions at desired times and prices (and may have to pay a premium or accept a discounted price). The Fund may experience substantial downside from certain FLEX Option positions, and FLEX Option positions may expire worthless. The value of the FLEX Options will be affected by, among other things, changes in the value of the Underlying Index, changes in interest rates, changes in the actual and implied volatility of the Underlying Index and the remaining time until the FLEX Options expire. The value of FLEX Options does not increase or decrease at the same rate as the level of the Underlying Index (although they generally move in the same direction).
Interest Rate Risk — When interest rates increase, fixed income securities or instruments held by the Fund will generally decline in value. The Fund may face a heightened level of interest rate risk in connection with the type and extent of certain monetary policy changes made by the Federal Reserve, such as target interest rate changes. Long-term fixed income securities or instruments will normally have more price volatility because of this risk than short-term fixed income securities or instruments. A wide variety of market factors can cause interest rates to rise, including central bank monetary policy, rising inflation and changes in general economic conditions. The risks associated with changing interest rates may have unpredictable effects on the markets and the Fund’s investments. Fluctuations in interest rates may also affect the liquidity of fixed income securities and instruments held by the Fund. A sudden or unpredictable increase in interest rates may cause volatility in the market and may decrease the liquidity of the Fund’s investments, which would make it harder for the Fund to sell its investments at an advantageous time.
Investments in Other Investment Companies Risk — As a shareholder of another investment company, the Fund will indirectly bear its proportionate share of any net management fees and other expenses paid by such other investment companies, in addition to the fees and expenses regularly borne by the Fund.
Large Shareholder Transactions Risk — The Fund may experience adverse effects when certain large shareholders, such as other funds, institutional investors (including those trading by use of non-discretionary mathematical formulas), financial intermediaries (who may make investment decisions on behalf of underlying clients and/or include the Fund in their investment model), individuals, accounts and Goldman Sachs affiliates, purchase or redeem large amounts of shares of a Fund. Such large shareholder redemptions, which may occur rapidly or unexpectedly, may cause the Fund to sell portfolio securities at times when it
GOLDMAN SACHS BUFFERED S&P 500 FUND - JAN/JUL
8. OTHER RISKS (continued)
would not otherwise do so, which may negatively impact the Fund’s NAV and liquidity. These transactions may also accelerate the realization of taxable income to shareholders if such sales of investments resulted in gains, and may also increase transaction costs. In addition, a large redemption could result in the Fund’s current expenses being allocated over a smaller asset base, leading to an increase in the Fund’s expense ratio. Similarly, large Fund share purchases may adversely affect the Fund’s performance to the extent that the Fund is delayed in investing new cash or otherwise maintains a larger cash position than it ordinarily would.
Market and Credit Risks — In the normal course of business, the Fund trades financial instruments and enters into financial transactions where risk of potential loss exists due to changes in the market (market risk). The value of the securities in which the Fund invests may go up or down in response to the prospects of individual companies, particular sectors or governments and/or general economic conditions throughout the world due to increasingly interconnected global economies and financial markets. Events such as war, acts of terrorism, social unrest, natural disasters, the spread of infectious illness or other public health threats could also significantly impact the Fund and its investments. Additionally, the Fund may also be exposed to credit risk in the event that an issuer or guarantor fails to perform or that an institution or entity with which the Fund has unsettled or open transactions defaults.
Non-Diversification Risk — The Fund is non-diversified, meaning that it is permitted to invest a larger percentage of its assets in one or more issuers or in fewer issuers than diversified mutual funds. Thus, the Fund may be more susceptible to adverse developments affecting any single issuer held in its portfolio, and may be more susceptible to greater losses because of these developments.
9. INDEMNIFICATIONS
Under the Trust’s organizational documents, its Trustees, officers, employees and agents are indemnified, to the extent permitted by the Act and state law, against certain liabilities that may arise out of performance of their duties to the Fund. Additionally, in the course of business, the Fund enters into contracts that contain a variety of indemnification clauses. The Fund’s maximum exposure under these arrangements is unknown, as this would involve future claims that may be made against the Fund that have not yet occurred. However, GSAM believes the risk of loss under these arrangements to be remote.
10. SUBSEQUENT EVENTS
Subsequent events after the Statement of Assets and Liabilities date have been evaluated, and GSAM has concluded that there is no impact requiring adjustment or disclosure in the financial statements.
GOLDMAN SACHS BUFFERED S&P 500 FUND - JAN/JUL
11. SUMMARY OF SHARE TRANSACTIONS
Share activity is as follows:
| | | | | | | | |
| | | Buffered S&P 500 Fund -Jan/Jul | |
| | | For the Period Ended
December 31, 2022(a) | |
| | | Shares | | | Dollars | |
| Institutional Shares | | | | | | | | |
| Shares sold | | | 495,000 | | | $ | 4,950,000 | |
| Service Shares | | | | | | | | |
| Shares sold | | | 5,000 | | | | 50,000 | |
| | |
| NET INCREASE | | | 500,000 | | | | 5,000,000 | |
| (a) | Commenced operations on December 30, 2022. |
Report of Independent Registered Public Accounting Firm
To the Board of Trustees of Goldman Sachs Variable Insurance Trust and Shareholders of Goldman Sachs Buffered S&P 500 Fund — Jan/Jul
Opinion on the Financial Statements
We have audited the accompanying statement of assets and liabilities, including the schedule of investments, of Goldman Sachs Buffered S&P 500 Fund — Jan/Jul (one of the funds constituting Goldman Sachs Variable Insurance Trust, referred to hereafter as the “Fund”) as of December 31, 2022, the related statements of operations and changes in net assets, including the related notes, and the financial highlights for the period December 30, 2022 (commencement of operations) through December 31, 2022 (collectively referred to as the “financial statements”). In our opinion, the financial statements present fairly, in all material respects, the financial position of the Fund as of December 31, 2022, the results of its operations, changes in net assets, and the financial highlights for the period December 30, 2022 (commencement of operations) through December 31, 2022 in conformity with accounting principles generally accepted in the United States of America.
Basis for Opinion
These financial statements are the responsibility of the Fund’s management. Our responsibility is to express an opinion on the Fund’s financial statements based on our audit. We are a public accounting firm registered with the Public Company Accounting Oversight Board (United States) (PCAOB) and are required to be independent with respect to the Fund in accordance with the U.S. federal securities laws and the applicable rules and regulations of the Securities and Exchange Commission and the PCAOB.
We conducted our audit of these financial statements in accordance with the standards of the PCAOB. Those standards require that we plan and perform the audit to obtain reasonable assurance about whether the financial statements are free of material misstatement, whether due to error or fraud.
Our audit included performing procedures to assess the risks of material misstatement of the financial statements, whether due to error or fraud, and performing procedures that respond to those risks. Such procedures included examining, on a test basis, evidence regarding the amounts and disclosures in the financial statements. Our audit also included evaluating the accounting principles used and significant estimates made by management, as well as evaluating the overall presentation of the financial statements. Our procedures included confirmation of securities owned as of December 31, 2022 by correspondence with the custodian, transfer agent and brokers; when replies were not received from brokers, we performed other auditing procedures. We believe that our audit provide a reasonable basis for our opinion.
/s/PricewaterhouseCoopers LLP
Boston, Massachusetts
February 14, 2023
We have served as the auditor of one or more investment companies in the Goldman Sachs fund complex since 2000.
GOLDMAN SACHS BUFFERED S&P 500 FUND - JAN/JUL
| | |
| Fund Expenses — Period Ended December 31, 2022 (Unaudited) | | |
As a shareholder of Institutional or Service Shares of the Fund, you incur ongoing costs, including management fees, distribution and/or service (12b-1) fees (with respect to Service) and other Fund expenses. This example is intended to help you understand your ongoing costs (in dollars) of investing in the Institutional Shares and Service Shares of the Fund and to compare these costs with the ongoing costs of investing in other mutual funds.
The example is based on an investment of $1,000 invested at the beginning of the period and held for the entire period from December 30, 2022, commencement of operations, through December 31, 2022, which represents a period of 2 days of a 365 day year.
Actual Expenses — The first line under each share class in the table below provides information about actual account values and actual expenses. You may use the information in this line, together with the amount you invested, to estimate the expenses that you paid over the period. Simply divide your account value by $1,000 (for example, an $8,600 account value divided by $1,000=8.6), then multiply the result by the number in the first line under the heading entitled “Expenses Paid” to estimate the expenses you paid on your account during this period.
Hypothetical Example for Comparison Purposes — The second line under each share class in the table below provides information about hypothetical account values and hypothetical expenses based on the Fund’s actual net expense ratio and an assumed rate of return of 5% per year before expenses, which is not the Fund’s actual return. The hypothetical account values and expenses may not be used to estimate the actual ending account balance or expenses you paid for the period. You may use this information to compare the ongoing costs of investing in the Fund and other funds. To do so, compare this 5% hypothetical example with the 5% hypothetical examples that appear in the shareholder reports of the other funds.
Please note that the expenses shown in the table are meant to highlight your ongoing costs only. As a shareholder of the Fund you do not incur any transaction costs, such as sales charges, redemption fees, or exchange fees, but shareholders of other funds may incur such costs. The second line of the table is useful in comparing ongoing costs only and will not help you determine the relative total costs of owning different funds whose shareholders may incur transaction costs.
| | | | | | | | | | | | |
| Share Class | | Beginning
Account Value
12/30/2022 | | | Ending
Account Value
12/31/22 | | | Expenses Paid
for the
period
ended
12/31/22* | |
| Institutional | | | | | | | | | | | | |
| | | | |
| Actual | | $ | 1,000.00 | | | $ | 1,000.00 | | | $ | 0.03 | |
| Hypothetical 5% return | | | 1,000.00 | | | | 1,000.24 | + | | | 0.03 | |
| Service | | | | | | | | | | | | |
| | | | |
| Actual | | | 1,000.00 | | | | 1,000.00 | | | | 0.04 | |
| Hypothetical 5% return | | | 1,000.00 | | | | 1,000.23 | + | | | 0.04 | |
| | * | The Fund commenced operations on December 30, 2022. Expenses for each share class are calculated using the Fund’s annualized net expense ratio for each class, which represents the ongoing expenses as a percentage of net assets for the period ended December 31, 2022. Expenses are calculated by multiplying the annualized net expense ratio by the average account value for the period; then multiplying the result by the number of days in the most recent fiscal half year; and then dividing that result by the number of days in the fiscal year. The annualized net expense ratios for the period were as follows: | |
| | | | | | | | |
| | |
| Fund | | Institutional | | | Service | |
Buffered S&P 500 Fund - Jan/Jul | | | 0.54% | | | | 0.79% | |
| | + | Hypothetical expenses are based on the Fund’s actual annualized net expense ratios and an assumed rate of return of 5% per year before expenses. | |
GOLDMAN SACHS BUFFERED S&P 500 FUND - JAN/JUL
Statement Regarding Basis for Initial Approval of Management Agreement for the Goldman Sachs Buffered S&P 500 Fund — Jan/Jul (Unaudited)
Background
The Goldman Sachs Buffered S&P 500 Fund – Jan/Jul (the “Fund”) is a newly-organized investment portfolio of Goldman Sachs Variable Insurance Trust (the “Trust”) that commenced investment operations on December 30, 2022. At a meeting held on June 14-15, 2022 (the “Meeting”) in connection with the Fund’s organization, the Board of Trustees, including all of the Trustees present who are not parties to the Fund’s investment management agreement (the “Management Agreement”) or “interested persons” (as defined in the Investment Company Act of 1940, as amended) of any party thereto (the “Independent Trustees”) approved the Management Agreement with Goldman Sachs Asset Management, L.P. (the “Investment Adviser”).
At the Meeting, the Trustees reviewed the Management Agreement, including information regarding the terms of the Management Agreement; the nature, extent and quality of the Investment Adviser’s anticipated services; the fees and expenses to be paid by the Fund; a comparison of the Fund’s proposed management fee and anticipated expenses with those paid by other similar mutual funds; the Investment Adviser’s proposal to limit certain expenses of the Fund that exceed a specified level; and potential benefits to be derived by the Investment Adviser and its affiliates from their relationships with the Fund. Various information was also provided at a prior meeting at which the Fund was discussed.
In connection with the Meeting, the Trustees received written materials and oral presentations on the topics covered. The Independent Trustees were advised by their independent legal counsel regarding their responsibilities under applicable law. In evaluating the Management Agreement at the Meeting, the Trustees relied upon information included in a presentation made by the Investment Adviser at the Meeting and information received at prior meetings of the Trustees, as well as on their knowledge of the Investment Adviser resulting from their meetings and other interactions over time.
Nature, Extent, and Quality of the Services to be Provided under the Management Agreement
As part of their review, the Trustees considered the nature, extent, and quality of the services to be provided by the Investment Adviser. In this regard, the Trustees considered both the investment advisory services and non-advisory services that would be provided to the Fund by the Investment Adviser and its affiliates. The Trustees also considered information about the Fund’s structure, investment objective, strategies, and other characteristics. The Trustees considered the experience and capabilities of the investment team and noted that the Fund’s portfolio managers were currently managing other series of the Trust. The Trustees concluded that the Investment Adviser would be able to commit substantial financial and other resources to the Fund. In this regard, the Trustees noted that, although the Fund was new (and therefore had no performance data to evaluate), the Investment Adviser’s management of the Fund likely would benefit the Fund and its shareholders.
Costs of Services to Be Provided and Profitability
The Trustees considered the contractual terms of the Management Agreement and the fee rates to be payable by the Fund thereunder. In this regard, the Trustees considered information on the services to be rendered by the Investment Adviser to the Fund, which included both advisory and administrative services that were directed to the needs and operations of the Fund as a registered mutual fund.
In particular, the Trustees reviewed information on the proposed management fees and the Fund’s projected total operating expense ratios (both gross and net of expense limitations), and those were compared to similar information for comparable mutual funds advised by other, unaffiliated investment management firms, as well as the peer group and category medians. The comparisons of the Fund’s fee rates and total operating expense ratios were prepared by a third-party provider of mutual fund data. The Trustees believed that this information was useful in evaluating the reasonableness of the management fees and total expenses expected to be paid by the Fund.
The Trustees considered the Investment Adviser’s undertaking to limit certain expenses of the Fund that exceed a specified level. In addition, the Trustees recognized that there was not yet profitability data to evaluate for the Fund, but considered the Investment Adviser’s representations that (i) such data would be provided after the Fund commenced operations, and (ii) the Fund was not expected to be profitable to the Investment Adviser and its affiliates initially.
The Trustees noted the competitive nature of the fund marketplace, and that many of the Fund’s shareholders would be investing in the Fund in part because of the Fund’s relationship with the Investment Adviser. They also noted that shareholders would be able to redeem their shares if they believe that the Fund fees and expenses are too high or if they are dissatisfied with the performance of the Fund.
GOLDMAN SACHS BUFFERED S&P 500 FUND - JAN/JUL
Statement Regarding Basis for Initial Approval of Management Agreement for the Goldman Sachs Buffered S&P 500 Fund — Jan/Jul (Unaudited) (continued)
Economies of Scale
The Trustees considered the proposed breakpoints in the fee rates payable under the Management Agreement at the following annual percentage rates of the average daily net assets of the Fund:
| | | | |
Average Daily
Net Assets | | Management Fee
Annual Rate | |
| |
| First $1 billion | | | 0.50 | % |
| |
| Next $1 billion | | | 0.45 | % |
| |
| Next $3 billion | | | 0.43 | % |
| |
| Next $3 billion | | | 0.42 | % |
| |
| Over $8 billion | | | 0.41 | % |
The Trustees noted that the breakpoints were meant to share potential economies of scale, if any, with the Fund and its shareholders as assets under management reach those asset levels. The Trustees considered the Fund’s projected asset levels and information comparing fee rates charged by the Investment Adviser with fee rates charged to other funds in the peer group, as well as the Investment Adviser’s undertaking to limit certain expenses of the Fund that exceed a specified level. Upon reviewing these matters, the Trustees concluded that the fee breakpoints represented a means of assuring that benefits of scalability, if any, would be passed along to shareholders at the specified asset levels.
Other Benefits to the Investment Adviser and Its Affiliates
The Trustees also considered the other benefits expected to be derived by the Investment Adviser and its affiliates from their relationship with the Fund, including: (a) transfer agency fees received by Goldman Sachs & Co. LLC (“Goldman Sachs”); (b) futures commissions earned by Goldman Sachs for executing futures transactions on behalf of the Fund; (c) trading efficiencies resulting from aggregation of orders of the Fund with those for other funds or accounts managed by the Investment Adviser ; (d) the Investment Adviser’s ability to leverage the infrastructure designed to service the Fund on behalf of its other clients; (e) the Investment Adviser’s ability to cross-market other products and services to Fund shareholders; (f) Goldman Sachs’ retention of certain fees as Fund Distributor; (g) the Investment Adviser’s ability to negotiate better pricing with custodians on behalf of its other clients, as a result of the relationship with the Fund; (h) the investment by the Fund of cash and cash collateral in the Investment Adviser managed money market funds that will result in increased assets under management for those money market funds; (i) the investment in exchange-traded funds (“ETFs”) managed by the Investment Adviser that will result in increased assets under management for those ETFs and may facilitate the development of the Investment Adviser’s ETF advisory business; and (j) the possibility that the working relationship between the Investment Adviser and the Fund’s third-party service providers may cause those service providers to be open to doing business with other areas of Goldman Sachs.
Conclusion
In connection with their consideration of the Management Agreement for the Fund at the Meeting, the Trustees gave weight to various factors, but did not identify any particular factor as controlling their decision. After deliberation and consideration of the information provided, including the factors described above, the Trustees concluded, in the exercise of their business judgment, that the management fee that would be payable by the Fund was reasonable in light of the services to be provided to it by the Investment Adviser, the Investment Adviser’s anticipated costs and the Fund’s reasonably anticipated asset levels. The Trustees unanimously concluded that the Investment Adviser’s management likely would benefit the Fund and its shareholders and that the Management Agreement should be approved with respect to the Fund.
GOLDMAN SACHS BUFFERED S&P 500 FUND - JAN/JUL
Trustees and Officers (Unaudited)
Independent Trustees
| | | | | | | | | | | | |
| | | | | |
Name, Address and Age1 | | Position(s) Held
with the Trust | | Term of
Office and
Length of
Time Served2 | | Principal Occupation(s)
During Past 5 Years | | Number of
Portfolios in
Fund Complex
Overseen by
Trustee3 | | | Other
Directorships
Held by Trustee4 |
Jessica Palmer5 Age: 73 | | Chair of the Board of Trustees | | Since 2018 (Trustee since 2007) | | Ms. Palmer is retired. She was formerly Consultant, Citigroup Human Resources Department (2007-2008); Managing Director, Citigroup Corporate and Investment Banking (previously, Salomon Smith Barney/Salomon Brothers) (1984-2006). Ms. Palmer was a Member of the Board of Trustees of Indian Mountain School (private elementary and secondary school) (2004-2009). Chair of the Board of Trustees — Goldman Sachs Trust and Goldman Sachs Variable Insurance Trust. | | | 103 | | | None |
Dwight L. Bush Age: 65 | | Trustee | | Since 2020 | | Ambassador Bush is President and CEO of D.L. Bush & Associates (a financial advisory and private investment firm) (2002-2014 and 2017-present) Director of MoneyLion, Inc. (an operator of a data-driven, digital financial platform) (2021-Present); and was formerly U.S. Ambassador to the Kingdom of Morocco (2014-2017) and a Member of the Board of Directors of Santander Bank, N.A. (2018-2019). Previously, Ambassador Bush served as an Advisory Board Member of Goldman Sachs Trust and Goldman Sachs Variable Insurance Trust (October 2019-January 2020). Trustee — Goldman Sachs Trust and Goldman Sachs Variable Insurance Trust. | | | 103 | | | MoneyLion, Inc. (an operator of a data-driven, digital financial platform) |
Kathryn A. Cassidy Age: 68 | | Trustee | | Since 2015 | | Ms. Cassidy is retired. She is Director, Vertical Aerospace Ltd. (an aerospace and technology company (2021-Present). Formerly, Ms. Cassidy was Advisor to the Chairman (May 2014-December 2014); and Senior Vice President and Treasurer (2008-2014), General Electric Company & General Electric Capital Corporation (technology and financial services companies). Trustee — Goldman Sachs Trust and Goldman Sachs Variable Insurance Trust. | | | 103 | | | Vertical Aerospace Ltd. (an aerospace and technology company) |
John G. Chou Age: 66 | | Trustee | | Since 2022 | | Mr. Chou is Executive Vice President and Special Advisor to the Chairman and CEO of AmerisourceBergen Corporation (a pharmaceutical and healthcare company) (2021- Present); and formerly held various executive management positions with AmerisourceBergen Corporation, including Executive Vice President and Chief Legal Officer (2019-2021); Executive Vice President and Chief Legal & Business Officer (2017-2019); and Executive Vice President and General Counsel (2011-2017). Trustee — Goldman Sachs Trust and Goldman Sachs Variable Insurance Trust. | | | 103 | | | None |
Diana M. Daniels5 Age: 73 | | Trustee | | Since 2007 | | Ms. Daniels is retired. Formerly, she was Vice President, General Counsel and Secretary, The Washington Post Company (1991-2006). Ms. Daniels is a Trustee Emeritus and serves as a Presidential Councillor of Cornell University (2013-Present); Director of 1735 NY Investments, LLC (oversees an investment fund that supports the mission of the American Institute of Architects) (2022-Present); former Member of the Legal Advisory Board, New York Stock Exchange (2003-2006) and of the Corporate Advisory Board, Standish Mellon Management Advisors (2006-2007). Trustee — Goldman Sachs Trust and Goldman Sachs Variable Insurance Trust. | | | 103 | | | None |
| | | | | | | | | | | | |
GOLDMAN SACHS BUFFERED S&P 500 FUND - JAN/JUL
Trustees and Officers (Unaudited) (continued)
Independent Trustees (continued)
| | | | | | | | | | | | |
| | | | | |
Name, Address and Age1 | | Position(s) Held
with the Trust | | Term of
Office and
Length of
Time Served2 | | Principal Occupation(s)
During Past 5 Years | | Number of
Portfolios in
Fund Complex
Overseen by
Trustee3 | | | Other
Directorships
Held by Trustee4 |
Joaquin Delgado Age: 62 | | Trustee | | Since 2020 | | Dr. Delgado is retired. He is Director, Stepan Company (a specialty chemical manufacturer) (2011-present); and was formerly Director, Hexion Inc. (a specialty chemical manufacturer) (2019-2022); Executive Vice President, Consumer Business Group of 3M Company (July 2016-July 2019); and Executive Vice President, Health Care Business Group of 3M Company (October 2012-July 2016). Previously, Dr. Delgado served as an Advisory Board Member of Goldman Sachs Trust and Goldman Sachs Variable Insurance Trust (October 2019-January 2020). Trustee — Goldman Sachs Trust and Goldman Sachs Variable Insurance Trust. | | | 103 | | | Stepan Company (a specialty chemical manufacturer) |
Eileen H. Dowling Age: 60 | | Trustee | | Since 2021 | | Ms. Dowling is retired. Formerly, she was Senior Advisor (April 2021-September 2021); and Managing Director (2013-2021), BlackRock, Inc. (a financial services firm). Trustee — Goldman Sachs Trust and Goldman Sachs Variable Insurance Trust. | | | 103 | | | None |
Gregory G. Weaver Age: 71 | | Trustee | | Since 2015 | | Mr. Weaver is retired. He is Director, Verizon Communications Inc. (2015-Present); and was formerly Chairman and Chief Executive Officer, Deloitte & Touche LLP (a professional services firm) (2001-2005 and 2012-2014); and Member of the Board of Directors, Deloitte & Touche LLP (2006-2012). Trustee — Goldman Sachs Trust and Goldman Sachs Variable Insurance Trust. | | | 103 | | | Verizon Communications Inc. |
Paul C. Wirth Age: 65 | | Trustee | | Since 2022 | | Mr. Wirth is retired. Formerly, he was Deputy Chief Financial Officer and Principal Accounting Officer (2011-2020); Finance Director and Principal Accounting Officer (2010-2011); and Managing Director, Global Controller, and Chief Accounting Officer (2005-2010) of Morgan Stanley. Trustee — Goldman Sachs Trust and Goldman Sachs Variable Insurance Trust. | | | 103 | | | None |
| | | | | | | | | | | | |
GOLDMAN SACHS BUFFERED S&P 500 FUND - JAN/JUL
Trustees and Officers (Unaudited) (continued)
Interested Trustee*
| | | | | | | | | | | | |
| | | | | |
Name, Address and Age1 | | Position(s) Held
with the Trust | | Term of
Office and
Length of
Time Served2 | | Principal Occupation(s)
During Past 5 Years | | Number of
Portfolios in
Fund Complex
Overseen by
Trustee3 | | | Other
Directorships
Held by Trustee4 |
James A. McNamara Age: 60 | | President and Trustee | | Since 2007 | | Advisory Director, Goldman Sachs (January 2018-Present); Managing Director, Goldman Sachs (January 2000-December 2017); Director of Institutional Fund Sales, GSAM (April 1998- December 2000); and Senior Vice President and Manager, Dreyfus Institutional Service Corporation (January 1993-April 1998). President and Trustee — Goldman Sachs Trust; Goldman Sachs Variable Insurance Trust; Goldman Sachs Trust II; Goldman Sachs MLP and Energy Renaissance Fund; Goldman Sachs ETF Trust; Goldman Sachs Credit Income Fund; and Goldman Sachs Real Estate Diversified Income Fund. | | | 172 | | | None |
| | | | | | | | | | | | |
| * | Mr. McNamara is considered to be an “Interested Trustee” because he holds positions with Goldman Sachs and owns securities issued by The Goldman Sachs Group, Inc. Mr. McNamara holds comparable positions with certain other companies of which Goldman Sachs, GSAM or an affiliate thereof is the investment adviser, administrator and/or distributor. |
| 1 | Each Trustee may be contacted by writing to the Trustee, c/o Goldman Sachs, 200 West Street, New York, New York, 10282, Attn: Caroline Kraus. Information is provided as of December 31, 2022. |
| 2 | Subject to such policies as may be adopted by the Board from time-to-time, each Trustee holds office for an indefinite term, until the earliest of: (a) the election of his or her successor; (b) the date the Trustee resigns or is removed by the Board or shareholders, in accordance with the Trust’s Declaration of Trust; or (c) the termination of the Trust. The Board has adopted policies which provide that each Independent Trustee shall retire as of December 31st of the calendar year in which he or she reaches (a) his or her 75th birthday or (b) the 15th anniversary of the date he or she became a Trustee, whichever is earlier, unless a waiver of such requirements shall have been adopted by a majority of the other Trustees. These policies may be changed by the Trustees without shareholder vote. |
| 3 | The Goldman Sachs Fund Complex includes certain other companies listed above for each respective Trustee. As of December 31, 2022, Goldman Sachs Trust consisted of 88 portfolios; Goldman Sachs Variable Insurance Trust consisted of 15 portfolios (12 of which offered shares to the public); Goldman Sachs Trust II consisted of 18 portfolios (7 of which offered shares to the public); Goldman Sachs ETF Trust consisted of 46 portfolios (29 of which offered shares to the public); Goldman Sachs ETF Trust II consisted of 2 portfolios (1 of which offered shares to the public); and Goldman Sachs MLP and Energy Renaissance Fund, Goldman Sachs Credit Income Fund and Goldman Sachs Real Estate Diversified Income Fund each consisted of one portfolio. Goldman Sachs Credit Income Fund did not offer shares to the public. |
| 4 | This column includes only directorships of companies required to report to the Securities and Exchange Commission under the Securities Exchange Act of 1934 (i.e., “public companies”) or other investment companies registered under the Act. |
| 5 | Ms. Daniels and Ms. Palmer retired as Independent Trustees effective January 1, 2023. |
Additional information about the Trustees is available in the Fund’s Statement of Additional Information, which can be obtained from Goldman Sachs free of charge by calling this toll-free number (in the United States of America): 1-800-526-7384.
GOLDMAN SACHS BUFFERED S&P 500 FUND - JAN/JUL
Trustees and Officers (Unaudited) (continued)
Officers of the Trust*
| | | | | | |
| | | |
| Name, Address and Age1 | | Position(s) Held
with the Trust | | Term of Office and
Length of
Time Served2 | | Principal Occupation(s) During Past 5 Years |
James A. McNamara
200 West Street New York, NY 10282 Age: 60 | | President and
Trustee | | Since 2007 | | Advisory Director, Goldman Sachs (January 2018-Present); Managing Director, Goldman Sachs (January 2000-December 2017); Director of Institutional Fund Sales, GSAM (April 1998-December 2000); and Senior Vice President and Manager, Dreyfus Institutional Service Corporation (January 1993-April 1998). President and Trustee — Goldman Sachs Trust; Goldman Sachs Variable Insurance Trust; Goldman Sachs Trust II; Goldman Sachs MLP and Energy Renaissance Fund; Goldman Sachs ETF Trust; Goldman Sachs Credit Income Fund; and Goldman Sachs Real Estate Diversified Income Fund. |
Joseph F. DiMaria
30 Hudson Street Jersey City, NJ 07302 Age: 52 | | Treasurer, Principal
Financial Officer and
Principal Accounting
Officer | | Since 2017
(Treasurer
and
Principal
Financial
Officer
since 2019) | | Managing Director, Goldman Sachs (November 2015-Present) and Vice President — Mutual Fund Administration, Columbia Management Investment Advisers, LLC (May 2010-October 2015). Treasurer, Principal Financial Officer and Principal Accounting Officer — Goldman Sachs Trust (previously Assistant Treasurer (2016)); Goldman Sachs Variable Insurance Trust (previously Assistant Treasurer (2016)); Goldman Sachs Trust II (previously Assistant Treasurer (2017)); Goldman Sachs MLP and Energy Renaissance Fund (previously Assistant Treasurer (2017)); Goldman Sachs ETF Trust (previously Assistant Treasurer (2017)); Goldman Sachs Credit Income Fund; and Goldman Sachs Real Estate Diversified Income Fund. |
Caroline L. Kraus
200 West Street New York, NY 10282 Age: 43 | | Secretary | | Since 2012 | | Managing Director, Goldman Sachs (January 2016-Present); Vice President, Goldman Sachs (August 2006-December 2015); Senior Counsel, Goldman Sachs (January 2020-Present); Associate General Counsel, Goldman Sachs (2012-December 2019); Assistant General Counsel, Goldman Sachs (August 2006-December 2011); and Associate, Weil, Gotshal & Manges, LLP (2002-2006). Secretary — Goldman Sachs Trust (previously Assistant Secretary (2012)); Goldman Sachs Variable Insurance Trust (previously Assistant Secretary (2012)); Goldman Sachs Trust II; Goldman Sachs BDC, Inc.; Goldman Sachs Private Middle Market Credit LLC; Goldman Sachs Private Middle Market Credit II LLC; Goldman Sachs Middle Market Lending Corp.; Goldman Sachs MLP and Energy Renaissance Fund; Goldman Sachs ETF Trust; Goldman Sachs Credit Income Fund; and Goldman Sachs Real Estate Diversified Income Fund. |
| | | | | | |
| * | Represents a partial list of officers of the Trust. Additional information about all the officers is available in the Fund’s Statement of Additional Information, which can be obtained from Goldman Sachs free of charge by calling this toll-free number (in the United States): 1-800-526-7384. |
| 1 | Information is provided as of December 31, 2022. |
| 2 | Officers hold office at the pleasure of the Board of Trustees or until their successors are duly elected and qualified. Each officer holds comparable positions with certain other companies of which Goldman Sachs, GSAM or an affiliate thereof is the investment adviser, administrator and/or distributor. |
| | |
| TRUSTEES | | OFFICERS |
| Gregory G. Weaver, Chair | | James A. McNamara, President |
| Dwight L. Bush | | Joseph F. DiMaria, Principal Financial Officer, |
| Kathryn A. Cassidy | | Principal Accounting Officer and Treasurer |
| John G. Chou | | Caroline L. Kraus, Secretary |
| Joaquin Delgado | | |
| Eileen H. Dowling | | |
| James A. McNamara | | |
| Paul C. Wirth | | |
GOLDMAN SACHS & CO. LLC
Distributor and Transfer Agent
GOLDMAN SACHS ASSET MANAGEMENT, L.P.
Investment Adviser
200 West Street, New York,
New York 10282
Visit our web site at www.GSAMFUNDS.com to obtain the most recent month-end returns.
The reports concerning the Fund included in this shareholder report may contain certain forward-looking statements about the factors that may affect the performance of the Fund in the future. These statements are based on Fund management’s predictions and expectations concerning certain future events and their expected impact on the Fund, such as performance of the economy as a whole and of specific industry sectors, changes in the levels of interest rates, the impact of developing world events, and other factors that may influence the future performance of the Fund. Management believes these forward-looking statements to be reasonable, although they are inherently uncertain and difficult to predict. Actual events may cause adjustments in portfolio management strategies from those currently expected to be employed.
A description of the policies and procedures that the Fund use to determine how to vote proxies relating to portfolio securities and information regarding how the Fund voted proxies relating to portfolio securities for the 12-month period ended June 30 is available (i) without charge, upon request by calling 1-800-621-2550; and (ii) on the Securities and Exchange Commission (“SEC”) web site at http://www.sec.gov.
The Fund will file portfolio holdings information for each month in a fiscal quarter within 60 days after the end of the relevant fiscal quarter on Form N-PORT. Portfolio holdings information for the third month of each fiscal quarter will be made available on the SEC’s web site at http://www.sec.gov. Portfolio holdings information may be obtained upon request and without charge by calling 1-800-526-7384 (for Retail Shareholders) or 1-800-621-2550 (for Institutional Shareholders).
Views and opinions expressed are for informational purposes only and do not constitute a recommendation by GSAM to buy, sell, or hold any security. Views and opinions are current as of the date of this presentation and may be subject to change, they should not be construed as investment advice.
Goldman Sachs & Co. LLC (“Goldman Sachs”) does not provide legal, tax or accounting advice. Any statement contained in this communication (including any attachments) concerning U.S. tax matters was not intended or written to be used, and cannot be used, for the purpose of avoiding penalties under the Internal Revenue Code, and was written to support the promotion or marketing of transactions or matters addressed. Clients of Goldman Sachs should obtain their own independent tax advice based on their particular circumstances.
The website links provided are for your convenience only and are not an endorsement or recommendation by GSAM of any of these websites or the products or services offered. GSAM is not responsible for the accuracy and validity of the content of these websites.
Fund holdings and allocations shown are as of December 31, 2022 and may not be representative of future investments. Fund holdings should not be relied on in making investment decisions and should not be construed as research or investment advice regarding particular securities. Current and future holdings are subject to risk.
References to indices, benchmarks or other measures of relative market performance over a specified period of time are provided for your information only and do not imply that the portfolio will achieve similar results. The index composition may not reflect the manner in which a portfolio is constructed. While an adviser seeks to design a portfolio which reflects appropriate risk and return features, portfolio characteristics may deviate from those of the benchmark.
The portfolio risk management process includes an effort to monitor and manage risk, but does not imply low risk.
Shares of the Goldman Sachs VIT Funds are offered to separate accounts of participating life insurance companies for the purpose of funding variable annuity contracts and variable life insurance policies. Shares of the Fund are not offered directly to the general public. The variable annuity contracts and variable life insurance policies are described in the separate prospectuses issued by participating insurance companies. You should refer to those prospectuses for information about surrender charges, mortality and expense risk fees and other charges that may be assessed by participating insurance companies under the variable annuity contracts or variable life insurance policies. Such fees or charges, if any, may affect the return you may realize with respect to your investments. Ask your representative for more complete information. Please consider a fund’s objectives, risks and charges and expenses, and read the prospectus carefully before investing. The prospectus contains this and other information about the Fund.
This material is not authorized for distribution to prospective investors unless preceded or accompanied by a current prospectus or summary prospectus, if applicable. Investors should consider the Fund’s objective, risks, and charges and expenses, and read the summary prospectus, if available, and/or the prospectus carefully before investing or sending money. The summary prospectus, if available, and the prospectus contain this and other information about the Fund and may be obtained from your authorized dealer or from Goldman Sachs & Co. LLC by calling 1-800-621-2550.
This report is prepared for the general information of contract owners and is not an offer of shares of the Goldman Sachs Variable Insurance Trust Funds.
© 2023 Goldman Sachs. All rights reserved.
VITBSP500AR-23 306016-OTU-1745122
| | (a) | As of the end of the period covered by this report, the registrant has adopted a code of ethics that applies to the registrant’s principal executive officer, principal financial officer, principal accounting officer or controller, or persons performing similar functions, regardless of whether these individuals are employed by the registrant or a third party (the “Code of Ethics”). |
| | (c) | During the period covered by this report, no amendments were made to the provisions of the Code of Ethics. |
| | (d) | During the period covered by this report, the registrant did not grant any waivers, including an implicit waiver, from any provision of the Code of Ethics. |
| | (f) | A copy of the Code of Ethics is available as provided in Item 13(a)(1) of this report. |
| ITEM 3. | AUDIT COMMITTEE FINANCIAL EXPERT. |
| | The registrant’s board of trustees has determined that the registrant has at least one “audit committee financial expert” (as defined in Item 3 of Form N-CSR) serving on its audit committee. Gregory G. Weaver is the “audit committee financial expert” and is “independent” (as each term is defined in Item 3 of Form N-CSR). |
| ITEM 4. | PRINCIPAL ACCOUNTANT FEES AND SERVICES. |
Item 4 — Principal Accountant Fees and Services for the Goldman Sachs Variable Insurance Trust (“GSVIT”):
Table 1 – Items 4(a) - 4(d)
| | | | | | | | | | |
| | | 2022 | | | 2021 | | | Description of Services Rendered |
Audit Fees: | | | | | | | | | | |
• PricewaterhouseCoopers (“PwC”) | | $ | 529,199 | | | $ | 499,130 | | | Financial Statement audits. |
Audit-Related Fees | | | | | | | | | | |
PwC | | $ | 38,900 | | | $ | 95,166 | | | Other attest services. |
Tax Fees | | | | | | | | | | |
PwC | | $ | 0 | | | $ | 0 | | | |
Items 4(b)(c) & (d) Table 2. Non-Audit Services to the GSVIT’s* that were pre-approved by the GSVIT’s Audit Committee pursuant to Rule 2-01(c)(7)(ii) of Regulation S-X
| | | | | | | | | | |
| | | 2022 | | | 2021 | | | Description of Services Rendered |
Audit-Related Fees | | | | | | | | | | |
PwC | | $ | 1,906,448 | | | $ | 1,906,448 | | | Internal control review performed in accordance with Statement on Standards for Attestation Engagements No. 16 and semi-annual updates related to withholding tax accrual for non-US jurisdictions. These fees are borne by the Funds’ adviser. |
| * | These include the advisor (excluding sub-advisors) and any entity controlling, controlled by or under common control with the advisor that provides ongoing services to the registrant (hereinafter referred to as “service affiliates”). |
Item 4(e)(1) — Audit Committee Pre-Approval Policies and Procedures
Pre-Approval of Audit and Non-Audit Services Provided to the Funds of the Goldman Sachs Variable Insurance Trust. The Audit and Non-Audit Services Pre-Approval Policy (the “Policy”) adopted by the Audit Committee of GSVIT sets forth the procedures and the conditions pursuant to which services performed by an independent auditor for GSVIT may be pre-approved. Services may be pre-approved specifically by the Audit Committee as a whole or, in certain circumstances, by the Audit Committee Chairman or the person designated as the Audit Committee Financial Expert. In addition, subject to specified cost limitations, certain services may be pre-approved under the provisions of the Policy. The Policy provides that the Audit Committee will consider whether the services provided by an independent auditor are consistent with the Securities and Exchange Commission’s rules on auditor independence. The Policy provides for periodic review and pre-approval by the Audit Committee of the services that may be provided by the independent auditor.
De Minimis Waiver. The pre-approval requirements of the Policy may be waived with respect to the provision of non-audit services that are permissible for an independent auditor to perform, provided (1) the aggregate amount of all such services provided constitutes no more than five percent of the total amount of revenues subject to pre-approval that was paid to the independent auditors during the fiscal year in which the services are provided; (2) such services were not recognized by GSVIT at the time of the engagement to be non-audit services; and (3) such services are promptly brought to the attention of the Audit Committee and approved prior to the completion of the audit by the Audit Committee or by one or more members of the Audit Committee to whom authority to grant such approvals has been delegated by the Audit Committee, pursuant to the pre-approval provisions of the Policy.
Pre-Approval of Non-Audit Services Provided to GSVIT’s Investment Advisers. The Policy provides that, in addition to requiring pre-approval of audit and non-audit services provided to GSVIT, the Audit Committee will pre-approve those non-audit services provided to GSVIT’s investment advisers (and entities controlling, controlled by or under common control with the investment advisers that provide ongoing services to GSVIT) where the engagement relates directly to the operations or financial reporting of GSVIT.
Item 4(e)(2) — 0% of the audit-related fees, tax fees and other fees listed in Table 1 were approved by GSVIT’s Audit Committee pursuant to the “de minimis” exception of Rule 2-01(c)(7)(i)(C) of Regulation S-X. In addition, 0% of the non-audit services to the GSVIT’s service affiliates listed in Table 2 were approved by GSVIT’s Audit Committee pursuant to the “de minimis” exception of Rule 2-01(c)(7)(i)(C) of Regulation S-X.
Item 4(f) — Not applicable.
Items 4(g) Aggregate Non-Audit Fees Disclosure
The aggregate non-audit fees billed to GSVIT for the twelve months ended December 31, 2022 and December 31, 2021 by PwC were approximately $38,900 and $95,166, respectively.
The aggregate non-audit fees billed to GSVIT’s adviser and service affiliates for non-audit services for the twelve months ended December 31, 2021 and December 31, 2020 by PwC were approximately $14.4 million and $14.4 million, respectively. The figures for these entities are not yet available for the twelve months ended December 31, 2022. With regard to the aggregate non-audit fees billed to GSVIT’s adviser and service affiliates, the 2021 and 2020 amounts include fees for non-audit services required to be pre-approved [see Table 2] and fees for non-audit services that did not require pre-approval since they did not directly relate to GSVIT’s operations or financial reporting.
Items 4(h) — GSVIT’s Audit Committee has considered whether the provision of non-audit services to GSVIT’s investment adviser and service affiliates that did not require pre-approval pursuant to paragraph (c)(7)(ii) of Rule 2-01 of Regulation S-X is compatible with maintaining the auditor’s independence.
| ITEM 5. | AUDIT COMMITTEE OF LISTED REGISTRANTS. |
Not applicable.
| ITEM 6. | SCHEDULE OF INVESTMENTS. |
Schedule of Investments is included as part of the Reports to Shareholders filed under Item 1.
| ITEM 7. | DISCLOSURE OF PROXY VOTING POLICIES AND PROCEDURES FOR CLOSED-END MANAGEMENT INVESTMENT COMPANIES. |
Not applicable.
| ITEM 8. | PORTFOLIO MANAGERS OF CLOSED-END MANAGEMENT INVESTMENT COMPANIES. |
Not applicable.
| ITEM 9. | PURCHASES OF EQUITY SECURITIES BY CLOSED-END MANAGEMENT INVESTMENT COMPANY AND AFFILIATED PURCHASERS. |
Not applicable.
| ITEM 10. | SUBMISSION OF MATTERS TO A VOTE OF SECURITY HOLDERS. |
There have been no material changes to the procedures by which shareholders may recommend nominees to the registrant’s board of trustees.
| ITEM 11. | CONTROLS AND PROCEDURES. |
| | (a) | The registrant’s principal executive and principal financial officers or persons performing similar functions have concluded that the registrant’s disclosure controls and procedures (as defined in Rule 30a-3(c) under the Investment Company Act of 1940, as amended (the “1940 Act”)) are effective as of a date within 90 days of the filing date of this report that includes the disclosure required by this paragraph, based on the evaluation of these controls and procedures required by Rule 30a-3(b) under the 1940 Act and 15d-15(b) under the Securities Exchange Act of 1934, as amended. |
| | (b) | There were no changes in the registrant’s internal control over financial reporting (as defined in Rule 30a-3(d) under the 1940 Act) that occurred during the period covered by this report that have materially affected, or are reasonably likely to materially affect, the registrant’s internal control over financial reporting. |
| ITEM 12. | DISCLOSURE OF SECURITIES LENDING ACTIVITIES FOR CLOSED-END MANAGEMENT INVESTMENT COMPANIES. |
Not applicable.
SIGNATURES
Pursuant to the requirements of the Securities Exchange Act of 1934 and the Investment Company Act of 1940, the registrant has duly caused this report to be signed on its behalf by the undersigned, thereunto duly authorized.
Goldman Sachs Variable Insurance Trust
| | |
/s/ James A. McNamara |
By: James A. McNamara |
Chief Executive Officer of |
Goldman Sachs Variable Insurance Trust |
|
Date: February 24, 2023 |
Pursuant to the requirements of the Securities Exchange Act of 1934 and the Investment Company Act of 1940, the report has been signed below by the following persons on behalf of the registrant and in the capacities and on the dates indicated.
| | |
/s/ James A. McNamara |
By: James A. McNamara |
Chief Executive Officer of |
Goldman Sachs Variable Insurance Trust |
|
Date: February 24, 2023 |
|
/s/ Joseph F. DiMaria |
By: Joseph F. DiMaria |
Principal Financial Officer of |
Goldman Sachs Variable Insurance Trust |
|
Date: February 24, 2023 |